Asus ROG Strix Scar 17 SE review - Laptop de jogos totalmente equipado com RTX 3080 Ti
O ROG Strix Scar SE é o carro-chefe dos jogos da Asus e, em 2022 também, está novamente equipado com os componentes mais rápidos atualmente disponíveis no mercado. Testamos o modelo top G733CX com o Intel Core i9-12950HX, o Nvidia GeForce RTX 3080 Ti, dois SSDs 2-TB da Samsung, e um painel QHD rápido com uma taxa de atualização de 240-Hz. O preço também é de alto nível, uma vez que o MSRP de nossa unidade de teste vem em 3.999 Euros (~$4.129).
Possíveis concorrentes em comparação
Avaliação | Data | Modelo | Peso | Altura | Size | Resolução | Preço |
|---|---|---|---|---|---|---|---|
| 86.9 % v7 (old) | 11/2022 | Asus ROG Strix Scar 17 SE G733CX-LL014W i9-12950HX, GeForce RTX 3080 Ti Laptop GPU | 2.9 kg | 28.3 mm | 17.30" | 2560x1440 | |
| 88.9 % v7 (old) | 09/2022 | Lenovo Legion 7 16IAX7-82TD004SGE i9-12900HX, GeForce RTX 3080 Ti Laptop GPU | 2.6 kg | 20 mm | 16.00" | 2560x1600 | |
| 88.3 % v7 (old) | 08/2022 | MSI Titan GT77 12UHS i9-12900HX, GeForce RTX 3080 Ti Laptop GPU | 3.3 kg | 23 mm | 17.30" | 1920x1080 | |
| 87.6 % v7 (old) | 09/2022 | Schenker XMG Neo 17 M22 R9 6900HX, GeForce RTX 3080 Ti Laptop GPU | 2.8 kg | 27 mm | 17.00" | 2560x1600 | |
| 89.2 % v7 (old) | 05/2022 | Alienware x17 R2 P48E i9-12900HK, GeForce RTX 3080 Ti Laptop GPU | 3.1 kg | 20.9 mm | 17.30" | 1920x1080 |
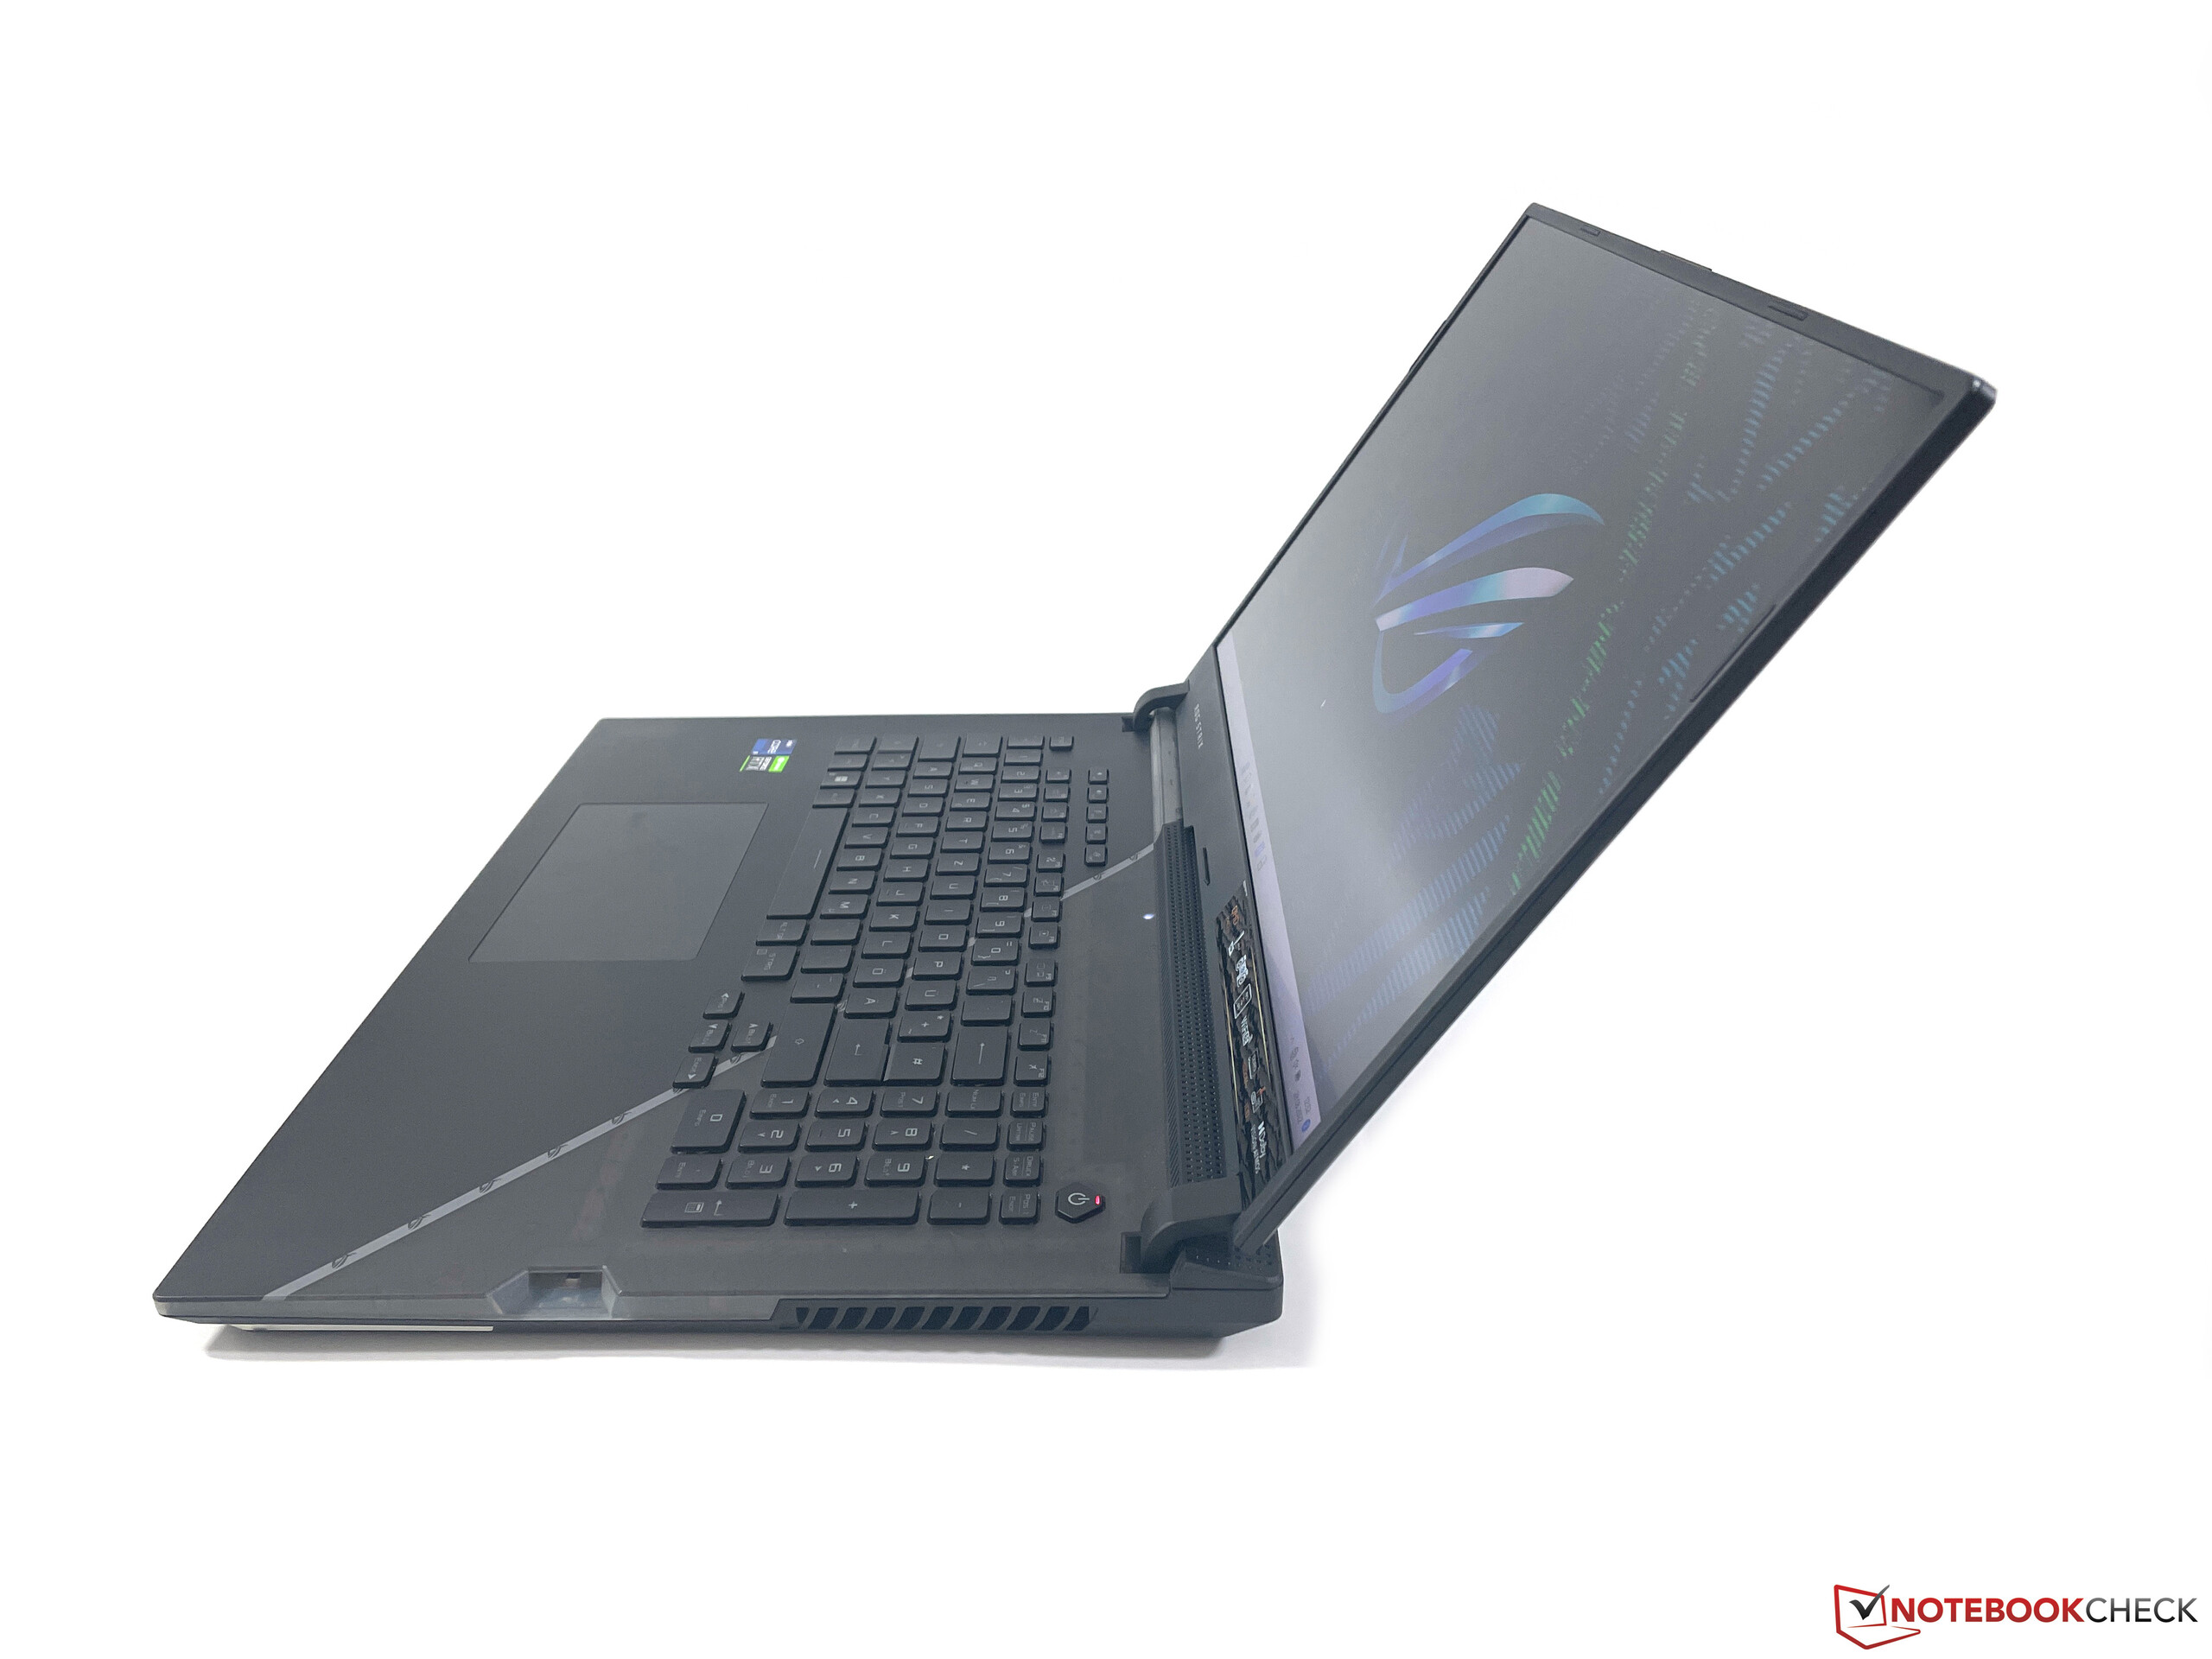
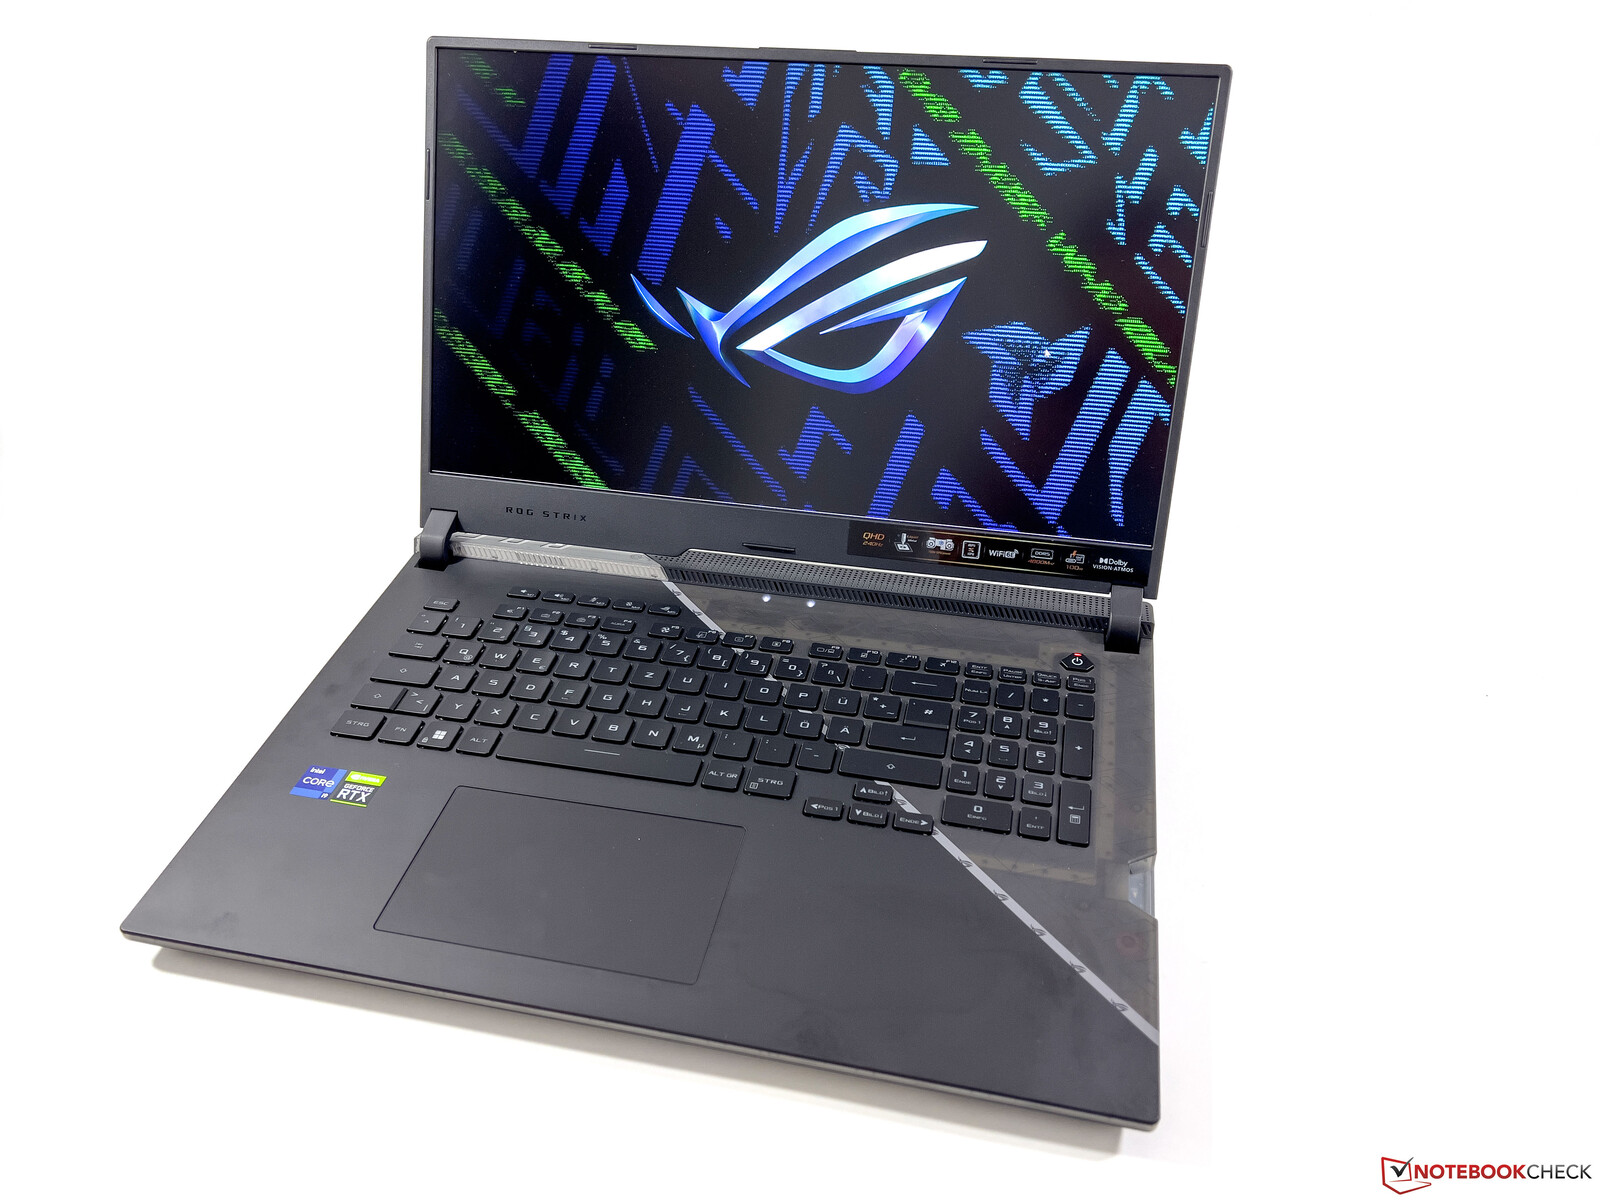
Case - Laptop de jogos com um design que se destaca e uma iluminação extensa
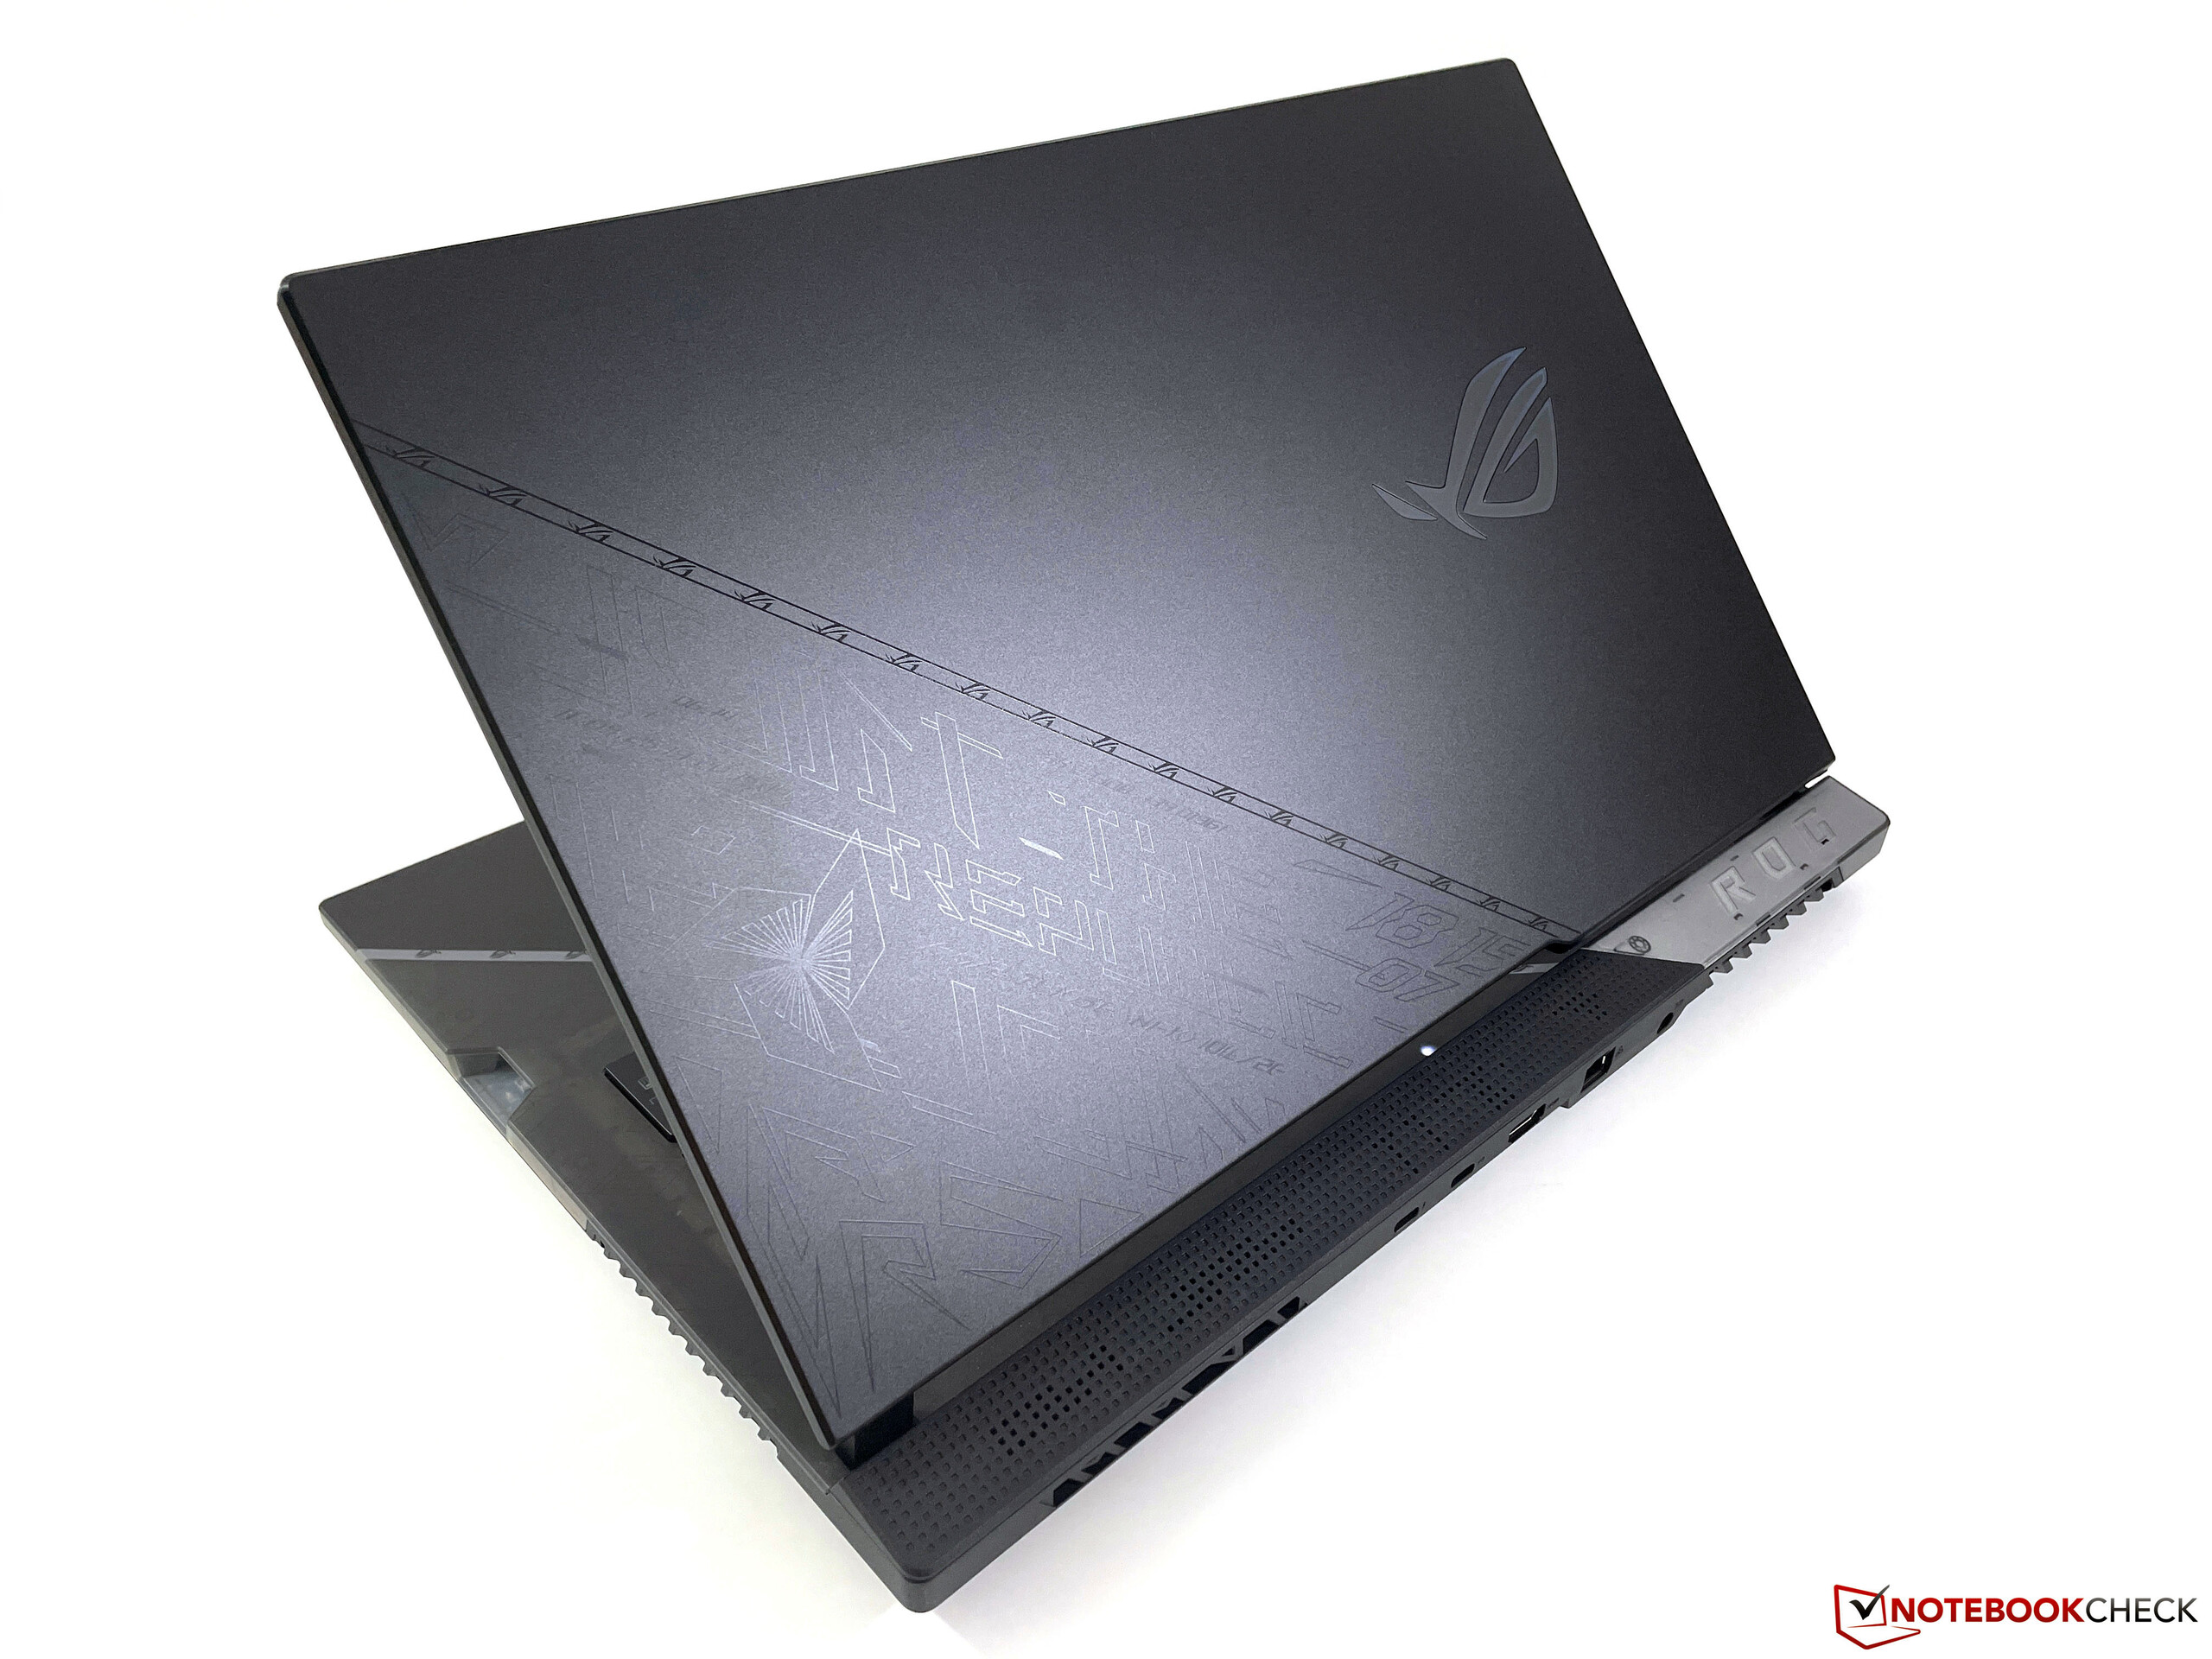
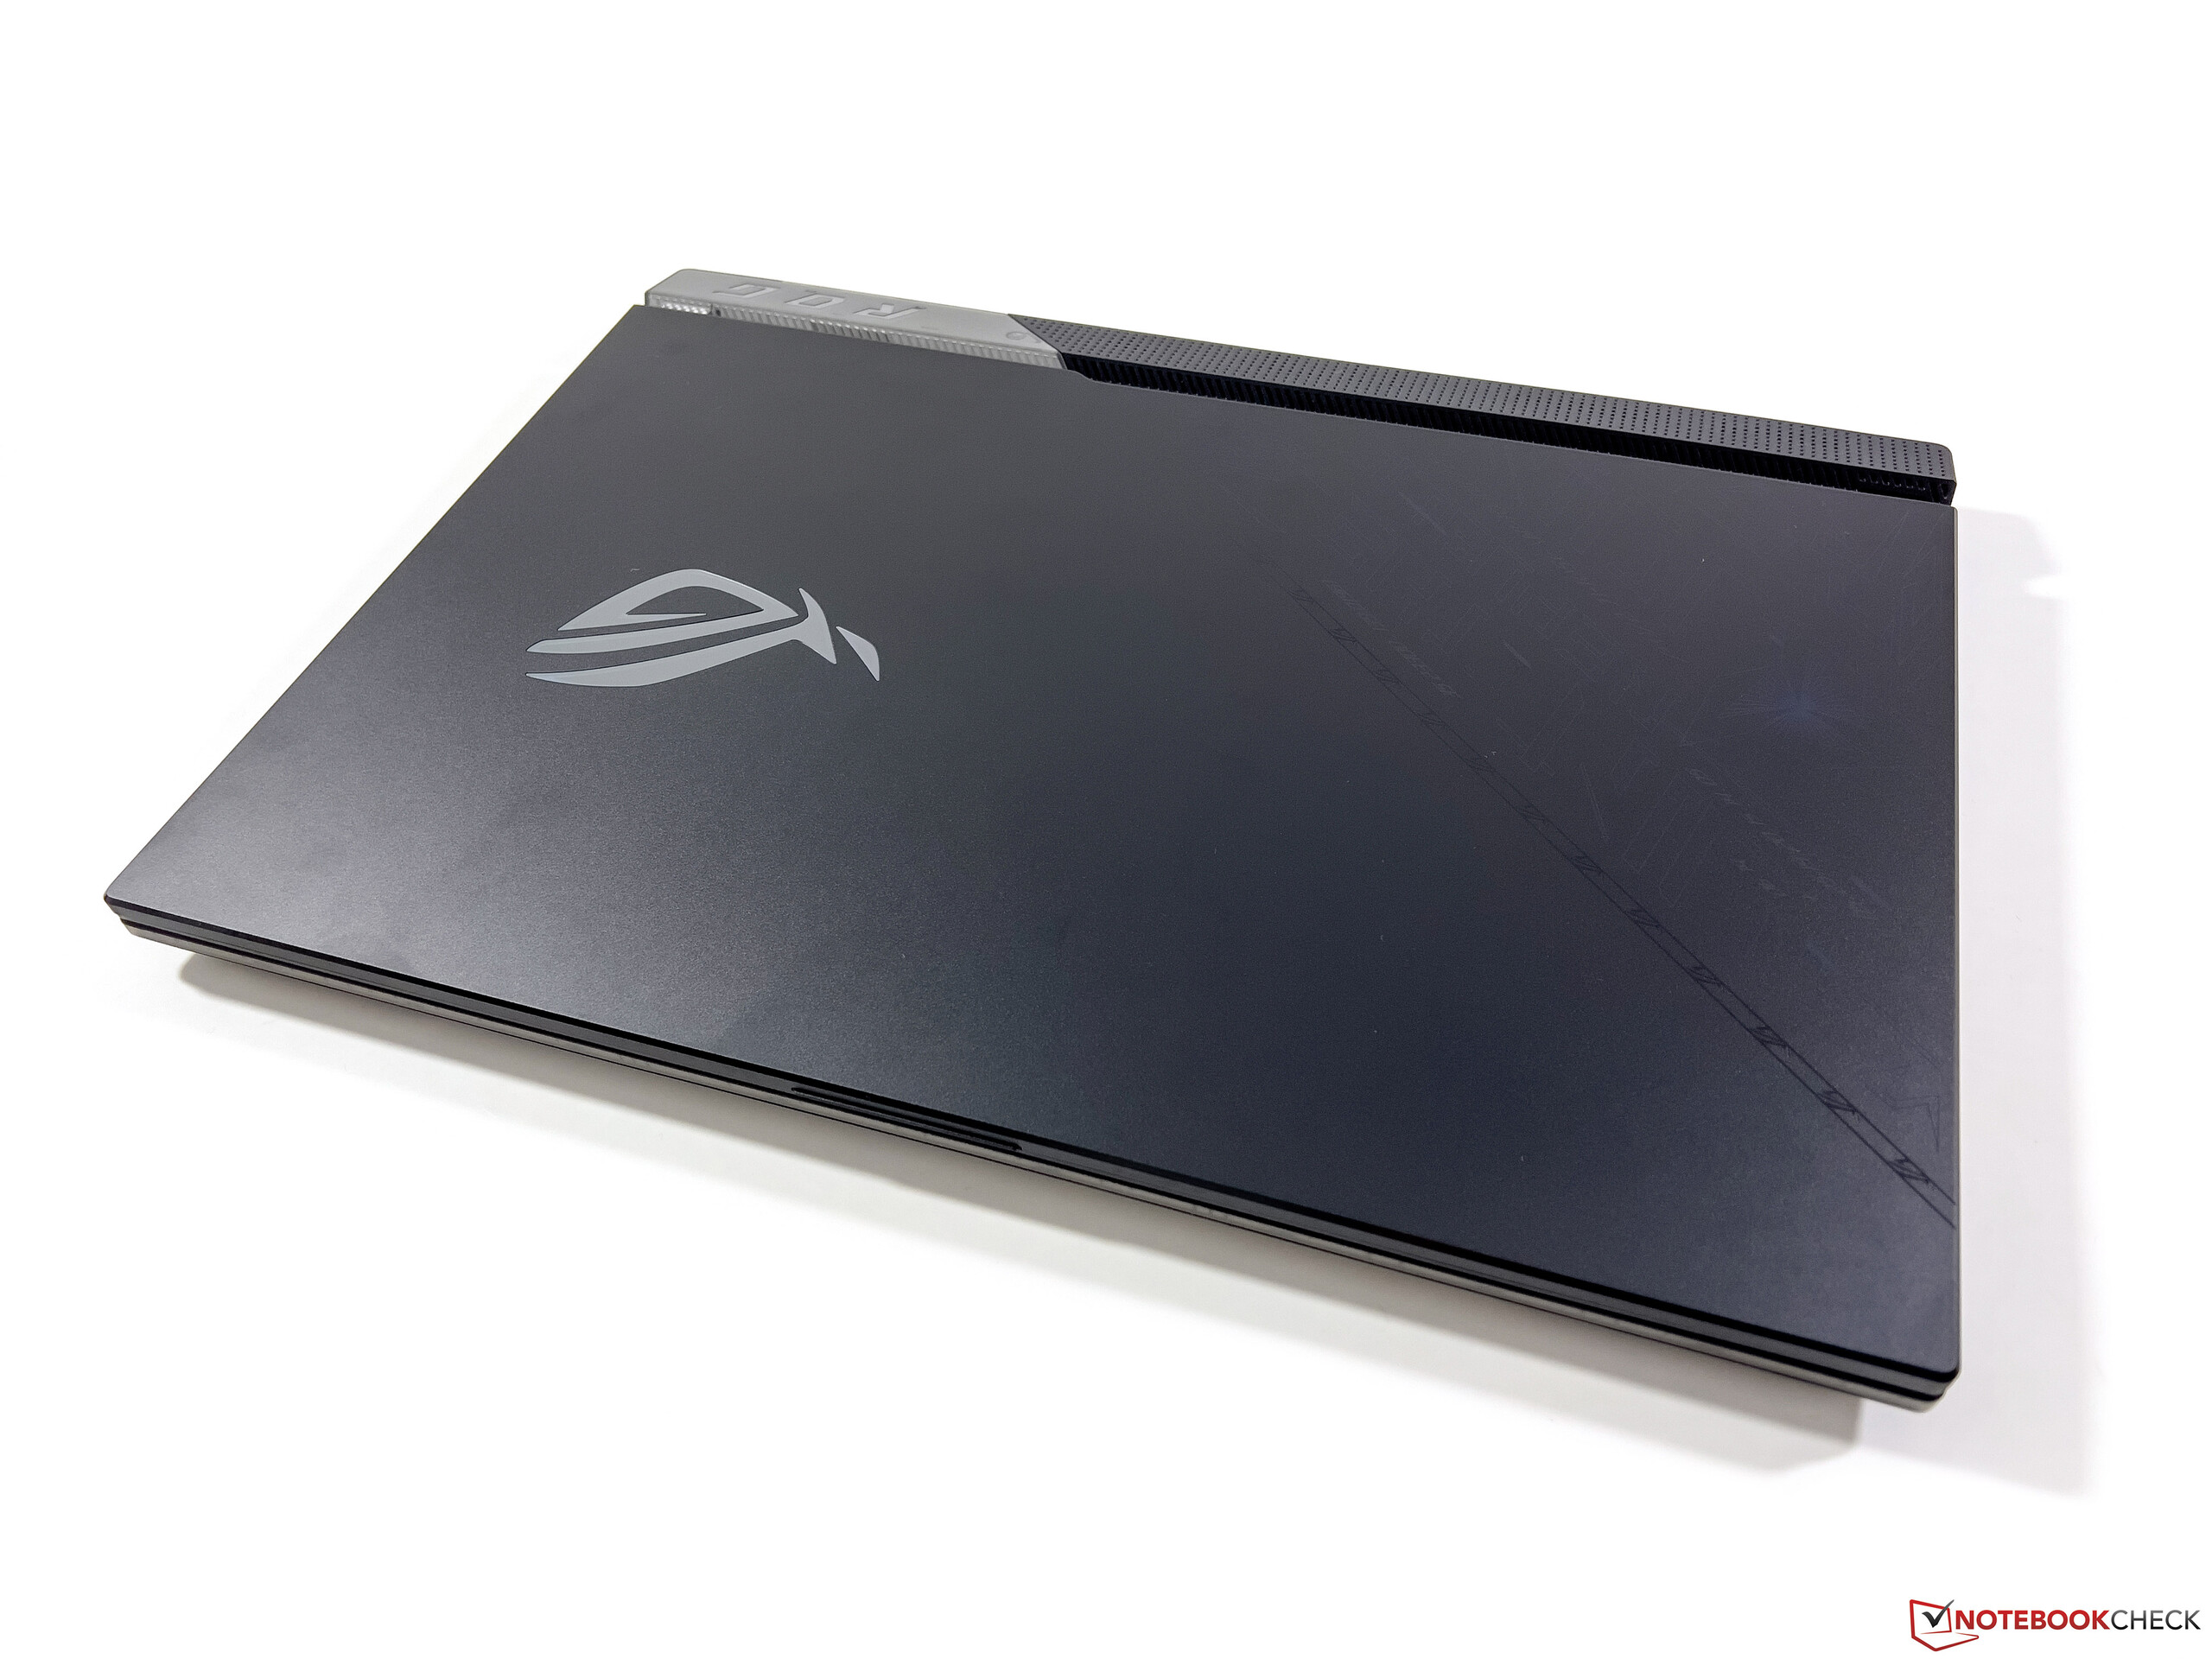
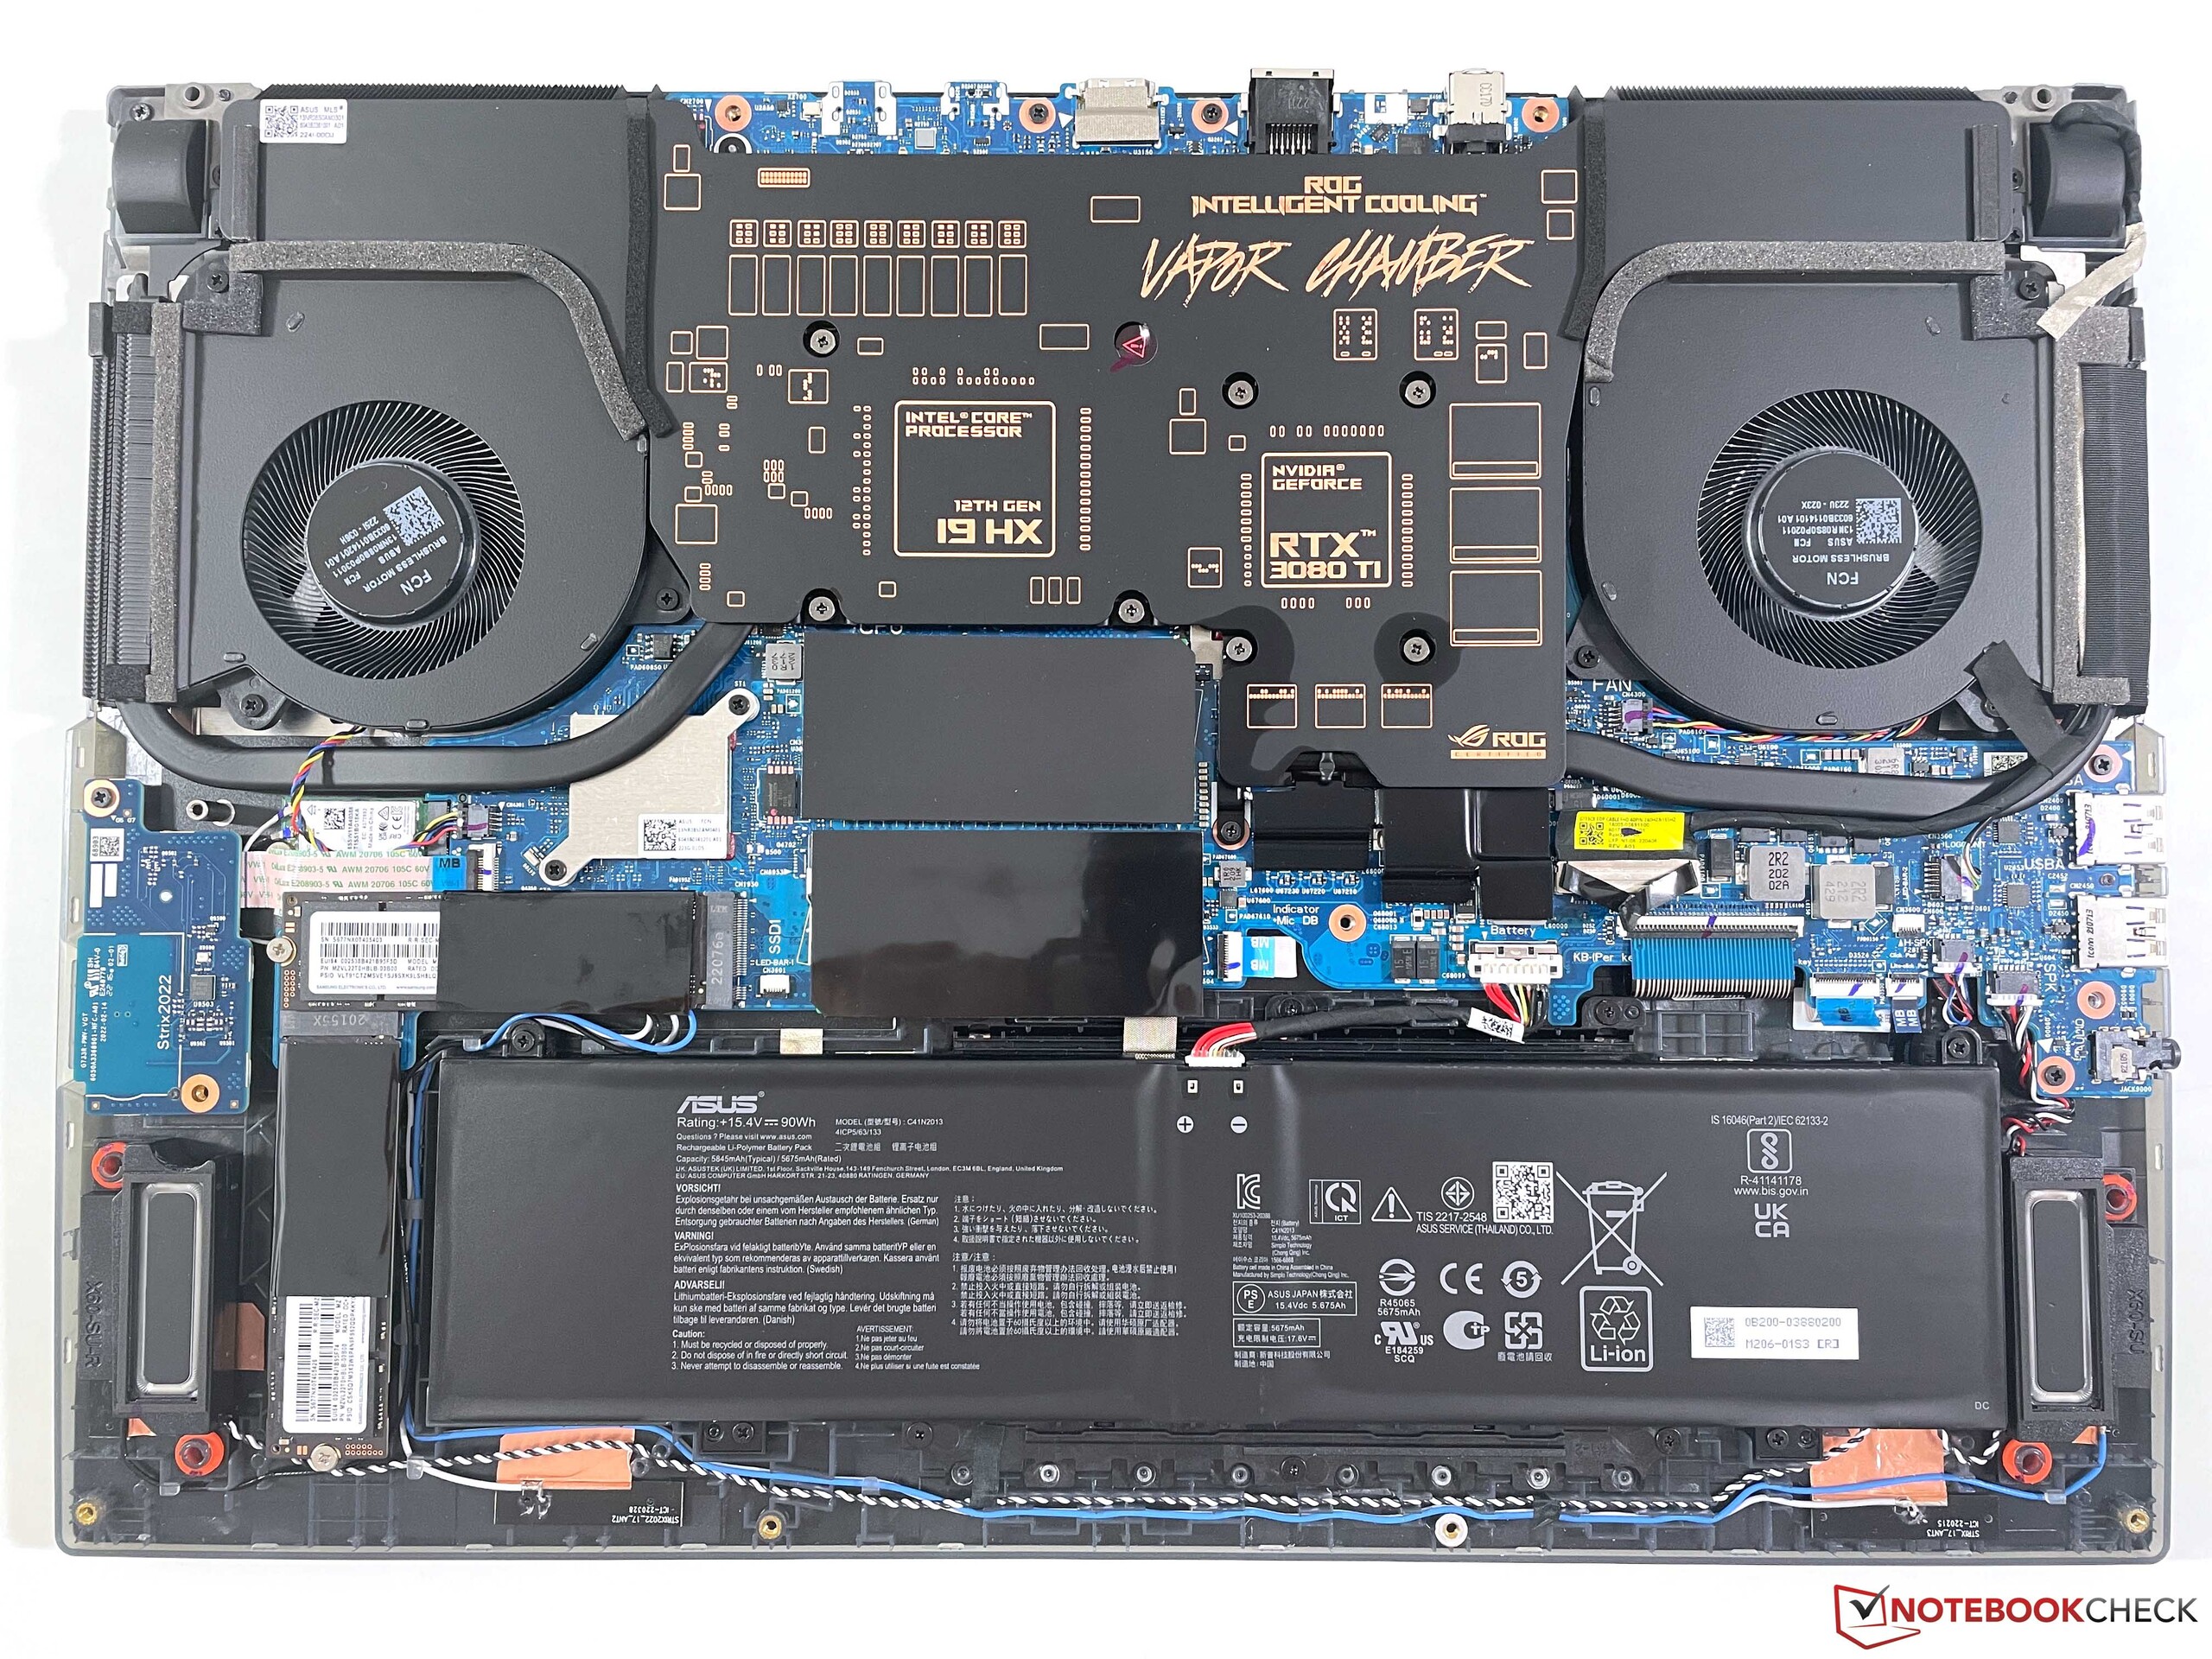
O ROG Strix Scar 17 é claramente um laptop de jogo que não esconde de forma alguma suas ambições. O caso é, em grande parte, idêntico ao g733QS do ano passadoe uma parte da unidade base é transparente novamente. Além disso, há elementos amplamente iluminados e alguns elementos adicionais de design ou artifícios, como a escrita especial na tampa que só se torna visível quando se acende uma luz UV sobre ela
A qualidade da caixa plástica é boa em geral, mesmo que as superfícies continuem a ser propensas a impressões digitais e você possa ouvir o ruído ocasional de rangidos leves ao abrir o visor, por exemplo. A estabilidade da unidade base espessa é decente, mas você ainda pode pressionar minimamente a unidade base na área central do teclado. Enquanto a tampa relativamente fina do visor faz um bom trabalho, a dobradiça ainda é incapaz de evitar alguns leves rangidos depois que o laptop é movido, por exemplo.
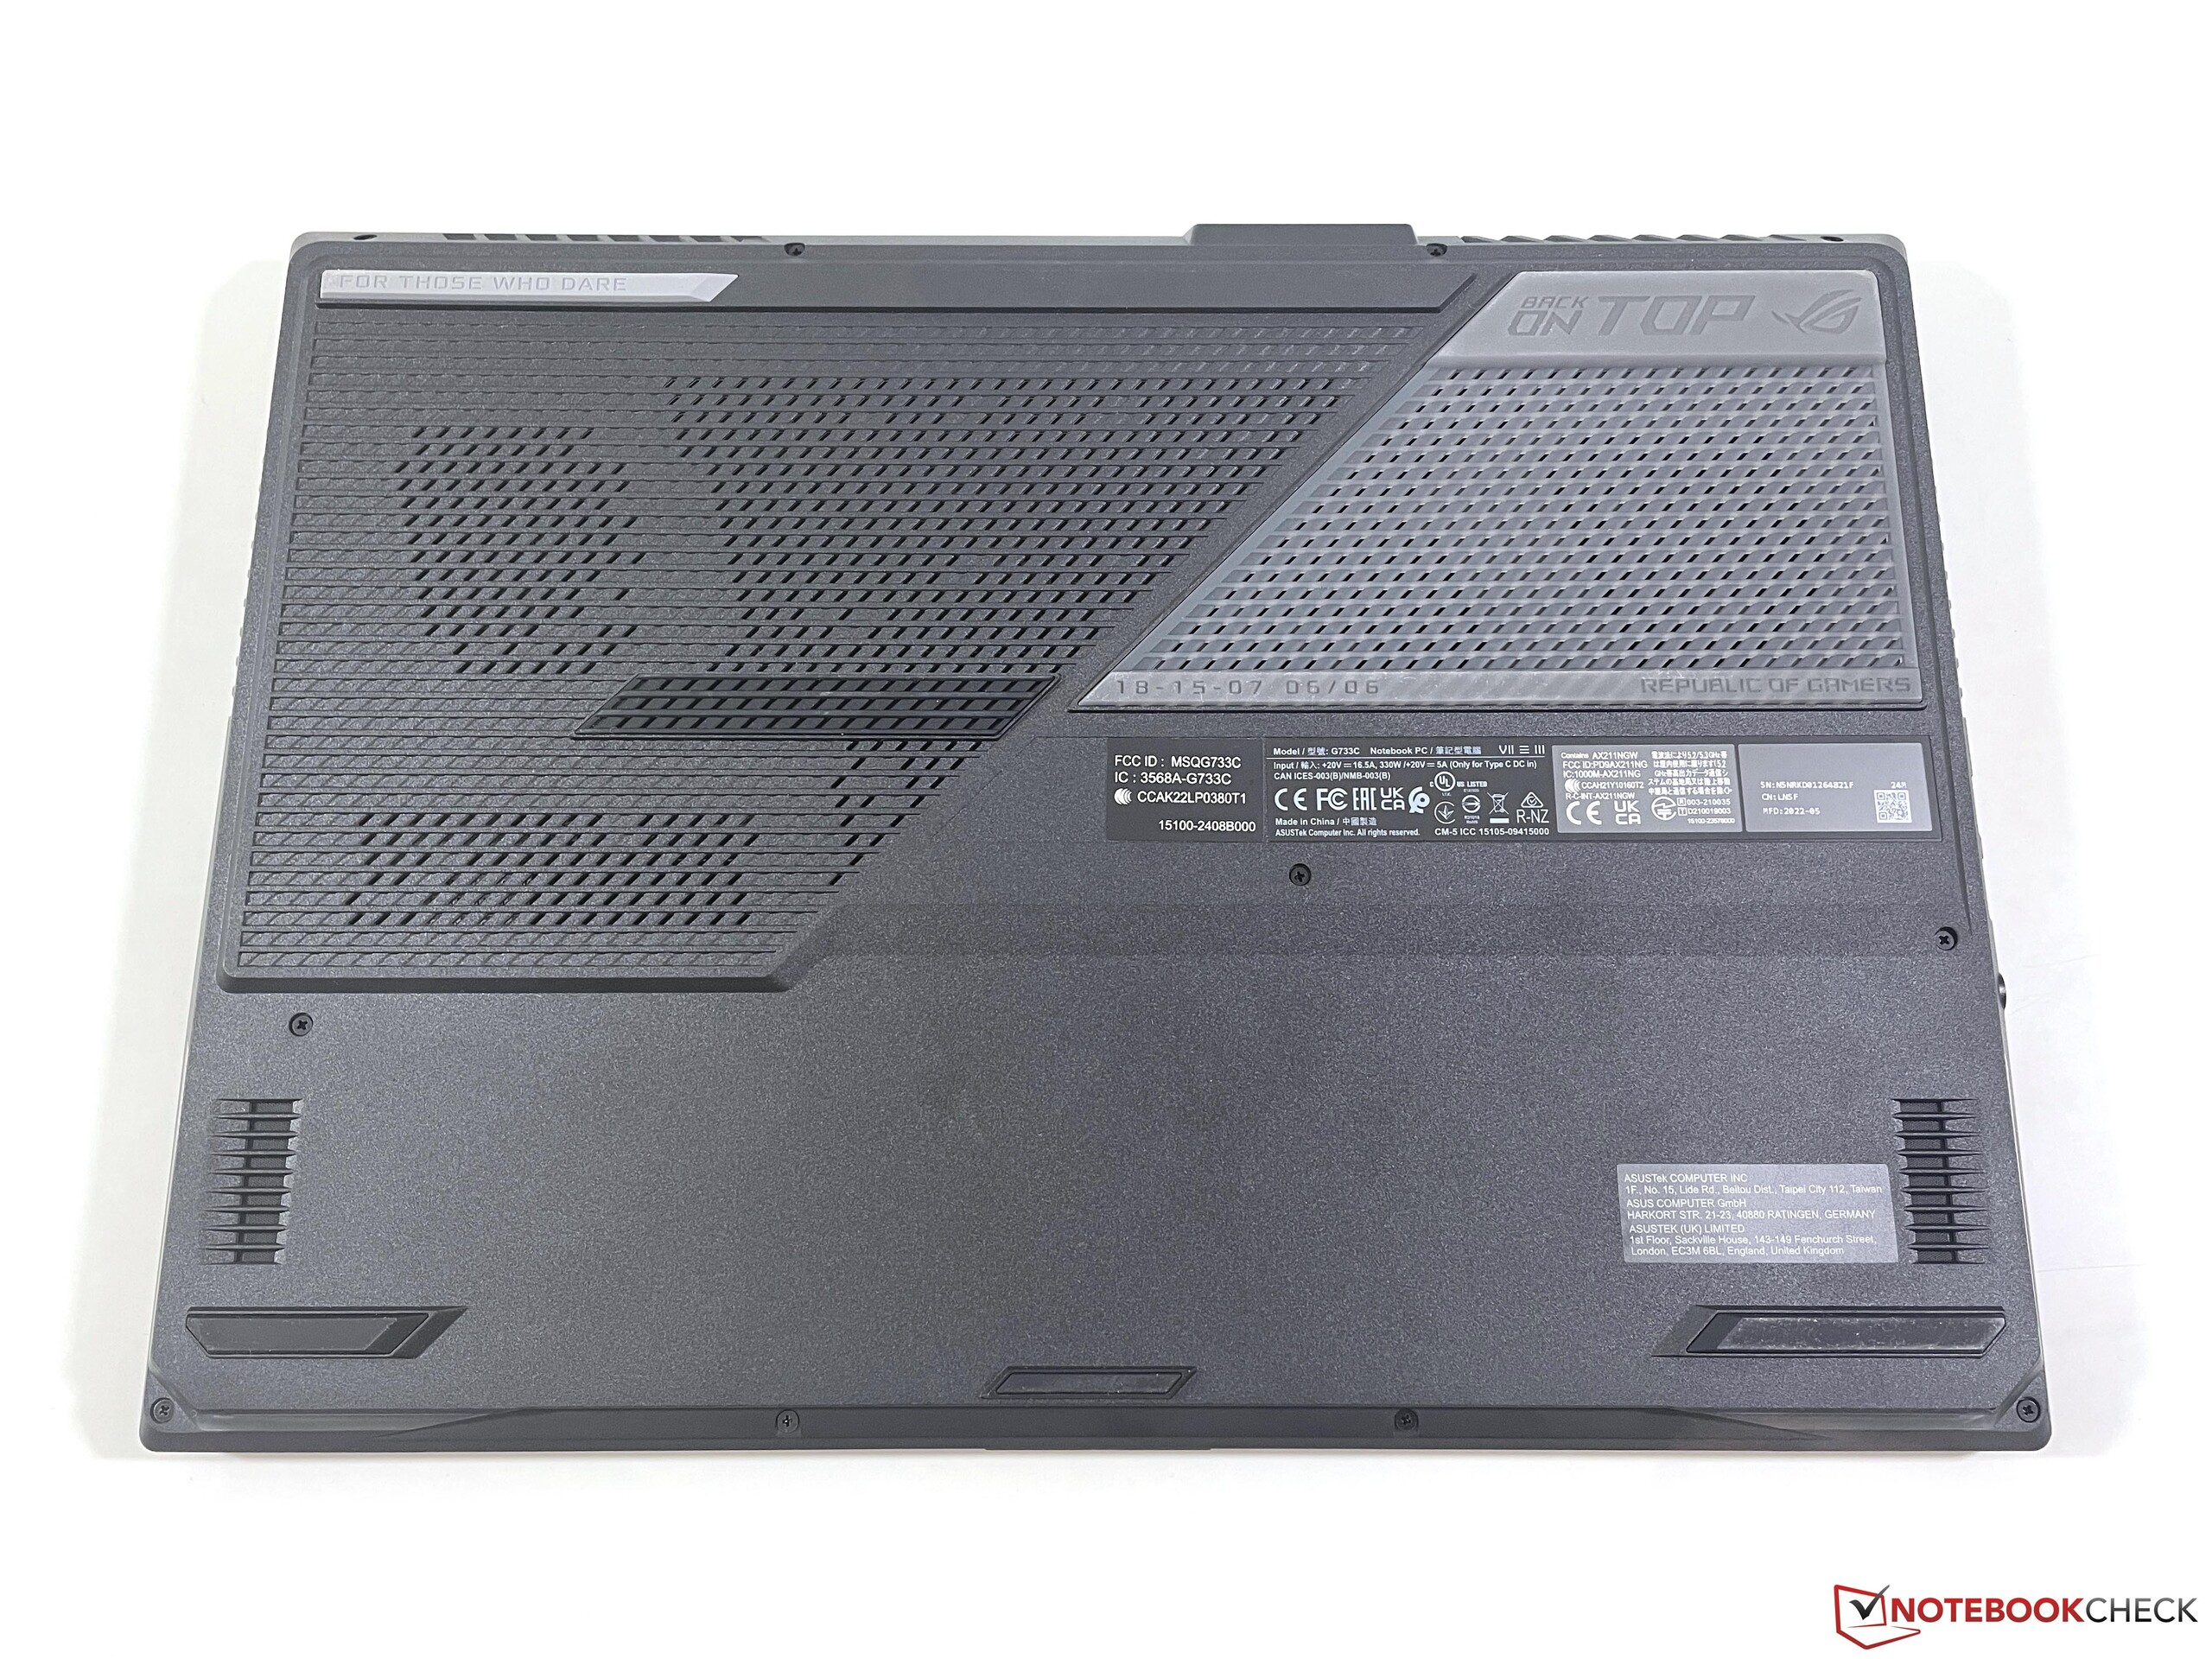
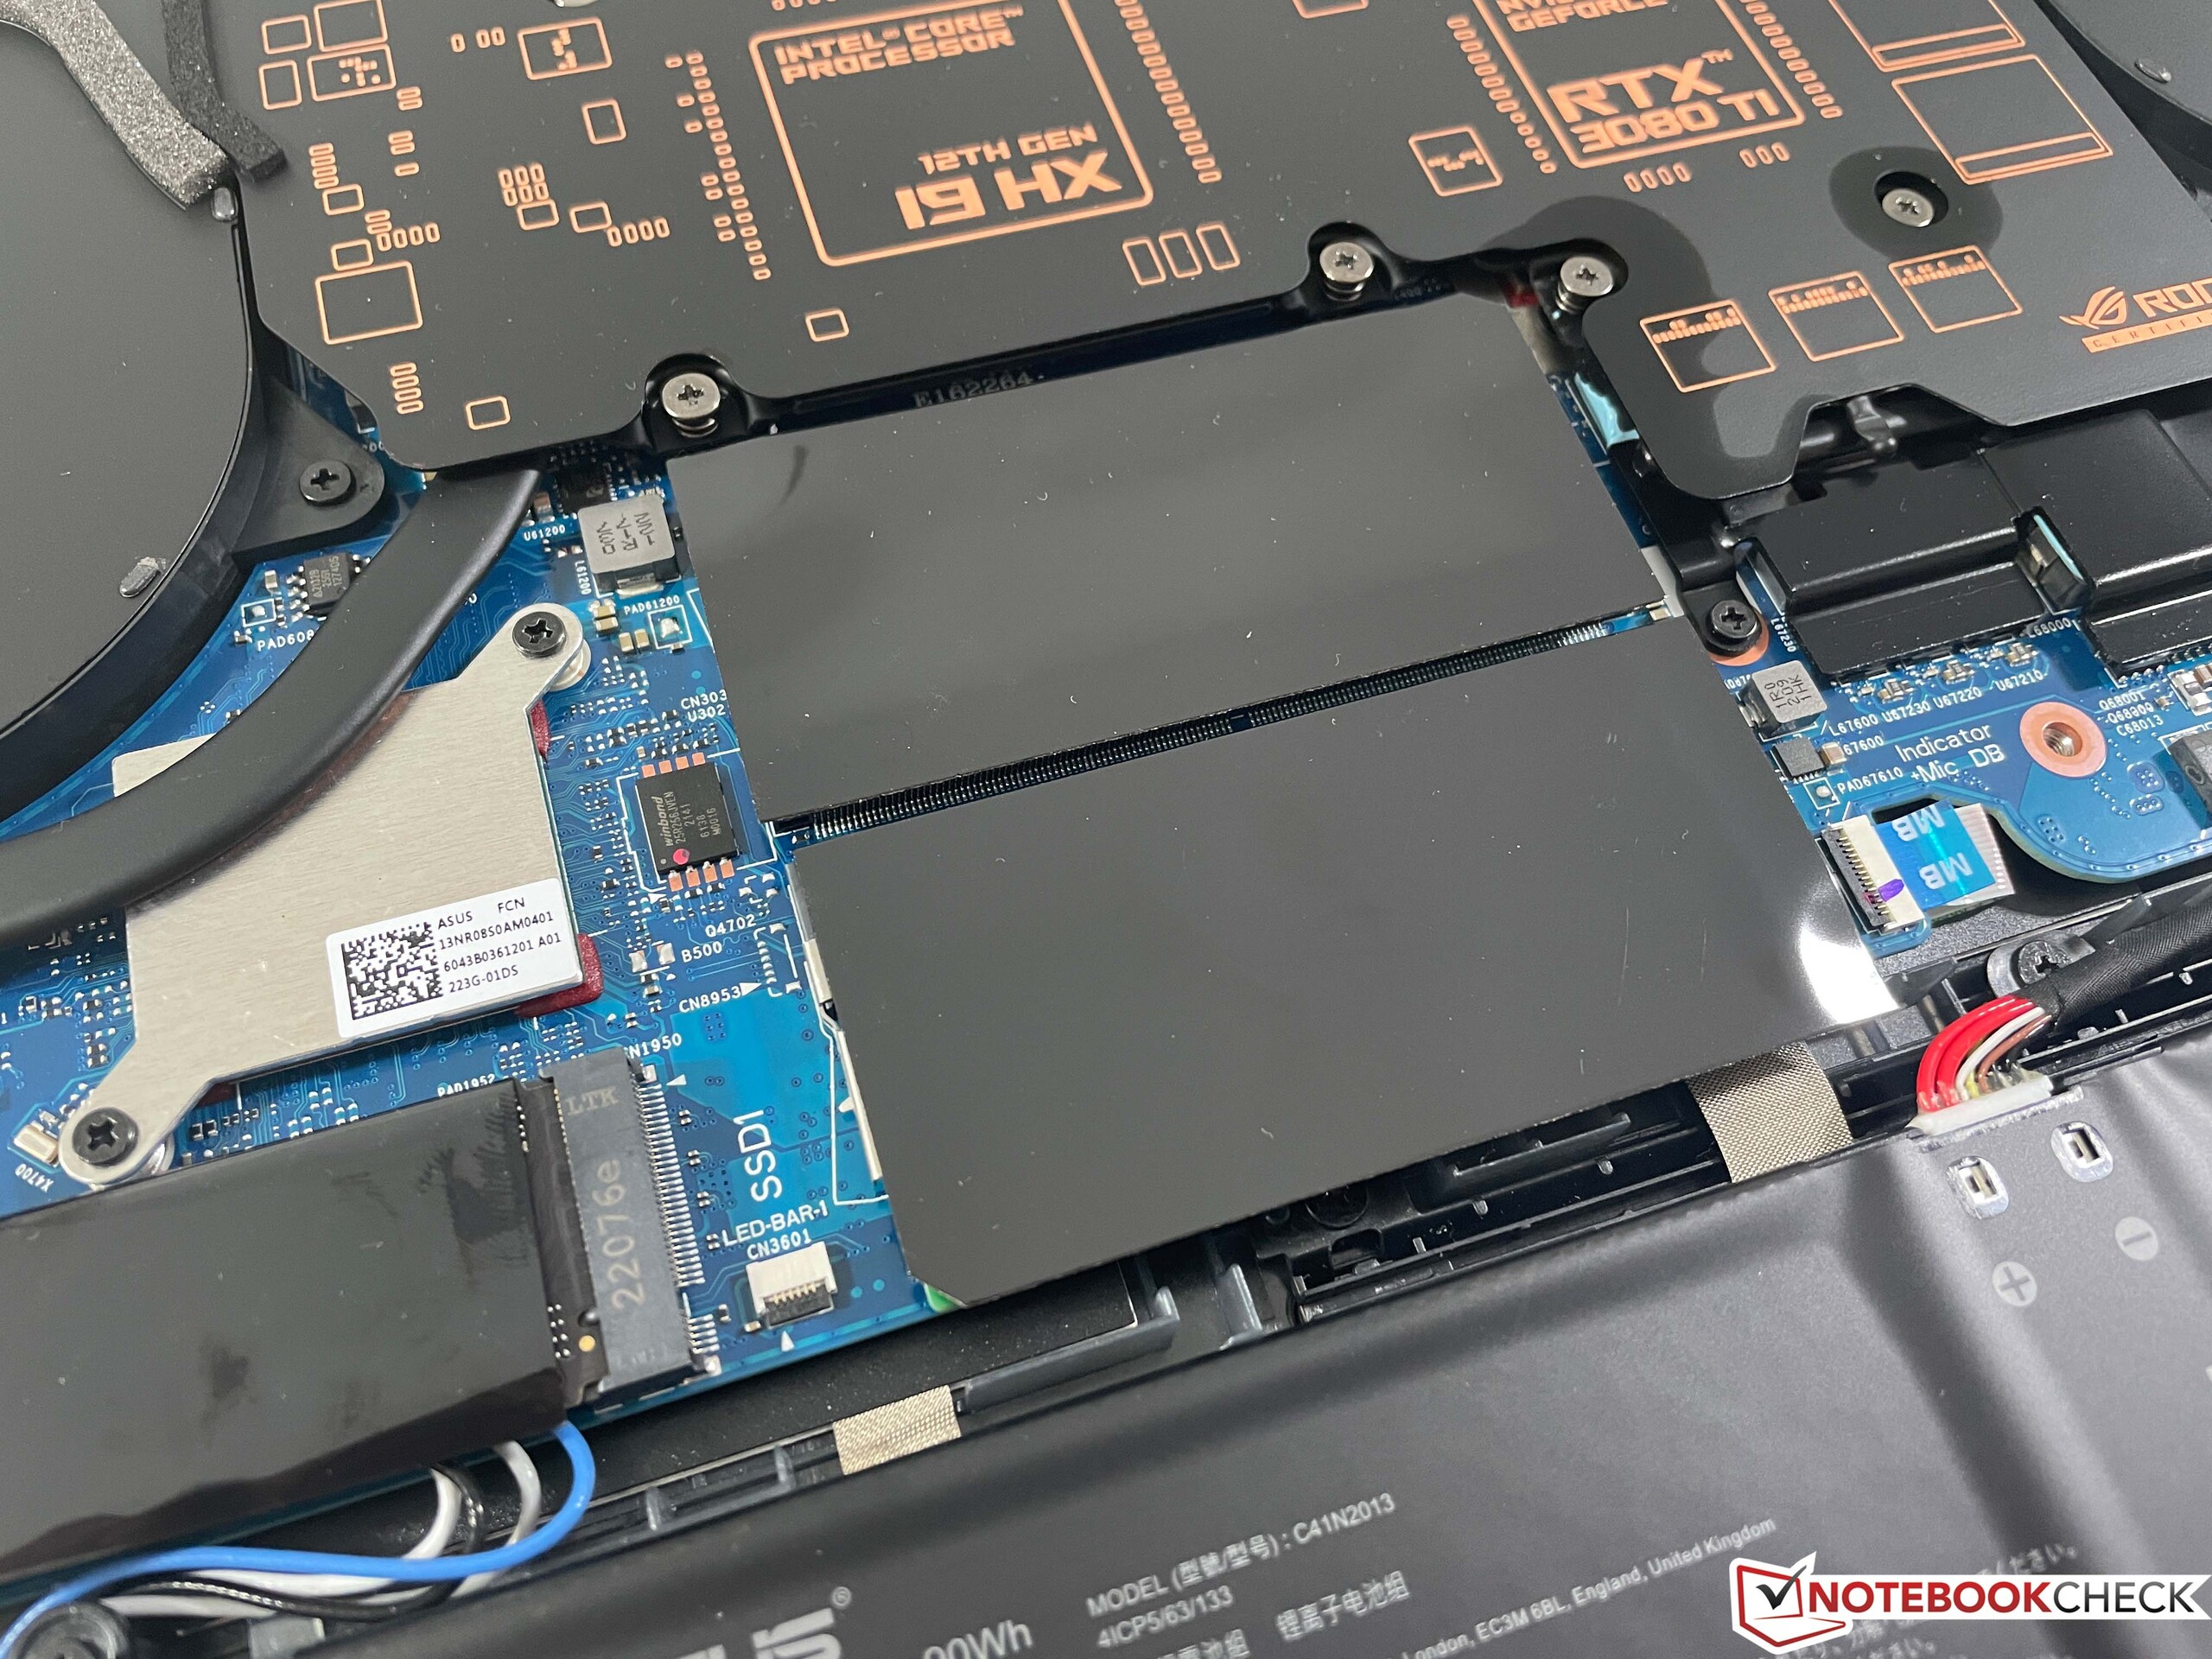
Mesmo que a tampa inferior da caixa possa ser removida, você tem que ter cuidado ao fazer isso. Como a iluminação está integrada na peça, primeiro é necessário desconectar dois pequenos cabos planos, antes de remover a tampa. Com acesso aos ventiladores, os dois SSDs, dois módulos de RAM e o módulo WLAN, as opções de manutenção são boas.
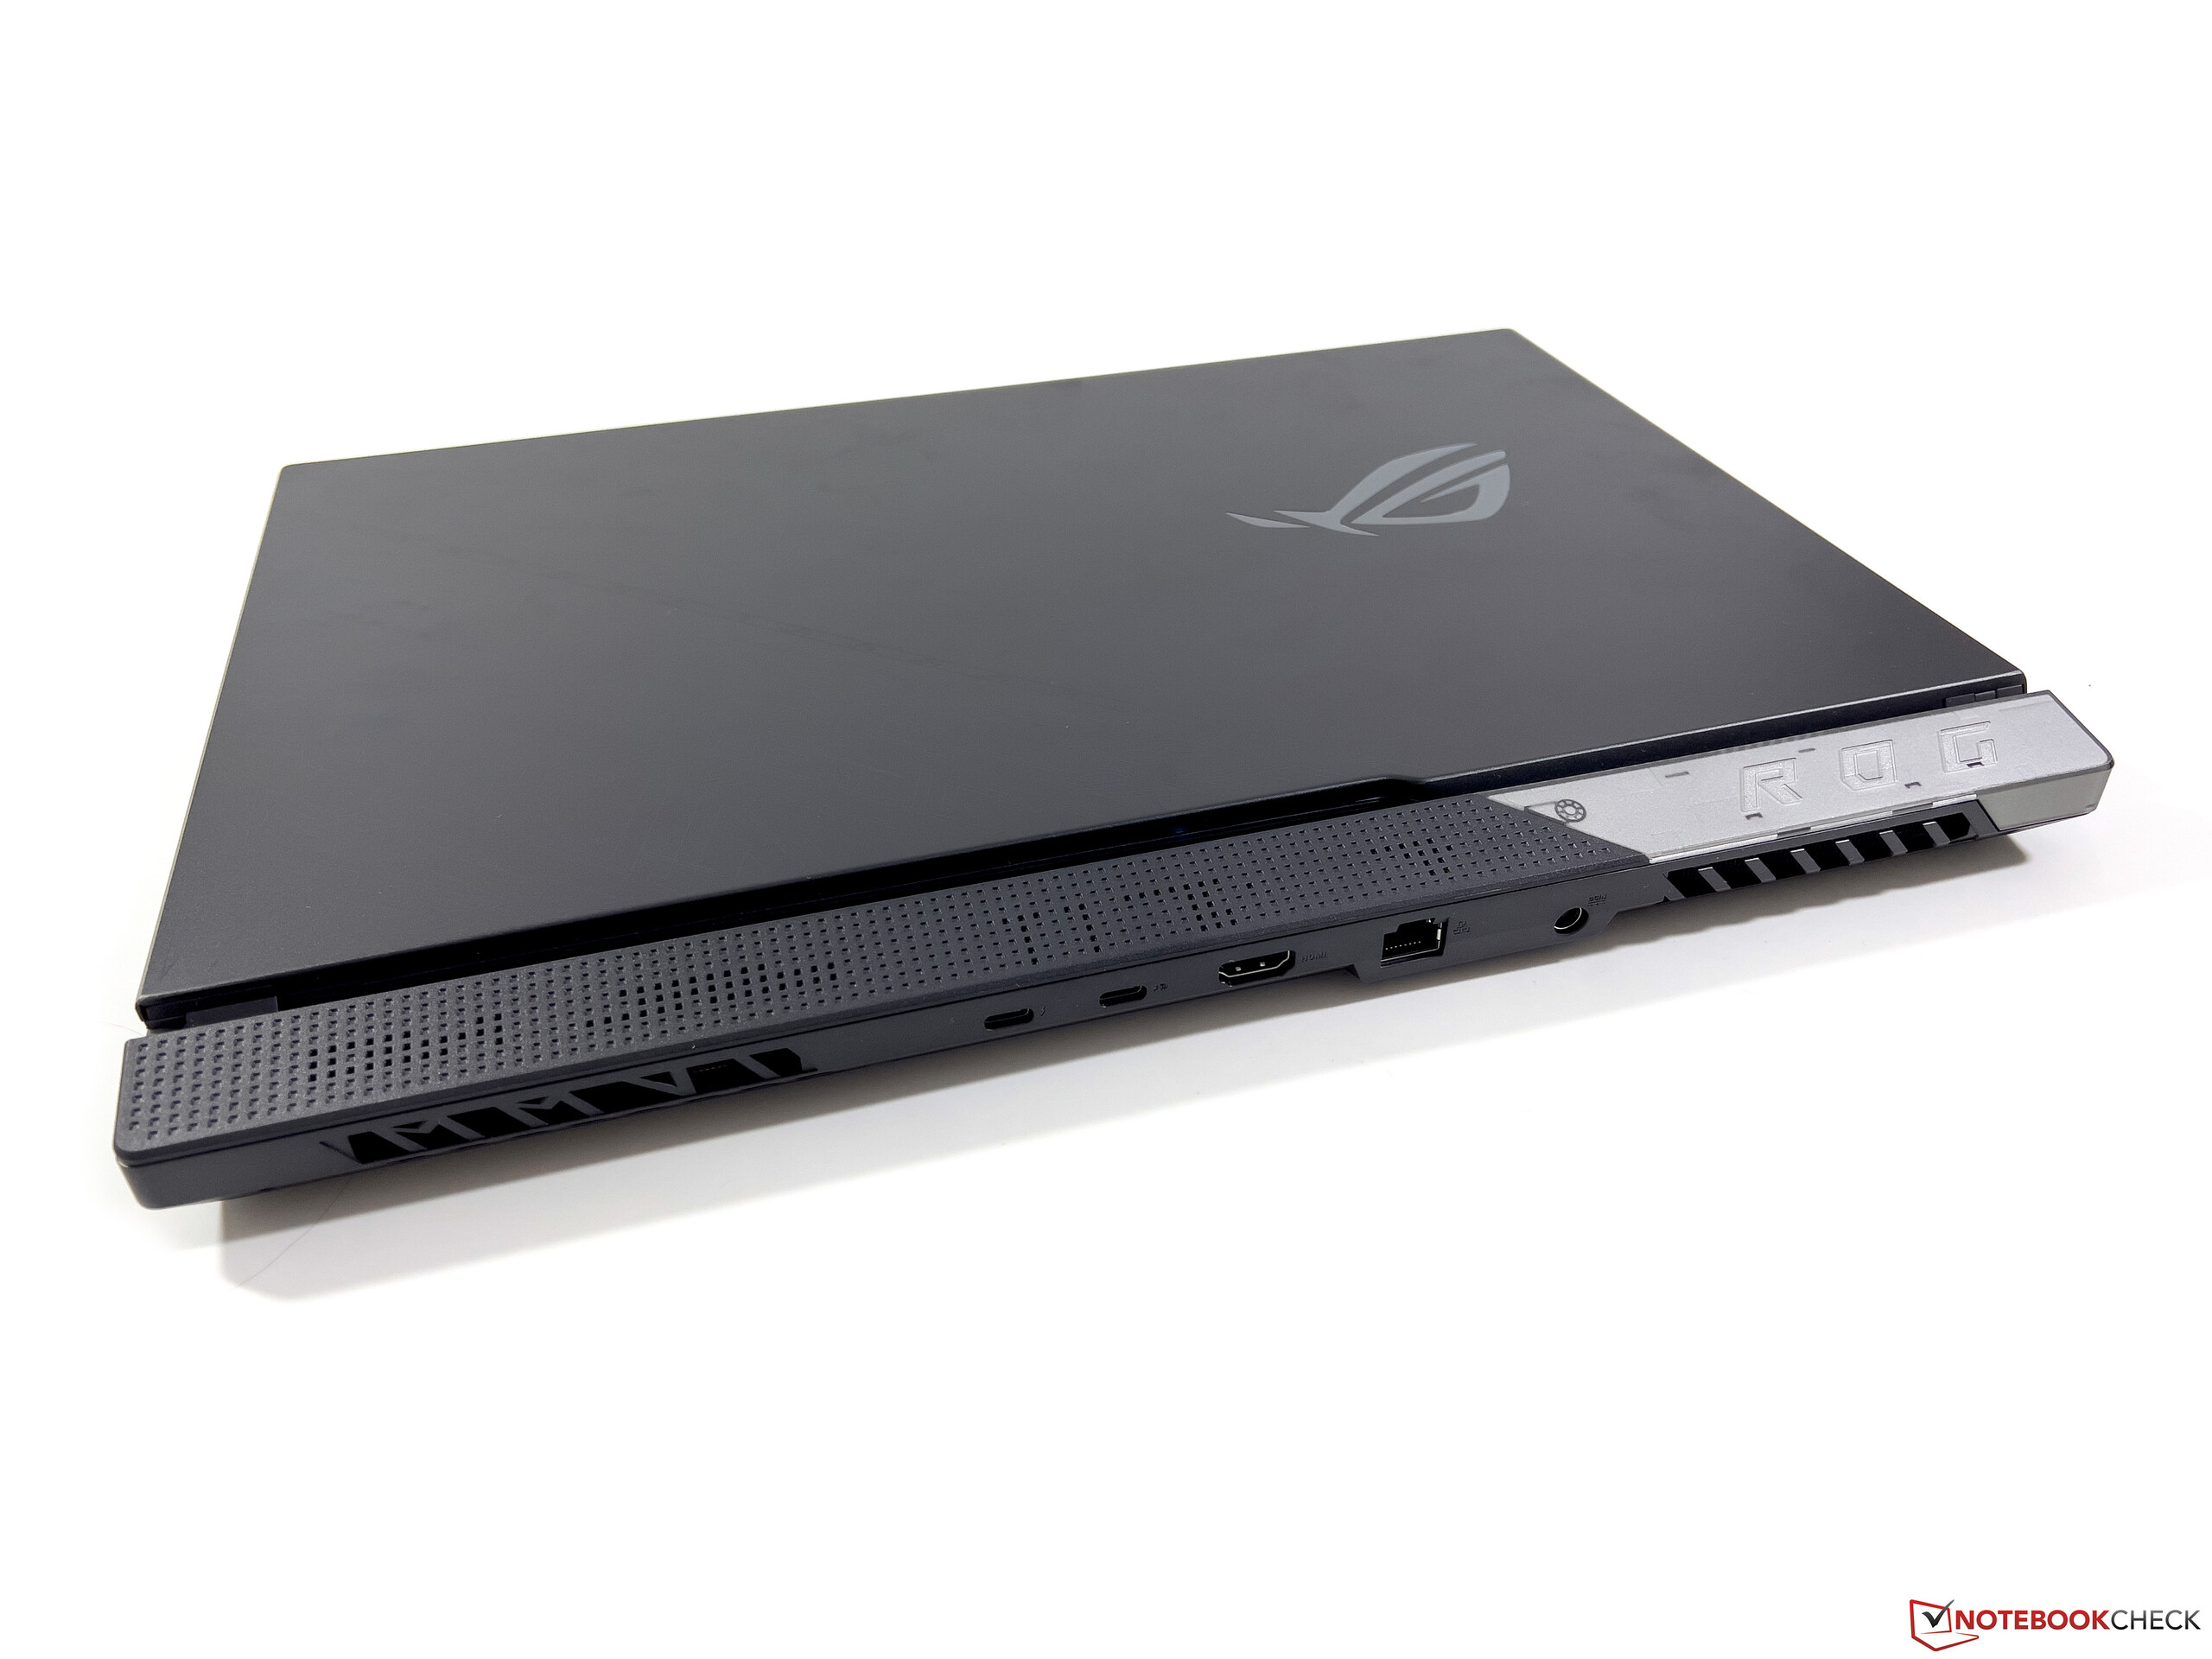
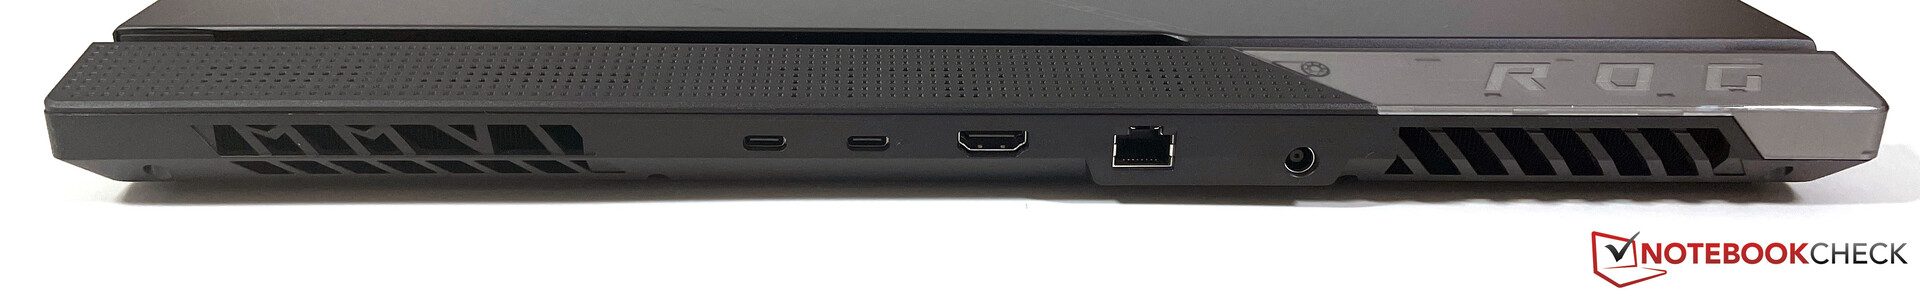
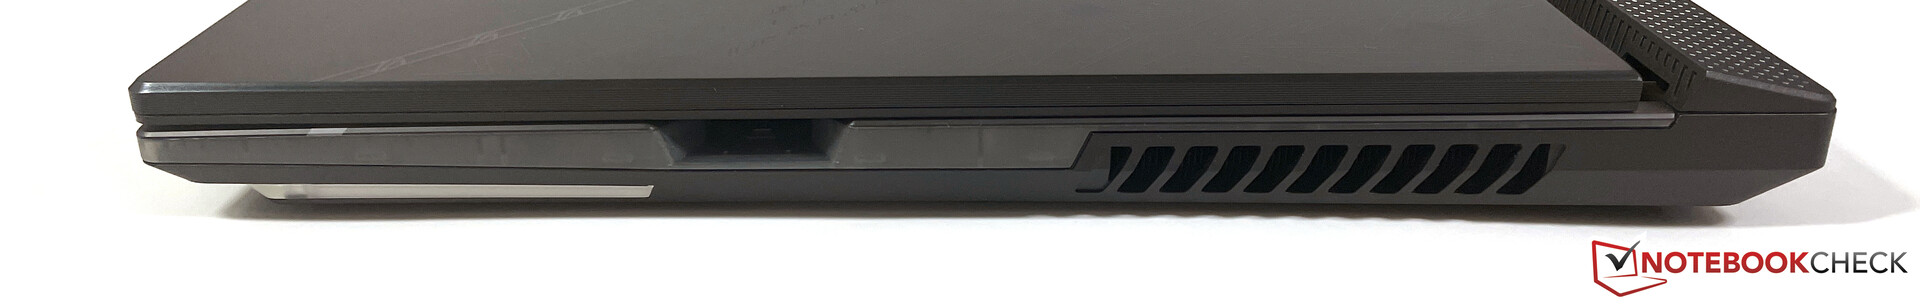
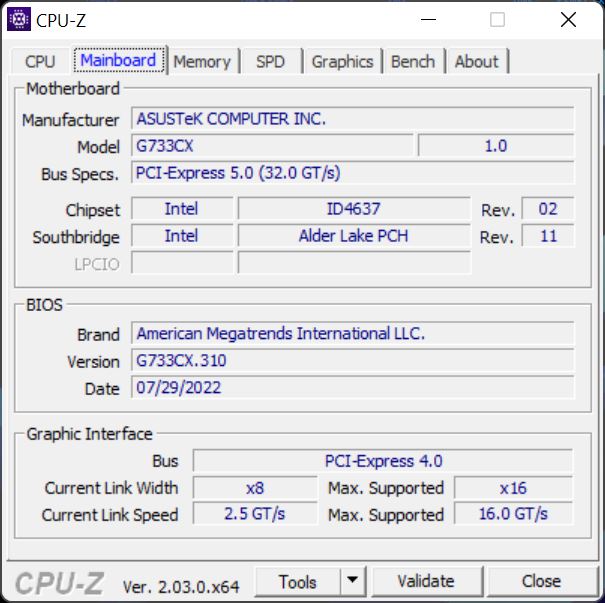
Equipamentos - ROG Strix Scar 17 com HDMI 2.1 & Wi-Fi 6E
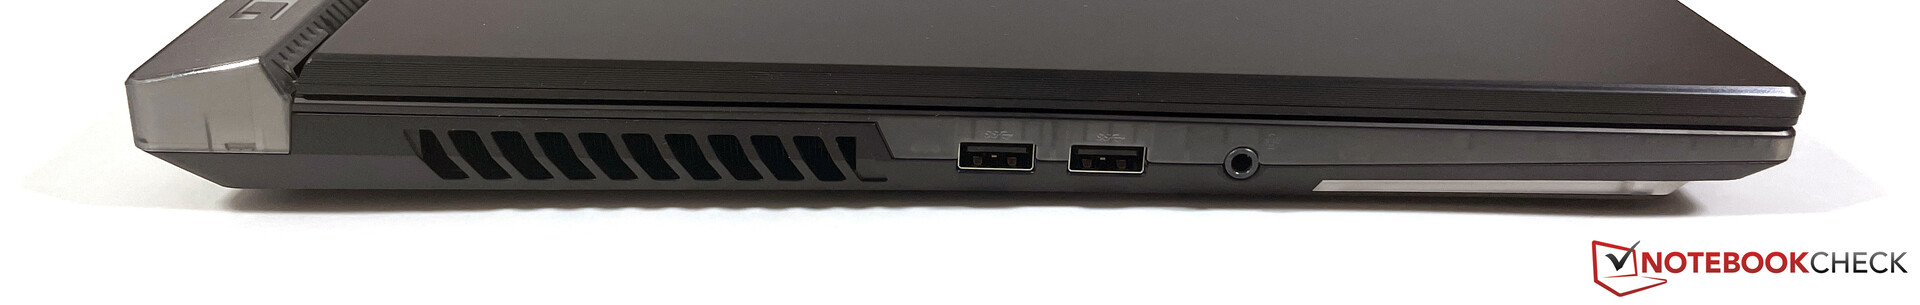
Além de uma conexão Thunderbolt, o G733CX oferece uma porta HDMI 2.1, e a porta USB na parte traseira também pode ser usada para carregar na estrada (máx. 100 watts). A maioria das conexões estão na parte traseira, e você encontrará apenas duas portas USB-A normais e a porta de áudio de 3,5 mm no lado esquerdo. O lado direito também oferece um slot para o Asus Keystone, permitindo armazenar as configurações e os dados do sistema.
O desempenho da WLAN com Intel AX211 é muito bom, e também conseguimos nos conectar à rede de 6-GHz de nosso roteador de referência Asus sem nenhum problema. Há também uma conexão Ethernet com 2,5 Gbit/s para conexões com fio. Os usuários do ROG Strix Scar 17 têm que passar sem uma webcam, mas se necessário, o fabricante oferece uma webcam externa correspondente (ROG Eye S).
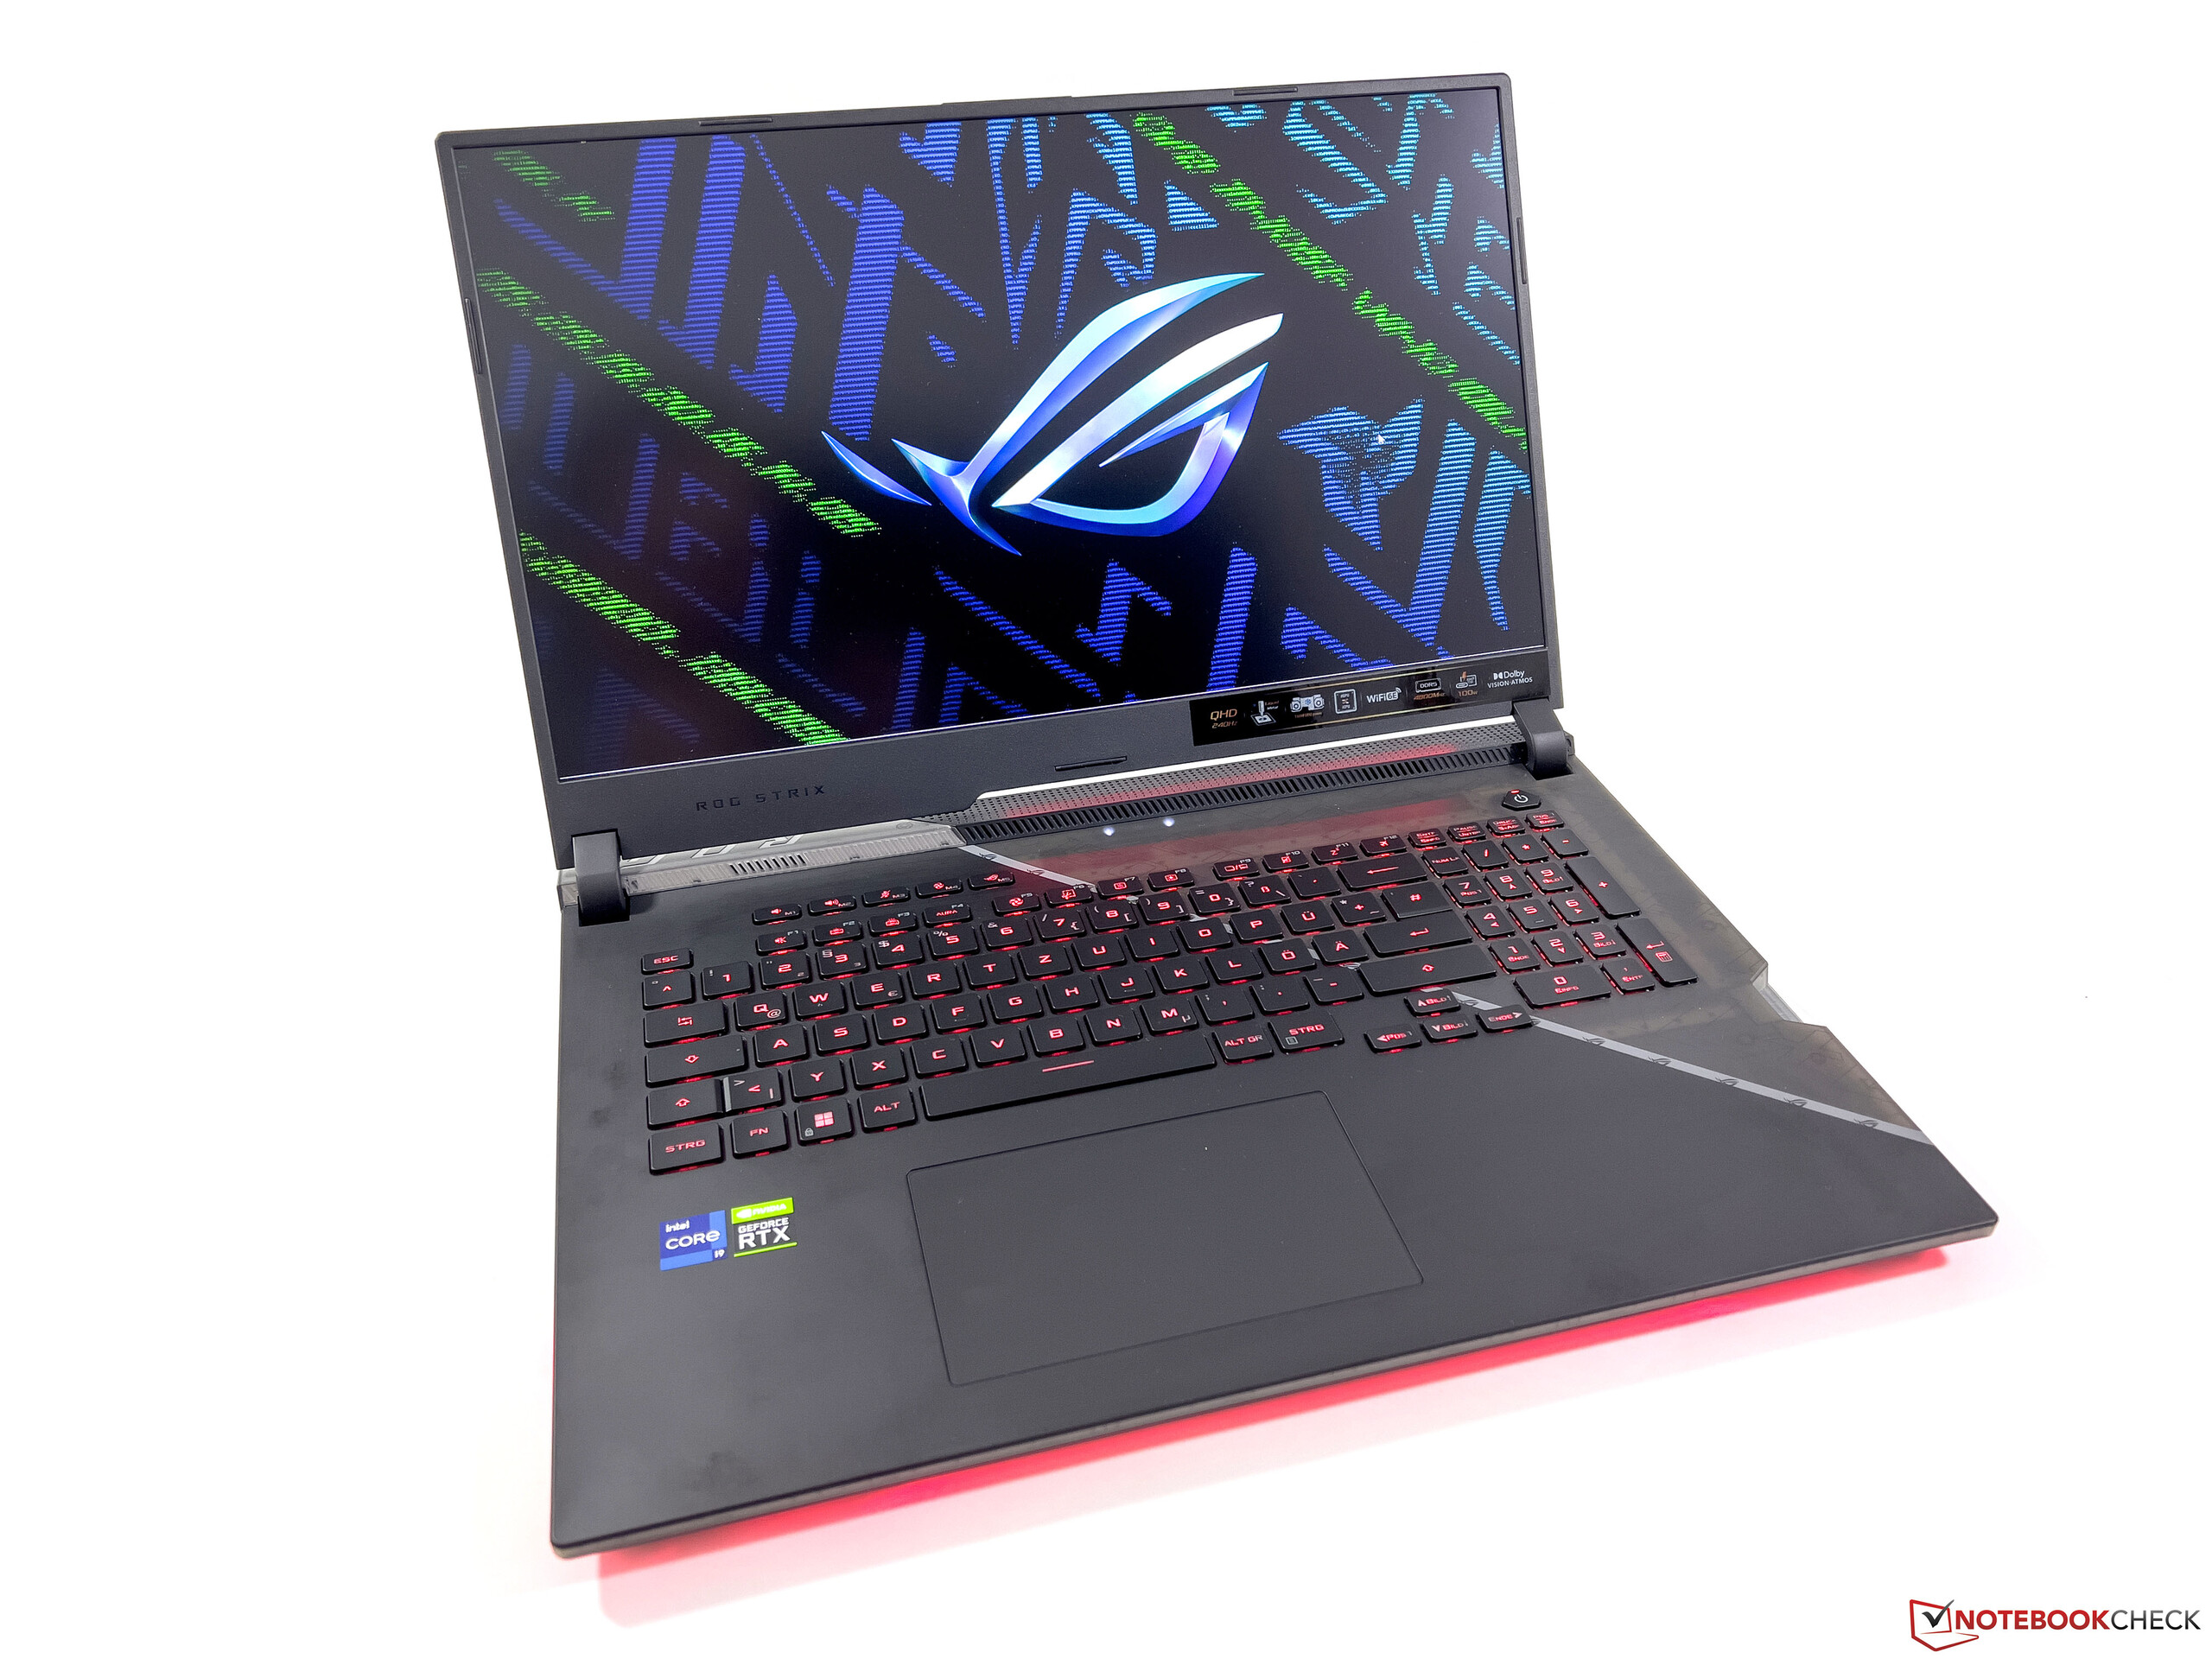
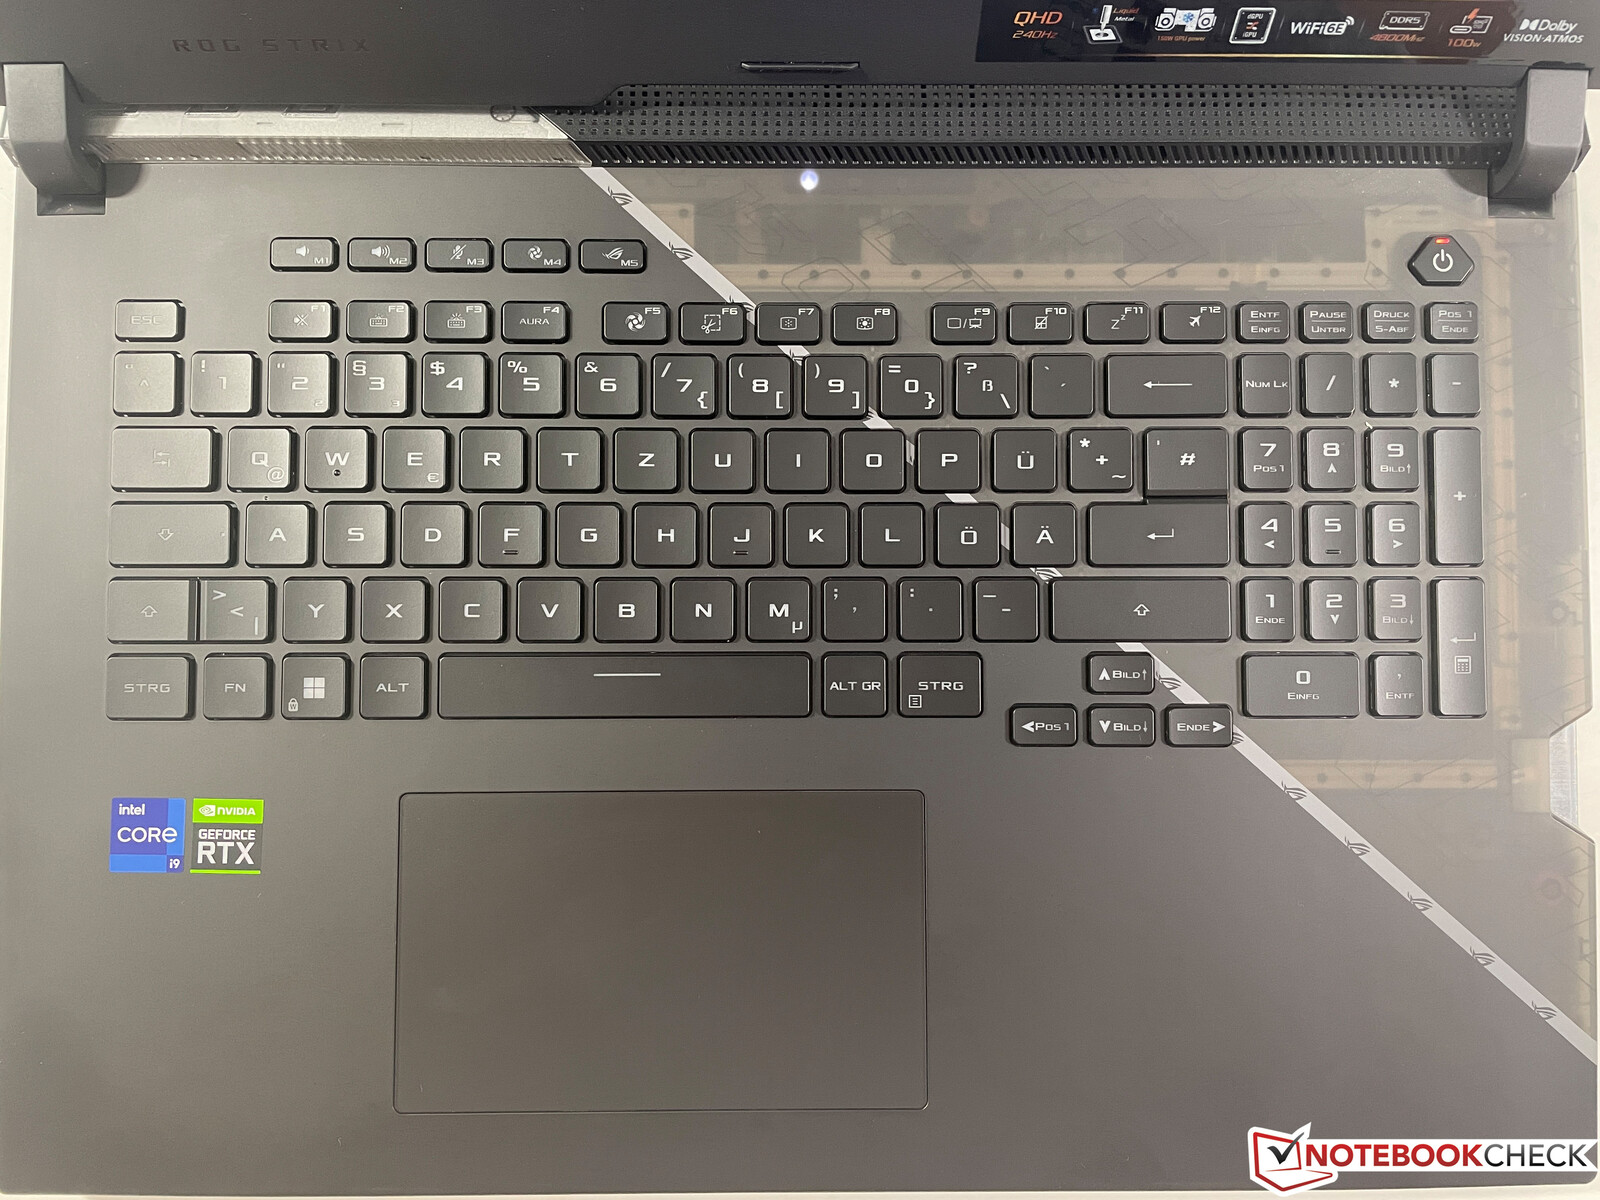
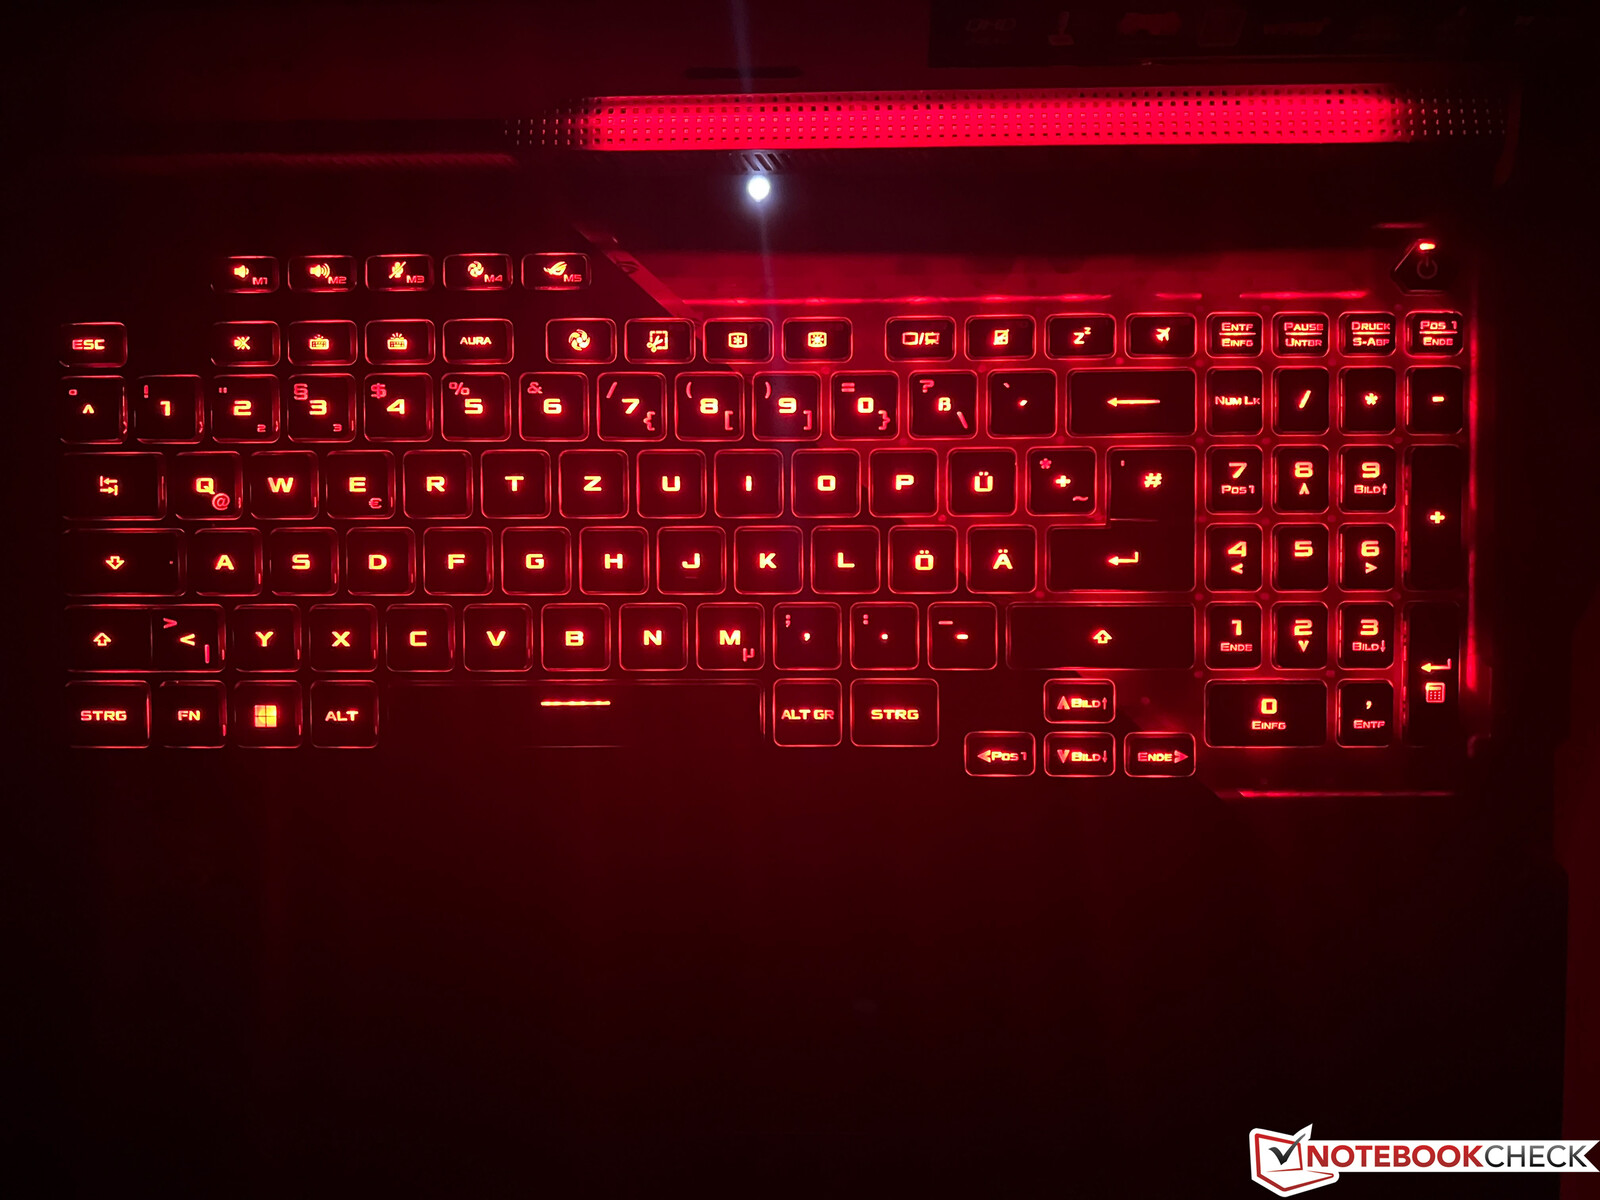
Dispositivos de entrada - Asus com um bom teclado
O Asus mudou novamente o layout do teclado, agora usando um layout mais convencional com teclas especiais menores. Há também um bloco de números "regular" novamente, o que também significa que as teclas de seta se moveram ligeiramente para a esquerda e agora são menores. Nem todos os usuários gostariam que isso acontecesse. No entanto, a qualidade do teclado é muito boa com o cubo longo de 2 mm, e você pode ficar louco na iluminação, o que permite configurar cada tecla separadamente, incluindo modos específicos do jogo através da tecnologia AuraSync. O grande ClickPad oferece boas características de deslizamento e funciona de forma confiável, mas também é bastante alto quando você o pressiona.
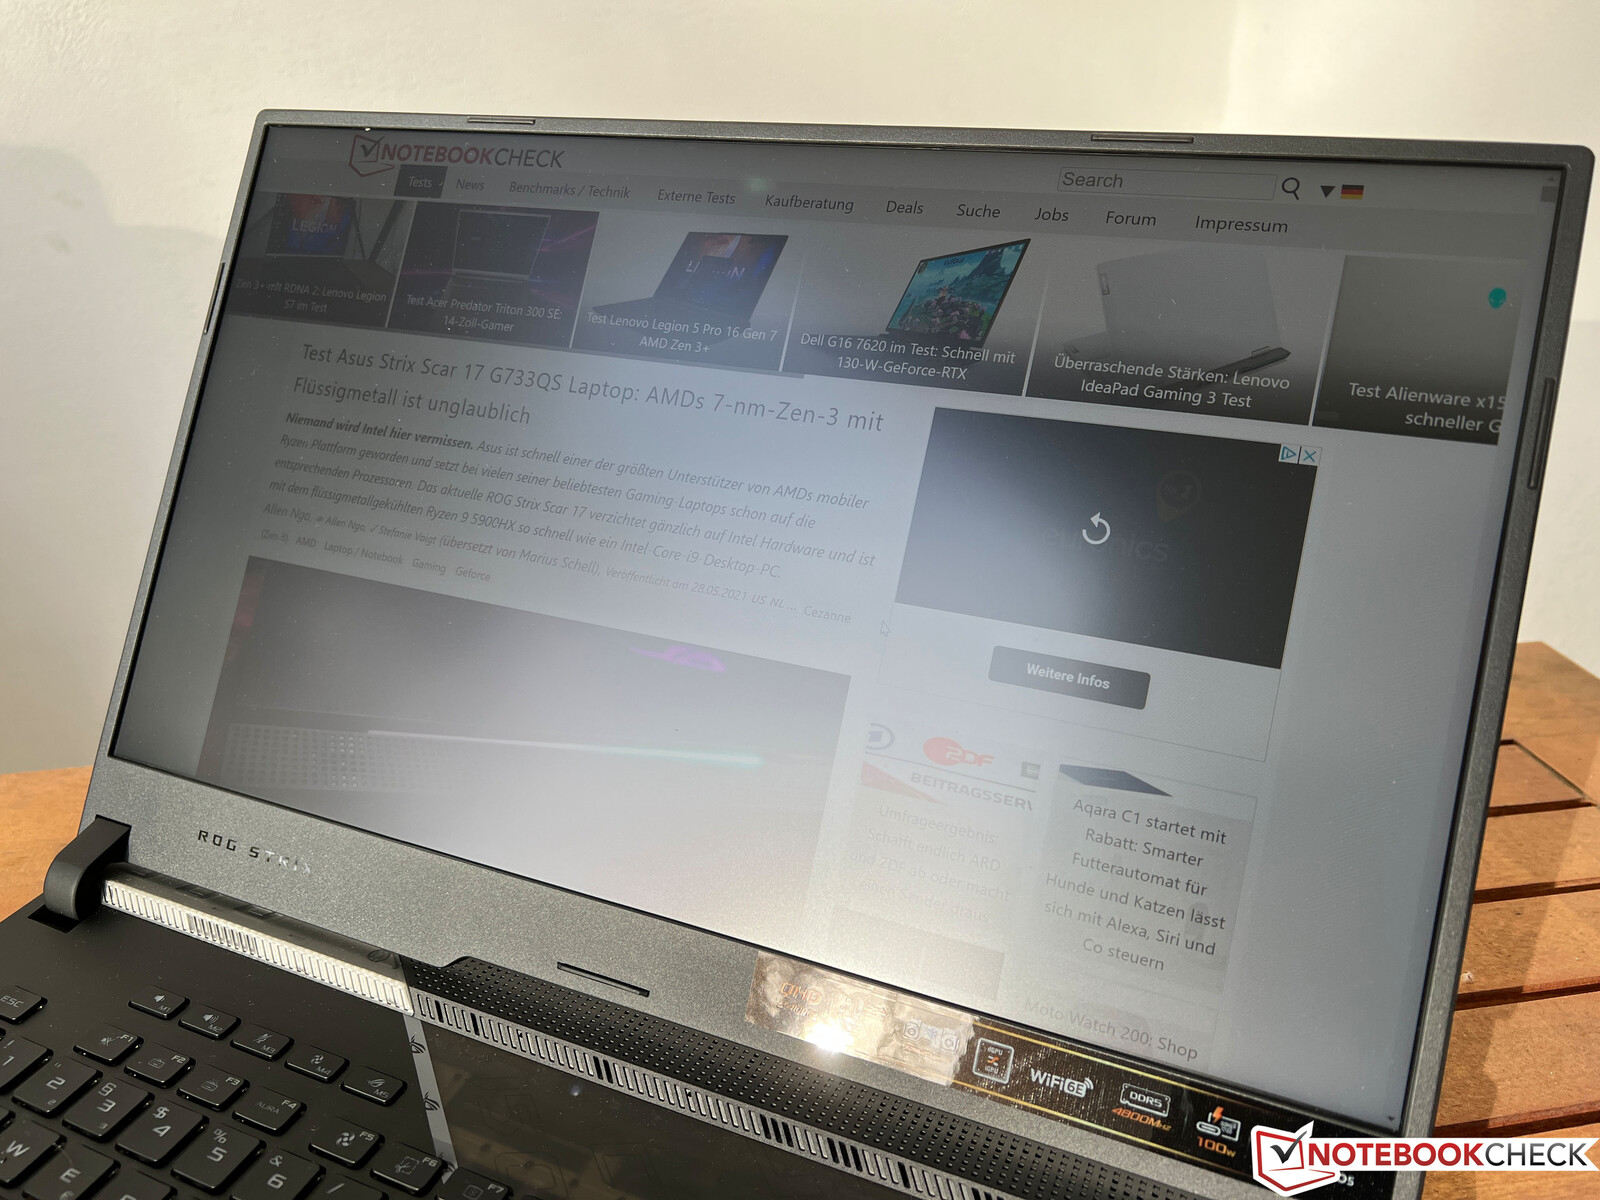
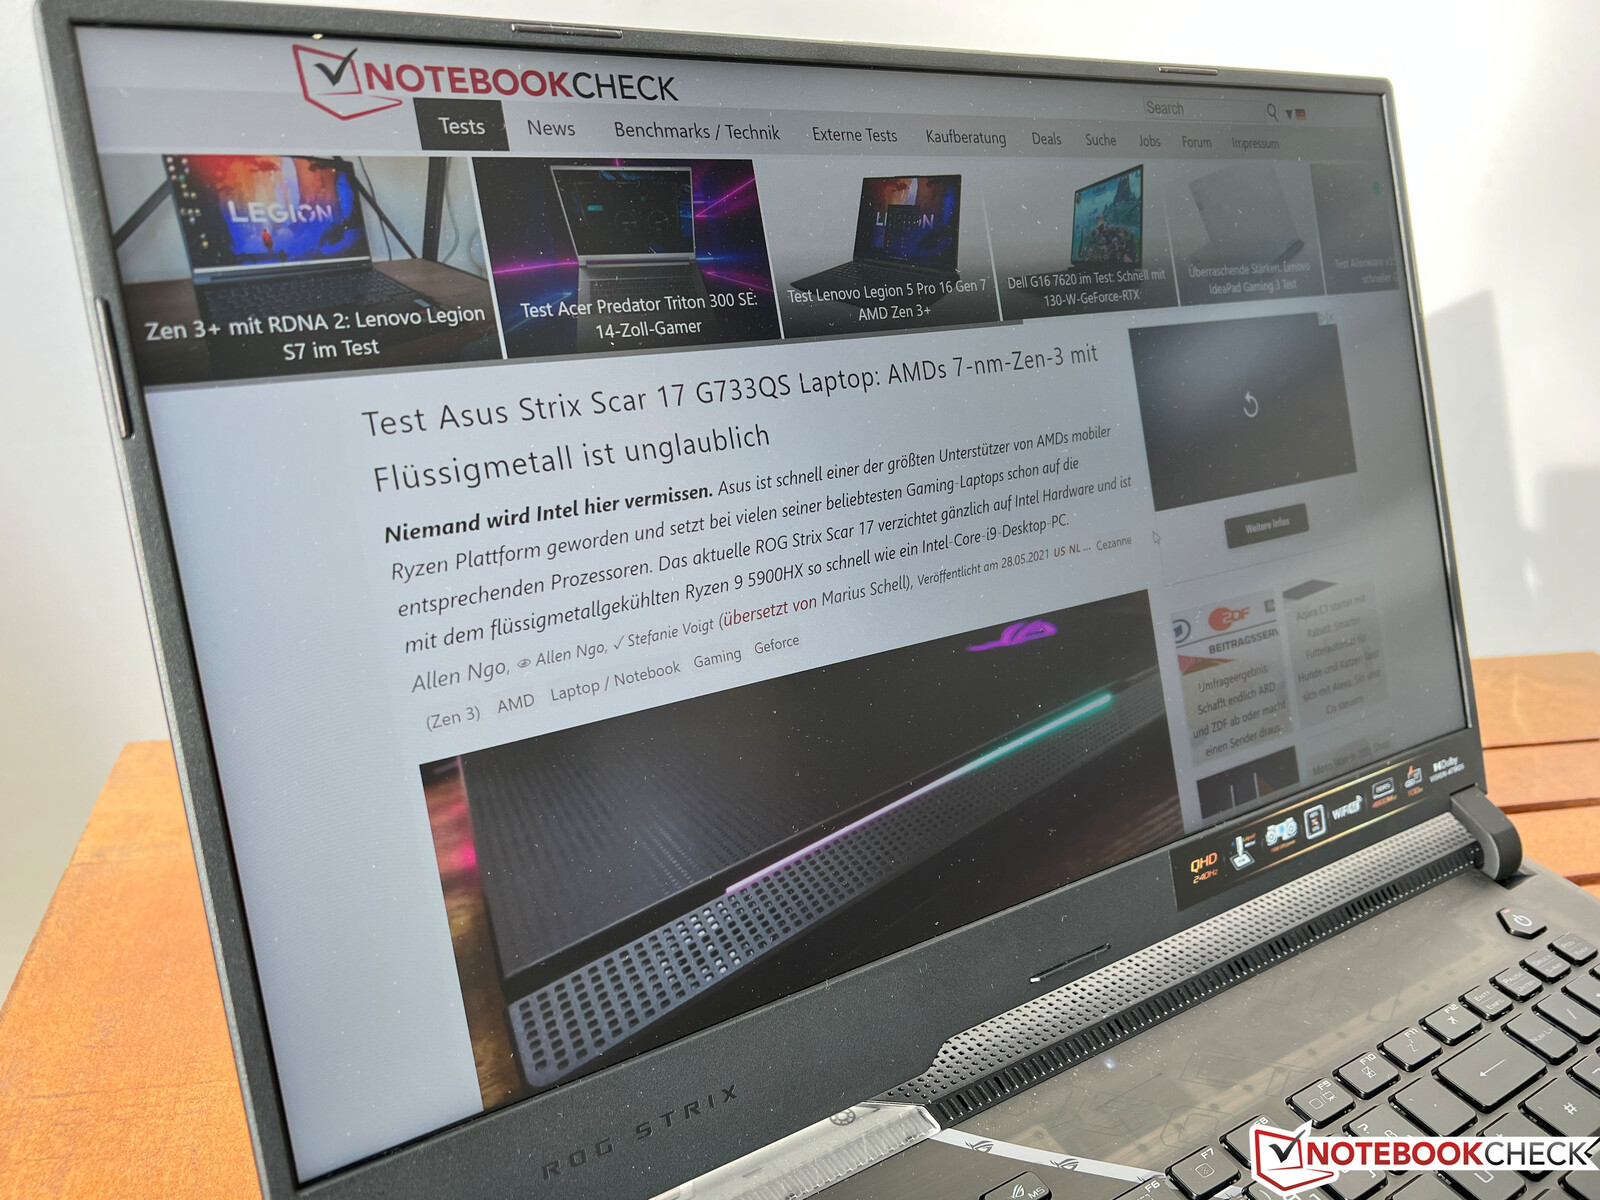
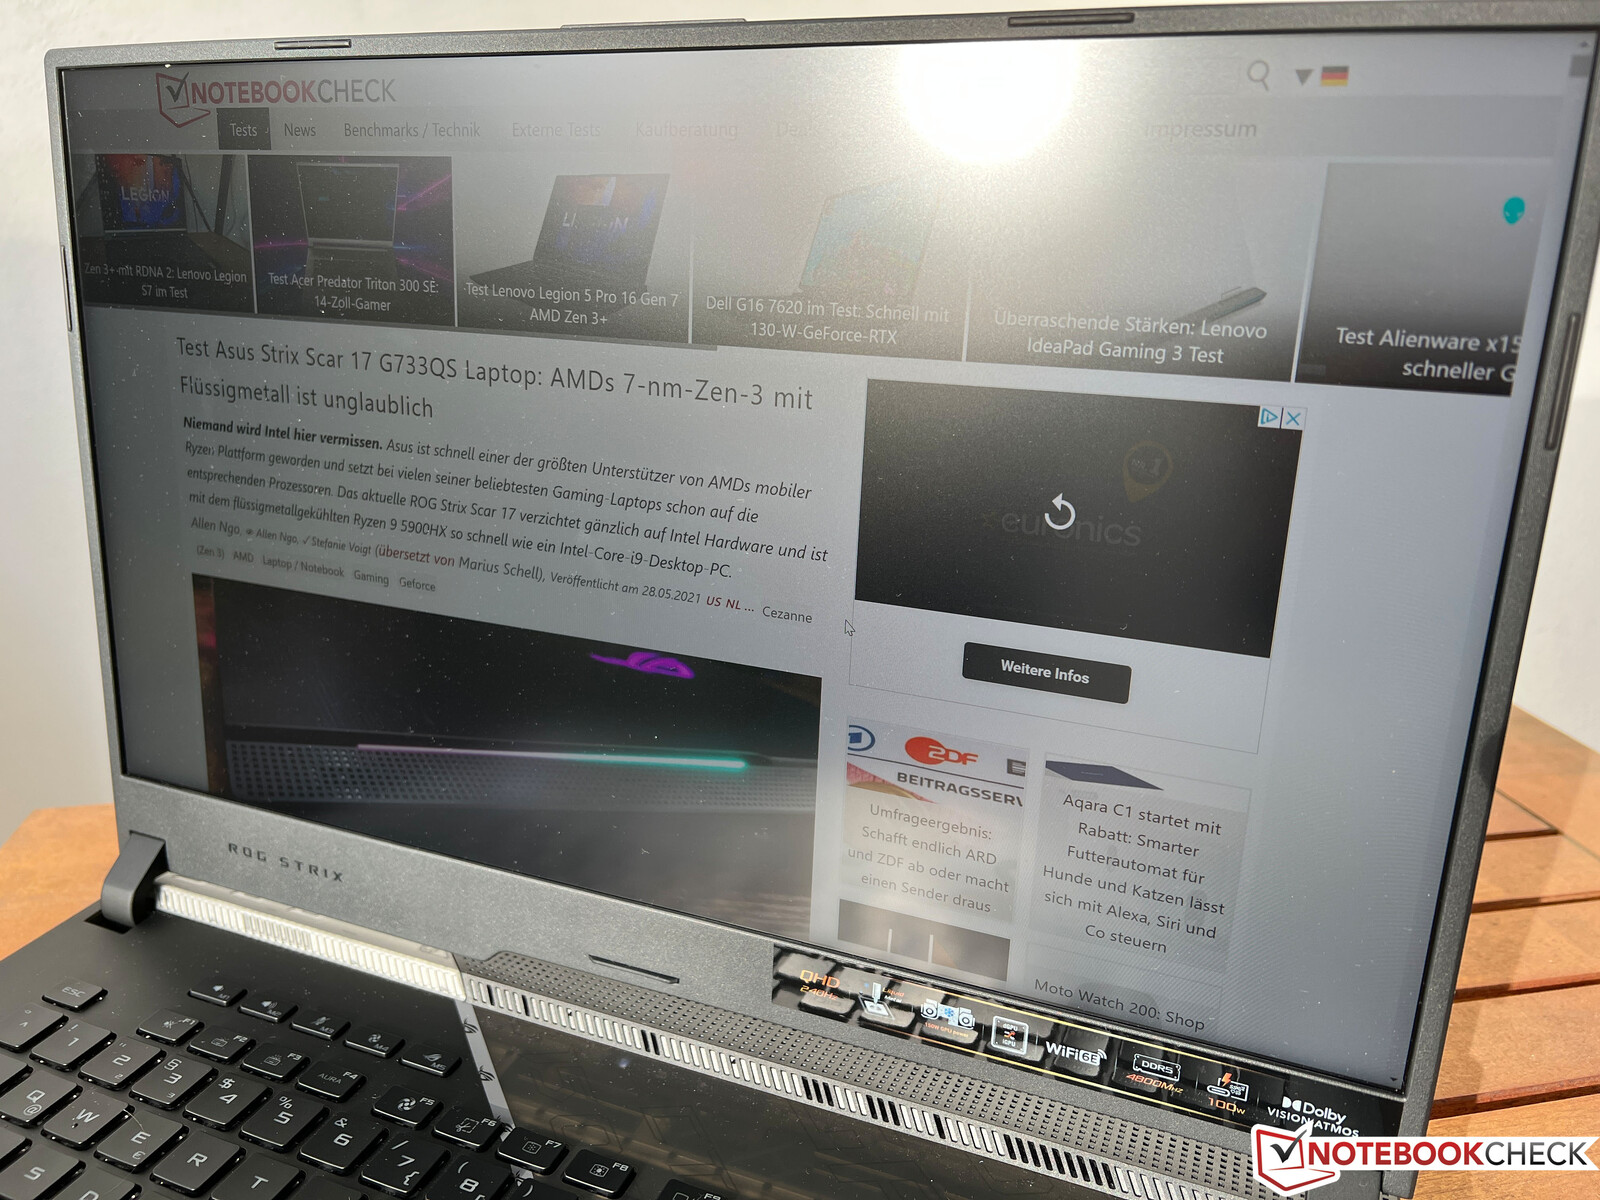
Mostrador - QHD com 240 Hz
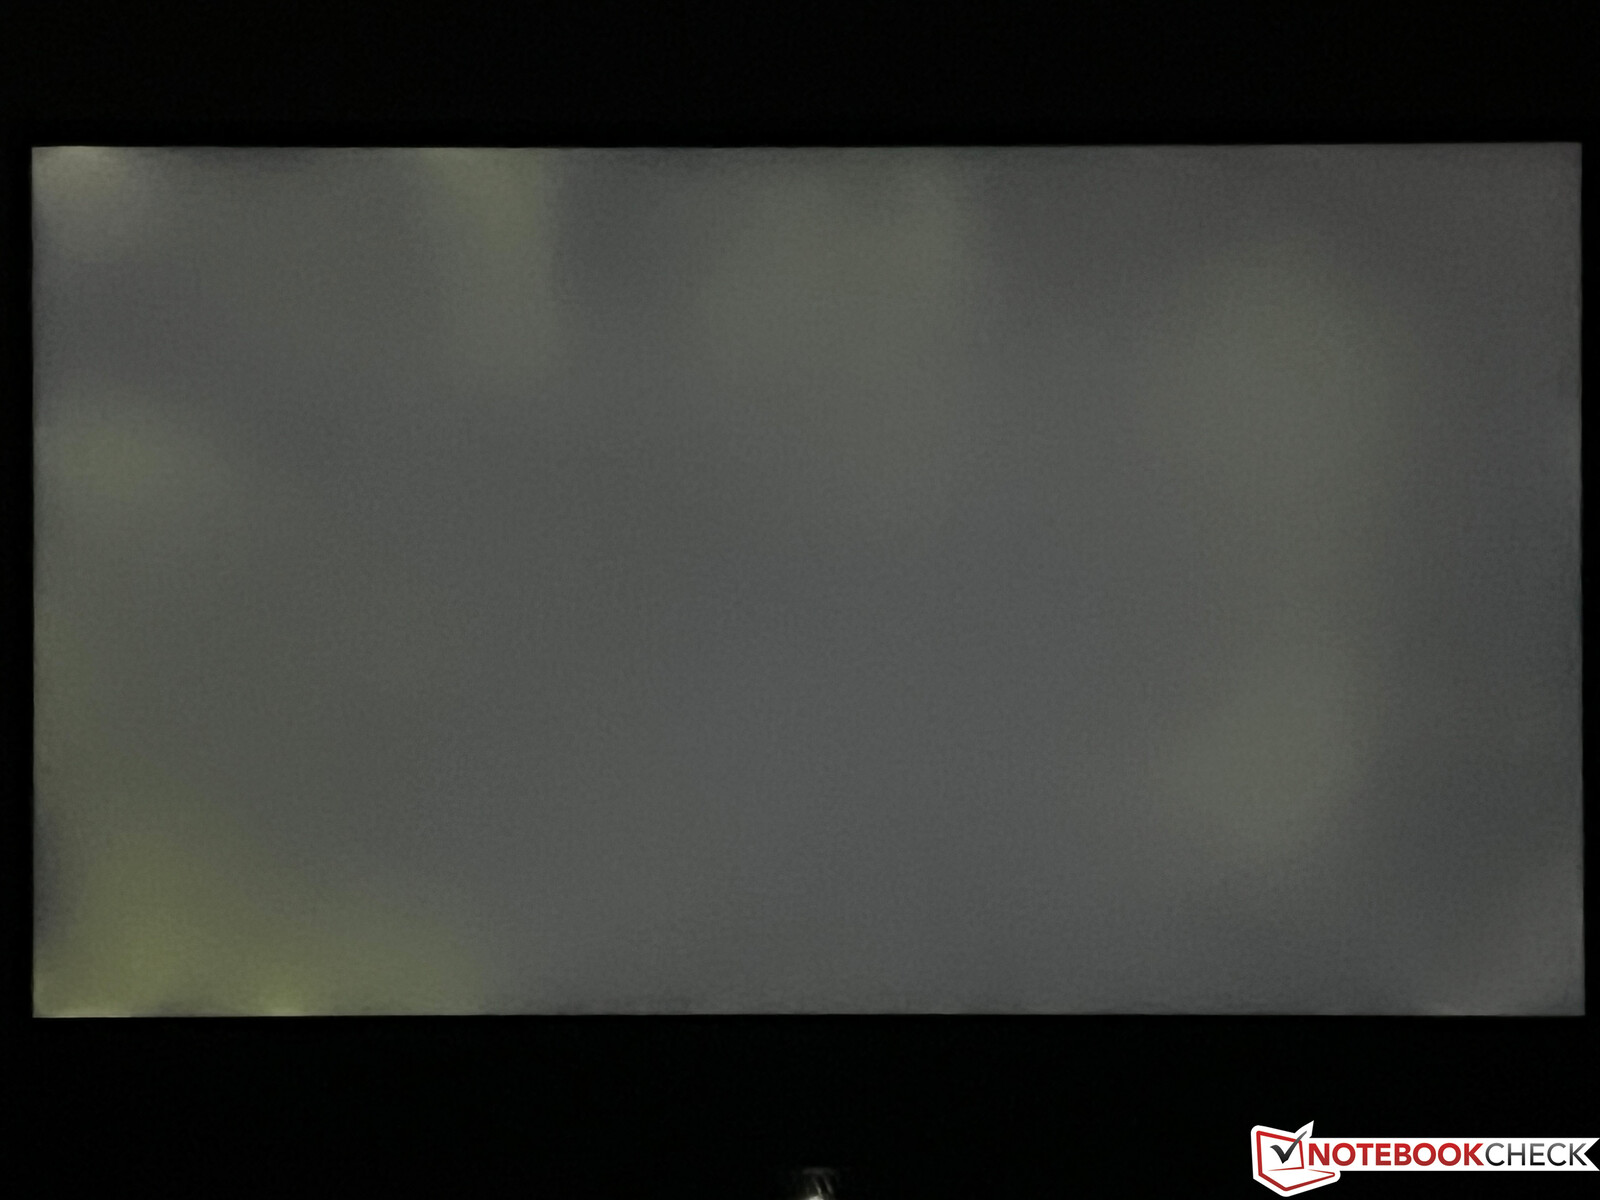
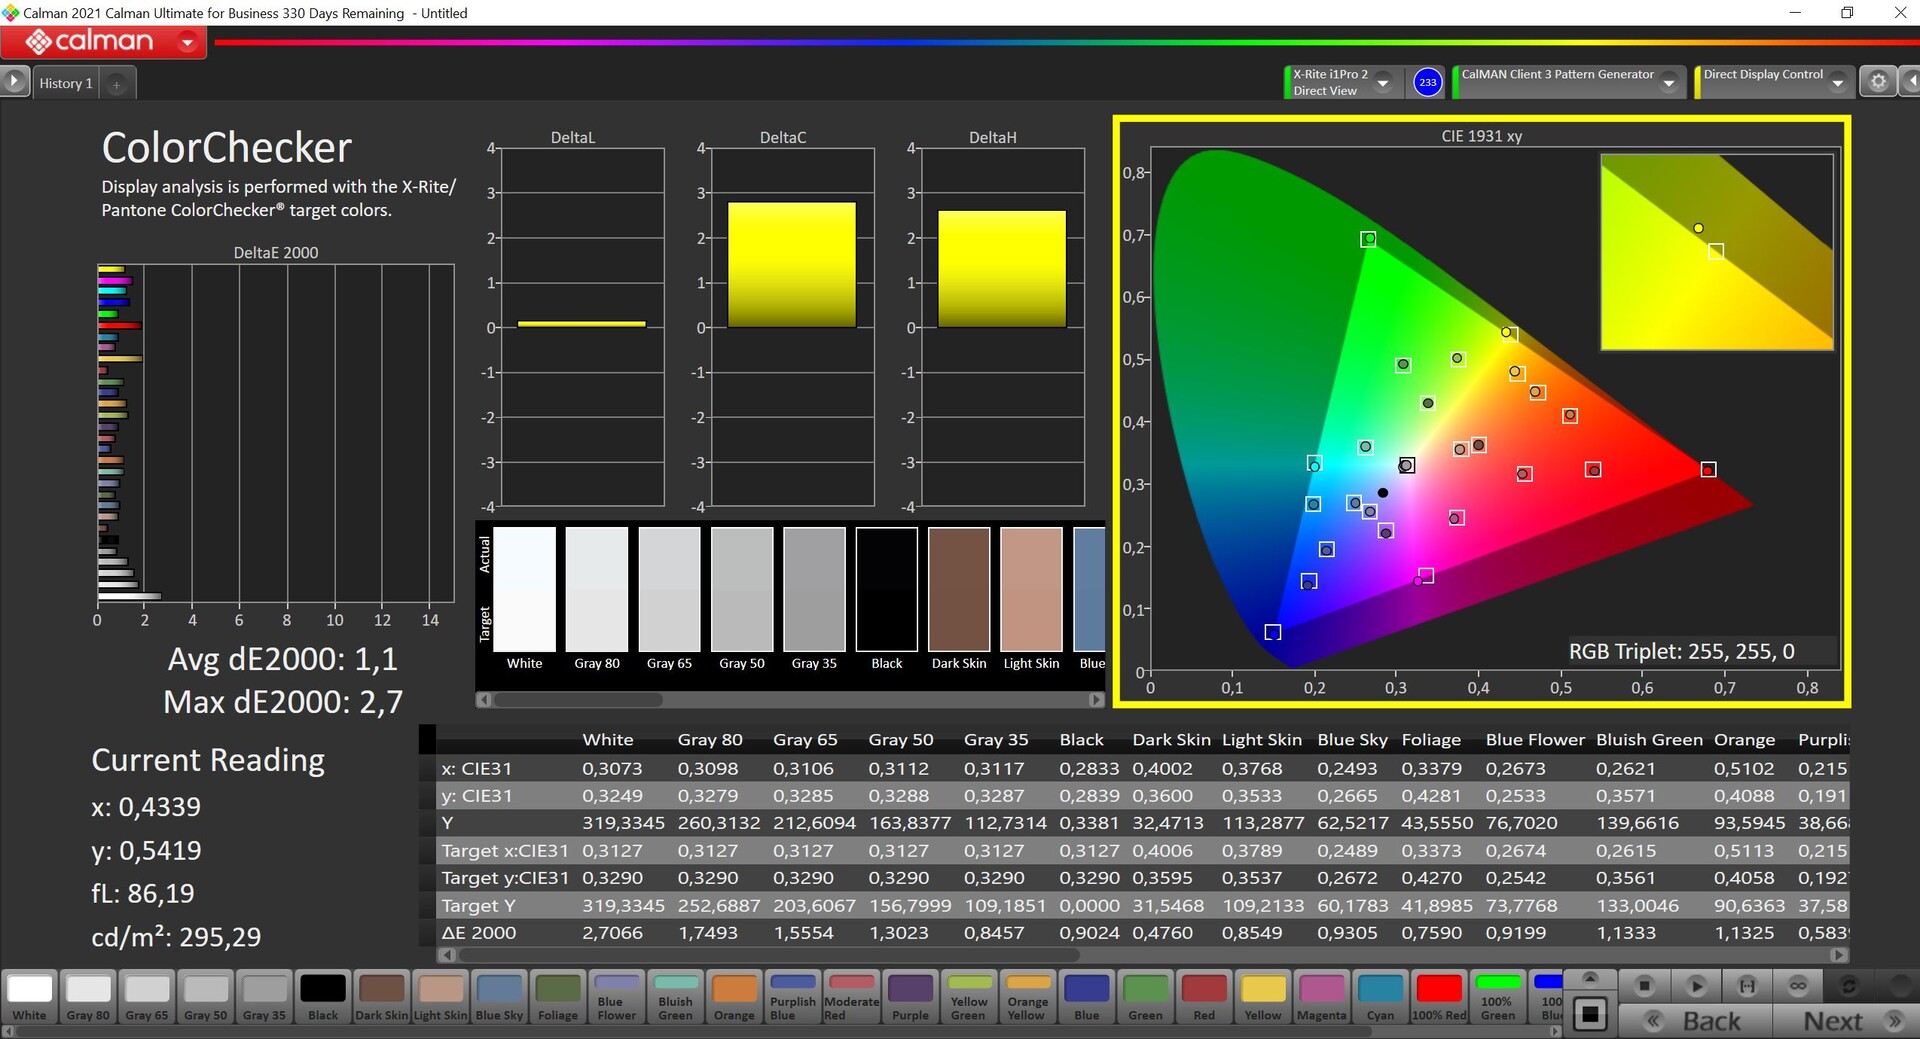
Além do painel Full-HD com 360 Hz que testamos em cicatriz 17 G733QS do ano passadoa Asus também oferece um painel QHD com uma taxa de atualização de 240 Hz, que é o painel em nossa unidade de teste. A impressão subjetiva da imagem do painel IPS mate (2560 x 1440 pixels, 16:9) é muito boa, e além do Dolby Vision HDR, o Adaptive Sync também é suportado. Os tempos de resposta são extremamente rápidos e o PWM não é usado. O brilho é de cerca de 300 cd/m² em média, que também é o mesmo nível do painel Full-HD com 360 Hz. Por outro lado, o valor de preto é um pouco alto, resultando também em uma relação de contraste medíocre de cerca de 1.000:1.
| |||||||||||||||||||||||||
iluminação: 87 %
iluminação com acumulador: 320 cd/m²
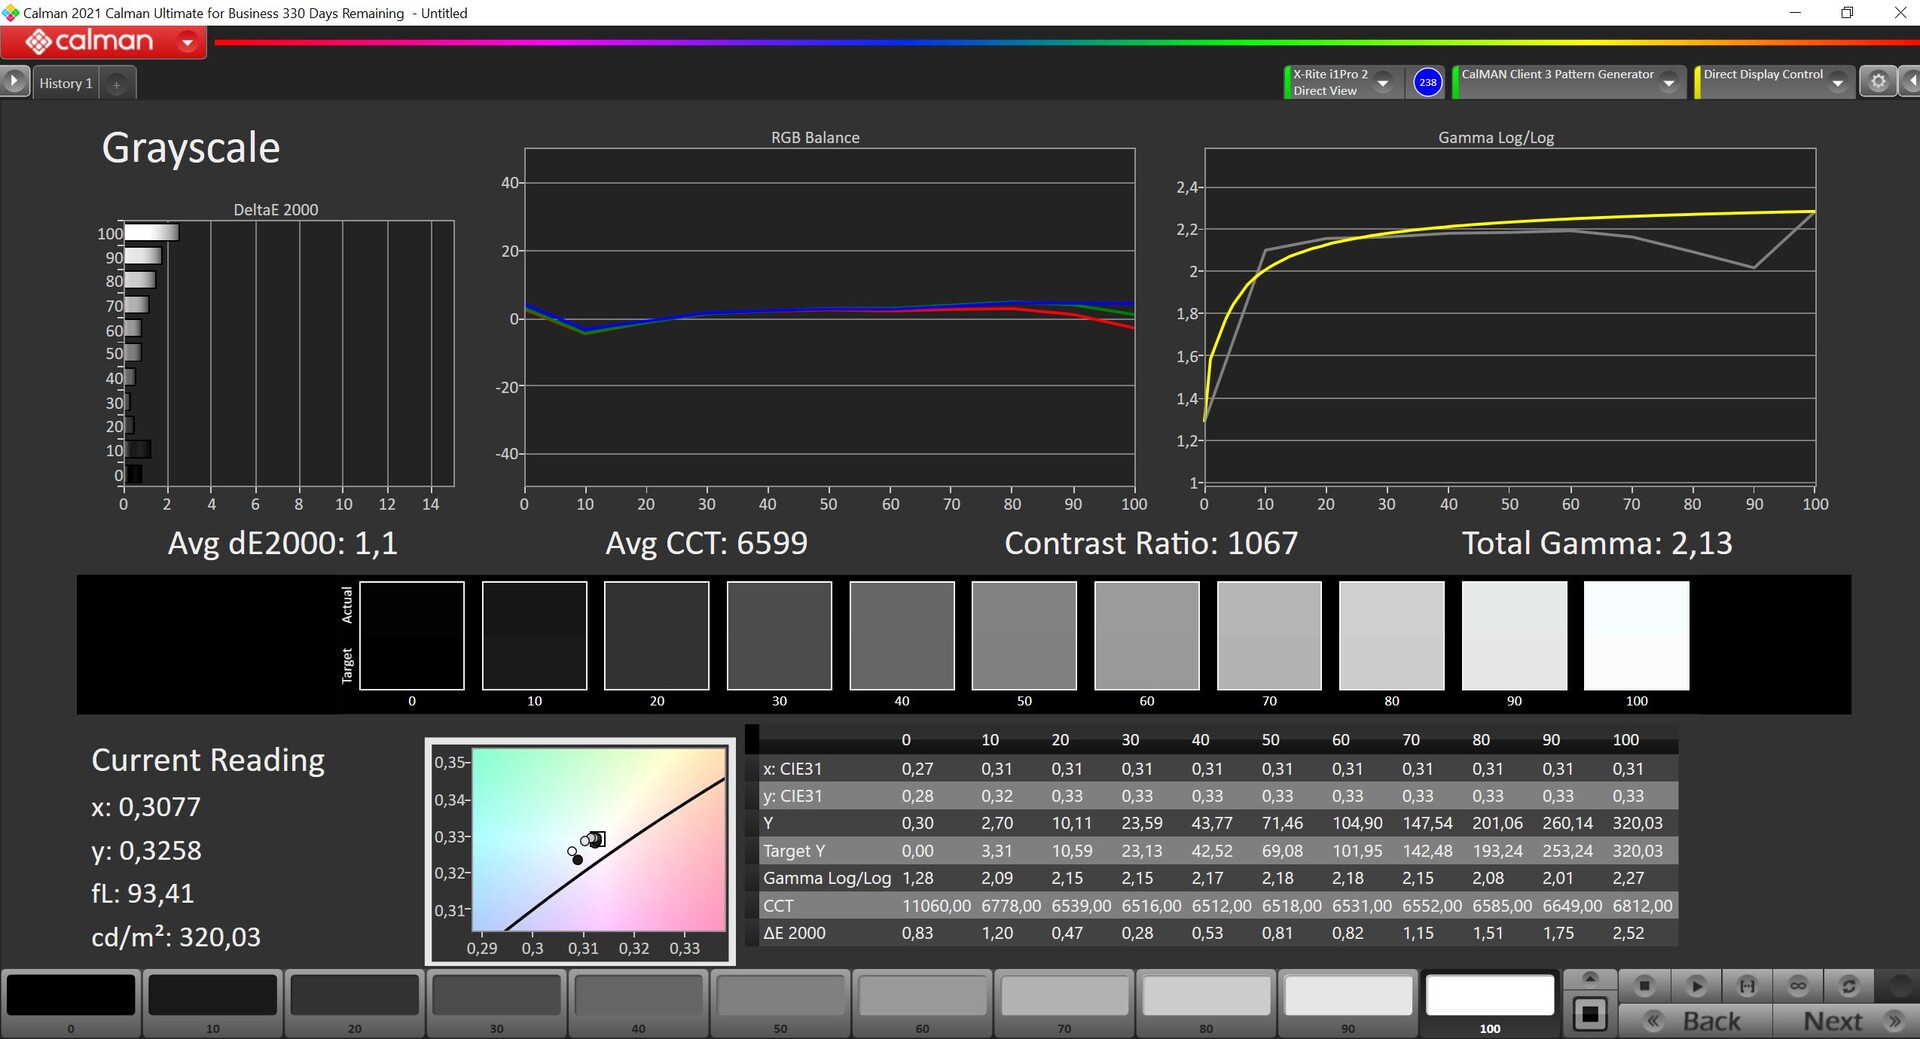
Contraste: 1067:1 (Preto: 0.3 cd/m²)
ΔE ColorChecker Calman: 1.1 | ∀{0.5-29.43 Ø4.71}
ΔE Greyscale Calman: 1.1 | ∀{0.09-98 Ø4.96}
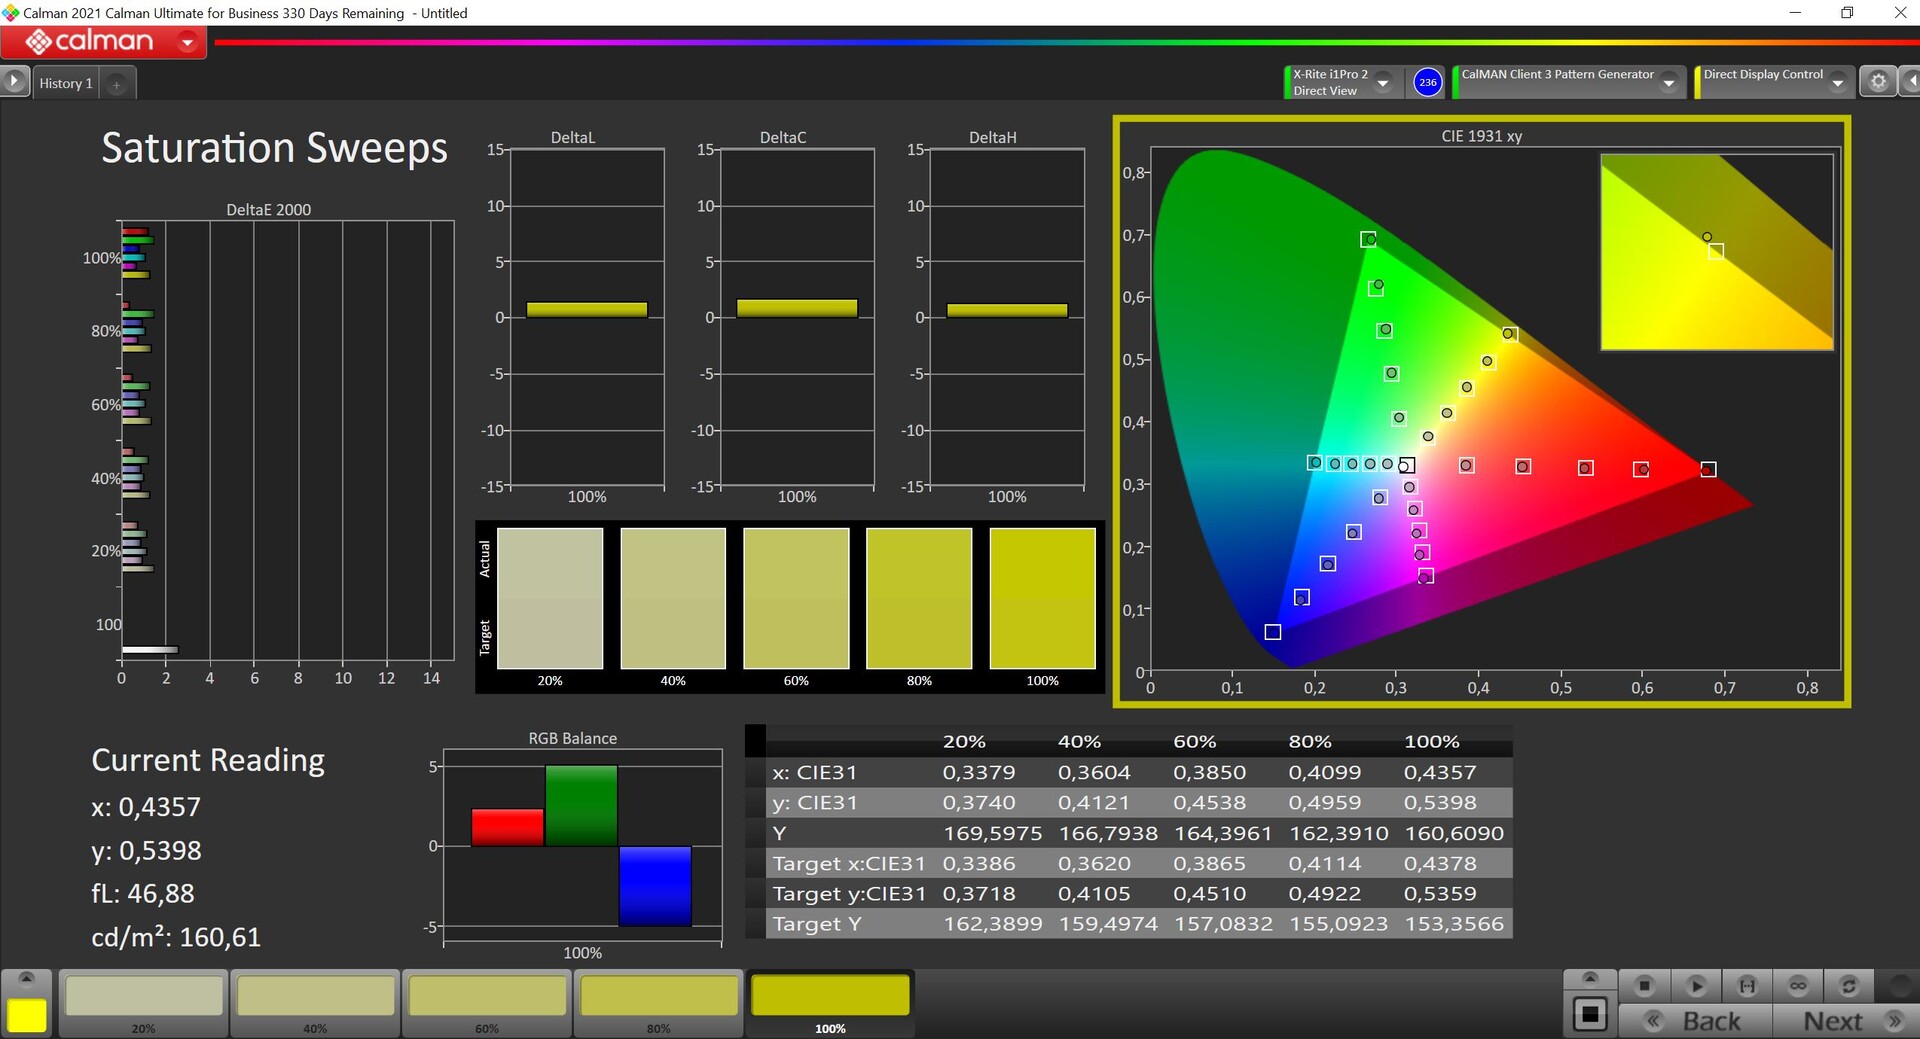
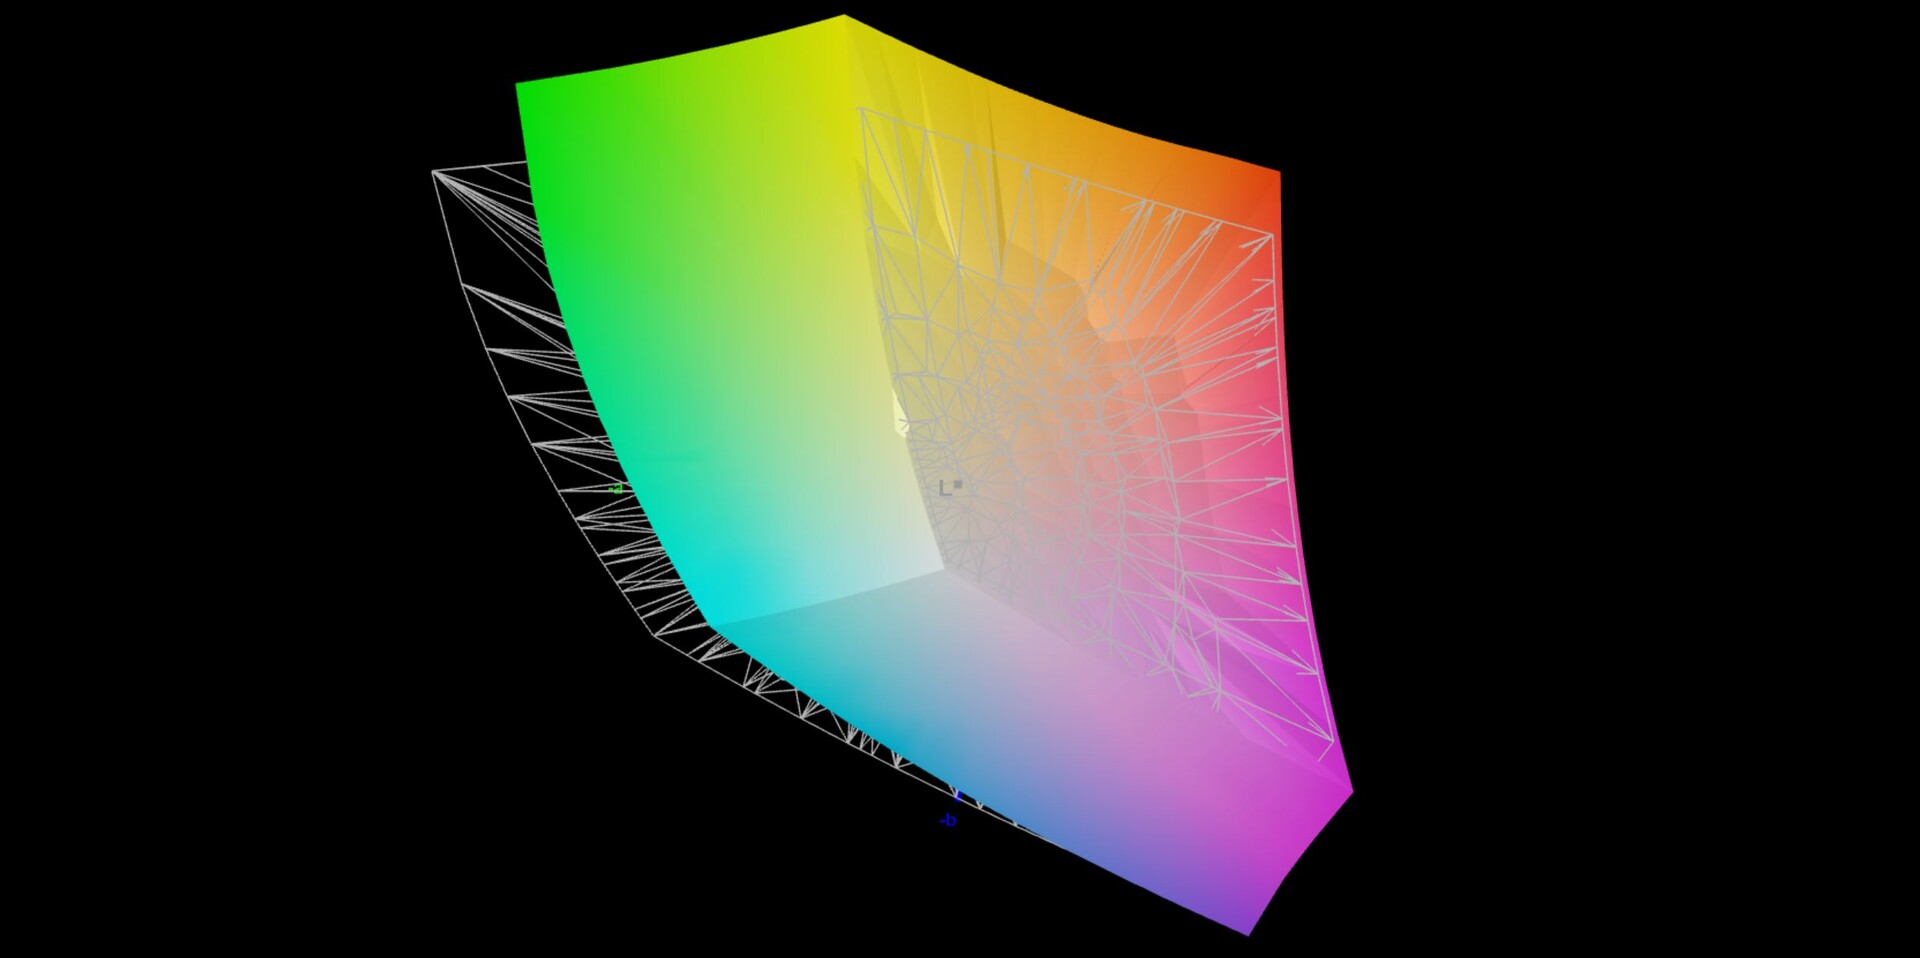
84.8% AdobeRGB 1998 (Argyll 3D)
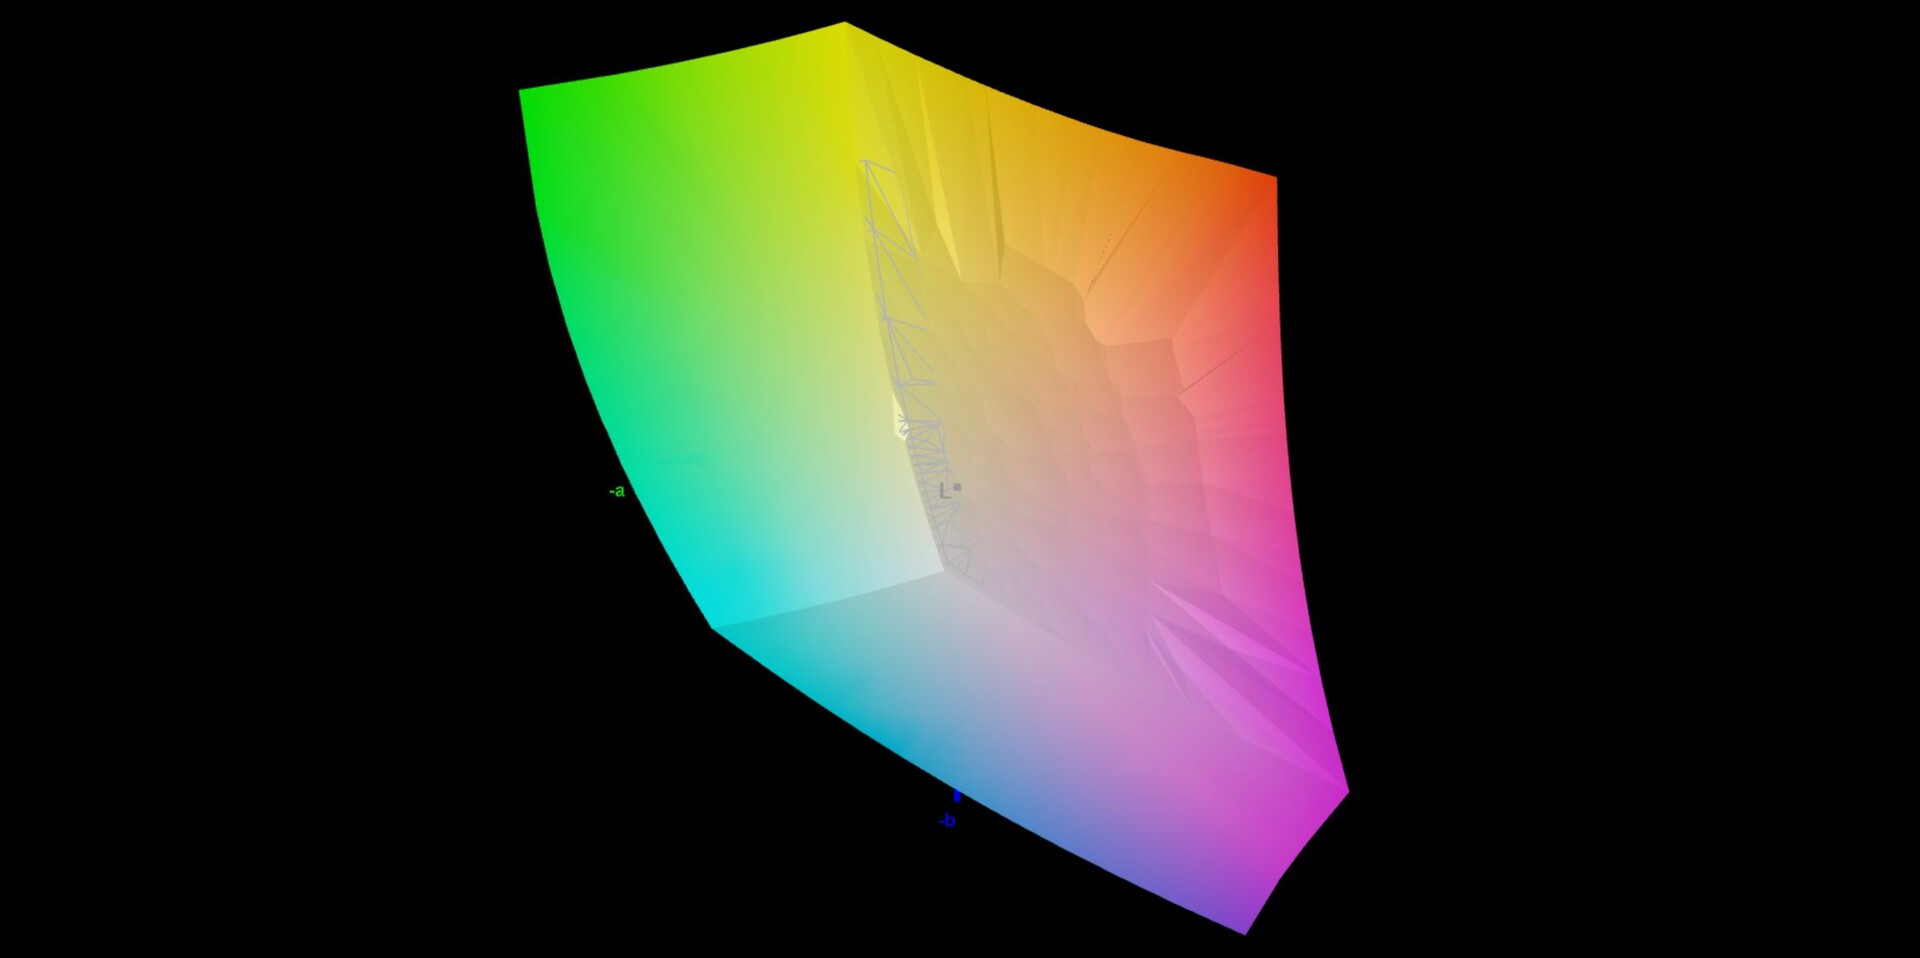
99.9% sRGB (Argyll 3D)
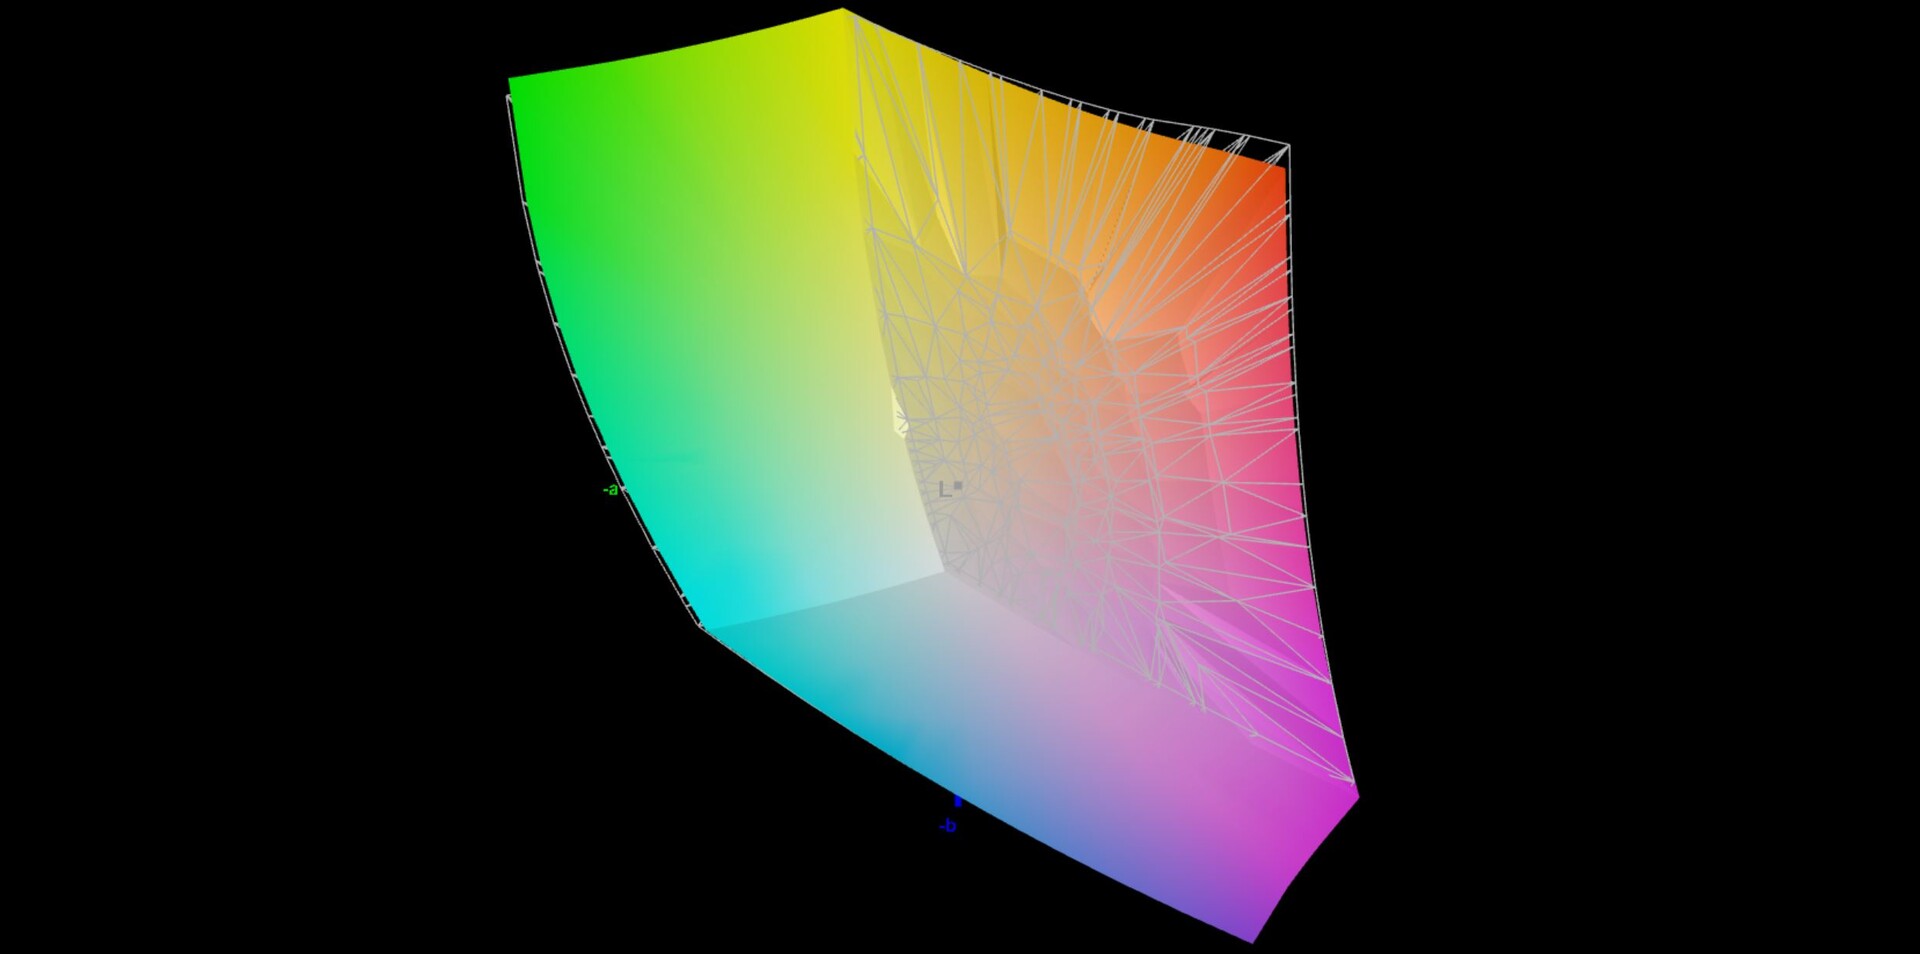
97.1% Display P3 (Argyll 3D)
Gamma: 2.13
CCT: 6599 K
| Asus ROG Strix Scar 17 SE G733CX-LL014W NE173QHM-NZ2, IPS, 2560x1440, 17.3" | Lenovo Legion 7 16IAX7-82TD004SGE NE160QDM-NY1, IPS, 2560x1600, 16" | MSI Titan GT77 12UHS Sharp SHP1544 LQ173M1JW08, IPS-Level, 1920x1080, 17.3" | Schenker XMG Neo 17 M22 BOE0A99, IPS, 2560x1600, 17" | Alienware x17 R2 P48E AU Optronics B173HAN, IPS, 1920x1080, 17.3" | Asus Strix Scar 17 G733QSA-XS99 AU Optronics B173HAN05.4, IPS, 1920x1080, 17.3" | |
|---|---|---|---|---|---|---|
| Display | -16% | -14% | -16% | -8% | -14% | |
| Display P3 Coverage (%) | 97.1 | 69.3 -29% | 70.8 -27% | 69 -29% | 79.2 -18% | 71 -27% |
| sRGB Coverage (%) | 99.9 | 98.2 -2% | 98.9 -1% | 99.8 0% | 99.8 0% | 99.4 -1% |
| AdobeRGB 1998 Coverage (%) | 84.8 | 70.8 -17% | 73 -14% | 69.6 -18% | 79.6 -6% | 72.2 -15% |
| Response Times | -38% | 48% | -25% | -55% | -12% | |
| Response Time Grey 50% / Grey 80% * (ms) | 5.7 ? | 12.6 ? -121% | 3.03 ? 47% | 10.8 ? -89% | 12.4 ? -118% | 6.6 ? -16% |
| Response Time Black / White * (ms) | 10.1 ? | 5.6 ? 45% | 5.28 ? 48% | 6.1 ? 40% | 9.2 ? 9% | 10.8 ? -7% |
| PWM Frequency (Hz) | ||||||
| Screen | -41% | -63% | -9% | -89% | -25% | |
| Brightness middle (cd/m²) | 320 | 547 71% | 280 -12% | 415 30% | 365.4 14% | 303.8 -5% |
| Brightness (cd/m²) | 303 | 523 73% | 275 -9% | 399 32% | 344 14% | 292 -4% |
| Brightness Distribution (%) | 87 | 88 1% | 79 -9% | 90 3% | 85 -2% | 85 -2% |
| Black Level * (cd/m²) | 0.3 | 0.44 -47% | 0.4 -33% | 0.43 -43% | 0.29 3% | 0.23 23% |
| Contrast (:1) | 1067 | 1243 16% | 700 -34% | 965 -10% | 1260 18% | 1321 24% |
| Colorchecker dE 2000 * | 1.1 | 2.1 -91% | 2.1 -91% | 1.44 -31% | 3.17 -188% | 1.87 -70% |
| Colorchecker dE 2000 max. * | 2.7 | 7 -159% | 5.83 -116% | 2.33 14% | 7.69 -185% | 3.26 -21% |
| Greyscale dE 2000 * | 1.1 | 3.2 -191% | 3.3 -200% | 1.8 -64% | 5.3 -382% | 2.7 -145% |
| Gamma | 2.13 103% | 2.23 99% | 2.13 103% | 2.132 103% | 2.18 101% | 2.26 97% |
| CCT | 6599 98% | 6979 93% | 7060 92% | 6327 103% | 5879 111% | 6436 101% |
| Colorchecker dE 2000 calibrated * | 0.9 | 1.58 | 0.89 | 0.51 | 1.45 | |
| Color Space (Percent of AdobeRGB 1998) (%) | 65.6 | |||||
| Color Space (Percent of sRGB) (%) | 99.4 | |||||
| Média Total (Programa/Configurações) | -32% /
-35% | -10% /
-35% | -17% /
-13% | -51% /
-65% | -17% /
-20% |
* ... menor é melhor
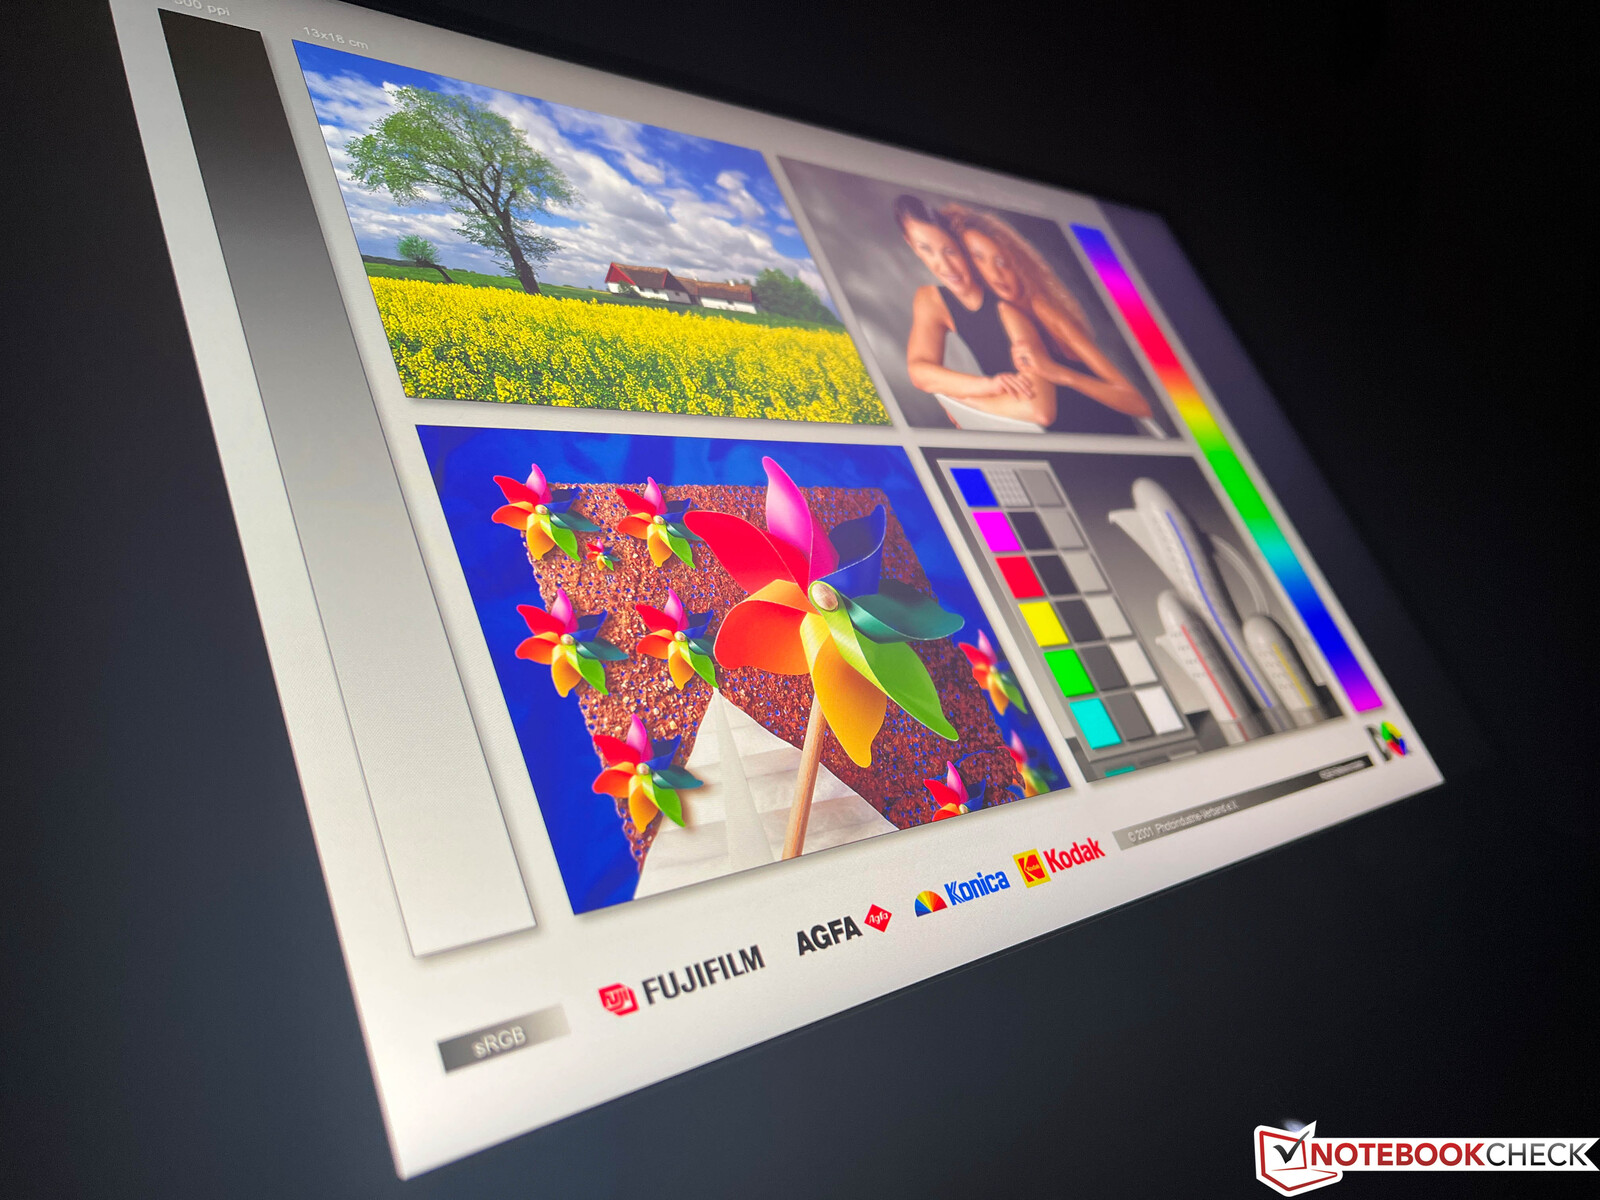
A tela cobre o espaço de cores P3, e nossa análise com o software profissional CalMAN mostra que a tela já é muito precisa no estado de entrega. Também não há coloração, e nossa própria calibração não levou a nenhuma melhoria adicional, portanto, não estamos oferecendo um perfil para você aqui. Este painel QHD é adequado para processamento de imagem e vídeo sem nenhuma limitação.
Exibir tempos de resposta
| ↔ Tempo de resposta preto para branco | ||
|---|---|---|
| 10.1 ms ... ascensão ↗ e queda ↘ combinadas | ↗ 5 ms ascensão | 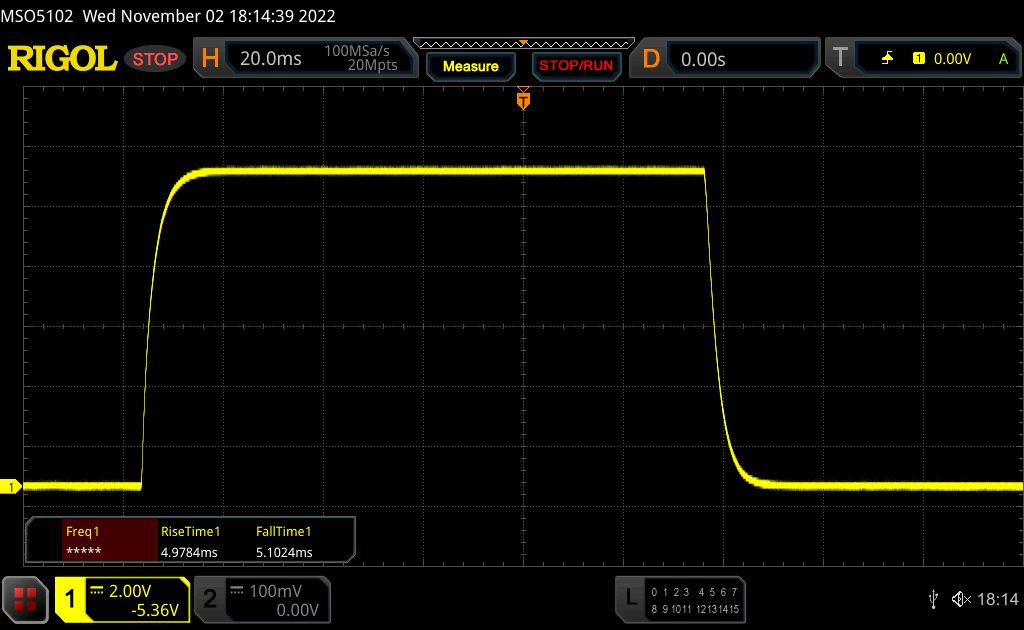 |
| ↘ 5.1 ms queda | ||
| A tela mostra boas taxas de resposta em nossos testes, mas pode ser muito lenta para jogadores competitivos. Em comparação, todos os dispositivos testados variam de 0.1 (mínimo) a 240 (máximo) ms. » 28 % de todos os dispositivos são melhores. Isso significa que o tempo de resposta medido é melhor que a média de todos os dispositivos testados (19.8 ms). | ||
| ↔ Tempo de resposta 50% cinza a 80% cinza | ||
| 5.7 ms ... ascensão ↗ e queda ↘ combinadas | ↗ 2.7 ms ascensão | 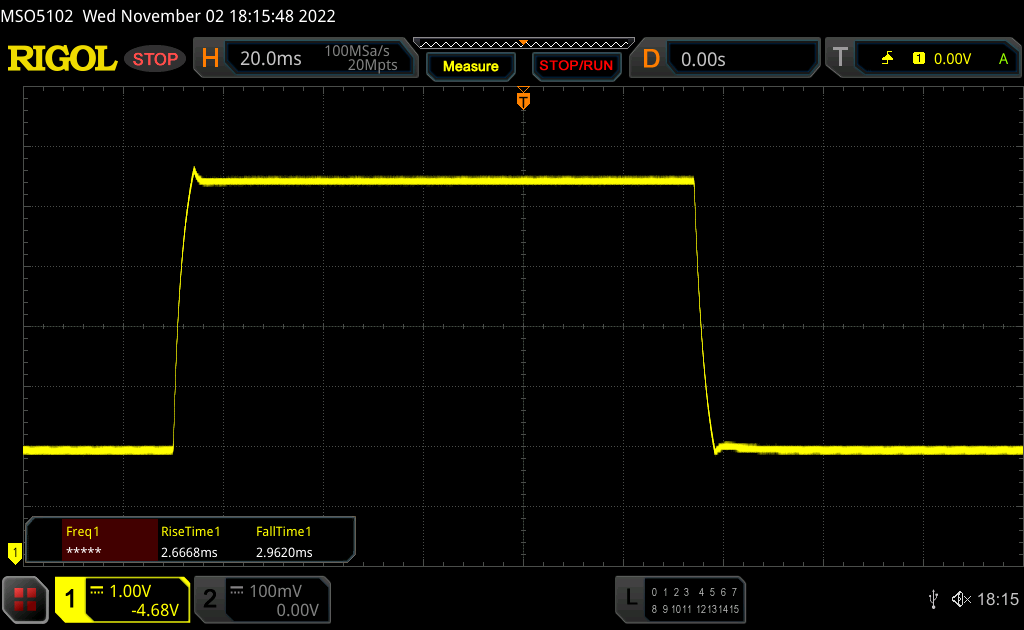 |
| ↘ 3 ms queda | ||
| A tela mostra taxas de resposta muito rápidas em nossos testes e deve ser muito adequada para jogos em ritmo acelerado. Em comparação, todos os dispositivos testados variam de 0.165 (mínimo) a 636 (máximo) ms. » 18 % de todos os dispositivos são melhores. Isso significa que o tempo de resposta medido é melhor que a média de todos os dispositivos testados (30.9 ms). | ||
Cintilação da tela / PWM (modulação por largura de pulso)
| Tela tremeluzindo / PWM não detectado | 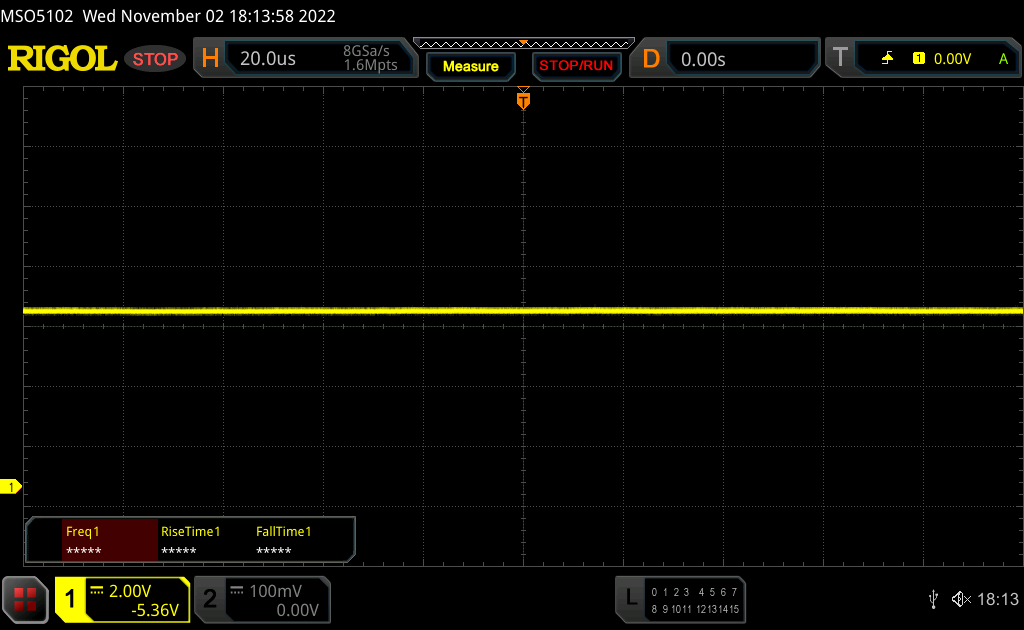 | ||
[pwm_comparison] Em comparação: 52 % de todos os dispositivos testados não usam PWM para escurecer a tela. Se PWM foi detectado, uma média de 7744 (mínimo: 5 - máximo: 343500) Hz foi medida. | |||
Desempenho - Intel HX com os freios aplicados
Condições de teste
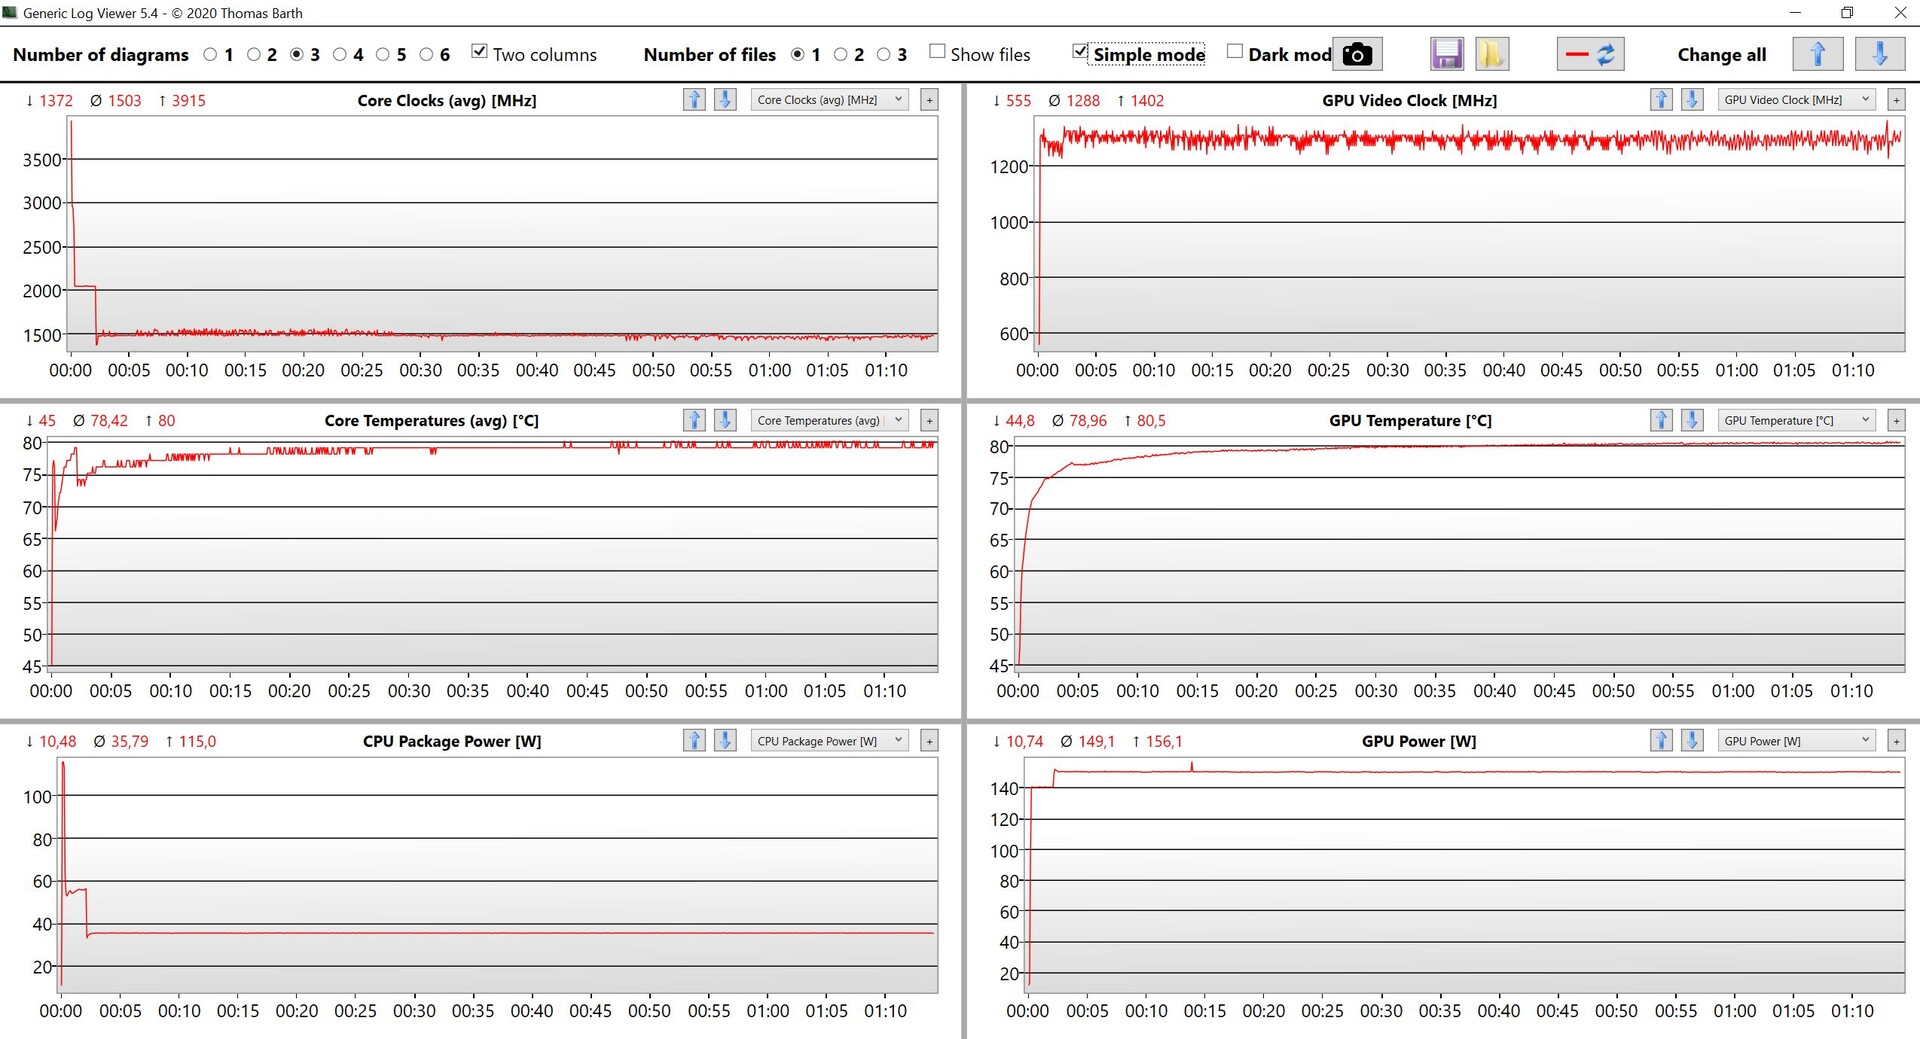
O software ROG oferece amplas opções de configuração e perfis de potência. Por exemplo, você pode desativar completamente a GPU integrada (MUX) ou definir manualmente os valores de potência para a CPU e a GPU. Para nossos benchmarks e medidas abaixo, utilizamos o perfil de performance, já que isto já torna disponível a performance completa da GPU. Embora a performance da CPU seja ainda ligeiramente maior no modo Turbo, isto não justifica o ruído significativamente maior da ventoinha em nossa opinião.
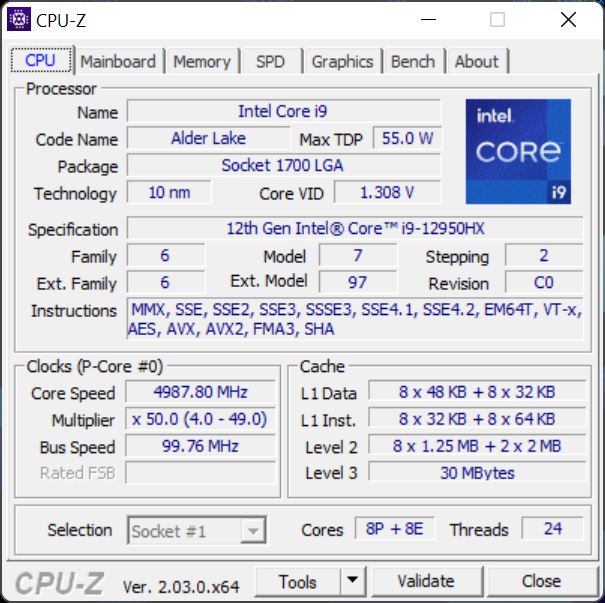
Processador - Core i9-12950HX
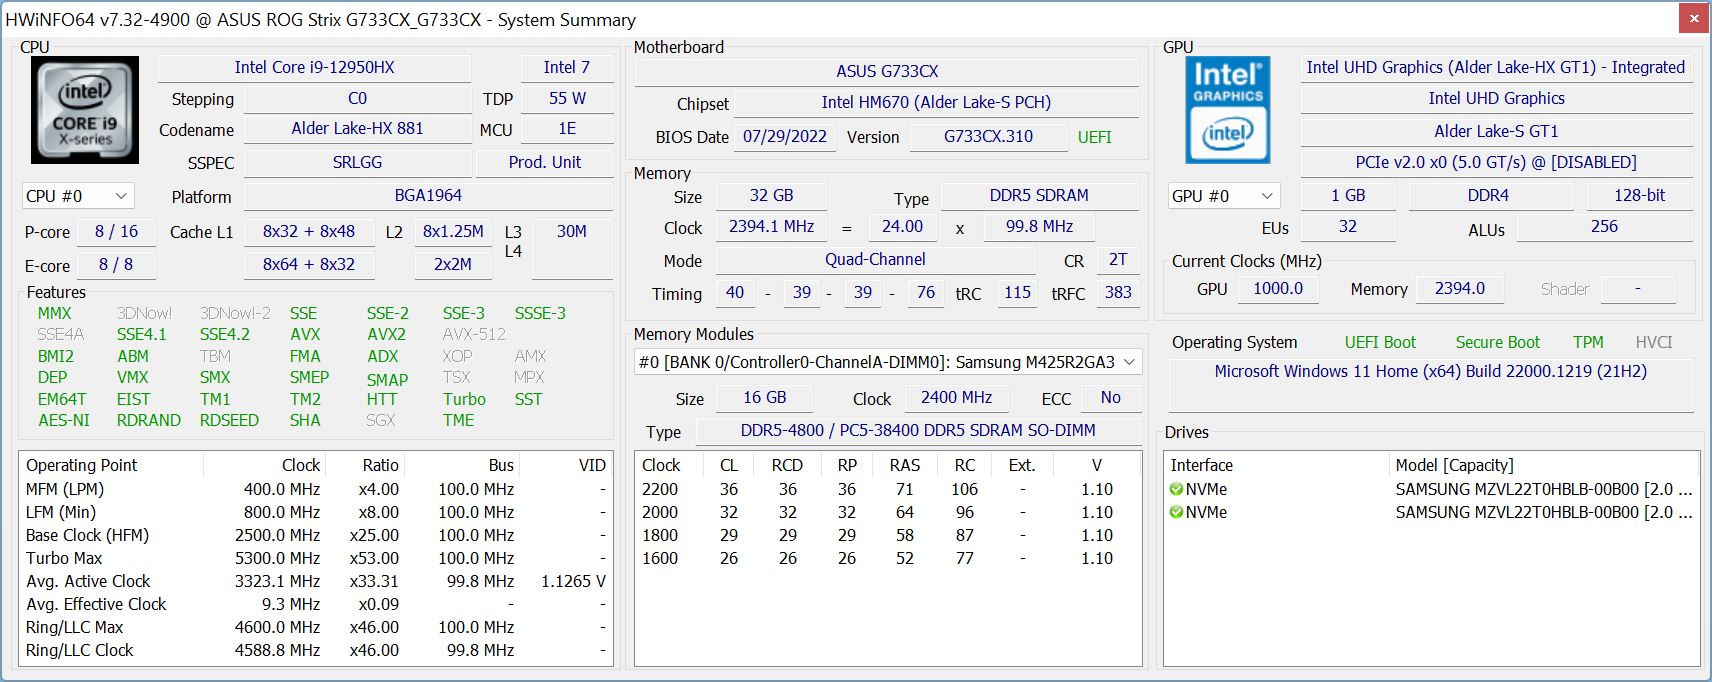
OIntel Core i9-12950HX é atualmente o processador móvel mais rápido da Intel. Mesmo sendo capaz de consumir até 175 watts, ele permanece longe deste valor em nossa unidade de teste. Em vez disso, vemos um consumo máximo de 115 watts (mesmo no modo Turbo), e em algum momento os níveis de valor se situam em 70 watts (105 watts no modo Turbo). Embora o desempenho da CPU não seja nada ruim, você também poderia obter isto com um Core i9 regular, e o prêmio adicional para o chip HX não vale a despesa adicional
Na operação com bateria, o consumo de energia é limitado a 35 watts, levando a um desempenho multi-core que é reduzido em cerca de 40%. Você pode encontrar referências adicionais de CPU em nossa seção técnica correspondente.
Cinebench R15 Multi Constant Load Test
Cinebench R23: Multi Core | Single Core
Cinebench R20: CPU (Multi Core) | CPU (Single Core)
Cinebench R15: CPU Multi 64Bit | CPU Single 64Bit
Blender: v2.79 BMW27 CPU
7-Zip 18.03: 7z b 4 | 7z b 4 -mmt1
Geekbench 5.5: Multi-Core | Single-Core
HWBOT x265 Benchmark v2.2: 4k Preset
LibreOffice : 20 Documents To PDF
R Benchmark 2.5: Overall mean
| CPU Performance rating | |
| Média da turma Gaming | |
| Lenovo Legion 7 16IAX7-82TD004SGE | |
| MSI Titan GT77 12UHS | |
| Asus ROG Strix Scar 17 SE G733CX-LL014W | |
| Média Intel Core i9-12950HX | |
| Alienware x17 R2 P48E | |
| Schenker XMG Neo 17 M22 | |
| Asus Strix Scar 17 G733QSA-XS99 | |
| Cinebench R23 / Multi Core | |
| Média da turma Gaming (10488 - 42661, n=104, últimos 2 anos) | |
| MSI Titan GT77 12UHS | |
| Lenovo Legion 7 16IAX7-82TD004SGE | |
| Asus ROG Strix Scar 17 SE G733CX-LL014W | |
| Média Intel Core i9-12950HX (16277 - 23113, n=7) | |
| Alienware x17 R2 P48E | |
| Schenker XMG Neo 17 M22 | |
| Asus Strix Scar 17 G733QSA-XS99 | |
| Cinebench R23 / Single Core | |
| Média da turma Gaming (1601 - 2415, n=104, últimos 2 anos) | |
| Lenovo Legion 7 16IAX7-82TD004SGE | |
| MSI Titan GT77 12UHS | |
| Alienware x17 R2 P48E | |
| Asus ROG Strix Scar 17 SE G733CX-LL014W | |
| Média Intel Core i9-12950HX (1465 - 1922, n=7) | |
| Schenker XMG Neo 17 M22 | |
| Asus Strix Scar 17 G733QSA-XS99 | |
| Cinebench R20 / CPU (Multi Core) | |
| Média da turma Gaming (4029 - 16433, n=103, últimos 2 anos) | |
| MSI Titan GT77 12UHS | |
| Lenovo Legion 7 16IAX7-82TD004SGE | |
| Média Intel Core i9-12950HX (6625 - 8777, n=7) | |
| Asus ROG Strix Scar 17 SE G733CX-LL014W | |
| Alienware x17 R2 P48E | |
| Schenker XMG Neo 17 M22 | |
| Asus Strix Scar 17 G733QSA-XS99 | |
| Cinebench R20 / CPU (Single Core) | |
| Média da turma Gaming (622 - 913, n=103, últimos 2 anos) | |
| Lenovo Legion 7 16IAX7-82TD004SGE | |
| Asus ROG Strix Scar 17 SE G733CX-LL014W | |
| MSI Titan GT77 12UHS | |
| Alienware x17 R2 P48E | |
| Média Intel Core i9-12950HX (703 - 741, n=7) | |
| Schenker XMG Neo 17 M22 | |
| Asus Strix Scar 17 G733QSA-XS99 | |
| Cinebench R15 / CPU Multi 64Bit | |
| Média da turma Gaming (1578 - 6330, n=102, últimos 2 anos) | |
| MSI Titan GT77 12UHS | |
| Lenovo Legion 7 16IAX7-82TD004SGE | |
| Asus ROG Strix Scar 17 SE G733CX-LL014W | |
| Média Intel Core i9-12950HX (2464 - 3530, n=7) | |
| Alienware x17 R2 P48E | |
| Schenker XMG Neo 17 M22 | |
| Asus Strix Scar 17 G733QSA-XS99 | |
| Cinebench R15 / CPU Single 64Bit | |
| Média da turma Gaming (188.8 - 350, n=103, últimos 2 anos) | |
| Lenovo Legion 7 16IAX7-82TD004SGE | |
| MSI Titan GT77 12UHS | |
| Asus ROG Strix Scar 17 SE G733CX-LL014W | |
| Alienware x17 R2 P48E | |
| Média Intel Core i9-12950HX (167 - 276, n=7) | |
| Schenker XMG Neo 17 M22 | |
| Asus Strix Scar 17 G733QSA-XS99 | |
| Blender / v2.79 BMW27 CPU | |
| Asus Strix Scar 17 G733QSA-XS99 | |
| Schenker XMG Neo 17 M22 | |
| Asus ROG Strix Scar 17 SE G733CX-LL014W | |
| Alienware x17 R2 P48E | |
| Média Intel Core i9-12950HX (138 - 193, n=7) | |
| Lenovo Legion 7 16IAX7-82TD004SGE | |
| Média da turma Gaming (79 - 330, n=101, últimos 2 anos) | |
| MSI Titan GT77 12UHS | |
| 7-Zip 18.03 / 7z b 4 | |
| Média da turma Gaming (33491 - 148086, n=102, últimos 2 anos) | |
| Lenovo Legion 7 16IAX7-82TD004SGE | |
| MSI Titan GT77 12UHS | |
| Média Intel Core i9-12950HX (65637 - 85019, n=7) | |
| Asus ROG Strix Scar 17 SE G733CX-LL014W | |
| Alienware x17 R2 P48E | |
| Schenker XMG Neo 17 M22 | |
| Asus Strix Scar 17 G733QSA-XS99 | |
| 7-Zip 18.03 / 7z b 4 -mmt1 | |
| Média da turma Gaming (4824 - 7436, n=102, últimos 2 anos) | |
| Lenovo Legion 7 16IAX7-82TD004SGE | |
| MSI Titan GT77 12UHS | |
| Asus ROG Strix Scar 17 SE G733CX-LL014W | |
| Média Intel Core i9-12950HX (6022 - 6318, n=7) | |
| Schenker XMG Neo 17 M22 | |
| Alienware x17 R2 P48E | |
| Asus Strix Scar 17 G733QSA-XS99 | |
| Geekbench 5.5 / Multi-Core | |
| Média da turma Gaming (6460 - 28263, n=102, últimos 2 anos) | |
| Lenovo Legion 7 16IAX7-82TD004SGE | |
| MSI Titan GT77 12UHS | |
| Asus ROG Strix Scar 17 SE G733CX-LL014W | |
| Média Intel Core i9-12950HX (14028 - 16009, n=7) | |
| Alienware x17 R2 P48E | |
| Schenker XMG Neo 17 M22 | |
| Asus Strix Scar 17 G733QSA-XS99 | |
| Geekbench 5.5 / Single-Core | |
| Média da turma Gaming (1403 - 2474, n=102, últimos 2 anos) | |
| MSI Titan GT77 12UHS | |
| Média Intel Core i9-12950HX (1847 - 1945, n=7) | |
| Alienware x17 R2 P48E | |
| Lenovo Legion 7 16IAX7-82TD004SGE | |
| Asus ROG Strix Scar 17 SE G733CX-LL014W | |
| Schenker XMG Neo 17 M22 | |
| Asus Strix Scar 17 G733QSA-XS99 | |
| HWBOT x265 Benchmark v2.2 / 4k Preset | |
| Média da turma Gaming (11.5 - 44.4, n=102, últimos 2 anos) | |
| MSI Titan GT77 12UHS | |
| Lenovo Legion 7 16IAX7-82TD004SGE | |
| Asus ROG Strix Scar 17 SE G733CX-LL014W | |
| Média Intel Core i9-12950HX (18.6 - 26.5, n=7) | |
| Alienware x17 R2 P48E | |
| Schenker XMG Neo 17 M22 | |
| Asus Strix Scar 17 G733QSA-XS99 | |
| LibreOffice / 20 Documents To PDF | |
| Schenker XMG Neo 17 M22 | |
| Média da turma Gaming (33.2 - 88.8, n=102, últimos 2 anos) | |
| Asus Strix Scar 17 G733QSA-XS99 | |
| Alienware x17 R2 P48E | |
| Média Intel Core i9-12950HX (34.7 - 45.4, n=7) | |
| MSI Titan GT77 12UHS | |
| Asus ROG Strix Scar 17 SE G733CX-LL014W | |
| Lenovo Legion 7 16IAX7-82TD004SGE | |
| R Benchmark 2.5 / Overall mean | |
| Asus Strix Scar 17 G733QSA-XS99 | |
| Schenker XMG Neo 17 M22 | |
| Média Intel Core i9-12950HX (0.4251 - 0.4515, n=7) | |
| Alienware x17 R2 P48E | |
| Asus ROG Strix Scar 17 SE G733CX-LL014W | |
| Média da turma Gaming (0.3439 - 0.59, n=102, últimos 2 anos) | |
| Lenovo Legion 7 16IAX7-82TD004SGE | |
| MSI Titan GT77 12UHS | |
* ... menor é melhor
AIDA64: FP32 Ray-Trace | FPU Julia | CPU SHA3 | CPU Queen | FPU SinJulia | FPU Mandel | CPU AES | CPU ZLib | FP64 Ray-Trace | CPU PhotoWorxx
| Performance rating | |
| Média da turma Gaming | |
| MSI Titan GT77 12UHS | |
| Asus ROG Strix Scar 17 SE G733CX-LL014W | |
| Média Intel Core i9-12950HX | |
| Schenker XMG Neo 17 M22 | |
| Asus Strix Scar 17 G733QSA-XS99 | |
| Lenovo Legion 7 16IAX7-82TD004SGE | |
| Alienware x17 R2 P48E | |
| AIDA64 / FP32 Ray-Trace | |
| Média da turma Gaming (10227 - 85542, n=102, últimos 2 anos) | |
| MSI Titan GT77 12UHS | |
| Média Intel Core i9-12950HX (15499 - 22868, n=7) | |
| Asus ROG Strix Scar 17 SE G733CX-LL014W | |
| Schenker XMG Neo 17 M22 | |
| Asus Strix Scar 17 G733QSA-XS99 | |
| Lenovo Legion 7 16IAX7-82TD004SGE | |
| Alienware x17 R2 P48E | |
| AIDA64 / FPU Julia | |
| Média da turma Gaming (51376 - 372155, n=102, últimos 2 anos) | |
| MSI Titan GT77 12UHS | |
| Asus Strix Scar 17 G733QSA-XS99 | |
| Schenker XMG Neo 17 M22 | |
| Média Intel Core i9-12950HX (77846 - 115907, n=7) | |
| Asus ROG Strix Scar 17 SE G733CX-LL014W | |
| Lenovo Legion 7 16IAX7-82TD004SGE | |
| Alienware x17 R2 P48E | |
| AIDA64 / CPU SHA3 | |
| Média da turma Gaming (2180 - 10115, n=102, últimos 2 anos) | |
| MSI Titan GT77 12UHS | |
| Lenovo Legion 7 16IAX7-82TD004SGE | |
| Asus ROG Strix Scar 17 SE G733CX-LL014W | |
| Média Intel Core i9-12950HX (3426 - 5069, n=7) | |
| Alienware x17 R2 P48E | |
| Asus Strix Scar 17 G733QSA-XS99 | |
| Schenker XMG Neo 17 M22 | |
| AIDA64 / CPU Queen | |
| Média da turma Gaming (49785 - 173351, n=86, últimos 2 anos) | |
| Alienware x17 R2 P48E | |
| Asus ROG Strix Scar 17 SE G733CX-LL014W | |
| Média Intel Core i9-12950HX (102752 - 104726, n=7) | |
| Asus Strix Scar 17 G733QSA-XS99 | |
| MSI Titan GT77 12UHS | |
| Schenker XMG Neo 17 M22 | |
| Lenovo Legion 7 16IAX7-82TD004SGE | |
| AIDA64 / FPU SinJulia | |
| Média da turma Gaming (4424 - 33636, n=102, últimos 2 anos) | |
| Lenovo Legion 7 16IAX7-82TD004SGE | |
| MSI Titan GT77 12UHS | |
| Schenker XMG Neo 17 M22 | |
| Asus Strix Scar 17 G733QSA-XS99 | |
| Média Intel Core i9-12950HX (10134 - 12823, n=7) | |
| Asus ROG Strix Scar 17 SE G733CX-LL014W | |
| Alienware x17 R2 P48E | |
| AIDA64 / FPU Mandel | |
| Média da turma Gaming (25115 - 196829, n=102, últimos 2 anos) | |
| Asus Strix Scar 17 G733QSA-XS99 | |
| Schenker XMG Neo 17 M22 | |
| MSI Titan GT77 12UHS | |
| Média Intel Core i9-12950HX (37146 - 57340, n=7) | |
| Asus ROG Strix Scar 17 SE G733CX-LL014W | |
| Lenovo Legion 7 16IAX7-82TD004SGE | |
| Alienware x17 R2 P48E | |
| AIDA64 / CPU AES | |
| MSI Titan GT77 12UHS | |
| Asus ROG Strix Scar 17 SE G733CX-LL014W | |
| Schenker XMG Neo 17 M22 | |
| Asus Strix Scar 17 G733QSA-XS99 | |
| Lenovo Legion 7 16IAX7-82TD004SGE | |
| Média Intel Core i9-12950HX (72599 - 181128, n=7) | |
| Média da turma Gaming (39258 - 247074, n=102, últimos 2 anos) | |
| Alienware x17 R2 P48E | |
| AIDA64 / CPU ZLib | |
| Média da turma Gaming (574 - 2531, n=102, últimos 2 anos) | |
| Lenovo Legion 7 16IAX7-82TD004SGE | |
| MSI Titan GT77 12UHS | |
| Asus ROG Strix Scar 17 SE G733CX-LL014W | |
| Alienware x17 R2 P48E | |
| Média Intel Core i9-12950HX (996 - 1417, n=7) | |
| Asus Strix Scar 17 G733QSA-XS99 | |
| Schenker XMG Neo 17 M22 | |
| AIDA64 / FP64 Ray-Trace | |
| Média da turma Gaming (5509 - 45446, n=102, últimos 2 anos) | |
| MSI Titan GT77 12UHS | |
| Média Intel Core i9-12950HX (8455 - 12432, n=7) | |
| Asus ROG Strix Scar 17 SE G733CX-LL014W | |
| Asus Strix Scar 17 G733QSA-XS99 | |
| Schenker XMG Neo 17 M22 | |
| Lenovo Legion 7 16IAX7-82TD004SGE | |
| Alienware x17 R2 P48E | |
| AIDA64 / CPU PhotoWorxx | |
| Média da turma Gaming (12271 - 89891, n=102, últimos 2 anos) | |
| Asus ROG Strix Scar 17 SE G733CX-LL014W | |
| MSI Titan GT77 12UHS | |
| Média Intel Core i9-12950HX (35479 - 42655, n=7) | |
| Lenovo Legion 7 16IAX7-82TD004SGE | |
| Alienware x17 R2 P48E | |
| Schenker XMG Neo 17 M22 | |
| Asus Strix Scar 17 G733QSA-XS99 | |
Desempenho do sistema
A impressão de desempenho subjetivo é excelente, o que também é confirmado pelos bons resultados de referência. Não notamos nenhum problema durante os testes.
CrossMark: Overall | Productivity | Creativity | Responsiveness
| PCMark 10 / Score | |
| Lenovo Legion 7 16IAX7-82TD004SGE | |
| Média da turma Gaming (5828 - 12414, n=93, últimos 2 anos) | |
| MSI Titan GT77 12UHS | |
| Alienware x17 R2 P48E | |
| Asus ROG Strix Scar 17 SE G733CX-LL014W | |
| Média Intel Core i9-12950HX, NVIDIA GeForce RTX 3080 Ti Laptop GPU (n=1) | |
| Asus Strix Scar 17 G733QSA-XS99 | |
| Schenker XMG Neo 17 M22 | |
| PCMark 10 / Essentials | |
| Alienware x17 R2 P48E | |
| Lenovo Legion 7 16IAX7-82TD004SGE | |
| MSI Titan GT77 12UHS | |
| Média da turma Gaming (8810 - 11935, n=97, últimos 2 anos) | |
| Asus Strix Scar 17 G733QSA-XS99 | |
| Asus ROG Strix Scar 17 SE G733CX-LL014W | |
| Média Intel Core i9-12950HX, NVIDIA GeForce RTX 3080 Ti Laptop GPU (n=1) | |
| Schenker XMG Neo 17 M22 | |
| PCMark 10 / Productivity | |
| Média da turma Gaming (6845 - 25323, n=95, últimos 2 anos) | |
| Lenovo Legion 7 16IAX7-82TD004SGE | |
| MSI Titan GT77 12UHS | |
| Alienware x17 R2 P48E | |
| Asus ROG Strix Scar 17 SE G733CX-LL014W | |
| Média Intel Core i9-12950HX, NVIDIA GeForce RTX 3080 Ti Laptop GPU (n=1) | |
| Asus Strix Scar 17 G733QSA-XS99 | |
| Schenker XMG Neo 17 M22 | |
| PCMark 10 / Digital Content Creation | |
| Lenovo Legion 7 16IAX7-82TD004SGE | |
| Média da turma Gaming (7602 - 19954, n=95, últimos 2 anos) | |
| MSI Titan GT77 12UHS | |
| Alienware x17 R2 P48E | |
| Asus ROG Strix Scar 17 SE G733CX-LL014W | |
| Média Intel Core i9-12950HX, NVIDIA GeForce RTX 3080 Ti Laptop GPU (n=1) | |
| Asus Strix Scar 17 G733QSA-XS99 | |
| Schenker XMG Neo 17 M22 | |
| CrossMark / Overall | |
| Lenovo Legion 7 16IAX7-82TD004SGE | |
| Asus ROG Strix Scar 17 SE G733CX-LL014W | |
| Média Intel Core i9-12950HX, NVIDIA GeForce RTX 3080 Ti Laptop GPU (n=1) | |
| MSI Titan GT77 12UHS | |
| Média da turma Gaming (1366 - 2409, n=94, últimos 2 anos) | |
| Alienware x17 R2 P48E | |
| Schenker XMG Neo 17 M22 | |
| CrossMark / Productivity | |
| Lenovo Legion 7 16IAX7-82TD004SGE | |
| MSI Titan GT77 12UHS | |
| Asus ROG Strix Scar 17 SE G733CX-LL014W | |
| Média Intel Core i9-12950HX, NVIDIA GeForce RTX 3080 Ti Laptop GPU (n=1) | |
| Média da turma Gaming (1386 - 2254, n=94, últimos 2 anos) | |
| Alienware x17 R2 P48E | |
| Schenker XMG Neo 17 M22 | |
| CrossMark / Creativity | |
| Asus ROG Strix Scar 17 SE G733CX-LL014W | |
| Média Intel Core i9-12950HX, NVIDIA GeForce RTX 3080 Ti Laptop GPU (n=1) | |
| Lenovo Legion 7 16IAX7-82TD004SGE | |
| MSI Titan GT77 12UHS | |
| Média da turma Gaming (1343 - 2786, n=94, últimos 2 anos) | |
| Alienware x17 R2 P48E | |
| Schenker XMG Neo 17 M22 | |
| CrossMark / Responsiveness | |
| Lenovo Legion 7 16IAX7-82TD004SGE | |
| MSI Titan GT77 12UHS | |
| Asus ROG Strix Scar 17 SE G733CX-LL014W | |
| Média Intel Core i9-12950HX, NVIDIA GeForce RTX 3080 Ti Laptop GPU (n=1) | |
| Média da turma Gaming (1226 - 2334, n=94, últimos 2 anos) | |
| Alienware x17 R2 P48E | |
| Schenker XMG Neo 17 M22 | |
| PCMark 10 Score | 7208 pontos | |
Ajuda | ||
| AIDA64 / Memory Copy | |
| Média da turma Gaming (21750 - 129946, n=102, últimos 2 anos) | |
| MSI Titan GT77 12UHS | |
| Lenovo Legion 7 16IAX7-82TD004SGE | |
| Asus ROG Strix Scar 17 SE G733CX-LL014W | |
| Média Intel Core i9-12950HX (59731 - 64732, n=7) | |
| Alienware x17 R2 P48E | |
| Schenker XMG Neo 17 M22 | |
| Asus Strix Scar 17 G733QSA-XS99 | |
| AIDA64 / Memory Read | |
| Média da turma Gaming (22956 - 118858, n=102, últimos 2 anos) | |
| Lenovo Legion 7 16IAX7-82TD004SGE | |
| Asus ROG Strix Scar 17 SE G733CX-LL014W | |
| Média Intel Core i9-12950HX (59744 - 70359, n=7) | |
| MSI Titan GT77 12UHS | |
| Alienware x17 R2 P48E | |
| Schenker XMG Neo 17 M22 | |
| Asus Strix Scar 17 G733QSA-XS99 | |
| AIDA64 / Memory Write | |
| Média da turma Gaming (22297 - 135096, n=102, últimos 2 anos) | |
| Asus ROG Strix Scar 17 SE G733CX-LL014W | |
| Lenovo Legion 7 16IAX7-82TD004SGE | |
| Média Intel Core i9-12950HX (57750 - 67899, n=7) | |
| MSI Titan GT77 12UHS | |
| Schenker XMG Neo 17 M22 | |
| Alienware x17 R2 P48E | |
| Asus Strix Scar 17 G733QSA-XS99 | |
| AIDA64 / Memory Latency | |
| Média da turma Gaming (75.3 - 165.4, n=102, últimos 2 anos) | |
| Alienware x17 R2 P48E | |
| Schenker XMG Neo 17 M22 | |
| MSI Titan GT77 12UHS | |
| Média Intel Core i9-12950HX (84.5 - 92.2, n=7) | |
| Lenovo Legion 7 16IAX7-82TD004SGE | |
| Asus ROG Strix Scar 17 SE G733CX-LL014W | |
| Asus Strix Scar 17 G733QSA-XS99 | |
* ... menor é melhor
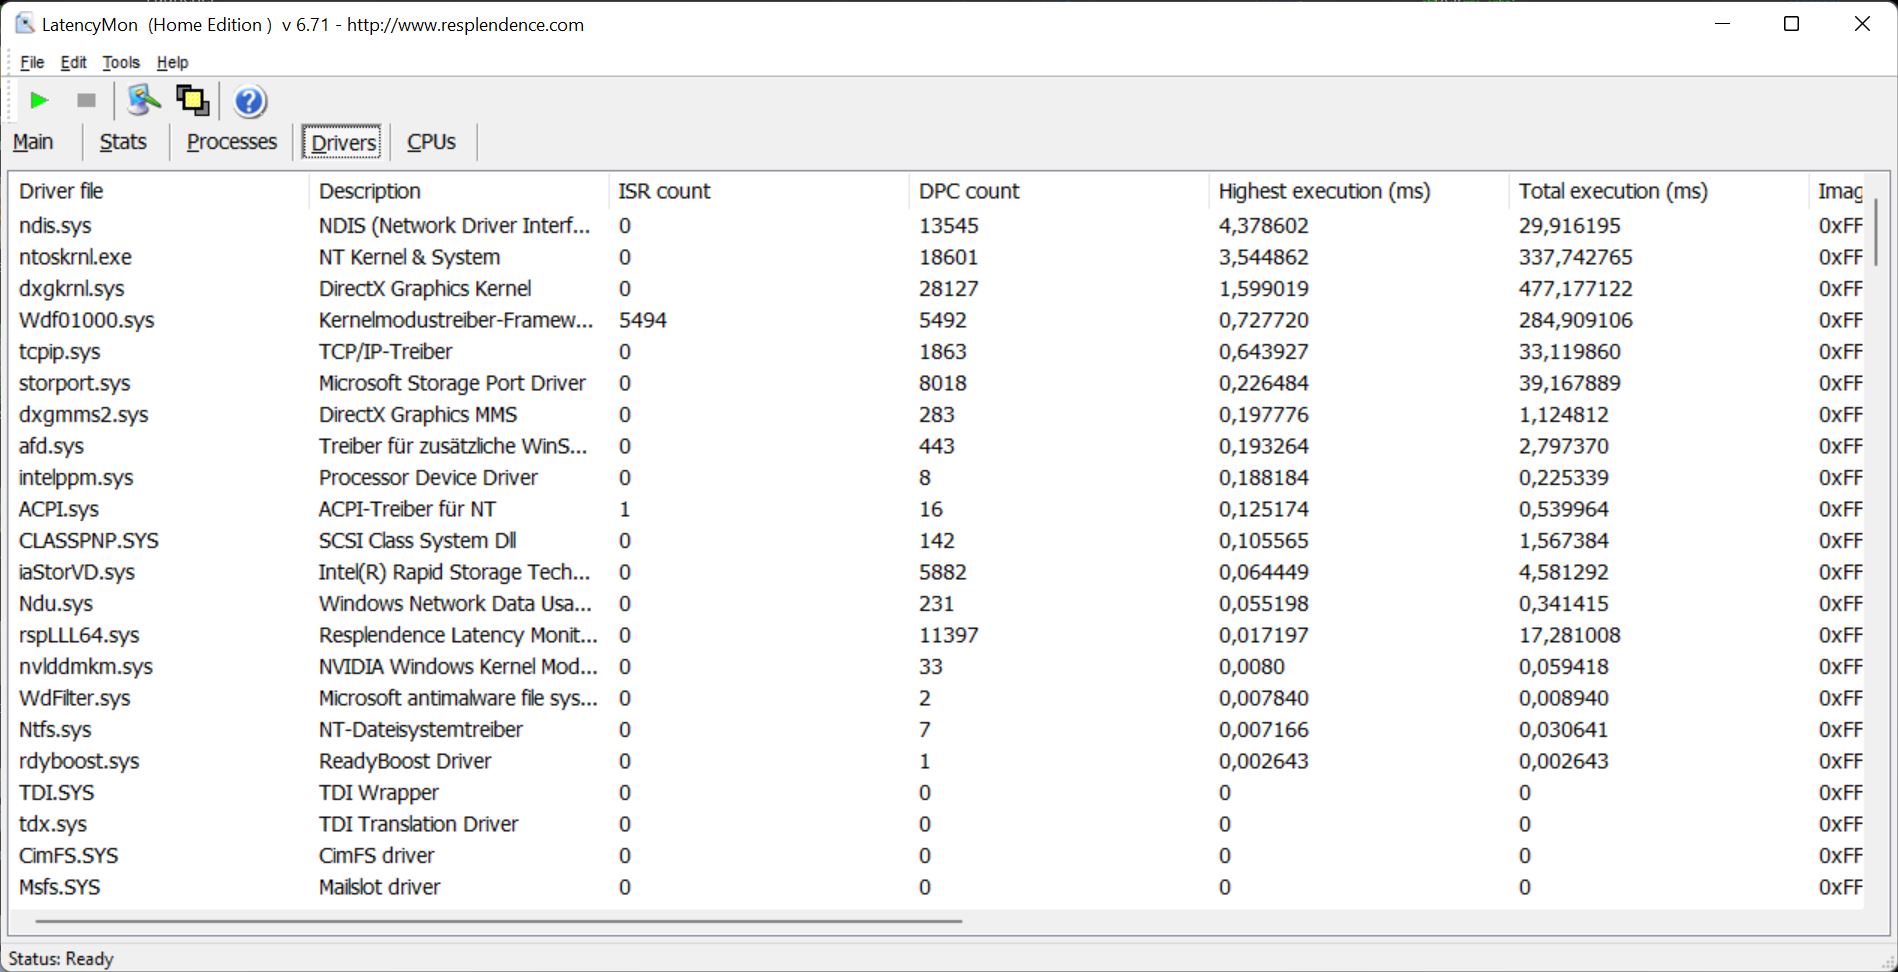
Latências DPC
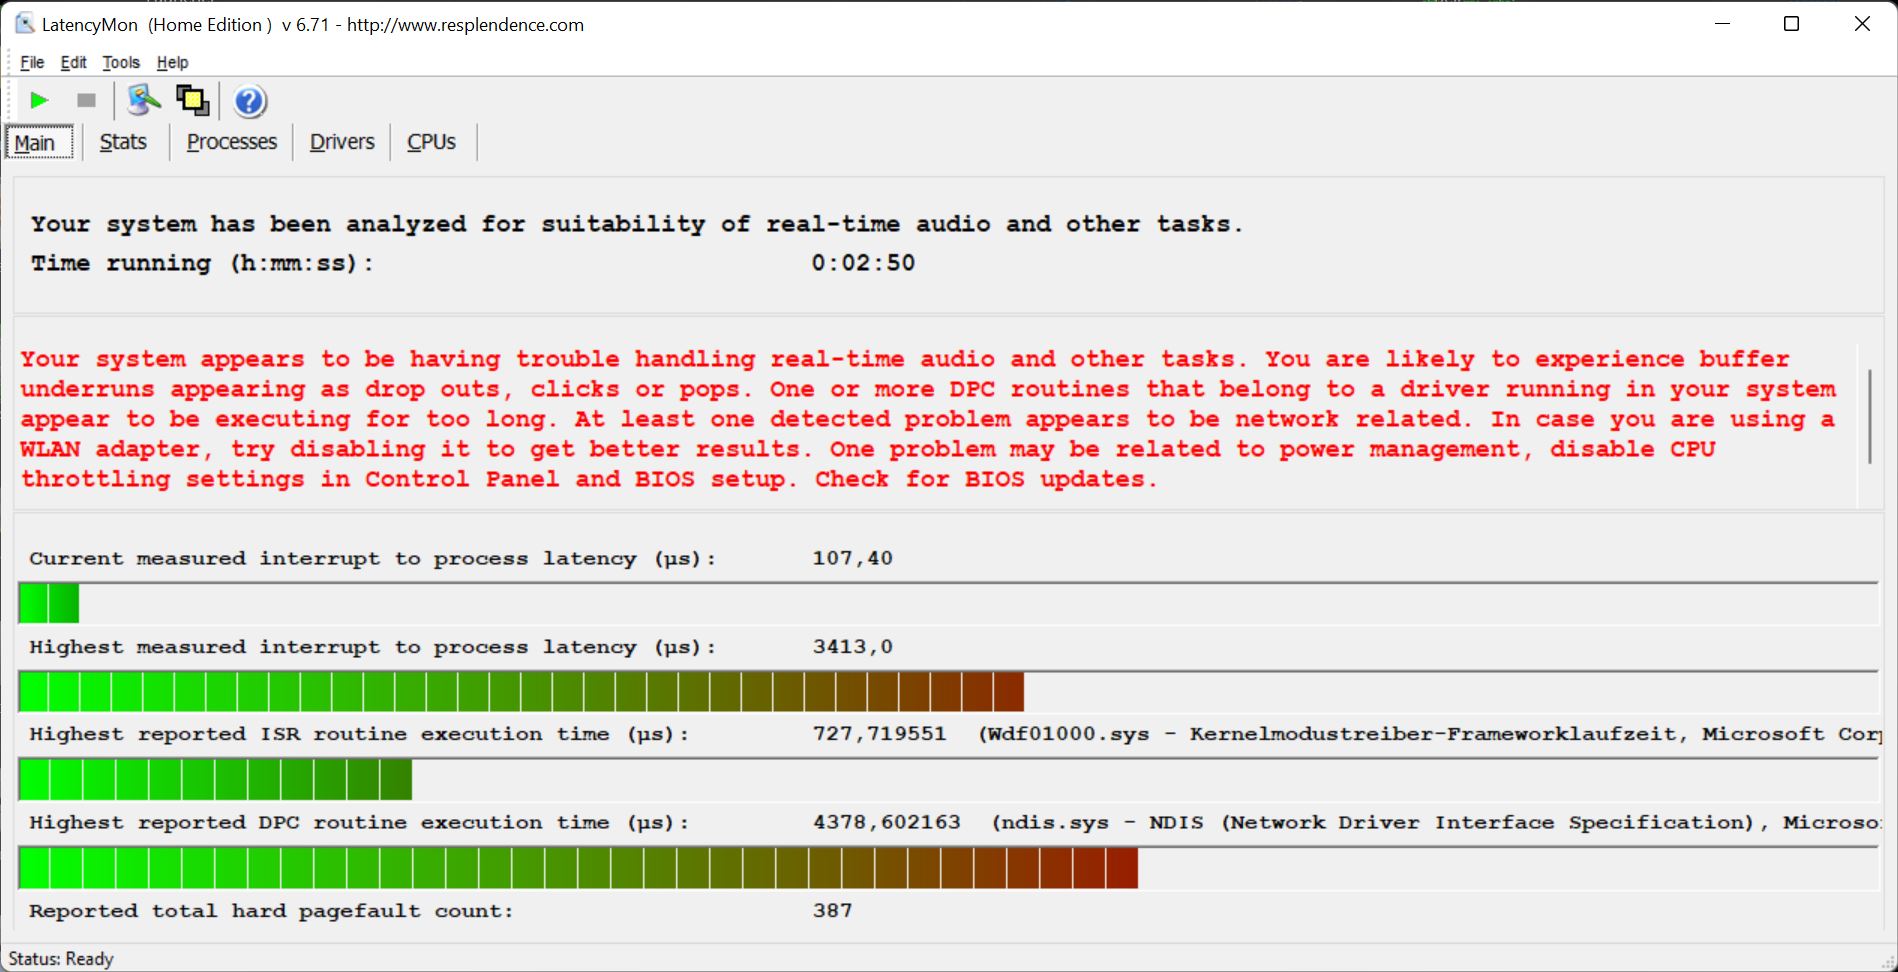
Em nosso teste de latência padronizado (navegando na Internet, vídeo 4K YouTube, carga de CPU), nossa unidade de teste com sua versão BIOS tem alguns problemas, por isso não é adequada para processamento de vídeo e áudio em tempo real.
| DPC Latencies / LatencyMon - interrupt to process latency (max), Web, Youtube, Prime95 | |
| Schenker XMG Neo 17 M22 | |
| Asus ROG Strix Scar 17 SE G733CX-LL014W | |
| MSI Titan GT77 12UHS | |
| MSI Titan GT77 12UHS | |
| Lenovo Legion 7 16IAX7-82TD004SGE | |
| Alienware x17 R2 P48E | |
| Asus Strix Scar 17 G733QSA-XS99 | |
* ... menor é melhor
Solução de armazenamento
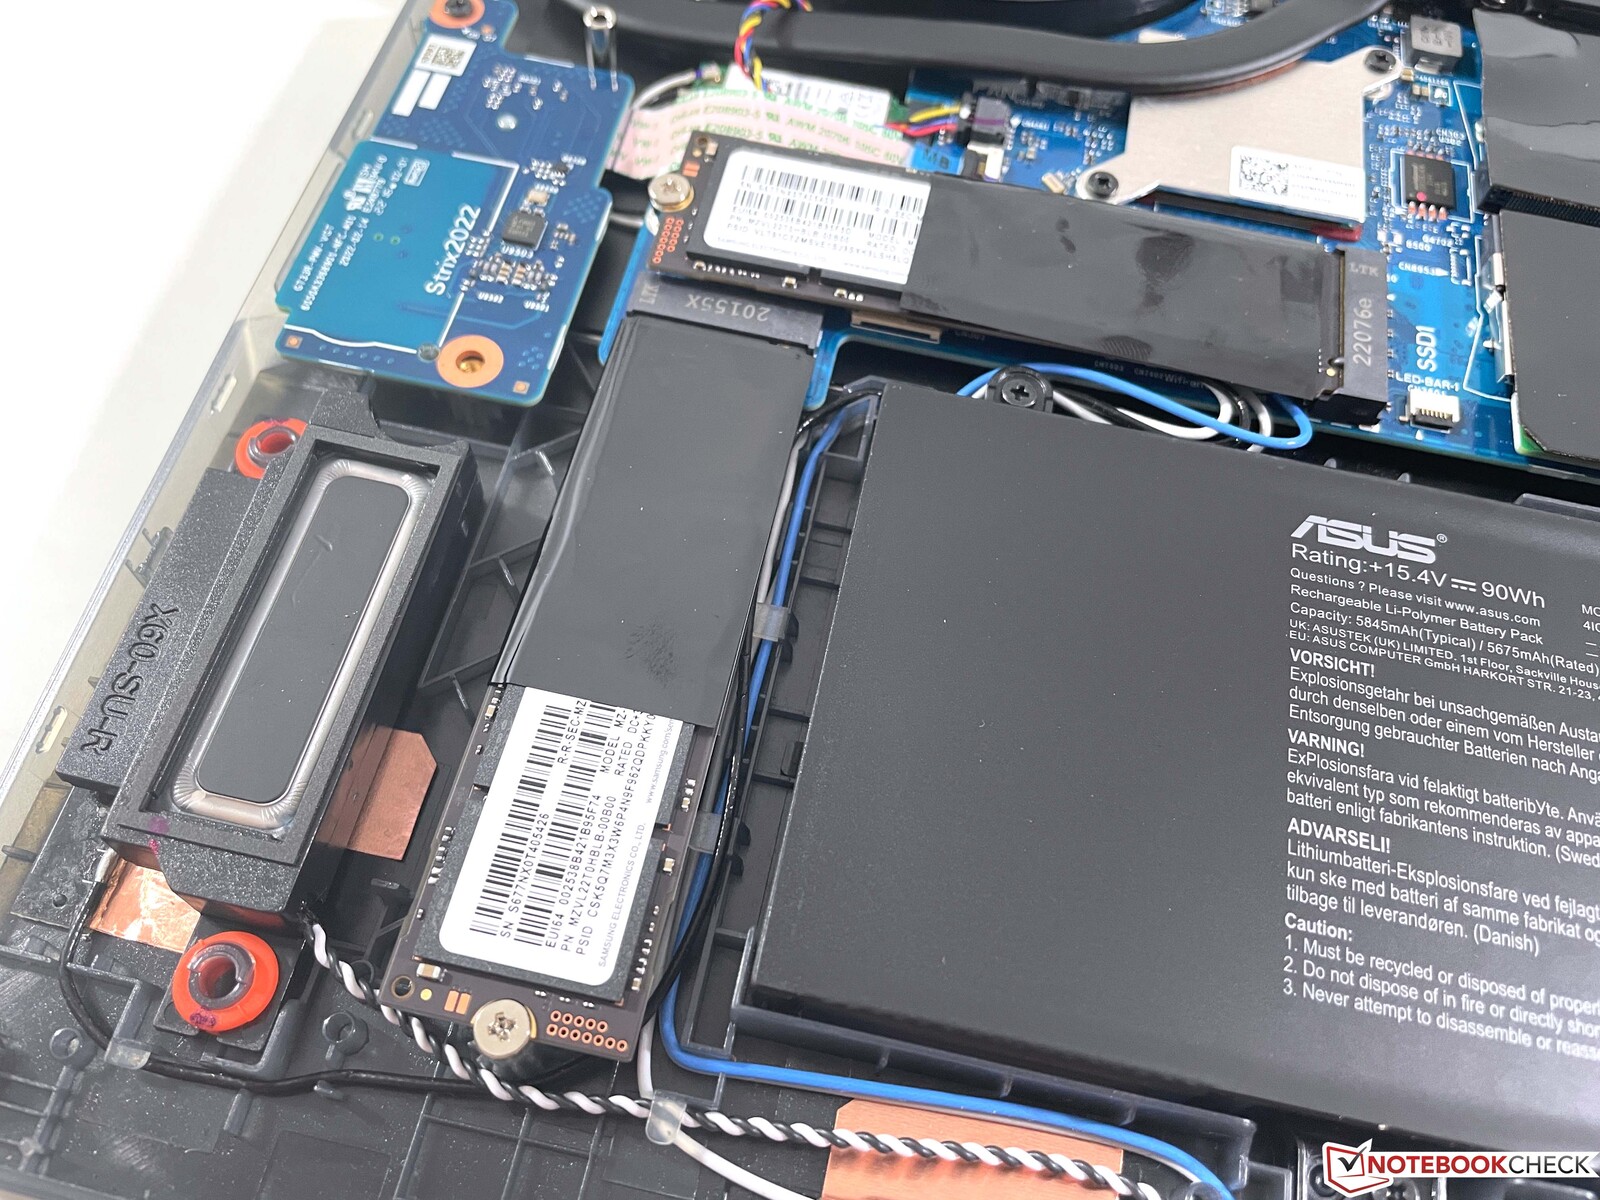
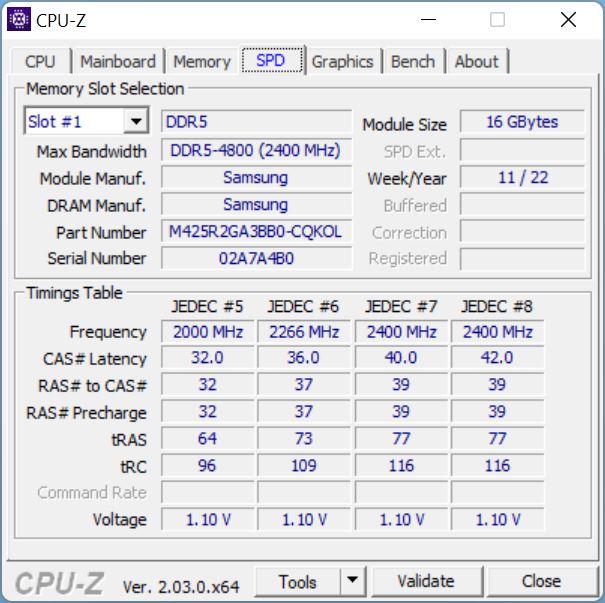
A Asus usa dois SSDs rápidos de 2 TB da Samsung (PM91A) em uma configuração RAID 0 aqui. Isto permite taxas de transferência extremamente altas de mais de 10 GB/s. Entretanto, o desempenho não permanece estável sob carga constante, caindo maciçamente em seu lugar. Mas isso não deve causar nenhuma limitação durante os jogos do dia-a-dia. Você pode encontrar referências adicionais de SSD aqui.

* ... menor é melhor
Disk Throttling: DiskSpd Read Loop, Queue Depth 8
Placa Gráfica
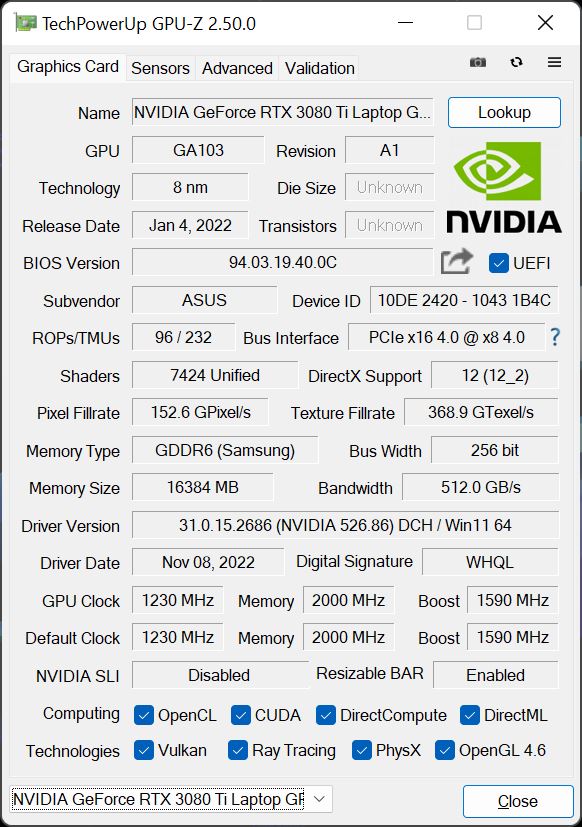
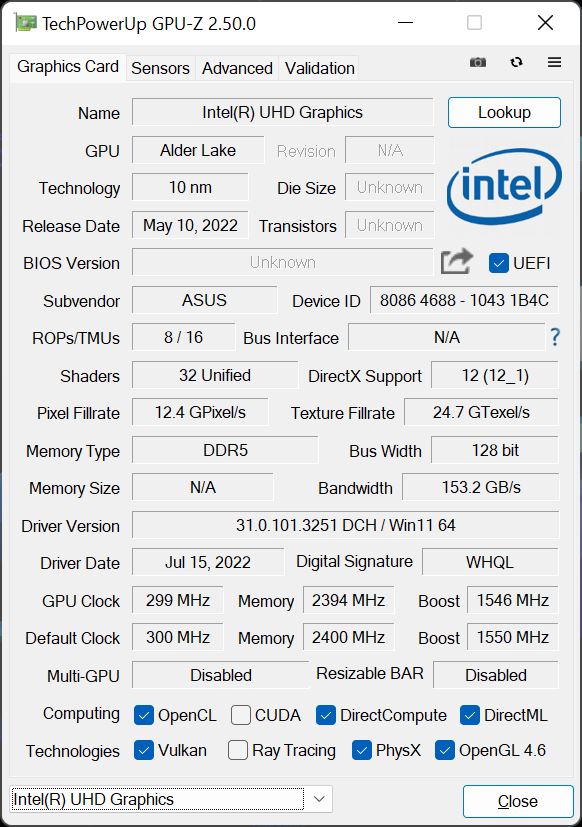
Asus usa oGeForce RTX 3080 Ti versão com um TGP de 150 watts, e a GPU também é capaz de usar um Dynamic Boost adicional de 25 watts do processador. Ele também atinge este valor (175 watts) no modo Performance, portanto não é necessário usar o modo Turbo. Há também um MUX que permite desativar completamente a GPU integrada (requer um reinício), o que melhora as latências enquanto se joga, mas não tem muito efeito sobre a performance gráfica em si
A performance gráfica se enquadra no grupo dos melhores jogadores e também é superior aos valores médios para o RTX 3080 Ti em nosso banco de dados. Além disso, o desempenho dos gráficos permanece completamente estável. O teste de estresse 3DMark Time Spy é aprovado sem problemas, e também não há queda de desempenho em nosso teste de carga constante Witcher 3. O desempenho dos jogos é facilmente suficiente para o máximo de detalhes na resolução nativa QHD, mesmo em jogos exigentes.
Na operação por bateria, a GPU pode consumir no máximo 44 watts, o que corresponde a uma queda de performance de cerca de 70%. Você pode encontrar referências adicionais de GPU aqui.
| 3DMark 11 Performance | 35997 pontos | |
| 3DMark Fire Strike Score | 28793 pontos | |
| 3DMark Time Spy Score | 12904 pontos | |
Ajuda | ||
| Blender / v3.3 Classroom OPTIX/RTX | |
| Média NVIDIA GeForce RTX 3080 Ti Laptop GPU (20 - 28, n=13) | |
| Lenovo Legion 7 16IAX7-82TD004SGE | |
| Asus ROG Strix Scar 17 SE G733CX-LL014W | |
| MSI Titan GT77 12UHS | |
| Média da turma Gaming (9 - 32, n=103, últimos 2 anos) | |
| Blender / v3.3 Classroom CUDA | |
| Lenovo Legion 7 16IAX7-82TD004SGE | |
| Média NVIDIA GeForce RTX 3080 Ti Laptop GPU (32 - 41, n=13) | |
| Asus ROG Strix Scar 17 SE G733CX-LL014W | |
| Média da turma Gaming (15 - 228, n=103, últimos 2 anos) | |
| MSI Titan GT77 12UHS | |
| Blender / v3.3 Classroom CPU | |
| Asus ROG Strix Scar 17 SE G733CX-LL014W | |
| Média NVIDIA GeForce RTX 3080 Ti Laptop GPU (261 - 429, n=13) | |
| Lenovo Legion 7 16IAX7-82TD004SGE | |
| MSI Titan GT77 12UHS | |
| Média da turma Gaming (122 - 565, n=99, últimos 2 anos) | |
* ... menor é melhor
| The Witcher 3 - 1920x1080 Ultra Graphics & Postprocessing (HBAO+) | |
| Média da turma Gaming (104.7 - 240, n=7, últimos 2 anos) | |
| MSI Titan GT77 12UHS | |
| Alienware x17 R2 P48E | |
| Schenker XMG Neo 17 M22 | |
| Asus ROG Strix Scar 17 SE G733CX-LL014W | |
| Lenovo Legion 7 16IAX7-82TD004SGE | |
| Média NVIDIA GeForce RTX 3080 Ti Laptop GPU (30 - 130.6, n=43) | |
| Asus Strix Scar 17 G733QSA-XS99 | |
| F1 22 | |
| 1920x1080 Ultra High Preset AA:T AF:16x | |
| Schenker XMG Neo 17 M22 | |
| Média NVIDIA GeForce RTX 3080 Ti Laptop GPU (78.9 - 91, n=4) | |
| MSI Titan GT77 12UHS | |
| Asus ROG Strix Scar 17 SE G733CX-LL014W | |
| Média da turma Gaming (40.1 - 121.2, n=4, últimos 2 anos) | |
| 2560x1440 Ultra High Preset AA:T AF:16x | |
| Schenker XMG Neo 17 M22 | |
| Média NVIDIA GeForce RTX 3080 Ti Laptop GPU (52.9 - 62, n=2) | |
| Média da turma Gaming (42 - 77.8, n=3, últimos 2 anos) | |
| Asus ROG Strix Scar 17 SE G733CX-LL014W | |
The Witcher 3 FPS Chart
| baixo | média | alto | ultra | QHD | |
|---|---|---|---|---|---|
| GTA V (2015) | 186.8 | 180.7 | 126.7 | 114.1 | |
| The Witcher 3 (2015) | 118.8 | ||||
| Dota 2 Reborn (2015) | 211 | 191 | 180.8 | 169.8 | |
| Final Fantasy XV Benchmark (2018) | 173.3 | 156.2 | 118.5 | 92.8 | |
| X-Plane 11.11 (2018) | 165.3 | 143.5 | 116.2 | ||
| Strange Brigade (2018) | 236 | 211 | 157.7 | ||
| F1 2021 (2021) | 236 | 211 | 132.8 | 106.2 | |
| Cyberpunk 2077 1.6 (2022) | 103 | 101 | 98 | 87 | 56 |
| F1 22 (2022) | 235 | 235 | 199.7 | 78.9 | 52.9 |
| Call of Duty Modern Warfare 2 2022 (2022) | 135 | 109 | 107 | 78 |
Emissões e gerenciamento de energia
Níveis de ruídos
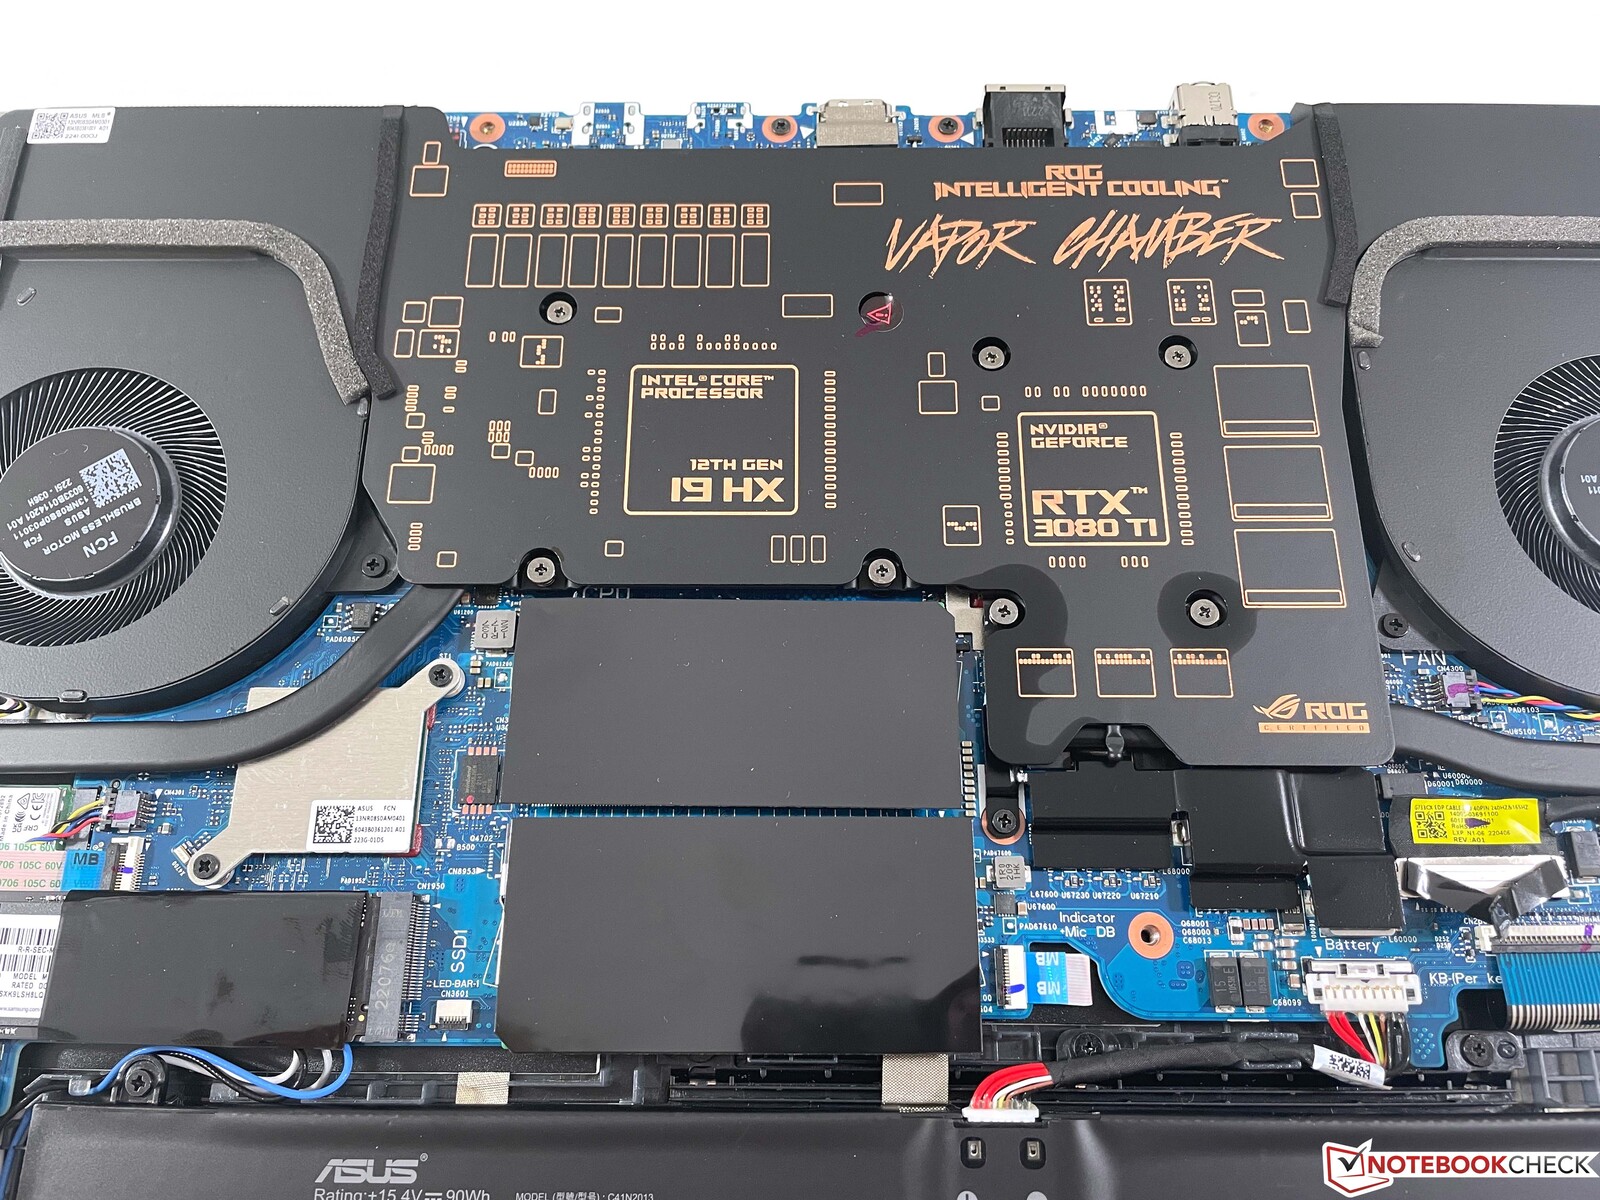
O Asus usa aqui um sistema de resfriamento por câmara de vapor. No modo Performance power, o dispositivo também permanece relativamente silencioso, e somos capazes de medir um máximo de 46 dB(A) durante o teste de estresse, bem como durante o jogo. É claro que isto ainda é perceptível, mas nossa unidade de teste ainda é significativamente mais silenciosa com isto do que os concorrentes. No modo Turbo, o desempenho do jogo é apenas insignificantemente maior, mas os dois ventiladores em funcionamento produzem um alto 54 dB(A). Durante a operação ociosa, os ventiladores muitas vezes permanecem desligados, mas quase sempre notamos alguns ruídos eletrônicos silenciosos. Sob carga, há também alguns ruídos audíveis da bobina que vêm da GPU, estamos adivinhando.
Barulho
| Ocioso |
| 23.9 / 23.9 / 23.9 dB |
| Carga |
| 34.3 / 45.9 dB |
 | ||
30 dB silencioso 40 dB(A) audível 50 dB(A) ruidosamente alto |
||
min: | ||
| Asus ROG Strix Scar 17 SE G733CX-LL014W GeForce RTX 3080 Ti Laptop GPU, i9-12950HX, Samsung PM9A1 MZVL22T0HBLB | Lenovo Legion 7 16IAX7-82TD004SGE GeForce RTX 3080 Ti Laptop GPU, i9-12900HX, Micron 3400 1TB MTFDKBA1T0TFH | MSI Titan GT77 12UHS GeForce RTX 3080 Ti Laptop GPU, i9-12900HX, Samsung PM9A1 MZVL21T0HCLR | Schenker XMG Neo 17 M22 GeForce RTX 3080 Ti Laptop GPU, R9 6900HX, Samsung SSD 980 Pro 1TB MZ-V8P1T0BW | Alienware x17 R2 P48E GeForce RTX 3080 Ti Laptop GPU, i9-12900HK, 2x Samsung PM9A1 1TB (RAID 0) | Asus Strix Scar 17 G733QSA-XS99 GeForce RTX 3080 Laptop GPU, R9 5900HX, 2x Samsung PM981a MZVLB1T0HBLR (RAID 0) | |
|---|---|---|---|---|---|---|
| Noise | -19% | -9% | -27% | 1% | -4% | |
| desligado / ambiente * (dB) | 23.9 | 24.5 -3% | 21.9 8% | 26 -9% | 22.7 5% | 25 -5% |
| Idle Minimum * (dB) | 23.9 | 24.5 -3% | 24.53 -3% | 26 -9% | 23.1 3% | 25.2 -5% |
| Idle Average * (dB) | 23.9 | 30 -26% | 24.53 -3% | 29 -21% | 23.1 3% | 25.2 -5% |
| Idle Maximum * (dB) | 23.9 | 32.5 -36% | 24.53 -3% | 40 -67% | 23.1 3% | 25.2 -5% |
| Load Average * (dB) | 34.3 | 43.9 -28% | 46.25 -35% | 47 -37% | 31.9 7% | 30.7 10% |
| Load Maximum * (dB) | 45.9 | 54.2 -18% | 54.25 -18% | 54 -18% | 52.5 -14% | 51.3 -12% |
| Witcher 3 ultra * (dB) | 48.8 | 56.86 | 52 | 52.5 | 51.3 |
* ... menor é melhor
Temperatura
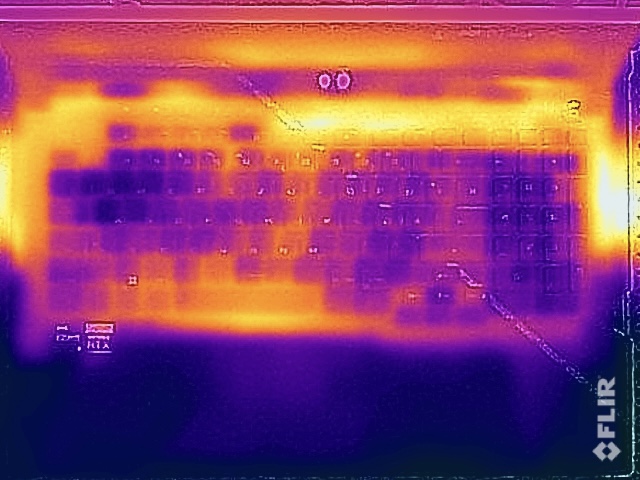
Apesar dos ventiladores relativamente silenciosos, as temperaturas de superfície não dão motivos para preocupação. Apesar de medirmos mais de 50 °C (122 °F) em alguns pontos isolados sob carga, o teclado permanece muito frio e não há nenhuma limitação durante os jogos
Durante o teste de estresse, a GPU recebe tratamento preferencial, funcionando de forma estável a 150 watts assim que o processador se desnivelar em cerca de 36 watts. Não há redução de desempenho logo após o teste de estresse.
(-) A temperatura máxima no lado superior é 48.8 °C / 120 F, em comparação com a média de 40.4 °C / 105 F , variando de 21.2 a 68.8 °C para a classe Gaming.
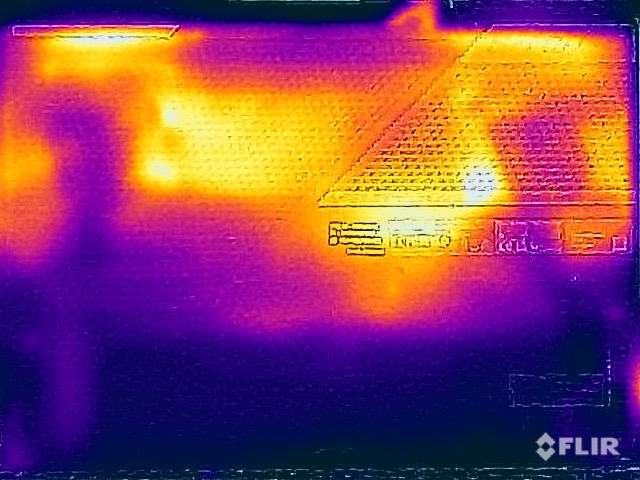
(-) A parte inferior aquece até um máximo de 52.4 °C / 126 F, em comparação com a média de 43.2 °C / 110 F
(+) Em uso inativo, a temperatura média para o lado superior é 28.6 °C / 83 F, em comparação com a média do dispositivo de 33.9 °C / ### class_avg_f### F.
(±) Jogando The Witcher 3, a temperatura média para o lado superior é 35.1 °C / 95 F, em comparação com a média do dispositivo de 33.9 °C / ## #class_avg_f### F.
(+) Os apoios para as mãos e o touchpad são mais frios que a temperatura da pele, com um máximo de 26 °C / 78.8 F e, portanto, são frios ao toque.
(+) A temperatura média da área do apoio para as mãos de dispositivos semelhantes foi 28.8 °C / 83.8 F (+2.8 °C / 5 F).
| Asus ROG Strix Scar 17 SE G733CX-LL014W Intel Core i9-12950HX, NVIDIA GeForce RTX 3080 Ti Laptop GPU | Lenovo Legion 7 16IAX7-82TD004SGE Intel Core i9-12900HX, NVIDIA GeForce RTX 3080 Ti Laptop GPU | MSI Titan GT77 12UHS Intel Core i9-12900HX, NVIDIA GeForce RTX 3080 Ti Laptop GPU | Schenker XMG Neo 17 M22 AMD Ryzen 9 6900HX, NVIDIA GeForce RTX 3080 Ti Laptop GPU | Alienware x17 R2 P48E Intel Core i9-12900HK, NVIDIA GeForce RTX 3080 Ti Laptop GPU | Asus Strix Scar 17 G733QSA-XS99 AMD Ryzen 9 5900HX, NVIDIA GeForce RTX 3080 Laptop GPU | |
|---|---|---|---|---|---|---|
| Heat | -8% | -3% | 1% | 7% | 4% | |
| Maximum Upper Side * (°C) | 48.8 | 44.4 9% | 40.8 16% | 49 -0% | 49.6 -2% | 40 18% |
| Maximum Bottom * (°C) | 52.4 | 60.8 -16% | 52.4 -0% | 52 1% | 42.4 19% | 39.8 24% |
| Idle Upper Side * (°C) | 30.4 | 33.8 -11% | 34.6 -14% | 30 1% | 29.2 4% | 34.6 -14% |
| Idle Bottom * (°C) | 34.1 | 38.8 -14% | 38.4 -13% | 33 3% | 32 6% | 38.4 -13% |
* ... menor é melhor
Oradores
O sistema de som consiste de um total de quatro módulos que produzem um som potente e espaçoso. Embora as caixas acústicas não sejam as mais barulhentas do mercado, a qualidade é muito boa em geral. Entretanto, devido ao barulho alto dos ventiladores durante os jogos, ainda assim recomendamos um fone de ouvido.
Asus ROG Strix Scar 17 SE G733CX-LL014W análise de áudio
(±) | o volume do alto-falante é médio, mas bom (###valor### dB)
Graves 100 - 315Hz
(±) | graves reduzidos - em média 6.2% menor que a mediana
(±) | a linearidade dos graves é média (7.5% delta para a frequência anterior)
Médios 400 - 2.000 Hz
(+) | médios equilibrados - apenas 2% longe da mediana
(+) | médios são lineares (3.9% delta para frequência anterior)
Altos 2 - 16 kHz
(+) | agudos equilibrados - apenas 3.5% longe da mediana
(±) | a linearidade dos máximos é média (9.3% delta para frequência anterior)
Geral 100 - 16.000 Hz
(+) | o som geral é linear (13.6% diferença em relação à mediana)
Comparado com a mesma classe
» 20% de todos os dispositivos testados nesta classe foram melhores, 7% semelhantes, 73% piores
» O melhor teve um delta de 6%, a média foi 18%, o pior foi 132%
Comparado com todos os dispositivos testados
» 15% de todos os dispositivos testados foram melhores, 4% semelhantes, 81% piores
» O melhor teve um delta de 4%, a média foi 23%, o pior foi 134%
MSI Titan GT77 12UHS análise de áudio
(+) | os alto-falantes podem tocar relativamente alto (###valor### dB)
Graves 100 - 315Hz
(-) | quase nenhum baixo - em média 71.8% menor que a mediana
(+) | o baixo é linear (0% delta para a frequência anterior)
Médios 400 - 2.000 Hz
(-) | quase nenhum médio - em média 71.8% menor que a mediana
(+) | médios são lineares (0% delta para frequência anterior)
Altos 2 - 16 kHz
(-) | quase nenhum máximo - em média 71.8% menor que a mediana
(+) | os máximos são lineares (0% delta da frequência anterior)
Geral 100 - 16.000 Hz
(-) | o som geral não é linear (107.7% diferença em relação à mediana)
Comparado com a mesma classe
» 100% de todos os dispositivos testados nesta classe foram melhores, 0% semelhantes, 0% piores
» O melhor teve um delta de 6%, a média foi 18%, o pior foi 132%
Comparado com todos os dispositivos testados
» 96% de todos os dispositivos testados foram melhores, 0% semelhantes, 4% piores
» O melhor teve um delta de 4%, a média foi 23%, o pior foi 134%
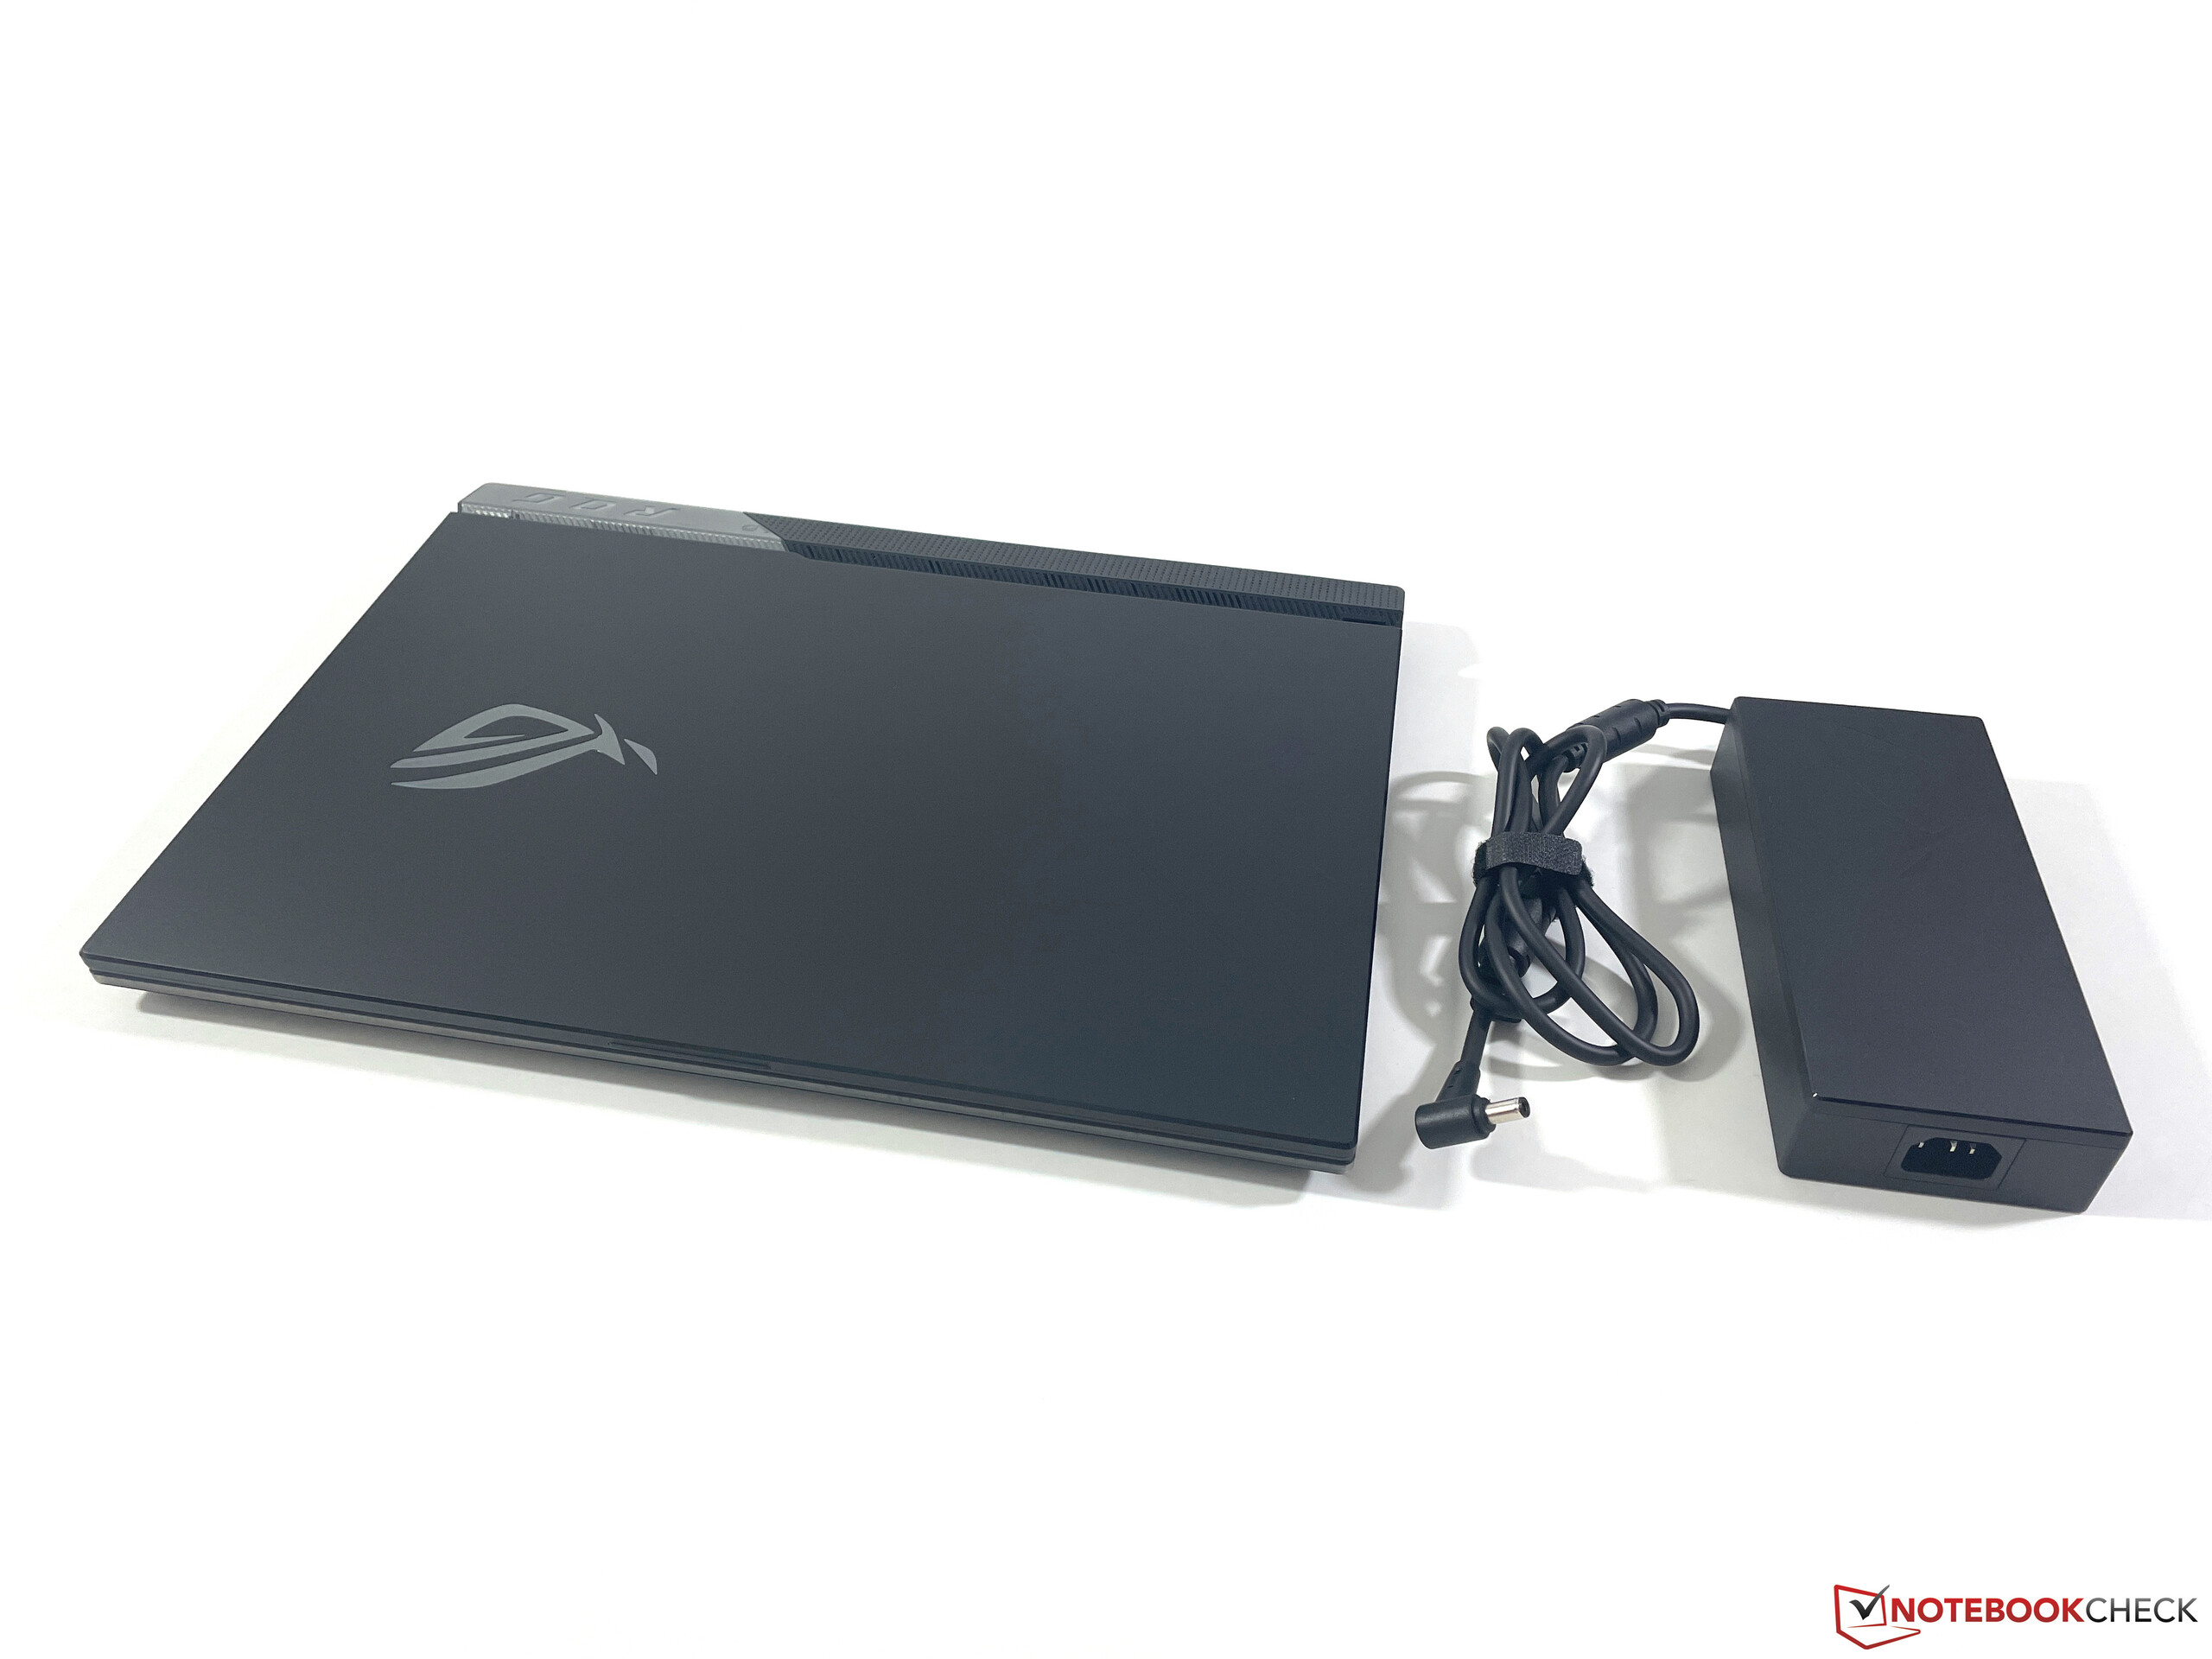
Consumo de energia
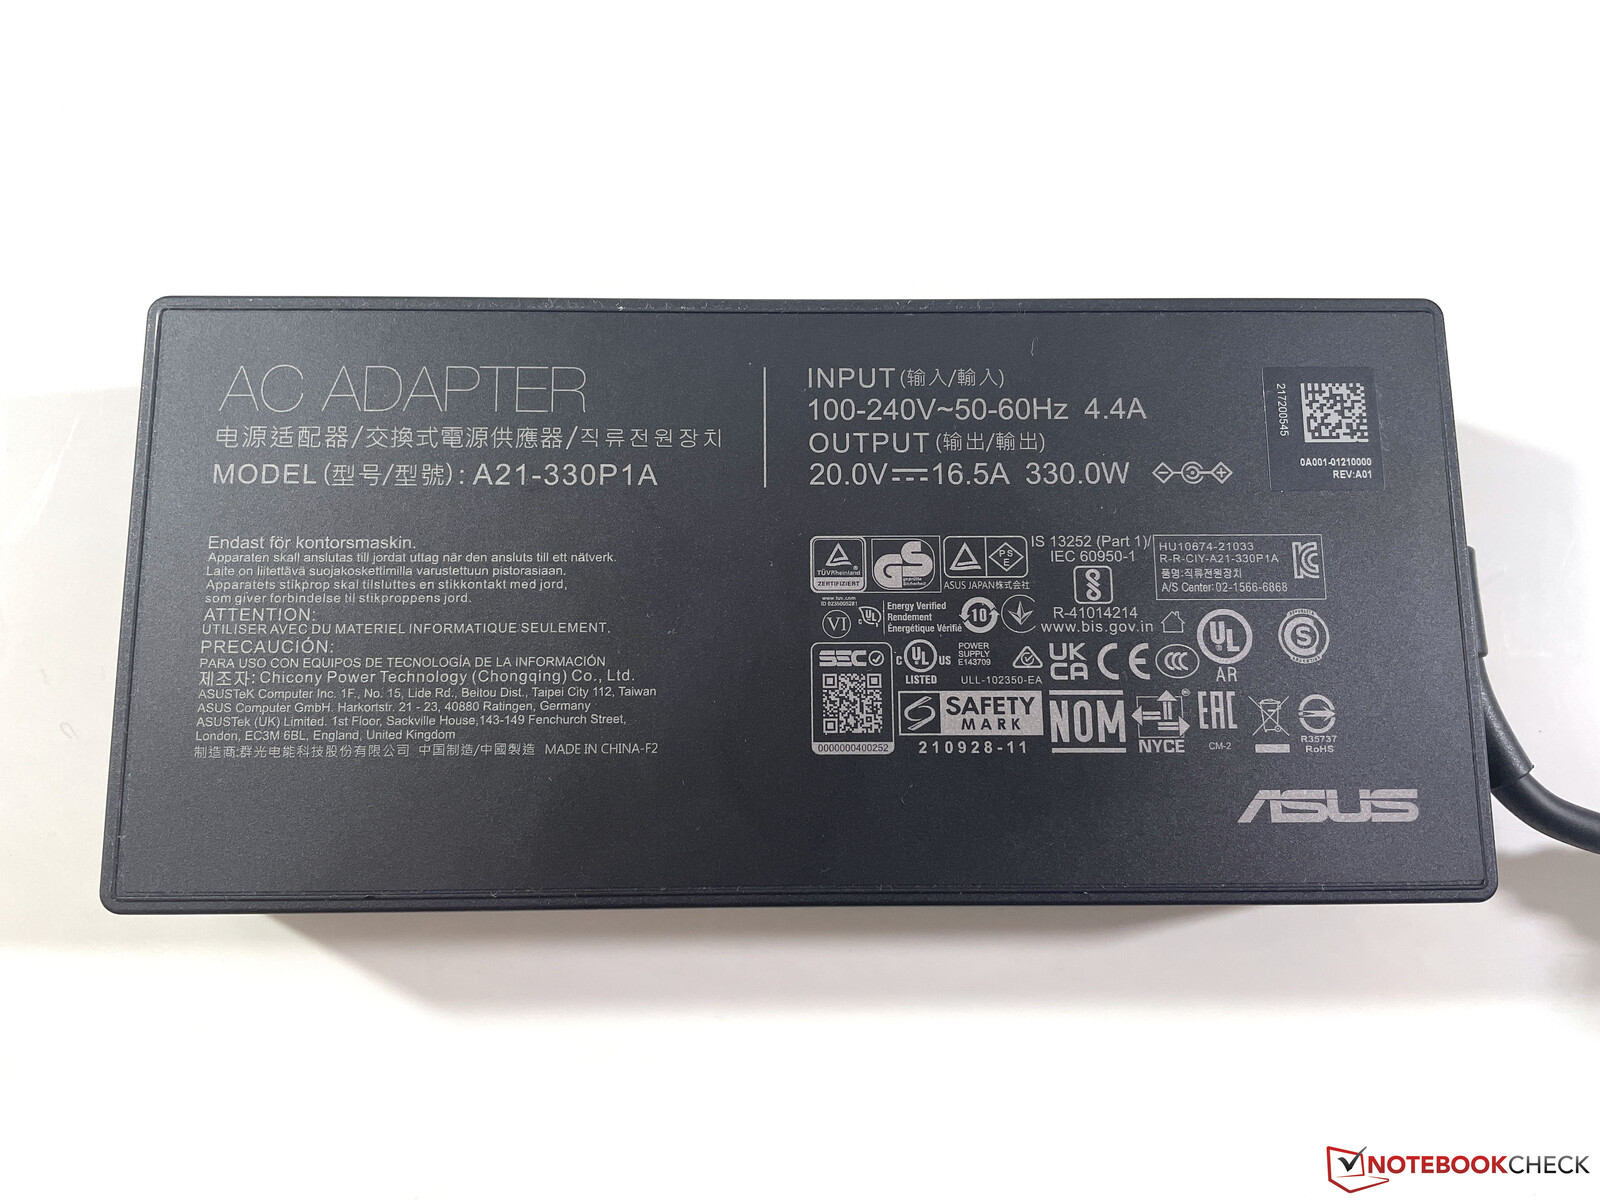
O ROG Strix Scar 17 SE não é um laptop muito eficiente, o que não é muito surpreendente considerando o poderoso hardware. Já medimos até 27 watts durante a operação ociosa, e enquanto jogamos, o valor aumenta para cerca de 230 watts. A fonte de alimentação de 330 watts é, portanto, suficientemente grande. O consumo em modo standby também é bastante alto a 2,6 watts, mas isto se deve aos efeitos de iluminação que são ativados por padrão.
| desligado | |
| Ocioso | |
| Carga |
|
Key:
min: | |
Power Consumption The Witcher 3 / Stress Test
Power Consumption With External Monitor
Vida útil da bateria
Em nosso teste WLAN a 150 cd/m², o que corresponde a 48% do brilho máximo, nossa unidade de teste dura apenas cerca de 4 horas. Considerando os altos valores de consumo, isto não é muito surpreendente. Alguns dos concorrentes duram significativamente mais aqui, se você precisar fazer a ponte entre o tempo de saída e o tempo de funcionamento. O jogo é possível por cerca de uma hora, mas apenas com uma redução significativa do desempenho. Leva cerca de 100 minutos para recarregar completamente a bateria de 90-Wh, com 80% da capacidade já disponível após cerca de 53 minutos.
Pro
Contra
Veredicto - Um laptop de jogo rápido totalmente equipado
O atual Asus ROG Strix Scar 17 SE fornece realmente tudo o que o coração de um jogador deseja. Um rápido painel QHD com 240 Hz junto com o GeForce RTX 3080 Ti, que também oferece potência suficiente para a resolução nativa em detalhes máximos. Embora o desempenho da CPU também seja bom para um laptop para jogos, o potencial do processador HX não pode ser usado totalmente. Portanto, você deve economizar o prêmio adicional para o processador mais potente e apenas escolher um Core i9 regular
Outras vantagens incluem as cores muito precisas, se você tiver que trabalhar diretamente no processamento de vídeo, por exemplo, as temperaturas moderadas da superfície, e os ventiladores relativamente silenciosos durante os jogos. Embora um modo Turbo esteja disponível, que também se torna significativamente mais alto, isto não tem muito impacto sobre o desempenho dos jogos, portanto, em nossa opinião, não vale a pena
O novo Asus ROG Strix Scar 17 SE oferece muitos recursos de desempenho e jogos, mas você deve economizar no prêmio adicional para o processador Intel HX.
Os concorrentes no mercado de jogos oferecem especificações de desempenho semelhantes, mas também displays mais brilhantes em peças e caixas menos brilhantes. Além disso, os ruídos eletrônicos podem se tornar irritantes a longo prazo.
Preço e Disponibilidade
Nossa configuração de teste do ROG Strix Scar 17 SE está disponível em Amazon por $3899e uma configuração menor com o Core i9-12900H regular também está disponível lá por $2278.
Asus ROG Strix Scar 17 SE G733CX-LL014W
- 11/18/2022 v7 (old)
Andreas Osthoff
Price comparison

