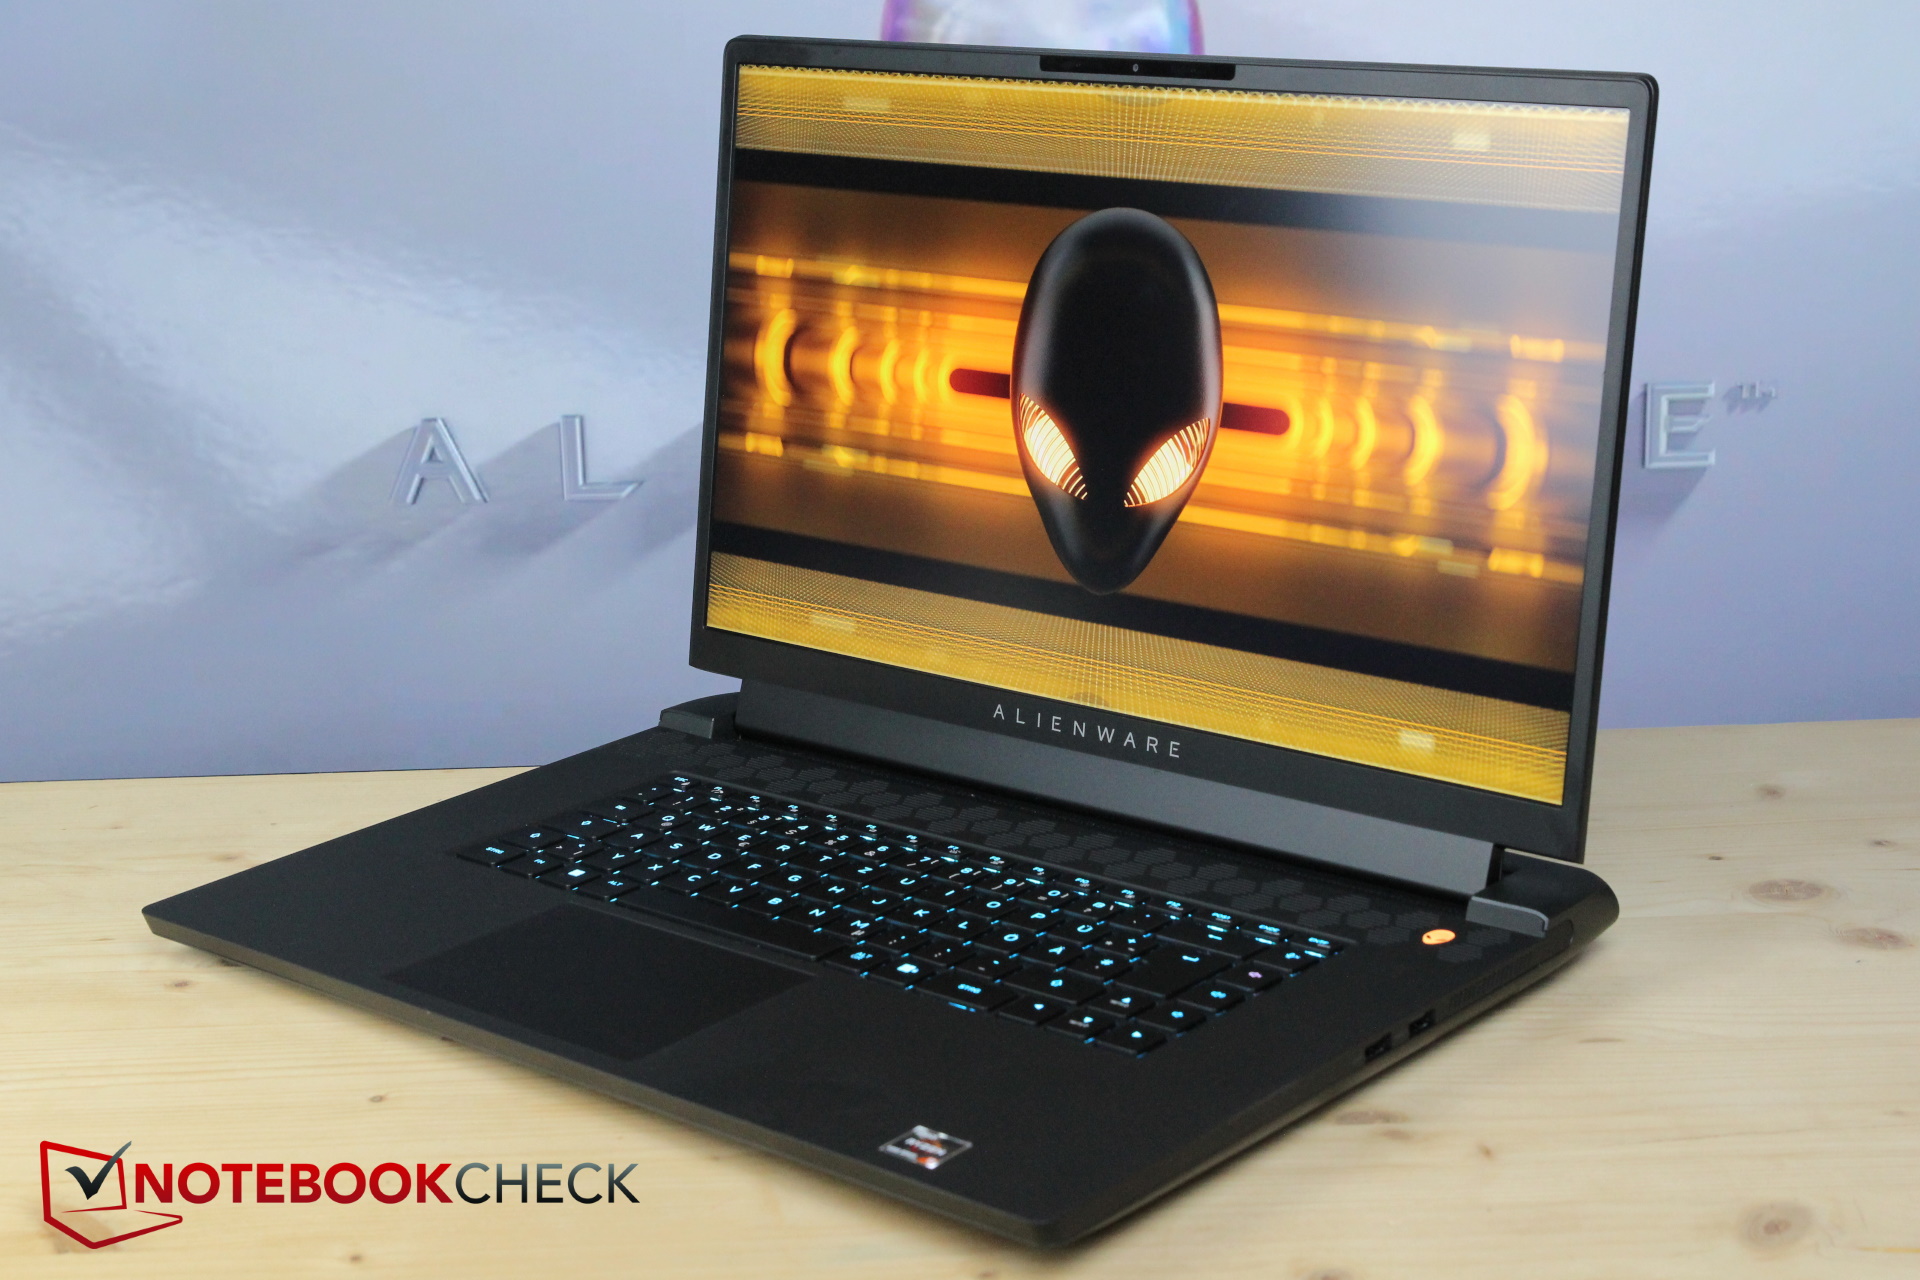
Alienware m17 R5 em revisão de laptop: Jogador All-AMD com grande potencial, mas com problemas de direção.
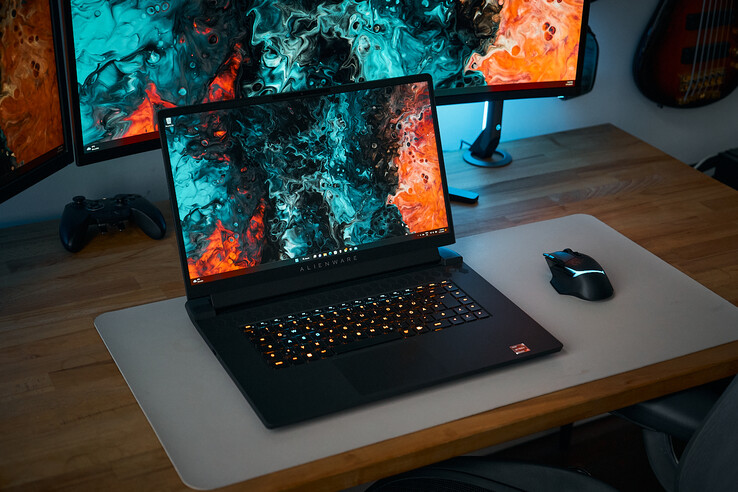
Em 2021, revisamos o predecessor Alienware m17 R4com sua CPU Comet Lake e RTX 3080. Ao fazer isso, algumas fraquezas foram descobertas, que foram bem refletidas no título da revisão ("Queimadas na atmosfera"). Agora temos o m17 R5, mas completo com hardware AMD desta vez, no laboratório de testes e estamos naturalmente interessados em saber se o sucessor finalmente conseguiu controlar os problemas de temperatura do predecessor.
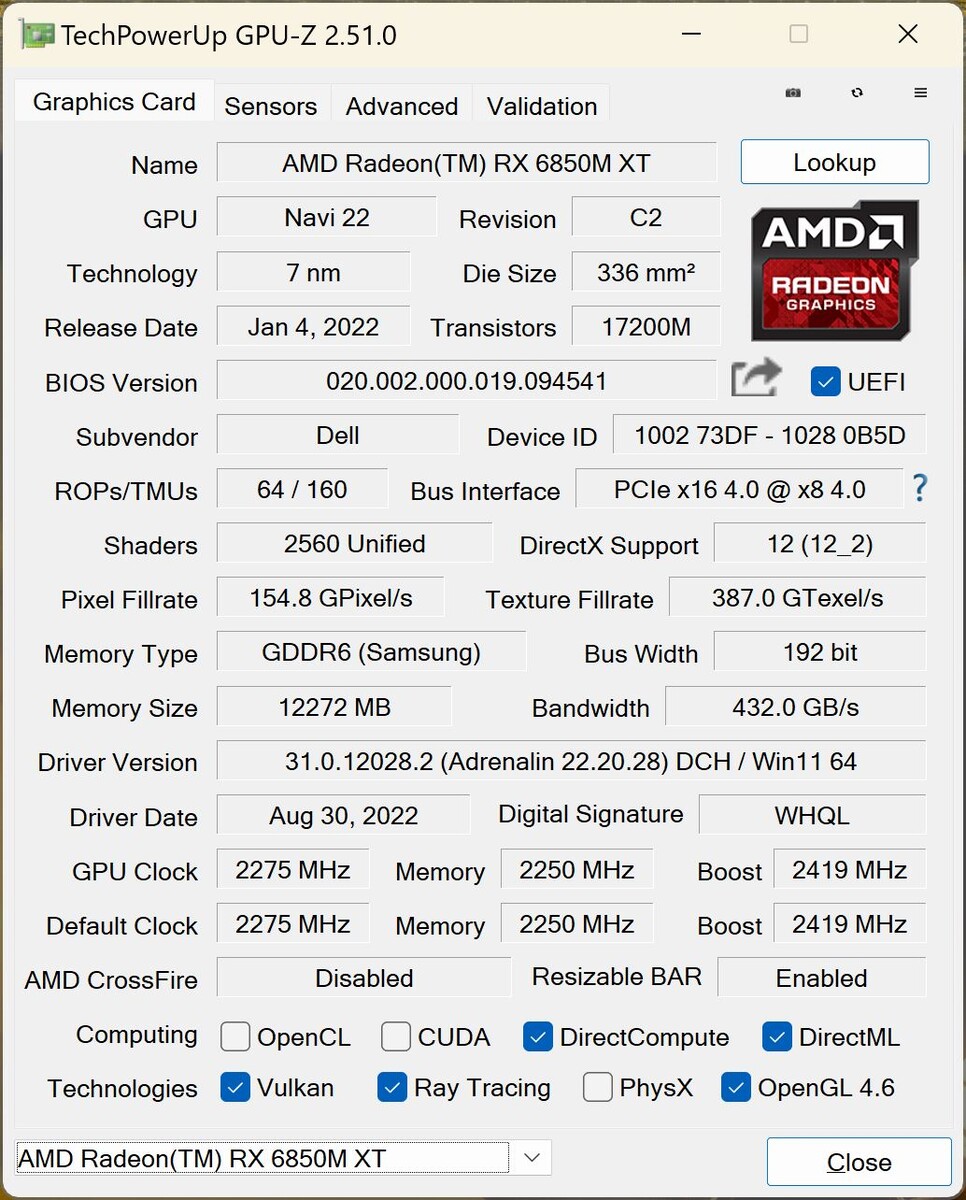
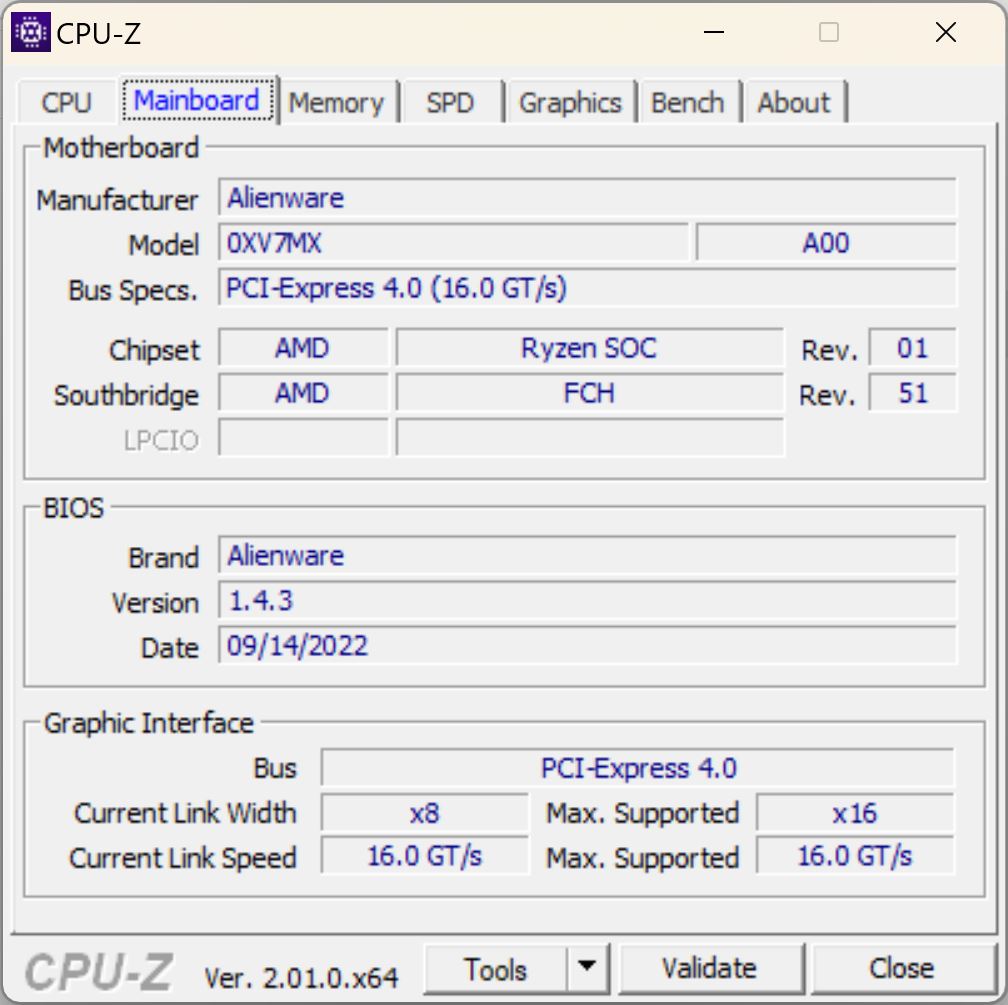
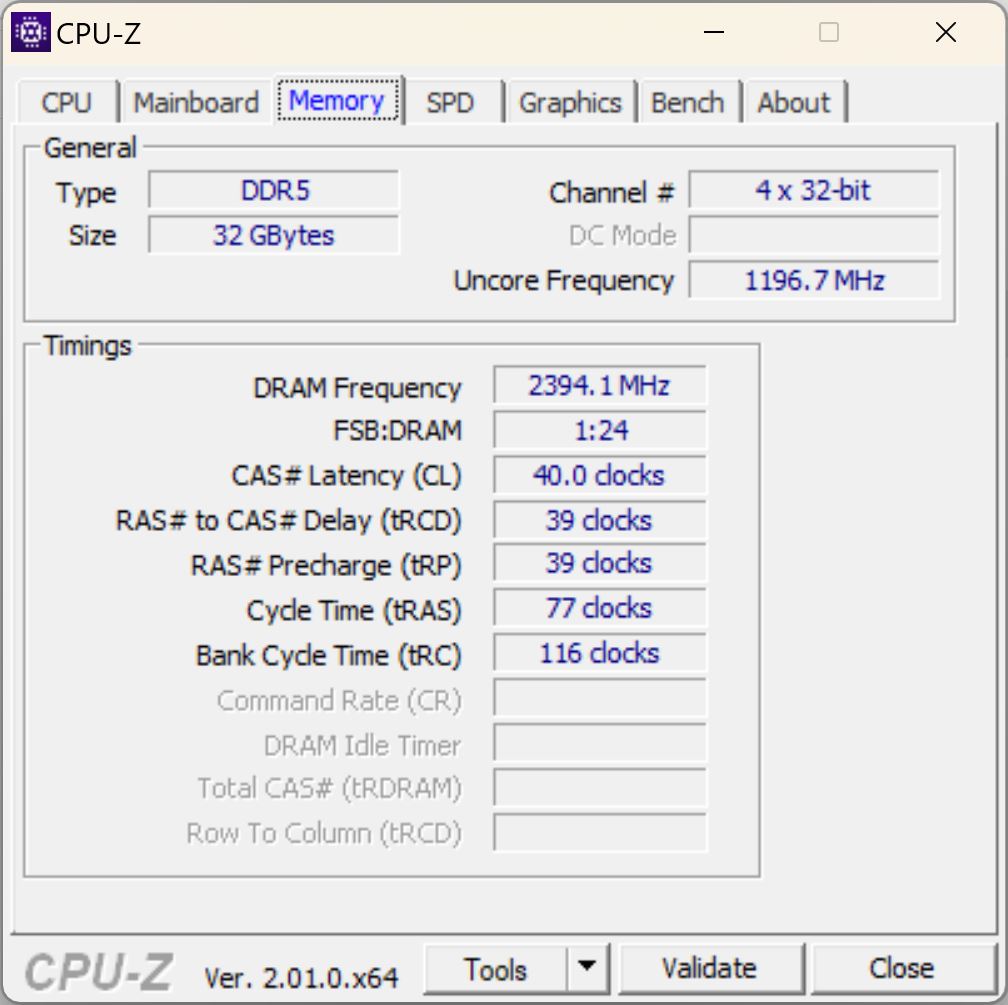
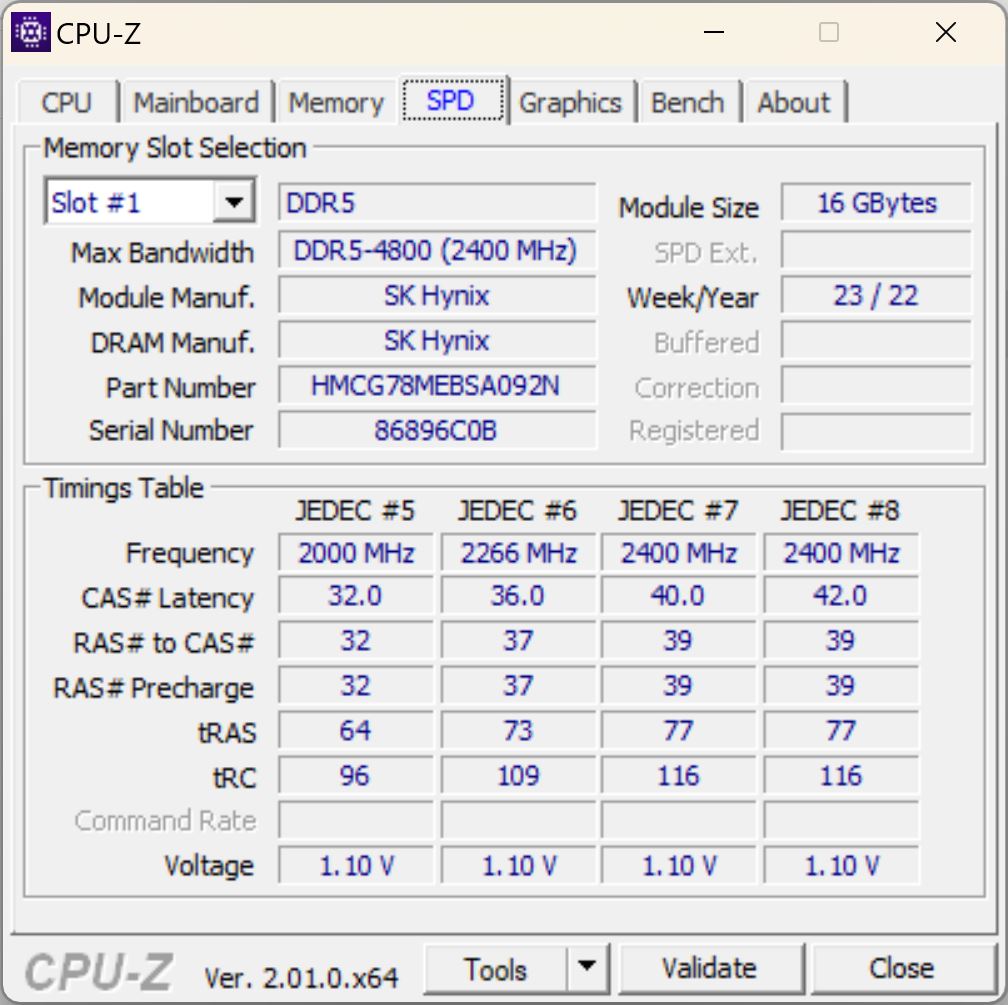
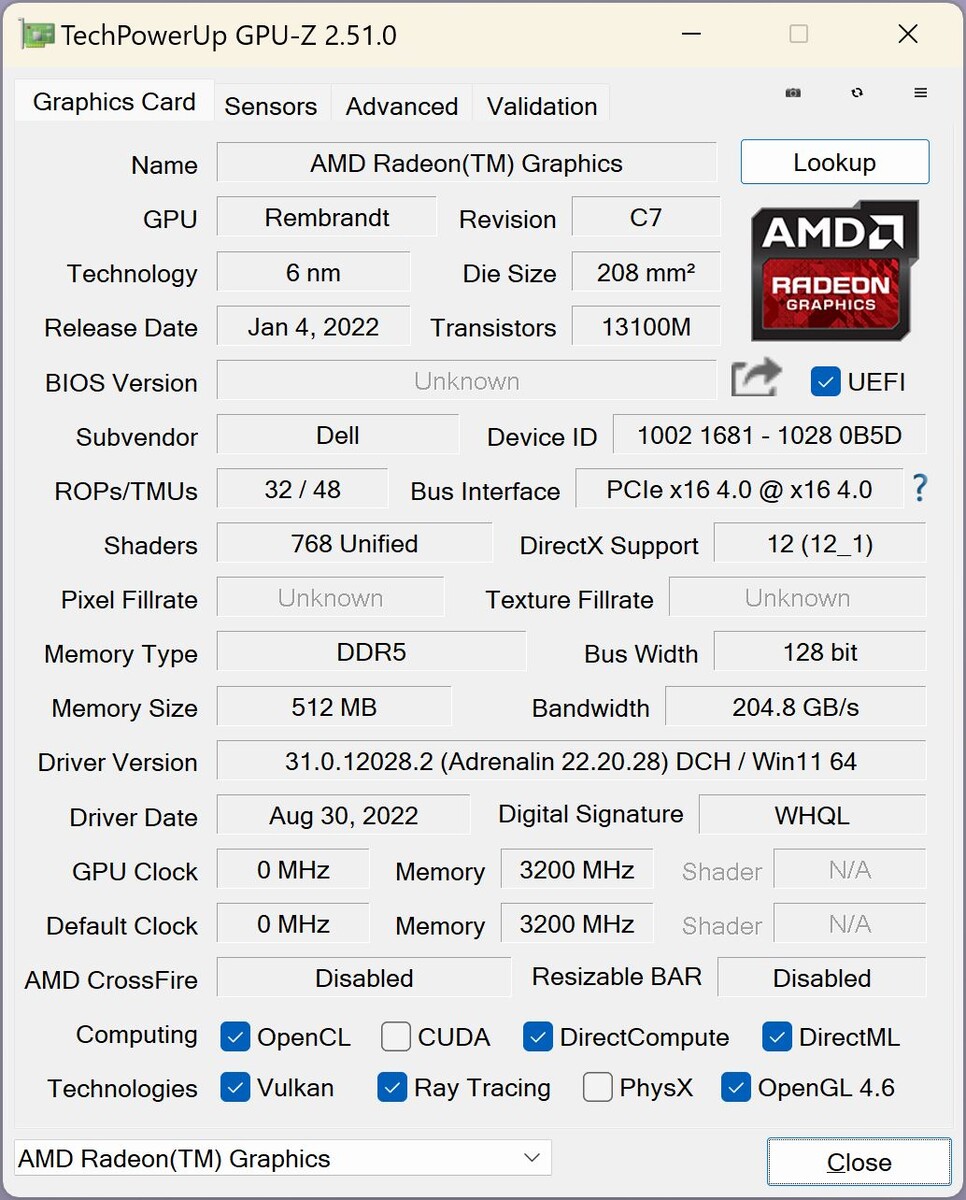
Nosso modelo all-AMD está fortemente equipado com um Ryzen 9 6900HX, a Radeon RX 6850M XT e 32 GB de RAM, e custa US$2550 igualmente forte. Por este preço, você certamente pode esperar várias otimizações. Naturalmente, também estamos interessados em como a combinação de CPU AMD e GPU AMD funciona contra várias combinações Intel/Nvidia.
Comparamos o R5 contra seu predecessor, o R4, mas também contra concorrentes igualmente equipados, tais como oAsus ROG Strix Scar 17 SEo Acer Predator Helios 300o Schenker XMG Neo 17 M22 e o Gigabyte Aorus 17X XES.
Possíveis concorrentes em comparação
Avaliação | Data | Modelo | Peso | Altura | Size | Resolução | Preço |
|---|---|---|---|---|---|---|---|
| 86.1 % v7 (old) | 01/2023 | Alienware m17 R5 (R9 6900HX, RX 6850M XT) R9 6900HX, Radeon RX 6850M XT | 3.4 kg | 26.7 mm | 17.00" | 3840x2160 | |
| 85.3 % v7 (old) | 04/2021 | Alienware m17 R4 i9-10980HK, GeForce RTX 3080 Laptop GPU | 3 kg | 22 mm | 17.30" | 1920x1080 | |
| 86.9 % v7 (old) | 11/2022 | Asus ROG Strix Scar 17 SE G733CX-LL014W i9-12950HX, GeForce RTX 3080 Ti Laptop GPU | 2.9 kg | 28.3 mm | 17.30" | 2560x1440 | |
| 86.5 % v7 (old) | 11/2022 | Acer Predator Helios 300 (i7-12700H, RTX 3070 Ti) i7-12700H, GeForce RTX 3070 Ti Laptop GPU | 3 kg | 27.65 mm | 17.30" | 2560x1440 | |
| 87.6 % v7 (old) | 09/2022 | Schenker XMG Neo 17 M22 R9 6900HX, GeForce RTX 3080 Ti Laptop GPU | 2.8 kg | 27 mm | 17.00" | 2560x1600 | |
| 83.7 % v7 (old) | 08/2022 | Aorus 17X XES i9-12900HX, GeForce RTX 3070 Ti Laptop GPU | 2.7 kg | 30 mm | 17.30" | 1920x1080 |
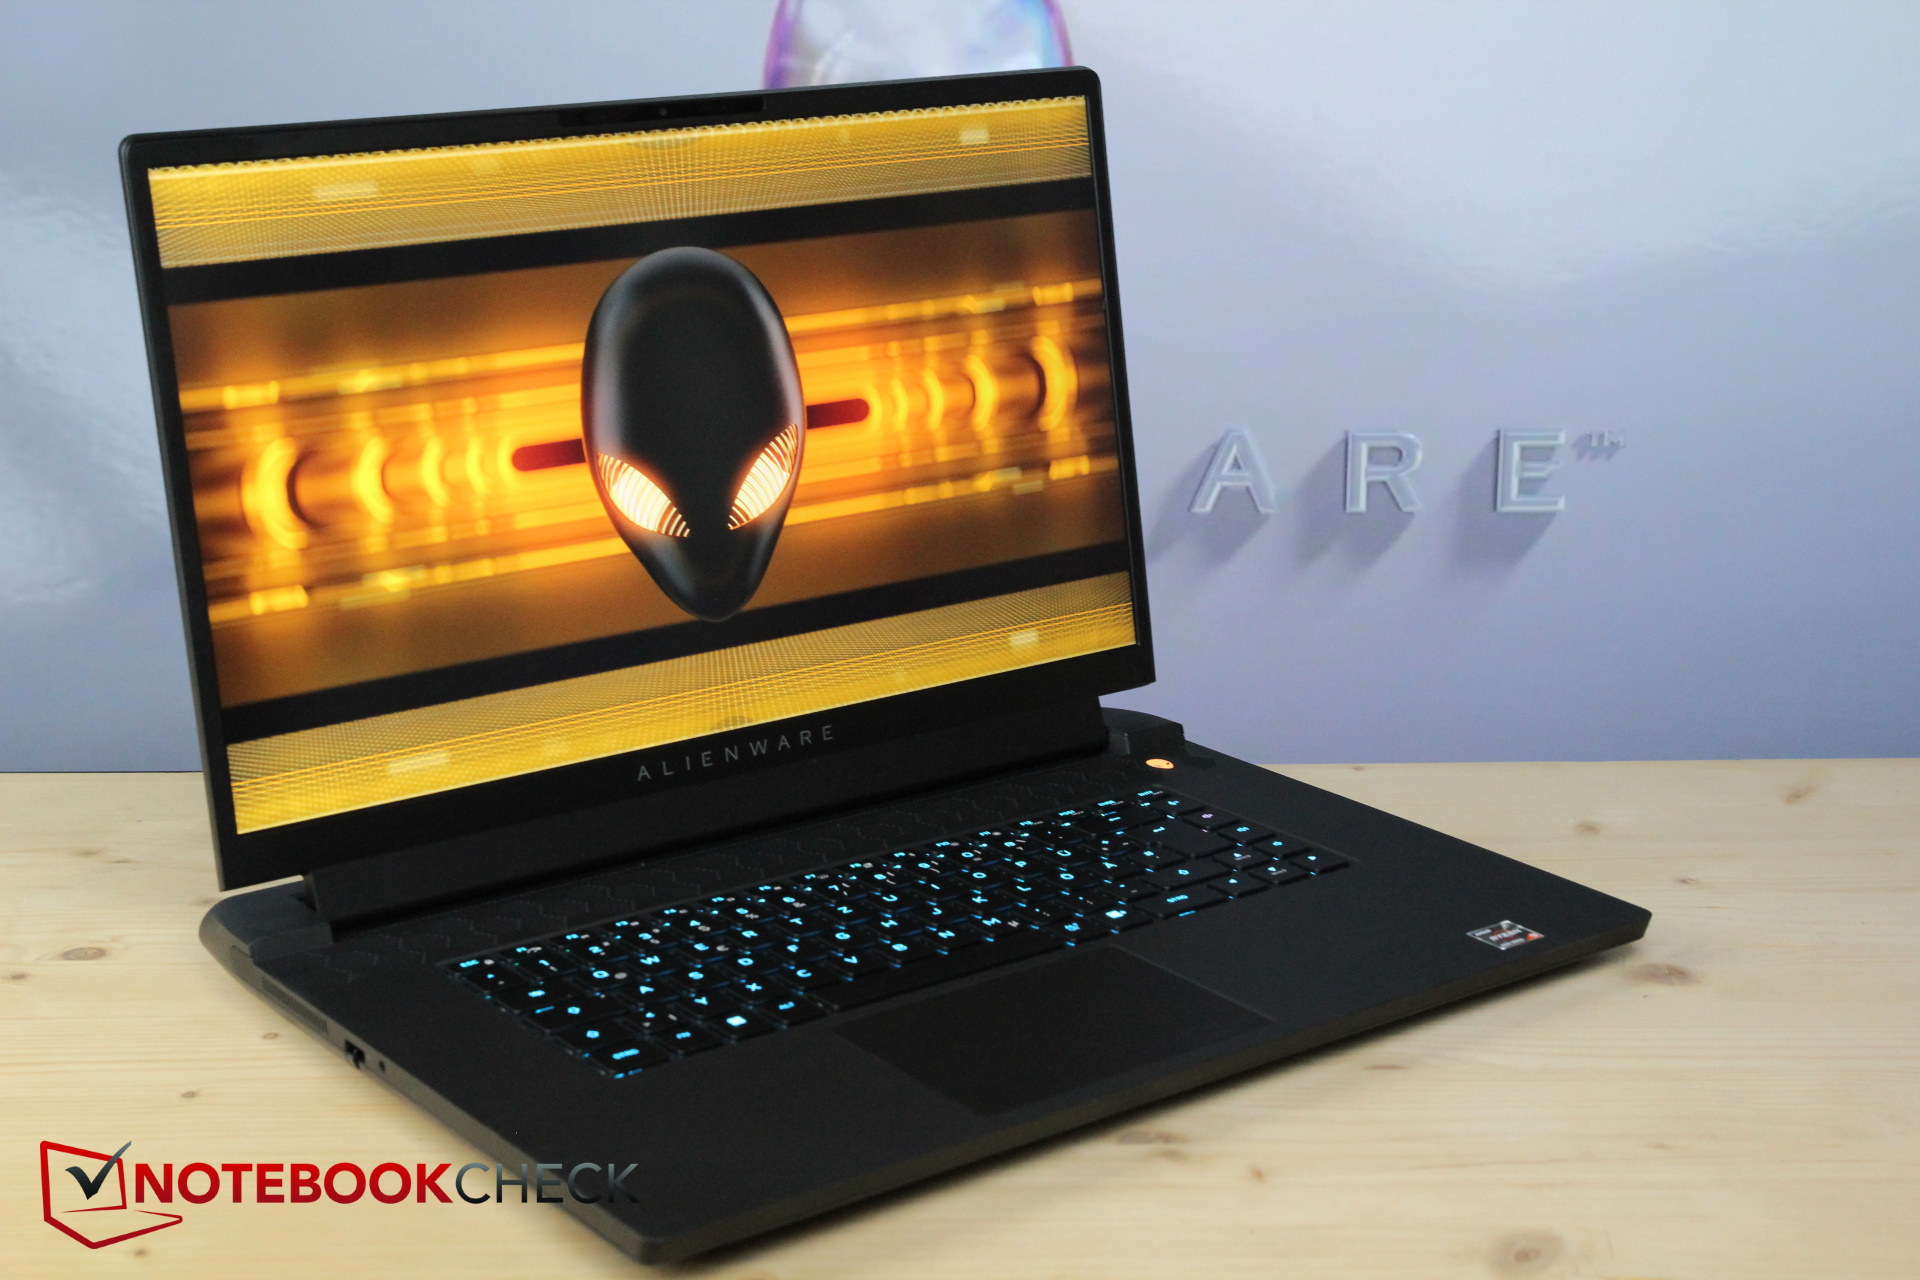
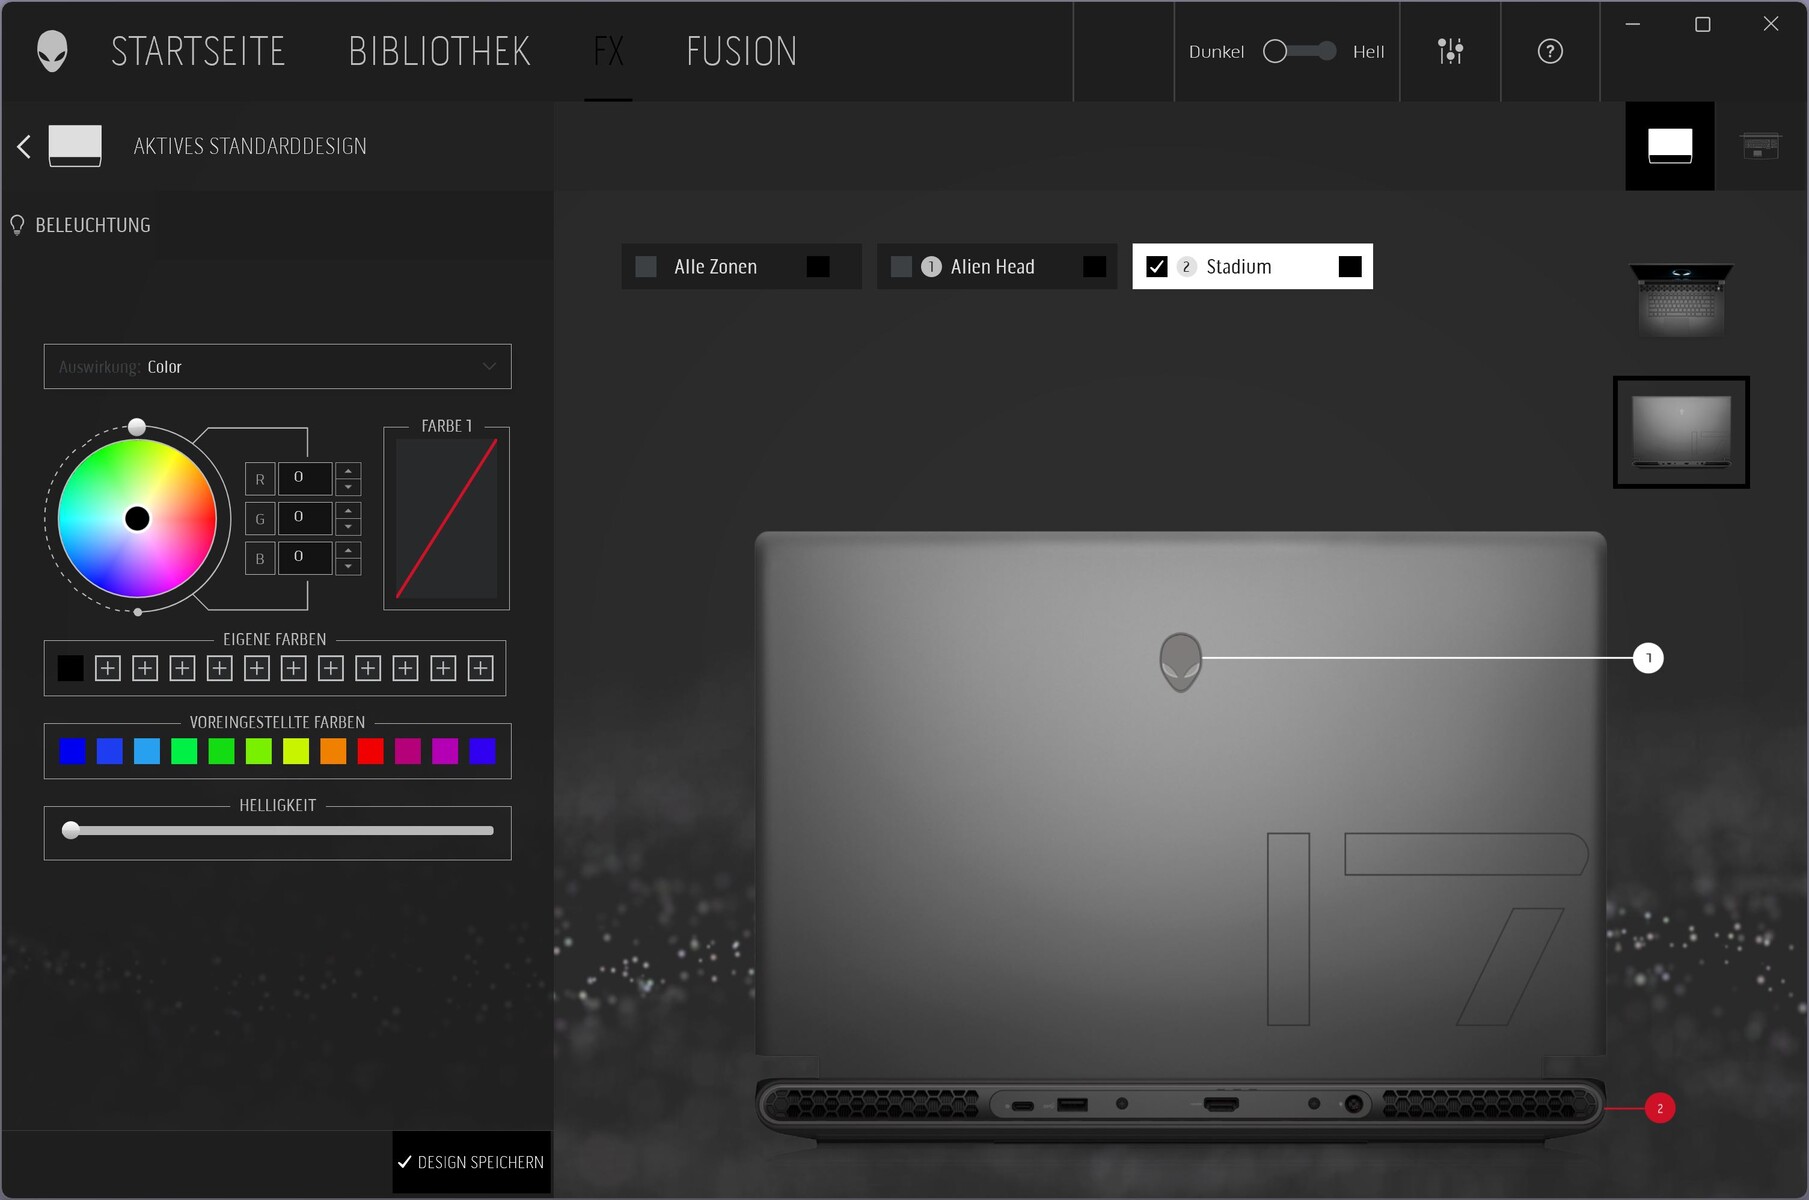
Estojo - Design reformulado no m17 R5
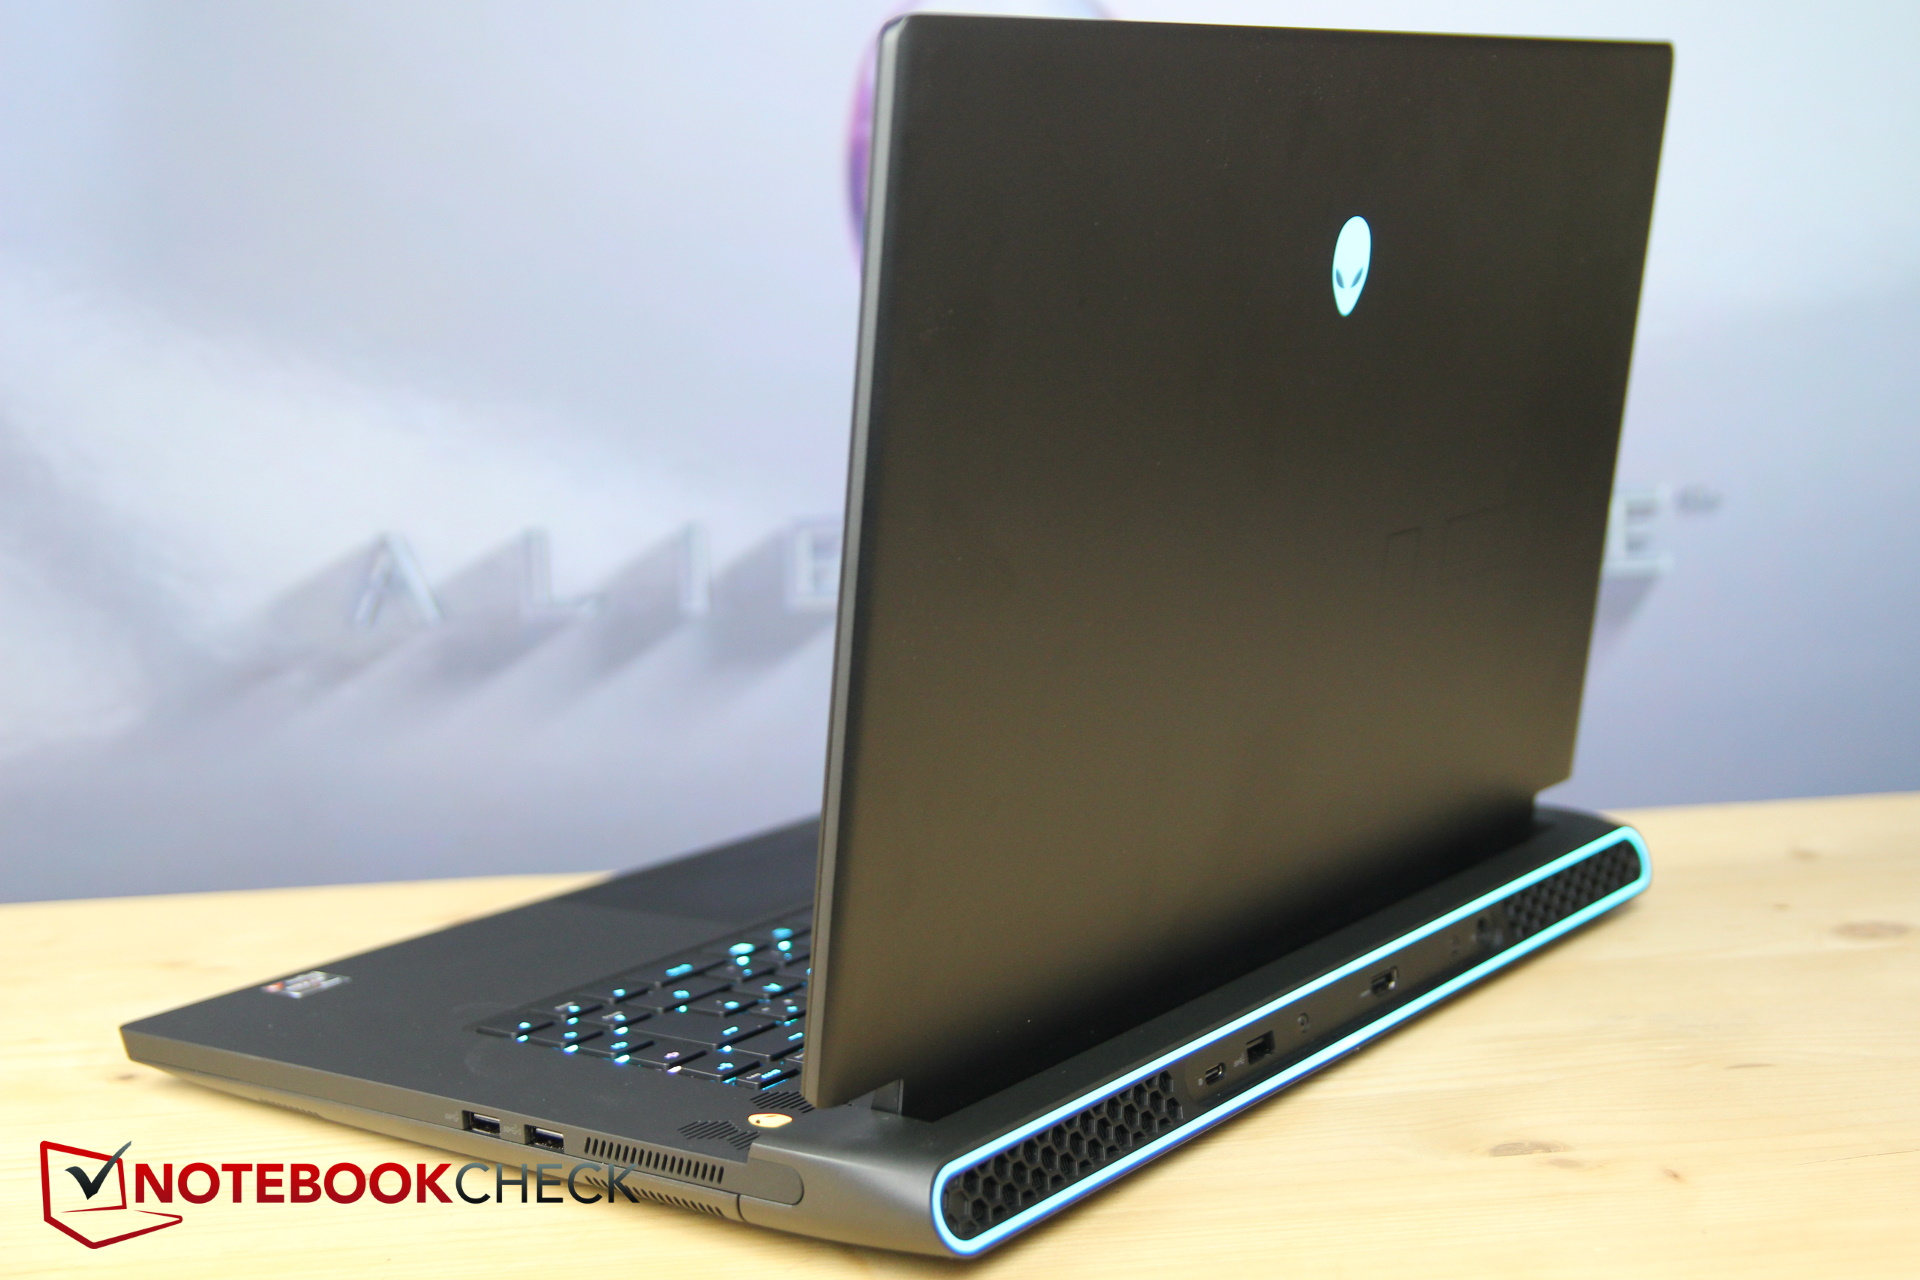
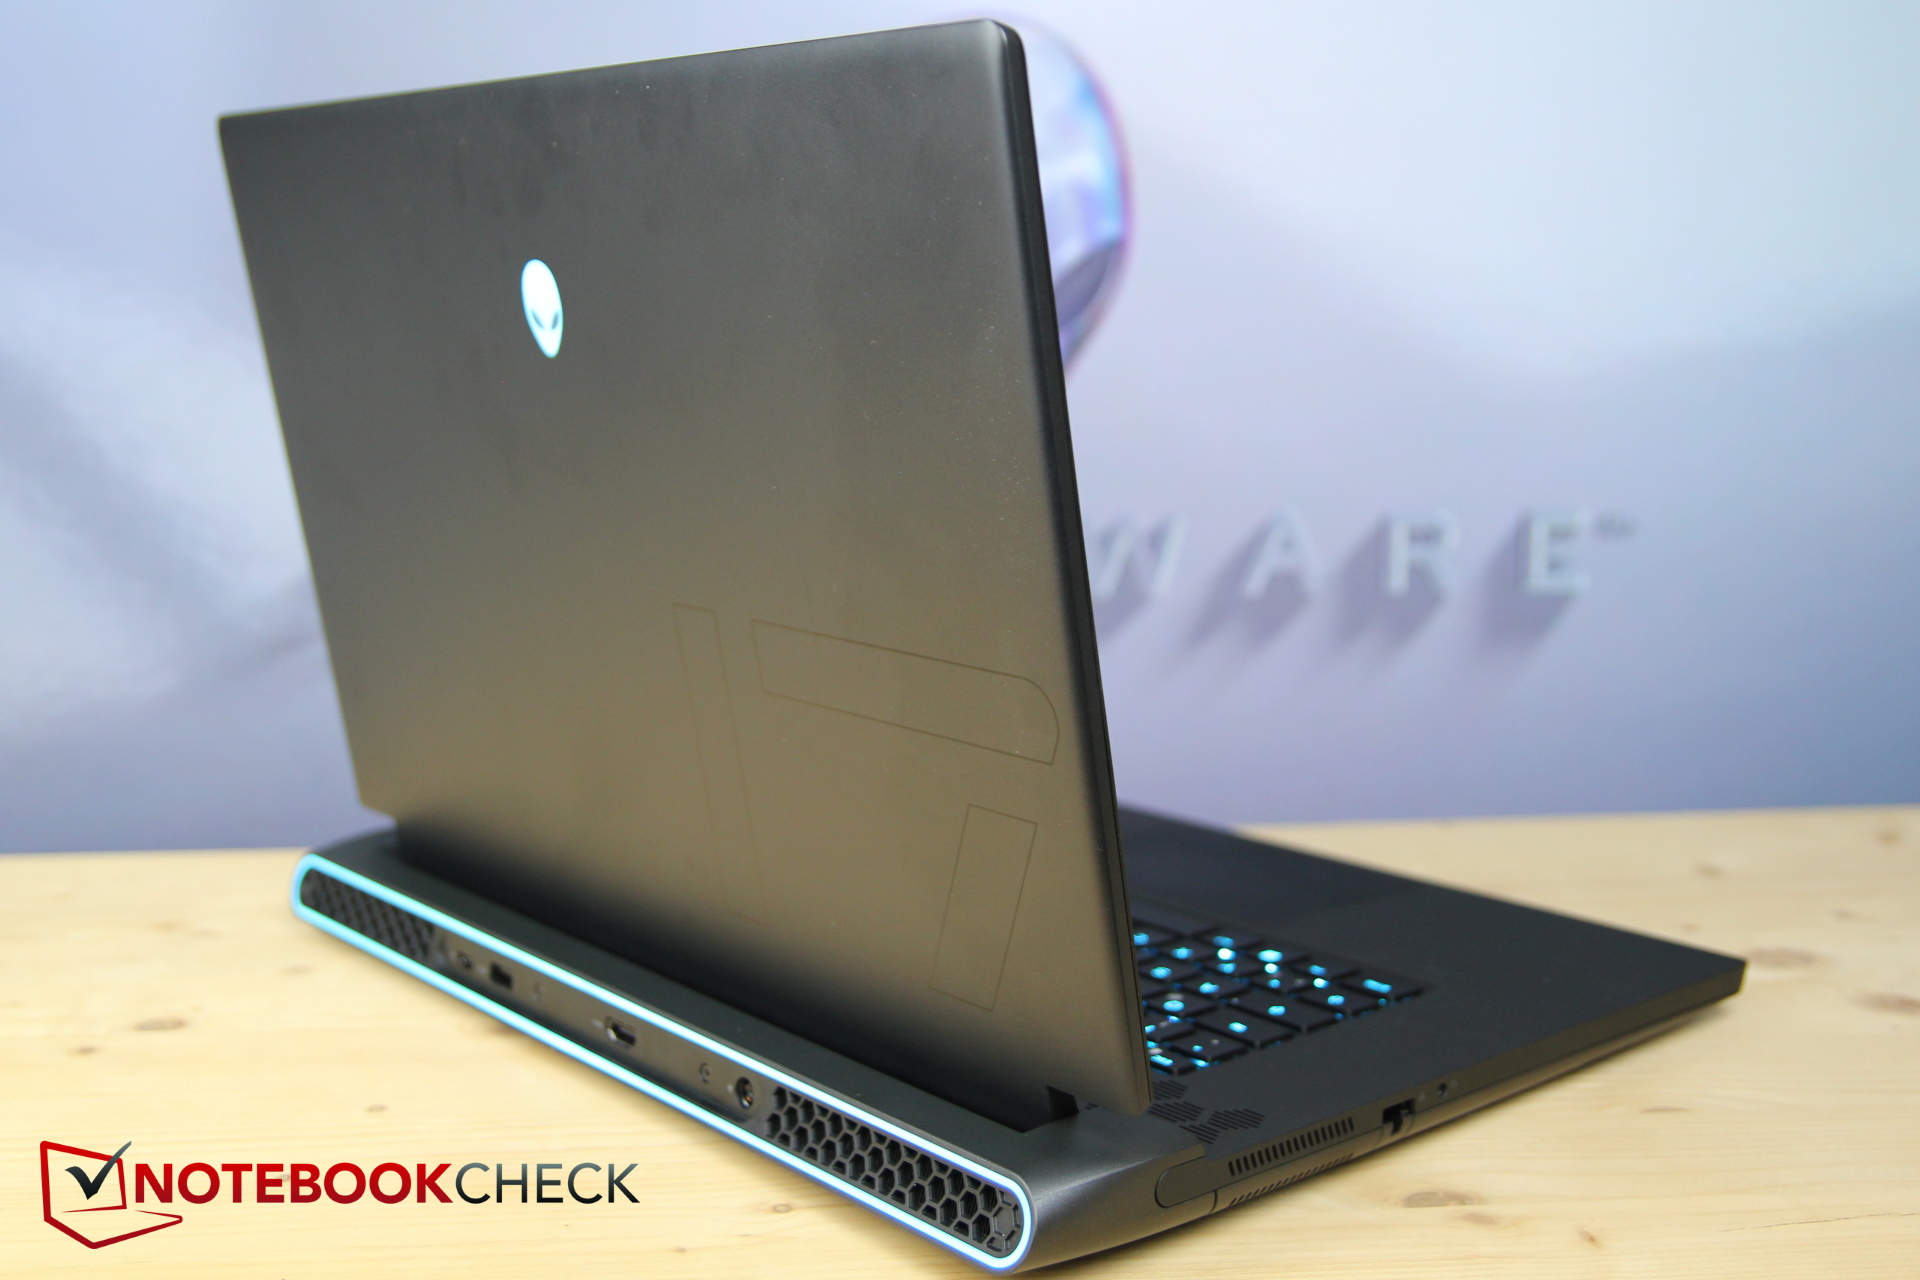
O caso foi fortemente reformulado, mesmo que a diferença só seja visível à primeira vista a partir do esquema de cores e da parte inferior. Depois do R4 branco, o novo m17 agora tem novamente um corpo de metal cinza escuro, e as grelhas na placa de base agora são favos de mel em vez de listradas. No geral, o design é quase liso para um Alienware, pelo menos quando desligado. Se você ligá-lo, vários LEDs lembram que você tem um laptop de jogo Alienígena diante de você.
Por outro lado, o layout interno também é novo, o teclado não tem mais um teclado numérico, as teclas de seta não sobressaem mais para baixo, as portas foram alteradas e assim por diante.
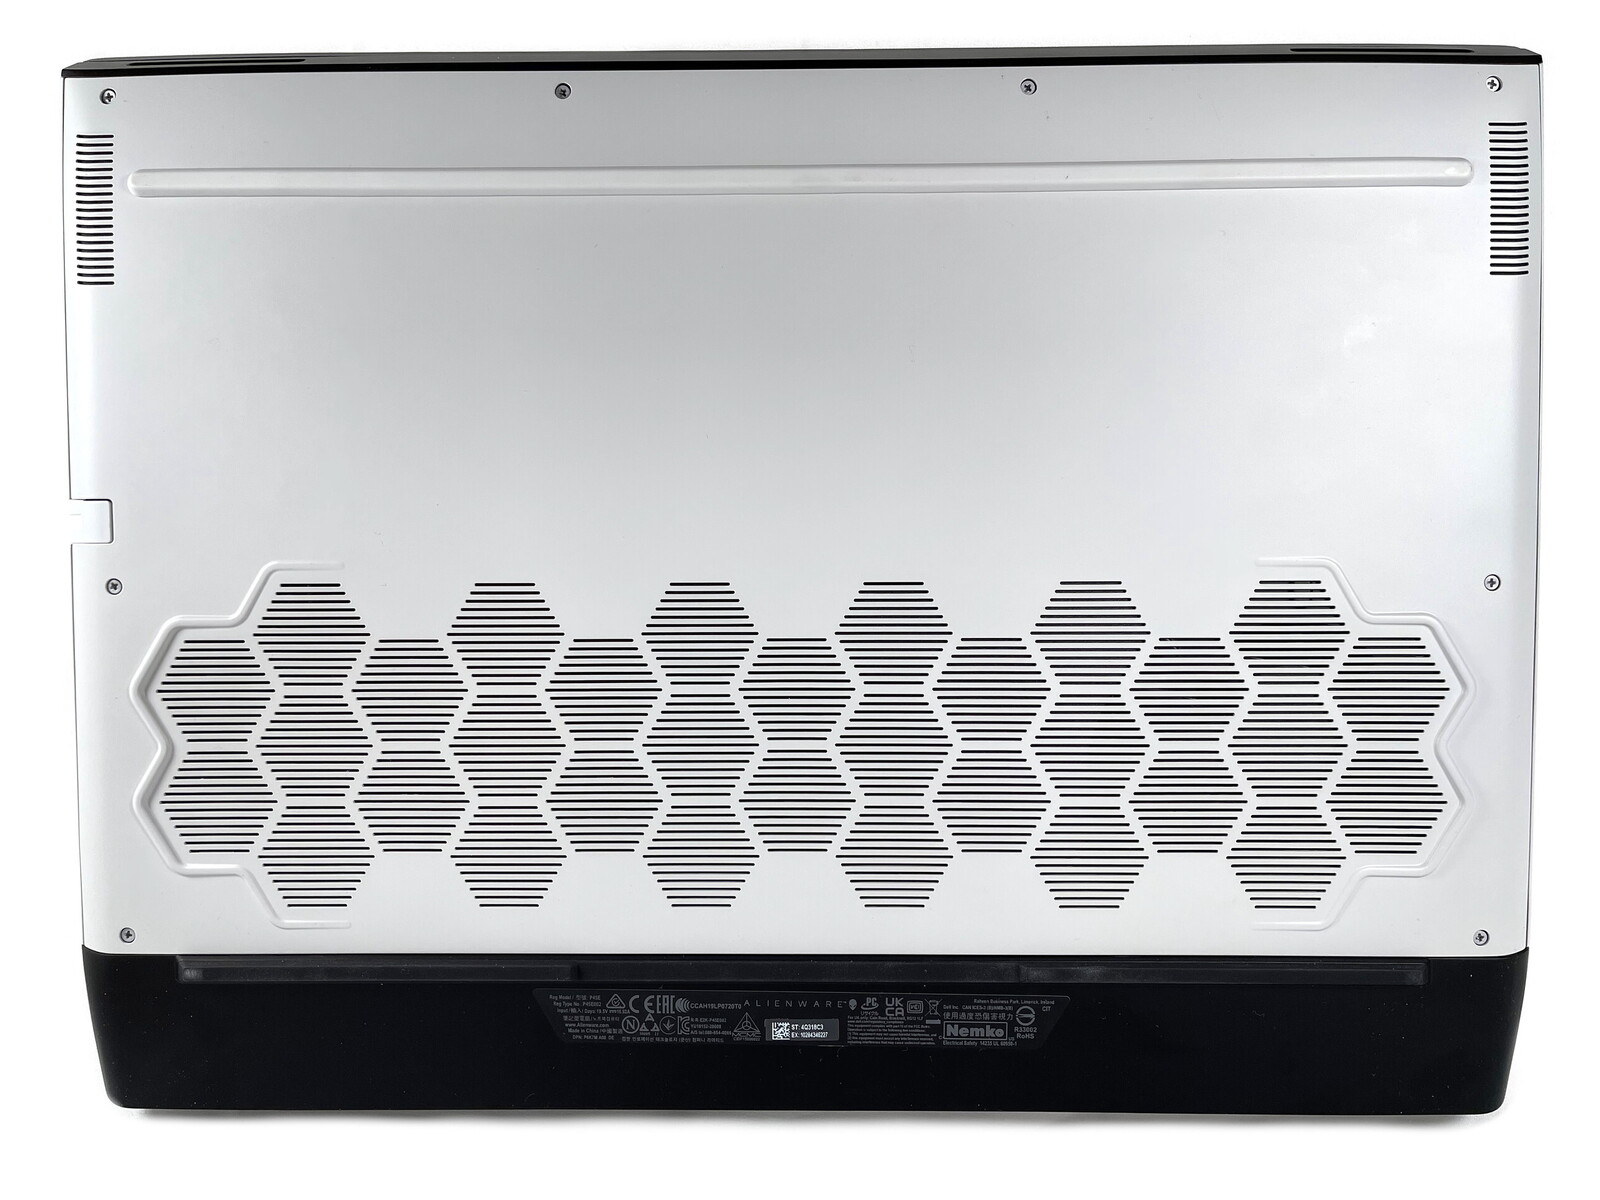
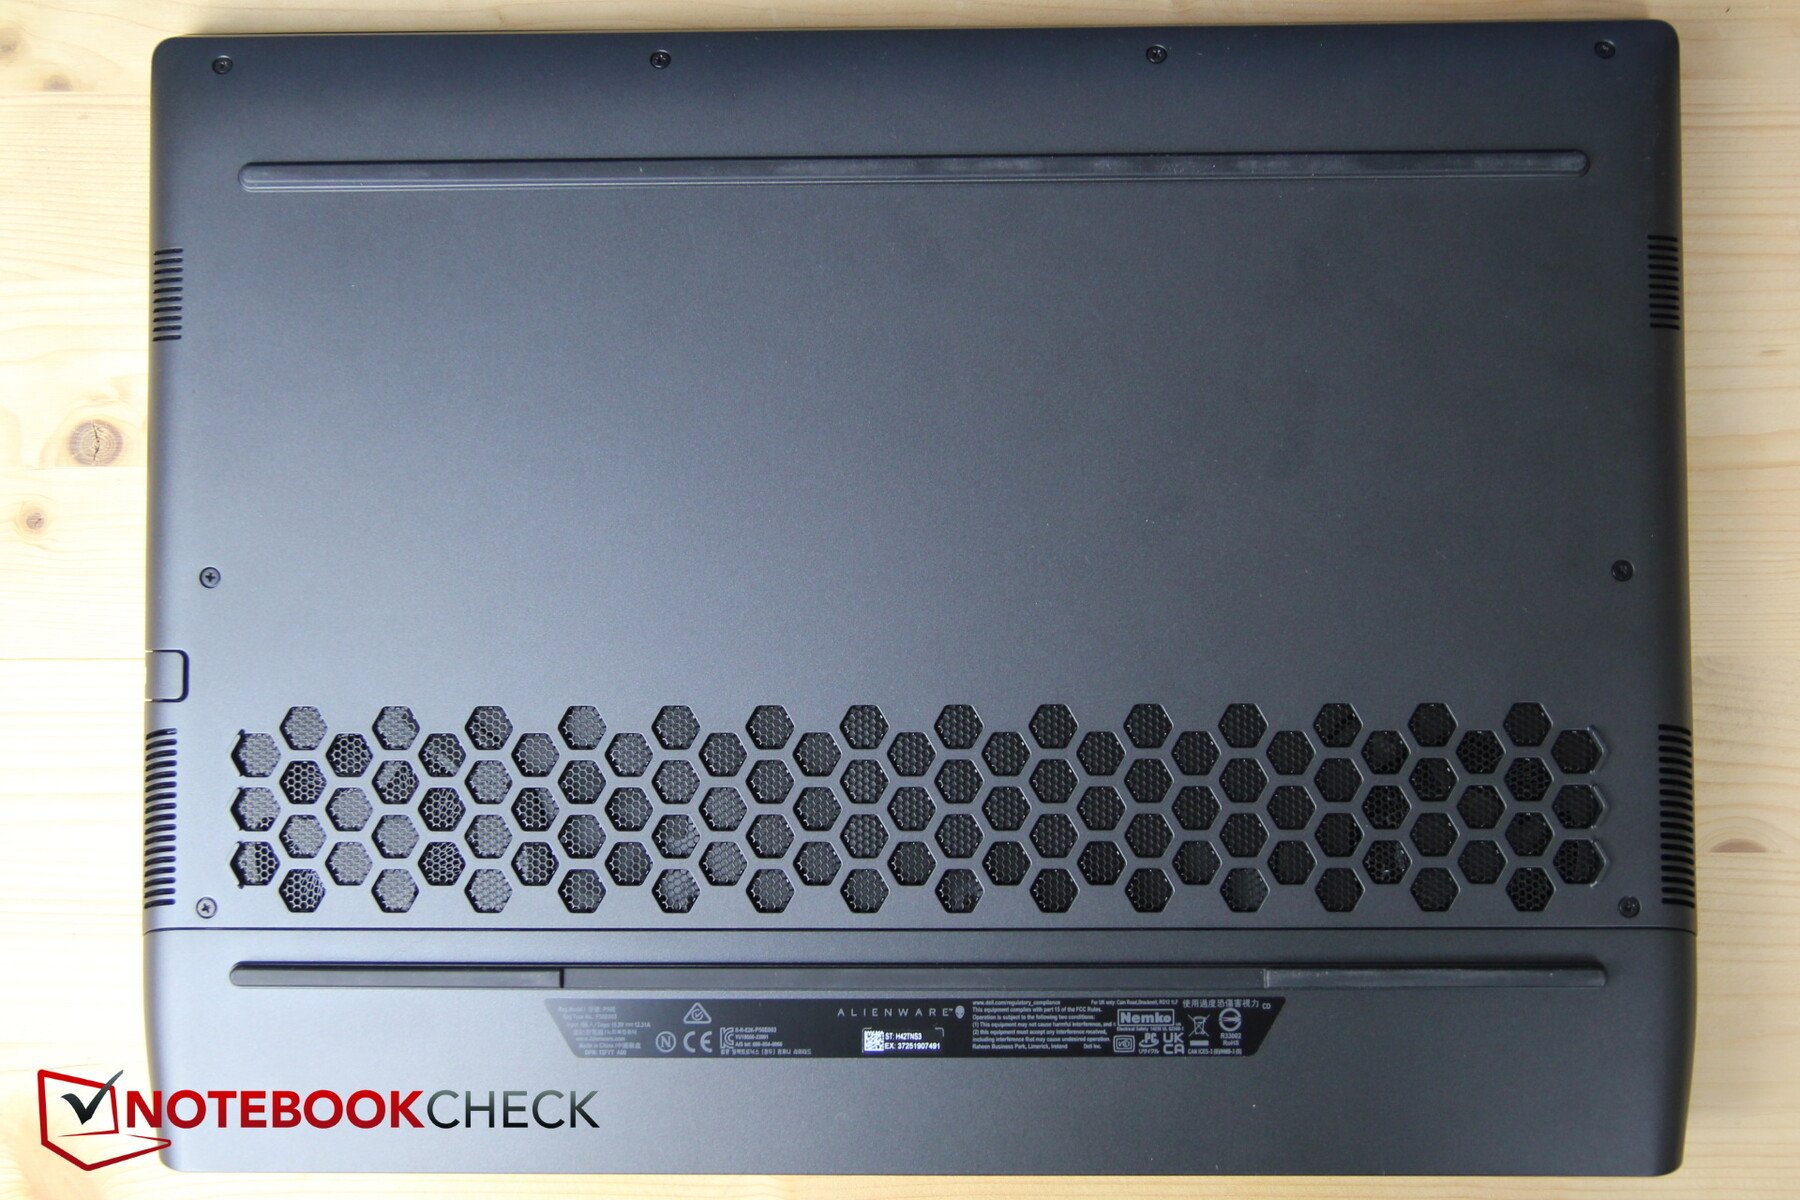
Como antes, a caixa externa é feita de metal resistente, enquanto as bordas do visor são feitas de plástico. A placa de base também é feita de plástico, mas também foi emborrachada como uma adição.
Em geral, o laptop é muito resistente à torção e racha apenas ligeiramente quando colocado sob tensão de torção. A tampa também é excepcionalmente estável e a qualidade geral de construção está em um nível elevado.

É bem conhecido que os laptops Alienware são bastante grandes devido a seu sistema de resfriamento expansivo, embora concorrentes como o Acer Predatorentretanto, "seguiram o exemplo" a este respeito.
O que é impressionante, entretanto, é que o m17 R5 ganhou muito peso. O jogador agora pesa 400 g a mais do que seu predecessor, o que o torna o dispositivo mais pesado no campo de comparação. O predecessor também era mais fino, mesmo que muitos concorrentes sejam mais espessos.
Em geral, o m17 é muito grande e, acima de tudo, pesado para sua classe.
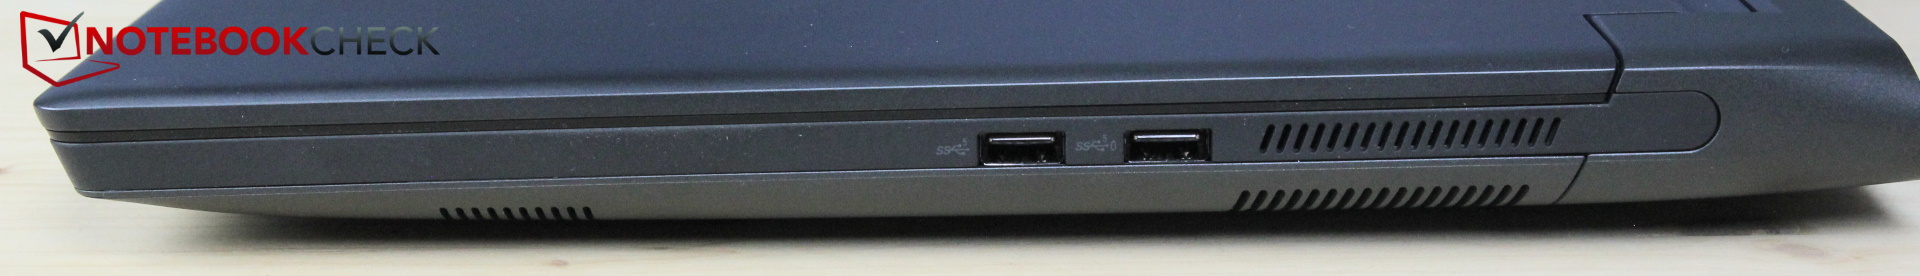
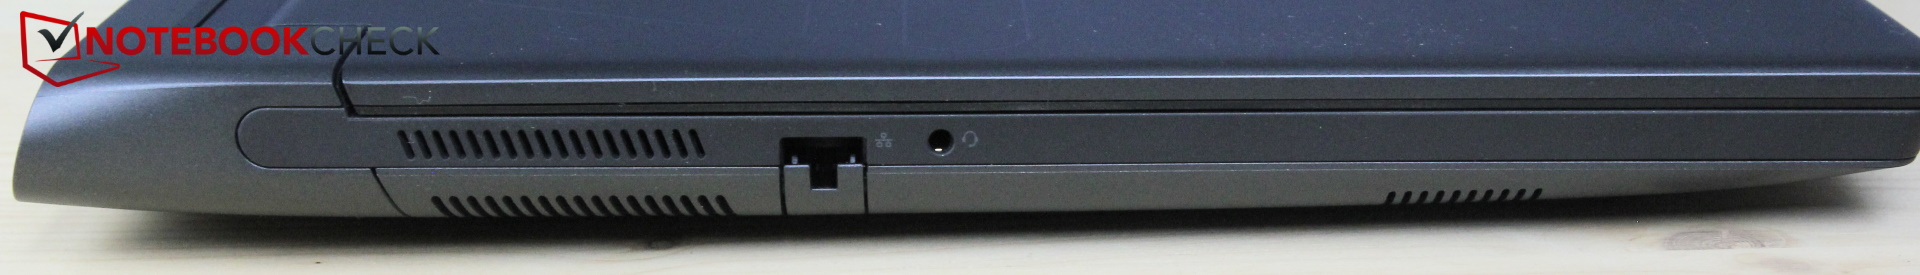
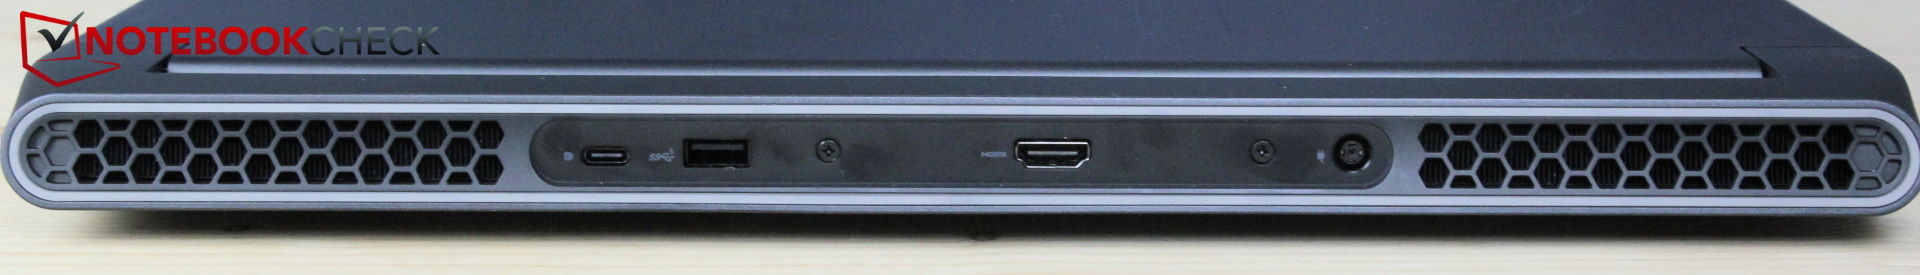
Equipamentos - Menos portas no m17 R5
A variedade de portos não se desenvolveu de forma alguma de forma positiva; vários portos do R4 foram simplesmente omitidos no R5. Estas incluem o porto Alienwareport para placas gráficas externas, o leitor microSD e o DisplayPort dedicado. A Dell simplesmente "aperta" esta última na funcionalidade de uma porta USB-C. Esta porta, por sua vez, ainda não suporta Thunderbolt ou USB 4 na versão AMD deste ano
O fato de não haver portas USB no lado esquerdo e de você ter que conectar todos os dispositivos USB ao lado do mouse rapidamente se mostrou irritante durante nossa revisão. Caso contrário, a maioria das portas estão na parte de trás com espaço suficiente entre elas.
Comunicação
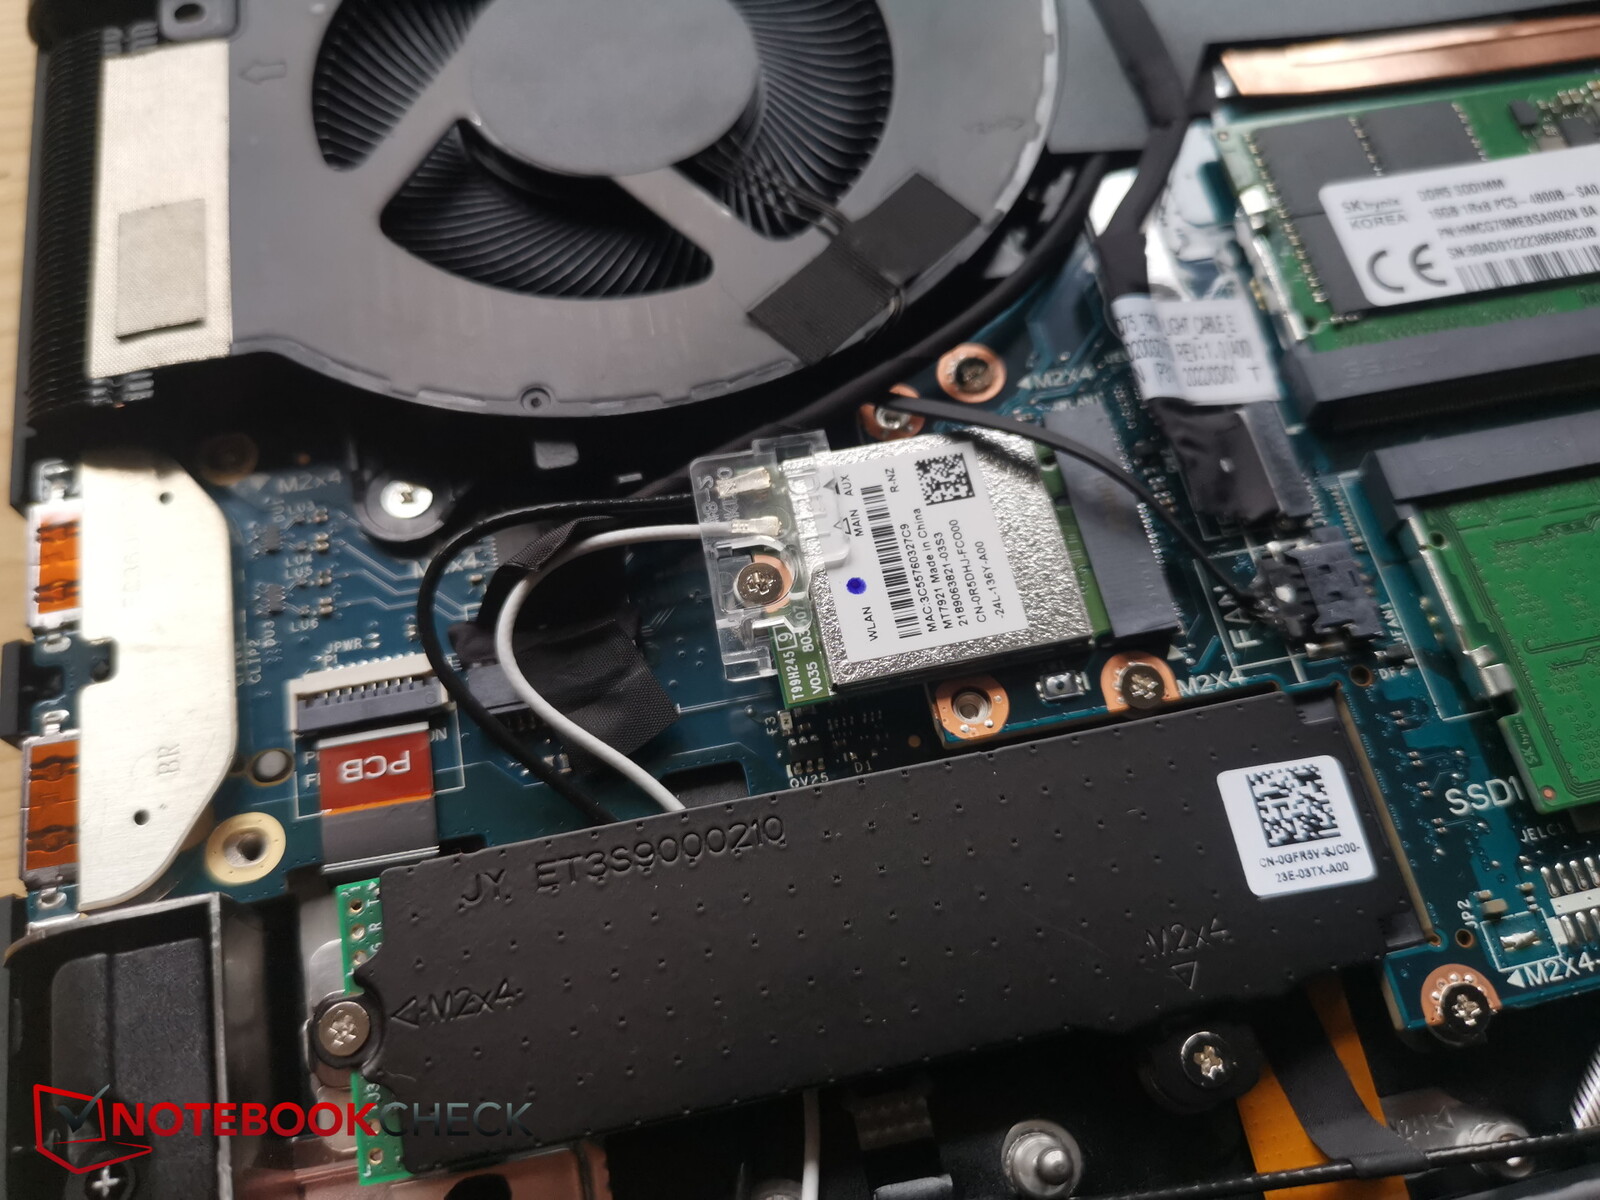
Em vez de um módulo Intel AX ou Killer Wireless, típico para esta classe, a Dell usa um MediaTek MT7921. Suas possibilidades são esgotadas pelo m17, mas são geralmente limitadas. Os laptops rivais são, em sua maioria, mais rápidos.
Webcam
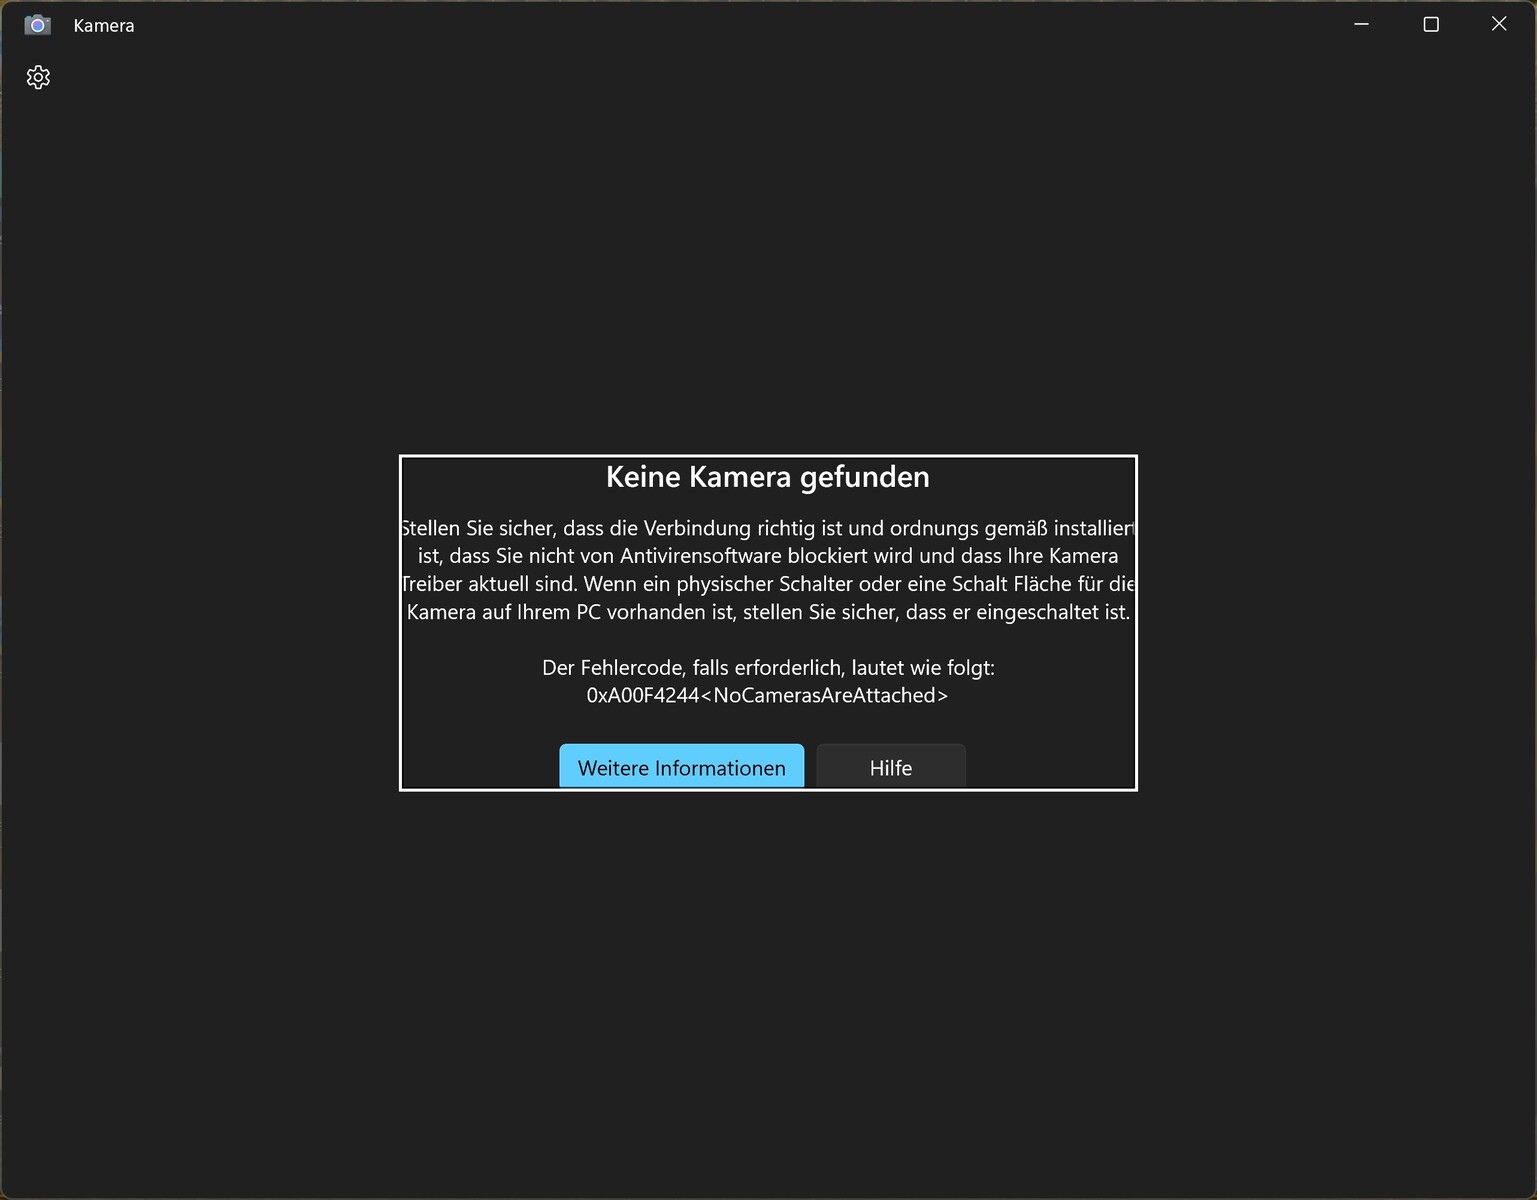
Enquanto muitos concorrentes têm uma webcam Full HD instalada, os usuários do m17 têm que se contentar com uma câmera 720p
Em nosso modelo de revisão, isto não funciona corretamente. Quando o iniciamos, recebemos a mensagem de que nenhuma webcam é encontrada, clicamos sem sentido, de repente aparece uma imagem de vídeo, então a mensagem de erro aparece novamente, mais tarde outra imagem.
Por outro lado, a webcam funciona em outro modelo m17-R5, que está atualmente curtindo uma carreira cinematográfica com nosso YouTuber Alex. Suspeitamos que algo está solto no hardware de nosso modelo de revisão. Pelo menos tivemos a sorte de poder tirar nossas duas fotos de teste.

 Radeon RX 6850M XT, R9 6900HX, SSSTC CA6-8D1024")
 Radeon RX 6850M XT, R9 6900HX, SSSTC CA6-8D1024")
Segurança
Os laptops para jogos muitas vezes não possuem recursos de segurança, assim como os Alienware. Falta um sensor de impressões digitais e você também não encontrará aqui um slot Kensington. A câmera 720p é capaz de IR para reconhecimento facial no Windows Olá.
Acessórios e Garantia
A Dell não embala nenhum acessório na caixa.
A garantia na Alemanha é de apenas 12 meses. Isto pode diferir dependendo de sua localização, portanto, os compradores interessados devem verificar novamente antes da compra.
Manutenção
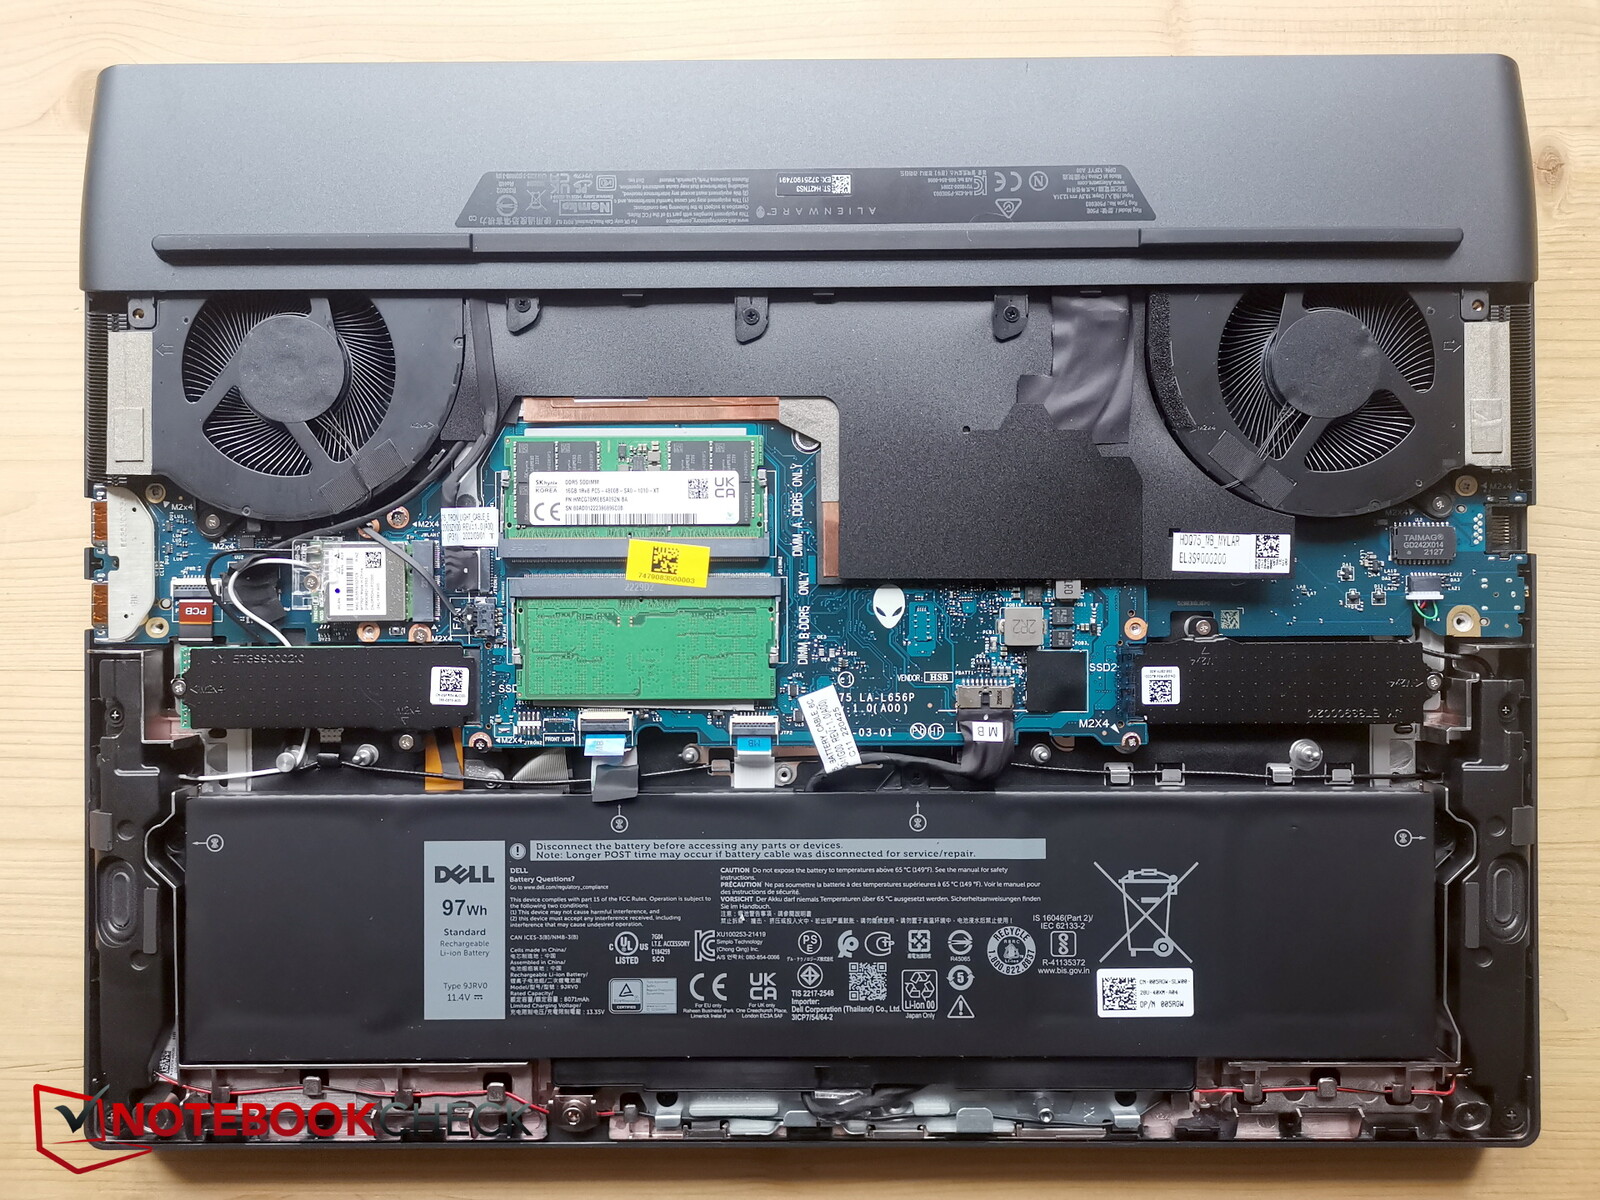
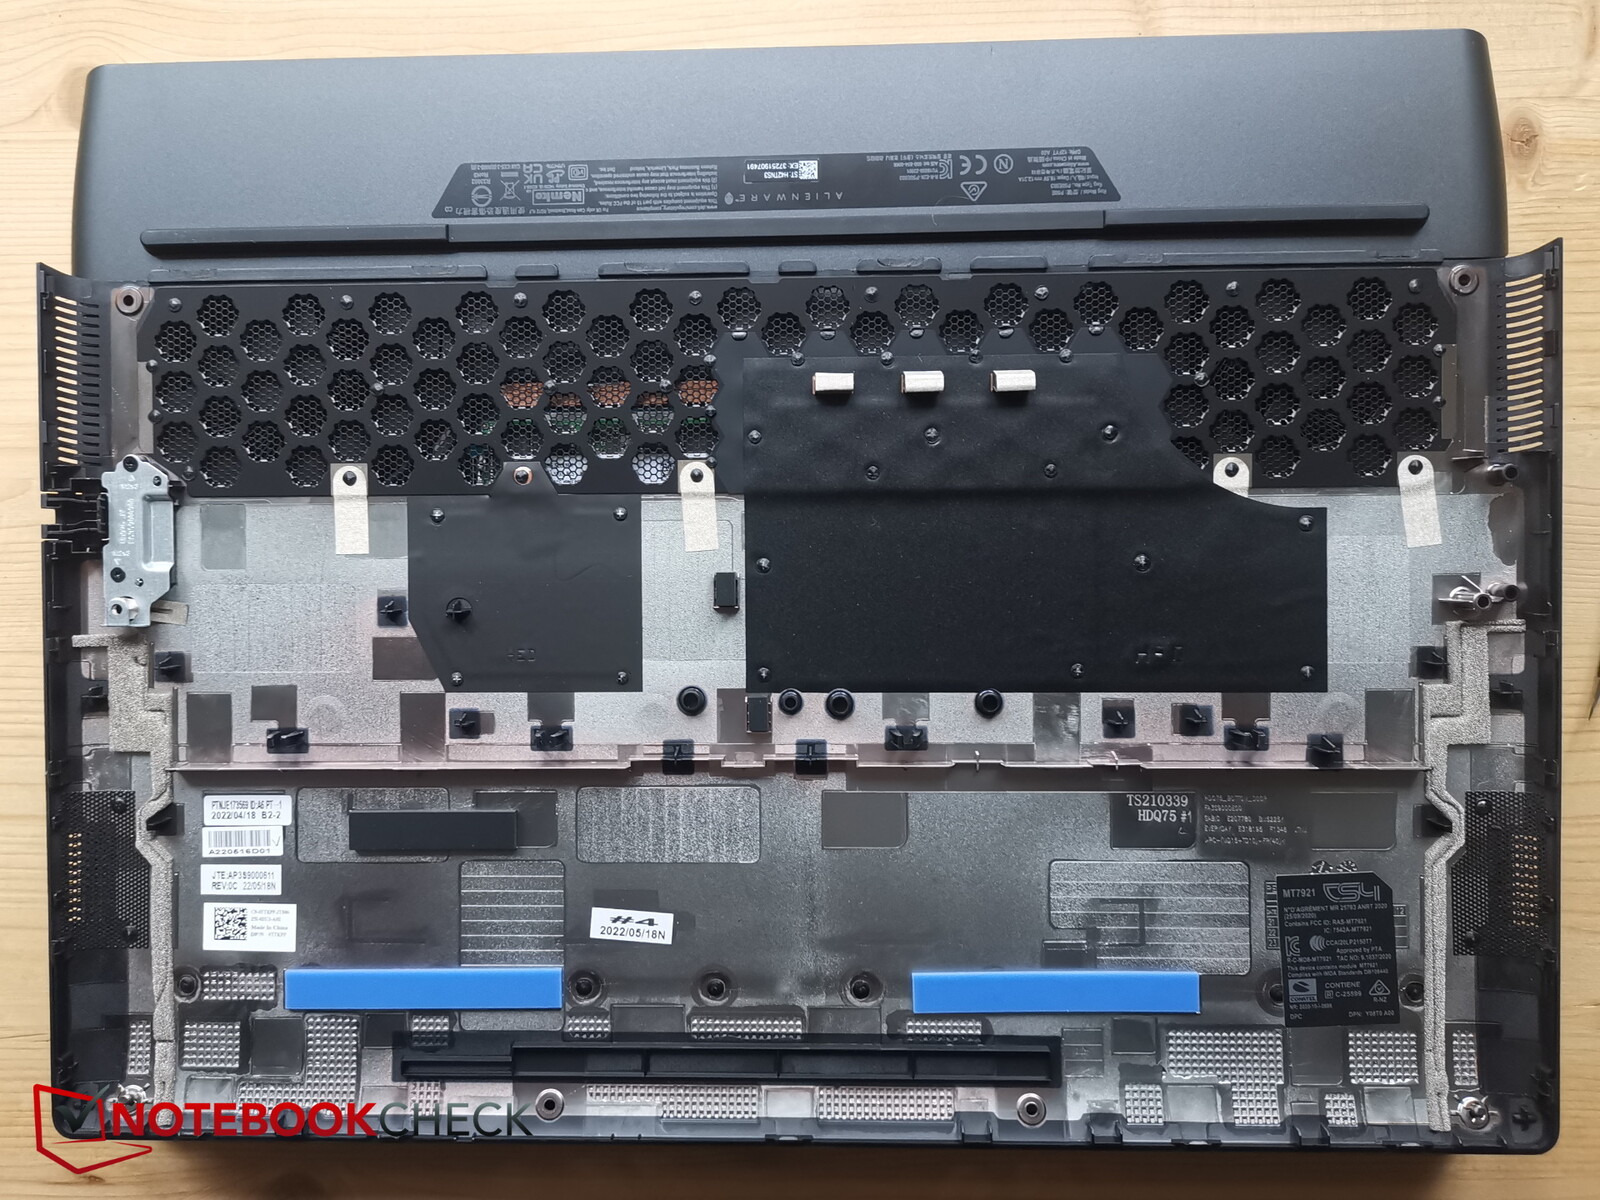
Para soltar a parte inferior, 8 parafusos de cabeça cruzada precisam ser desatarraxados. Dois deles são muito mais longos, portanto, deve-se lembrar quais parafusos vão em qual rosca.
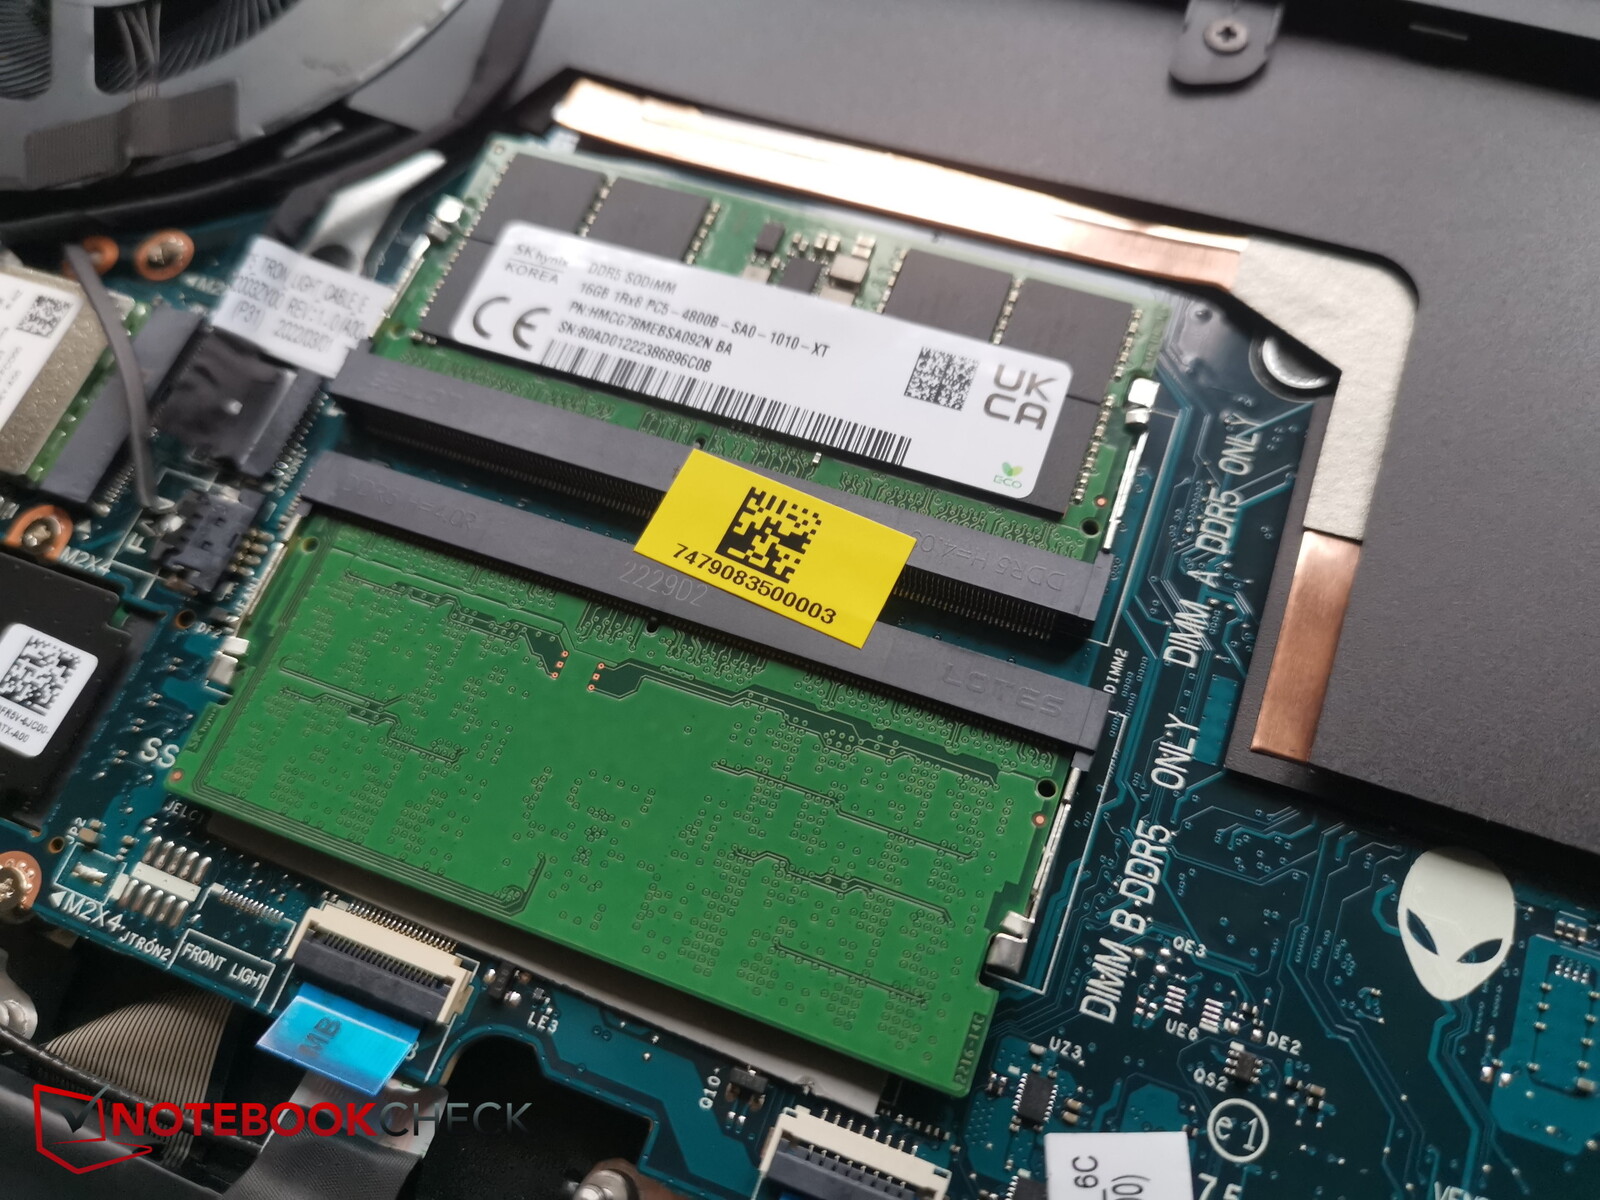
Uma vez desatarraxados, a parte inferior pode ser aberta por alavanca quase sem ferramentas. Você então tem acesso aos ventiladores, dois slots de RAM, dois slots M.2 SSD, a bateria e o módulo Wifi substituível.
Dispositivos de entrada - 17 polegadas sem numpad
Teclado
O layout do teclado também foi reformulado. Apesar do tamanho de 17 polegadas, o teclado numérico foi abandonado, mas as setas do teclado agora são de tamanho normal e o layout parece muito arrumado. A tecla enter agora também é de tamanho normal, mas as teclas de deslocamento são um pouco mais curtas.
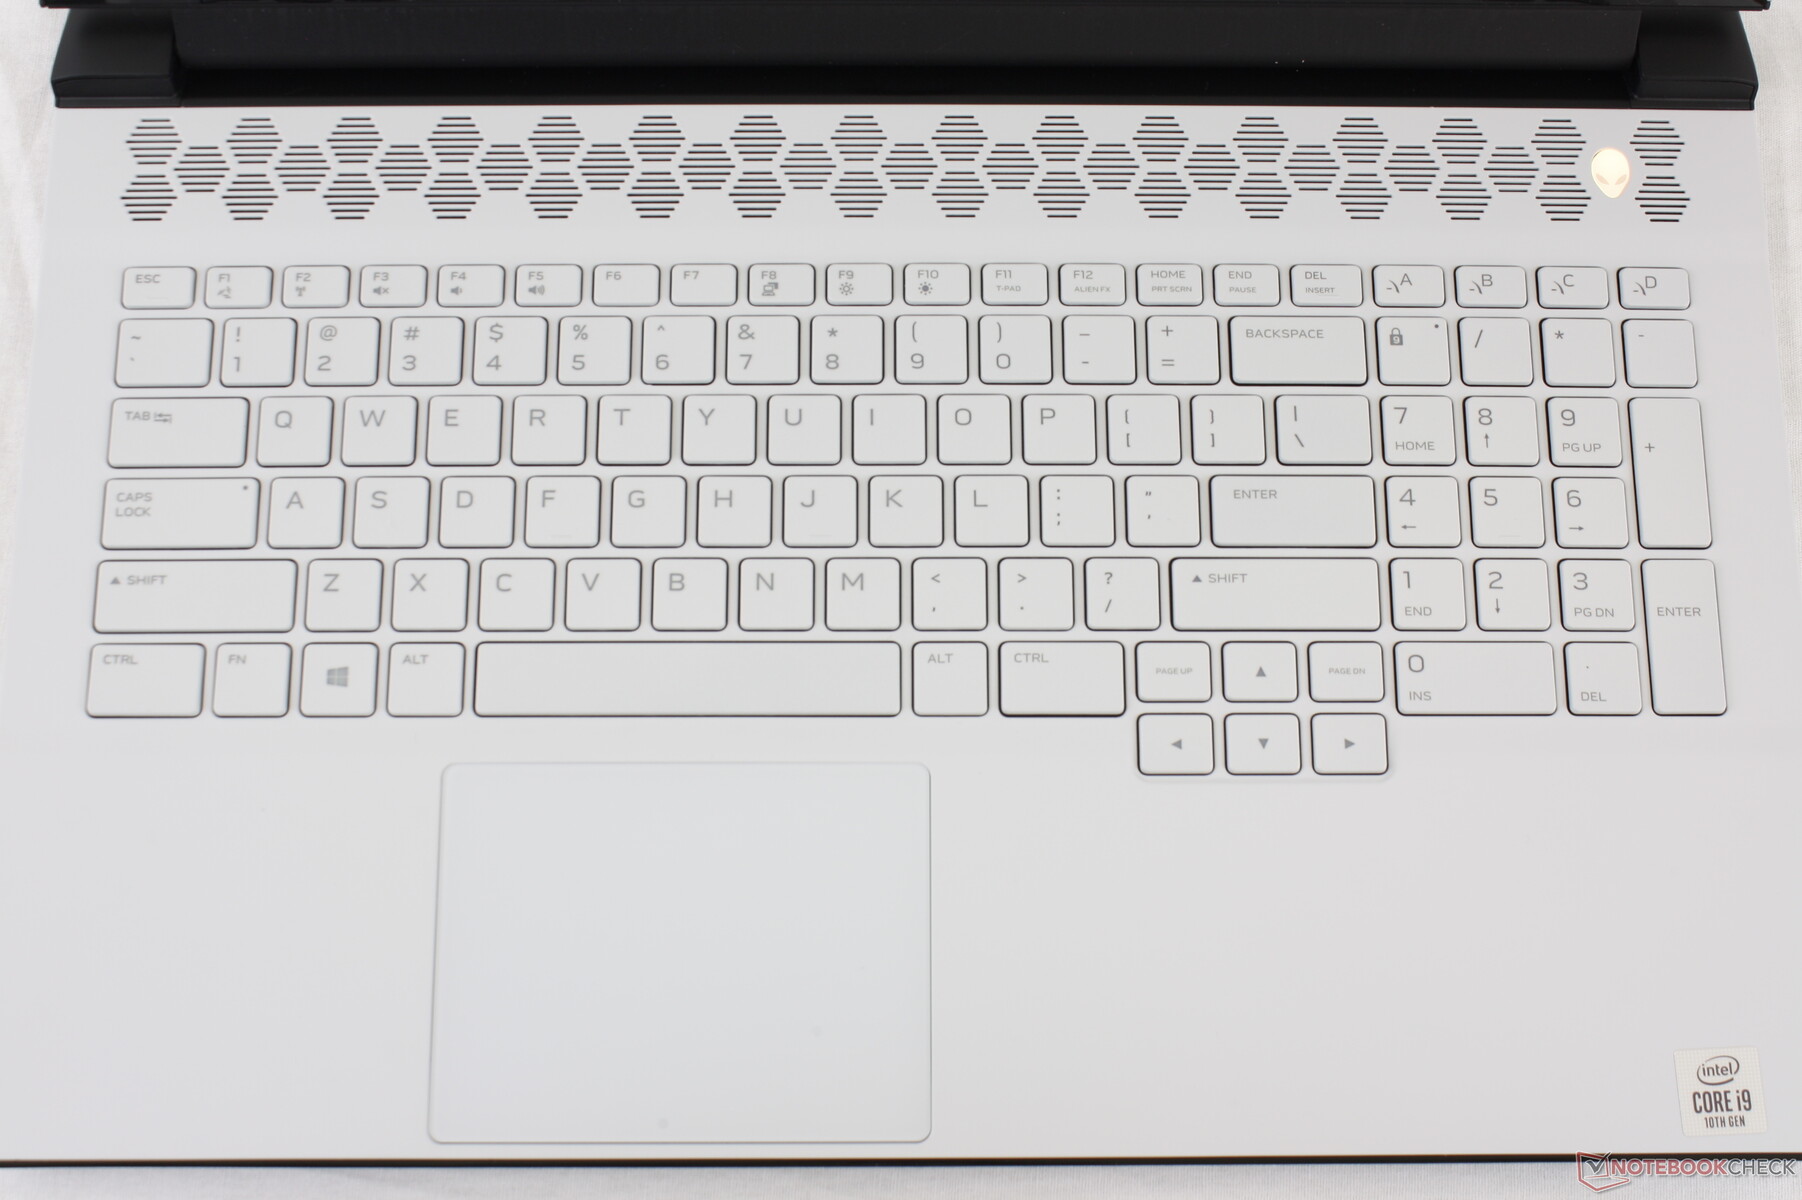
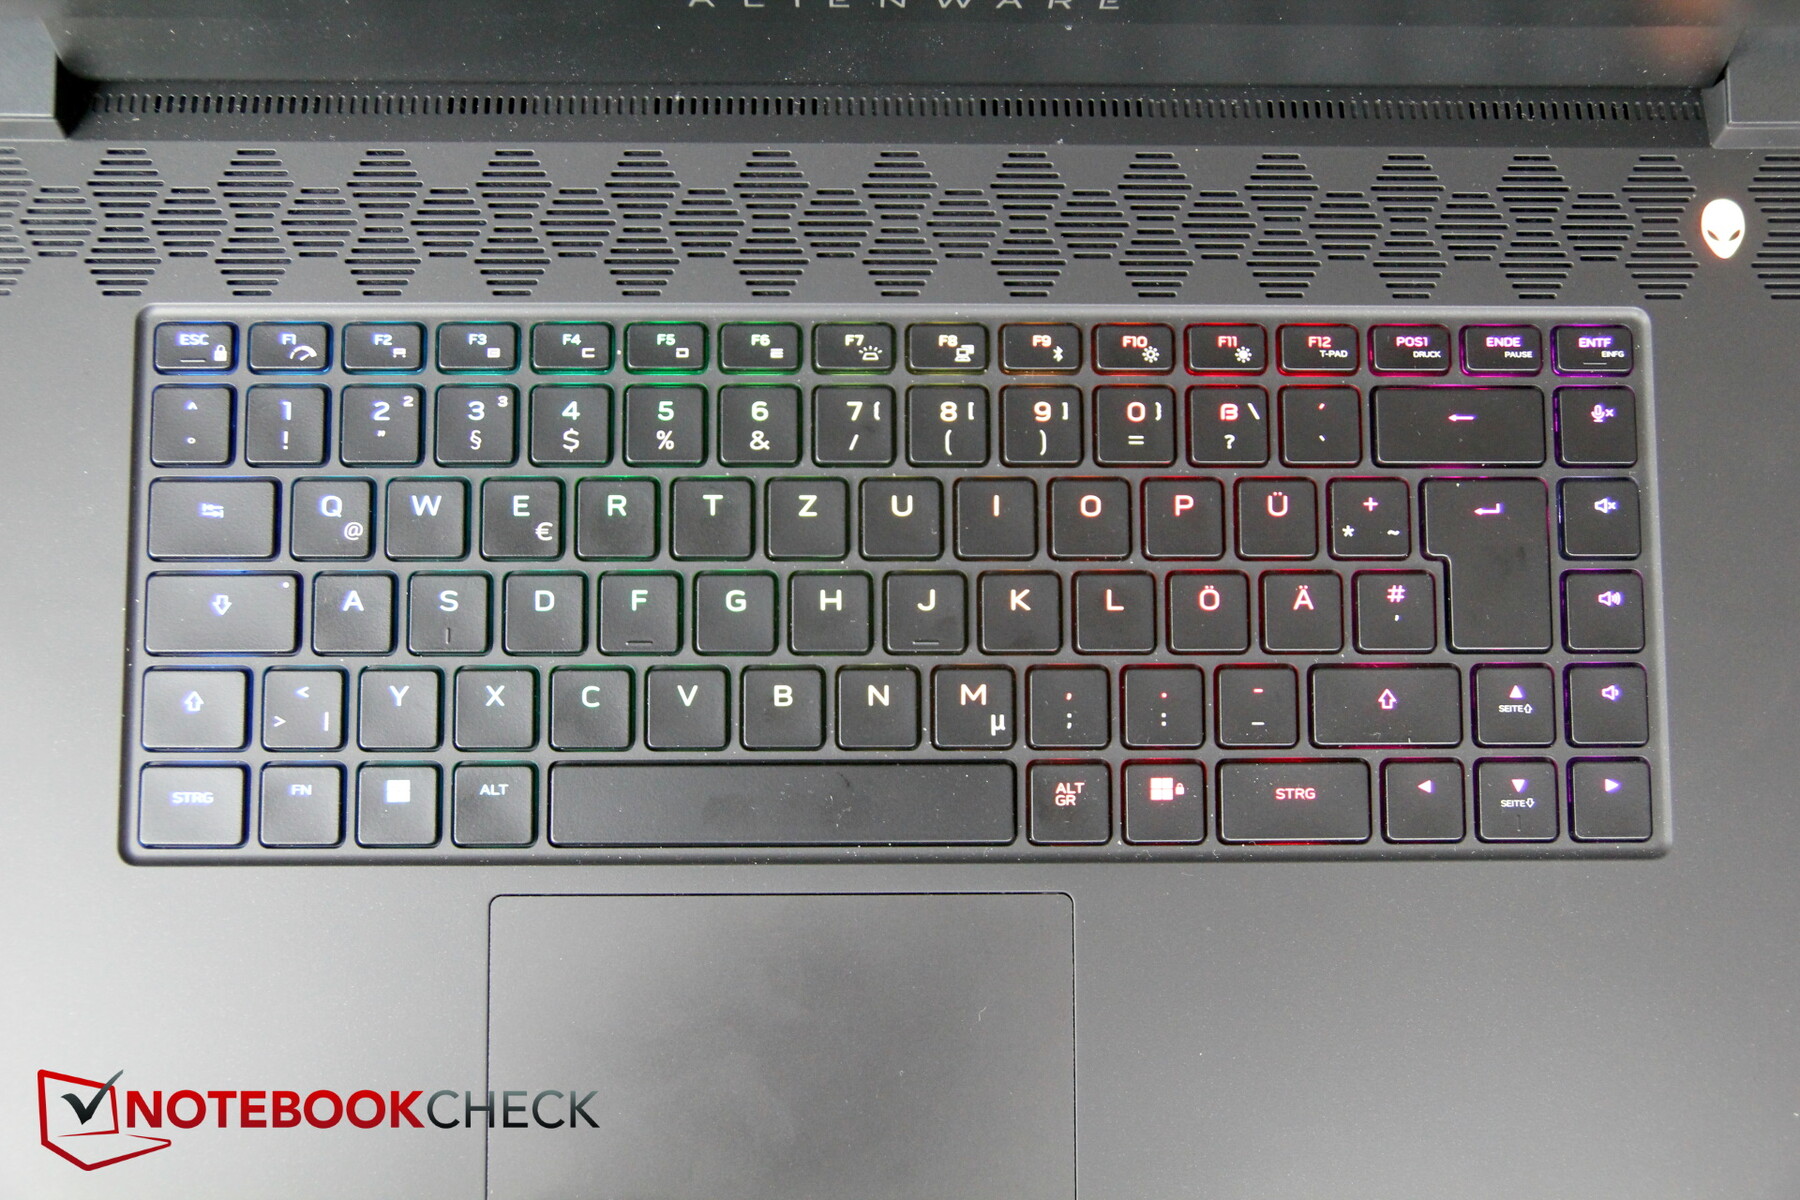
As próprias chaves têm uma viagem média e o feedback é claramente perceptível. Em geral, a experiência de digitação é muito boa e o ruído de digitação é moderado.
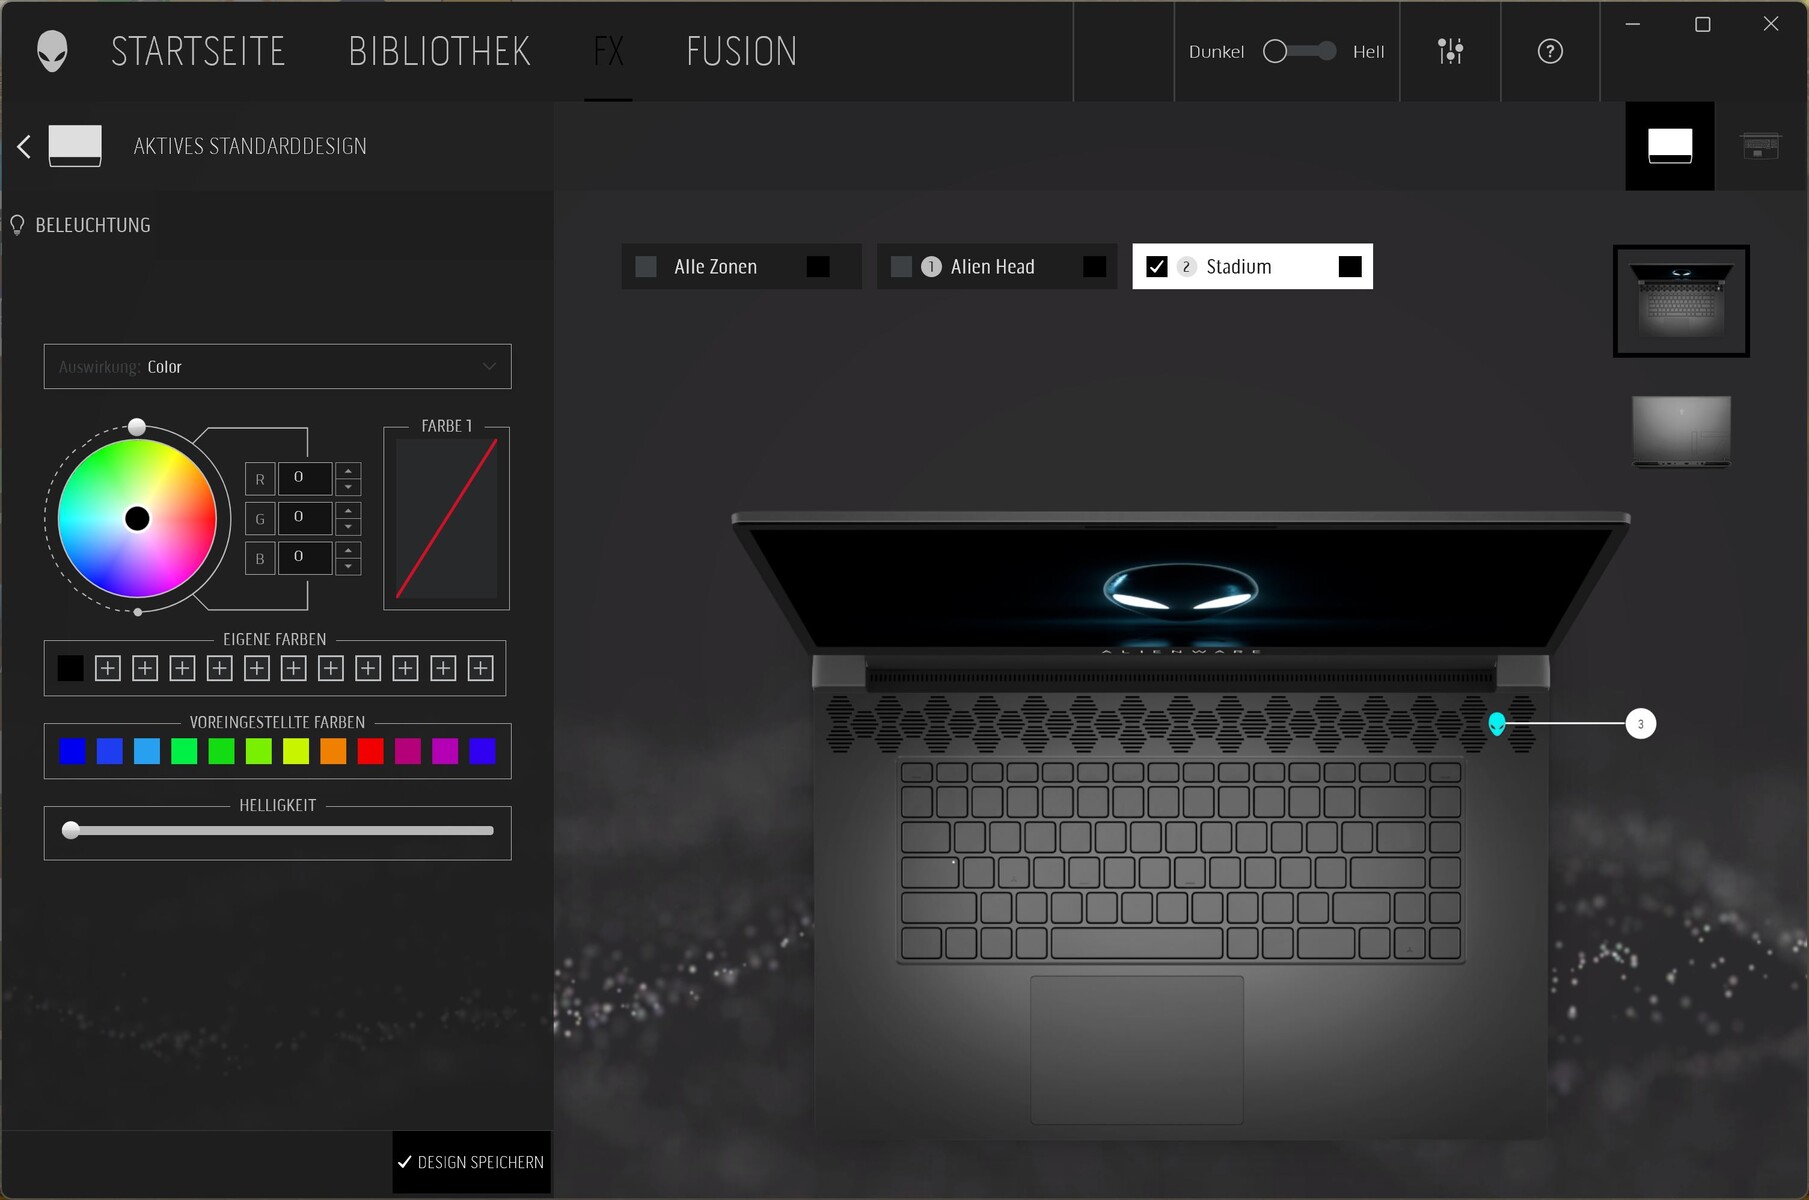
Hoje em dia, uma luz de fundo é indispensável e tem que ser colorida em um laptop para jogos. Assim, o m17 permite todos os tipos de LED gimmicks. Além dos efeitos RGB por tecla, você também pode configurar os logotipos Alienígenas na frente e atrás, assim como a barra LED na parte de trás.
Touchpad
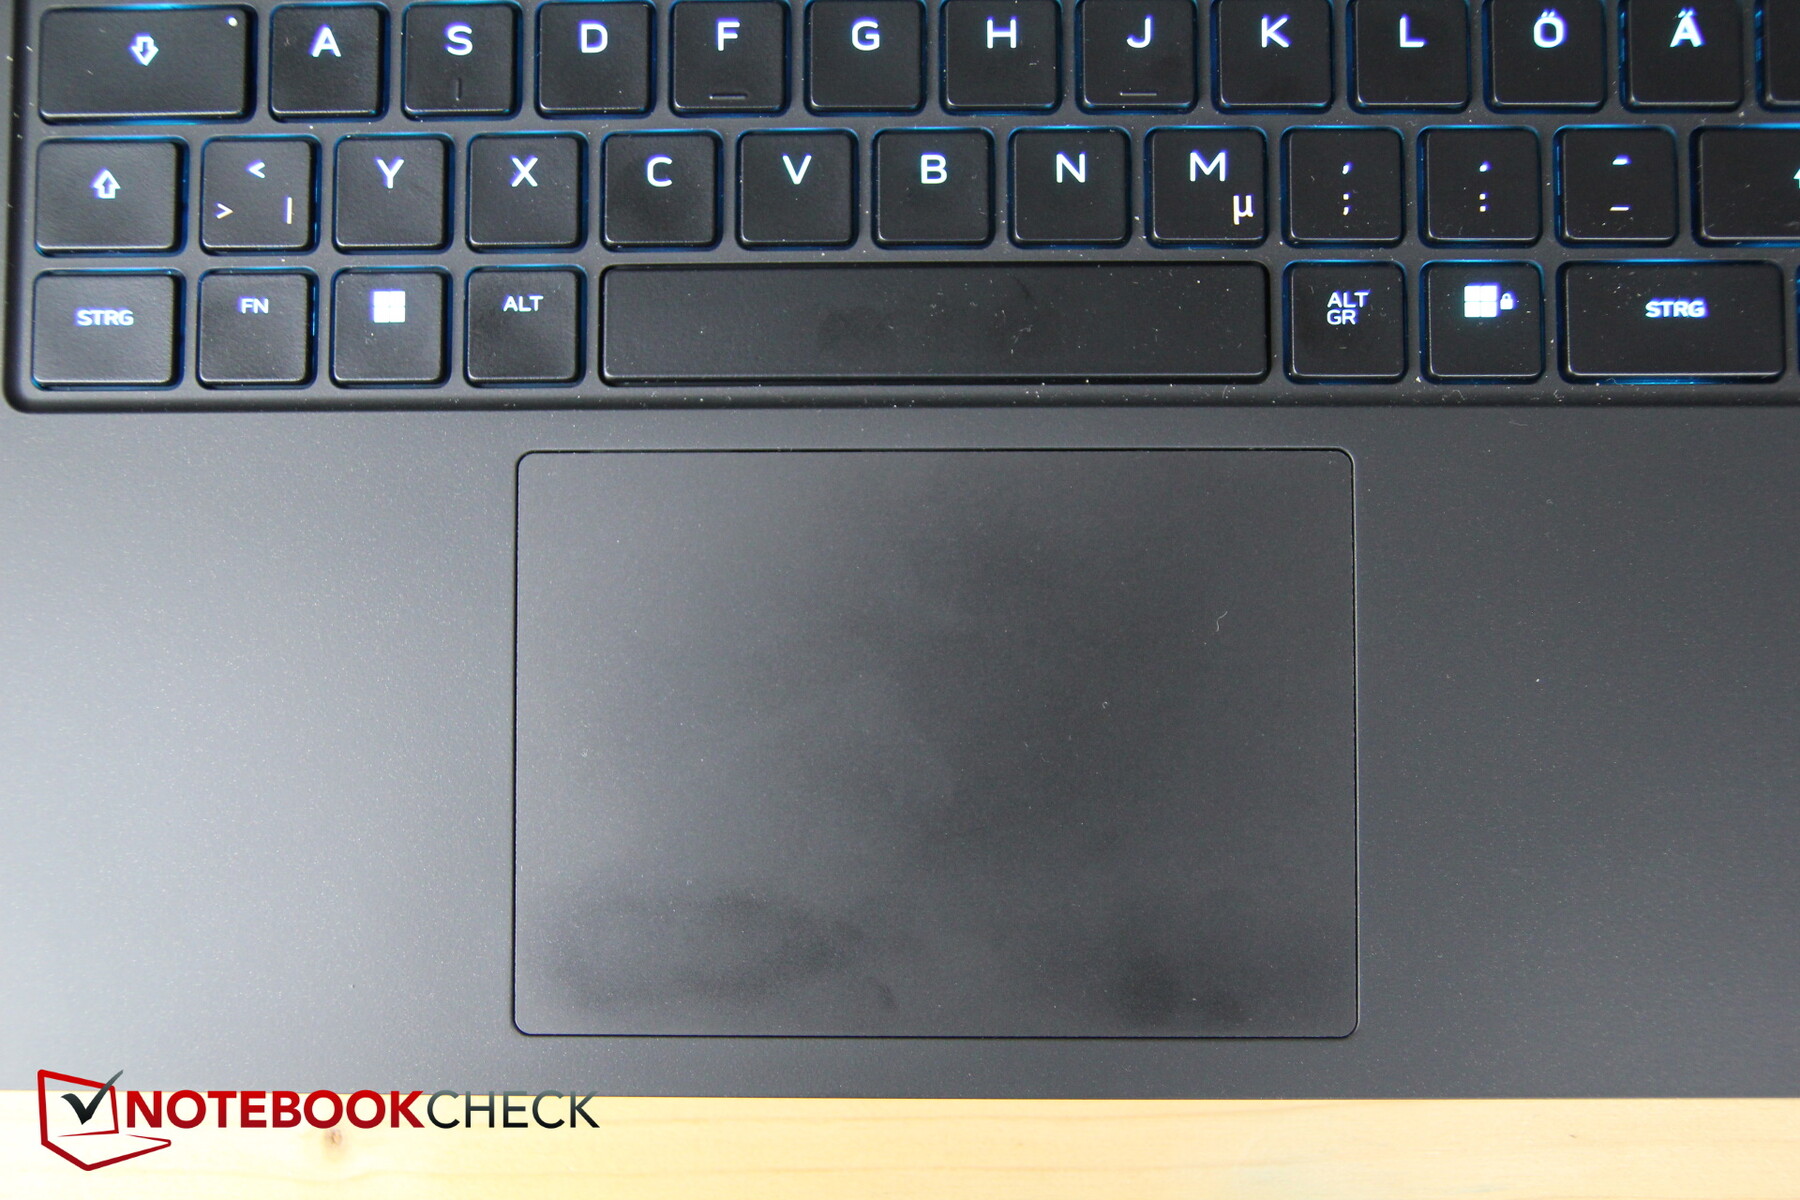
O touchpad de tamanho médio (11,5 x 8 cm) tem boas propriedades de deslizamento; ele só vacila ligeiramente durante movimentos muito lentos.
Os botões de clique integrados têm um bom ponto de pressão e fornecem um feedback claro. Em nosso modelo de revisão, entretanto, os cliques ocasionalmente ficam "presos", ou seja, um botão não volta a aparecer após ser clicado para baixo. O ruído dos cliques é moderado.
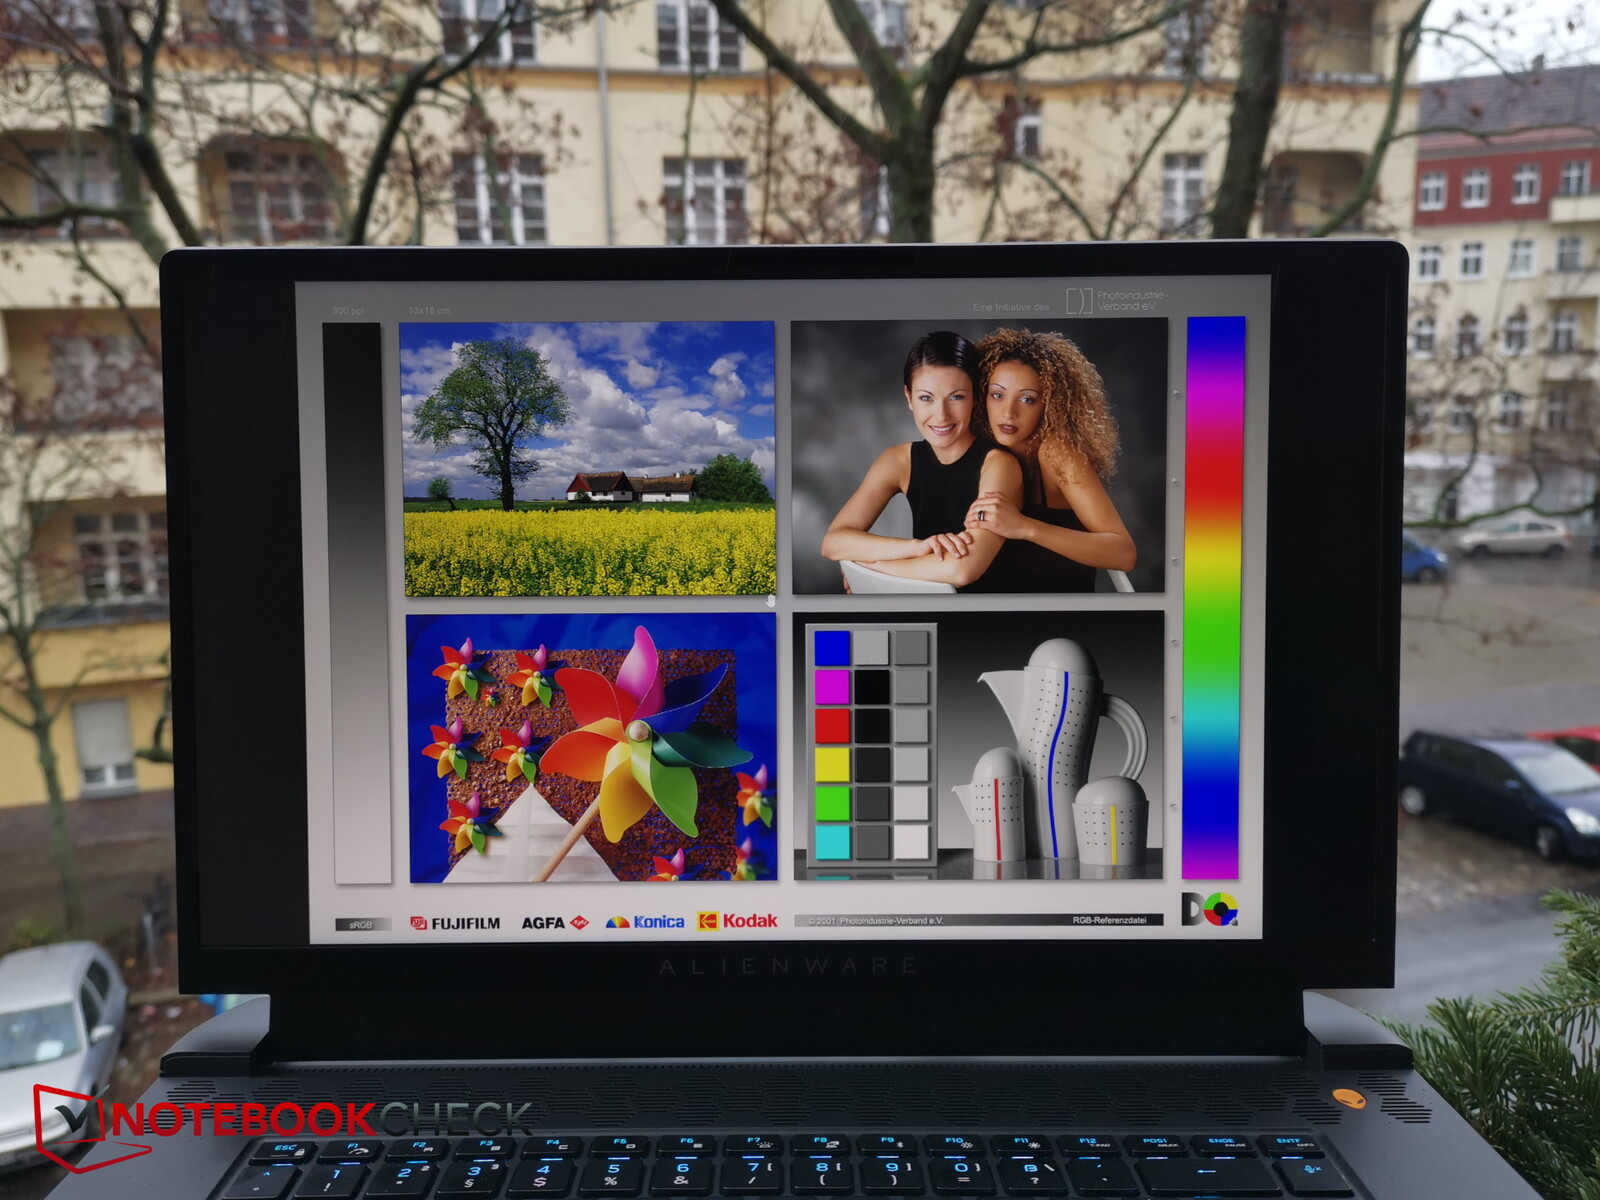
Display - Painel 4K Brilhante no Alienware
A Dell instala um painel IPS UHD fosco (3.840 x 2.160 pixels) da AU Optronics com uma taxa de atualização de 120 Hz.
Há numerosas opções alternativas, começando com três displays Full HD, que diferem principalmente na taxa de atualização (165, 360, 480 Hz!), mas também no suporte de FreeSync vs G-Sync. Depois há um display QHD (2.560 x 1.440) com 165 Hz.
Nossas medidas estão um pouco distantes do tempo de resposta anunciado de 3 ms; medimos entre 11,6 e 16,4 ms. O sangramento da tela é mínimo, especialmente na borda inferior direita. O PWM não é usado.
Em uma comparação de classes, o brilho de quase 450 lêndeas é muito bom, e a iluminação também é boa. O nível de preto, por outro lado, cai acentuadamente, o que significa que o contraste sofre um pouco.
| |||||||||||||||||||||||||
iluminação: 87 %
iluminação com acumulador: 481 cd/m²
Contraste: 880:1 (Preto: 0.55 cd/m²)
ΔE ColorChecker Calman: 4.8 | ∀{0.5-29.43 Ø4.71}
calibrated: 4.74
ΔE Greyscale Calman: 5.5 | ∀{0.09-98 Ø4.96}
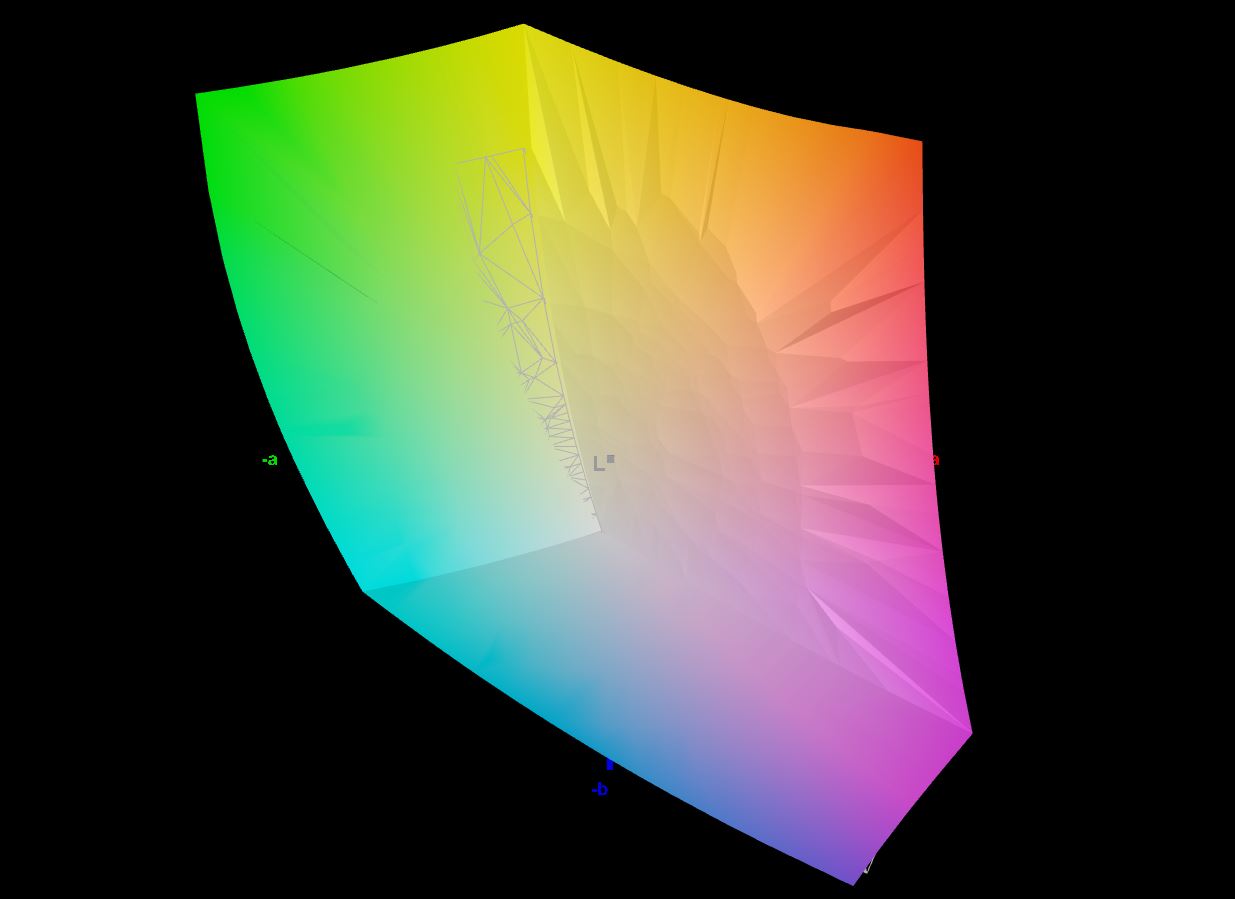
88.4% AdobeRGB 1998 (Argyll 3D)
99.6% sRGB (Argyll 3D)
97.2% Display P3 (Argyll 3D)
Gamma: 2.42
CCT: 6148 K
| Alienware m17 R5 (R9 6900HX, RX 6850M XT) AU Optronics AUODBA3, IPS, 3840x2160, 17" | Alienware m17 R4 AU Optronics AUOEC91, IPS, 1920x1080, 17.3" | Asus ROG Strix Scar 17 SE G733CX-LL014W NE173QHM-NZ2, IPS, 2560x1440, 17.3" | Acer Predator Helios 300 (i7-12700H, RTX 3070 Ti) BOE0A1A, IPS, 2560x1440, 17.3" | Schenker XMG Neo 17 M22 BOE0A99, IPS, 2560x1600, 17" | Aorus 17X XES Sharp SHP1563, IPS, 1920x1080, 17.3" | |
|---|---|---|---|---|---|---|
| Display | -16% | -1% | -1% | -17% | -16% | |
| Display P3 Coverage (%) | 97.2 | 69.8 -28% | 97.1 0% | 96.8 0% | 69 -29% | 70.1 -28% |
| sRGB Coverage (%) | 99.6 | 99.7 0% | 99.9 0% | 99.9 0% | 99.8 0% | 99.9 0% |
| AdobeRGB 1998 Coverage (%) | 88.4 | 71.6 -19% | 84.8 -4% | 84.8 -4% | 69.6 -21% | 71.9 -19% |
| Response Times | 21% | 39% | 2% | 41% | 65% | |
| Response Time Grey 50% / Grey 80% * (ms) | 16.4 ? | 13.2 ? 20% | 5.7 ? 65% | 16.4 ? -0% | 10.8 ? 34% | 3.4 ? 79% |
| Response Time Black / White * (ms) | 11.6 ? | 9.2 ? 21% | 10.1 ? 13% | 11.2 ? 3% | 6.1 ? 47% | 5.8 ? 50% |
| PWM Frequency (Hz) | ||||||
| Screen | 41% | 28% | 17% | 33% | 1% | |
| Brightness middle (cd/m²) | 484 | 305 -37% | 320 -34% | 366 -24% | 415 -14% | 278 -43% |
| Brightness (cd/m²) | 449 | 301 -33% | 303 -33% | 340 -24% | 399 -11% | 273 -39% |
| Brightness Distribution (%) | 87 | 93 7% | 87 0% | 85 -2% | 90 3% | 79 -9% |
| Black Level * (cd/m²) | 0.55 | 0.19 65% | 0.3 45% | 0.31 44% | 0.43 22% | 0.26 53% |
| Contrast (:1) | 880 | 1605 82% | 1067 21% | 1181 34% | 965 10% | 1069 21% |
| Colorchecker dE 2000 * | 4.8 | 1.31 73% | 1.1 77% | 3.56 26% | 1.44 70% | 3.96 17% |
| Colorchecker dE 2000 max. * | 7.48 | 2.32 69% | 2.7 64% | 5.66 24% | 2.33 69% | 10.78 -44% |
| Colorchecker dE 2000 calibrated * | 4.74 | 0.91 81% | 3.31 30% | 0.89 81% | 1.07 77% | |
| Greyscale dE 2000 * | 5.5 | 2.3 58% | 1.1 80% | 2.84 48% | 1.8 67% | 6.8 -24% |
| Gamma | 2.42 91% | 2.281 96% | 2.13 103% | 2.29 96% | 2.132 103% | 2.224 99% |
| CCT | 6148 106% | 6449 101% | 6599 98% | 6835 95% | 6327 103% | 7651 85% |
| Color Space (Percent of AdobeRGB 1998) (%) | 72 | |||||
| Color Space (Percent of sRGB) (%) | 94 | |||||
| Média Total (Programa/Configurações) | 15% /
26% | 22% /
23% | 6% /
11% | 19% /
23% | 17% /
7% |
* ... menor é melhor
O Alienware oferece uma cobertura de espaço de cores decente: sRGB é totalmente reproduzido, DisplayP3 é de 97% e AdobeRGB é de 88%. Isto torna a tela adequada para edição profissional de imagem e vídeo.
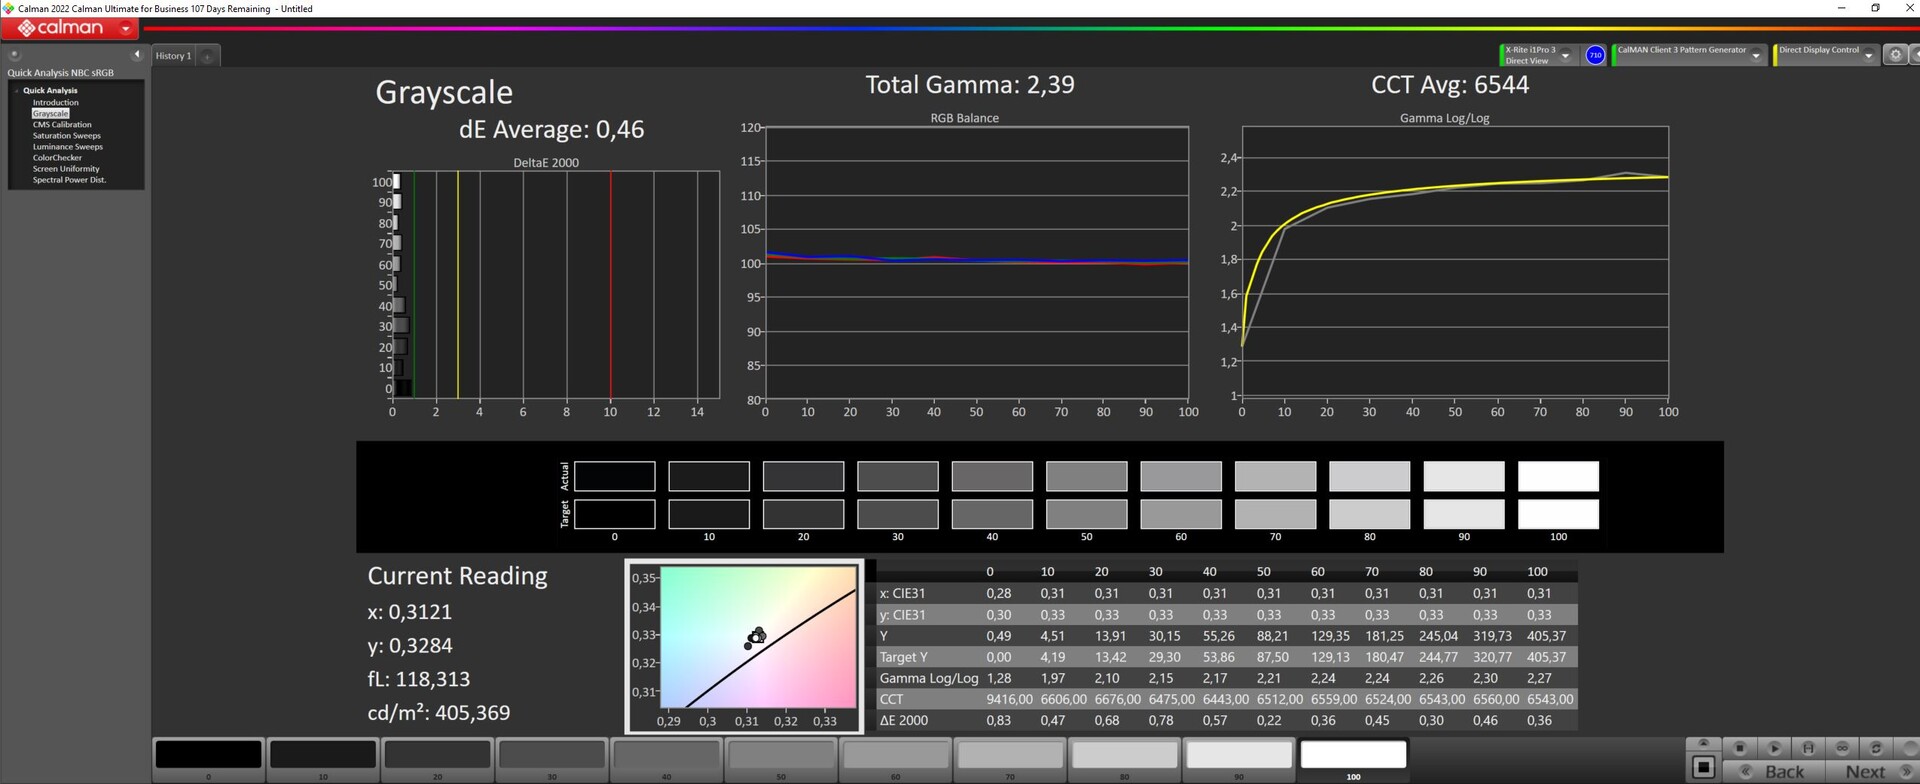
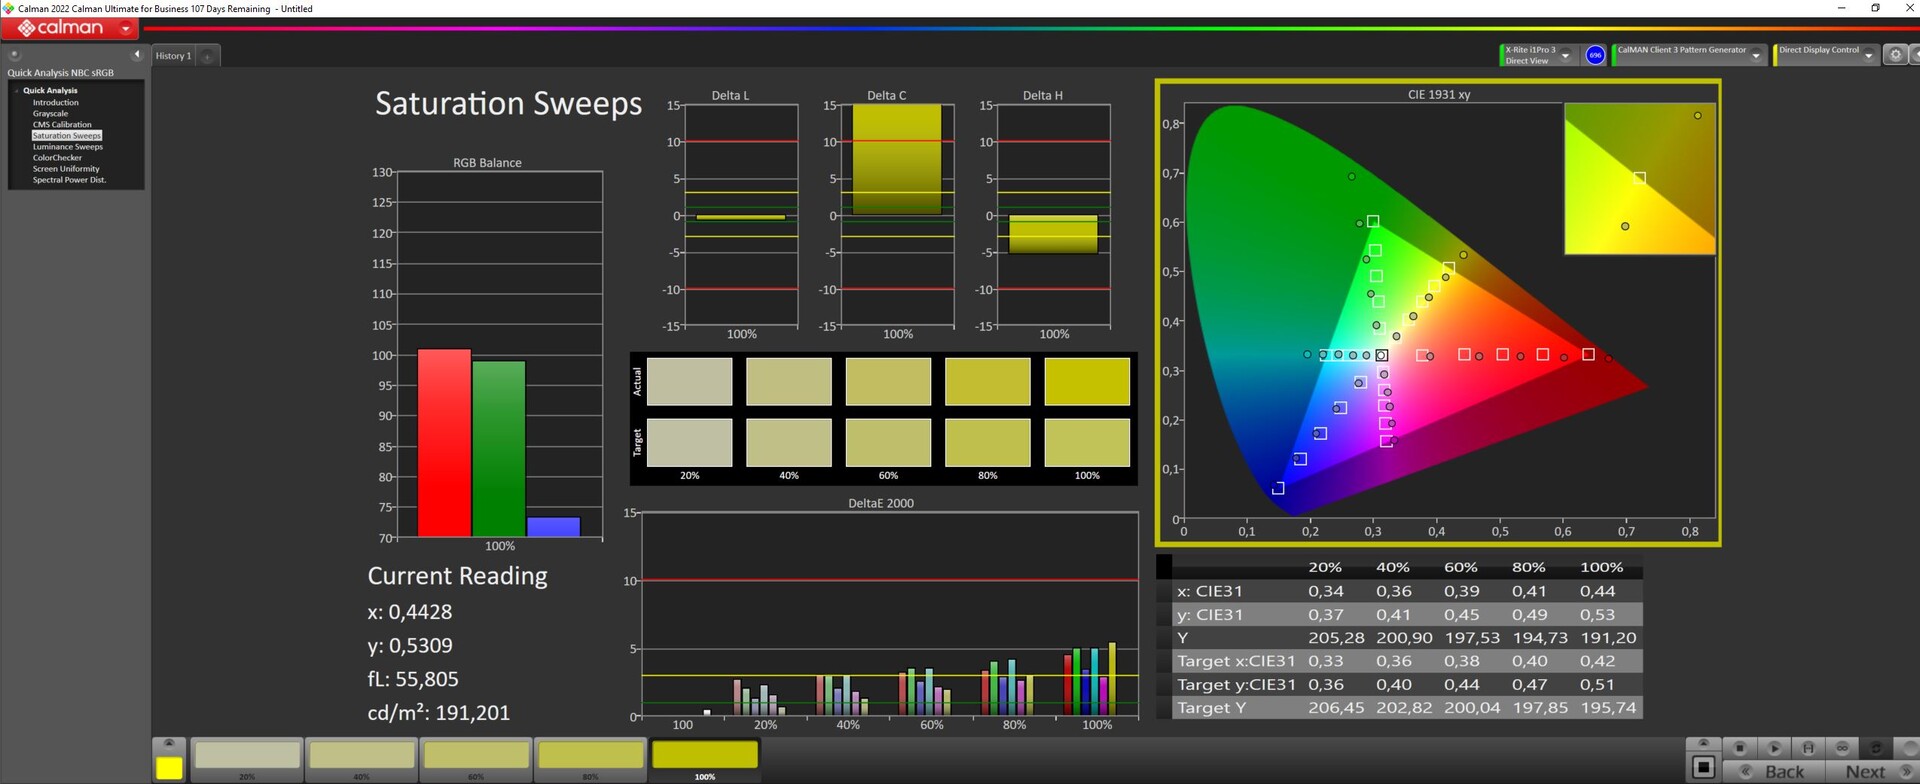
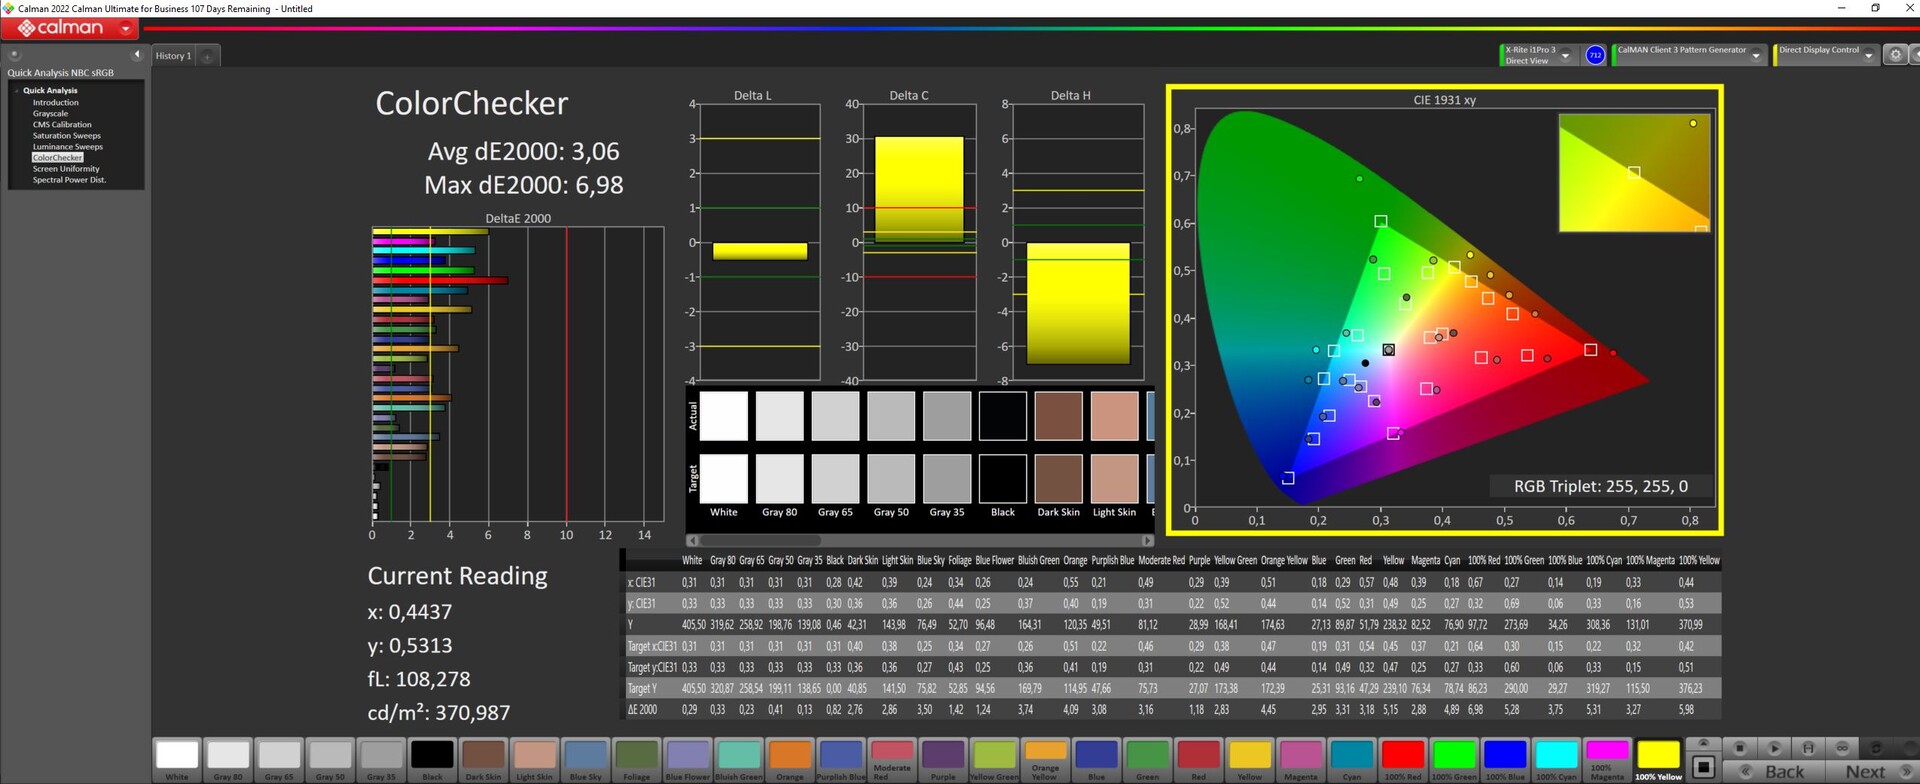
Apesar da boa cobertura do espaço de cor, os valores DeltaE não são particularmente baixos. Um valor DeltaE próximo a 5 é um pouco alto demais tanto para as cores quanto para as escalas de cinza
Nossa calibração manual reduz o valor DeltaE para 0,46 para a escala de cinza e os desvios de cor para 3,06. O perfil pode ser baixado acima.

Exibir tempos de resposta
| ↔ Tempo de resposta preto para branco | ||
|---|---|---|
| 11.6 ms ... ascensão ↗ e queda ↘ combinadas | ↗ 6.2 ms ascensão | 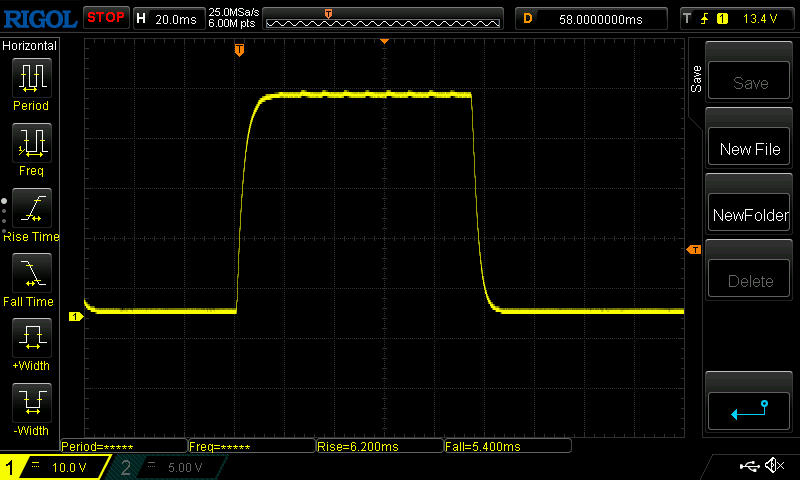 |
| ↘ 5.4 ms queda | ||
| A tela mostra boas taxas de resposta em nossos testes, mas pode ser muito lenta para jogadores competitivos. Em comparação, todos os dispositivos testados variam de 0.1 (mínimo) a 240 (máximo) ms. » 31 % de todos os dispositivos são melhores. Isso significa que o tempo de resposta medido é melhor que a média de todos os dispositivos testados (19.8 ms). | ||
| ↔ Tempo de resposta 50% cinza a 80% cinza | ||
| 16.4 ms ... ascensão ↗ e queda ↘ combinadas | ↗ 7.8 ms ascensão | 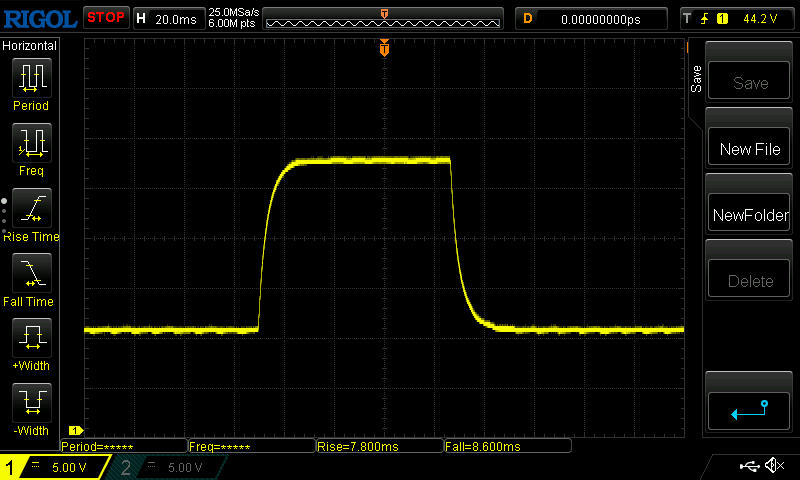 |
| ↘ 8.6 ms queda | ||
| A tela mostra boas taxas de resposta em nossos testes, mas pode ser muito lenta para jogadores competitivos. Em comparação, todos os dispositivos testados variam de 0.165 (mínimo) a 636 (máximo) ms. » 31 % de todos os dispositivos são melhores. Isso significa que o tempo de resposta medido é melhor que a média de todos os dispositivos testados (31 ms). | ||
Cintilação da tela / PWM (modulação por largura de pulso)
| Tela tremeluzindo / PWM não detectado |  | ||
[pwm_comparison] Em comparação: 52 % de todos os dispositivos testados não usam PWM para escurecer a tela. Se PWM foi detectado, uma média de 7754 (mínimo: 5 - máximo: 343500) Hz foi medida. | |||
Ao ar livre, as 450 lêndeas junto com a superfície fosca são úteis para reduzir a maioria dos reflexos. No entanto, o fraco contraste proíbe o uso à luz direta do sol.
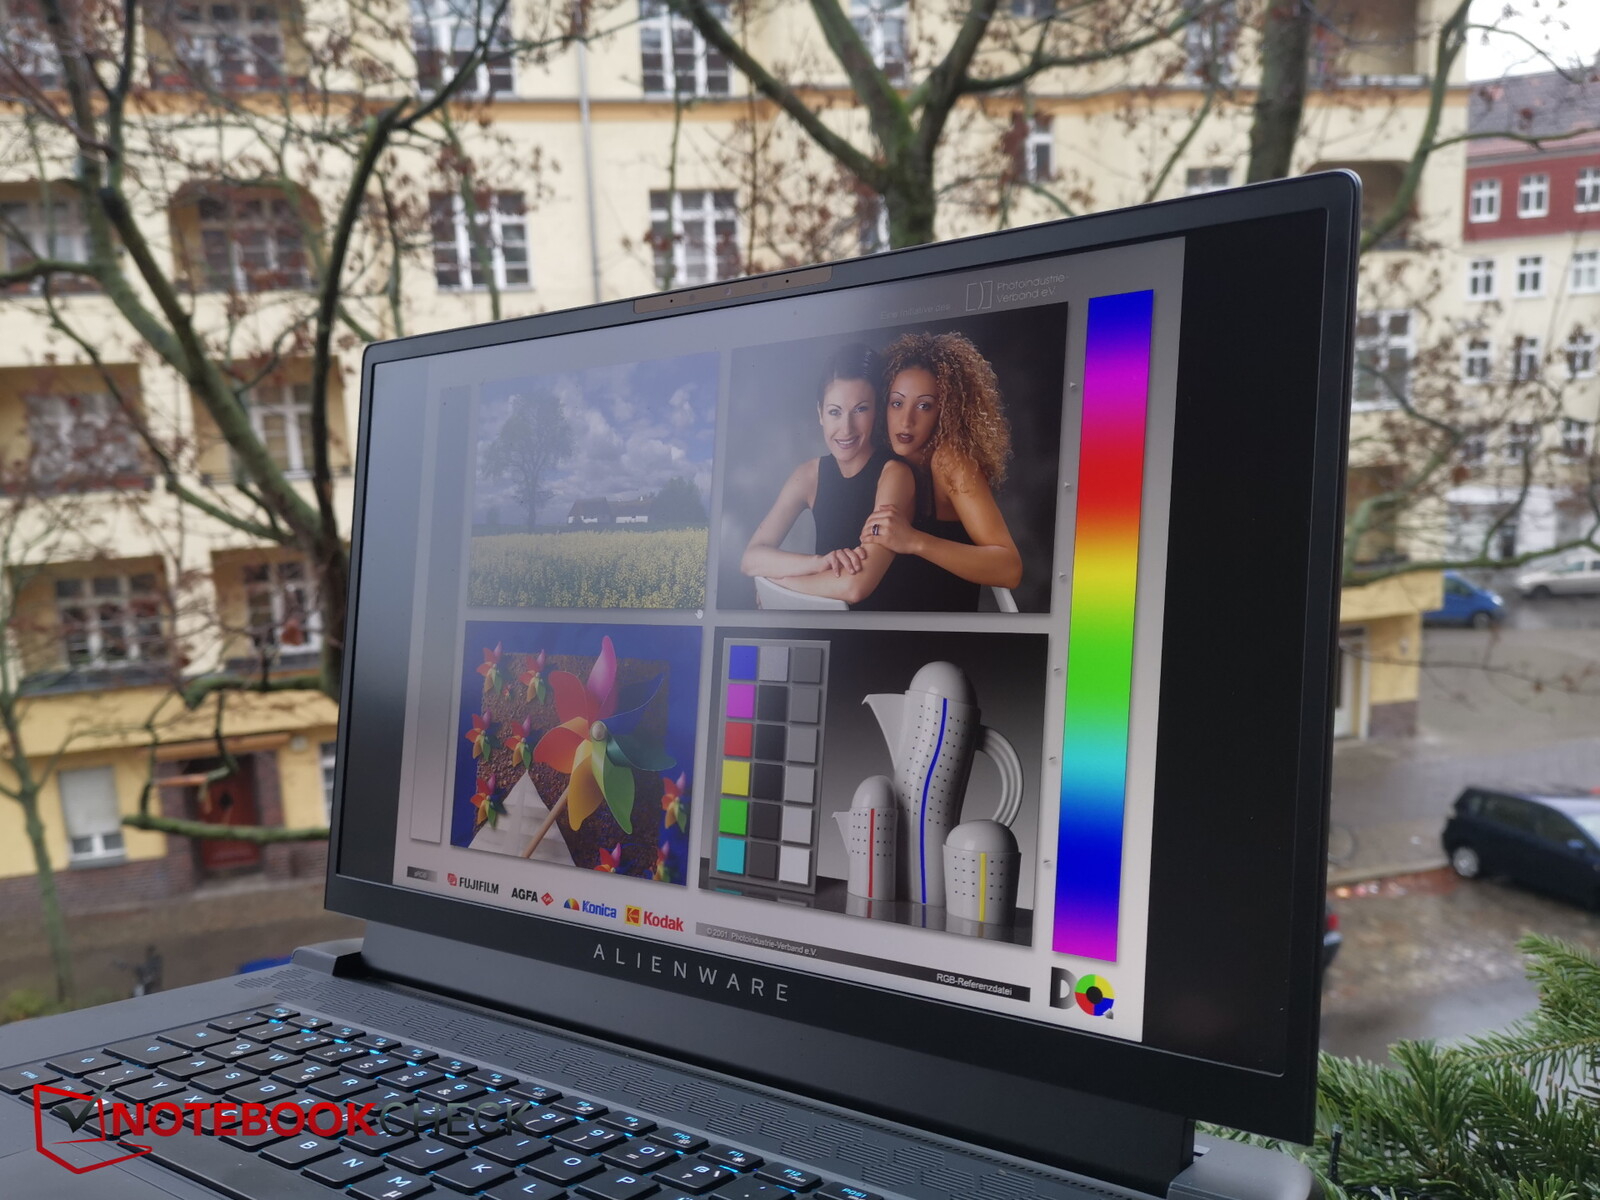
A estabilidade do ângulo de visão é aceitável, mas não é grande em comparação com a norma IPS. Quando visto de ângulos extremos, perde-se uma quantidade considerável de brilho.

Desempenho - Os motoristas dificultam o verdadeiro potencial
Tanto o AMD Ryzen 9 6900HXcom seus oito núcleos e o AMD Radeon RX 6850M XT bem como os generosos 32 GB de RAM colocam o dispositivo na categoria de jogador de alto desempenho. Isto significa que o dispositivo deve ser capaz de executar todos os jogos atuais sem problemas na tela integrada, mesmo que nem sempre na resolução nativa de 4K.
Alternativamente, você pode ir um tamanho menor no configurador com oRyzen 7 6800H e um Radeon RX 6700Ma RAM pode ser variada entre 8 e 64 GB.

Condições de teste
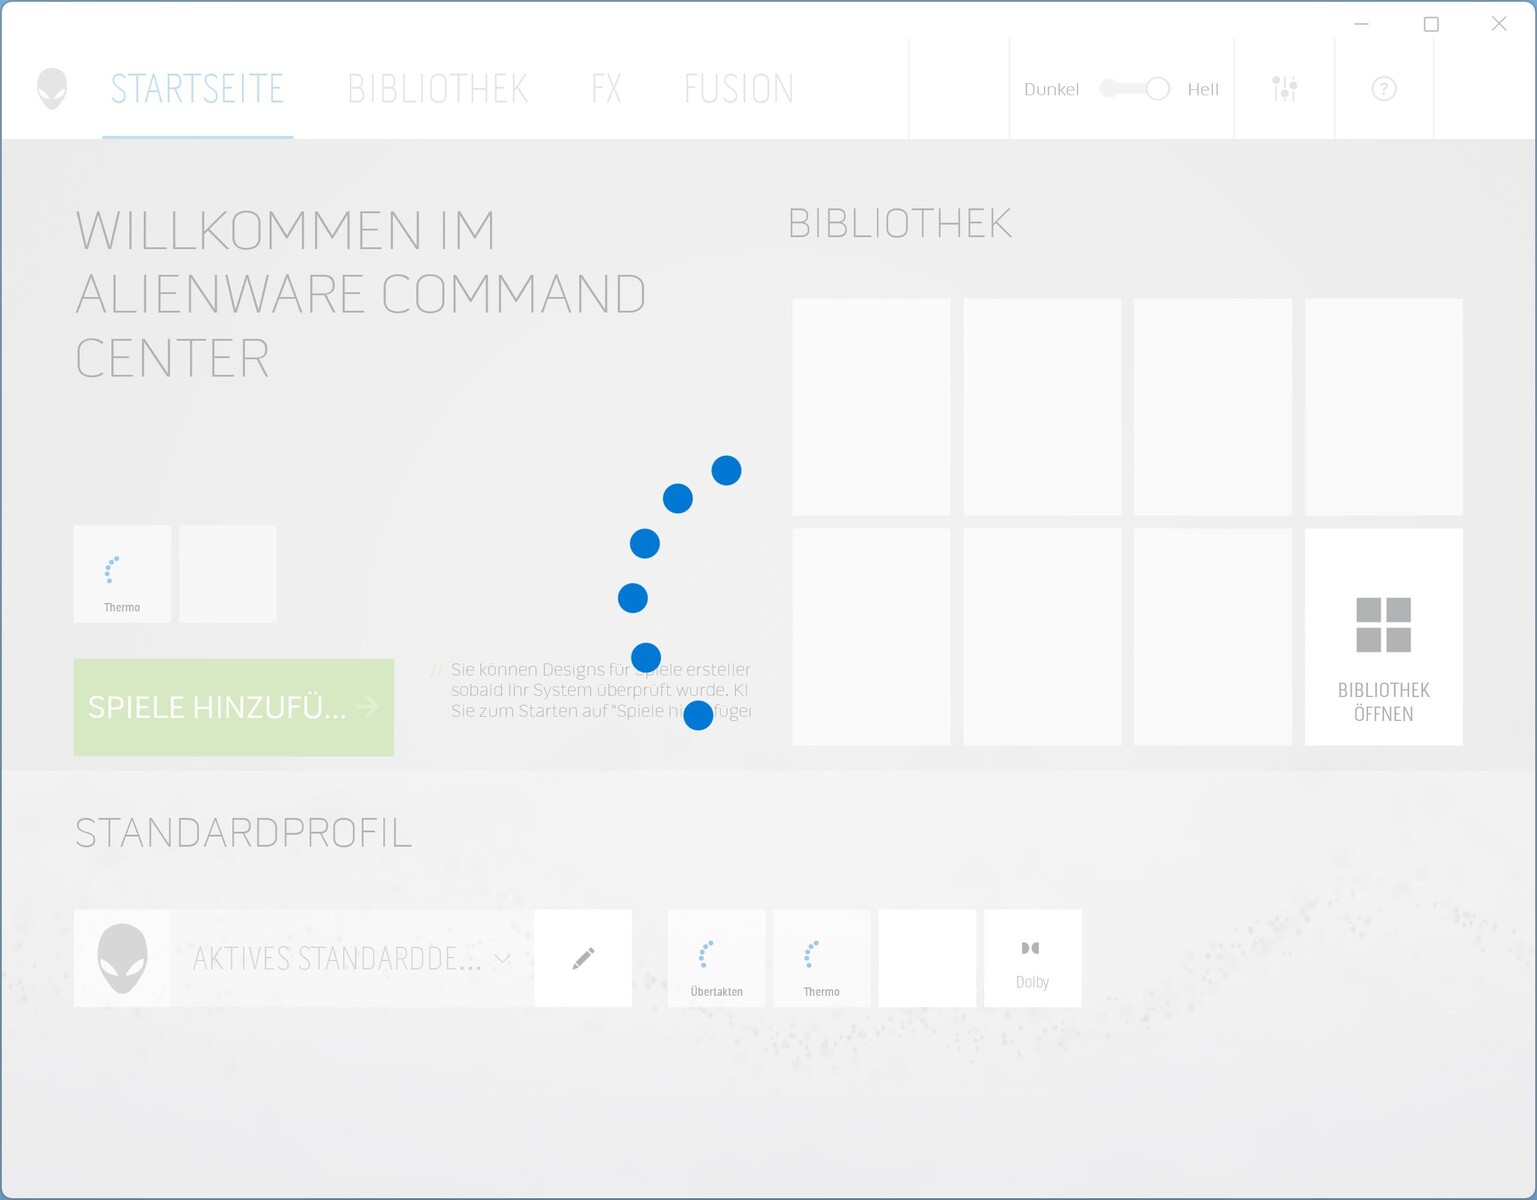
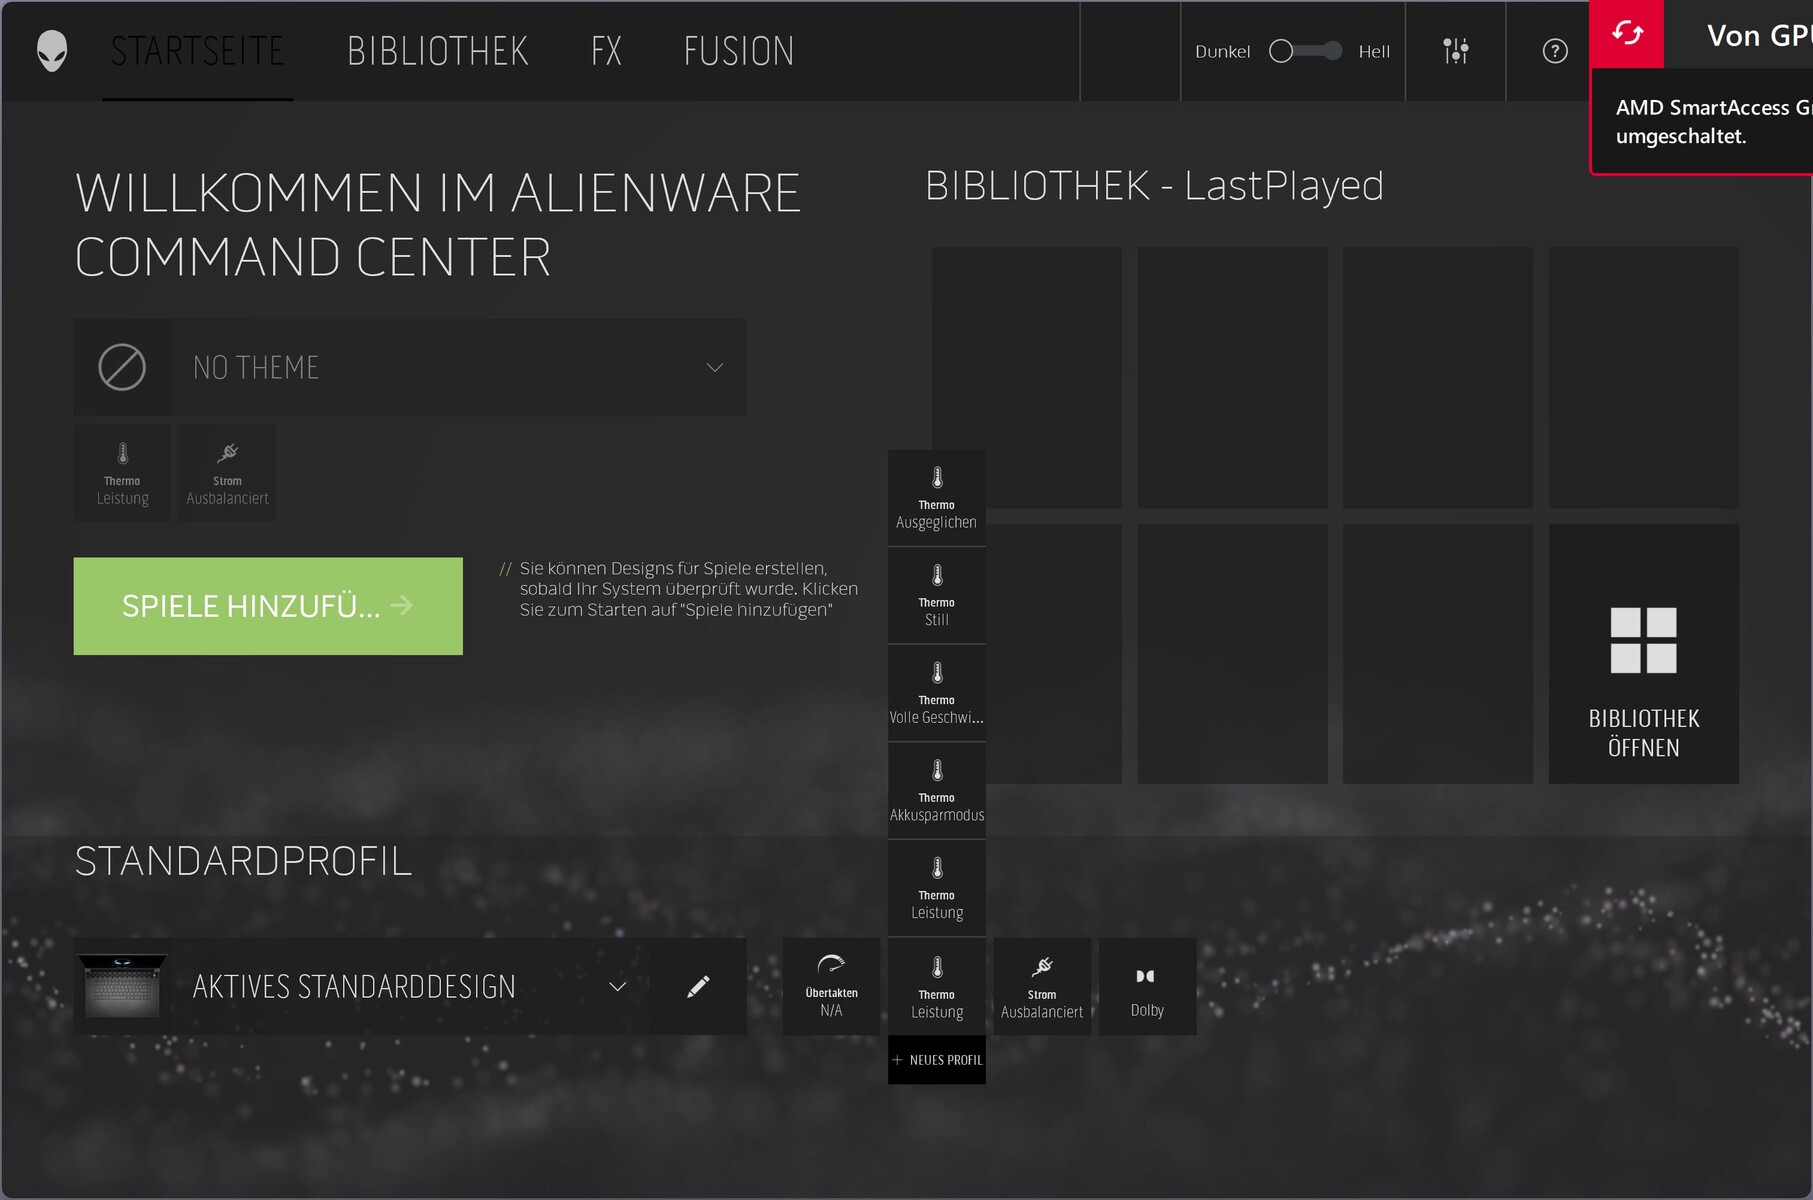
Infelizmente, a Dell sempre tem dois aplicativos de fabricantes pré-instalados em laptops Alienware, a saber, "My Alienware" e o "Alienware Command Center". Enquanto o primeiro é dedicado principalmente ao suporte, o segundo é o centro de controle. No Centro de Comando, você define a iluminação e os modos de desempenho, dos quais há um total de cinco. Além disso, determinados valores podem ser overclockados manualmente.
Escolhemos o modo Performance para os benchmarks. Somente a Full Speed aperta ainda mais o desempenho, mas aqui os ventiladores estão sempre no máximo.
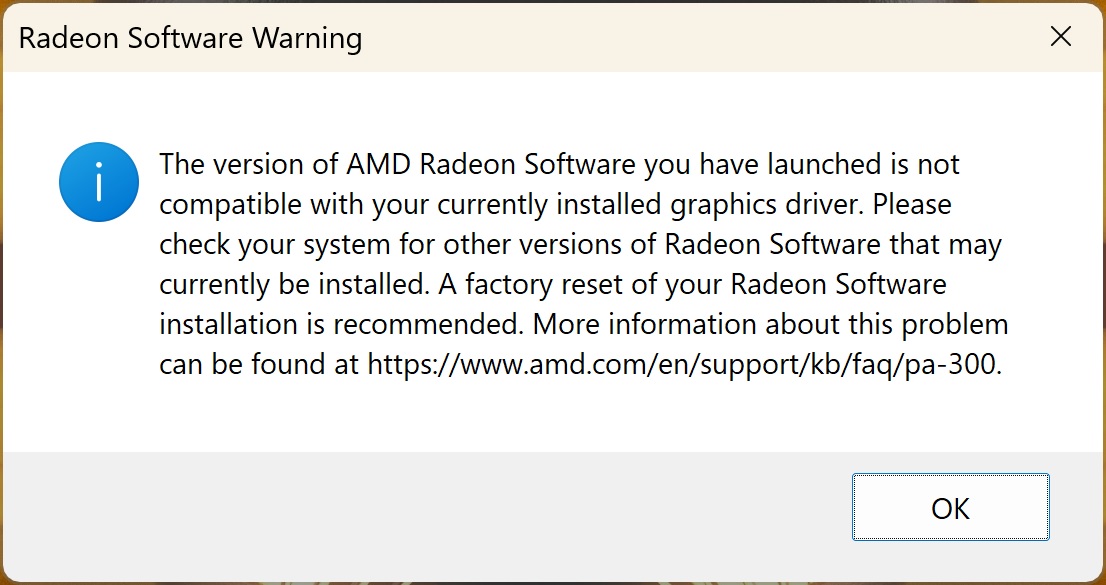
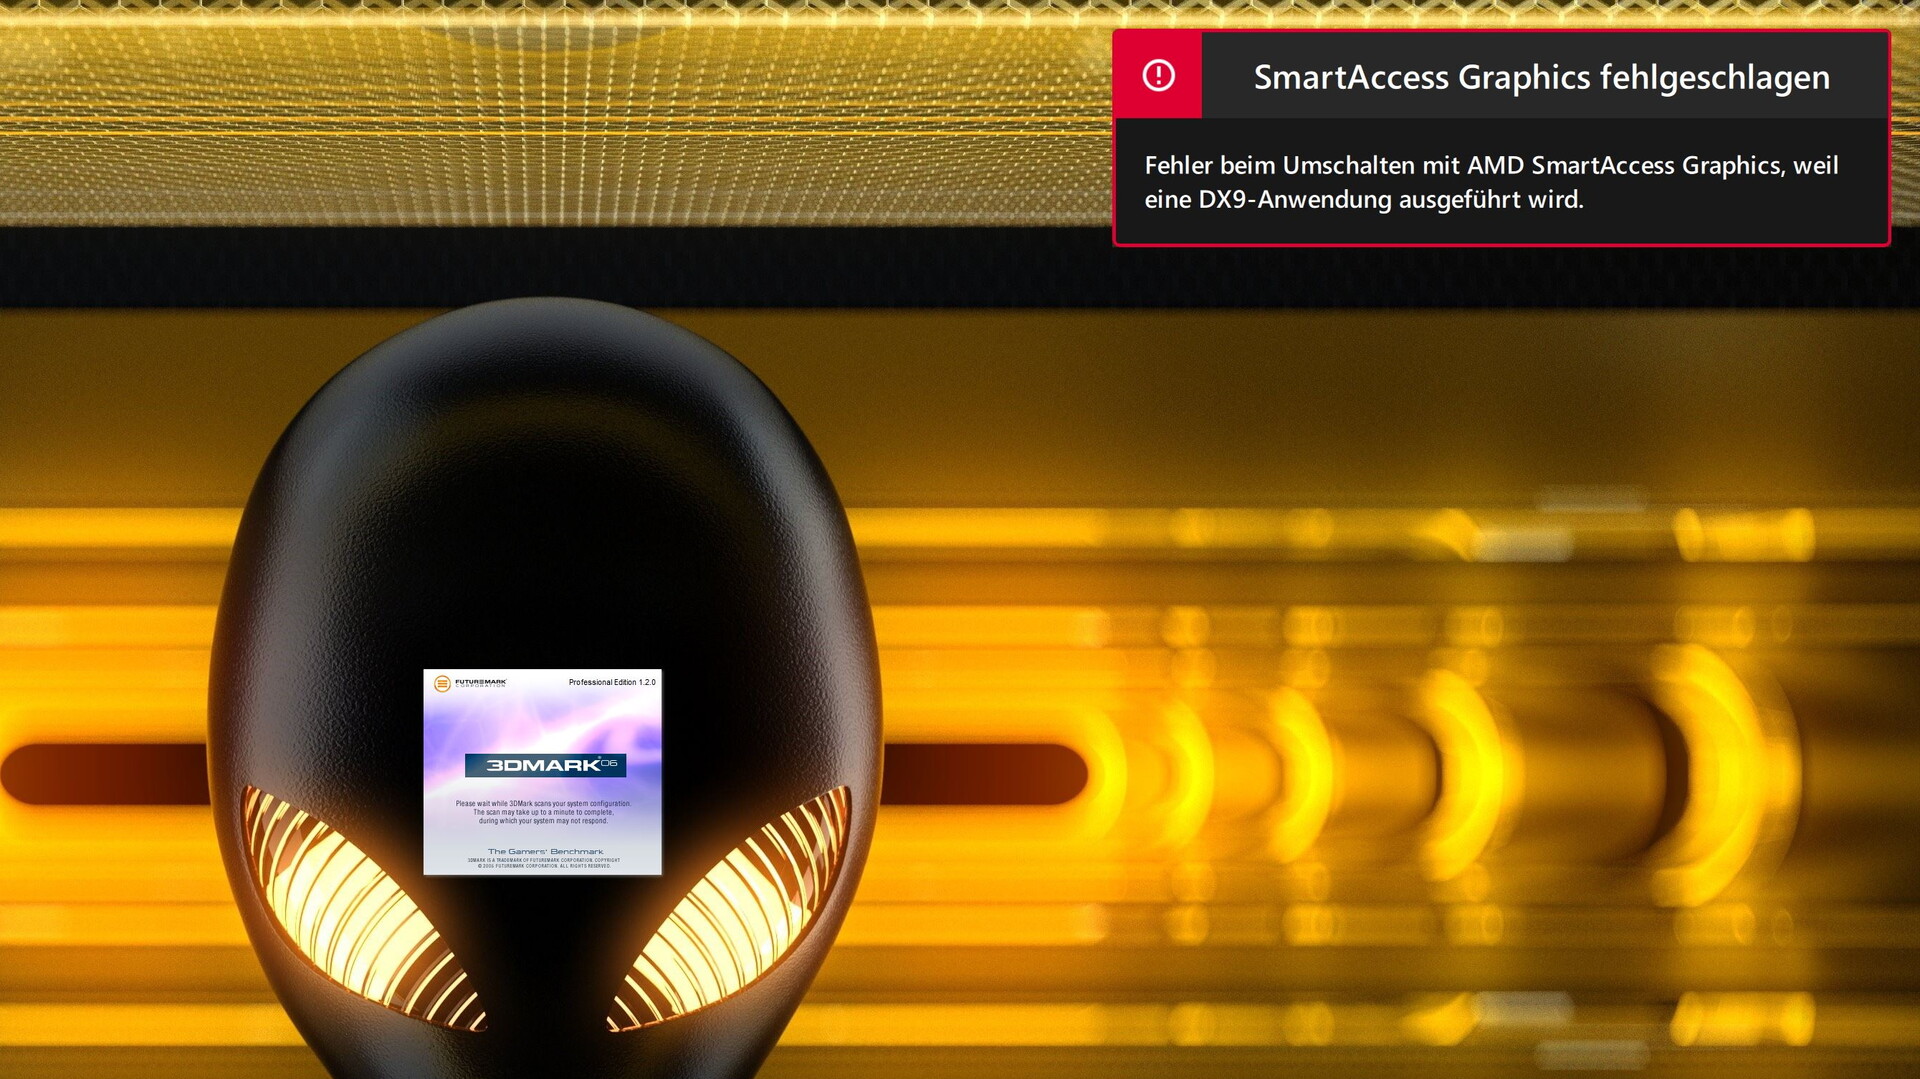
Durante os testes, encontramos repetidamente problemas com a configuração de todos os-AMD. No início, não conseguimos acessar o software Radeon no sistema pré-configurado da Dell
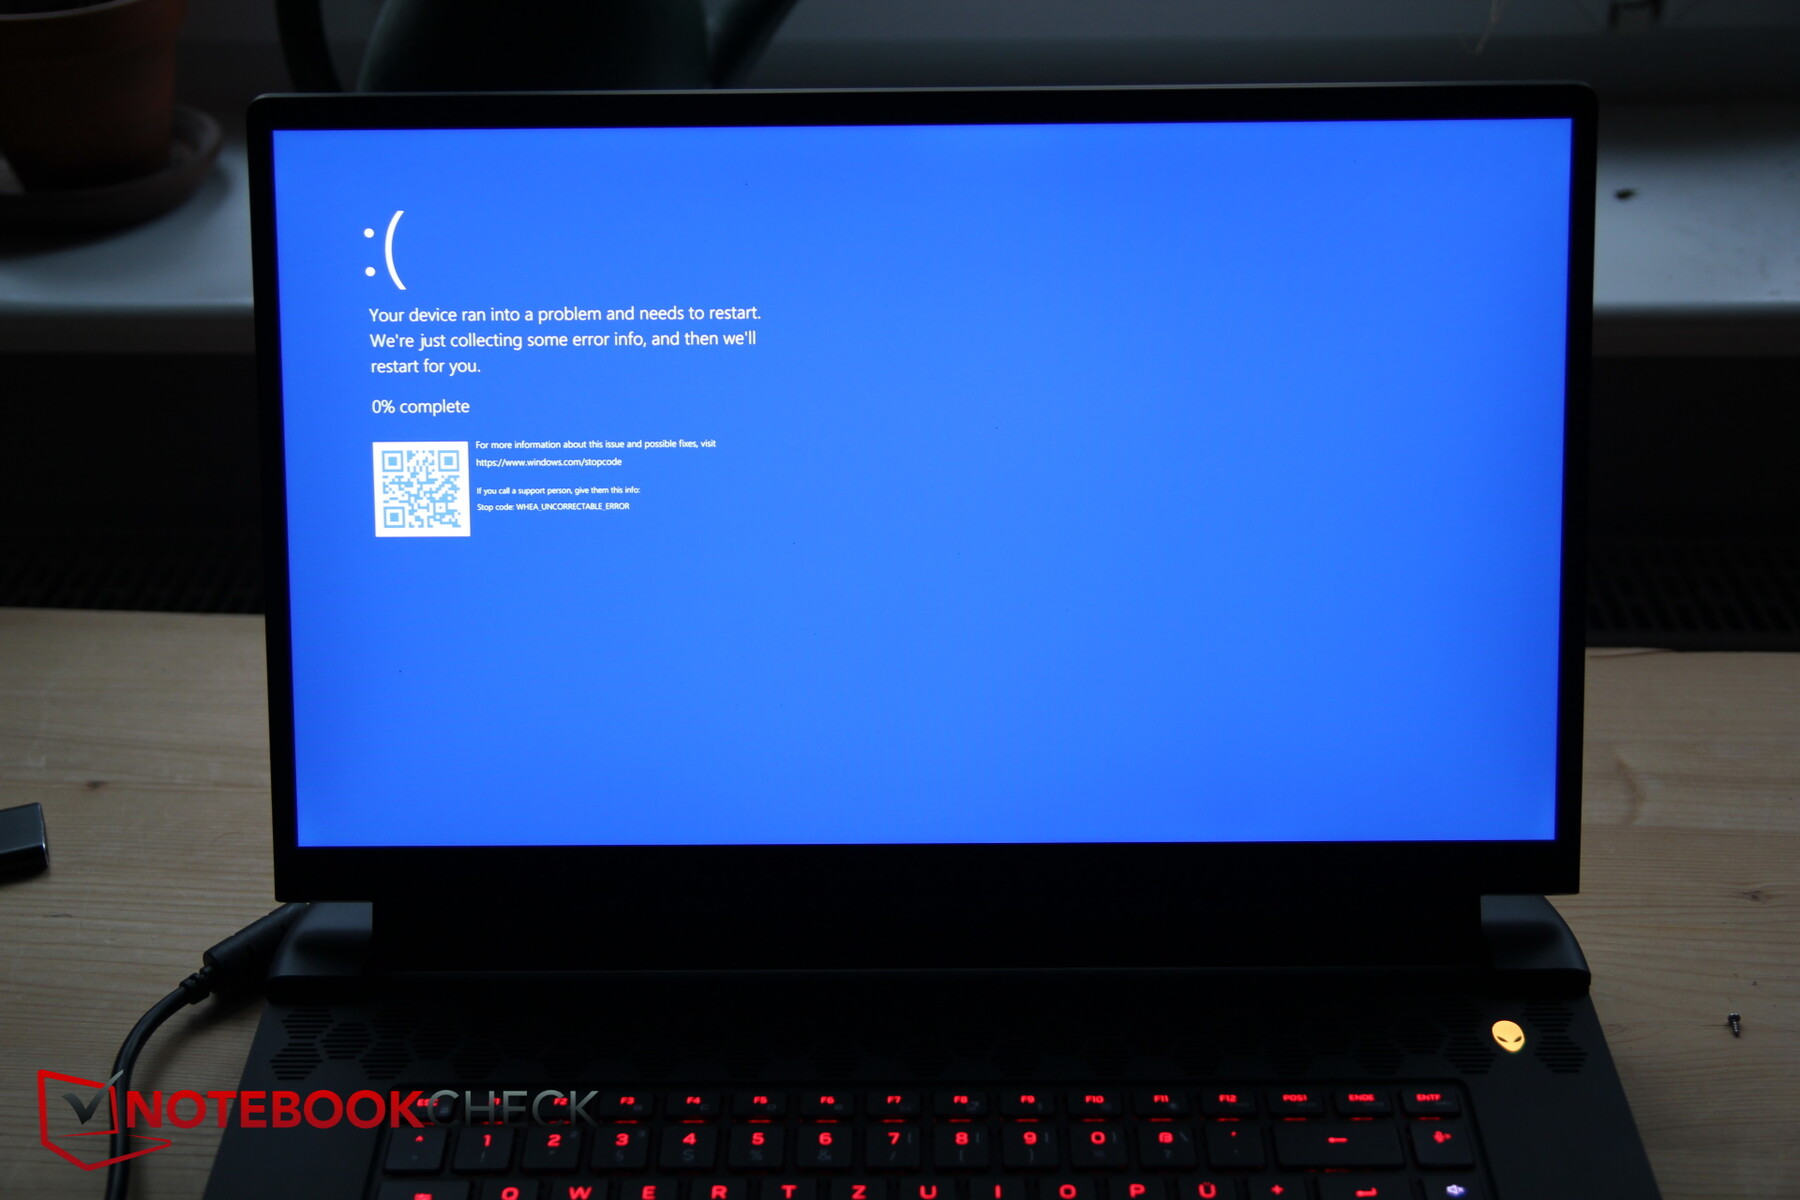
A instalação dos últimos motoristas levou a consideráveis problemas de estabilidade, e por isso instalamos um motorista mais velho e estável, a conselho da Dell. No entanto, uma vez ocorreu uma tela azul em nosso modelo de revisão e o m17 caiu completamente durante um padrão de jogo padrão. O mesmo ocorreu também no modo de sono. E este foi um dispositivo de substituição!
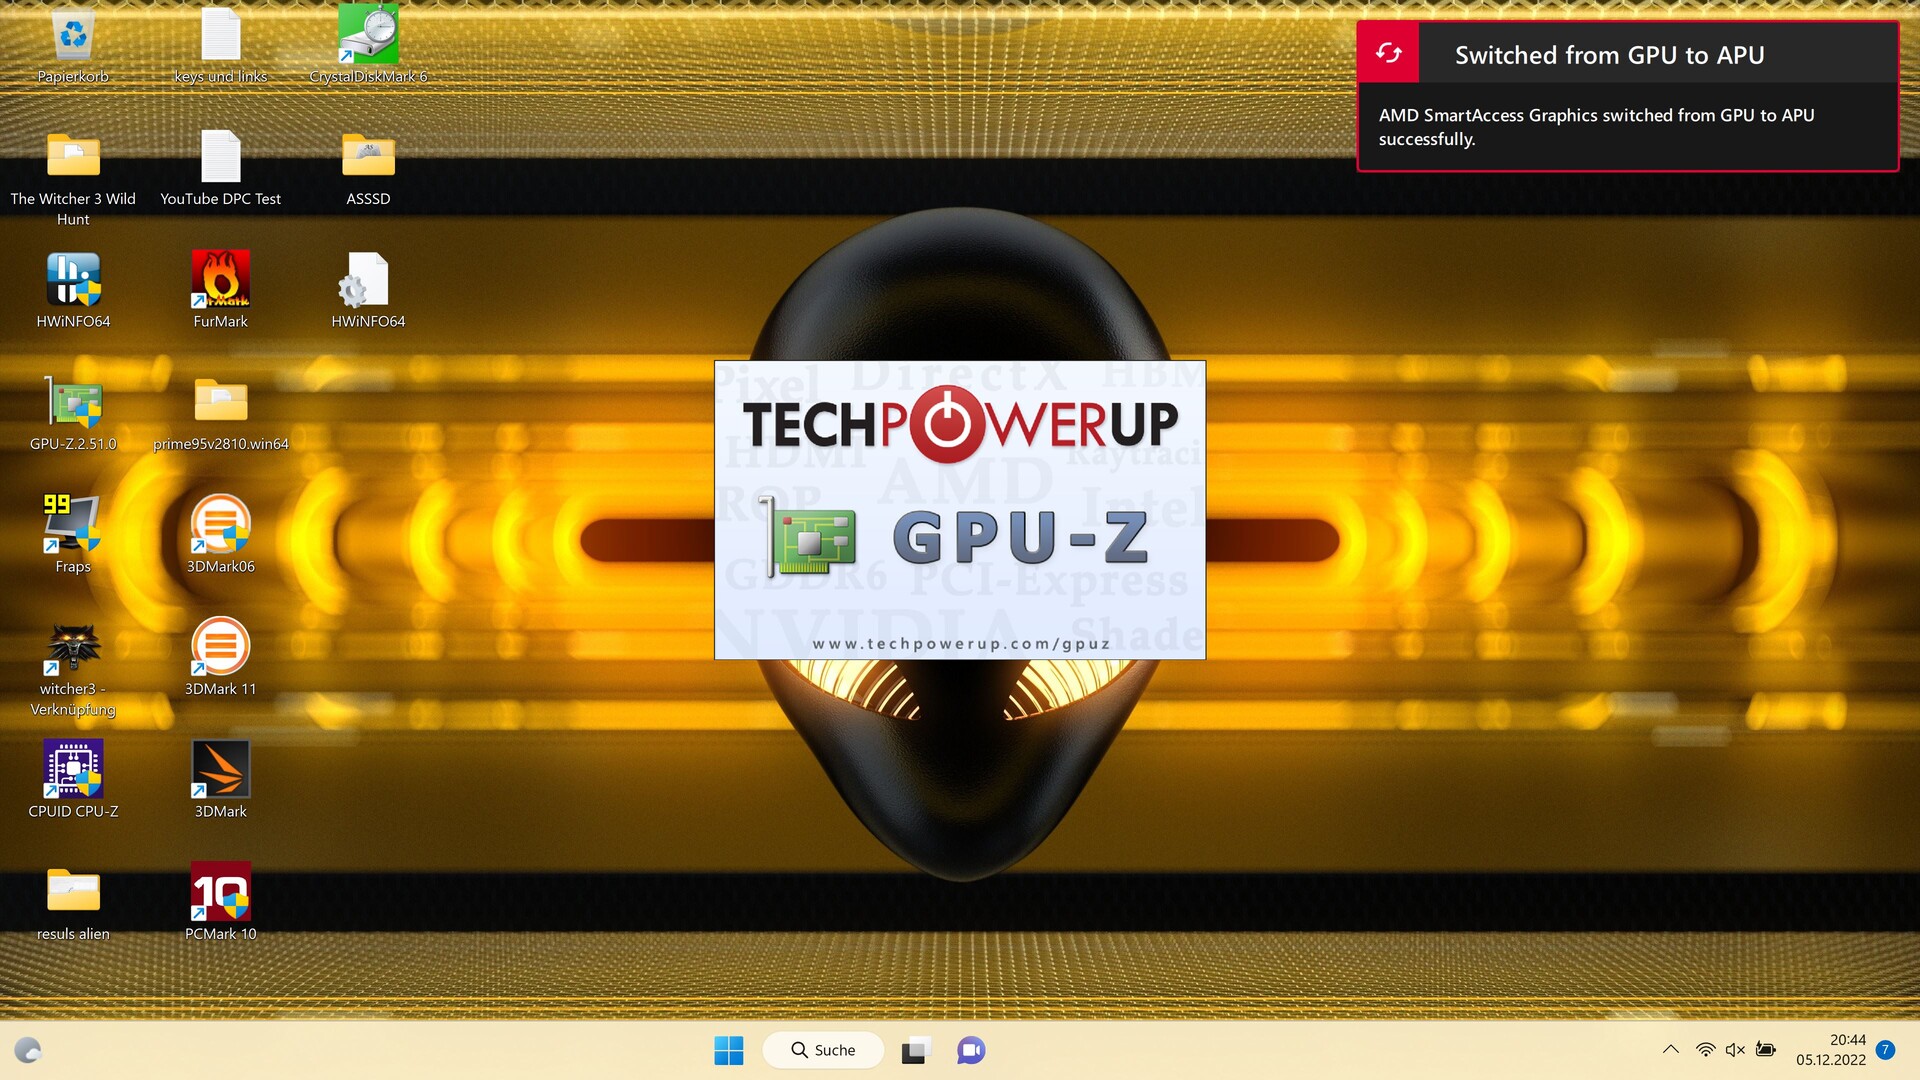
Além disso, a comutação gráfica automática da AMD não parece funcionar perfeitamente. Ao contrário do Optimus da Nvidia, o SmartAccess da AMD sempre fez com que o sistema ficasse pendurado por alguns segundos ao alternar entre a GPU integrada e a dedicada, o que foi realmente irritante. Esperamos que, em breve, apareçam soluções mais estáveis para o driver.
Processador
O AMD Ryzen 9 6900HX tem 8 núcleos Zen3+ que regram de 3,3 a 4,9 GHz e podem processar 16 roscas simultaneamente.
Em nossos testes de CPU, o processador AMD tem o desempenho esperado. Ele permanece sempre dentro da faixa de desvio de 1-2 por cento em comparação à média de todos os laptops testados com a mesma CPU.
O loop Cinebench R15 mostra que o desempenho é muito consistente. No entanto, ele fica aquém de sua Intel i9-12900HX contrapartida, e o i7-12700H no Acer Predator Helios 300 também é mais rápido.
O modo dedesempenho no Centro de Controle dificilmente faz diferença. Seja balanceado, de desempenho ou de velocidade total, o TDP é quase o mesmo em todas as execuções do CB-15.
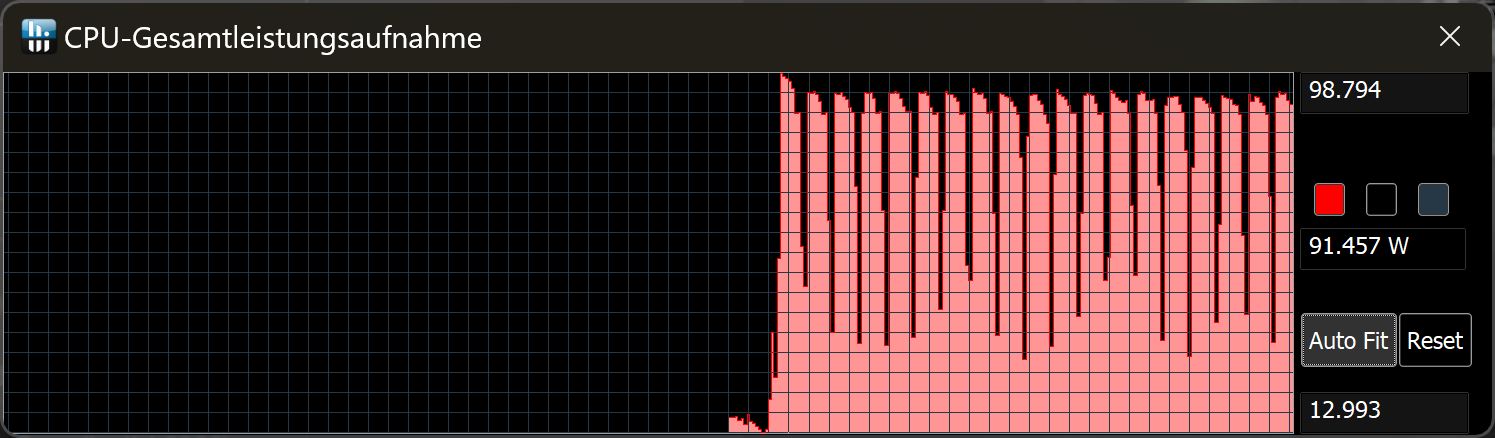
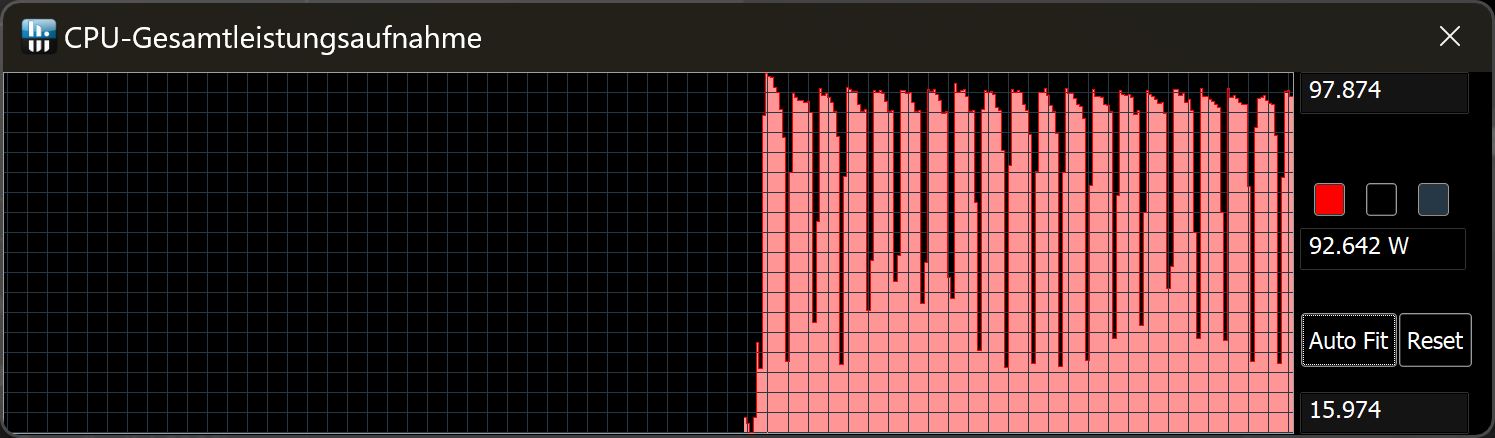
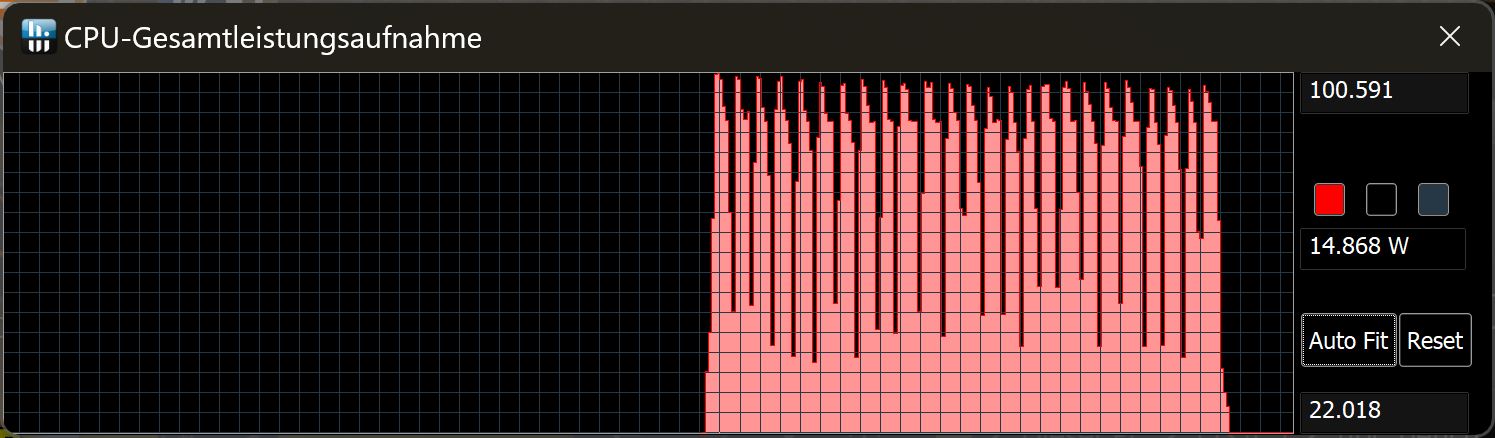
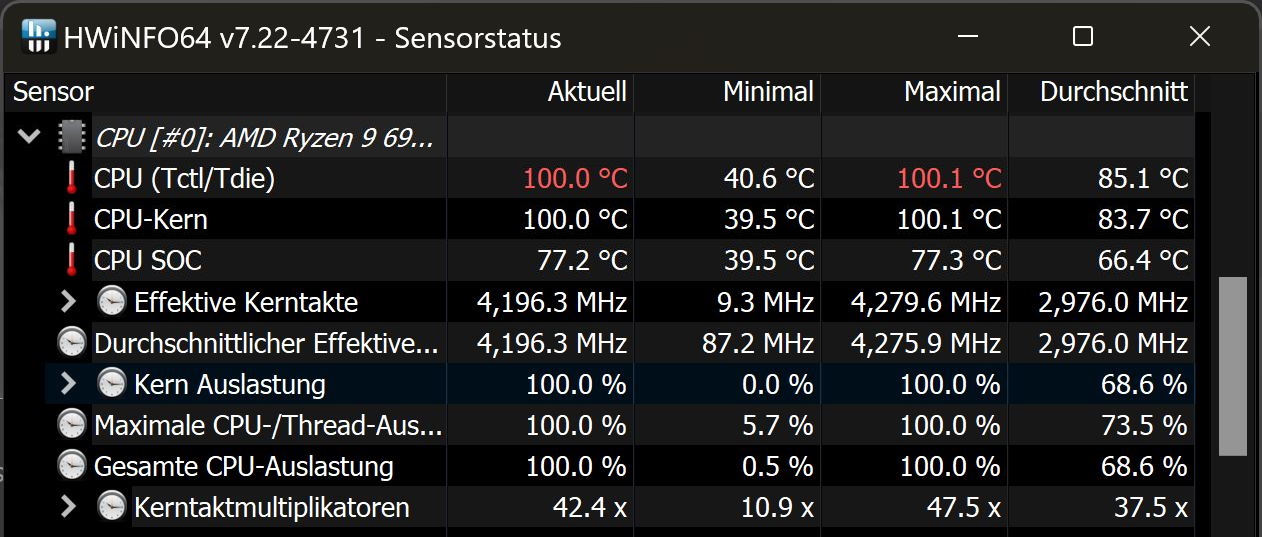
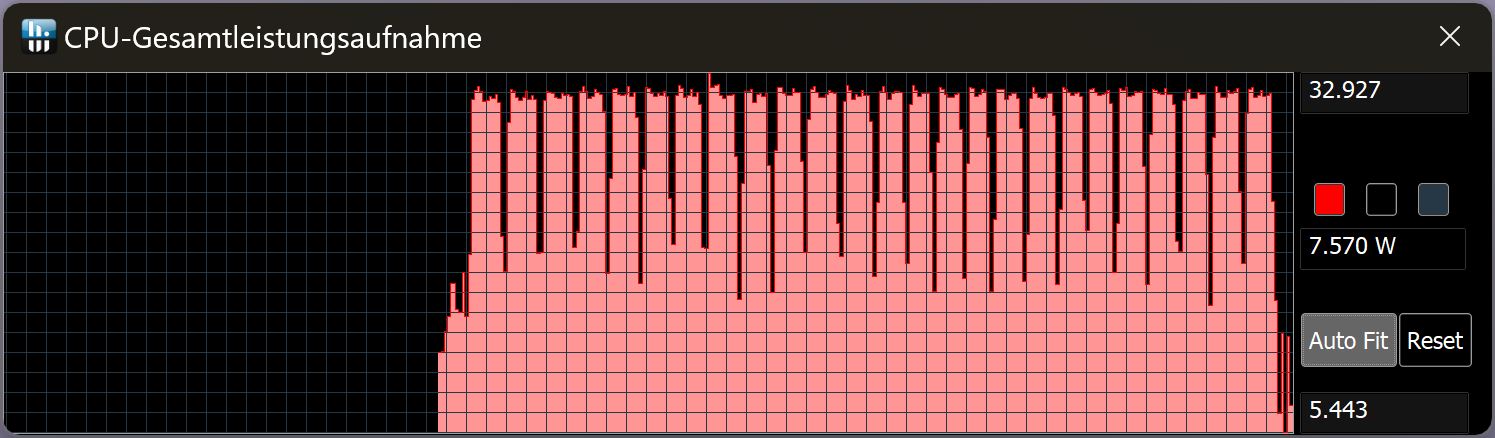
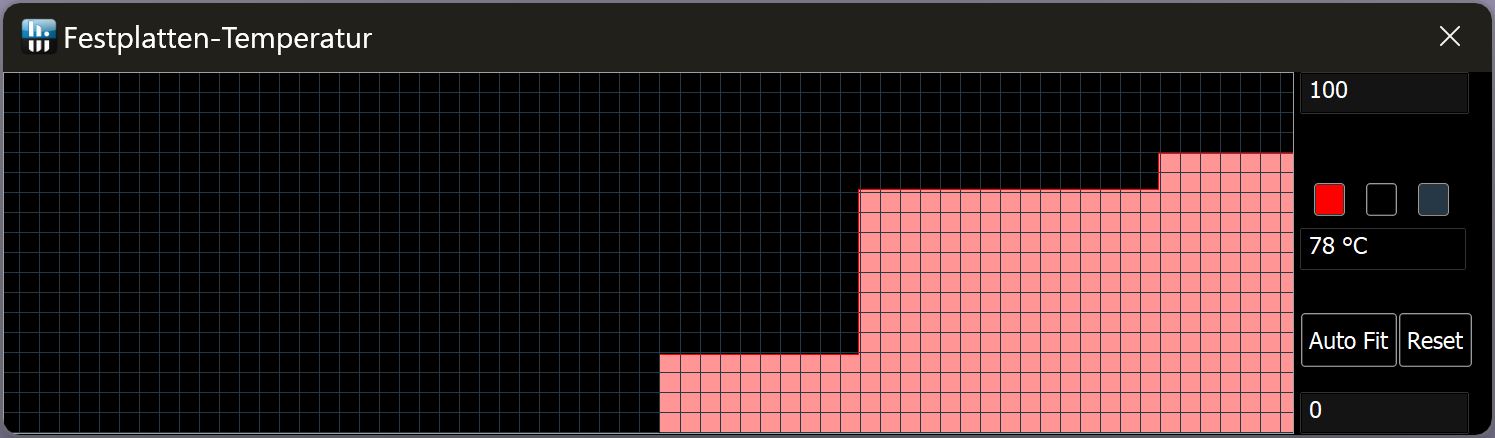
De acordo com a HWinfo, a CPU atingiu quase constantemente 100 °C durante uma corrida Cinebench, o que é muito alto.
Longe da tomada de energia, o desempenho da CPU cai cerca de 38% no Cinebench R15. Aqui o TDP é apenas um máximo de 32 W.
Cinebench R15 Multi Sustained Load
Cinebench R23: Multi Core | Single Core
Cinebench R20: CPU (Multi Core) | CPU (Single Core)
Cinebench R15: CPU Multi 64Bit | CPU Single 64Bit
Blender: v2.79 BMW27 CPU
7-Zip 18.03: 7z b 4 | 7z b 4 -mmt1
Geekbench 5.5: Multi-Core | Single-Core
HWBOT x265 Benchmark v2.2: 4k Preset
LibreOffice : 20 Documents To PDF
R Benchmark 2.5: Overall mean
| CPU Performance rating | |
| Média da turma Gaming | |
| Asus ROG Strix Scar 17 SE G733CX-LL014W | |
| Aorus 17X XES | |
| Acer Predator Helios 300 (i7-12700H, RTX 3070 Ti) | |
| Schenker XMG Neo 17 M22 | |
| Alienware m17 R5 (R9 6900HX, RX 6850M XT) | |
| Média AMD Ryzen 9 6900HX | |
| Alienware m17 R4 | |
| Cinebench R23 / Multi Core | |
| Média da turma Gaming (10488 - 42661, n=107, últimos 2 anos) | |
| Asus ROG Strix Scar 17 SE G733CX-LL014W | |
| Aorus 17X XES | |
| Acer Predator Helios 300 (i7-12700H, RTX 3070 Ti) | |
| Schenker XMG Neo 17 M22 | |
| Alienware m17 R5 (R9 6900HX, RX 6850M XT) | |
| Média AMD Ryzen 9 6900HX (9709 - 15100, n=19) | |
| Alienware m17 R4 | |
| Cinebench R23 / Single Core | |
| Média da turma Gaming (1166 - 2415, n=107, últimos 2 anos) | |
| Aorus 17X XES | |
| Asus ROG Strix Scar 17 SE G733CX-LL014W | |
| Acer Predator Helios 300 (i7-12700H, RTX 3070 Ti) | |
| Média AMD Ryzen 9 6900HX (1516 - 1616, n=19) | |
| Schenker XMG Neo 17 M22 | |
| Alienware m17 R5 (R9 6900HX, RX 6850M XT) | |
| Alienware m17 R4 | |
| Cinebench R20 / CPU (Multi Core) | |
| Média da turma Gaming (4029 - 16433, n=106, últimos 2 anos) | |
| Asus ROG Strix Scar 17 SE G733CX-LL014W | |
| Aorus 17X XES | |
| Acer Predator Helios 300 (i7-12700H, RTX 3070 Ti) | |
| Schenker XMG Neo 17 M22 | |
| Alienware m17 R5 (R9 6900HX, RX 6850M XT) | |
| Média AMD Ryzen 9 6900HX (3742 - 5813, n=19) | |
| Alienware m17 R4 | |
| Cinebench R20 / CPU (Single Core) | |
| Média da turma Gaming (442 - 913, n=106, últimos 2 anos) | |
| Asus ROG Strix Scar 17 SE G733CX-LL014W | |
| Aorus 17X XES | |
| Acer Predator Helios 300 (i7-12700H, RTX 3070 Ti) | |
| Alienware m17 R5 (R9 6900HX, RX 6850M XT) | |
| Média AMD Ryzen 9 6900HX (595 - 631, n=19) | |
| Schenker XMG Neo 17 M22 | |
| Alienware m17 R4 | |
| Cinebench R15 / CPU Multi 64Bit | |
| Média da turma Gaming (1578 - 6330, n=105, últimos 2 anos) | |
| Asus ROG Strix Scar 17 SE G733CX-LL014W | |
| Acer Predator Helios 300 (i7-12700H, RTX 3070 Ti) | |
| Aorus 17X XES | |
| Alienware m17 R5 (R9 6900HX, RX 6850M XT) | |
| Schenker XMG Neo 17 M22 | |
| Média AMD Ryzen 9 6900HX (1588 - 2411, n=19) | |
| Alienware m17 R4 | |
| Cinebench R15 / CPU Single 64Bit | |
| Média da turma Gaming (188.8 - 350, n=106, últimos 2 anos) | |
| Aorus 17X XES | |
| Asus ROG Strix Scar 17 SE G733CX-LL014W | |
| Acer Predator Helios 300 (i7-12700H, RTX 3070 Ti) | |
| Alienware m17 R5 (R9 6900HX, RX 6850M XT) | |
| Média AMD Ryzen 9 6900HX (241 - 261, n=19) | |
| Schenker XMG Neo 17 M22 | |
| Alienware m17 R4 | |
| Blender / v2.79 BMW27 CPU | |
| Alienware m17 R4 | |
| Média AMD Ryzen 9 6900HX (212 - 357, n=21) | |
| Alienware m17 R5 (R9 6900HX, RX 6850M XT) | |
| Schenker XMG Neo 17 M22 | |
| Acer Predator Helios 300 (i7-12700H, RTX 3070 Ti) | |
| Aorus 17X XES | |
| Asus ROG Strix Scar 17 SE G733CX-LL014W | |
| Média da turma Gaming (79 - 330, n=104, últimos 2 anos) | |
| 7-Zip 18.03 / 7z b 4 | |
| Média da turma Gaming (33491 - 148086, n=105, últimos 2 anos) | |
| Asus ROG Strix Scar 17 SE G733CX-LL014W | |
| Aorus 17X XES | |
| Acer Predator Helios 300 (i7-12700H, RTX 3070 Ti) | |
| Schenker XMG Neo 17 M22 | |
| Alienware m17 R5 (R9 6900HX, RX 6850M XT) | |
| Média AMD Ryzen 9 6900HX (49526 - 65336, n=20) | |
| Alienware m17 R4 | |
| 7-Zip 18.03 / 7z b 4 -mmt1 | |
| Média da turma Gaming (4199 - 7436, n=105, últimos 2 anos) | |
| Aorus 17X XES | |
| Asus ROG Strix Scar 17 SE G733CX-LL014W | |
| Schenker XMG Neo 17 M22 | |
| Média AMD Ryzen 9 6900HX (5090 - 6070, n=20) | |
| Acer Predator Helios 300 (i7-12700H, RTX 3070 Ti) | |
| Alienware m17 R5 (R9 6900HX, RX 6850M XT) | |
| Alienware m17 R4 | |
| Geekbench 5.5 / Multi-Core | |
| Média da turma Gaming (6460 - 28263, n=105, últimos 2 anos) | |
| Asus ROG Strix Scar 17 SE G733CX-LL014W | |
| Aorus 17X XES | |
| Acer Predator Helios 300 (i7-12700H, RTX 3070 Ti) | |
| Schenker XMG Neo 17 M22 | |
| Alienware m17 R5 (R9 6900HX, RX 6850M XT) | |
| Média AMD Ryzen 9 6900HX (8313 - 10490, n=21) | |
| Alienware m17 R4 | |
| Geekbench 5.5 / Single-Core | |
| Média da turma Gaming (986 - 2474, n=105, últimos 2 anos) | |
| Aorus 17X XES | |
| Asus ROG Strix Scar 17 SE G733CX-LL014W | |
| Acer Predator Helios 300 (i7-12700H, RTX 3070 Ti) | |
| Schenker XMG Neo 17 M22 | |
| Média AMD Ryzen 9 6900HX (1523 - 1652, n=21) | |
| Alienware m17 R5 (R9 6900HX, RX 6850M XT) | |
| Alienware m17 R4 | |
| HWBOT x265 Benchmark v2.2 / 4k Preset | |
| Média da turma Gaming (11.5 - 44.4, n=105, últimos 2 anos) | |
| Asus ROG Strix Scar 17 SE G733CX-LL014W | |
| Aorus 17X XES | |
| Schenker XMG Neo 17 M22 | |
| Alienware m17 R5 (R9 6900HX, RX 6850M XT) | |
| Média AMD Ryzen 9 6900HX (12.6 - 18.7, n=20) | |
| Acer Predator Helios 300 (i7-12700H, RTX 3070 Ti) | |
| Alienware m17 R4 | |
| LibreOffice / 20 Documents To PDF | |
| Acer Predator Helios 300 (i7-12700H, RTX 3070 Ti) | |
| Alienware m17 R5 (R9 6900HX, RX 6850M XT) | |
| Schenker XMG Neo 17 M22 | |
| Média AMD Ryzen 9 6900HX (44.8 - 81.7, n=20) | |
| Alienware m17 R4 | |
| Média da turma Gaming (33.2 - 88.8, n=105, últimos 2 anos) | |
| Aorus 17X XES | |
| Asus ROG Strix Scar 17 SE G733CX-LL014W | |
| R Benchmark 2.5 / Overall mean | |
| Alienware m17 R4 | |
| Alienware m17 R5 (R9 6900HX, RX 6850M XT) | |
| Média AMD Ryzen 9 6900HX (0.4627 - 0.4974, n=20) | |
| Schenker XMG Neo 17 M22 | |
| Acer Predator Helios 300 (i7-12700H, RTX 3070 Ti) | |
| Média da turma Gaming (0.3439 - 0.759, n=106, últimos 2 anos) | |
| Asus ROG Strix Scar 17 SE G733CX-LL014W | |
| Aorus 17X XES | |
* ... menor é melhor
AIDA64: FP32 Ray-Trace | FPU Julia | CPU SHA3 | CPU Queen | FPU SinJulia | FPU Mandel | CPU AES | CPU ZLib | FP64 Ray-Trace | CPU PhotoWorxx
| Performance rating | |
| Média da turma Gaming | |
| Asus ROG Strix Scar 17 SE G733CX-LL014W | |
| Schenker XMG Neo 17 M22 | |
| Acer Predator Helios 300 (i7-12700H, RTX 3070 Ti) | |
| Aorus 17X XES | |
| Média AMD Ryzen 9 6900HX | |
| Alienware m17 R5 (R9 6900HX, RX 6850M XT) | |
| Alienware m17 R4 | |
| AIDA64 / FP32 Ray-Trace | |
| Média da turma Gaming (10227 - 85542, n=105, últimos 2 anos) | |
| Asus ROG Strix Scar 17 SE G733CX-LL014W | |
| Acer Predator Helios 300 (i7-12700H, RTX 3070 Ti) | |
| Alienware m17 R5 (R9 6900HX, RX 6850M XT) | |
| Schenker XMG Neo 17 M22 | |
| Média AMD Ryzen 9 6900HX (10950 - 17963, n=20) | |
| Aorus 17X XES | |
| Alienware m17 R4 | |
| AIDA64 / FPU Julia | |
| Média da turma Gaming (51376 - 238426, n=105, últimos 2 anos) | |
| Alienware m17 R5 (R9 6900HX, RX 6850M XT) | |
| Schenker XMG Neo 17 M22 | |
| Média AMD Ryzen 9 6900HX (71414 - 110797, n=20) | |
| Acer Predator Helios 300 (i7-12700H, RTX 3070 Ti) | |
| Asus ROG Strix Scar 17 SE G733CX-LL014W | |
| Aorus 17X XES | |
| Alienware m17 R4 | |
| AIDA64 / CPU SHA3 | |
| Média da turma Gaming (2180 - 10115, n=105, últimos 2 anos) | |
| Asus ROG Strix Scar 17 SE G733CX-LL014W | |
| Acer Predator Helios 300 (i7-12700H, RTX 3070 Ti) | |
| Alienware m17 R4 | |
| Aorus 17X XES | |
| Alienware m17 R5 (R9 6900HX, RX 6850M XT) | |
| Schenker XMG Neo 17 M22 | |
| Média AMD Ryzen 9 6900HX (2471 - 3804, n=20) | |
| AIDA64 / CPU Queen | |
| Média da turma Gaming (49785 - 173351, n=90, últimos 2 anos) | |
| Alienware m17 R5 (R9 6900HX, RX 6850M XT) | |
| Aorus 17X XES | |
| Asus ROG Strix Scar 17 SE G733CX-LL014W | |
| Acer Predator Helios 300 (i7-12700H, RTX 3070 Ti) | |
| Schenker XMG Neo 17 M22 | |
| Média AMD Ryzen 9 6900HX (84185 - 107544, n=20) | |
| Alienware m17 R4 | |
| AIDA64 / FPU SinJulia | |
| Média da turma Gaming (4424 - 33636, n=105, últimos 2 anos) | |
| Alienware m17 R5 (R9 6900HX, RX 6850M XT) | |
| Schenker XMG Neo 17 M22 | |
| Média AMD Ryzen 9 6900HX (10970 - 13205, n=20) | |
| Asus ROG Strix Scar 17 SE G733CX-LL014W | |
| Aorus 17X XES | |
| Alienware m17 R4 | |
| Acer Predator Helios 300 (i7-12700H, RTX 3070 Ti) | |
| AIDA64 / FPU Mandel | |
| Média da turma Gaming (25115 - 128721, n=105, últimos 2 anos) | |
| Alienware m17 R5 (R9 6900HX, RX 6850M XT) | |
| Schenker XMG Neo 17 M22 | |
| Média AMD Ryzen 9 6900HX (39164 - 61370, n=20) | |
| Acer Predator Helios 300 (i7-12700H, RTX 3070 Ti) | |
| Asus ROG Strix Scar 17 SE G733CX-LL014W | |
| Aorus 17X XES | |
| Alienware m17 R4 | |
| AIDA64 / CPU AES | |
| Asus ROG Strix Scar 17 SE G733CX-LL014W | |
| Schenker XMG Neo 17 M22 | |
| Aorus 17X XES | |
| Média AMD Ryzen 9 6900HX (54613 - 142360, n=20) | |
| Média da turma Gaming (39258 - 247074, n=105, últimos 2 anos) | |
| Acer Predator Helios 300 (i7-12700H, RTX 3070 Ti) | |
| Alienware m17 R5 (R9 6900HX, RX 6850M XT) | |
| Alienware m17 R4 | |
| AIDA64 / CPU ZLib | |
| Média da turma Gaming (574 - 2531, n=105, últimos 2 anos) | |
| Asus ROG Strix Scar 17 SE G733CX-LL014W | |
| Acer Predator Helios 300 (i7-12700H, RTX 3070 Ti) | |
| Aorus 17X XES | |
| Alienware m17 R5 (R9 6900HX, RX 6850M XT) | |
| Schenker XMG Neo 17 M22 | |
| Média AMD Ryzen 9 6900HX (578 - 911, n=20) | |
| Alienware m17 R4 | |
| AIDA64 / FP64 Ray-Trace | |
| Média da turma Gaming (5509 - 45446, n=105, últimos 2 anos) | |
| Acer Predator Helios 300 (i7-12700H, RTX 3070 Ti) | |
| Asus ROG Strix Scar 17 SE G733CX-LL014W | |
| Alienware m17 R5 (R9 6900HX, RX 6850M XT) | |
| Schenker XMG Neo 17 M22 | |
| Aorus 17X XES | |
| Média AMD Ryzen 9 6900HX (5798 - 9540, n=20) | |
| Alienware m17 R4 | |
| AIDA64 / CPU PhotoWorxx | |
| Média da turma Gaming (12271 - 89891, n=105, últimos 2 anos) | |
| Asus ROG Strix Scar 17 SE G733CX-LL014W | |
| Aorus 17X XES | |
| Acer Predator Helios 300 (i7-12700H, RTX 3070 Ti) | |
| Alienware m17 R5 (R9 6900HX, RX 6850M XT) | |
| Schenker XMG Neo 17 M22 | |
| Média AMD Ryzen 9 6900HX (26873 - 30604, n=20) | |
| Alienware m17 R4 | |
Desempenho do sistema
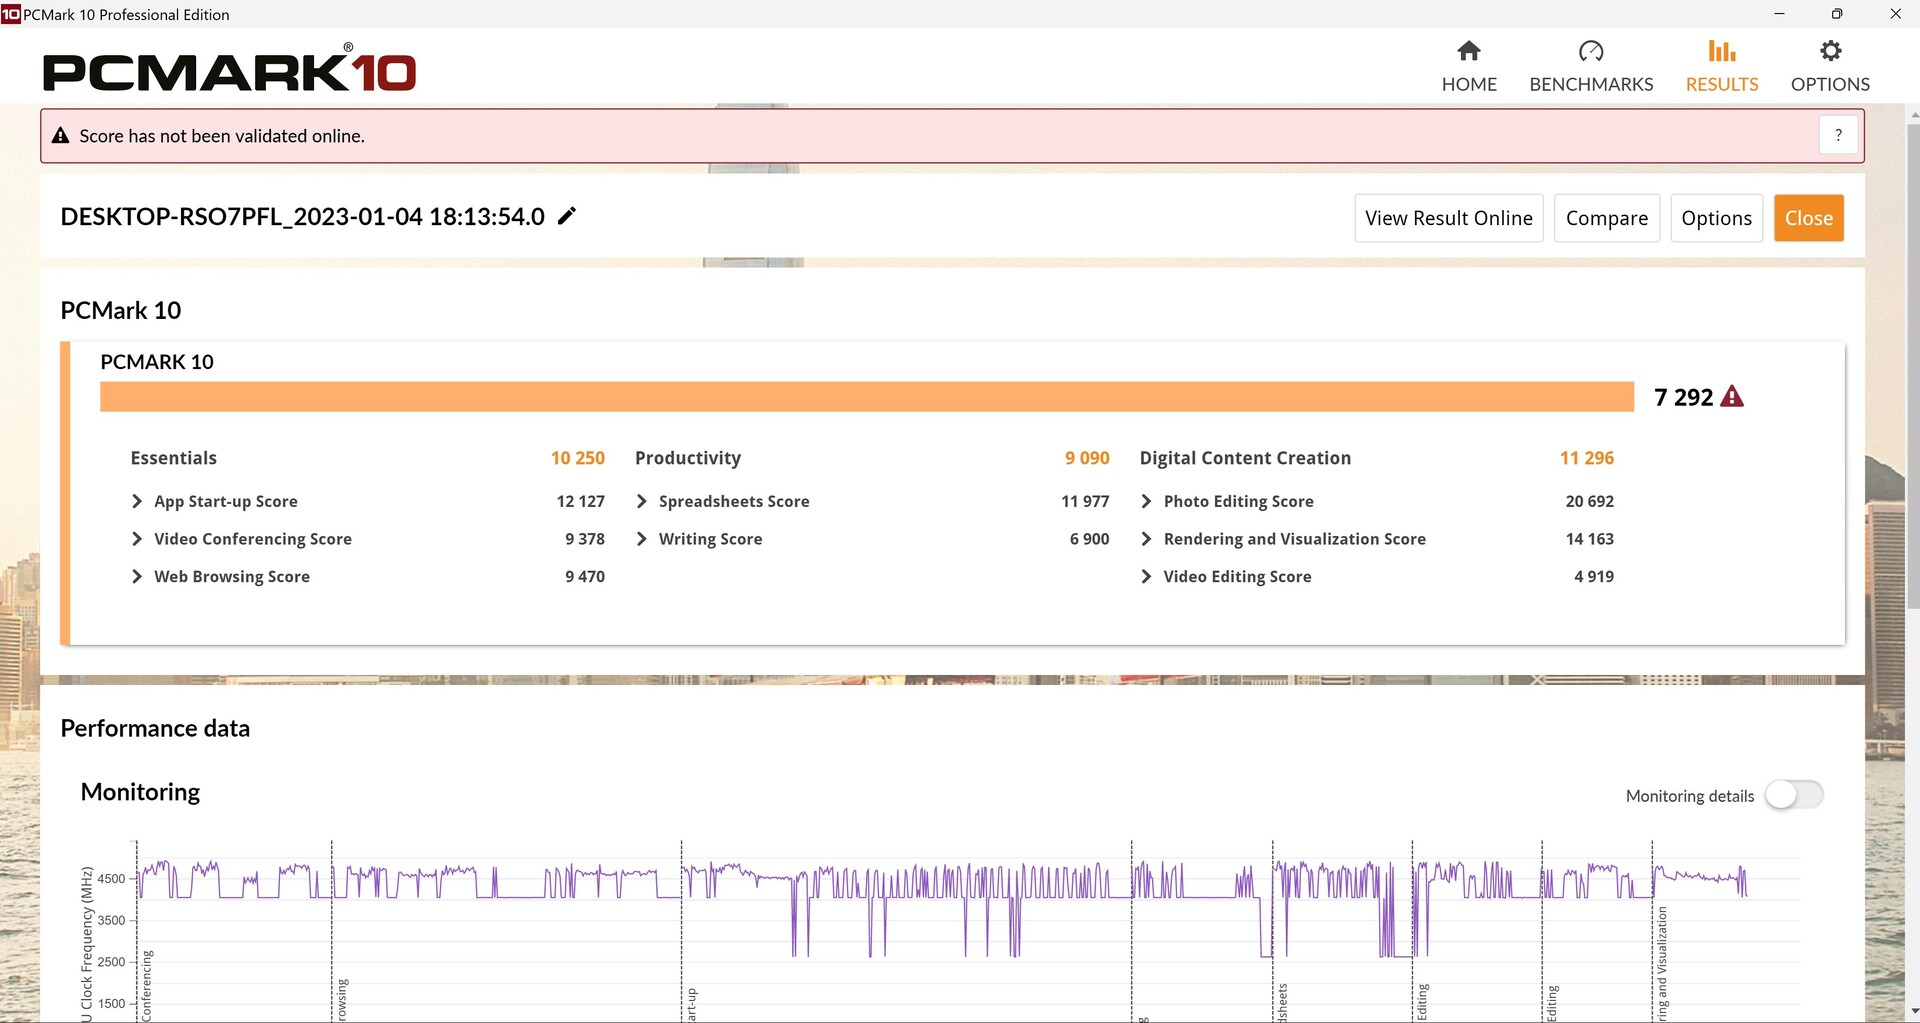
O desempenho no PCMark 10 também é quase exatamente o esperado. Na seção "Produtividade", os cartões AMD geralmente têm um desempenho pior do que os laptops com GPUs Nvidia, mas em geral o m17 R5 cai no meio entre seus concorrentes.
CrossMark: Overall | Productivity | Creativity | Responsiveness
| PCMark 10 / Score | |
| Média da turma Gaming (5828 - 12414, n=93, últimos 2 anos) | |
| Aorus 17X XES | |
| Acer Predator Helios 300 (i7-12700H, RTX 3070 Ti) | |
| Média AMD Ryzen 9 6900HX, AMD Radeon RX 6850M XT (7292 - 7377, n=2) | |
| Alienware m17 R5 (R9 6900HX, RX 6850M XT) | |
| Asus ROG Strix Scar 17 SE G733CX-LL014W | |
| Schenker XMG Neo 17 M22 | |
| Alienware m17 R4 | |
| PCMark 10 / Essentials | |
| Acer Predator Helios 300 (i7-12700H, RTX 3070 Ti) | |
| Média da turma Gaming (8810 - 11935, n=97, últimos 2 anos) | |
| Aorus 17X XES | |
| Média AMD Ryzen 9 6900HX, AMD Radeon RX 6850M XT (10250 - 10521, n=2) | |
| Asus ROG Strix Scar 17 SE G733CX-LL014W | |
| Alienware m17 R5 (R9 6900HX, RX 6850M XT) | |
| Schenker XMG Neo 17 M22 | |
| Alienware m17 R4 | |
| PCMark 10 / Productivity | |
| Média da turma Gaming (6845 - 25323, n=95, últimos 2 anos) | |
| Aorus 17X XES | |
| Acer Predator Helios 300 (i7-12700H, RTX 3070 Ti) | |
| Asus ROG Strix Scar 17 SE G733CX-LL014W | |
| Schenker XMG Neo 17 M22 | |
| Média AMD Ryzen 9 6900HX, AMD Radeon RX 6850M XT (9090 - 9097, n=2) | |
| Alienware m17 R5 (R9 6900HX, RX 6850M XT) | |
| Alienware m17 R4 | |
| PCMark 10 / Digital Content Creation | |
| Média da turma Gaming (7602 - 19954, n=95, últimos 2 anos) | |
| Acer Predator Helios 300 (i7-12700H, RTX 3070 Ti) | |
| Aorus 17X XES | |
| Média AMD Ryzen 9 6900HX, AMD Radeon RX 6850M XT (11296 - 11385, n=2) | |
| Alienware m17 R5 (R9 6900HX, RX 6850M XT) | |
| Asus ROG Strix Scar 17 SE G733CX-LL014W | |
| Schenker XMG Neo 17 M22 | |
| Alienware m17 R4 | |
| CrossMark / Overall | |
| Aorus 17X XES | |
| Asus ROG Strix Scar 17 SE G733CX-LL014W | |
| Média da turma Gaming (1366 - 2409, n=94, últimos 2 anos) | |
| Acer Predator Helios 300 (i7-12700H, RTX 3070 Ti) | |
| Schenker XMG Neo 17 M22 | |
| Alienware m17 R5 (R9 6900HX, RX 6850M XT) | |
| Média AMD Ryzen 9 6900HX, AMD Radeon RX 6850M XT (1596 - 1597, n=2) | |
| CrossMark / Productivity | |
| Aorus 17X XES | |
| Asus ROG Strix Scar 17 SE G733CX-LL014W | |
| Média da turma Gaming (1386 - 2254, n=94, últimos 2 anos) | |
| Acer Predator Helios 300 (i7-12700H, RTX 3070 Ti) | |
| Schenker XMG Neo 17 M22 | |
| Alienware m17 R5 (R9 6900HX, RX 6850M XT) | |
| Média AMD Ryzen 9 6900HX, AMD Radeon RX 6850M XT (1551 - 1565, n=2) | |
| CrossMark / Creativity | |
| Asus ROG Strix Scar 17 SE G733CX-LL014W | |
| Aorus 17X XES | |
| Média da turma Gaming (1343 - 2786, n=94, últimos 2 anos) | |
| Acer Predator Helios 300 (i7-12700H, RTX 3070 Ti) | |
| Schenker XMG Neo 17 M22 | |
| Média AMD Ryzen 9 6900HX, AMD Radeon RX 6850M XT (1738 - 1754, n=2) | |
| Alienware m17 R5 (R9 6900HX, RX 6850M XT) | |
| CrossMark / Responsiveness | |
| Aorus 17X XES | |
| Asus ROG Strix Scar 17 SE G733CX-LL014W | |
| Acer Predator Helios 300 (i7-12700H, RTX 3070 Ti) | |
| Média da turma Gaming (1226 - 2334, n=94, últimos 2 anos) | |
| Schenker XMG Neo 17 M22 | |
| Alienware m17 R5 (R9 6900HX, RX 6850M XT) | |
| Média AMD Ryzen 9 6900HX, AMD Radeon RX 6850M XT (1310 - 1315, n=2) | |
| PCMark 10 Score | 7292 pontos | |
Ajuda | ||
| AIDA64 / Memory Copy | |
| Média da turma Gaming (21750 - 129946, n=105, últimos 2 anos) | |
| Asus ROG Strix Scar 17 SE G733CX-LL014W | |
| Aorus 17X XES | |
| Acer Predator Helios 300 (i7-12700H, RTX 3070 Ti) | |
| Média AMD Ryzen 9 6900HX (47938 - 53345, n=20) | |
| Alienware m17 R5 (R9 6900HX, RX 6850M XT) | |
| Schenker XMG Neo 17 M22 | |
| Alienware m17 R4 | |
| AIDA64 / Memory Read | |
| Média da turma Gaming (22956 - 118858, n=105, últimos 2 anos) | |
| Asus ROG Strix Scar 17 SE G733CX-LL014W | |
| Aorus 17X XES | |
| Acer Predator Helios 300 (i7-12700H, RTX 3070 Ti) | |
| Schenker XMG Neo 17 M22 | |
| Média AMD Ryzen 9 6900HX (43892 - 53321, n=20) | |
| Alienware m17 R5 (R9 6900HX, RX 6850M XT) | |
| Alienware m17 R4 | |
| AIDA64 / Memory Write | |
| Média da turma Gaming (22297 - 135096, n=105, últimos 2 anos) | |
| Asus ROG Strix Scar 17 SE G733CX-LL014W | |
| Aorus 17X XES | |
| Acer Predator Helios 300 (i7-12700H, RTX 3070 Ti) | |
| Schenker XMG Neo 17 M22 | |
| Alienware m17 R5 (R9 6900HX, RX 6850M XT) | |
| Média AMD Ryzen 9 6900HX (51085 - 57202, n=20) | |
| Alienware m17 R4 | |
| AIDA64 / Memory Latency | |
| Média da turma Gaming (75.3 - 259, n=105, últimos 2 anos) | |
| Alienware m17 R5 (R9 6900HX, RX 6850M XT) | |
| Acer Predator Helios 300 (i7-12700H, RTX 3070 Ti) | |
| Schenker XMG Neo 17 M22 | |
| Média AMD Ryzen 9 6900HX (80.7 - 120.6, n=20) | |
| Aorus 17X XES | |
| Asus ROG Strix Scar 17 SE G733CX-LL014W | |
| Alienware m17 R4 | |
* ... menor é melhor
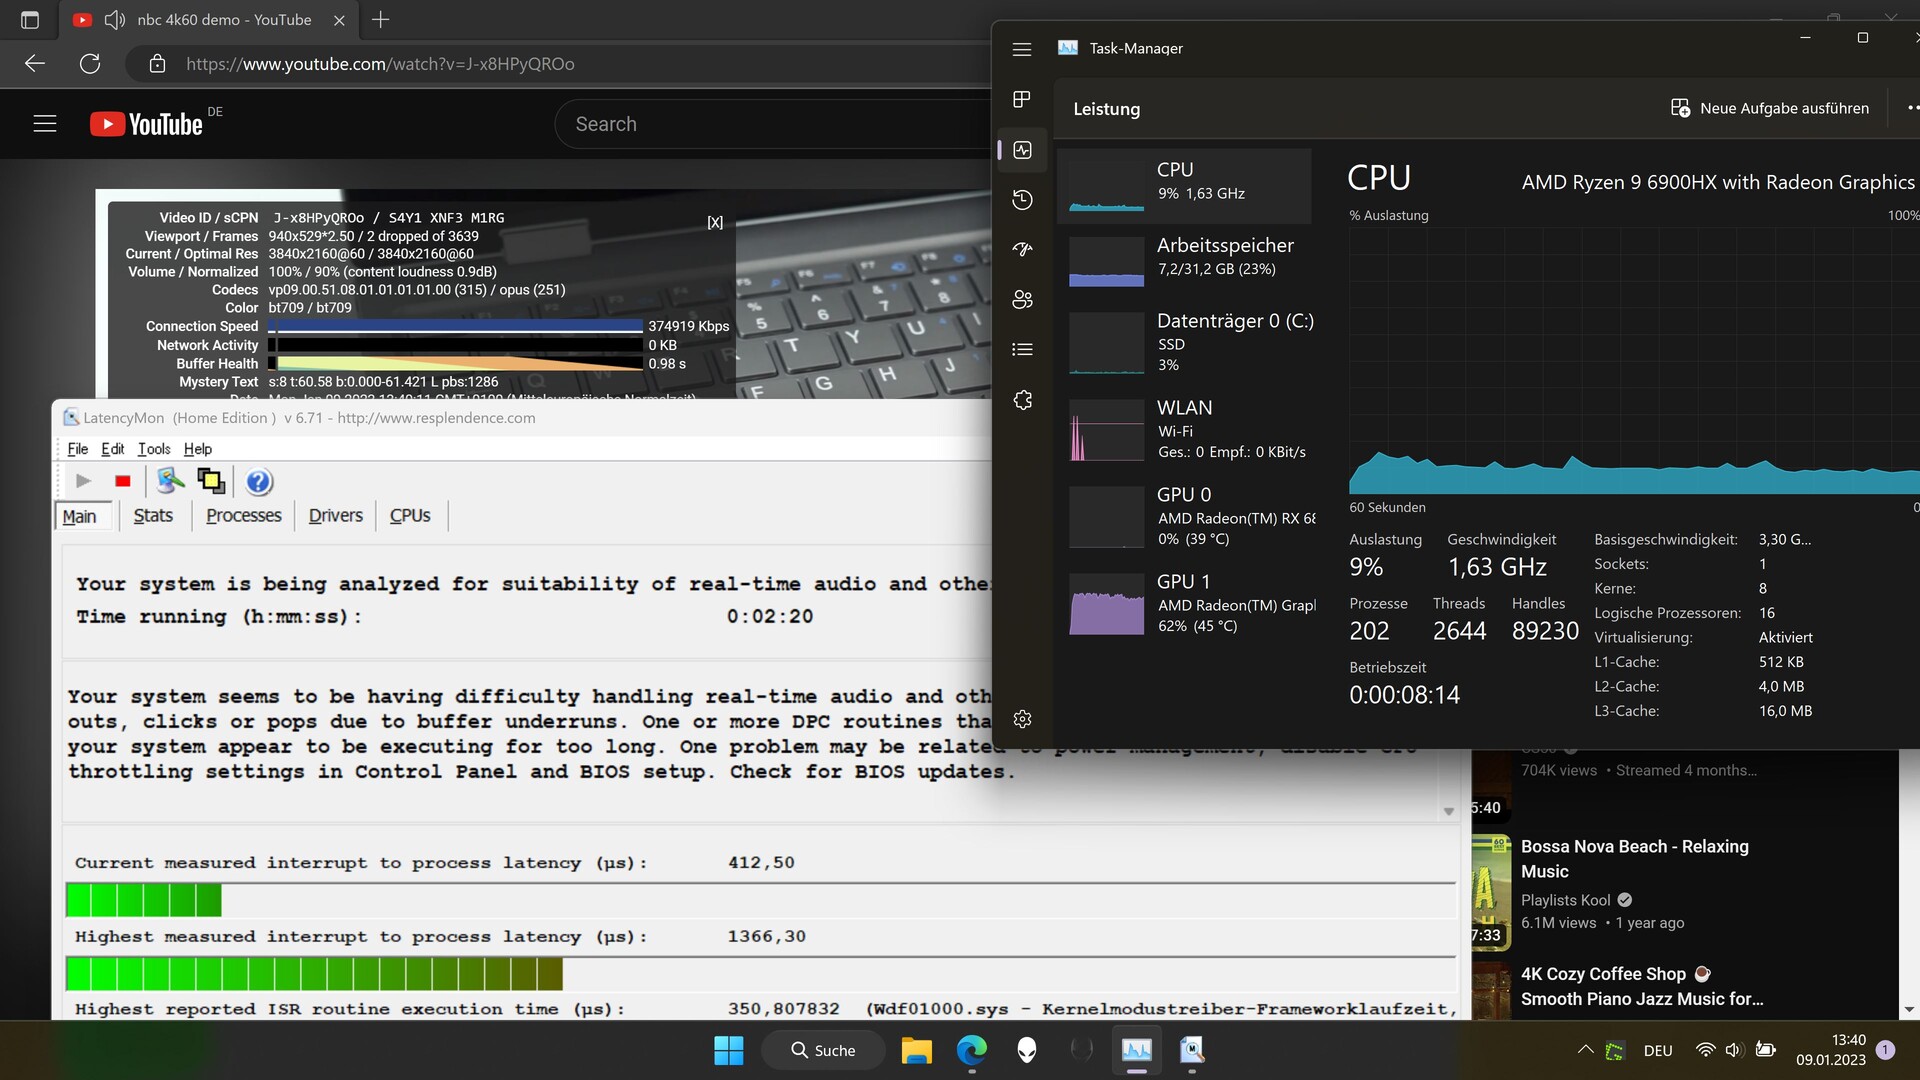
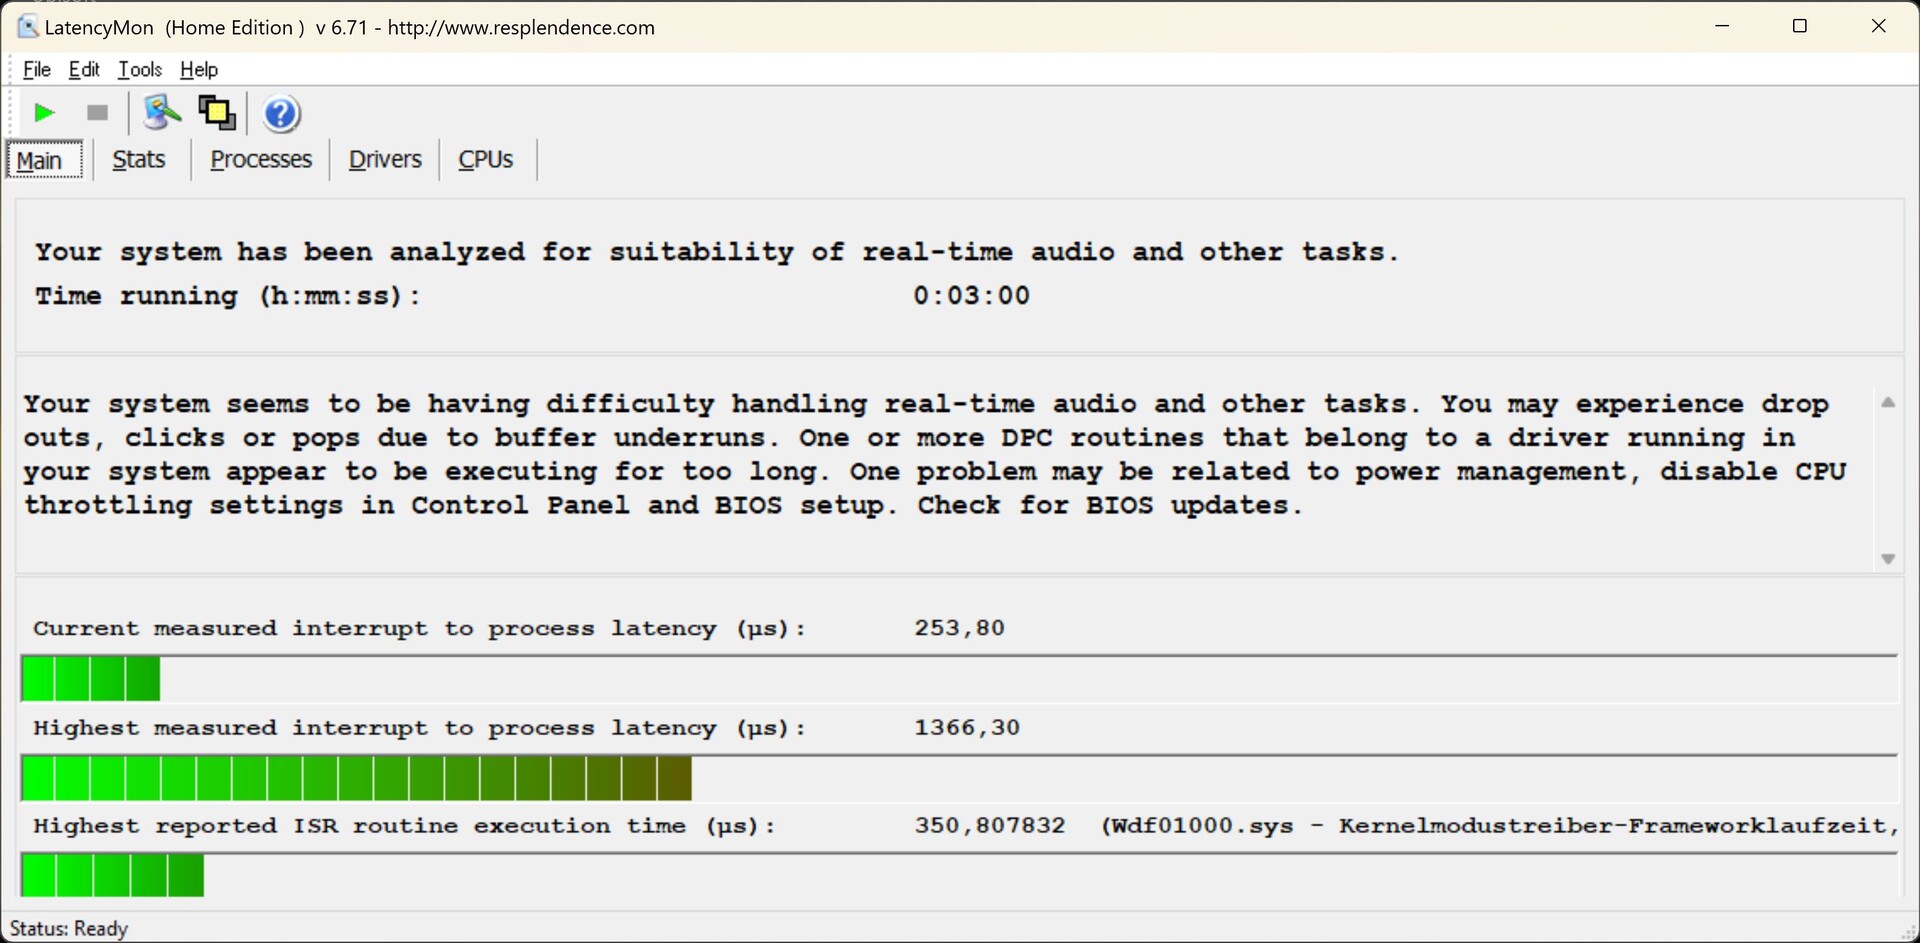
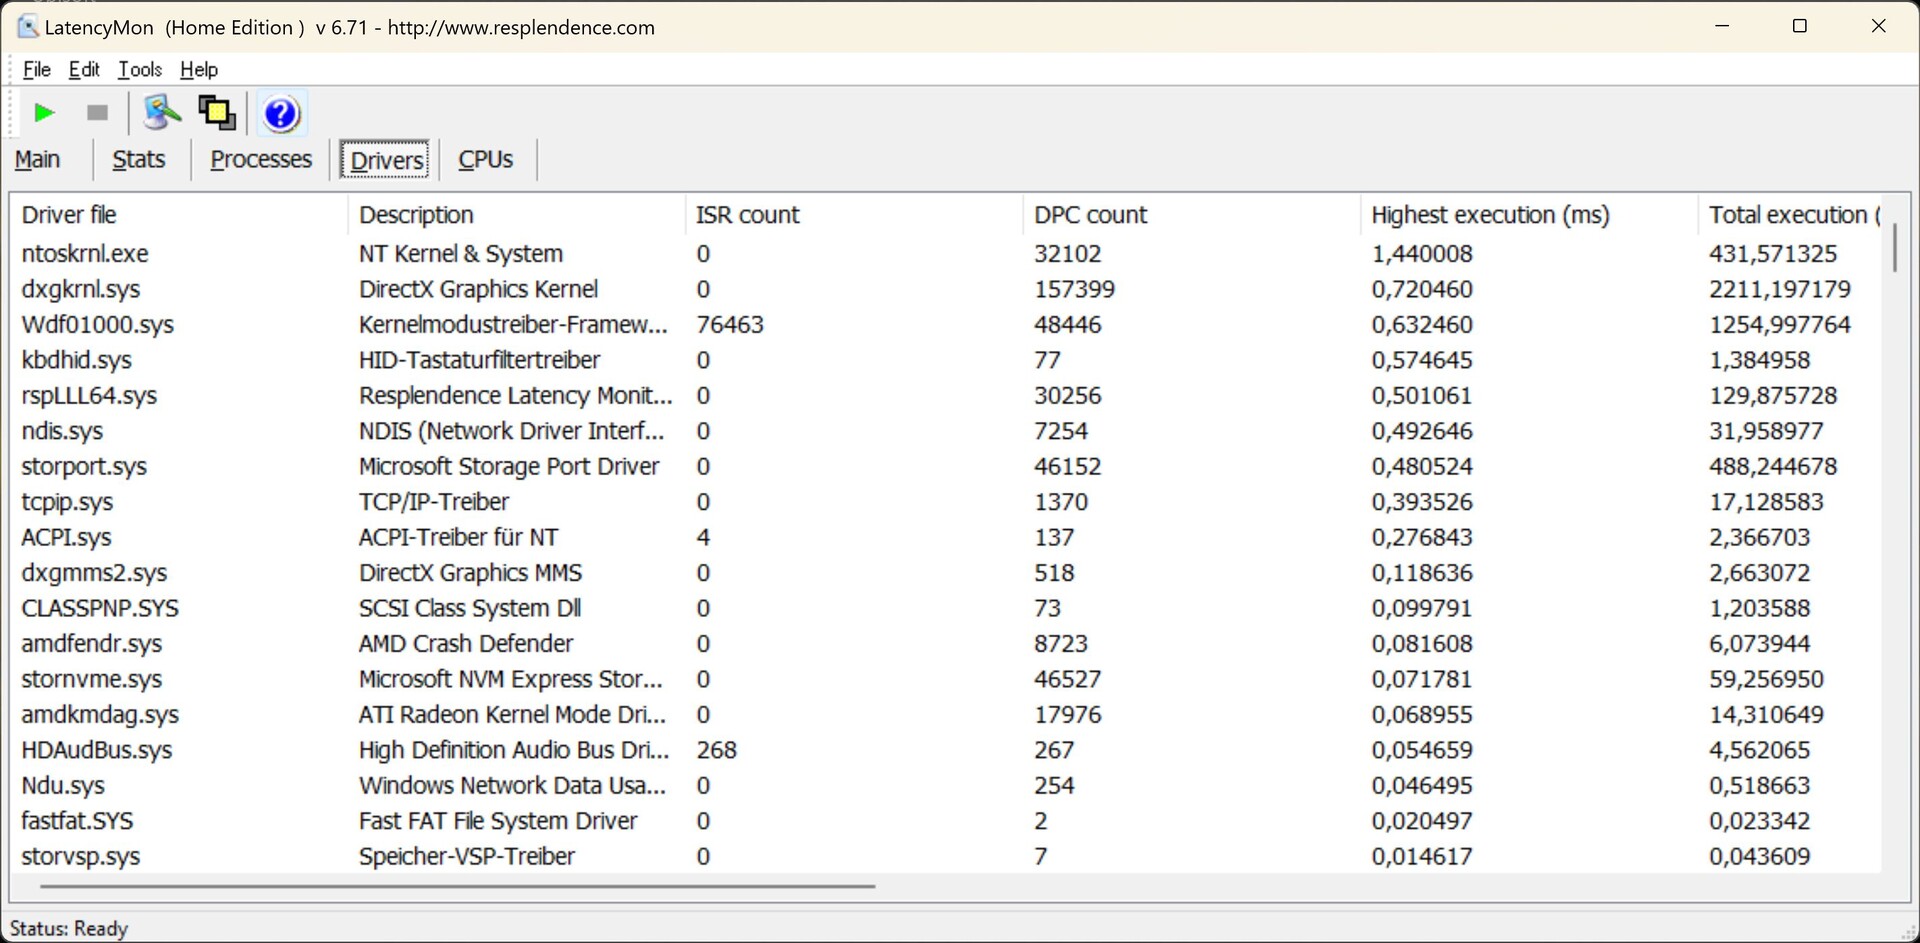
Latência do DPC
O Alienware não suou ao abrir o navegador Edge, mas mesmo abrindo nossa página inicial do Notebookcheck levou a latências no laptop. O kernel e os drivers DirectX parecem ser os culpados, entre outras coisas. Também neste caso, alguns concorrentes têm valores de latência ainda mais altos.
Ao reproduzir nosso vídeo de 4K/60 fps no YouTube, houve 2 quedas de quadros e uma carga bastante alta na GPU interna.
| DPC Latencies / LatencyMon - interrupt to process latency (max), Web, Youtube, Prime95 | |
| Schenker XMG Neo 17 M22 | |
| Asus ROG Strix Scar 17 SE G733CX-LL014W | |
| Acer Predator Helios 300 (i7-12700H, RTX 3070 Ti) | |
| Alienware m17 R5 (R9 6900HX, RX 6850M XT) | |
| Aorus 17X XES | |
| Alienware m17 R4 | |
* ... menor é melhor
Dispositivos de armazenamento
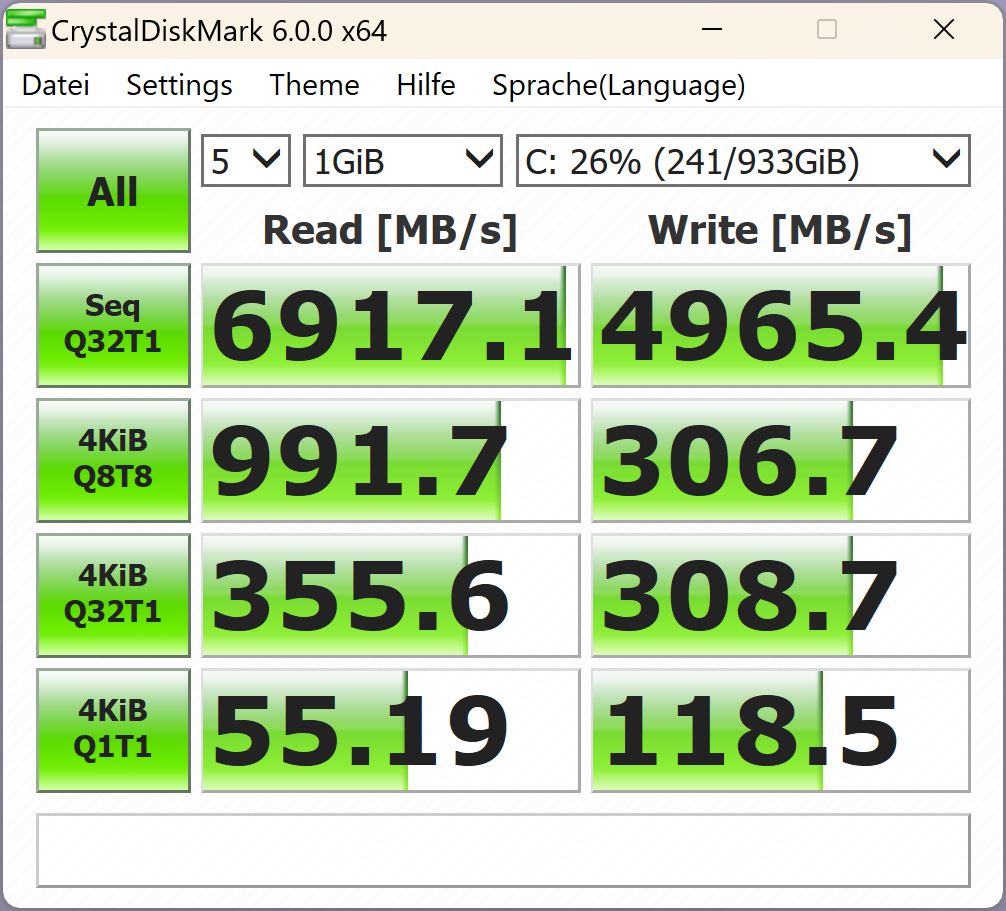
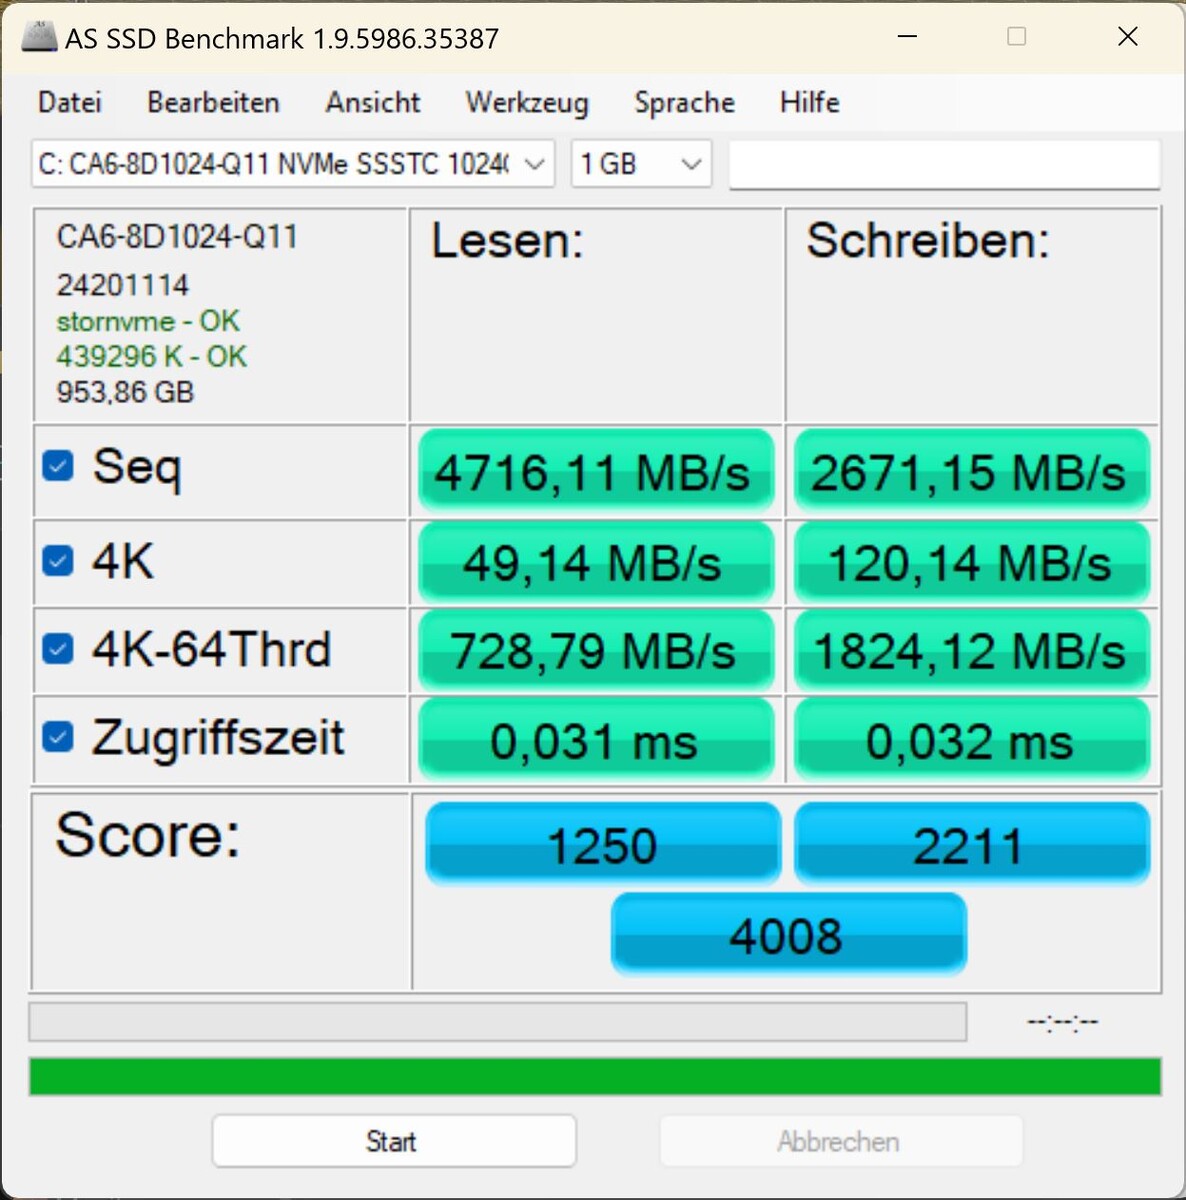
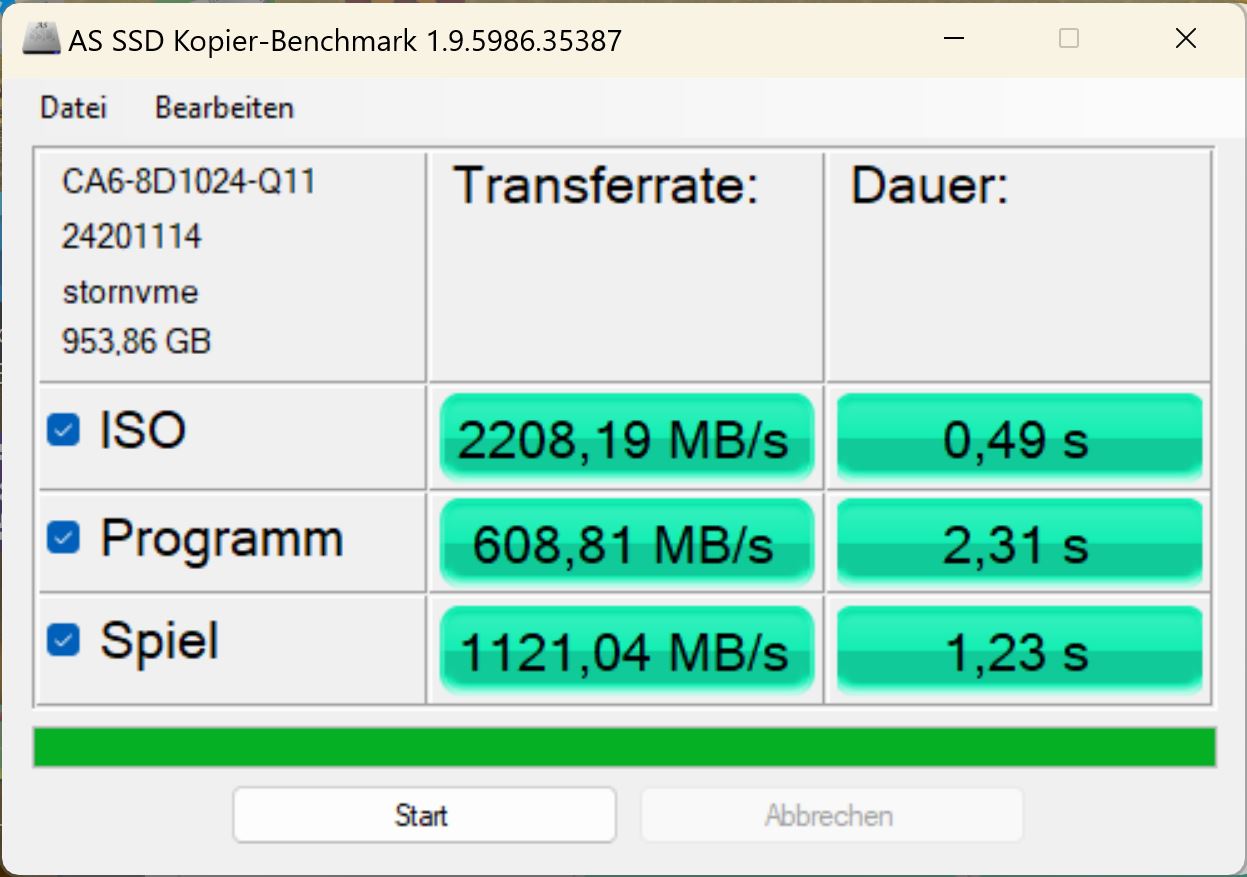
A Dell instala um SSD de 1 TB NVMe Gen4 da Solid State Storage Technology Corporation (SSSTC). Ele ocupa a 20ª posição em nossa lista de melhores HDD/SSD, portanto, deve ser rápido o suficiente.
No entanto, a unidade instalada não se aproxima do desempenho do modelo de referência. Ela permanece claramente abaixo de suas capacidades, e os dispositivos de armazenamento dos concorrentes, em sua maioria, funcionam muito mais rápido.
Uma progressão instável durante o teste de carga sustentada revela que o acionamento não consegue manter o forte desempenho do qual é teoricamente capaz. De acordo com a HWinfo, o resfriamento não é o problema.
Dispositivos de armazenamento

* ... menor é melhor
Sustained Read Performance: DiskSpd Read Loop, Queue Depth 8
Placa Gráfica
Um dedicado AMD Radeon RX 6850M XT visa proporcionar prazer de jogo, e seu desempenho é geralmente classificado entre o de um RTX 3070 e um RTX 3080.
A GPU faz um trabalho decente nos testes do 3DMark e deixa seus concorrentes com o RTX 3070 Tipor uma margem significativa. O m17 R4 predecessor com seu RTX 3080 está mais ou menos no mesmo nível do R5 e até a concorrência com o RTX 3080 Ti está ao alcance da mão.
No modo de bateria, o desempenho 3D cai em 43%.
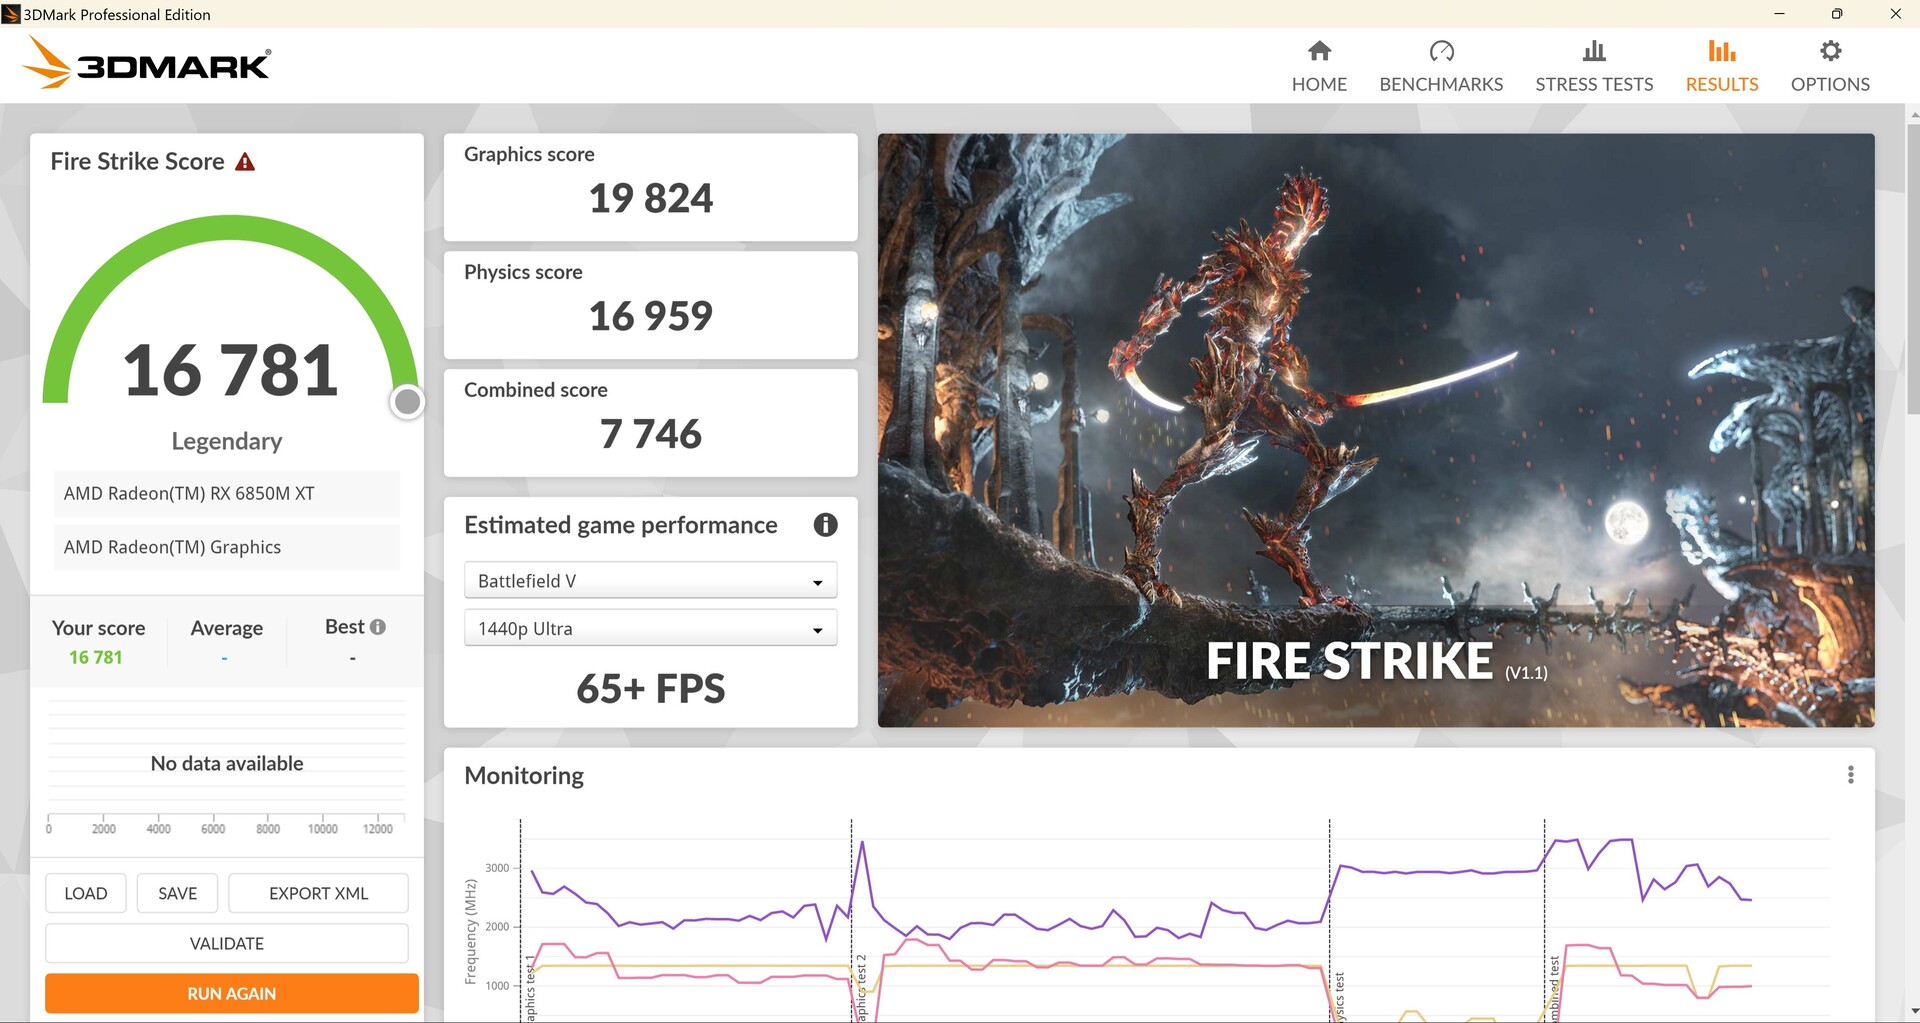
Mais uma vez, semelhante ao Cinebench, os modos de desempenho no Centro de Controle não parecem ter qualquer efeito sobre a pontuação Fire Strike (veja as imagens abaixo). Seja Equilibrado, Performance ou Full Speed, a pontuação permanece quase idêntica. Possivelmente, os motoristas também não estão interagindo com as configurações do Centro de Controle aqui.
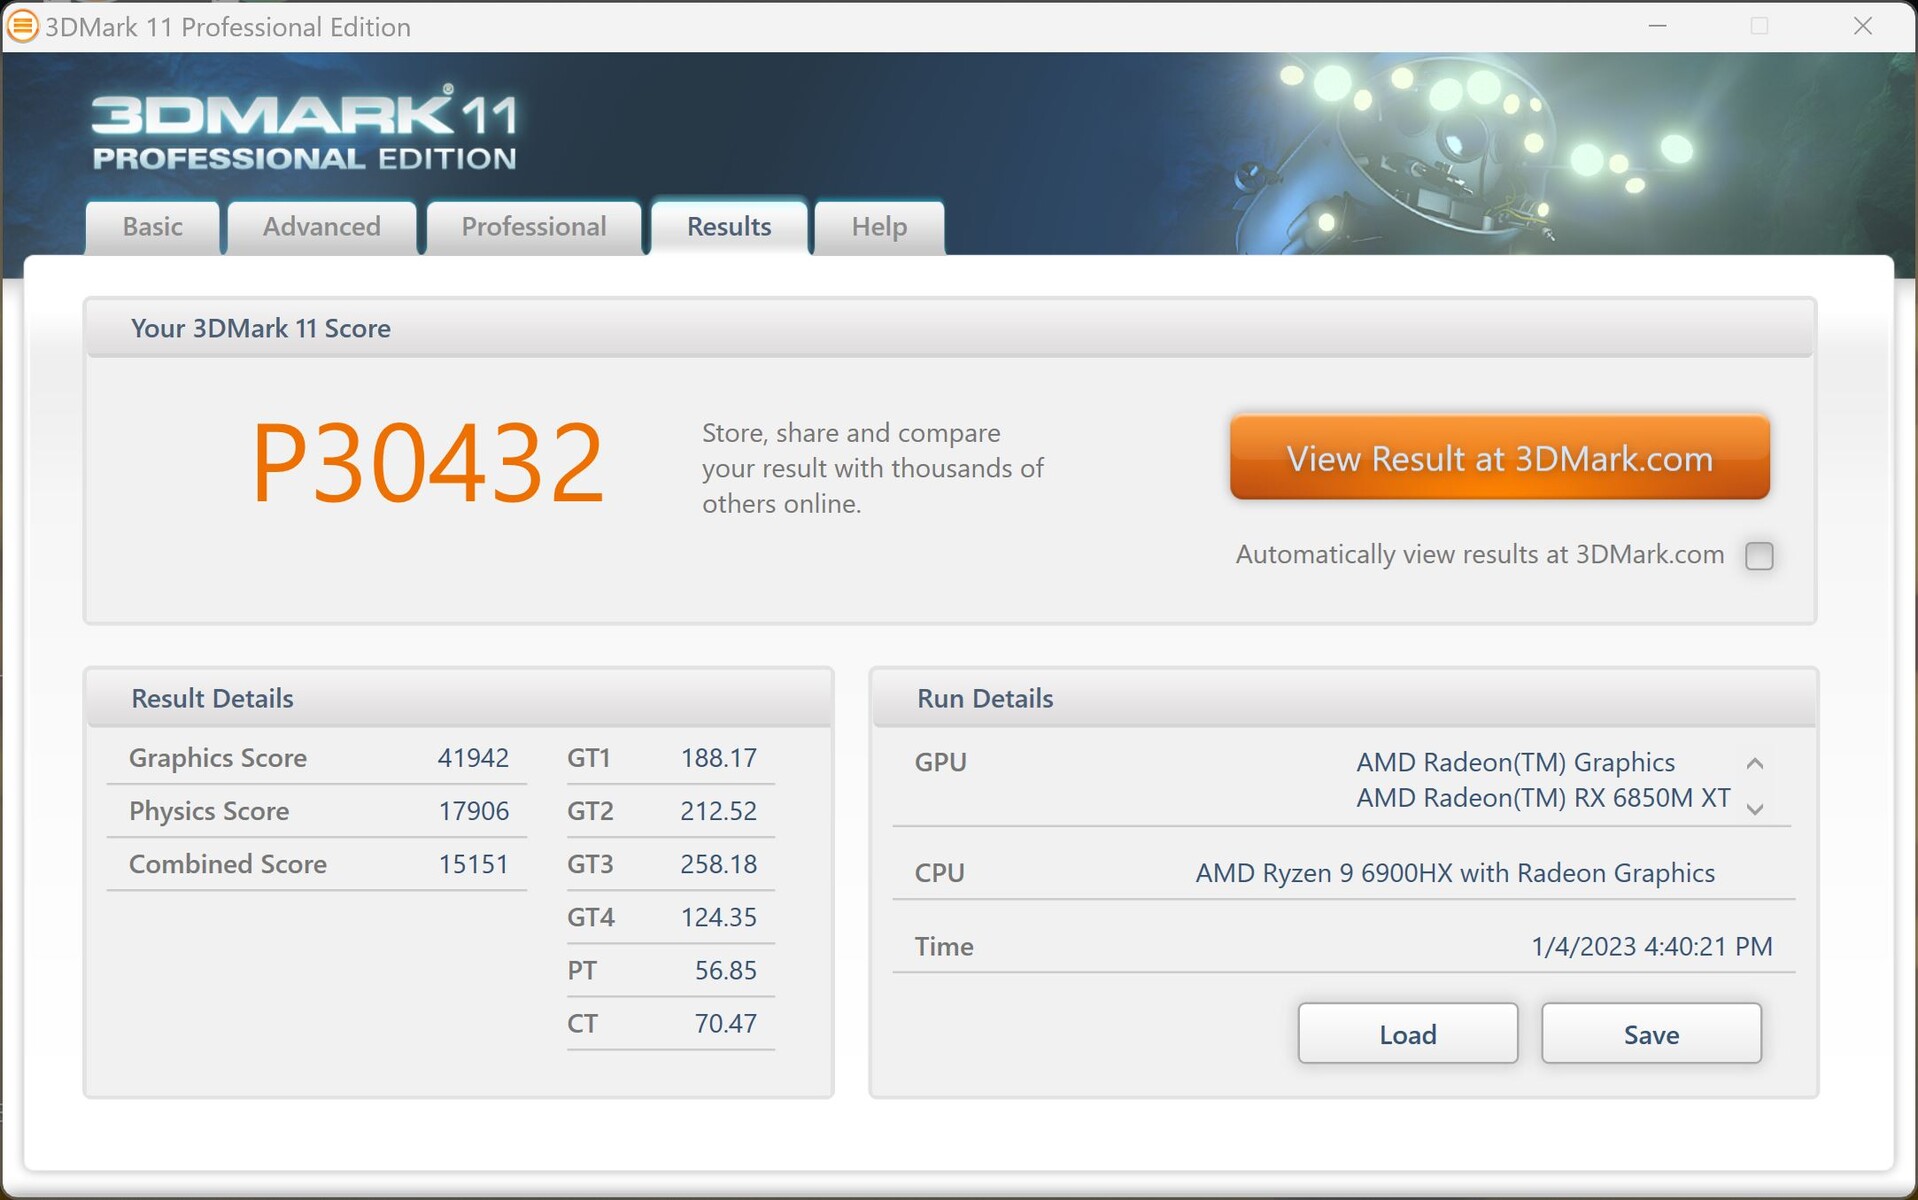


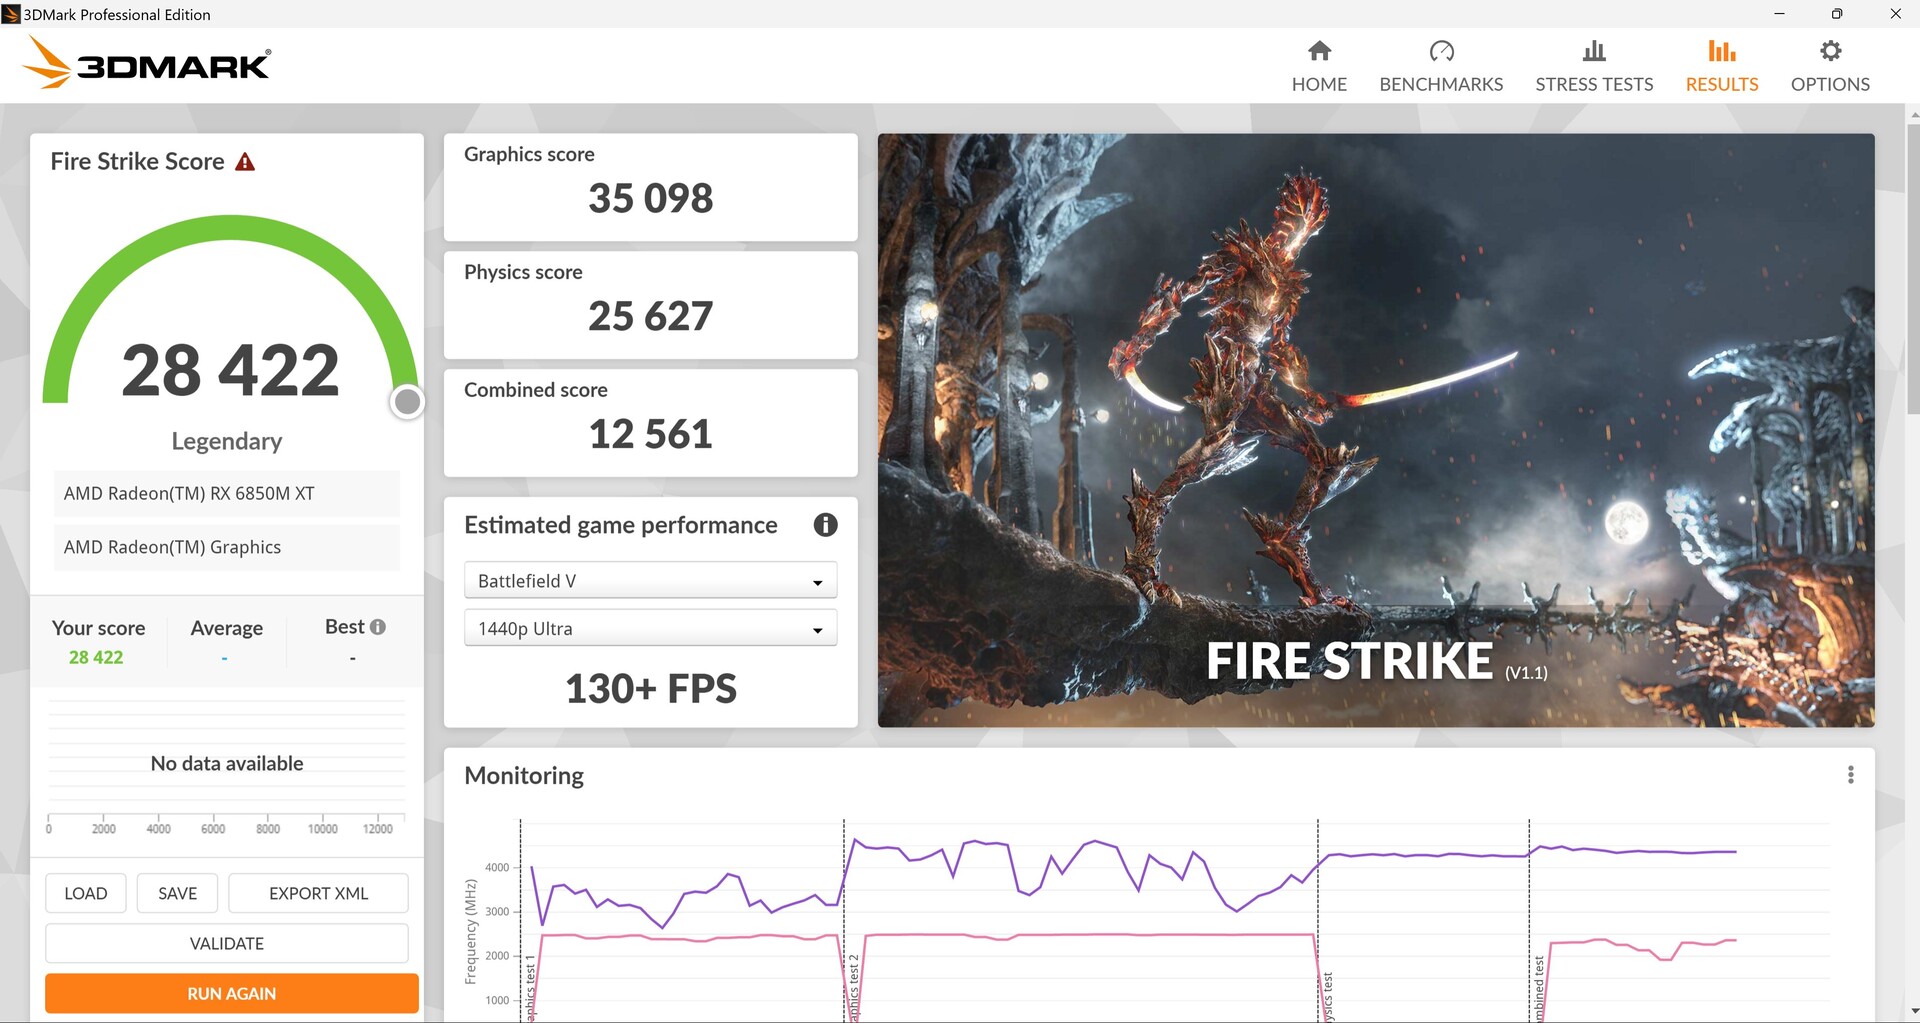
| 3DMark 11 Performance | 30432 pontos | |
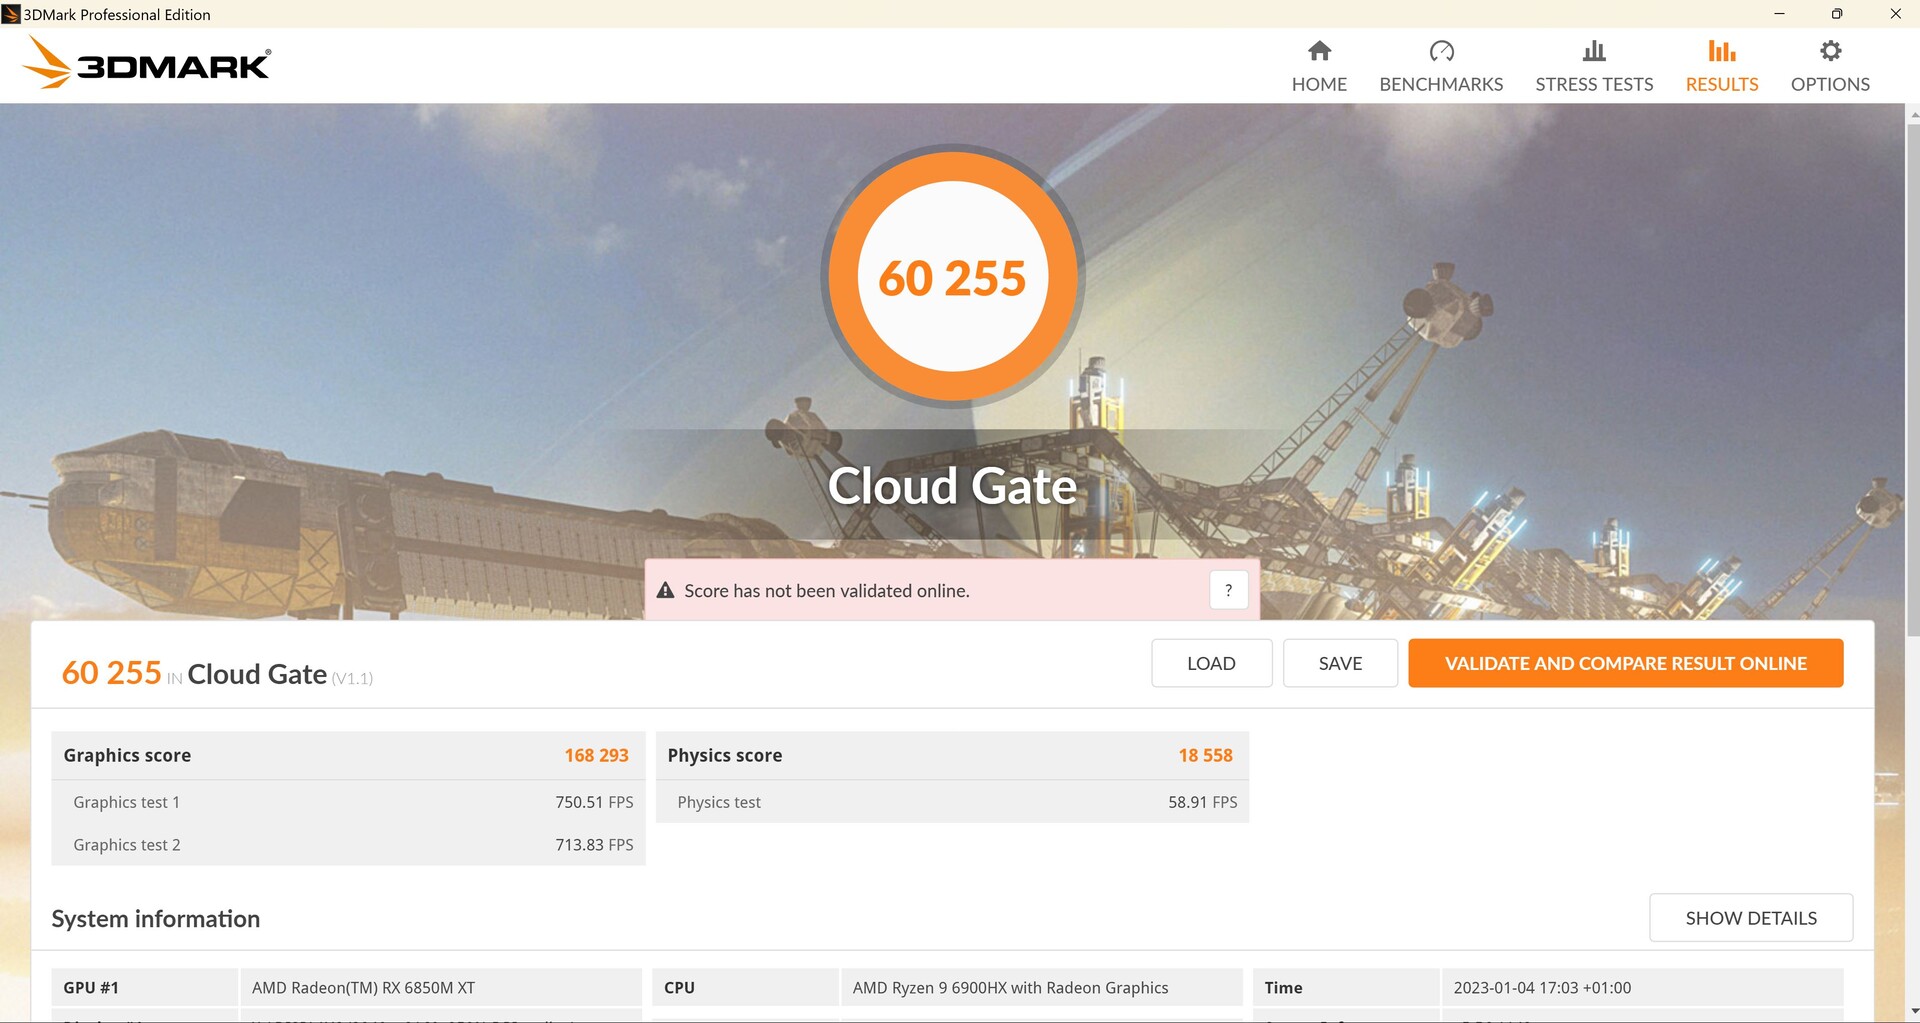
| 3DMark Cloud Gate Standard Score | 60255 pontos | |
| 3DMark Fire Strike Score | 28368 pontos | |
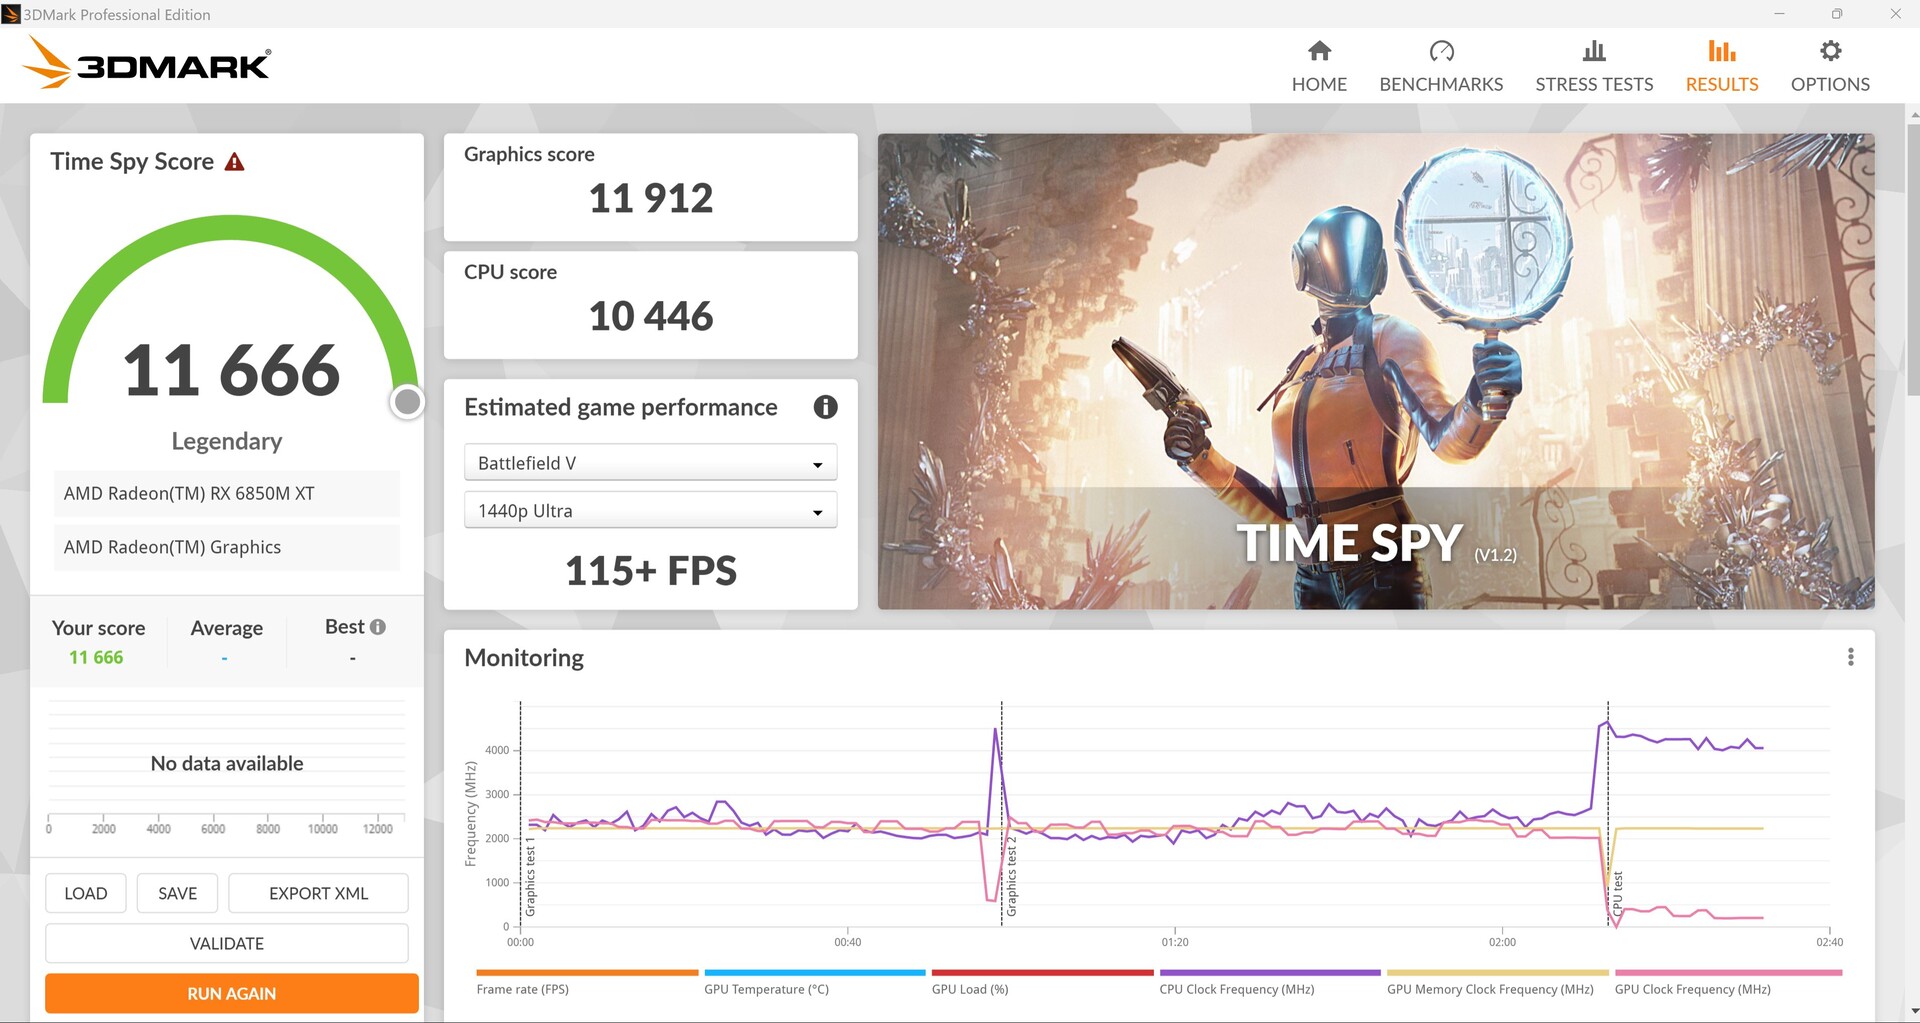
| 3DMark Time Spy Score | 11666 pontos | |
Ajuda | ||
* ... menor é melhor
Desempenho nos jogos
Nos jogos, o desempenho da AMD Alienware depende muito do jogo jogado. Em jogos com CPU, toda a concorrência da Intel está à frente, como no DOTA 2 Reborn.
Em jogos com GPU, as marés podem virar e o m17 R5 pode ser encontrado nas primeiras posições (Witcher 3), apesar da forte concorrência do RTX 3080 Ti. Entretanto, há sempre jogos (GTA V) nos quais o desempenho está abaixo da média. Isto também pode ser devido aos motoristas.
Os resultados no painel X indicam que a troca de gráficos não funcionou. Os resultados são reprodutíveis.
O desempenho do Ray Tracing em Dying Light 2 e Cyberpunk 2077 é mais fraco que o das placas concorrentes da série Nvidia 3000.
| The Witcher 3 - 1920x1080 Ultra Graphics & Postprocessing (HBAO+) | |
| Média da turma Gaming (104.7 - 240, n=7, últimos 2 anos) | |
| Alienware m17 R5 (R9 6900HX, RX 6850M XT) | |
| Schenker XMG Neo 17 M22 | |
| Acer Predator Helios 300 (i7-12700H, RTX 3070 Ti) | |
| Asus ROG Strix Scar 17 SE G733CX-LL014W | |
| Alienware m17 R4 | |
| Aorus 17X XES | |
| Dying Light 2 | |
| 1920x1080 High Quality | |
| Alienware m17 R5 (R9 6900HX, RX 6850M XT) | |
| Média AMD Radeon RX 6850M XT (n=1) | |
| Acer Predator Helios 300 (i7-12700H, RTX 3070 Ti) | |
| 3840x2160 High Quality | |
| Alienware m17 R5 (R9 6900HX, RX 6850M XT) | |
| Média AMD Radeon RX 6850M XT (n=1) | |
| 1920x1080 High Quality Raytracing | |
| Acer Predator Helios 300 (i7-12700H, RTX 3070 Ti) | |
| Alienware m17 R5 (R9 6900HX, RX 6850M XT) | |
| Média AMD Radeon RX 6850M XT (n=1) | |
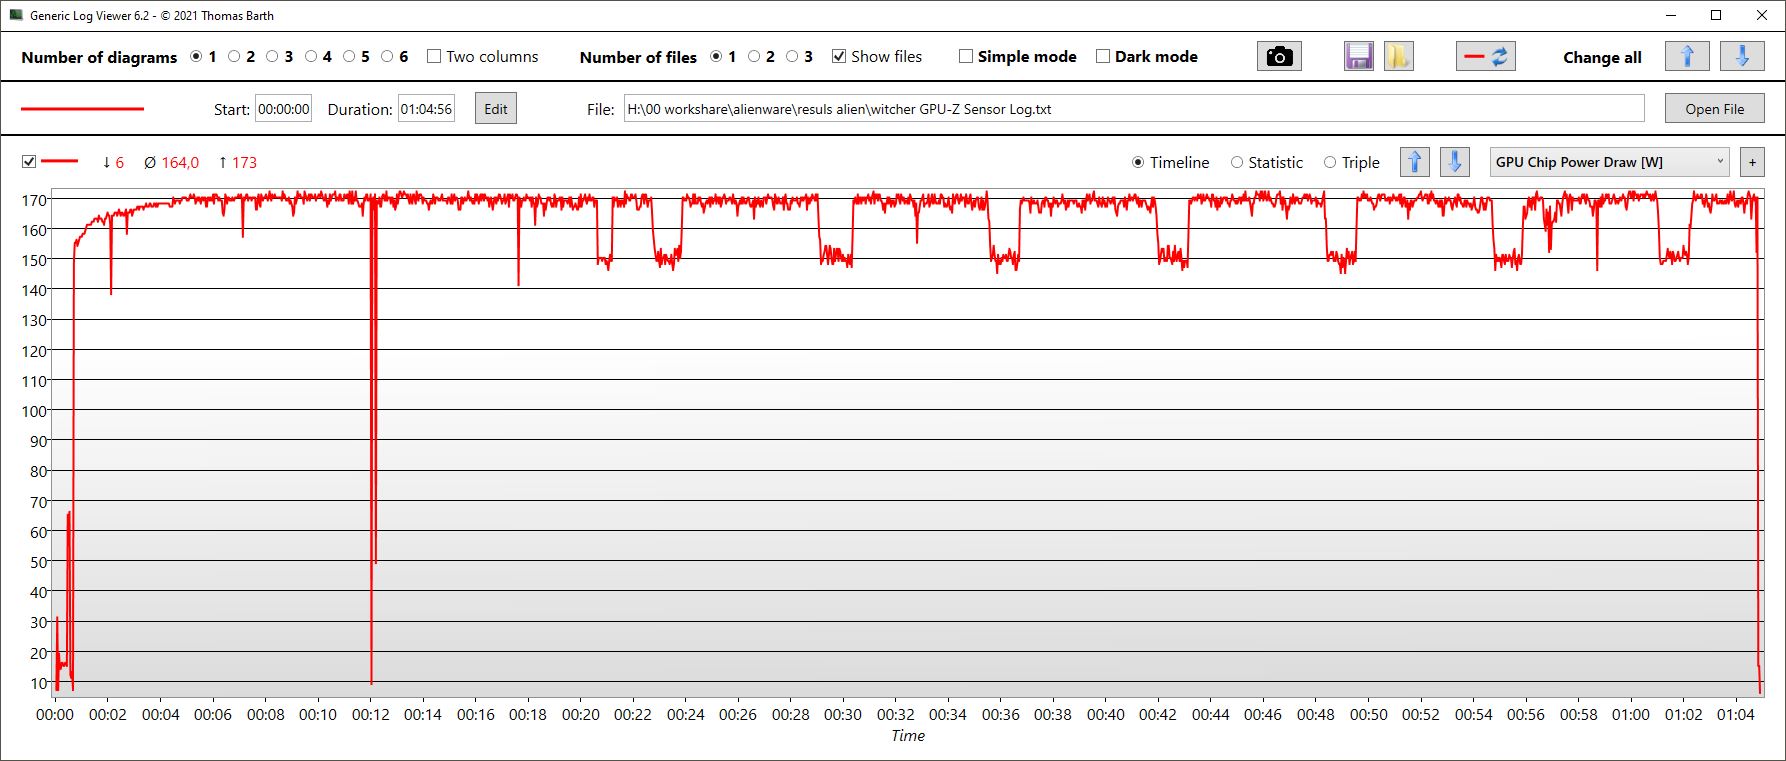
Em nosso loop de uma hora de duração Witcher 3, a taxa geral de quadros é bastante estável, com valores de desempenho que rivalizam com oRTX 3070 Ti no Acer Predator e até mesmo o RTX 3080 Ti no XMG Neo 17.
O relógio GPU é quase constante em 2,4 a 2,5 GHz, e a placa aquece até cerca de 75 °C. O consumo de energia da GPU é de cerca de 164 W.
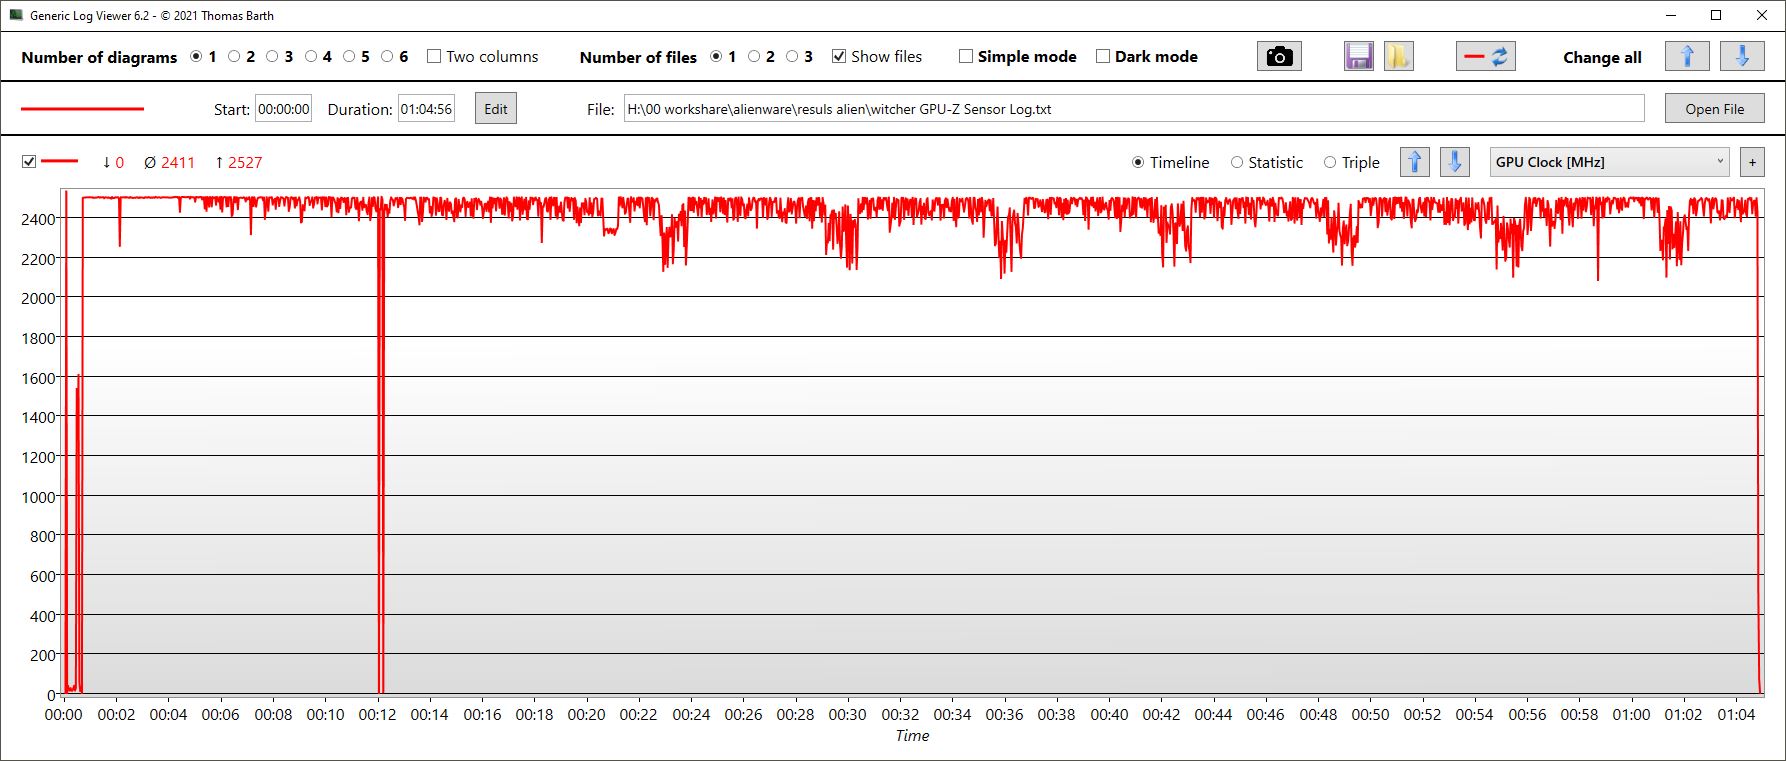
Witcher 3 FPS chart
| baixo | média | alto | ultra | QHD | 4K | |
|---|---|---|---|---|---|---|
| GTA V (2015) | 173.2 | 168.3 | 152 | 92.6 | 88.7 | 98.5 |
| The Witcher 3 (2015) | 222 | 198.2 | 188.6 | 126.2 | 72.2 | |
| Dota 2 Reborn (2015) | 134.7 | 116.5 | 112.5 | 94 | 77.5 | |
| Final Fantasy XV Benchmark (2018) | 113.6 | 84.5 | 48.8 | |||
| X-Plane 11.11 (2018) | 66.9 | 51 | 43.3 | 27.5 | ||
| Far Cry 5 (2018) | 126 | 109 | 105 | 102 | 99 | 68 |
| Strange Brigade (2018) | 375 | 291 | 256 | 230 | 171 | 92.1 |
| Assassin´s Creed Valhalla (2020) | 87 | 47 | ||||
| Dying Light 2 (2022) | 136 | 107 | 86 | 60 | 30 | |
| Cyberpunk 2077 1.6 (2022) | 57 | 26 | ||||
| Call of Duty Modern Warfare 2 2022 (2022) | 86 | 54 |
Emissões - Altas temperaturas do núcleo da CPU, caso contrário imperceptíveis
Ruído
Em modo inativo, os ventiladores permanecem em sua maioria silenciosos fora do modo Full Speed . No entanto, eles fazem uma breve inversão periódica por um a três segundos, o que não faz sentido. Isto acontece até mesmo no modo de sono com a tela fechada, o que é bastante irritante. Portanto, aqui também, os motoristas não estão perfeitamente ajustados.
Ao jogar no modo Performance , o novo m17 se torna ligeiramente mais alto do que seu predecessor, mas permanece relativamente silencioso em comparação com o resto da competição, tornando-o um dos jogadores mais silenciosos de alta performance.
Barulho
| Ocioso |
| 23 / 28.11 / 28.11 dB |
| Carga |
| 30.62 / 50.17 dB |
 | ||
30 dB silencioso 40 dB(A) audível 50 dB(A) ruidosamente alto |
||
min: | ||
| Alienware m17 R5 (R9 6900HX, RX 6850M XT) Radeon RX 6850M XT, R9 6900HX, SSSTC CA6-8D1024 | Alienware m17 R4 GeForce RTX 3080 Laptop GPU, i9-10980HK, 2x Micron 2300 512 GB (RAID 0) | Asus ROG Strix Scar 17 SE G733CX-LL014W GeForce RTX 3080 Ti Laptop GPU, i9-12950HX, Samsung PM9A1 MZVL22T0HBLB | Acer Predator Helios 300 (i7-12700H, RTX 3070 Ti) GeForce RTX 3070 Ti Laptop GPU, i7-12700H, Samsung PM9A1 MZVL21T0HCLR | Schenker XMG Neo 17 M22 GeForce RTX 3080 Ti Laptop GPU, R9 6900HX, Samsung SSD 980 Pro 1TB MZ-V8P1T0BW | Aorus 17X XES GeForce RTX 3070 Ti Laptop GPU, i9-12900HX, Gigabyte AG470S1TB-SI B10 | |
|---|---|---|---|---|---|---|
| Noise | -9% | 3% | -18% | -20% | -25% | |
| desligado / ambiente * (dB) | 23 | 24 -4% | 23.9 -4% | 23 -0% | 26 -13% | 26 -13% |
| Idle Minimum * (dB) | 23 | 24 -4% | 23.9 -4% | 23 -0% | 26 -13% | 28 -22% |
| Idle Average * (dB) | 28.11 | 25 11% | 23.9 15% | 25.92 8% | 29 -3% | 32 -14% |
| Idle Maximum * (dB) | 28.11 | 36 -28% | 23.9 15% | 40.67 -45% | 40 -42% | 38 -35% |
| Load Average * (dB) | 30.62 | 45 -47% | 34.3 -12% | 42.7 -39% | 47 -53% | 53 -73% |
| Witcher 3 ultra * (dB) | 49.75 | 47 6% | 62.48 -26% | 52 -5% | 54 -9% | |
| Load Maximum * (dB) | 50.17 | 50 -0% | 45.9 9% | 62.67 -25% | 54 -8% | 55 -10% |
* ... menor é melhor
Temperatura
O m17 permanece sempre frio quando ocioso, portanto, as temperaturas ociosas anormalmente altas de seu predecessor são coisa do passado.
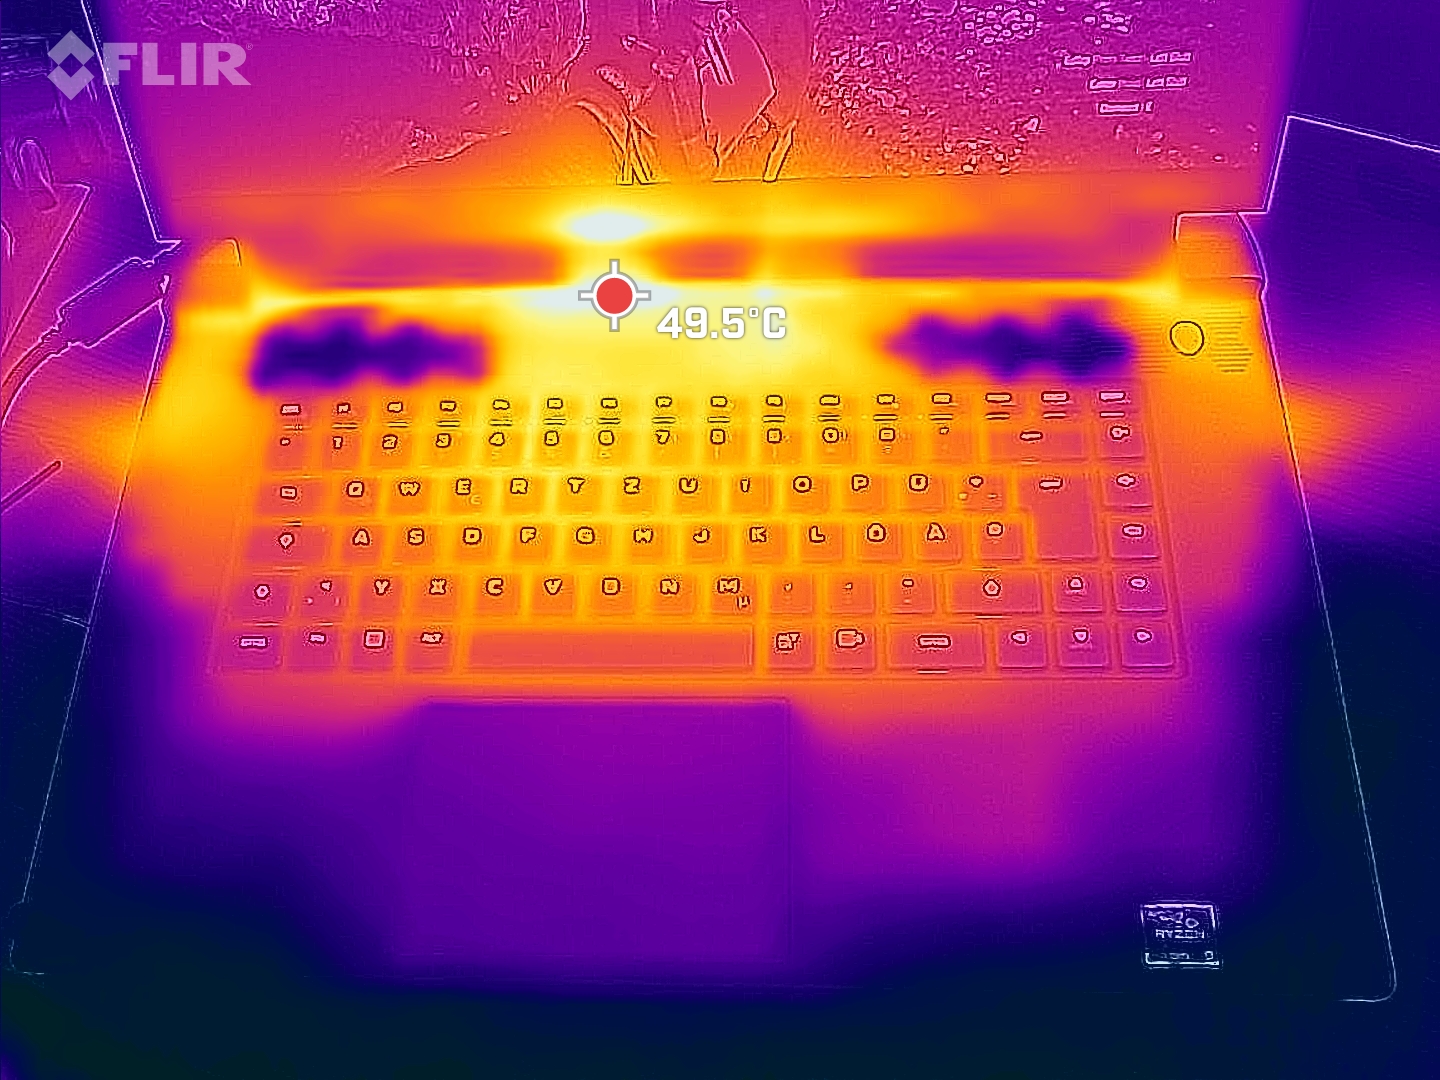
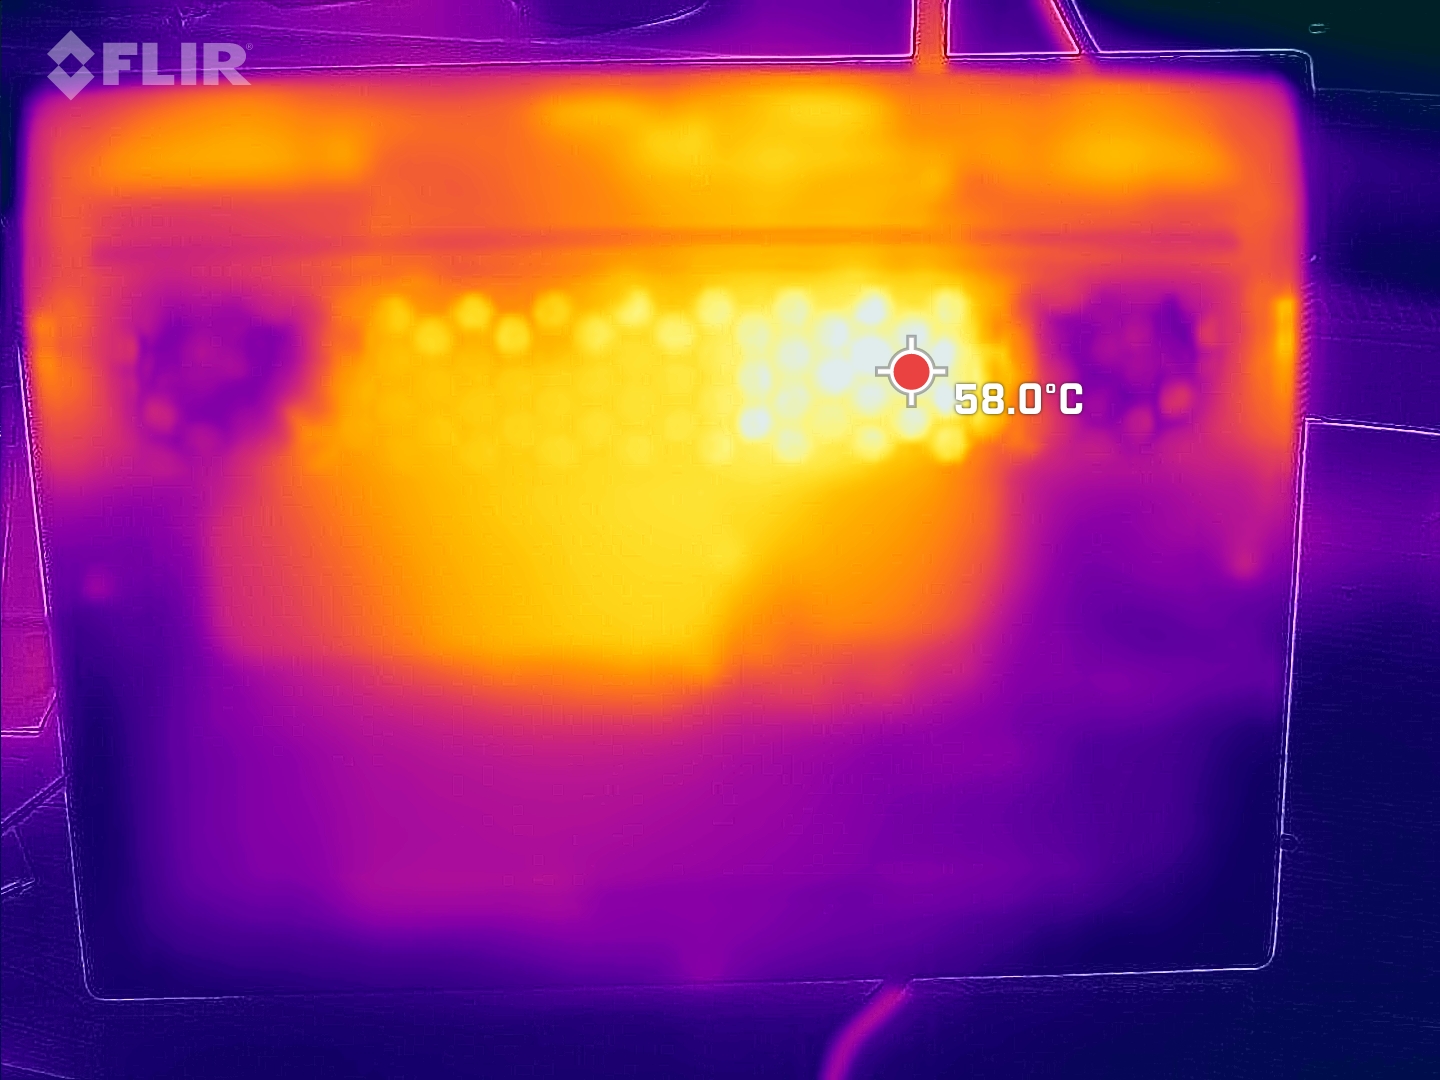
Os restos da palma também permanecem frios sob carga. No entanto, desenvolvem-se pontos quentes de até 56 °C, especialmente na parte inferior do centro, em direção ao mostrador. Há concorrentes que se mantêm um pouco mais frios, mas o Alienware também não fica para trás; pelo menos um dispositivo (Aorus 17) atinge temperaturas semelhantes.
(-) A temperatura máxima no lado superior é 53 °C / 127 F, em comparação com a média de 40.4 °C / 105 F , variando de 21.2 a 68.8 °C para a classe Gaming.
(-) A parte inferior aquece até um máximo de 56 °C / 133 F, em comparação com a média de 43.2 °C / 110 F
(+) Em uso inativo, a temperatura média para o lado superior é 25.3 °C / 78 F, em comparação com a média do dispositivo de 33.9 °C / ### class_avg_f### F.
(±) Jogando The Witcher 3, a temperatura média para o lado superior é 36.4 °C / 98 F, em comparação com a média do dispositivo de 33.9 °C / ## #class_avg_f### F.
(+) Os apoios para as mãos e o touchpad são mais frios que a temperatura da pele, com um máximo de 29 °C / 84.2 F e, portanto, são frios ao toque.
(±) A temperatura média da área do apoio para as mãos de dispositivos semelhantes foi 28.8 °C / 83.8 F (-0.2 °C / -0.4 F).
| Alienware m17 R5 (R9 6900HX, RX 6850M XT) AMD Ryzen 9 6900HX, AMD Radeon RX 6850M XT | Alienware m17 R4 Intel Core i9-10980HK, NVIDIA GeForce RTX 3080 Laptop GPU | Asus ROG Strix Scar 17 SE G733CX-LL014W Intel Core i9-12950HX, NVIDIA GeForce RTX 3080 Ti Laptop GPU | Acer Predator Helios 300 (i7-12700H, RTX 3070 Ti) Intel Core i7-12700H, NVIDIA GeForce RTX 3070 Ti Laptop GPU | Schenker XMG Neo 17 M22 AMD Ryzen 9 6900HX, NVIDIA GeForce RTX 3080 Ti Laptop GPU | Aorus 17X XES Intel Core i9-12900HX, NVIDIA GeForce RTX 3070 Ti Laptop GPU | |
|---|---|---|---|---|---|---|
| Heat | -25% | -1% | 6% | 0% | -16% | |
| Maximum Upper Side * (°C) | 53 | 58 -9% | 48.8 8% | 35 34% | 49 8% | 54 -2% |
| Maximum Bottom * (°C) | 56 | 46 18% | 52.4 6% | 53 5% | 52 7% | 58 -4% |
| Idle Upper Side * (°C) | 30 | 45 -50% | 30.4 -1% | 29 3% | 30 -0% | 37 -23% |
| Idle Bottom * (°C) | 29 | 46 -59% | 34.1 -18% | 34 -17% | 33 -14% | 39 -34% |
* ... menor é melhor
Teste de estresse
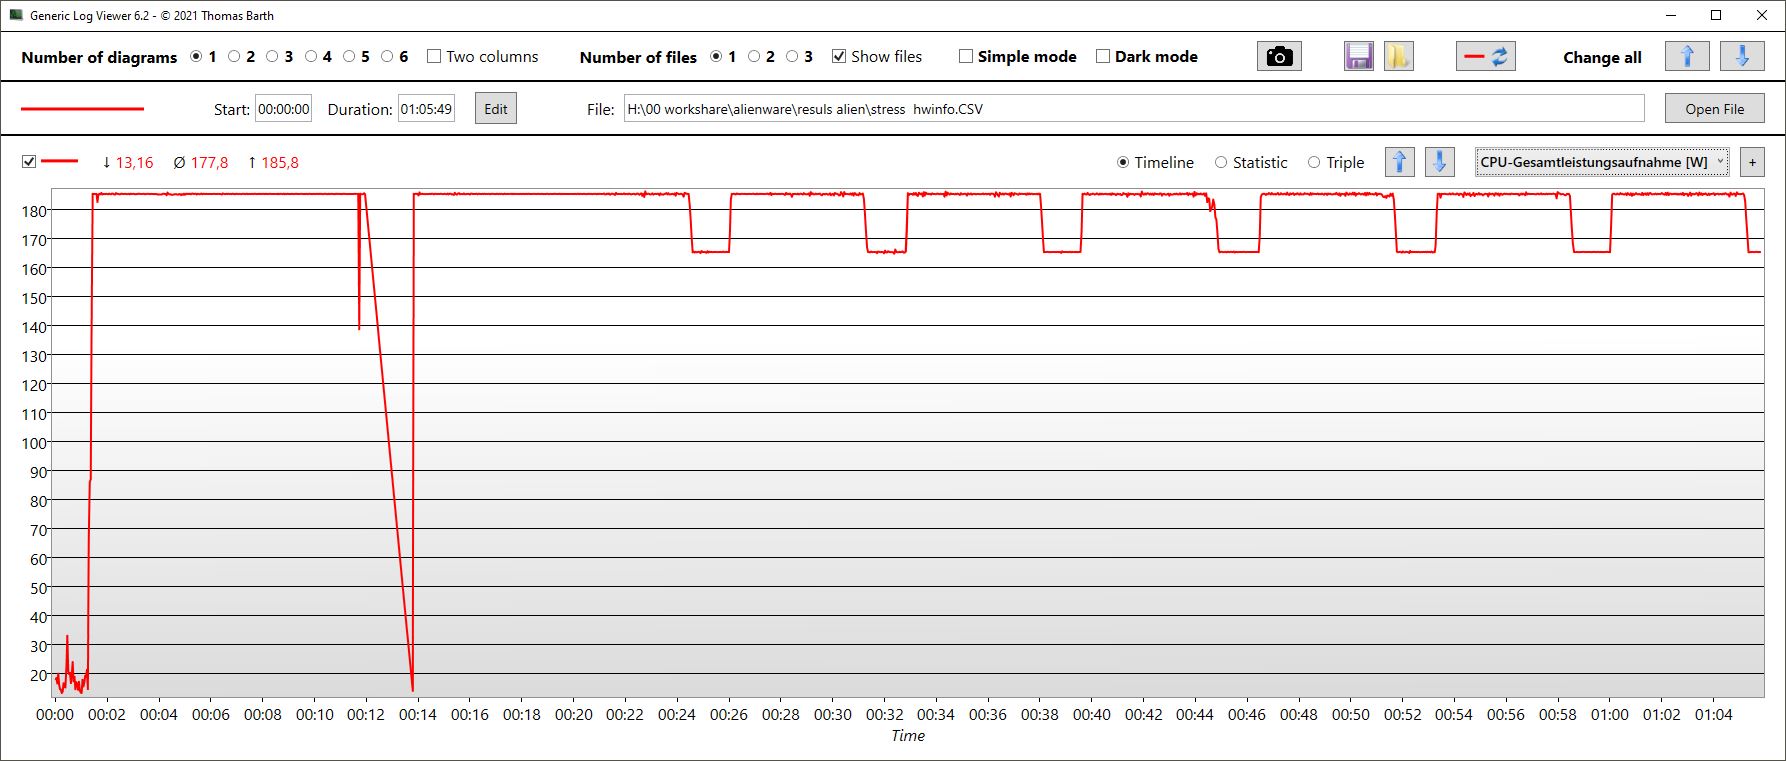
Os núcleos começam nosso teste de estresse em torno de 4,3 GHz. Com o tempo, este relógio é mantido bastante bem, caindo apenas minimamente. As temperaturas dos núcleos atingem repetidamente os altos 100 °C!
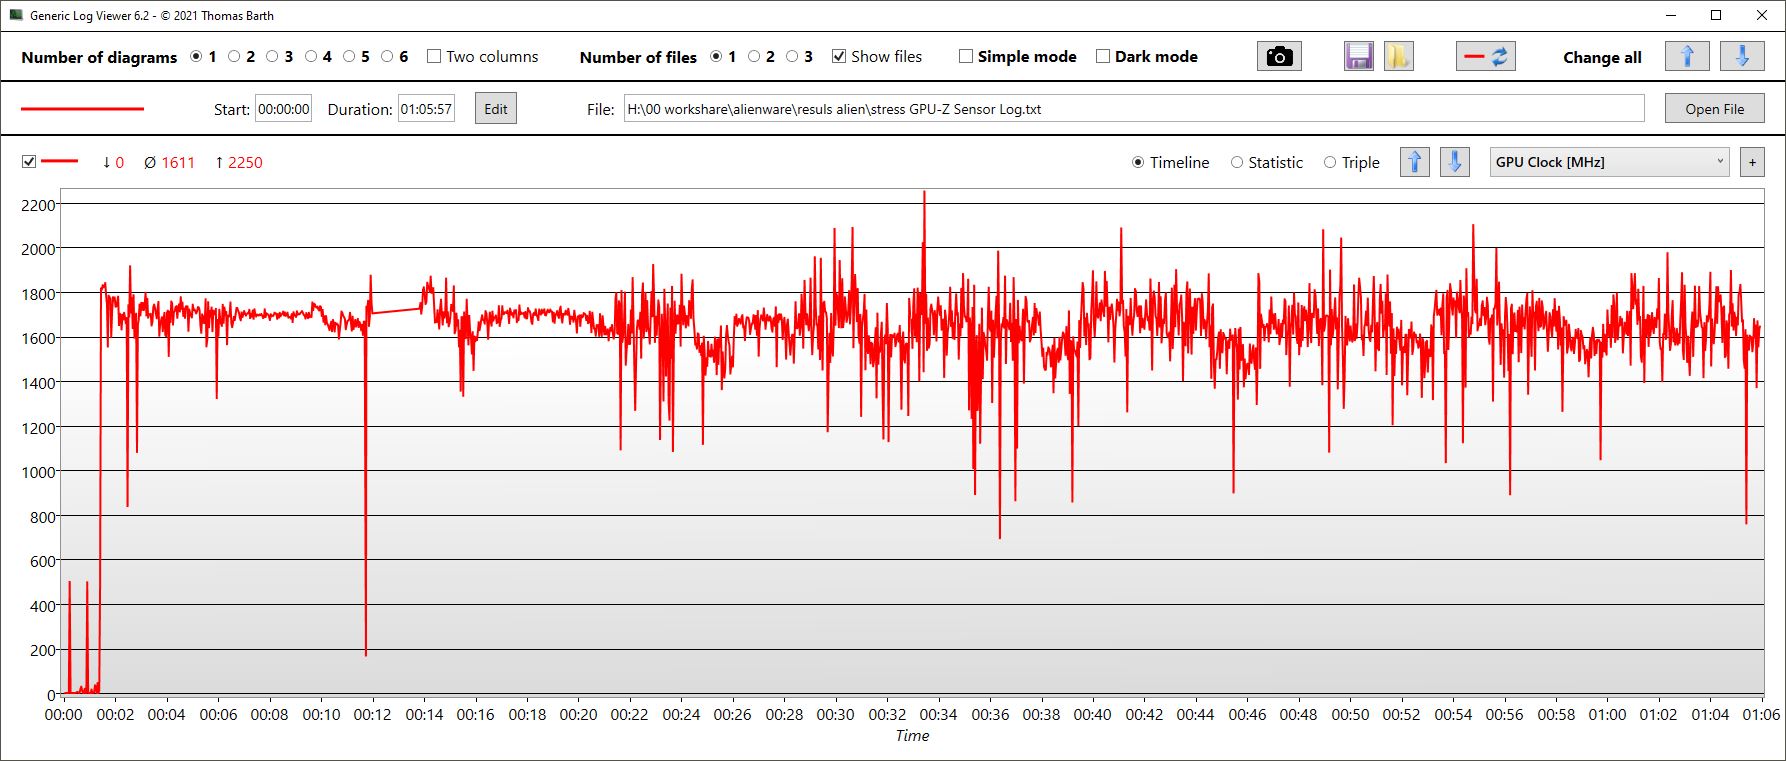
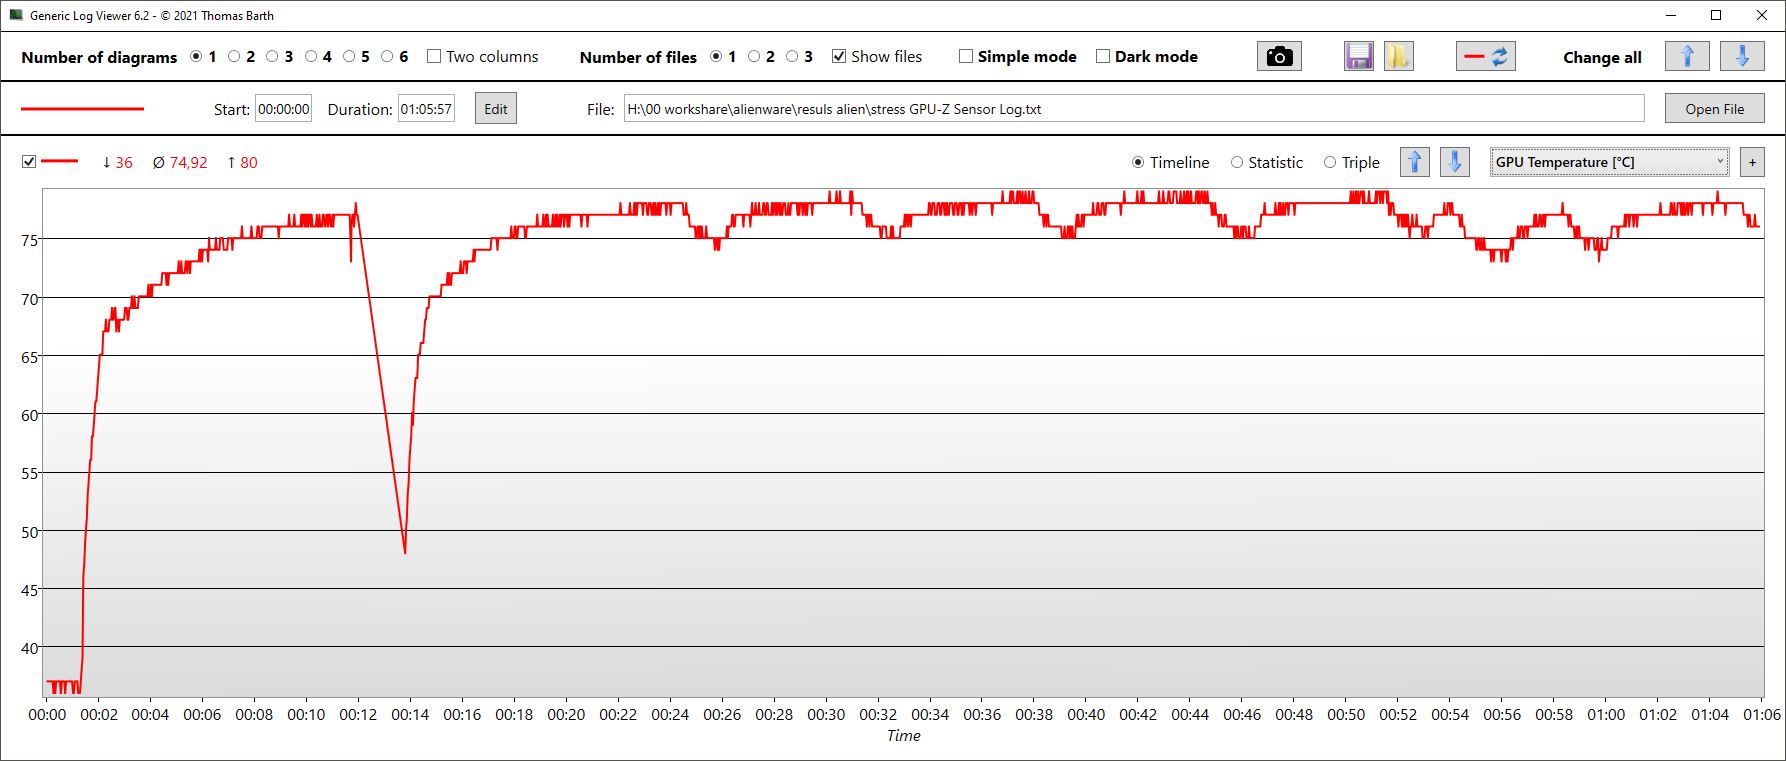
A GPU tem temperaturas um pouco mais toleráveis de cerca de 75 °C. A taxa de relógio da GPU é de 1,6 GHz em média.
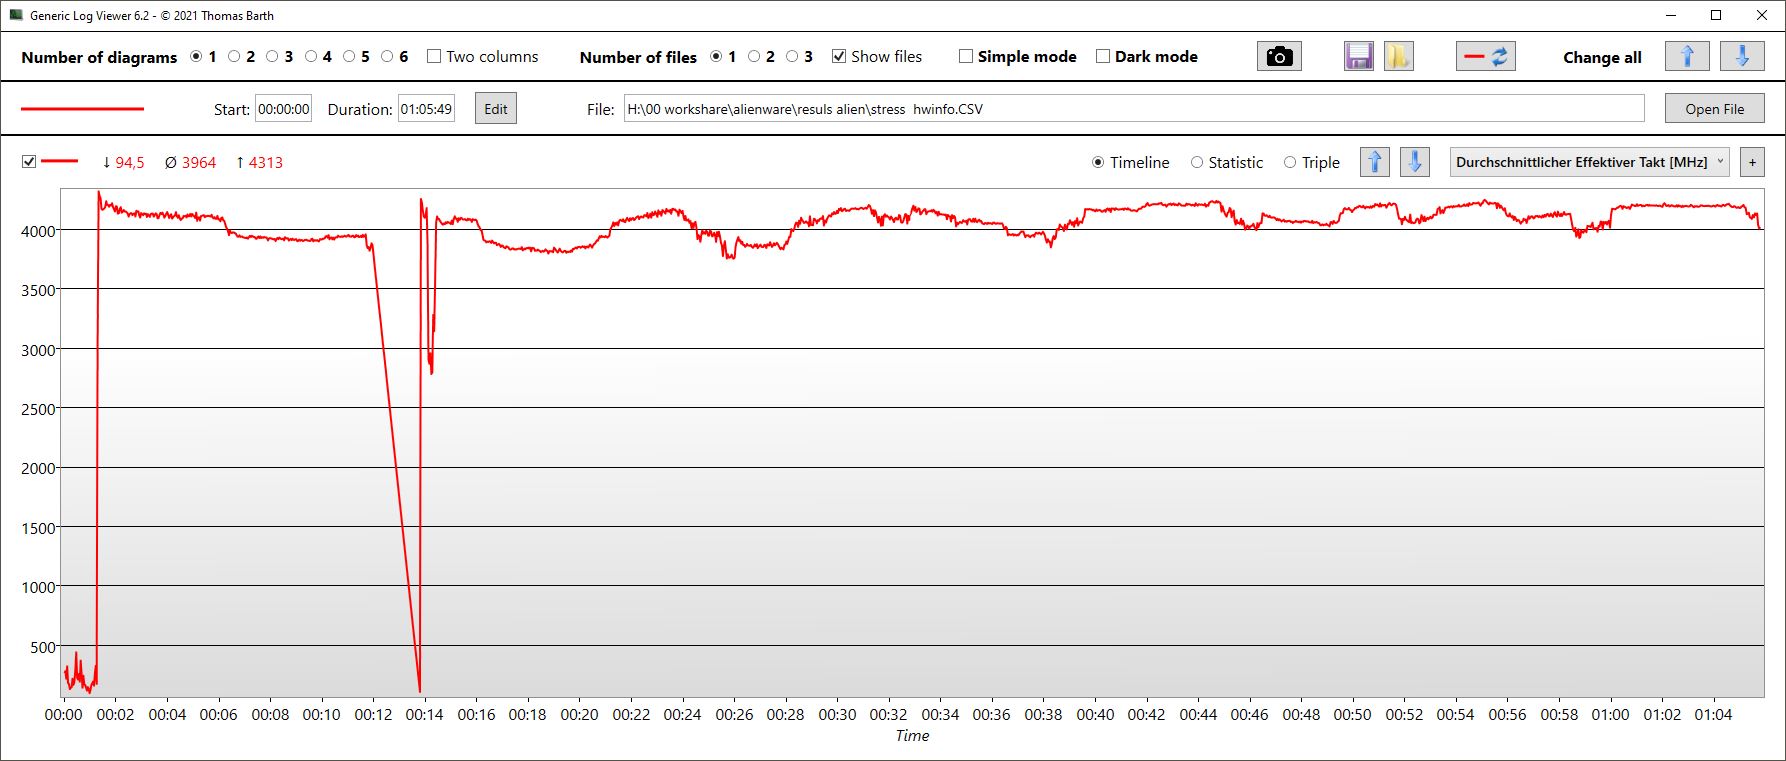
| Relógio CPU (GHz) | Relógio GPU (MHz) | Temperatura média da CPU (°C) | Temperatura média da GPU (°C) | |
| System Idle | ||||
| Prime95 + FurMark Stress | 4 | 1,6 | 94 | 75 |
| Witcher 3 Estresse | 0,71 | 2,4 | 70 | 75 |
Oradores
Os alto-falantes estéreo são comparativamente altos e têm alturas e médios equilibrados. Os graves estão claramente subrepresentados, razão pela qual é recomendável conectar dispositivos de áudio externos via conector de fone de ouvido, Bluetooth ou HDMI.
Alienware m17 R5 (R9 6900HX, RX 6850M XT) análise de áudio
(+) | os alto-falantes podem tocar relativamente alto (###valor### dB)
Graves 100 - 315Hz
(-) | quase nenhum baixo - em média 20.5% menor que a mediana
(±) | a linearidade dos graves é média (14.1% delta para a frequência anterior)
Médios 400 - 2.000 Hz
(+) | médios equilibrados - apenas 4.8% longe da mediana
(+) | médios são lineares (5.9% delta para frequência anterior)
Altos 2 - 16 kHz
(+) | agudos equilibrados - apenas 1.6% longe da mediana
(+) | os máximos são lineares (4.1% delta da frequência anterior)
Geral 100 - 16.000 Hz
(±) | a linearidade do som geral é média (15.7% diferença em relação à mediana)
Comparado com a mesma classe
» 37% de todos os dispositivos testados nesta classe foram melhores, 7% semelhantes, 57% piores
» O melhor teve um delta de 6%, a média foi 18%, o pior foi 132%
Comparado com todos os dispositivos testados
» 24% de todos os dispositivos testados foram melhores, 5% semelhantes, 71% piores
» O melhor teve um delta de 4%, a média foi 23%, o pior foi 134%
Acer Predator Helios 300 (i7-12700H, RTX 3070 Ti) análise de áudio
(±) | o volume do alto-falante é médio, mas bom (###valor### dB)
Graves 100 - 315Hz
(±) | graves reduzidos - em média 12.7% menor que a mediana
(±) | a linearidade dos graves é média (11.2% delta para a frequência anterior)
Médios 400 - 2.000 Hz
(±) | médios mais altos - em média 5.5% maior que a mediana
(±) | a linearidade dos médios é média (7.9% delta para frequência anterior)
Altos 2 - 16 kHz
(+) | agudos equilibrados - apenas 2.1% longe da mediana
(+) | os máximos são lineares (3.5% delta da frequência anterior)
Geral 100 - 16.000 Hz
(±) | a linearidade do som geral é média (15.8% diferença em relação à mediana)
Comparado com a mesma classe
» 37% de todos os dispositivos testados nesta classe foram melhores, 7% semelhantes, 56% piores
» O melhor teve um delta de 6%, a média foi 18%, o pior foi 132%
Comparado com todos os dispositivos testados
» 24% de todos os dispositivos testados foram melhores, 5% semelhantes, 70% piores
» O melhor teve um delta de 4%, a média foi 23%, o pior foi 134%
Gerenciamento de energia - Tempos médios de execução
Consumo de energia
O m17 R5 é bastante econômico quando ocioso e também é "superado" pela maioria da concorrência durante os picos de carga. Entretanto, o laptop é menos econômico quando está jogando: em Witcher 3, ele consome a maioria de todos os dispositivos de comparação. Isto não é surpreendente, uma vez que ele também executa o melhor em nosso Witcher 3 teste de estresse.
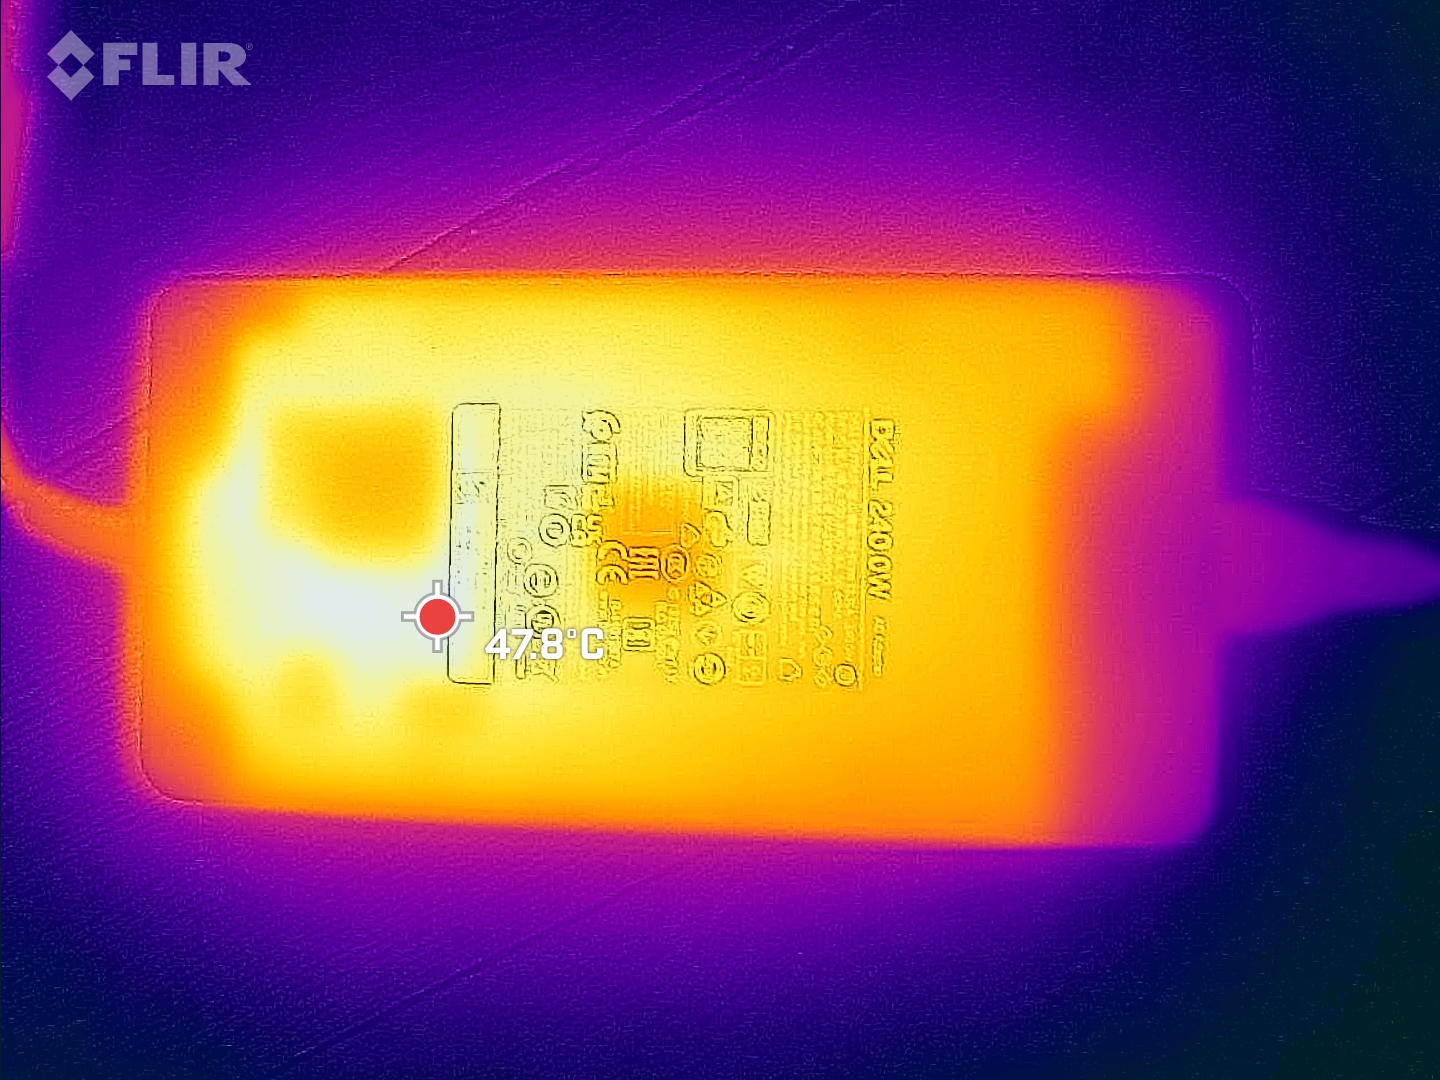
A unidade de alimentação plana, mas ampla, foi projetada para uma potência de 240 W e, portanto, está praticamente no máximo. A diferença na potência de entrada/saída deve garantir que ela não fique sobrecarregada e possa lidar com o pico ocasional de carga de 250 W.
| Ocioso | |
| Carga |
|
Key:
min: | |
| Alienware m17 R5 (R9 6900HX, RX 6850M XT) R9 6900HX, Radeon RX 6850M XT, SSSTC CA6-8D1024, IPS, 3840x2160, 17" | Alienware m17 R4 i9-10980HK, GeForce RTX 3080 Laptop GPU, 2x Micron 2300 512 GB (RAID 0), IPS, 1920x1080, 17.3" | Asus ROG Strix Scar 17 SE G733CX-LL014W i9-12950HX, GeForce RTX 3080 Ti Laptop GPU, Samsung PM9A1 MZVL22T0HBLB, IPS, 2560x1440, 17.3" | Acer Predator Helios 300 (i7-12700H, RTX 3070 Ti) i7-12700H, GeForce RTX 3070 Ti Laptop GPU, Samsung PM9A1 MZVL21T0HCLR, IPS, 2560x1440, 17.3" | Schenker XMG Neo 17 M22 R9 6900HX, GeForce RTX 3080 Ti Laptop GPU, Samsung SSD 980 Pro 1TB MZ-V8P1T0BW, IPS, 2560x1600, 17" | Aorus 17X XES i9-12900HX, GeForce RTX 3070 Ti Laptop GPU, Gigabyte AG470S1TB-SI B10, IPS, 1920x1080, 17.3" | Média AMD Radeon RX 6850M XT | Média da turma Gaming | |
|---|---|---|---|---|---|---|---|---|
| Power Consumption | -119% | -40% | -21% | 11% | -49% | -6% | -16% | |
| Idle Minimum * (Watt) | 13 | 42 -223% | 19.3 -48% | 15 -15% | 7 46% | 18 -38% | 11.5 ? 12% | 13 ? -0% |
| Idle Average * (Watt) | 16.5 | 48 -191% | 26.5 -61% | 20 -21% | 11 33% | 28 -70% | 19.3 ? -17% | 19 ? -15% |
| Idle Maximum * (Watt) | 17 | 58 -241% | 27.1 -59% | 22.3 -31% | 17 -0% | 36 -112% | 20.1 ? -18% | 24.6 ? -45% |
| Load Average * (Watt) | 93 | 124 -33% | 141 -52% | 133 -43% | 92 1% | 153 -65% | 93.7 ? -1% | 110.7 ? -19% |
| Witcher 3 ultra * (Watt) | 239 | 219 8% | 225 6% | 231 3% | 221 8% | 221 8% | ||
| Load Maximum * (Watt) | 251 | 337 -34% | 307.9 -23% | 290 -16% | 306 -22% | 290 -16% | 264 ? -5% | 259 ? -3% |
* ... menor é melhor
Power consumption Witcher 3 / Stress test
Power consumption with an external monitor
Vida útil da bateria
Infelizmente, o m17 não muda automaticamente para 60 Hz para economizar energia quando você puxa a tomada para fora da tomada. Isto se aplica a todos os modos, mas dificilmente teve um impacto negativo em nosso teste de bateria.
Com uma capacidade de 97 Wh, a bateria é uma das maiores em comparação com a concorrência. No entanto, dois rivais têm melhor desempenho. O Schenker XMG Neo 17 em particular é capaz de espremer ainda mais tempo fora de sua bateria de aproximadamente o mesmo tamanho, graças aos modos inteligentes de economia de energia. Talvez as melhorias urgentes para o motorista descritas acima façam a diferença para o m17.
O laptop durou entre 3,7 a 4,7 horas no teste WiFi, dependendo da luminosidade do visor. Uma noite de cinema pode ser planejada para pouco menos de 5 horas. Estes são valores sólidos para um dispositivo de 17 polegadas.
| Alienware m17 R5 (R9 6900HX, RX 6850M XT) R9 6900HX, Radeon RX 6850M XT, 97 Wh | Alienware m17 R4 i9-10980HK, GeForce RTX 3080 Laptop GPU, 86 Wh | Asus ROG Strix Scar 17 SE G733CX-LL014W i9-12950HX, GeForce RTX 3080 Ti Laptop GPU, 90 Wh | Acer Predator Helios 300 (i7-12700H, RTX 3070 Ti) i7-12700H, GeForce RTX 3070 Ti Laptop GPU, 90 Wh | Schenker XMG Neo 17 M22 R9 6900HX, GeForce RTX 3080 Ti Laptop GPU, 99 Wh | Aorus 17X XES i9-12900HX, GeForce RTX 3070 Ti Laptop GPU, 99 Wh | Média da turma Gaming | |
|---|---|---|---|---|---|---|---|
| Duração da bateria | -46% | -12% | 15% | 41% | -17% | 34% | |
| H.264 (h) | 4.9 | 2.2 -55% | 5.9 20% | 6.6 35% | 3.8 -22% | 8.32 ? 70% | |
| WiFi v1.3 (h) | 4.8 | 2.4 -50% | 4.2 -12% | 6 25% | 9 88% | 4.4 -8% | 7.11 ? 48% |
| Load (h) | 1.8 | 1.2 -33% | 1.8 0% | 1.8 0% | 1.4 -22% | 1.502 ? -17% | |
| Reader / Idle (h) | 12 | 8.27 ? |
Pro
Contra
Conclusão: Jogador AMD Incompleto com grande potencial
No geral, o sistema all-AMD no Alienware m17 R5 é impressionante, especialmente o desempenho gráfico. No entanto, vários problemas de driver e inconsistências desnecessárias nos impedem de desfrutar verdadeiramente de uma máquina de jogo tão potente.
Além do forte desempenho 3D, gostamos particularmente da qualidade de construção, do display UHD bastante brilhante com alta cobertura de espaço de cores, e do fato de que o jogador é frequentemente silencioso quando não está sob carga e também bastante mais silencioso do que alguns concorrentes sob carga.
Mas é aqui que começam os problemas (do motorista), porque mesmo no modo de sono, os ventiladores de repente fazem marcha lenta por 1-3 segundos sem nenhuma razão. A chave gráfica SmartAccess sempre congela o sistema por vários segundos, ocorrem falhas aleatórias, os modos de desempenho no Centro de Controle dificilmente trazem qualquer mudança no desempenho e certamente poderiam espremer um pouco mais de vida útil da bateria do Alienígena no modo de economia de energia.
O Alienware m17 R5 com CPU AMD e GPU é um forte jogador, mas infelizmente ainda tem muito potencial e necessidade de otimização quando se trata dos drivers.
É uma verdadeira pena que o jogador, de outra forma poderoso, esteja atualmente sendo frustrado em seu potencial por tais problemas. Se você está procurando uma alternativa estável até que estes sejam corrigidos, você tem uma ampla seleção à sua frente: O Lâmina Razer 17 é também uma máquina sólida, enquanto o XMG Neo 17 oferece alto desempenho em combinação com resfriamento líquido. O Asus ROG Strix Scar 17 fornece melhor hardware, bem como um melhor desempenho bruto.
Preço e Disponibilidade
Em Loja da Dell nos EUAas configurações do Alienware m17 R5 começam em US$1399,99. Uma configuração idêntica ao nosso dispositivo de revisão custa US$2549,99.
Alienware m17 R5 (R9 6900HX, RX 6850M XT)
- 01/13/2023 v7 (old)
Christian Hintze
Price comparison

