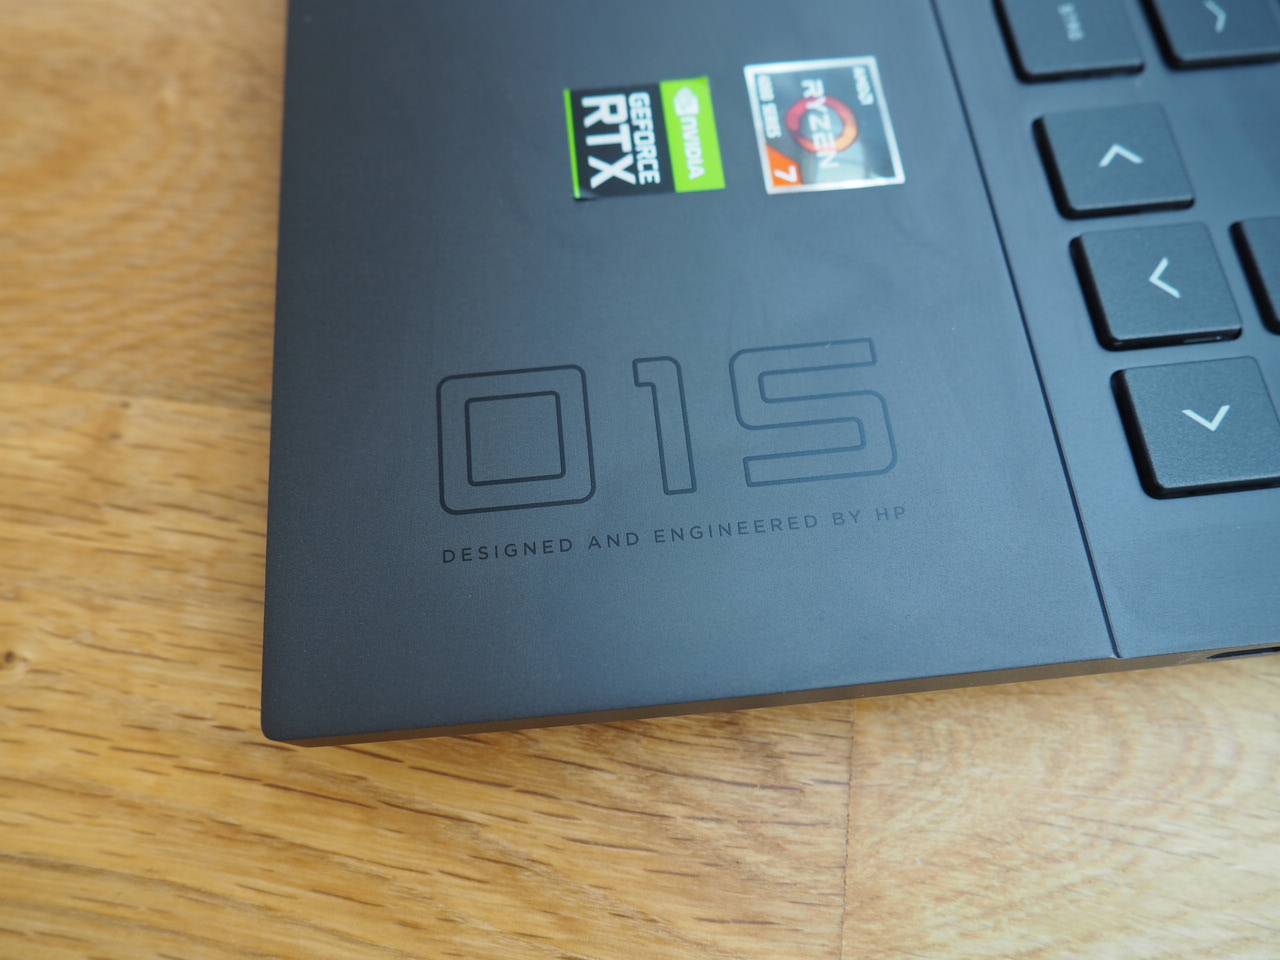
Revisão do laptop HP Omen 15: O forte processador AMD faz a Intel tremer

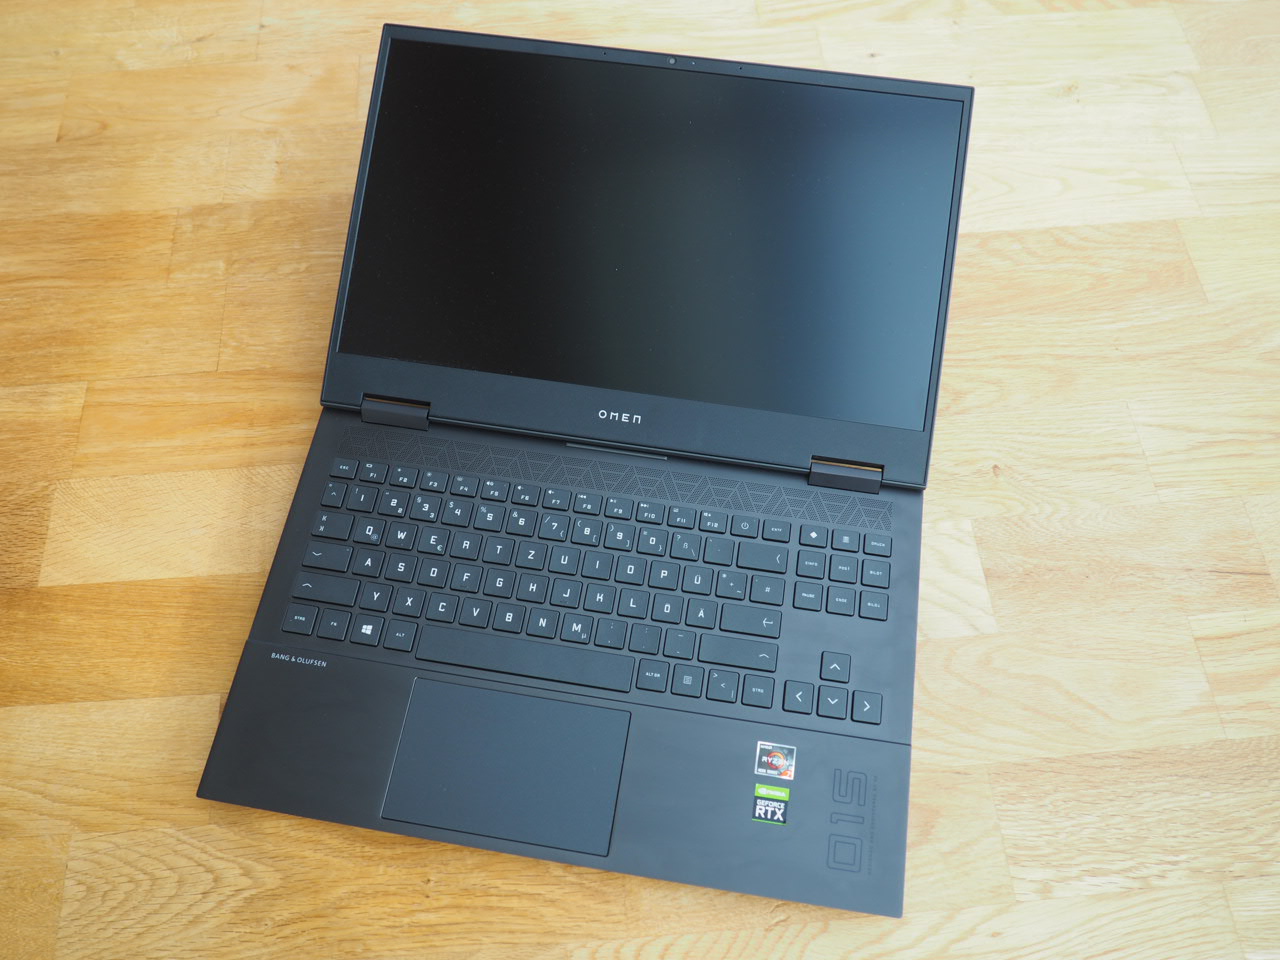
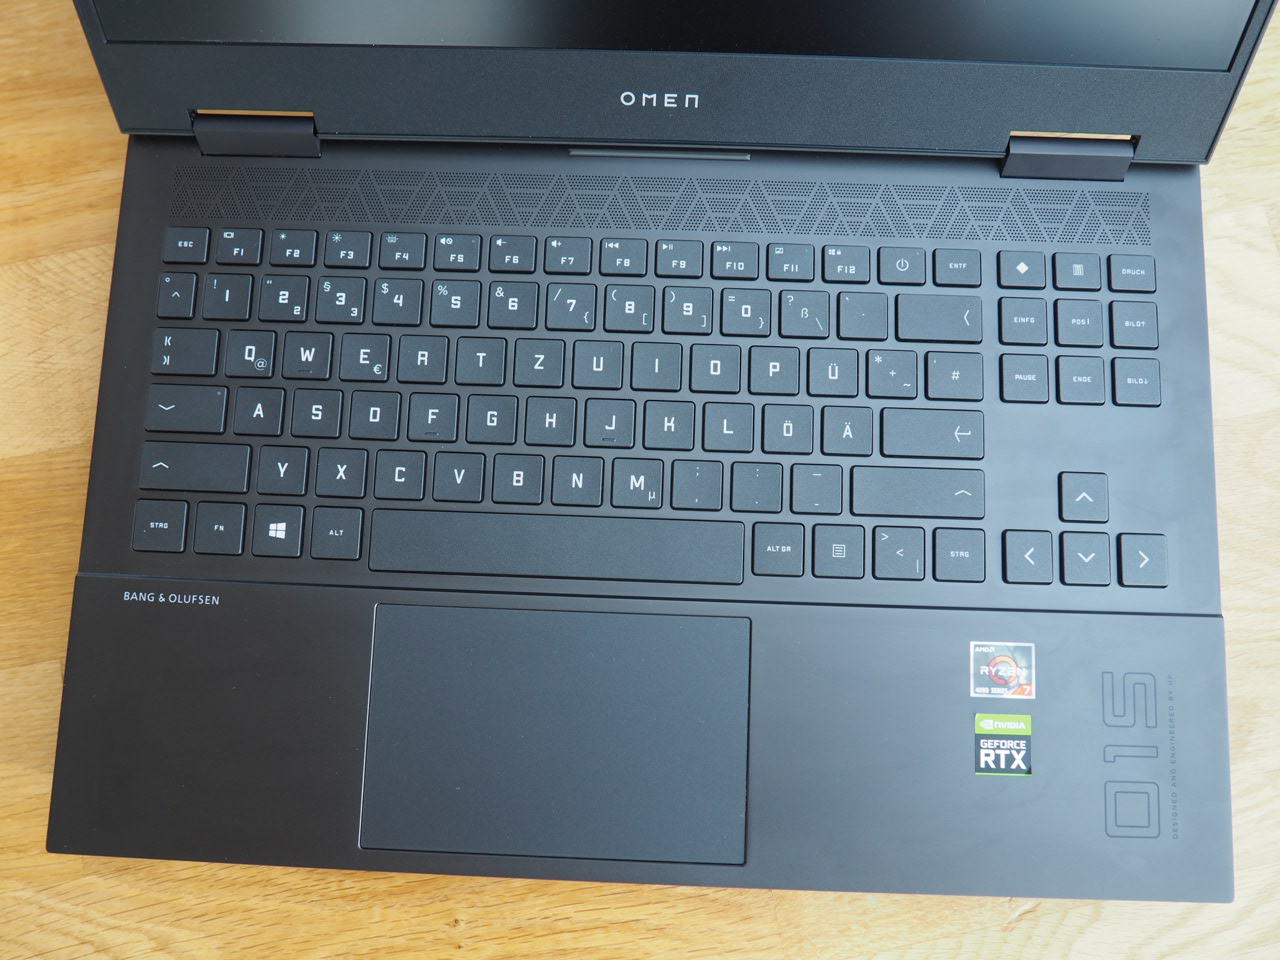
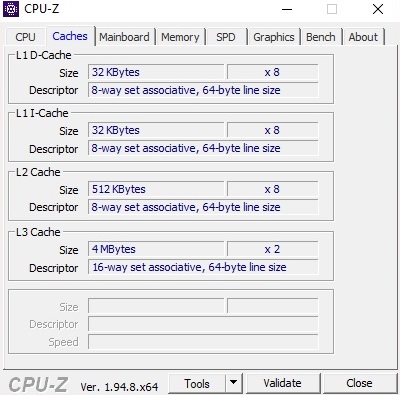
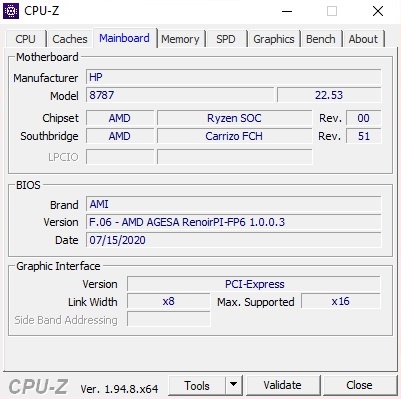
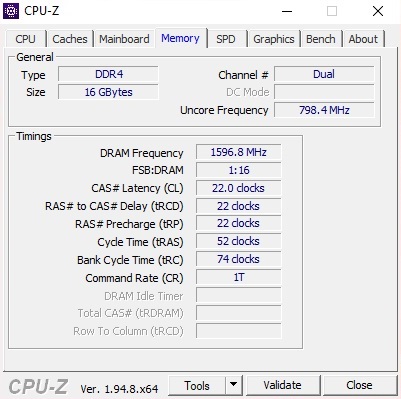
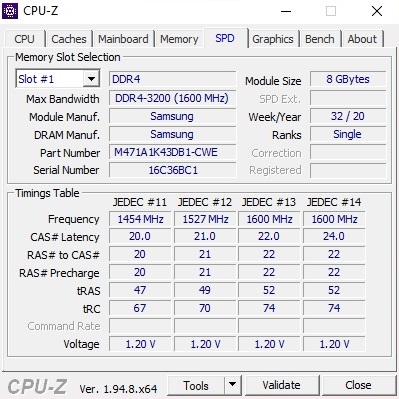
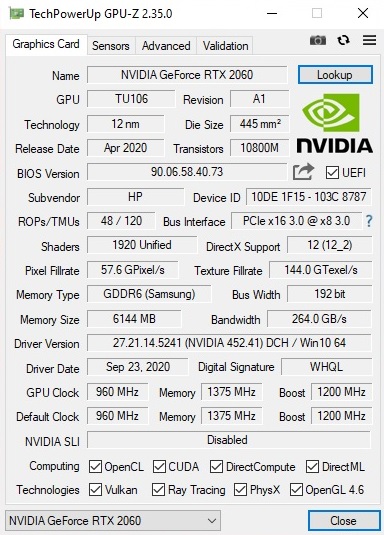
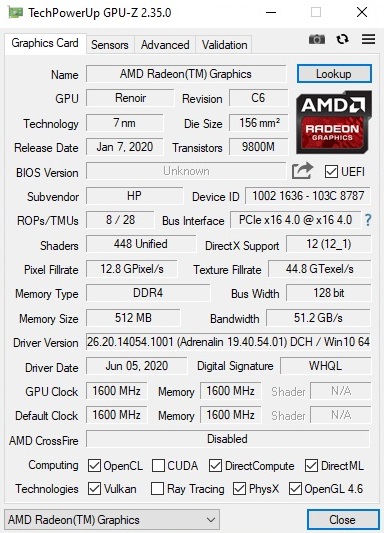
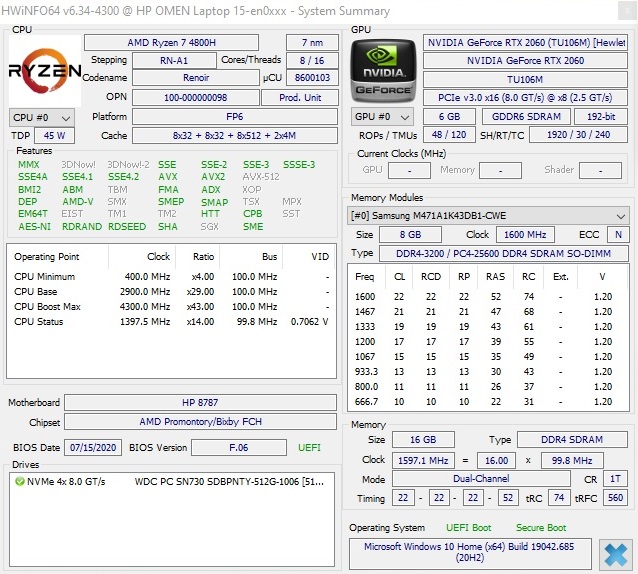
O Omen 15 da HP tem um portfólio de hardware muito amplo. Não há apenas vários modelos Intel, mas também várias variantes AMD. Como placa gráfica é utilizado um chip mid-range ou high-end da geração Turing da Nvidia (GeForce GTX 1650 Ti para RTX 2070). Uma das melhores relações preço-desempenho é atualmente oferecida pelo Omen 15-en0375ng testado por nós, por cerca de 1.260 Euros (~$1530, quecontém umRyzen 7 4800He umGeForce RTX 2060comomencionado no início). As imagens geradas são exibidas em um painel IPS mate com 1.920 x 1.080 pixels. Além disso, há 2x 8 GB DDR4-3.200 RAM em modo de canal duplo e um SSD NVMe de 512 GB no formato M.2 com economia de espaço. O pacote é completado pelo Windows 10 Home 64 bit como sistema operacional
Os concorrentes da Omen 15-en0375ng incluem outros jogadores de 15 polegadas de orçamento com RTX 2060, como o Schenker XMG Core 15, o Asus TUF A15, o Acer Predator Triton 300, o Aorus 5 KB, e o Lenovo Legion 5. Cada um destes cadernos aparece na tabela como dispositivo de comparação
Possible competitors in comparison
Avaliação | Data | Modelo | Peso | Altura | Size | Resolução | Preço |
|---|---|---|---|---|---|---|---|
| 82.8 % v7 (old) | 01/2021 | HP Omen 15-en0375ng R7 4800H, GeForce RTX 2060 Mobile | 2.2 kg | 23 mm | 15.60" | 1920x1080 | |
| 82.1 % v7 (old) | 10/2020 | Schenker XMG Core 15 GK5NR0O R7 4800H, GeForce RTX 2060 Mobile | 2 kg | 19.9 mm | 15.60" | 1920x1080 | |
| 82.7 % v7 (old) | 06/2020 | Asus TUF Gaming A15 FA506IV-HN172 R7 4800H, GeForce RTX 2060 Mobile | 2.2 kg | 24.9 mm | 15.60" | 1920x1080 | |
| 82.1 % v7 (old) | 12/2020 | Acer Predator Triton 300 PT315-52-79LP i7-10750H, GeForce RTX 2060 Mobile | 2.1 kg | 19.9 mm | 15.60" | 1920x1080 | |
| 83.7 % v7 (old) | 10/2020 | Aorus 5 KB i7-10750H, GeForce RTX 2060 Mobile | 2.1 kg | 28 mm | 15.60" | 1920x1080 | |
| 83.3 % v7 (old) | 07/2020 | Lenovo Legion 5 15IMH05H i5-10300H, GeForce RTX 2060 Mobile | 2.5 kg | 26.1 mm | 15.60" | 1920x1080 |
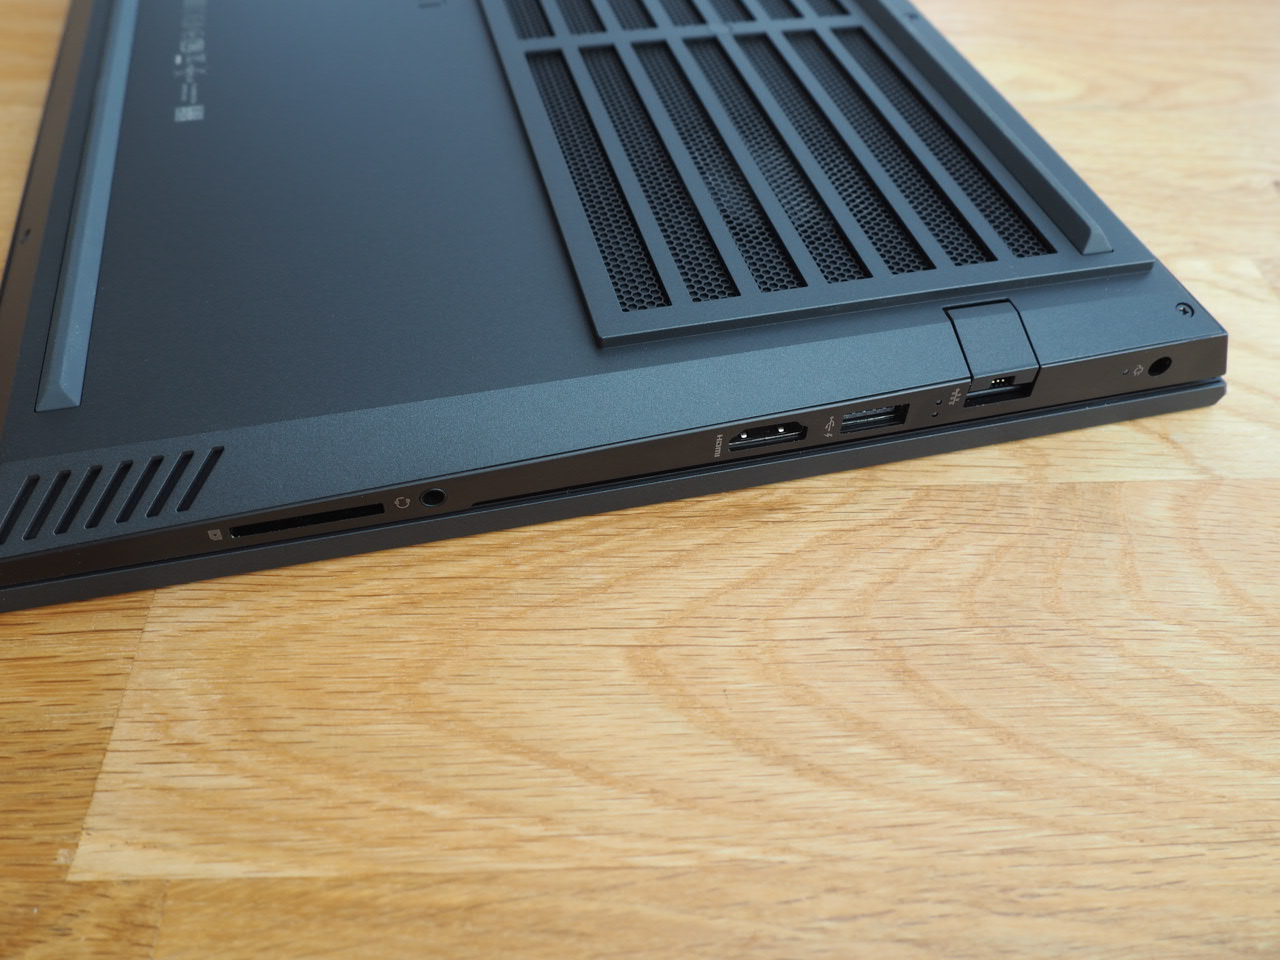
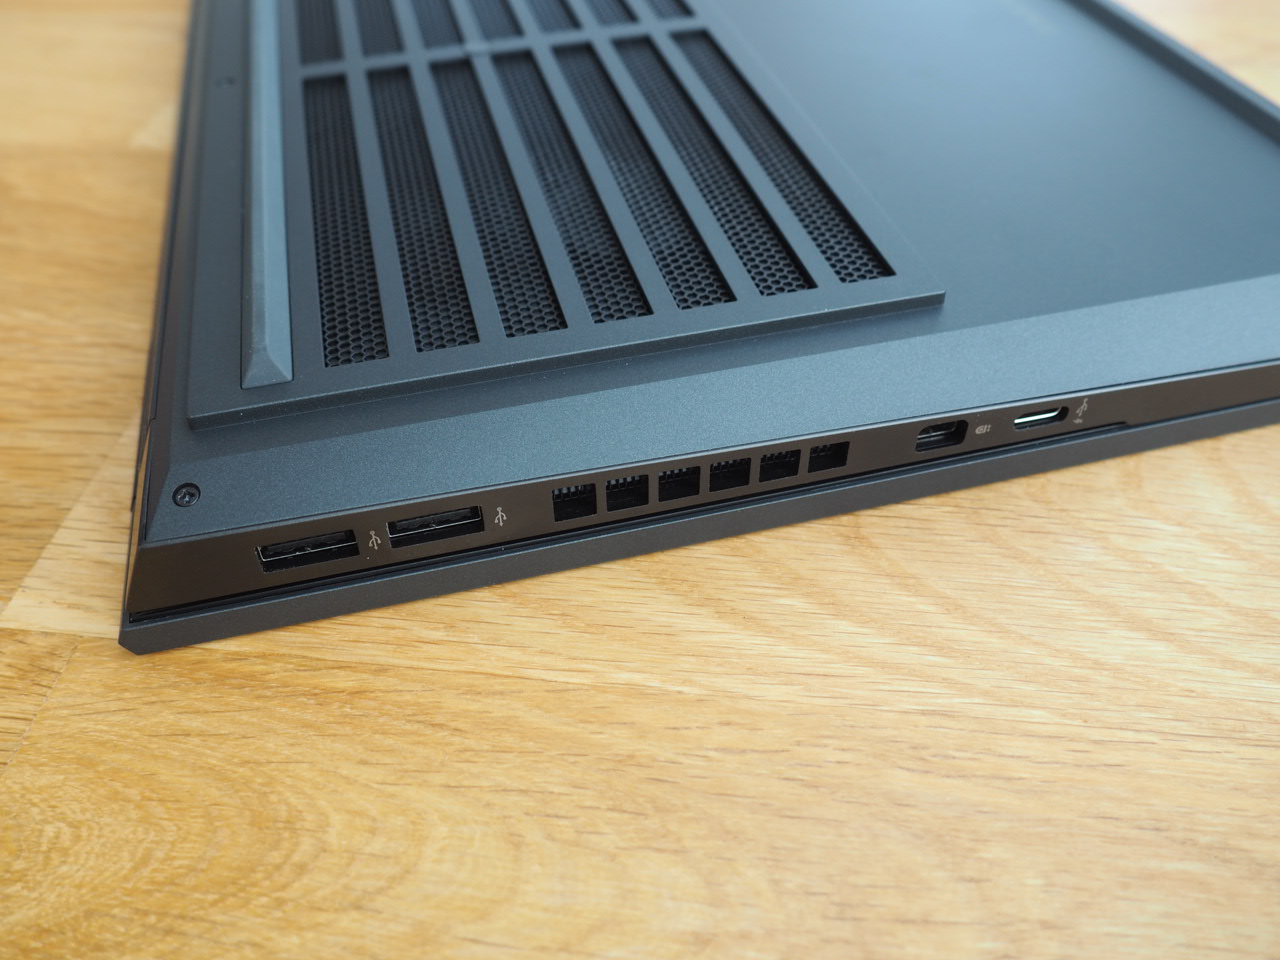
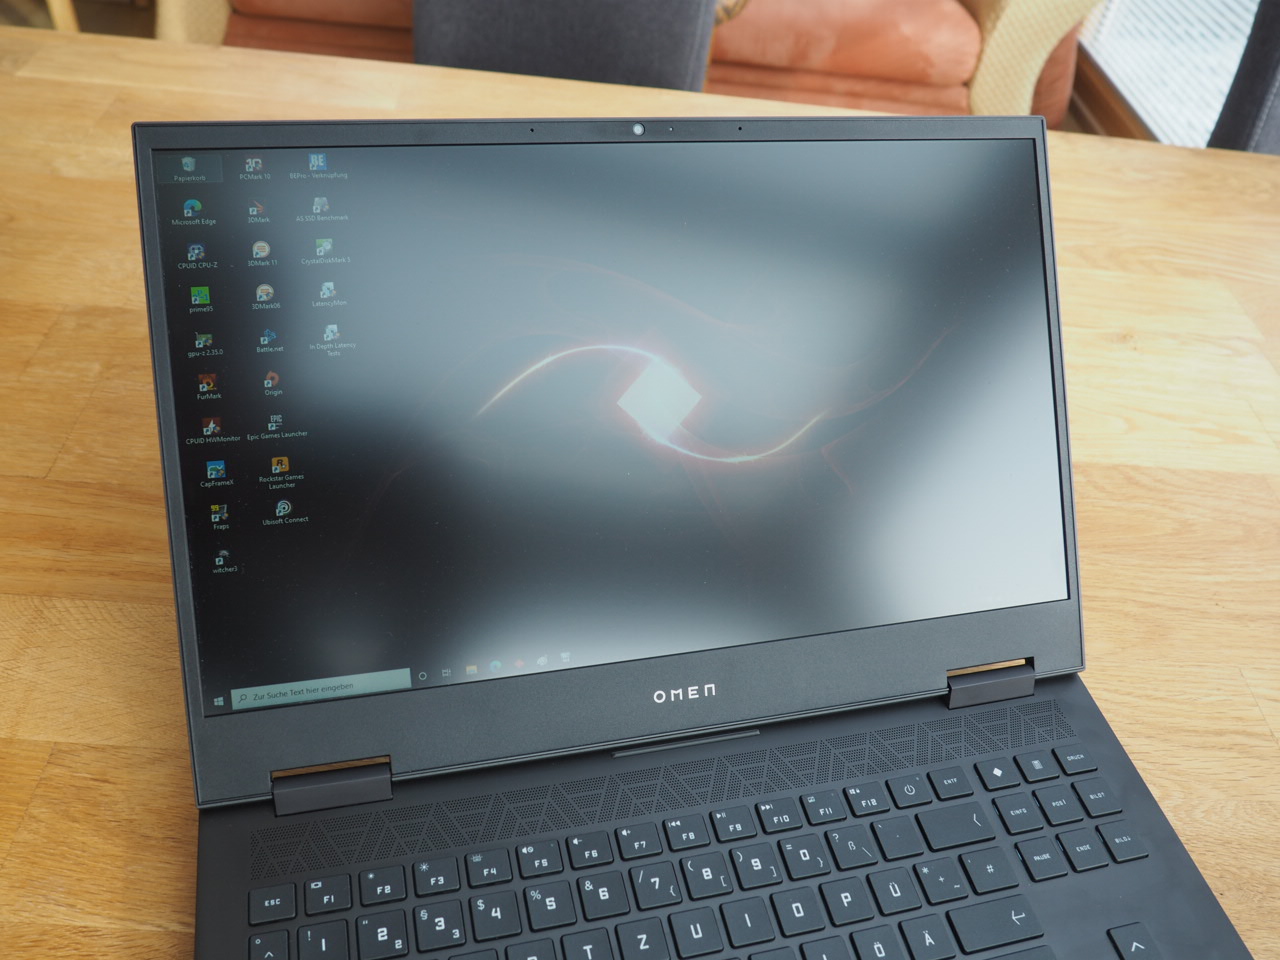
O chassi é basicamente o mesmo que o Omen 15-ek0456ng que testamos há alguns meses, razão pela qual nos abstemos de analisar novamente o chassi, o equipamento e os dispositivos de entrada. No entanto, os modelos não são completamente idênticos. Por exemplo, a versão AMD tem uma etiqueta ou iluminação de teclado branca em vez de vermelha. Os compradores também terão que passar sem uma porta Thunderbolt 3
SDCardreader
| SD Card Reader | |
| average JPG Copy Test (av. of 3 runs) | |
| Média da turma Gaming (20.9 - 210, n=54, últimos 2 anos) | |
| Aorus 5 KB (Toshiba Exceria Pro SDXC 64 GB UHS-II) | |
| HP Omen 15-en0375ng (Toshiba Exceria Pro SDXC 64 GB UHS-II) | |
| Schenker XMG Core 15 GK5NR0O (Toshiba Exceria Pro SDXC 64 GB UHS-II) | |
| maximum AS SSD Seq Read Test (1GB) | |
| Média da turma Gaming (25.5 - 261, n=51, últimos 2 anos) | |
| HP Omen 15-en0375ng (Toshiba Exceria Pro SDXC 64 GB UHS-II) | |
| Aorus 5 KB (Toshiba Exceria Pro SDXC 64 GB UHS-II) | |
| Schenker XMG Core 15 GK5NR0O (Toshiba Exceria Pro SDXC 64 GB UHS-II) | |
Comunicação
Webcam


Mostrar
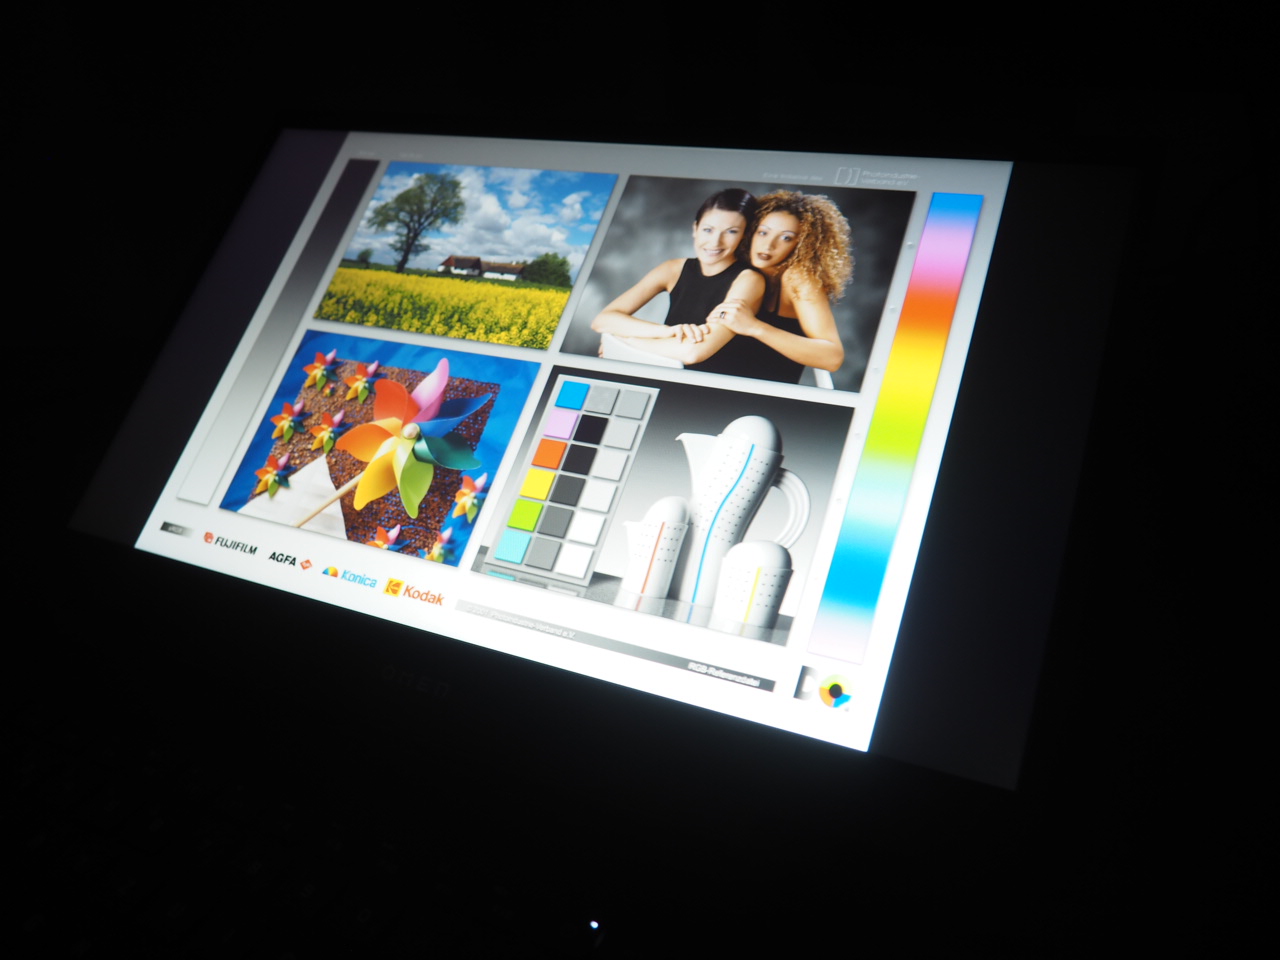
Vamos direto a uma das maiores decepções: a exposição. Enquanto a variante Intel poderia se exibir com um bom painel de 144 Hz no teste, a edição AMD tem apenas um painel medíocre de 60 Hz a bordo
| |||||||||||||||||||||||||
iluminação: 88 %
iluminação com acumulador: 297 cd/m²
Contraste: 900:1 (Preto: 0.33 cd/m²)
ΔE ColorChecker Calman: 4.54 | ∀{0.5-29.43 Ø4.71}
calibrated: 4.66
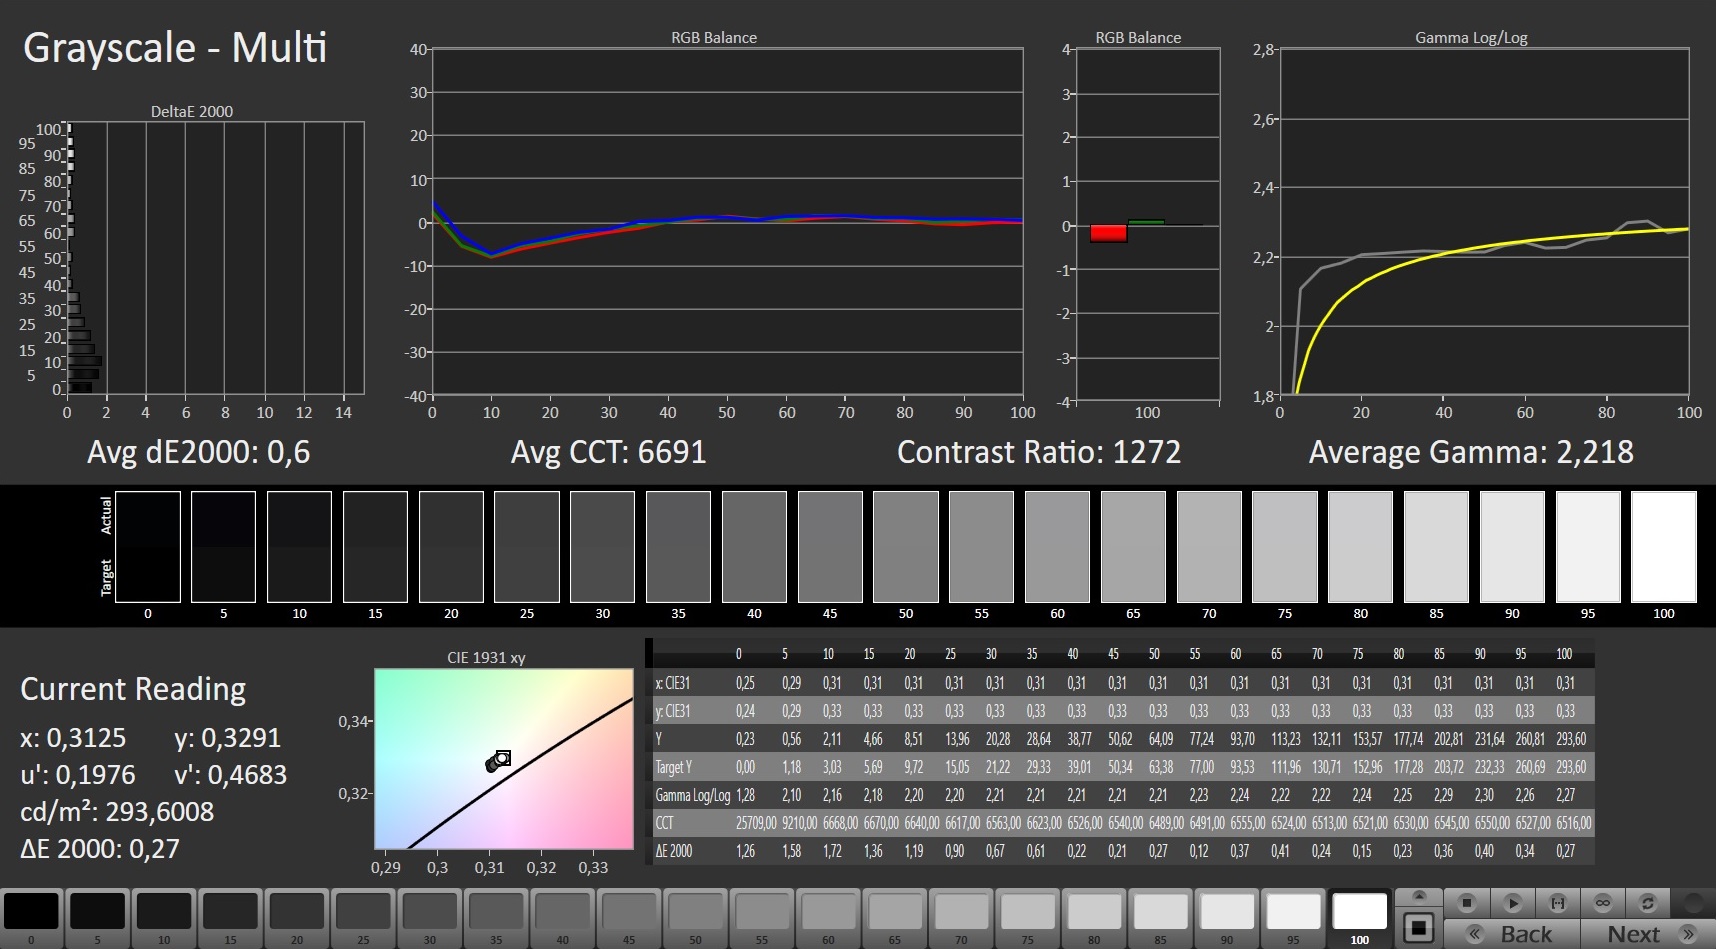
ΔE Greyscale Calman: 2.1 | ∀{0.09-98 Ø4.96}
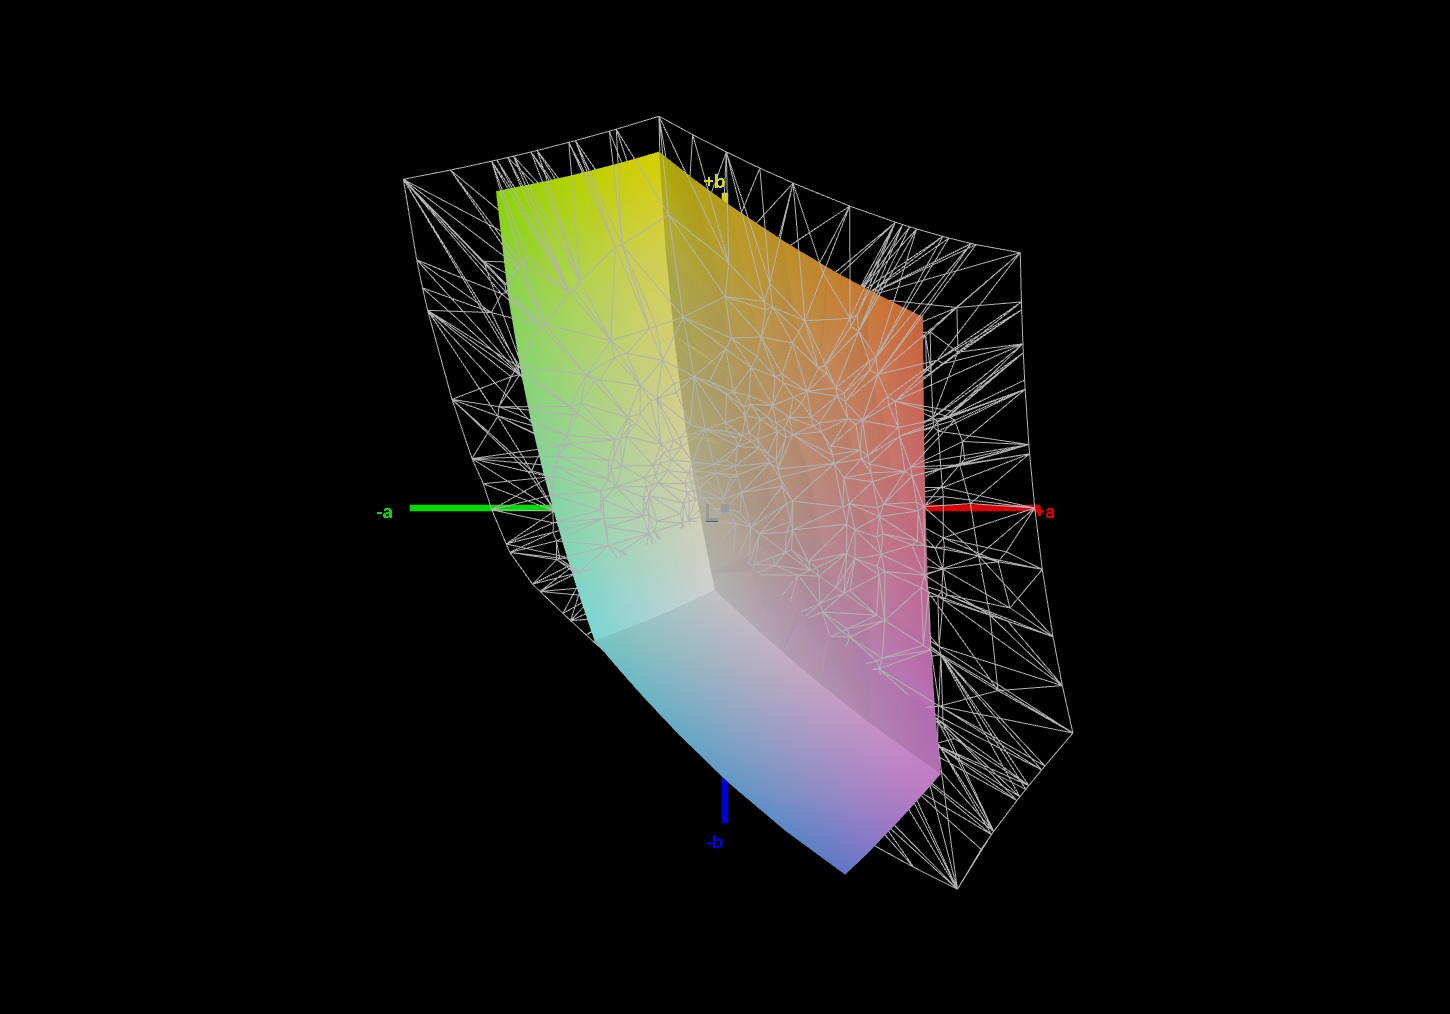
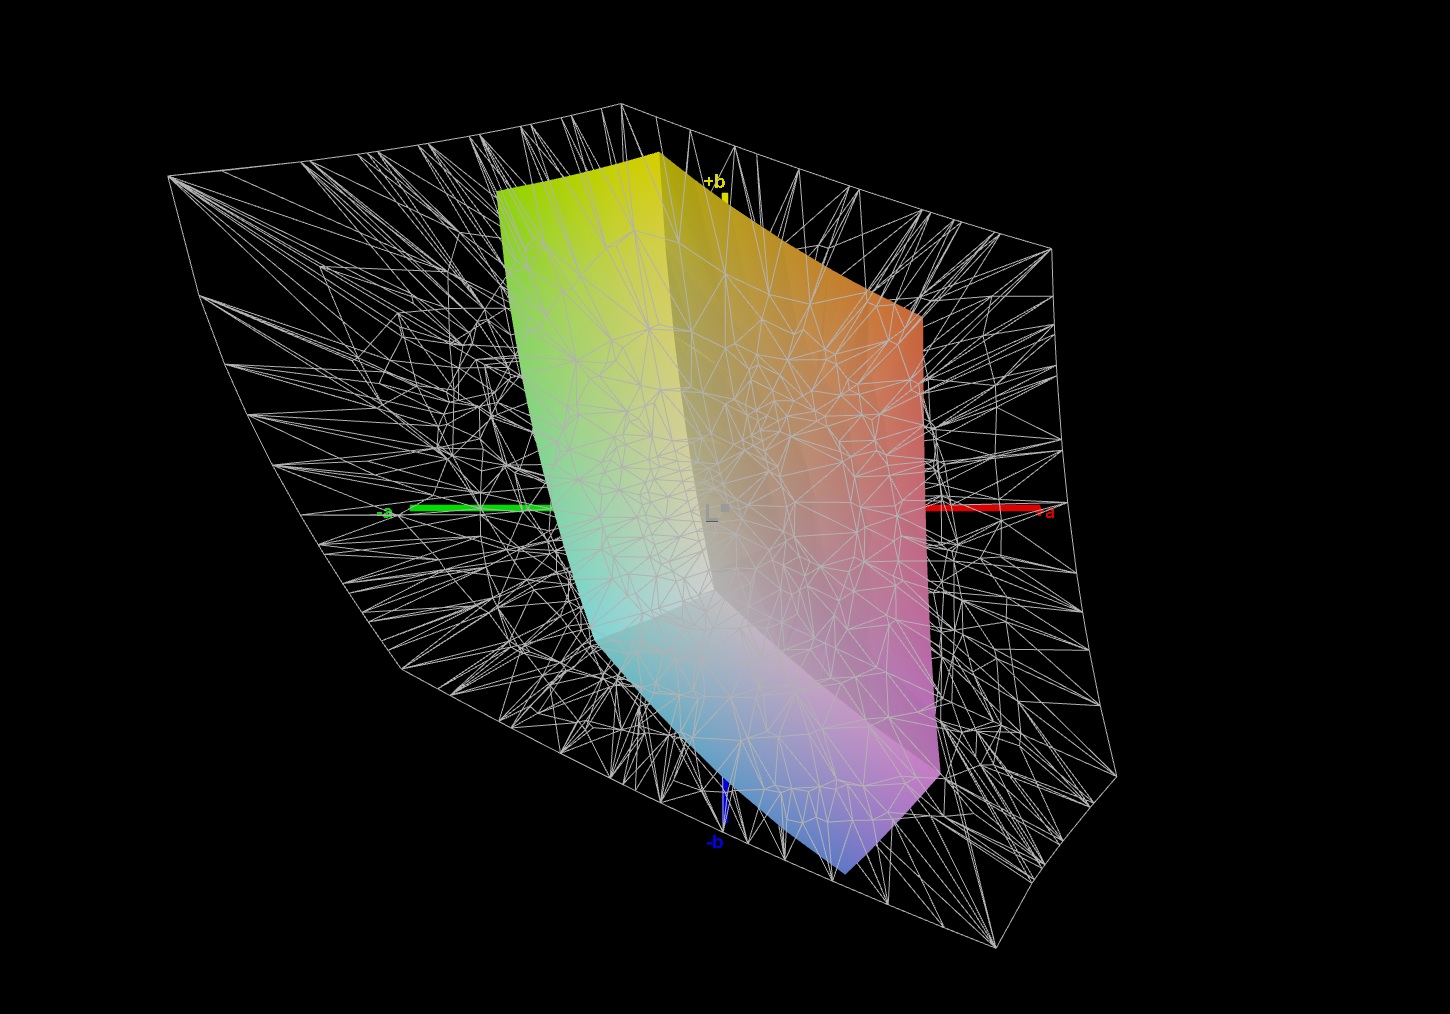
58% sRGB (Argyll 1.6.3 3D)
40% AdobeRGB 1998 (Argyll 1.6.3 3D)
40.42% AdobeRGB 1998 (Argyll 3D)
57.6% sRGB (Argyll 3D)
39.12% Display P3 (Argyll 3D)
Gamma: 2.066
CCT: 6291 K
| HP Omen 15-en0375ng BOE0852, IPS, 1920x1080, 15.6" | Schenker XMG Core 15 GK5NR0O LM156LF-1F02, IPS, 1920x1080, 15.6" | Asus TUF Gaming A15 FA506IV-HN172 LM156LF-2F01, IPS, 1920x1080, 15.6" | Acer Predator Triton 300 PT315-52-79LP BOE08FB, IPS, 1920x1080, 15.6" | Aorus 5 KB LG Philips LP156WFG-SPB2 (LGD05E8), IPS, 1920x1080, 15.6" | Lenovo Legion 5 15IMH05H BOE CQ NV156FHM-NX1, IPS, 1920x1080, 15.6" | |
|---|---|---|---|---|---|---|
| Display | 69% | 0% | 1% | 61% | -1% | |
| Display P3 Coverage (%) | 39.12 | 67.2 72% | 38.92 -1% | 39.51 1% | 63.4 62% | 38.8 -1% |
| sRGB Coverage (%) | 57.6 | 95.9 66% | 58.5 2% | 58.1 1% | 92.8 61% | 57.8 0% |
| AdobeRGB 1998 Coverage (%) | 40.42 | 68.5 69% | 40.22 0% | 40.81 1% | 64.8 60% | 40.09 -1% |
| Response Times | 61% | -14% | 4% | 50% | 16% | |
| Response Time Grey 50% / Grey 80% * (ms) | 30.4 ? | 9.6 ? 68% | 34 ? -12% | 29.2 ? 4% | 14.4 ? 53% | 26 ? 14% |
| Response Time Black / White * (ms) | 20.8 ? | 9.6 ? 54% | 24 ? -15% | 20 ? 4% | 11.2 ? 46% | 17 ? 18% |
| PWM Frequency (Hz) | 200 ? | |||||
| Screen | 0% | 1% | -8% | 33% | 0% | |
| Brightness middle (cd/m²) | 297 | 312 5% | 280 -6% | 279 -6% | 318 7% | 301 1% |
| Brightness (cd/m²) | 275 | 290 5% | 254 -8% | 257 -7% | 298 8% | 277 1% |
| Brightness Distribution (%) | 88 | 87 -1% | 88 0% | 89 1% | 87 -1% | 77 -12% |
| Black Level * (cd/m²) | 0.33 | 0.2 39% | 0.15 55% | 0.31 6% | 0.3 9% | 0.26 21% |
| Contrast (:1) | 900 | 1560 73% | 1867 107% | 900 0% | 1060 18% | 1158 29% |
| Colorchecker dE 2000 * | 4.54 | 4.84 -7% | 5.89 -30% | 5.84 -29% | 2.49 45% | 5.12 -13% |
| Colorchecker dE 2000 max. * | 18.92 | 13.85 27% | 19 -0% | 21.8 -15% | 5.06 73% | 8.86 53% |
| Colorchecker dE 2000 calibrated * | 4.66 | 1.77 62% | 4.79 -3% | 4.54 3% | 1.53 67% | 4.88 -5% |
| Greyscale dE 2000 * | 2.1 | 9 -329% | 4.08 -94% | 3.1 -48% | 1.6 24% | 3.47 -65% |
| Gamma | 2.066 106% | 2.105 105% | 2.33 94% | 2.116 104% | 2.211 100% | 2.37 93% |
| CCT | 6291 103% | 8099 80% | 7303 89% | 6577 99% | 6714 97% | 7062 92% |
| Color Space (Percent of AdobeRGB 1998) (%) | 40 | 68 70% | 37 -7% | 41 2% | 65 63% | 37 -7% |
| Color Space (Percent of sRGB) (%) | 58 | 92 59% | 58 0% | 59 2% | 89 53% | 57 -2% |
| Média Total (Programa/Configurações) | 43% /
21% | -4% /
-1% | -1% /
-5% | 48% /
41% | 5% /
2% |
* ... menor é melhor
Além do tempo de resposta, o contraste também é muito pior. Em vez de mais de 1400:1, o modelo AMD tem apenas uma proporção de 900:1. O modelo Intel também está normalmente à frente nas outras disciplinas - seja a precisão da cor, o valor do preto ou o brilho. O Omen 15-en0375ng dificilmente é adequado para uso externo devido a seu brilho escasso (aprox. 275 cd/m²)
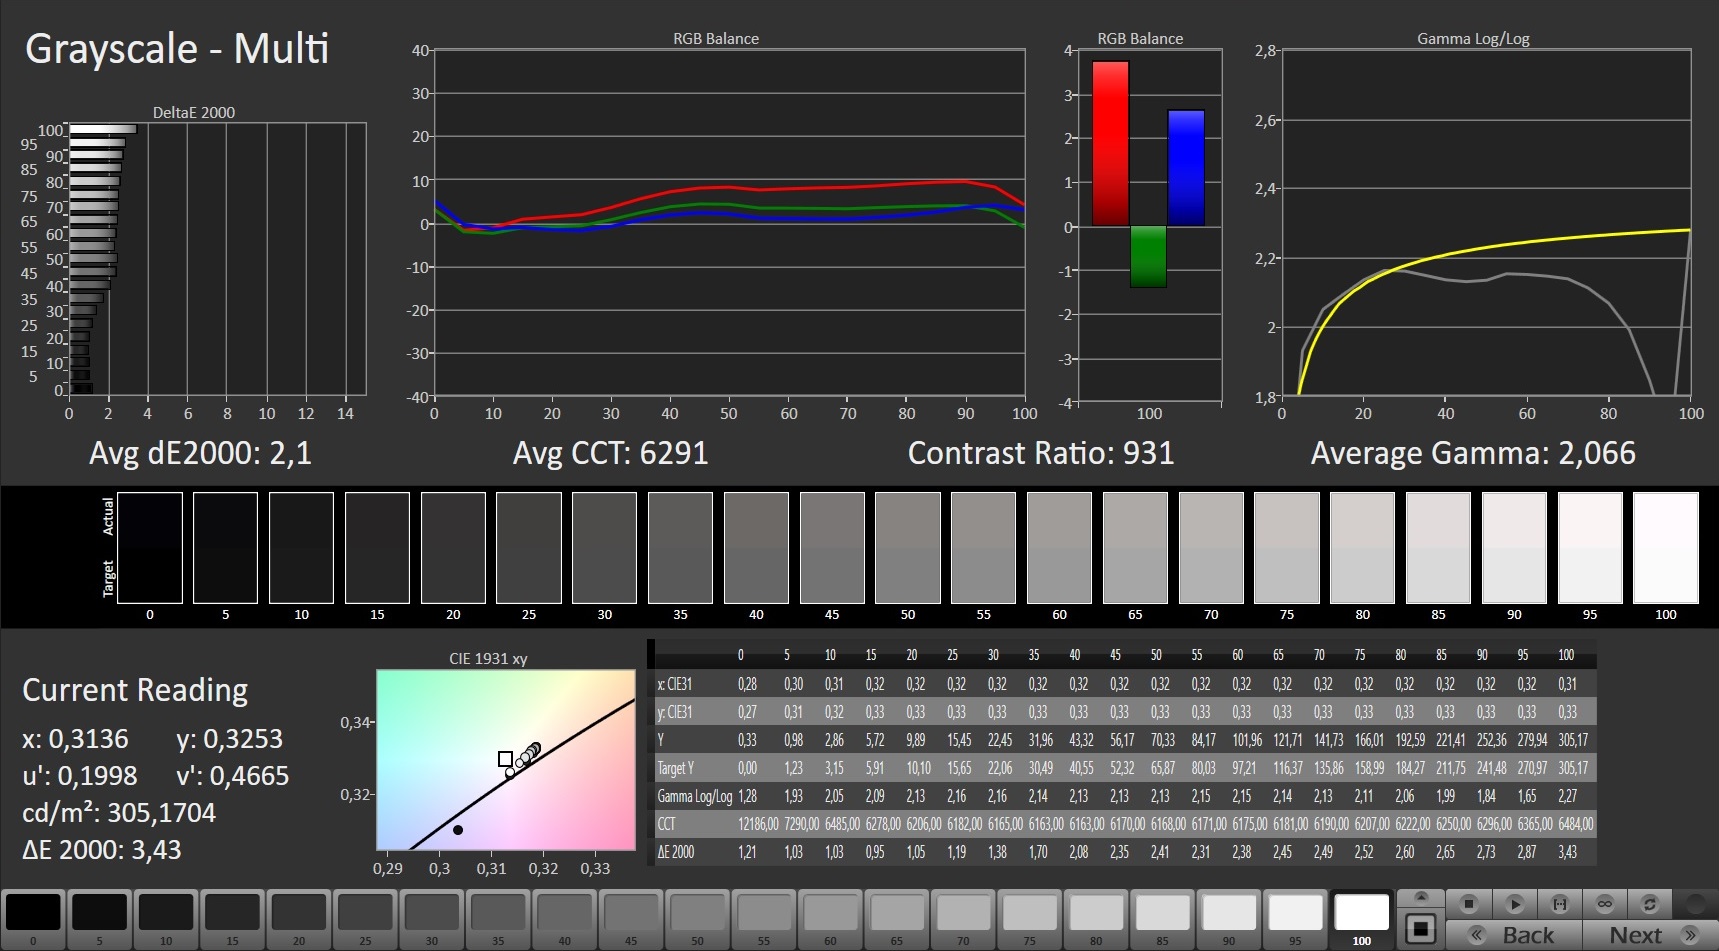
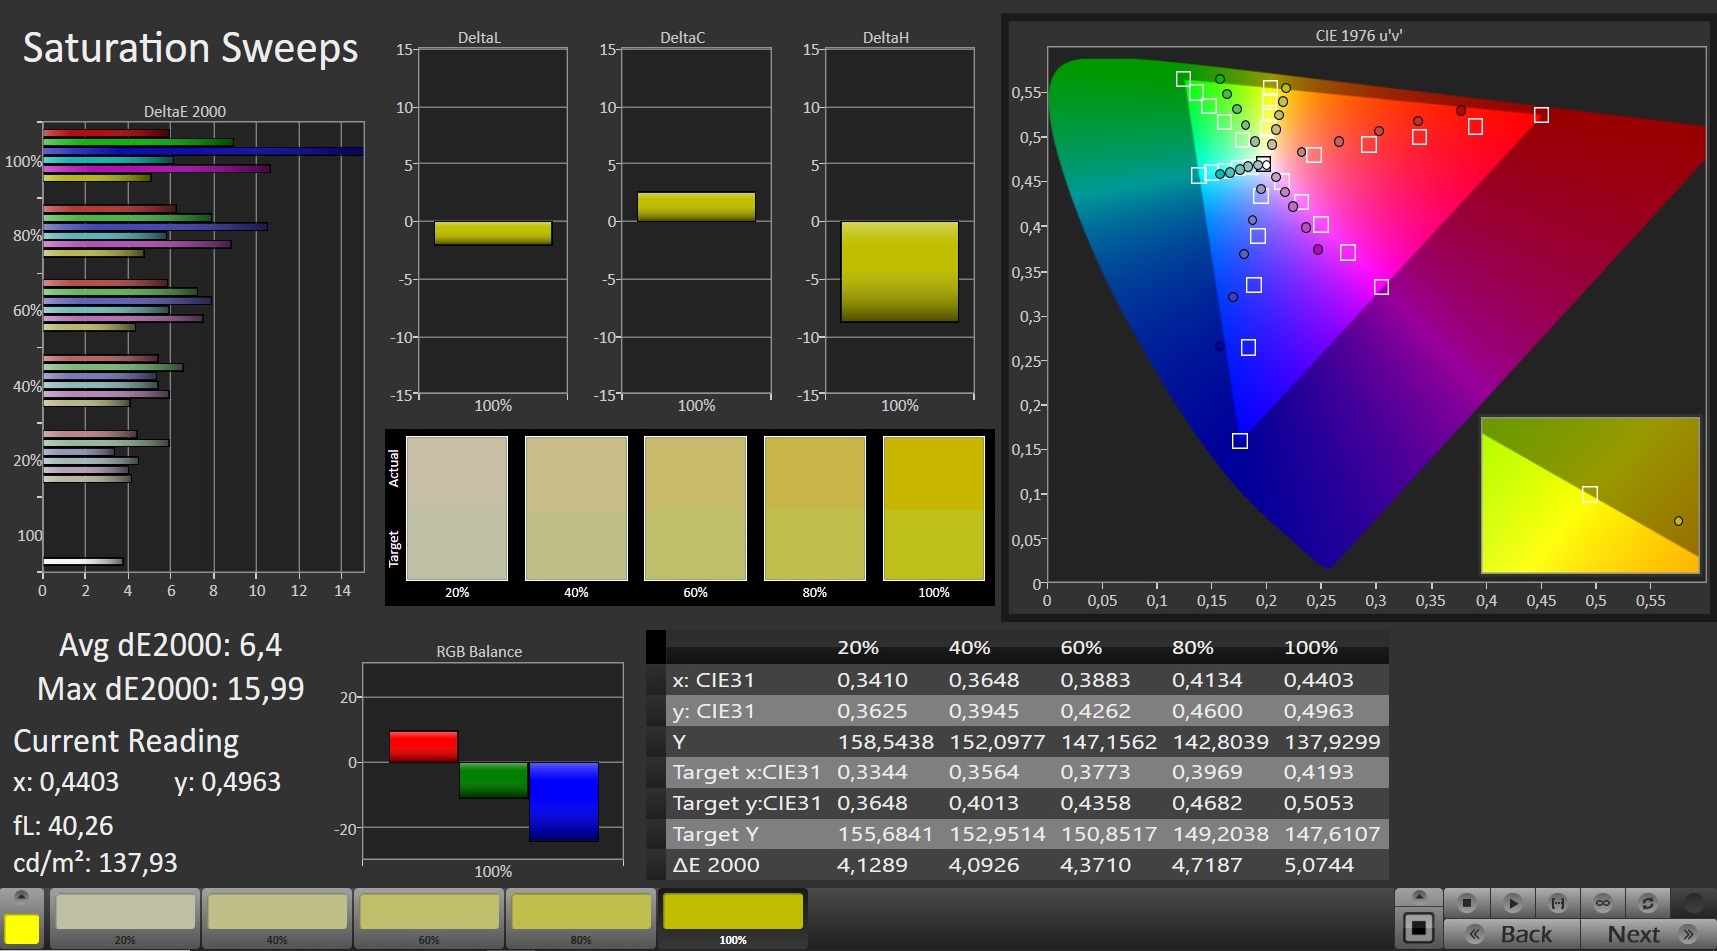
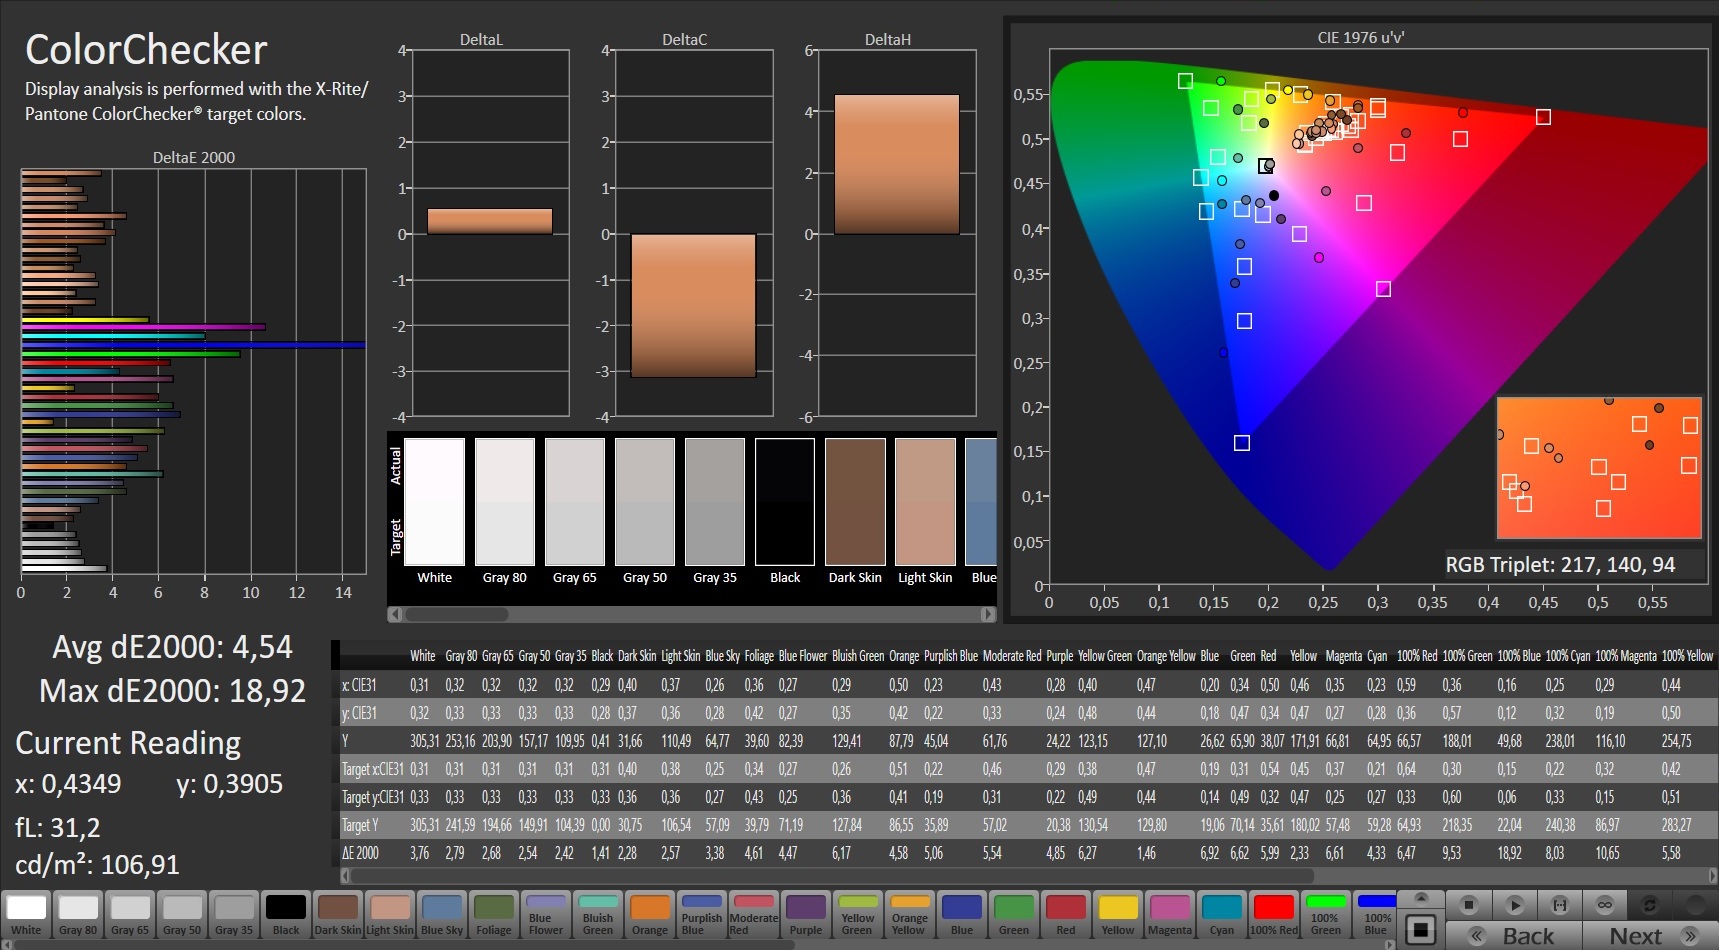
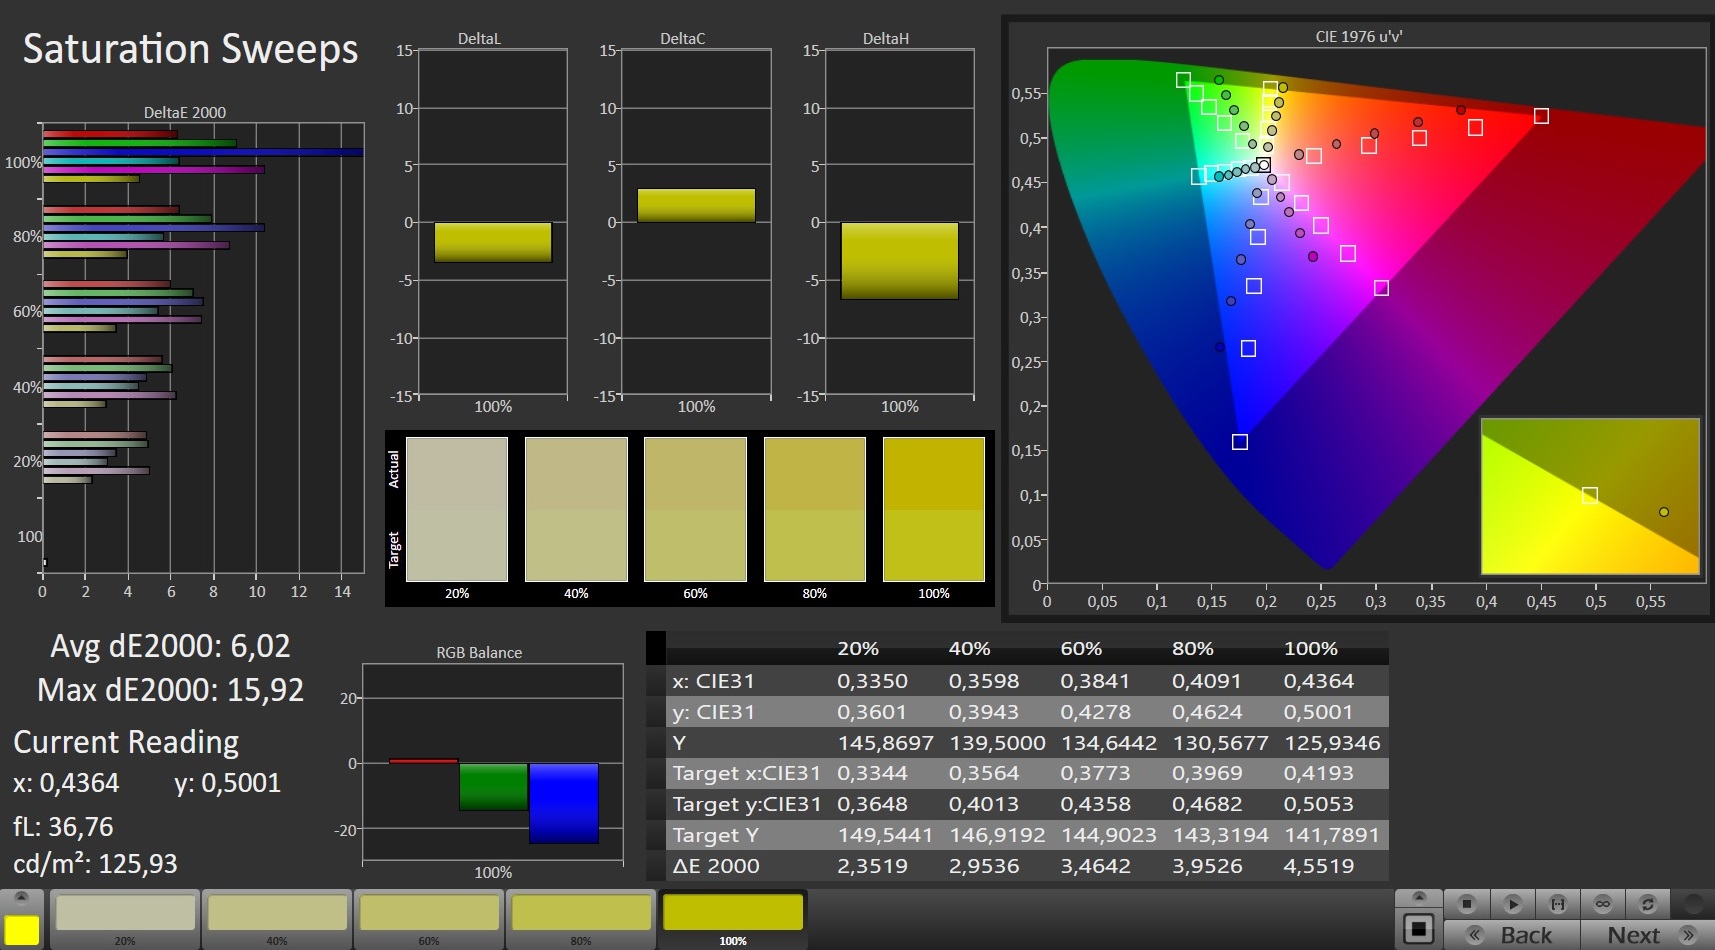
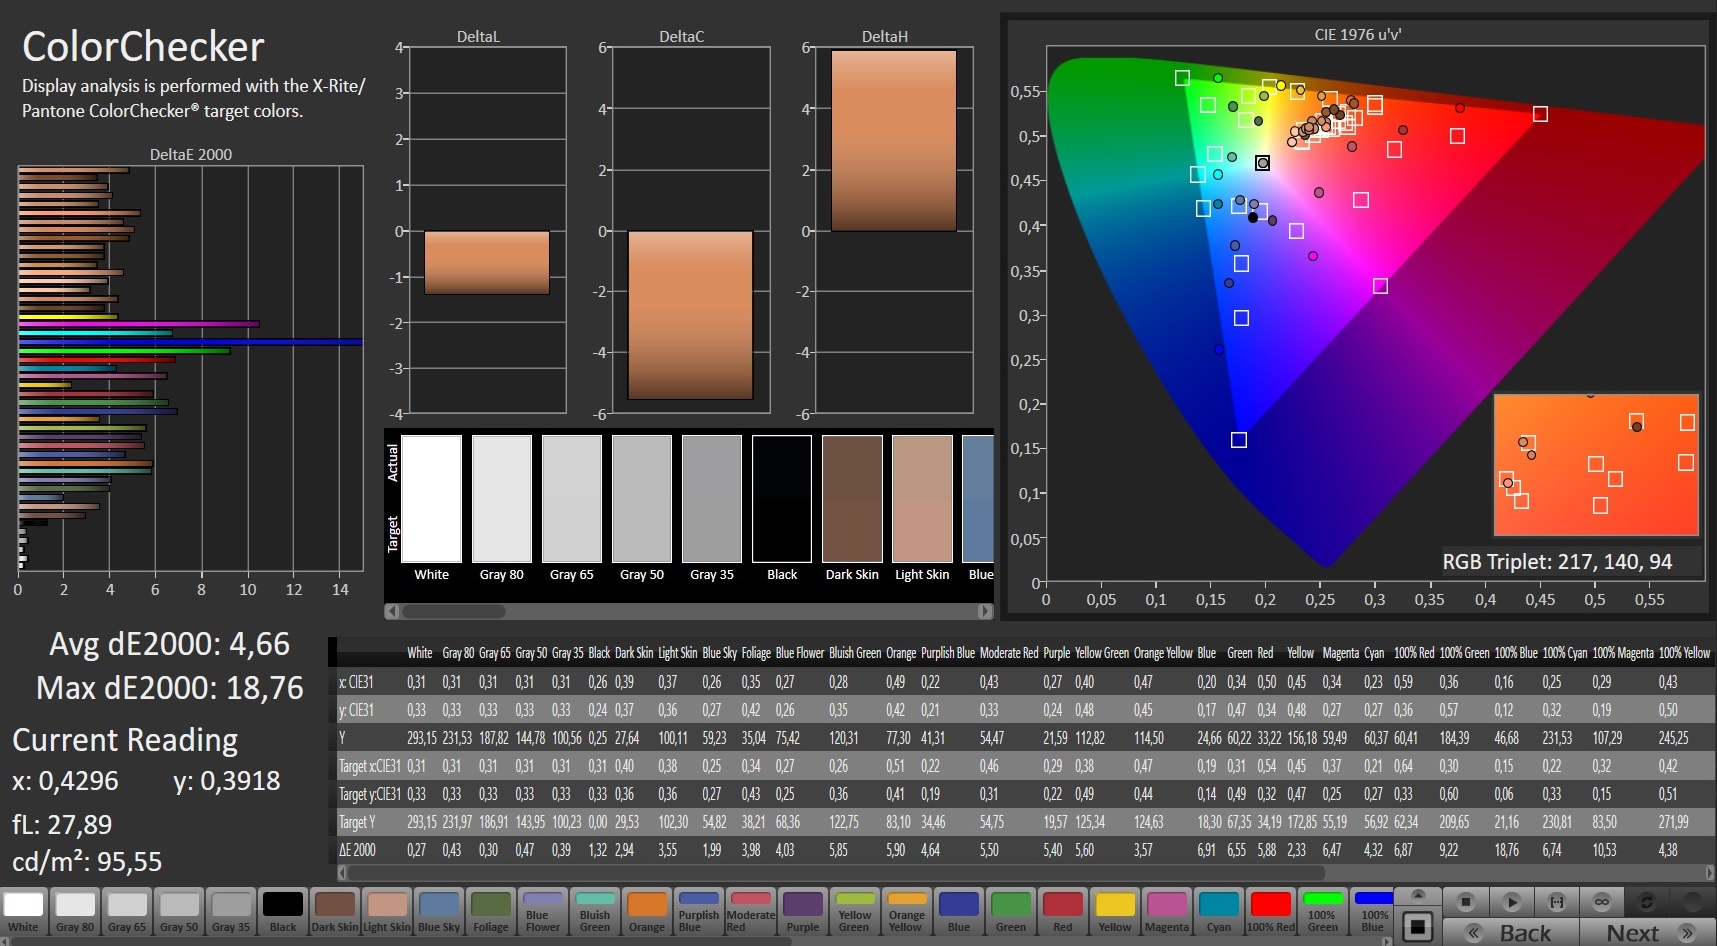
Entretanto, o pequeno espaço de cores é o maior inconveniente aos nossos olhos: 58% sRGB e 40% AdobeRGB resultam em imagens bastante pálidas e indiferenciadas. A boa estabilidade do ângulo de visão só pode compensar esta deficiência até certo ponto. Em resumo, a qualidade da imagem não faz justiça ao preço do notebook. Independentemente de ser um produto econômico ou uma máquina de luxo: Esperamos um painel de alta qualidade com pelo menos 300 cd/m² de brilho, pelo menos 1000:1 de contraste e pelo menos 80% de cobertura sRGB para laptops de jogos - e 120 Hz para cima por 1.000 Euros (~$1214)
No entanto, a HP não está sozinha em seu mau desempenho. Com exceção do Schenker Core 15 e Aorus 5 KB, as exibições da concorrência também deixam muito a desejar. Atenção: Abaixo de um brilho de 100%, a tela cintila com 200 Hz, o que pode causar problemas para pessoas sensíveis
Exibir tempos de resposta
| ↔ Tempo de resposta preto para branco | ||
|---|---|---|
| 20.8 ms ... ascensão ↗ e queda ↘ combinadas | ↗ 11.6 ms ascensão | 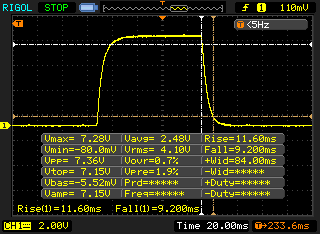 |
| ↘ 9.2 ms queda | ||
| A tela mostra boas taxas de resposta em nossos testes, mas pode ser muito lenta para jogadores competitivos. Em comparação, todos os dispositivos testados variam de 0.1 (mínimo) a 240 (máximo) ms. » 46 % de todos os dispositivos são melhores. Isso significa que o tempo de resposta medido é semelhante à média de todos os dispositivos testados (19.8 ms). | ||
| ↔ Tempo de resposta 50% cinza a 80% cinza | ||
| 30.4 ms ... ascensão ↗ e queda ↘ combinadas | ↗ 16.4 ms ascensão | 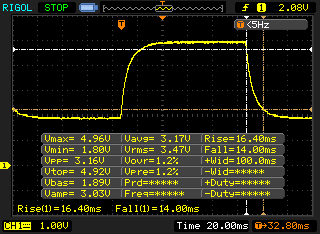 |
| ↘ 14 ms queda | ||
| A tela mostra taxas de resposta lentas em nossos testes e será insatisfatória para os jogadores. Em comparação, todos os dispositivos testados variam de 0.165 (mínimo) a 636 (máximo) ms. » 41 % de todos os dispositivos são melhores. Isso significa que o tempo de resposta medido é semelhante à média de todos os dispositivos testados (30.9 ms). | ||
Cintilação da tela / PWM (modulação por largura de pulso)
| Tela tremeluzindo/PWM detectado | 200 Hz | ≤ 99 % configuração de brilho | 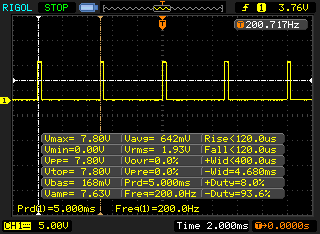 |
A luz de fundo da tela pisca em 200 Hz (pior caso, por exemplo, utilizando PWM) Cintilação detectada em uma configuração de brilho de 99 % e abaixo. Não deve haver cintilação ou PWM acima desta configuração de brilho. A frequência de 200 Hz é relativamente baixa, portanto, usuários sensíveis provavelmente notarão cintilação e sentirão fadiga ocular na configuração de brilho indicada e abaixo. [pwm_comparison] Em comparação: 52 % de todos os dispositivos testados não usam PWM para escurecer a tela. Se PWM foi detectado, uma média de 7741 (mínimo: 5 - máximo: 343500) Hz foi medida. | |||
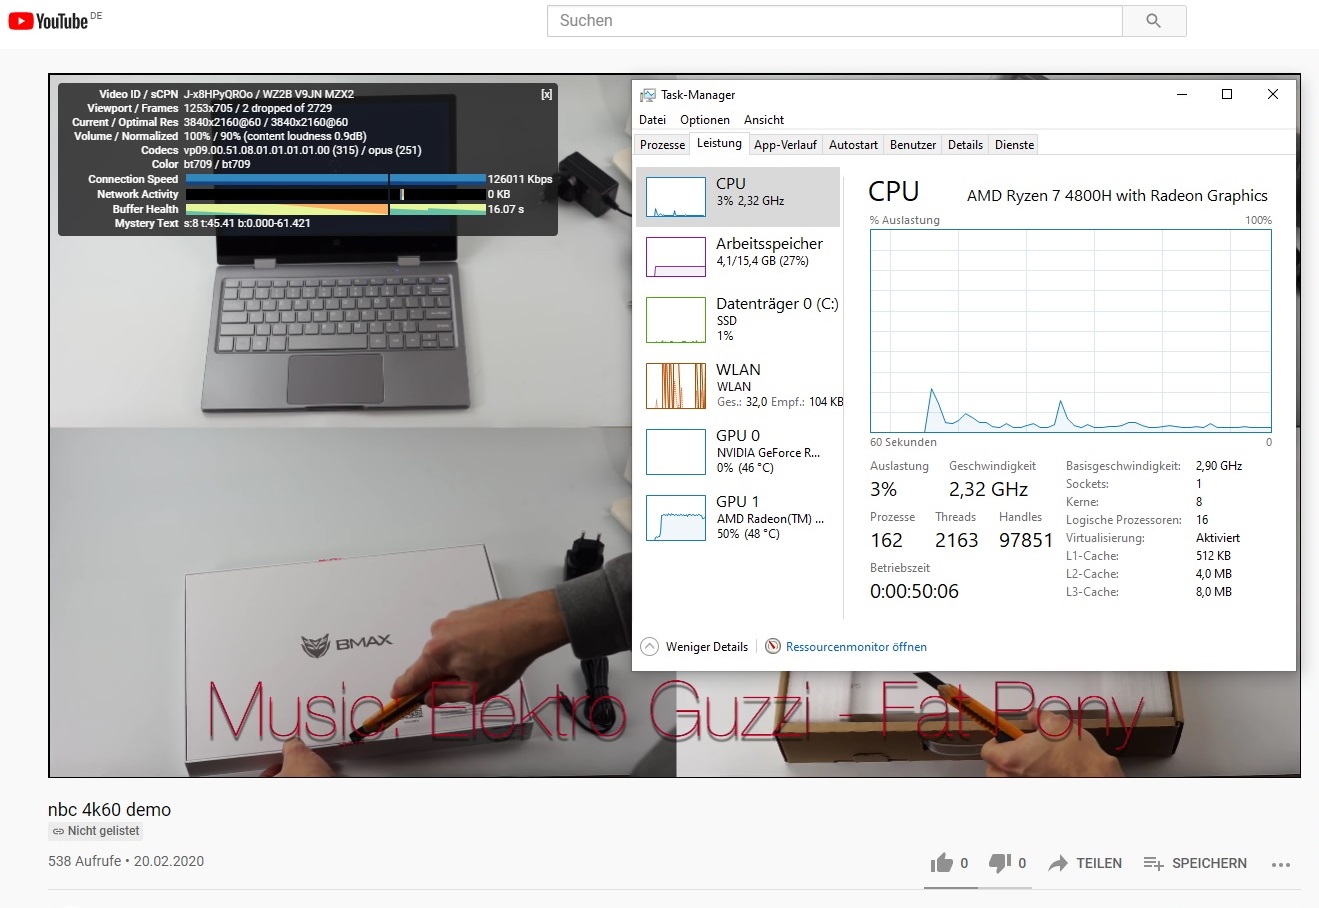
Condições de teste
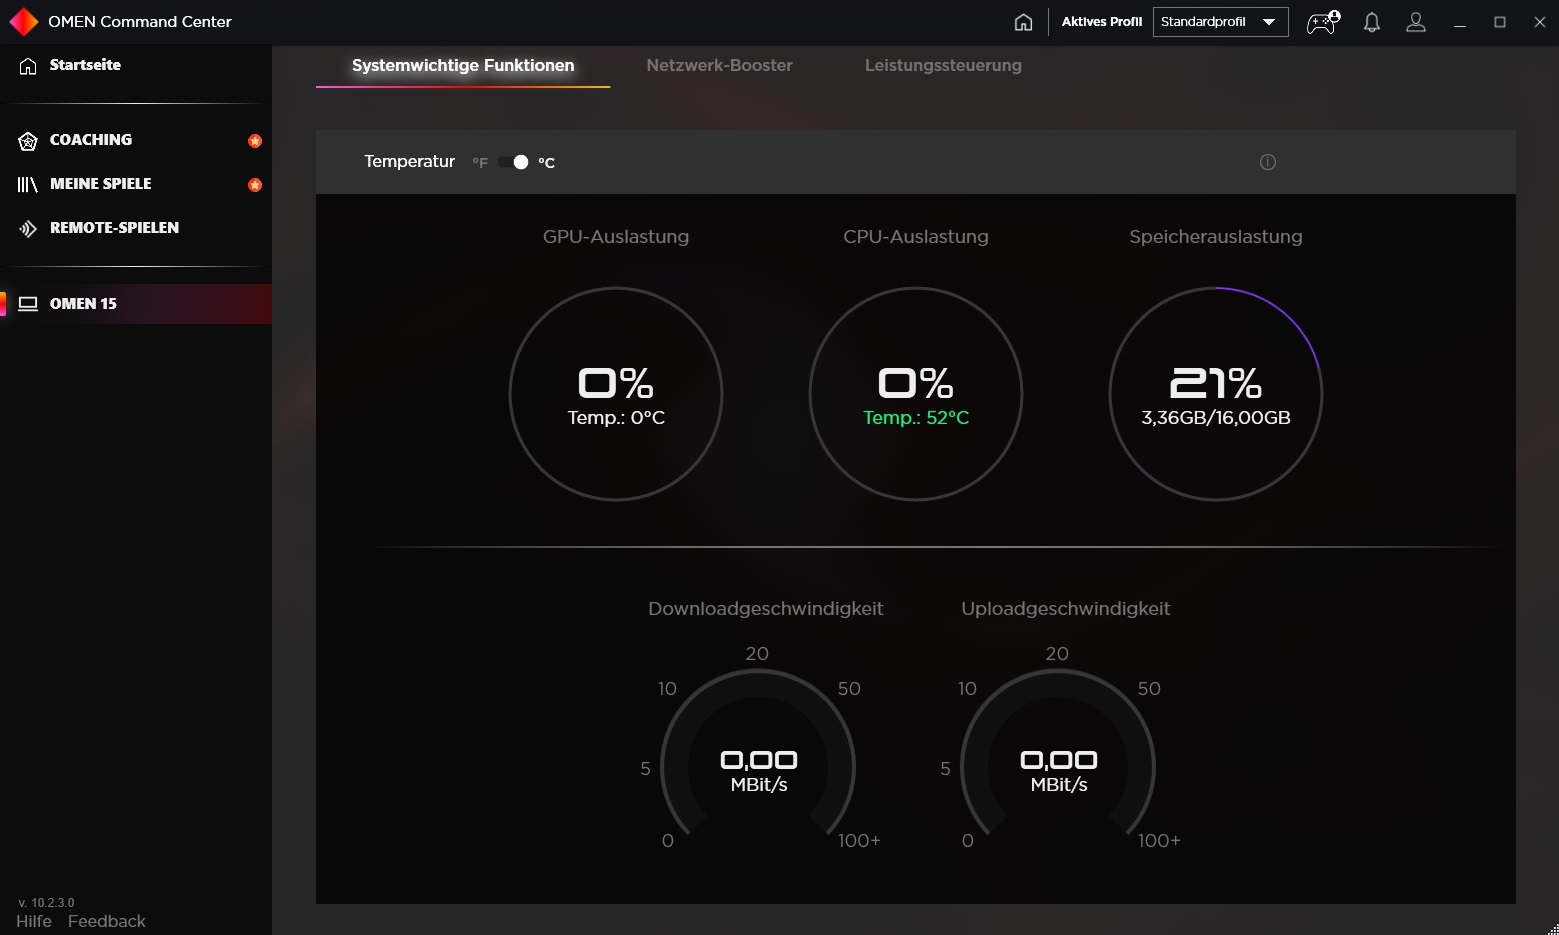
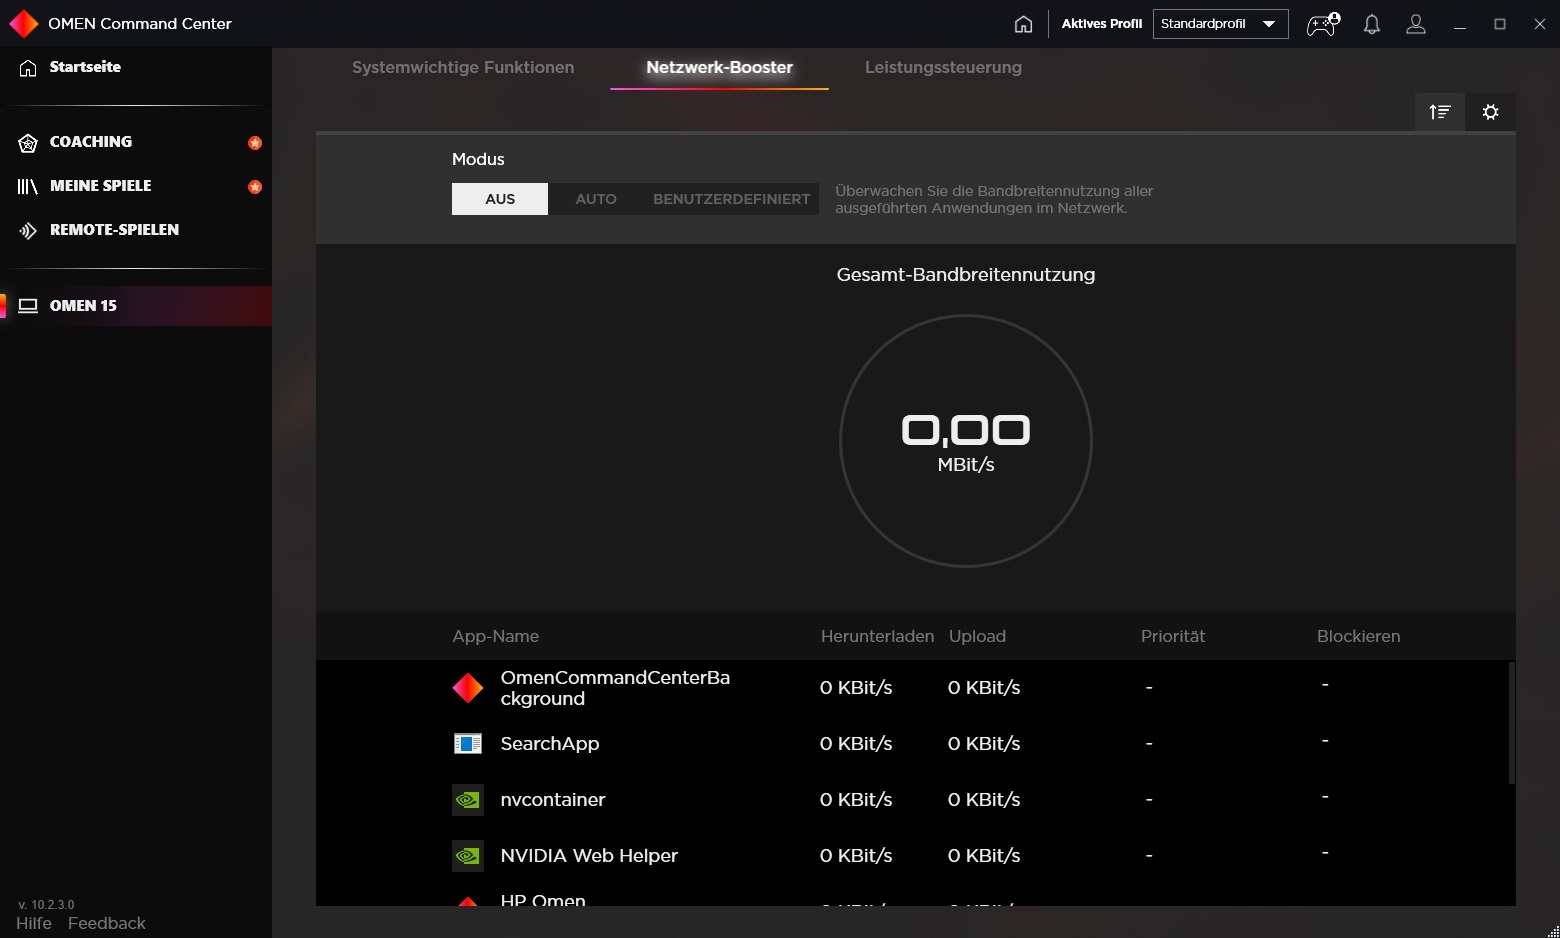
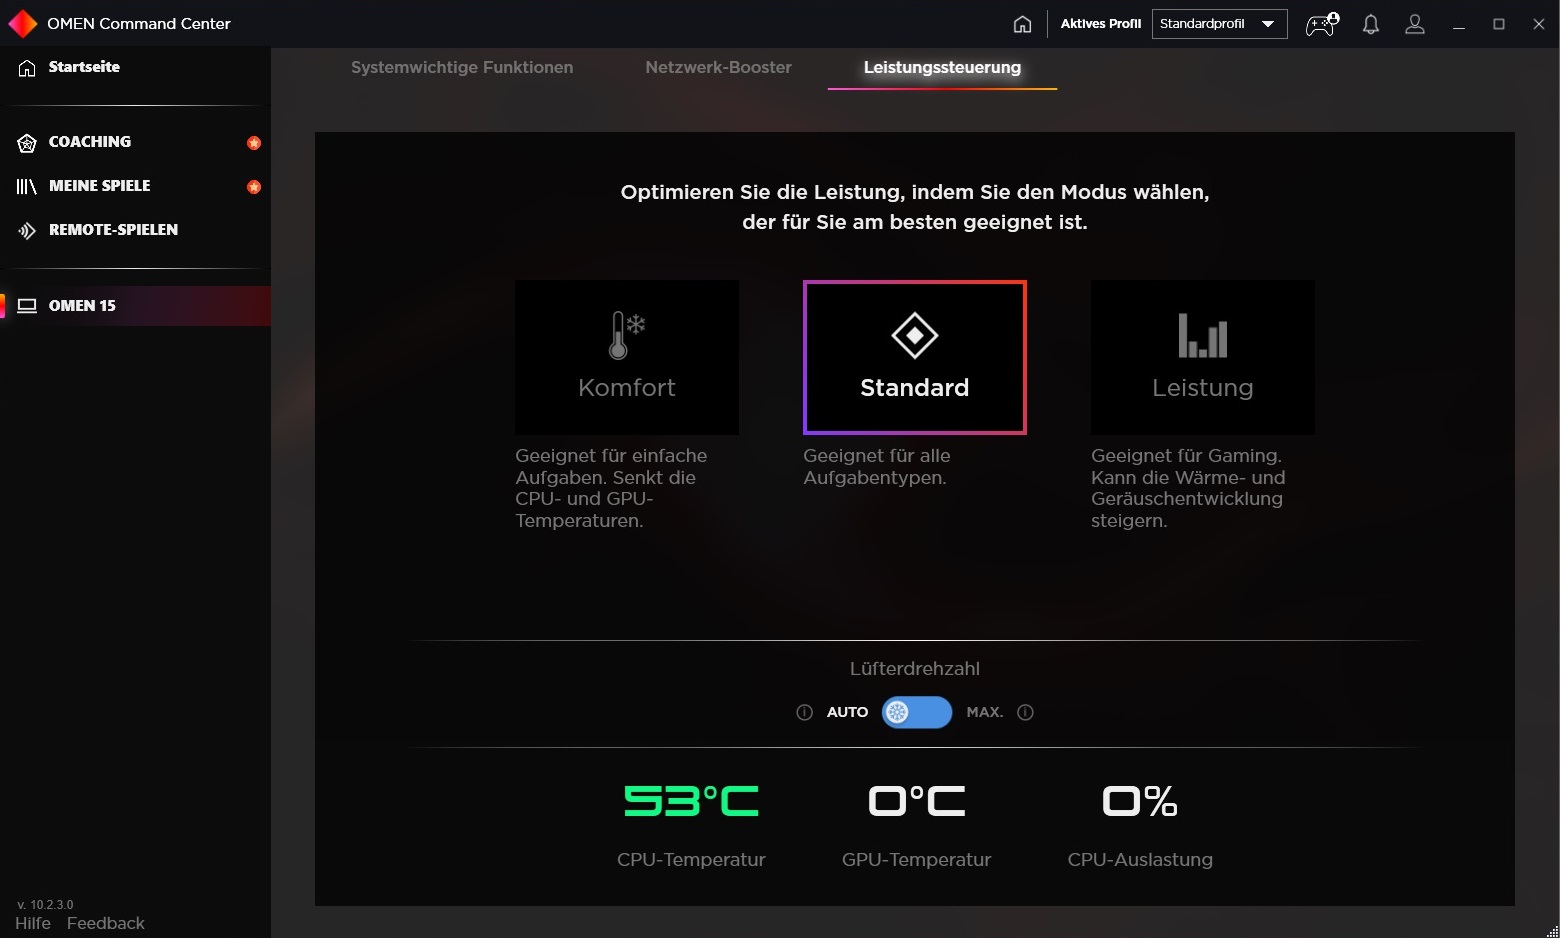
Os ventiladores de afinação podem desabafar no Centro de Comando pré-instalado. Além do monitoramento do sistema, a ferramenta também oferece um booster de rede e controle de desempenho. Este último inclui três perfis que afetam o desempenho e as temperaturas ou volume. Nossos testes sempre foram realizados com o modo padrão, que é suposto ser adequado para todos os tipos de tarefas e está ativo fora da caixa. Os ventiladores sempre funcionavam em modo automático (ver captura de tela nº 3)
Energia
Embora seja um dispositivo de orçamento em termos de preço, o Omen 15-en0375ng definitivamente pertence ao segmento high-end. Isto se deve principalmente ao forte processador de oito núcleos, que raramente tem vantagens sobre um rápido quatro ou seis núcleos em jogos até agora, mas mostra seus músculos em aplicações especializadas e geralmente tem mais futuro garantido
Processador
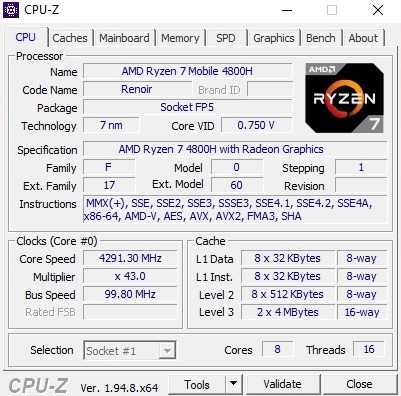
Os benchmarks provam de forma impressionante que a AMD está atualmente dando o tom no setor de CPU e ultrapassou a Intel. Graças a seus muitos núcleos, o Ryzen 7 4800H, que pode processar até 16 roscas simultaneamente via SMT, passa cerca de 50% do Core i7-10750H, que é muito popular entre os laptops de jogos, em aplicações multi-core como o Cinebench R15. A vantagem sobre o Core i5-10300H, por exemplo, no Legion 5 15IMH05H, é mesmo em torno de 100%
Embora o desempenho caia em alguns por cento sob carga prolongada, o Omen 15-en0375ng também corta um bom número no loop Cinebench. O relógio está aproximadamente no mesmo nível do concorrente Schenker Core 15 de 4800H, enquanto o Asus TUF A15 tem que lidar com um Turbo fortemente flutuante
* ... menor é melhor
Desempenho do sistema
O Omen 15 também é um dos pioneiros quando se trata de desempenho do sistema. 5.766 pontos no PCMark 10 catapultam o equipamento de 15 polegadas para a posição superior
Latências DPC
Em termos de latências, o caderno também não tem que ouvir nenhuma crítica. De acordo com a ferramenta LatencyMon, o sistema é bem adequado para conteúdo e aplicações em tempo real
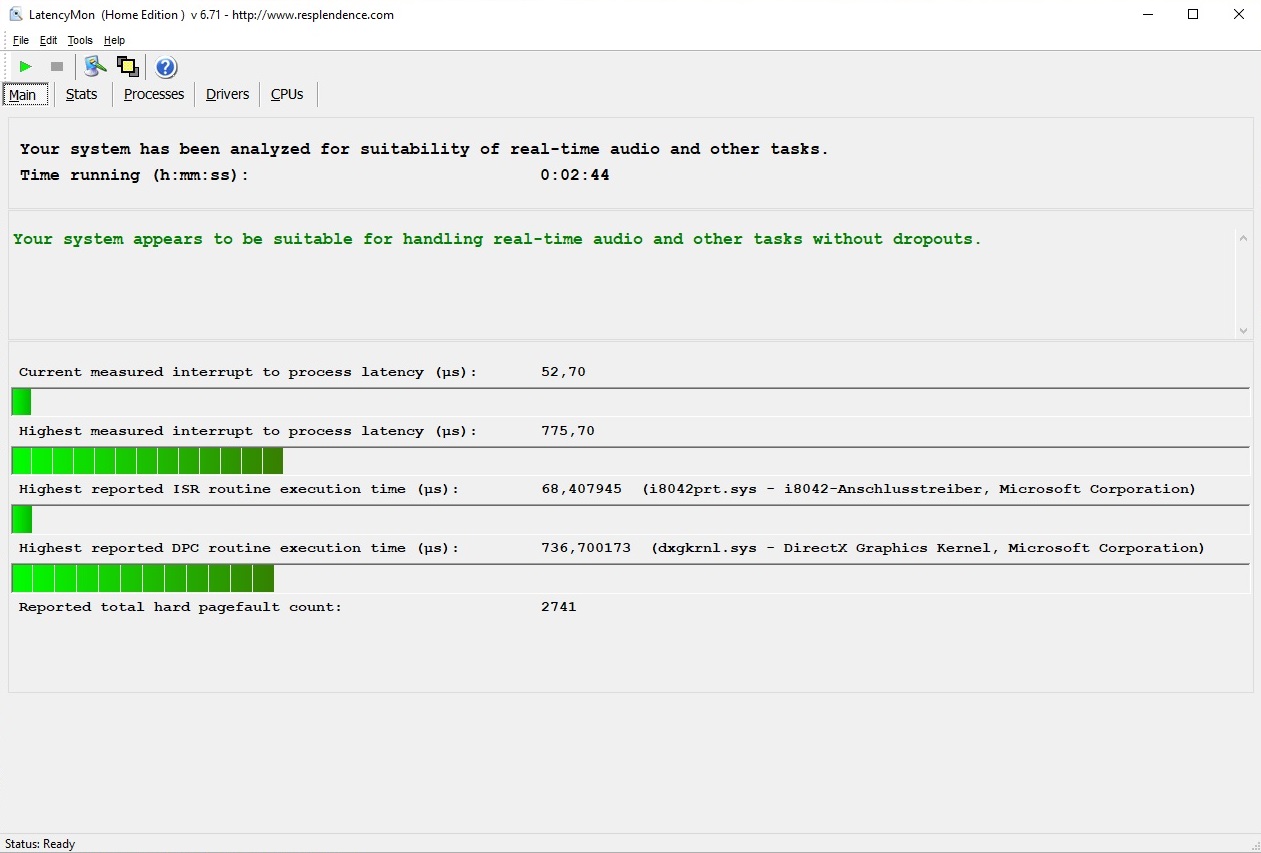
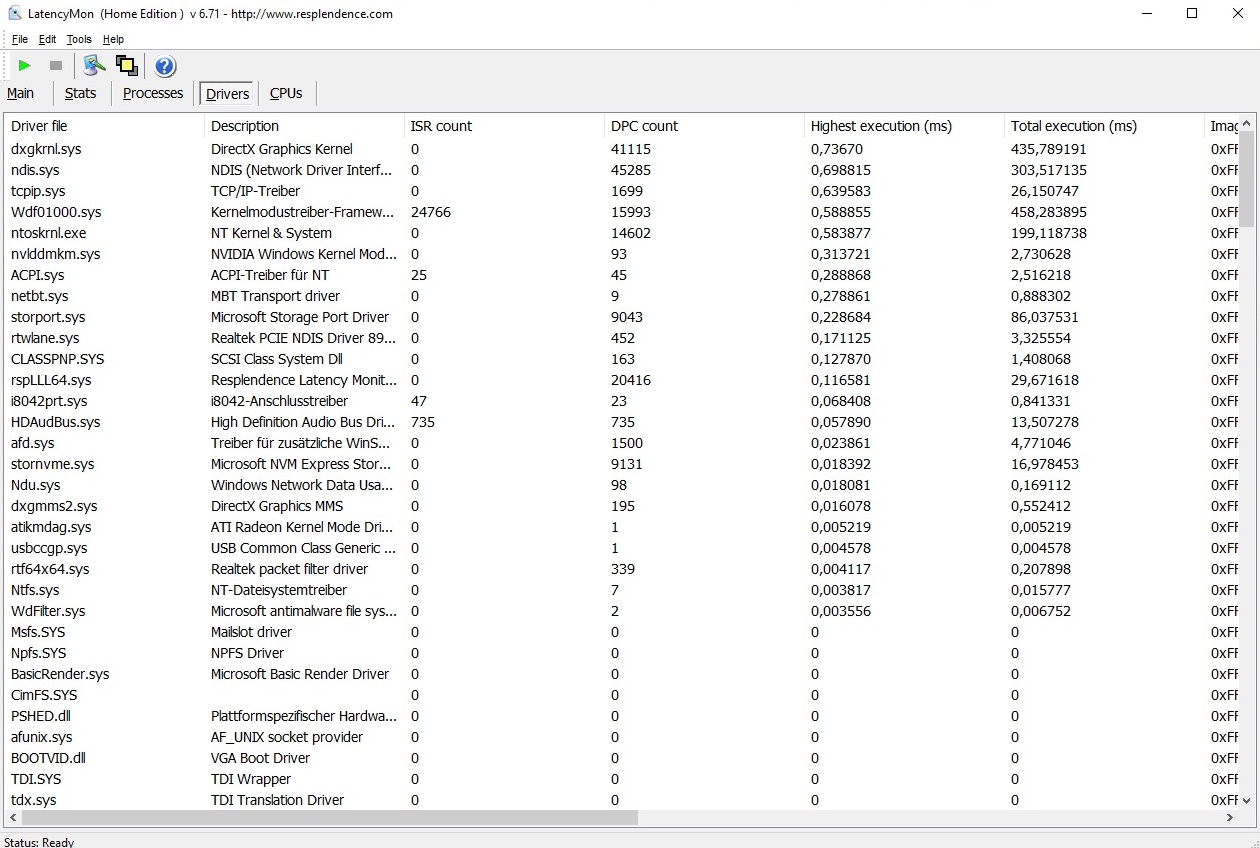
| DPC Latencies / LatencyMon - interrupt to process latency (max), Web, Youtube, Prime95 | |
| Schenker XMG Core 15 GK5NR0O | |
| Acer Predator Triton 300 PT315-52-79LP | |
| Aorus 5 KB | |
| Asus TUF Gaming A15 FA506IV-HN172 | |
| HP Omen 15-en0375ng | |
| Lenovo Legion 5 15IMH05H | |
* ... menor é melhor
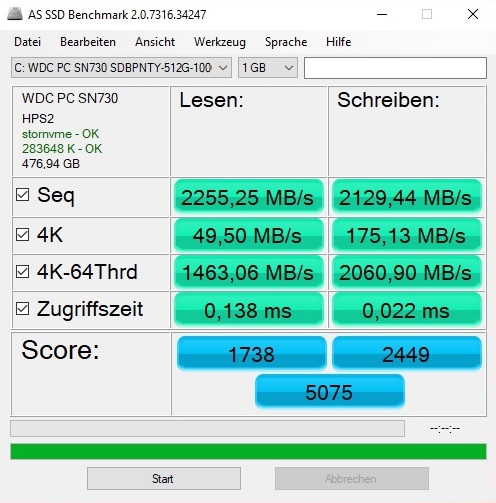
Armazenamento em massa
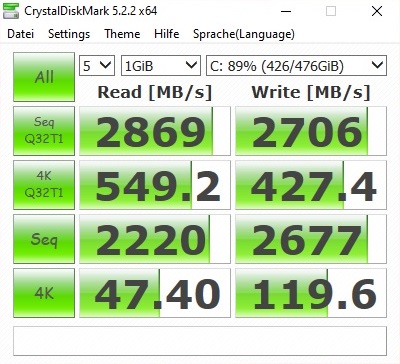
Os compradores também podem esperar por um dispositivo rápido de armazenamento em massa. O modelo 512 GB WDC PC SN730 instalado na amostra de revisão atinge mais de 2000 MB/s em leitura e escrita seqüencial, o que é um resultado muito bom. Não é de se admirar, já que se trata de uma unidade PCIe/NVMe moderna
| HP Omen 15-en0375ng WDC PC SN730 SDBPNTY-512G | Schenker XMG Core 15 GK5NR0O Samsung SSD 970 EVO Plus 500GB | Asus TUF Gaming A15 FA506IV-HN172 Kingston OM8PCP3512F-AB | Acer Predator Triton 300 PT315-52-79LP WDC PC SN730 SDBQNTY-1T00 | Aorus 5 KB ADATA XPG SX8200 Pro (ASX8200PNP-512GT) | Lenovo Legion 5 15IMH05H Samsung PM991 MZALQ512HALU | Média WDC PC SN730 SDBPNTY-512G | |
|---|---|---|---|---|---|---|---|
| CrystalDiskMark 5.2 / 6 | 28% | -13% | -0% | 10% | -18% | 3% | |
| Write 4K (MB/s) | 119.6 | 233 95% | 219.8 84% | 117.5 -2% | 162.1 36% | 145.4 22% | 164.3 ? 37% |
| Read 4K (MB/s) | 47.4 | 54.5 15% | 50.2 6% | 47.36 0% | 60.7 28% | 51.6 9% | 48.2 ? 2% |
| Write Seq (MB/s) | 2677 | 3050 14% | 979 -63% | 2748 3% | 2366 -12% | 1007 -62% | 2096 ? -22% |
| Read Seq (MB/s) | 2220 | 3042 37% | 1990 -10% | 2084 -6% | 2633 19% | 1145 -48% | 2123 ? -4% |
| Write 4K Q32T1 (MB/s) | 427.4 | 520 22% | 516 21% | 407.3 -5% | 428.2 0% | 468.4 10% | 451 ? 6% |
| Read 4K Q32T1 (MB/s) | 549 | 546 -1% | 298.3 -46% | 474.6 -14% | 582 6% | 528 -4% | 509 ? -7% |
| Write Seq Q32T1 (MB/s) | 2706 | 3241 20% | 982 -64% | 3069 13% | 2480 -8% | 1381 -49% | 2551 ? -6% |
| Read Seq Q32T1 (MB/s) | 2869 | 3538 23% | 1907 -34% | 3154 10% | 3121 9% | 2291 -20% | 3330 ? 16% |
| AS SSD | 15% | -29% | -3% | -17% | -36% | -16% | |
| Seq Read (MB/s) | 2255 | 2836 26% | 1682 -25% | 2369 5% | 2795 24% | 2012 -11% | 2605 ? 16% |
| Seq Write (MB/s) | 2129 | 2452 15% | 904 -58% | 2446 15% | 2172 2% | 1261 -41% | 1905 ? -11% |
| 4K Read (MB/s) | 49.5 | 60.4 22% | 60.2 22% | 40.61 -18% | 53.3 8% | 43.66 -12% | 45.8 ? -7% |
| 4K Write (MB/s) | 175.1 | 190.5 9% | 164.8 -6% | 103.2 -41% | 121.3 -31% | 109.3 -38% | 155.6 ? -11% |
| 4K-64 Read (MB/s) | 1463 | 1283 -12% | 472.5 -68% | 1637 12% | 714 -51% | 851 -42% | 1181 ? -19% |
| 4K-64 Write (MB/s) | 2061 | 2298 11% | 845 -59% | 1961 -5% | 1376 -33% | 780 -62% | 1372 ? -33% |
| Access Time Read * (ms) | 0.138 | 0.034 75% | 0.087 37% | 0.06 57% | 0.049 64% | 0.117 15% | 0.0801 ? 42% |
| Access Time Write * (ms) | 0.022 | 0.02 9% | 0.02 9% | 0.036 -64% | 0.036 -64% | 0.036 -64% | 0.04195 ? -91% |
| Score Read (Points) | 1738 | 1627 -6% | 701 -60% | 1915 10% | 1046 -40% | 1096 -37% | 1488 ? -14% |
| Score Write (Points) | 2449 | 2734 12% | 1101 -55% | 2309 -6% | 1714 -30% | 1016 -59% | 1718 ? -30% |
| Score Total (Points) | 5075 | 5184 2% | 2143 -58% | 5205 3% | 3279 -35% | 2643 -48% | 3938 ? -22% |
| Média Total (Programa/Configurações) | 22% /
20% | -21% /
-22% | -2% /
-2% | -4% /
-6% | -27% /
-28% | -7% /
-8% |
* ... menor é melhor

Continuous reading: DiskSpd Read Loop, Queue Depth 8
Placa gráfica
O GeForce RTX 2060 é o companheiro perfeito para os jogadores que desejam investir no máximo 1.500 Euros (~$1820) em um notebook. O modelo DirectX 12 está localizado entre a gama média e superior em termos de desempenho e, ao contrário de seus irmãos mais baratos, pode ostentar capacidades "reais" de traçado de raio
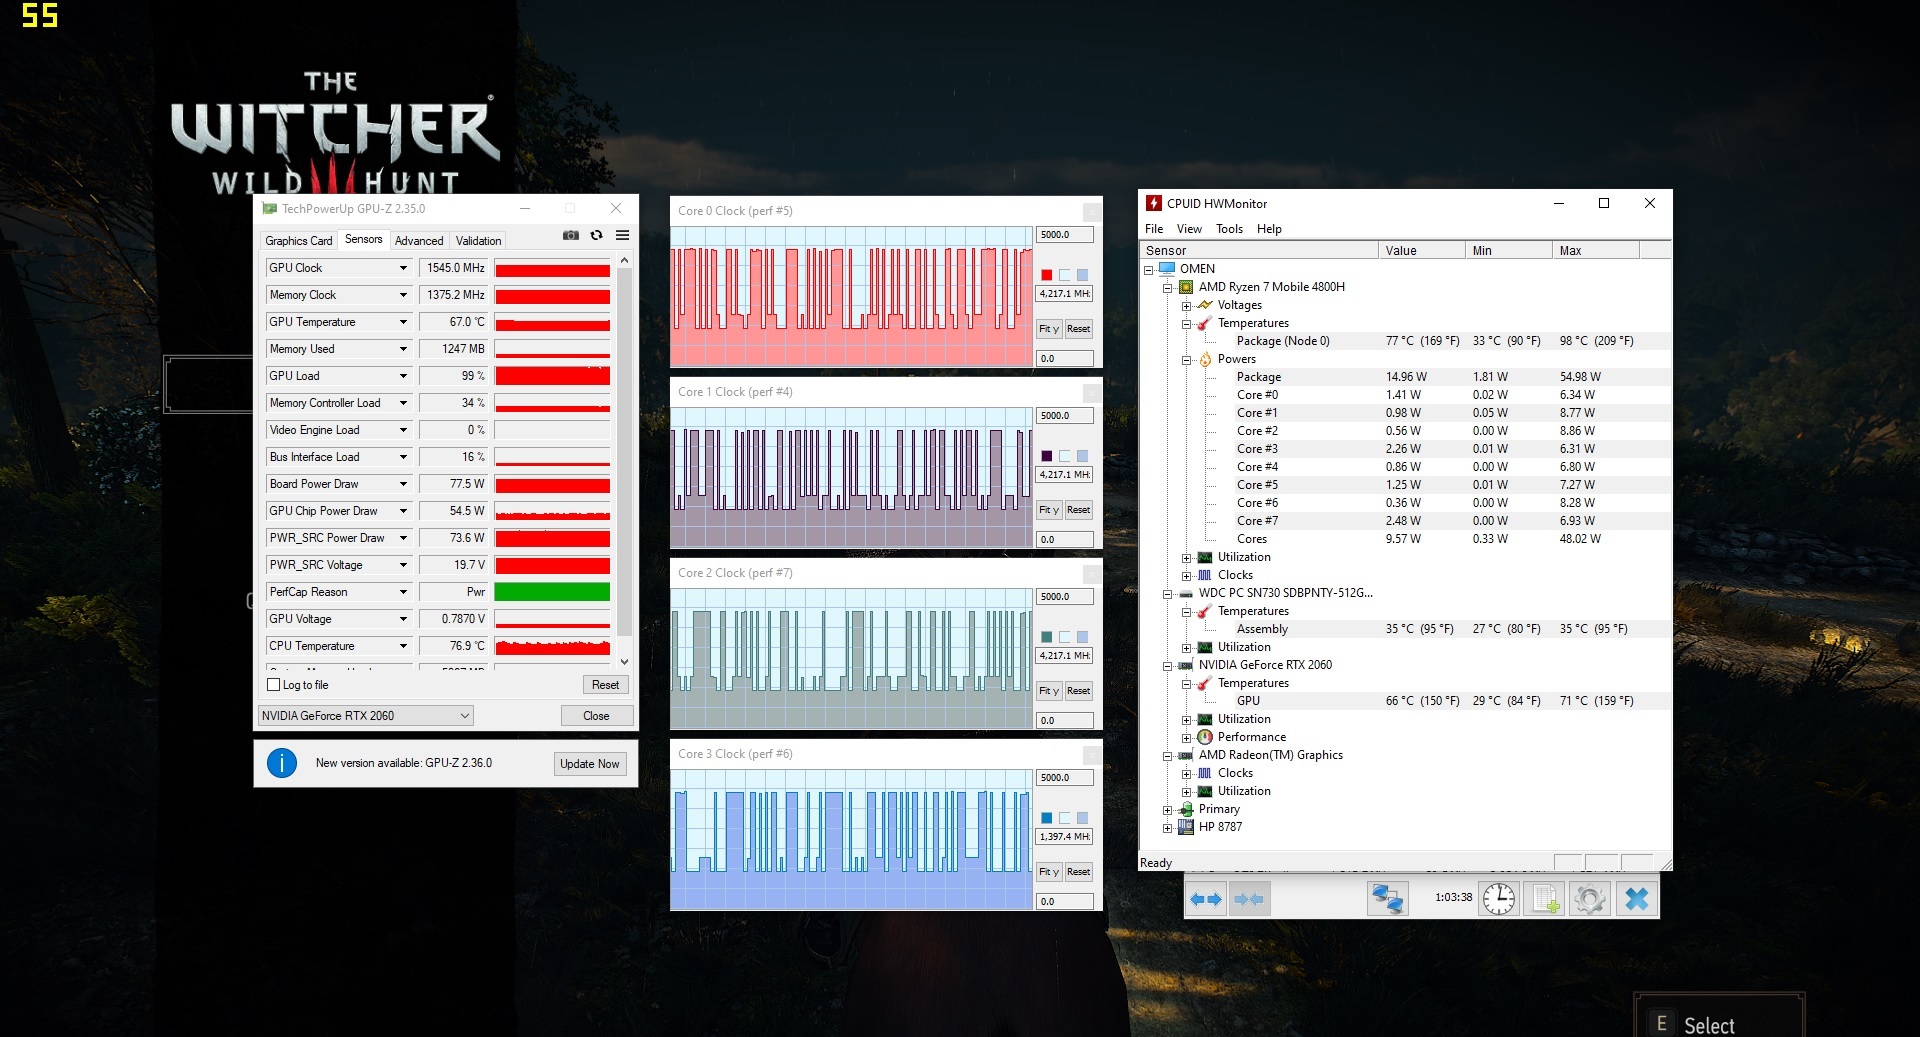
Enquanto a potência da CPU está - como já explicado - acima da média, a velocidade da GPU fica um pouco atrás da concorrência. O Omen 15-en0375ng traz a traseira nos testes do 3DMark, mas a diferença é muitas vezes marginal e subjetivamente quase imperceptível. O mesmo se aplica à queda sutil da taxa de quadros no testeWitcher 3 (cerca de 1 hora @FHD/Ultra), que simula uma carga 3D mais longa
| 3DMark 11 Performance | 18798 pontos | |
| 3DMark Cloud Gate Standard Score | 38655 pontos | |
| 3DMark Fire Strike Score | 14526 pontos | |
| 3DMark Time Spy Score | 6161 pontos | |
Ajuda | ||
Desempenho do jogo
A combinação de Ryzen 7 4800H e GeForce RTX 2060 é rápida o suficiente para jogar a maioria dos jogos atuais suavemente com 1.920 x 1.080 pixels e detalhes máximos. Somente jogos muito exigentes e/ou pouco otimizados, tais como Watch Dogs Legion, Dirt 5 e Cyberpunk 2077, solte o FPS Avg abaixo da marca de 40
| The Witcher 3 | |
| 1920x1080 High Graphics & Postprocessing (Nvidia HairWorks Off) | |
| Média da turma Gaming (341 - 404, n=2, últimos 2 anos) | |
| Lenovo Legion 5 15IMH05H | |
| HP Omen 15-en0375ng | |
| Asus TUF Gaming A15 FA506IV-HN172 | |
| Schenker XMG Core 15 GK5NR0O | |
| 1920x1080 Ultra Graphics & Postprocessing (HBAO+) | |
| Média da turma Gaming (104.7 - 240, n=7, últimos 2 anos) | |
| Lenovo Legion 5 15IMH05H | |
| Asus TUF Gaming A15 FA506IV-HN172 | |
| Acer Predator Triton 300 PT315-52-79LP | |
| Schenker XMG Core 15 GK5NR0O | |
| Aorus 5 KB | |
| HP Omen 15-en0375ng | |
| baixo | média | alto | ultra | |
|---|---|---|---|---|
| GTA V (2015) | 165 | 159 | 127 | 70.8 |
| The Witcher 3 (2015) | 107 | 56.4 | ||
| Dota 2 Reborn (2015) | 123 | 115 | 109 | 104 |
| X-Plane 11.11 (2018) | 91.5 | 81.9 | 68.8 | |
| Shadow of the Tomb Raider (2018) | 83 | 73 | ||
| Battlefield V (2018) | 102 | 93.1 | ||
| Borderlands 3 (2019) | 61.9 | 48.1 | ||
| Valorant (2020) | 177 | |||
| Crysis Remastered (2020) | 52.9 | 40 | ||
| FIFA 21 (2020) | 163 | 161 | ||
| Watch Dogs Legion (2020) | 66 | 36 | ||
| Dirt 5 (2020) | 59.2 | 38.7 | ||
| Assassin´s Creed Valhalla (2020) | 53 | 46 | ||
| Call of Duty Black Ops Cold War (2020) | 62.2 | 57.1 | ||
| Yakuza Like a Dragon (2020) | 71.8 | 64.1 | ||
| Immortals Fenyx Rising (2020) | 54 | 51 | ||
| Cyberpunk 2077 1.0 (2020) | 45.3 | 38.8 |
Emissões
Emissões sonoras
O controle do ventilador deixa uma impressão decente quando ocioso e durante atividades simples (escritório, web, etc.). Embora possa haver pequenos surtos de vez em quando, os ventiladores geralmente ficam parados, o que leva a uma operação silenciosa. Sob carga, porém, o ventilador de 15 polegadas atrai claramente a atenção. 48 dB(A) no teste Witcher 3 é semelhante ao nível de ruído da competição, que atinge 47 a 51 dB(A)
Barulho
| Ocioso |
| 24 / 25 / 37 dB |
| Carga |
| 45 / 51 dB |
 | ||
30 dB silencioso 40 dB(A) audível 50 dB(A) ruidosamente alto |
||
min: | ||
| HP Omen 15-en0375ng R7 4800H, GeForce RTX 2060 Mobile | Schenker XMG Core 15 GK5NR0O R7 4800H, GeForce RTX 2060 Mobile | Asus TUF Gaming A15 FA506IV-HN172 R7 4800H, GeForce RTX 2060 Mobile | Acer Predator Triton 300 PT315-52-79LP i7-10750H, GeForce RTX 2060 Mobile | Aorus 5 KB i7-10750H, GeForce RTX 2060 Mobile | Lenovo Legion 5 15IMH05H i5-10300H, GeForce RTX 2060 Mobile | Média da turma Gaming | |
|---|---|---|---|---|---|---|---|
| Noise | -2% | -6% | -2% | -8% | -6% | -0% | |
| desligado / ambiente * (dB) | 24 | 25 -4% | 30.2 -26% | 25 -4% | 25 -4% | 30.7 -28% | 24.1 ? -0% |
| Idle Minimum * (dB) | 24 | 26 -8% | 30.2 -26% | 25 -4% | 26 -8% | 30.7 -28% | 25.9 ? -8% |
| Idle Average * (dB) | 25 | 30 -20% | 30.2 -21% | 29 -16% | 30 -20% | 30.7 -23% | 27.4 ? -10% |
| Idle Maximum * (dB) | 37 | 32 14% | 30.2 18% | 34 8% | 34 8% | 30.7 17% | 30.1 ? 19% |
| Load Average * (dB) | 45 | 46 -2% | 40 11% | 44 2% | 53 -18% | 36.6 19% | 43.7 ? 3% |
| Witcher 3 ultra * (dB) | 48 | 48 -0% | 49 -2% | 49 -2% | 51 -6% | 47 2% | |
| Load Maximum * (dB) | 51 | 48 6% | 49 4% | 49 4% | 56 -10% | 50.9 -0% | 54.3 ? -6% |
* ... menor é melhor
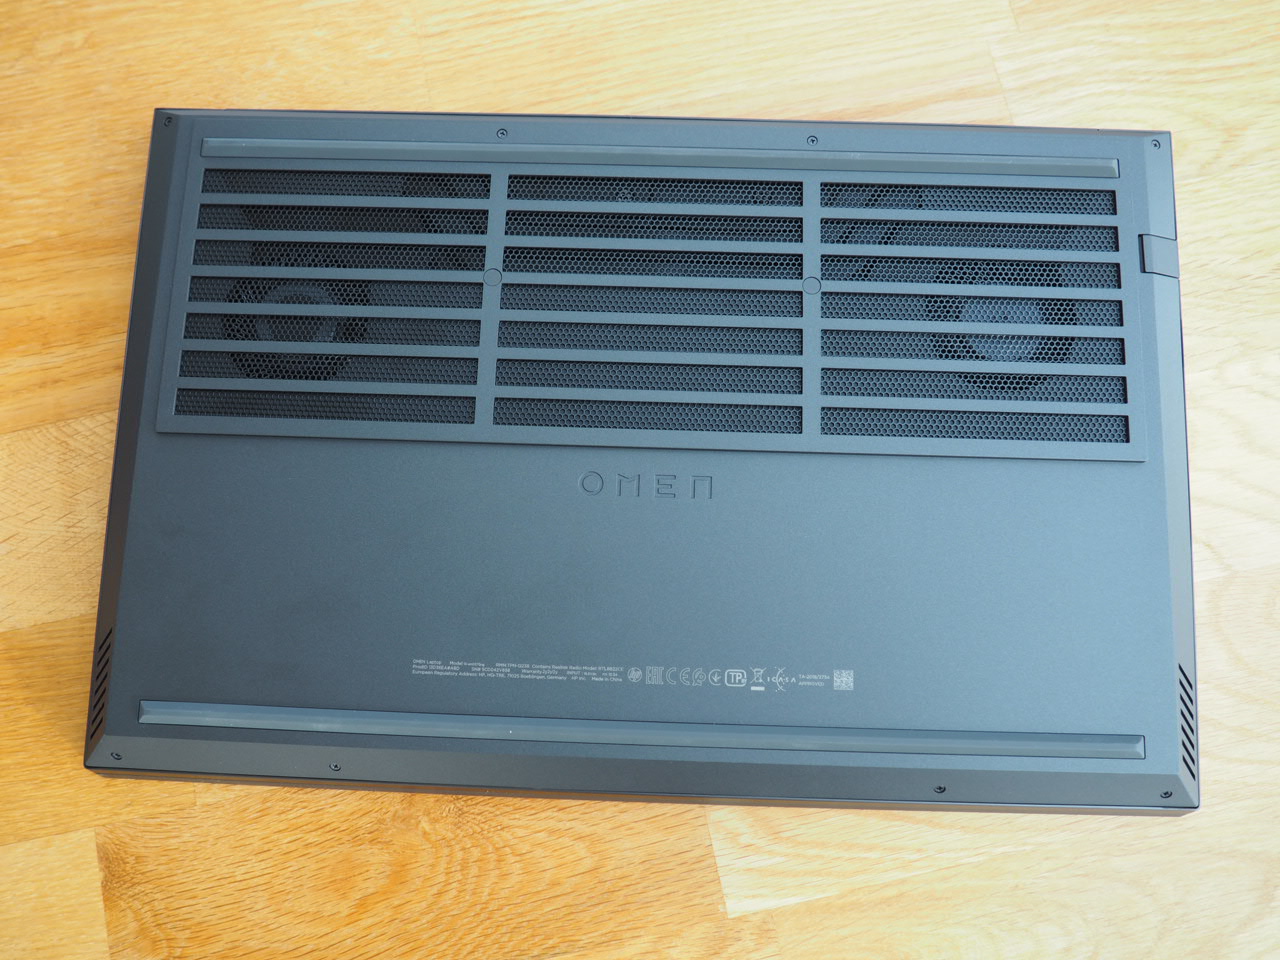
Temperatura
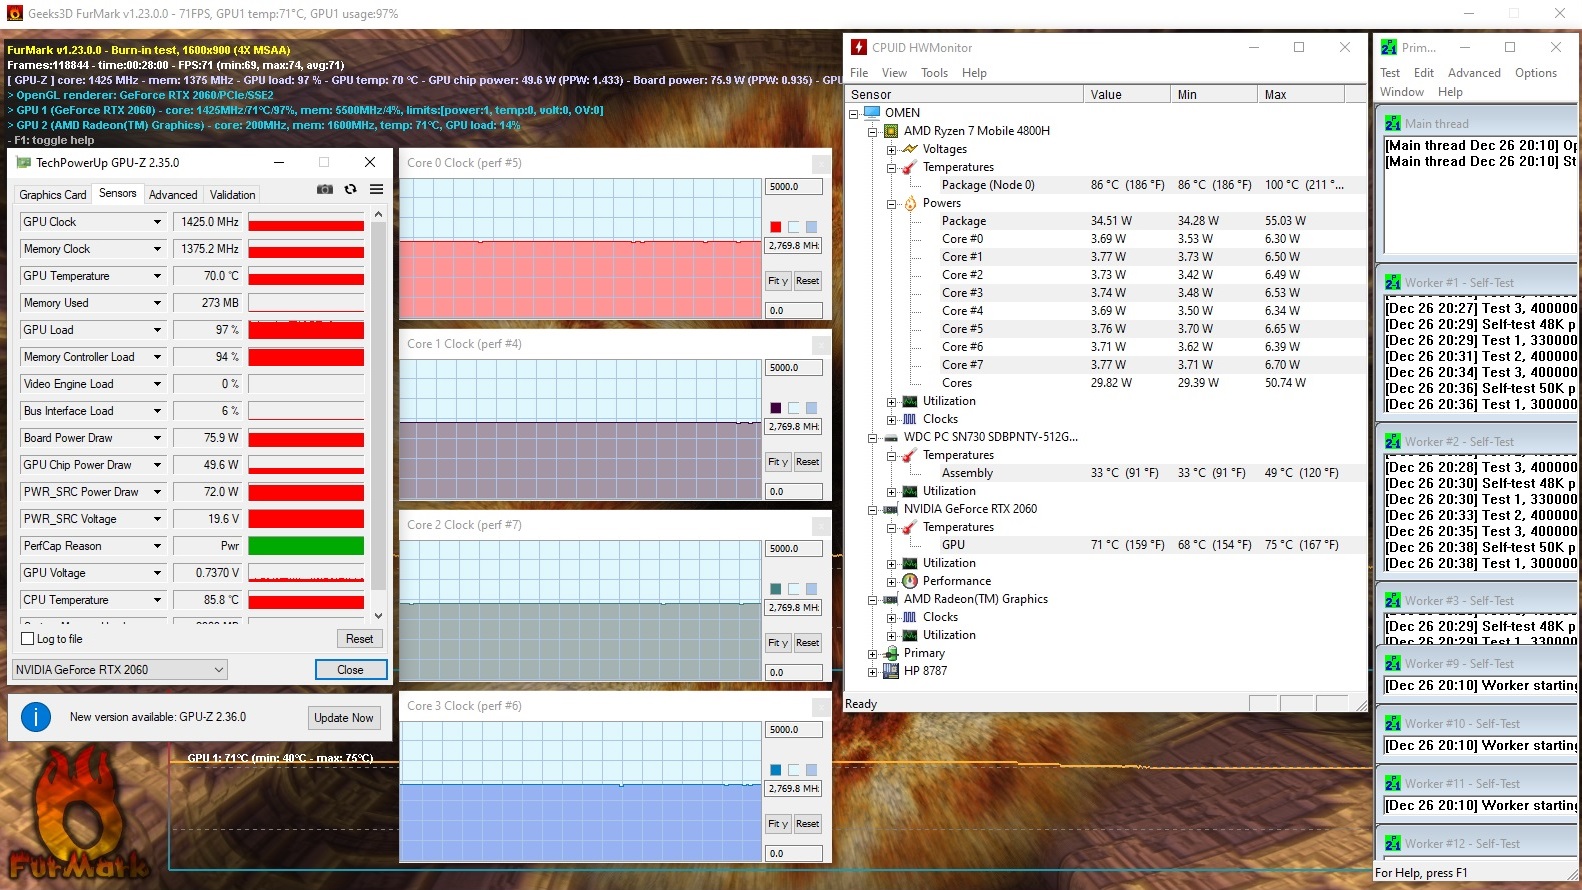
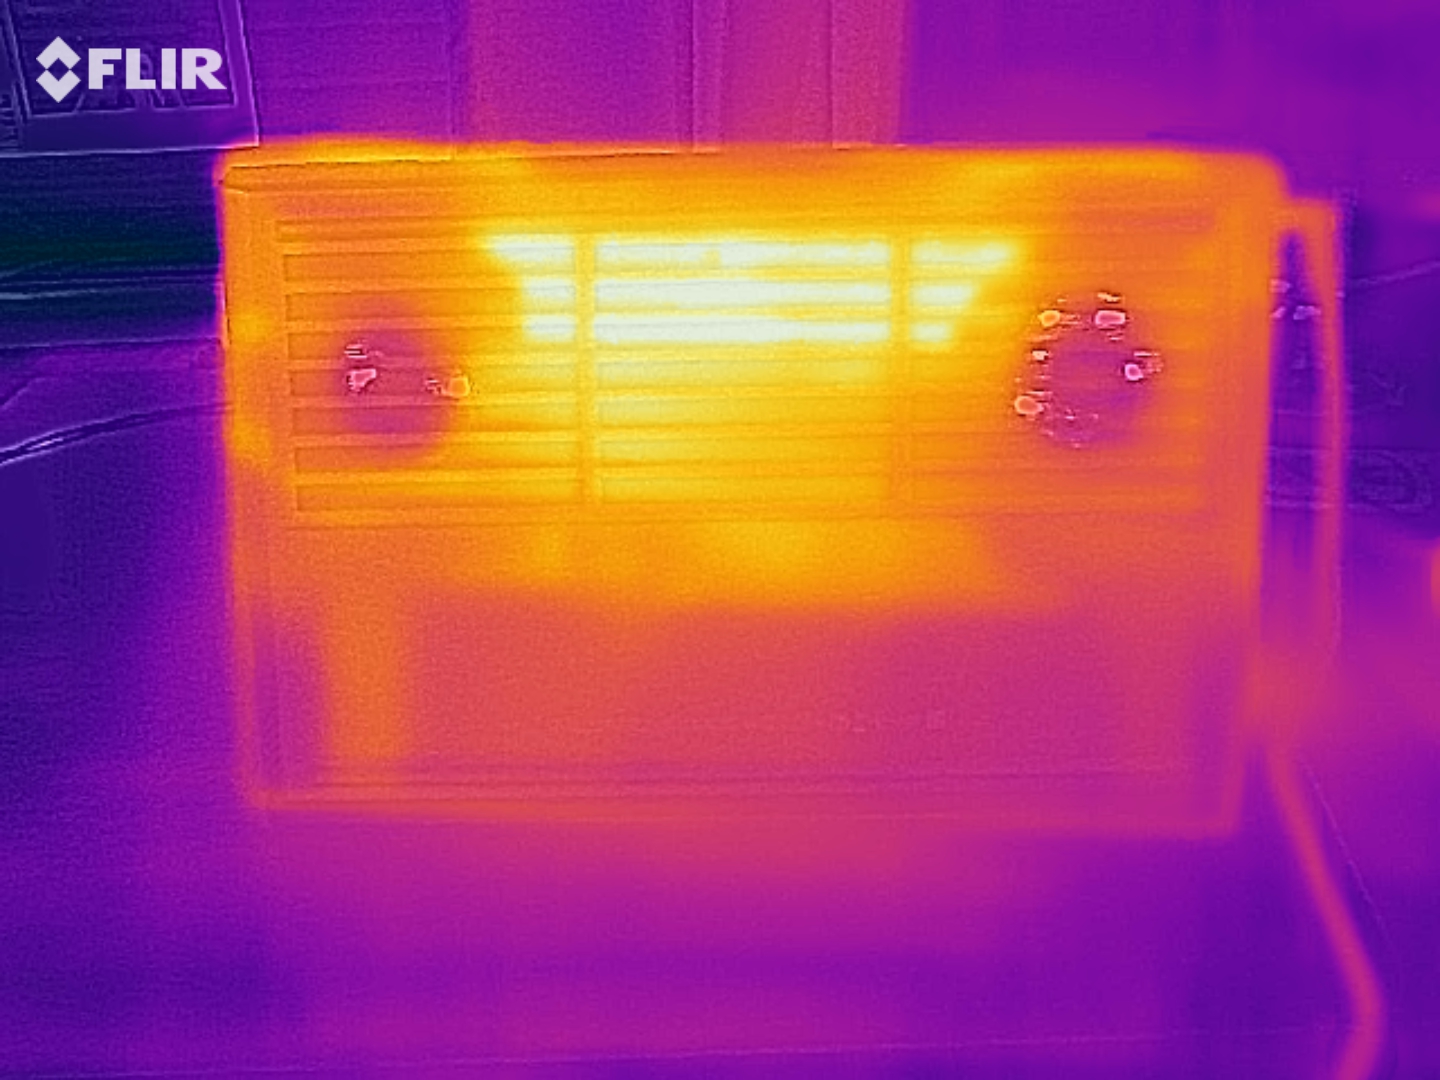
O desenvolvimento da temperatura do chassi varia muito. Enquanto a parte inferior da caixa aquece até mais de 50 °C (122 °F)em alguns lugares sob carga máxima, a parte superior só atinge um máximo de 42 °C (107,6 °F) - umataxamoderada. Debaixo do capô, o processador em particular aquece. Após 60 minutos de testes de estresse com as ferramentas Furmark e Prime95, o Ryzen 7 4800H ficou confortável a cerca de 86 °C (186,8 °F). O GeForce RTX 2060 permaneceu visivelmente mais frio com pouco menos de 70 °C (158 °F). Os valores no teste Witcher 3 podem ser vistos na primeira captura de tela
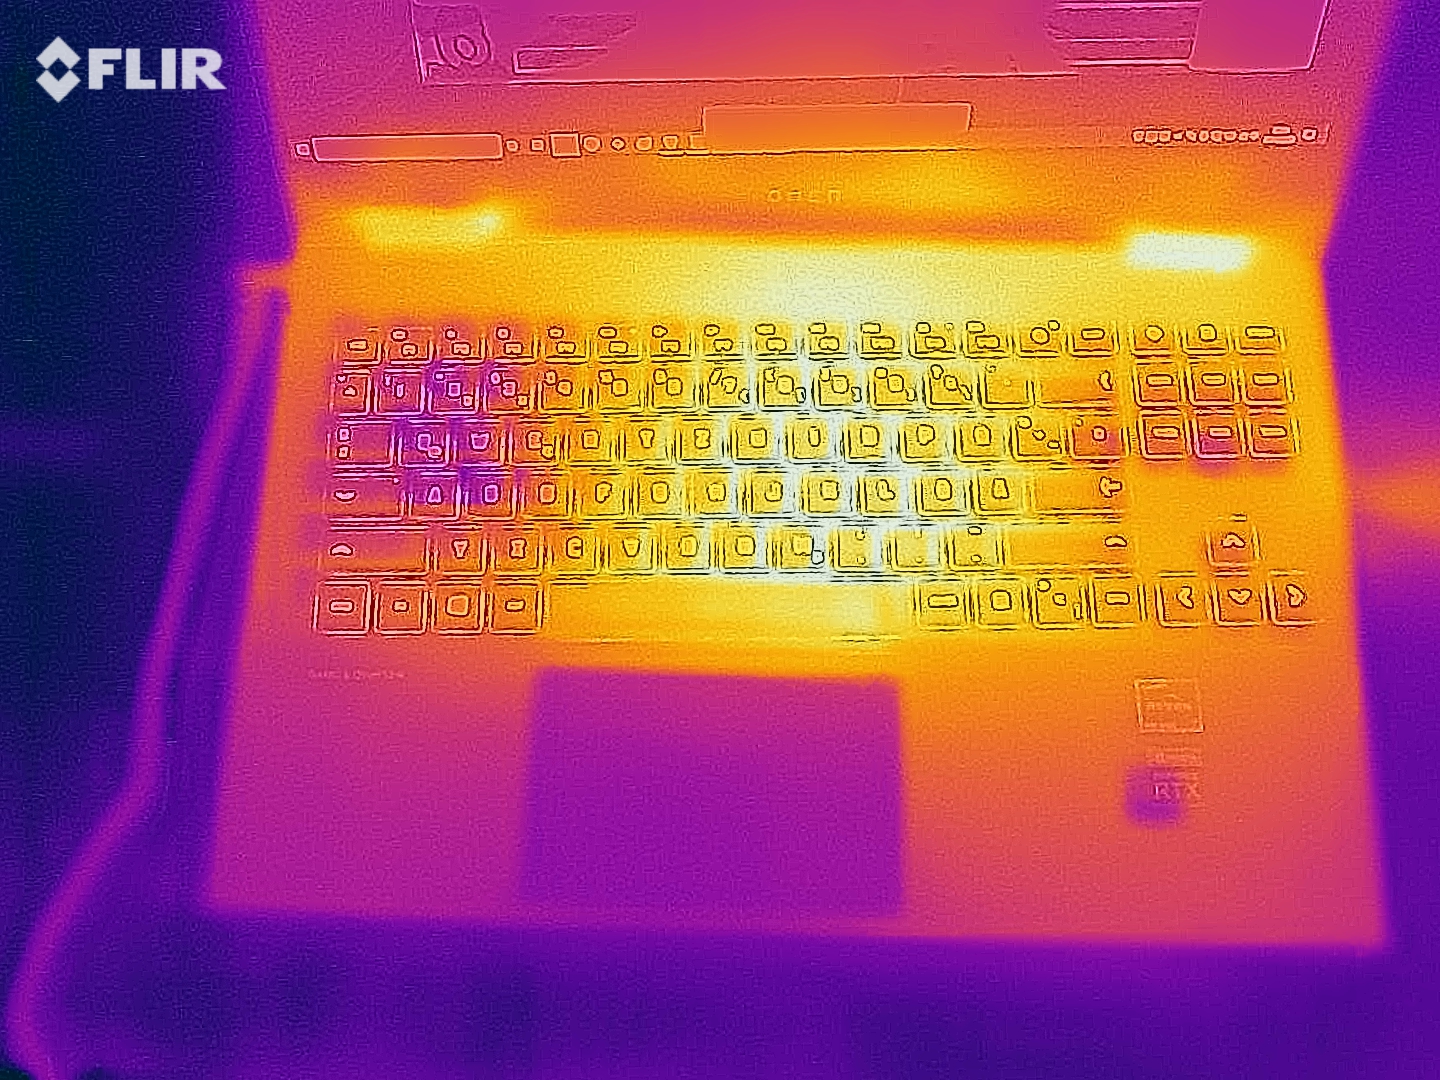
(±) A temperatura máxima no lado superior é 42 °C / 108 F, em comparação com a média de 40.4 °C / 105 F , variando de 21.2 a 68.8 °C para a classe Gaming.
(-) A parte inferior aquece até um máximo de 54 °C / 129 F, em comparação com a média de 43.2 °C / 110 F
(+) Em uso inativo, a temperatura média para o lado superior é 27.1 °C / 81 F, em comparação com a média do dispositivo de 33.9 °C / ### class_avg_f### F.
(-) Jogando The Witcher 3, a temperatura média para o lado superior é 38.7 °C / 102 F, em comparação com a média do dispositivo de 33.9 °C / ## #class_avg_f### F.
(+) Os apoios para as mãos e o touchpad estão atingindo a temperatura máxima da pele (35 °C / 95 F) e, portanto, não estão quentes.
(-) A temperatura média da área do apoio para as mãos de dispositivos semelhantes foi 28.8 °C / 83.8 F (-6.2 °C / -11.2 F).
| HP Omen 15-en0375ng R7 4800H, GeForce RTX 2060 Mobile | Schenker XMG Core 15 GK5NR0O R7 4800H, GeForce RTX 2060 Mobile | Asus TUF Gaming A15 FA506IV-HN172 R7 4800H, GeForce RTX 2060 Mobile | Acer Predator Triton 300 PT315-52-79LP i7-10750H, GeForce RTX 2060 Mobile | Aorus 5 KB i7-10750H, GeForce RTX 2060 Mobile | Lenovo Legion 5 15IMH05H i5-10300H, GeForce RTX 2060 Mobile | Média da turma Gaming | |
|---|---|---|---|---|---|---|---|
| Heat | -14% | 4% | -21% | -11% | 2% | -6% | |
| Maximum Upper Side * (°C) | 42 | 51 -21% | 42.9 -2% | 55 -31% | 50 -19% | 46.3 -10% | 45.1 ? -7% |
| Maximum Bottom * (°C) | 54 | 64 -19% | 49.9 8% | 65 -20% | 49 9% | 44.4 18% | 48.1 ? 11% |
| Idle Upper Side * (°C) | 28 | 29 -4% | 27.8 1% | 32 -14% | 35 -25% | 28.1 -0% | 31 ? -11% |
| Idle Bottom * (°C) | 29 | 32 -10% | 27 7% | 34 -17% | 31 -7% | 29.4 -1% | 34.2 ? -18% |
* ... menor é melhor
Alto-falante
HP Omen 15-en0375ng análise de áudio
(+) | os alto-falantes podem tocar relativamente alto (###valor### dB)
Graves 100 - 315Hz
(-) | quase nenhum baixo - em média 21.4% menor que a mediana
(-) | graves não são lineares (15% delta para frequência anterior)
Médios 400 - 2.000 Hz
(+) | médios equilibrados - apenas 1.9% longe da mediana
(+) | médios são lineares (4.3% delta para frequência anterior)
Altos 2 - 16 kHz
(+) | agudos equilibrados - apenas 3.3% longe da mediana
(+) | os máximos são lineares (6.6% delta da frequência anterior)
Geral 100 - 16.000 Hz
(+) | o som geral é linear (14.7% diferença em relação à mediana)
Comparado com a mesma classe
» 29% de todos os dispositivos testados nesta classe foram melhores, 7% semelhantes, 64% piores
» O melhor teve um delta de 6%, a média foi 18%, o pior foi 132%
Comparado com todos os dispositivos testados
» 19% de todos os dispositivos testados foram melhores, 4% semelhantes, 77% piores
» O melhor teve um delta de 4%, a média foi 23%, o pior foi 134%
Schenker XMG Core 15 GK5NR0O análise de áudio
(+) | os alto-falantes podem tocar relativamente alto (###valor### dB)
Graves 100 - 315Hz
(-) | quase nenhum baixo - em média 24.2% menor que a mediana
(±) | a linearidade dos graves é média (14.8% delta para a frequência anterior)
Médios 400 - 2.000 Hz
(+) | médios equilibrados - apenas 2% longe da mediana
(+) | médios são lineares (3.8% delta para frequência anterior)
Altos 2 - 16 kHz
(±) | máximos mais altos - em média 7.1% maior que a mediana
(±) | a linearidade dos máximos é média (9% delta para frequência anterior)
Geral 100 - 16.000 Hz
(±) | a linearidade do som geral é média (18.8% diferença em relação à mediana)
Comparado com a mesma classe
» 62% de todos os dispositivos testados nesta classe foram melhores, 8% semelhantes, 30% piores
» O melhor teve um delta de 6%, a média foi 18%, o pior foi 132%
Comparado com todos os dispositivos testados
» 44% de todos os dispositivos testados foram melhores, 8% semelhantes, 49% piores
» O melhor teve um delta de 4%, a média foi 23%, o pior foi 134%
Gerenciamento de energia
Absorção de energia
Para um caderno de jogos, o consumo de energia está dentro dos limites. O Omen 15-en0375ng é relativamente frugal com 4 a 22 watts em modo ocioso, o que promete bons tempos de funcionamento da bateria. Mesmo sob carga, as taxas de consumo são geralmente melhores do que as da concorrência. Há muitas indicações de que o Ryzen 7 4800H é mais eficiente em termos energéticos do que seus equivalentes da Intel - graças ao moderno processo de fabricação (7 vs 14 nm)
| desligado | |
| Ocioso | |
| Carga |
|
Key:
min: | |
| HP Omen 15-en0375ng R7 4800H, GeForce RTX 2060 Mobile | Schenker XMG Core 15 GK5NR0O R7 4800H, GeForce RTX 2060 Mobile | Asus TUF Gaming A15 FA506IV-HN172 R7 4800H, GeForce RTX 2060 Mobile | Acer Predator Triton 300 PT315-52-79LP i7-10750H, GeForce RTX 2060 Mobile | Aorus 5 KB i7-10750H, GeForce RTX 2060 Mobile | Lenovo Legion 5 15IMH05H i5-10300H, GeForce RTX 2060 Mobile | Média da turma Gaming | |
|---|---|---|---|---|---|---|---|
| Power Consumption | -43% | -5% | -4% | -31% | 12% | -81% | |
| Idle Minimum * (Watt) | 4 | 12 -200% | 5.4 -35% | 4 -0% | 8 -100% | 3.2 20% | 13.1 ? -228% |
| Idle Average * (Watt) | 9 | 14 -56% | 10 -11% | 10 -11% | 12 -33% | 8.3 8% | 19 ? -111% |
| Idle Maximum * (Watt) | 22 | 20 9% | 10.5 52% | 19 14% | 21 5% | 8.7 60% | 24.6 ? -12% |
| Load Average * (Watt) | 102 | 103 -1% | 135 -32% | 96 6% | 128 -25% | 82 20% | 111.3 ? -9% |
| Witcher 3 ultra * (Watt) | 119 | 125 -5% | 144 -21% | 136 -14% | 138 -16% | 151 -27% | |
| Load Maximum * (Watt) | 182 | 193 -6% | 147 19% | 214 -18% | 217 -19% | 195 -7% | 260 ? -43% |
* ... menor é melhor
Duração da bateria
Um dos maiores pontos fortes do Omen 15-en0375ng é sua vida útil da bateria. Até 20 horas no estojo ideal (carga mínima e brilho do visor) e cerca de 10,5 horas de navegação na Internet via WLAN (brilho reduzido a cerca de 150 d/m²) são excelentes no segmento de jogos. Somente a Lenovo's Legion 5 pode chegar perto destas taxas. No entanto, o desempenho também cai significativamente no modo de bateria. A taxa de quadros caiu em quase 90(!)% no teste Witcher 3 sem fonte de alimentação. Entretanto, desempenho ou não: 70,9 Wh capacidade da bateria deve ser um modelo para a concorrência (48 a 62 Wh)
| HP Omen 15-en0375ng R7 4800H, GeForce RTX 2060 Mobile, 70.9 Wh | Schenker XMG Core 15 GK5NR0O R7 4800H, GeForce RTX 2060 Mobile, 62 Wh | Asus TUF Gaming A15 FA506IV-HN172 R7 4800H, GeForce RTX 2060 Mobile, 48 Wh | Acer Predator Triton 300 PT315-52-79LP i7-10750H, GeForce RTX 2060 Mobile, 58.7 Wh | Aorus 5 KB i7-10750H, GeForce RTX 2060 Mobile, 48.96 Wh | Lenovo Legion 5 15IMH05H i5-10300H, GeForce RTX 2060 Mobile, 60 Wh | Média da turma Gaming | |
|---|---|---|---|---|---|---|---|
| Duração da bateria | -41% | -29% | -39% | -51% | -27% | -37% | |
| Reader / Idle (h) | 20 | 7.8 -61% | 9.8 -51% | 9.6 -52% | 9 -55% | 14.1 -29% | 7.84 ? -61% |
| WiFi v1.3 (h) | 10.5 | 5.9 -44% | 6.2 -41% | 5.5 -48% | 4.8 -54% | 7.2 -31% | 7.08 ? -33% |
| Load (h) | 1.8 | 1.5 -17% | 1.9 6% | 1.5 -17% | 1 -44% | 1.4 -22% | 1.496 ? -17% |
| H.264 (h) | 6.2 | 5.4 | 9.2 | 8.27 ? |
Pro
Contra
Conclusão
Se você pode suportar um display de 60 Hz com pouca cor e um alto nível de ruído no modo 3D, o Omen 15-en0375ng é um caderno de jogos poderoso e não muito caro.
Consideramos cerca de 1.260 Euros (~$1530) para um Ryzen 7 4800H, um GeForce RTX 2060, um SSD de 512 GB e 16 GB de RAM de canal duplo como uma boa oferta que apela aos jogadores conscientes do preço. Detalhes muito altos são raramente um problema na resolução nativa de 1.920 x 1.080. Os compradores também serão prejudicados com uma bateria de última geração, que até mesmo bate a maioria das outras classes de notebooks.
Se a HP agora melhorar a velocidade do módulo WLAN, a estabilidade do case e a qualidade de imagem repetidamente criticada, a concorrência terá que se vestir extra calorosamente.
Nota: Outros modelos AMD do Omen 15 oferecem um painel (provavelmente melhor) de 144 Hz.
Disponibilidade
O modelo testado com o sufixo en0375ng é listado apenas por muito poucas lojas online (por exemplo, Mediamarkt & Saturn) e infelizmente não está disponível lá no momento
HP Omen 15-en0375ng
- 12/29/2020 v7 (old)
Florian Glaser
Price comparison
