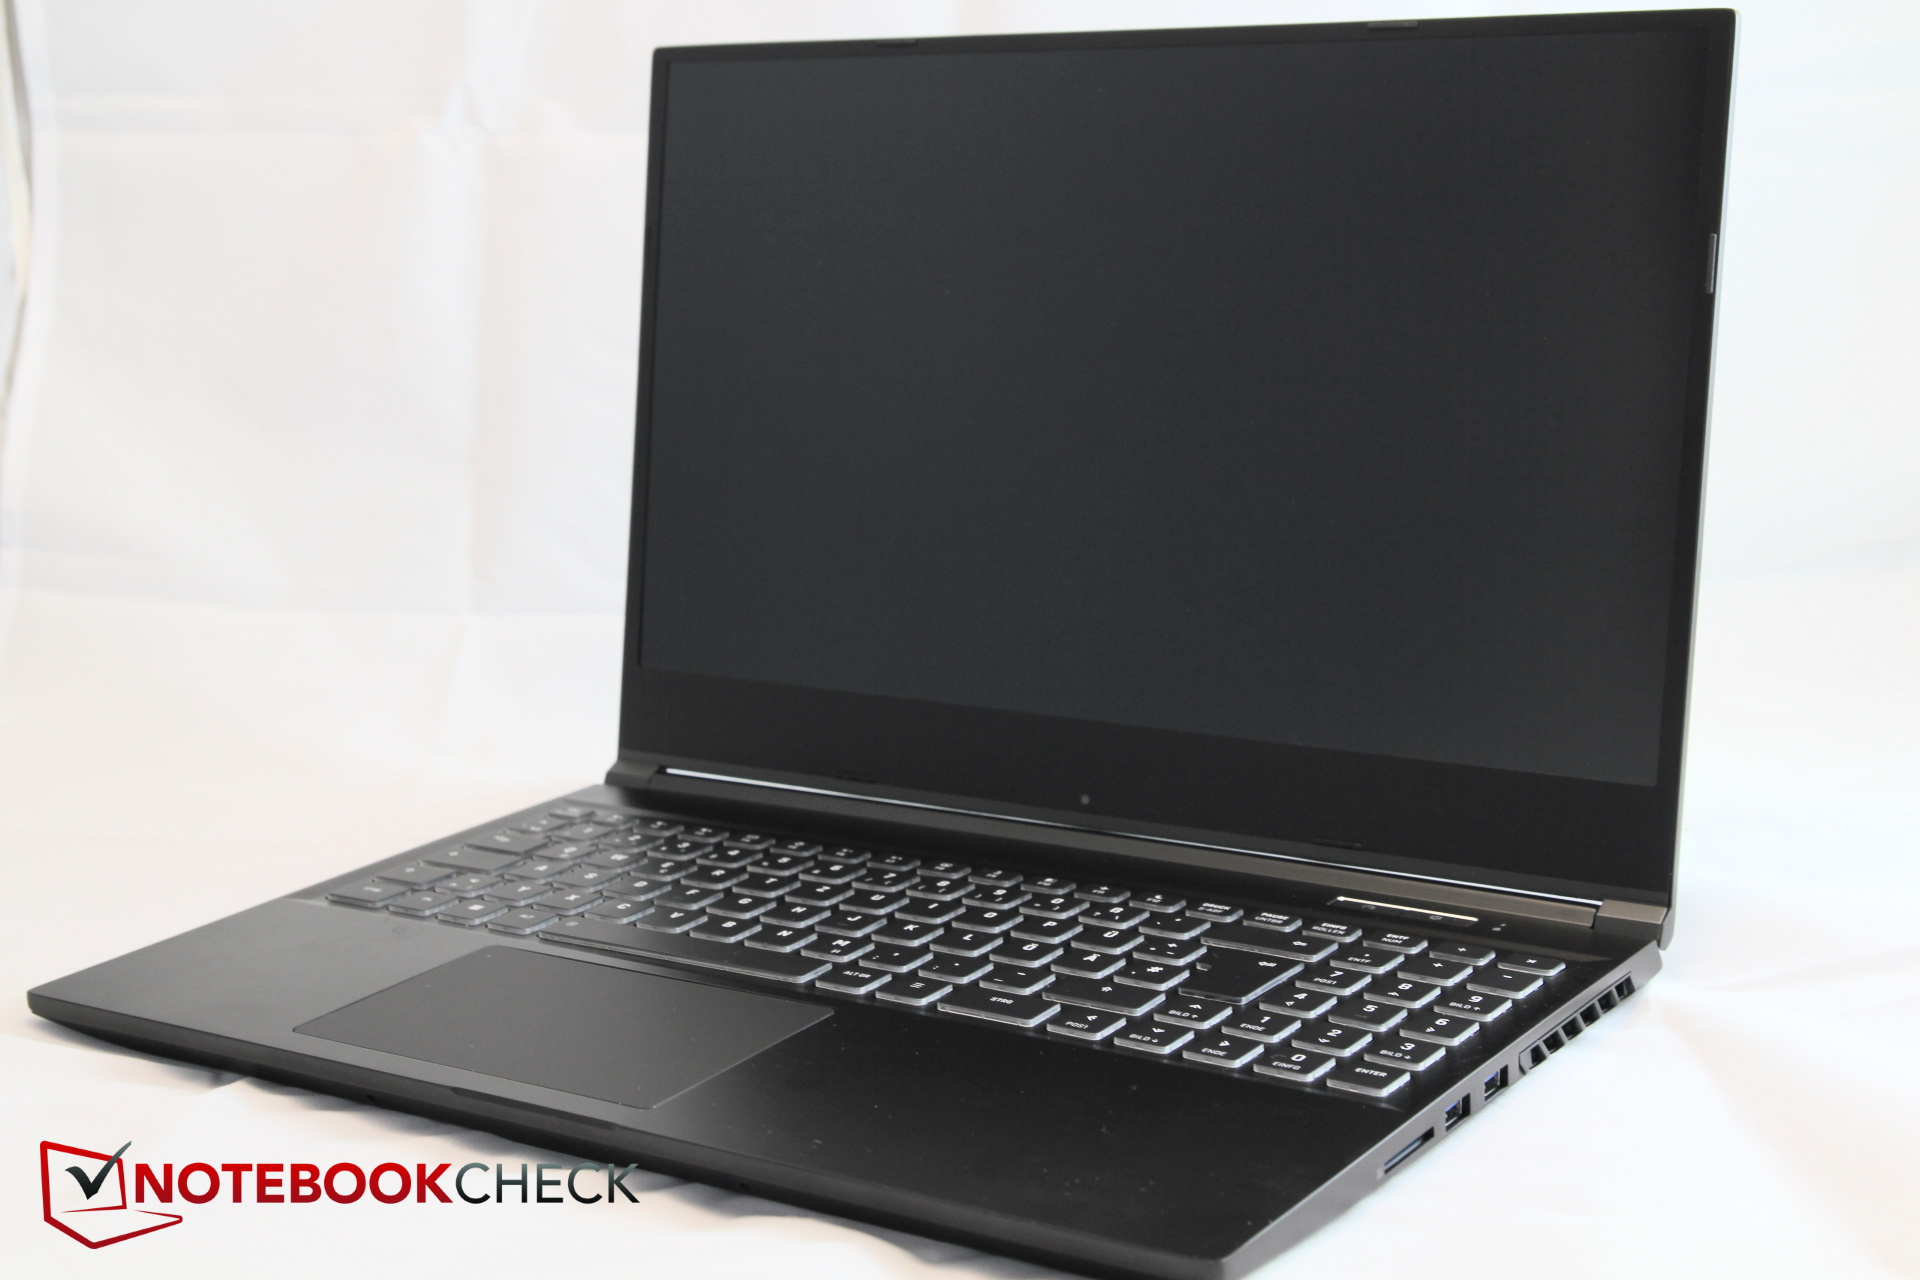
Breve Análise do Portátil Schenker XMG Core 15 (Tongfang GK5NR0O): Gamer AMD com uma boa relação de preço-desempenho
Avaliação | Data | Modelo | Peso | Altura | Size | Resolução | Preço |
|---|---|---|---|---|---|---|---|
| 82.1 % v7 (old) | 10/2020 | Schenker XMG Core 15 GK5NR0O R7 4800H, GeForce RTX 2060 Mobile | 2 kg | 19.9 mm | 15.60" | 1920x1080 | |
| 81.3 % v7 (old) | 02/2020 | Schenker XMG Core 15 GK5CP6V i7-9750H, GeForce GTX 1660 Ti Mobile | 2 kg | 26 mm | 15.60" | 1920x1080 | |
| 81.6 % v7 (old) | 09/2020 | Dell G3 15 3500-G4DG2 i7-10750H, GeForce RTX 2060 Mobile | 2.3 kg | 22 mm | 15.60" | 1920x1080 | |
| 83.3 % v7 (old) | 07/2020 | Lenovo Legion 5 15IMH05H i5-10300H, GeForce RTX 2060 Mobile | 2.5 kg | 26.1 mm | 15.60" | 1920x1080 | |
| 82.7 % v7 (old) | 06/2020 | Asus TUF Gaming A15 FA506IV-HN172 R7 4800H, GeForce RTX 2060 Mobile | 2.2 kg | 24.9 mm | 15.60" | 1920x1080 | |
| 83.7 % v7 (old) | 06/2020 | Dell G5 15 SE 5505 P89F R7 4800H, Radeon RX 5600M | 2.4 kg | 21.6 mm | 15.60" | 1920x1080 |
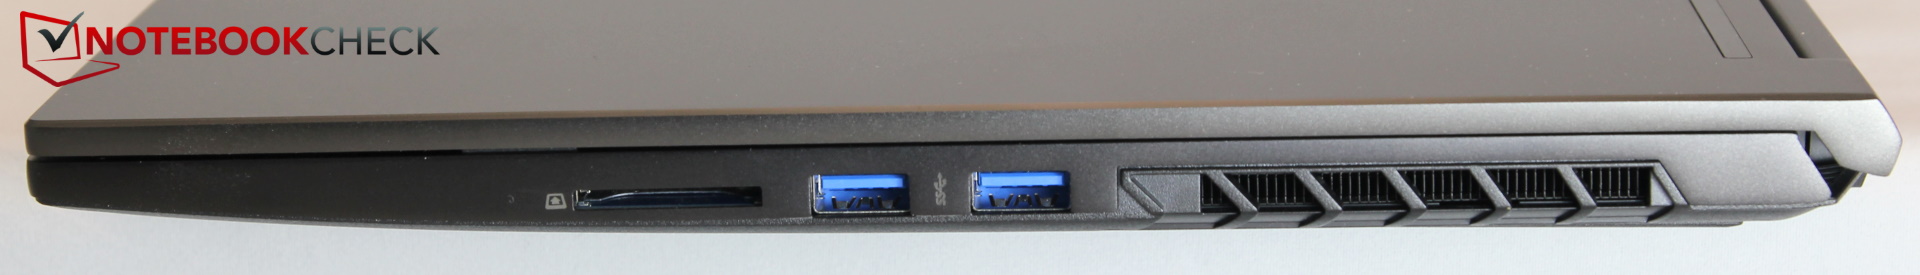
| SD Card Reader | |
| average JPG Copy Test (av. of 3 runs) | |
| Média da turma Gaming (20.9 - 210, n=54, últimos 2 anos) | |
| Dell G5 15 SE 5505 P89F (Toshiba Exceria Pro SDXC 64 GB UHS-II) | |
| Schenker XMG Core 15 GK5NR0O (Toshiba Exceria Pro SDXC 64 GB UHS-II) | |
| Dell G3 15 3500-G4DG2 (Toshiba Exceria Pro SDXC 64 GB UHS-II) | |
| Schenker XMG Core 15 GK5CP6V (Toshiba Exceria Pro SDXC 64 GB UHS-II) | |
| maximum AS SSD Seq Read Test (1GB) | |
| Média da turma Gaming (25.5 - 261, n=51, últimos 2 anos) | |
| Dell G5 15 SE 5505 P89F (Toshiba Exceria Pro SDXC 64 GB UHS-II) | |
| Schenker XMG Core 15 GK5NR0O (Toshiba Exceria Pro SDXC 64 GB UHS-II) | |
| Dell G3 15 3500-G4DG2 (Toshiba Exceria Pro SDXC 64 GB UHS-II) | |
| Schenker XMG Core 15 GK5CP6V (Toshiba Exceria Pro SDXC 64 GB UHS-II) | |


| |||||||||||||||||||||||||
iluminação: 87 %
iluminação com acumulador: 312 cd/m²
Contraste: 1560:1 (Preto: 0.2 cd/m²)
ΔE ColorChecker Calman: 4.84 | ∀{0.5-29.43 Ø4.73}
calibrated: 1.77
ΔE Greyscale Calman: 9 | ∀{0.09-98 Ø4.97}
92% sRGB (Argyll 1.6.3 3D)
68% AdobeRGB 1998 (Argyll 1.6.3 3D)
68.5% AdobeRGB 1998 (Argyll 3D)
95.9% sRGB (Argyll 3D)
67.2% Display P3 (Argyll 3D)
Gamma: 2.105
CCT: 8099 K
| Schenker XMG Core 15 GK5NR0O LM156LF-1F02, IPS, 1920x1080, 15.6" | Schenker XMG Core 15 GK5CP6V BOEhydis NV156FHM-N4G (BOE084D), IPS, 1920x1080, 15.6" | Dell G3 15 3500-G4DG2 AU Optronics AUO80ED, IPS, 1920x1080, 15.6" | Lenovo Legion 5 15IMH05H BOE CQ NV156FHM-NX1, IPS, 1920x1080, 15.6" | Asus TUF Gaming A15 FA506IV-HN172 LM156LF-2F01, IPS, 1920x1080, 15.6" | Dell G5 15 SE 5505 P89F BOE NV156FH, WVA, 1920x1080, 15.6" | |
|---|---|---|---|---|---|---|
| Display | -5% | -3% | -41% | -41% | -6% | |
| Display P3 Coverage (%) | 67.2 | 63.3 -6% | 64.6 -4% | 38.8 -42% | 38.92 -42% | 63 -6% |
| sRGB Coverage (%) | 95.9 | 91.2 -5% | 93.9 -2% | 57.8 -40% | 58.5 -39% | 90.1 -6% |
| AdobeRGB 1998 Coverage (%) | 68.5 | 65 -5% | 66.4 -3% | 40.09 -41% | 40.22 -41% | 64.1 -6% |
| Response Times | 0% | -15% | -124% | -202% | -63% | |
| Response Time Grey 50% / Grey 80% * (ms) | 9.6 ? | 8.8 ? 8% | 14 ? -46% | 26 ? -171% | 34 ? -254% | 20.4 ? -113% |
| Response Time Black / White * (ms) | 9.6 ? | 10.4 ? -8% | 8 ? 17% | 17 ? -77% | 24 ? -150% | 10.8 ? -13% |
| PWM Frequency (Hz) | 198.4 ? | |||||
| Screen | 7% | -1% | -22% | -21% | -3% | |
| Brightness middle (cd/m²) | 312 | 324 4% | 301 -4% | 301 -4% | 280 -10% | 292 -6% |
| Brightness (cd/m²) | 290 | 296 2% | 298 3% | 277 -4% | 254 -12% | 290 0% |
| Brightness Distribution (%) | 87 | 88 1% | 81 -7% | 77 -11% | 88 1% | 77 -11% |
| Black Level * (cd/m²) | 0.2 | 0.27 -35% | 0.23 -15% | 0.26 -30% | 0.15 25% | 0.27 -35% |
| Contrast (:1) | 1560 | 1200 -23% | 1309 -16% | 1158 -26% | 1867 20% | 1081 -31% |
| Colorchecker dE 2000 * | 4.84 | 4.07 16% | 4.68 3% | 5.12 -6% | 5.89 -22% | 3.99 18% |
| Colorchecker dE 2000 max. * | 13.85 | 6.39 54% | 8.86 36% | 19 -37% | 6.11 56% | |
| Colorchecker dE 2000 calibrated * | 1.77 | 1.49 16% | 1.87 -6% | 4.88 -176% | 4.79 -171% | 3.02 -71% |
| Greyscale dE 2000 * | 9 | 4.01 55% | 5.79 36% | 3.47 61% | 4.08 55% | 3.3 63% |
| Gamma | 2.105 105% | 2.6 85% | 2.46 89% | 2.37 93% | 2.33 94% | 2.25 98% |
| CCT | 8099 80% | 7350 88% | 7706 84% | 7062 92% | 7303 89% | 7047 92% |
| Color Space (Percent of AdobeRGB 1998) (%) | 68 | 59 -13% | 61 -10% | 37 -46% | 37 -46% | 58.1 -15% |
| Color Space (Percent of sRGB) (%) | 92 | 91 -1% | 94 2% | 57 -38% | 58 -37% | 89.7 -2% |
| Média Total (Programa/Configurações) | 1% /
4% | -6% /
-3% | -62% /
-38% | -88% /
-48% | -24% /
-11% |
* ... menor é melhor
Exibir tempos de resposta
| ↔ Tempo de resposta preto para branco | ||
|---|---|---|
| 9.6 ms ... ascensão ↗ e queda ↘ combinadas | ↗ 4.4 ms ascensão | 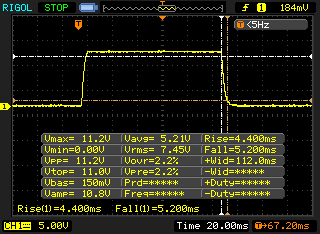 |
| ↘ 5.2 ms queda | ||
| A tela mostra taxas de resposta rápidas em nossos testes e deve ser adequada para jogos. Em comparação, todos os dispositivos testados variam de 0.1 (mínimo) a 240 (máximo) ms. » 26 % de todos os dispositivos são melhores. Isso significa que o tempo de resposta medido é melhor que a média de todos os dispositivos testados (19.9 ms). | ||
| ↔ Tempo de resposta 50% cinza a 80% cinza | ||
| 9.6 ms ... ascensão ↗ e queda ↘ combinadas | ↗ 5.2 ms ascensão | 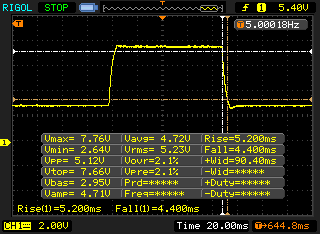 |
| ↘ 4.4 ms queda | ||
| A tela mostra taxas de resposta rápidas em nossos testes e deve ser adequada para jogos. Em comparação, todos os dispositivos testados variam de 0.165 (mínimo) a 636 (máximo) ms. » 23 % de todos os dispositivos são melhores. Isso significa que o tempo de resposta medido é melhor que a média de todos os dispositivos testados (31.1 ms). | ||
Cintilação da tela / PWM (modulação por largura de pulso)
| Tela tremeluzindo / PWM não detectado | 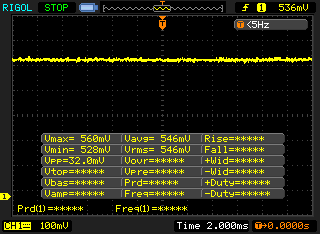 | ||
[pwm_comparison] Em comparação: 52 % de todos os dispositivos testados não usam PWM para escurecer a tela. Se PWM foi detectado, uma média de 7791 (mínimo: 5 - máximo: 343500) Hz foi medida. | |||

* ... menor é melhor
| PCMark 8 Home Score Accelerated v2 | 5197 pontos | |
| PCMark 8 Work Score Accelerated v2 | 5983 pontos | |
| PCMark 10 Score | 5427 pontos | |
Ajuda | ||
| DPC Latencies / LatencyMon - interrupt to process latency (max), Web, Youtube, Prime95 | |
| Dell G3 15 3500-G4DG2 | |
| Dell G5 15 SE 5505 P89F | |
| Schenker XMG Core 15 GK5NR0O | |
| Asus TUF Gaming A15 FA506IV-HN172 | |
| Lenovo Legion 5 15IMH05H | |
* ... menor é melhor
| Schenker XMG Core 15 GK5NR0O Samsung SSD 970 EVO Plus 500GB | Schenker XMG Core 15 GK5CP6V Samsung SSD 970 EVO Plus 500GB | Dell G3 15 3500-G4DG2 SK Hynix BC511 HFM512GDJTNI | Lenovo Legion 5 15IMH05H Samsung PM991 MZALQ512HALU | Asus TUF Gaming A15 FA506IV-HN172 Kingston OM8PCP3512F-AB | Dell G5 15 SE 5505 P89F Samsung PM991 MZ9LQ512HALU | Média Samsung SSD 970 EVO Plus 500GB | |
|---|---|---|---|---|---|---|---|
| CrystalDiskMark 5.2 / 6 | -30% | -46% | -35% | -35% | -35% | -16% | |
| Write 4K (MB/s) | 233 | 102 -56% | 99.6 -57% | 145.4 -38% | 219.8 -6% | 142.1 -39% | 159.2 ? -32% |
| Read 4K (MB/s) | 54.5 | 41.39 -24% | 38.8 -29% | 51.6 -5% | 50.2 -8% | 46.43 -15% | 48.5 ? -11% |
| Write Seq (MB/s) | 3050 | 1649 -46% | 1117 -63% | 1007 -67% | 979 -68% | 1108 -64% | 2114 ? -31% |
| Read Seq (MB/s) | 3042 | 1367 -55% | 1030 -66% | 1145 -62% | 1990 -35% | 1622 -47% | 2044 ? -33% |
| Write 4K Q32T1 (MB/s) | 520 | 379 -27% | 445.2 -14% | 468.4 -10% | 516 -1% | 467 -10% | 435 ? -16% |
| Read 4K Q32T1 (MB/s) | 546 | 401.2 -27% | 331.8 -39% | 528 -3% | 298.3 -45% | 525 -4% | 508 ? -7% |
| Write Seq Q32T1 (MB/s) | 3241 | 3276 1% | 1102 -66% | 1381 -57% | 982 -70% | 1203 -63% | 3238 ? 0% |
| Read Seq Q32T1 (MB/s) | 3538 | 3417 -3% | 2227 -37% | 2291 -35% | 1907 -46% | 2288 -35% | 3499 ? -1% |
| Write 4K Q8T8 (MB/s) | 981 | 2067 ? | |||||
| Read 4K Q8T8 (MB/s) | 300.9 | 1064 ? | |||||
| AS SSD | -20% | -68% | -55% | -53% | -74% | -10% | |
| Seq Read (MB/s) | 2836 | 2261 -20% | 1305 -54% | 2012 -29% | 1682 -41% | 1386 -51% | 2640 ? -7% |
| Seq Write (MB/s) | 2452 | 2393 -2% | 767 -69% | 1261 -49% | 904 -63% | 1234 -50% | 2500 ? 2% |
| 4K Read (MB/s) | 60.4 | 54.6 -10% | 41.84 -31% | 43.66 -28% | 60.2 0% | 41.32 -32% | 54.8 ? -9% |
| 4K Write (MB/s) | 190.5 | 118.4 -38% | 90.1 -53% | 109.3 -43% | 164.8 -13% | 128 -33% | 141.2 ? -26% |
| 4K-64 Read (MB/s) | 1283 | 1376 7% | 773 -40% | 851 -34% | 472.5 -63% | 854 -33% | 1345 ? 5% |
| 4K-64 Write (MB/s) | 2298 | 2299 0% | 711 -69% | 780 -66% | 845 -63% | 721 -69% | 2116 ? -8% |
| Access Time Read * (ms) | 0.034 | 0.07 -106% | 0.09 -165% | 0.117 -244% | 0.087 -156% | 0.098 -188% | 0.0475 ? -40% |
| Access Time Write * (ms) | 0.02 | 0.031 -55% | 0.04 -100% | 0.036 -80% | 0.02 -0% | 0.095 -375% | 0.02775 ? -39% |
| Score Read (Points) | 1627 | 1657 2% | 945 -42% | 1096 -33% | 701 -57% | 1034 -36% | 1664 ? 2% |
| Score Write (Points) | 2734 | 2657 -3% | 878 -68% | 1016 -63% | 1101 -60% | 973 -64% | 2507 ? -8% |
| Score Total (Points) | 5184 | 5175 0% | 2290 -56% | 2643 -49% | 2143 -59% | 2536 -51% | 5023 ? -3% |
| Copy ISO MB/s (MB/s) | 2039 | 1481 -27% | 675 -67% | 1284 -37% | 1989 ? -2% | ||
| Copy Program MB/s (MB/s) | 438 | 467.5 7% | 248.4 -43% | 401.9 -8% | 442 ? 1% | ||
| Copy Game MB/s (MB/s) | 1137 | 734 -35% | 535 -53% | 1013 -11% | 1121 ? -1% | ||
| Média Total (Programa/Configurações) | -25% /
-24% | -57% /
-59% | -45% /
-48% | -44% /
-46% | -55% /
-60% | -13% /
-12% |
* ... menor é melhor

Constant Performance Read: DiskSpd Read Loop, Queue Depth 8
| 3DMark 11 Performance | 18520 pontos | |
| 3DMark Cloud Gate Standard Score | 36445 pontos | |
| 3DMark Fire Strike Score | 14633 pontos | |
| 3DMark Time Spy Score | 6145 pontos | |
Ajuda | ||
| The Witcher 3 | |
| 1920x1080 High Graphics & Postprocessing (Nvidia HairWorks Off) | |
| Média da turma Gaming (181 - 341, n=3, últimos 2 anos) | |
| Lenovo Legion 5 15IMH05H | |
| Média NVIDIA GeForce RTX 2060 Mobile (74.4 - 131, n=33) | |
| Asus TUF Gaming A15 FA506IV-HN172 | |
| Schenker XMG Core 15 GK5NR0O | |
| Dell G5 15 SE 5505 P89F | |
| Schenker XMG Core 15 GK5CP6V | |
| 1920x1080 Ultra Graphics & Postprocessing (HBAO+) | |
| Média da turma Gaming (95 - 240, n=8, últimos 2 anos) | |
| Lenovo Legion 5 15IMH05H | |
| Dell G5 15 SE 5505 P89F | |
| Média NVIDIA GeForce RTX 2060 Mobile (50.6 - 74, n=40) | |
| Asus TUF Gaming A15 FA506IV-HN172 | |
| Schenker XMG Core 15 GK5NR0O | |
| Schenker XMG Core 15 GK5CP6V | |
| Dell G3 15 3500-G4DG2 | |
| baixo | média | alto | ultra | |
|---|---|---|---|---|
| GTA V (2015) | 156 | 143 | 112 | 62 |
| The Witcher 3 (2015) | 219.5 | 105 | 58.8 | |
| Dota 2 Reborn (2015) | 110.9 | 109.6 | 94 | 90.8 |
| X-Plane 11.11 (2018) | 89.1 | 75.9 | 64.7 | |
| Far Cry 5 (2018) | 95 | 87 | 81 | 76 |
| Battlefield V (2018) | 111.1 | 77.9 | 68.5 | 63.2 |
Barulho
| Ocioso |
| 26 / 30 / 32 dB |
| Carga |
| 46 / 48 dB |
 | ||
30 dB silencioso 40 dB(A) audível 50 dB(A) ruidosamente alto |
||
min: | ||
| Schenker XMG Core 15 GK5NR0O R7 4800H, GeForce RTX 2060 Mobile | Schenker XMG Core 15 GK5CP6V i7-9750H, GeForce GTX 1660 Ti Mobile | Dell G3 15 3500-G4DG2 i7-10750H, GeForce RTX 2060 Mobile | Lenovo Legion 5 15IMH05H i5-10300H, GeForce RTX 2060 Mobile | Asus TUF Gaming A15 FA506IV-HN172 R7 4800H, GeForce RTX 2060 Mobile | Dell G5 15 SE 5505 P89F R7 4800H, Radeon RX 5600M | |
|---|---|---|---|---|---|---|
| Noise | -8% | 0% | -3% | -3% | 4% | |
| desligado / ambiente * (dB) | 25 | 30 -20% | 26.7 -7% | 30.7 -23% | 30.2 -21% | 28 -12% |
| Idle Minimum * (dB) | 26 | 30 -15% | 27.1 -4% | 30.7 -18% | 30.2 -16% | 28 -8% |
| Idle Average * (dB) | 30 | 31 -3% | 27.1 10% | 30.7 -2% | 30.2 -1% | 28 7% |
| Idle Maximum * (dB) | 32 | 33 -3% | 30.8 4% | 30.7 4% | 30.2 6% | 28 12% |
| Load Average * (dB) | 46 | 48 -4% | 45.3 2% | 36.6 20% | 40 13% | 28 39% |
| Witcher 3 ultra * (dB) | 48 | 51 -6% | 48.7 -1% | 47 2% | 49 -2% | 50.6 -5% |
| Load Maximum * (dB) | 48 | 51 -6% | 48.7 -1% | 50.9 -6% | 49 -2% | 50.6 -5% |
* ... menor é melhor
(-) A temperatura máxima no lado superior é 51 °C / 124 F, em comparação com a média de 40.4 °C / 105 F , variando de 21.2 a 68.8 °C para a classe Gaming.
(-) A parte inferior aquece até um máximo de 64 °C / 147 F, em comparação com a média de 43.2 °C / 110 F
(+) Em uso inativo, a temperatura média para o lado superior é 28.3 °C / 83 F, em comparação com a média do dispositivo de 33.9 °C / ### class_avg_f### F.
(-) Jogando The Witcher 3, a temperatura média para o lado superior é 42.6 °C / 109 F, em comparação com a média do dispositivo de 33.9 °C / ## #class_avg_f### F.
(±) Os apoios para as mãos e o touchpad podem ficar muito quentes ao toque, com um máximo de 36 °C / 96.8 F.
(-) A temperatura média da área do apoio para as mãos de dispositivos semelhantes foi 28.8 °C / 83.8 F (-7.2 °C / -13 F).
| Schenker XMG Core 15 GK5NR0O R7 4800H, GeForce RTX 2060 Mobile | Schenker XMG Core 15 GK5CP6V i7-9750H, GeForce GTX 1660 Ti Mobile | Dell G3 15 3500-G4DG2 i7-10750H, GeForce RTX 2060 Mobile | Lenovo Legion 5 15IMH05H i5-10300H, GeForce RTX 2060 Mobile | Asus TUF Gaming A15 FA506IV-HN172 R7 4800H, GeForce RTX 2060 Mobile | Dell G5 15 SE 5505 P89F R7 4800H, Radeon RX 5600M | |
|---|---|---|---|---|---|---|
| Heat | 8% | -5% | 13% | 15% | 4% | |
| Maximum Upper Side * (°C) | 51 | 48 6% | 50.3 1% | 46.3 9% | 42.9 16% | 53 -4% |
| Maximum Bottom * (°C) | 64 | 59 8% | 58.6 8% | 44.4 31% | 49.9 22% | 57.6 10% |
| Idle Upper Side * (°C) | 29 | 27 7% | 33.9 -17% | 28.1 3% | 27.8 4% | 27.4 6% |
| Idle Bottom * (°C) | 32 | 28 12% | 36.3 -13% | 29.4 8% | 27 16% | 31 3% |
* ... menor é melhor
Schenker XMG Core 15 GK5NR0O análise de áudio
(+) | os alto-falantes podem tocar relativamente alto (###valor### dB)
Graves 100 - 315Hz
(-) | quase nenhum baixo - em média 24.2% menor que a mediana
(±) | a linearidade dos graves é média (14.8% delta para a frequência anterior)
Médios 400 - 2.000 Hz
(+) | médios equilibrados - apenas 2% longe da mediana
(+) | médios são lineares (3.8% delta para frequência anterior)
Altos 2 - 16 kHz
(±) | máximos mais altos - em média 7.1% maior que a mediana
(±) | a linearidade dos máximos é média (9% delta para frequência anterior)
Geral 100 - 16.000 Hz
(±) | a linearidade do som geral é média (18.8% diferença em relação à mediana)
Comparado com a mesma classe
» 62% de todos os dispositivos testados nesta classe foram melhores, 8% semelhantes, 30% piores
» O melhor teve um delta de 6%, a média foi 18%, o pior foi 132%
Comparado com todos os dispositivos testados
» 43% de todos os dispositivos testados foram melhores, 8% semelhantes, 49% piores
» O melhor teve um delta de 4%, a média foi 24%, o pior foi 134%
Schenker XMG Core 15 GK5CP6V análise de áudio
(±) | o volume do alto-falante é médio, mas bom (###valor### dB)
Graves 100 - 315Hz
(-) | quase nenhum baixo - em média 23.1% menor que a mediana
(±) | a linearidade dos graves é média (11.5% delta para a frequência anterior)
Médios 400 - 2.000 Hz
(+) | médios equilibrados - apenas 4.7% longe da mediana
(±) | a linearidade dos médios é média (9% delta para frequência anterior)
Altos 2 - 16 kHz
(+) | agudos equilibrados - apenas 1.5% longe da mediana
(+) | os máximos são lineares (4.6% delta da frequência anterior)
Geral 100 - 16.000 Hz
(±) | a linearidade do som geral é média (23.1% diferença em relação à mediana)
Comparado com a mesma classe
» 84% de todos os dispositivos testados nesta classe foram melhores, 5% semelhantes, 12% piores
» O melhor teve um delta de 6%, a média foi 18%, o pior foi 132%
Comparado com todos os dispositivos testados
» 69% de todos os dispositivos testados foram melhores, 5% semelhantes, 26% piores
» O melhor teve um delta de 4%, a média foi 24%, o pior foi 134%
| desligado | |
| Ocioso | |
| Carga |
|
Key:
min: | |
| Schenker XMG Core 15 GK5NR0O R7 4800H, GeForce RTX 2060 Mobile | Schenker XMG Core 15 GK5CP6V i7-9750H, GeForce GTX 1660 Ti Mobile | Dell G3 15 3500-G4DG2 i7-10750H, GeForce RTX 2060 Mobile | Lenovo Legion 5 15IMH05H i5-10300H, GeForce RTX 2060 Mobile | Asus TUF Gaming A15 FA506IV-HN172 R7 4800H, GeForce RTX 2060 Mobile | Dell G5 15 SE 5505 P89F R7 4800H, Radeon RX 5600M | Média da turma Gaming | |
|---|---|---|---|---|---|---|---|
| Power Consumption | 13% | 7% | 28% | 18% | 20% | -21% | |
| Idle Minimum * (Watt) | 12 | 9 25% | 7 42% | 3.2 73% | 5.4 55% | 6.5 46% | 13.2 ? -10% |
| Idle Average * (Watt) | 14 | 12 14% | 10.2 27% | 8.3 41% | 10 29% | 10.6 24% | 18.9 ? -35% |
| Idle Maximum * (Watt) | 20 | 18 10% | 15 25% | 8.7 57% | 10.5 47% | 11 45% | 24.3 ? -22% |
| Load Average * (Watt) | 103 | 86 17% | 147 -43% | 82 20% | 135 -31% | 84.1 18% | 108.3 ? -5% |
| Witcher 3 ultra * (Watt) | 125 | 126 -1% | 131 -5% | 151 -21% | 144 -15% | 152.9 -22% | |
| Load Maximum * (Watt) | 193 | 173 10% | 197 -2% | 195 -1% | 147 24% | 180.4 7% | 254 ? -32% |
* ... menor é melhor
| Schenker XMG Core 15 GK5NR0O R7 4800H, GeForce RTX 2060 Mobile, 62 Wh | Schenker XMG Core 15 GK5CP6V i7-9750H, GeForce GTX 1660 Ti Mobile, 46 Wh | Dell G3 15 3500-G4DG2 i7-10750H, GeForce RTX 2060 Mobile, 68 Wh | Lenovo Legion 5 15IMH05H i5-10300H, GeForce RTX 2060 Mobile, 60 Wh | Asus TUF Gaming A15 FA506IV-HN172 R7 4800H, GeForce RTX 2060 Mobile, 48 Wh | Dell G5 15 SE 5505 P89F R7 4800H, Radeon RX 5600M, 51 Wh | Média da turma Gaming | |
|---|---|---|---|---|---|---|---|
| Duração da bateria | -38% | -3% | 36% | 11% | 16% | 16% | |
| Reader / Idle (h) | 7.8 | 6.1 -22% | 7.5 -4% | 14.1 81% | 9.8 26% | 11.2 44% | 8.71 ? 12% |
| H.264 (h) | 6.2 | 9.2 48% | 5.4 -13% | 8.26 ? 33% | |||
| WiFi v1.3 (h) | 5.9 | 3.6 -39% | 5.2 -12% | 7.2 22% | 6.2 5% | 6.2 5% | 7.04 ? 19% |
| Load (h) | 1.5 | 0.7 -53% | 1.6 7% | 1.4 -7% | 1.9 27% | 1.5 0% | 1.47 ? -2% |
Pro
Contra
Veredict - Schenker econômico com hardware poderoso

Atualmente, uma atualização de hardware faz mais sentido do que nunca. Os novos processadores Zen 2 da AMD elevaram o desempenho do portátil a novos domínios neste momento, e uma RTX 2060 em vez da GTX 1660 Ti como companheira do Ryzen 7 é apenas consequente. No entanto, o aumento de desempenho do 1660 Ti resultou menor do que o esperado. Por outro lado, o desempenho da CPU está além de qualquer dúvida e o WLAN e a tela também são capazes de convencer.
Mas aqueles que pensam que o tamanho relativamente compacto e o peso comparativamente baixo fazem do XMG a máquina de jogos móvel perfeita, ficarão decepcionados com o afogamento massivo do desempenho gráfico no modo de bateria. Além disso, o Schenker consome mais energia durante a operação inativa do que seria realmente necessário com Optimus, e também fica muito quente sob uso intenso.
Enquanto o Schenker XMG Core 15 oferece hardware poderoso em uma carcaça bastante fina por um preço baixo de menos de 1.500 Euros (~$ 1.745), ele estraga seu potencial de mobilidade com forte afogamento no modo de bateria. Conectado, particularmente o desempenho do CPU é emocionante, mas a RTX 2060 é um pouco mais rápida na maioria dos concorrentes.
Schenker XMG Core 15 GK5NR0O
- 09/25/2020 v7 (old)
Christian Hintze
Price comparison
