Revisão do laptop Lenovo ThinkPad P16 G1: Uma estação de trabalho HX55 potente e recém-desenhada
Desde 2015, a Lenovo possui dois modelos no segmento clássico de estações de trabalho móveis, onde o foco é principalmente o desempenho. Mais recentemente, esses modelos passaram a se chamarLenovo ThinkPad P15 Gen 2e oLenovo ThinkPad P17 Gen 2. Como o nome sugere, cada dispositivo veio com um display de 15 e 17 polegadas. Em 2022, a Lenovo decidiu acabar com esta dualidade de estações de trabalho e agora eles oferecem uma estação de trabalho móvel cheia de gordura: o Lenovo ThinkPad P16 Gen 1, que substitui os dois modelos anteriores. Em particular, uma comparação com seus concorrentes diretos da Dell e da Asus mostrará como ela se comporta bem com dispositivos similares onde o desempenho móvel é uma prioridade.
Possíveis concorrentes em comparação
Avaliação | Data | Modelo | Peso | Altura | Size | Resolução | Preço |
|---|---|---|---|---|---|---|---|
| 88.2 % v7 (old) | 02/2023 | Lenovo ThinkPad P16 G1 21D6001DMB i7-12850HX, RTX A2000 Laptop GPU | 3 kg | 30.23 mm | 16.00" | 2560x1600 | |
| 87.2 % v7 (old) | 10/2021 | Lenovo ThinkPad P15 G2-20YQ001JGE i7-11800H, RTX A3000 Laptop GPU | 2.9 kg | 31.5 mm | 15.60" | 1920x1080 | |
| 87.8 % v7 (old) | 10/2021 | Lenovo ThinkPad P17 G2-20YU0025G i7-11800H, RTX A2000 Laptop GPU | 3.6 kg | 28.38 mm | 17.30" | 1920x1080 | |
| 89.7 % v7 (old) | 02/2022 | HP ZBook Fury 17 G8-4A6A9EA i9-11950H, RTX A3000 Laptop GPU | 2.9 kg | 27 mm | 17.30" | 3840x2160 | |
| 88.4 % v7 (old) | 10/2022 | Dell Precision 7670 i7-12850HX, RTX A2000 Laptop GPU | 2.7 kg | 24.7 mm | 16.00" | 3840x2400 | |
| 89.6 % v7 (old) | 01/2023 | Asus ExpertBook B6 Flip B6602FC2 i9-12950HX, RTX A2000 Laptop GPU | 2.8 kg | 27.2 mm | 16.00" | 2560x1600 |
Estojo: Uma tampa de alumínio cinza com uma estrutura de magnésio
Desde o início da série ThinkPad P, oP15e P17foram a representação mais clássica do design do ThinkPad. Com suas caixas de plástico boxeadas, com estrutura de magnésio e o clássico mecanismo de dobradiças na base, foram os laptops ThinkPad que mais se aproximaram de modelos como o clássicoLenovo ThinkPad T60. Para os ventiladores ThinkPad, certamente uma característica positiva, mas o design também poderia ser considerado como tendo ultrapassado sua data de validade - especialmente no que diz respeito às grandes luneis de exibição.
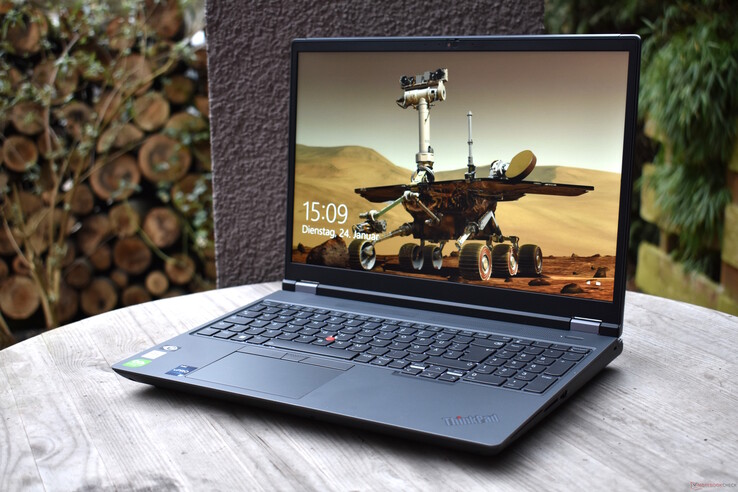
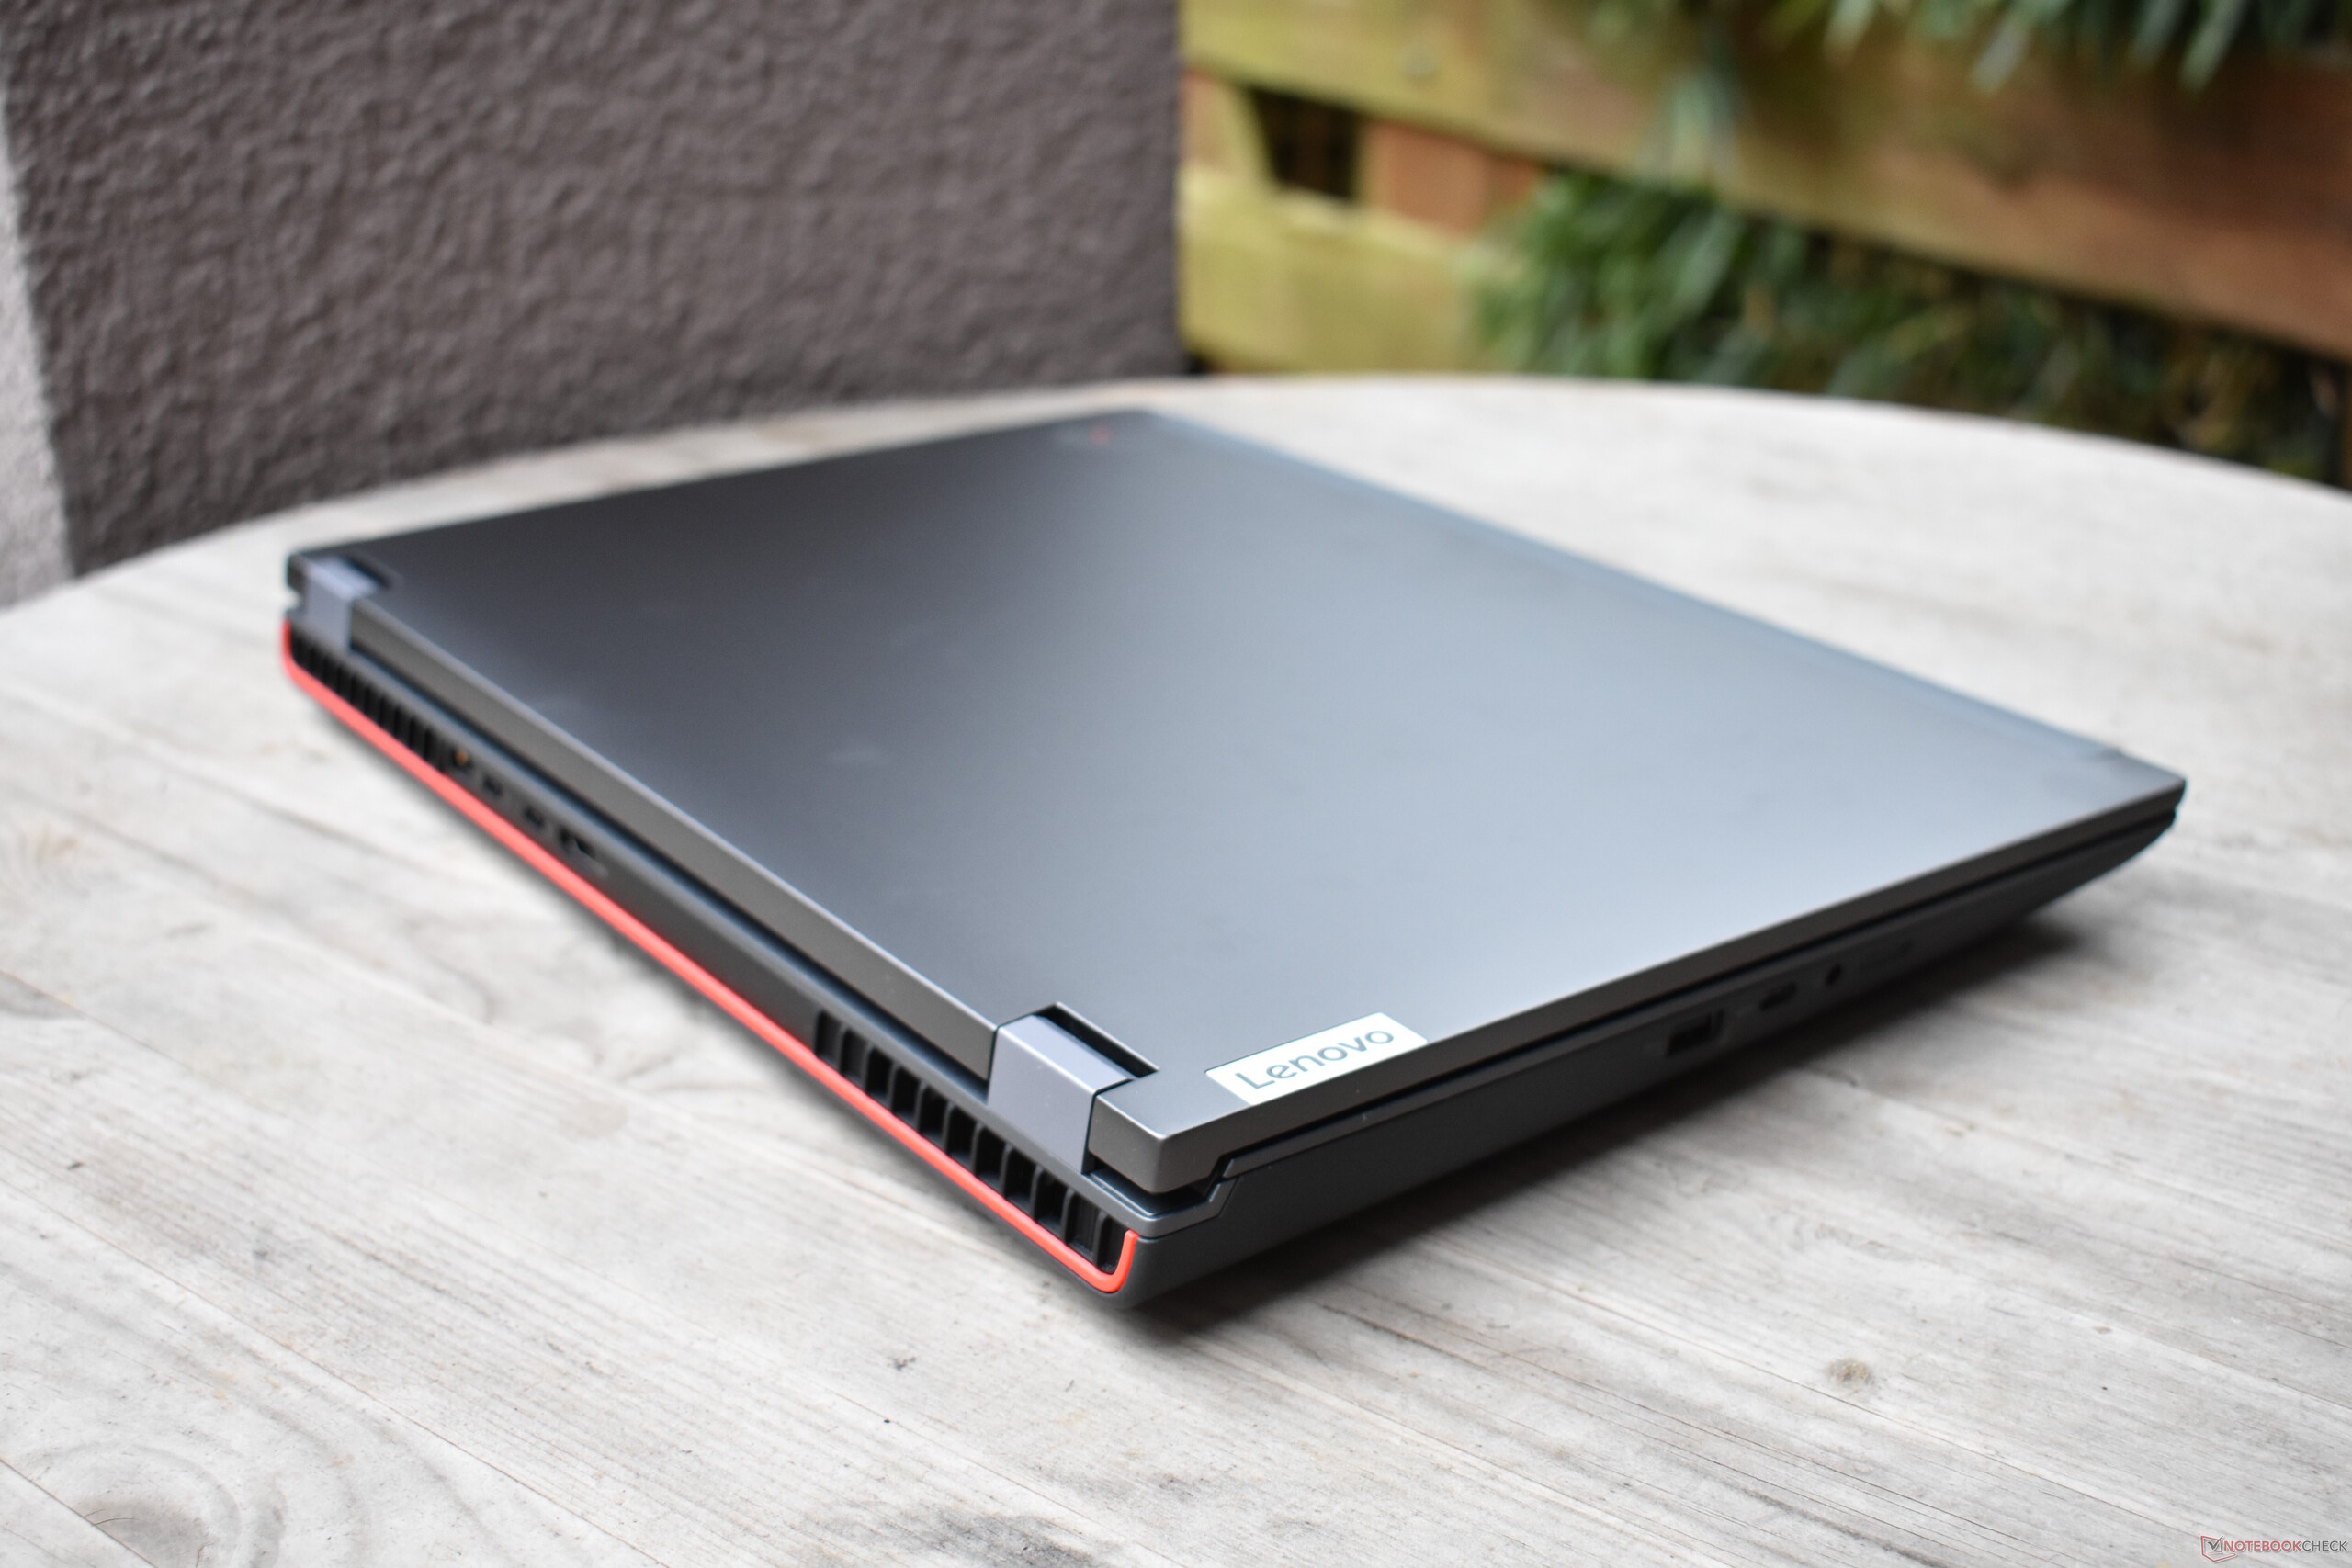
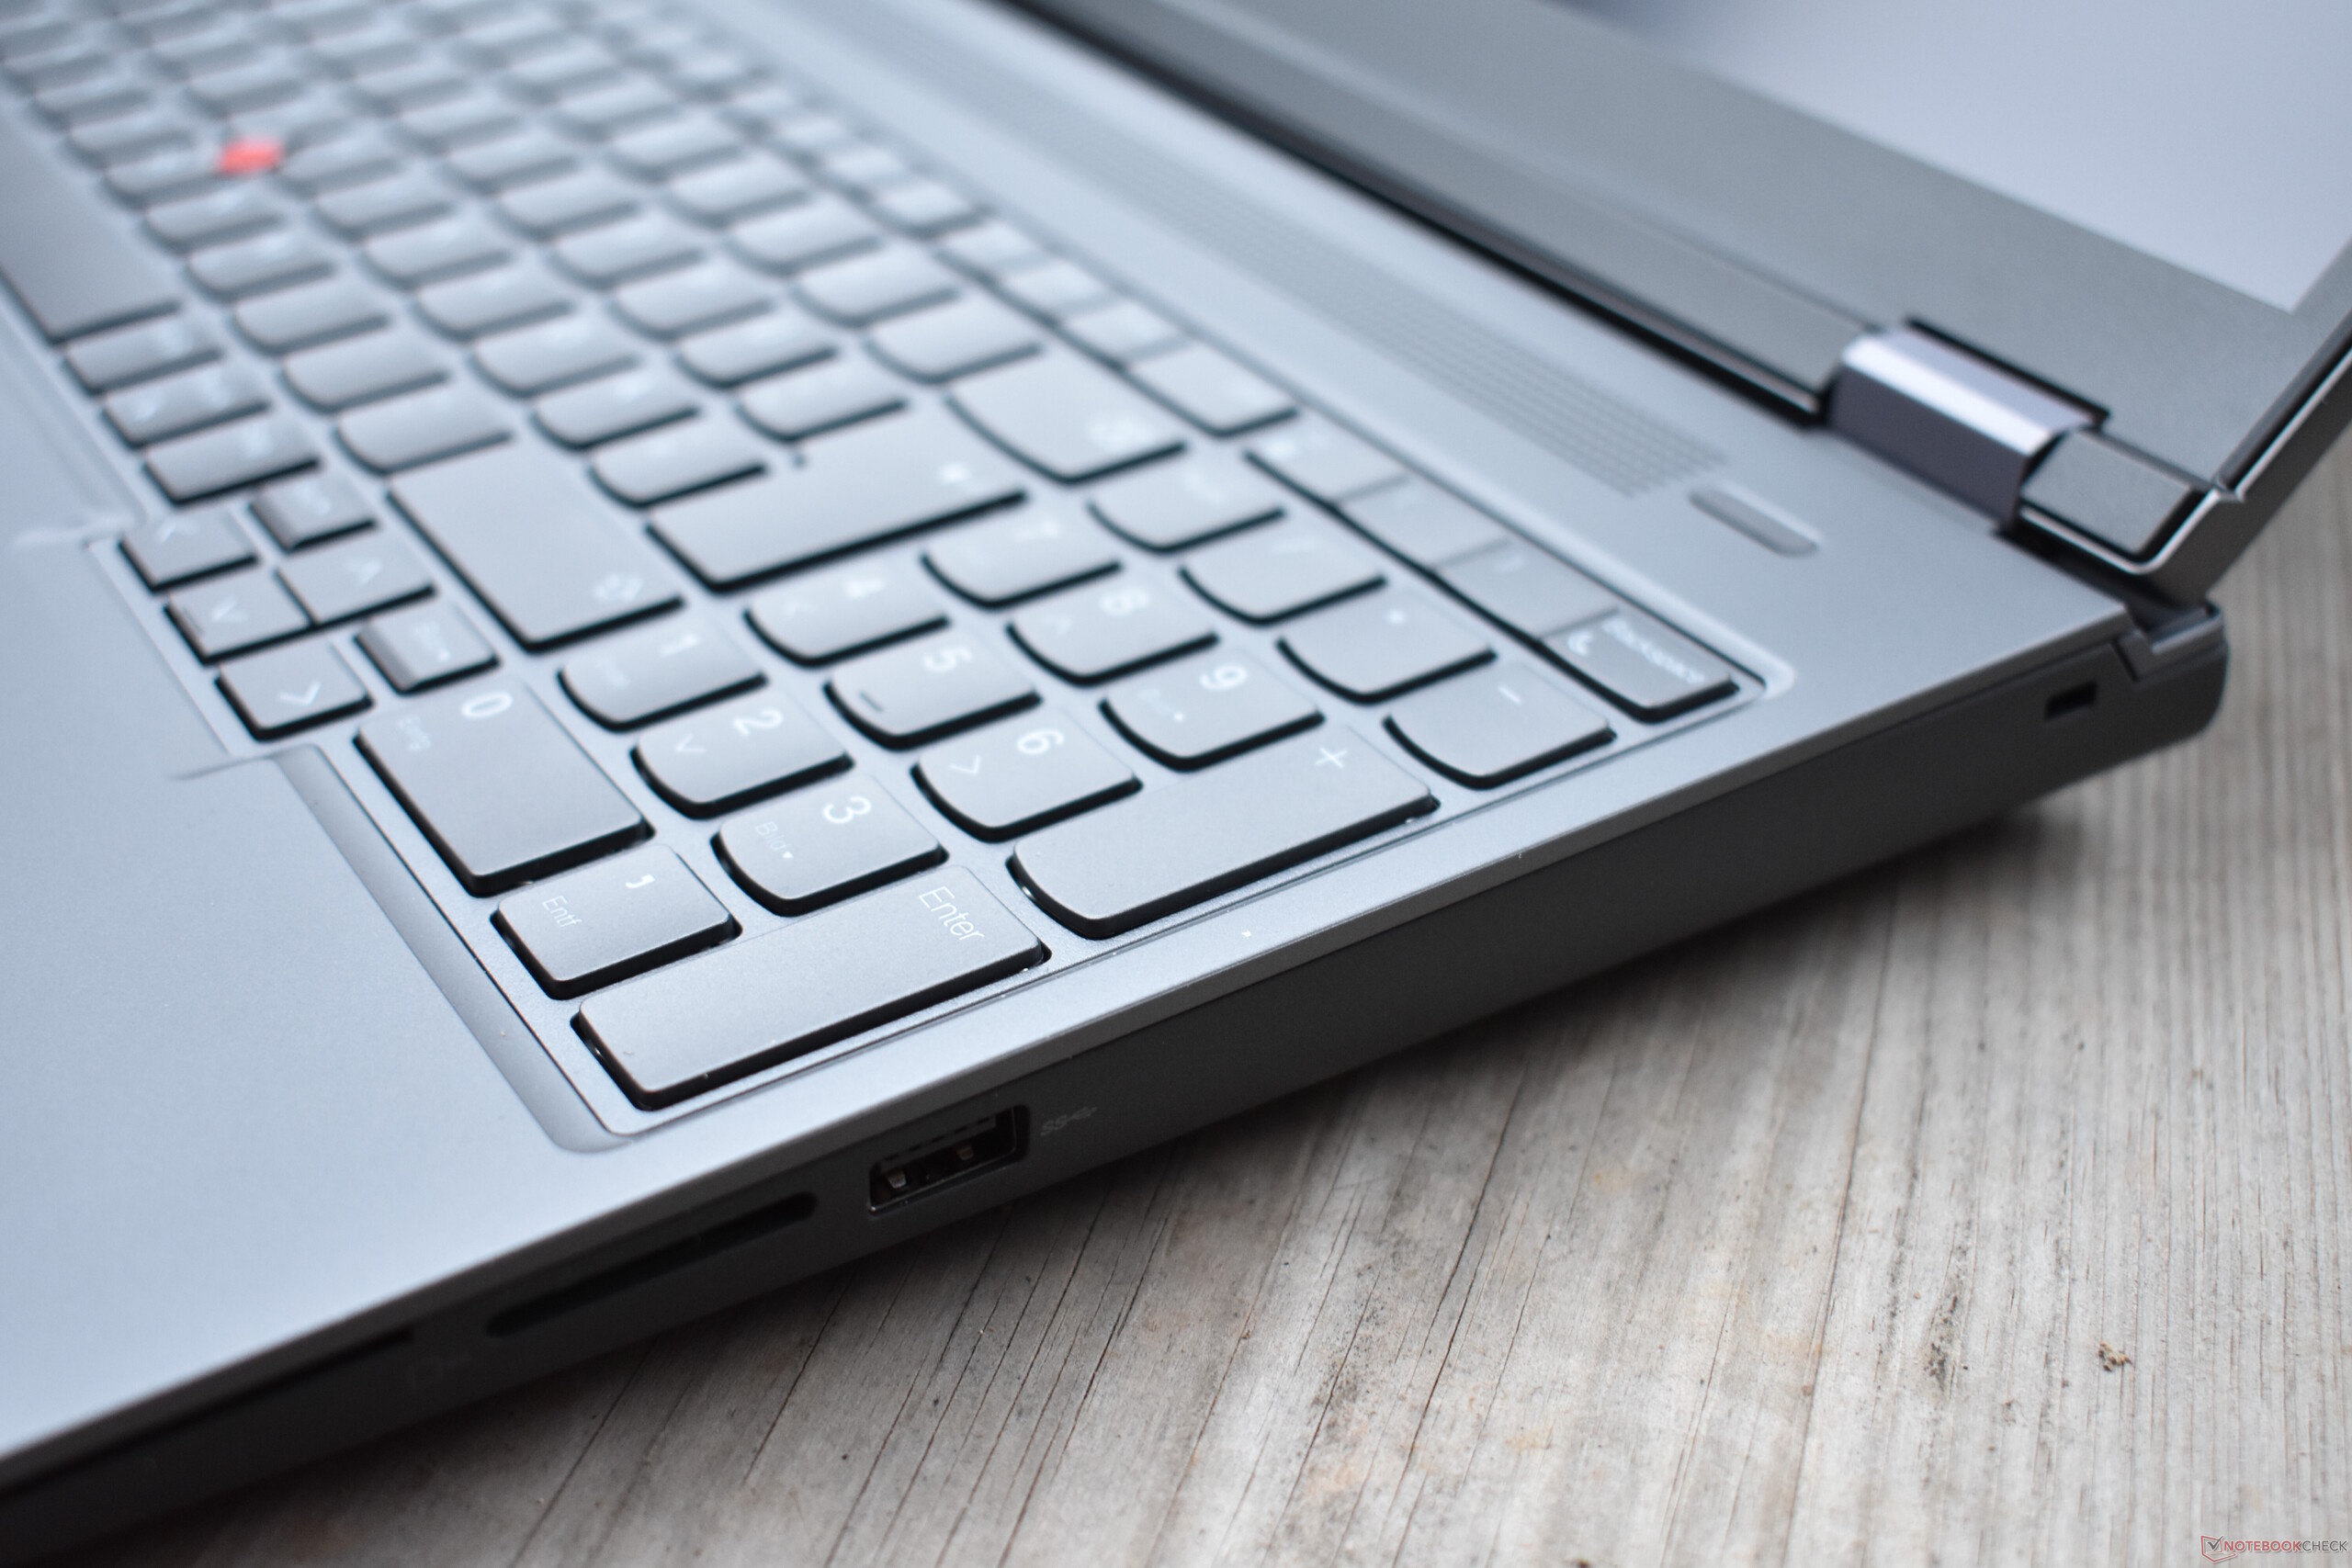
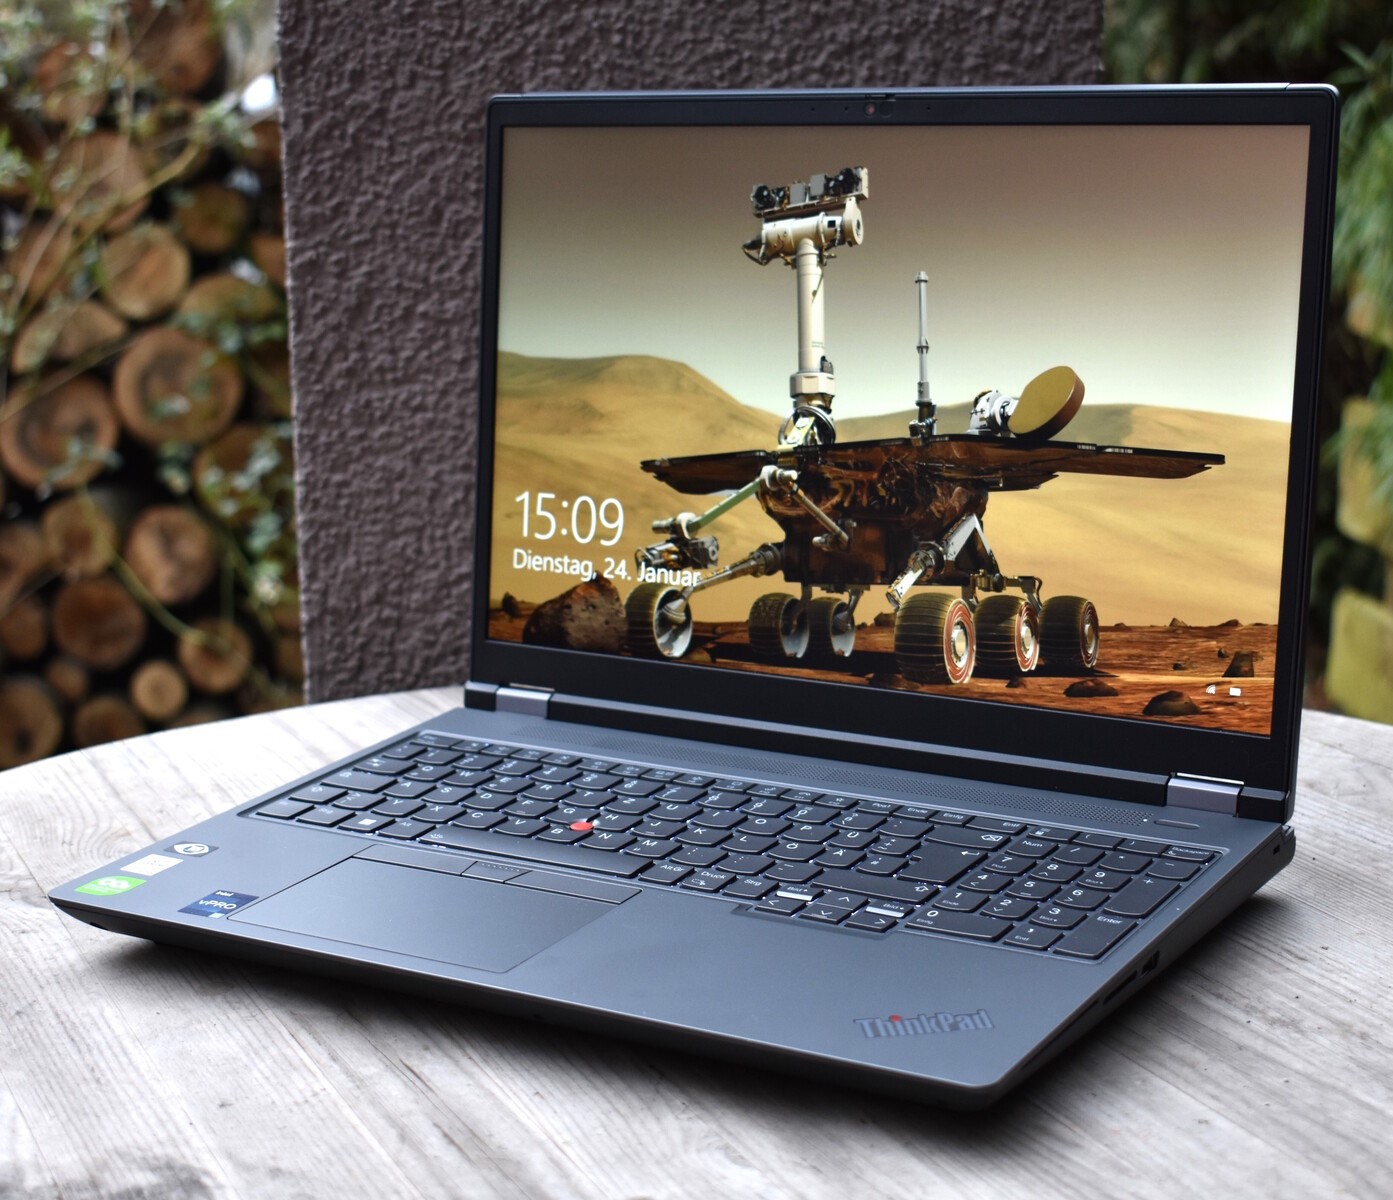
O ThinkPad P16 muda muitas coisas. O apoio de palma, o teclado e a tampa da tela estão inteiramente em "Storm Gray". As bordas arredondadas garantem uma forma um pouco menos boxeada. Em relação à parte traseira do dispositivo, a Lenovo demonstrou estar interessada em experimentar, já que esta área é embelezada com destaques vermelhos. O P16 também parece mais moderno do que seu antecessor, pois as luneiras da tela são muito mais finas. Entretanto, para um dispositivo moderno, eles ainda são relativamente grandes, em particular, na parte inferior da tela.
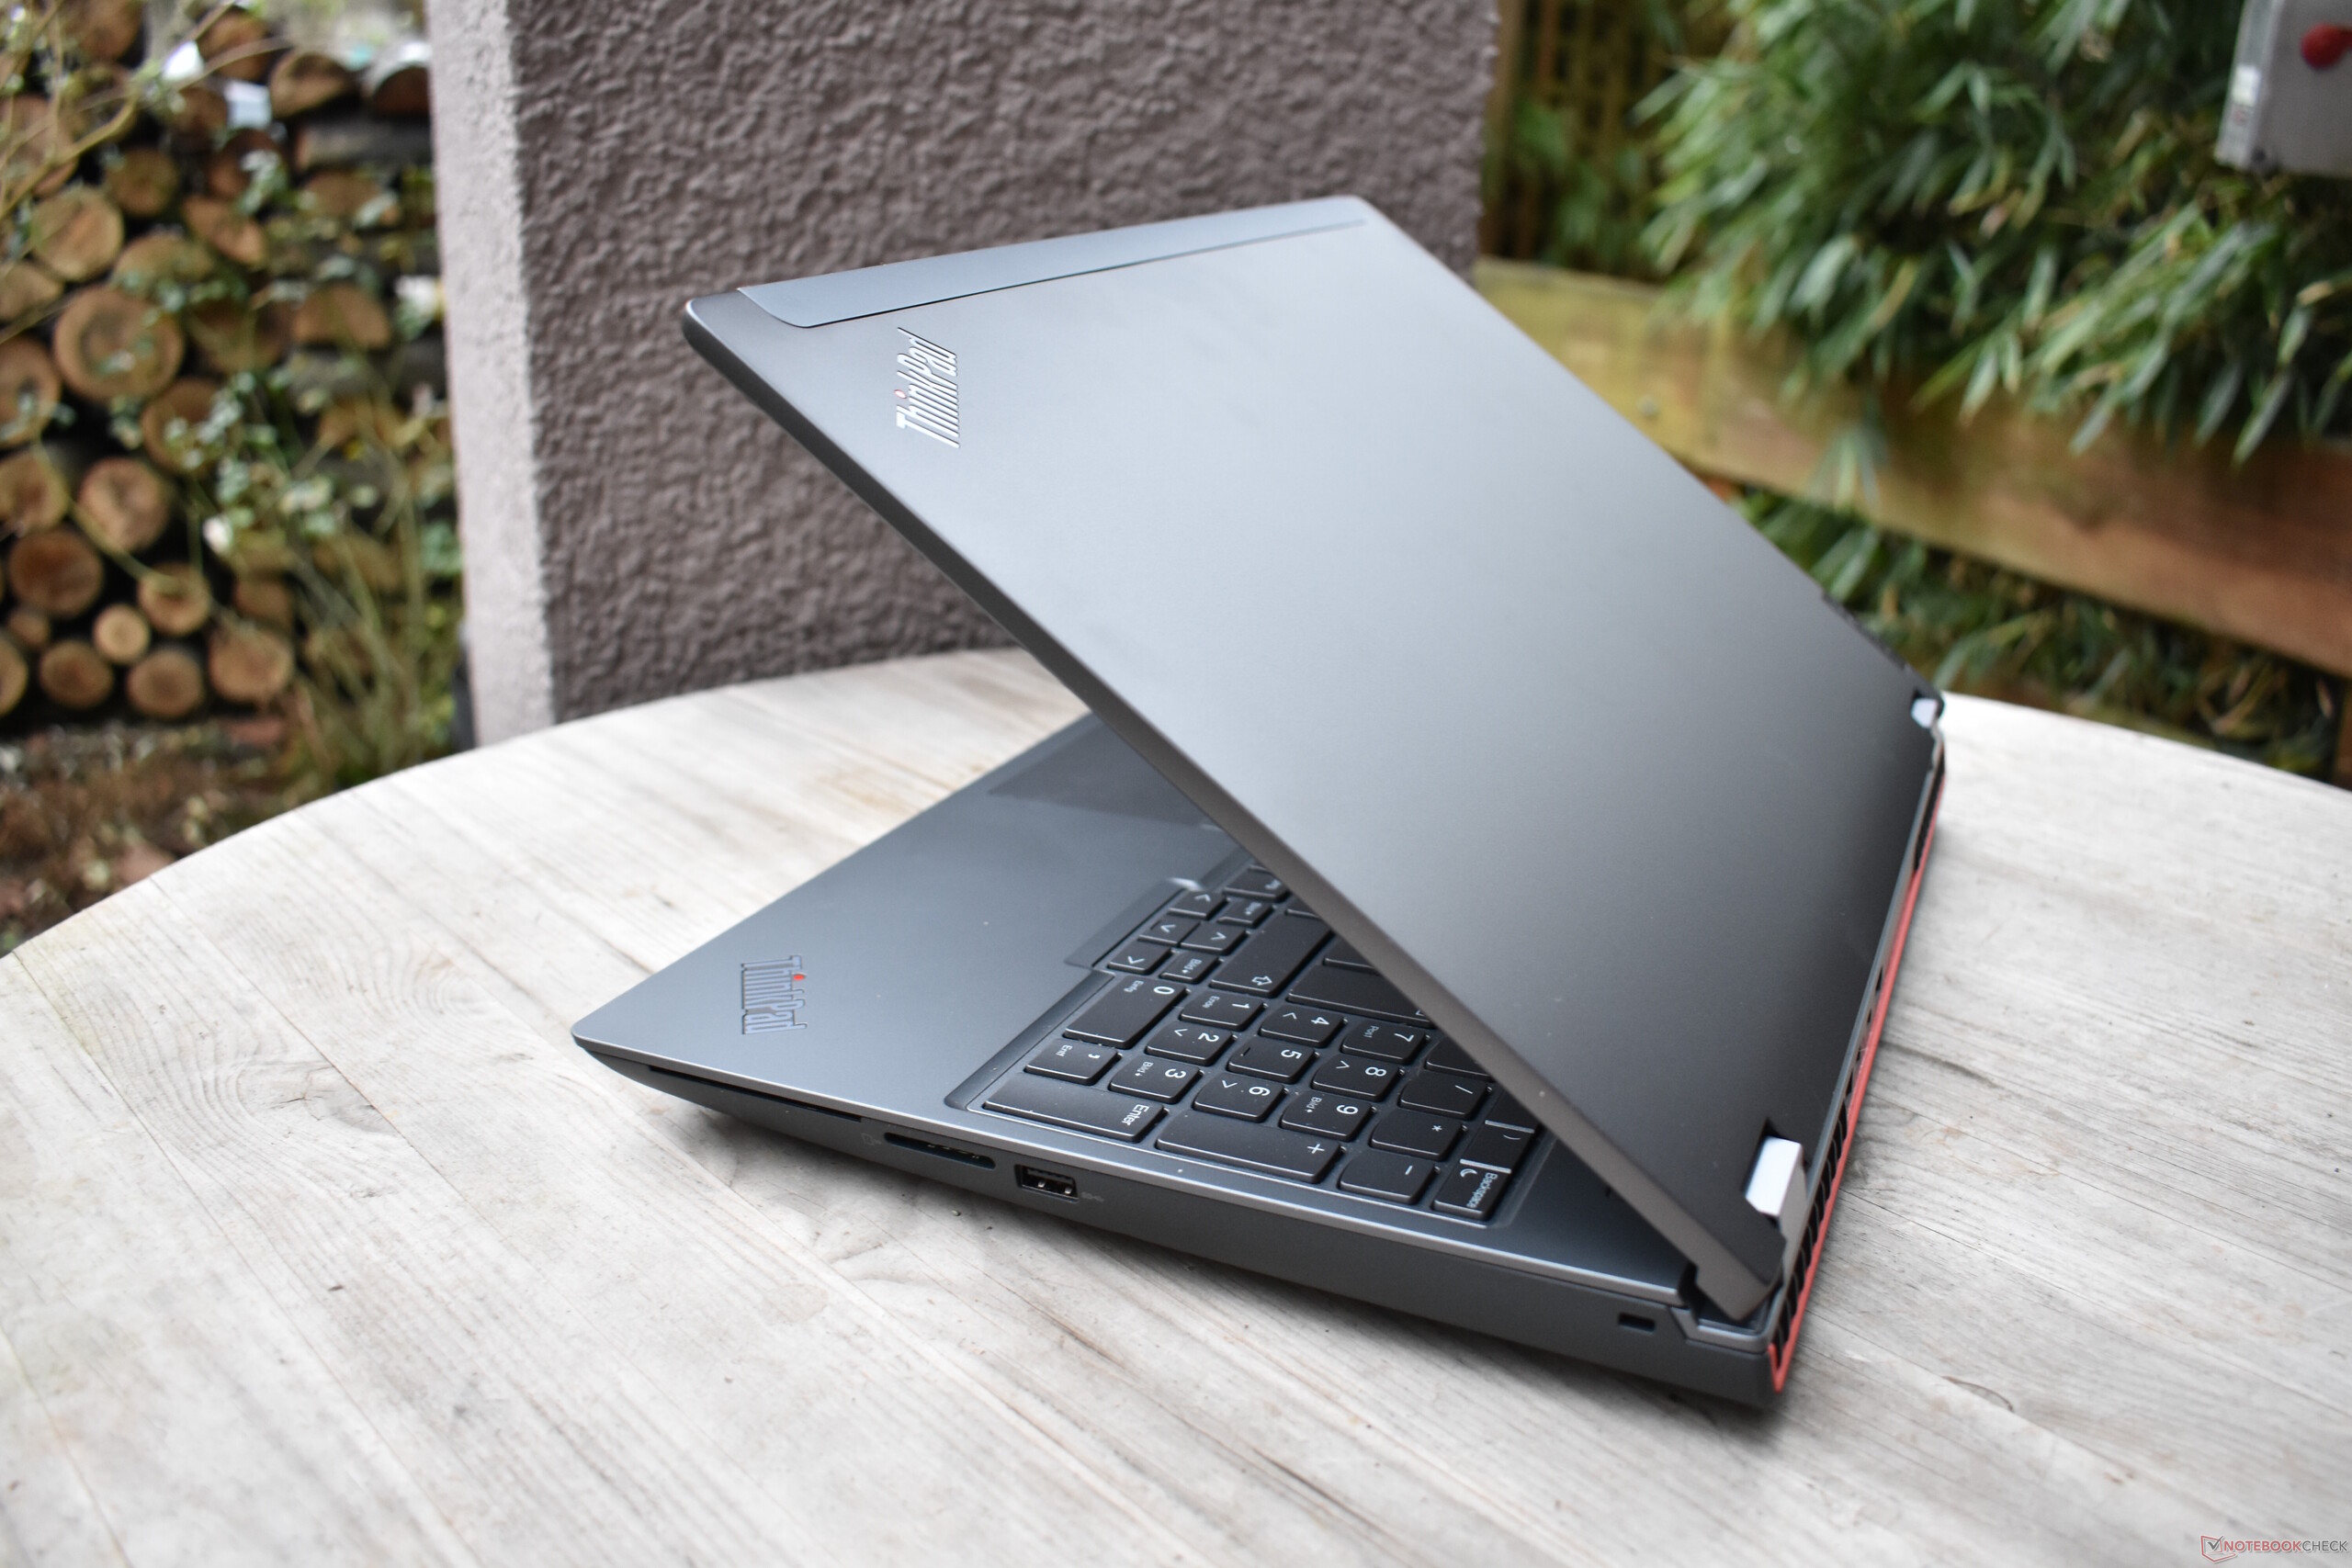
A unidade base é feita de plástico de fibra de vidro que é reforçada com uma moldura de magnésio; assim como as anteriores. As superfícies têm um revestimento aveludado e o plástico cinza é menos propenso a impressões digitais do que o plástico preto encontrado nos modelos anteriores do ThinkPad. A base não pode ser torcida e a única área fraca é o leitor de cartões inteligentes onde o apoio de palma flexiona levemente. A Lenovo optou por usar alumínio para a tampa de LCD e, da mesma forma, recebeu reforço adicional na forma de uma gaiola de rolo de magnésio. A estabilidade da tampa da tela é muito melhor em comparação com a P15 e a P17.
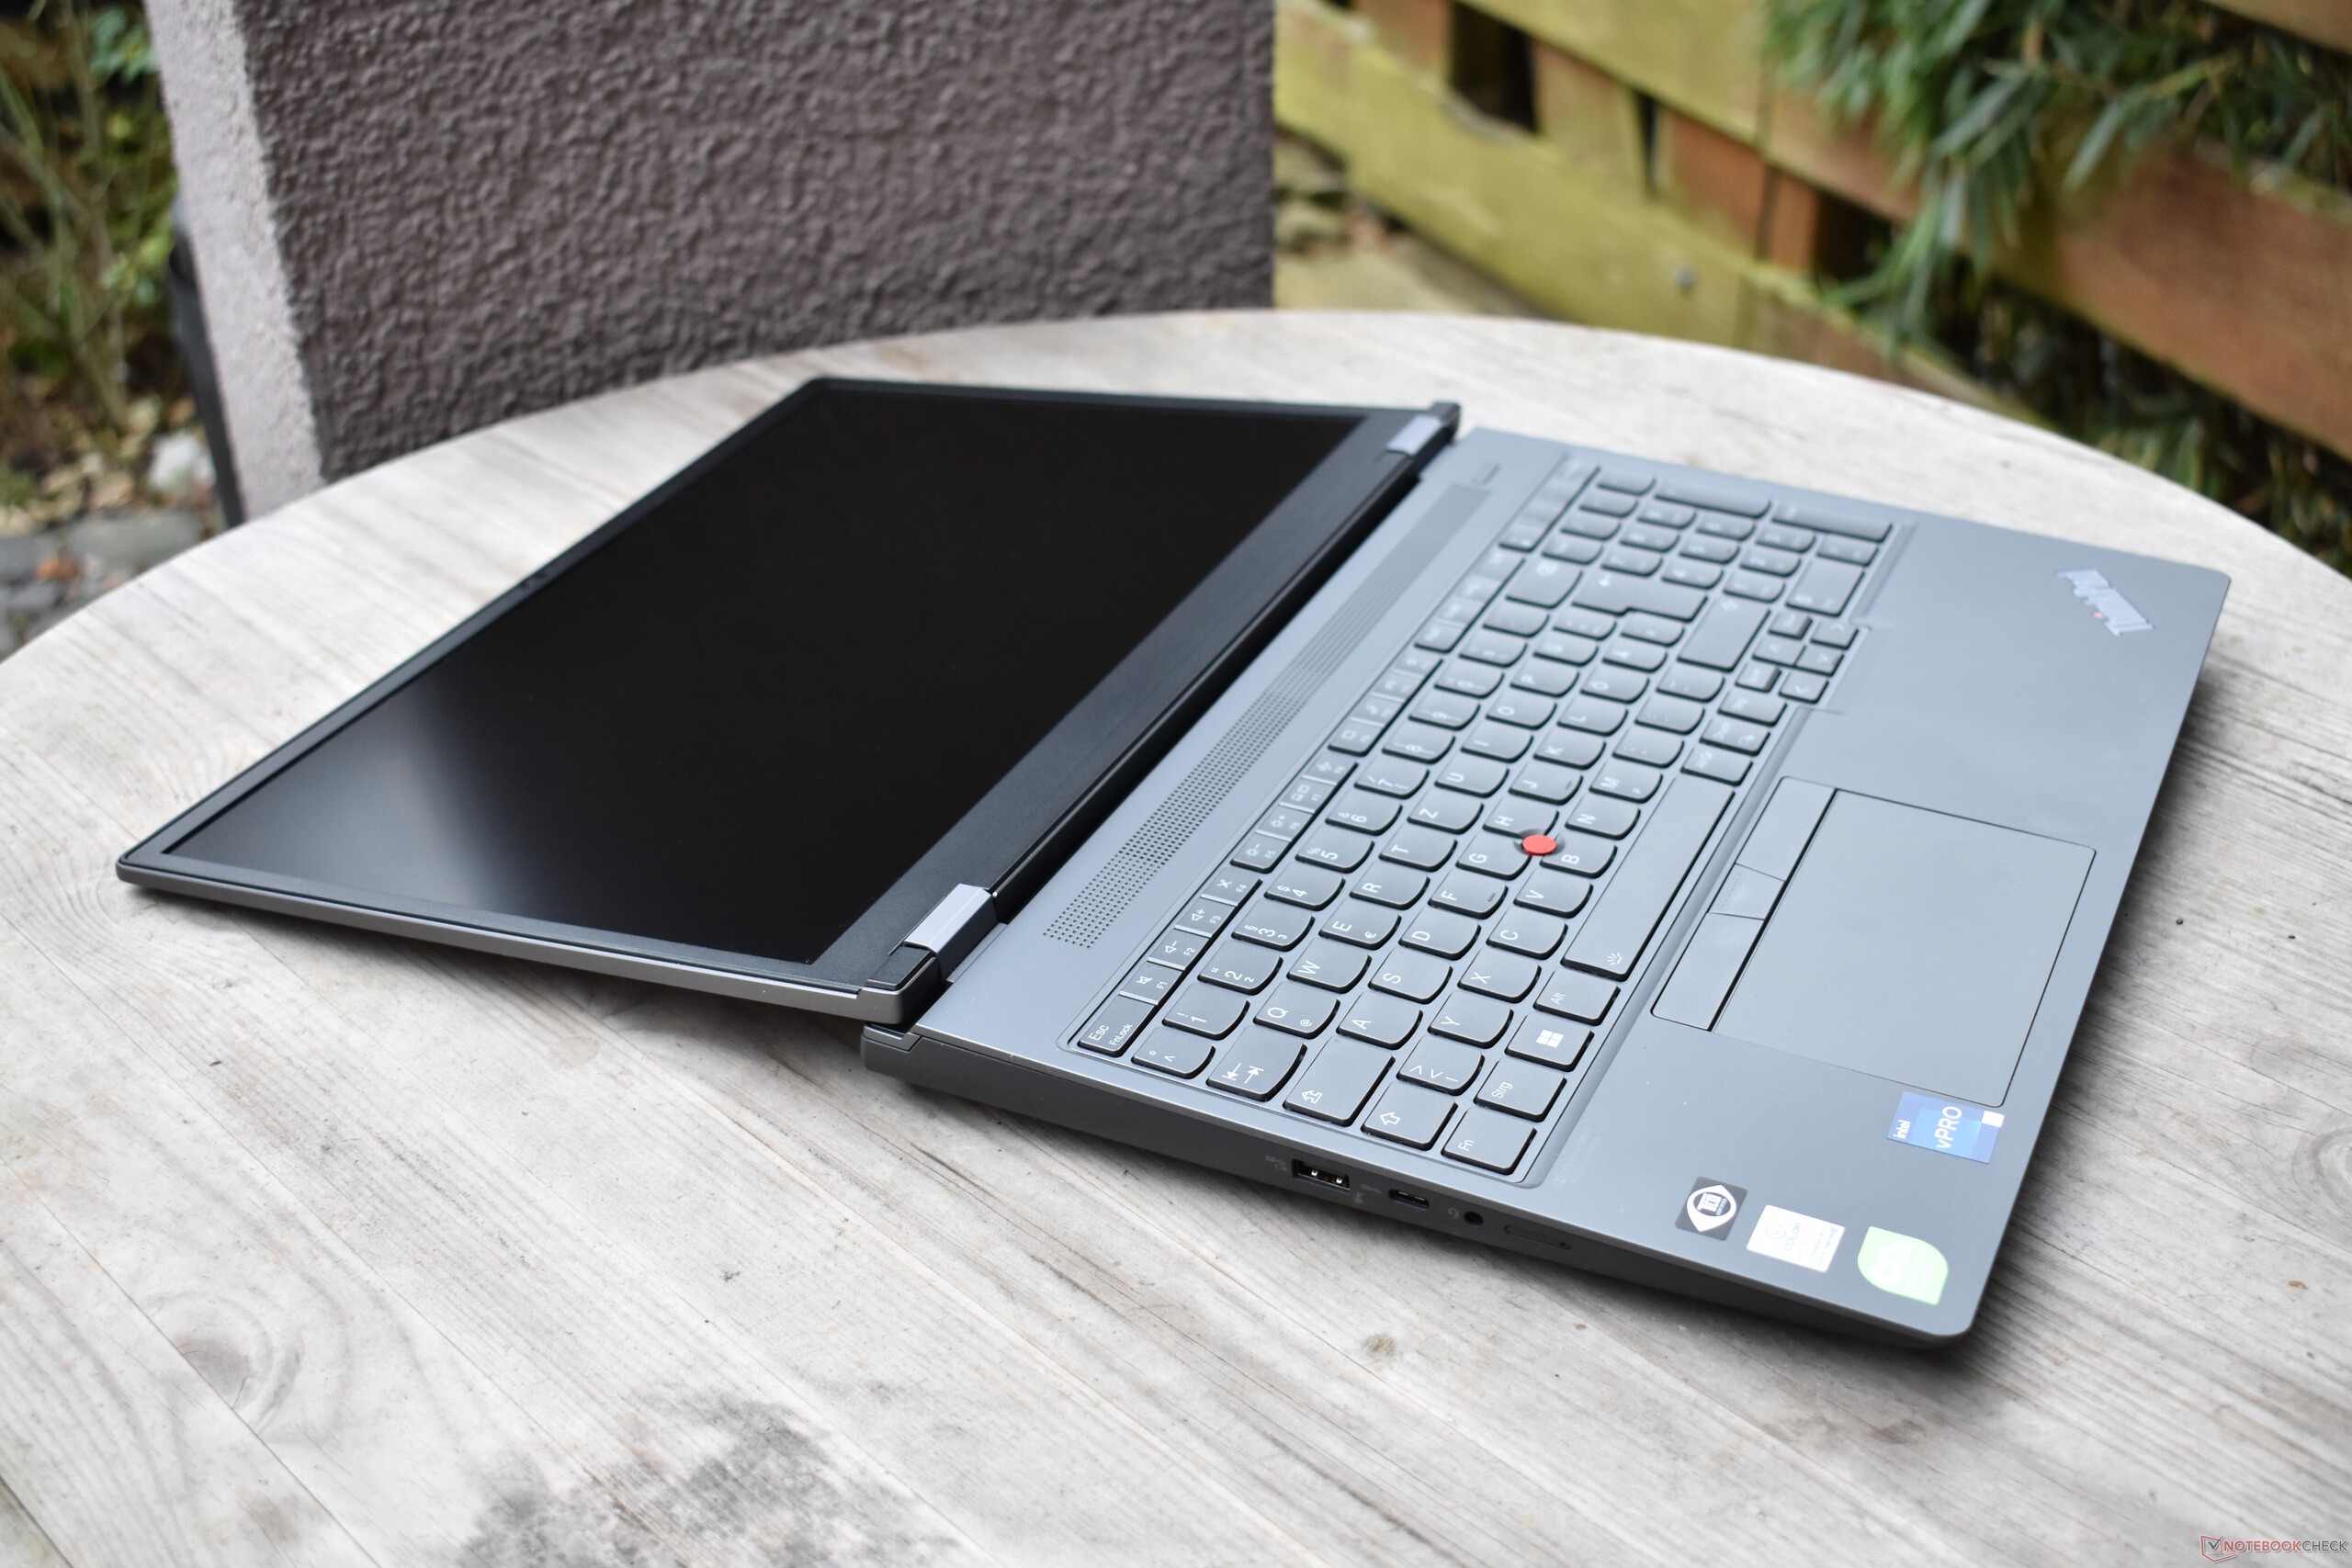
As dobradiças grandes, superiores e inferiores, com suas tampas prateadas, são praticamente idênticas a esses modelos e mantêm o mostrador solidamente no lugar sem qualquer sinal de oscilação. O mostrador pode ser aberto com uma mão com um ângulo de mais de 180 graus.
Mais um ThinkPad P15 G3 do que um P17 G3: Em termos de tamanho e peso, o Lenovo ThinkPad P16 G1 está muito mais próximo de seu predecessor menor do que do maior.
Uma comparação com o Dell Precision 7670 também é interessante: A estação de trabalho Dell de 16 polegadas é mais móvel em todos os sentidos, pois não só é menor, mas também mais fina e mais leve. Com o Precision 7770, a Dell continua a oferecer uma variante ainda maior e mais potente do LCD de 17 polegadas.
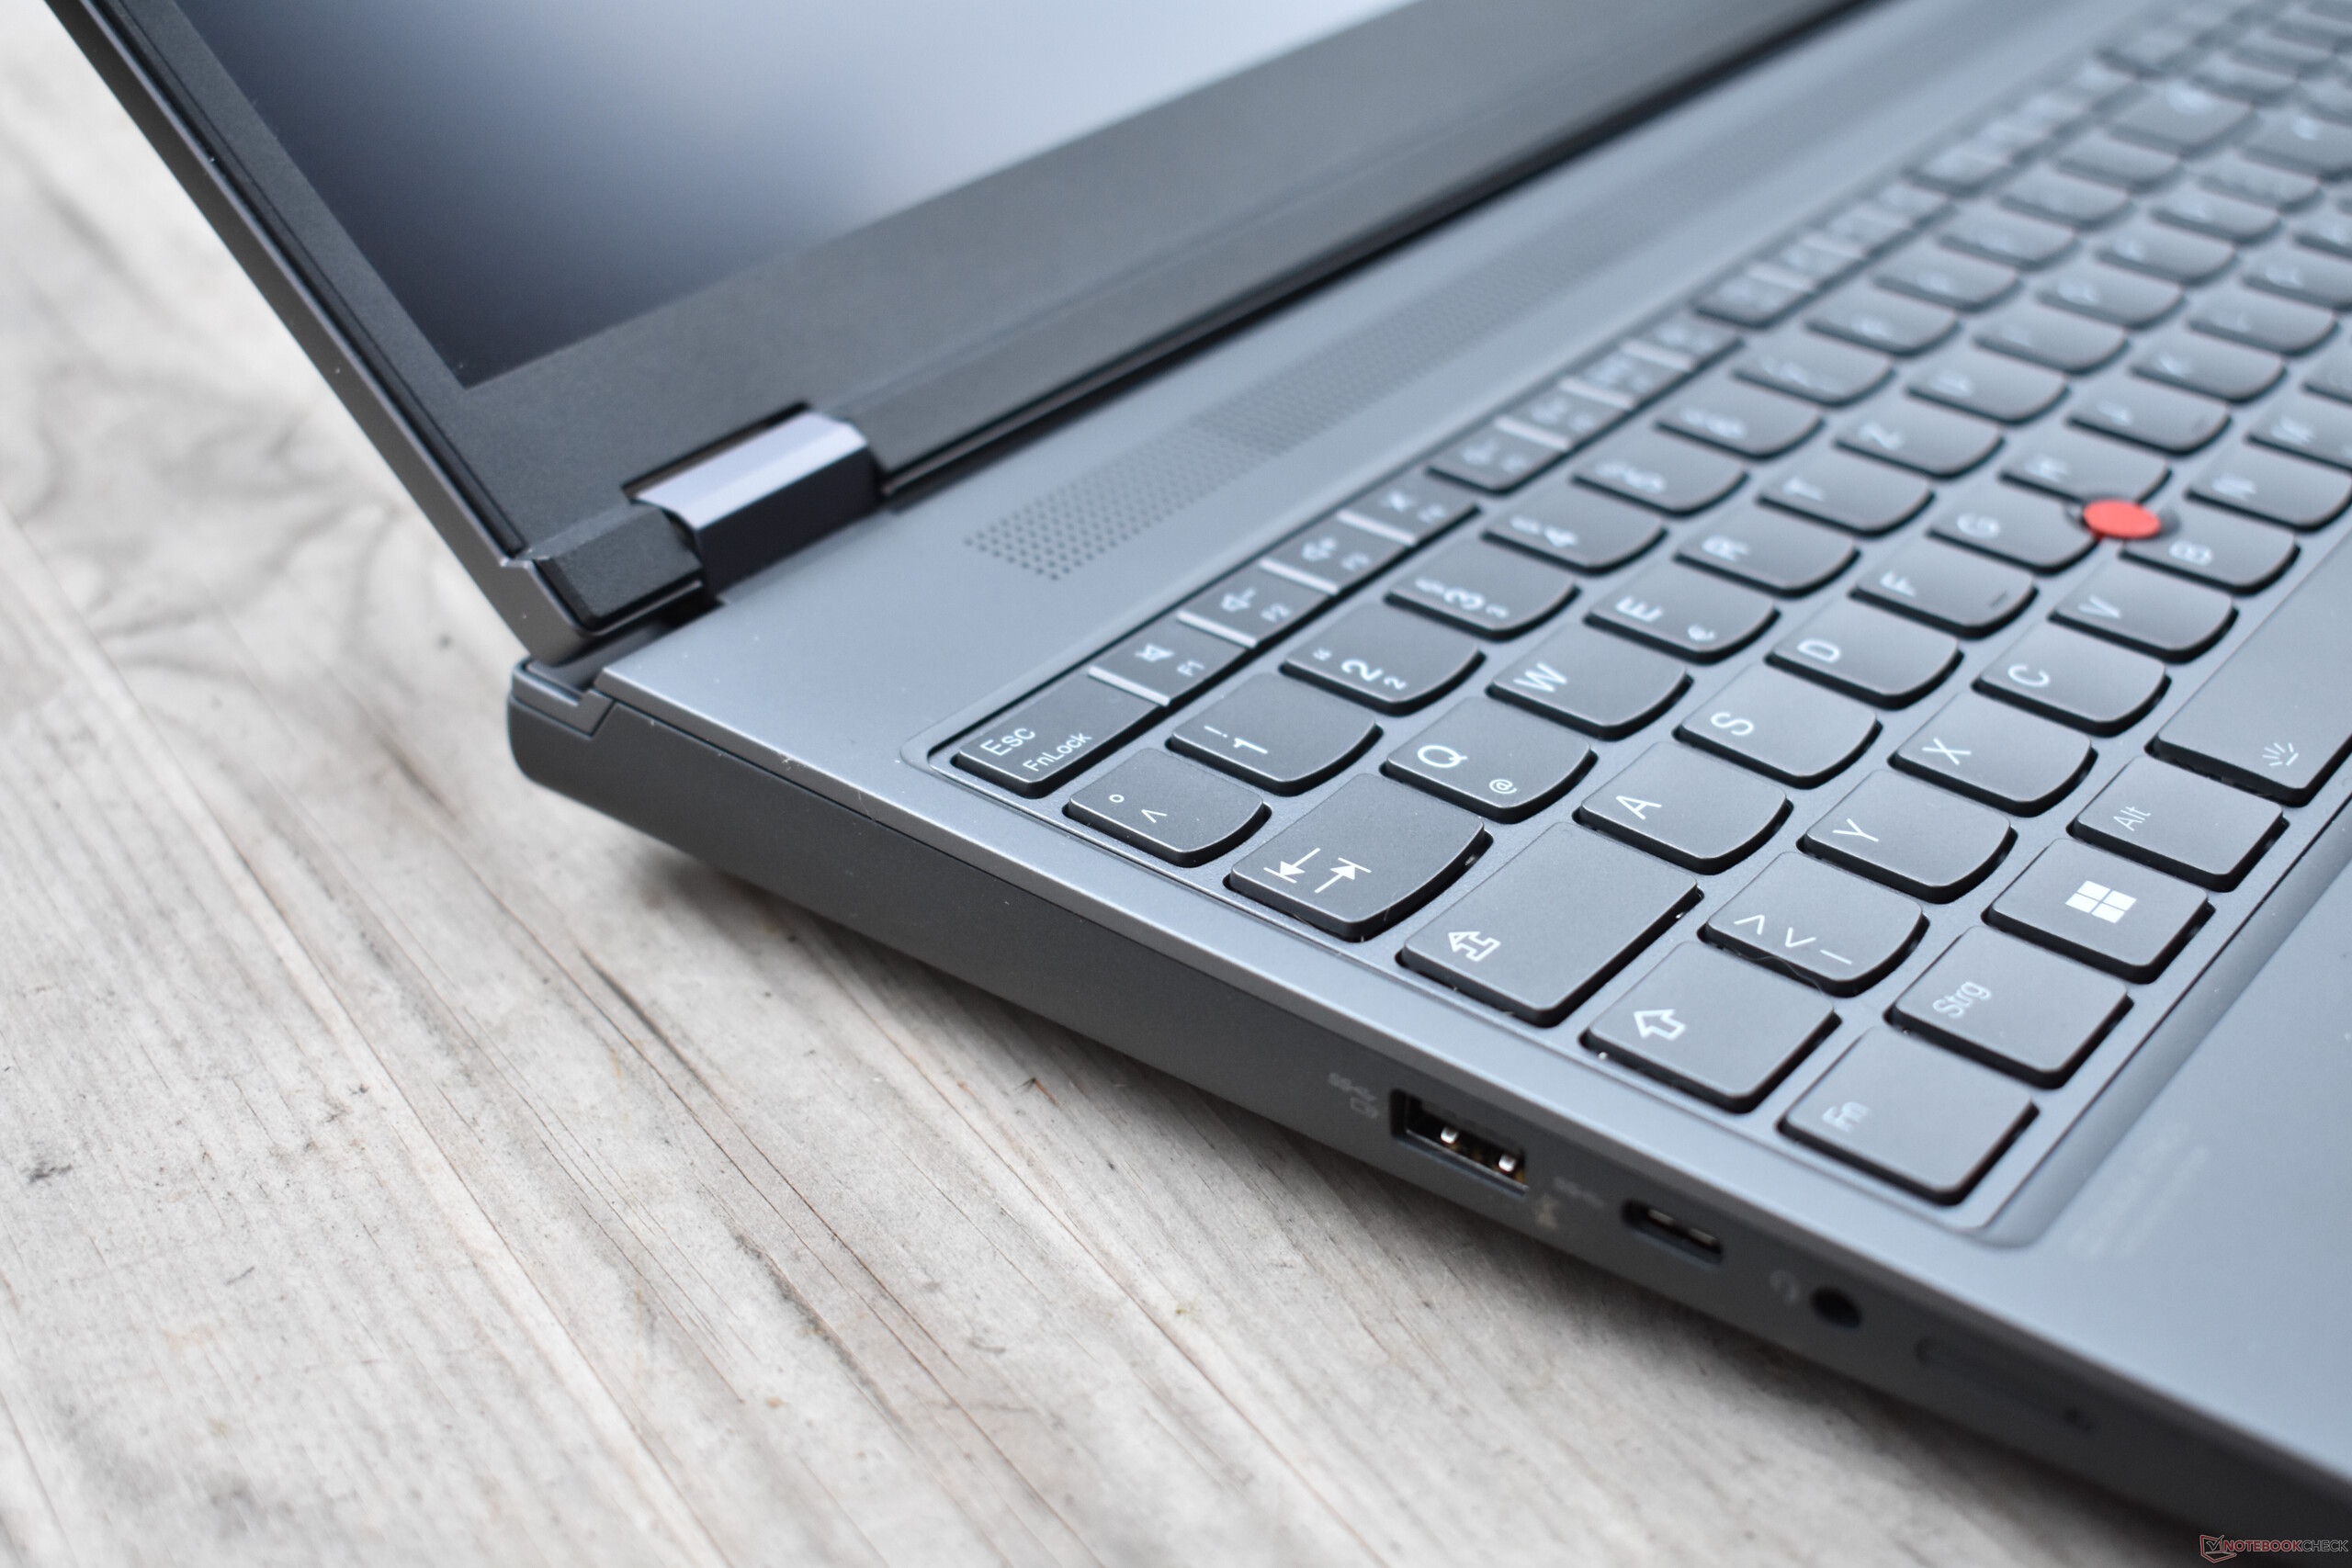
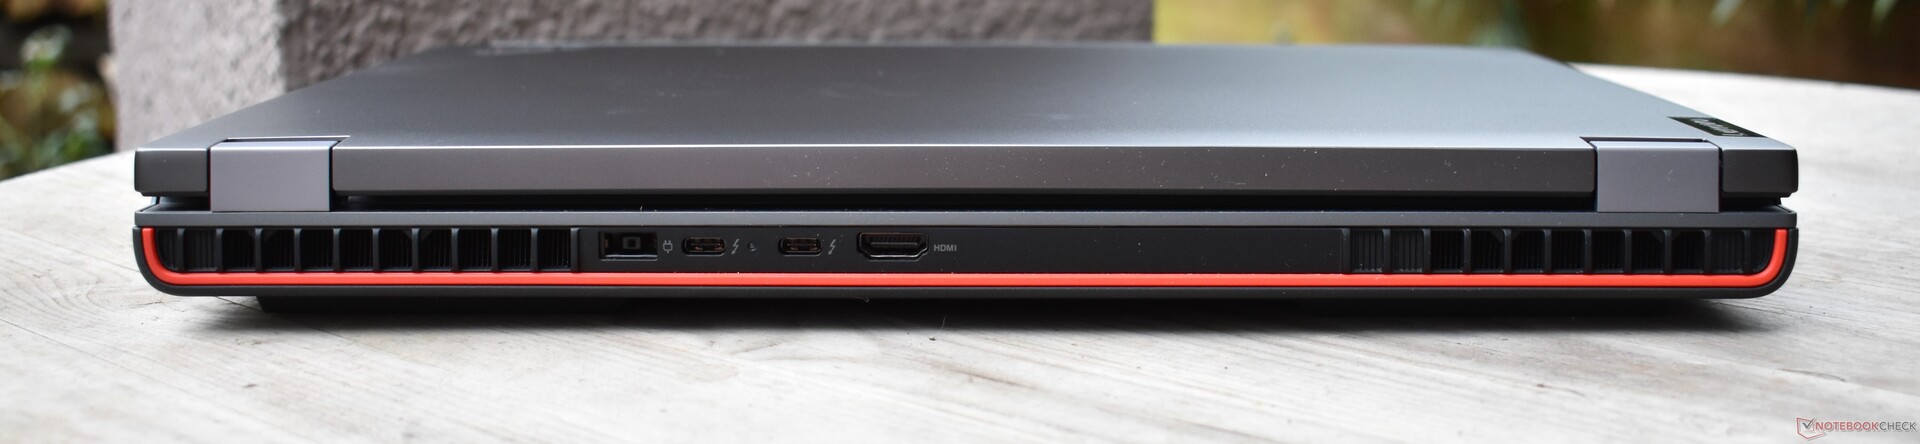
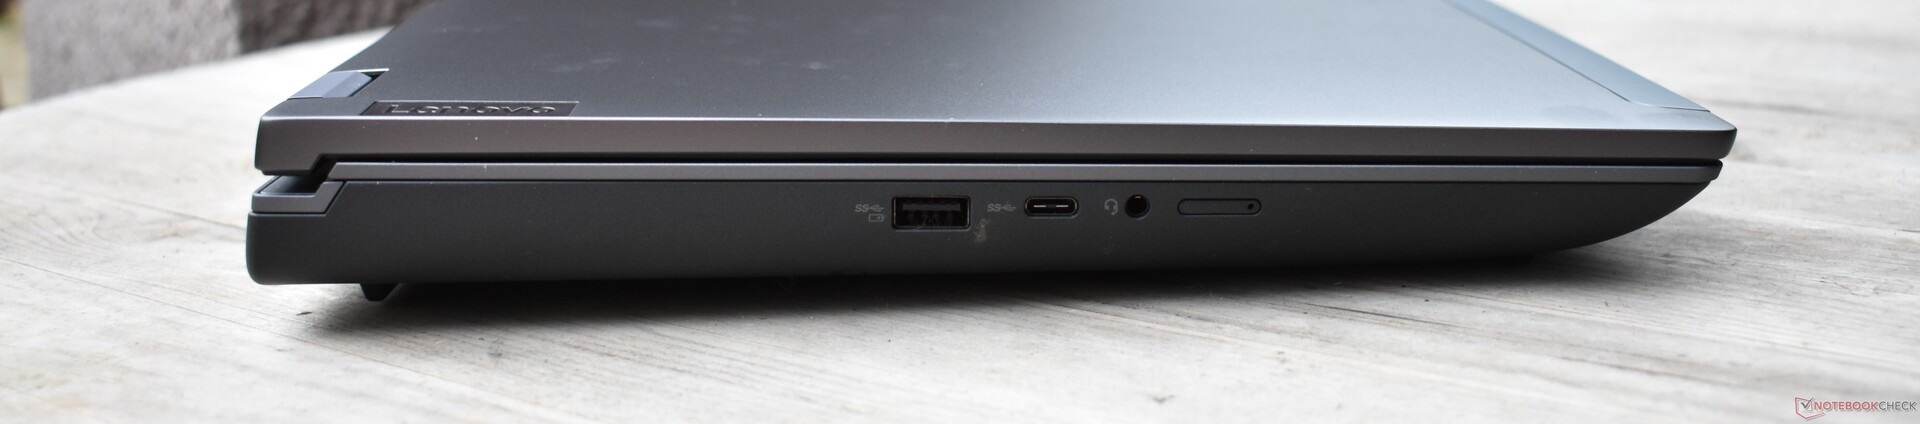
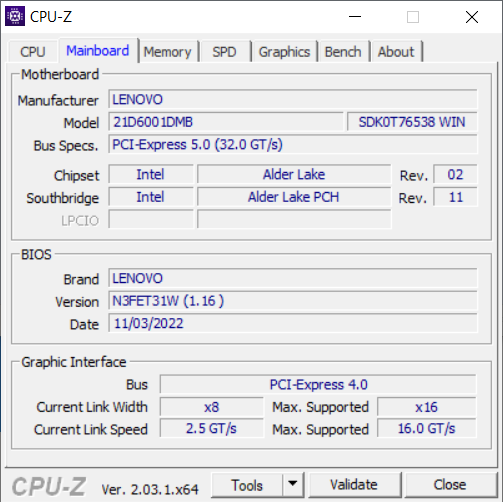
Características: Um ThinkPad P16 sem RJ45
A Lenovo atualizou o projeto sem alterar drasticamente as opções de conectividade. É apenas uma mudança além da localização dos portos: A funcionalidade da ethernet RJ45 foi abandonada. O uso da Internet com fio é servido por uma doca ou uma das portas Thunderbolt.
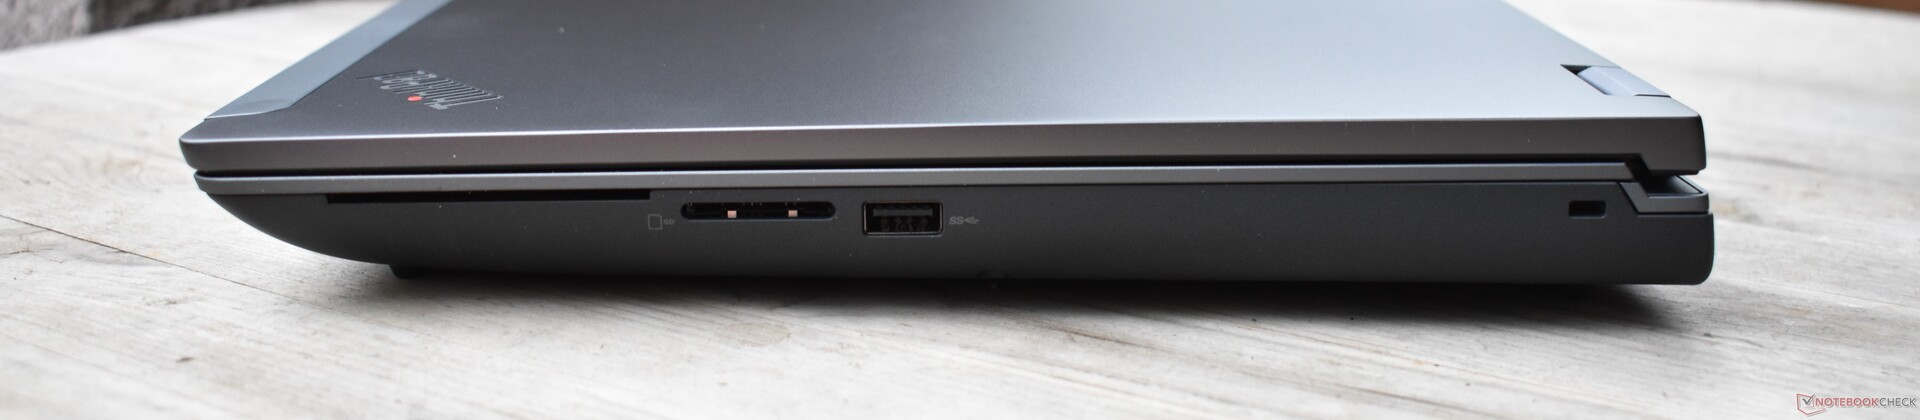
Leitor de cartões SD
Os resultados de referência do leitor de cartões SD - que testamos com nosso cartão de referência AV Pro microSD 128 GB - são surpreendentemente ruins. Os resultados estão bem abaixo da média para um dispositivo de classe de estação de trabalho, bem como para seu próprio predecessor.
| SD Card Reader | |
| average JPG Copy Test (av. of 3 runs) | |
| Lenovo ThinkPad P15 G2-20YQ001JGE (AV Pro V60) | |
| Dell Precision 7670 (Toshiba Exceria Pro SDXC 64 GB UHS-II) | |
| Lenovo ThinkPad P17 G2-20YU0025G (Toshiba Exceria Pro SDXC 64 GB UHS-II) | |
| Média da turma Workstation (49.6 - 681, n=14, últimos 2 anos) | |
| HP ZBook Fury 17 G8-4A6A9EA (Angelbird AV Pro V60) | |
| Lenovo ThinkPad P16 G1 21D6001DMB (AV Pro V60) | |
| maximum AS SSD Seq Read Test (1GB) | |
| Média da turma Workstation (87.6 - 1455, n=14, últimos 2 anos) | |
| Lenovo ThinkPad P15 G2-20YQ001JGE (AV Pro V60) | |
| Lenovo ThinkPad P17 G2-20YU0025G (Toshiba Exceria Pro SDXC 64 GB UHS-II) | |
| Dell Precision 7670 (Toshiba Exceria Pro SDXC 64 GB UHS-II) | |
| HP ZBook Fury 17 G8-4A6A9EA (Angelbird AV Pro V60) | |
| Lenovo ThinkPad P16 G1 21D6001DMB (AV Pro V60) | |
Comunicação
O desempenho da placa Intel AX211WiFi-6E é melhor do que o AX210 encontrado nos modelos anteriores ThinkPad P15 e P17. Acima de tudo, ela tem um bom desempenho na área de recepção, mas o envio de dados é um pouco mais lento e menos estável.
Nosso modelo de revisão não possuía um módulo WWAN (4G LTE), mas pode ser equipado com um.
| Networking | |
| Lenovo ThinkPad P16 G1 21D6001DMB | |
| iperf3 transmit AXE11000 | |
| iperf3 receive AXE11000 | |
| Lenovo ThinkPad P15 G2-20YQ001JGE | |
| iperf3 transmit AX12 | |
| iperf3 receive AX12 | |
| Lenovo ThinkPad P17 G2-20YU0025G | |
| iperf3 transmit AX12 | |
| iperf3 receive AX12 | |
| HP ZBook Fury 17 G8-4A6A9EA | |
| iperf3 transmit AX12 | |
| iperf3 receive AX12 | |
| Dell Precision 7670 | |
| iperf3 transmit AXE11000 6GHz | |
| iperf3 receive AXE11000 6GHz | |
| Asus ExpertBook B6 Flip B6602FC2 | |
| iperf3 transmit AXE11000 6GHz | |
| iperf3 receive AXE11000 6GHz | |
| iperf3 transmit AXE11000 | |
| iperf3 receive AXE11000 | |
Webcam
No geral, a webcam de 1080p produz imagens desbotadas, desfocadas e barulhentas.


Segurança
Além do leitor de impressão digital incorporado no botão de alimentação, o Lenovo ThinkPad P16 2022 tem uma câmera infravermelha compatível com Windows Hello. A fechadura Kensington pode oferecer proteção e há também um leitor de smartcard opcional. O Lenovo ThinkPad P16 tem um chip TPM dedicado e a webcam possui um obturador mecânico de câmera.
Acessórios
Além da fonte de alimentação de 170 watts, completa com um conector Slim Tip, o laptop vem sem acessórios adicionais. O acessório opcional mais importante deve ser uma doca como a doca ThinkPad Thunderbolt 4 Workstation
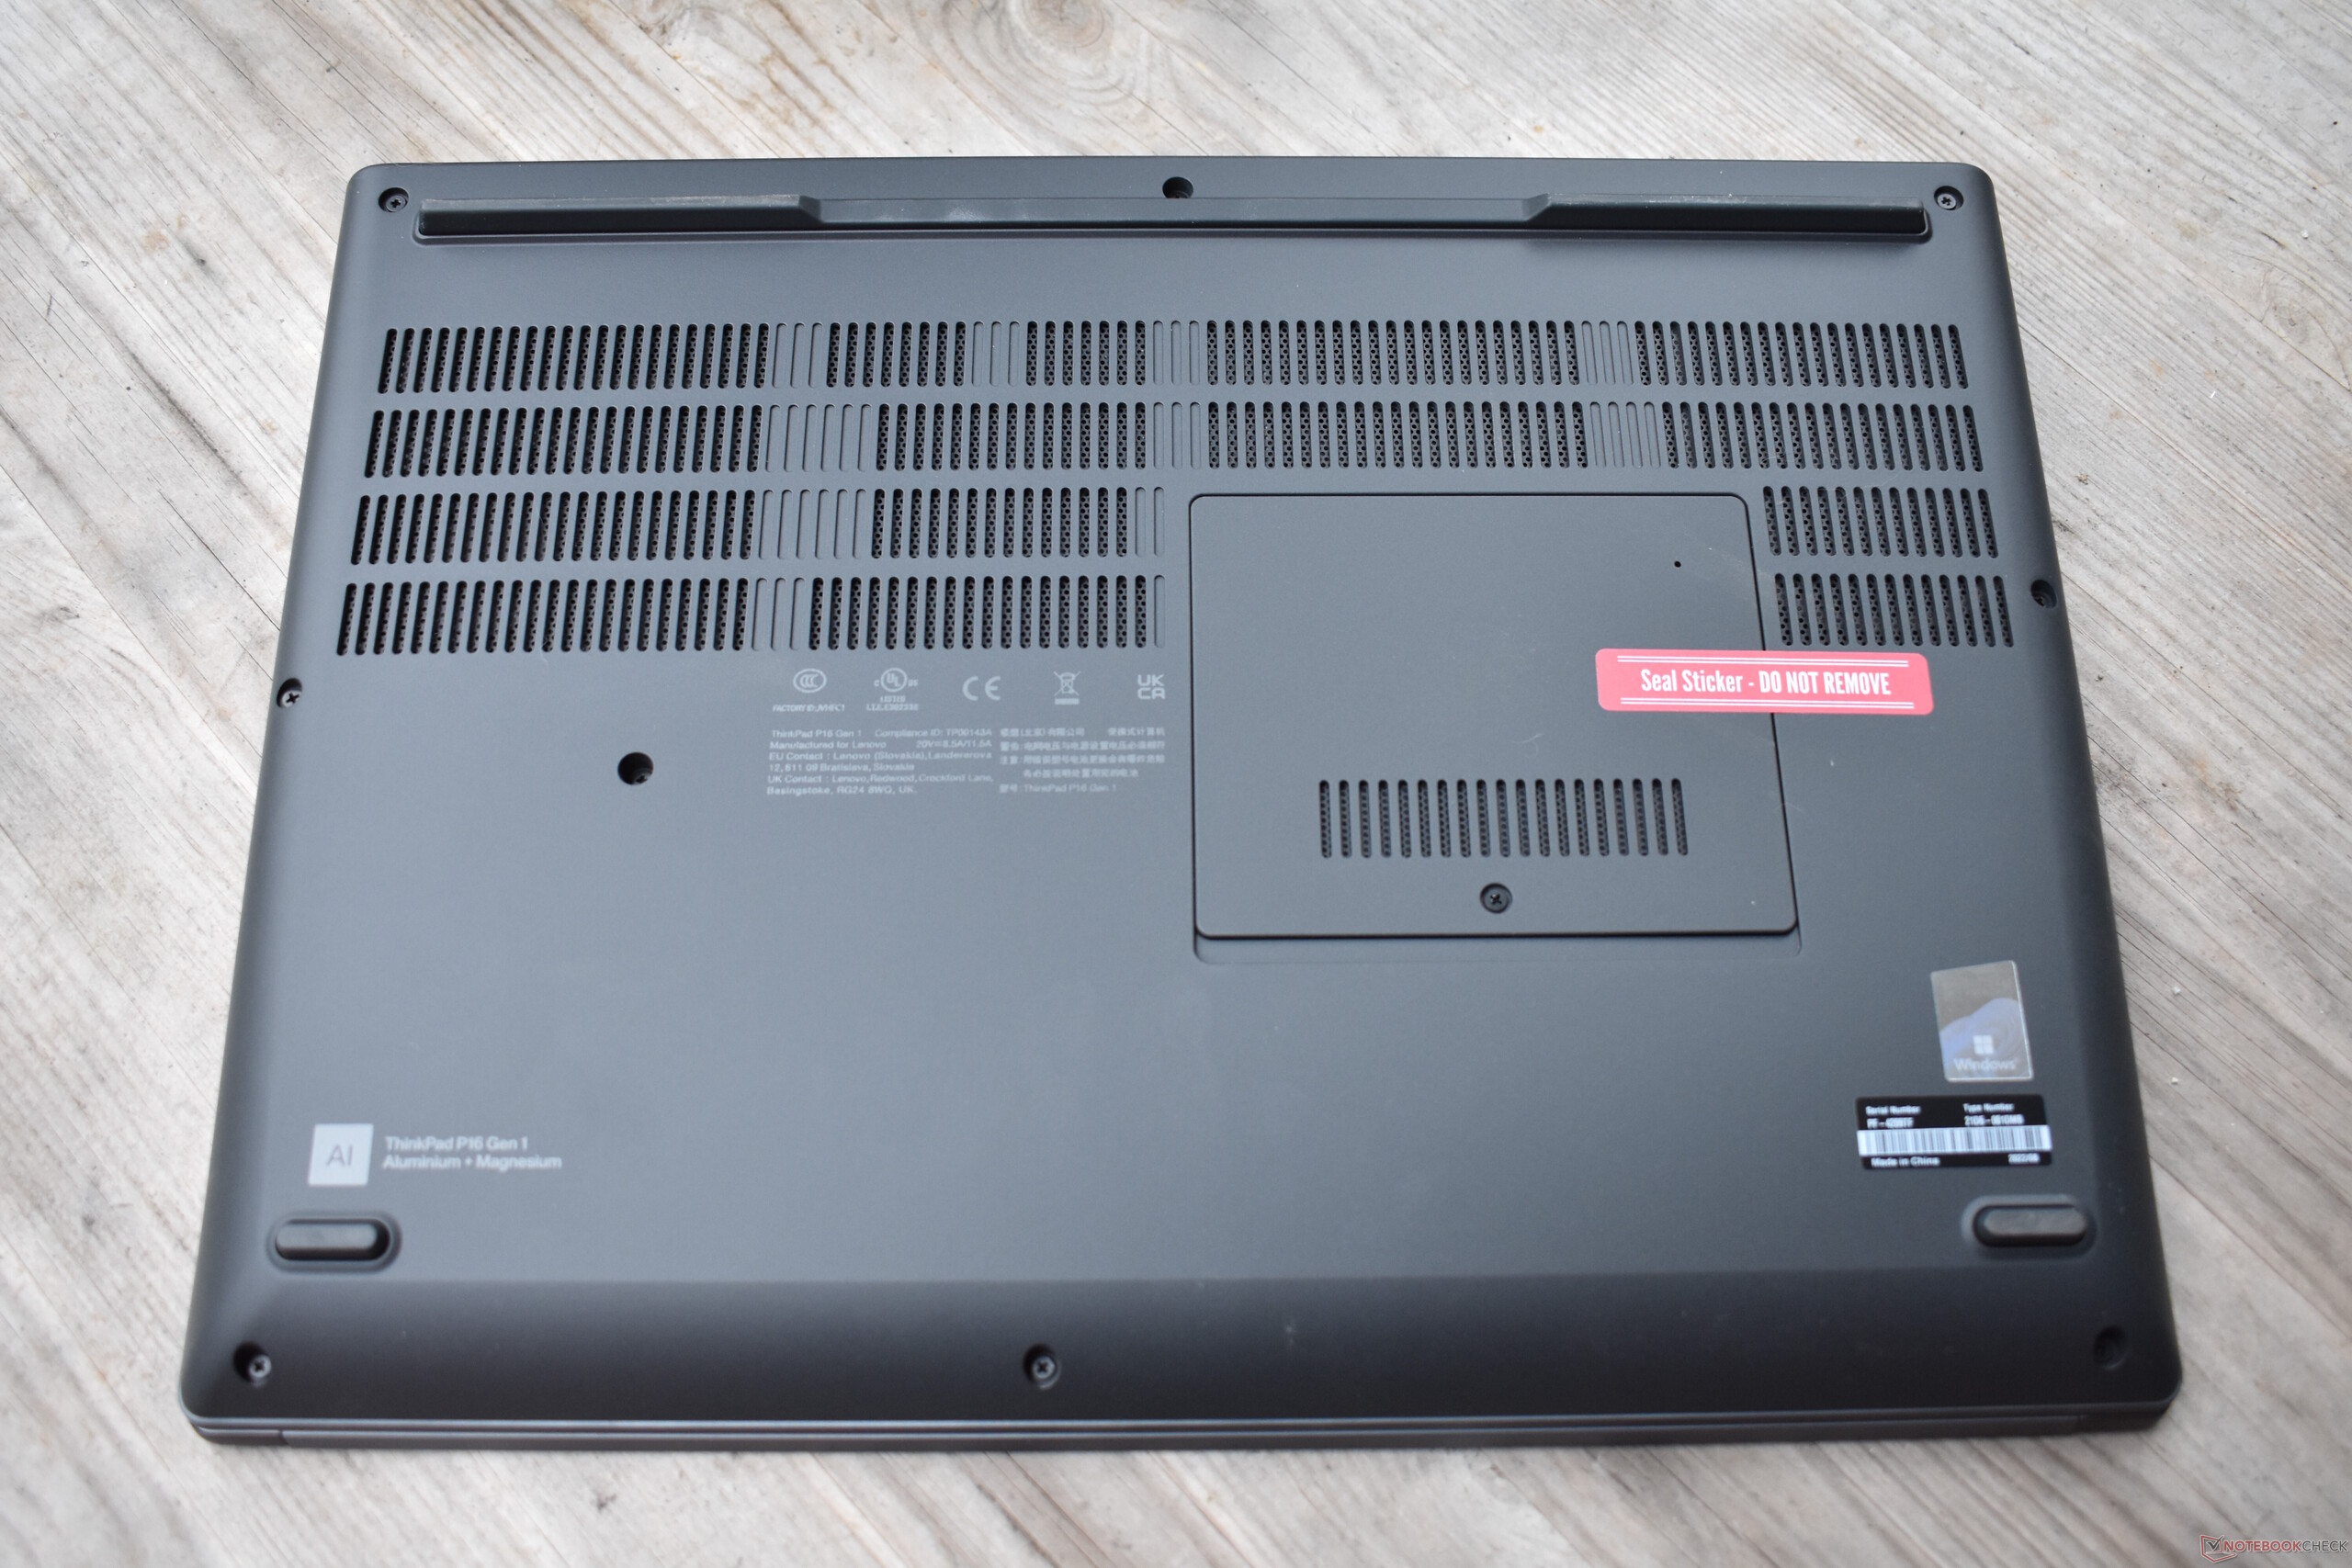
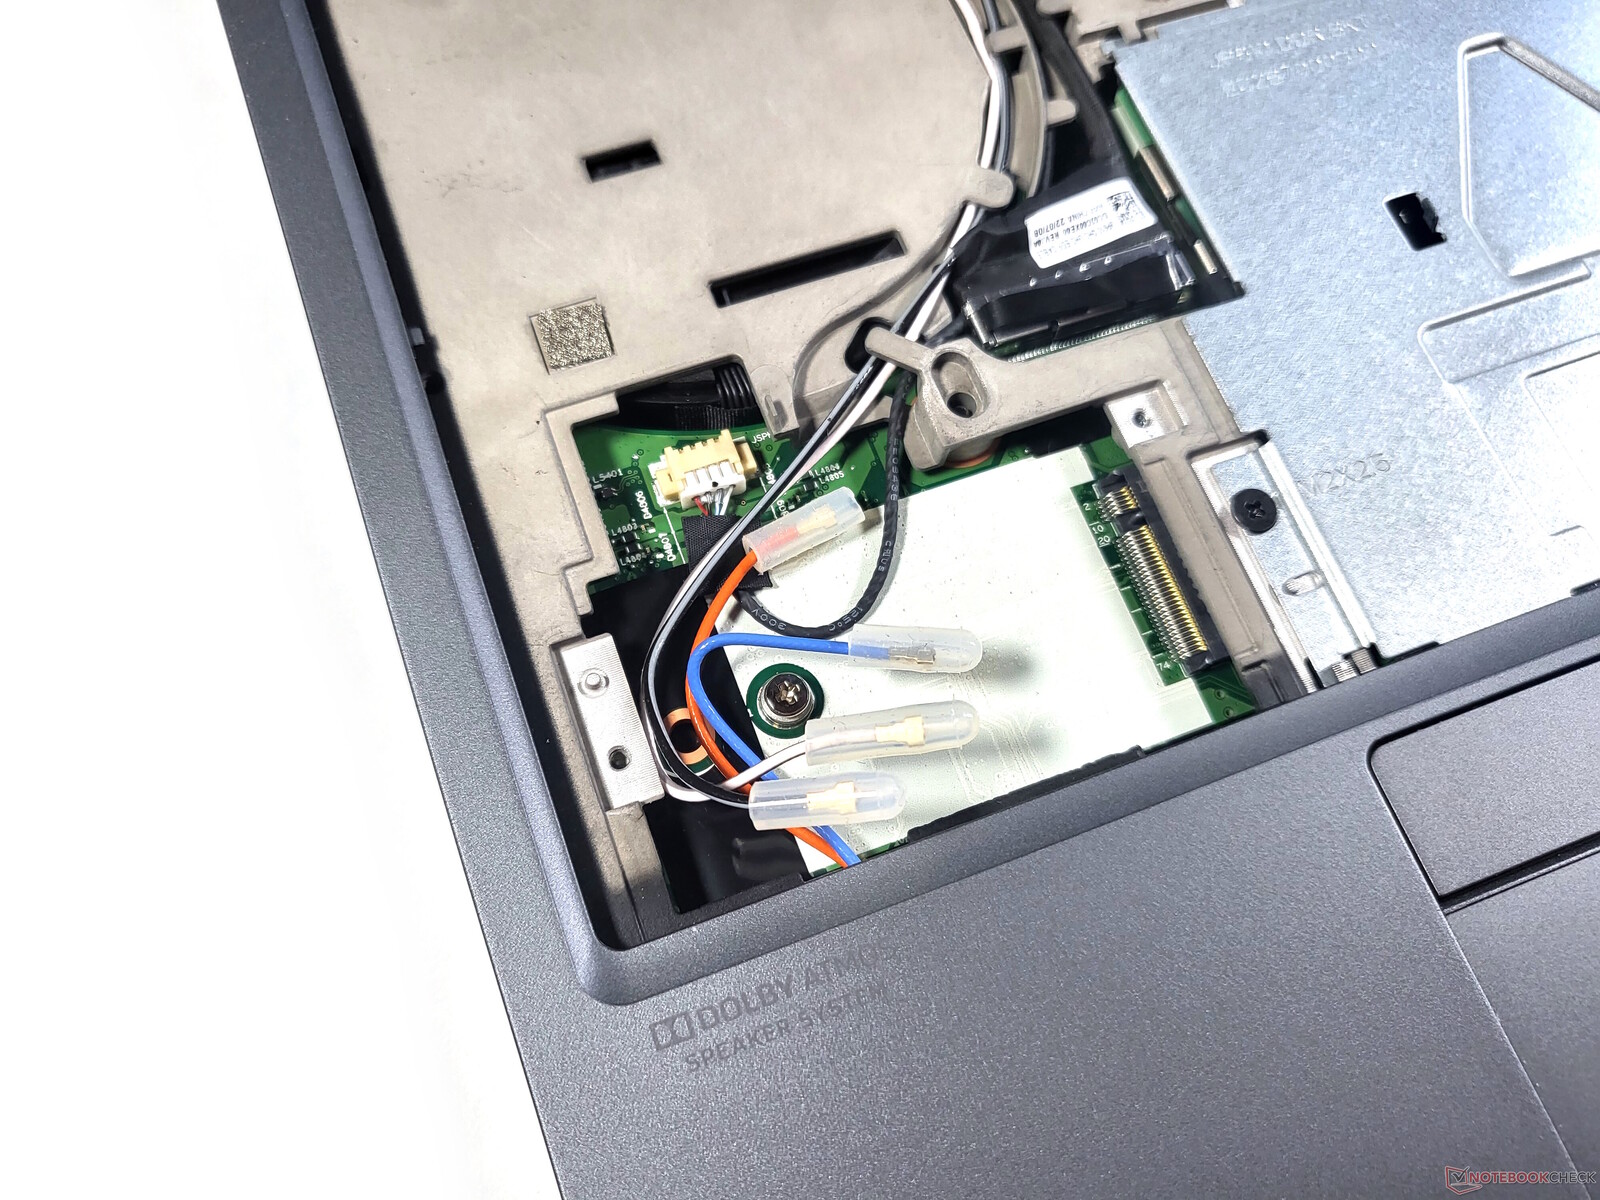
Manutenção
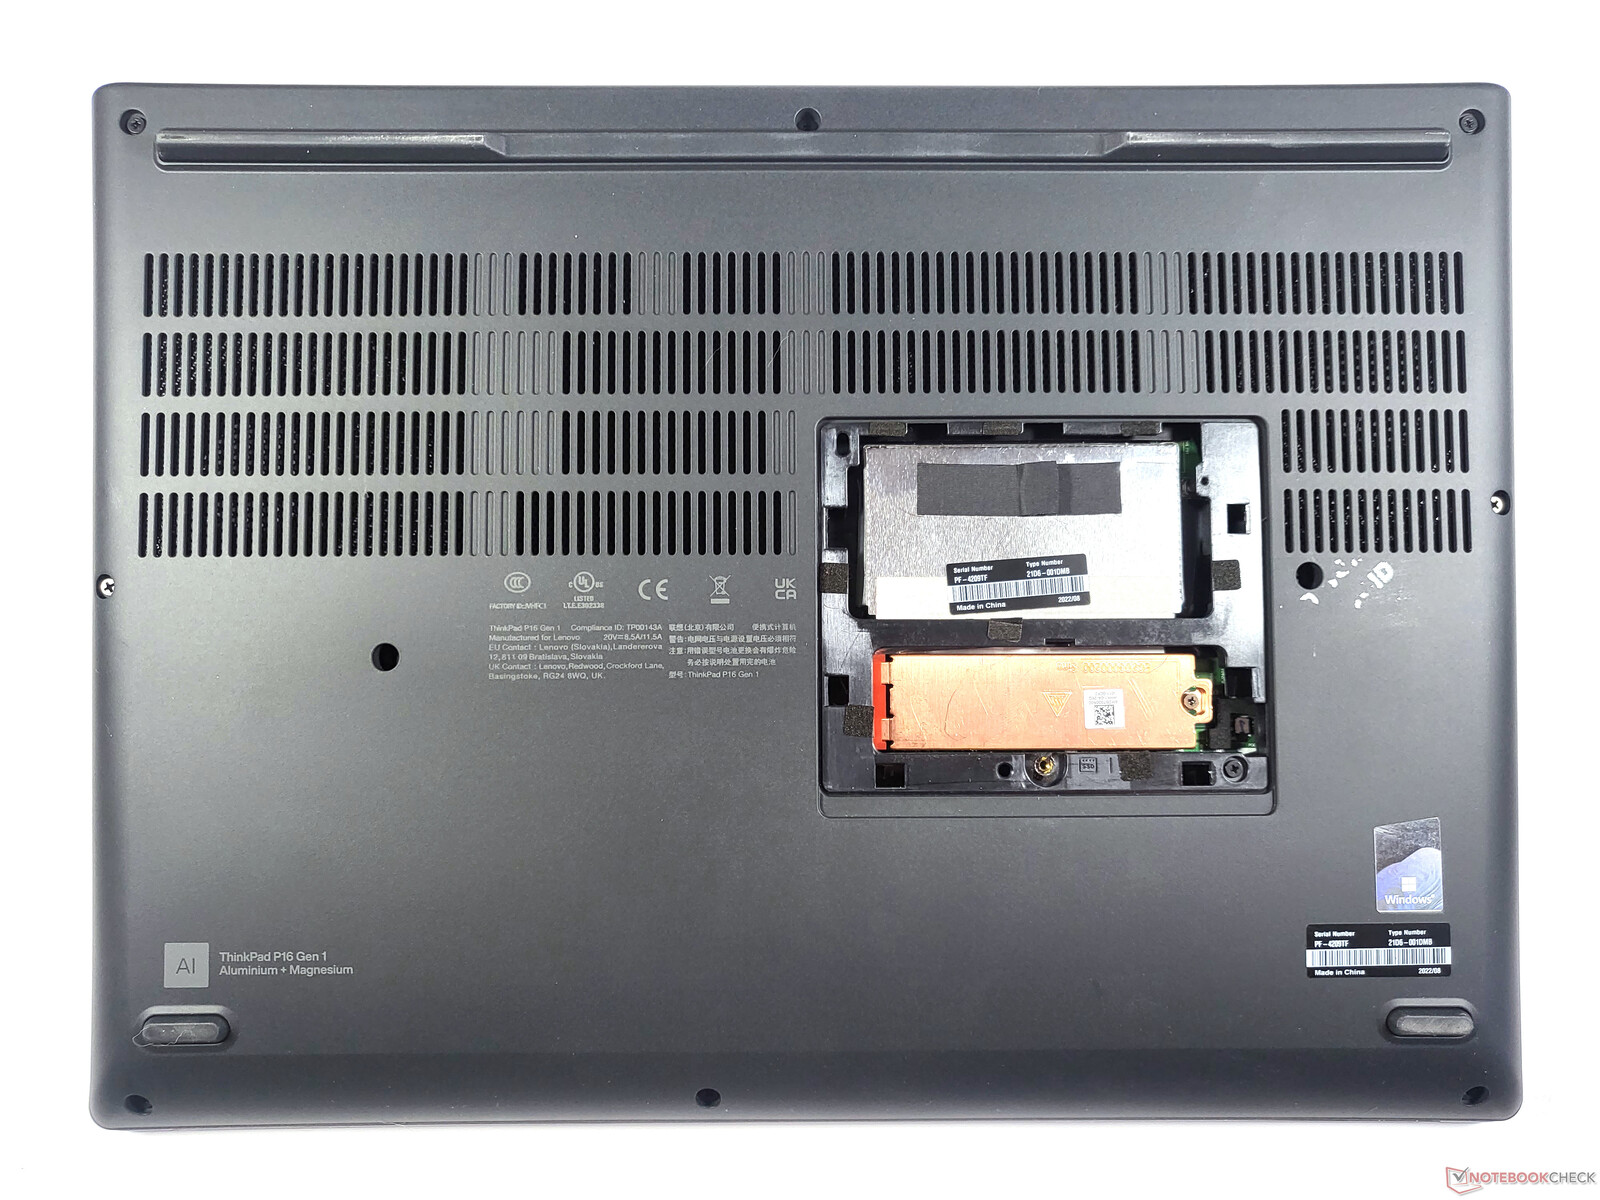
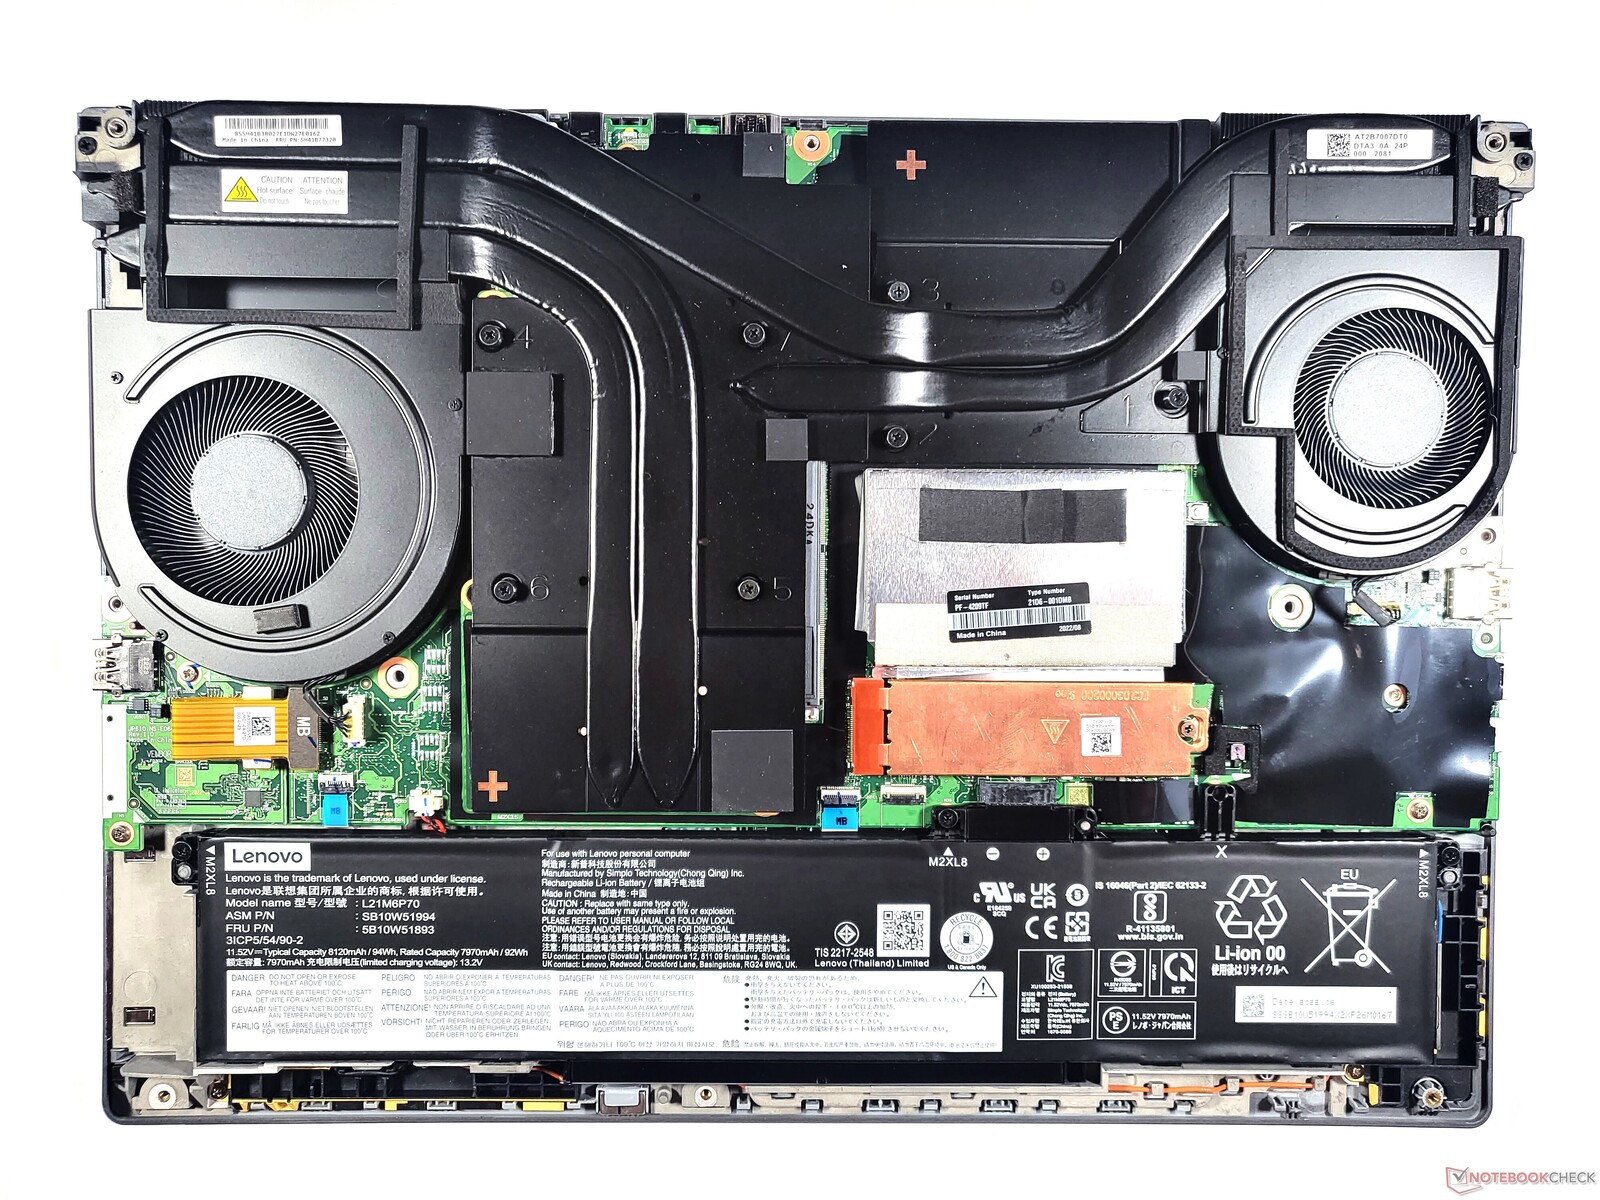
A Lenovo tornou muito fácil alcançar dois dos quatro slots de RAM, pois apenas a pequena tampa na parte inferior do dispositivo tem que ser removida. Aqui você também pode encontrar um slot M.2 2280 gratuito. É ligeiramente mais difícil acessar os outros slots de RAM, o segundo slot M.2, o módulo WiFi soldado, bem como o slot WWAN: o teclado tem que dar lugar a isso. O último obstáculo se apresenta na forma de duas tampas metálicas. No total, outros dez parafusos de cruzetas adicionais fixados com ganchos de plástico estão na parte inferior do laptop. Ao remover esta parte, você obtém uma visão clara do grande sistema de resfriamento com um total de dois ventiladores e a bateria interna.
Todas estas etapas podem ser realizadas sem anular a garantia. Com o Manual de Manutenção de Hardware, a Lenovo forneceu um conjunto adequado de instruções
.
Garantia
Fora da caixa, o laptop comercial Lenovo ThinkPad P16 Gen 1 vem com uma garantia de 3 anos. Por uma sobretaxa, esta também pode ser estendida para cinco anos. Nosso dispositivo de revisão tem o Premier Support com serviço no local. Entretanto, a maioria das configurações do ThinkPad P16 exige uma sobretaxa adicional para usufruir deste recurso. Os clientes só têm direito a estas opções de serviço estendido na Alemanha. Internacionalmente, a garantia Bring In está disponível.
Dispositivos de entrada: O ThinkPad P agora também tem 1,5 mm de curso de chave
Teclado
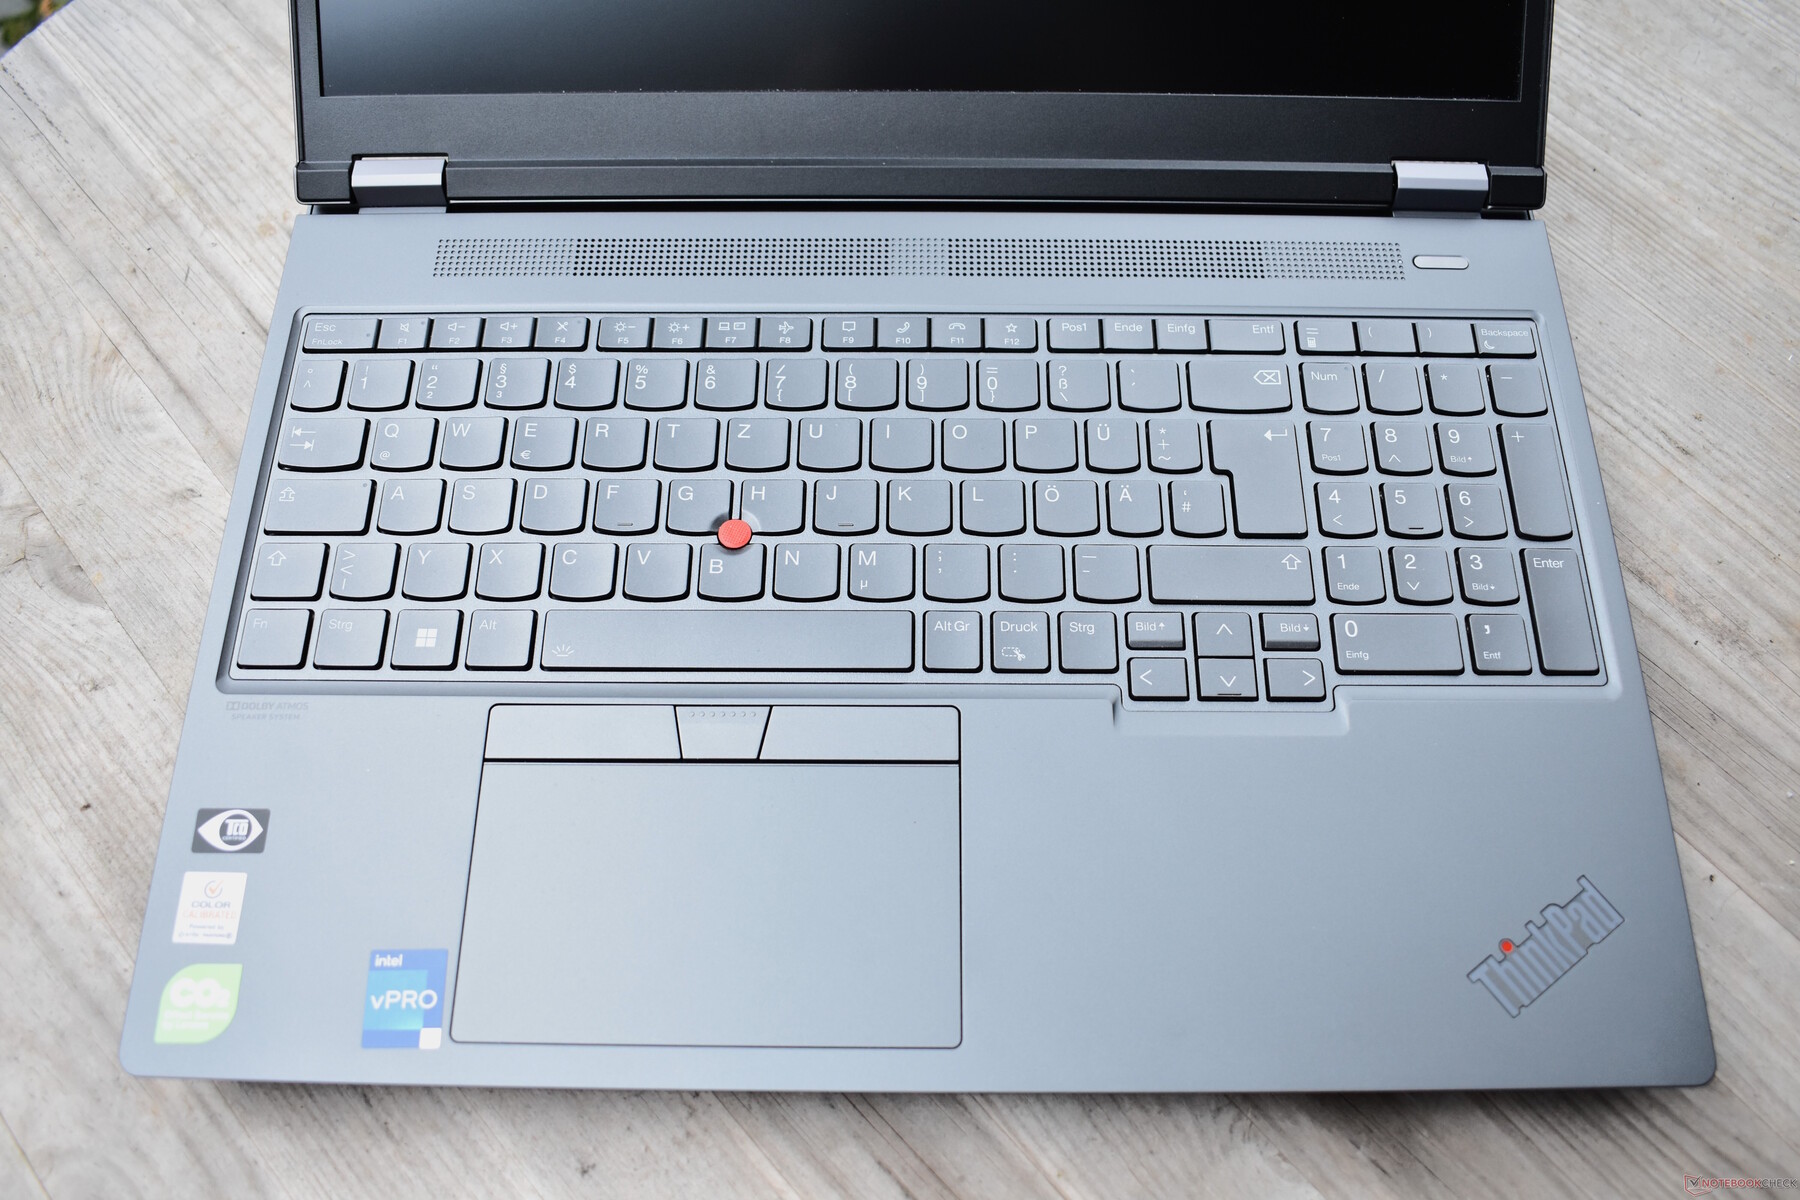
Começando pela cor, a Lenovo reformulou completamente o teclado do ThinkPad P16. O teclado está agora todo cinzento, o que, em nossa opinião, não parece ser tão premium. Embora este seja um ponto de crítica relativamente insignificante, a decisão de reduzir o curso das teclas iluminadas de 1,8 para agora apenas 1,5 mm, bem como a altura reduzida das teclas, pesa muito: Como resultado, o teclado ThinkPad perde um pouco do toque especial que tinha antes. No entanto, ainda estamos lidando com um teclado muito bom que oferece uma experiência de digitação maravilhosamente agradável - embora agora não haja muito que separe o dispositivo Lenovo de seus concorrentes HP e Dell. É um mistério porque a própria Lenovo optaria por encurtar o percurso da chave em uma estação de trabalho tão grande e grossa.
A Lenovo não fez nenhuma mudança no layout com tudo como era antes. Uma mudança é de natureza ótica, pois as chaves externas agora são quadradas em vez de arredondadas. Como estas não são as teclas das letras, isso não causou um impacto negativo na experiência de digitação. Semelhante às chaves arredondadas, as chaves quadradas têm uma forma um tanto côncava.
Touchpad & TrackPoint
O touchpad da Lenovo ThinkPad P16 G1 parece mais largo que os modelos anteriores e, em termos de largura, agora cresceu 11,5 cm. A superfície é feita de plástico que parece ainda mais suave do que seu predecessor. Em termos de manuseio, o touchpad é muito bom e traduz perfeitamente os gestos multitoque. No entanto, o feedback tátil fica aquém dos trackpads feitos de vidro. Como estamos lidando com um trackpad mecânico, só é possível aplicar cliques na parte inferior do trackpad. O mecanismo de cliques é bastante monótono, mas não chacoalha ou abana.
O TrackPoint continua fornecendo uma boa alternativa ao touchpad se o ponteiro do mouse tiver que ser movido rapidamente durante a digitação. Em comparação com seu predecessor, o bastão apontador vermelho, com tampa de borracha, permaneceu inalterado. Em contraste, a Lenovo redesenhou as teclas TrackPoint dedicadas que agora parecem mais modernas sem perder nada no caminho da usabilidade.
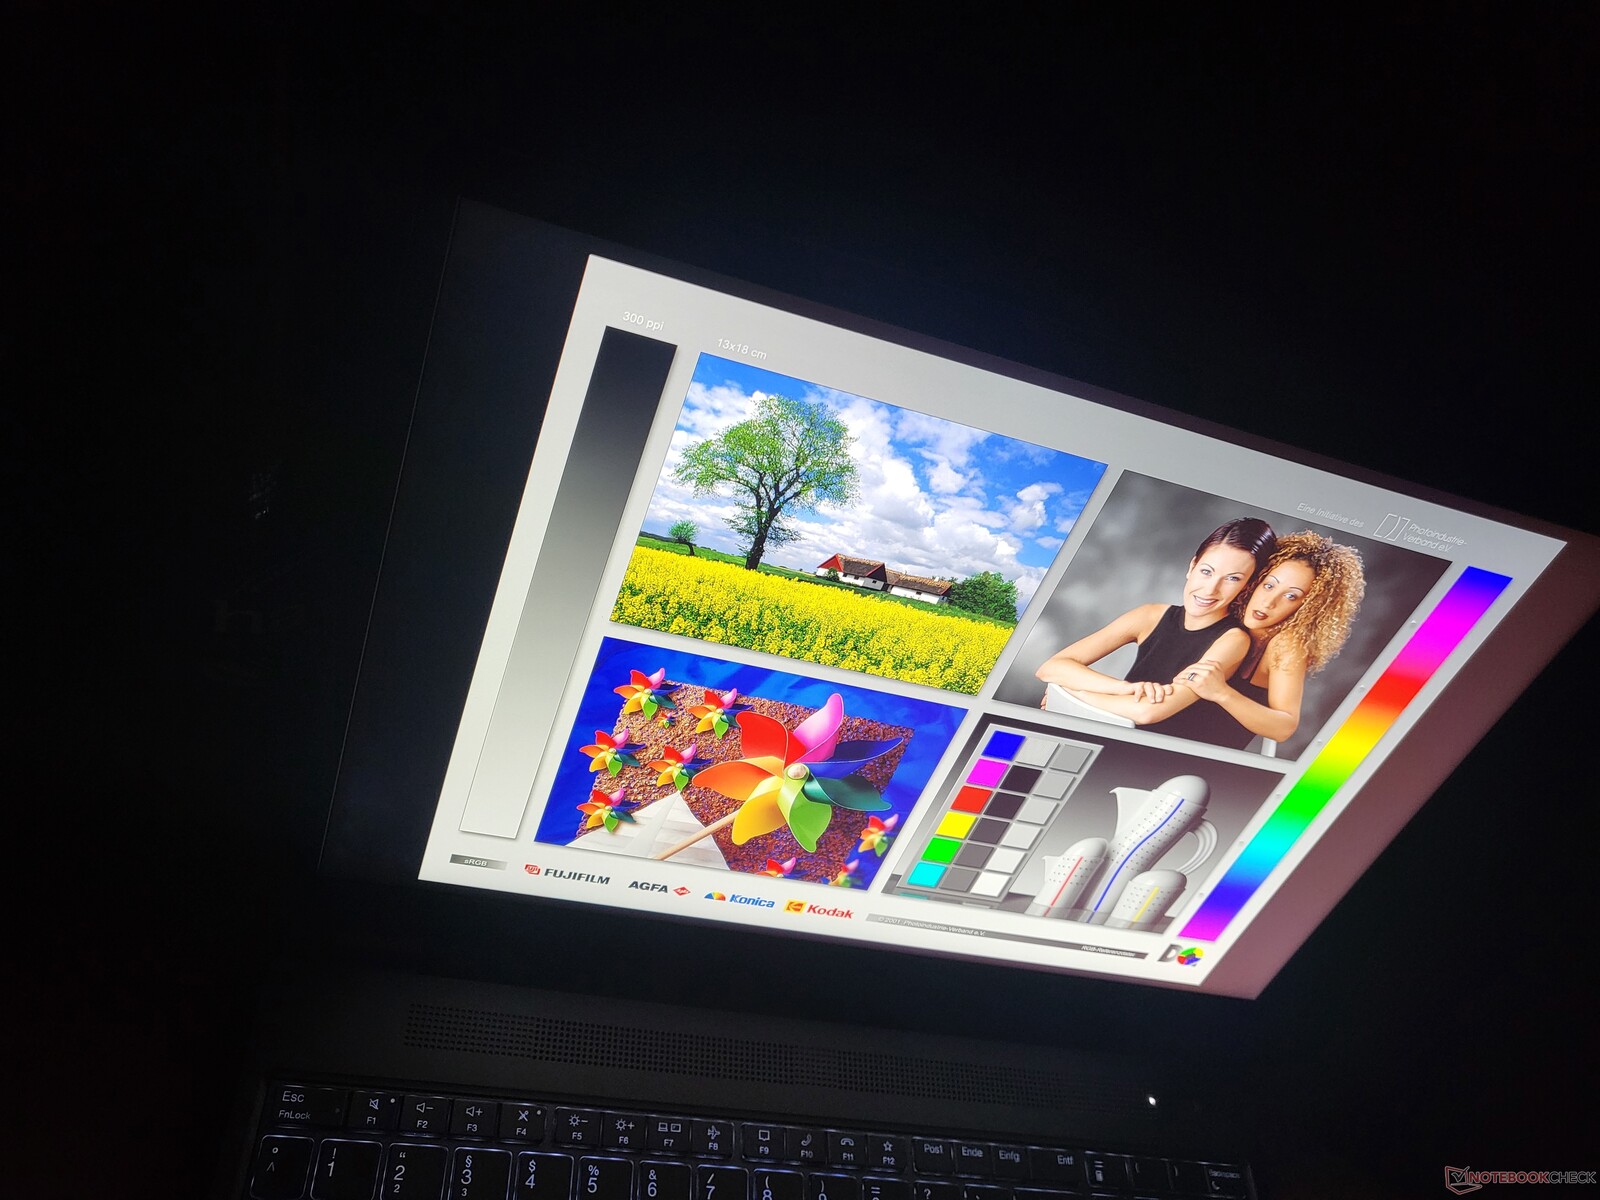
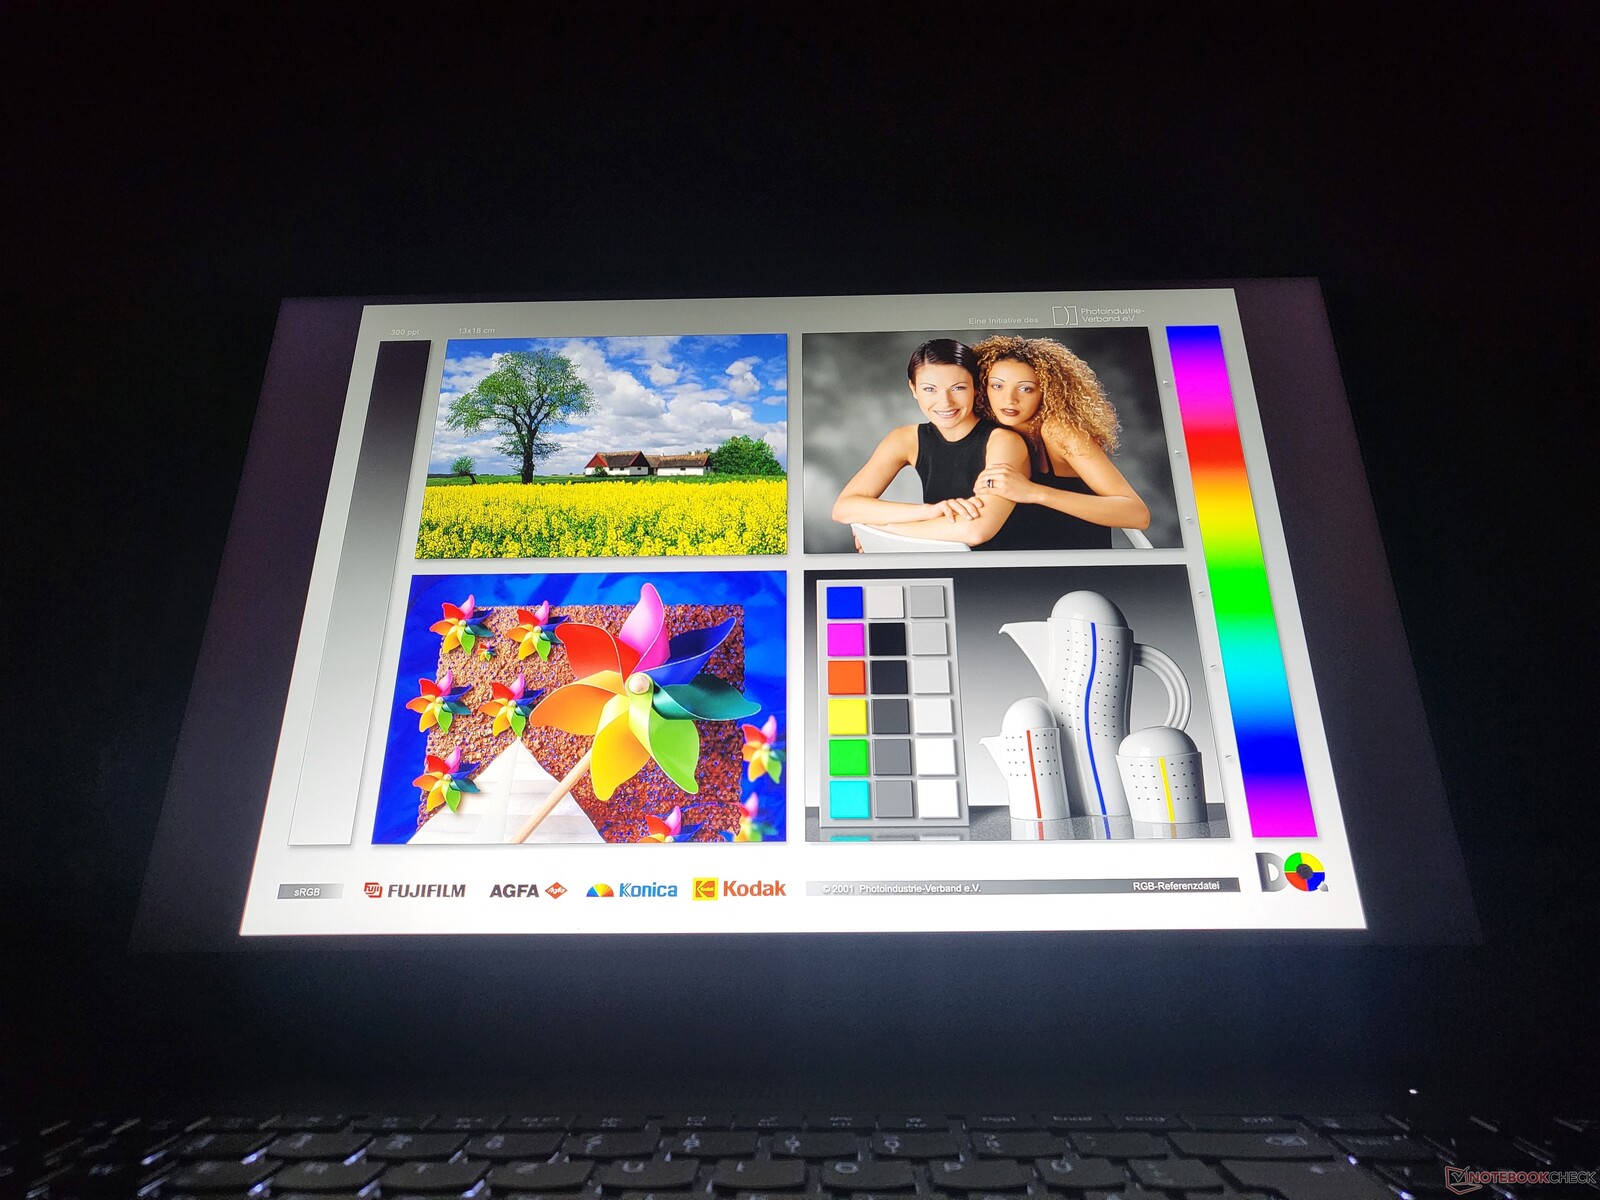
Mostrar: Uma nova opção de LCD WQXGA para a estação de trabalho Thinkpad
Como é usual para os laptops ThinkPad, o Lenovo ThinkPad P16 2022 oferece uma seleção de várias opções de exibição que cobrem uma variedade de aplicações e categorias de preço. O que todos eles têm em comum é uma relação de aspecto de 16:10, além de serem painéis de 16 polegadas:
- WUXGA (1920 x 1200), IPS, 300 cd/m², 100 % sRGB, fosco
- WQXGA (2560 x 1600), IPS, 400 cd/m², 100 % sRGB, fosco
- WQUXGA (3840 x 2400), IPS, 600 cd/m², 100 % AdobeRGB, mate
- WQUXGA (3840 x 2400), OLED, 400 cd/m², 100 % DCI-P3, anti-ofuscante, multi-toque
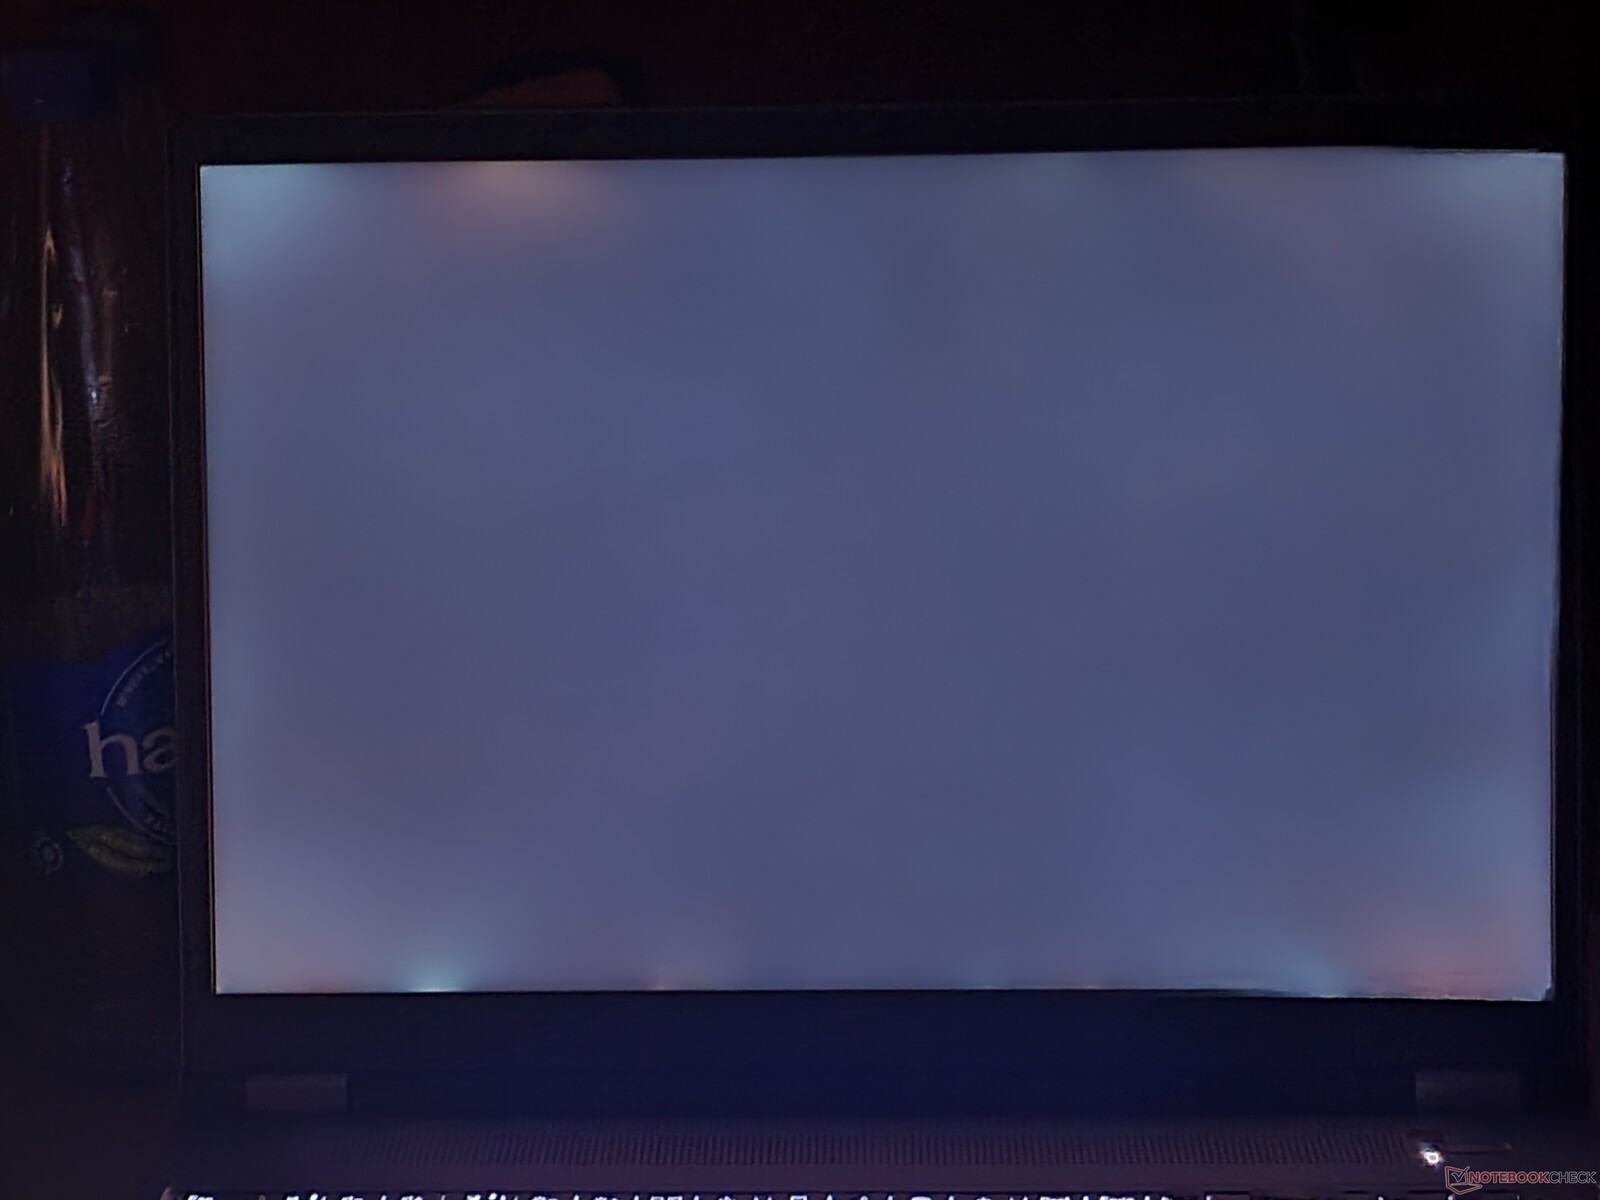
O nível de resolução médio de 2,5K encontrado no P16 é novo, pois o P15 e o P17 só estavam disponíveis em 16:9 com Full-HD (1920 x 1080) ou 4K UHD (3840 x 2160). O display WQXGA embutido entrega o anunciado 400 cd/m² quase no botão com uma média de 398 cd/m². Em comparação com seus equivalentes diretos, isto o coloca no meio do pacote. A tela do Asus ExpertBook B6 Flip é marginalmente mais brilhante.
| |||||||||||||||||||||||||
iluminação: 90 %
iluminação com acumulador: 424 cd/m²
Contraste: 1767:1 (Preto: 0.24 cd/m²)
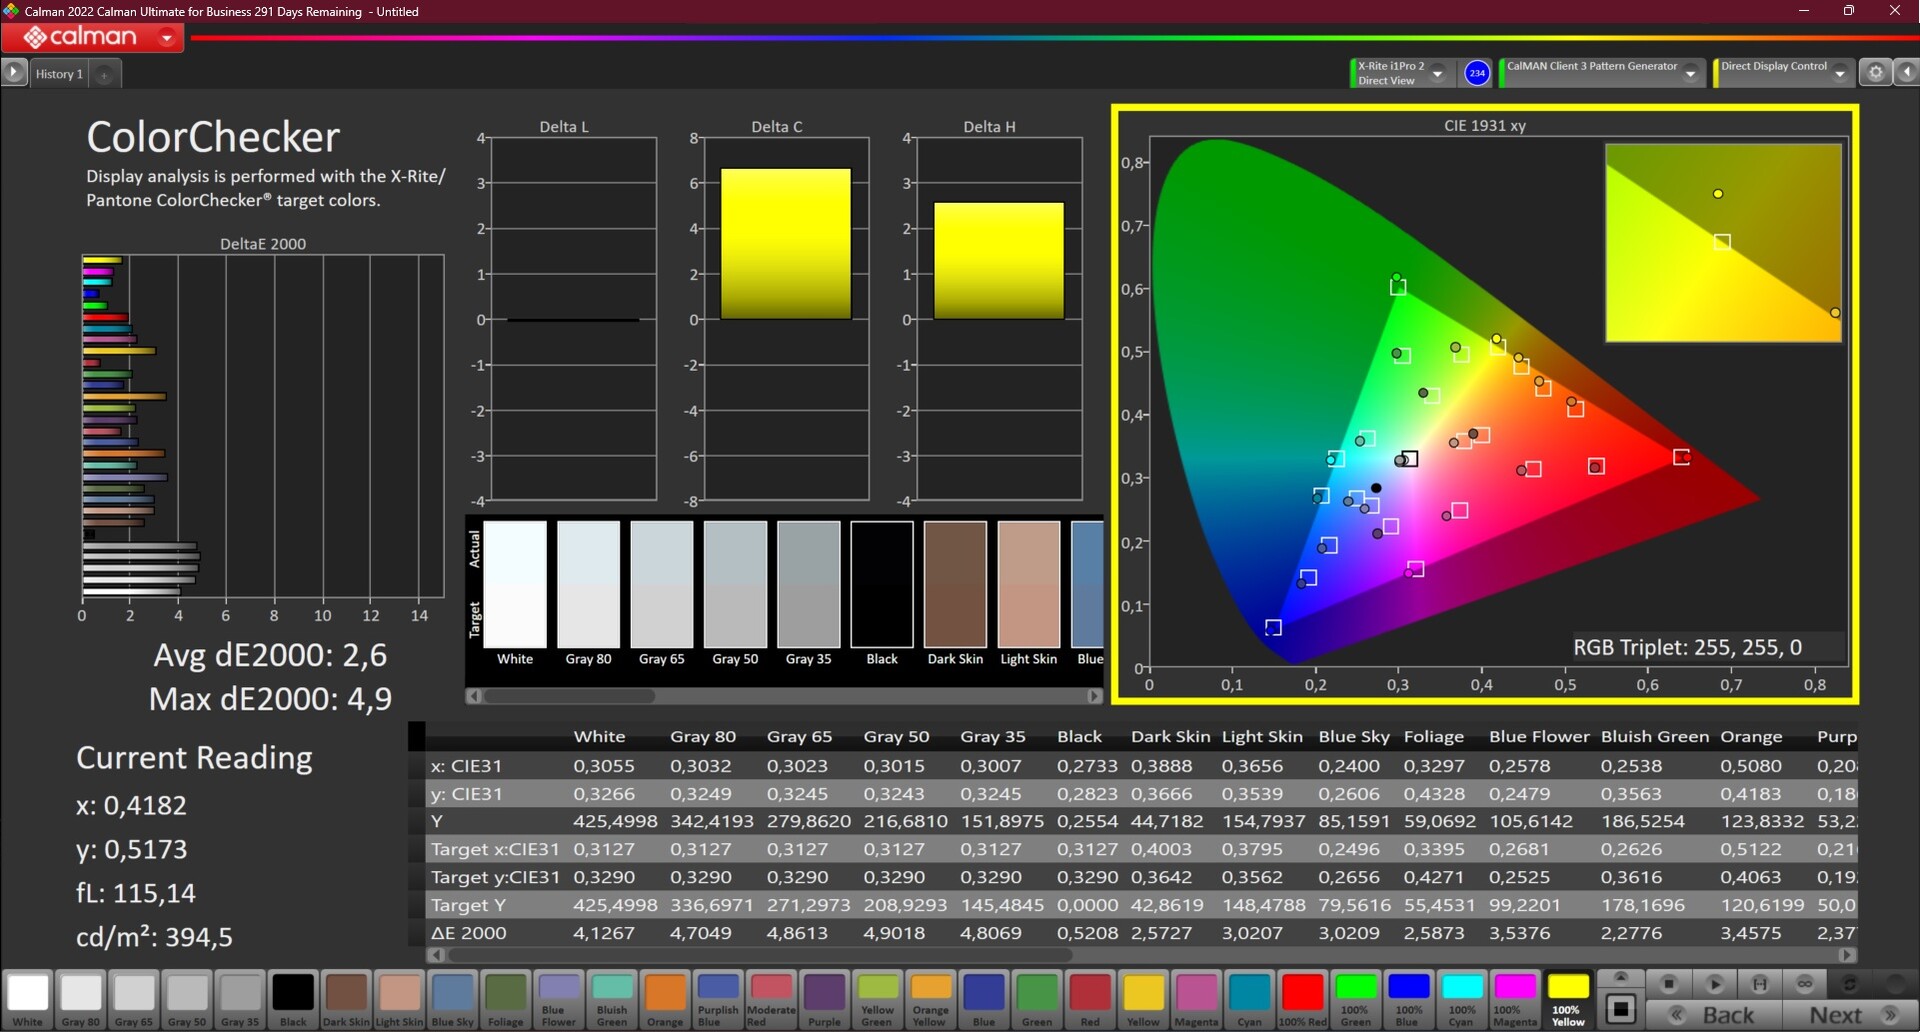
ΔE ColorChecker Calman: 2.6 | ∀{0.5-29.43 Ø4.71}
calibrated: 0.8
ΔE Greyscale Calman: 4.1 | ∀{0.09-98 Ø4.96}
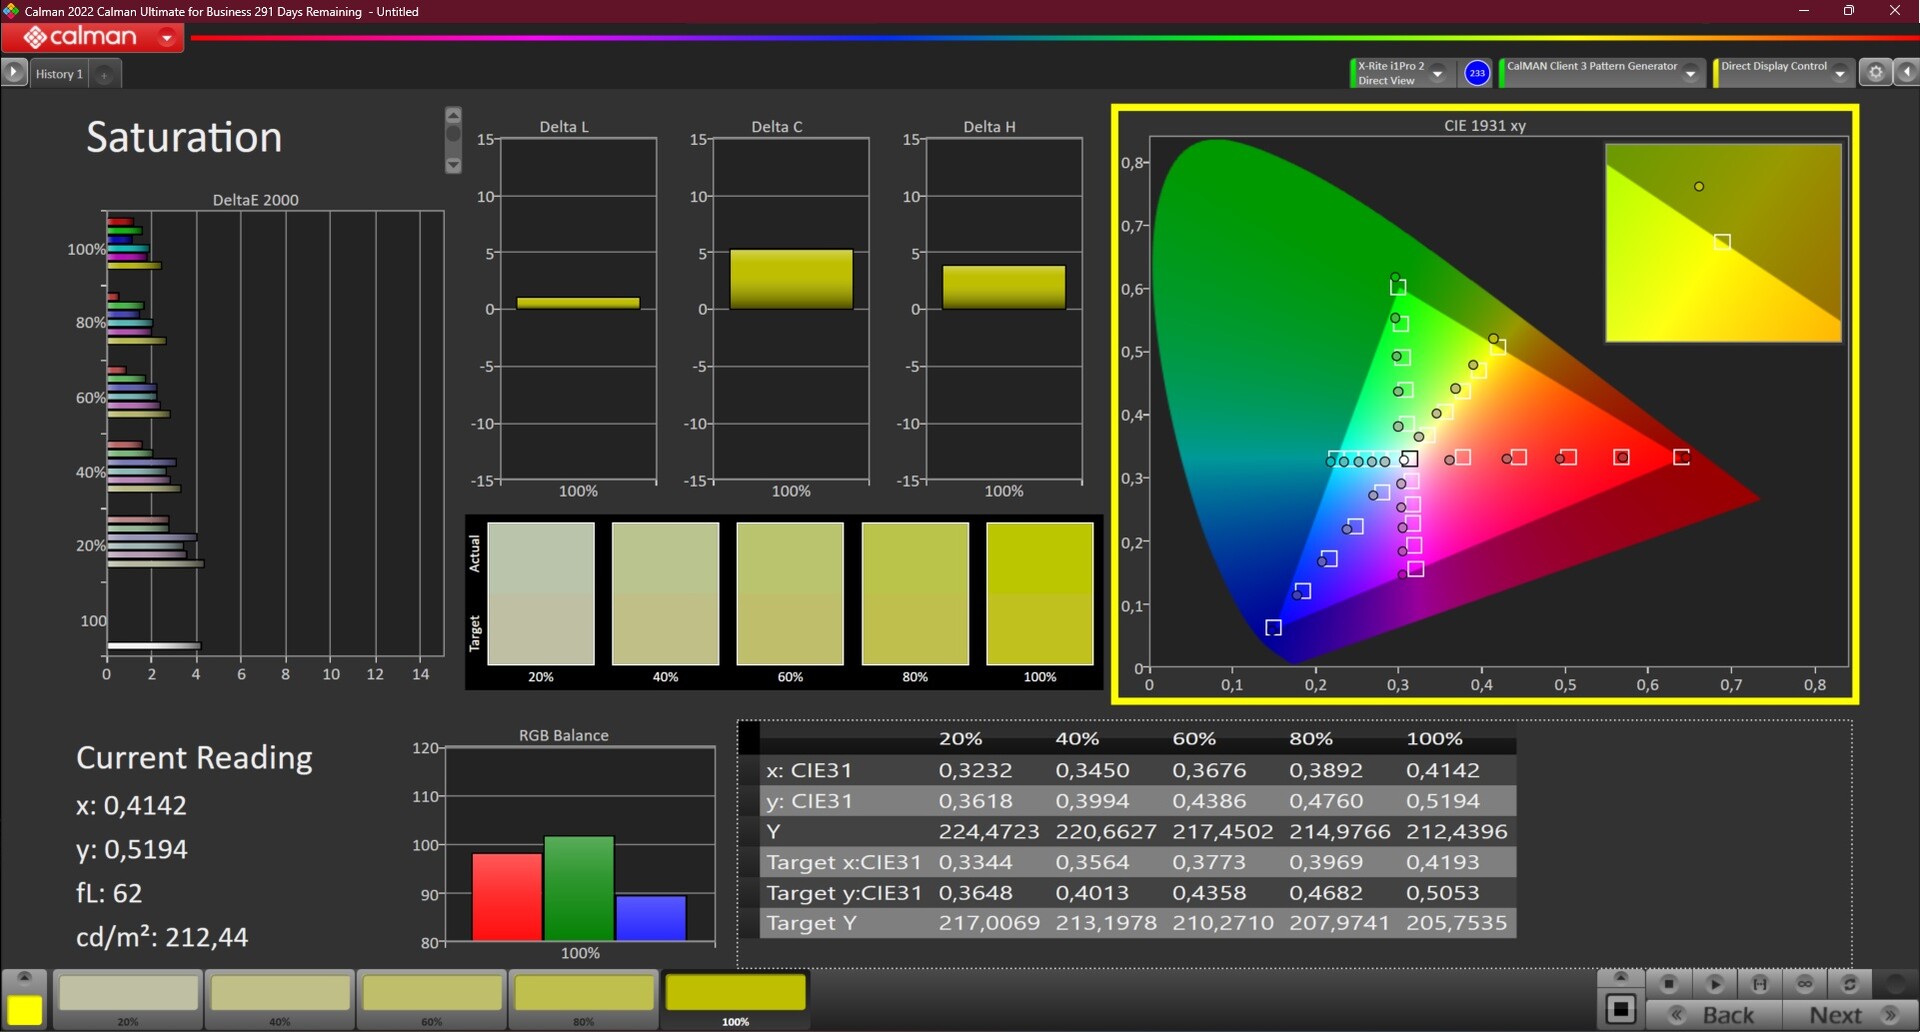
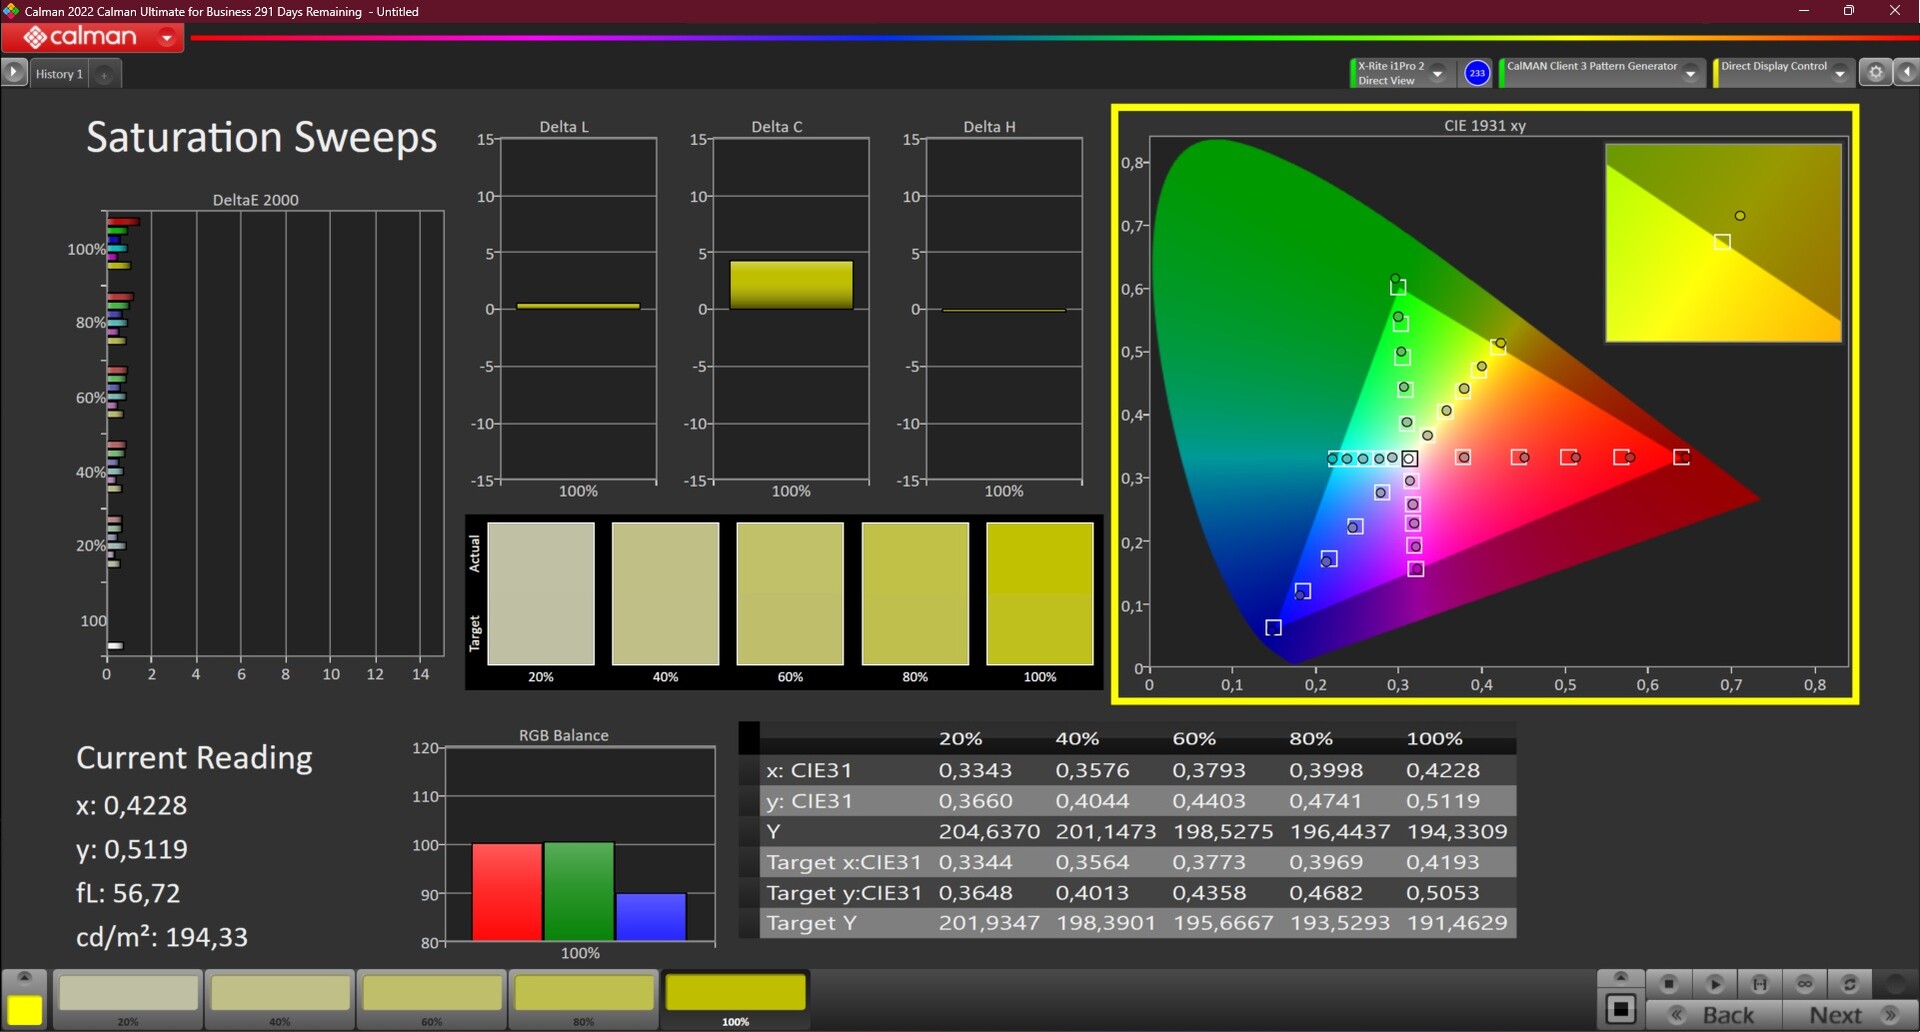
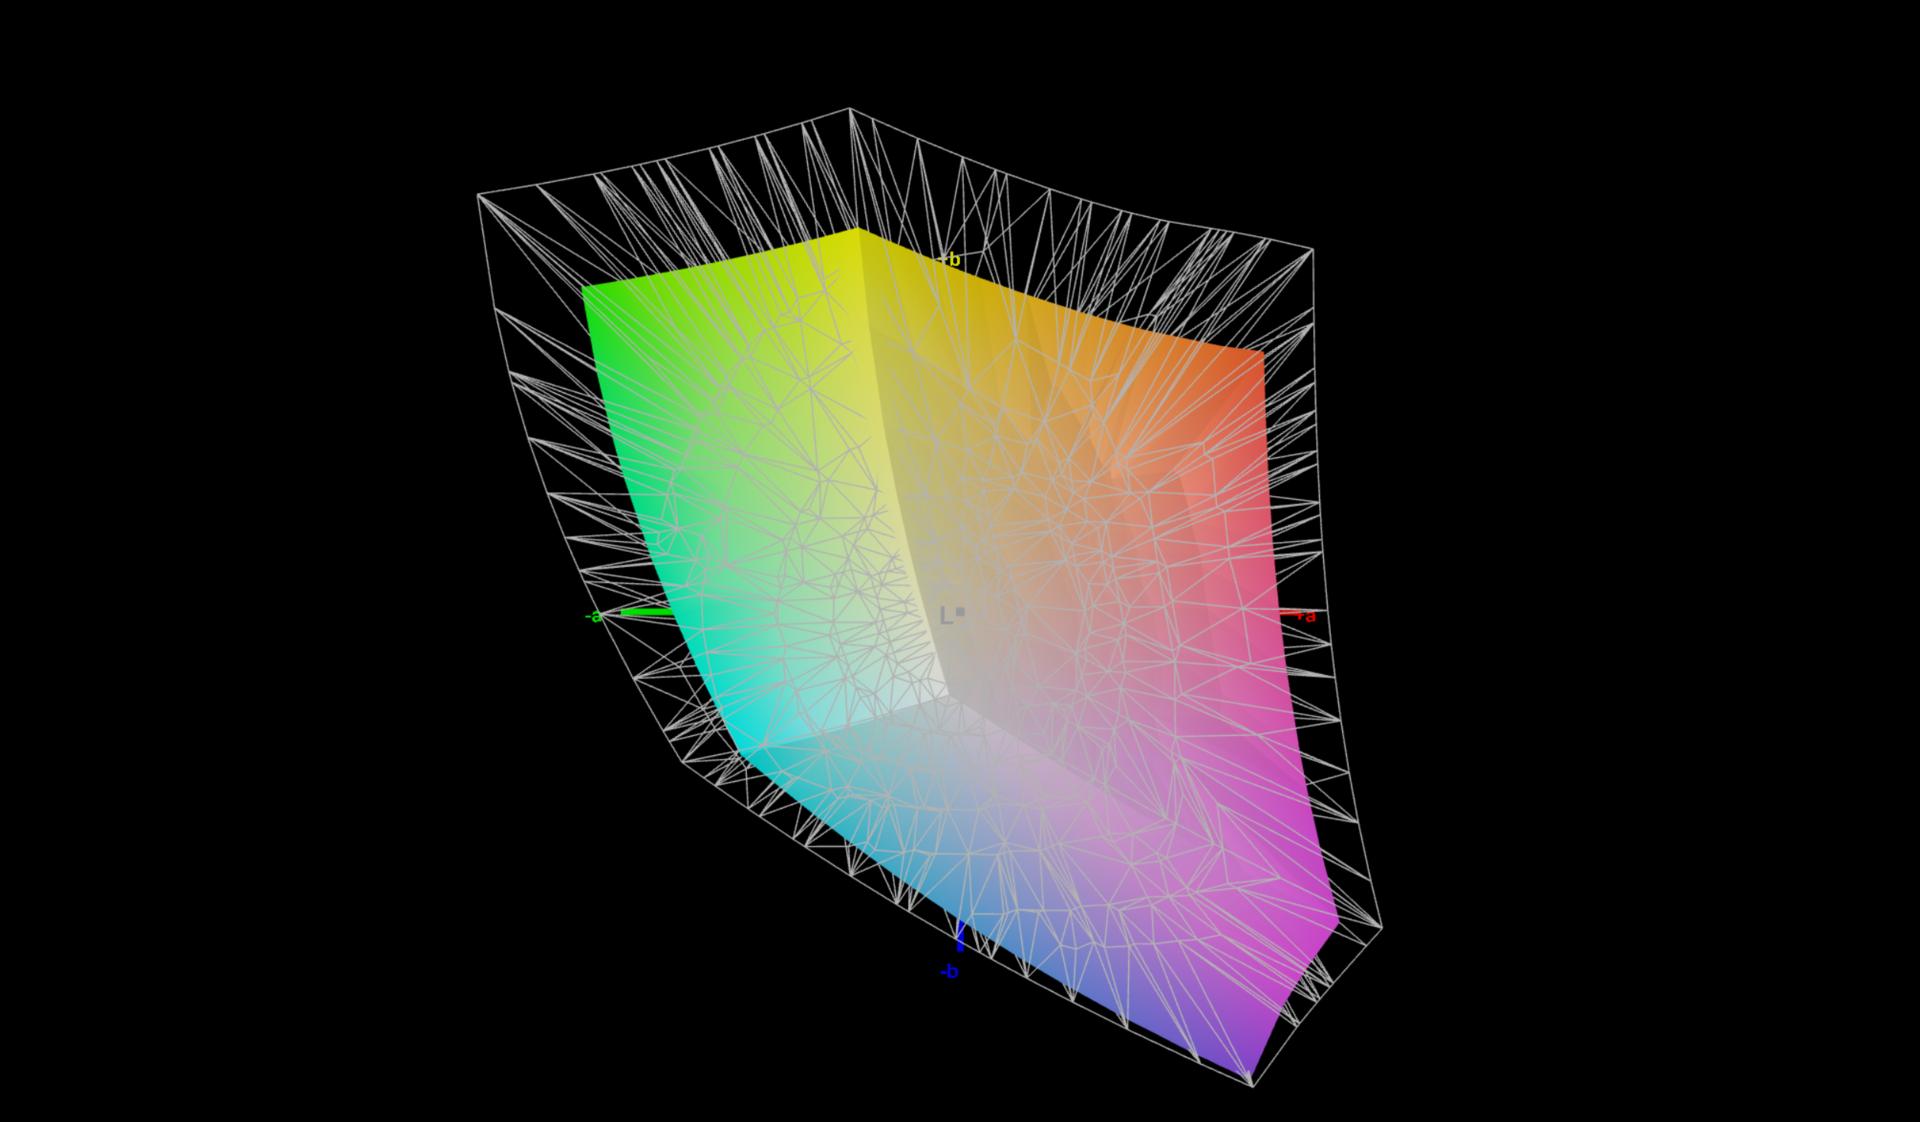
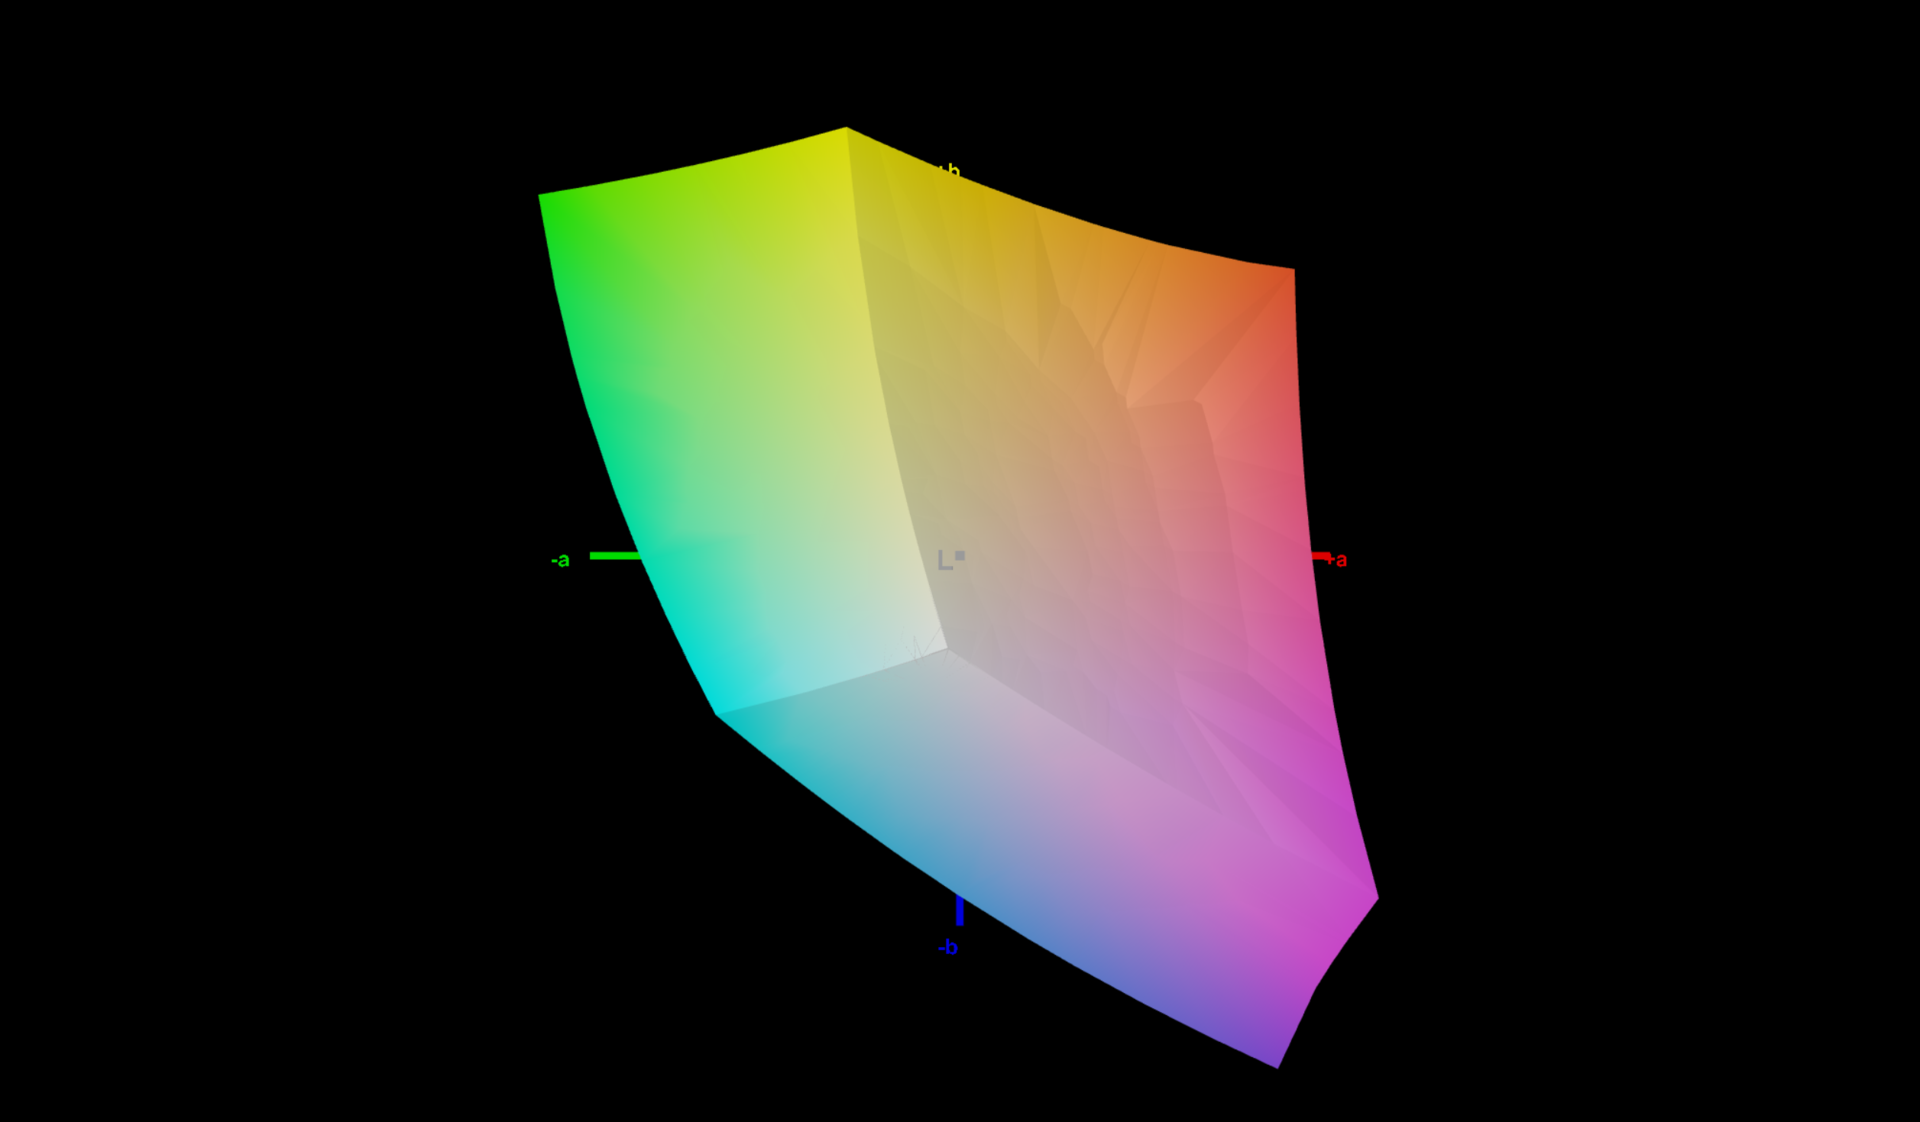
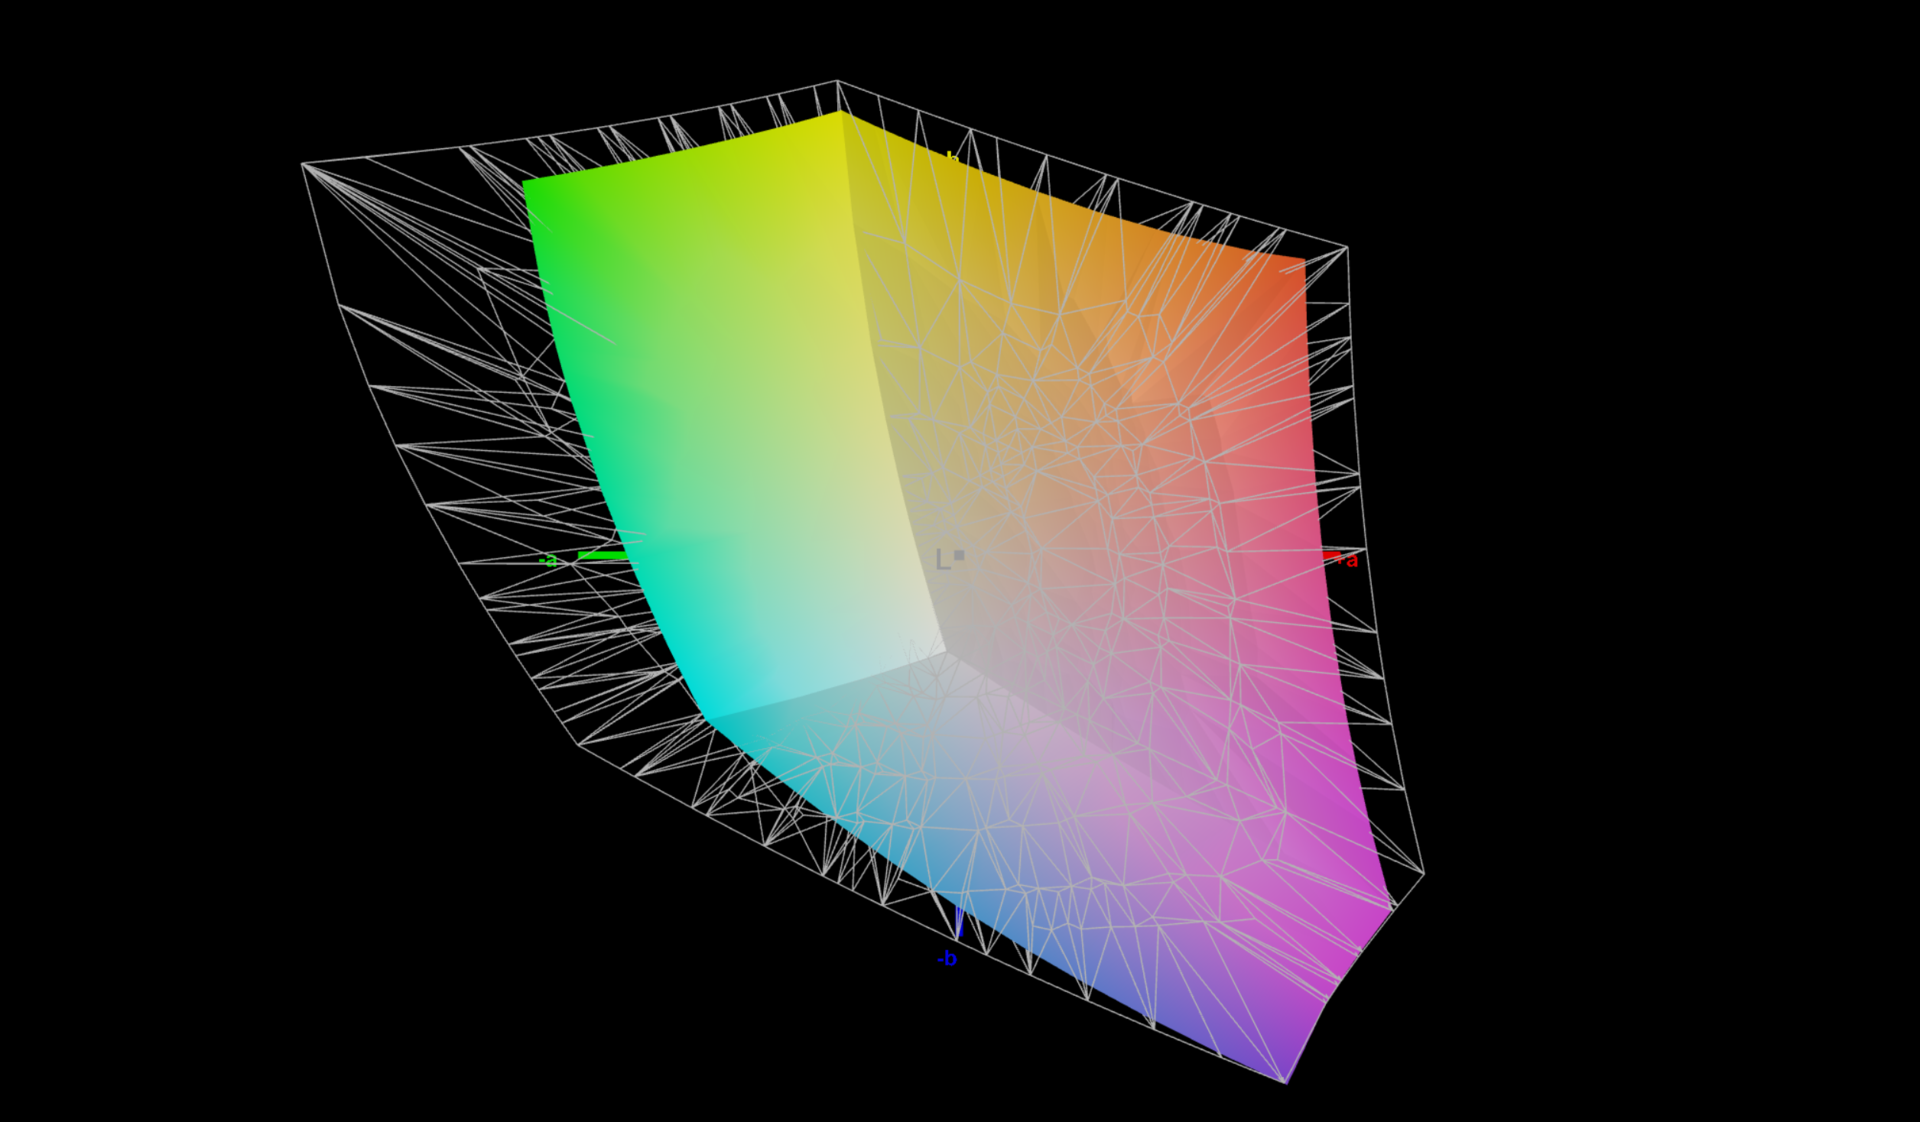
73.3% AdobeRGB 1998 (Argyll 3D)
100% sRGB (Argyll 3D)
71.5% Display P3 (Argyll 3D)
Gamma: 2.13
CCT: 7252 K
| Lenovo ThinkPad P16 G1 21D6001DMB NE160QDM-N63 , IPS LED, 2560x1600, 16" | Lenovo ThinkPad P15 G2-20YQ001JGE N156HCE_GN1, IPS, 1920x1080, 15.6" | Lenovo ThinkPad P17 G2-20YU0025G LP173WF4-SPF7, IPS LED, 1920x1080, 17.3" | HP ZBook Fury 17 G8-4A6A9EA AUOCD8C, IPS, 3840x2160, 17.3" | Dell Precision 7670 Samsung 160YV03, OLED, 3840x2400, 16" | Asus ExpertBook B6 Flip B6602FC2 AU Optronics Model: AUOE495, IPS, 2560x1600, 16" | |
|---|---|---|---|---|---|---|
| Display | -3% | -10% | 19% | 24% | 18% | |
| Display P3 Coverage (%) | 71.5 | 68.6 -4% | 67.9 -5% | 99.1 39% | 99.9 40% | 97.9 37% |
| sRGB Coverage (%) | 100 | 99.8 0% | 87.3 -13% | 100 0% | 100 0% | 99.89 0% |
| AdobeRGB 1998 Coverage (%) | 73.3 | 70.6 -4% | 63.9 -13% | 86.8 18% | 97.5 33% | 85.52 17% |
| Response Times | 20% | 6% | -41% | 94% | 20% | |
| Response Time Grey 50% / Grey 80% * (ms) | 37.7 ? | 37.6 ? -0% | 39.2 ? -4% | 67.6 ? -79% | 1.9 ? 95% | 36 ? 5% |
| Response Time Black / White * (ms) | 26.3 ? | 16 ? 39% | 22.4 ? 15% | 26.8 ? -2% | 2 ? 92% | 17 ? 35% |
| PWM Frequency (Hz) | 26040 ? | 59.5 ? | ||||
| Screen | -3% | -77% | 27% | -12% | -27% | |
| Brightness middle (cd/m²) | 424 | 498 17% | 361 -15% | 568 34% | 340.1 -20% | 440 4% |
| Brightness (cd/m²) | 398 | 490 23% | 334 -16% | 564 42% | 342 -14% | 418 5% |
| Brightness Distribution (%) | 90 | 95 6% | 87 -3% | 88 -2% | 98 9% | 82 -9% |
| Black Level * (cd/m²) | 0.24 | 0.39 -63% | 0.35 -46% | 0.33 -38% | 0.3 -25% | |
| Contrast (:1) | 1767 | 1277 -28% | 1031 -42% | 1721 -3% | 1467 -17% | |
| Colorchecker dE 2000 * | 2.6 | 2.1 19% | 5.4 -108% | 1 62% | 2.5 4% | 2.81 -8% |
| Colorchecker dE 2000 max. * | 4.9 | 5.6 -14% | 9.9 -102% | 2.4 51% | 8.19 -67% | 4.62 6% |
| Colorchecker dE 2000 calibrated * | 0.8 | 0.8 -0% | 3.2 -300% | 0.5 37% | 2.99 -274% | |
| Greyscale dE 2000 * | 4.1 | 3.4 17% | 6.5 -59% | 1.7 59% | 3.5 15% | 0.91 78% |
| Gamma | 2.13 103% | 2.32 95% | 2.23 99% | 2.18 101% | 2.12 104% | 2.2 100% |
| CCT | 7252 90% | 7162 91% | 7351 88% | 6461 101% | 6704 97% | 6600 98% |
| Média Total (Programa/Configurações) | 5% /
1% | -27% /
-51% | 2% /
16% | 35% /
17% | 4% /
-10% |
* ... menor é melhor
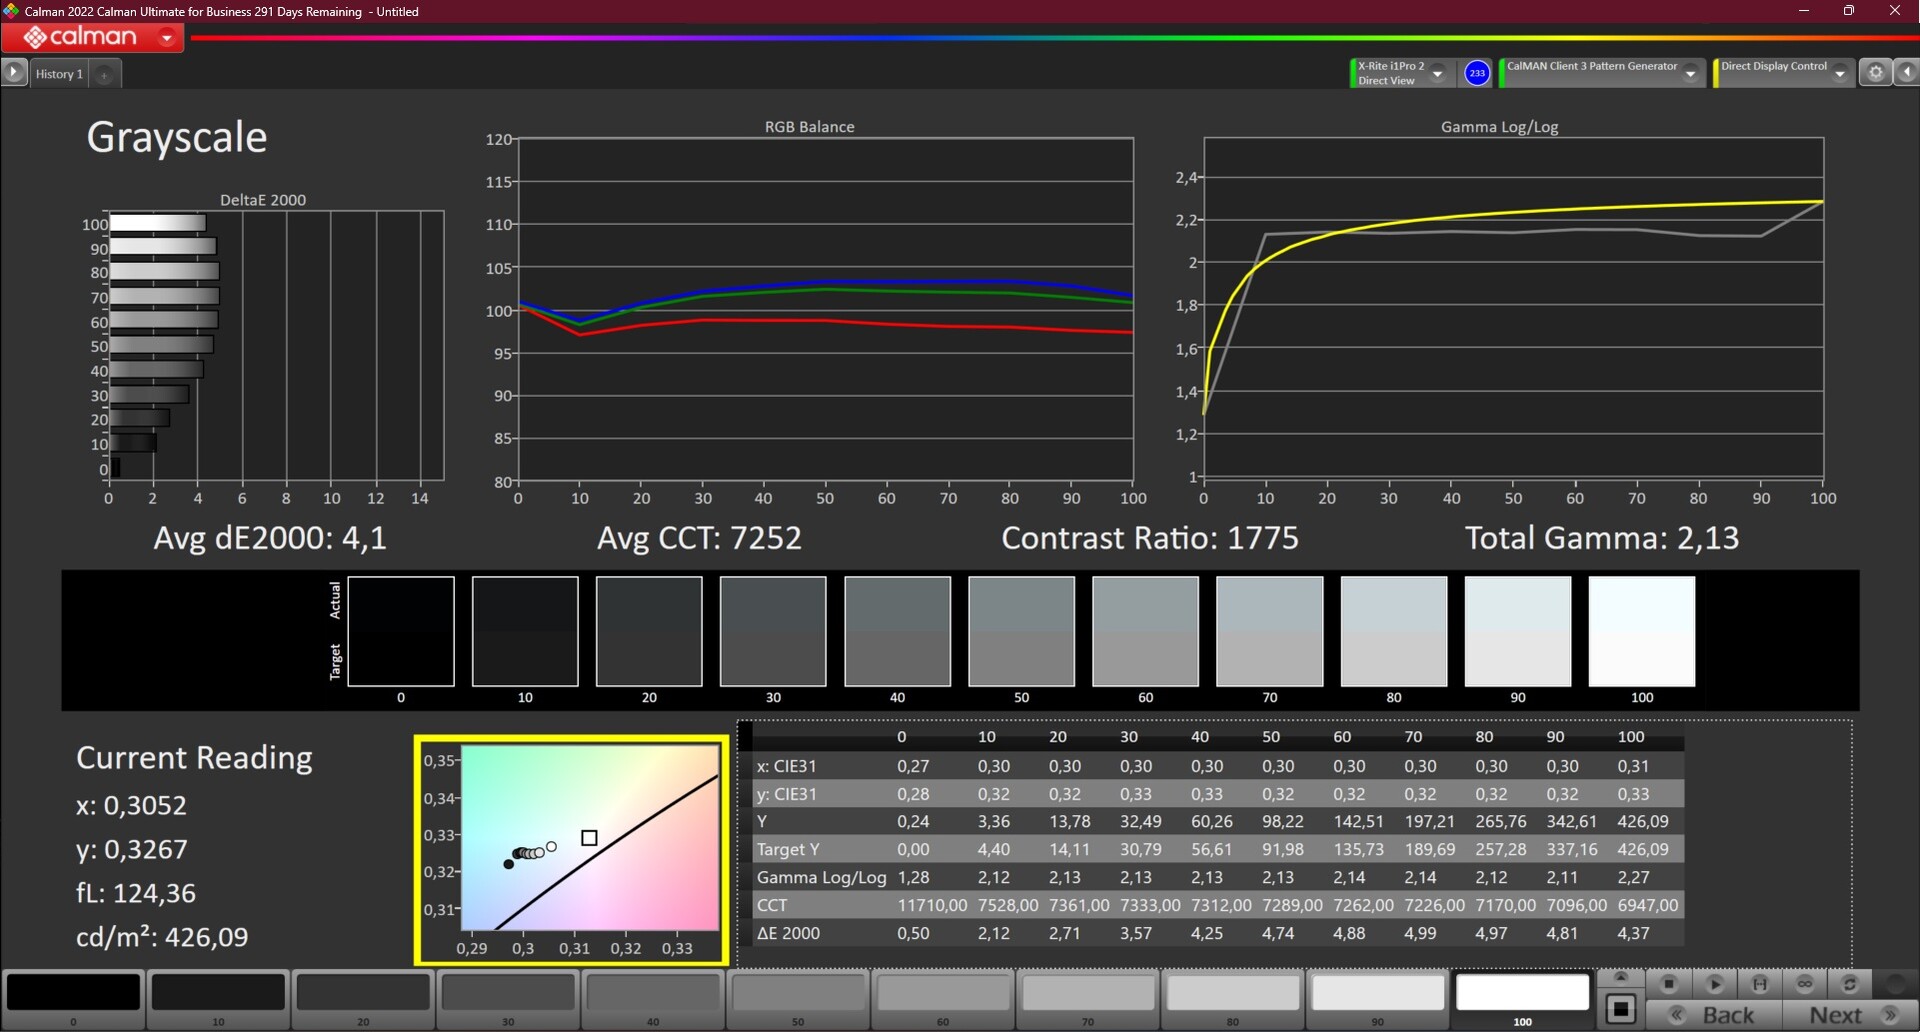
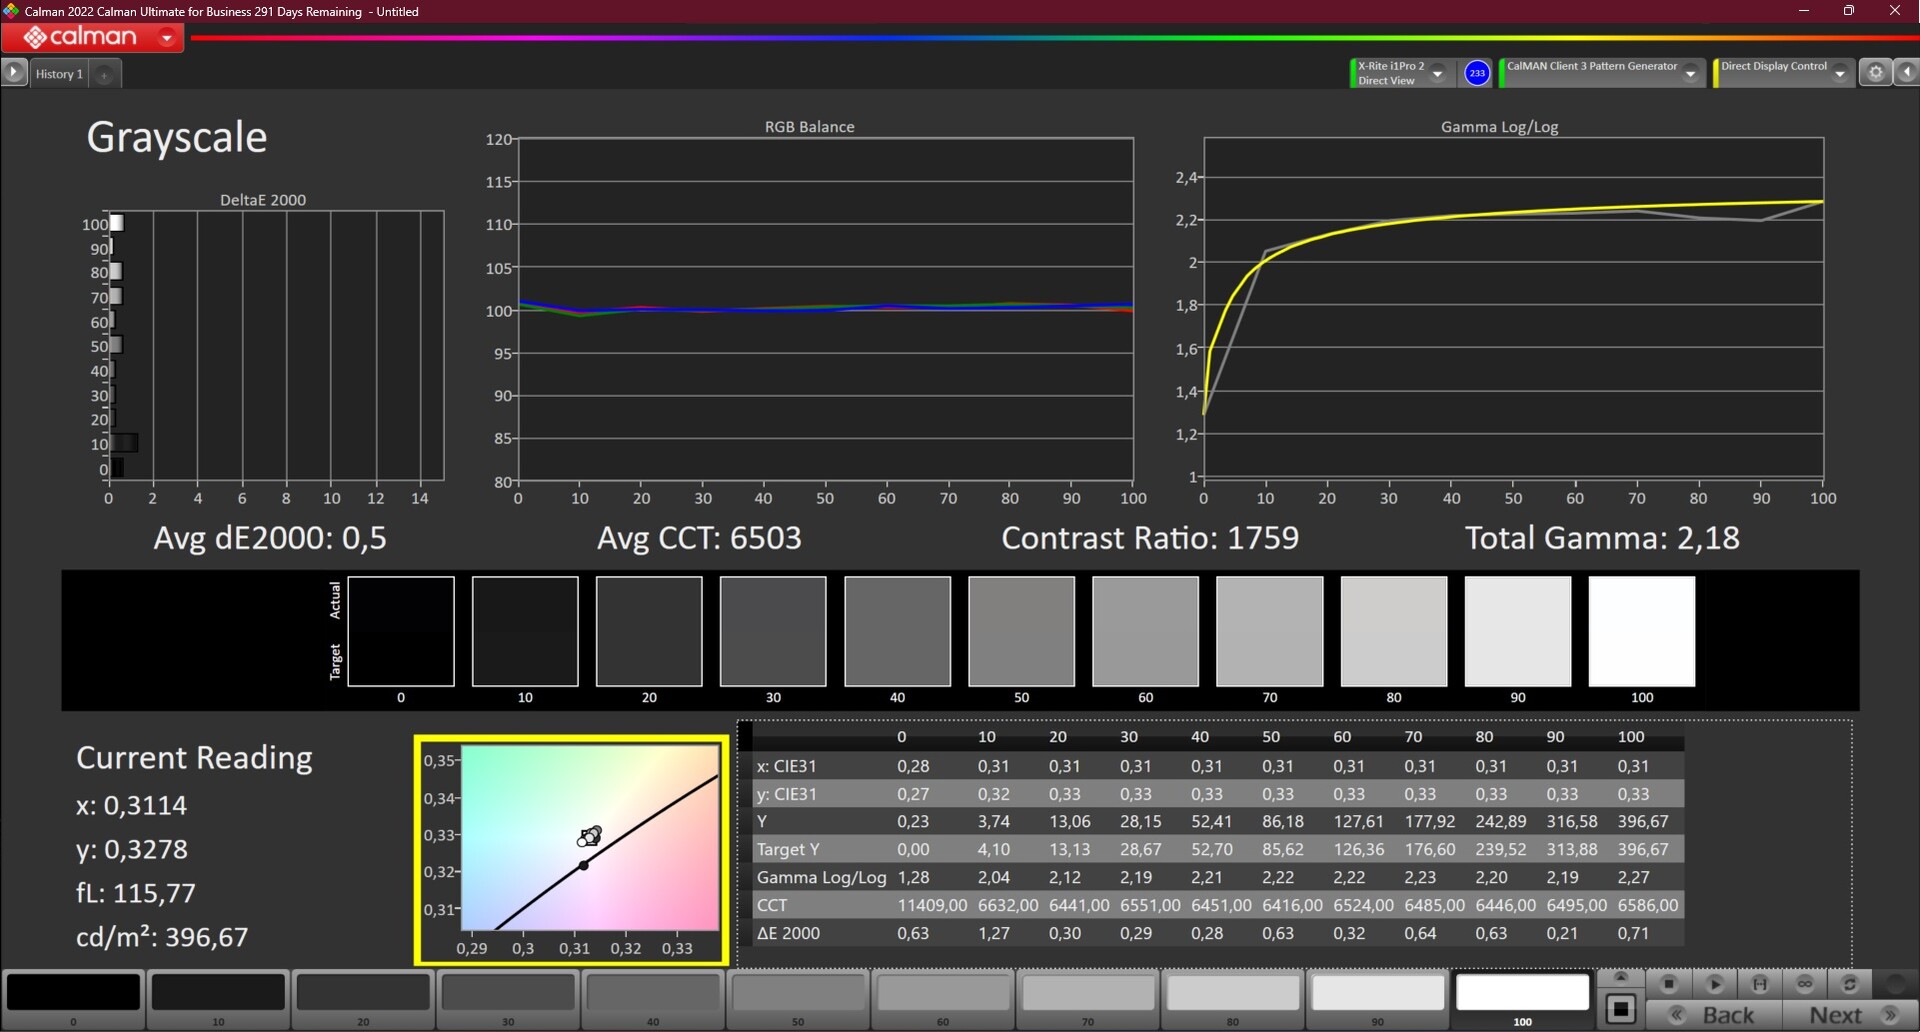
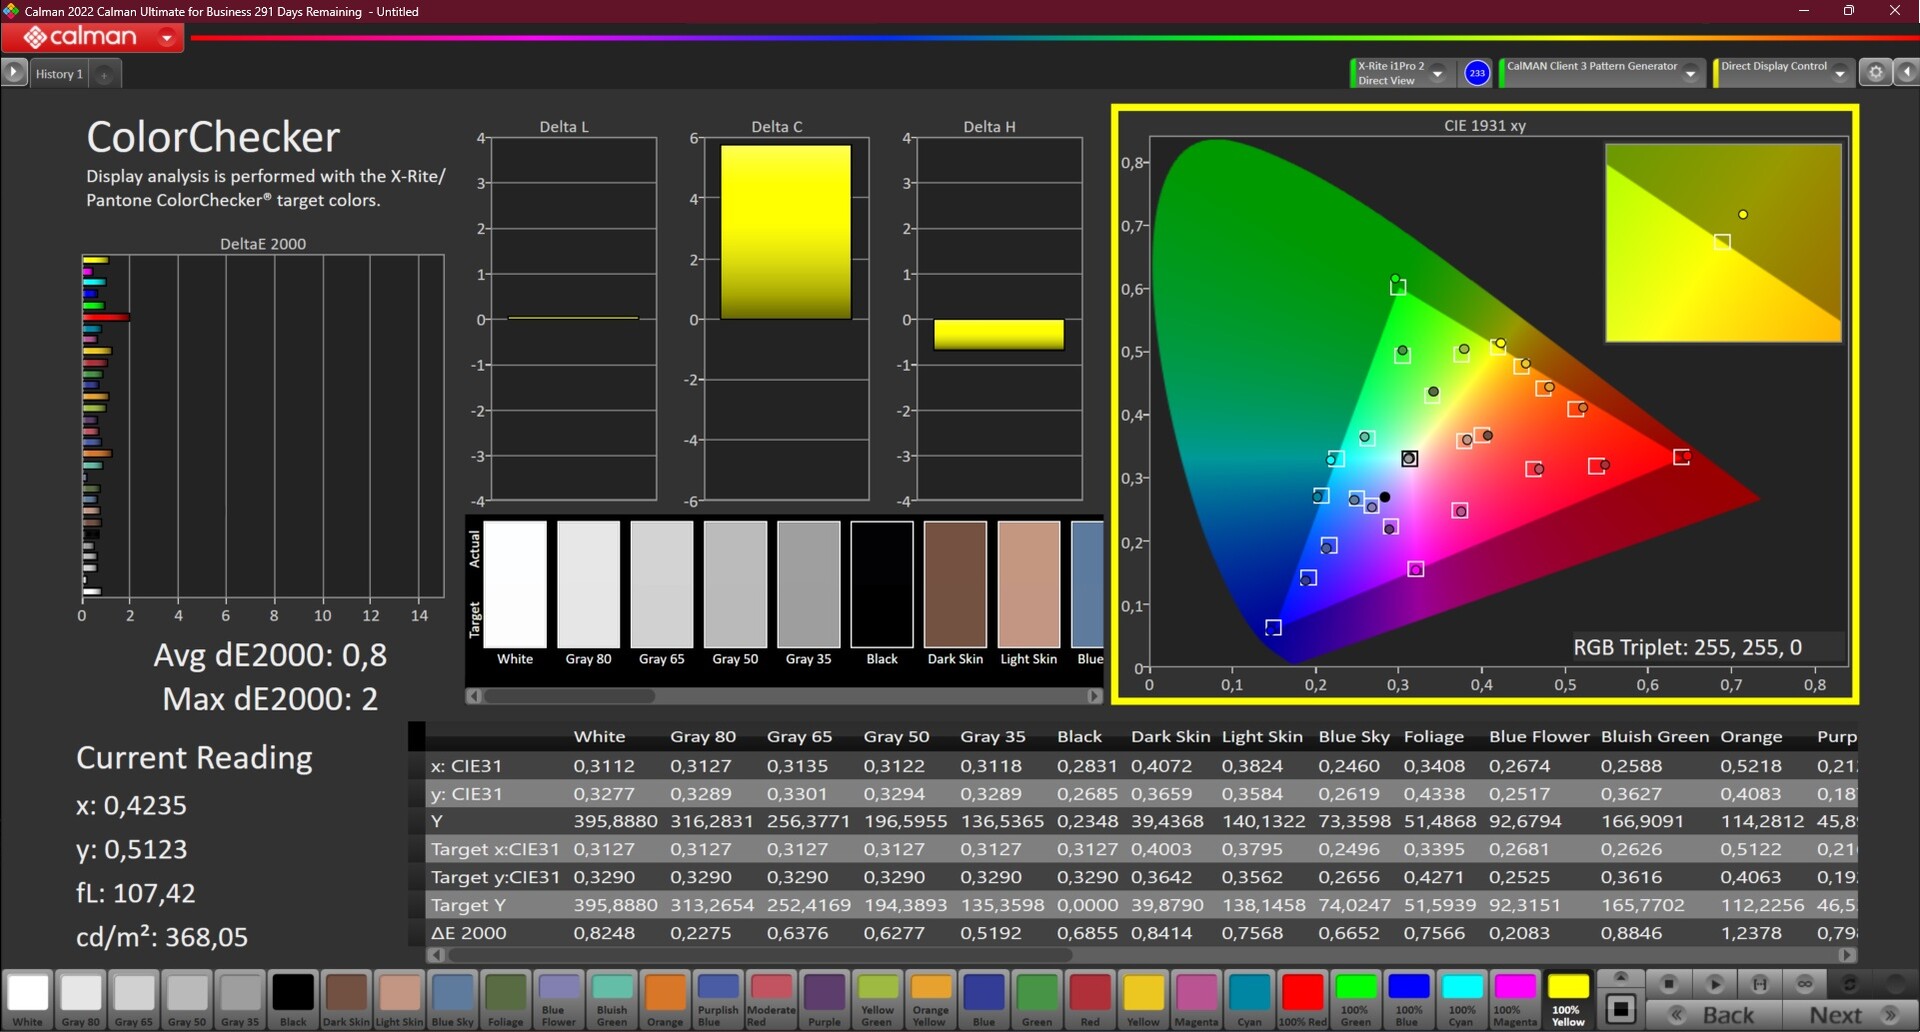
Fora da caixa, as cores foram colocadas um pouco frias demais que pudemos medir usando o CalMan e o Colorímetro X-Rite i1Pro 2. A calibração ajudou a corrigir isso e também contribuiu para alcançar um excelente valor DeltaE de 0,8. Como sempre, o perfil que criamos está disponível para download, gratuitamente.
Uma vez calibrado, o display também pode ser usado para o processamento simples da imagem, pois cobre completamente o espaço de cor sRGB. Para espaços de cores maiores, uma das opções WQUXGA deve ser selecionada.
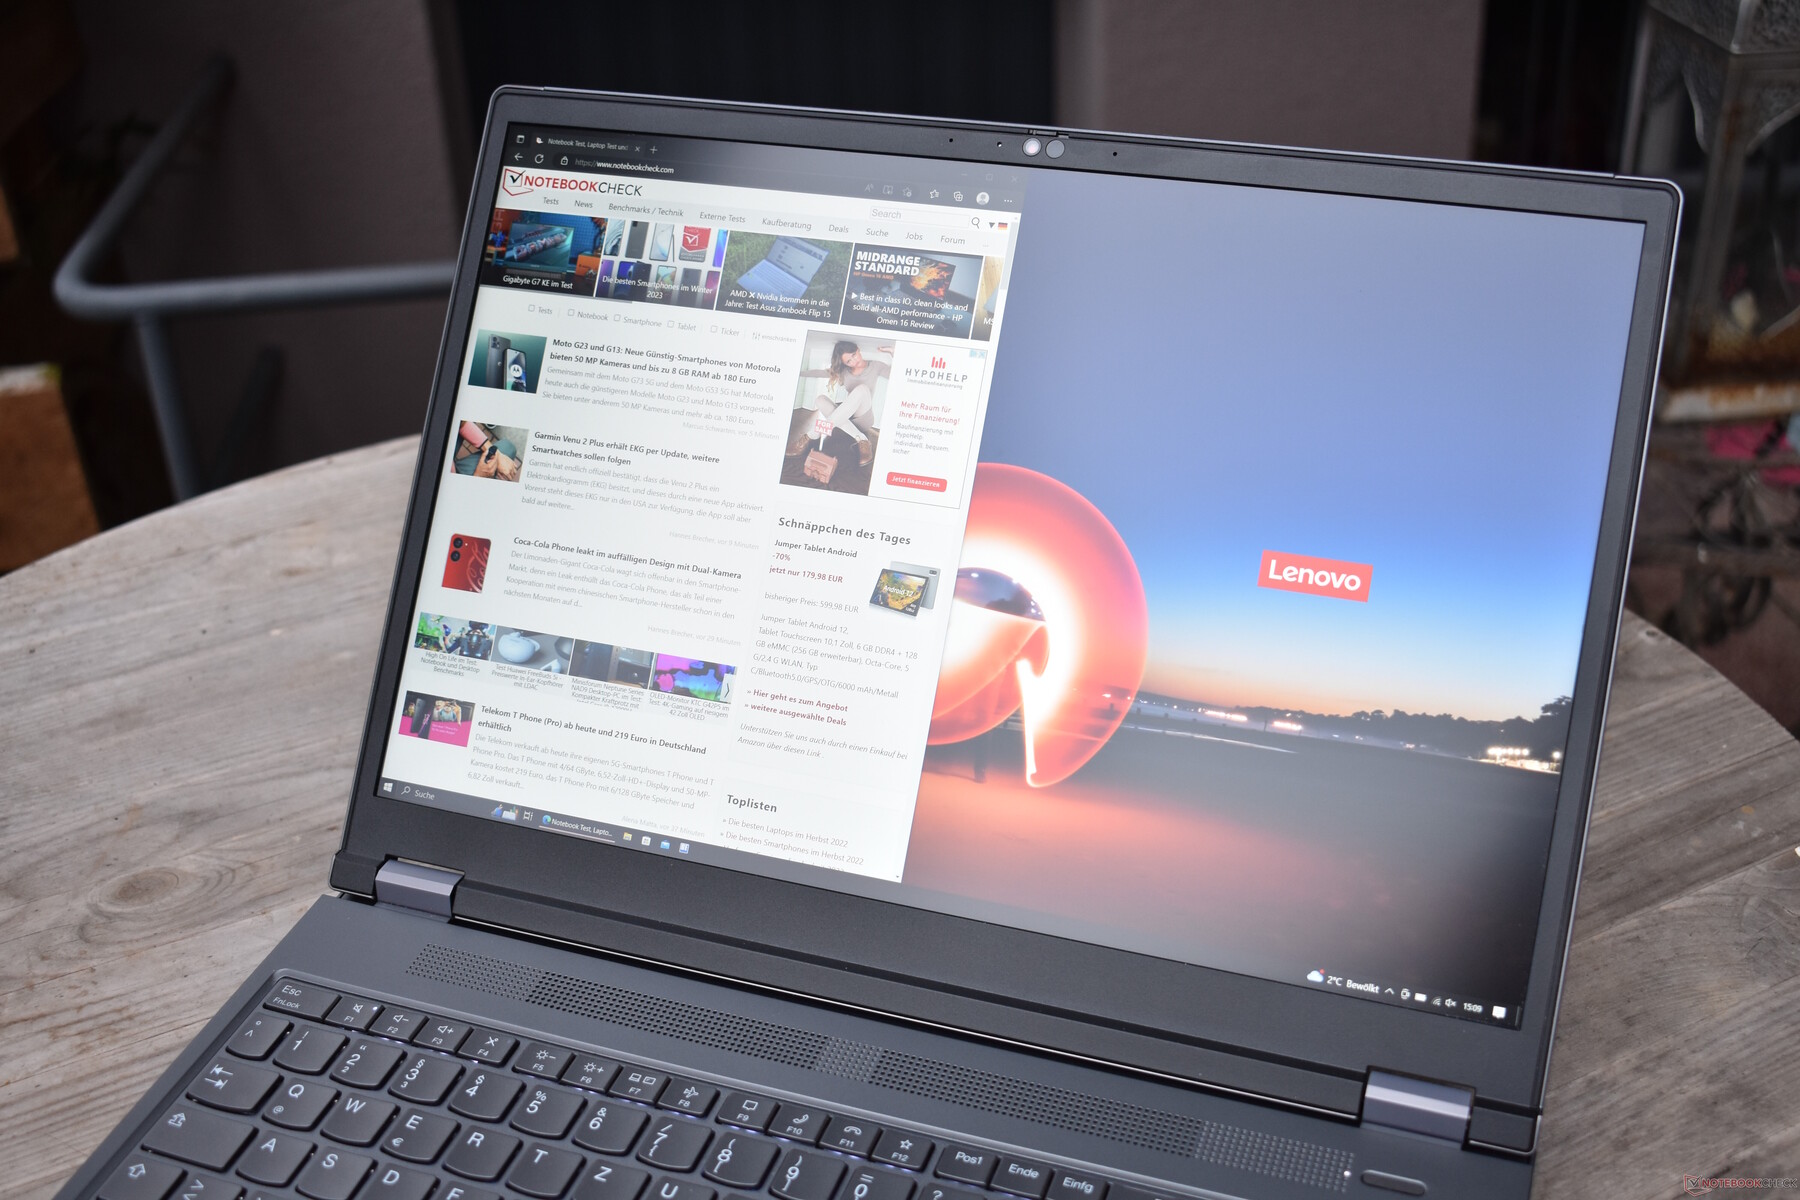
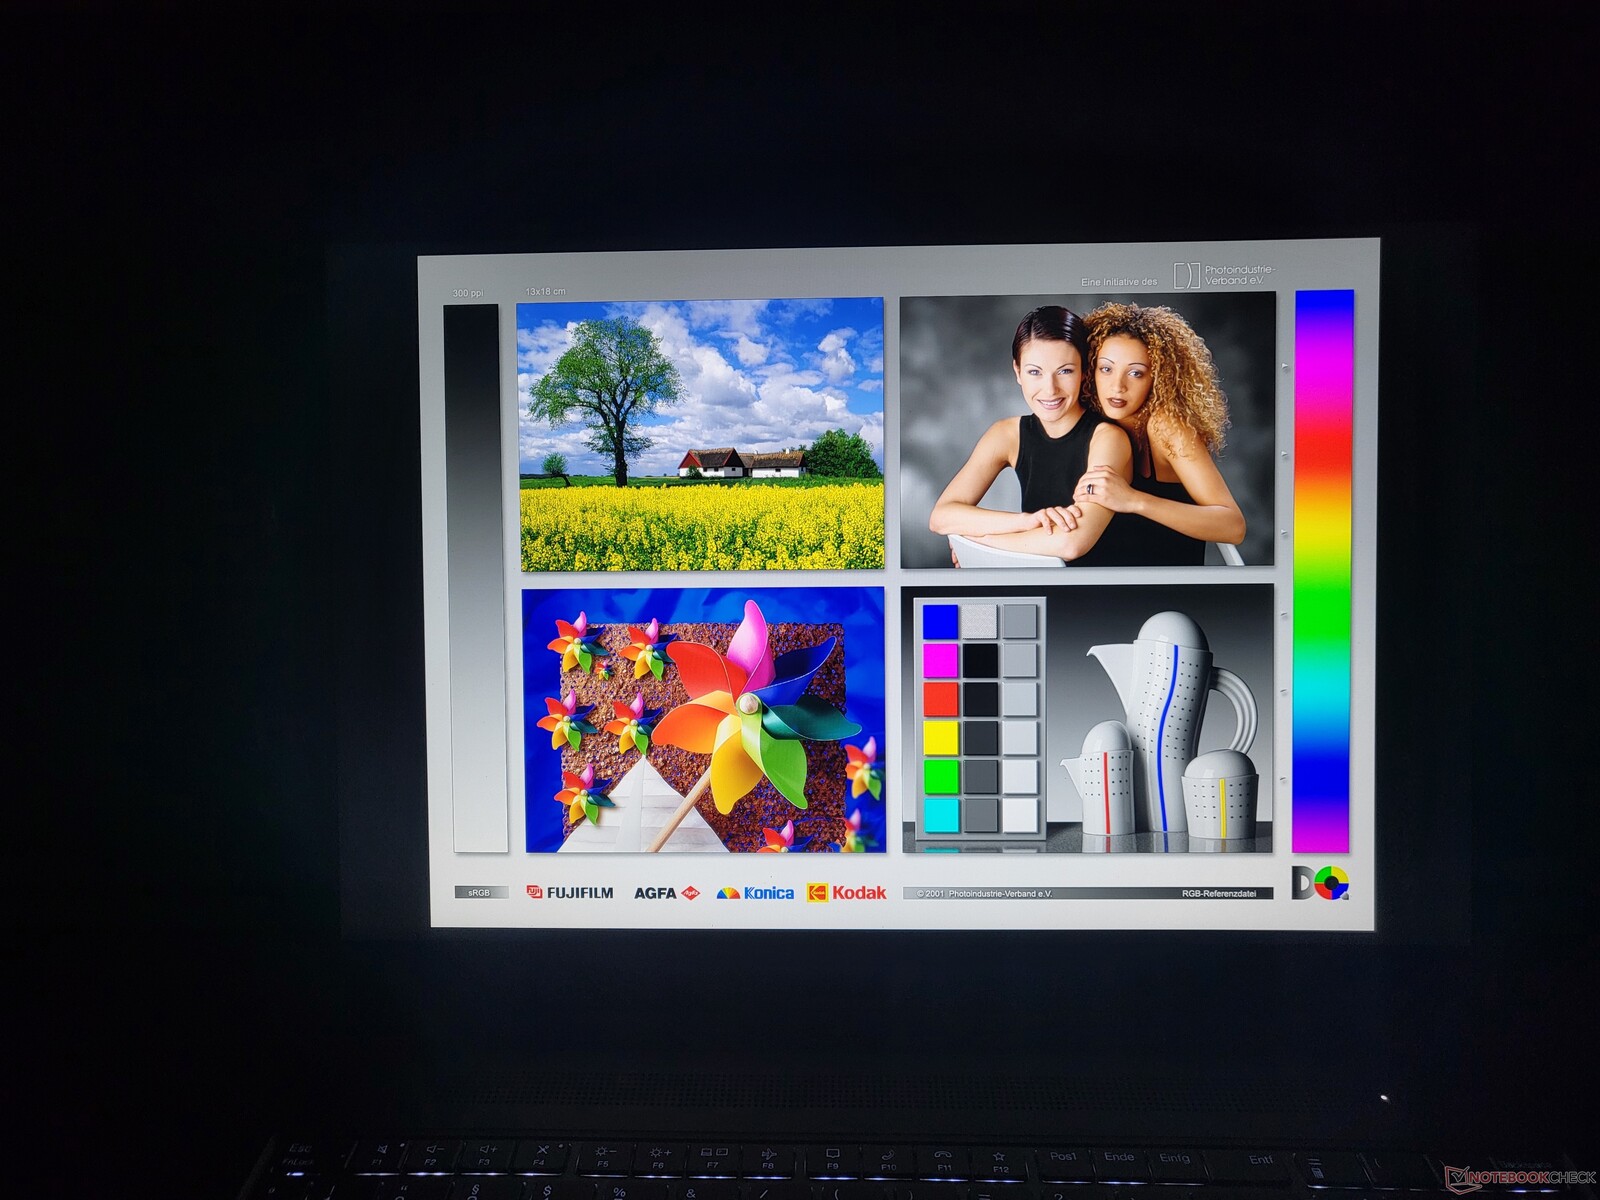
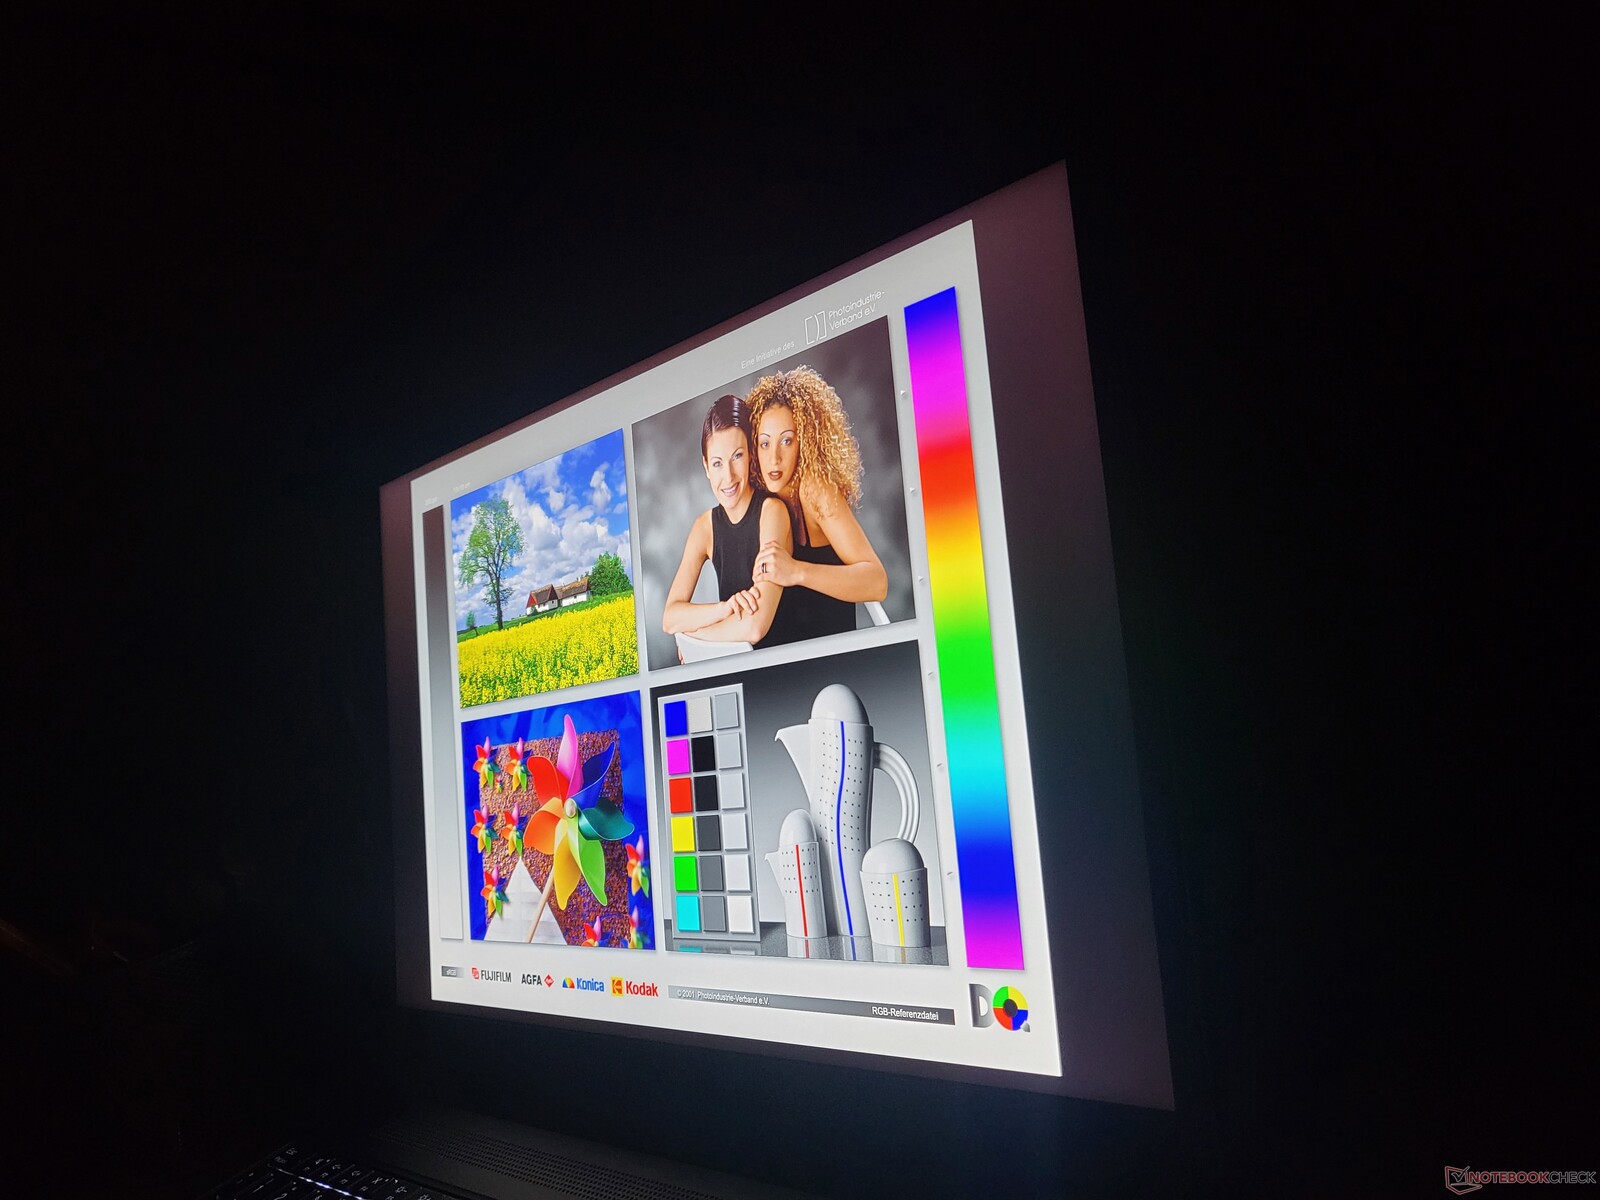
Ao ar livre, o Lenovo ThinkPad P16 G1 se sai muito bem graças aos bons níveis de brilho da tela fosca.
Exibir tempos de resposta
| ↔ Tempo de resposta preto para branco | ||
|---|---|---|
| 26.3 ms ... ascensão ↗ e queda ↘ combinadas | ↗ 14 ms ascensão | 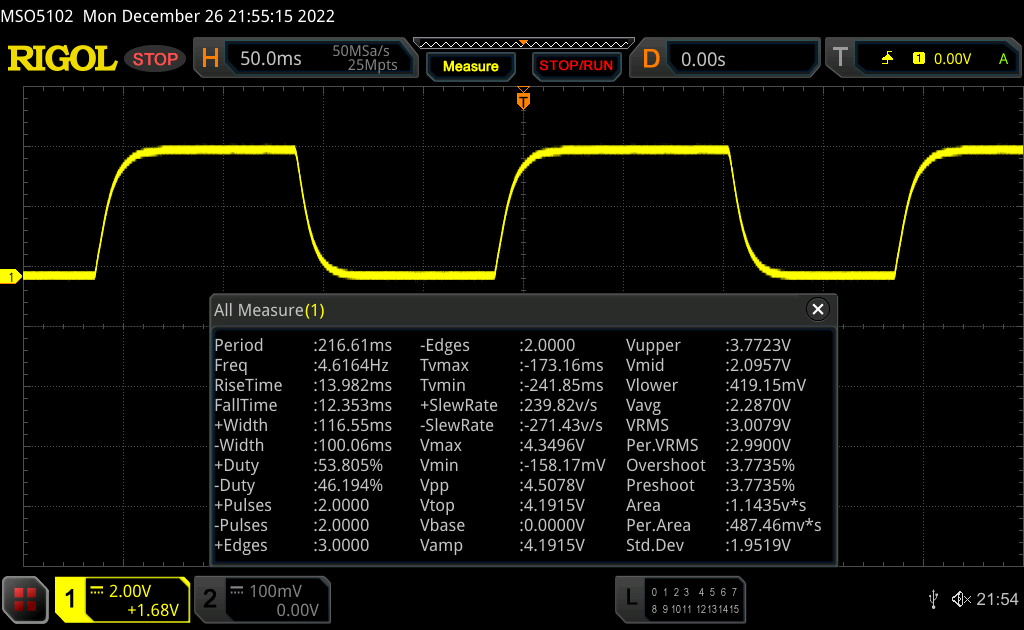 |
| ↘ 12.3 ms queda | ||
| A tela mostra taxas de resposta relativamente lentas em nossos testes e pode ser muito lenta para os jogadores. Em comparação, todos os dispositivos testados variam de 0.1 (mínimo) a 240 (máximo) ms. » 66 % de todos os dispositivos são melhores. Isso significa que o tempo de resposta medido é pior que a média de todos os dispositivos testados (19.8 ms). | ||
| ↔ Tempo de resposta 50% cinza a 80% cinza | ||
| 37.7 ms ... ascensão ↗ e queda ↘ combinadas | ↗ 18.6 ms ascensão | 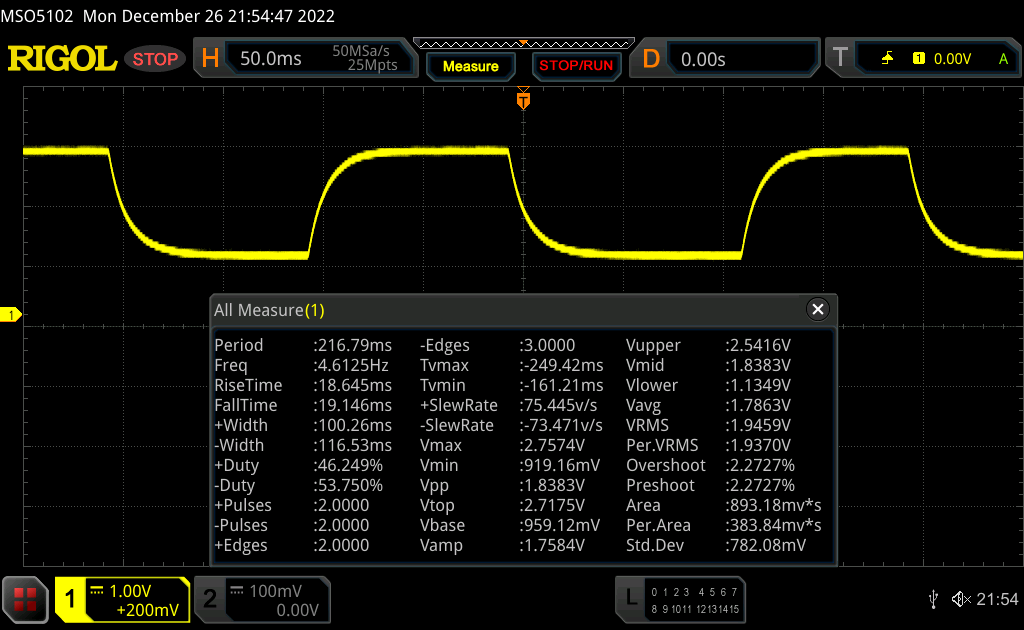 |
| ↘ 19.1 ms queda | ||
| A tela mostra taxas de resposta lentas em nossos testes e será insatisfatória para os jogadores. Em comparação, todos os dispositivos testados variam de 0.165 (mínimo) a 636 (máximo) ms. » 55 % de todos os dispositivos são melhores. Isso significa que o tempo de resposta medido é pior que a média de todos os dispositivos testados (31 ms). | ||
Cintilação da tela / PWM (modulação por largura de pulso)
| Tela tremeluzindo / PWM não detectado | 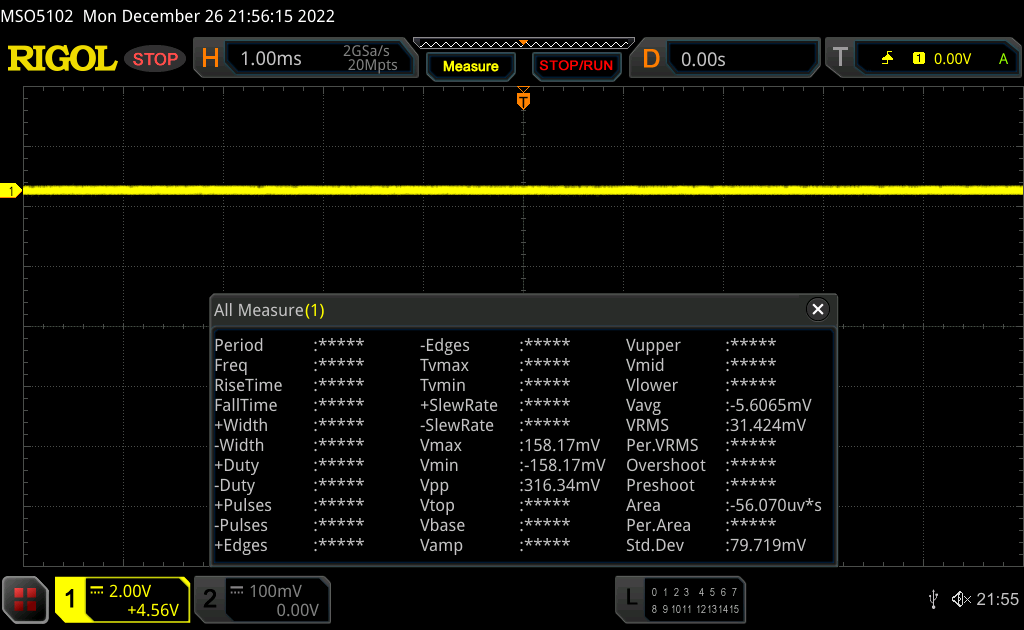 | ||
[pwm_comparison] Em comparação: 52 % de todos os dispositivos testados não usam PWM para escurecer a tela. Se PWM foi detectado, uma média de 7757 (mínimo: 5 - máximo: 343500) Hz foi medida. | |||
Desempenho: Uma CPU Intel poderosa e uma GPU Nvidia bastante fraca
A Lenovo oferece o ThinkPad P16 G1 em uma ampla variedade de configurações. Todos contêm um processador Intel da série Alder Lake HX, sendo as opções oIntel Core i5-12600HX, i7-12800HX, i7-12850HX, i9-12900HXbem como oi9-12950HX. Infelizmente, as CPUs Xeon não estão mais disponíveis e seu trabalho agora está sendo feito pelas CPUs que terminam em 50. Como a Lenovo não solda suas CPUs, cada um destes processadores pode ser configurado com uma das seguintes CPUs: Intel ARC Pro A30M, Nvidia RTX A1000, RTX A2000, RTX A3000, RTX A4500 e RTX A5500.
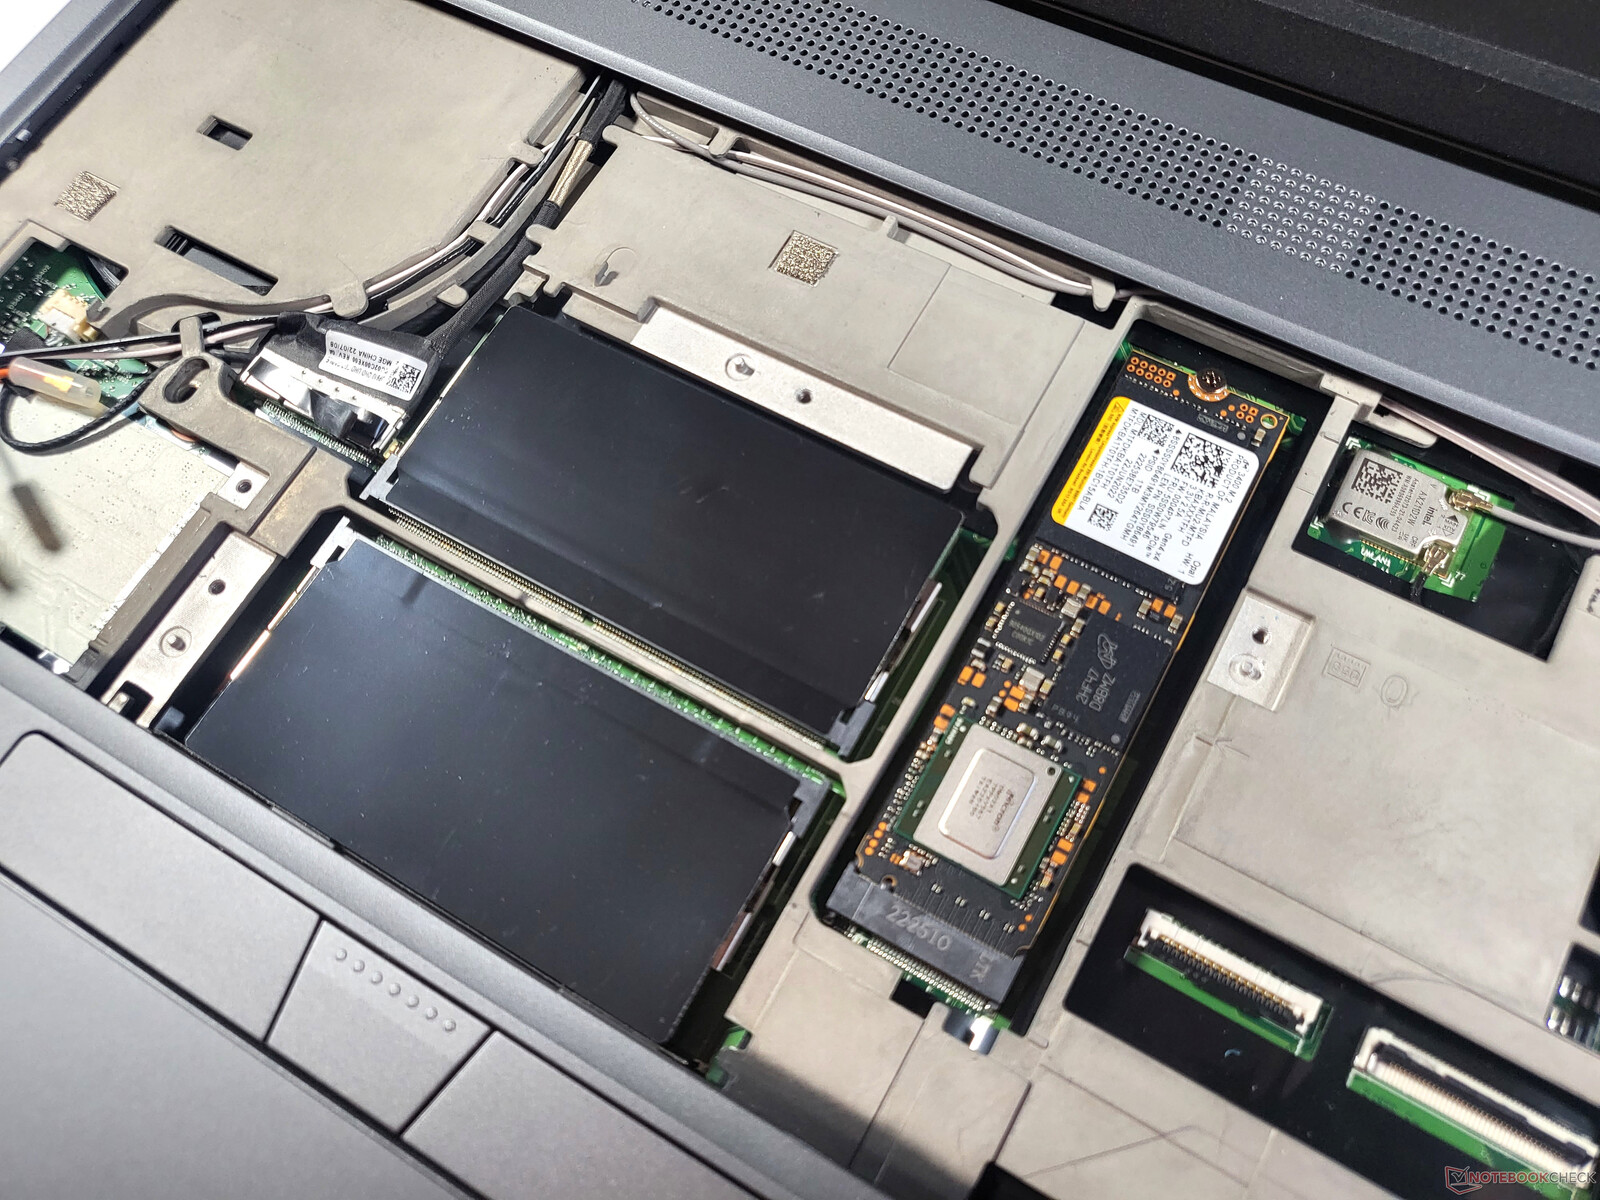
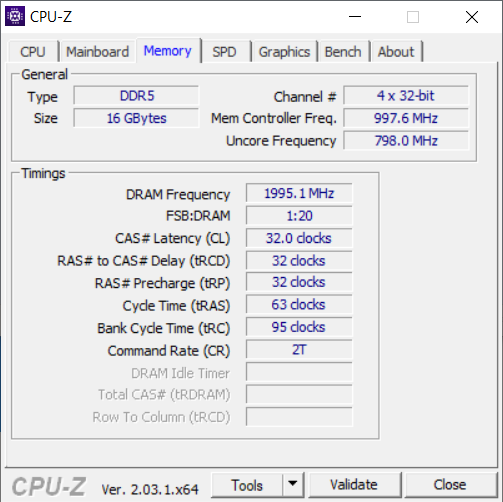
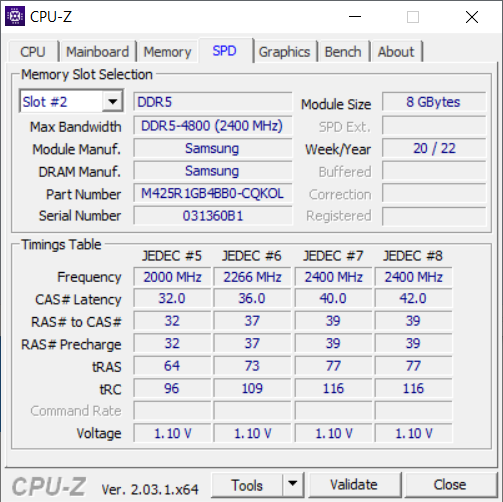
As possíveis variações não terminam aqui, pois o Lenovo ThinkPad P16 G1 tem quatro slots de RAM. Isso torna possível ter até 128 GB de RAM DDR5-3600, onde também a RAM ECC está disponível para 50 CPUs modelo. Há um total de dois slots SSD e ambos podem aceitar M.2 2280 SSDs. A capacidade máxima de armazenamento em massa que a Lenovo vende em seu laptop ThinkPad é de até oito terabytes e vem na forma de dois SSDs de 4 terabytes.
Condições de teste
A Lenovo usa os próprios modos de potência do Windows para seus modos de potência ThinkPads. Por um curto período, o processador pode consumir até 125 watts, mas é limitado a 95 watts por períodos mais longos. Se for selecionado o modo de potência "Melhor Desempenho" em vez de "Melhor Desempenho", o consumo se situa brevemente em 100 watts e 80 watts sob carga contínua. Usando o modo "Mais Eficiência da Bateria", as limitações são consideravelmente mais severas com o turbo a 70 watts e o consumo sustentado sentado a 30 watts. Além do teste de bateria WiFi, nossos testes foram realizados usando o modo "Melhor Desempenho".
Uma característica especial de nosso dispositivo de revisão: Ele ainda vem com o Windows 10 Pro. Para a maioria dos testes, isto não é um problema, mas esta versão mais antiga do Windows foi responsável por uma pontuação muito baixa no Cinebench R15. Por esta razão, decidimos contra o loop do Cinebench R15 com este dispositivo.
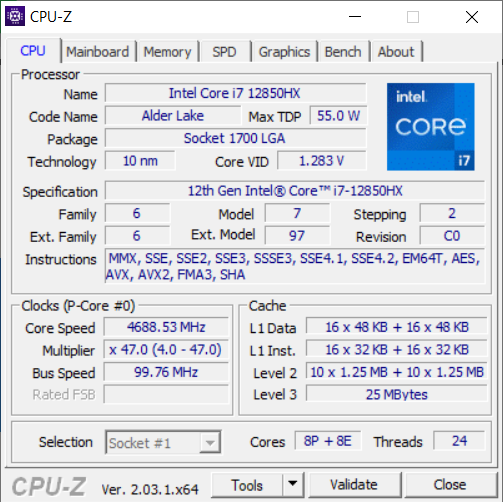
Processador
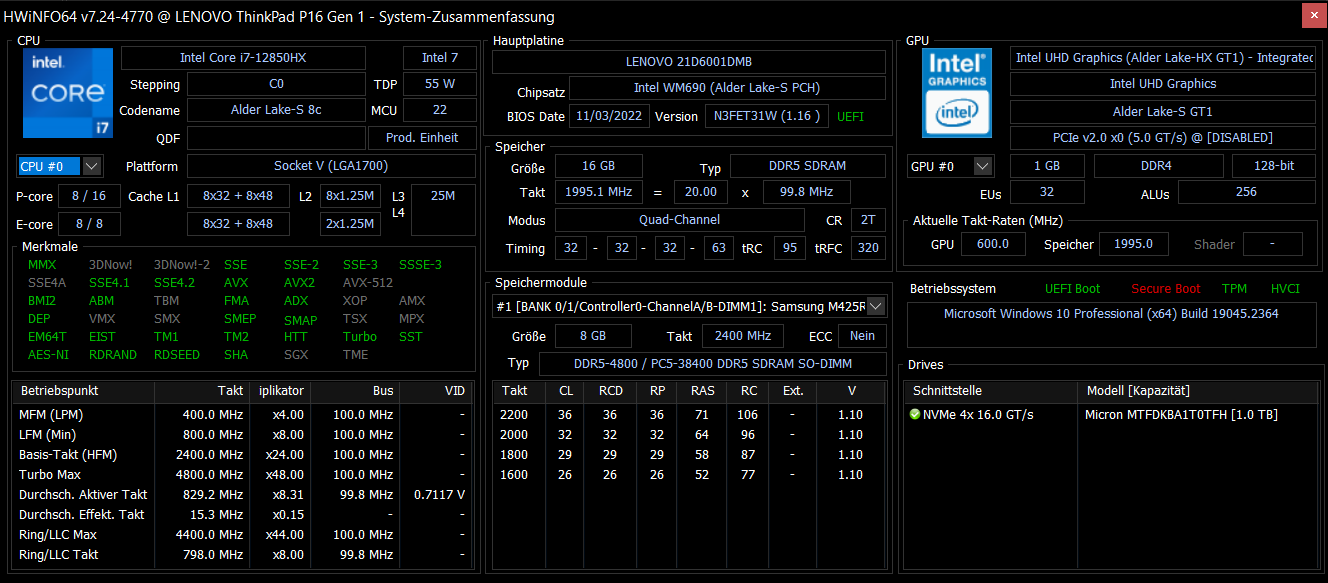
OIntel Core i7-12850HXé um processador com um total de 16 núcleos. Como a arquitetura do "Lago Alder" possui uma estrutura assimétrica, oito desses núcleos são os poderosos núcleos P (2,1 a 4,8 GHz), sendo os outros oito núcleos os eficientes núcleos E (1,5 a 3,4 GHz). Graças à hyperthreading, o processador possui mais de 24 fios. Como membro da série HX55, o típico TDP paira em torno de 55 watts. Para comparações detalhadas com outros processadores atuais, verifique nosso Lista de CPU.
O desempenho da CPU do sistema é excelente e acima da média para este processador. O ThinkPad P16 bate o Dell Precision 7670 de forma bastante convincente. Entretanto, o Asus ExpertBook B6 Flip é mais rápido graças a seu i9. Curiosamente, o X1 Extreme G5 está quase no mesmo nível do P16, embora tenha apenas os seis núcleos P. Em comparação com o P15 G2 e P17 G2, o desempenho da CPU é cerca de 31 a 35 % melhor
.No modo de bateria, o ThinkPad P16 marcou 14,844 pontos no Cinebench R23. Sem uma unidade de alimentação conectada, o desempenho da CPU é cerca de 15% menor.
Cinebench R23 Multi Endurance Test
Cinebench R23: Multi Core | Single Core
Cinebench R20: CPU (Multi Core) | CPU (Single Core)
Cinebench R15: CPU Multi 64Bit | CPU Single 64Bit
Blender: v2.79 BMW27 CPU
7-Zip 18.03: 7z b 4 | 7z b 4 -mmt1
Geekbench 5.5: Multi-Core | Single-Core
HWBOT x265 Benchmark v2.2: 4k Preset
LibreOffice : 20 Documents To PDF
R Benchmark 2.5: Overall mean
| CPU Performance rating | |
| Média da turma Workstation | |
| Asus ExpertBook B6 Flip B6602FC2 | |
| Lenovo ThinkPad P16 G1 21D6001DMB | |
| Lenovo ThinkPad X1 Extreme G5-21DE003RGE | |
| Média Intel Core i7-12850HX | |
| Dell Precision 7670 | |
| HP ZBook Fury 17 G8-4A6A9EA | |
| Lenovo ThinkPad Z16 G1 21D5S00T00 | |
| Lenovo ThinkPad P17 G2-20YU0025G | |
| Lenovo ThinkPad P15 G2-20YQ001JGE | |
| Cinebench R23 / Multi Core | |
| Média da turma Workstation (14621 - 38520, n=23, últimos 2 anos) | |
| Asus ExpertBook B6 Flip B6602FC2 | |
| Lenovo ThinkPad X1 Extreme G5-21DE003RGE | |
| Lenovo ThinkPad P16 G1 21D6001DMB | |
| Média Intel Core i7-12850HX (15093 - 17510, n=2) | |
| Dell Precision 7670 | |
| HP ZBook Fury 17 G8-4A6A9EA | |
| Lenovo ThinkPad P17 G2-20YU0025G | |
| Lenovo ThinkPad Z16 G1 21D5S00T00 | |
| Lenovo ThinkPad P15 G2-20YQ001JGE | |
| Cinebench R23 / Single Core | |
| Média da turma Workstation (1712 - 2228, n=23, últimos 2 anos) | |
| Asus ExpertBook B6 Flip B6602FC2 | |
| Lenovo ThinkPad P16 G1 21D6001DMB | |
| Lenovo ThinkPad X1 Extreme G5-21DE003RGE | |
| Média Intel Core i7-12850HX (1596 - 1845, n=2) | |
| HP ZBook Fury 17 G8-4A6A9EA | |
| Dell Precision 7670 | |
| Lenovo ThinkPad P17 G2-20YU0025G | |
| Lenovo ThinkPad P15 G2-20YQ001JGE | |
| Lenovo ThinkPad Z16 G1 21D5S00T00 | |
| Cinebench R20 / CPU (Multi Core) | |
| Média da turma Workstation (5760 - 15043, n=23, últimos 2 anos) | |
| Asus ExpertBook B6 Flip B6602FC2 | |
| Lenovo ThinkPad X1 Extreme G5-21DE003RGE | |
| Lenovo ThinkPad P16 G1 21D6001DMB | |
| Média Intel Core i7-12850HX (6217 - 6764, n=2) | |
| Dell Precision 7670 | |
| Lenovo ThinkPad P17 G2-20YU0025G | |
| HP ZBook Fury 17 G8-4A6A9EA | |
| Lenovo ThinkPad Z16 G1 21D5S00T00 | |
| Lenovo ThinkPad P15 G2-20YQ001JGE | |
| Cinebench R20 / CPU (Single Core) | |
| Média da turma Workstation (671 - 857, n=23, últimos 2 anos) | |
| Asus ExpertBook B6 Flip B6602FC2 | |
| Lenovo ThinkPad P16 G1 21D6001DMB | |
| Lenovo ThinkPad X1 Extreme G5-21DE003RGE | |
| Média Intel Core i7-12850HX (687 - 708, n=2) | |
| Dell Precision 7670 | |
| HP ZBook Fury 17 G8-4A6A9EA | |
| Lenovo ThinkPad Z16 G1 21D5S00T00 | |
| Lenovo ThinkPad P17 G2-20YU0025G | |
| Lenovo ThinkPad P15 G2-20YQ001JGE | |
| Cinebench R15 / CPU Multi 64Bit | |
| Média da turma Workstation (2489 - 5810, n=23, últimos 2 anos) | |
| Asus ExpertBook B6 Flip B6602FC2 | |
| Lenovo ThinkPad P16 G1 21D6001DMB | |
| Lenovo ThinkPad X1 Extreme G5-21DE003RGE | |
| Média Intel Core i7-12850HX (2432 - 2926, n=2) | |
| Dell Precision 7670 | |
| Lenovo ThinkPad P17 G2-20YU0025G | |
| HP ZBook Fury 17 G8-4A6A9EA | |
| Lenovo ThinkPad Z16 G1 21D5S00T00 | |
| Lenovo ThinkPad P15 G2-20YQ001JGE | |
| Cinebench R15 / CPU Single 64Bit | |
| Média da turma Workstation (191.4 - 328, n=23, últimos 2 anos) | |
| Asus ExpertBook B6 Flip B6602FC2 | |
| Lenovo ThinkPad P16 G1 21D6001DMB | |
| Média Intel Core i7-12850HX (253 - 268, n=2) | |
| Lenovo ThinkPad X1 Extreme G5-21DE003RGE | |
| Dell Precision 7670 | |
| HP ZBook Fury 17 G8-4A6A9EA | |
| Lenovo ThinkPad Z16 G1 21D5S00T00 | |
| Lenovo ThinkPad P17 G2-20YU0025G | |
| Lenovo ThinkPad P15 G2-20YQ001JGE | |
| Blender / v2.79 BMW27 CPU | |
| Lenovo ThinkPad P15 G2-20YQ001JGE | |
| Lenovo ThinkPad P17 G2-20YU0025G | |
| HP ZBook Fury 17 G8-4A6A9EA | |
| Lenovo ThinkPad Z16 G1 21D5S00T00 | |
| Dell Precision 7670 | |
| Média Intel Core i7-12850HX (181 - 205, n=2) | |
| Asus ExpertBook B6 Flip B6602FC2 | |
| Lenovo ThinkPad X1 Extreme G5-21DE003RGE | |
| Lenovo ThinkPad P16 G1 21D6001DMB | |
| Média da turma Workstation (91 - 222, n=23, últimos 2 anos) | |
| 7-Zip 18.03 / 7z b 4 | |
| Média da turma Workstation (60489 - 116969, n=23, últimos 2 anos) | |
| Asus ExpertBook B6 Flip B6602FC2 | |
| Lenovo ThinkPad P16 G1 21D6001DMB | |
| Lenovo ThinkPad X1 Extreme G5-21DE003RGE | |
| Média Intel Core i7-12850HX (53893 - 69464, n=2) | |
| Lenovo ThinkPad Z16 G1 21D5S00T00 | |
| Dell Precision 7670 | |
| HP ZBook Fury 17 G8-4A6A9EA | |
| Lenovo ThinkPad P15 G2-20YQ001JGE | |
| Lenovo ThinkPad P17 G2-20YU0025G | |
| 7-Zip 18.03 / 7z b 4 -mmt1 | |
| Média da turma Workstation (5126 - 6960, n=23, últimos 2 anos) | |
| Asus ExpertBook B6 Flip B6602FC2 | |
| HP ZBook Fury 17 G8-4A6A9EA | |
| Lenovo ThinkPad P16 G1 21D6001DMB | |
| Lenovo ThinkPad X1 Extreme G5-21DE003RGE | |
| Média Intel Core i7-12850HX (5608 - 5916, n=2) | |
| Dell Precision 7670 | |
| Lenovo ThinkPad P15 G2-20YQ001JGE | |
| Lenovo ThinkPad P17 G2-20YU0025G | |
| Lenovo ThinkPad Z16 G1 21D5S00T00 | |
| Geekbench 5.5 / Multi-Core | |
| Média da turma Workstation (11542 - 25554, n=23, últimos 2 anos) | |
| Asus ExpertBook B6 Flip B6602FC2 | |
| Lenovo ThinkPad P16 G1 21D6001DMB | |
| Média Intel Core i7-12850HX (11509 - 13095, n=2) | |
| Lenovo ThinkPad X1 Extreme G5-21DE003RGE | |
| Dell Precision 7670 | |
| Lenovo ThinkPad P15 G2-20YQ001JGE | |
| Lenovo ThinkPad Z16 G1 21D5S00T00 | |
| HP ZBook Fury 17 G8-4A6A9EA | |
| Lenovo ThinkPad P17 G2-20YU0025G | |
| Geekbench 5.5 / Single-Core | |
| Média da turma Workstation (1783 - 2183, n=23, últimos 2 anos) | |
| Asus ExpertBook B6 Flip B6602FC2 | |
| Lenovo ThinkPad X1 Extreme G5-21DE003RGE | |
| Lenovo ThinkPad P16 G1 21D6001DMB | |
| Média Intel Core i7-12850HX (1777 - 1787, n=2) | |
| Dell Precision 7670 | |
| HP ZBook Fury 17 G8-4A6A9EA | |
| Lenovo ThinkPad P15 G2-20YQ001JGE | |
| Lenovo ThinkPad P17 G2-20YU0025G | |
| Lenovo ThinkPad Z16 G1 21D5S00T00 | |
| HWBOT x265 Benchmark v2.2 / 4k Preset | |
| Média da turma Workstation (17.8 - 40.5, n=23, últimos 2 anos) | |
| Asus ExpertBook B6 Flip B6602FC2 | |
| Dell Precision 7670 | |
| Média Intel Core i7-12850HX (17.2 - 17.3, n=2) | |
| Lenovo ThinkPad P16 G1 21D6001DMB | |
| Lenovo ThinkPad X1 Extreme G5-21DE003RGE | |
| Lenovo ThinkPad Z16 G1 21D5S00T00 | |
| Lenovo ThinkPad P17 G2-20YU0025G | |
| HP ZBook Fury 17 G8-4A6A9EA | |
| Lenovo ThinkPad P15 G2-20YQ001JGE | |
| LibreOffice / 20 Documents To PDF | |
| HP ZBook Fury 17 G8-4A6A9EA | |
| Lenovo ThinkPad P17 G2-20YU0025G | |
| Lenovo ThinkPad Z16 G1 21D5S00T00 | |
| Dell Precision 7670 | |
| Lenovo ThinkPad P15 G2-20YQ001JGE | |
| Média Intel Core i7-12850HX (46.9 - 48.6, n=2) | |
| Média da turma Workstation (37.1 - 74.7, n=23, últimos 2 anos) | |
| Lenovo ThinkPad P16 G1 21D6001DMB | |
| Asus ExpertBook B6 Flip B6602FC2 | |
| Lenovo ThinkPad X1 Extreme G5-21DE003RGE | |
| R Benchmark 2.5 / Overall mean | |
| Lenovo ThinkPad P17 G2-20YU0025G | |
| Lenovo ThinkPad P15 G2-20YQ001JGE | |
| HP ZBook Fury 17 G8-4A6A9EA | |
| Lenovo ThinkPad Z16 G1 21D5S00T00 | |
| Dell Precision 7670 | |
| Lenovo ThinkPad X1 Extreme G5-21DE003RGE | |
| Média Intel Core i7-12850HX (0.45 - 0.4698, n=2) | |
| Asus ExpertBook B6 Flip B6602FC2 | |
| Lenovo ThinkPad P16 G1 21D6001DMB | |
| Média da turma Workstation (0.3825 - 0.603, n=23, últimos 2 anos) | |
* ... menor é melhor
AIDA64: FP32 Ray-Trace | FPU Julia | CPU SHA3 | CPU Queen | FPU SinJulia | FPU Mandel | CPU AES | CPU ZLib | FP64 Ray-Trace | CPU PhotoWorxx
| Performance rating | |
| Média da turma Workstation | |
| Lenovo ThinkPad P16 G1 21D6001DMB | |
| Asus ExpertBook B6 Flip B6602FC2 | |
| Média Intel Core i7-12850HX | |
| HP ZBook Fury 17 G8-4A6A9EA | |
| Dell Precision 7670 | |
| AIDA64 / FP32 Ray-Trace | |
| Média da turma Workstation (16730 - 61611, n=23, últimos 2 anos) | |
| Lenovo ThinkPad P16 G1 21D6001DMB | |
| Asus ExpertBook B6 Flip B6602FC2 | |
| HP ZBook Fury 17 G8-4A6A9EA | |
| Média Intel Core i7-12850HX (12983 - 16752, n=2) | |
| Dell Precision 7670 | |
| AIDA64 / FPU Julia | |
| Média da turma Workstation (89597 - 186971, n=23, últimos 2 anos) | |
| Lenovo ThinkPad P16 G1 21D6001DMB | |
| Asus ExpertBook B6 Flip B6602FC2 | |
| Média Intel Core i7-12850HX (68219 - 87231, n=2) | |
| Dell Precision 7670 | |
| HP ZBook Fury 17 G8-4A6A9EA | |
| AIDA64 / CPU SHA3 | |
| Média da turma Workstation (4178 - 8975, n=23, últimos 2 anos) | |
| HP ZBook Fury 17 G8-4A6A9EA | |
| Lenovo ThinkPad P16 G1 21D6001DMB | |
| Asus ExpertBook B6 Flip B6602FC2 | |
| Média Intel Core i7-12850HX (3098 - 3818, n=2) | |
| Dell Precision 7670 | |
| AIDA64 / CPU Queen | |
| Média da turma Workstation (60778 - 144411, n=23, últimos 2 anos) | |
| Asus ExpertBook B6 Flip B6602FC2 | |
| HP ZBook Fury 17 G8-4A6A9EA | |
| Lenovo ThinkPad P16 G1 21D6001DMB | |
| Média Intel Core i7-12850HX (26716 - 95664, n=2) | |
| Dell Precision 7670 | |
| AIDA64 / FPU SinJulia | |
| Média da turma Workstation (8165 - 29343, n=23, últimos 2 anos) | |
| Lenovo ThinkPad P16 G1 21D6001DMB | |
| Asus ExpertBook B6 Flip B6602FC2 | |
| Média Intel Core i7-12850HX (9869 - 11286, n=2) | |
| HP ZBook Fury 17 G8-4A6A9EA | |
| Dell Precision 7670 | |
| AIDA64 / FPU Mandel | |
| Média da turma Workstation (44497 - 98153, n=23, últimos 2 anos) | |
| Lenovo ThinkPad P16 G1 21D6001DMB | |
| Asus ExpertBook B6 Flip B6602FC2 | |
| HP ZBook Fury 17 G8-4A6A9EA | |
| Média Intel Core i7-12850HX (34218 - 42580, n=2) | |
| Dell Precision 7670 | |
| AIDA64 / CPU AES | |
| Média da turma Workstation (73133 - 187841, n=23, últimos 2 anos) | |
| HP ZBook Fury 17 G8-4A6A9EA | |
| Lenovo ThinkPad P16 G1 21D6001DMB | |
| Asus ExpertBook B6 Flip B6602FC2 | |
| Média Intel Core i7-12850HX (63362 - 80775, n=2) | |
| Dell Precision 7670 | |
| AIDA64 / CPU ZLib | |
| Média da turma Workstation (929 - 2148, n=23, últimos 2 anos) | |
| Lenovo ThinkPad P16 G1 21D6001DMB | |
| Asus ExpertBook B6 Flip B6602FC2 | |
| Média Intel Core i7-12850HX (817 - 1102, n=2) | |
| Dell Precision 7670 | |
| HP ZBook Fury 17 G8-4A6A9EA | |
| AIDA64 / FP64 Ray-Trace | |
| Média da turma Workstation (8545 - 32891, n=23, últimos 2 anos) | |
| Lenovo ThinkPad P16 G1 21D6001DMB | |
| Asus ExpertBook B6 Flip B6602FC2 | |
| HP ZBook Fury 17 G8-4A6A9EA | |
| Média Intel Core i7-12850HX (7671 - 9145, n=2) | |
| Dell Precision 7670 | |
| AIDA64 / CPU PhotoWorxx | |
| Média da turma Workstation (37151 - 93684, n=23, últimos 2 anos) | |
| Dell Precision 7670 | |
| Média Intel Core i7-12850HX (33415 - 42035, n=2) | |
| Asus ExpertBook B6 Flip B6602FC2 | |
| Lenovo ThinkPad P16 G1 21D6001DMB | |
| HP ZBook Fury 17 G8-4A6A9EA | |
Desempenho do sistema
Embora a pontuação PCMark 10 seja comparativamente mais baixa, o Lenovo ThinkPad P16 G1 oferece muito bom desempenho no uso diário - algo que é lógico considerando os componentes poderosos. Assim, o CrossMark acaba sendo consideravelmente melhor.
CrossMark: Overall | Productivity | Creativity | Responsiveness
| PCMark 10 / Score | |
| Média da turma Workstation (6563 - 10409, n=19, últimos 2 anos) | |
| Asus ExpertBook B6 Flip B6602FC2 | |
| Dell Precision 7670 | |
| Lenovo ThinkPad P15 G2-20YQ001JGE | |
| Média Intel Core i7-12850HX, NVIDIA RTX A2000 Laptop GPU (6226 - 6663, n=2) | |
| Lenovo ThinkPad P17 G2-20YU0025G | |
| Lenovo ThinkPad P16 G1 21D6001DMB | |
| HP ZBook Fury 17 G8-4A6A9EA | |
| PCMark 10 / Essentials | |
| Asus ExpertBook B6 Flip B6602FC2 | |
| Dell Precision 7670 | |
| Média da turma Workstation (9622 - 11157, n=19, últimos 2 anos) | |
| Média Intel Core i7-12850HX, NVIDIA RTX A2000 Laptop GPU (10128 - 10555, n=2) | |
| Lenovo ThinkPad P15 G2-20YQ001JGE | |
| Lenovo ThinkPad P16 G1 21D6001DMB | |
| Lenovo ThinkPad P17 G2-20YU0025G | |
| HP ZBook Fury 17 G8-4A6A9EA | |
| PCMark 10 / Productivity | |
| Média da turma Workstation (8789 - 20616, n=19, últimos 2 anos) | |
| Asus ExpertBook B6 Flip B6602FC2 | |
| Lenovo ThinkPad P16 G1 21D6001DMB | |
| Média Intel Core i7-12850HX, NVIDIA RTX A2000 Laptop GPU (9008 - 9349, n=2) | |
| Dell Precision 7670 | |
| Lenovo ThinkPad P15 G2-20YQ001JGE | |
| Lenovo ThinkPad P17 G2-20YU0025G | |
| HP ZBook Fury 17 G8-4A6A9EA | |
| PCMark 10 / Digital Content Creation | |
| Média da turma Workstation (8108 - 15631, n=19, últimos 2 anos) | |
| HP ZBook Fury 17 G8-4A6A9EA | |
| Asus ExpertBook B6 Flip B6602FC2 | |
| Lenovo ThinkPad P15 G2-20YQ001JGE | |
| Lenovo ThinkPad P17 G2-20YU0025G | |
| Dell Precision 7670 | |
| Média Intel Core i7-12850HX, NVIDIA RTX A2000 Laptop GPU (6918 - 8443, n=2) | |
| Lenovo ThinkPad P16 G1 21D6001DMB | |
| CrossMark / Overall | |
| Asus ExpertBook B6 Flip B6602FC2 | |
| Média da turma Workstation (1307 - 2267, n=22, últimos 2 anos) | |
| Lenovo ThinkPad P16 G1 21D6001DMB | |
| Média Intel Core i7-12850HX, NVIDIA RTX A2000 Laptop GPU (1509 - 1720, n=2) | |
| Dell Precision 7670 | |
| HP ZBook Fury 17 G8-4A6A9EA | |
| CrossMark / Productivity | |
| Asus ExpertBook B6 Flip B6602FC2 | |
| Média da turma Workstation (1130 - 2122, n=22, últimos 2 anos) | |
| Lenovo ThinkPad P16 G1 21D6001DMB | |
| Média Intel Core i7-12850HX, NVIDIA RTX A2000 Laptop GPU (1445 - 1611, n=2) | |
| HP ZBook Fury 17 G8-4A6A9EA | |
| Dell Precision 7670 | |
| CrossMark / Creativity | |
| Média da turma Workstation (1657 - 2725, n=22, últimos 2 anos) | |
| Asus ExpertBook B6 Flip B6602FC2 | |
| Lenovo ThinkPad P16 G1 21D6001DMB | |
| Média Intel Core i7-12850HX, NVIDIA RTX A2000 Laptop GPU (1682 - 1943, n=2) | |
| Dell Precision 7670 | |
| HP ZBook Fury 17 G8-4A6A9EA | |
| CrossMark / Responsiveness | |
| Asus ExpertBook B6 Flip B6602FC2 | |
| Média da turma Workstation (993 - 2096, n=22, últimos 2 anos) | |
| Lenovo ThinkPad P16 G1 21D6001DMB | |
| Média Intel Core i7-12850HX, NVIDIA RTX A2000 Laptop GPU (1238 - 1454, n=2) | |
| Dell Precision 7670 | |
| HP ZBook Fury 17 G8-4A6A9EA | |
| PCMark 10 Score | 6226 pontos | |
Ajuda | ||
| AIDA64 / Memory Copy | |
| Média da turma Workstation (56003 - 164795, n=23, últimos 2 anos) | |
| Dell Precision 7670 | |
| Asus ExpertBook B6 Flip B6602FC2 | |
| Média Intel Core i7-12850HX (53840 - 62841, n=2) | |
| Lenovo ThinkPad P16 G1 21D6001DMB | |
| HP ZBook Fury 17 G8-4A6A9EA | |
| AIDA64 / Memory Read | |
| Média da turma Workstation (55795 - 121563, n=23, últimos 2 anos) | |
| Dell Precision 7670 | |
| Média Intel Core i7-12850HX (58944 - 68747, n=2) | |
| Asus ExpertBook B6 Flip B6602FC2 | |
| Lenovo ThinkPad P16 G1 21D6001DMB | |
| HP ZBook Fury 17 G8-4A6A9EA | |
| AIDA64 / Memory Write | |
| Média da turma Workstation (55663 - 214520, n=23, últimos 2 anos) | |
| Dell Precision 7670 | |
| Asus ExpertBook B6 Flip B6602FC2 | |
| Média Intel Core i7-12850HX (52160 - 64365, n=2) | |
| Lenovo ThinkPad P16 G1 21D6001DMB | |
| HP ZBook Fury 17 G8-4A6A9EA | |
| AIDA64 / Memory Latency | |
| Média da turma Workstation (84.5 - 165.2, n=23, últimos 2 anos) | |
| Lenovo ThinkPad P16 G1 21D6001DMB | |
| Asus ExpertBook B6 Flip B6602FC2 | |
| Média Intel Core i7-12850HX (88.5 - 95.4, n=2) | |
| Dell Precision 7670 | |
| HP ZBook Fury 17 G8-4A6A9EA | |
| Lenovo ThinkPad P17 G2-20YU0025G | |
| Lenovo ThinkPad P15 G2-20YQ001JGE | |
* ... menor é melhor
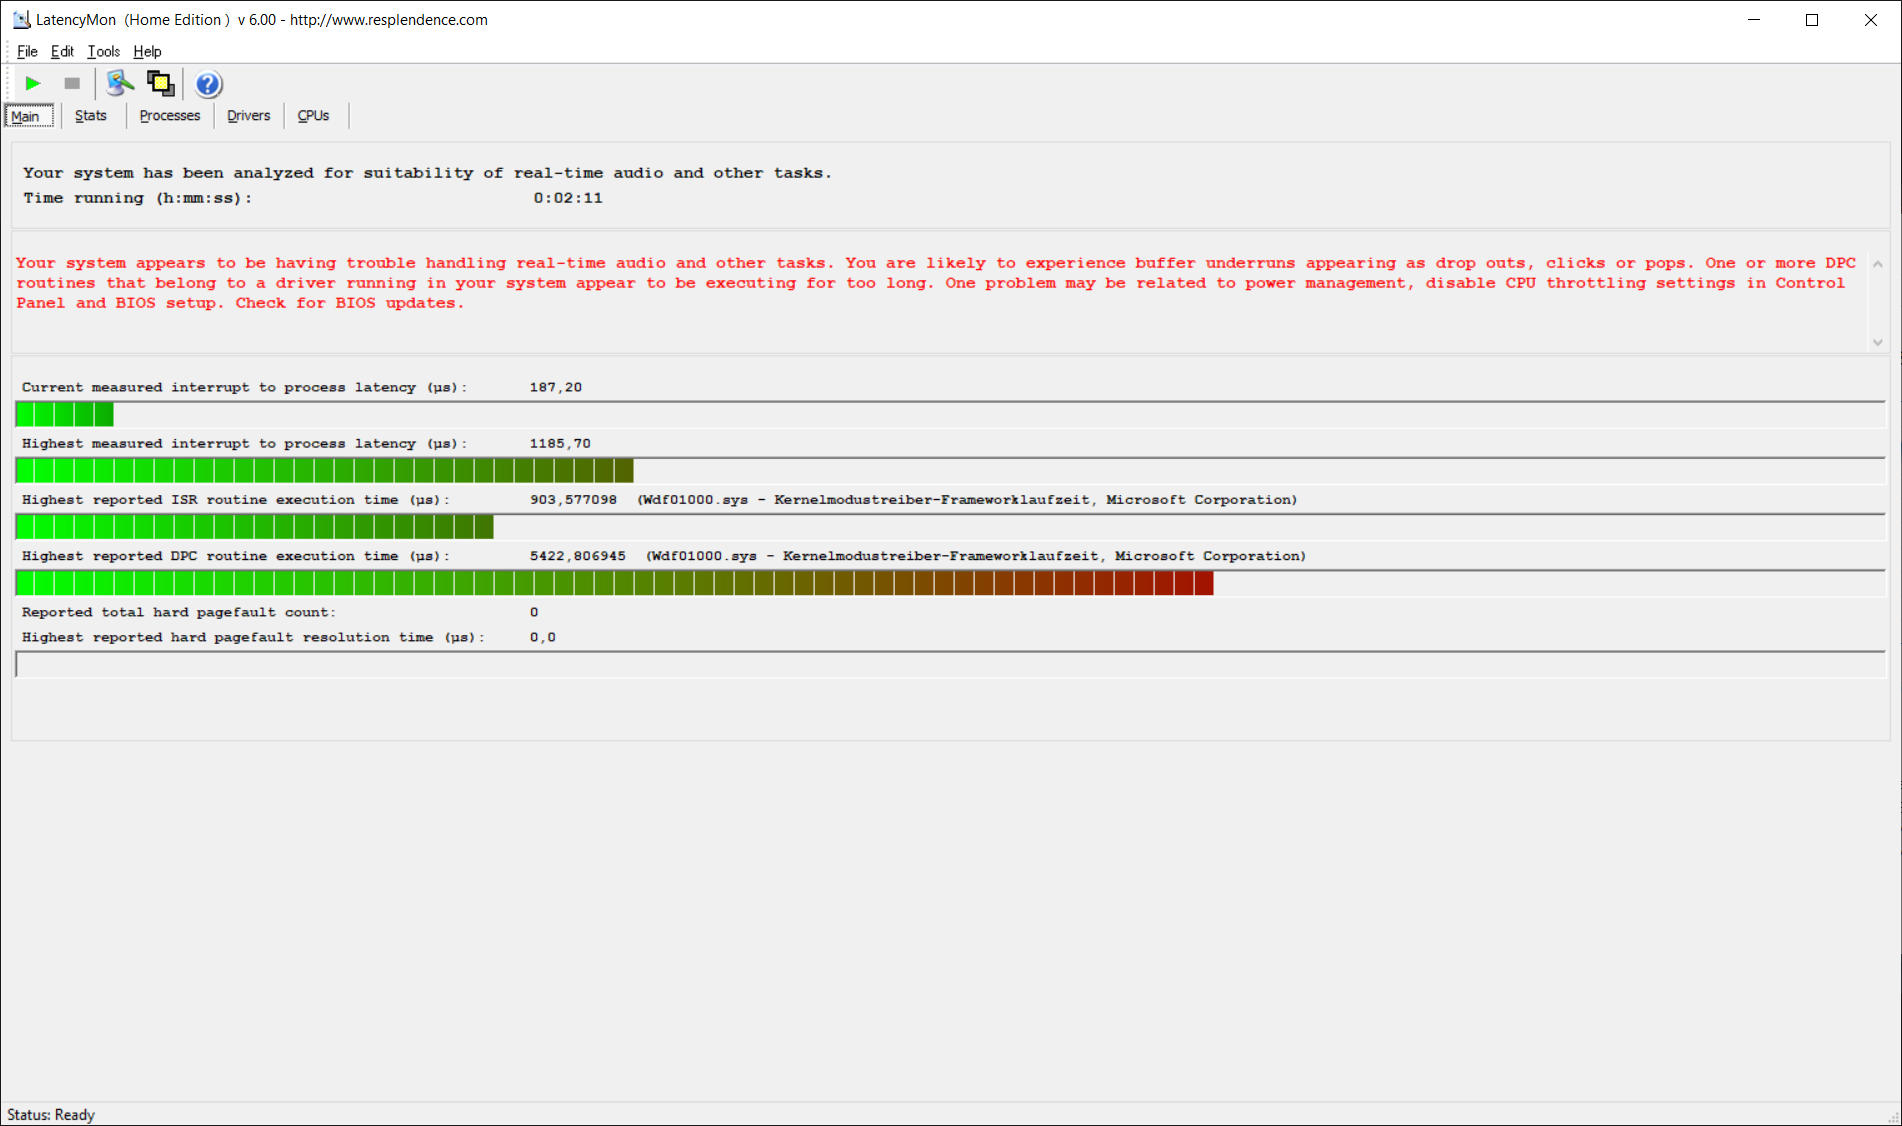
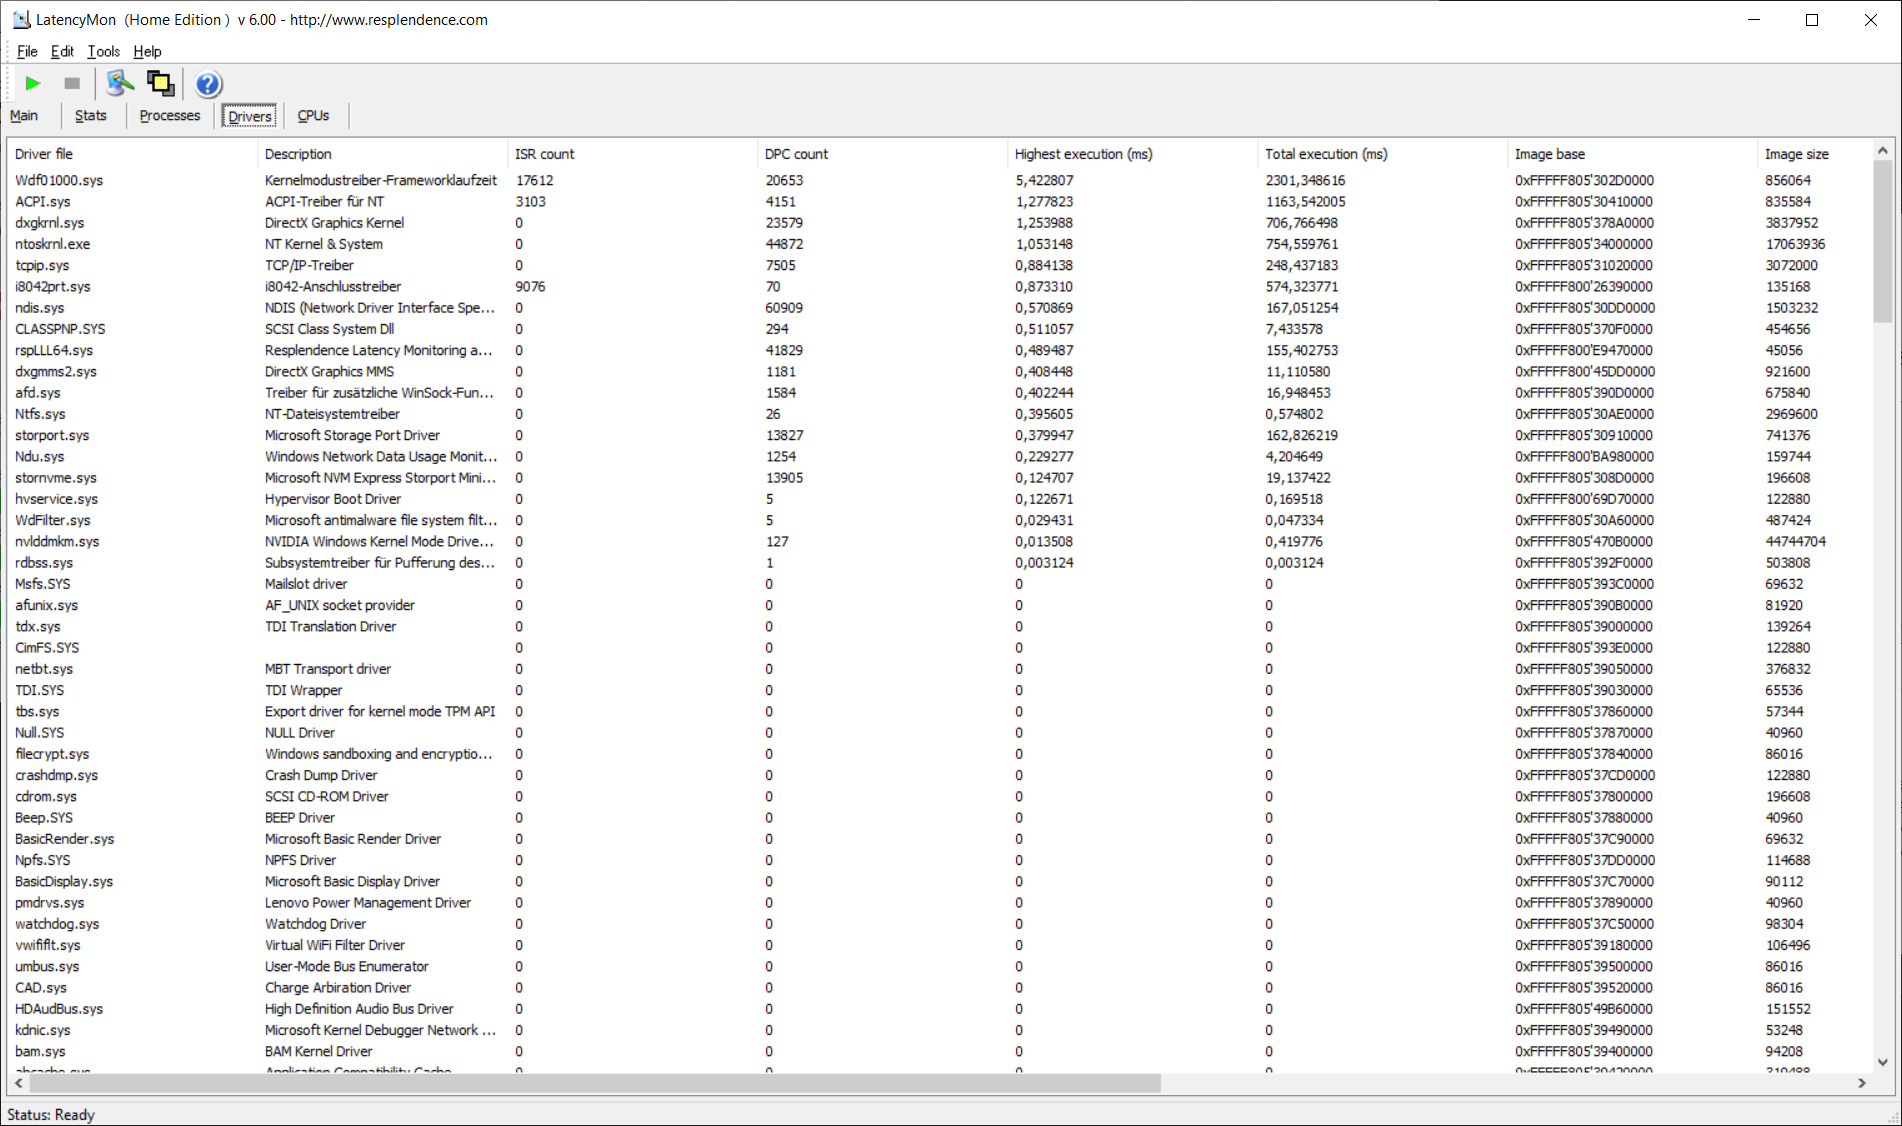
Latências DPC
As latências do DPC são significativamente mais baixas do que seu predecessor, mas ainda muito altas. No entanto, isto pode mudar a qualquer momento com a ajuda de atualizações do motorista.
| DPC Latencies / LatencyMon - interrupt to process latency (max), Web, Youtube, Prime95 | |
| Lenovo ThinkPad P17 G2-20YU0025G | |
| Lenovo ThinkPad P15 G2-20YQ001JGE | |
| Asus ExpertBook B6 Flip B6602FC2 | |
| Dell Precision 7670 | |
| Lenovo ThinkPad P16 G1 21D6001DMB | |
| HP ZBook Studio 16 G9 62U04EA | |
* ... menor é melhor
Armazenamento em massa
O SSD da Lenovo ThinkPad P16 G1 é da Micron, tem capacidade de um terabyte e é um SSD NVMe PCIe 4.0 muito rápido no formato M.2 2280. O SSD é mais lento do que o SSD da Samsung encontrado no Asus ExpertBook, mas mais rápido do que o resto de seus concorrentes.

* ... menor é melhor
Continuous Performance Read: DiskSpd Read Loop, Queue Depth 8
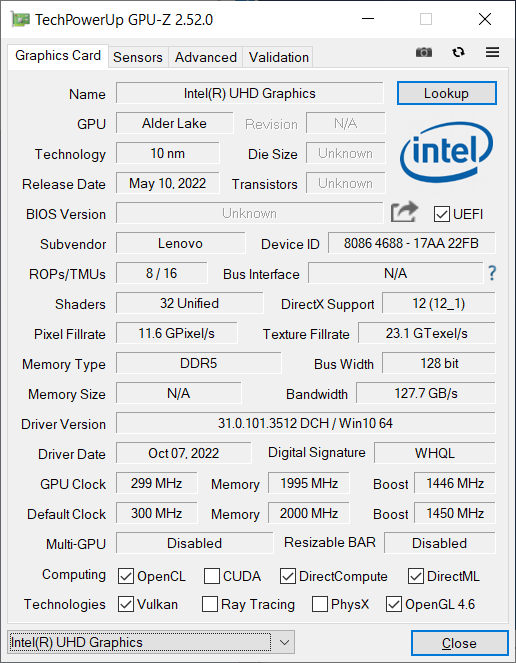
Placa gráfica
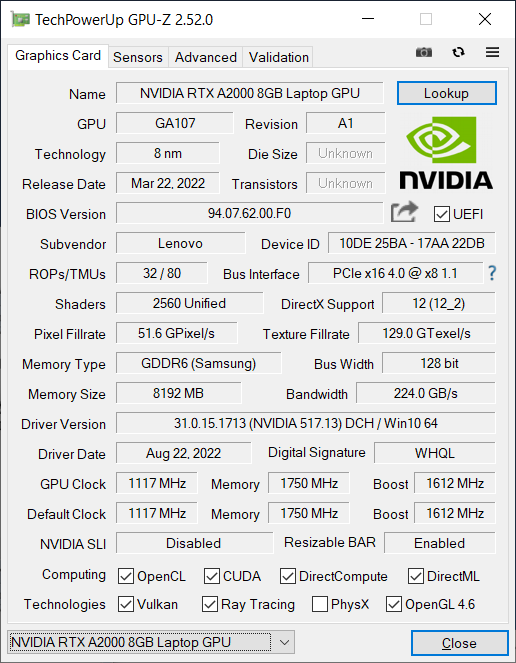
ONvidia RTX A2000 é uma GPU de geração Ampere da série RTX profissional da Nvidia, anteriormente conhecida como "Quadro". As unidades Shader 2560 têm uma velocidade máxima de relógio de 1,678 GHz. O TDP típico para este chip gráfico varia entre 35 e 95 watts; o RTX A2000 tem 8 GB de RAM dedicada anexada a um barramento de memória de 128 bits. OLista de GPUé um excelente recurso para comparações de benchmark com outros chips gráficos.
O RTX A2000 no Lenovo ThinkPad P16 pode consumir até 60 watts, tornando-o uma das opções de nível básico com a próxima melhor GPU, o RTX A3000 capaz de consumir até 115 watts. De acordo com o consumo limitado, o desempenho do RTX A2000 não é particularmente notável. De todas as estações de trabalho comparadas, a Lenovo ThinkPad P16 teve o pior desempenho, independentemente de ter sido no teste 3DMark ou no benchmark SPECviewperf específico da estação de trabalho. Em particular, oDell Precision 7670bem como o Asus ExpertBook B6 Flipa tarifa é melhor com quase as mesmas GPUs que rodam a 90 e 95 watts TDP, respectivamente, nesses laptops.
Este resultado também é refletido no teste do misturador: Nos testes de aceleração da GPU, o ThinkPad P16 G1 é mais lento que a concorrência. No entanto, no teste de CPU Blender, é a estação de trabalho móvel mais rápida.
Como no caso do processador, o desempenho da GPU é limitado no modo de bateria com o desempenho caindo cerca de 15% em comparação com a operação de fornecimento de energia.
| 3DMark 11 Performance | 15998 pontos | |
| 3DMark Cloud Gate Standard Score | 40815 pontos | |
| 3DMark Fire Strike Score | 10381 pontos | |
| 3DMark Time Spy Score | 5184 pontos | |
Ajuda | ||
* ... menor é melhor
Desempenho nos jogos
Como uma estação de trabalho móvel, o Lenovo ThinkPad P16 não é um laptop para jogos. Entretanto, jogos mais novos também são possíveis, se não em 4K. Como nos benchmarks sintéticos, a concorrência direta é mais rápida que a do P16. O baixo TDP é tornado ainda mais difícil pelo fato de que o P16 não consegue manter o desempenho constante da GPU sob carga constante.
| The Witcher 3 - 1920x1080 Ultra Graphics & Postprocessing (HBAO+) | |
| Média da turma Workstation (n=1últimos 2 anos) | |
| Lenovo ThinkPad P15 G2-20YQ001JGE | |
| Asus ExpertBook B6 Flip B6602FC2 | |
| HP ZBook Fury 17 G8-4A6A9EA | |
| Dell Precision 7670 | |
| Lenovo ThinkPad P17 G2-20YU0025G | |
| Lenovo ThinkPad P16 G1 21D6001DMB | |
Witcher 3 FPS diagram
| baixo | média | alto | ultra | QHD | |
|---|---|---|---|---|---|
| The Witcher 3 (2015) | 273 | 150.5 | 79.7 | 43.6 | |
| Dota 2 Reborn (2015) | 177.5 | 160.8 | 149.3 | 139.5 | |
| Final Fantasy XV Benchmark (2018) | 96.7 | 51.9 | 38.3 | 31.1 | |
| X-Plane 11.11 (2018) | 140.3 | 119.2 | 95.6 | ||
| Strange Brigade (2018) | 280 | 118.6 | 91.1 | 77.8 | 54.3 |
Emissões: O ventilador fica alto mas o portátil ThinkPad permanece frio
Emissões sonoras
Quando ociosos, os ventiladores do Lenovo ThinkPad P16 permanecem em silêncio. A 56,3 dB(a) sob carga, eles podem ficar mais barulhentos - ainda mais barulhentos que os equivalentes diretos do laptop. Entretanto, este não é o caso em todas as aplicações. No teste Witcher 3, os ventiladores funcionaram relativamente silenciosos, medindo apenas 34,1 dB(a).
Não conseguimos detectar nenhuma bobina de lamentação no laptop Lenovo.
Barulho
| Ocioso |
| 23.2 / 23.2 / 23.2 dB |
| Carga |
| 47.8 / 56.3 dB |
 | ||
30 dB silencioso 40 dB(A) audível 50 dB(A) ruidosamente alto |
||
min: | ||
| Lenovo ThinkPad P16 G1 21D6001DMB RTX A2000 Laptop GPU, i7-12850HX, Micron 3400 1TB MTFDKBA1T0TFH | Lenovo ThinkPad P15 G2-20YQ001JGE RTX A3000 Laptop GPU, i7-11800H, Kioxia XG7 KXG7AZNV512G | Lenovo ThinkPad P17 G2-20YU0025G RTX A2000 Laptop GPU, i7-11800H, Kioxia XG7 KXG7AZNV512G | HP ZBook Fury 17 G8-4A6A9EA RTX A3000 Laptop GPU, i9-11950H, Toshiba XG6 KXG60ZNV1T02 | Dell Precision 7670 RTX A2000 Laptop GPU, i7-12850HX, SK Hynix HFS001TEJ9X115N | Asus ExpertBook B6 Flip B6602FC2 RTX A2000 Laptop GPU, i9-12950HX, Samsung PM9A1 MZVL21T0HCLR | |
|---|---|---|---|---|---|---|
| Noise | -6% | -4% | -5% | -4% | -22% | |
| desligado / ambiente * (dB) | 23.2 | 24.3 -5% | 26.4 -14% | 24.5 -6% | 22.7 2% | 26 -12% |
| Idle Minimum * (dB) | 23.2 | 24.3 -5% | 26.4 -14% | 24.5 -6% | 22.9 1% | 32.4 -40% |
| Idle Average * (dB) | 23.2 | 24.3 -5% | 26.4 -14% | 24.5 -6% | 22.9 1% | 32.4 -40% |
| Idle Maximum * (dB) | 23.2 | 28.6 -23% | 26.4 -14% | 26.8 -16% | 24.5 -6% | 32.4 -40% |
| Load Average * (dB) | 47.8 | 47.5 1% | 38.1 20% | 41.8 13% | 48.7 -2% | 51.9 -9% |
| Witcher 3 ultra * (dB) | 34.1 | 38.1 -12% | 44.9 -32% | 45.2 -33% | ||
| Load Maximum * (dB) | 56.3 | 54.9 2% | 45 20% | 47.1 16% | 52.1 7% | 52.1 7% |
* ... menor é melhor
Temperatura
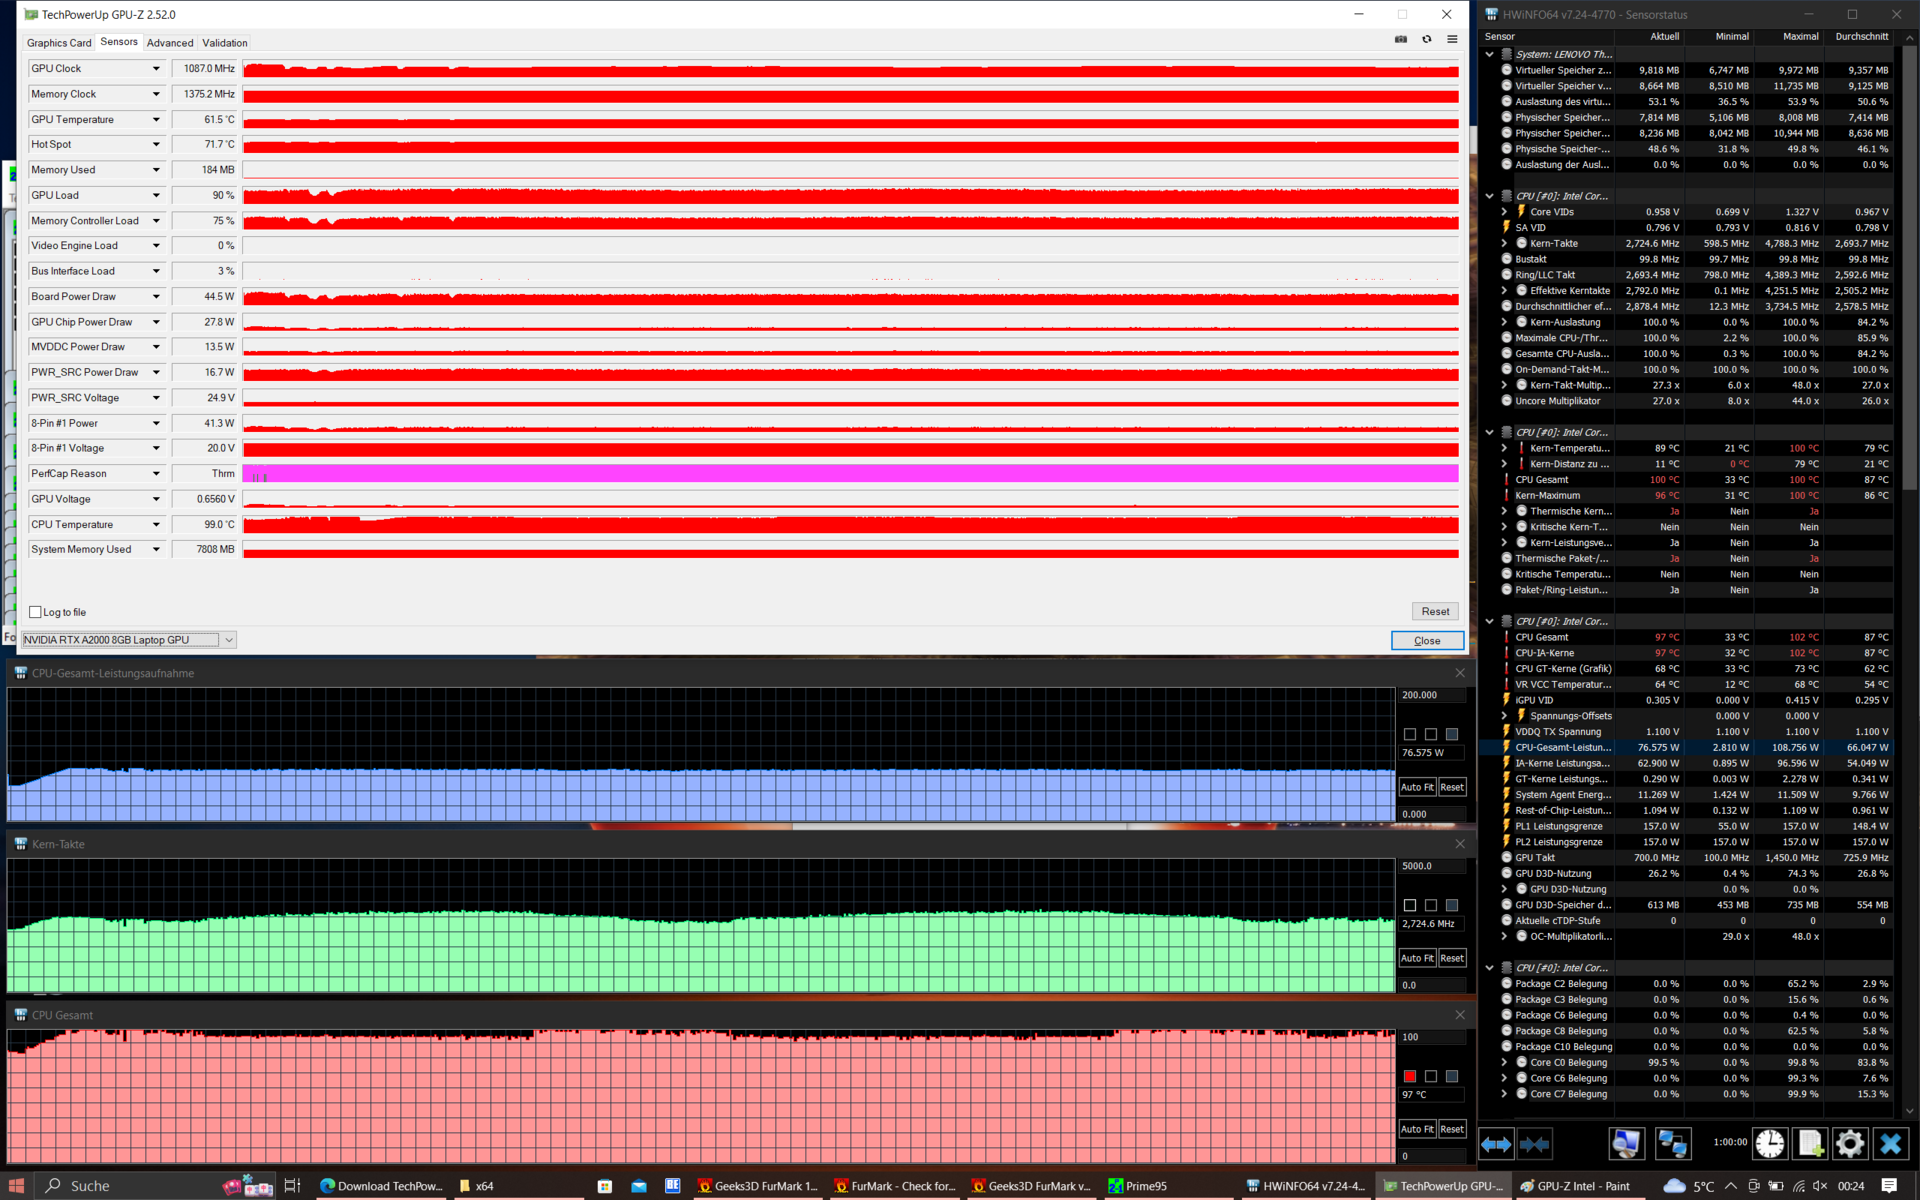
A caixa espaçosa, com sua construção em gaiola de rolo e câmara de vapor, garante uma distribuição relativamente uniforme do calor residual. Como resultado, o descanso de palma do Lenovo ThinkPad P16 fica um pouco quente, mas as temperaturas máximas se mantêm dentro de limites aceitáveis. No teste de estresse, a temperatura do hotspot mediu 43,1 graus e pode ser considerada um bom resultado.
Embora o processador não tenha sido estrangulado durante o teste de estresse, o desempenho da GPU caiu: Após uma hora, ele só pode consumir 45 watts ao invés de 60.
(±) A temperatura máxima no lado superior é 43.1 °C / 110 F, em comparação com a média de 38.2 °C / 101 F , variando de 22.2 a 69.8 °C para a classe Workstation.
(+) A parte inferior aquece até um máximo de 39.9 °C / 104 F, em comparação com a média de 41.1 °C / 106 F
(+) Em uso inativo, a temperatura média para o lado superior é 24.7 °C / 76 F, em comparação com a média do dispositivo de 32 °C / ### class_avg_f### F.
(+) Jogando The Witcher 3, a temperatura média para o lado superior é 31.2 °C / 88 F, em comparação com a média do dispositivo de 32 °C / ## #class_avg_f### F.
(±) Os apoios para as mãos e o touchpad podem ficar muito quentes ao toque, com um máximo de 36.7 °C / 98.1 F.
(-) A temperatura média da área do apoio para as mãos de dispositivos semelhantes foi 27.8 °C / 82 F (-8.9 °C / -16.1 F).
| Lenovo ThinkPad P16 G1 21D6001DMB Intel Core i7-12850HX, NVIDIA RTX A2000 Laptop GPU | Lenovo ThinkPad P15 G2-20YQ001JGE Intel Core i7-11800H, NVIDIA RTX A3000 Laptop GPU | Lenovo ThinkPad P17 G2-20YU0025G Intel Core i7-11800H, NVIDIA RTX A2000 Laptop GPU | HP ZBook Fury 17 G8-4A6A9EA Intel Core i9-11950H, NVIDIA RTX A3000 Laptop GPU | Dell Precision 7670 Intel Core i7-12850HX, NVIDIA RTX A2000 Laptop GPU | Asus ExpertBook B6 Flip B6602FC2 Intel Core i9-12950HX, NVIDIA RTX A2000 Laptop GPU | |
|---|---|---|---|---|---|---|
| Heat | -21% | -12% | -12% | -18% | -15% | |
| Maximum Upper Side * (°C) | 43.1 | 49.7 -15% | 49.6 -15% | 41.9 3% | 51 -18% | 48.4 -12% |
| Maximum Bottom * (°C) | 39.9 | 63.2 -58% | 52.1 -31% | 52.9 -33% | 45.8 -15% | 52.3 -31% |
| Idle Upper Side * (°C) | 26 | 27.1 -4% | 26 -0% | 28.2 -8% | 31.8 -22% | 27.8 -7% |
| Idle Bottom * (°C) | 27.6 | 29.8 -8% | 27.6 -0% | 30.7 -11% | 32.6 -18% | 30.3 -10% |
* ... menor é melhor
Oradores
Os alto-falantes estéreo se sentam na parte superior do teclado. Em comparação com osPensePad P15 G2os alto-falantes são um pouco mais silenciosos no geral, mas produzem um som mais equilibrado com graves adicionais. Embora a qualidade de som seja boa para um laptop, ela ainda não é compatível com um sistema de som externo.
Lenovo ThinkPad P16 G1 21D6001DMB análise de áudio
(±) | o volume do alto-falante é médio, mas bom (###valor### dB)
Graves 100 - 315Hz
(±) | graves reduzidos - em média 9.7% menor que a mediana
(±) | a linearidade dos graves é média (12.8% delta para a frequência anterior)
Médios 400 - 2.000 Hz
(+) | médios equilibrados - apenas 2.9% longe da mediana
(+) | médios são lineares (6.3% delta para frequência anterior)
Altos 2 - 16 kHz
(+) | agudos equilibrados - apenas 3.1% longe da mediana
(+) | os máximos são lineares (4.3% delta da frequência anterior)
Geral 100 - 16.000 Hz
(+) | o som geral é linear (13% diferença em relação à mediana)
Comparado com a mesma classe
» 22% de todos os dispositivos testados nesta classe foram melhores, 6% semelhantes, 72% piores
» O melhor teve um delta de 7%, a média foi 17%, o pior foi 35%
Comparado com todos os dispositivos testados
» 13% de todos os dispositivos testados foram melhores, 3% semelhantes, 85% piores
» O melhor teve um delta de 4%, a média foi 23%, o pior foi 134%
Lenovo ThinkPad P15 G2-20YQ001JGE análise de áudio
(±) | o volume do alto-falante é médio, mas bom (###valor### dB)
Graves 100 - 315Hz
(-) | quase nenhum baixo - em média 15.5% menor que a mediana
(±) | a linearidade dos graves é média (9.6% delta para a frequência anterior)
Médios 400 - 2.000 Hz
(±) | médios mais altos - em média 7.5% maior que a mediana
(+) | médios são lineares (6.6% delta para frequência anterior)
Altos 2 - 16 kHz
(+) | agudos equilibrados - apenas 2.4% longe da mediana
(+) | os máximos são lineares (5.8% delta da frequência anterior)
Geral 100 - 16.000 Hz
(±) | a linearidade do som geral é média (20.6% diferença em relação à mediana)
Comparado com a mesma classe
» 74% de todos os dispositivos testados nesta classe foram melhores, 6% semelhantes, 21% piores
» O melhor teve um delta de 7%, a média foi 17%, o pior foi 35%
Comparado com todos os dispositivos testados
» 55% de todos os dispositivos testados foram melhores, 8% semelhantes, 37% piores
» O melhor teve um delta de 4%, a média foi 23%, o pior foi 134%
Gerenciamento de energia: A GPU afeta negativamente o gerenciamento de energia
Consumo de energia
O ThinkPad P16 da Lenovo funciona de forma mais eficiente do que dispositivos comparáveis. Mesmo quando ocioso, ele é mais eficiente em termos energéticos do que a concorrência. Entretanto, para ser justo, também deve ser dito que laptops similares da HP e da Dell têm displays 4K. Da mesma forma, apesar de seu LCD WQXGA de maior resolução, é mais eficiente que o P15 e o P17 com seus painéis Full HD.
O adaptador de energia Slim Tip fornece 170 watts - muito bem colocado para o consumo máximo de 168,9 watts.
| desligado | |
| Ocioso | |
| Carga |
|
Key:
min: | |
| Lenovo ThinkPad P16 G1 21D6001DMB i7-12850HX, RTX A2000 Laptop GPU, Micron 3400 1TB MTFDKBA1T0TFH, IPS LED, 2560x1600, 16" | Lenovo ThinkPad P15 G2-20YQ001JGE i7-11800H, RTX A3000 Laptop GPU, Kioxia XG7 KXG7AZNV512G, IPS, 1920x1080, 15.6" | Lenovo ThinkPad P17 G2-20YU0025G i7-11800H, RTX A2000 Laptop GPU, Kioxia XG7 KXG7AZNV512G, IPS LED, 1920x1080, 17.3" | HP ZBook Fury 17 G8-4A6A9EA i9-11950H, RTX A3000 Laptop GPU, Toshiba XG6 KXG60ZNV1T02, IPS, 3840x2160, 17.3" | Dell Precision 7670 i7-12850HX, RTX A2000 Laptop GPU, SK Hynix HFS001TEJ9X115N, OLED, 3840x2400, 16" | Asus ExpertBook B6 Flip B6602FC2 i9-12950HX, RTX A2000 Laptop GPU, Samsung PM9A1 MZVL21T0HCLR, IPS, 2560x1600, 16" | Média NVIDIA RTX A2000 Laptop GPU | Média da turma Workstation | |
|---|---|---|---|---|---|---|---|---|
| Power Consumption | -23% | -15% | -49% | -56% | -67% | -24% | -39% | |
| Idle Minimum * (Watt) | 5.1 | 6.3 -24% | 6.1 -20% | 7.6 -49% | 7.5 -47% | 10.5 -106% | 6.6 ? -29% | 9.11 ? -79% |
| Idle Average * (Watt) | 9.2 | 10.7 -16% | 10.9 -18% | 16.7 -82% | 9.5 -3% | 11.9 -29% | 11.8 ? -28% | 13.8 ? -50% |
| Idle Maximum * (Watt) | 9.9 | 11.6 -17% | 12.3 -24% | 17.5 -77% | 28.4 -187% | 18 -82% | 16.7 ? -69% | 17.9 ? -81% |
| Load Average * (Watt) | 124.1 | 99.3 20% | 106.3 14% | 117 6% | 139.1 -12% | 182 -47% | 116.3 ? 6% | 96 ? 23% |
| Witcher 3 ultra * (Watt) | 87.7 | 154 -76% | 124 -41% | 150 -71% | 134 -53% | 177.5 -102% | ||
| Load Maximum * (Watt) | 168.9 | 210 -24% | 168.9 -0% | 202 -20% | 220.8 -31% | 229 -36% | 171.2 ? -1% | 180.3 ? -7% |
* ... menor é melhor
Power consumption Witcher 3 / stress test
Power consumption with an external monitor
Duração da bateria
A Lenovo não fez nenhuma alteração na bateria interna de polímero de lítio de 94 watts-hora. Assim, a duração da bateria está em um nível semelhante ao de suas antecessoras por volta de nove horas no teste WiFi (150 cd/m² de brilho de tela). O ThinkPad P16 tem uma clara vantagem sobre o Dell Precision 7670que não dura quase tanto tempo no teste WiFi devido a sua bateria menor de 83 watts-hora e tela de 4K.
| Lenovo ThinkPad P16 G1 21D6001DMB i7-12850HX, RTX A2000 Laptop GPU, 94 Wh | Lenovo ThinkPad P15 G2-20YQ001JGE i7-11800H, RTX A3000 Laptop GPU, 94 Wh | Lenovo ThinkPad P17 G2-20YU0025G i7-11800H, RTX A2000 Laptop GPU, 94 Wh | HP ZBook Fury 17 G8-4A6A9EA i9-11950H, RTX A3000 Laptop GPU, 94 Wh | Dell Precision 7670 i7-12850HX, RTX A2000 Laptop GPU, 83 Wh | Asus ExpertBook B6 Flip B6602FC2 i9-12950HX, RTX A2000 Laptop GPU, 90 Wh | Média da turma Workstation | |
|---|---|---|---|---|---|---|---|
| Duração da bateria | -12% | -9% | -5% | -33% | -7% | -15% | |
| WiFi v1.3 (h) | 9.4 | 9.9 5% | 9.8 4% | 7.4 -21% | 5.9 -37% | 8.7 -7% | 8.55 ? -9% |
| Load (h) | 1.8 | 1.3 -28% | 1.4 -22% | 2 11% | 1.3 -28% | 1.7 -6% | 1.441 ? -20% |
Pro
Contra
Veredicto: A nova estação de trabalho ThinkPad é exposta pelo chip gráfico
Com o ThinkPad P16 Gen 1, a Lenovo deu um grande passo de ter duas estações de trabalho de 15 e 17 polegadas para apenas um único modelo de 16 polegadas - uma simplificação rara, mas bem-vinda, da linha de produção. Ao mesmo tempo, a Lenovo também ousou sacudir a linguagem de design anterior da série ThinkPad P. Em suma, o resultado é uma estação de trabalho muito boa que, no entanto, não está livre de falhas.
Um dos pontos fortes do laptop Lenovo é, sem dúvida, sua capacidade de expansão. Somente estes tipos de estações de trabalho podem oferecer até quatro slots de RAM. O dispositivo também vem embalado e está pré-preparado para a WWAN. No entanto, sentimos falta da porta ethernet RJ45. Se o novo design é uma melhoria óptica, é uma questão de gosto, mas a nova tampa do display reforçada com metal é, sem dúvida, muito sólida. O display WQXGA fosco impressiona com seu alto brilho, mas é uma pena que a Lenovo não ofereça o painel de 165 Hz encontrado noX1 Extreme Gen 5. Os dispositivos de entrada do ThinkPad P16 continuam a ser muito bons, mas o deslocamento reduzido da chave não o coloca exatamente no mesmo nível de seu antecessor, oPensePad P17.
Quando se trata de estações de trabalho móveis, o desempenho é fundamental. Aqui podemos ver que o desempenho do processador foi melhorado significativamente. No entanto, isso não se aplica à GPU: desnecessariamente, a Lenovo deixou o RTX A2000 com um consumo de apenas 60 watts. Estranhamente, os ventiladores não funcionam poderosamente sob carga pura de CPU, portanto, por esta razão, a performance do laptop sob carga é estrangulada. Falando do ventilador: Sob carga sustentada, o resfriamento ativo funciona muito alto. Entretanto, isto tem a vantagem de que em quase todas as áreas, o ThinkPad P16 permanece consideravelmente mais frio que seus modelos predecessores de cabeça quente, o P15 e o P17.
Potente desempenho da CPU, mas a GPU fica para trás nesta versão de revisão do ThinkPad P16.
Em resumo, nosso modelo de revisão Lenovo ThinkPad P16 G1 é uma excelente escolha quando solicitado para executar tarefas pesadas de CPU. Se a GPU for importante, você deve se abster de comprar a versão RTX-A2000. Entretanto, isso não significa que um ThinkPad P16 com uma das GPUs mais potentes sofre do mesmo problema - nossa revisão do modelo Nvidia RTX A5500 está agora online.
Para quem procura uma estação de trabalho mais móvel, uma alternativa interessante poderia ser o Dell Precision 7670, com seu estojo mais fino e compacto. O Asus ExpertBook B6 Flip combina a potência de uma estação de trabalho com um design conversível e poderia ser uma escolha interessante para os usuários que trabalham freqüentemente com um estilete
.Preço e disponibilidade
O alto desempenho tem um preço: O ThinkPad P16 custa pelo menos 2.050 dólares americanos, com os modelos mais bem equipados chegando a mais de 3500 dólares americanos. Um dispositivo semelhante ao nosso modelo de revisão custa cerca de 2.800 dólares americanos na Amazônia.
Lenovo ThinkPad P16 G1 21D6001DMB
- 01/27/2023 v7 (old)
Benjamin Herzig
Price comparison

