Revisão do laptop Lenovo ThinkPad Z16 G1: Poderoso porta-bandeira da AMD com um hickup
ThinkPad e AMD - uma combinação que não tem sido vista com muita freqüência há muito tempo. Entretanto, nos últimos anos isto definitivamente mudou, culminando agora com a Lenovo ThinkPad série Z, a primeira série high-end com os chips Ryzen. No início do ano, a Lenovo anunciou dois modelos e tamanhos. Já podíamos testar os menoresLenovo ThinkPad Z13e agora segue o modelo com o grande visor de 16 polegadas, o Lenovo ThinkPad Z16.
Enquanto o Z13 coloca claramente o foco na mobilidade, o Z16 visa o setor multimídia e deve competir com laptops como o Dell XPS 15 e Apple MacBook Pro 16, e até mesmo com o Lenovo ThinkPad X1 Extreme, o atual top dog da Lenovo para clientes multimídia.
Possíveis concorrentes em comparação
Avaliação | Data | Modelo | Peso | Altura | Size | Resolução | Preço |
|---|---|---|---|---|---|---|---|
| 87.3 % v7 (old) | 10/2022 | Lenovo ThinkPad Z16 G1 21D5S00T00 R7 PRO 6850H, Radeon RX 6500M | 1.9 kg | 15.8 mm | 16.00" | 1920x1200 | |
| 89 % v7 (old) | 11/2021 | Lenovo ThinkPad X1 Extreme G4-20Y5CTO1WW (3050 Ti) i7-11800H, GeForce RTX 3050 Ti Laptop GPU | 2 kg | 18.2 mm | 16.00" | 3840x2400 | |
| 88.3 % v7 (old) | 12/2021 | Lenovo ThinkPad X1 Extreme G4-20Y50040GE i9-11950H, GeForce RTX 3080 Laptop GPU | 1.9 kg | 18.2 mm | 16.00" | 3840x2400 | |
| 89.5 % v7 (old) | 05/2022 | Dell XPS 15 9520 RTX 3050 Ti i7-12700H, GeForce RTX 3050 Ti Laptop GPU | 1.9 kg | 18 mm | 15.60" | 3456x2160 | |
| 89.3 % v7 (old) | 06/2022 | Dell XPS 17 9720 i7-12700H, GeForce RTX 3050 4GB Laptop GPU | 2.5 kg | 19.5 mm | 17.00" | 3840x2400 | |
| 93.2 % v7 (old) | 11/2021 | Apple MacBook Pro 16 2021 M1 Pro M1 Pro, M1 Pro 16-Core GPU | 2.2 kg | 16.8 mm | 16.20" | 3456x2234 | |
| 92.5 % v7 (old) | 11/2021 | Apple MacBook Pro 16 2021 M1 Max M1 Max, M1 Max 32-Core GPU | 2.2 kg | 16.8 mm | 16.20" | 3456x2234 |
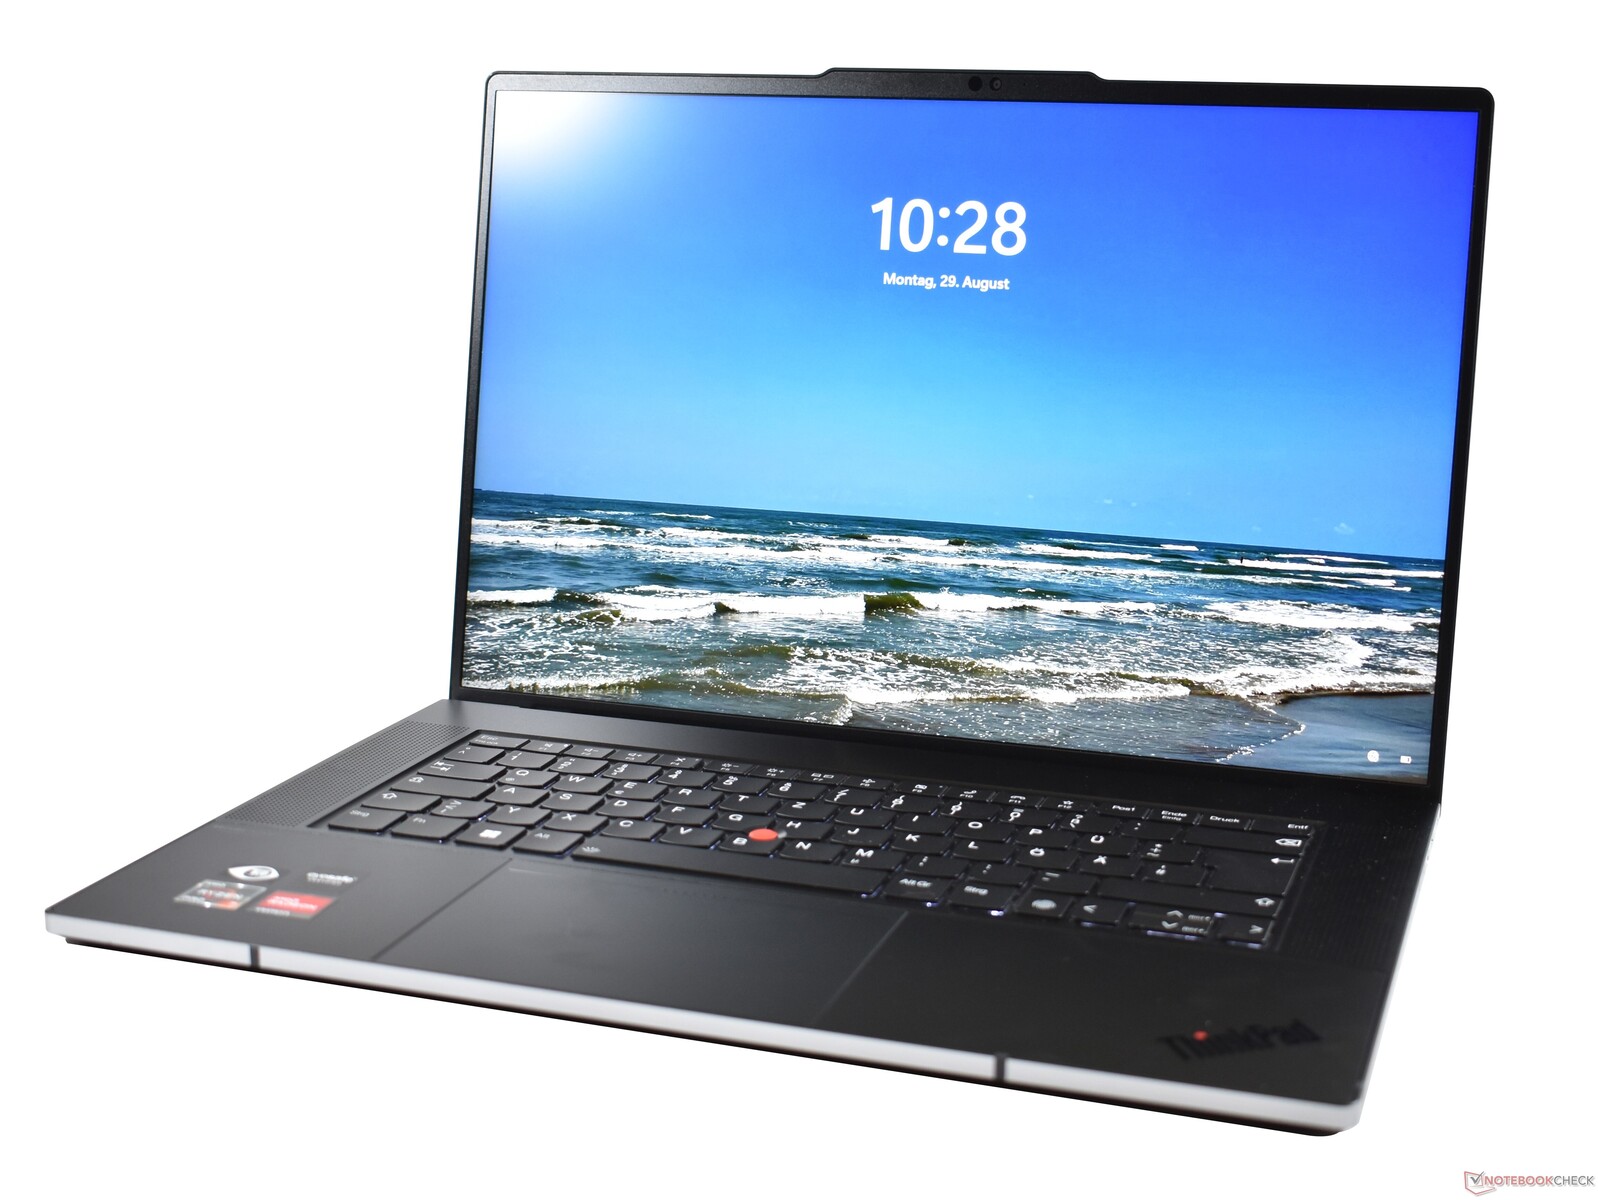
Uma caixa compacta de alumínio: Lenovo ThinkPad Z16 G1
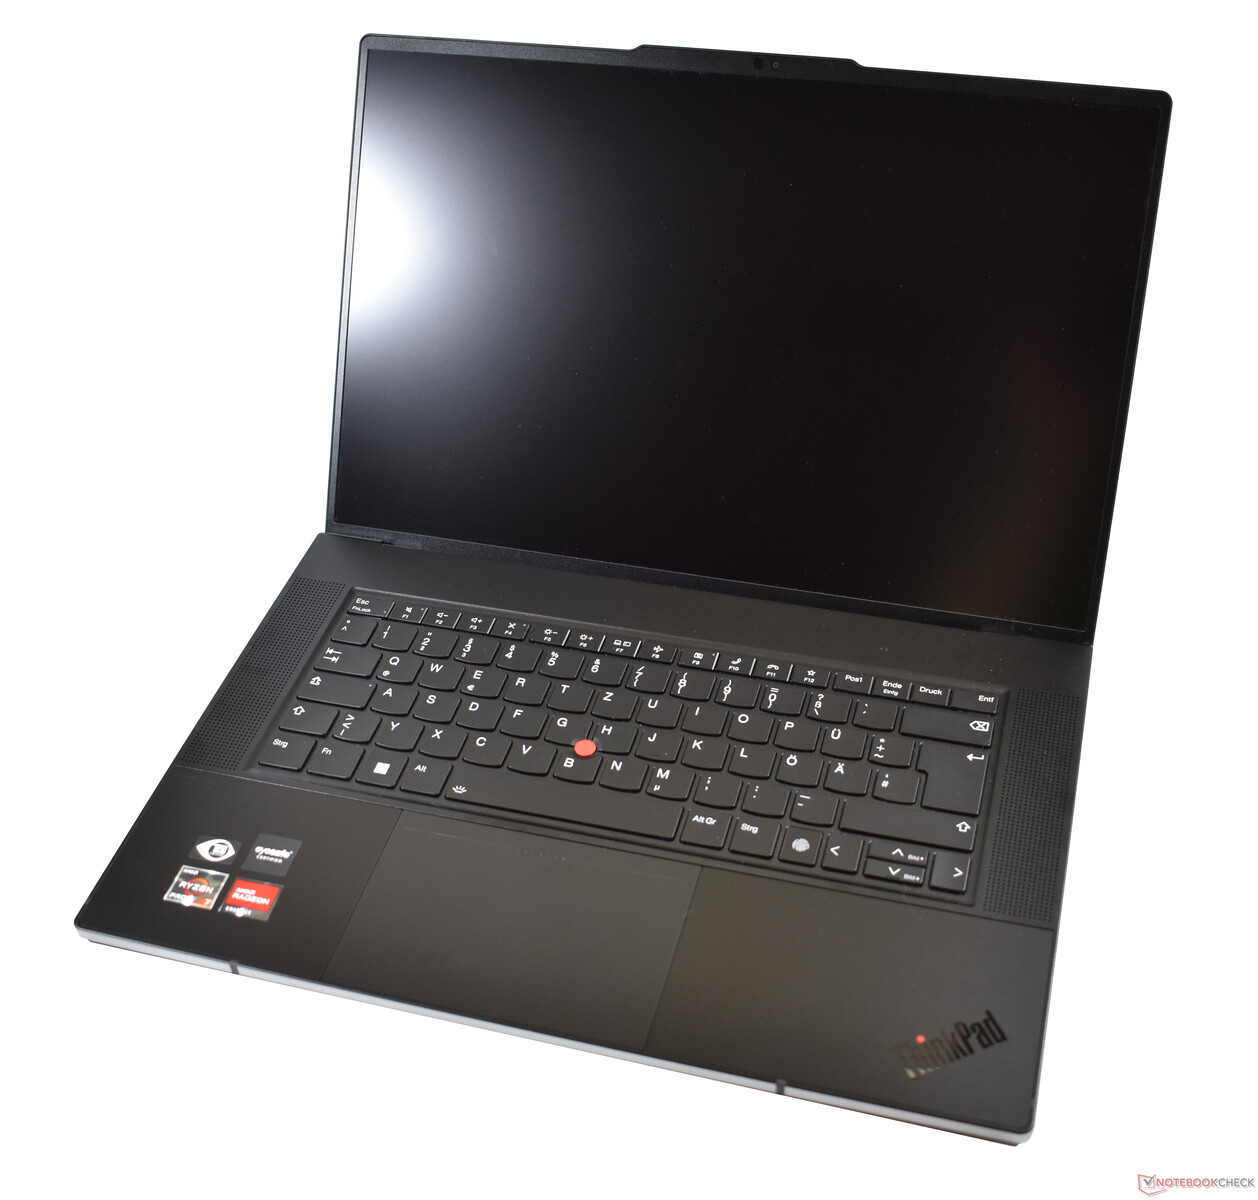
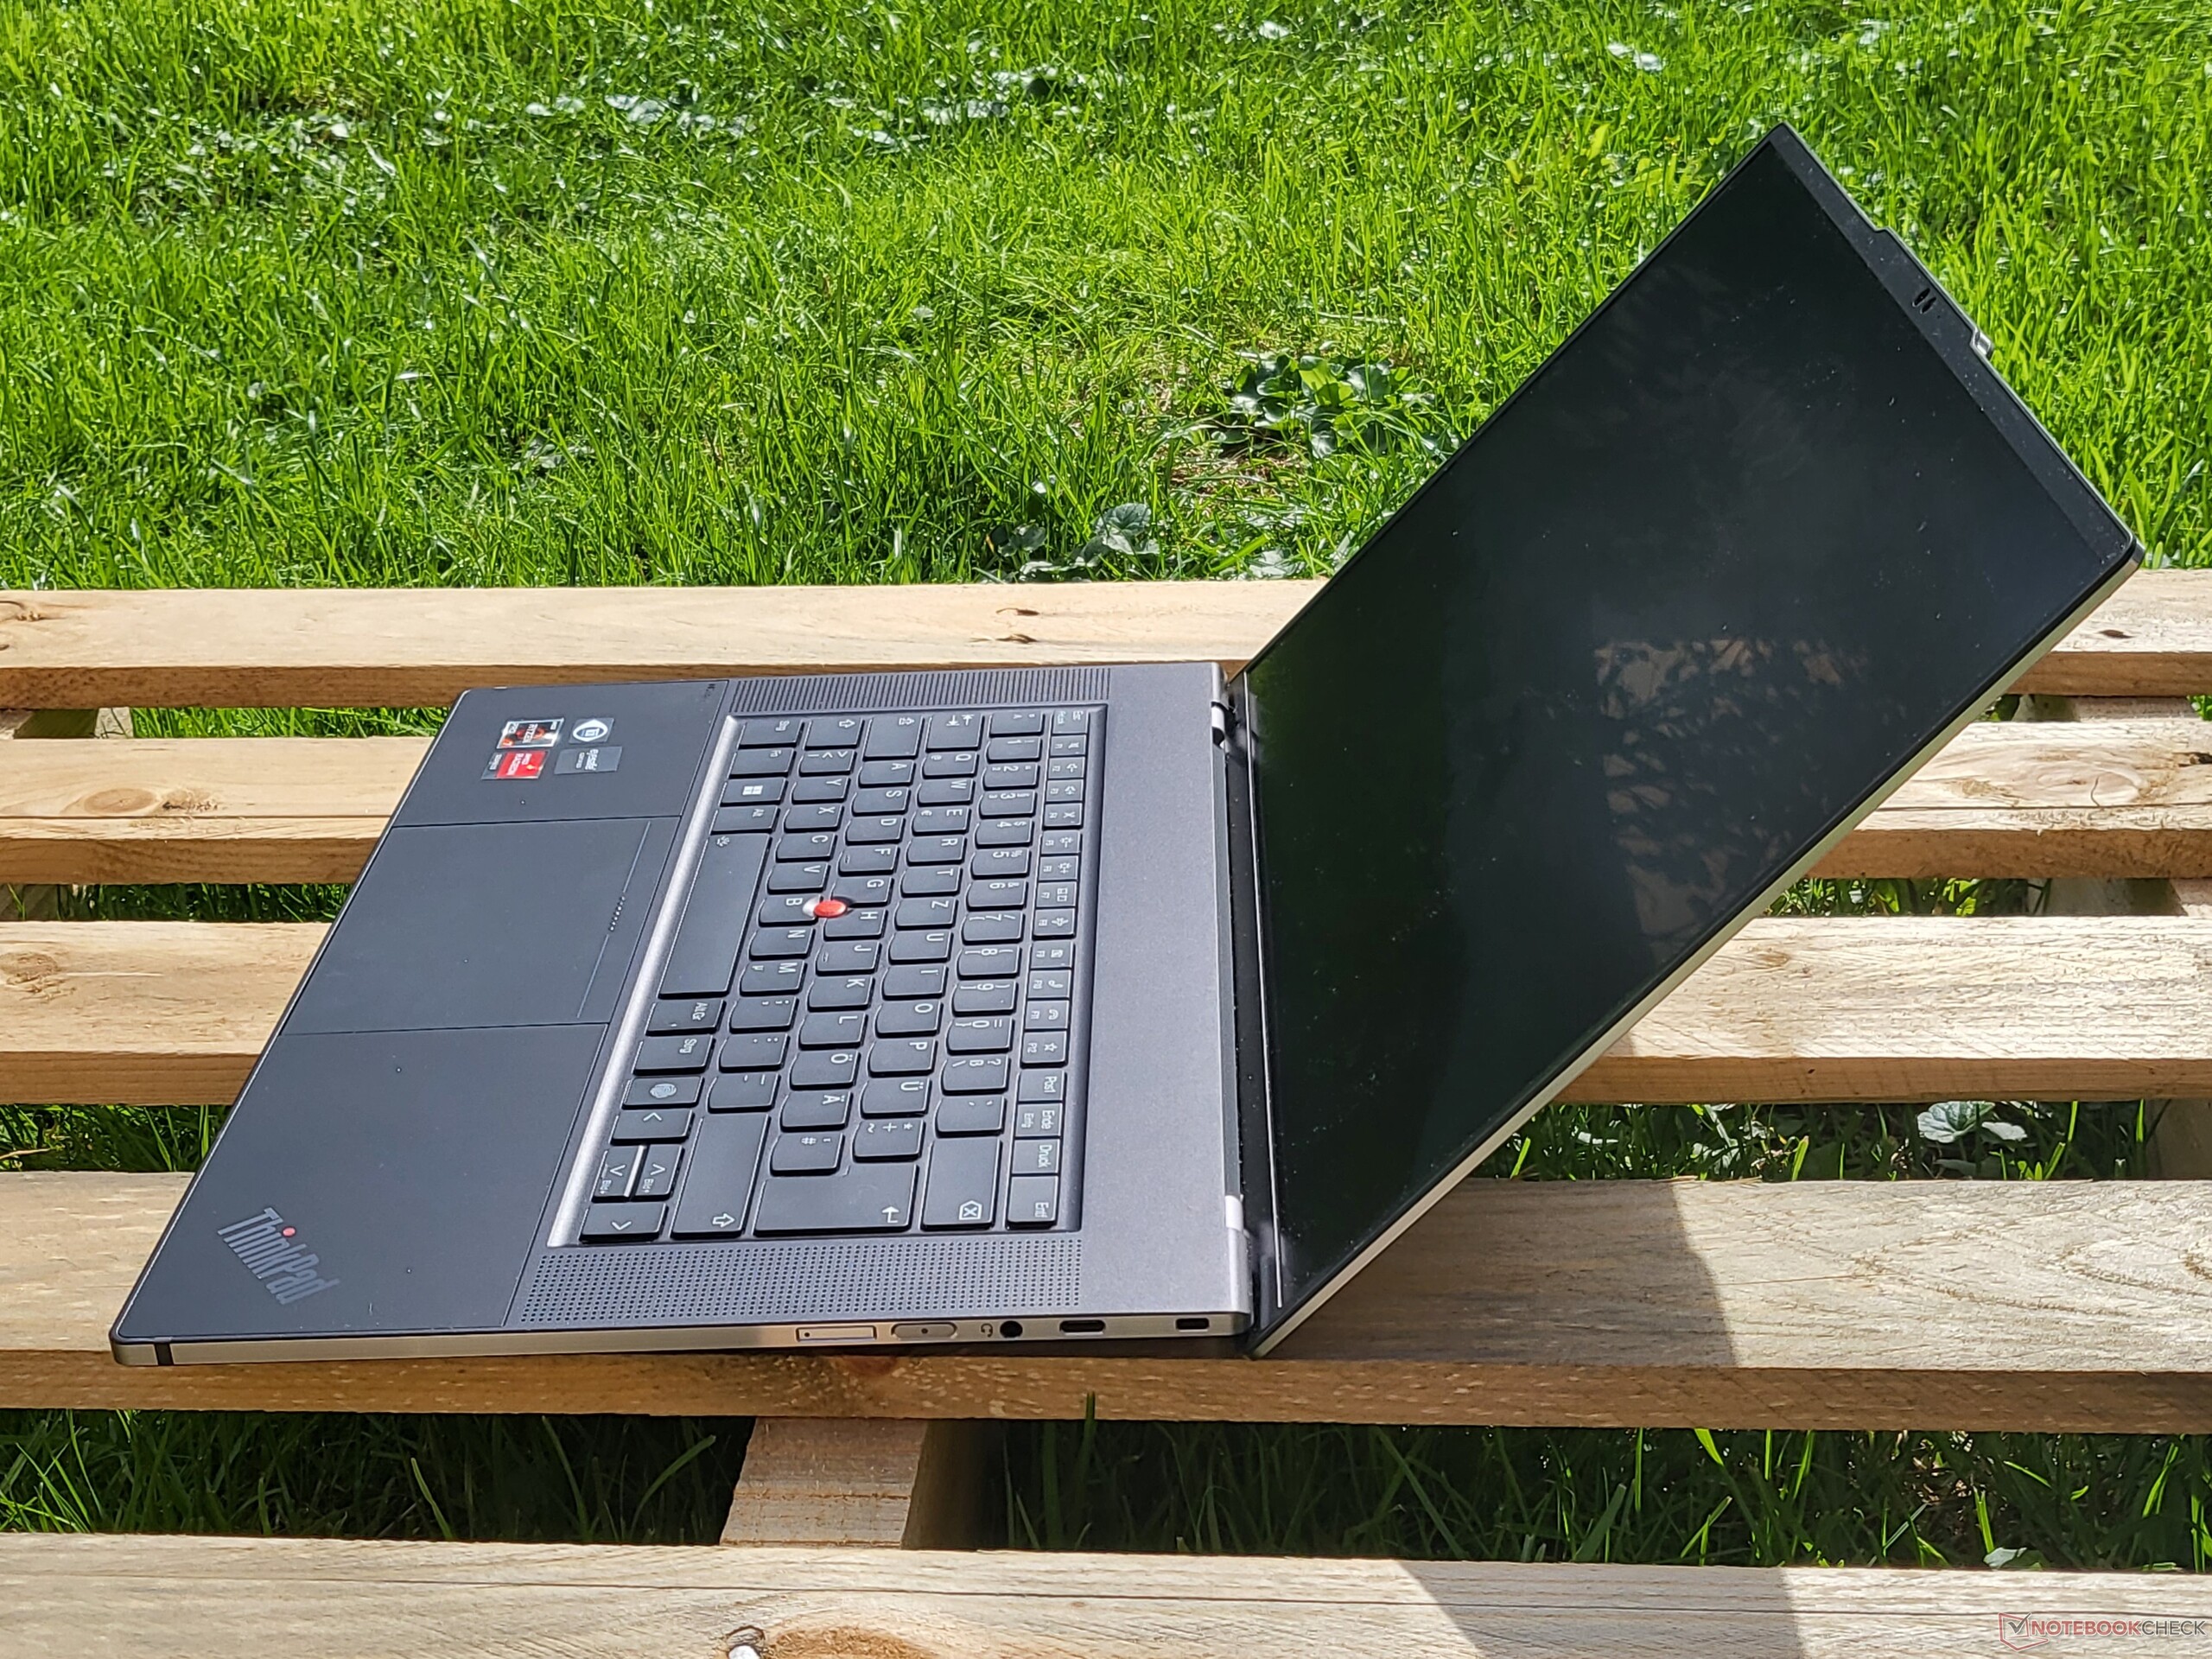
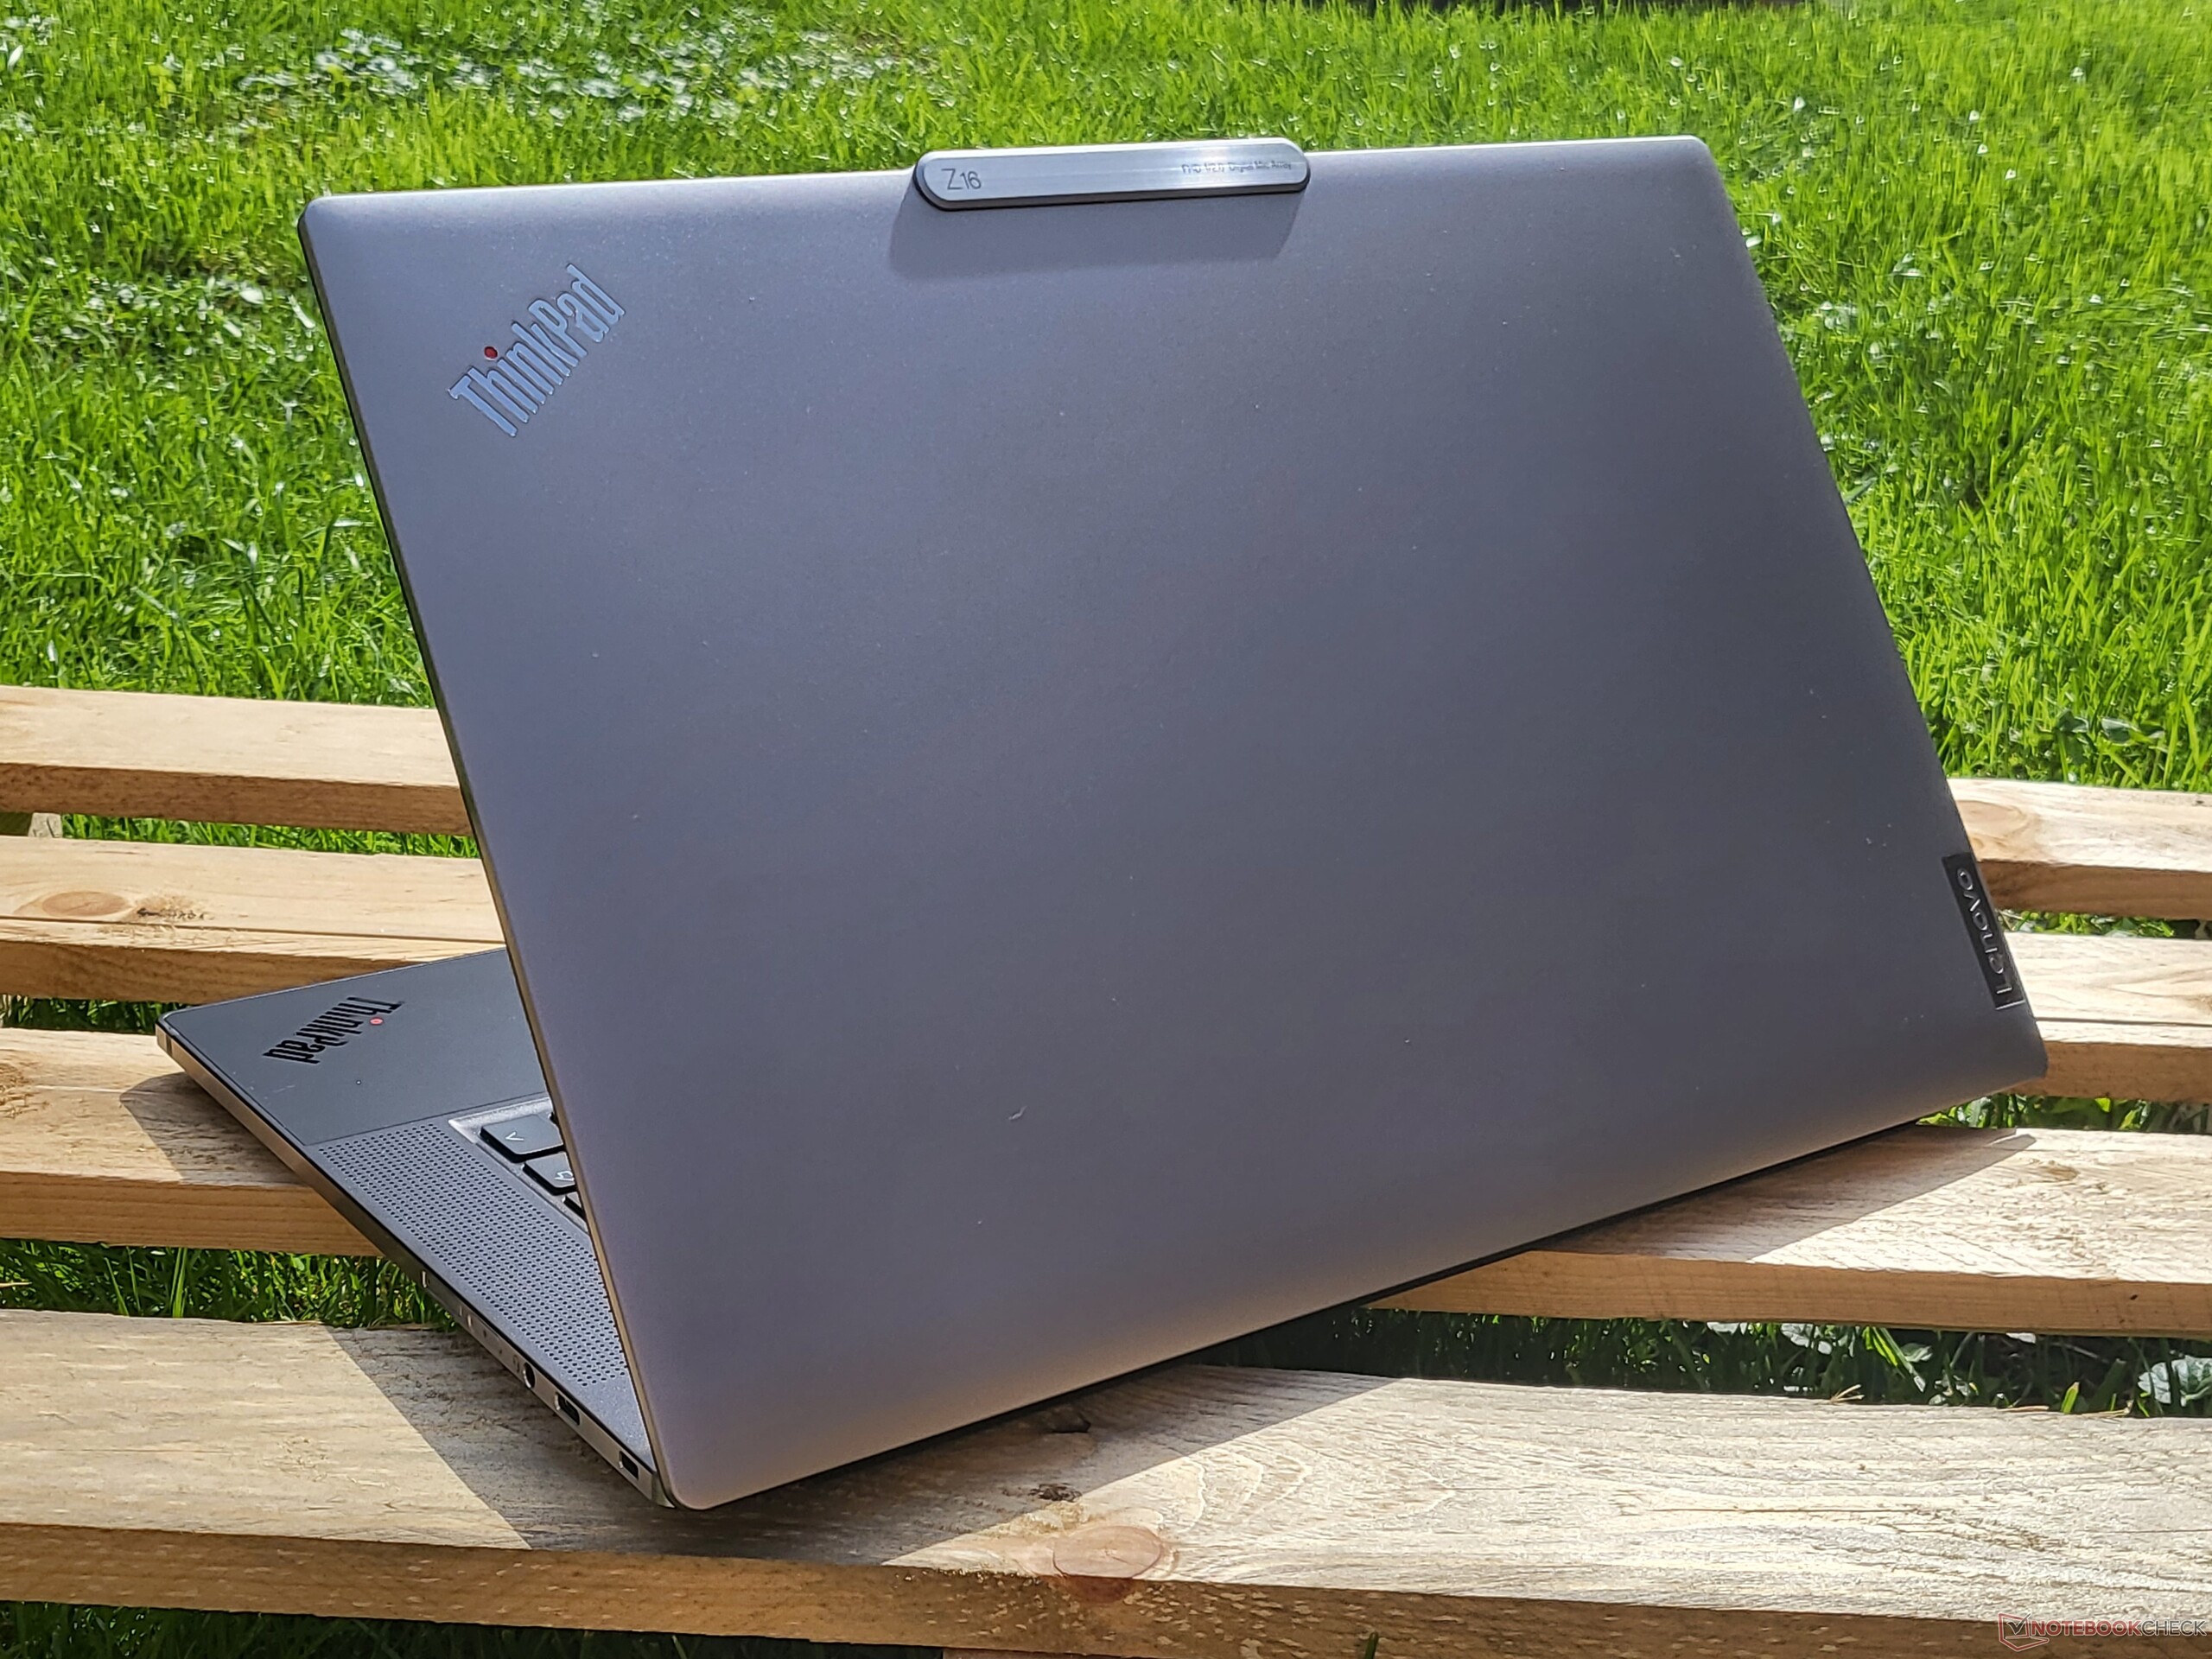
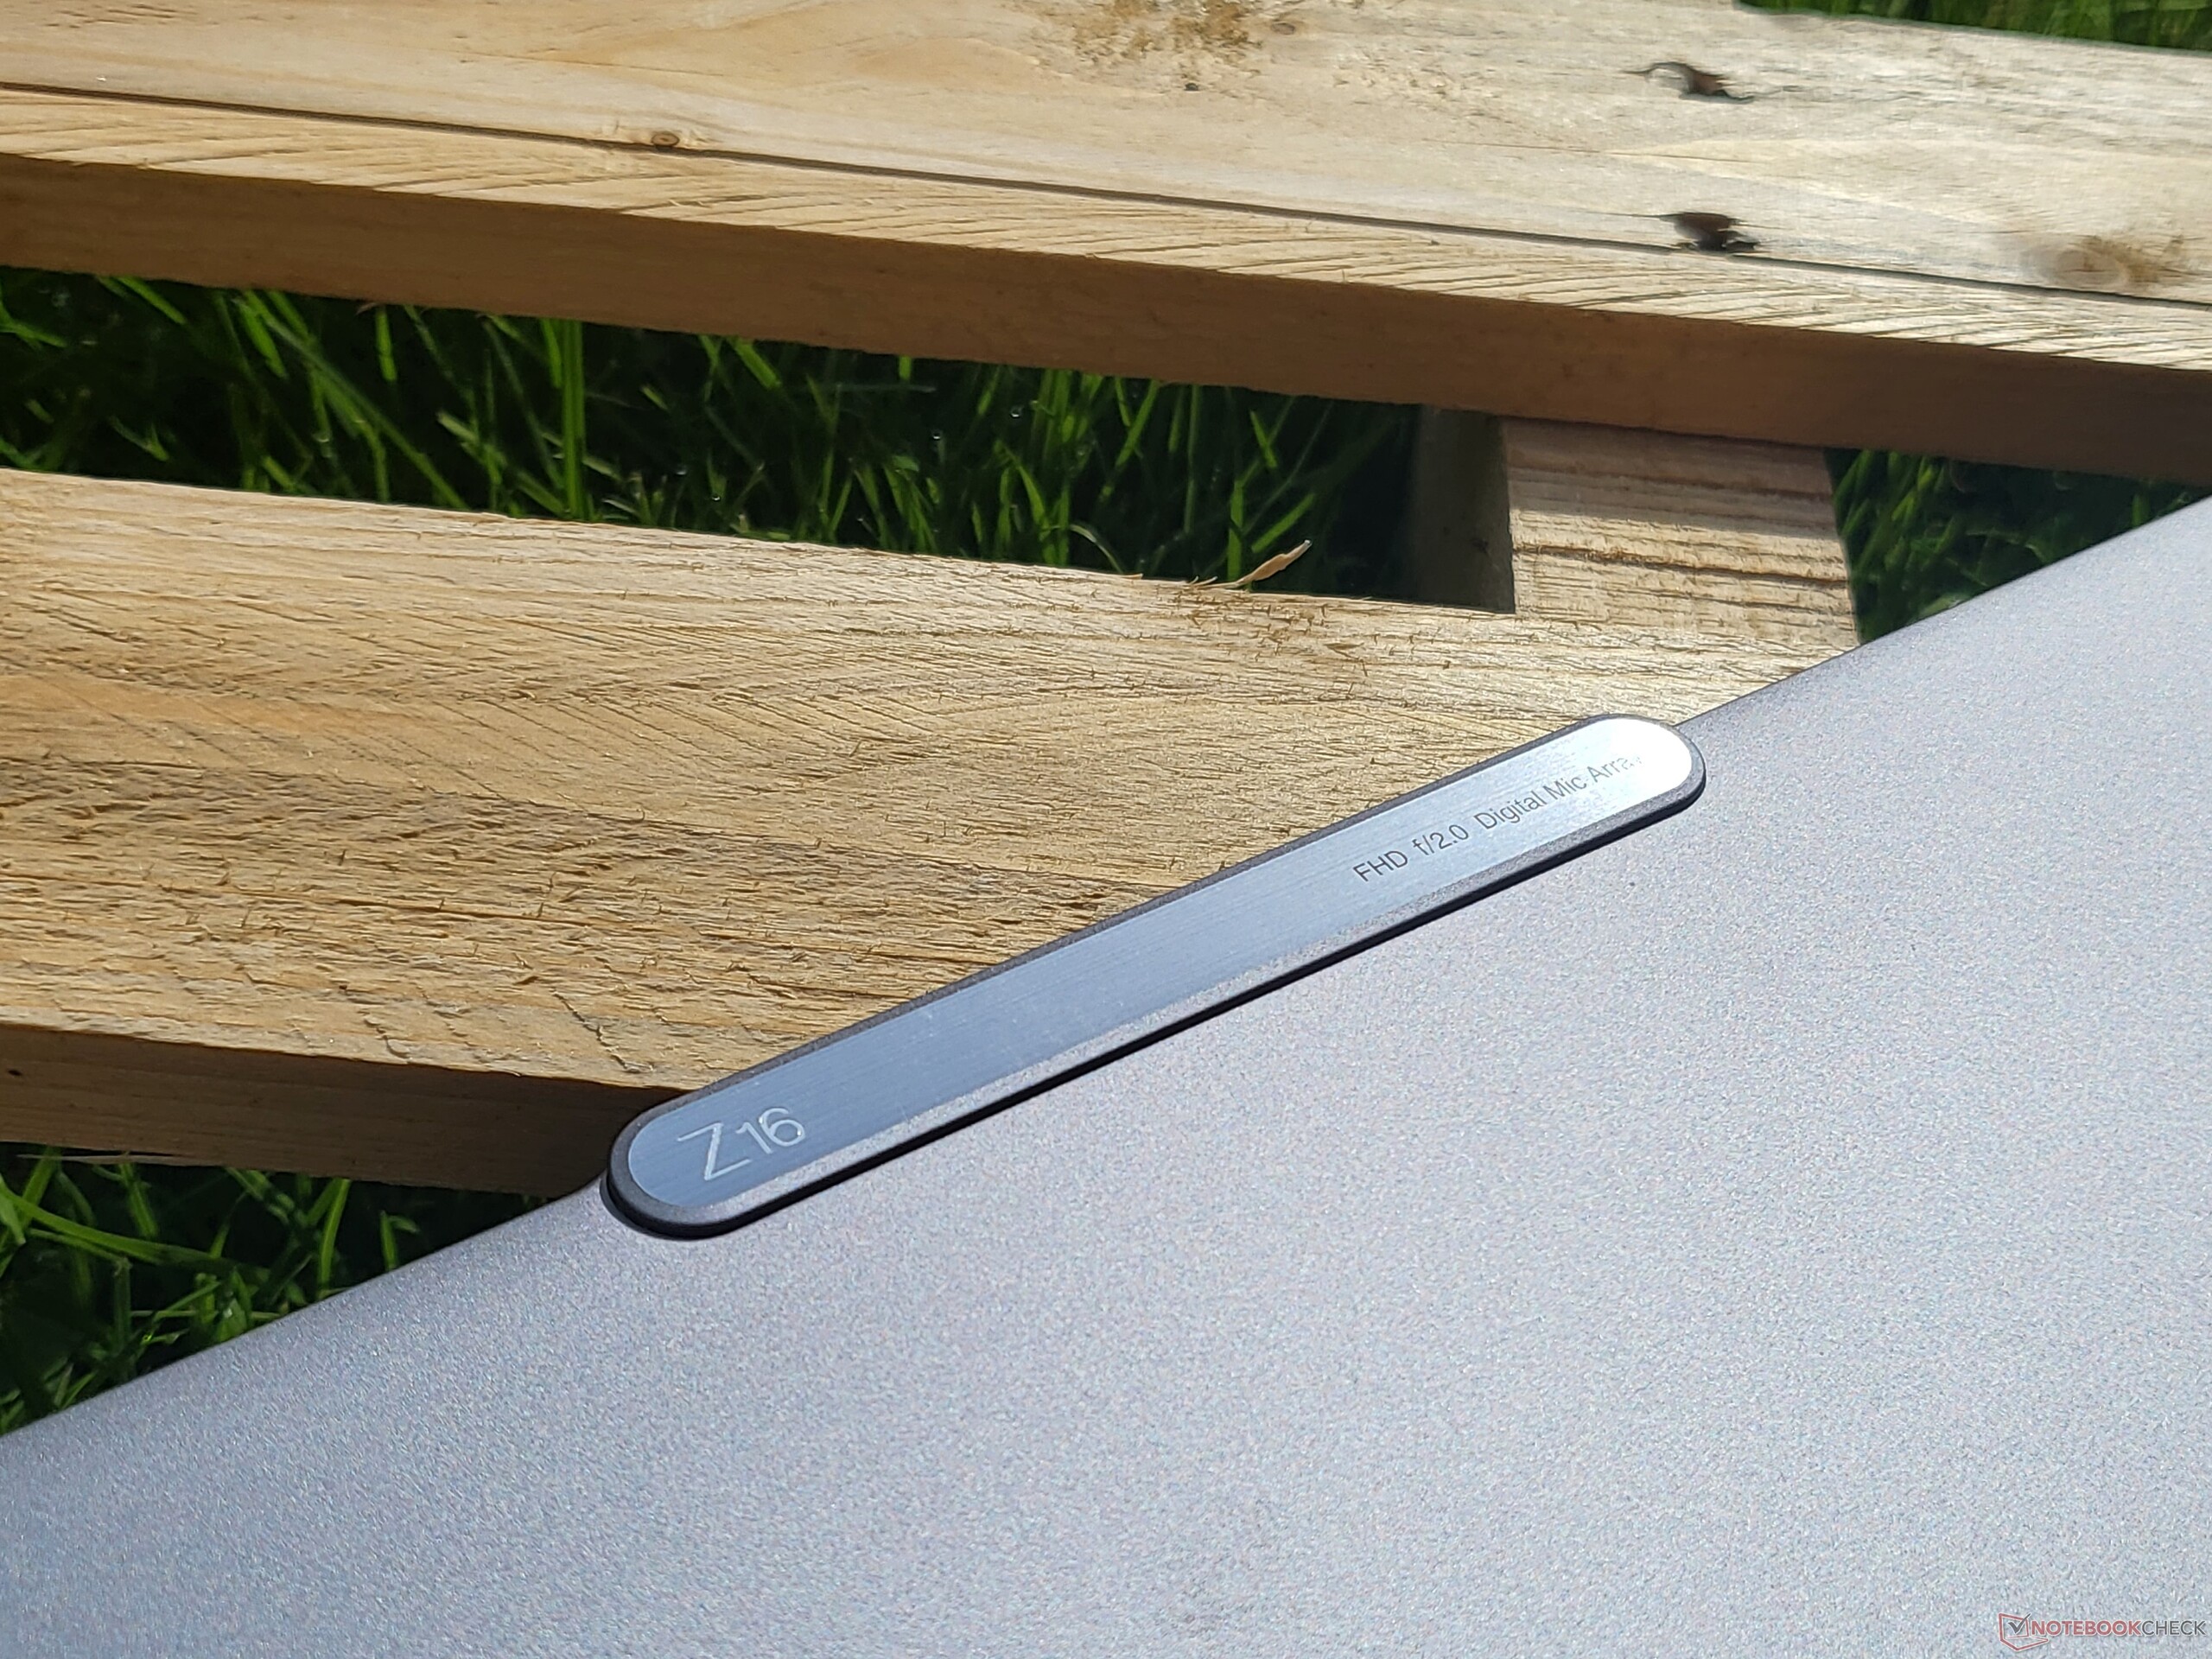
A maior diferença em comparação com a série ThinkPad X1 Extreme estabelecida está no design: Enquanto a X1 Extremoutiliza atributos clássicos do ThinkPad, a aparência do ThinkPad Z16 é muito mais parecida com a do mercado de laptops. Com seu grande touchpad, o teclado retangular e a tampa da tela prateada, parece um híbrido entre um XPS ou MacBook e um ThinkPad. É claro que a Lenovo também colocará seus próprios sotaques, como por exemplo, o bojo da câmera na tampa da tela, o que também é muito prático de se usar para levantar a tampa. Isto pode ser feito facilmente com uma mão, mas apenas até um ângulo de abertura de cerca de 135 graus. 180 graus, como em outros ThinkPads, não são possíveis aqui.
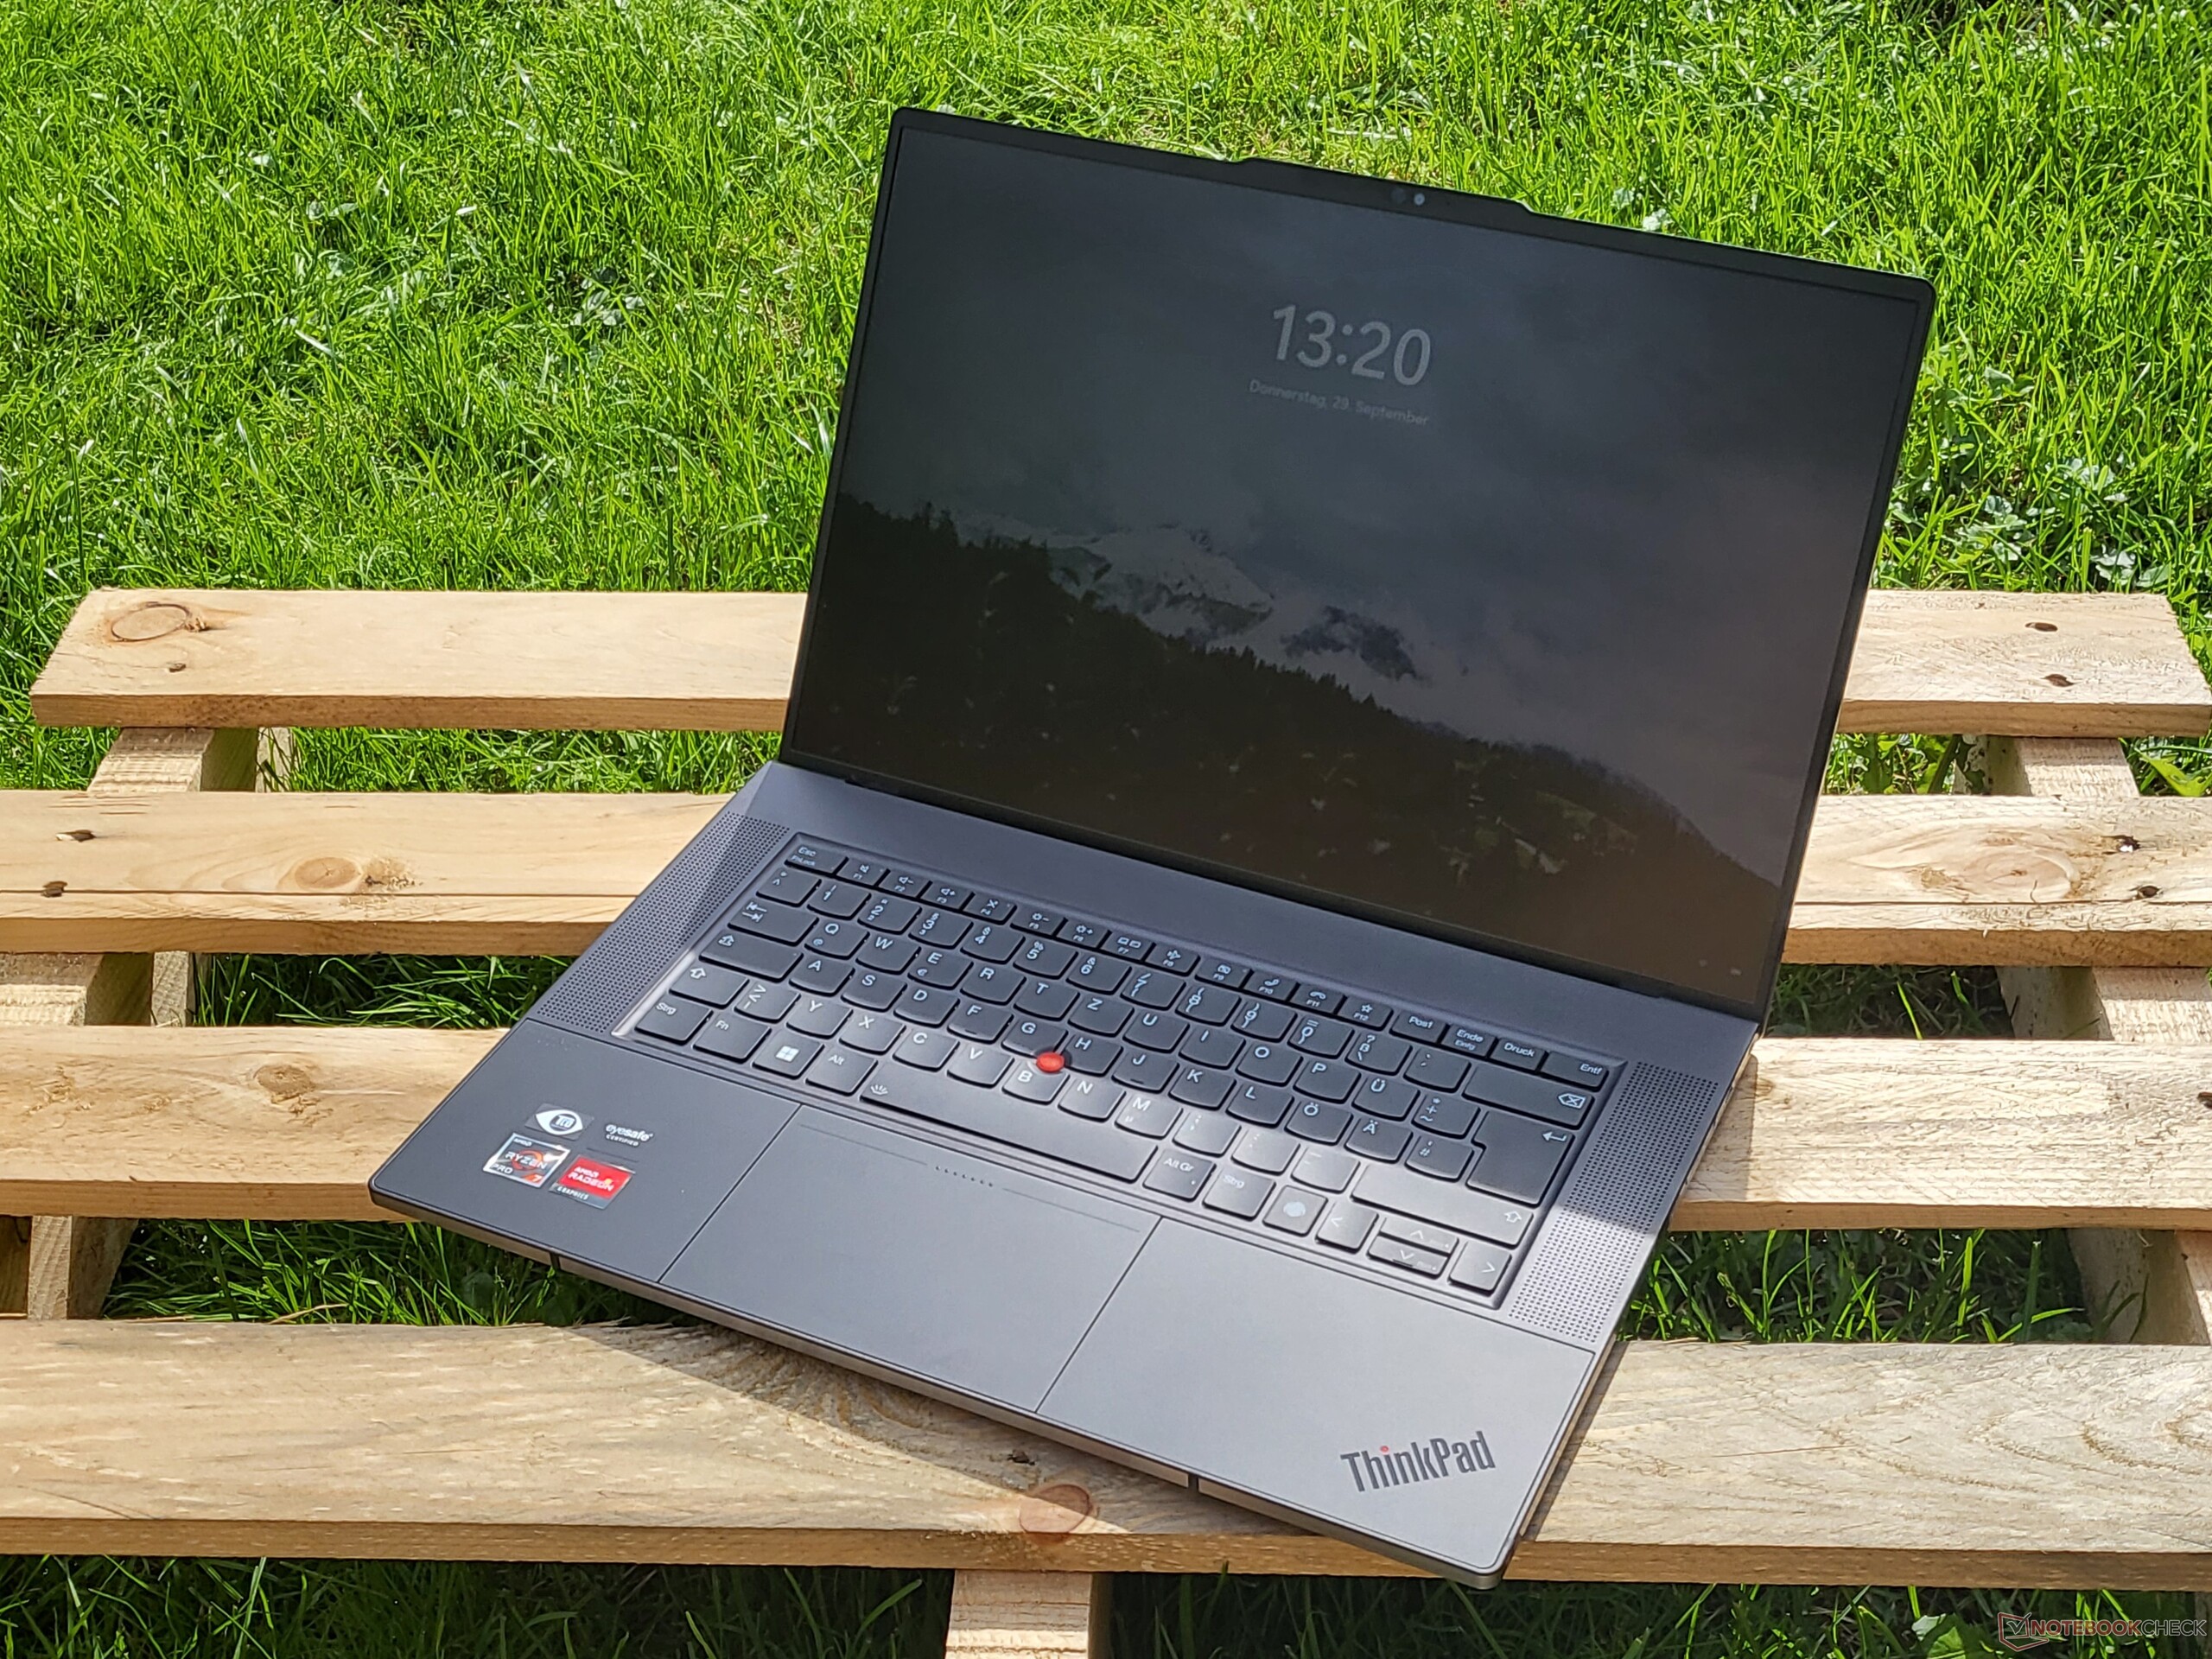
Em termos de escolha de materiais, a Lenovo também toma um caminho diferente do que com a série X1. A tampa da tela é feita de alumínio prata, a moldura do teclado é anodizada em preto e o fundo é lacado em preto. Somente a moldura do display é feita de plástico. Outra característica interessante é o descanso para a palma da mão, já que são feitos de vidro fosco. Isto cria alguns hápticos para o Z16 que estão um nível acima do X1 Extreme, mas isto também pode ser uma questão de gosto. Pelo menos, o Z16 terá definitivamente menos problemas com superfícies gordurosas. A estabilidade da caixa também está em um nível muito alto, mas, naturalmente, a tampa fina do visor é mais fraca do que a base.
O ThinkPad Z16 é o laptop mais compacto de 16 polegadas em nossa comparação. O é o mais compacto Dell XPS 15 é menor, mas "apenas" oferece um LCD de 15,6 polegadas. Em termos de espessura, o Z16 também está à frente, já que é mais fino do que todos os outros concorrentes. Em termos de seu peso, todos os concorrentes estão extremamente próximos uns dos outros.
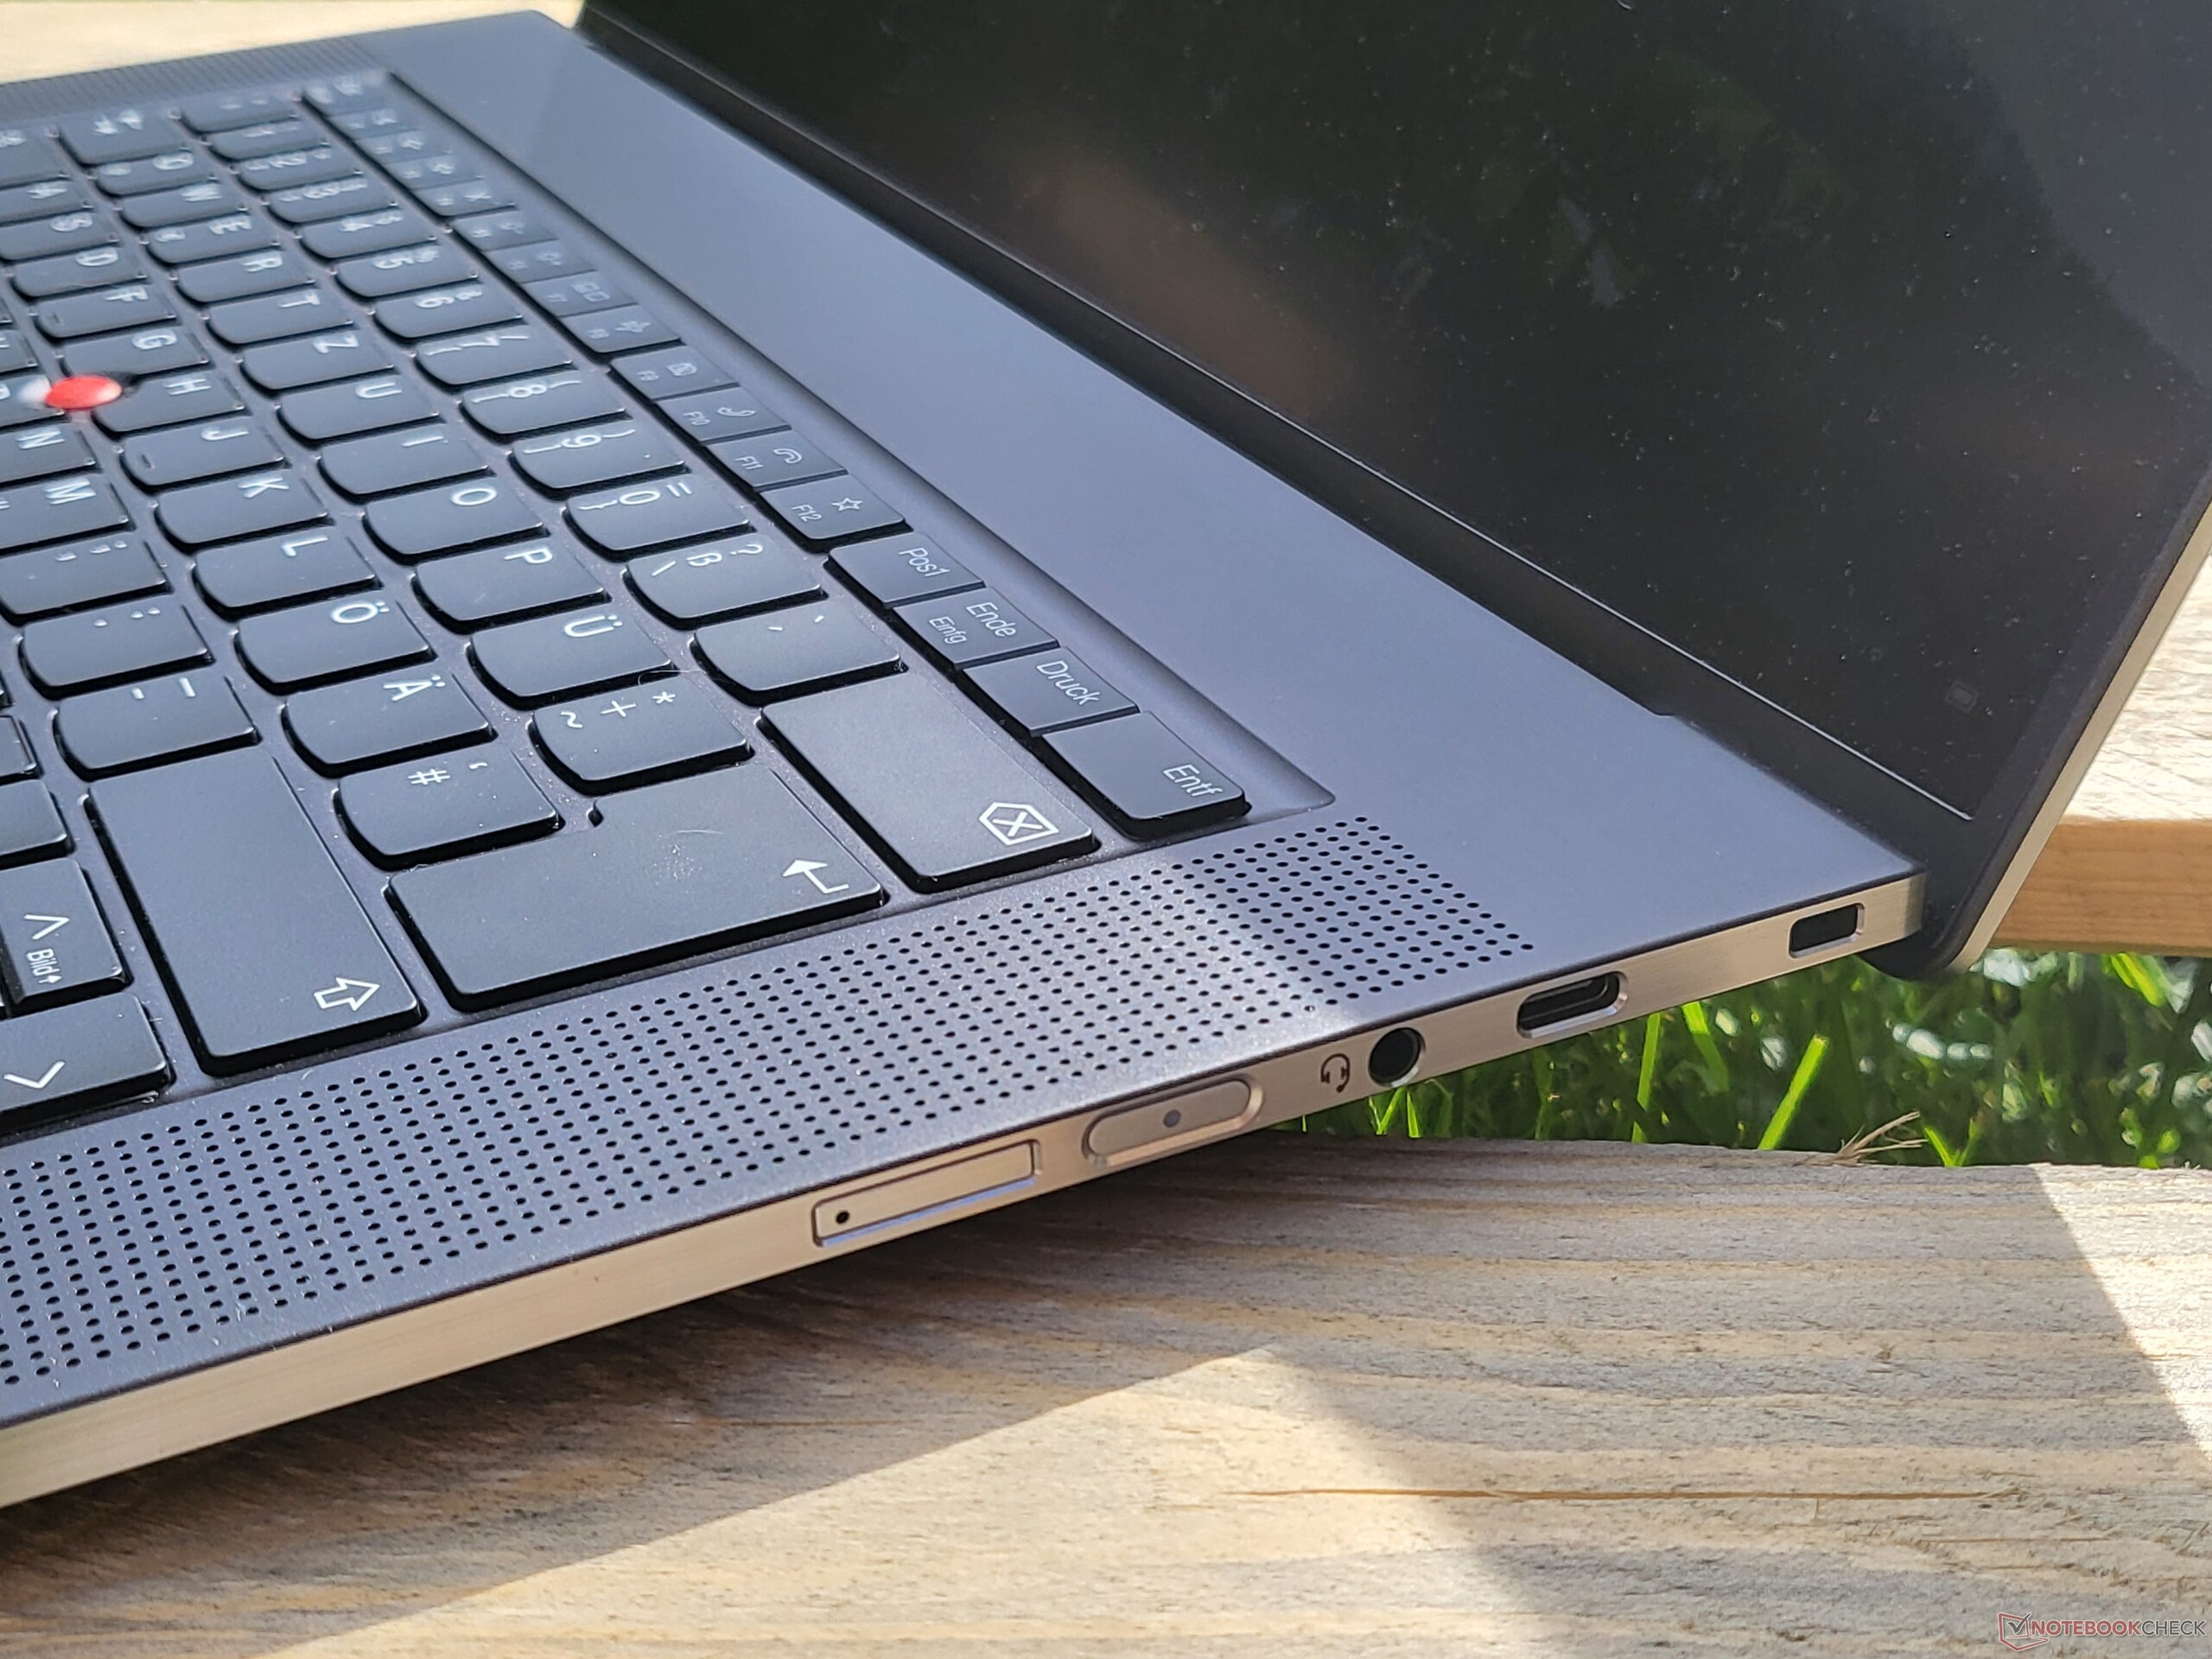
Equipamento: Lenovo com uma seleção de porto esparsa
O equipamento de conexão é idêntico ao do Dell XPS 15 9520, o que o torna um dos mais fracos em nosso campo de teste. Neste ponto, o Z16 fica claramente atrás do ThinkPad X1 Extremee até mesmo o Apple MacBook Pro 16ao menos oferece HDMI.
Ao contrário dos laptops Intel, não há Thunderbolt 4 com AMD. Por outro lado, o ThinkPad Z16 inclui USB 4, que oferece o mesmo conjunto de recursos que o Thunderbolt 3. No entanto, a compatibilidade com os acessórios Thunderbolt não é garantida e tem que ser determinada individualmente.
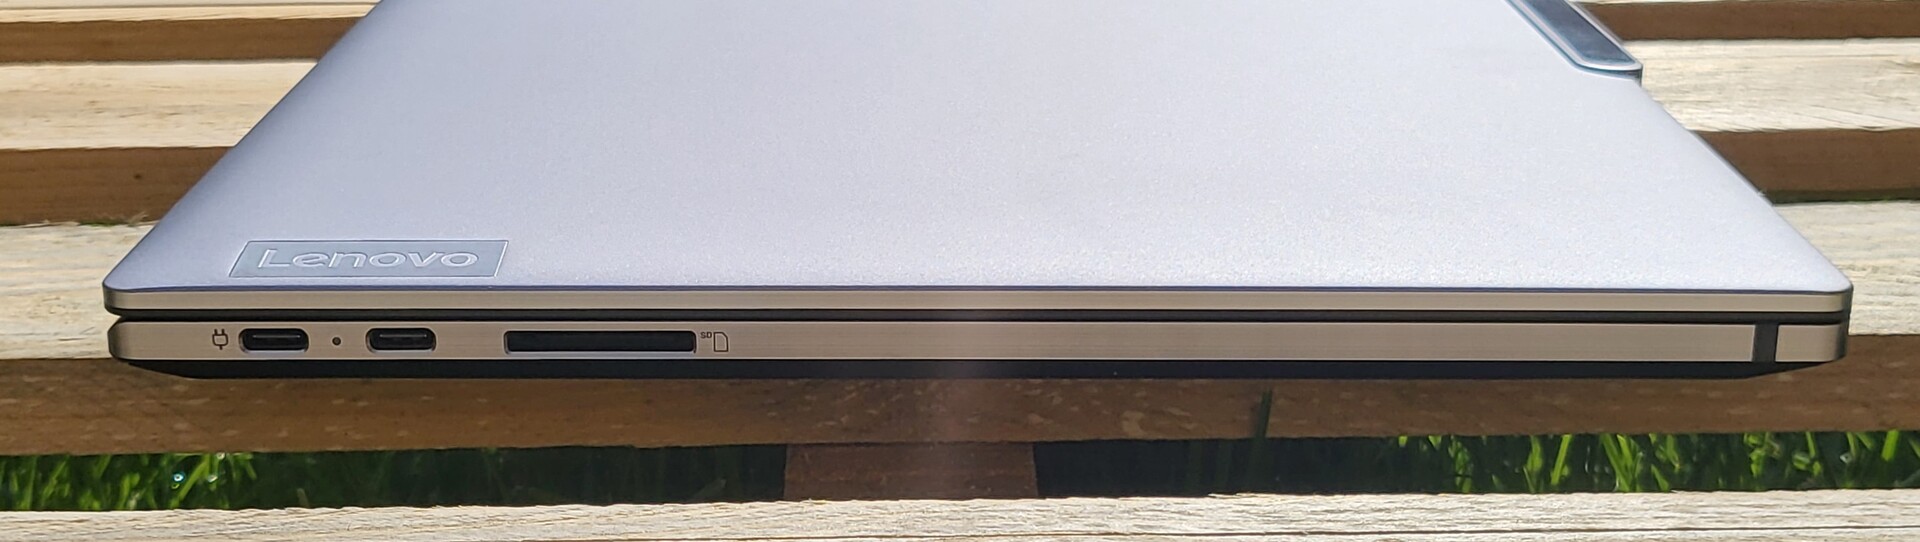
Leitor de cartões SD
O Lenovo ThinkPad Z16 G1 inclui um leitor de cartões SD de tamanho completo, mas os cartões SD não podem ser inseridos completamente. O leitor de cartões é extremamente rápido, particularmente ao ler dados. Testamos isto com nosso cartão de referência microSD AV Pro 128-GB.
| SD Card Reader | |
| average JPG Copy Test (av. of 3 runs) | |
| Dell XPS 17 9720 (Toshiba Exceria Pro SDXC 64 GB UHS-II) | |
| Lenovo ThinkPad X1 Extreme G4-20Y5CTO1WW (3050 Ti) (AV Pro V60) | |
| Dell XPS 15 9520 RTX 3050 Ti (Toshiba Exceria Pro SDXC 64 GB UHS-II) | |
| Média da turma Multimedia (23 - 531, n=43, últimos 2 anos) | |
| Apple MacBook Pro 16 2021 M1 Pro (Angelbird AV Pro V60) | |
| Lenovo ThinkPad Z16 G1 21D5S00T00 | |
| maximum AS SSD Seq Read Test (1GB) | |
| Lenovo ThinkPad Z16 G1 21D5S00T00 | |
| Dell XPS 17 9720 (Toshiba Exceria Pro SDXC 64 GB UHS-II) | |
| Média da turma Multimedia (27.9 - 1455, n=42, últimos 2 anos) | |
| Dell XPS 15 9520 RTX 3050 Ti (Toshiba Exceria Pro SDXC 64 GB UHS-II) | |
| Lenovo ThinkPad X1 Extreme G4-20Y5CTO1WW (3050 Ti) (AV Pro V60) | |
Comunicação
A Lenovo rotula a Qualcomm WCN685x (2x2) embutida como "Qualcomm NFA-725A" É um cartão Wi-Fi 6E. Com algumas pequenas variações, o ThinkPad Z16 alcança resultados muito bons com este módulo Wi-Fi.
Nossa unidade de teste também inclui um módulo 4G da Quectel. Se você precisar do WWAN, ele já deve estar incluído em seu pedido, já que não pode ser instalado mais tarde.
| Networking | |
| Lenovo ThinkPad Z16 G1 21D5S00T00 | |
| iperf3 receive AXE11000 6GHz | |
| iperf3 receive AXE11000 | |
| iperf3 transmit AXE11000 6GHz | |
| iperf3 transmit AXE11000 | |
| Lenovo ThinkPad X1 Extreme G4-20Y5CTO1WW (3050 Ti) | |
| iperf3 transmit AX12 | |
| iperf3 receive AX12 | |
| Dell XPS 15 9520 RTX 3050 Ti | |
| iperf3 receive AXE11000 | |
| iperf3 transmit AXE11000 | |
| Dell XPS 17 9720 | |
| iperf3 receive AXE11000 | |
| iperf3 transmit AXE11000 | |
| Apple MacBook Pro 16 2021 M1 Pro | |
| iperf3 transmit AX12 | |
| iperf3 receive AX12 | |
| iperf3 receive AXE11000 | |
| iperf3 transmit AXE11000 | |
Webcam
A Lenovo dá muito espaço para a webcam em termos de design, e a câmera de 1080p também é relativamente boa para um laptop. No entanto, ainda há muito espaço para melhorias, e o disparador de auto-foguetes em um smartphone ainda é muito melhor.


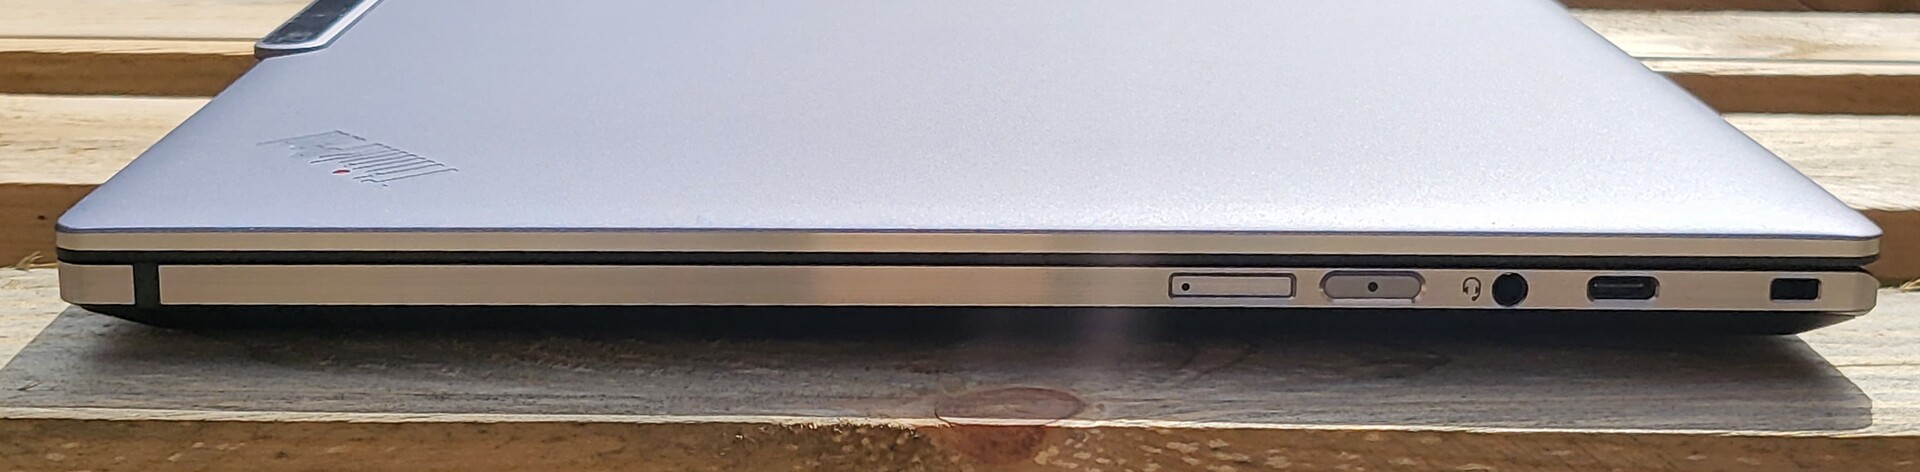
Segurança
Além do dTMP, o Lenovo ThinkPad Z16 também inclui um leitor de impressões digitais no teclado, a câmera infravermelha para Windows Hello, e uma fechadura Kensington Lock. O que não está incluído é um leitor de cartões inteligentes e um obturador de webcam físico, mas você pode desligar a câmera eletronicamente pressionando a tecla F9 em seu lugar.
Acessórios
Além do carregador de 135 watts com um conector USB-C, nenhum outro acessório está incluído.
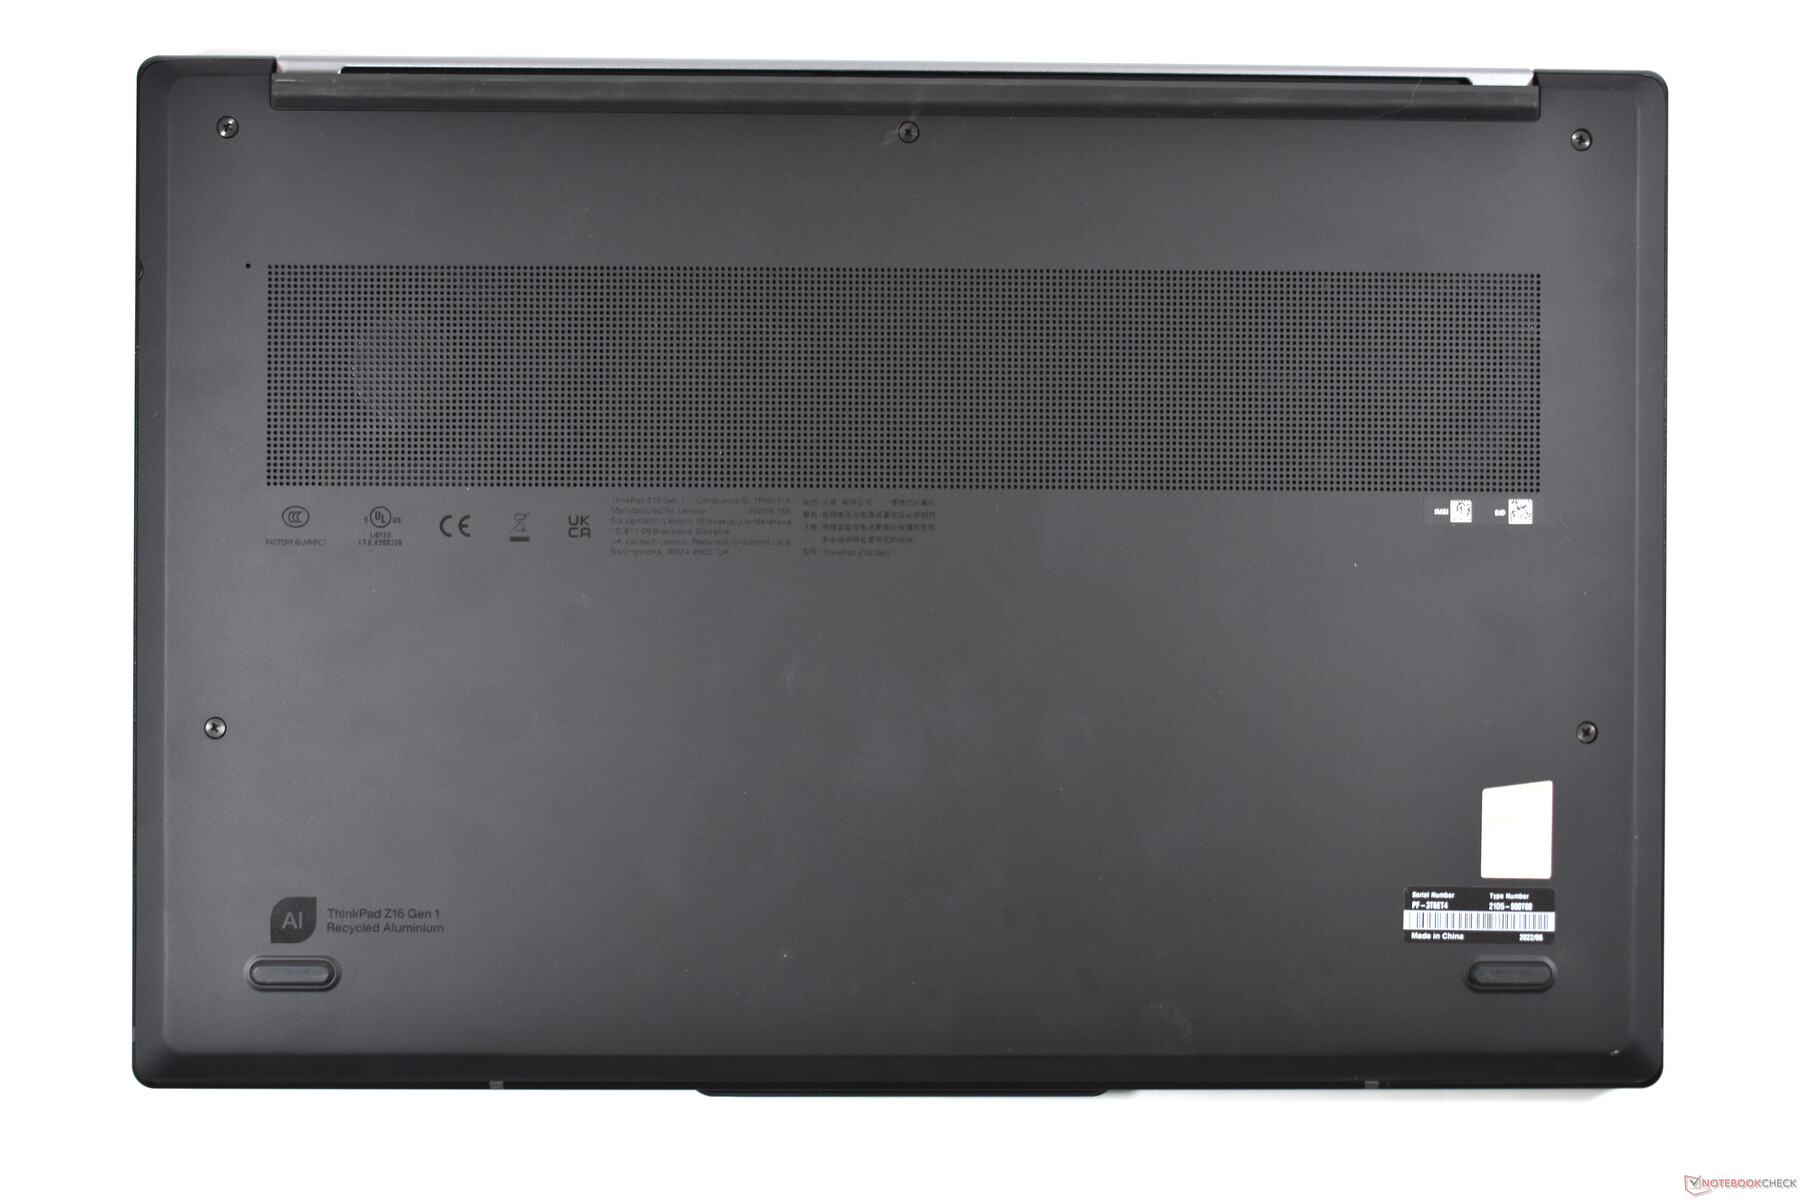
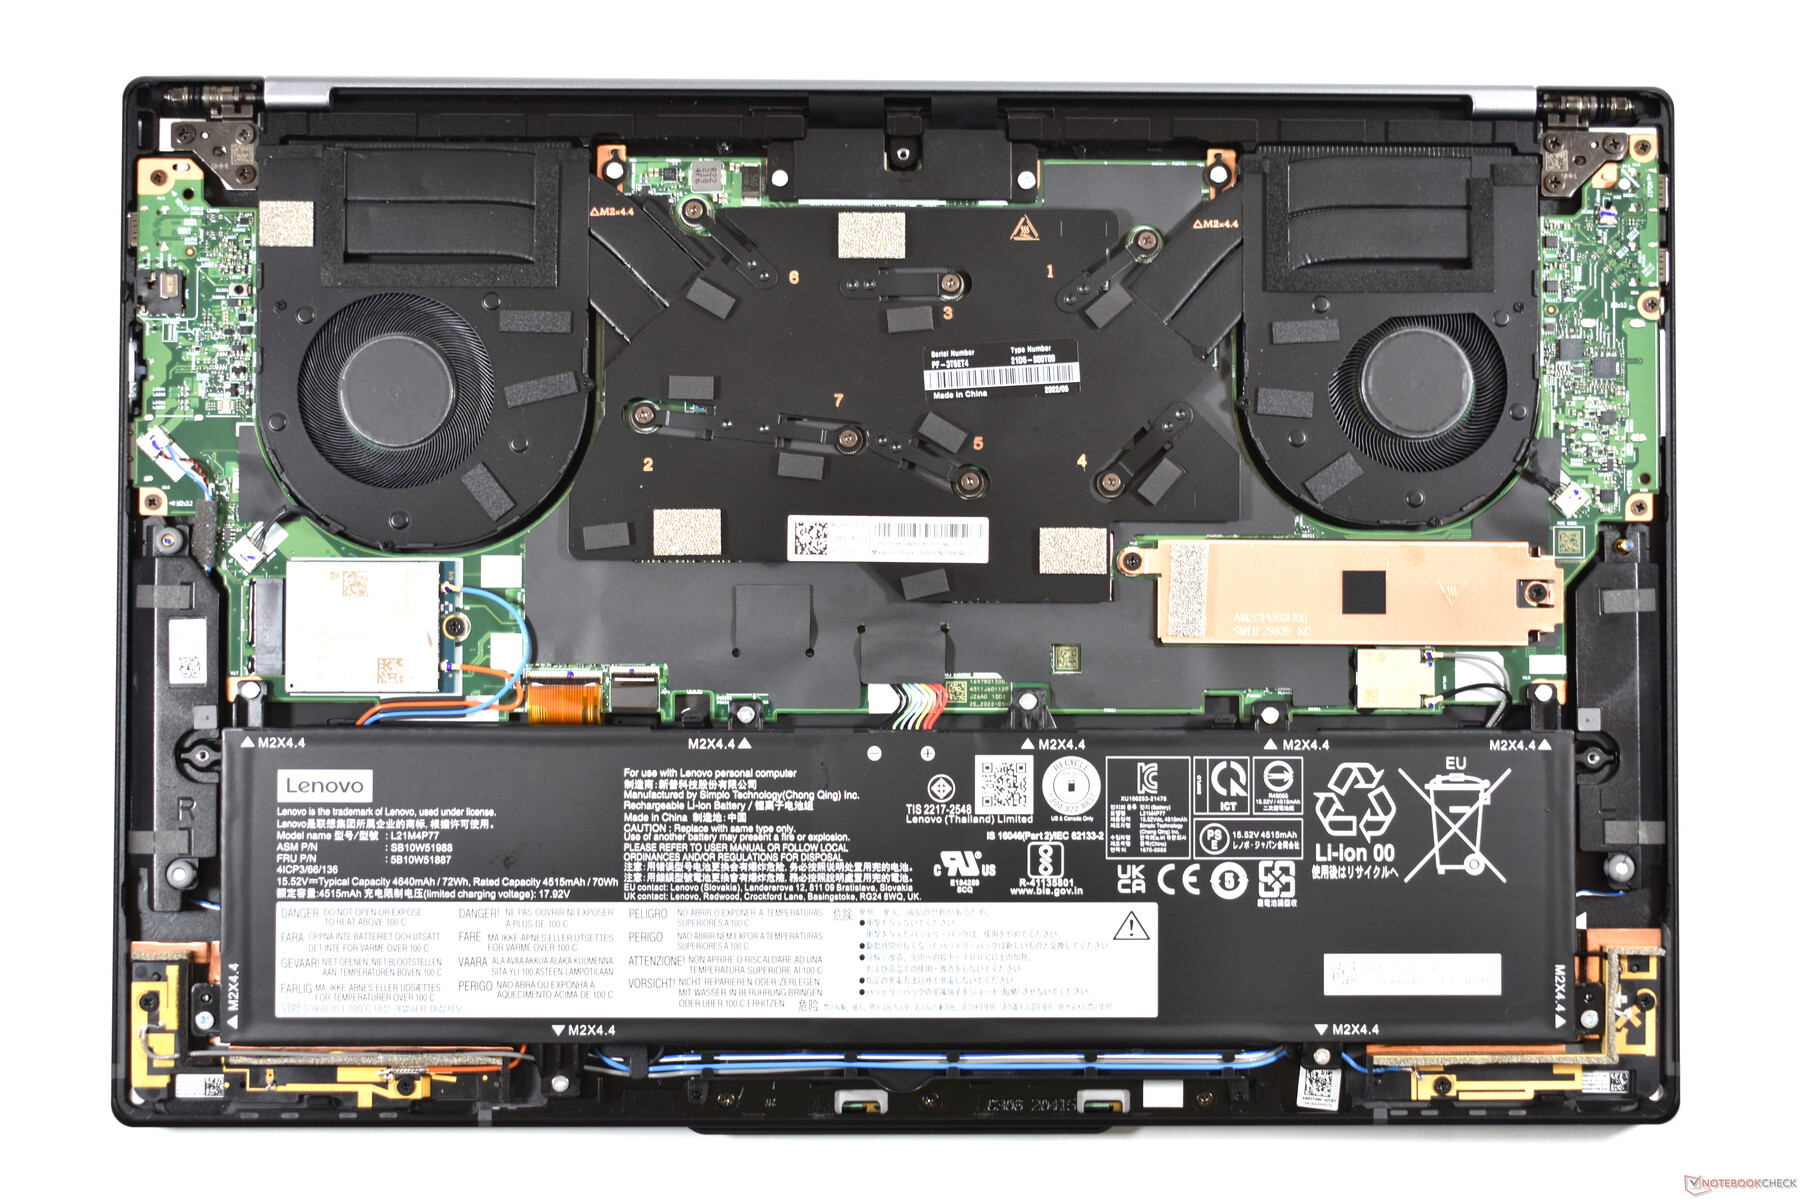
Manutenção
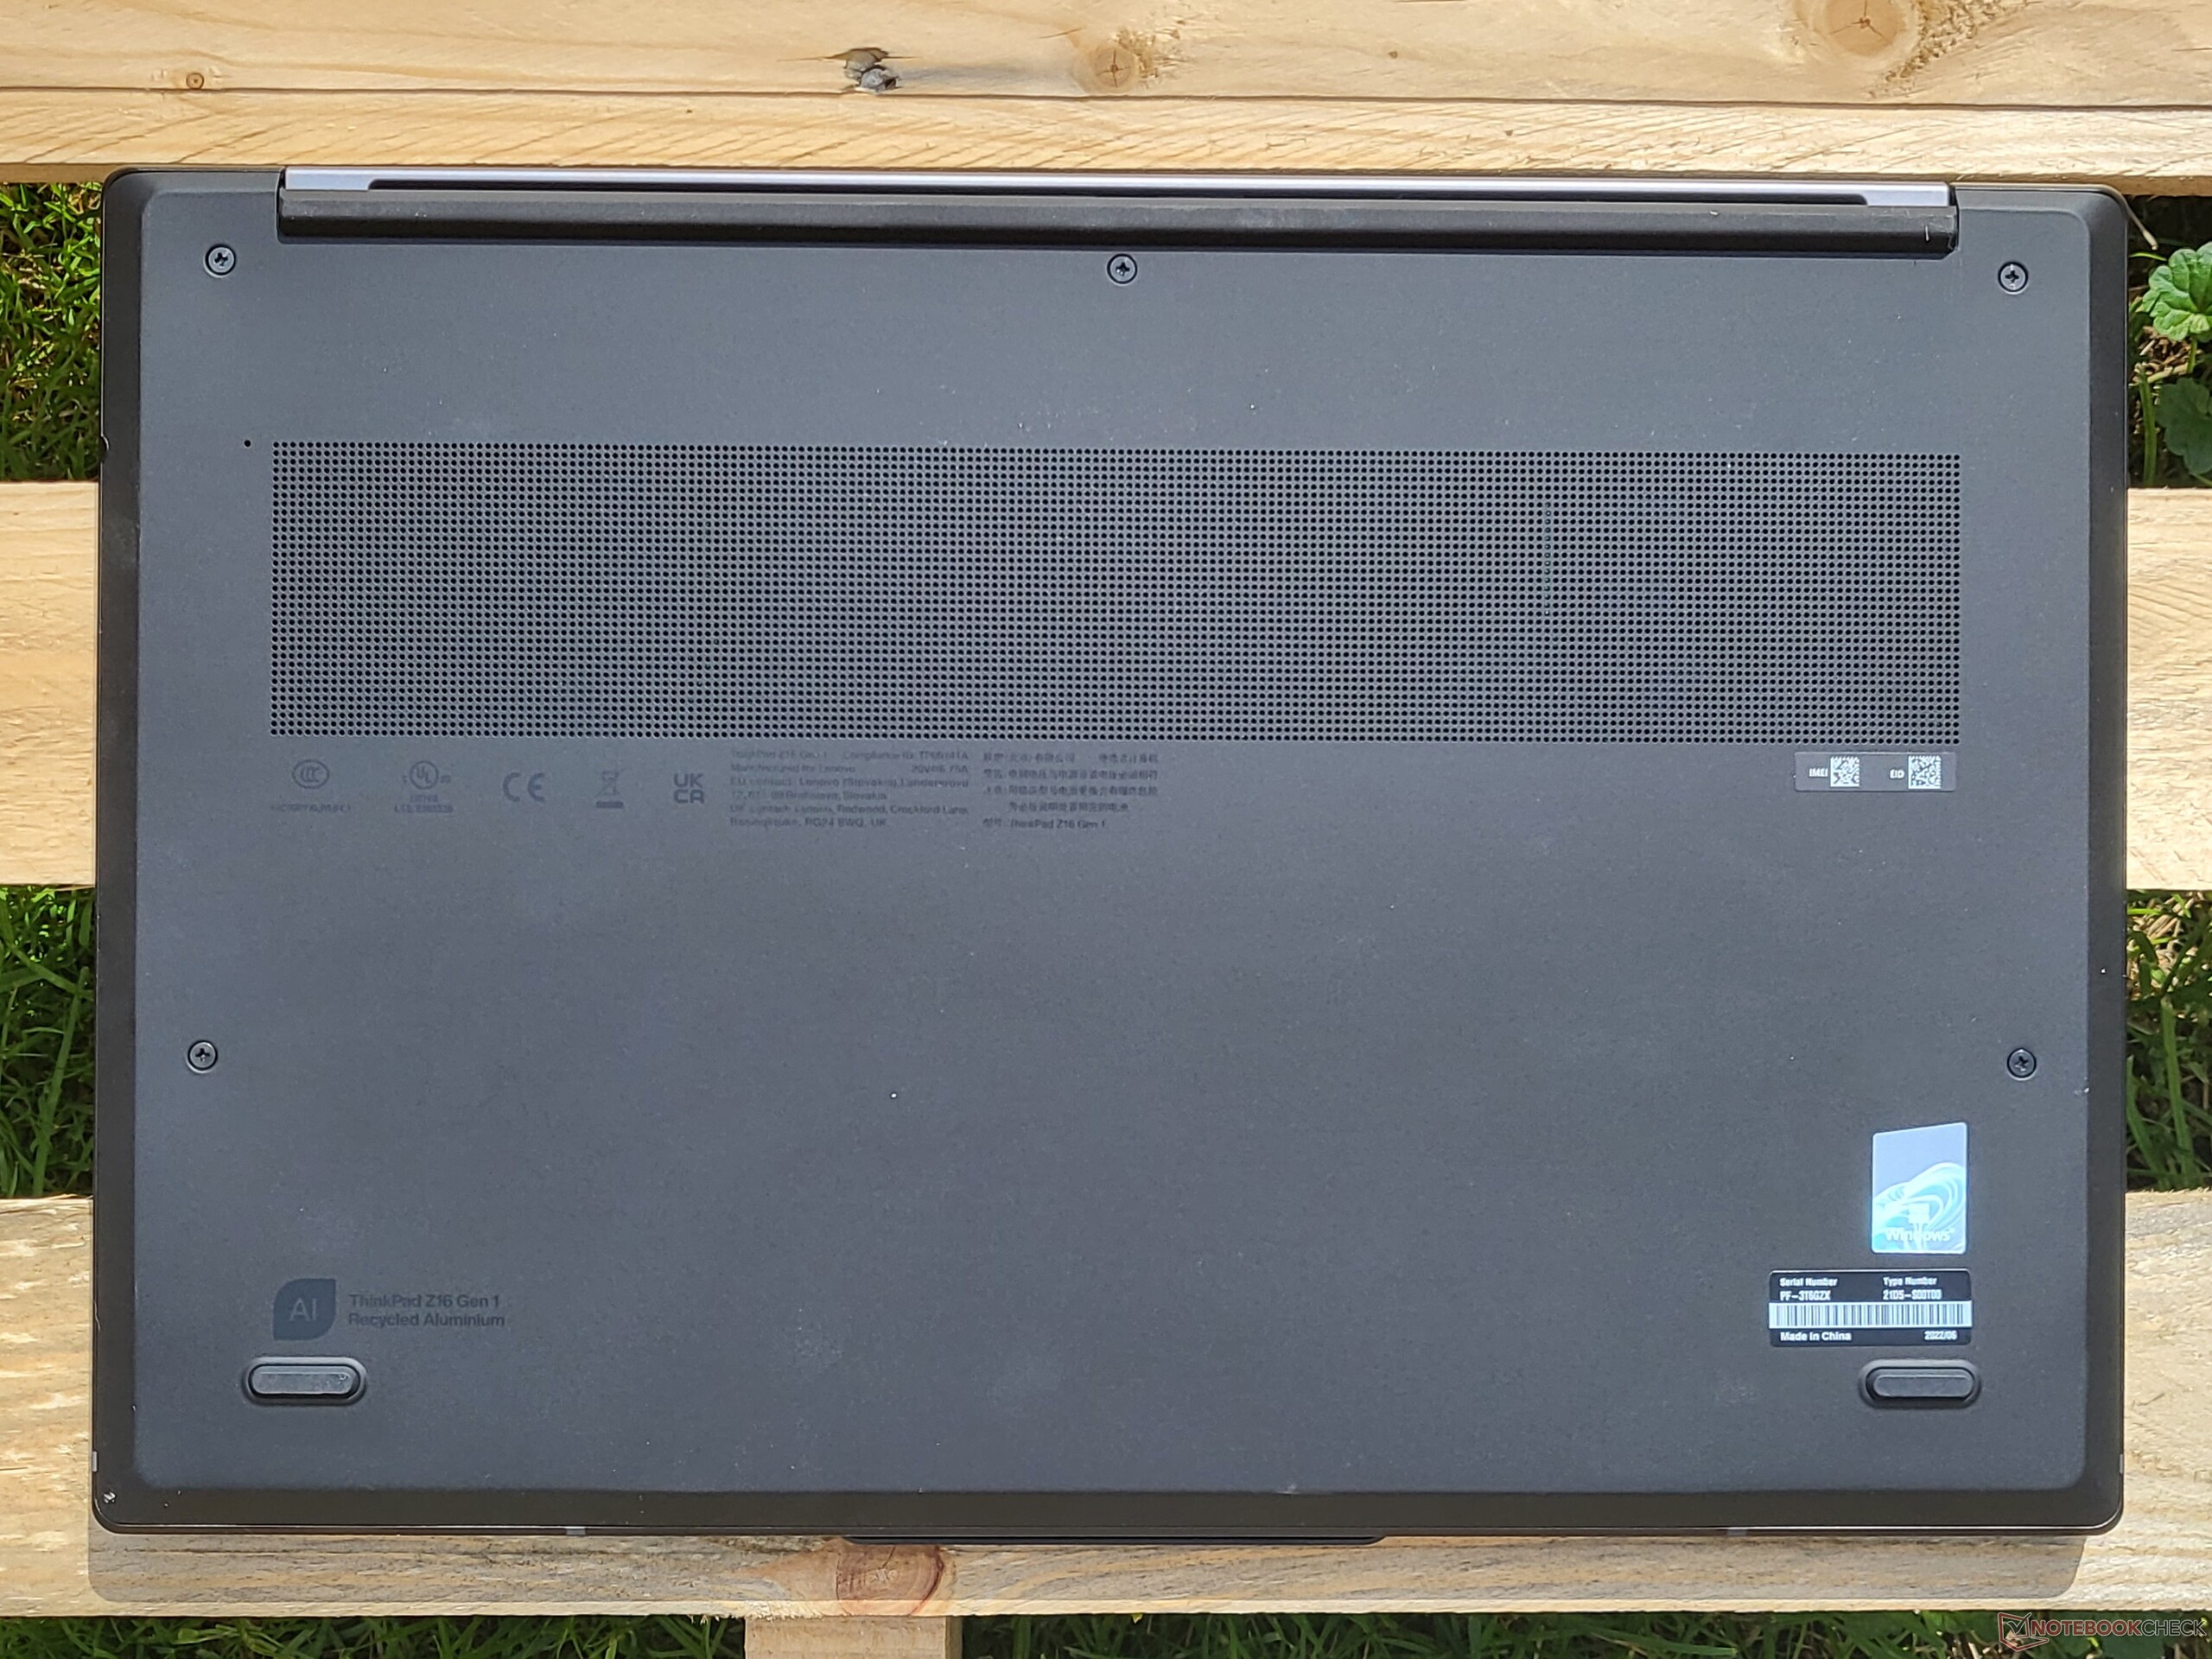
A Lenovo facilita muito o acesso ao interior do ThinkPad Z16 Gen 1. Após remover os cinco parafusos Philips, você pode remover diretamente a tampa traseira. Infelizmente, não há muitas opções para atualizações, e o ThinkPad Z16 não é muito modular para um laptop tão grande. A RAM e o módulo Wi-Fi são soldados e há apenas um único slot M.2-2280. O cartão WWAN ocupa um slot M.2-2242
É claro que você pode limpar os ventiladores ou substituir a bateria, mas o portátil ThinkPad nos desaponta claramente em termos de opções de atualização. Tanto os modelos Dell XPS como o ThinkPad X1 Extremesão significativamente mais modulares.
Garantia
Nossa unidade de teste é um modelo especial da Campuspoint, oferecendo um pacote de garantia muito generoso: 36 meses de serviço no local e "Premier Support" A garantia varia dependendo do país, e os ThinkPads são frequentemente vendidos com apenas um ano de garantia nos EUA. Entretanto, em todos os casos a garantia pode ser expandida até cinco anos e também atualizada por serviços tais como a substituição da bateria integrada. Além disso, o Z16 também inclui uma garantia internacional como um ThinkPad, mas não há nenhum serviço no local fora de seu país de compra.
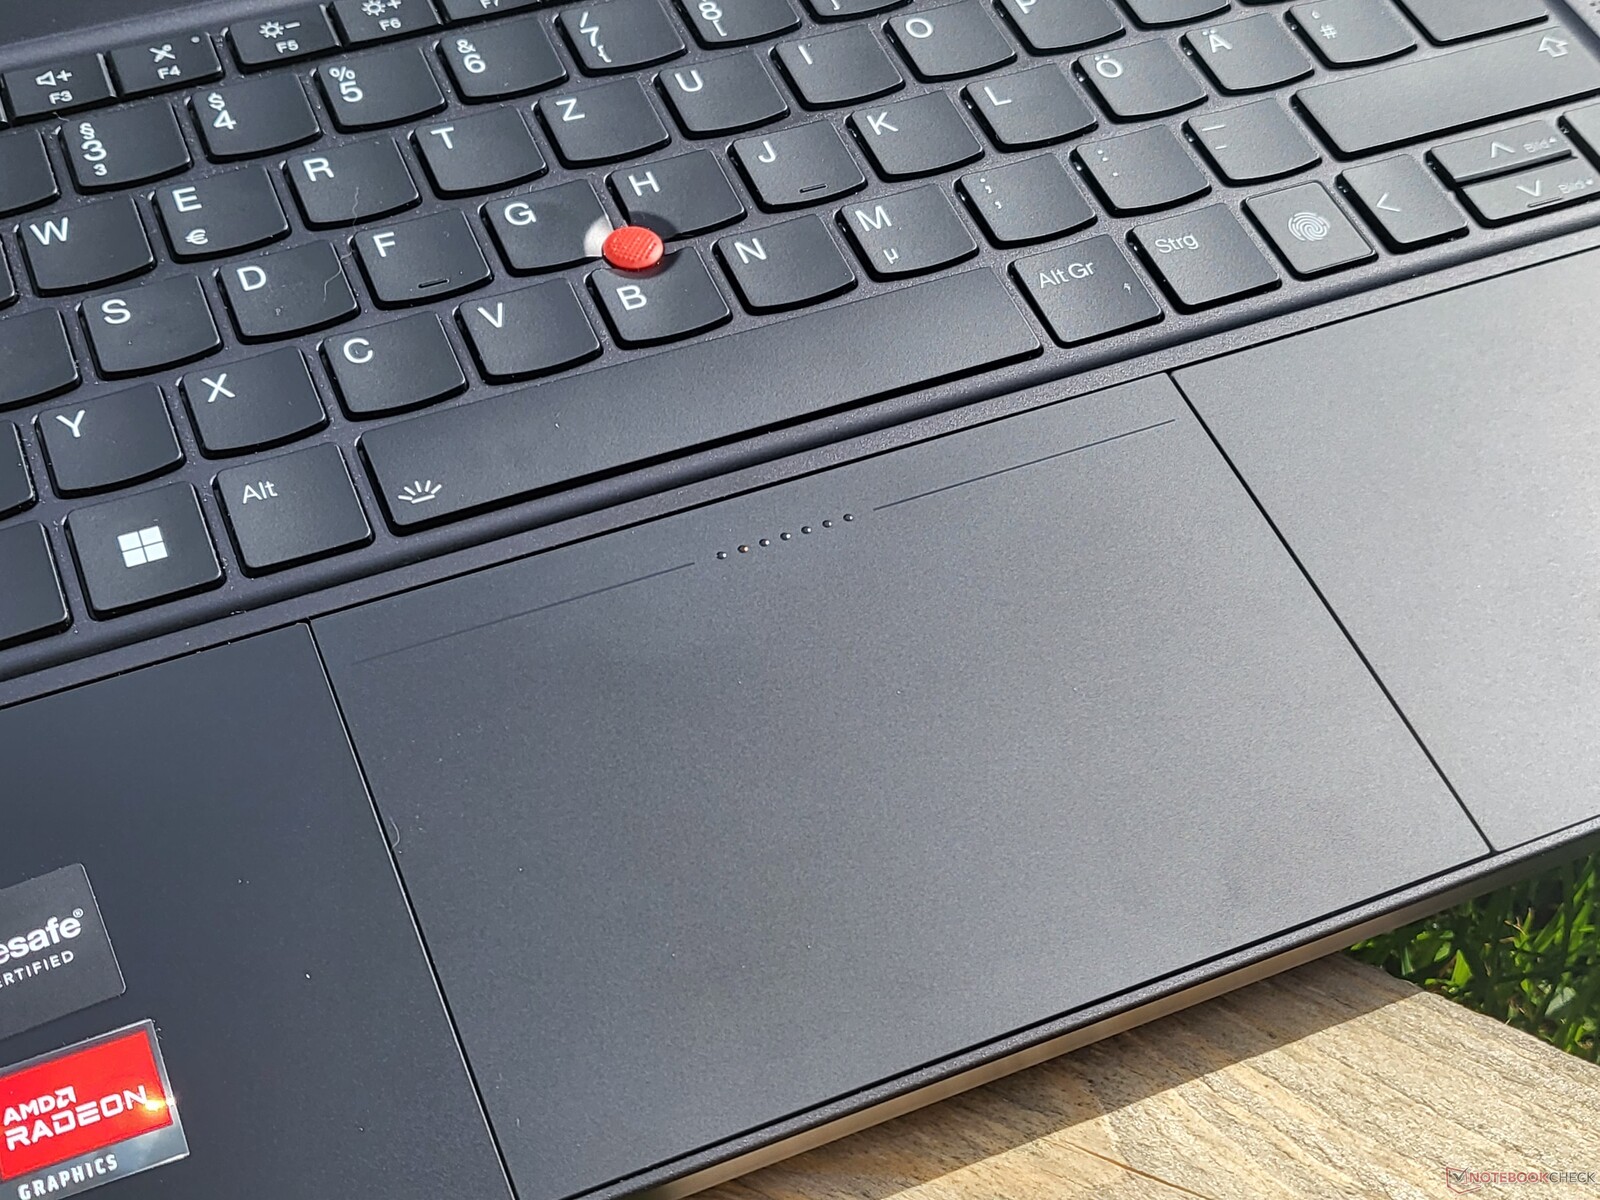
Dispositivos de entrada: O melhor touchpad em um ThinkPad Lenovo
Teclado
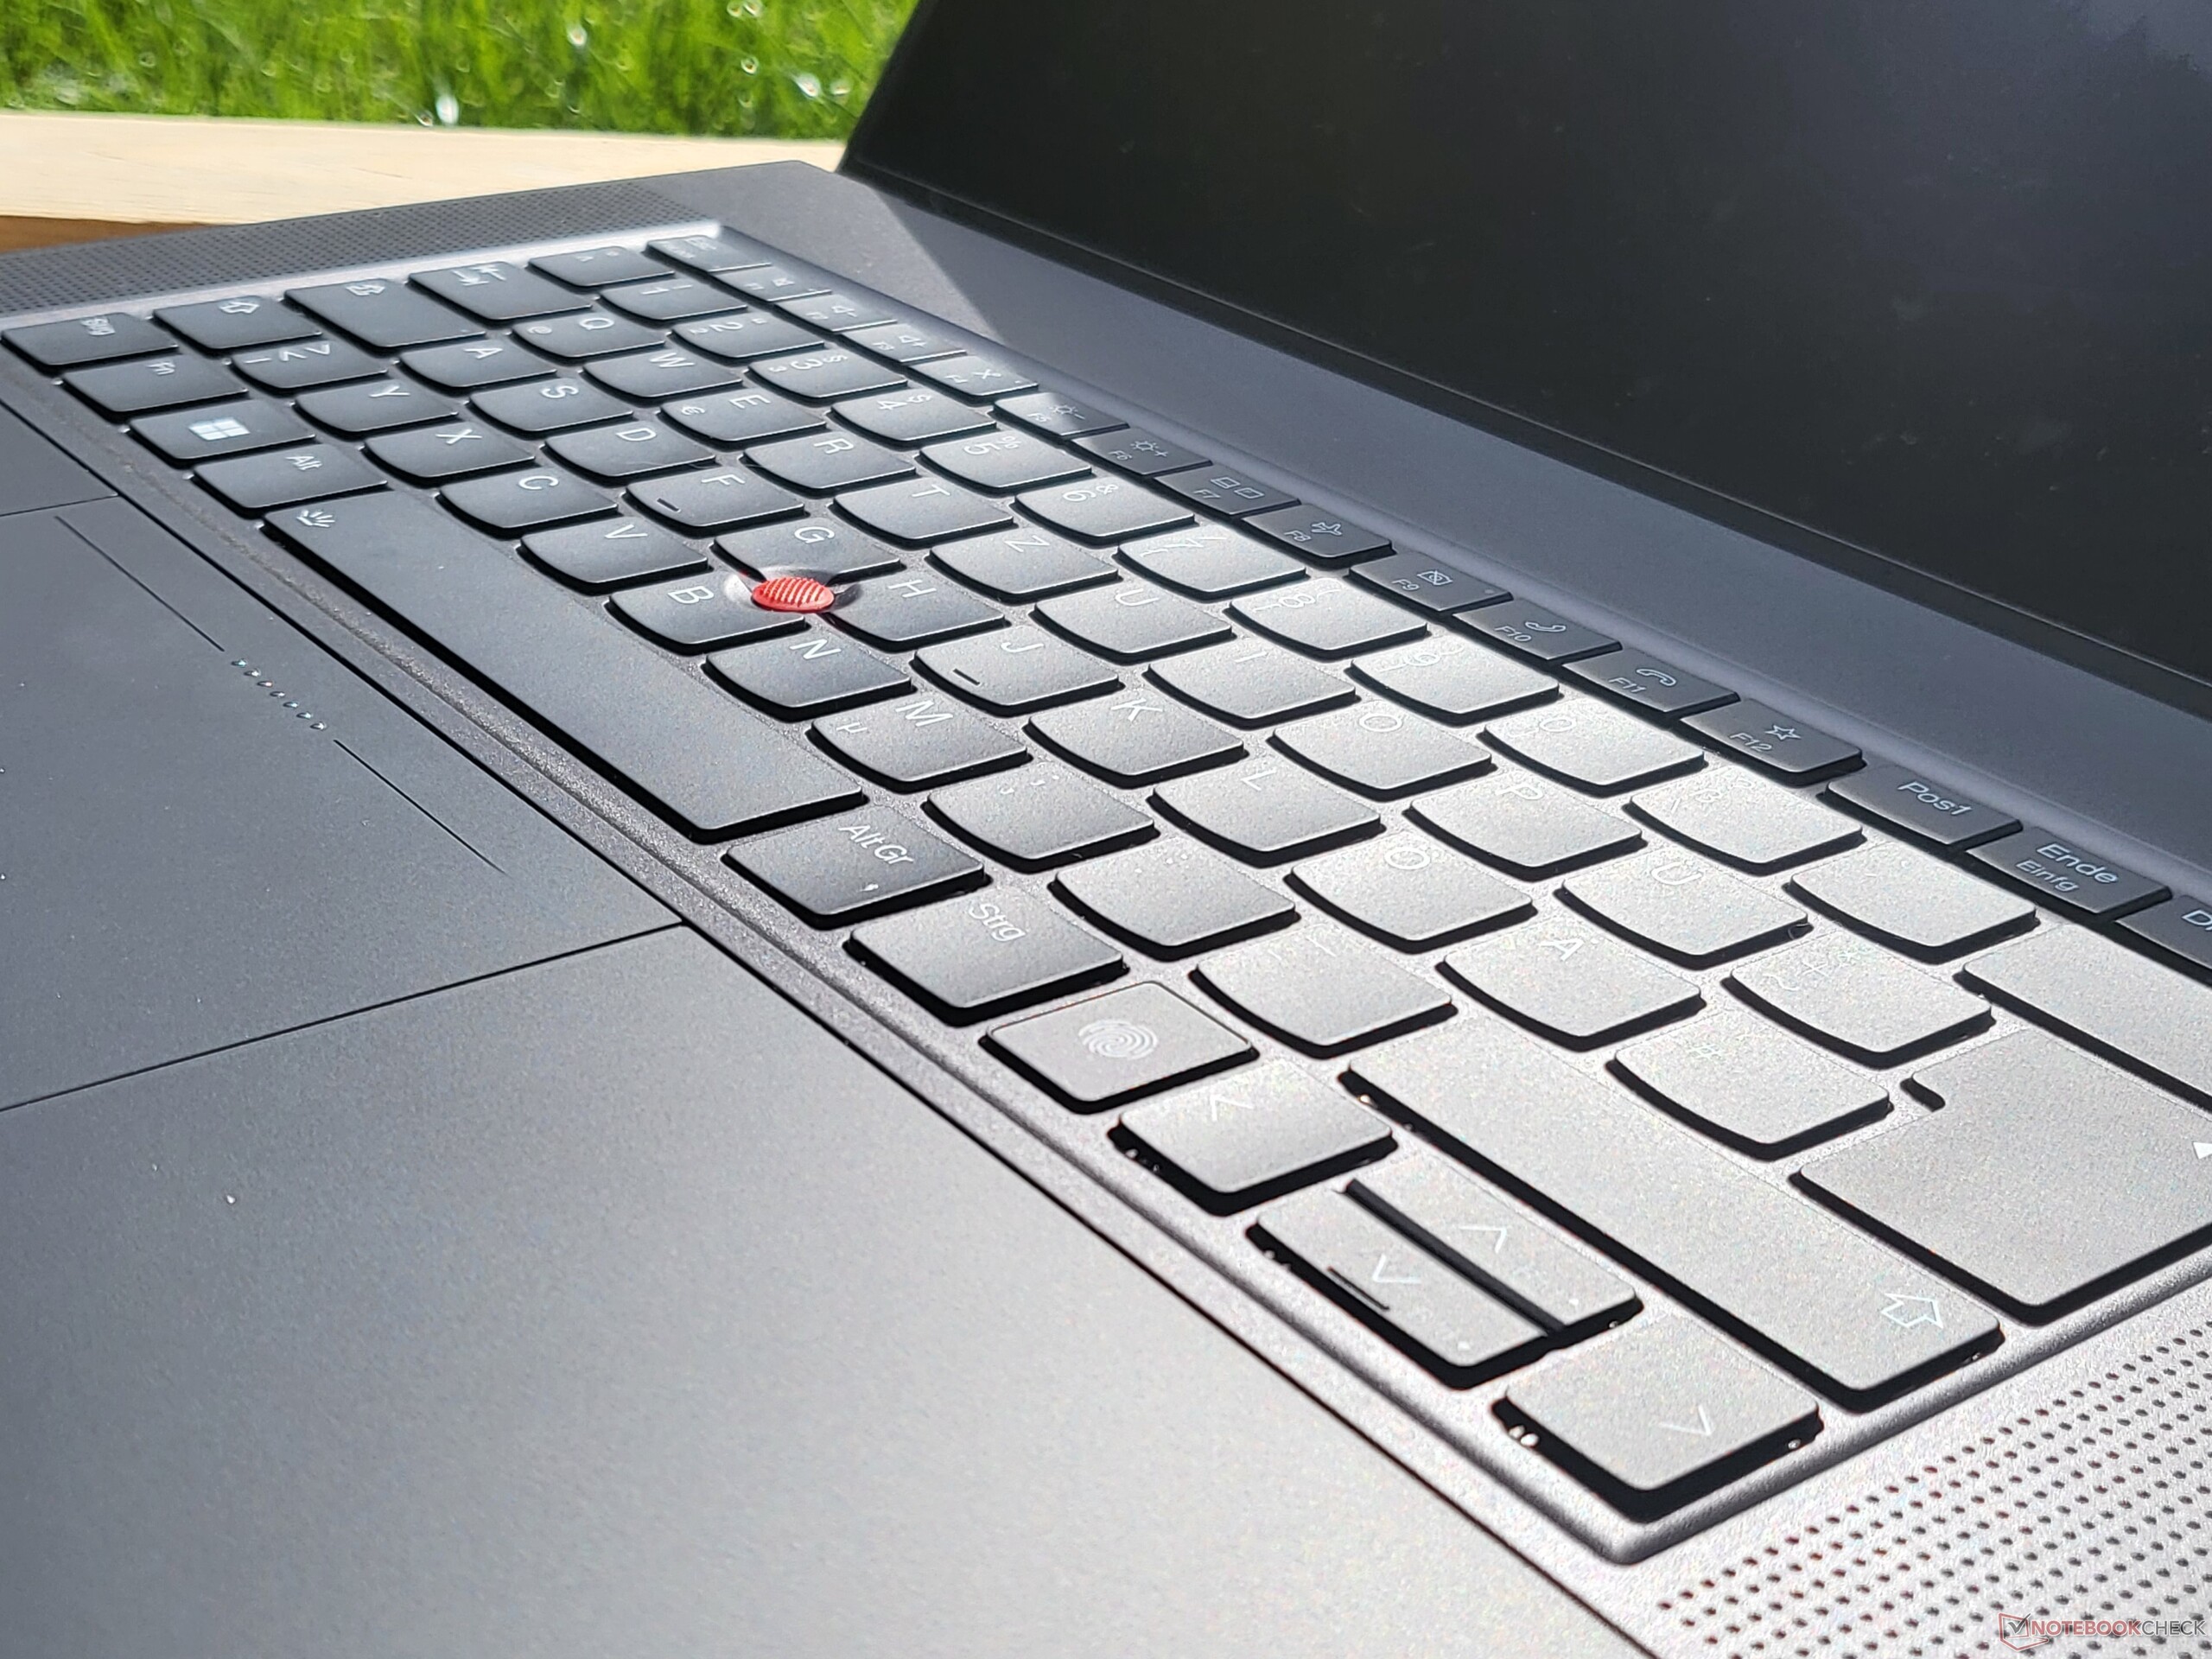
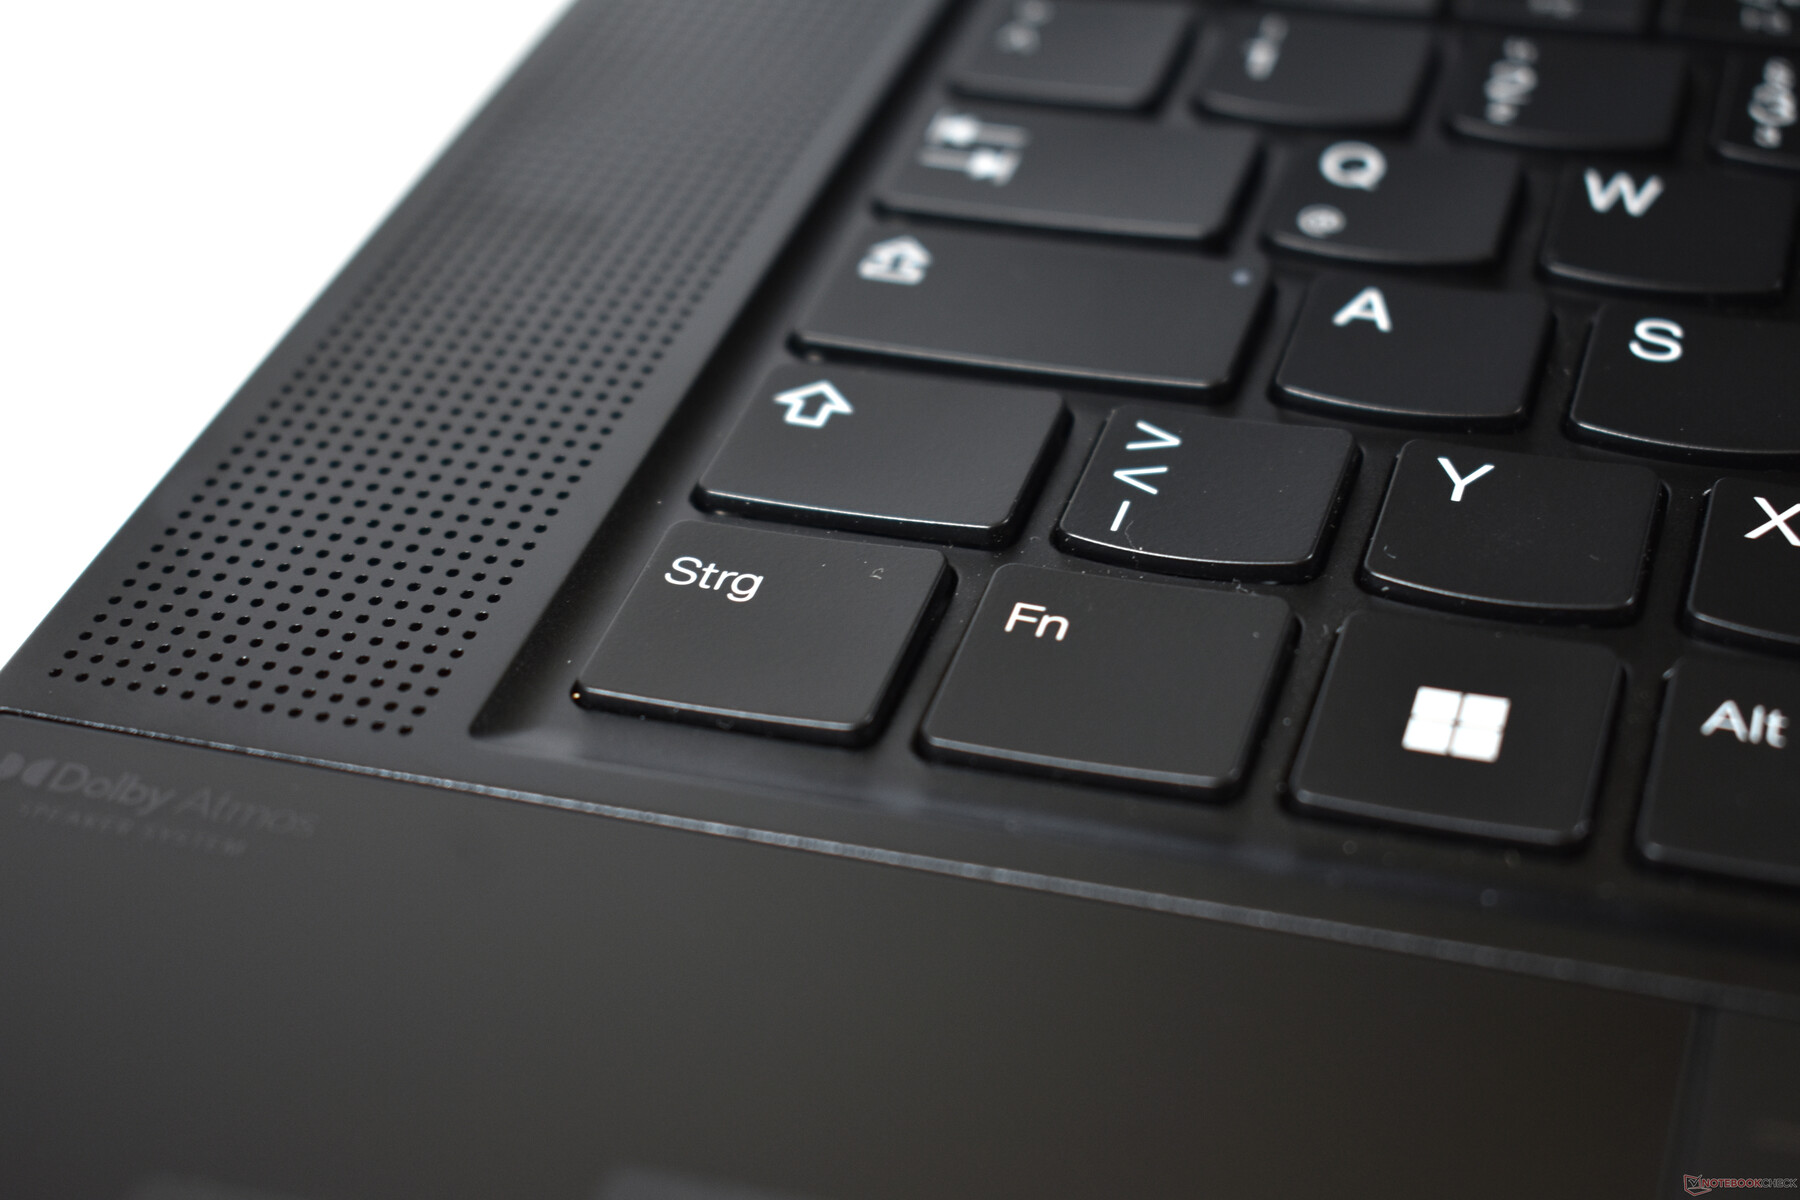
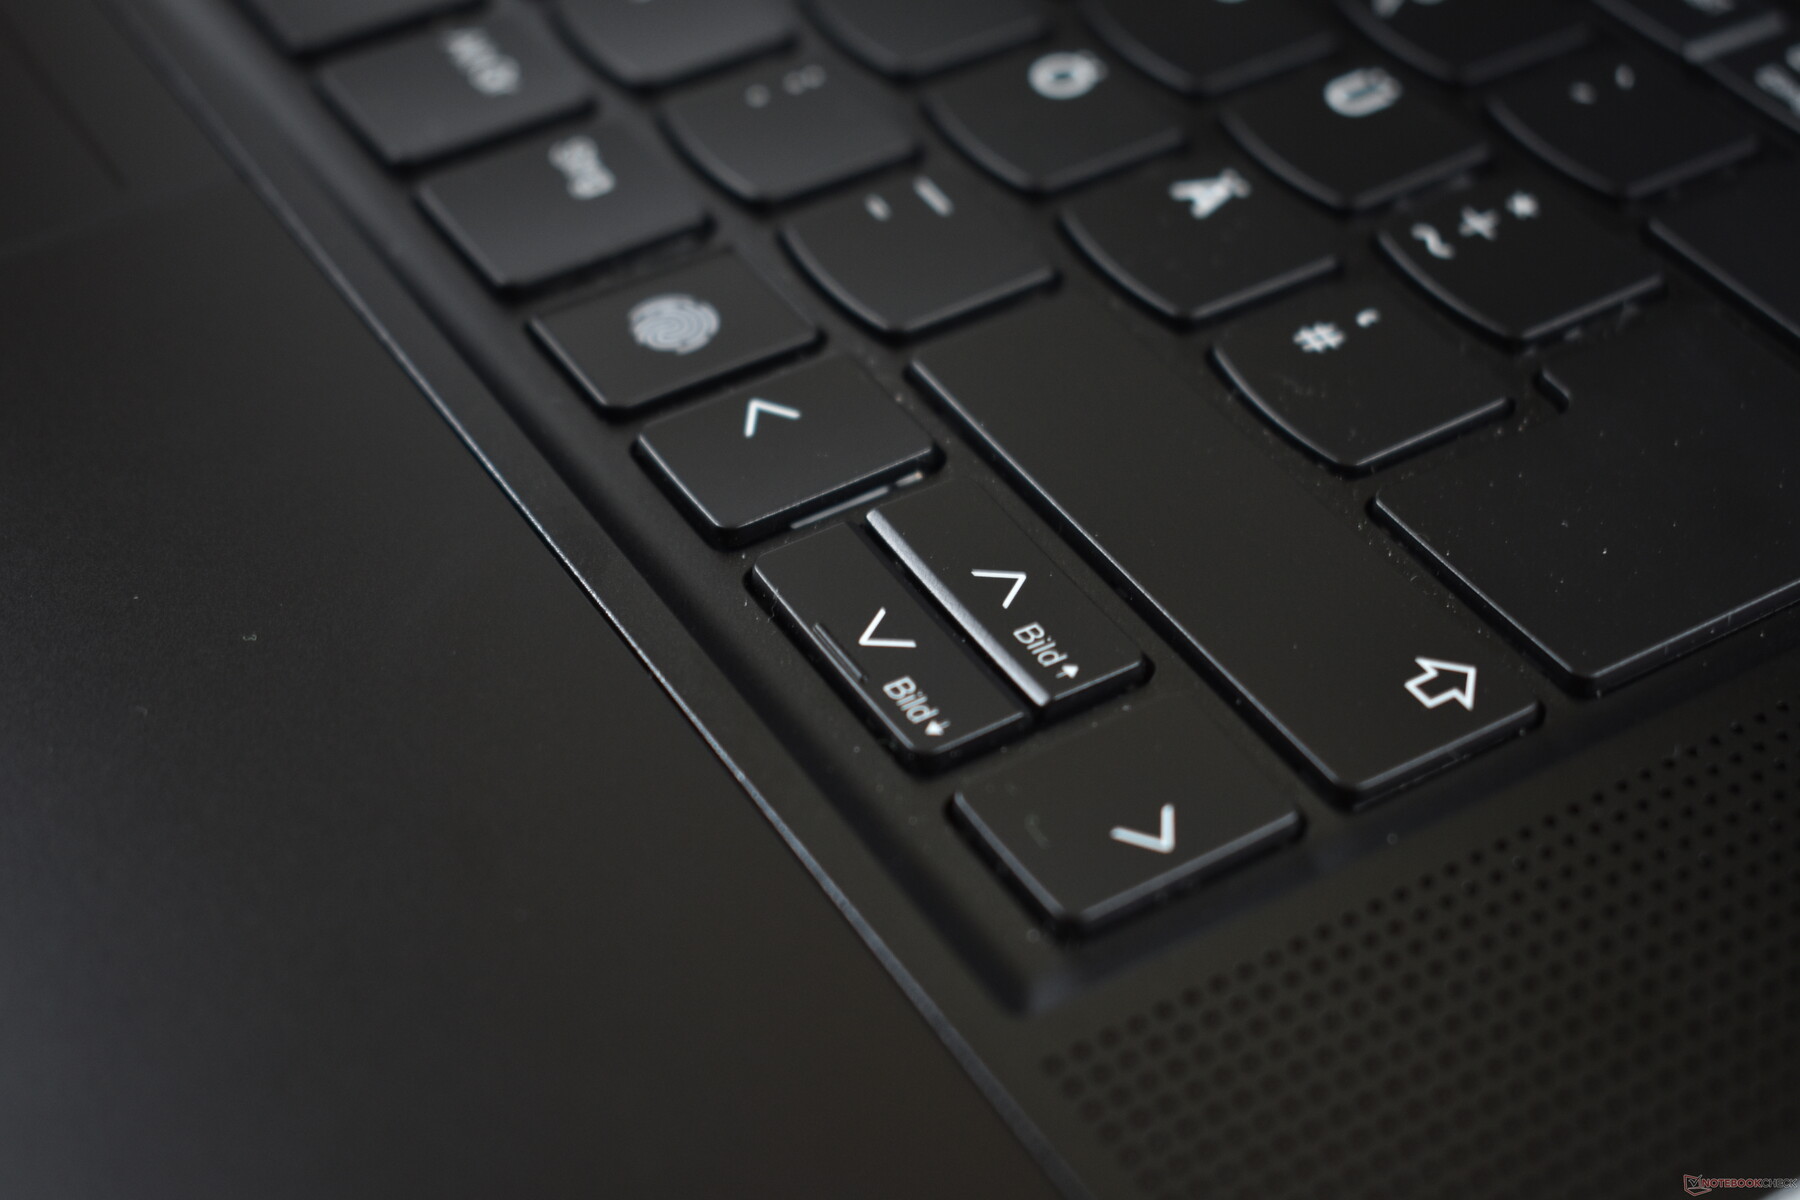
O teclado de dois níveis com luz de fundo também está mais próximo do computador portátil convencional, e as teclas externas não têm mais a forma da tecla em forma de U ThinkPad-typical. A Lenovo também forçou o teclado em geral a uma forma retangular e removeu o recesso para as teclas de seta que, de outra forma, é usual para o ThinkPad. Junto com esta mudança, as teclas de imagem para cima/para baixo também foram removidas. E finalmente, a Lenovo também trocou as teclas Ctrl e Fn, com a tecla Ctrl ficando agora do lado de fora.
Oferecendo um curso da chave de apenas 1,35 mm (~0,053 in), as chaves são novamente mais finas do que em muitos outros laptops ThinkPad atuais. Por exemplo, o X1 Extreme oferece 1,5 mm (~0,059 pol.). Além disso, as tampas das teclas são mais planas. Isto resulta em uma experiência de digitação menos luxuosa e não muito típica do ThinkPad. Entretanto, comparado ao Dell XPS e ao MacBook Pro, o teclado é ainda melhor, oferecendo um ponto de pressão claro e nítido e uma resistência que é simplesmente correta. Com 28,5 cm (~11,2 pol.), o teclado também tem a largura padrão completa.
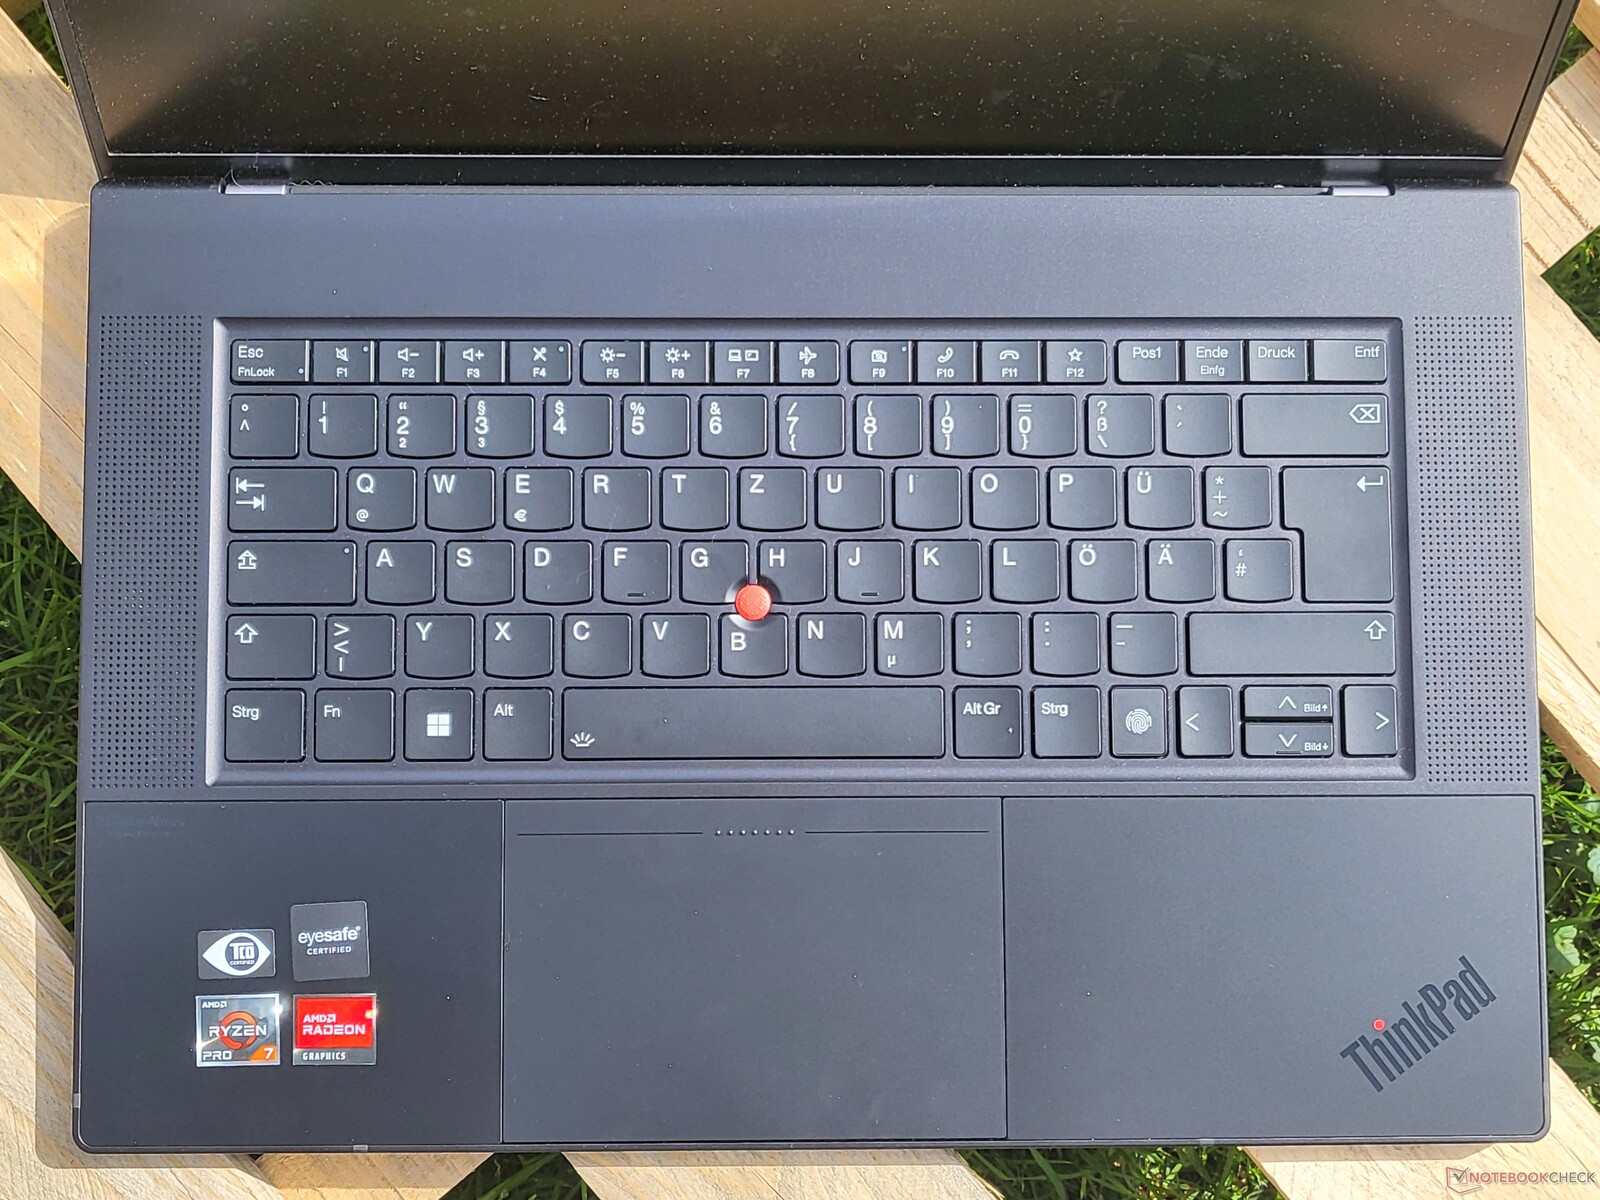
TrackPad e TrackPoint
Sem mais delongas: O Z16 tem o melhor e também o maior TrackPad (12 x 8 cm) de todos os ThinkPads atuais. A superfície é feita de vidro fosco, assim como o apoio de palma. Isto tem uma qualidade extremamente alta e também garante características ideais de deslizamento. O motor háptico do ClickPad, que simula cliques reais, também é muito bom. O ClickPad pode ser clicado uniformemente em qualquer lugar, em contraste com os TrackPads mecânicos usuais que você só pode usar para clicar na área inferior. Com sua háptica de alta qualidade, implementação de software e tamanho espaçoso, o portátil ThinkPad pode ser operado com extrema comodidade usando o touchpad.
Em comparação com outros ThinkPads, o que é um pouco menos confortável é o TrackPoint sem nenhuma chave dedicada. Por outro lado, o TrackPoint continua a ser uma ótima opção, se você tiver que mover rapidamente o cursor do mouse enquanto digita. Nesta solução táctil, as teclas TrackPoint integradas são melhores do que pensávamos anteriormente.
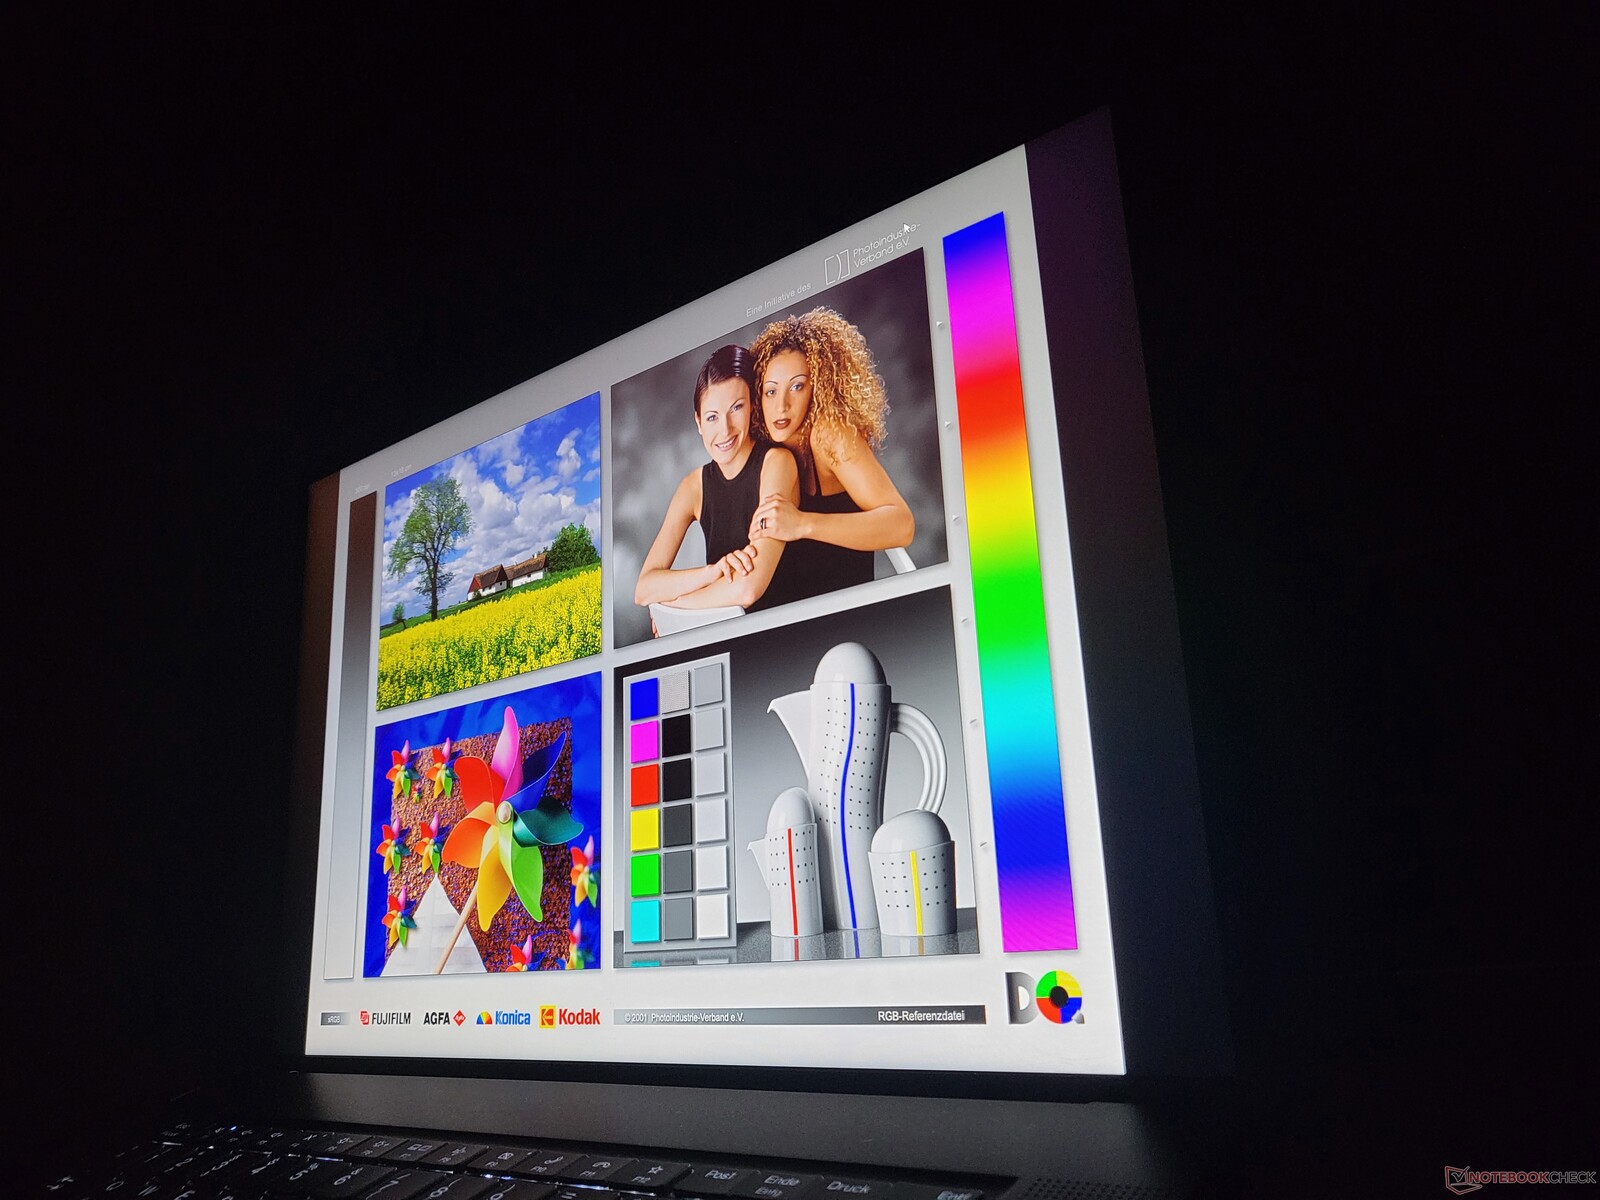
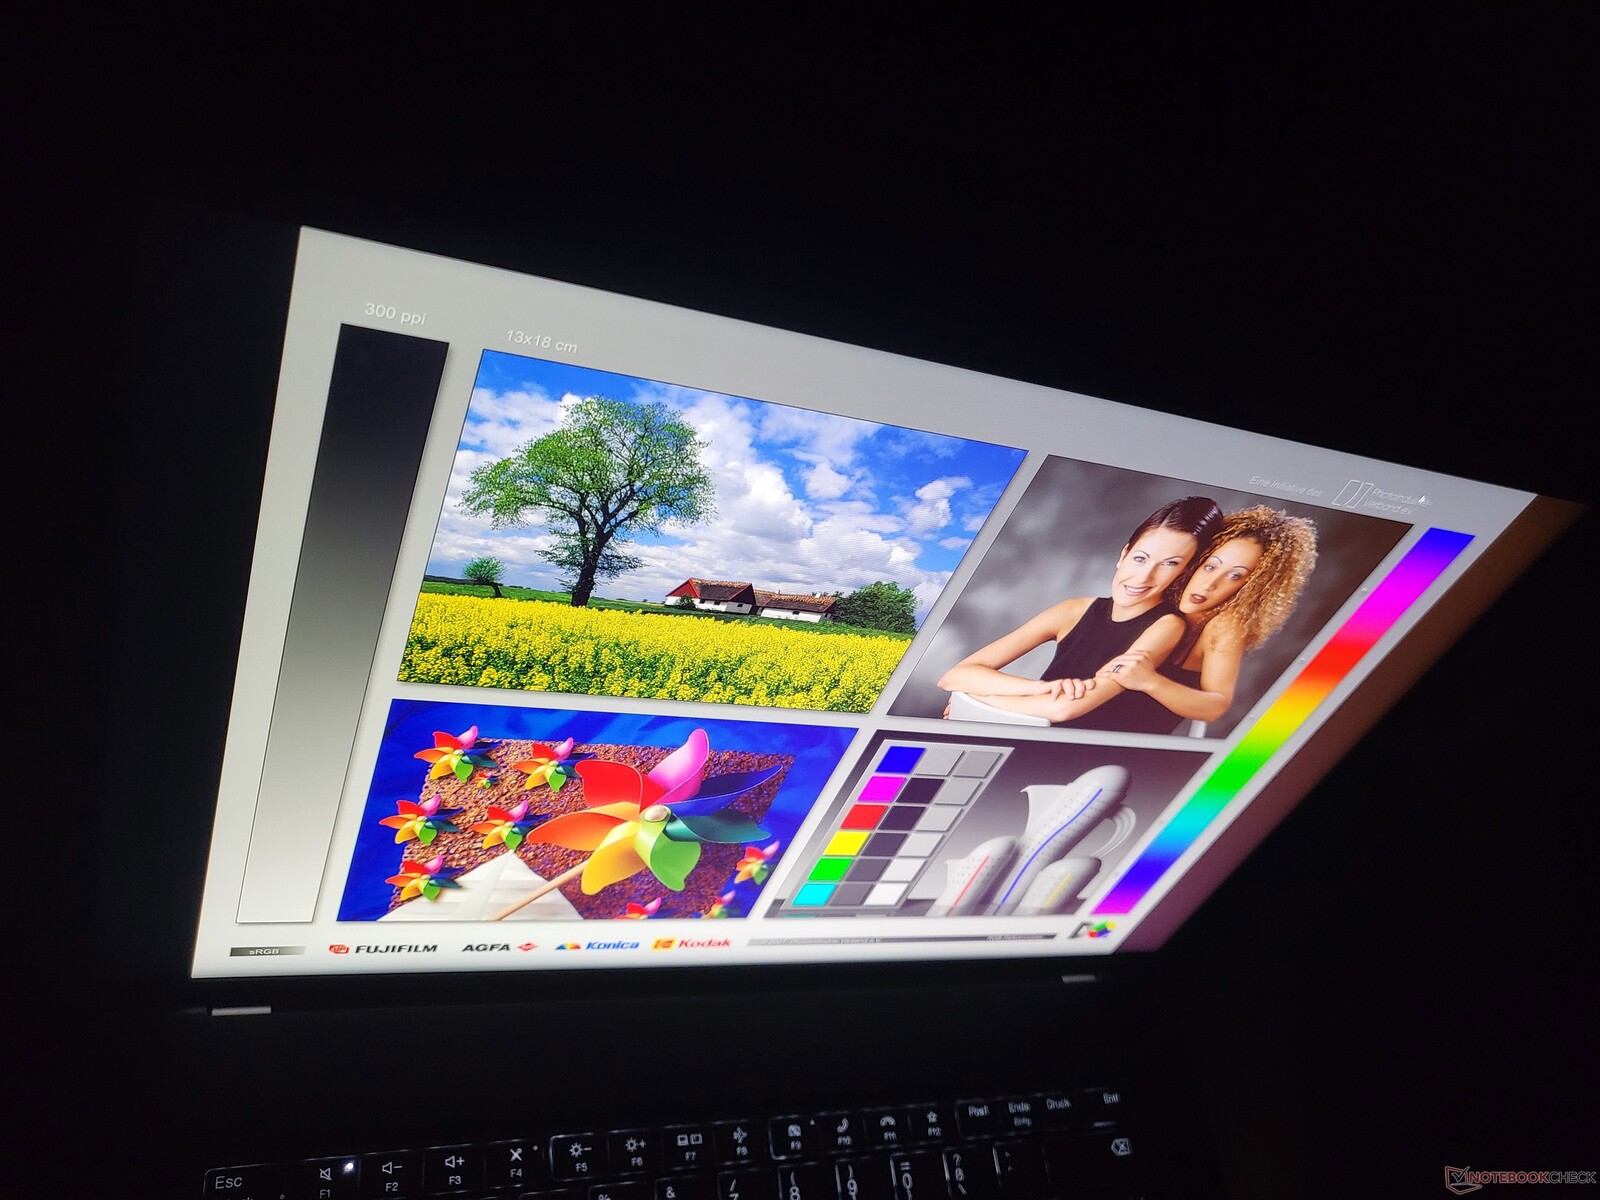
ThinkPad Z16 Gen 1: visor Matte WUXGA com um bom brilho
A Lenovo quase sempre oferece várias opções de exibição com seus laptops ThinkPad, e o Lenovo ThinkPad Z16 Gen 1 não é uma exceção a esta regra. Os compradores podem escolher entre os seguintes displays que têm todos o formato 16:10 e diagonal de 16 polegadas em comum
- IPS WUXGA (1.920 x 1.200), 400 cd/m², fosco, 100% sRGB, baixa potência
- IPS WUXGA (1.920 x 1.200), 400 cd/m², semi-brilhante, 100% sRGB, Baixa Potência, Toque
- OLED WQUXGA (3.840 x 2.400), 400 cd/m² (SDR), semi-brilhante, 100 % DCI-P3, Touch, Dolby Vision
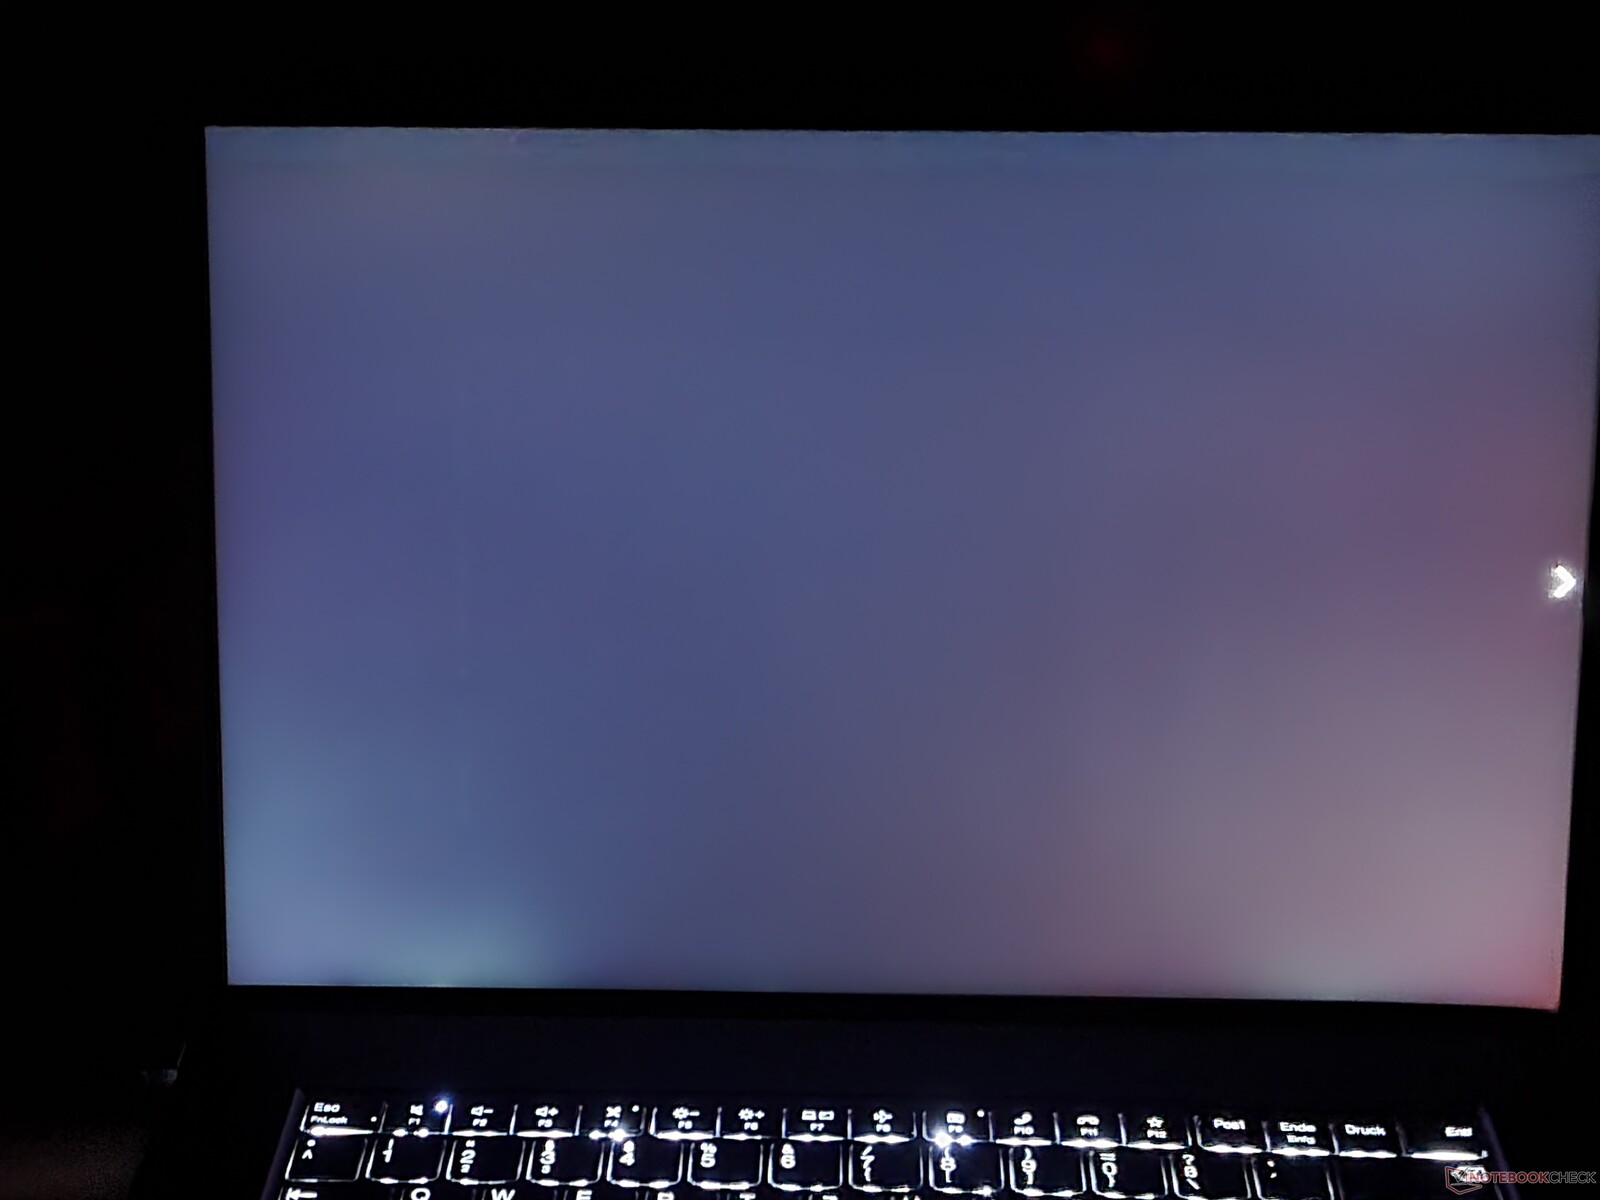
O que se destaca em comparação com o ThinkPad X1 Extreme é que não há opção 2,5K (2.560 x 1.600). Os usuários têm que selecionar entre uma resolução bastante baixa e uma muito alta. No caso de nossa unidade de teste, nós temos a opção básica. Isto mais do que cumpre os 400 cd/m² prometidos, já que o brilho médio é de 446 cd/m².
| |||||||||||||||||||||||||
iluminação: 83 %
iluminação com acumulador: 487 cd/m²
Contraste: 1571:1 (Preto: 0.31 cd/m²)
ΔE ColorChecker Calman: 1.8 | ∀{0.5-29.43 Ø4.73}
calibrated: 0.8
ΔE Greyscale Calman: 2.3 | ∀{0.09-98 Ø4.97}
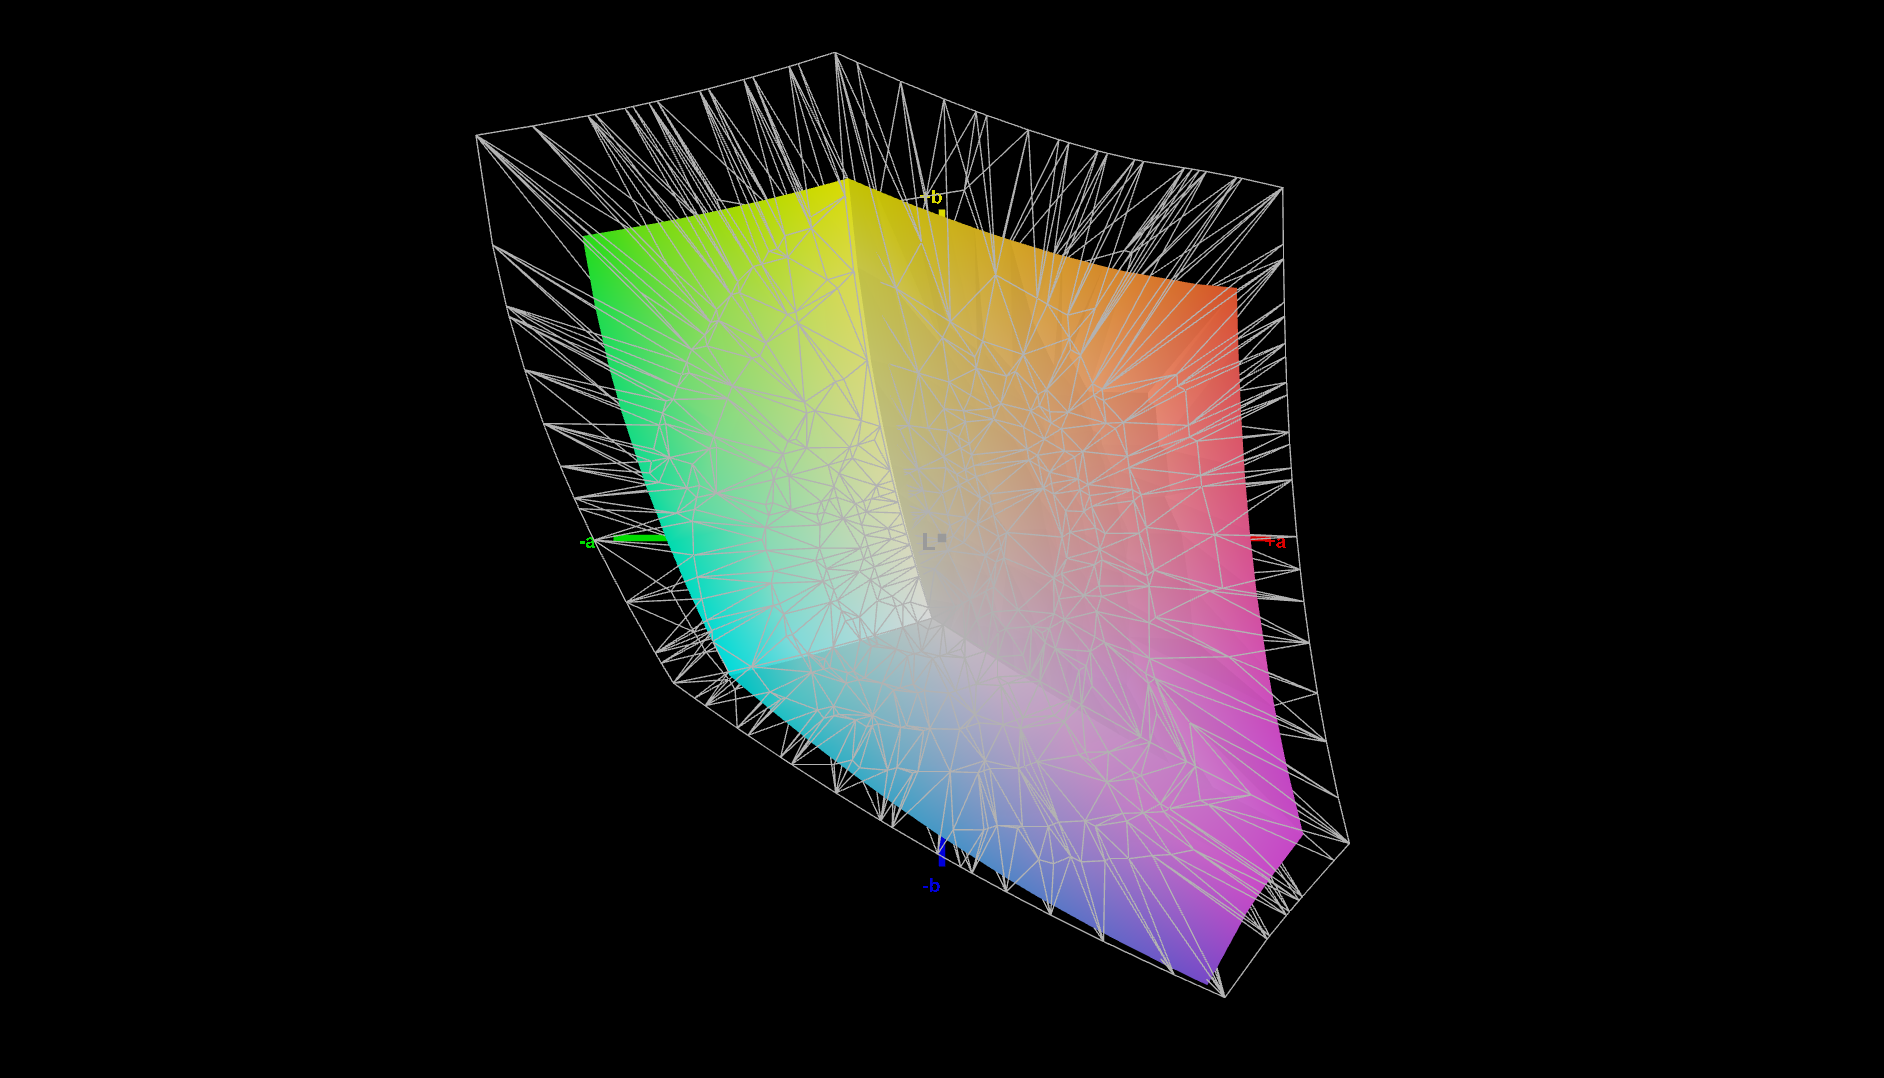
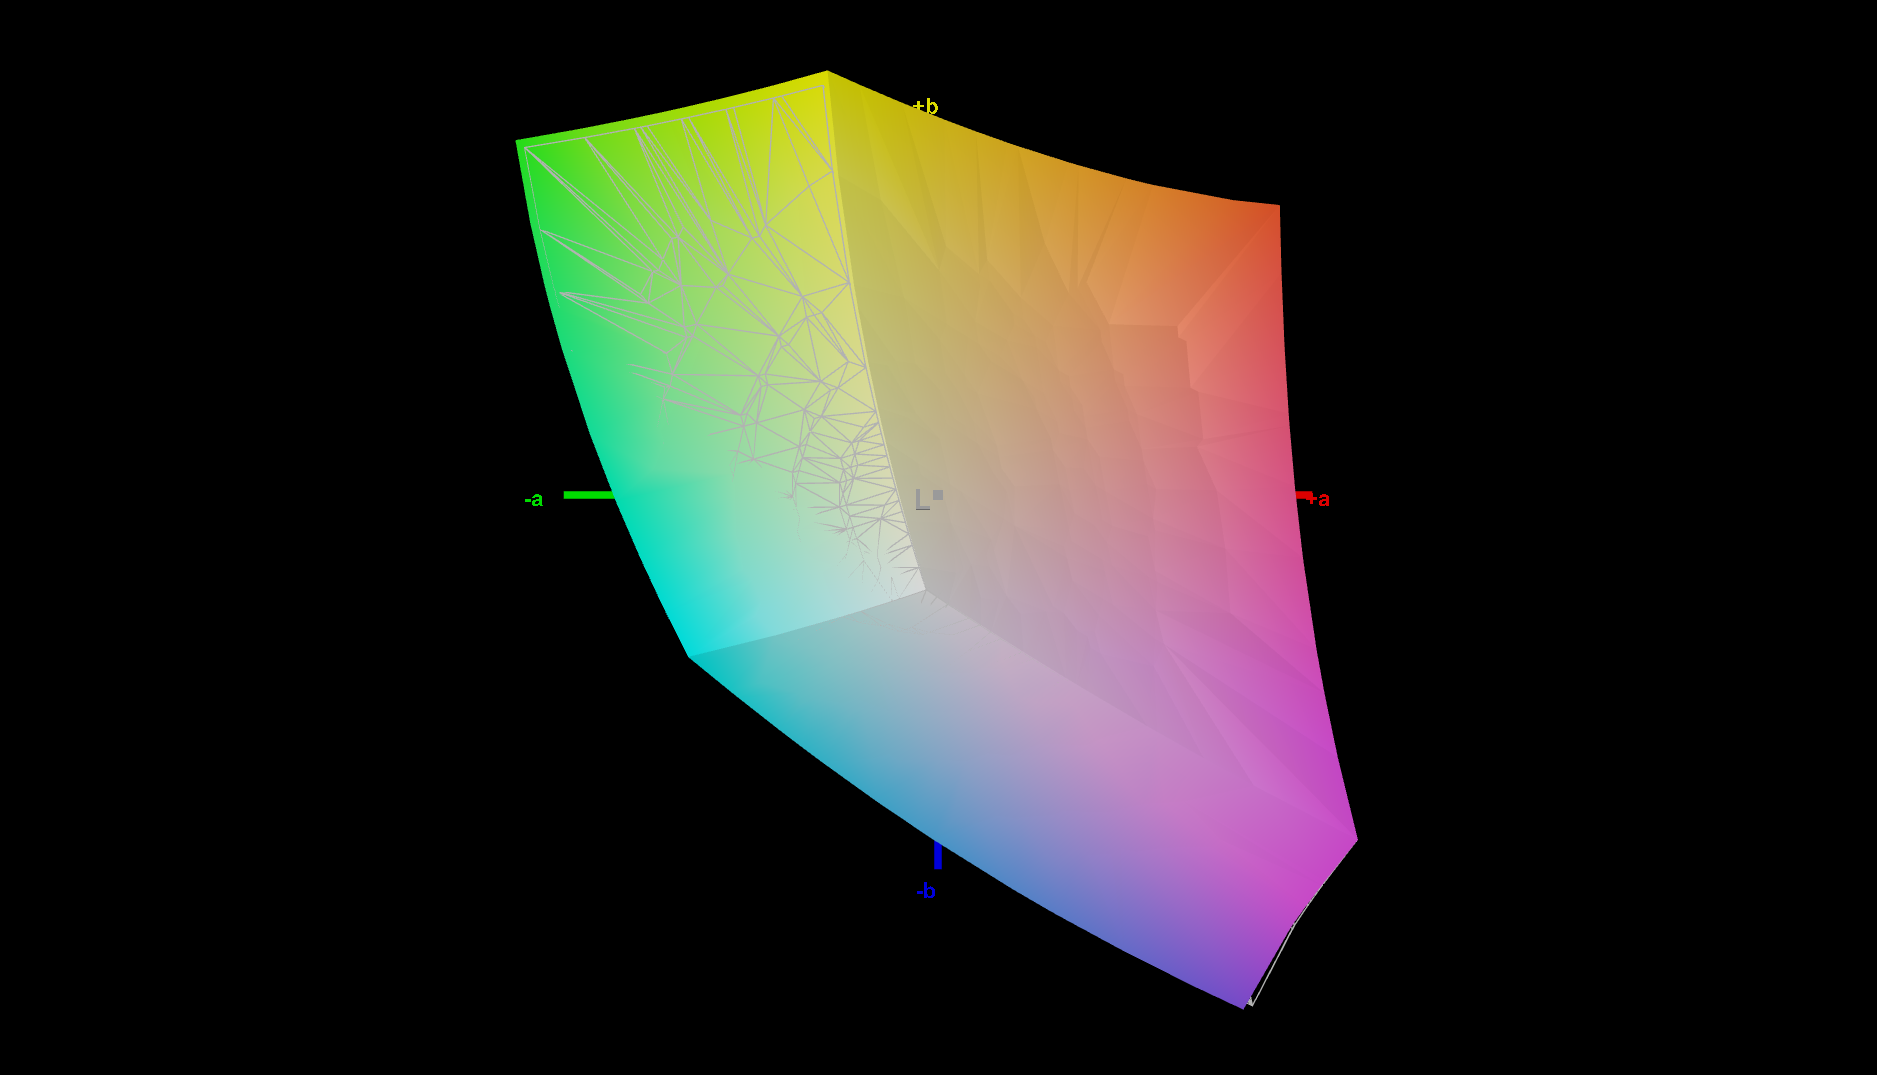
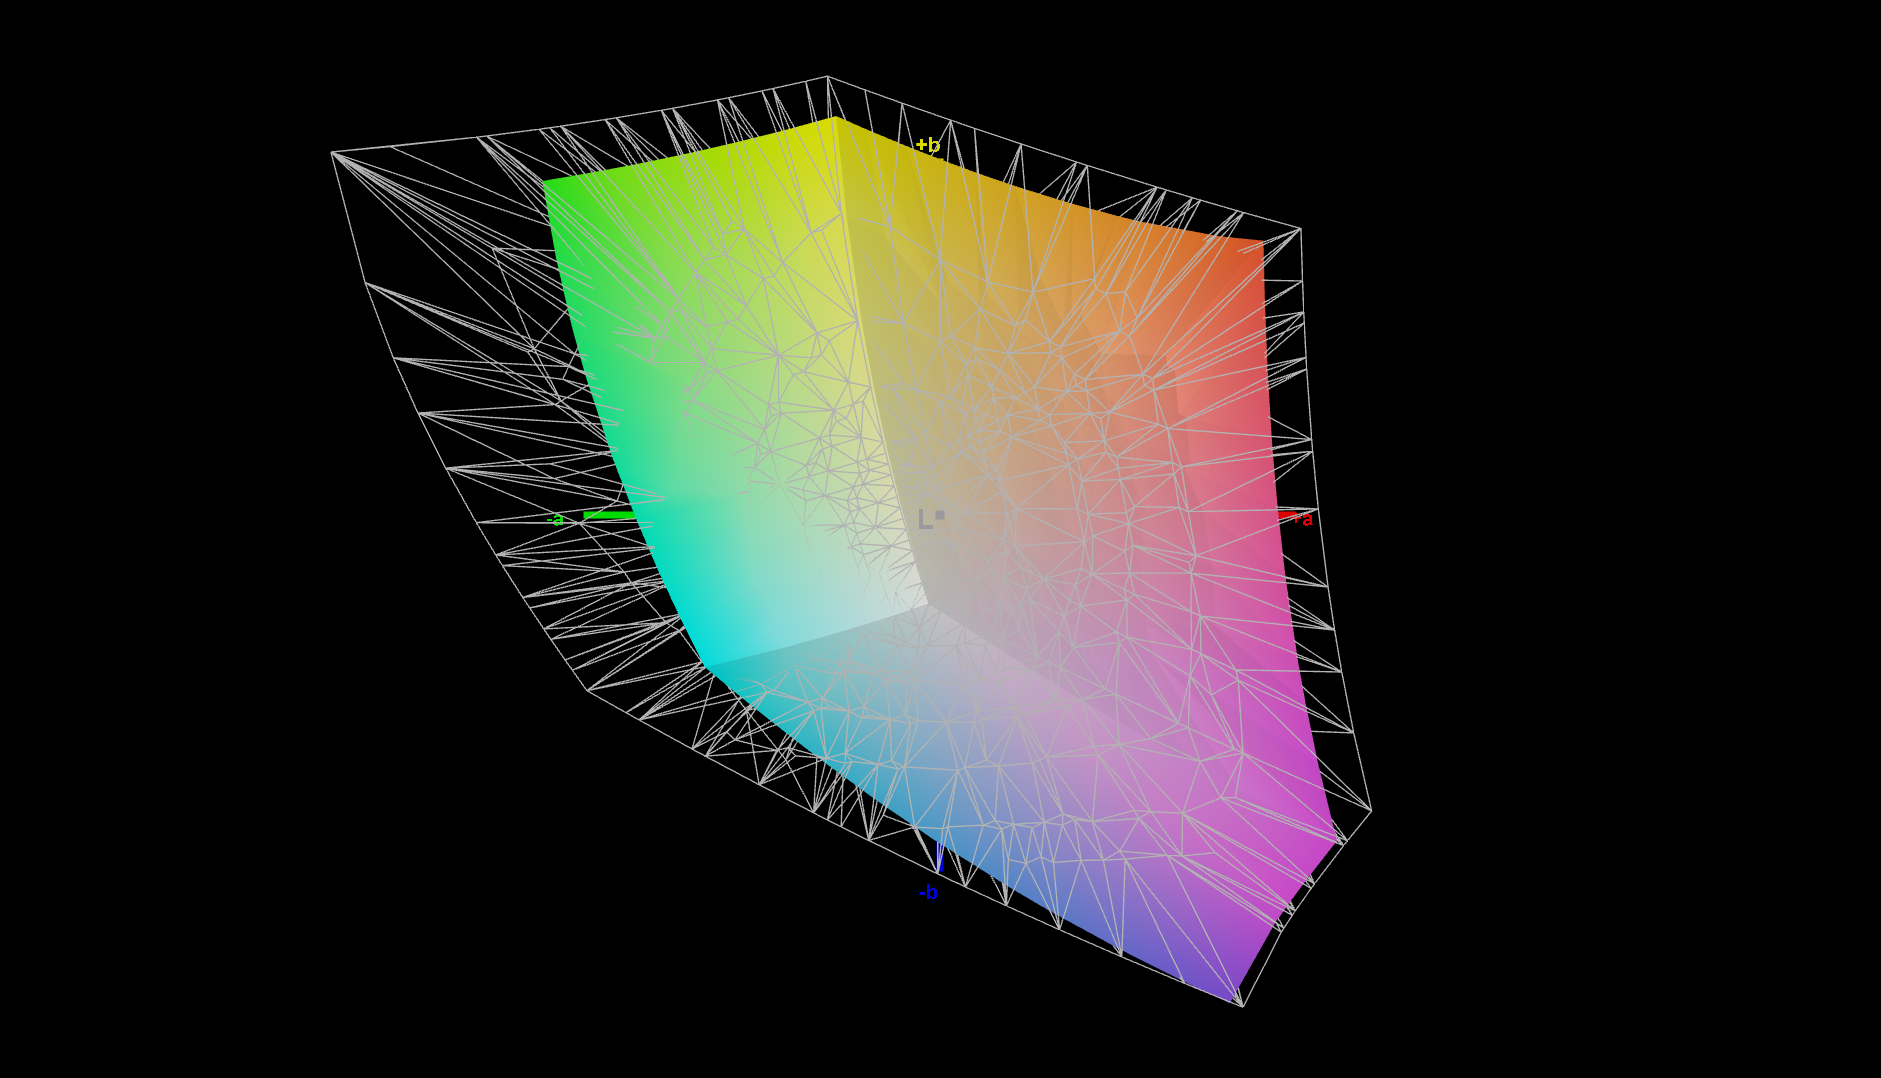
72.1% AdobeRGB 1998 (Argyll 3D)
99.7% sRGB (Argyll 3D)
70% Display P3 (Argyll 3D)
Gamma: 2.16
CCT: 6867 K
| Lenovo ThinkPad Z16 G1 21D5S00T00 NE160WUM-N62 , IPS LED, 1920x1200, 16" | Lenovo ThinkPad X1 Extreme G4-20Y5CTO1WW (3050 Ti) LP160UQ1-SPB1, IPS LED, 3840x2400, 16" | Dell XPS 15 9520 RTX 3050 Ti Samsung 156XG01, OLED, 3456x2160, 15.6" | Dell XPS 17 9720 Sharp LQ170R1, IPS, 3840x2400, 17" | Apple MacBook Pro 16 2021 M1 Pro Liquid Retina XDR, Mini-LED, 3456x2234, 16.2" | |
|---|---|---|---|---|---|
| Display | 18% | 20% | 25% | 21% | |
| Display P3 Coverage (%) | 70 | 84.3 20% | 97.8 40% | 94.8 35% | 99.1 42% |
| sRGB Coverage (%) | 99.7 | 98.3 -1% | 99.9 0% | 100 0% | 100 0% |
| AdobeRGB 1998 Coverage (%) | 72.1 | 97.8 36% | 86 19% | 100 39% | 88 22% |
| Response Times | -59% | 94% | -24% | -137% | |
| Response Time Grey 50% / Grey 80% * (ms) | 40 ? | 60 ? -50% | 1.9 ? 95% | 53.2 ? -33% | 42.8 ? -7% |
| Response Time Black / White * (ms) | 25 ? | 42 ? -68% | 1.9 ? 92% | 28.4 ? -14% | 91.6 ? -266% |
| PWM Frequency (Hz) | 59.52 ? | 17990 ? | 14880 | ||
| Screen | -14% | -55% | -23% | 212% | |
| Brightness middle (cd/m²) | 487 | 639 31% | 381.4 -22% | 438 -10% | 514 6% |
| Brightness (cd/m²) | 446 | 612 37% | 384 -14% | 411 -8% | 497 11% |
| Brightness Distribution (%) | 83 | 84 1% | 95 14% | 86 4% | 95 14% |
| Black Level * (cd/m²) | 0.31 | 0.47 -52% | 0.27 13% | 0.02 94% | |
| Contrast (:1) | 1571 | 1360 -13% | 1622 3% | 25700 1536% | |
| Colorchecker dE 2000 * | 1.8 | 2.2 -22% | 4.34 -141% | 2.5 -39% | 1.4 22% |
| Colorchecker dE 2000 max. * | 3.3 | 5.3 -61% | 9.24 -180% | 6.3 -91% | 2.8 15% |
| Colorchecker dE 2000 calibrated * | 0.8 | 1.4 -75% | 0.8 -0% | ||
| Greyscale dE 2000 * | 2.3 | 1.7 26% | 2 13% | 4.2 -83% | 2.3 -0% |
| Gamma | 2.16 102% | 2.31 95% | 2.13 103% | 2.22 99% | 2.27 97% |
| CCT | 6867 95% | 6390 102% | 6210 105% | 7034 92% | 6792 96% |
| Média Total (Programa/Configurações) | -18% /
-14% | 20% /
-8% | -7% /
-13% | 32% /
115% |
* ... menor é melhor
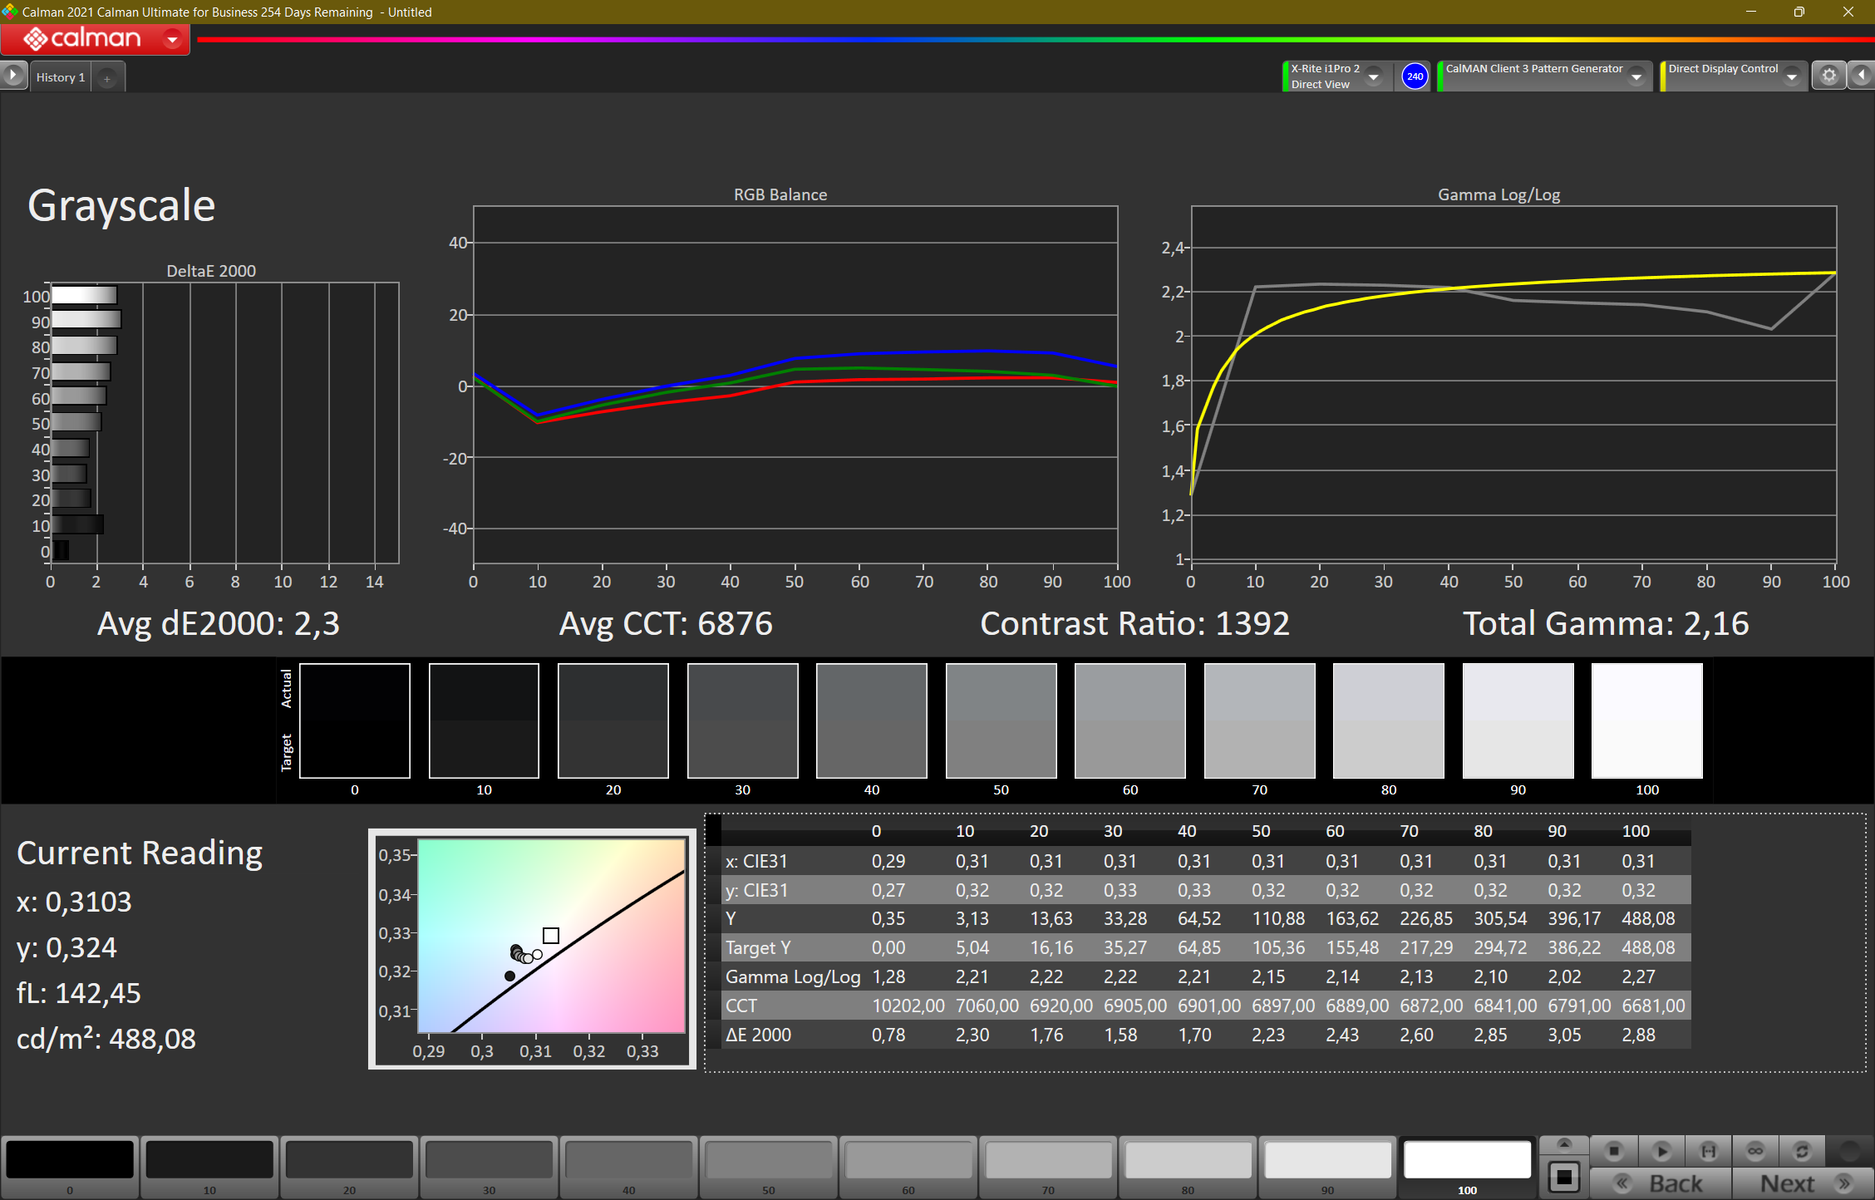
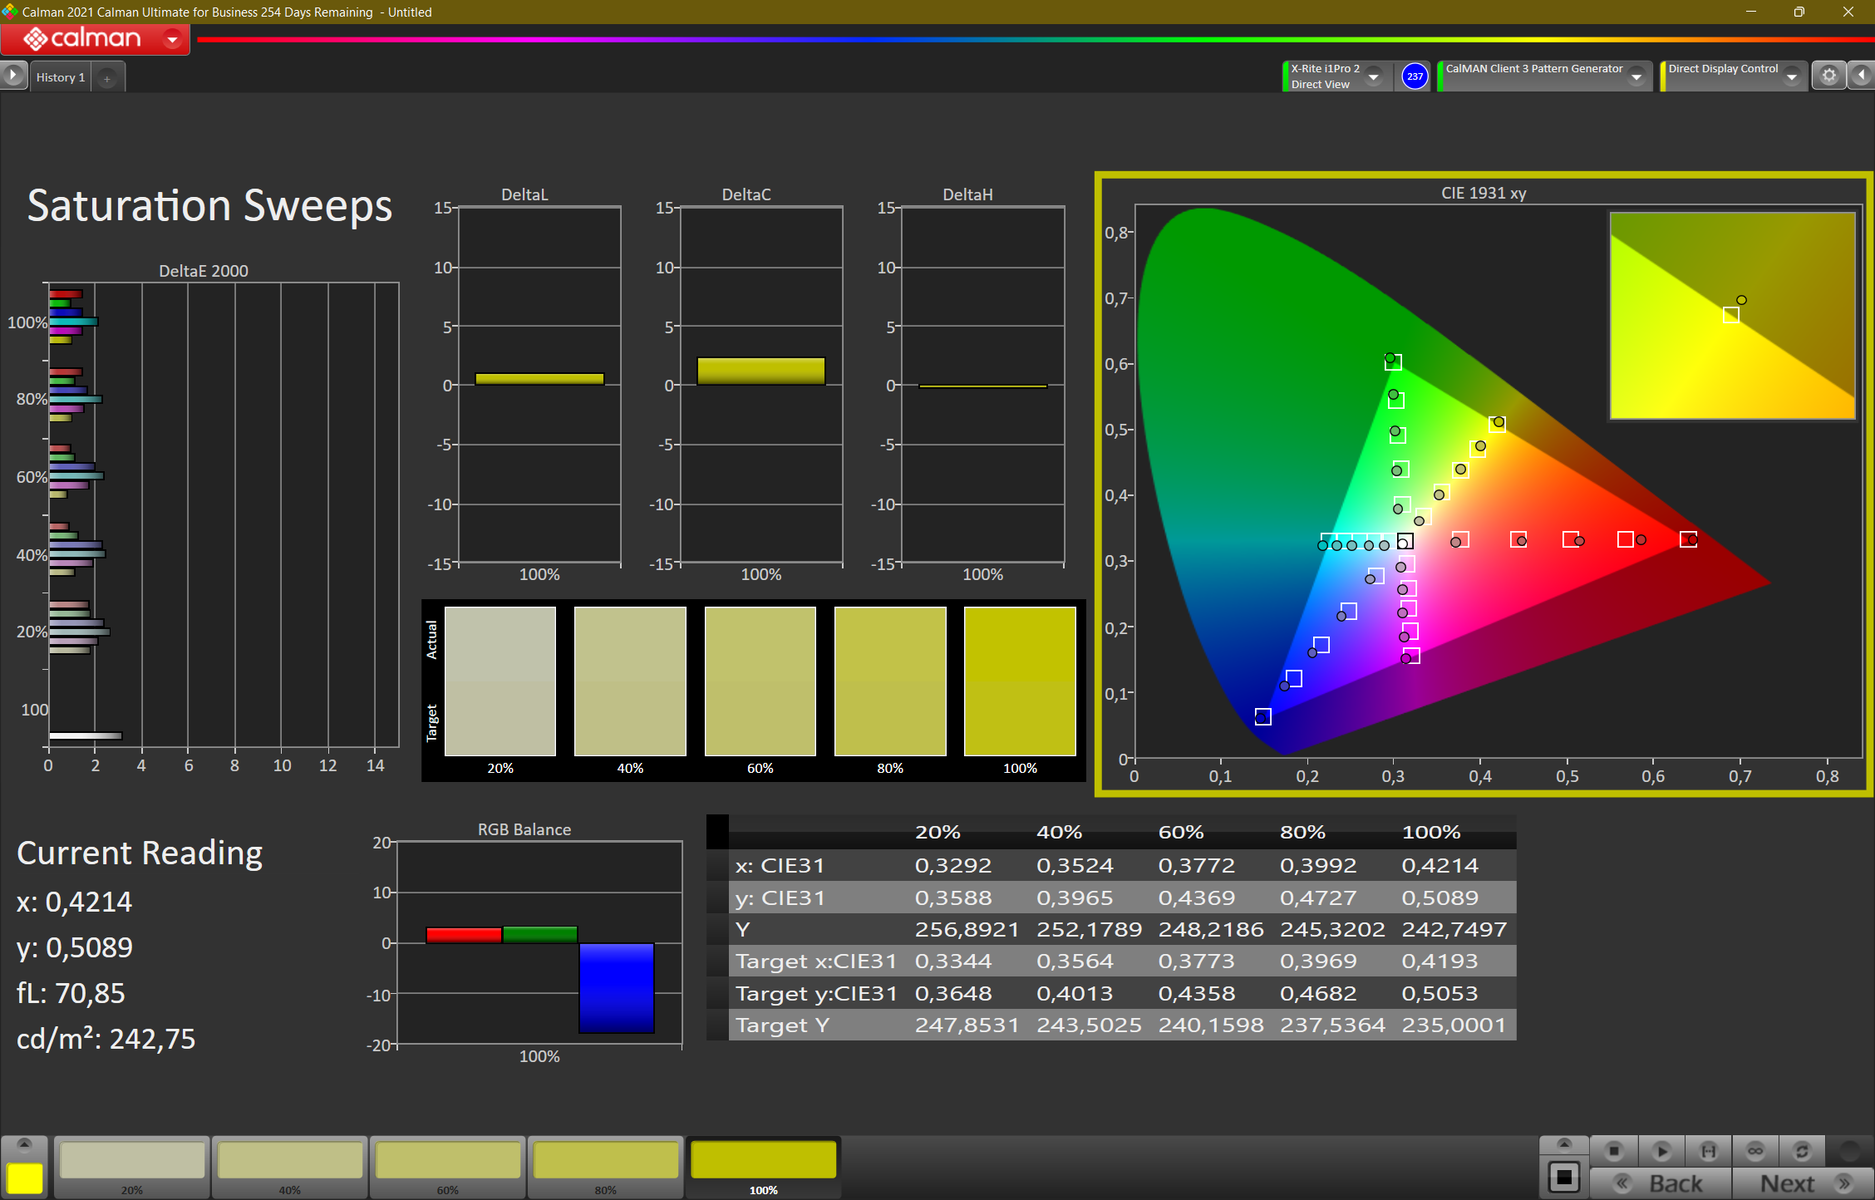
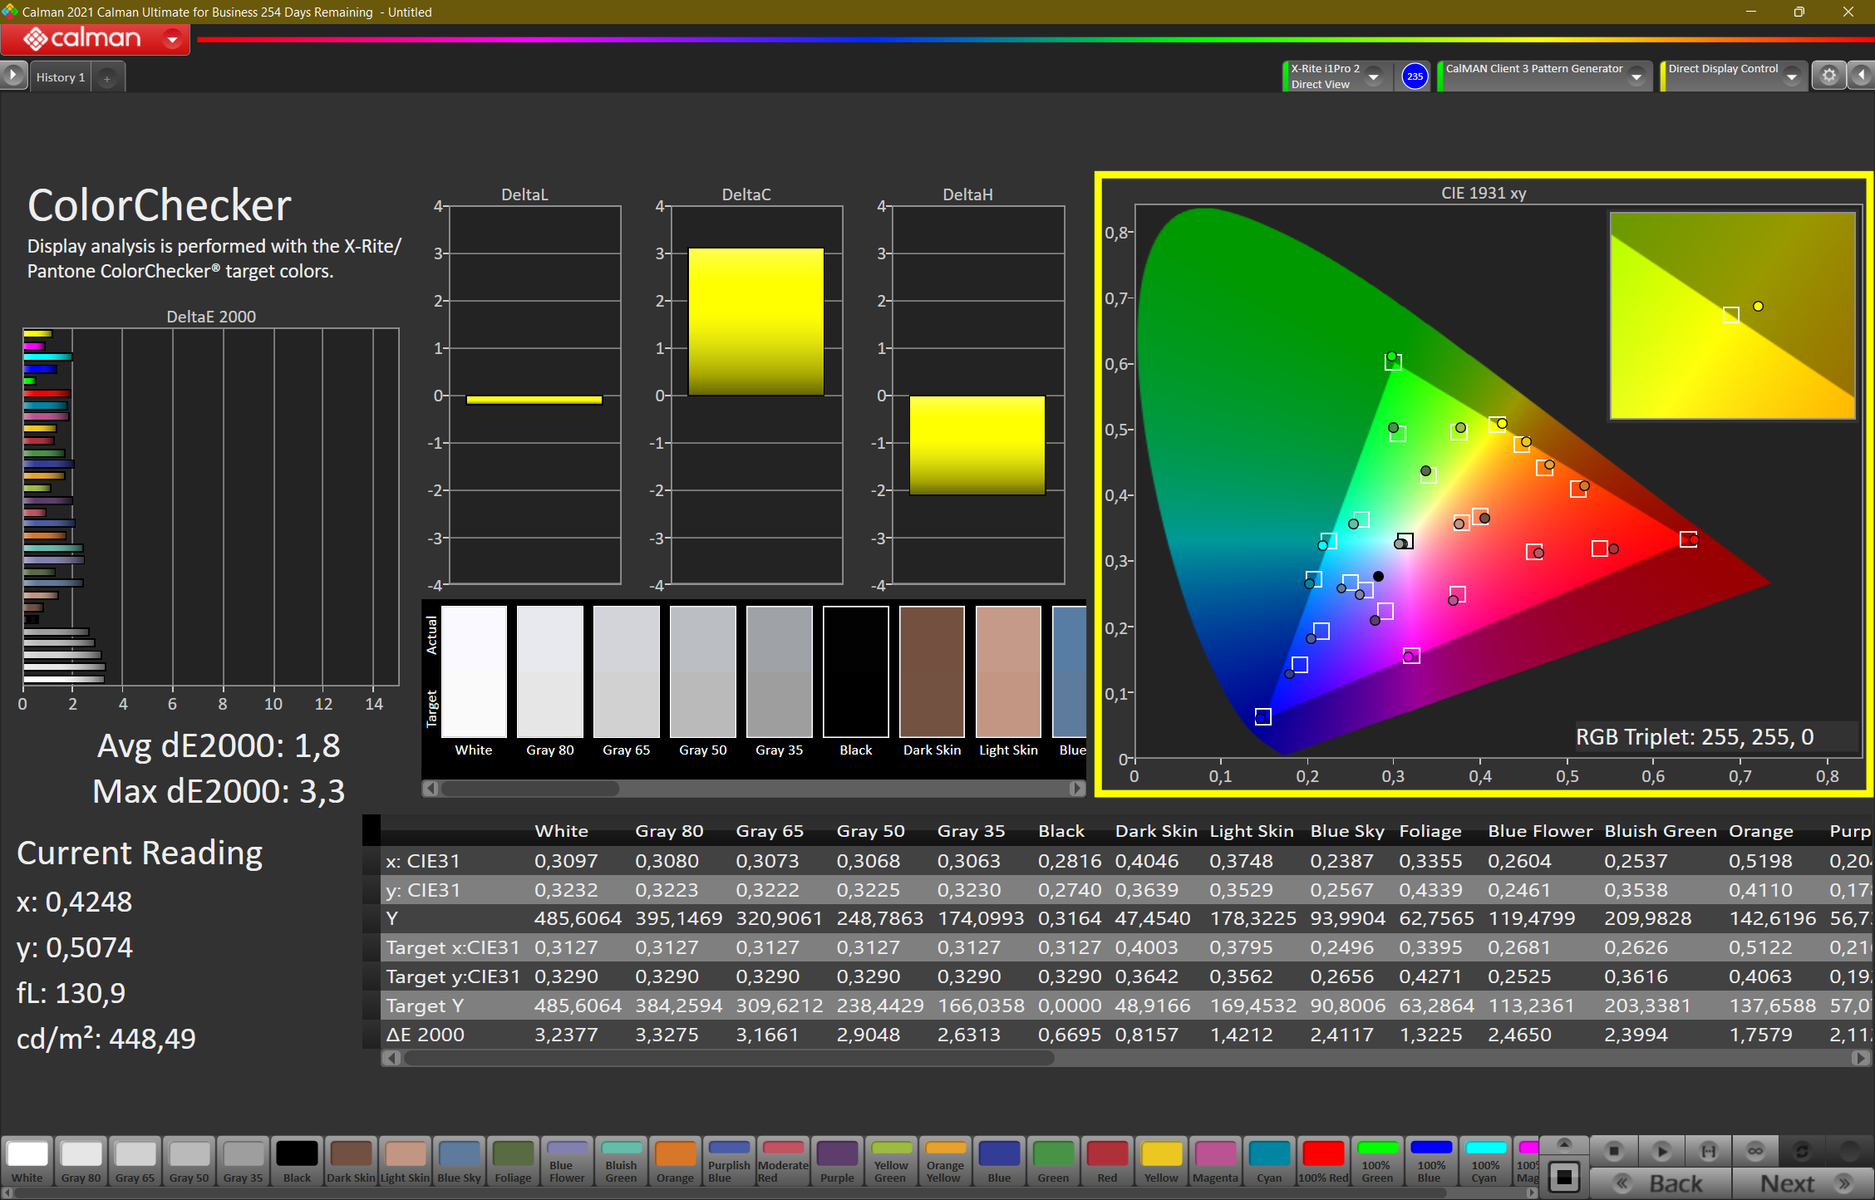
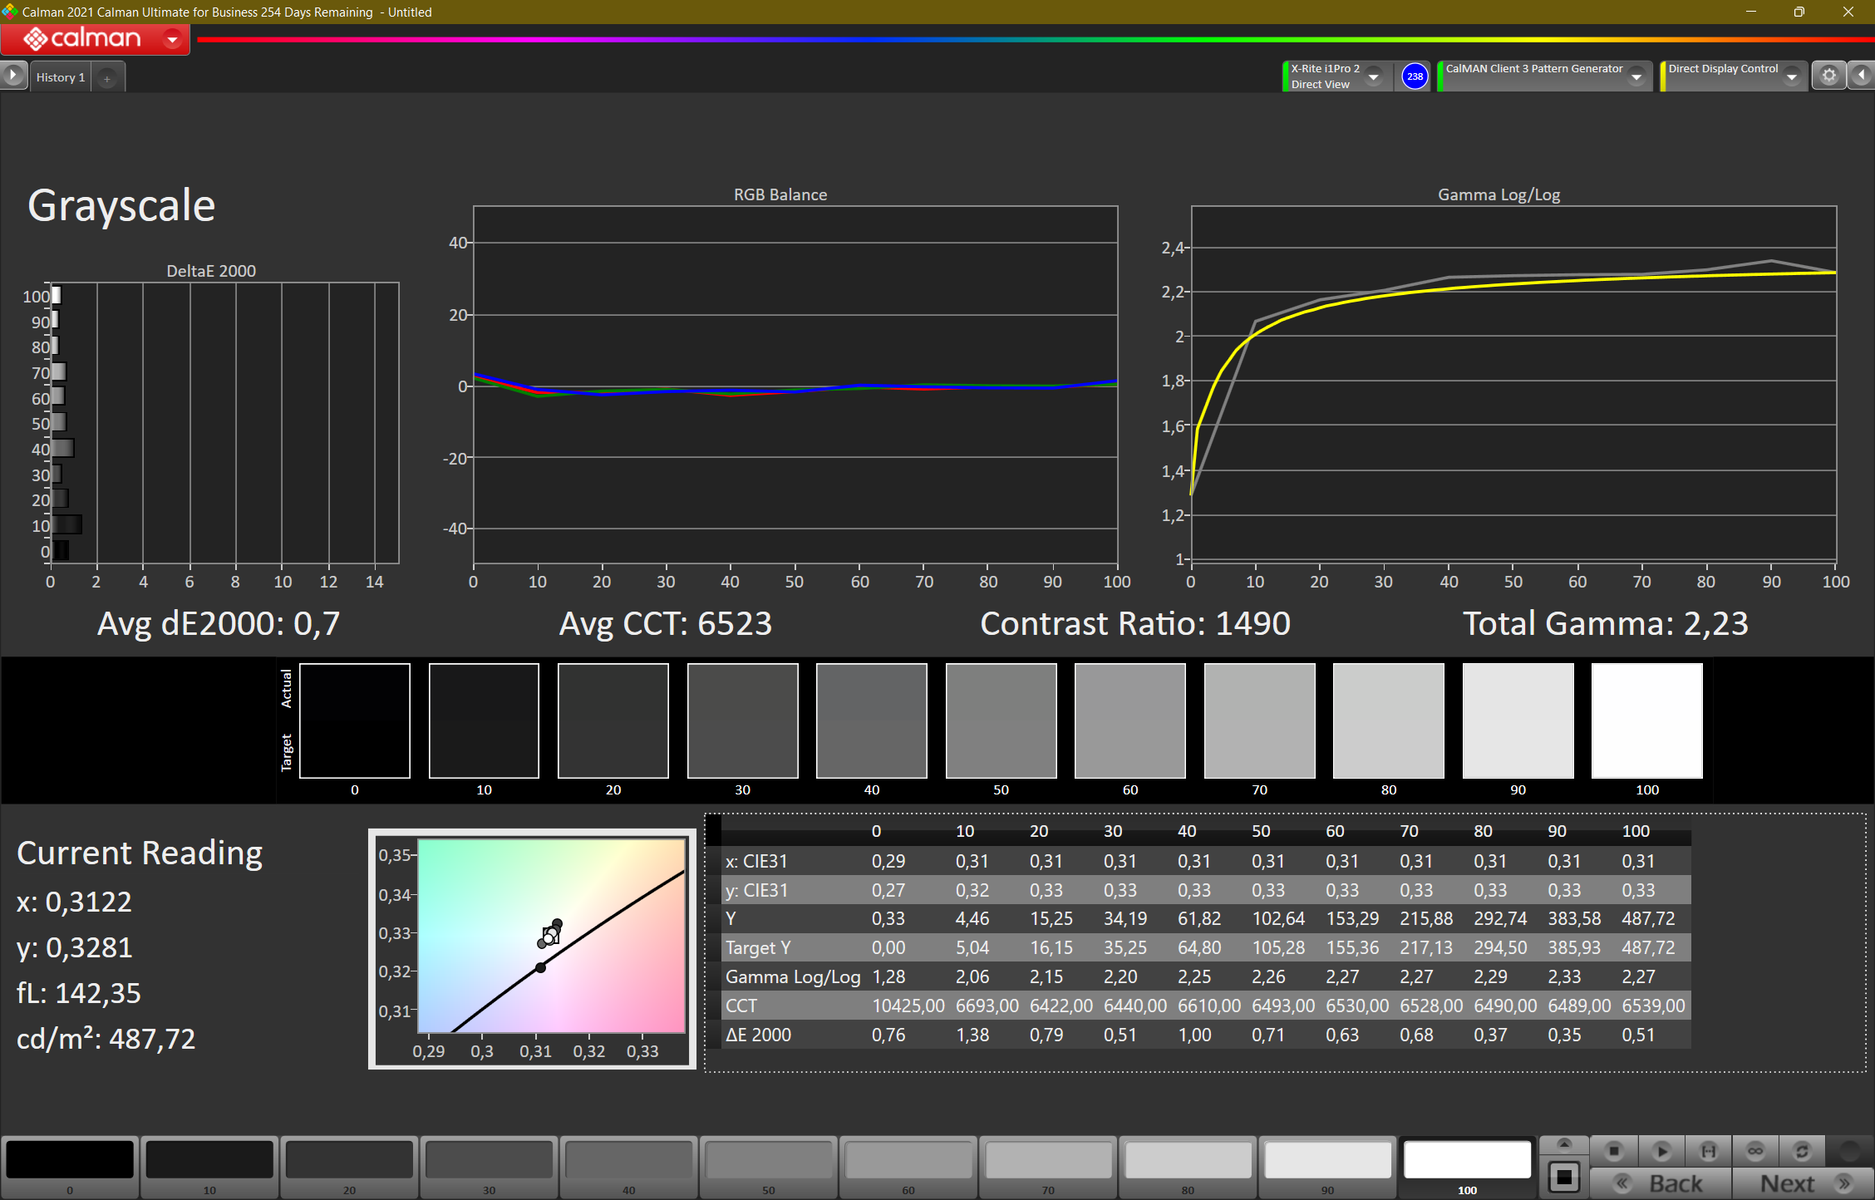
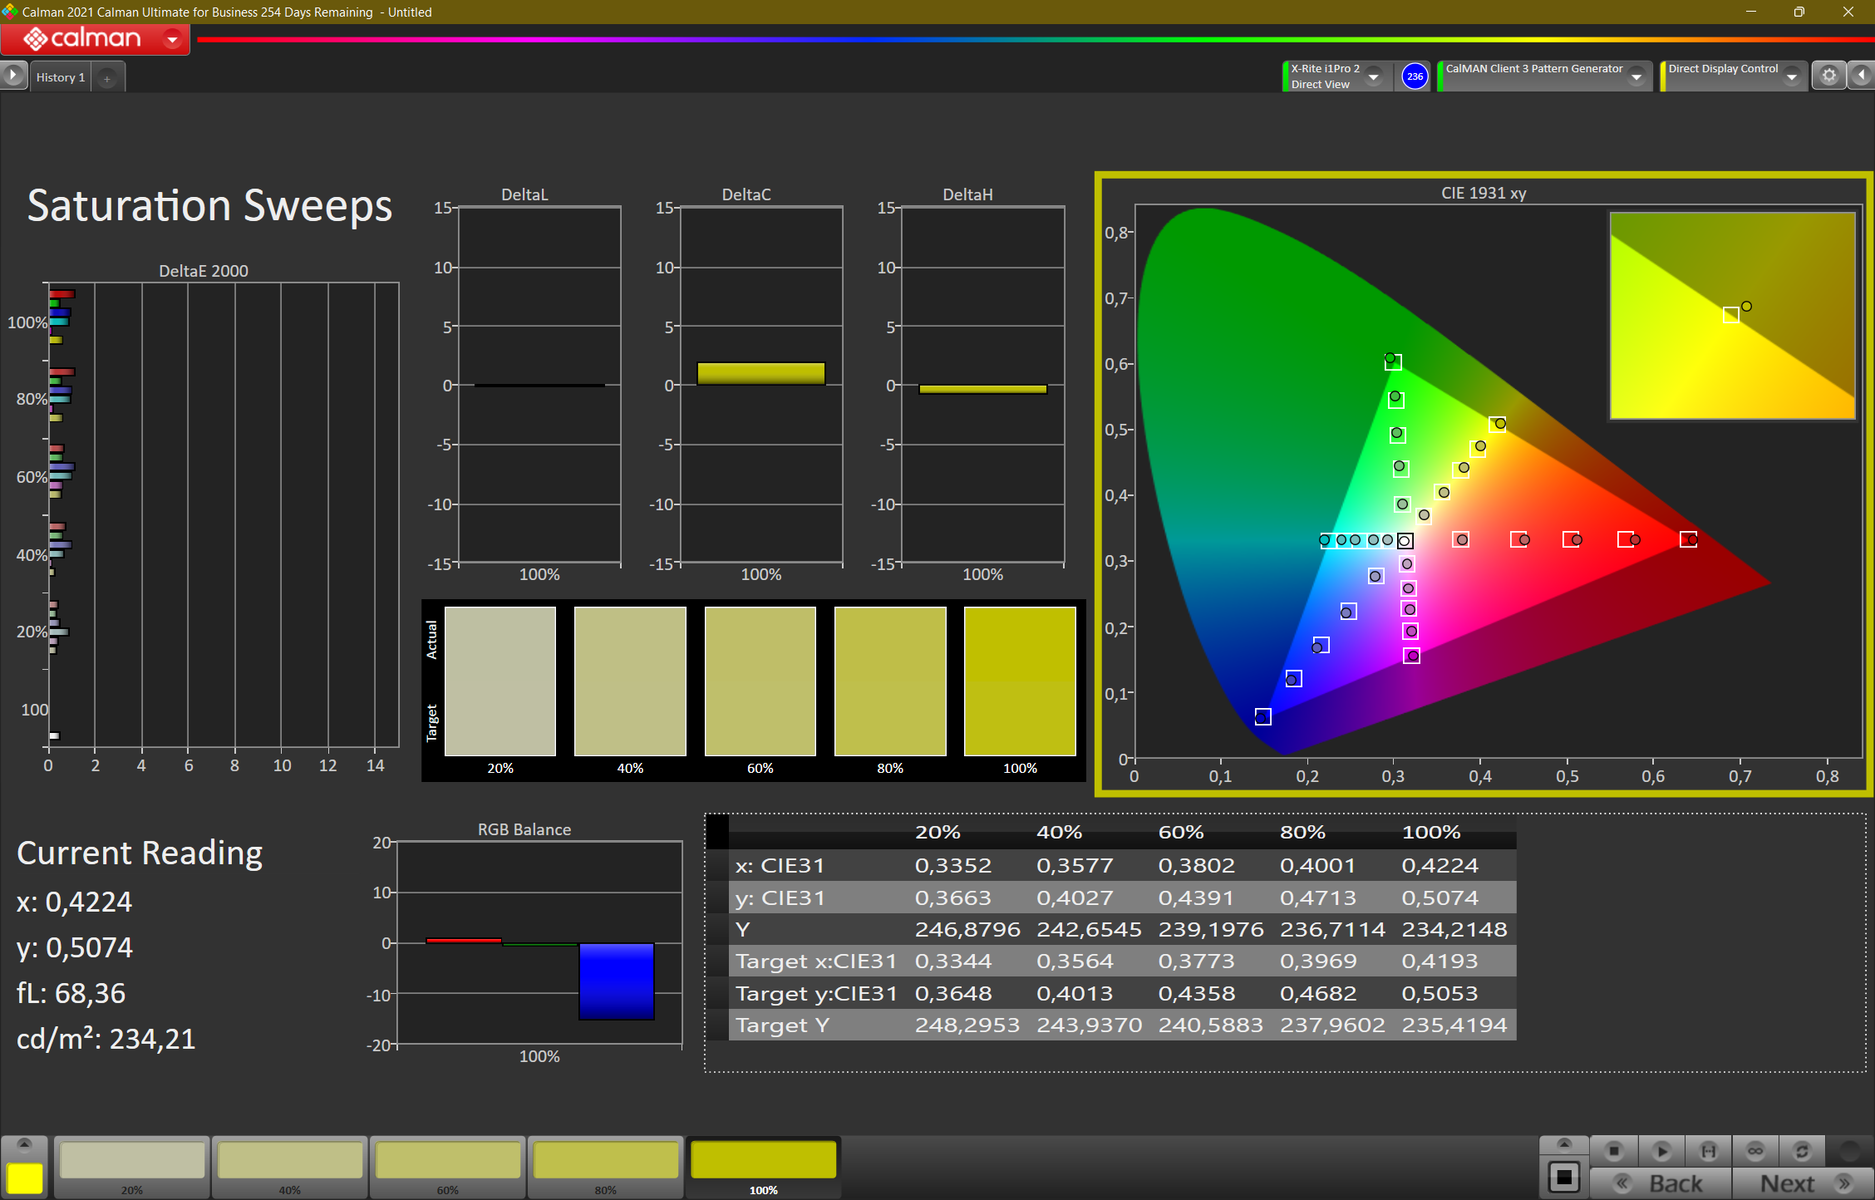
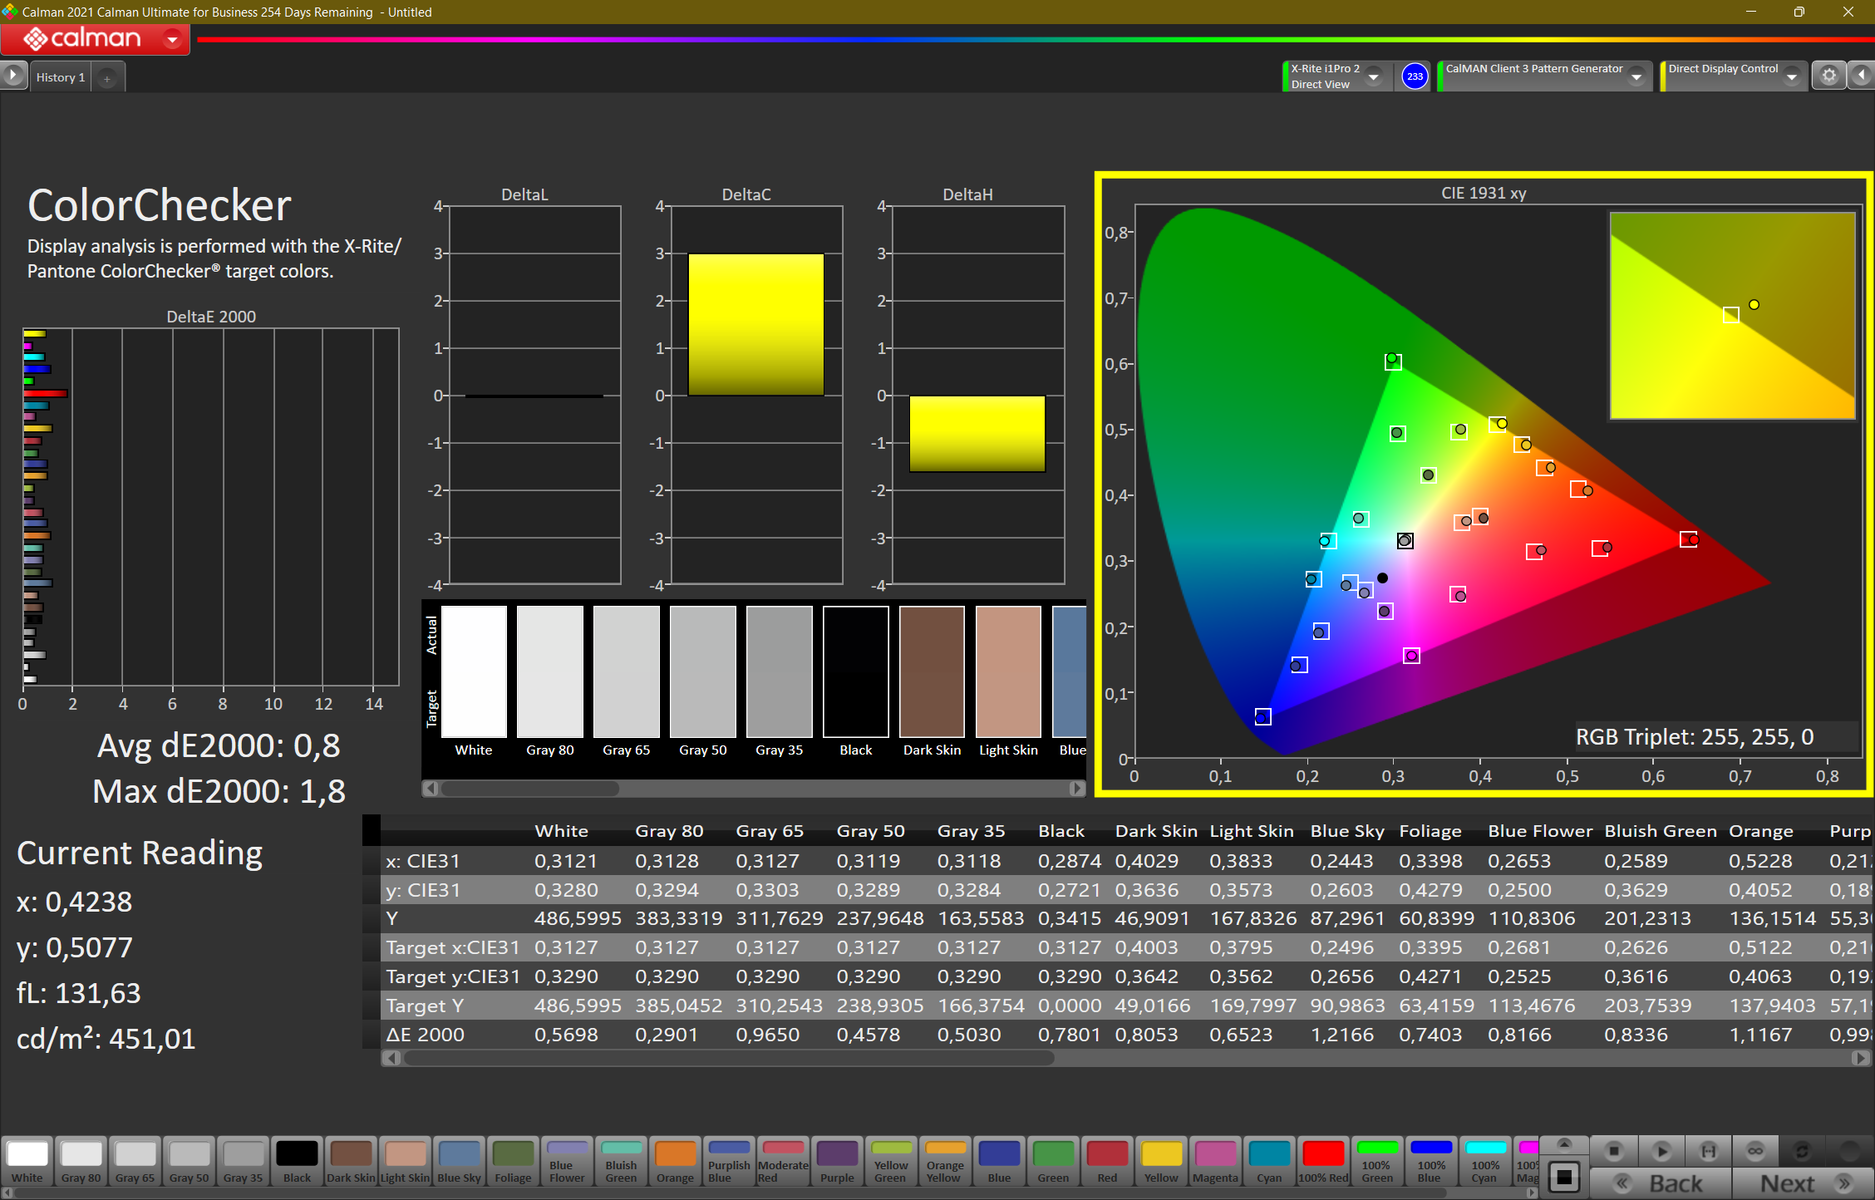
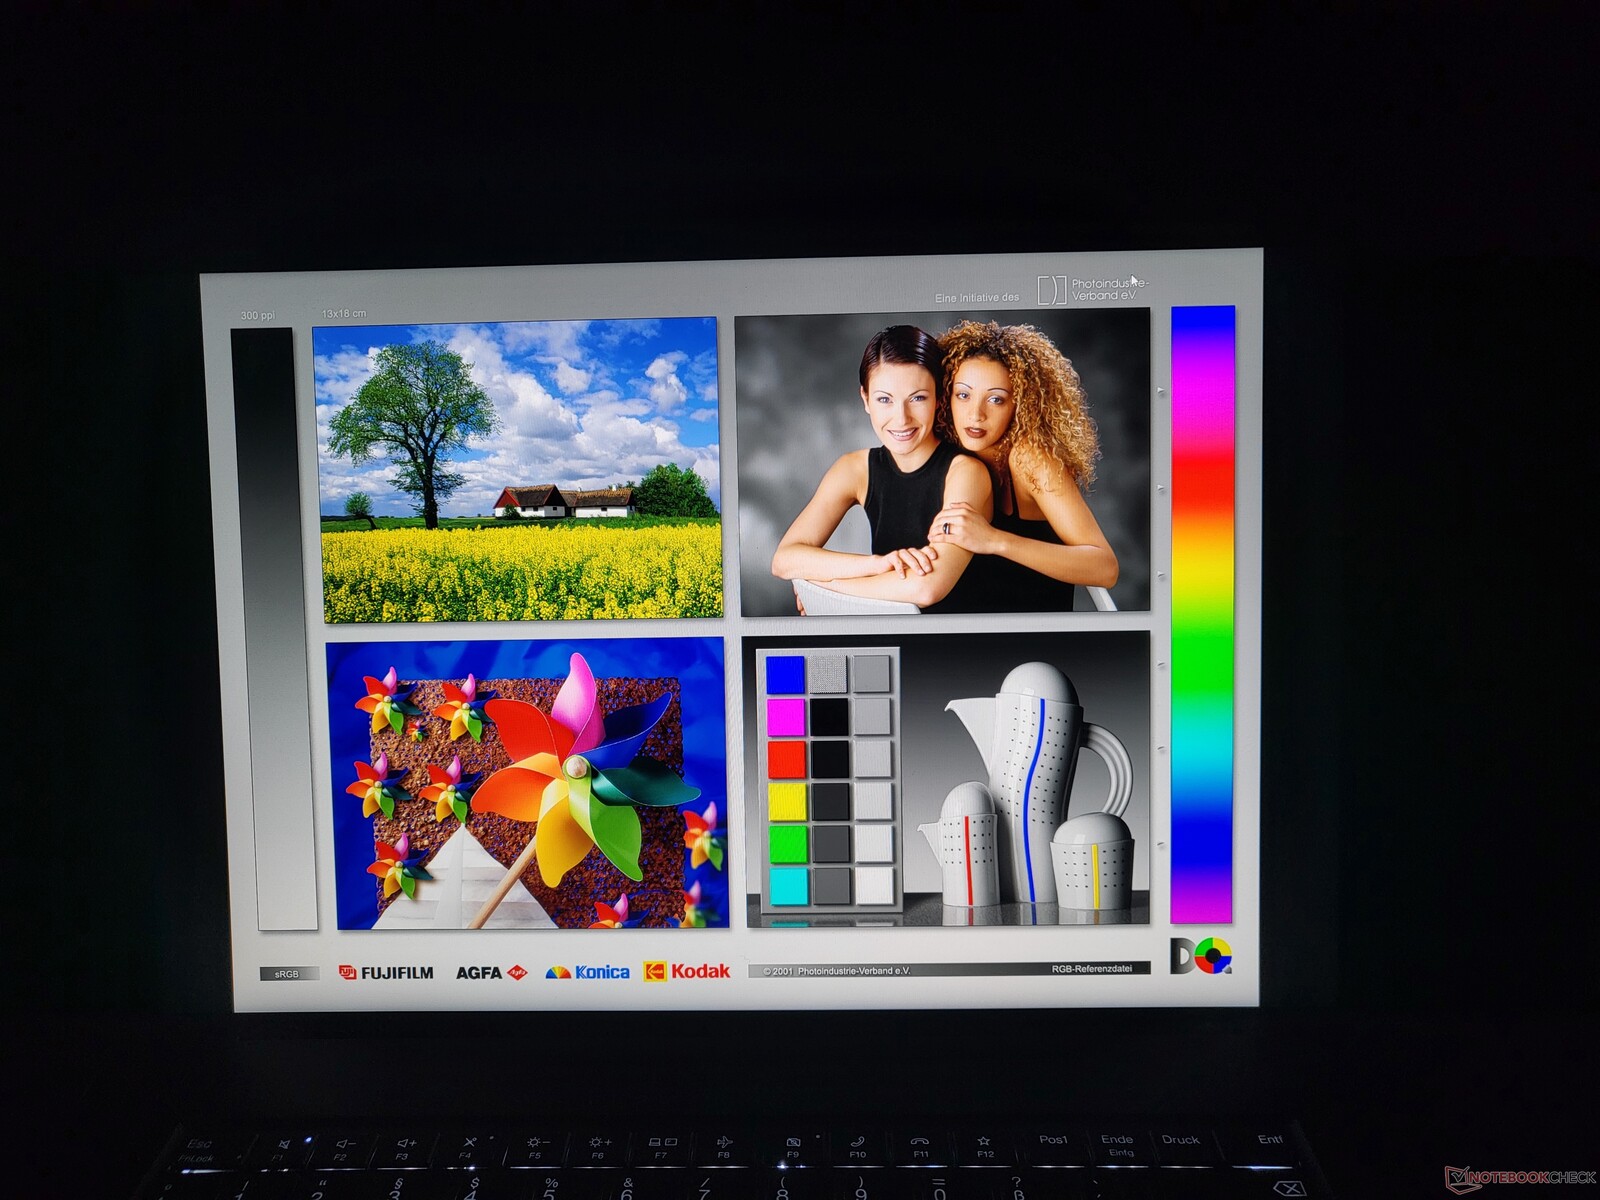
A exibição do ThinkPad Z16 G1 da Lenovo já está relativamente bem ajustada no estado de entrega, o que é mostrado em seus baixos desvios Delta-E. Medimos a tela usando CalMan e o Colorímetro X-Rite i1 Pro 2. Uma calibração com o Profiler i1 foi capaz de baixar ainda mais o valor do Delta-E, levando a uma reprodução de cores bastante precisa. Como sempre, o perfil de cor criado está disponível para seu download gratuito acima.
O marketing da Lenovo promete 100% de cobertura de espaço de cor sRGB, e medimos 99,7%. Com isto, o display LCD é adequado para o processamento simples de imagens. Para obter uma cobertura de espaço de cores ainda maior, você teria que selecionar o painel opcional OLED.
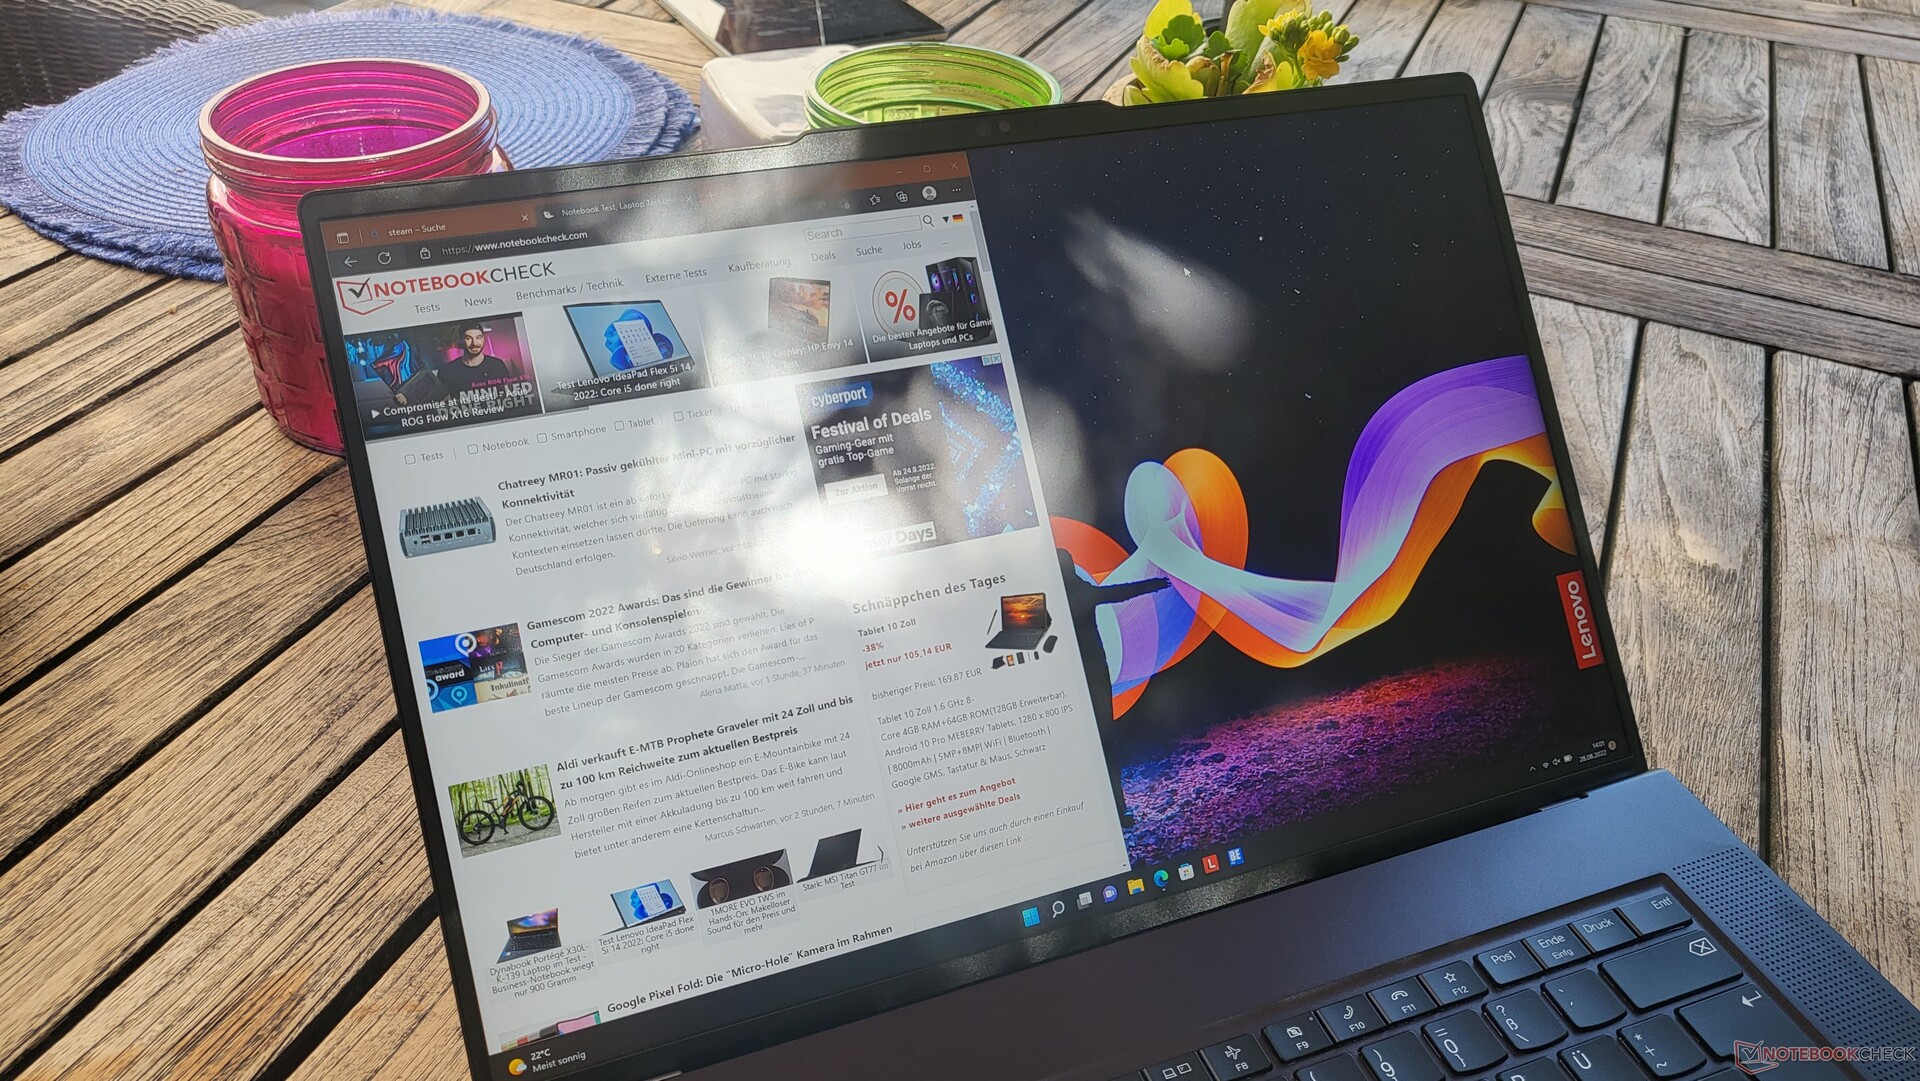
Devido a seu brilho relativamente alto e superfície de exibição fosca, o laptop ThinkPad Z16 pode ser usado ao ar livre sem problemas, desde que você evite a luz direta do sol.
Exibir tempos de resposta
| ↔ Tempo de resposta preto para branco | ||
|---|---|---|
| 25 ms ... ascensão ↗ e queda ↘ combinadas | ↗ 12 ms ascensão | 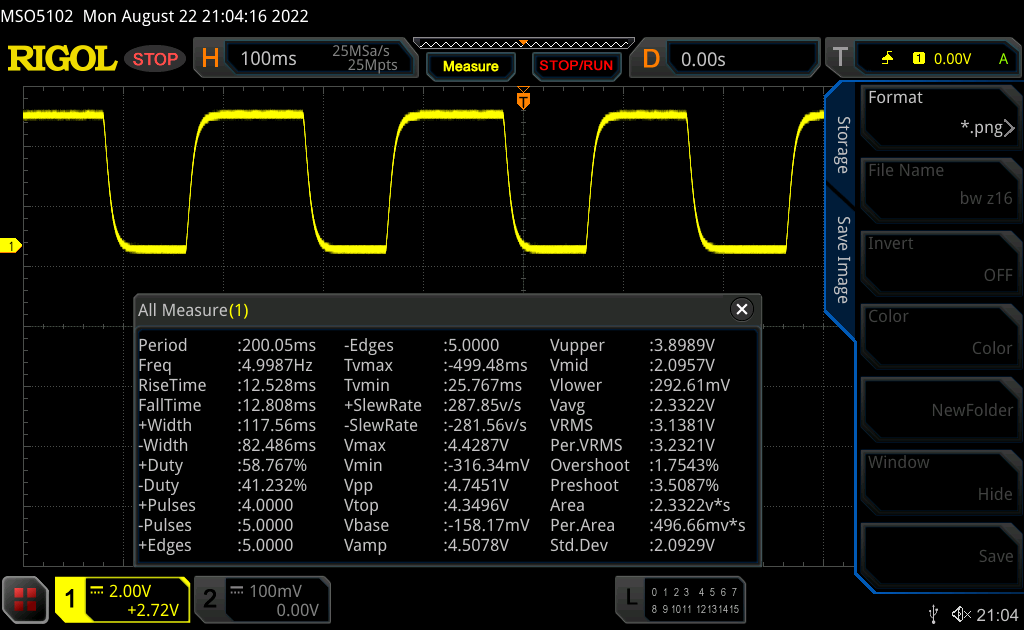 |
| ↘ 13 ms queda | ||
| A tela mostra taxas de resposta relativamente lentas em nossos testes e pode ser muito lenta para os jogadores. Em comparação, todos os dispositivos testados variam de 0.1 (mínimo) a 240 (máximo) ms. » 59 % de todos os dispositivos são melhores. Isso significa que o tempo de resposta medido é pior que a média de todos os dispositivos testados (19.9 ms). | ||
| ↔ Tempo de resposta 50% cinza a 80% cinza | ||
| 40 ms ... ascensão ↗ e queda ↘ combinadas | ↗ 17 ms ascensão |  |
| ↘ 23 ms queda | ||
| A tela mostra taxas de resposta lentas em nossos testes e será insatisfatória para os jogadores. Em comparação, todos os dispositivos testados variam de 0.165 (mínimo) a 636 (máximo) ms. » 61 % de todos os dispositivos são melhores. Isso significa que o tempo de resposta medido é pior que a média de todos os dispositivos testados (31.1 ms). | ||
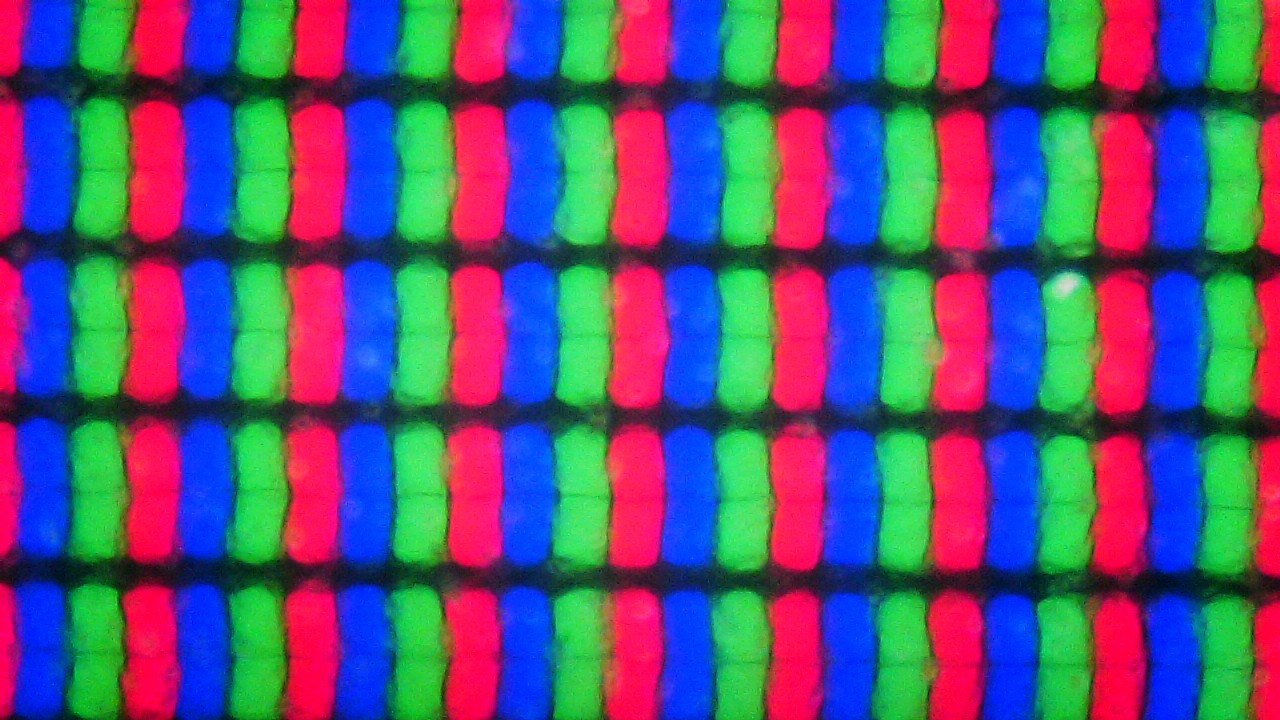
Cintilação da tela / PWM (modulação por largura de pulso)
| Tela tremeluzindo / PWM não detectado | 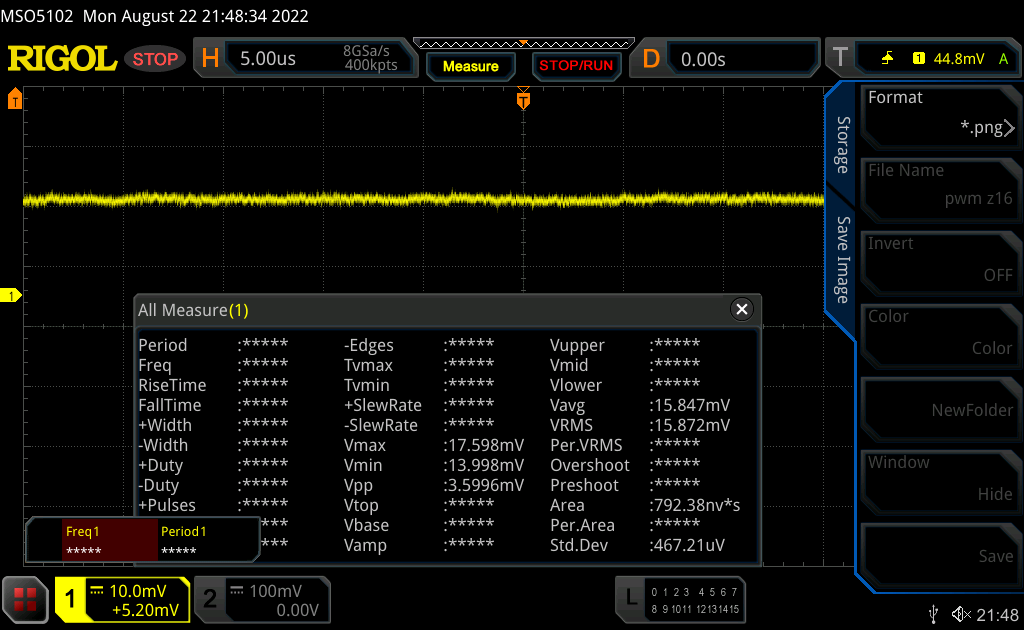 | ||
[pwm_comparison] Em comparação: 52 % de todos os dispositivos testados não usam PWM para escurecer a tela. Se PWM foi detectado, uma média de 7784 (mínimo: 5 - máximo: 343500) Hz foi medida. | |||
Desempenho: AMD Ryzen 6000H encontra Radeon RX 6500M
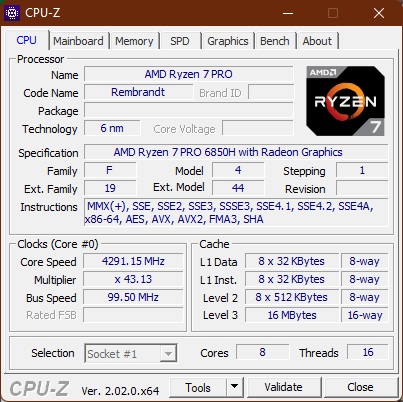
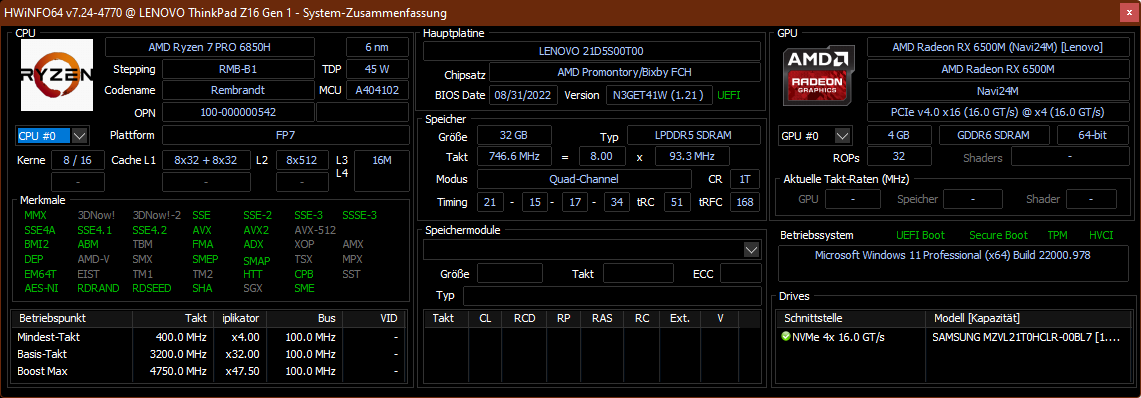
A seleção de processadores para o ThinkPad Z16 Gen 1 inclui três opções, sendo que todas as CPUs fazem parte da linha Ryzen Pro da AMD para clientes comerciais. OAMD Ryzen 5 Pro 6650Hcom seis núcleos serve como o nível de entrada, e você também pode obter o Ryzen 7 Pro 6850He oRyzen 9 Pro 6950Hambos com oito núcleos. Como chip gráfico, você pode usar a GPU integrada Radeon ou opcionalmente obter o AMD Radeon RX 6500M. O Lenovo ThinkPad Z16 é o primeiro ThinkPad que você pode comprar com uma combinação de CPU AMD e AMD dGPU.
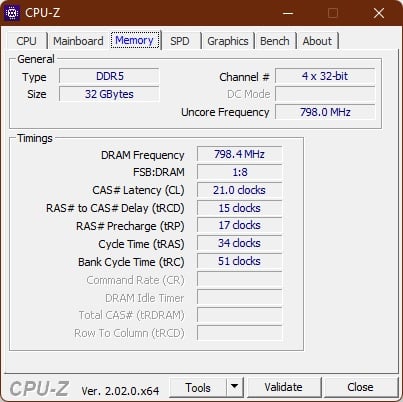
Na série ThinkPad Z, a Lenovo usa memória LPDDR5-6400 soldada, com a Z16 oferecendo 16 ou 32 GB de RAM. Um único SSD M.2-2280 serve como armazenamento.
Condições de teste
Nosso teste foi realizado em condições difíceis, já que o Z16 criou alguns grandes problemas para nós. Nossa primeira unidade de teste foi constantemente reiniciada quando o Wi-Fi foi ativado. Recebemos então um dispositivo de troca, que resolveu os problemas em grande parte, e o ThinkPad de substituição foi significativamente mais estável.
No modo "Melhor Desempenho" do Windows, a CPU do ThinkPad Z16 tem um limite de potência a curto prazo de 65 watts e, a longo prazo, o processador pode consumir 47 watts.
Processador
OAMD Ryzen 7 Pro 6850H é um processador da geração 2022 Rembrandt que tem um TDP típico de 45 watts como um chip da série H. Seus oito núcleos (16 fios com Hyperthreading) têm uma velocidade básica de relógio de 3,2 GHz e uma velocidade máxima de 4,7 GHz. Para algumas comparações adicionais com outros processadores, recomendamos nosso Lista de comparação de CPU.
O Lenovo ThinkPad Z16 Gen 1 é o primeiro ThinkPad com a série AMD-H. Nos testes de benchmark, ele atinge um desempenho muito bom, embora permaneça atrás dos concorrentes em várias disciplinas. As CPUs Intel Core-i da 12ª geração são melhores tanto no desempenho single como no multicore, embora a vantagem não dure muito tempo no desempenho multicore. Os processadores M1 Pro e Max também têm vantagens, além dos benchmarks emulados
Mesmo que o modo "Ultra Performance" não esteja disponível no funcionamento por bateria, o desempenho da CPU permanece quase inalterado no funcionamento por bateria apesar disto (11.963 pontos no teste Cinebench R23 Multicore).
Cinebench R15 Multi Constant Load Test
Cinebench R23: Multi Core | Single Core
Cinebench R20: CPU (Multi Core) | CPU (Single Core)
Cinebench R15: CPU Multi 64Bit | CPU Single 64Bit
Blender: v2.79 BMW27 CPU
7-Zip 18.03: 7z b 4 | 7z b 4 -mmt1
Geekbench 5.5: Multi-Core | Single-Core
HWBOT x265 Benchmark v2.2: 4k Preset
LibreOffice : 20 Documents To PDF
R Benchmark 2.5: Overall mean
| CPU Performance rating | |
| Média da turma Multimedia | |
| Dell XPS 17 9720 | |
| Dell XPS 15 9520 RTX 3050 Ti | |
| Lenovo ThinkPad X1 Extreme G4-20Y50040GE -3! | |
| Apple MacBook Pro 16 2021 M1 Pro -5! | |
| Lenovo ThinkPad Z16 G1 21D5S00T00 | |
| Apple MacBook Pro 16 2021 M1 Max -5! | |
| Lenovo ThinkPad X1 Extreme G4-20Y5CTO1WW (3050 Ti) | |
| Média AMD Ryzen 7 PRO 6850H | |
| Cinebench R23 / Multi Core | |
| Média da turma Multimedia (4861 - 33362, n=81, últimos 2 anos) | |
| Dell XPS 17 9720 | |
| Dell XPS 15 9520 RTX 3050 Ti | |
| Lenovo ThinkPad X1 Extreme G4-20Y5CTO1WW (3050 Ti) | |
| Média AMD Ryzen 7 PRO 6850H (12016 - 12770, n=2) | |
| Apple MacBook Pro 16 2021 M1 Max | |
| Apple MacBook Pro 16 2021 M1 Pro | |
| Lenovo ThinkPad X1 Extreme G4-20Y50040GE | |
| Lenovo ThinkPad Z16 G1 21D5S00T00 | |
| Cinebench R23 / Single Core | |
| Média da turma Multimedia (1128 - 2459, n=73, últimos 2 anos) | |
| Dell XPS 15 9520 RTX 3050 Ti | |
| Dell XPS 17 9720 | |
| Lenovo ThinkPad X1 Extreme G4-20Y50040GE | |
| Apple MacBook Pro 16 2021 M1 Pro | |
| Apple MacBook Pro 16 2021 M1 Max | |
| Lenovo ThinkPad X1 Extreme G4-20Y5CTO1WW (3050 Ti) | |
| Lenovo ThinkPad Z16 G1 21D5S00T00 | |
| Média AMD Ryzen 7 PRO 6850H (1469 - 1491, n=2) | |
| Cinebench R20 / CPU (Multi Core) | |
| Média da turma Multimedia (1887 - 12912, n=64, últimos 2 anos) | |
| Dell XPS 15 9520 RTX 3050 Ti | |
| Lenovo ThinkPad Z16 G1 21D5S00T00 | |
| Dell XPS 17 9720 | |
| Lenovo ThinkPad X1 Extreme G4-20Y5CTO1WW (3050 Ti) | |
| Lenovo ThinkPad X1 Extreme G4-20Y50040GE | |
| Média AMD Ryzen 7 PRO 6850H (2990 - 4946, n=3) | |
| Apple MacBook Pro 16 2021 M1 Max | |
| Apple MacBook Pro 16 2021 M1 Pro | |
| Cinebench R20 / CPU (Single Core) | |
| Média da turma Multimedia (425 - 853, n=64, últimos 2 anos) | |
| Dell XPS 15 9520 RTX 3050 Ti | |
| Dell XPS 17 9720 | |
| Lenovo ThinkPad X1 Extreme G4-20Y50040GE | |
| Lenovo ThinkPad X1 Extreme G4-20Y5CTO1WW (3050 Ti) | |
| Lenovo ThinkPad Z16 G1 21D5S00T00 | |
| Média AMD Ryzen 7 PRO 6850H (564 - 583, n=3) | |
| Apple MacBook Pro 16 2021 M1 Pro | |
| Apple MacBook Pro 16 2021 M1 Max | |
| Cinebench R15 / CPU Multi 64Bit | |
| Dell XPS 17 9720 | |
| Dell XPS 17 9720 | |
| Média da turma Multimedia (856 - 5224, n=68, últimos 2 anos) | |
| Dell XPS 15 9520 RTX 3050 Ti | |
| Lenovo ThinkPad X1 Extreme G4-20Y50040GE | |
| Lenovo ThinkPad X1 Extreme G4-20Y50040GE | |
| Média AMD Ryzen 7 PRO 6850H (2081 - 2090, n=2) | |
| Lenovo ThinkPad Z16 G1 21D5S00T00 | |
| Lenovo ThinkPad X1 Extreme G4-20Y5CTO1WW (3050 Ti) | |
| Apple MacBook Pro 16 2021 M1 Max | |
| Apple MacBook Pro 16 2021 M1 Pro | |
| Cinebench R15 / CPU Single 64Bit | |
| Média da turma Multimedia (184.8 - 326, n=66, últimos 2 anos) | |
| Dell XPS 17 9720 | |
| Dell XPS 15 9520 RTX 3050 Ti | |
| Lenovo ThinkPad X1 Extreme G4-20Y50040GE | |
| Lenovo ThinkPad Z16 G1 21D5S00T00 | |
| Lenovo ThinkPad X1 Extreme G4-20Y5CTO1WW (3050 Ti) | |
| Apple MacBook Pro 16 2021 M1 Pro | |
| Média AMD Ryzen 7 PRO 6850H (166.2 - 244, n=2) | |
| Apple MacBook Pro 16 2021 M1 Max | |
| Blender / v2.79 BMW27 CPU | |
| Lenovo ThinkPad X1 Extreme G4-20Y5CTO1WW (3050 Ti) | |
| Média da turma Multimedia (100 - 557, n=65, últimos 2 anos) | |
| Média AMD Ryzen 7 PRO 6850H (235 - 248, n=2) | |
| Dell XPS 17 9720 | |
| Lenovo ThinkPad Z16 G1 21D5S00T00 | |
| Dell XPS 15 9520 RTX 3050 Ti | |
| Apple MacBook Pro 16 2021 M1 Max | |
| Apple MacBook Pro 16 2021 M1 Pro | |
| 7-Zip 18.03 / 7z b 4 | |
| Dell XPS 15 9520 RTX 3050 Ti | |
| Dell XPS 17 9720 | |
| Média da turma Multimedia (29095 - 130368, n=62, últimos 2 anos) | |
| Lenovo ThinkPad Z16 G1 21D5S00T00 | |
| Média AMD Ryzen 7 PRO 6850H (52391 - 56498, n=2) | |
| Lenovo ThinkPad X1 Extreme G4-20Y5CTO1WW (3050 Ti) | |
| 7-Zip 18.03 / 7z b 4 -mmt1 | |
| Média da turma Multimedia (3666 - 7545, n=63, últimos 2 anos) | |
| Dell XPS 17 9720 | |
| Dell XPS 15 9520 RTX 3050 Ti | |
| Lenovo ThinkPad X1 Extreme G4-20Y5CTO1WW (3050 Ti) | |
| Média AMD Ryzen 7 PRO 6850H (5374 - 5460, n=2) | |
| Lenovo ThinkPad Z16 G1 21D5S00T00 | |
| Geekbench 5.5 / Multi-Core | |
| Dell XPS 17 9720 | |
| Média da turma Multimedia (4652 - 20422, n=62, últimos 2 anos) | |
| Apple MacBook Pro 16 2021 M1 Max | |
| Apple MacBook Pro 16 2021 M1 Pro | |
| Dell XPS 15 9520 RTX 3050 Ti | |
| Lenovo ThinkPad Z16 G1 21D5S00T00 | |
| Média AMD Ryzen 7 PRO 6850H (8093 - 8851, n=2) | |
| Lenovo ThinkPad X1 Extreme G4-20Y5CTO1WW (3050 Ti) | |
| Lenovo ThinkPad X1 Extreme G4-20Y50040GE | |
| Geekbench 5.5 / Single-Core | |
| Média da turma Multimedia (805 - 2974, n=62, últimos 2 anos) | |
| Apple MacBook Pro 16 2021 M1 Max | |
| Dell XPS 15 9520 RTX 3050 Ti | |
| Apple MacBook Pro 16 2021 M1 Pro | |
| Dell XPS 17 9720 | |
| Lenovo ThinkPad X1 Extreme G4-20Y50040GE | |
| Lenovo ThinkPad X1 Extreme G4-20Y5CTO1WW (3050 Ti) | |
| Lenovo ThinkPad Z16 G1 21D5S00T00 | |
| Média AMD Ryzen 7 PRO 6850H (1474 - 1481, n=2) | |
| HWBOT x265 Benchmark v2.2 / 4k Preset | |
| Média da turma Multimedia (5.26 - 36.1, n=63, últimos 2 anos) | |
| Lenovo ThinkPad Z16 G1 21D5S00T00 | |
| Dell XPS 15 9520 RTX 3050 Ti | |
| Dell XPS 17 9720 | |
| Média AMD Ryzen 7 PRO 6850H (12.7 - 15.9, n=2) | |
| Lenovo ThinkPad X1 Extreme G4-20Y50040GE | |
| Lenovo ThinkPad X1 Extreme G4-20Y5CTO1WW (3050 Ti) | |
| LibreOffice / 20 Documents To PDF | |
| Média AMD Ryzen 7 PRO 6850H (50.7 - 95.2, n=2) | |
| Lenovo ThinkPad Z16 G1 21D5S00T00 | |
| Média da turma Multimedia (23.9 - 146.7, n=64, últimos 2 anos) | |
| Dell XPS 17 9720 | |
| Lenovo ThinkPad X1 Extreme G4-20Y5CTO1WW (3050 Ti) | |
| Dell XPS 15 9520 RTX 3050 Ti | |
| Lenovo ThinkPad X1 Extreme G4-20Y50040GE | |
| R Benchmark 2.5 / Overall mean | |
| Lenovo ThinkPad X1 Extreme G4-20Y5CTO1WW (3050 Ti) | |
| Lenovo ThinkPad X1 Extreme G4-20Y50040GE | |
| Média AMD Ryzen 7 PRO 6850H (0.516 - 0.524, n=2) | |
| Lenovo ThinkPad Z16 G1 21D5S00T00 | |
| Média da turma Multimedia (0.3604 - 0.947, n=63, últimos 2 anos) | |
| Dell XPS 15 9520 RTX 3050 Ti | |
| Dell XPS 17 9720 | |
* ... menor é melhor
AIDA64: FP32 Ray-Trace | FPU Julia | CPU SHA3 | CPU Queen | FPU SinJulia | FPU Mandel | CPU AES | CPU ZLib | FP64 Ray-Trace | CPU PhotoWorxx
| Performance rating | |
| Média da turma Multimedia | |
| Média AMD Ryzen 7 PRO 6850H | |
| Lenovo ThinkPad Z16 G1 21D5S00T00 | |
| Lenovo ThinkPad X1 Extreme G4-20Y50040GE | |
| Lenovo ThinkPad X1 Extreme G4-20Y5CTO1WW (3050 Ti) | |
| Dell XPS 15 9520 RTX 3050 Ti | |
| Dell XPS 17 9720 | |
| AIDA64 / FP32 Ray-Trace | |
| Média da turma Multimedia (2214 - 50388, n=60, últimos 2 anos) | |
| Lenovo ThinkPad Z16 G1 21D5S00T00 | |
| Lenovo ThinkPad X1 Extreme G4-20Y50040GE | |
| Média AMD Ryzen 7 PRO 6850H (15009 - 15301, n=2) | |
| Lenovo ThinkPad X1 Extreme G4-20Y5CTO1WW (3050 Ti) | |
| Dell XPS 15 9520 RTX 3050 Ti | |
| Dell XPS 17 9720 | |
| AIDA64 / FPU Julia | |
| Lenovo ThinkPad Z16 G1 21D5S00T00 | |
| Média AMD Ryzen 7 PRO 6850H (93021 - 94997, n=2) | |
| Média da turma Multimedia (12867 - 201874, n=61, últimos 2 anos) | |
| Lenovo ThinkPad X1 Extreme G4-20Y50040GE | |
| Lenovo ThinkPad X1 Extreme G4-20Y5CTO1WW (3050 Ti) | |
| Dell XPS 15 9520 RTX 3050 Ti | |
| Dell XPS 17 9720 | |
| AIDA64 / CPU SHA3 | |
| Lenovo ThinkPad X1 Extreme G4-20Y50040GE | |
| Lenovo ThinkPad X1 Extreme G4-20Y5CTO1WW (3050 Ti) | |
| Média da turma Multimedia (653 - 8623, n=61, últimos 2 anos) | |
| Lenovo ThinkPad Z16 G1 21D5S00T00 | |
| Média AMD Ryzen 7 PRO 6850H (3155 - 3169, n=2) | |
| Dell XPS 15 9520 RTX 3050 Ti | |
| Dell XPS 17 9720 | |
| AIDA64 / CPU Queen | |
| Lenovo ThinkPad Z16 G1 21D5S00T00 | |
| Média AMD Ryzen 7 PRO 6850H (100724 - 102905, n=2) | |
| Dell XPS 17 9720 | |
| Dell XPS 15 9520 RTX 3050 Ti | |
| Lenovo ThinkPad X1 Extreme G4-20Y50040GE | |
| Lenovo ThinkPad X1 Extreme G4-20Y5CTO1WW (3050 Ti) | |
| Média da turma Multimedia (13483 - 181505, n=49, últimos 2 anos) | |
| AIDA64 / FPU SinJulia | |
| Lenovo ThinkPad Z16 G1 21D5S00T00 | |
| Média AMD Ryzen 7 PRO 6850H (12309 - 12638, n=2) | |
| Lenovo ThinkPad X1 Extreme G4-20Y50040GE | |
| Lenovo ThinkPad X1 Extreme G4-20Y5CTO1WW (3050 Ti) | |
| Média da turma Multimedia (1240 - 28794, n=61, últimos 2 anos) | |
| Dell XPS 15 9520 RTX 3050 Ti | |
| Dell XPS 17 9720 | |
| AIDA64 / FPU Mandel | |
| Lenovo ThinkPad Z16 G1 21D5S00T00 | |
| Média AMD Ryzen 7 PRO 6850H (51299 - 51802, n=2) | |
| Média da turma Multimedia (6395 - 105740, n=60, últimos 2 anos) | |
| Lenovo ThinkPad X1 Extreme G4-20Y50040GE | |
| Lenovo ThinkPad X1 Extreme G4-20Y5CTO1WW (3050 Ti) | |
| Dell XPS 15 9520 RTX 3050 Ti | |
| Dell XPS 17 9720 | |
| AIDA64 / CPU AES | |
| Lenovo ThinkPad X1 Extreme G4-20Y50040GE | |
| Lenovo ThinkPad X1 Extreme G4-20Y5CTO1WW (3050 Ti) | |
| Média AMD Ryzen 7 PRO 6850H (60476 - 128243, n=2) | |
| Dell XPS 15 9520 RTX 3050 Ti | |
| Dell XPS 17 9720 | |
| Média da turma Multimedia (13243 - 126790, n=61, últimos 2 anos) | |
| Lenovo ThinkPad Z16 G1 21D5S00T00 | |
| AIDA64 / CPU ZLib | |
| Média da turma Multimedia (167.2 - 2022, n=61, últimos 2 anos) | |
| Dell XPS 17 9720 | |
| Dell XPS 15 9520 RTX 3050 Ti | |
| Lenovo ThinkPad X1 Extreme G4-20Y50040GE | |
| Média AMD Ryzen 7 PRO 6850H (806 - 809, n=2) | |
| Lenovo ThinkPad Z16 G1 21D5S00T00 | |
| Lenovo ThinkPad X1 Extreme G4-20Y5CTO1WW (3050 Ti) | |
| AIDA64 / FP64 Ray-Trace | |
| Média da turma Multimedia (1014 - 26875, n=61, últimos 2 anos) | |
| Lenovo ThinkPad X1 Extreme G4-20Y50040GE | |
| Lenovo ThinkPad Z16 G1 21D5S00T00 | |
| Média AMD Ryzen 7 PRO 6850H (7876 - 8104, n=2) | |
| Lenovo ThinkPad X1 Extreme G4-20Y5CTO1WW (3050 Ti) | |
| Dell XPS 15 9520 RTX 3050 Ti | |
| Dell XPS 17 9720 | |
| AIDA64 / CPU PhotoWorxx | |
| Média da turma Multimedia (12860 - 88154, n=61, últimos 2 anos) | |
| Dell XPS 17 9720 | |
| Dell XPS 15 9520 RTX 3050 Ti | |
| Lenovo ThinkPad Z16 G1 21D5S00T00 | |
| Média AMD Ryzen 7 PRO 6850H (18157 - 26176, n=2) | |
| Lenovo ThinkPad X1 Extreme G4-20Y5CTO1WW (3050 Ti) | |
| Lenovo ThinkPad X1 Extreme G4-20Y50040GE | |
Desempenho do sistema
No PCMark 10, o Lenovo ThinkPad Z16 G1 coloca no meio do campo, mas no Crossmark, mais na extremidade inferior do campo de comparação. Na operação diária, o Lenovo ThinkPad Z16 G1 funciona de forma absolutamente suave e rápida.
CrossMark: Overall | Productivity | Creativity | Responsiveness
| PCMark 10 / Score | |
| Média da turma Multimedia (4325 - 10386, n=58, últimos 2 anos) | |
| Dell XPS 15 9520 RTX 3050 Ti | |
| Lenovo ThinkPad X1 Extreme G4-20Y50040GE | |
| Dell XPS 17 9720 | |
| Lenovo ThinkPad Z16 G1 21D5S00T00 | |
| Média AMD Ryzen 7 PRO 6850H, AMD Radeon RX 6500M (n=1) | |
| Lenovo ThinkPad X1 Extreme G4-20Y5CTO1WW (3050 Ti) | |
| PCMark 10 / Essentials | |
| Dell XPS 15 9520 RTX 3050 Ti | |
| Lenovo ThinkPad X1 Extreme G4-20Y5CTO1WW (3050 Ti) | |
| Lenovo ThinkPad X1 Extreme G4-20Y50040GE | |
| Média da turma Multimedia (8025 - 11664, n=57, últimos 2 anos) | |
| Dell XPS 17 9720 | |
| Lenovo ThinkPad Z16 G1 21D5S00T00 | |
| Média AMD Ryzen 7 PRO 6850H, AMD Radeon RX 6500M (n=1) | |
| PCMark 10 / Productivity | |
| Média da turma Multimedia (7323 - 18233, n=57, últimos 2 anos) | |
| Dell XPS 15 9520 RTX 3050 Ti | |
| Dell XPS 17 9720 | |
| Lenovo ThinkPad X1 Extreme G4-20Y50040GE | |
| Lenovo ThinkPad X1 Extreme G4-20Y5CTO1WW (3050 Ti) | |
| Lenovo ThinkPad Z16 G1 21D5S00T00 | |
| Média AMD Ryzen 7 PRO 6850H, AMD Radeon RX 6500M (n=1) | |
| PCMark 10 / Digital Content Creation | |
| Média da turma Multimedia (3651 - 16240, n=57, últimos 2 anos) | |
| Lenovo ThinkPad X1 Extreme G4-20Y50040GE | |
| Dell XPS 17 9720 | |
| Dell XPS 15 9520 RTX 3050 Ti | |
| Lenovo ThinkPad Z16 G1 21D5S00T00 | |
| Média AMD Ryzen 7 PRO 6850H, AMD Radeon RX 6500M (n=1) | |
| Lenovo ThinkPad X1 Extreme G4-20Y5CTO1WW (3050 Ti) | |
| CrossMark / Overall | |
| Dell XPS 15 9520 RTX 3050 Ti | |
| Dell XPS 17 9720 | |
| Média da turma Multimedia (866 - 2728, n=67, últimos 2 anos) | |
| Lenovo ThinkPad X1 Extreme G4-20Y50040GE | |
| Apple MacBook Pro 16 2021 M1 Max | |
| Apple MacBook Pro 16 2021 M1 Pro | |
| Lenovo ThinkPad Z16 G1 21D5S00T00 | |
| Média AMD Ryzen 7 PRO 6850H, AMD Radeon RX 6500M (n=1) | |
| CrossMark / Productivity | |
| Dell XPS 15 9520 RTX 3050 Ti | |
| Média da turma Multimedia (931 - 2489, n=67, últimos 2 anos) | |
| Dell XPS 17 9720 | |
| Lenovo ThinkPad X1 Extreme G4-20Y50040GE | |
| Lenovo ThinkPad Z16 G1 21D5S00T00 | |
| Média AMD Ryzen 7 PRO 6850H, AMD Radeon RX 6500M (n=1) | |
| Apple MacBook Pro 16 2021 M1 Max | |
| Apple MacBook Pro 16 2021 M1 Pro | |
| CrossMark / Creativity | |
| Média da turma Multimedia (907 - 3465, n=67, últimos 2 anos) | |
| Apple MacBook Pro 16 2021 M1 Max | |
| Dell XPS 17 9720 | |
| Apple MacBook Pro 16 2021 M1 Pro | |
| Dell XPS 15 9520 RTX 3050 Ti | |
| Lenovo ThinkPad X1 Extreme G4-20Y50040GE | |
| Lenovo ThinkPad Z16 G1 21D5S00T00 | |
| Média AMD Ryzen 7 PRO 6850H, AMD Radeon RX 6500M (n=1) | |
| CrossMark / Responsiveness | |
| Dell XPS 15 9520 RTX 3050 Ti | |
| Dell XPS 17 9720 | |
| Lenovo ThinkPad X1 Extreme G4-20Y50040GE | |
| Média da turma Multimedia (605 - 2024, n=67, últimos 2 anos) | |
| Lenovo ThinkPad Z16 G1 21D5S00T00 | |
| Média AMD Ryzen 7 PRO 6850H, AMD Radeon RX 6500M (n=1) | |
| Apple MacBook Pro 16 2021 M1 Max | |
| Apple MacBook Pro 16 2021 M1 Pro | |
| PCMark 10 Score | 6530 pontos | |
Ajuda | ||
| AIDA64 / Memory Copy | |
| Média da turma Multimedia (21158 - 132135, n=61, últimos 2 anos) | |
| Dell XPS 17 9720 | |
| Dell XPS 15 9520 RTX 3050 Ti | |
| Lenovo ThinkPad Z16 G1 21D5S00T00 | |
| Média AMD Ryzen 7 PRO 6850H (30324 - 48504, n=2) | |
| Lenovo ThinkPad X1 Extreme G4-20Y5CTO1WW (3050 Ti) | |
| Lenovo ThinkPad X1 Extreme G4-20Y50040GE | |
| AIDA64 / Memory Read | |
| Média da turma Multimedia (19699 - 174586, n=61, últimos 2 anos) | |
| Dell XPS 17 9720 | |
| Dell XPS 15 9520 RTX 3050 Ti | |
| Lenovo ThinkPad Z16 G1 21D5S00T00 | |
| Lenovo ThinkPad X1 Extreme G4-20Y5CTO1WW (3050 Ti) | |
| Média AMD Ryzen 7 PRO 6850H (33791 - 42736, n=2) | |
| Lenovo ThinkPad X1 Extreme G4-20Y50040GE | |
| AIDA64 / Memory Write | |
| Média da turma Multimedia (17733 - 134998, n=61, últimos 2 anos) | |
| Dell XPS 17 9720 | |
| Dell XPS 15 9520 RTX 3050 Ti | |
| Lenovo ThinkPad Z16 G1 21D5S00T00 | |
| Média AMD Ryzen 7 PRO 6850H (32728 - 51157, n=2) | |
| Lenovo ThinkPad X1 Extreme G4-20Y5CTO1WW (3050 Ti) | |
| Lenovo ThinkPad X1 Extreme G4-20Y50040GE | |
| AIDA64 / Memory Latency | |
| Lenovo ThinkPad Z16 G1 21D5S00T00 | |
| Média da turma Multimedia (7 - 535, n=60, últimos 2 anos) | |
| Média AMD Ryzen 7 PRO 6850H (93.5 - 132.1, n=2) | |
| Dell XPS 15 9520 RTX 3050 Ti | |
| Dell XPS 17 9720 | |
| Lenovo ThinkPad X1 Extreme G4-20Y50040GE | |
| Lenovo ThinkPad X1 Extreme G4-20Y5CTO1WW (3050 Ti) | |
* ... menor é melhor
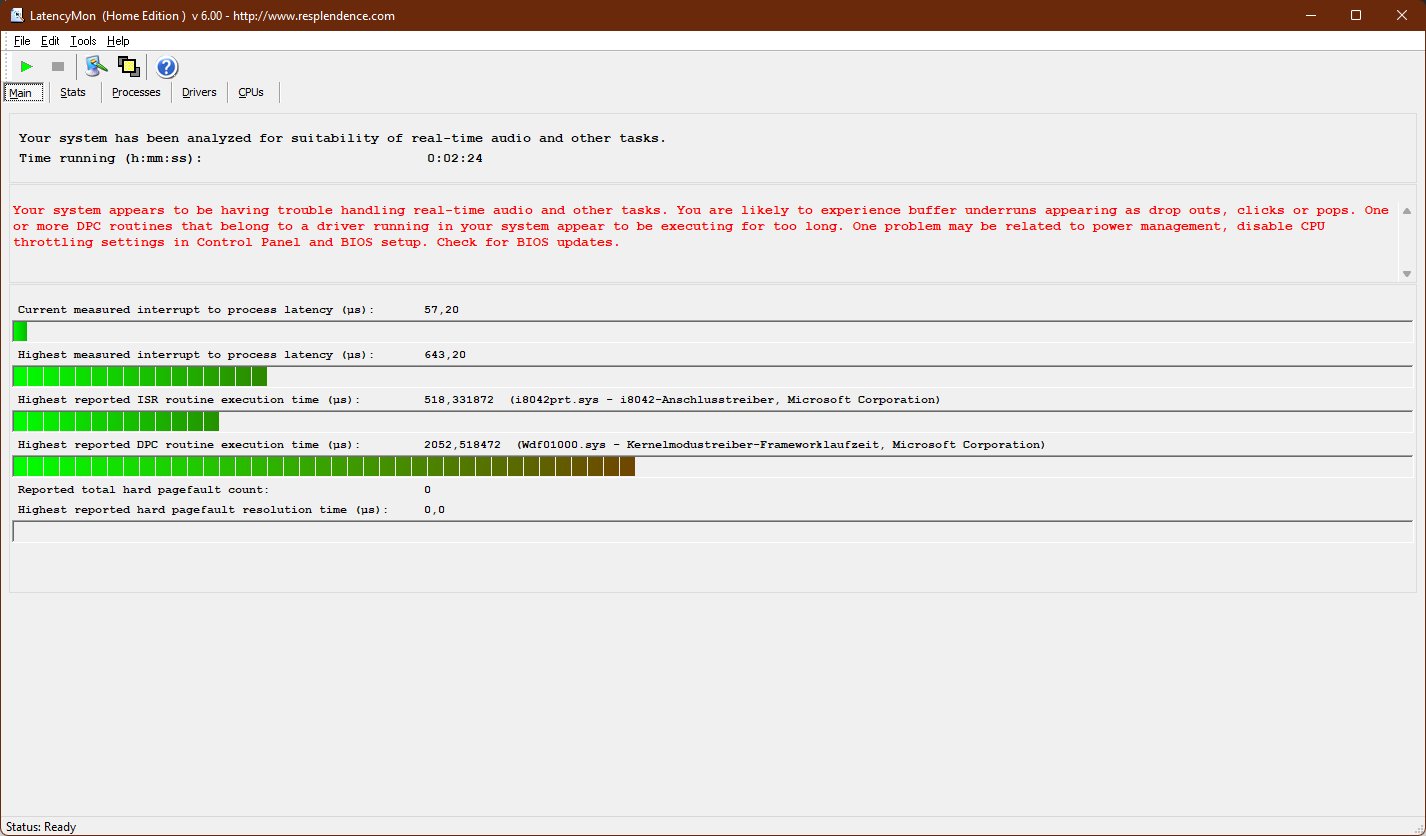
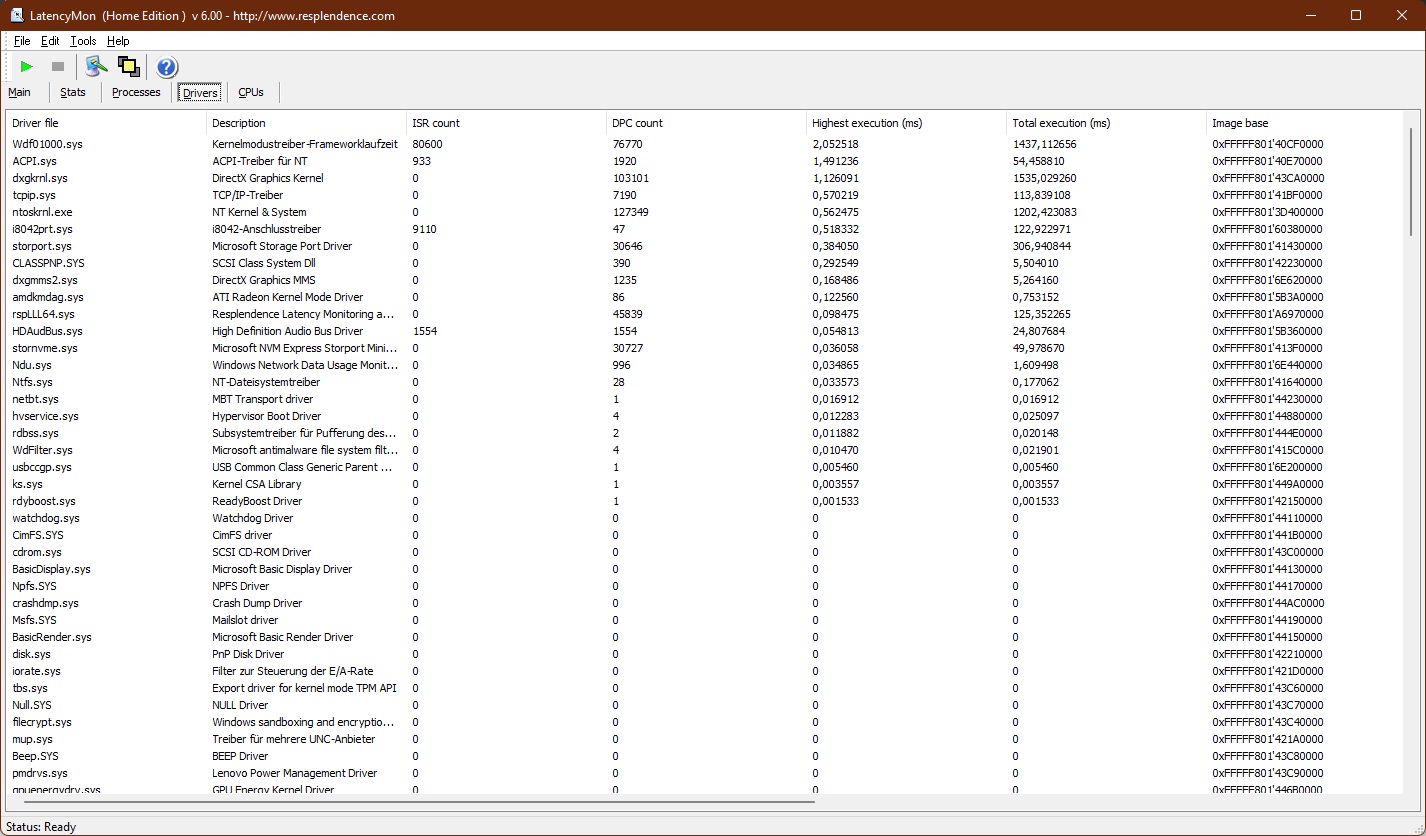
Latências DPC
Nossa unidade de teste do Lenovo ThinkPad Z16 G1 tem problemas com latências DPC, o que pode levar a algumas quedas durante o processamento de áudio e vídeo. Estes problemas podem ser solucionados com atualizações de driver ou firmware e podem variar de unidade para unidade.
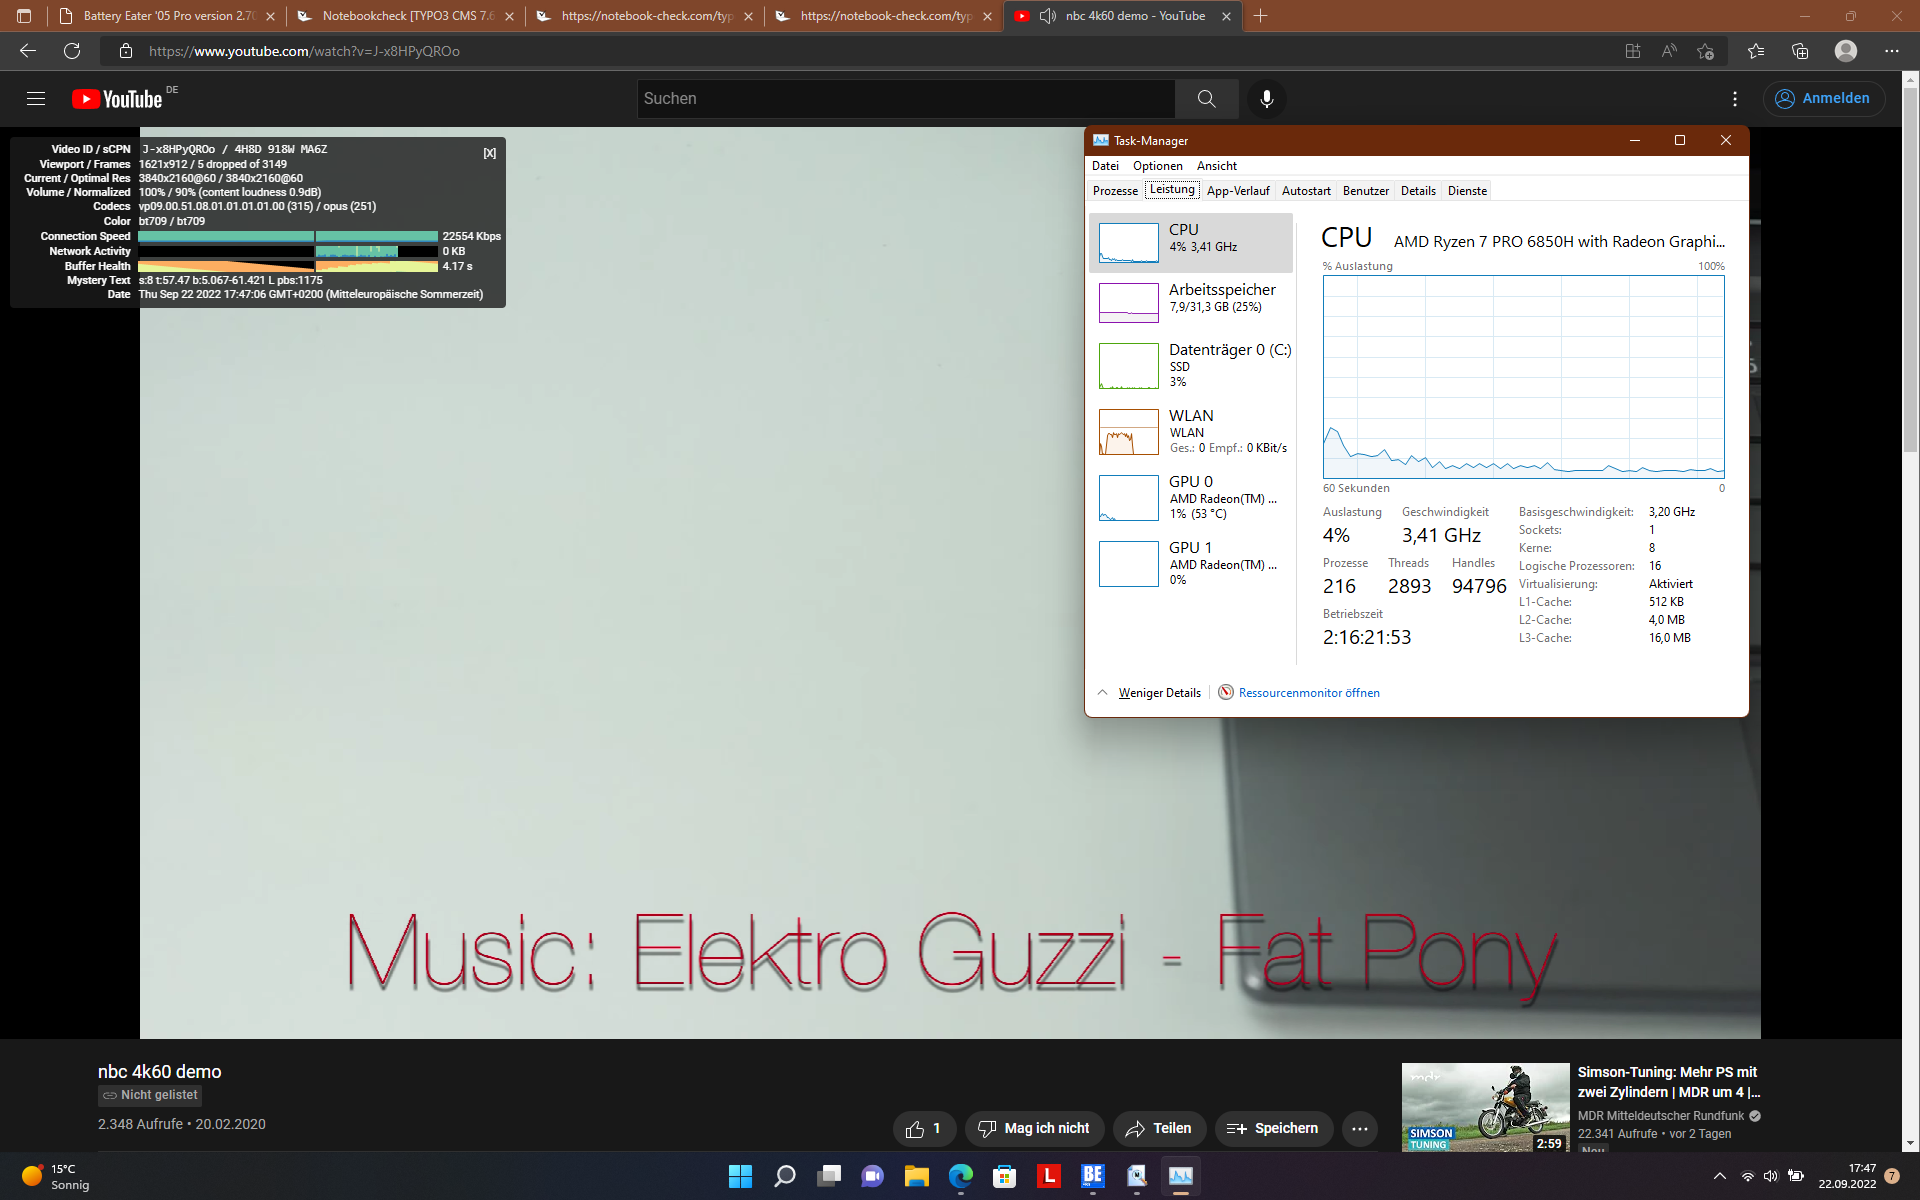
Quase não há quedas no teste do YouTube, onde as cargas da CPU e da GPU também permanecem extremamente baixas.
| DPC Latencies / LatencyMon - interrupt to process latency (max), Web, Youtube, Prime95 | |
| Lenovo ThinkPad X1 Extreme G4-20Y50040GE | |
| Dell XPS 17 9720 | |
| Lenovo ThinkPad X1 Extreme G4-20Y5CTO1WW (3050 Ti) | |
| Dell XPS 15 9520 RTX 3050 Ti | |
| Lenovo ThinkPad Z16 G1 21D5S00T00 | |
* ... menor é melhor
Solução de armazenamento
O Samsung PM9A1 SSD no Lenovo ThinkPad Z16 Gen 1 oferece uma capacidade de armazenamento de 1 Terrabyte. É um SSD M.2-2280 que está conectado com o mais novo padrão NVMe PCIe-4.0. Os resultados em nosso teste de referência pintam um quadro misto: Olhando para a velocidade absoluta, este é um SSD muito rápido, mas todos os outros laptops em nossa comparação são mais rápidos, mesmo que a diferença não seja muito grande. Além disso, o desempenho sob carga constante também varia.

* ... menor é melhor
Constant Performance Reading: DiskSpd Read Loop, Queue Depth 8
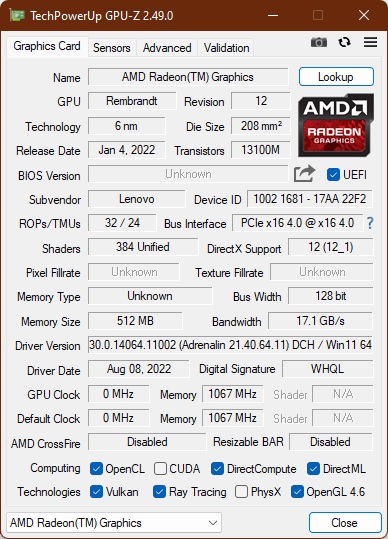
Placa Gráfica
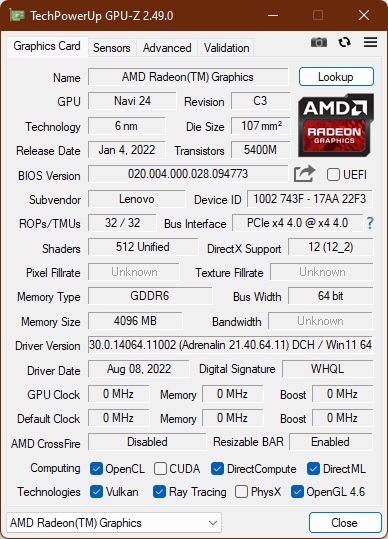
A última vez que a Lenovo usou um chip gráfico dedicado da AMD em um ThinkPad (naquele ponto no ThinkPad T500que ainda usava a marca ATi), o iPhone tinha apenas um ano de idade. Naturalmente, a Lenovo não escolheu um processador gráfico muito poderoso com o AMD Radeon RX 6500M. O consumo típico de energia deste chip de nível básico é de 50 watts, embora ele seja capaz de consumir 55 watts no ThinkPad Z16.
Com isto, o ThinkPad Z16 G1 funciona na mesma faixa que os modelos de nível de entrada do ThinkPad X1 Extremecom oNvidia GeForce RTX 3050 Tie o Dell XPS 15com a mesma GPU. Isto também vale para o desempenho gráfico em si, e nos benchmarks gráficos 3DMark Time Spy e Fire Strike, os RX 6500M variam no mesmo nível que o RTX 3050 Ti.
Na operação com bateria, o desempenho gráfico fica ligeiramente inferior, em cerca de 23% no 3DMark Time Spy (3429 pontos).
| 3DMark 06 Standard Score | 35958 pontos | |
| 3DMark Vantage P Result | 51599 pontos | |
| 3DMark 11 Performance | 17548 pontos | |
| 3DMark Ice Storm Standard Score | 116884 pontos | |
| 3DMark Cloud Gate Standard Score | 92553 pontos | |
| 3DMark Fire Strike Score | 12287 pontos | |
| 3DMark Time Spy Score | 4795 pontos | |
Ajuda | ||
Em nossos relatórios de teste, o teste do misturador 3.3 é relativamente novo. No benchmark Classroom em modo HIP, o ThinkPad Z16 com o Radeon RX 6500Malcança um desempenho semelhante ao do Dell Inspiron 14 Plus 7420com oRTX 3050 no modo CUDA. O RTX 3050 Ti noDell Inspiron 16 Plus 7620tem um desempenho cerca de 30% melhor neste teste. Em qualquer caso, o tempo de renderização é significativamente reduzido em comparação com o modo CPU.
* ... menor é melhor
Desempenho nos jogos
Como nos benchmarks sintéticos, o desempenho do jogo está aproximadamente no nível do Dell XPS 15 9520com o RTX 3050 Ti, com o X1 Extreme que tem o mesmo chip Nvidia tendendo a ficar um pouco melhor nos jogos. Mesmo jogos mais novos podem ser reproduzidos em configurações de alto ou alto detalhe, mas somente em resolução Full-HD. O desempenho do AMD Radeon, muito provavelmente, não será suficiente para jogos 4K.
Você deve observar que o desempenho da GPU sofre com o estrangulamento. Em nosso loop The Witcher 3, a taxa de FPS cai de 45 para apenas 35 FPS iniciais.
| The Witcher 3 - 1920x1080 High Graphics & Postprocessing (Nvidia HairWorks Off) | |
| Lenovo ThinkPad X1 Extreme G4-20Y50040GE | |
| Dell XPS 17 9720 | |
| Lenovo ThinkPad X1 Extreme G4-20Y5CTO1WW (3050 Ti) | |
| Média da turma Multimedia (22 - 224, n=13, últimos 2 anos) | |
| Dell XPS 15 9520 RTX 3050 Ti | |
| Lenovo ThinkPad Z16 G1 21D5S00T00 | |
| Média AMD Radeon RX 6500M (n=1) | |
| F1 2021 - 1920x1080 Ultra High Preset + Raytracing AA:T AF:16x | |
| Dell XPS 17 9720 | |
| Lenovo ThinkPad Z16 G1 21D5S00T00 | |
| Média AMD Radeon RX 6500M (n=1) | |
| GTA V - 1920x1080 High/On (Advanced Graphics Off) AA:2xMSAA + FX AF:8x | |
| Dell XPS 17 9720 | |
| Lenovo ThinkPad X1 Extreme G4-20Y5CTO1WW (3050 Ti) | |
| Lenovo ThinkPad Z16 G1 21D5S00T00 | |
| Média AMD Radeon RX 6500M (90 - 96.6, n=2) | |
| Dell XPS 15 9520 RTX 3050 Ti | |
| Média da turma Multimedia (19.5 - 186.1, n=56, últimos 2 anos) | |
The Witcher 3 FPS Chart
| baixo | média | alto | ultra | |
|---|---|---|---|---|
| GTA V (2015) | 154.7 | 144.8 | 96.6 | 41.8 |
| The Witcher 3 (2015) | 195 | 136.2 | 57.4 | 39.1 |
| Dota 2 Reborn (2015) | 121.5 | 106.1 | 102.2 | 94.8 |
| Final Fantasy XV Benchmark (2018) | 126.6 | 65.8 | 46.9 | |
| X-Plane 11.11 (2018) | 47.7 | 40.7 | 36.8 | |
| Far Cry 5 (2018) | 90 | 75 | 71 | 66 |
| Strange Brigade (2018) | 266 | 119.1 | 98.8 | 86.3 |
| Metro Exodus (2019) | 137.4 | 66.7 | 46.7 | 37 |
| The Division 2 (2019) | 129 | 82 | 67 | 47 |
| Borderlands 3 (2019) | 78.2 | 66.6 | 47.1 | 34.5 |
| Hunt Showdown (2020) | 124.8 | 68.9 | 57.3 | |
| Doom Eternal (2020) | 232 | 101.2 | 57.5 | |
| Gears Tactics (2020) | 257.8 | 125.2 | 82.4 | 56.6 |
| Death Stranding (2020) | 130.4 | 89.3 | 82.2 | 78.9 |
| Horizon Zero Dawn (2020) | 103 | 71 | 59 | 54 |
| Crysis Remastered (2020) | 185.6 | 88.7 | 26.3 | 19.6 |
| Mafia Definitive Edition (2020) | 91.4 | 53 | 48.7 | |
| Star Wars Squadrons (2020) | 267 | 150.5 | 131.7 | 119.6 |
| Watch Dogs Legion (2020) | 81.1 | 70 | 59.1 | 24.6 |
| Dirt 5 (2020) | 159.4 | 72.9 | 56.3 | 37.4 |
| Assassin´s Creed Valhalla (2020) | 113 | 62 | 45 | 39 |
| Yakuza Like a Dragon (2020) | 80.3 | 60.6 | 58.4 | 54.5 |
| Immortals Fenyx Rising (2020) | 89 | 68 | 47 | 41 |
| Hitman 3 (2021) | 157.2 | 102.1 | 88.7 | 80.5 |
| Mass Effect Legendary Edition (2021) | 82.2 | 75.6 | ||
| Days Gone (2021) | 116.3 | 70.6 | 62.7 | 44.2 |
| F1 2021 (2021) | 245 | 139 | 105.1 | 42.9 |
| New World (2021) | 70.3 | 53 | 46.2 | 40.4 |
| Far Cry 6 (2021) | 91.7 | 69.8 | 62.5 | 54.5 |
| Back 4 Blood (2021) | 116 | 95.3 | 92.7 | |
| Guardians of the Galaxy (2021) | 83 | 48 | 47 | 44 |
| Riders Republic (2021) | 71 | 68 | 58 | 43 |
| Forza Horizon 5 (2021) | 152 | 101 | 81 | 27 |
| Battlefield 2042 (2021) | 129.7 | 71.2 | 53.3 | 23.3 |
| Farming Simulator 22 (2021) | 96.6 | 86 | ||
| Halo Infinite (2021) | 62.4 | 43.6 | 42.4 | |
| God of War (2022) | 64.5 | 54.1 | 39.6 | 11.9 |
| Rainbow Six Extraction (2022) | 96 | 69 | 61 | 34 |
| Dying Light 2 (2022) | 58.4 | 46.6 | 37 | |
| GRID Legends (2022) | 146.9 | 105 | 75.9 | 59.9 |
| Cyberpunk 2077 1.6 (2022) | 66.2 | 66.5 | 32.3 | 29.2 |
| Elex 2 (2022) | 53.4 | 51 | 44 | 37.6 |
| Ghostwire Tokyo (2022) | 72.7 | 71 | 65.5 | 66.3 |
| Tiny Tina's Wonderlands (2022) | 118.1 | 88.5 | 45.8 | 29.8 |
| Vampire Bloodhunt (2022) | 142.7 | 115 | 106.7 | 98.1 |
| F1 22 (2022) | 116.3 | 97.2 | 75.6 | 13.9 |
| The Quarry (2022) | 64.1 | 48.3 | 38.9 | 25.4 |
Emissões: O ventilador permanece silencioso, mas o ThinkPad Z16 funciona a quente
Emissões sonoras
Sob carga baixa, o ventilador do Lenovo ThinkPad Z16 G1 funciona muito silenciosamente, de modo que você dificilmente poderá percebê-lo. Mesmo o MacBook Pro 16 mit M1 Pro é minimamente mais alto neste ponto. Isto muda sob carga máxima, já que o MacBook é então mais silencioso, mesmo na versão mais potente com o M1 Max. Entretanto, o ThinkPad Z16 ainda não é um laptop barulhento, e o nível máximo de ruído dos ventiladores permanece significativamente abaixo do Lenovo ThinkPad X1 Extreme G4.
Não notamos nenhum lamento de bobina na Z16.
Barulho
| Ocioso |
| 23.7 / 23.7 / 23.7 dB |
| Carga |
| 25.9 / 46.9 dB |
 | ||
30 dB silencioso 40 dB(A) audível 50 dB(A) ruidosamente alto |
||
min: | ||
| Lenovo ThinkPad Z16 G1 21D5S00T00 Radeon RX 6500M, R7 PRO 6850H, Samsung PM9A1 MZVL21T0HCLR | Lenovo ThinkPad X1 Extreme G4-20Y5CTO1WW (3050 Ti) GeForce RTX 3050 Ti Laptop GPU, i7-11800H, Samsung PM9A1 MZVL21T0HCLR | Lenovo ThinkPad X1 Extreme G4-20Y50040GE GeForce RTX 3080 Laptop GPU, i9-11950H, Kioxia XG7 KXG7AZNV1T02 | Dell XPS 15 9520 RTX 3050 Ti GeForce RTX 3050 Ti Laptop GPU, i7-12700H, WDC PC SN810 512GB | Dell XPS 17 9720 GeForce RTX 3050 4GB Laptop GPU, i7-12700H, Micron 3400 MTFDKBA512TFH 512GB | Apple MacBook Pro 16 2021 M1 Pro M1 Pro 16-Core GPU, M1 Pro, Apple SSD AP1024R | Apple MacBook Pro 16 2021 M1 Max M1 Max 32-Core GPU, M1 Max, Apple SSD AP2048R | |
|---|---|---|---|---|---|---|---|
| Noise | -12% | -15% | 3% | -11% | 1% | -7% | |
| desligado / ambiente * (dB) | 23.7 | 23.52 1% | 24.7 -4% | 22.8 4% | 24 -1% | 24.7 -4% | 24.2 -2% |
| Idle Minimum * (dB) | 23.7 | 23.52 1% | 24.7 -4% | 22.9 3% | 24 -1% | 24.7 -4% | 24.2 -2% |
| Idle Average * (dB) | 23.7 | 23.52 1% | 24.7 -4% | 22.9 3% | 24 -1% | 24.7 -4% | 24.2 -2% |
| Idle Maximum * (dB) | 23.7 | 23.52 1% | 28.1 -19% | 22.9 3% | 24 -1% | 24.7 -4% | 24.2 -2% |
| Load Average * (dB) | 25.9 | 42.9 -66% | 42.5 -64% | 30.9 -19% | 43.9 -69% | 26.1 -1% | 42.9 -66% |
| Witcher 3 ultra * (dB) | 46.9 | 52.5 -12% | 46.4 1% | 37.8 19% | 48.4 -3% | 39.5 16% | |
| Load Maximum * (dB) | 46.9 | 52.45 -12% | 52.1 -11% | 44.7 5% | 48.4 -3% | 37.4 20% | 42.9 9% |
* ... menor é melhor
Temperaturas
O Lenovo ThinkPad Z16 Gen 1 permanece completamente frio durante a operação ociosa. Por outro lado, o ThinkPad Z16 funciona bastante quente sob carga, quer seja durante o teste de estresse ou durante o teste Witcher 3. Medimos a temperatura máxima acima do teclado a 56,8 ºC (~134 ºF). Mesmo que você possa facilmente evitar tocar nesta área, o resto do estojo também aquece significativamente. O apoio de palma atinge uma temperatura máxima de 36,5 ºC (~98 ºF), que se sente visivelmente quente e pode levar a mãos suadas
Durante o teste de esforço, nossa unidade de teste de reposição também não consegue se manter estável. Tanto o Prime95 como o FurMark running levam a frequentes reinicializações repentinas. Portanto, não podemos incluir o teste de estresse de uma hora.
(-) A temperatura máxima no lado superior é 56.8 °C / 134 F, em comparação com a média de 36.8 °C / 98 F , variando de 21 a 71 °C para a classe Multimedia.
(-) A parte inferior aquece até um máximo de 53.3 °C / 128 F, em comparação com a média de 39.1 °C / 102 F
(+) Em uso inativo, a temperatura média para o lado superior é 27 °C / 81 F, em comparação com a média do dispositivo de 31.3 °C / ### class_avg_f### F.
(-) Jogando The Witcher 3, a temperatura média para o lado superior é 43.8 °C / 111 F, em comparação com a média do dispositivo de 31.3 °C / ## #class_avg_f### F.
(±) Os apoios para as mãos e o touchpad podem ficar muito quentes ao toque, com um máximo de 36.6 °C / 97.9 F.
(-) A temperatura média da área do apoio para as mãos de dispositivos semelhantes foi 28.7 °C / 83.7 F (-7.9 °C / -14.2 F).
| Lenovo ThinkPad Z16 G1 21D5S00T00 AMD Ryzen 7 PRO 6850H, AMD Radeon RX 6500M | Lenovo ThinkPad X1 Extreme G4-20Y5CTO1WW (3050 Ti) Intel Core i7-11800H, NVIDIA GeForce RTX 3050 Ti Laptop GPU | Lenovo ThinkPad X1 Extreme G4-20Y50040GE Intel Core i9-11950H, NVIDIA GeForce RTX 3080 Laptop GPU | Dell XPS 15 9520 RTX 3050 Ti Intel Core i7-12700H, NVIDIA GeForce RTX 3050 Ti Laptop GPU | Dell XPS 17 9720 Intel Core i7-12700H, NVIDIA GeForce RTX 3050 4GB Laptop GPU | Apple MacBook Pro 16 2021 M1 Pro Apple M1 Pro, Apple M1 Pro 16-Core GPU | Apple MacBook Pro 16 2021 M1 Max Apple M1 Max, Apple M1 Max 32-Core GPU | |
|---|---|---|---|---|---|---|---|
| Heat | 4% | 3% | -1% | 12% | 22% | 21% | |
| Maximum Upper Side * (°C) | 56.8 | 49 14% | 51.4 10% | 51.4 10% | 49.5 13% | 41 28% | 42.3 26% |
| Maximum Bottom * (°C) | 53.3 | 44.4 17% | 55.9 -5% | 51 4% | 38.4 28% | 39 27% | 41.7 22% |
| Idle Upper Side * (°C) | 28.2 | 32.1 -14% | 27.2 4% | 30 -6% | 28 1% | 24 15% | 23.9 15% |
| Idle Bottom * (°C) | 29.4 | 29.8 -1% | 28.8 2% | 33 -12% | 27.8 5% | 24 18% | 23.9 19% |
* ... menor é melhor
Orador
Em ambos os lados do teclado estão os alto-falantes estéreo do ThinkPad Z16 da Lenovo. Eles são bastante altos e até têm um pouco de baixo, mas ainda assim perdem em comparação com os do Apple MacBook Pro 16. O MacBook simplesmente oferece mais baixo e volume.
Lenovo ThinkPad Z16 G1 21D5S00T00 análise de áudio
(±) | o volume do alto-falante é médio, mas bom (###valor### dB)
Graves 100 - 315Hz
(±) | graves reduzidos - em média 11.3% menor que a mediana
(±) | a linearidade dos graves é média (13% delta para a frequência anterior)
Médios 400 - 2.000 Hz
(+) | médios equilibrados - apenas 2.6% longe da mediana
(+) | médios são lineares (3.2% delta para frequência anterior)
Altos 2 - 16 kHz
(+) | agudos equilibrados - apenas 2.6% longe da mediana
(+) | os máximos são lineares (5.7% delta da frequência anterior)
Geral 100 - 16.000 Hz
(+) | o som geral é linear (12.5% diferença em relação à mediana)
Comparado com a mesma classe
» 24% de todos os dispositivos testados nesta classe foram melhores, 3% semelhantes, 73% piores
» O melhor teve um delta de 5%, a média foi 17%, o pior foi 45%
Comparado com todos os dispositivos testados
» 11% de todos os dispositivos testados foram melhores, 2% semelhantes, 87% piores
» O melhor teve um delta de 4%, a média foi 24%, o pior foi 134%
Dell XPS 17 9720 análise de áudio
(+) | os alto-falantes podem tocar relativamente alto (###valor### dB)
Graves 100 - 315Hz
(±) | graves reduzidos - em média 7.3% menor que a mediana
(±) | a linearidade dos graves é média (11.4% delta para a frequência anterior)
Médios 400 - 2.000 Hz
(+) | médios equilibrados - apenas 3.4% longe da mediana
(±) | a linearidade dos médios é média (7.6% delta para frequência anterior)
Altos 2 - 16 kHz
(+) | agudos equilibrados - apenas 3.7% longe da mediana
(±) | a linearidade dos máximos é média (7.1% delta para frequência anterior)
Geral 100 - 16.000 Hz
(+) | o som geral é linear (8.8% diferença em relação à mediana)
Comparado com a mesma classe
» 11% de todos os dispositivos testados nesta classe foram melhores, 2% semelhantes, 87% piores
» O melhor teve um delta de 5%, a média foi 17%, o pior foi 45%
Comparado com todos os dispositivos testados
» 3% de todos os dispositivos testados foram melhores, 1% semelhantes, 97% piores
» O melhor teve um delta de 4%, a média foi 24%, o pior foi 134%
Apple MacBook Pro 16 2021 M1 Pro análise de áudio
(+) | os alto-falantes podem tocar relativamente alto (###valor### dB)
Graves 100 - 315Hz
(+) | bons graves - apenas 3.8% longe da mediana
(+) | o baixo é linear (5.2% delta para a frequência anterior)
Médios 400 - 2.000 Hz
(+) | médios equilibrados - apenas 1.3% longe da mediana
(+) | médios são lineares (2.1% delta para frequência anterior)
Altos 2 - 16 kHz
(+) | agudos equilibrados - apenas 1.9% longe da mediana
(+) | os máximos são lineares (2.7% delta da frequência anterior)
Geral 100 - 16.000 Hz
(+) | o som geral é linear (4.6% diferença em relação à mediana)
Comparado com a mesma classe
» 0% de todos os dispositivos testados nesta classe foram melhores, 0% semelhantes, 100% piores
» O melhor teve um delta de 5%, a média foi 17%, o pior foi 45%
Comparado com todos os dispositivos testados
» 0% de todos os dispositivos testados foram melhores, 0% semelhantes, 100% piores
» O melhor teve um delta de 4%, a média foi 24%, o pior foi 134%
Gerenciamento de energia: PensePad com uma boa vida útil da bateria, apesar da pequena bateria
Consumo de energia
Nesta categoria, o Lenovo ThinkPad Z16 G1 é realmente o melhor de sua classe, e nenhum de seus concorrentes diretos corre mais eficientemente. Somente o Apple MacBook Pro 16 com o M1 Pro é um pouco mais eficiente em termos de consumo mínimo ocioso. Entretanto, devemos também mencionar aqui, que a exibição do ThinkPad Z16 Gen 1 tem uma resolução significativamente menor do que a dos dispositivos de comparação.
A fonte de energia de 135 watts é apenas suficientemente grande para o consumo máximo de cerca de 133 watts
| desligado | |
| Ocioso | |
| Carga |
|
Key:
min: | |
| Lenovo ThinkPad Z16 G1 21D5S00T00 R7 PRO 6850H, Radeon RX 6500M, Samsung PM9A1 MZVL21T0HCLR, IPS LED, 1920x1200, 16" | Lenovo ThinkPad X1 Extreme G4-20Y5CTO1WW (3050 Ti) i7-11800H, GeForce RTX 3050 Ti Laptop GPU, Samsung PM9A1 MZVL21T0HCLR, IPS LED, 3840x2400, 16" | Lenovo ThinkPad X1 Extreme G4-20Y50040GE i9-11950H, GeForce RTX 3080 Laptop GPU, Kioxia XG7 KXG7AZNV1T02, IPS, 3840x2400, 16" | Dell XPS 15 9520 RTX 3050 Ti i7-12700H, GeForce RTX 3050 Ti Laptop GPU, WDC PC SN810 512GB, OLED, 3456x2160, 15.6" | Dell XPS 17 9720 i7-12700H, GeForce RTX 3050 4GB Laptop GPU, Micron 3400 MTFDKBA512TFH 512GB, IPS, 3840x2400, 17" | Apple MacBook Pro 16 2021 M1 Pro M1 Pro, M1 Pro 16-Core GPU, Apple SSD AP1024R, Mini-LED, 3456x2234, 16.2" | Apple MacBook Pro 16 2021 M1 Max M1 Max, M1 Max 32-Core GPU, Apple SSD AP2048R, Mini-LED, 3456x2234, 16.2" | Média AMD Radeon RX 6500M | Média da turma Multimedia | |
|---|---|---|---|---|---|---|---|---|---|
| Power Consumption | -79% | -80% | -13% | -50% | -17% | -38% | 0% | -8% | |
| Idle Minimum * (Watt) | 5.3 | 10.3 -94% | 12.3 -132% | 5.5 -4% | 7.8 -47% | 5 6% | 5.4 -2% | 5.3 ? -0% | 5.71 ? -8% |
| Idle Average * (Watt) | 8.6 | 22.06 -157% | 22.8 -165% | 7.2 16% | 15.1 -76% | 15.1 -76% | 16.4 -91% | 8.6 ? -0% | 10.1 ? -17% |
| Idle Maximum * (Watt) | 9.5 | 23 -142% | 13.9 -46% | 16 -68% | 17 -79% | 15.5 -63% | 16.7 -76% | 9.5 ? -0% | 12.4 ? -31% |
| Load Average * (Watt) | 65.2 | 102.57 -57% | 95.4 -46% | 91.8 -41% | 114 -75% | 54 17% | 94 -44% | 65.2 ? -0% | 65 ? -0% |
| Witcher 3 ultra * (Watt) | 93.6 | 106 -13% | 154 -65% | 74.6 20% | 115.2 -23% | 104 -11% | |||
| Load Maximum * (Watt) | 133.81 | 147.8 -10% | 170.7 -28% | 134.7 -1% | 135.6 -1% | 90 33% | 135 -1% | 133.8 ? -0% | 112.2 ? 16% |
* ... menor é melhor
Power Consumption The Witcher 3 / Stress Test
Power Consumption With External Monitor
Vida útil da bateria
Em termos de capacidade da bateria, o Lenovo ThinkPad Z16 G1 se apresenta como relativamente avarento, com apenas 72 Watthours. No entanto, a duração da bateria do portátil ThinkPad ainda é melhor, pelo menos em comparação com os concorrentes do Windows. Por outro lado, ele não chega nem perto de atingir os valores de Apple's MacBook Pro 16mas que também tem a maior bateria em nosso campo de comparação
Em cerca de 10 horas no teste Wi-Fi (a 150 cd/m² de brilho), o Z16 não tem que se esconder. No brilho máximo, ele ainda dura 8 horas em nosso teste Wi-Fi automatizado. Entretanto, isto só vale para a versão WUXGA do Z16, e o visor opcional 4K UHD deve encurtar significativamente a vida útil da bateria.
| Lenovo ThinkPad Z16 G1 21D5S00T00 R7 PRO 6850H, Radeon RX 6500M, 72 Wh | Lenovo ThinkPad X1 Extreme G4-20Y5CTO1WW (3050 Ti) i7-11800H, GeForce RTX 3050 Ti Laptop GPU, 90 Wh | Lenovo ThinkPad X1 Extreme G4-20Y50040GE i9-11950H, GeForce RTX 3080 Laptop GPU, 90 Wh | Dell XPS 15 9520 RTX 3050 Ti i7-12700H, GeForce RTX 3050 Ti Laptop GPU, 86 Wh | Apple MacBook Pro 16 2021 M1 Pro M1 Pro, M1 Pro 16-Core GPU, 99.6 Wh | Apple MacBook Pro 16 2021 M1 Max M1 Max, M1 Max 32-Core GPU, 99.6 Wh | Média da turma Multimedia | |
|---|---|---|---|---|---|---|---|
| Duração da bateria | -40% | -40% | 21% | 59% | 15% | 13% | |
| H.264 (h) | 11.9 | 6.7 -44% | 6.9 -42% | 17.5 47% | 17 43% | 16.4 ? 38% | |
| WiFi v1.3 (h) | 9.9 | 6.6 -33% | 6.8 -31% | 8.8 -11% | 16.9 71% | 14.9 51% | 12 ? 21% |
| Load (h) | 2.1 | 1.2 -43% | 1.1 -48% | 3.2 52% | 1.1 -48% | 1.675 ? -20% |
Pro
Contra
Veredicto: O Lenovo ThinkPad Z16 G1 é um ótimo laptop, mas...

O ThinkPad Z16 Gen 1 da Lenovo realmente nos deu algumas dores de cabeça. No papel, poderia ser um laptop muito bom, e em nosso teste, isto também se revelou verdade. No entanto, ainda não conseguimos dar-lhe uma recomendação "muito boa".
Primeiro, devemos listar todos os aspectos positivos do portátil ThinkPad: O ThinkPad Z16 G1 oferece um desempenho muito bom em um estojo relativamente compacto. A qualidade do case é excelente, e com a combinação de muito alumínio e o apoio de palma de vidro, a Lenovo faz um monte de coisas certas a esse respeito. O fabricante também faz um bom trabalho com o touchpad, que é significativamente melhor do que o de todos os outros ThinkPads. O teclado também é bom, mesmo que não seja tão bom quanto o de outros ThinkPads. O ThinkPad Z16 inclui um visor mate, brilhante e oferece uma boa duração da bateria, mesmo que a bateria seja relativamente pequena.
O primeiro grande problema do Z16 são suas conexões. O ThinkPad Z16 é um laptop de 16 polegadas e um dispositivo comercial. O fato de tal dispositivo não oferecer nenhuma porta USB-A, e particularmente também nenhum HDMI, é dificilmente aceitável. O gerenciamento da temperatura também cria algumas dificuldades, já que o ThinkPad Z16 fica bastante quente. É melhor que você não toque na área acima do teclado sob carga. Em um ThinkPad relativamente grande, achamos a RAM soldada uma limitação desnecessária. Um ponto de reclamação significativamente menos importante, mas ainda relevante: Ao Z16 falta uma opção para uma tela de 2,5K, e também não há uma tela com uma taxa de atualização mais alta.
Poderia ser um laptop muito bom se não houvesse apenas os problemas de reinício, pois, caso contrário, vemos muitos aspectos positivos no ThinkPad Z16 Gen 1 da Lenovo.
Mas todas essas reclamações não foram o que causou nossas dores de cabeça - esse foi o já mencionado problema com os reinícios, o que nos levou a pedir uma nova unidade de teste. Felizmente, o problema foi significativamente menos pronunciado em nossa unidade de teste de reposição, mas infelizmente, o problema ainda aconteceu.
Isto leva a uma avaliação significativamente pior do ThinkPad Z16 do que teria que ser de outra forma. Isto é lamentável, já que de outra forma não desgostaríamos do ThinkPad, mesmo que sua falta de equipamento de conexão seja menos convincente para seu mercado-alvo do que a do ThinkPad Z13 compacto. Em termos de portos, o Lenovo ThinkPad X1 Extreme G4 é significativamente mais flexível. Mesmo o MacBook Pro 16 ainda oferece pelo menos HDMI, mas por outro lado, falta-lhe a opção WWAN do ThinkPad Z16.
Nota: Devido ao problema com a estabilidade do sistema, a avaliação do ThinkPad Z16 ficou 3 pontos percentuais abaixo.
Preço e Disponibilidade
O Lenovo ThinkPad Z16 Gen 1 está disponível no site a partir de US$1.975na loja virtual da Lenovo. A Amazon também lista várias configurações do ThinkPad Z16 a partir de $1850 (link de afiliação).
Lenovo ThinkPad Z16 G1 21D5S00T00
- 09/29/2022 v7 (old)
Benjamin Herzig
Price comparison

