Dell Precision 7670 revisão da estação de trabalho: Estréia do Core i7-12850HX e CAMM RAM

A série Precision 7000 é o lar das principais estações de trabalho móveis da Dell, em contraste com a série média Precision série 5000 ou orçamento Precision série 3000. O Precision 7670 é o primeiro modelo de 16 polegadas da família sentado entre as de 15,6 polegadas Precision 7560 e 17,3 polegadas Precision 7760. Confusamente, a Dell está produzindo duas variantes do Precision 7670 chamadas "Performance base" e "Thin base". Esta revisão específica está na variante "Thin base" com a revisão "Performance base" para vir em uma data posterior.
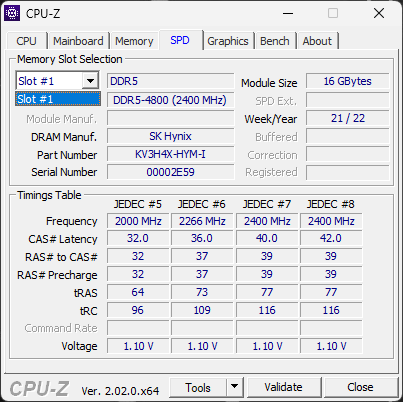
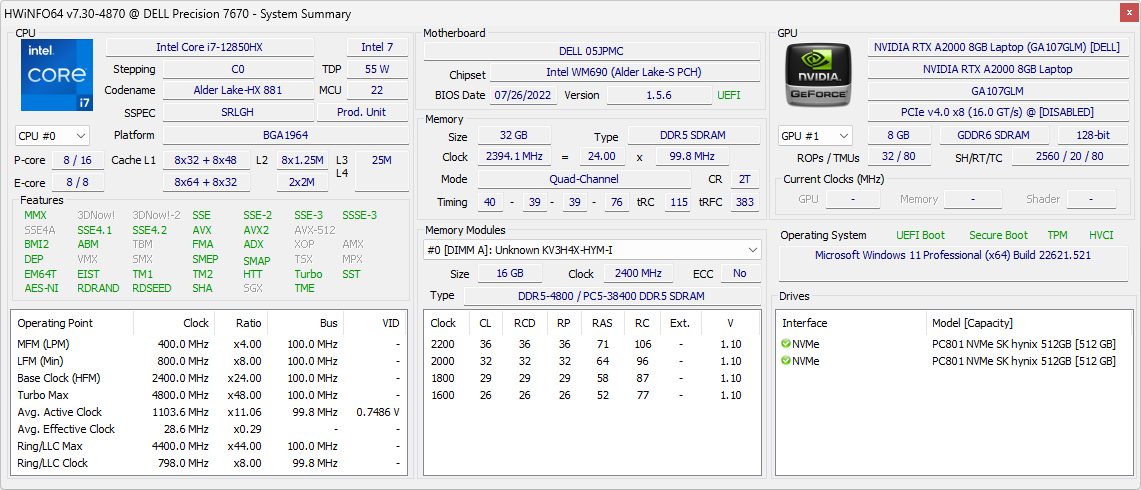
As opções são muito amplas, desde o Core i5-12600HX até o i9-12950HX, gráficos Iris Xe até o discreto Nvidia RTX A5500, FHD IPS até 4K OLED, e até mesmo SODIMM ou CAMM RAM até 128 GB. Nossa unidade específica de revisão é uma configuração de médio alcance com o i7-12850HX, RTX A2000 de 95 W e tela tátil OLED 4K por aproximadamente US$ 4.100.
Infelizmente não há opções de RAM Xeon ou ECC para a Precision 7670 no momento, mas a vPro é suportada em todas as SKUs.
Há poucos concorrentes diretos no momento, já que o espaço de 16 polegadas da estação de trabalho ainda é relativamente novo. As alternativas atuais incluem o Asus ProArt StudioBook Pro 16, Lenovo ThinkPad P1 G4e o HP ZBook Fury 16.
Mais análises da Dell:
Possíveis concorrentes em comparação
Avaliação | Data | Modelo | Peso | Altura | Size | Resolução | Preço |
|---|---|---|---|---|---|---|---|
| 88.4 % v7 (old) | 10/2022 | Dell Precision 7670 i7-12850HX, RTX A2000 Laptop GPU | 2.7 kg | 24.7 mm | 16.00" | 3840x2400 | |
| 89.3 % v7 (old) | Lenovo ThinkPad P1 G4-20Y4Z9DVUS i7-11800H, T1200 Laptop GPU | 1.8 kg | 17.7 mm | 16.00" | 2560x1600 | ||
v (old) | 12/2021 | Asus ProArt StudioBook 16 W7600H5A-2BL2 W-11955M, RTX A5000 Laptop GPU | 2.4 kg | 21.4 mm | 16.00" | 3840x2400 | |
| 88.3 % v7 (old) | 10/2021 | Dell Precision 5000 5560 i7-11850H, RTX A2000 Laptop GPU | 2 kg | 18 mm | 15.60" | 3840x2400 | |
| 87.8 % v7 (old) | 08/2020 | Dell Precision 7550 W-10885M, Quadro RTX 5000 Max-Q | 2.8 kg | 27.36 mm | 15.60" | 3840x2160 | |
| 90.3 % v7 (old) | 10/2021 | HP ZBook Fury 15 G8 i9-11950H, RTX A5000 Laptop GPU | 2.5 kg | 25.9 mm | 15.60" | 3840x2160 |
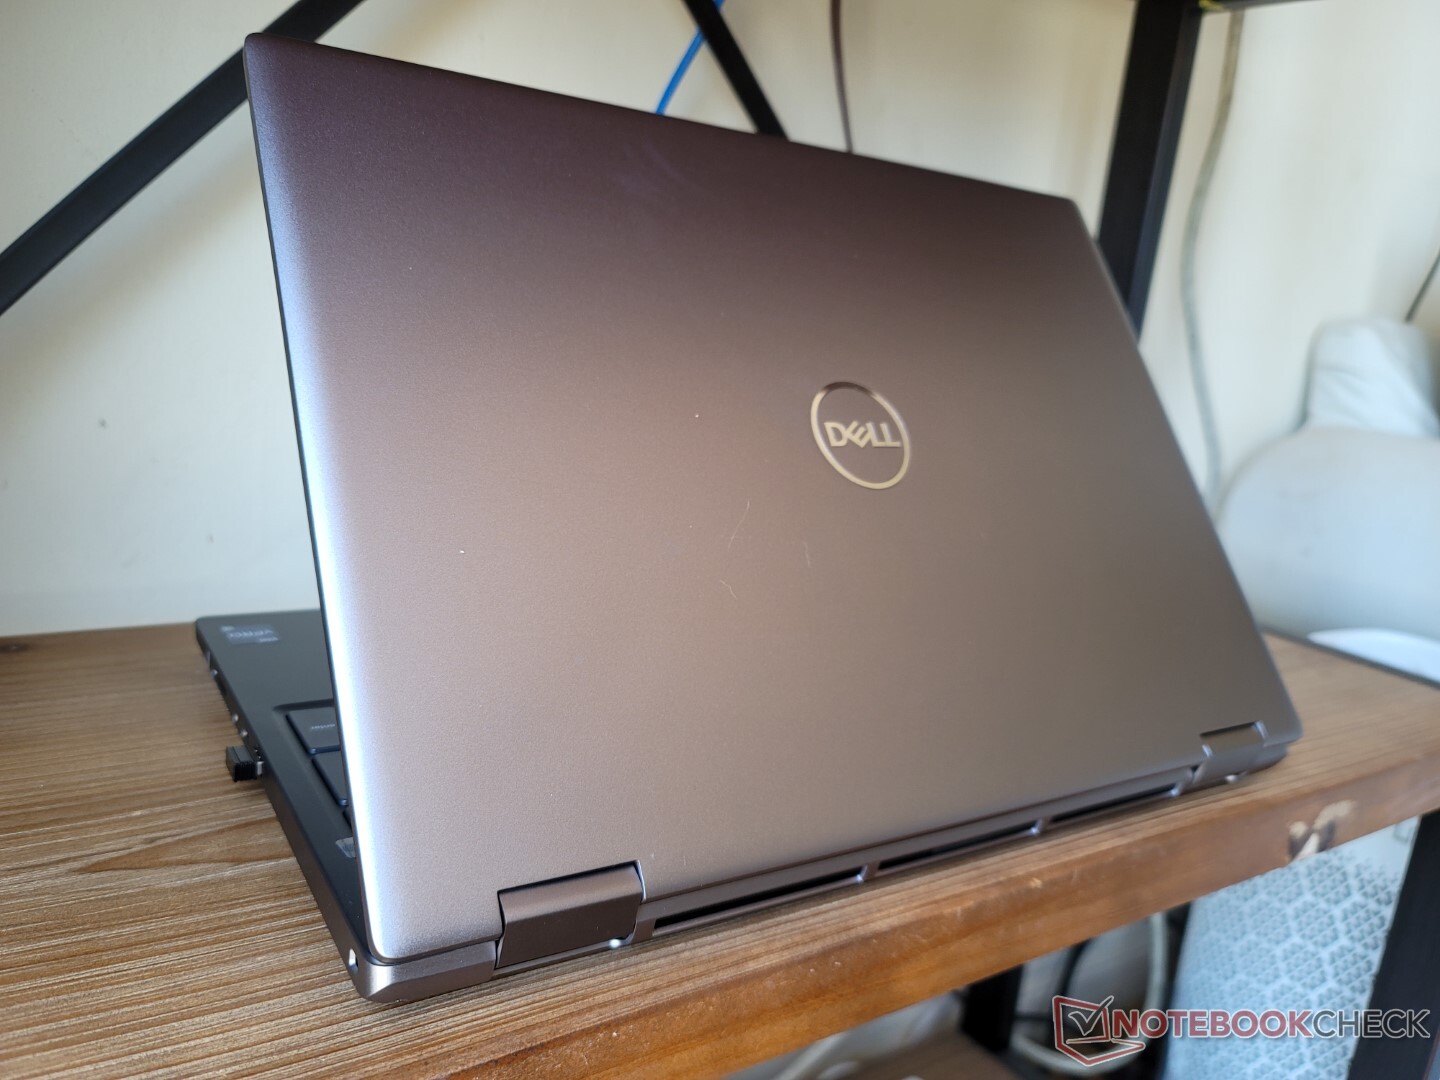
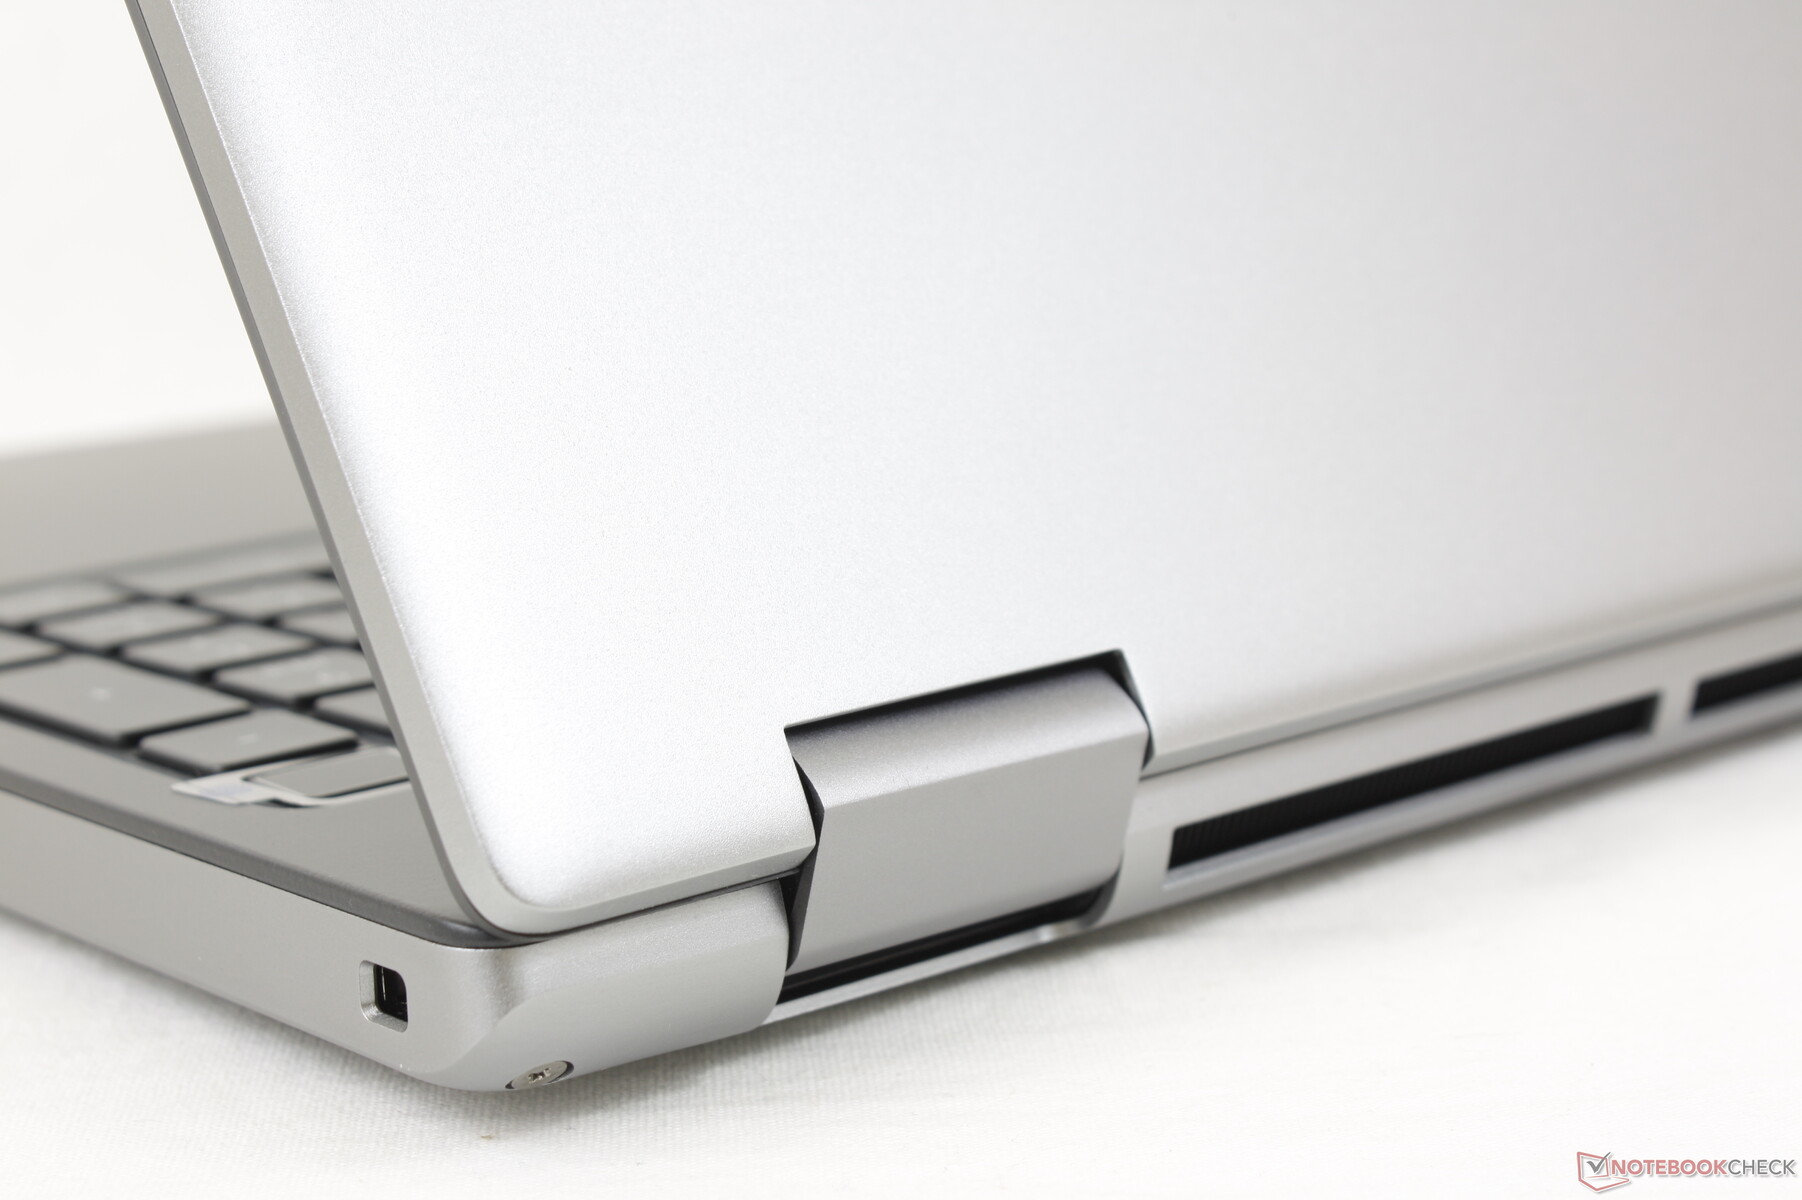
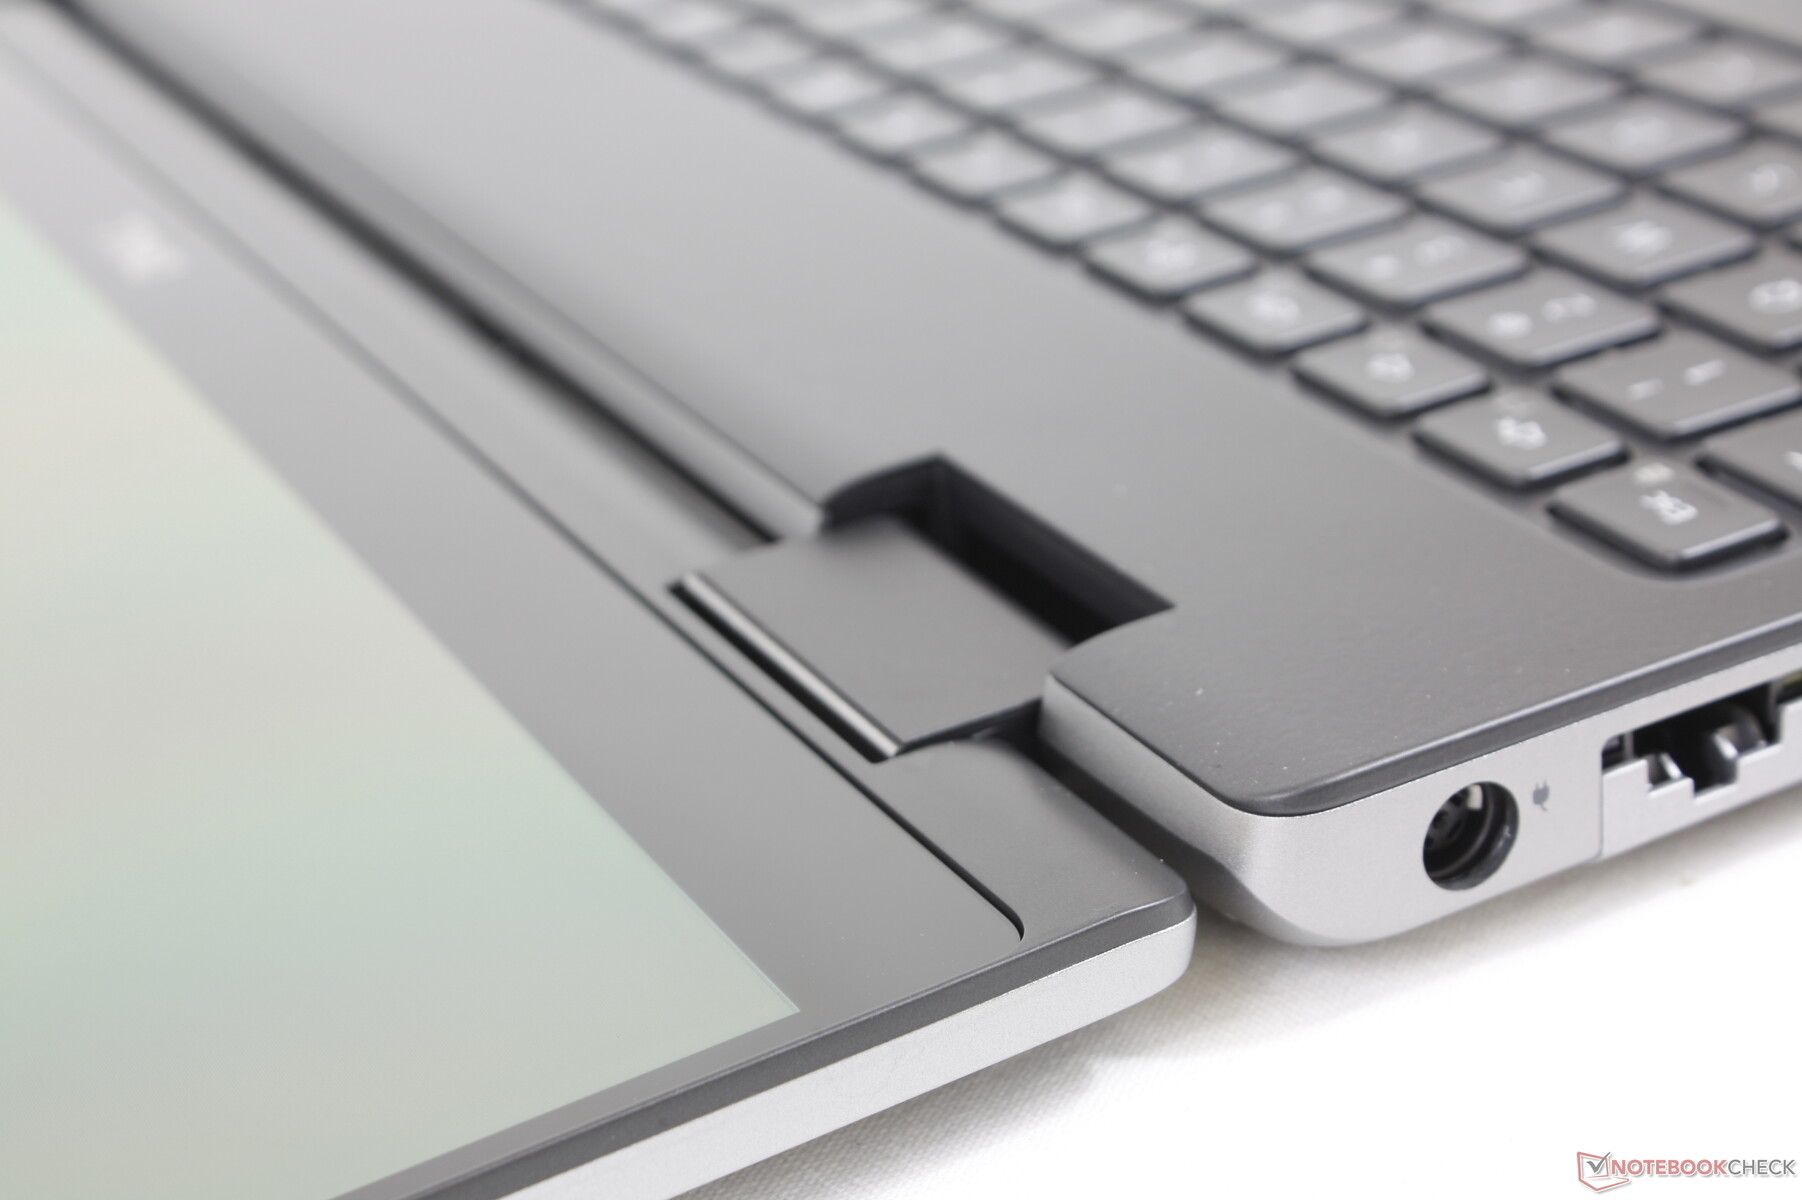
Estojo - Clássico Precision Look And Feel
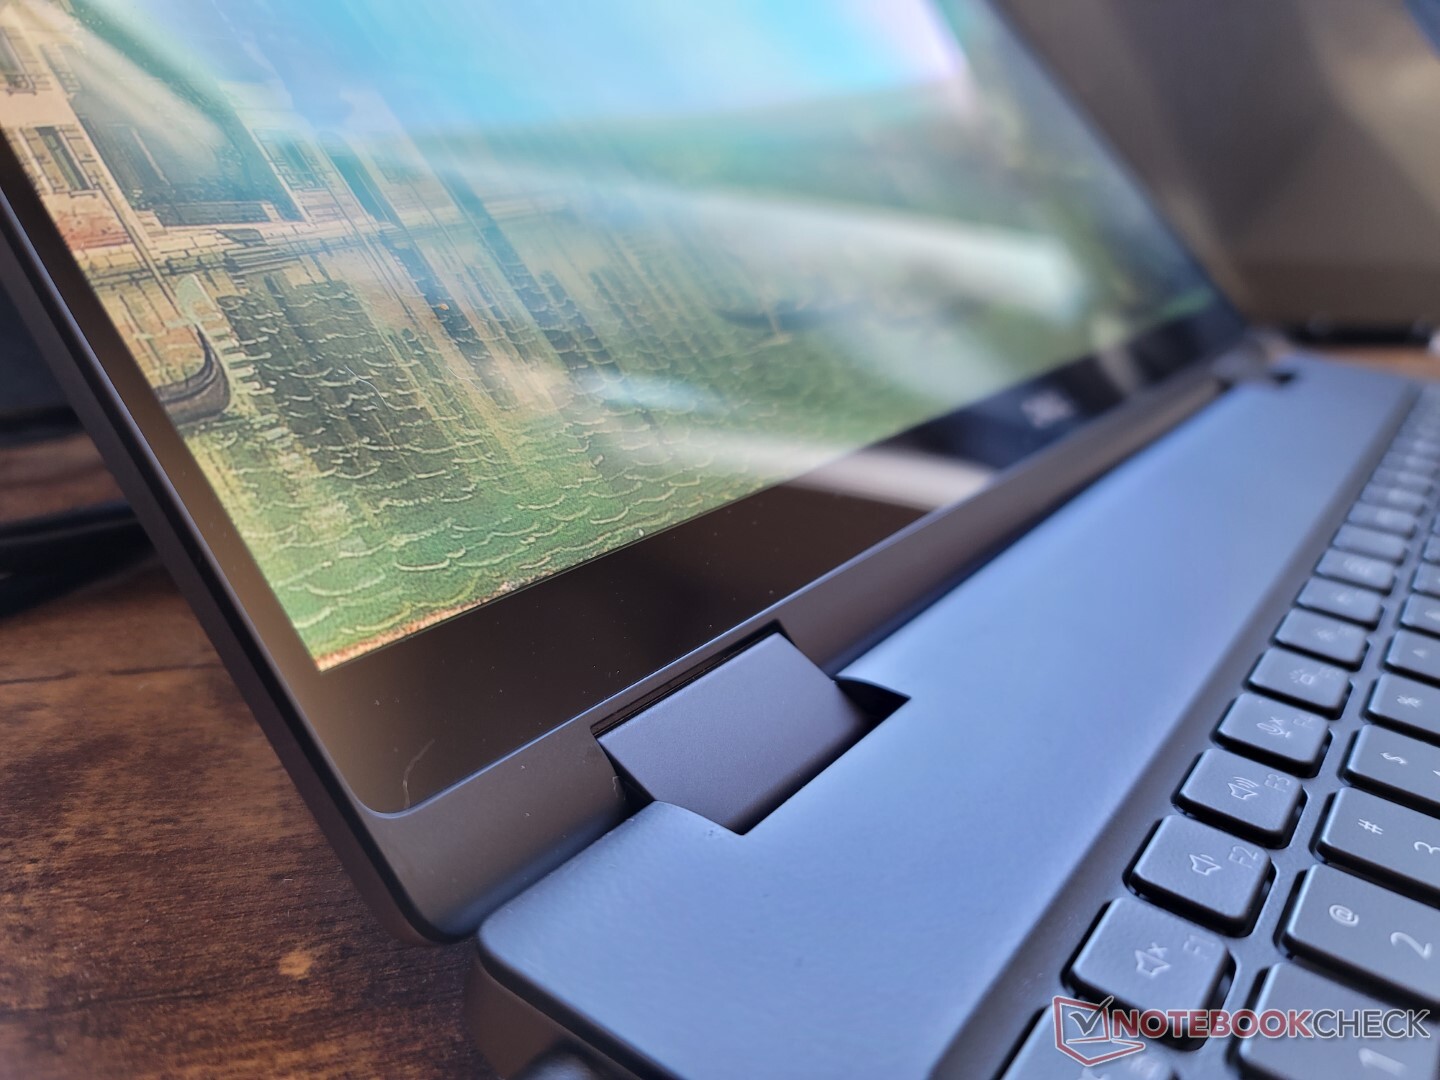
O projeto do chassi e os materiais coincidem estreitamente com o de 2020 Precision 7550. O teclado preto, por exemplo, ainda é ligeiramente emborrachado para um toque premium, enquanto o esqueleto metálico externo permanece grosso para primeiras impressões mais fortes do que o PensePad P1 G4 ou Asus ProArt StudioBook. A aplicação de pressão no centro do teclado ou na tampa externa irá deformar suas superfícies um pouco mais do que em um Estúdio HP ZBookmas, de outra forma, não podemos notar nenhum ranger ou pontos fracos importantes.
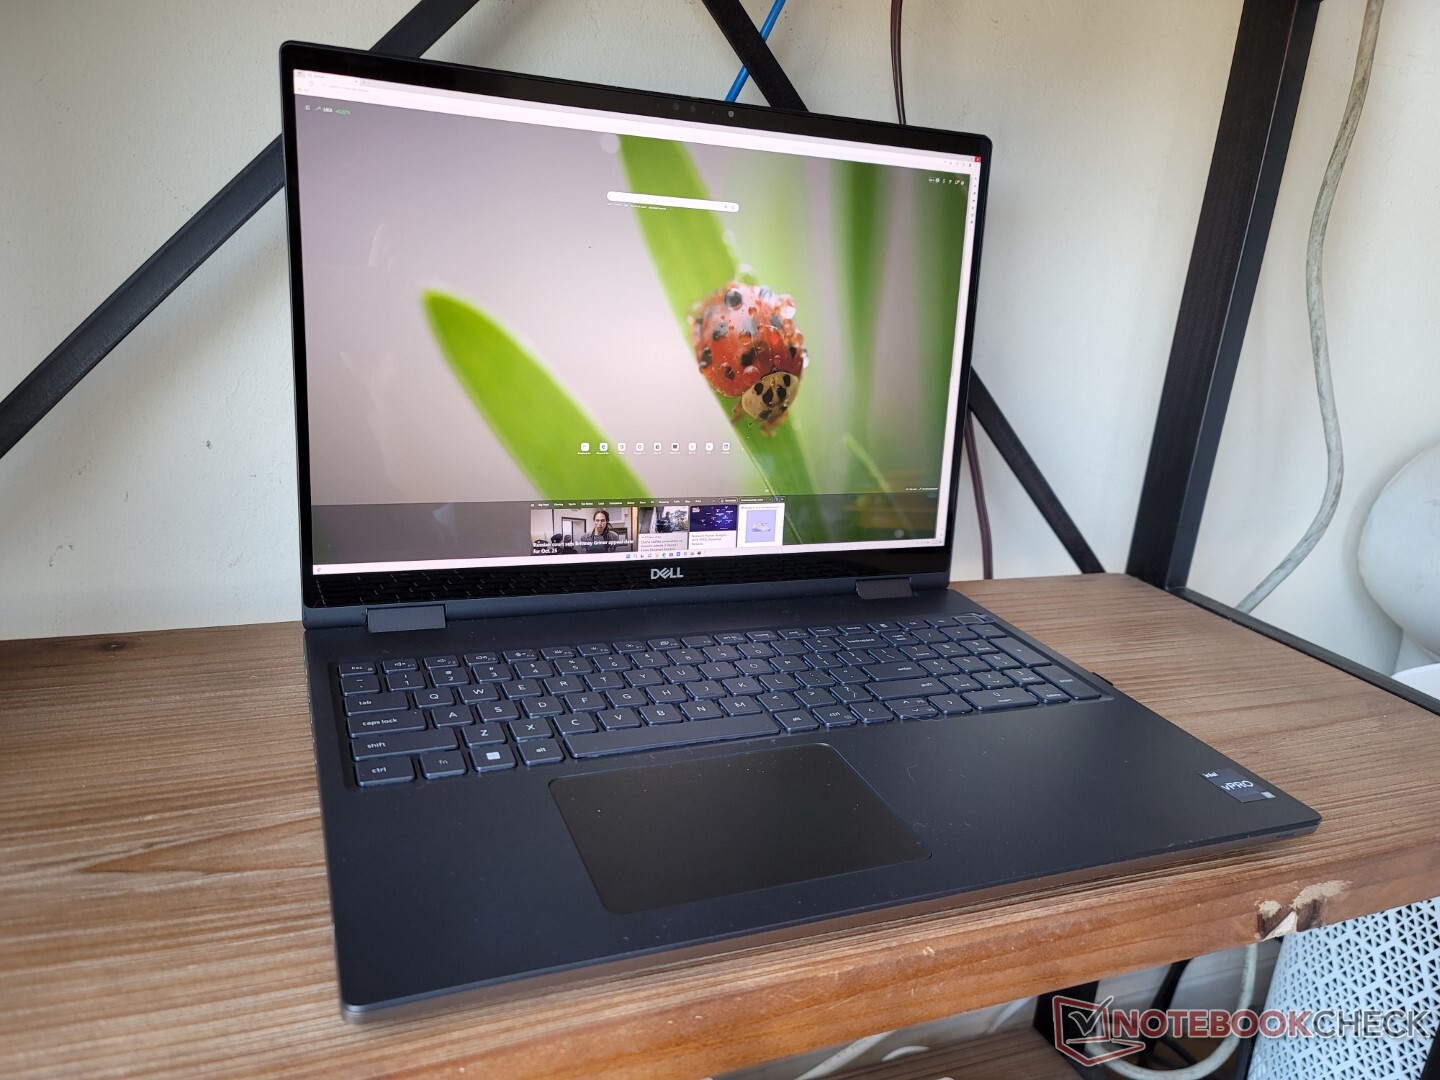
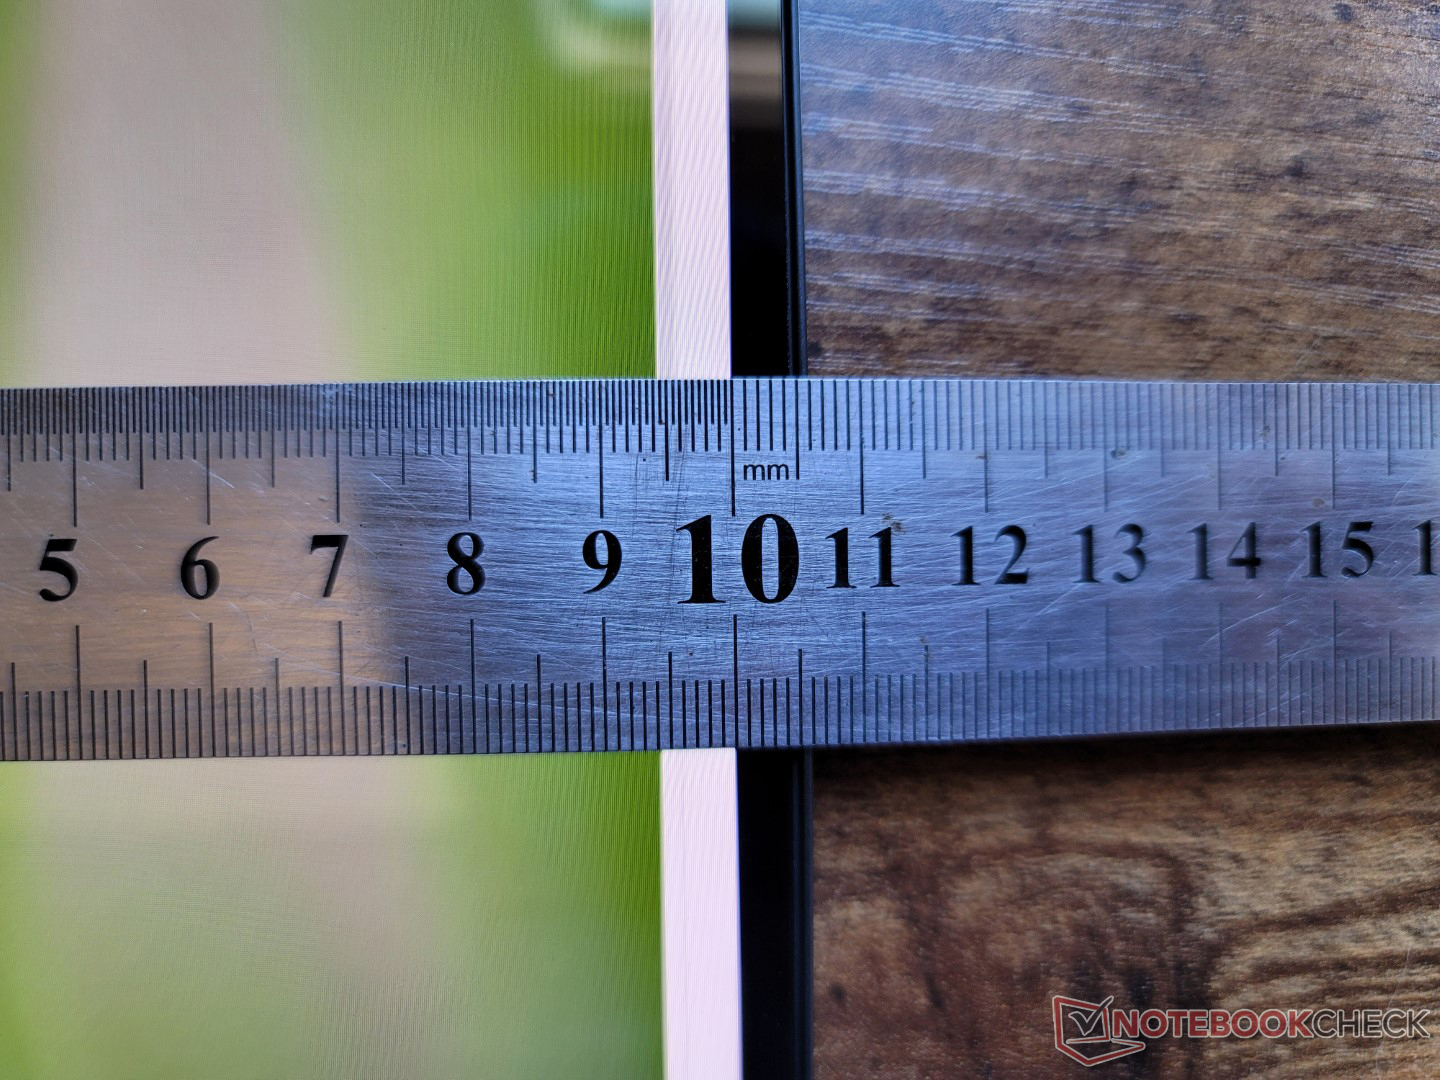
O Precision 7670 ainda é relativamente grande e pesado, apesar de nossa unidade de teste ser a versão "Thin base". Com 24,7 mm de espessura, o sistema é mais grosso do que o Asus ProArt StudioBook 16 e apenas um cabelo mais fino do que o HP ZBook Fury 15 G8. Também é muito mais pesado por várias centenas de gramas cada um devido em parte ao fator de forma maior de 16:10 polegadas.
A "Base de desempenho" é cerca de 3 mm mais grossa e pelo menos 70 g mais pesada que a "Base fina", dependendo da configuração.
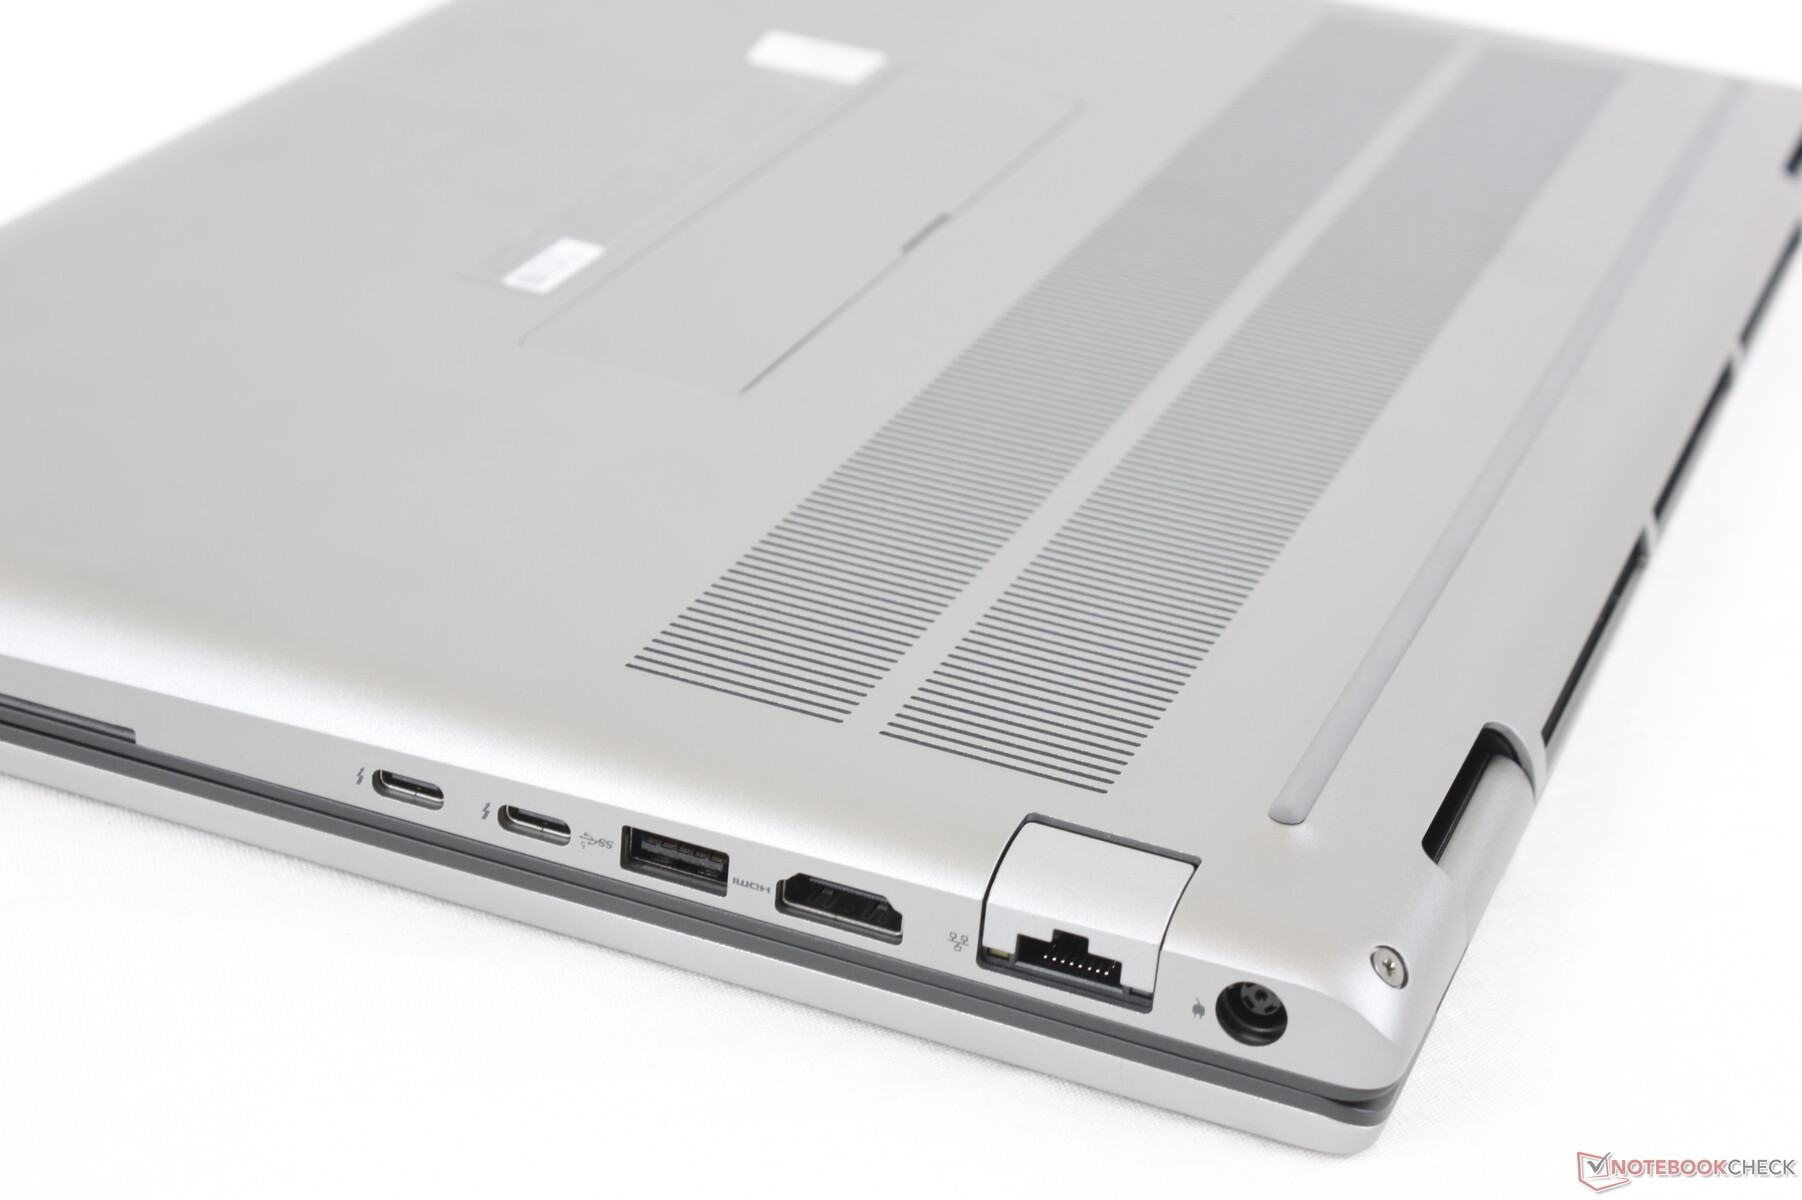
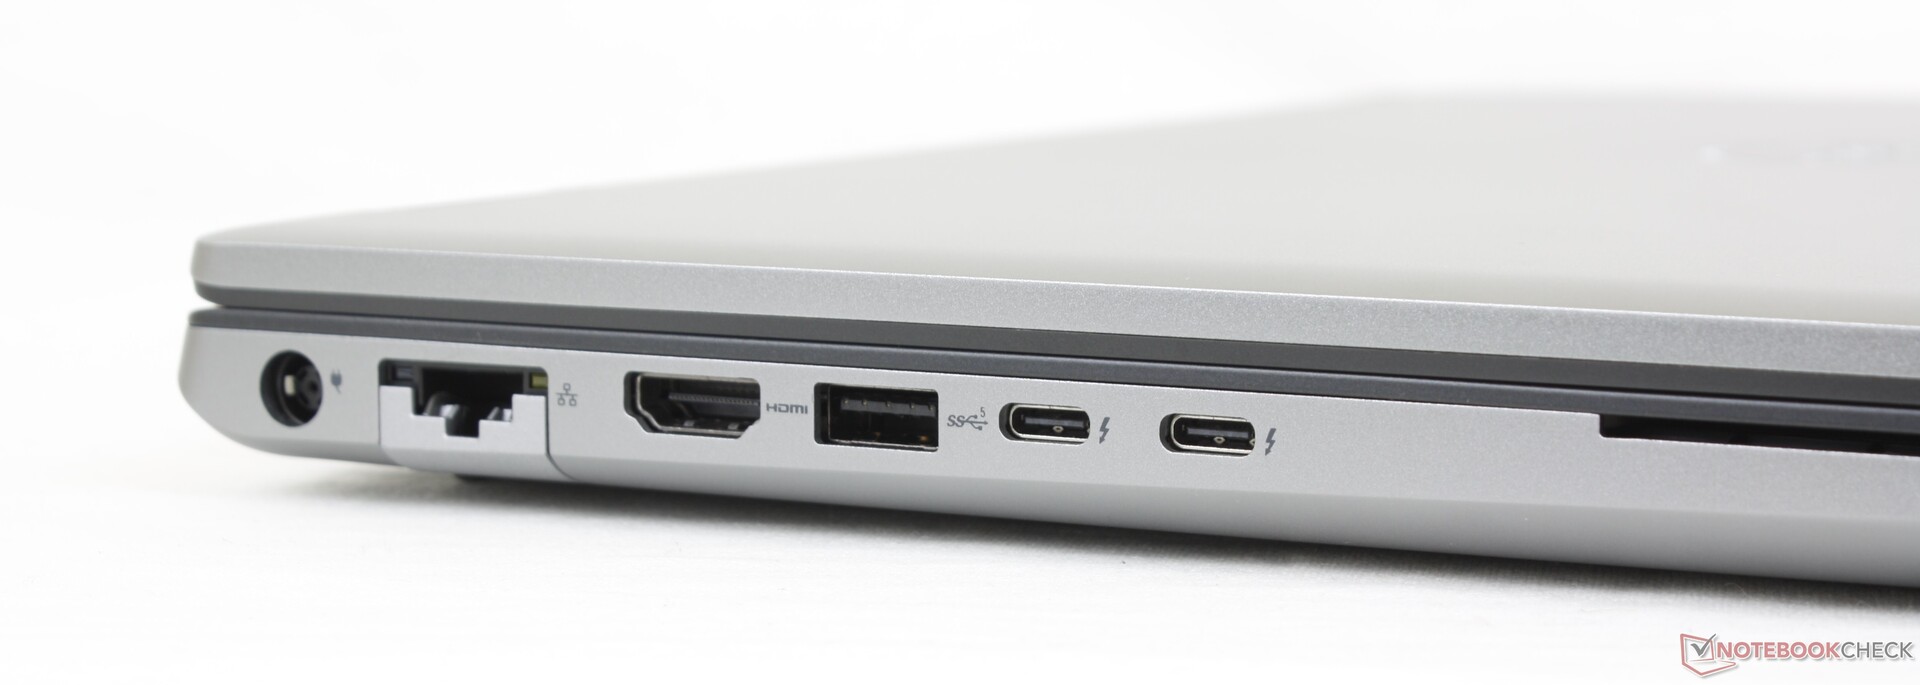
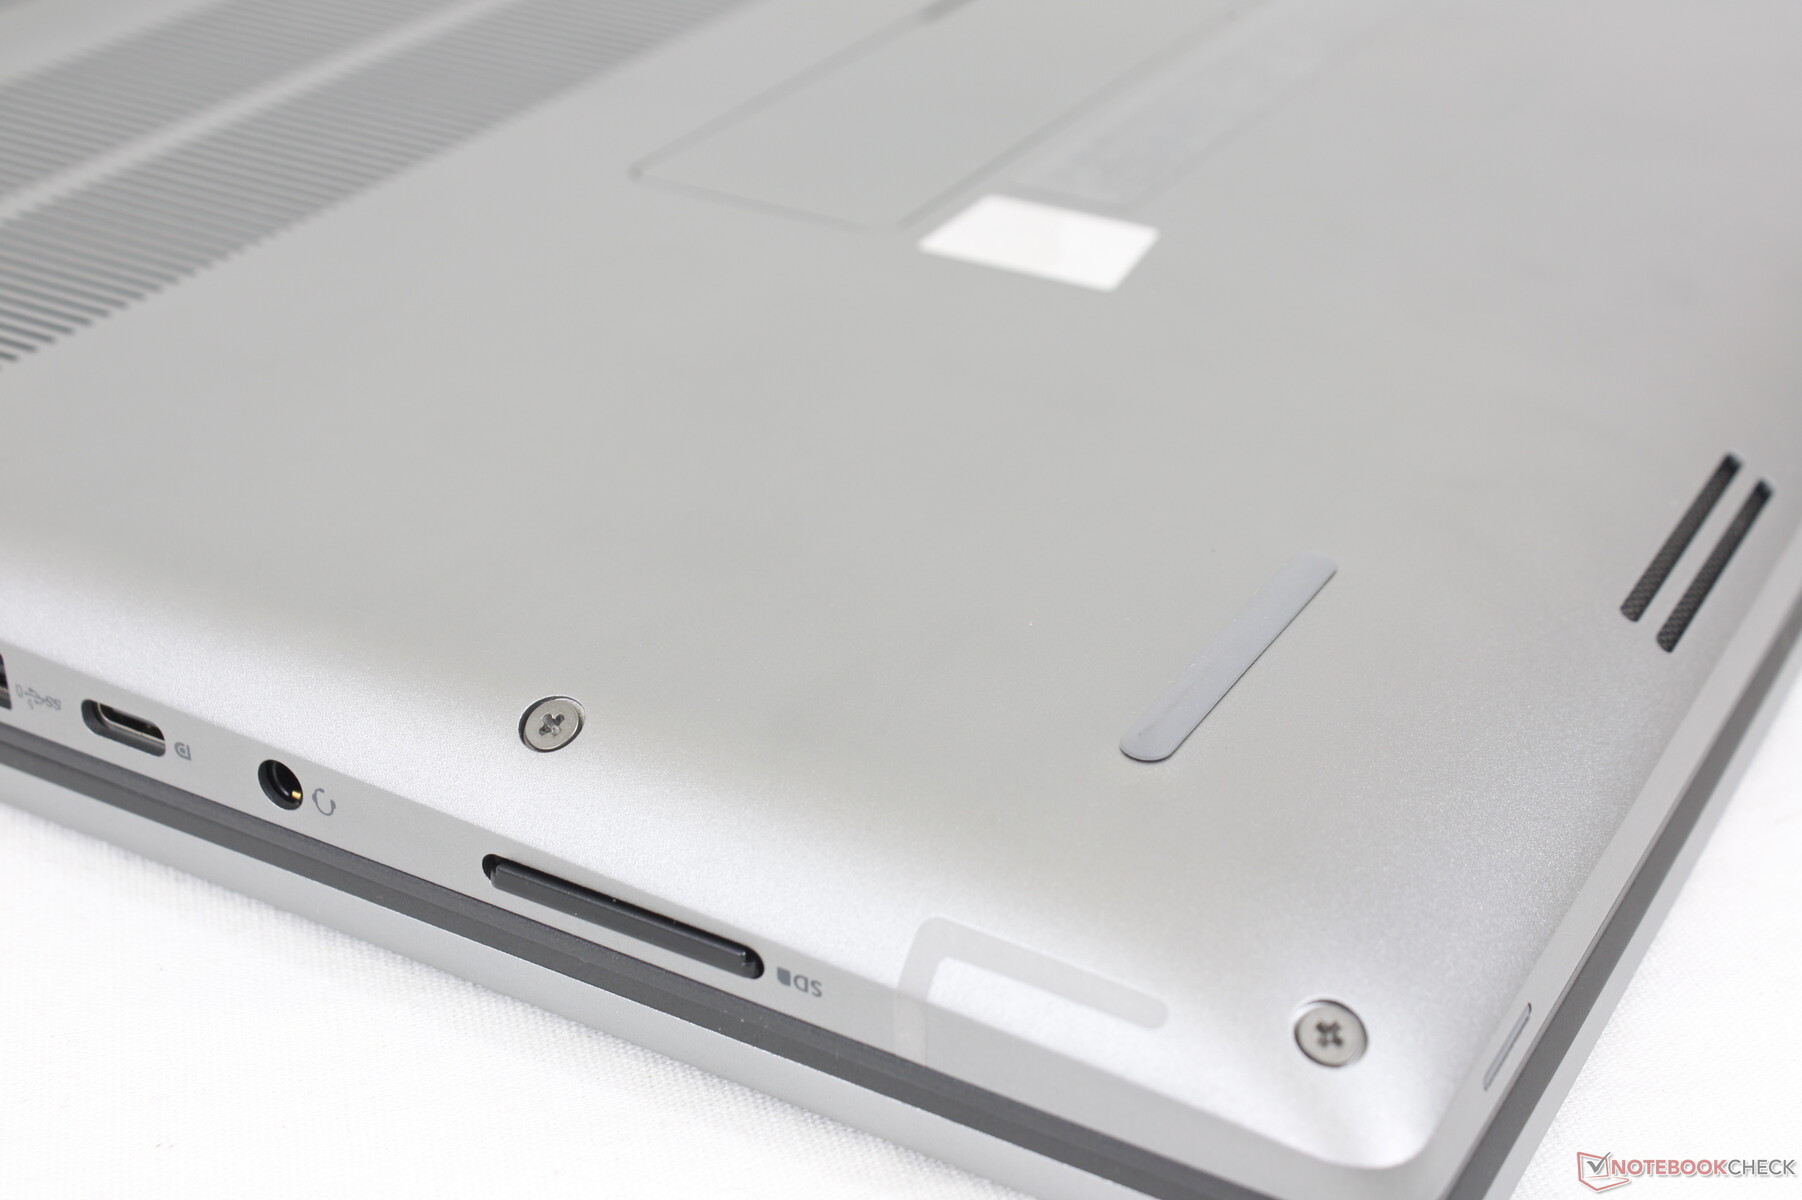
Conectividade - Thunderbolt 4 Mas sem PD-In
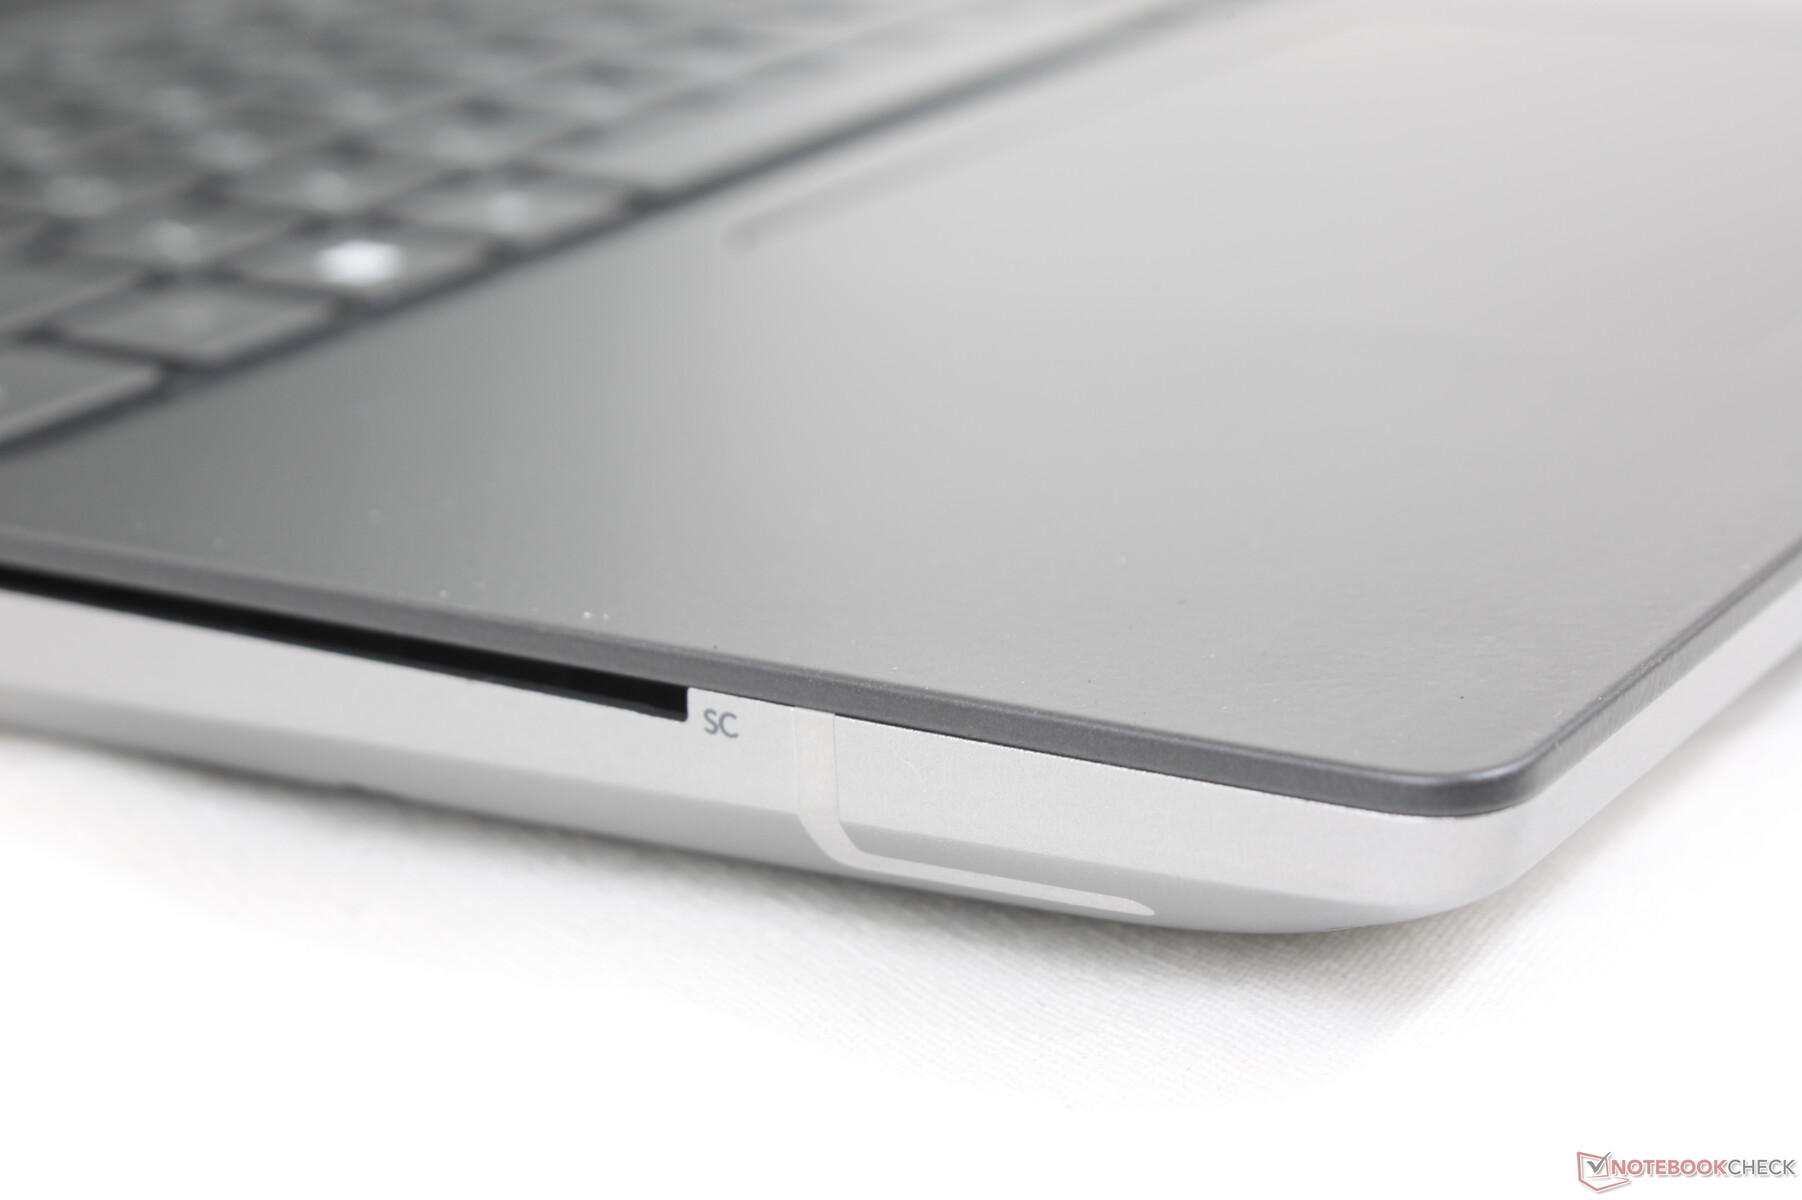
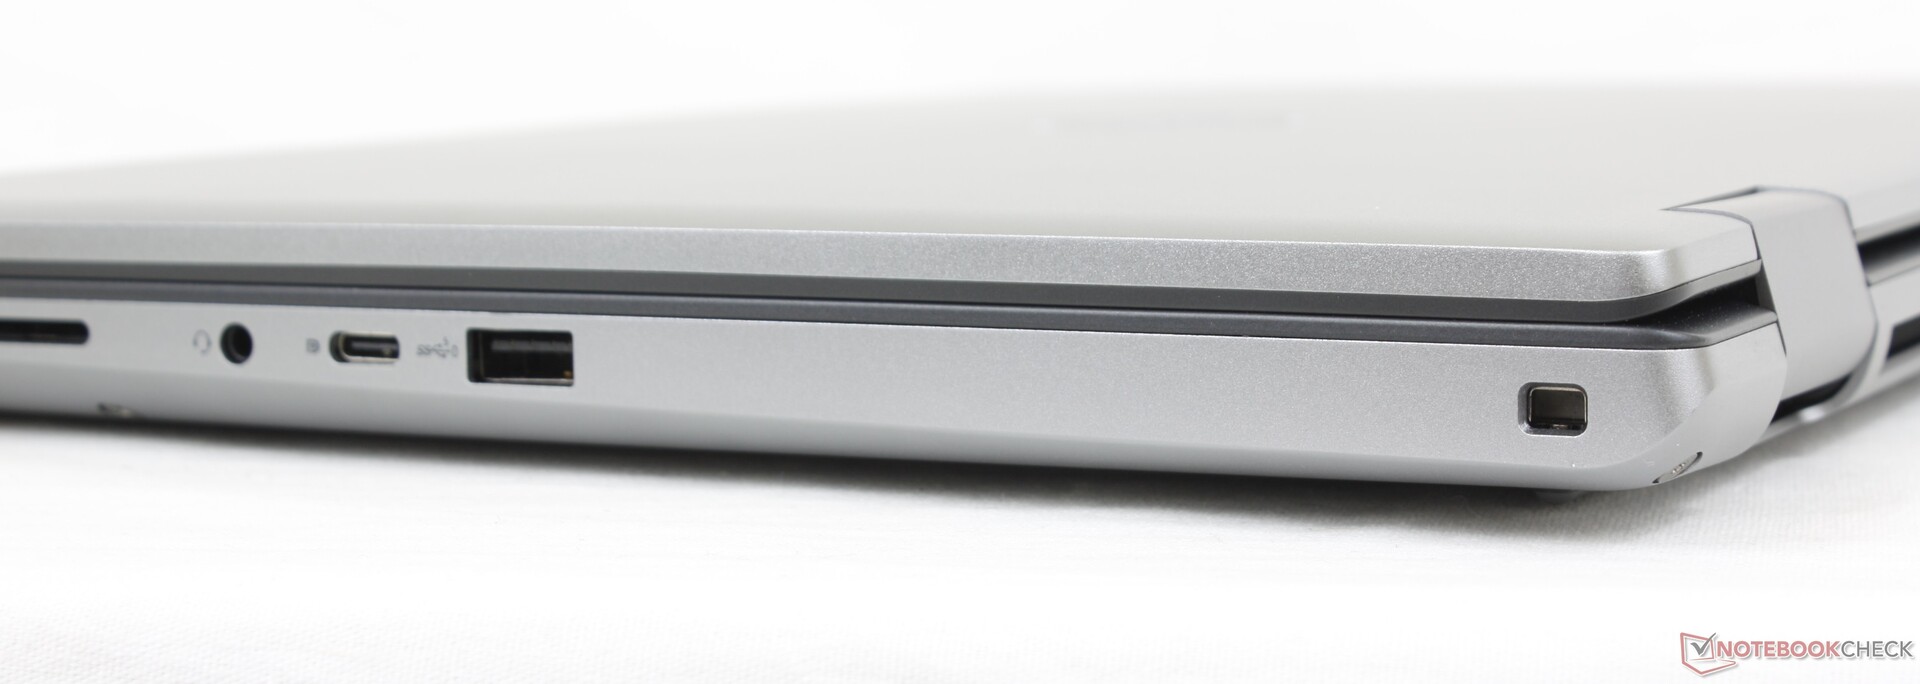
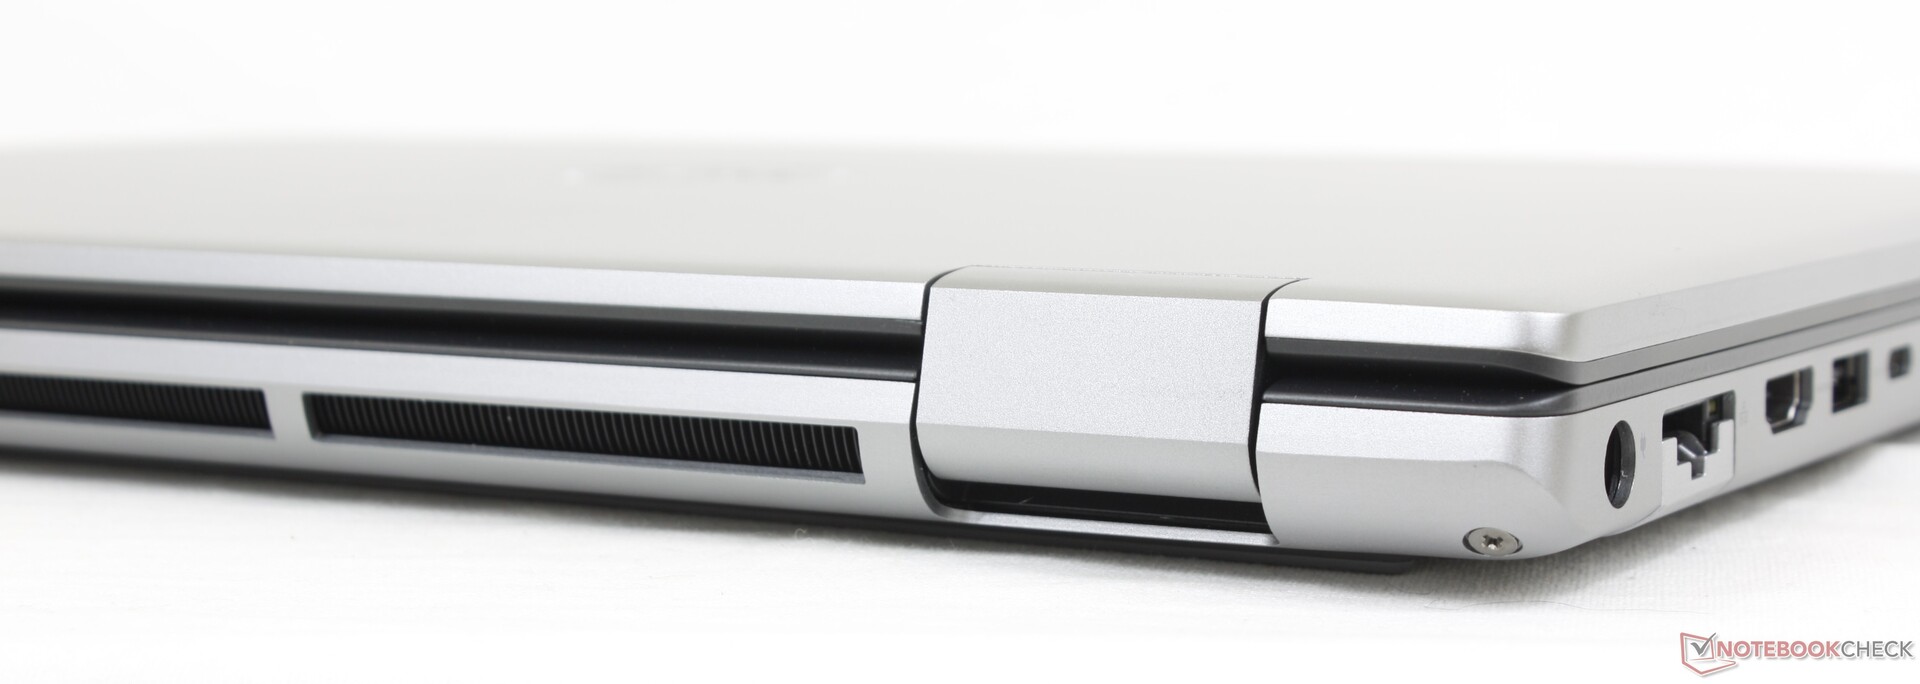
As opções de porta são excelentes especialmente porque há mais portas USB do que na maioria das outras estações de trabalho. Muitas das portas estão ao longo da borda esquerda enquanto as portas na borda direita estão bastante próximas à frente. Observe que a porta RJ-45 suporta apenas velocidades de até 1 Gbps ao invés de 10 Gbps.
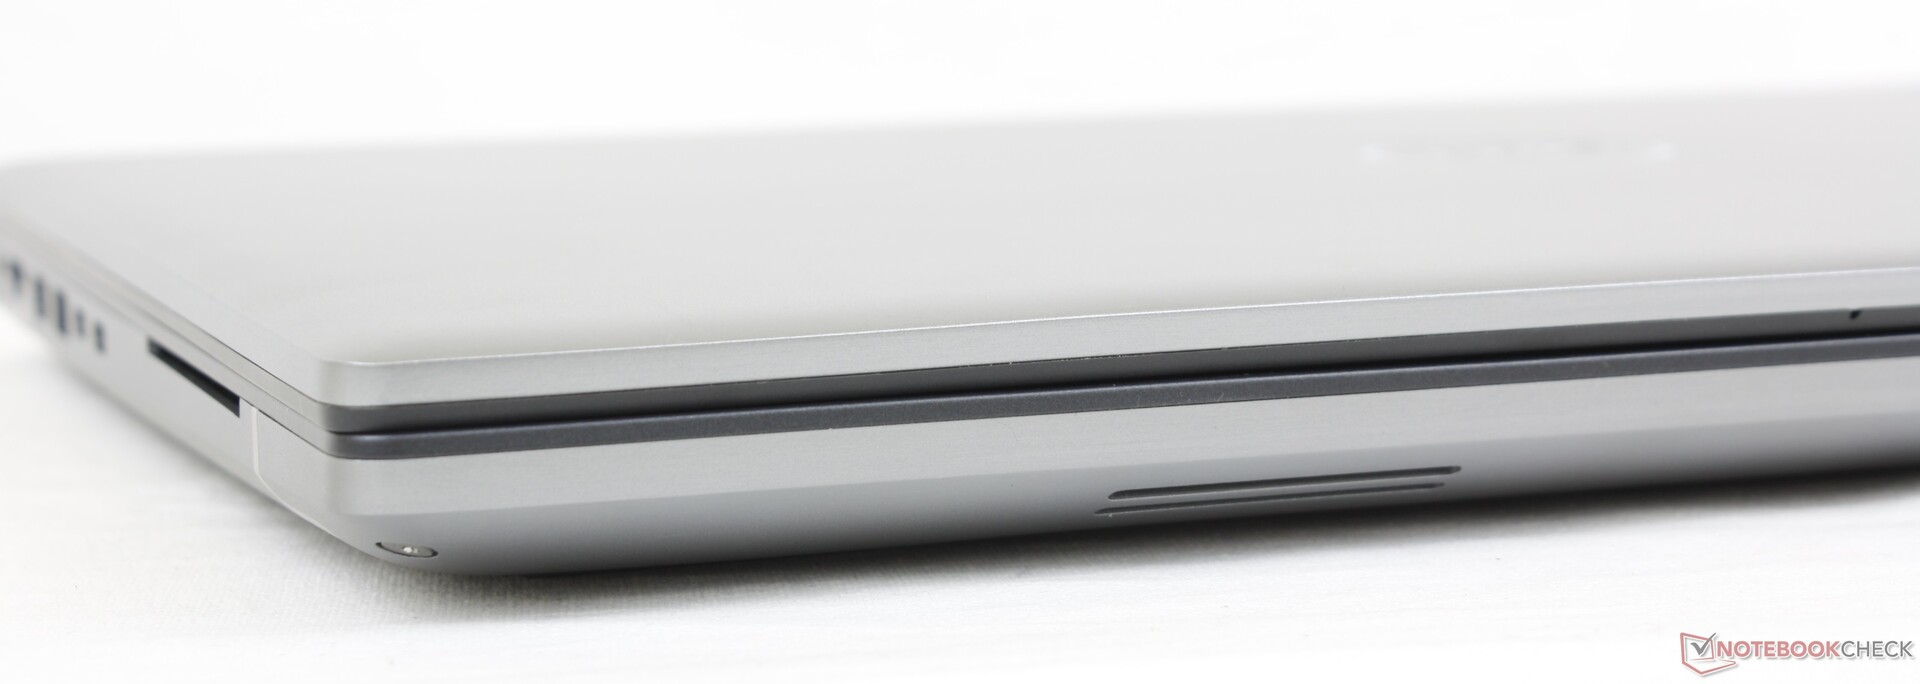
Leitor de cartões SD
As taxas de transferência com o leitor SD com mola são tão rápidas como no Precision 7550 ou mais de 2x mais rápidas do que no HP ZBook Fury G8. A mudança de 1 GB de fotos de nossa placa UHS-II para a área de trabalho leva apenas 5 a 6 segundos.
| SD Card Reader | |
| average JPG Copy Test (av. of 3 runs) | |
| Lenovo ThinkPad P1 G4-20Y4Z9DVUS (Angelbird AV Pro V60) | |
| Dell Precision 5000 5560 (AV Pro V60) | |
| Dell Precision 7670 (Toshiba Exceria Pro SDXC 64 GB UHS-II) | |
| Dell Precision 7550 (Toshiba Exceria Pro SDXC 64 GB UHS-II) | |
| HP ZBook Fury 15 G8 (AV Pro V60) | |
| Asus ProArt StudioBook 16 W7600H5A-2BL2 (AV Pro SD microSD 128 GB V60) | |
| maximum AS SSD Seq Read Test (1GB) | |
| Dell Precision 5000 5560 (AV Pro V60) | |
| Dell Precision 7550 (Toshiba Exceria Pro SDXC 64 GB UHS-II) | |
| Dell Precision 7670 (Toshiba Exceria Pro SDXC 64 GB UHS-II) | |
| Lenovo ThinkPad P1 G4-20Y4Z9DVUS (Angelbird AV Pro V60) | |
| HP ZBook Fury 15 G8 (AV Pro V60) | |
| Asus ProArt StudioBook 16 W7600H5A-2BL2 (AV Pro SD microSD 128 GB V60) | |
Comunicação
Um Intel AX211 vem como padrão para conectividade Wi-Fi 6E e Bluetooth opcional. Infelizmente, o Wi-Fi 6E não é necessariamente mais rápido que o Wi-Fi 6 em muitas situações. As taxas de transferência parecem variar muito mais em nosso Precision 7670 quando comparado com a maioria das outras estações de trabalho, mesmo quando apenas a um ou dois metros de distância de nosso ponto de acesso de 6 GHz.
| Networking | |
| iperf3 transmit AX12 | |
| Lenovo ThinkPad P1 G4-20Y4Z9DVUS | |
| HP ZBook Fury 15 G8 | |
| Dell Precision 7550 | |
| Dell Precision 5000 5560 | |
| Asus ProArt StudioBook 16 W7600H5A-2BL2 | |
| iperf3 receive AX12 | |
| Dell Precision 5000 5560 | |
| Lenovo ThinkPad P1 G4-20Y4Z9DVUS | |
| Dell Precision 7550 | |
| HP ZBook Fury 15 G8 | |
| Asus ProArt StudioBook 16 W7600H5A-2BL2 | |
| iperf3 receive AXE11000 6GHz | |
| Dell Precision 7670 | |
| iperf3 transmit AXE11000 6GHz | |
| Dell Precision 7670 | |
Webcam
A webcam de 2 MP é uma atualização das webcams de 1 MP na maioria dos sistemas XPS. No entanto, ela ainda está pálida em comparação com as câmeras de 5 MP na maioria dos mais novos laptops HP
Tanto o infravermelho e um obturador estão incluídos para suporte e privacidade do Windows Hello, respectivamente.


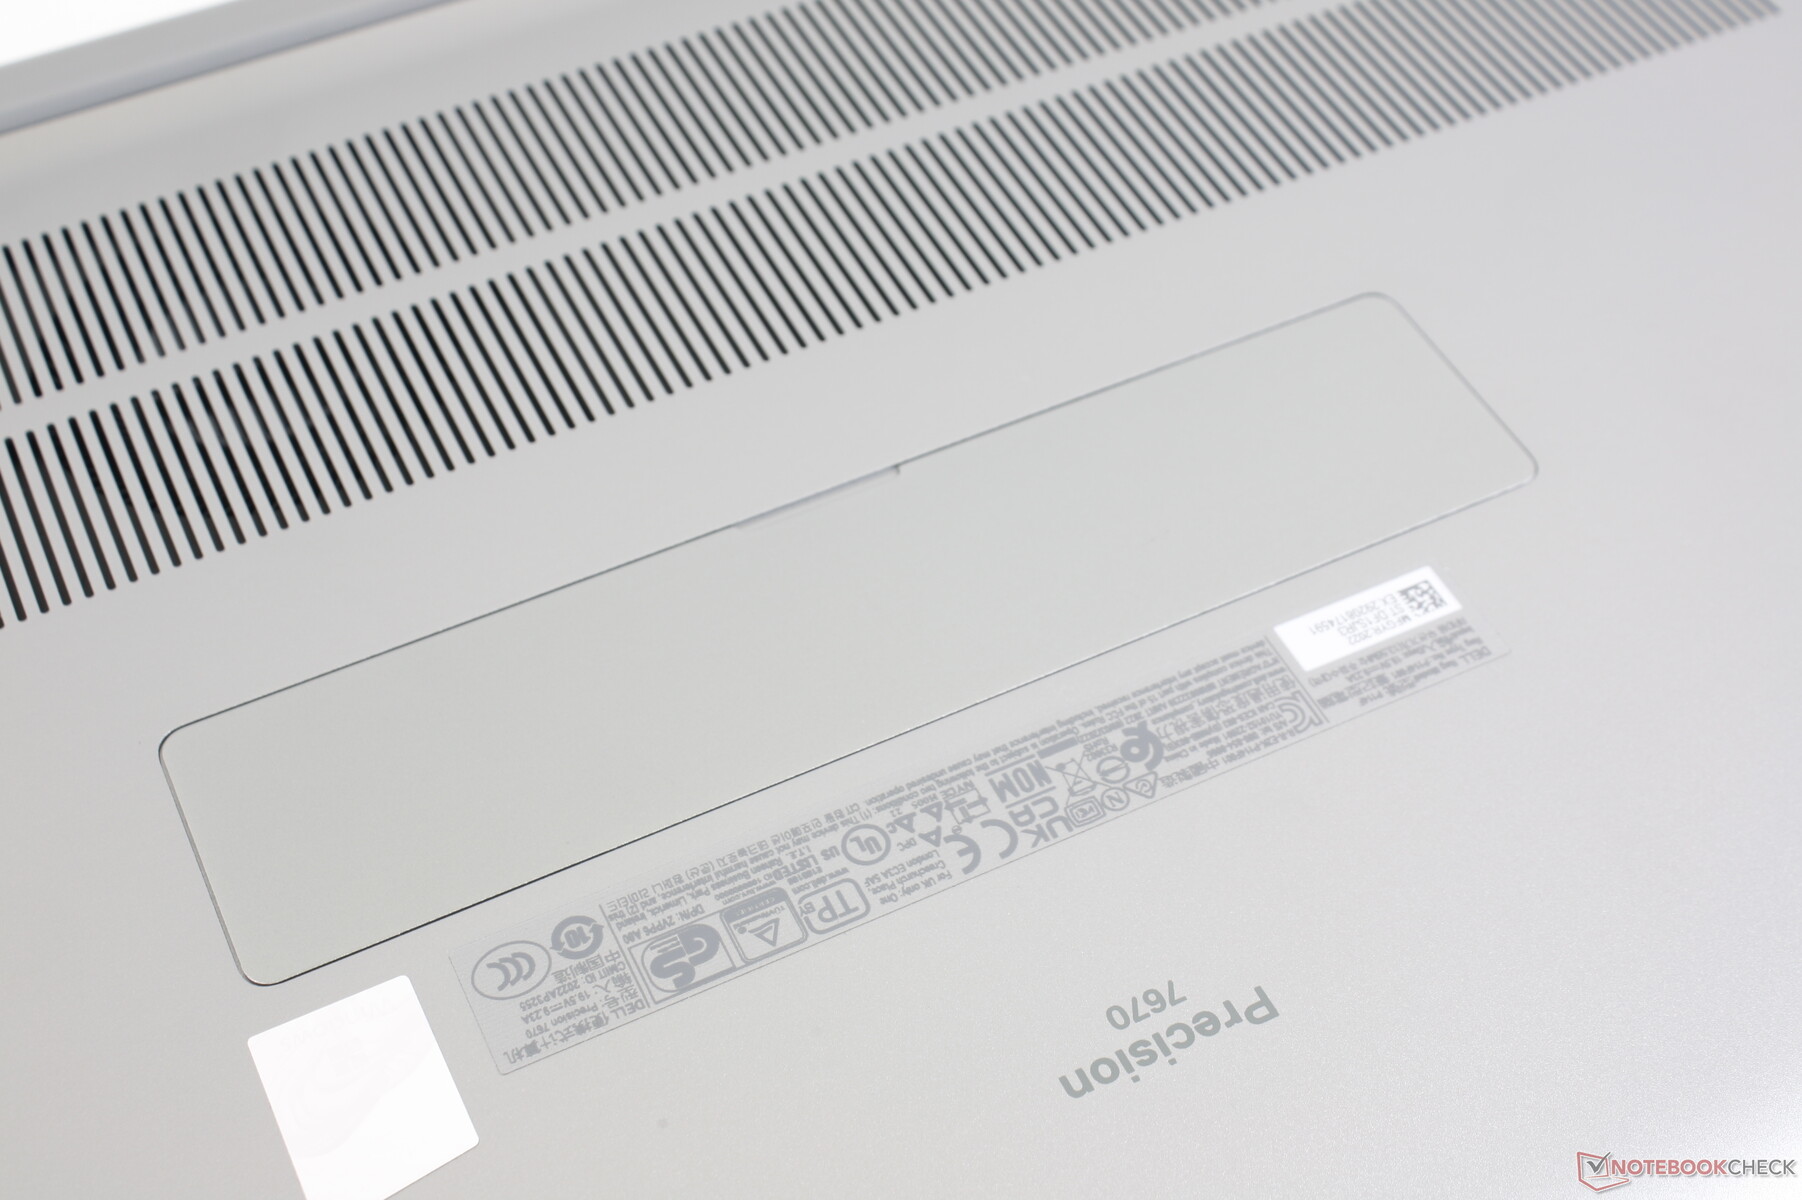
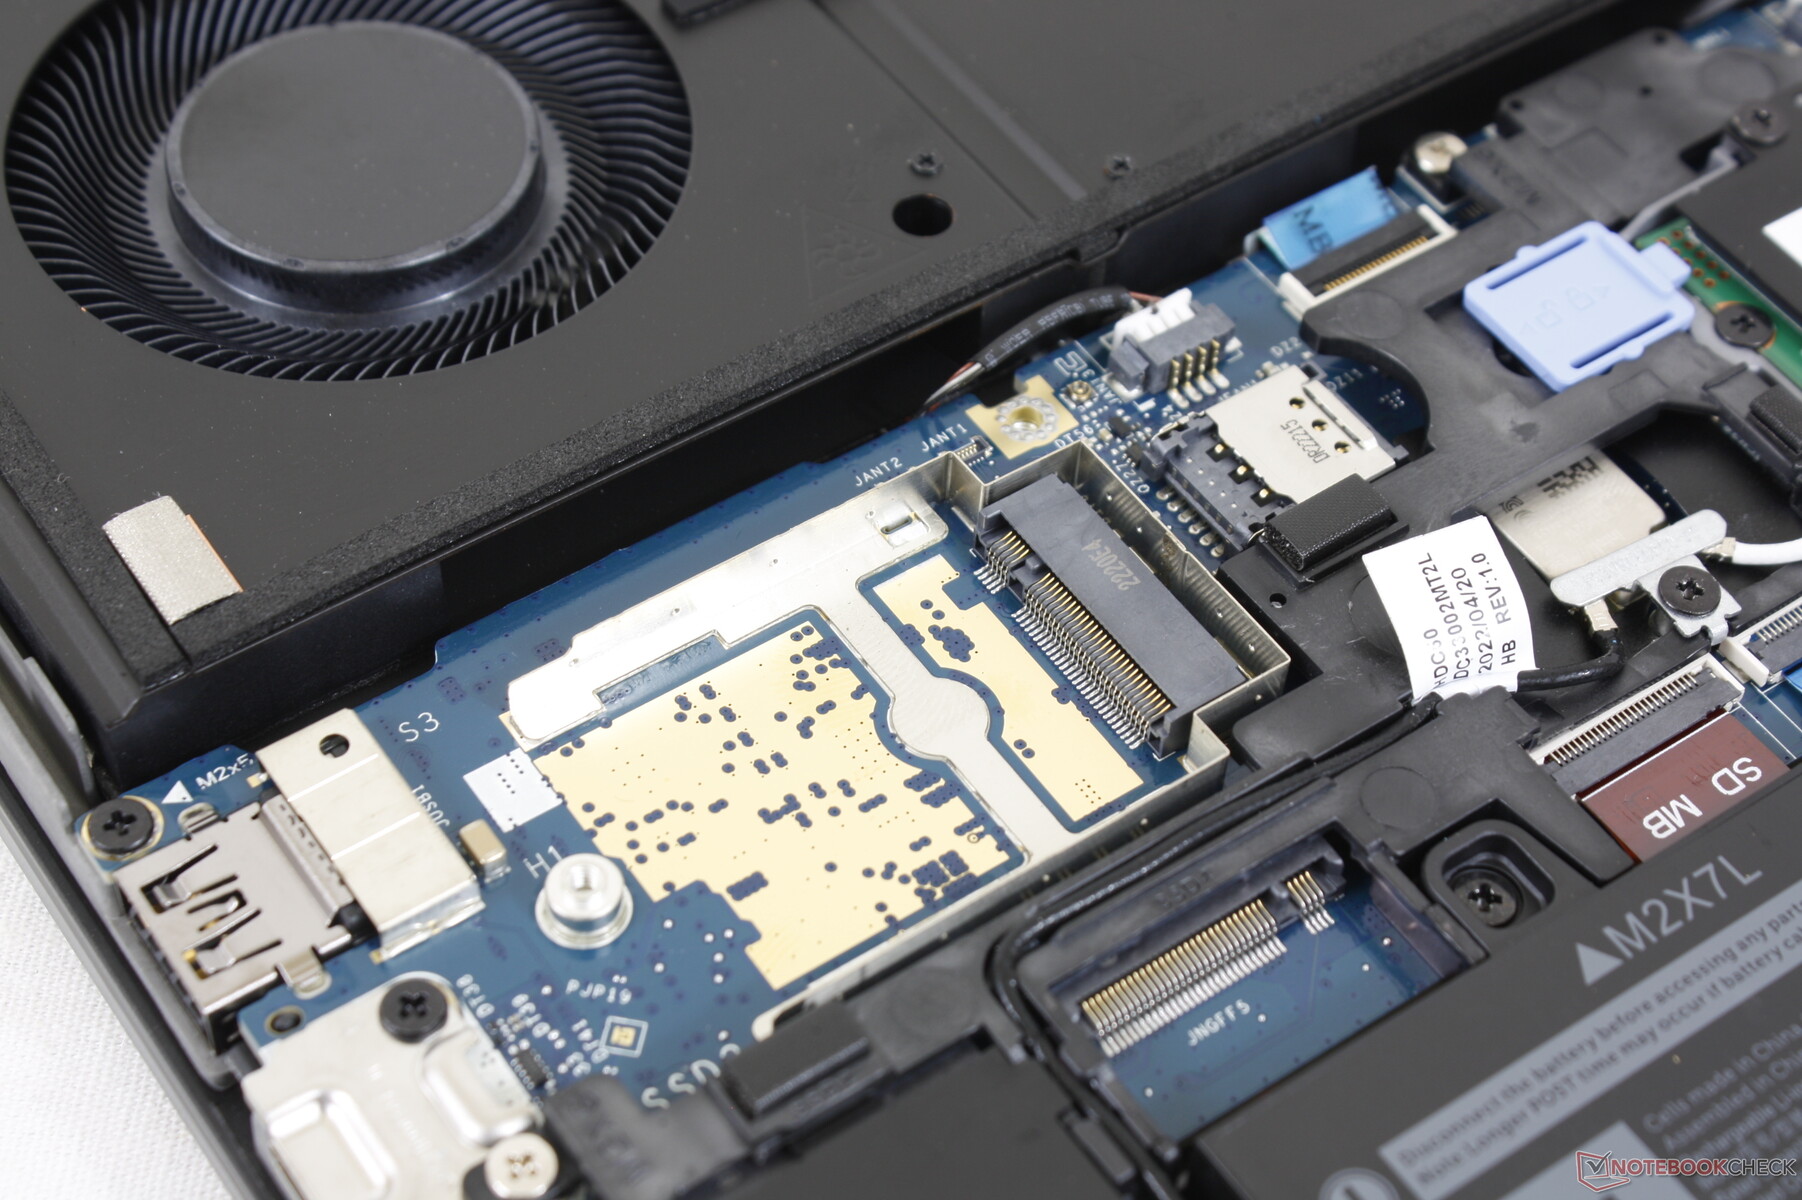
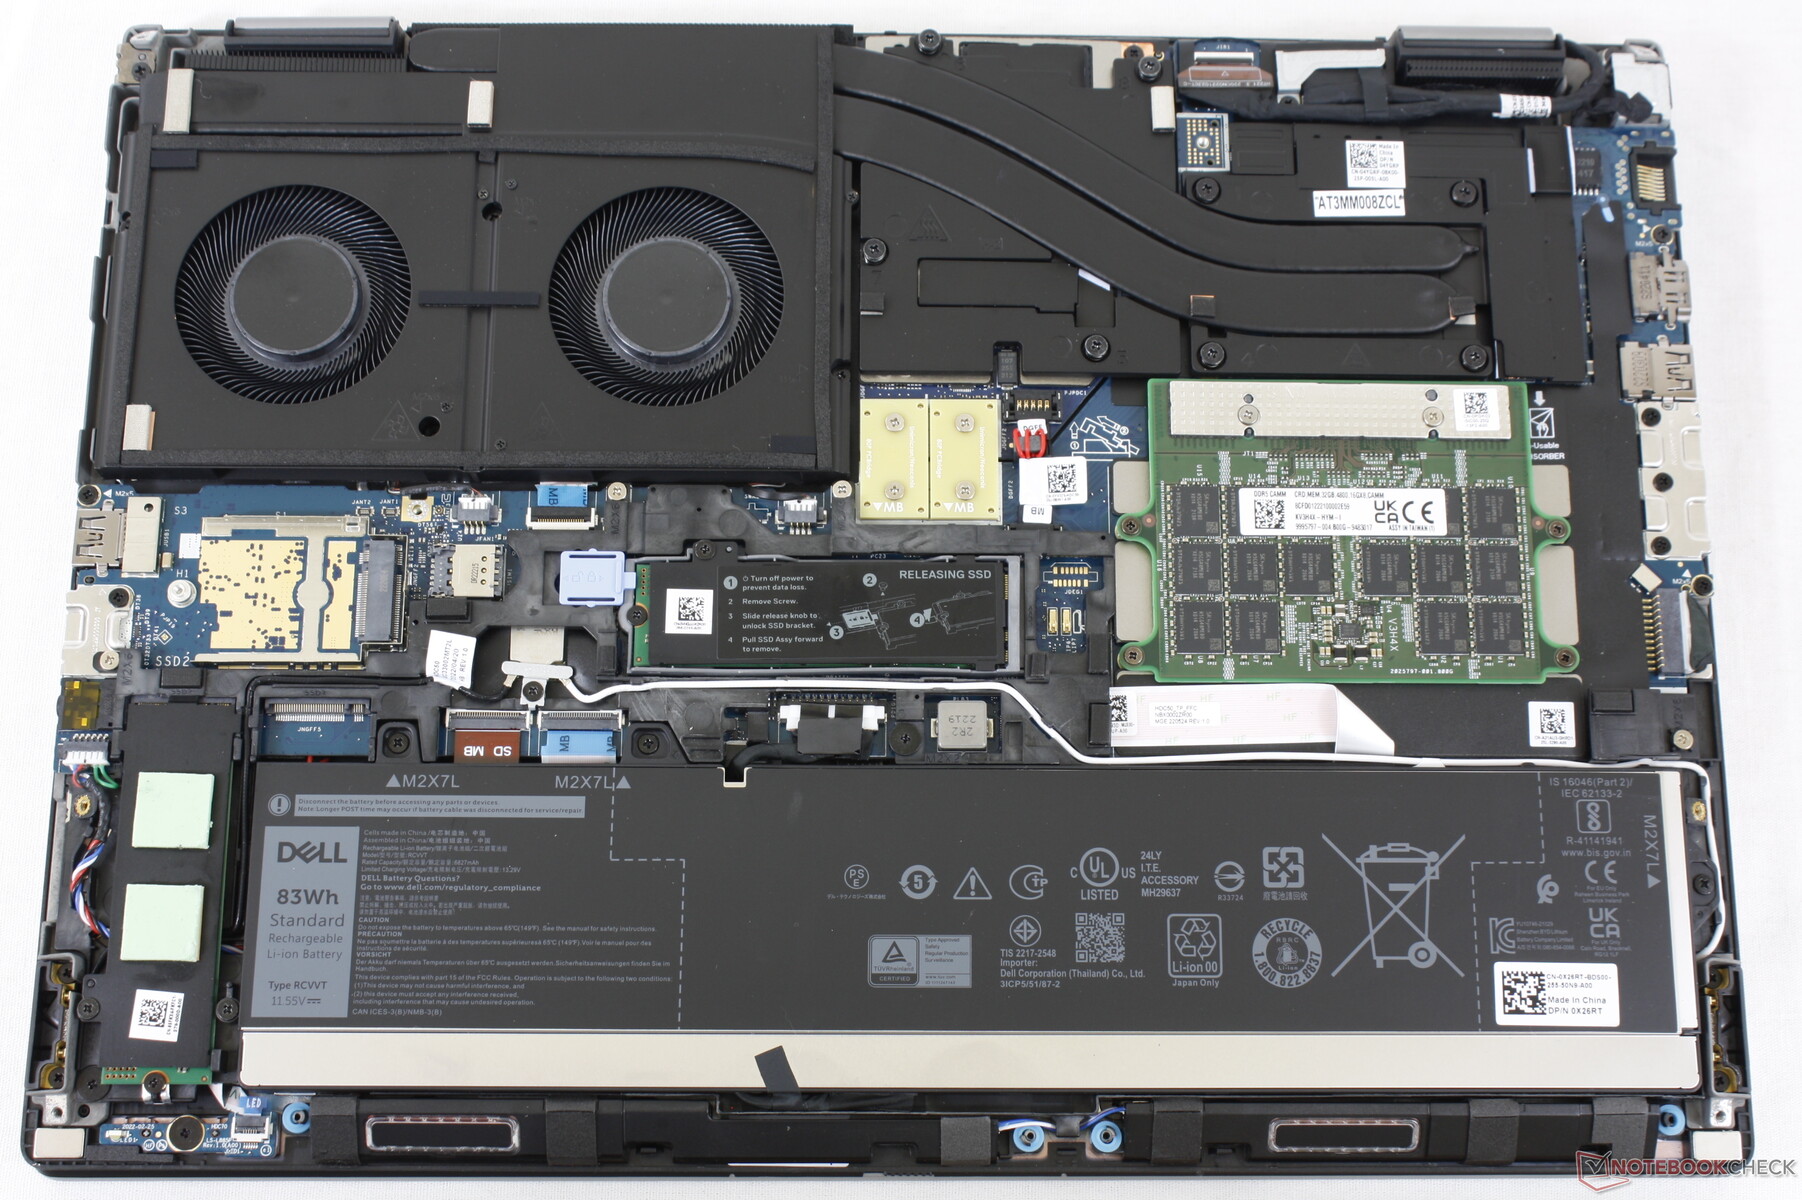
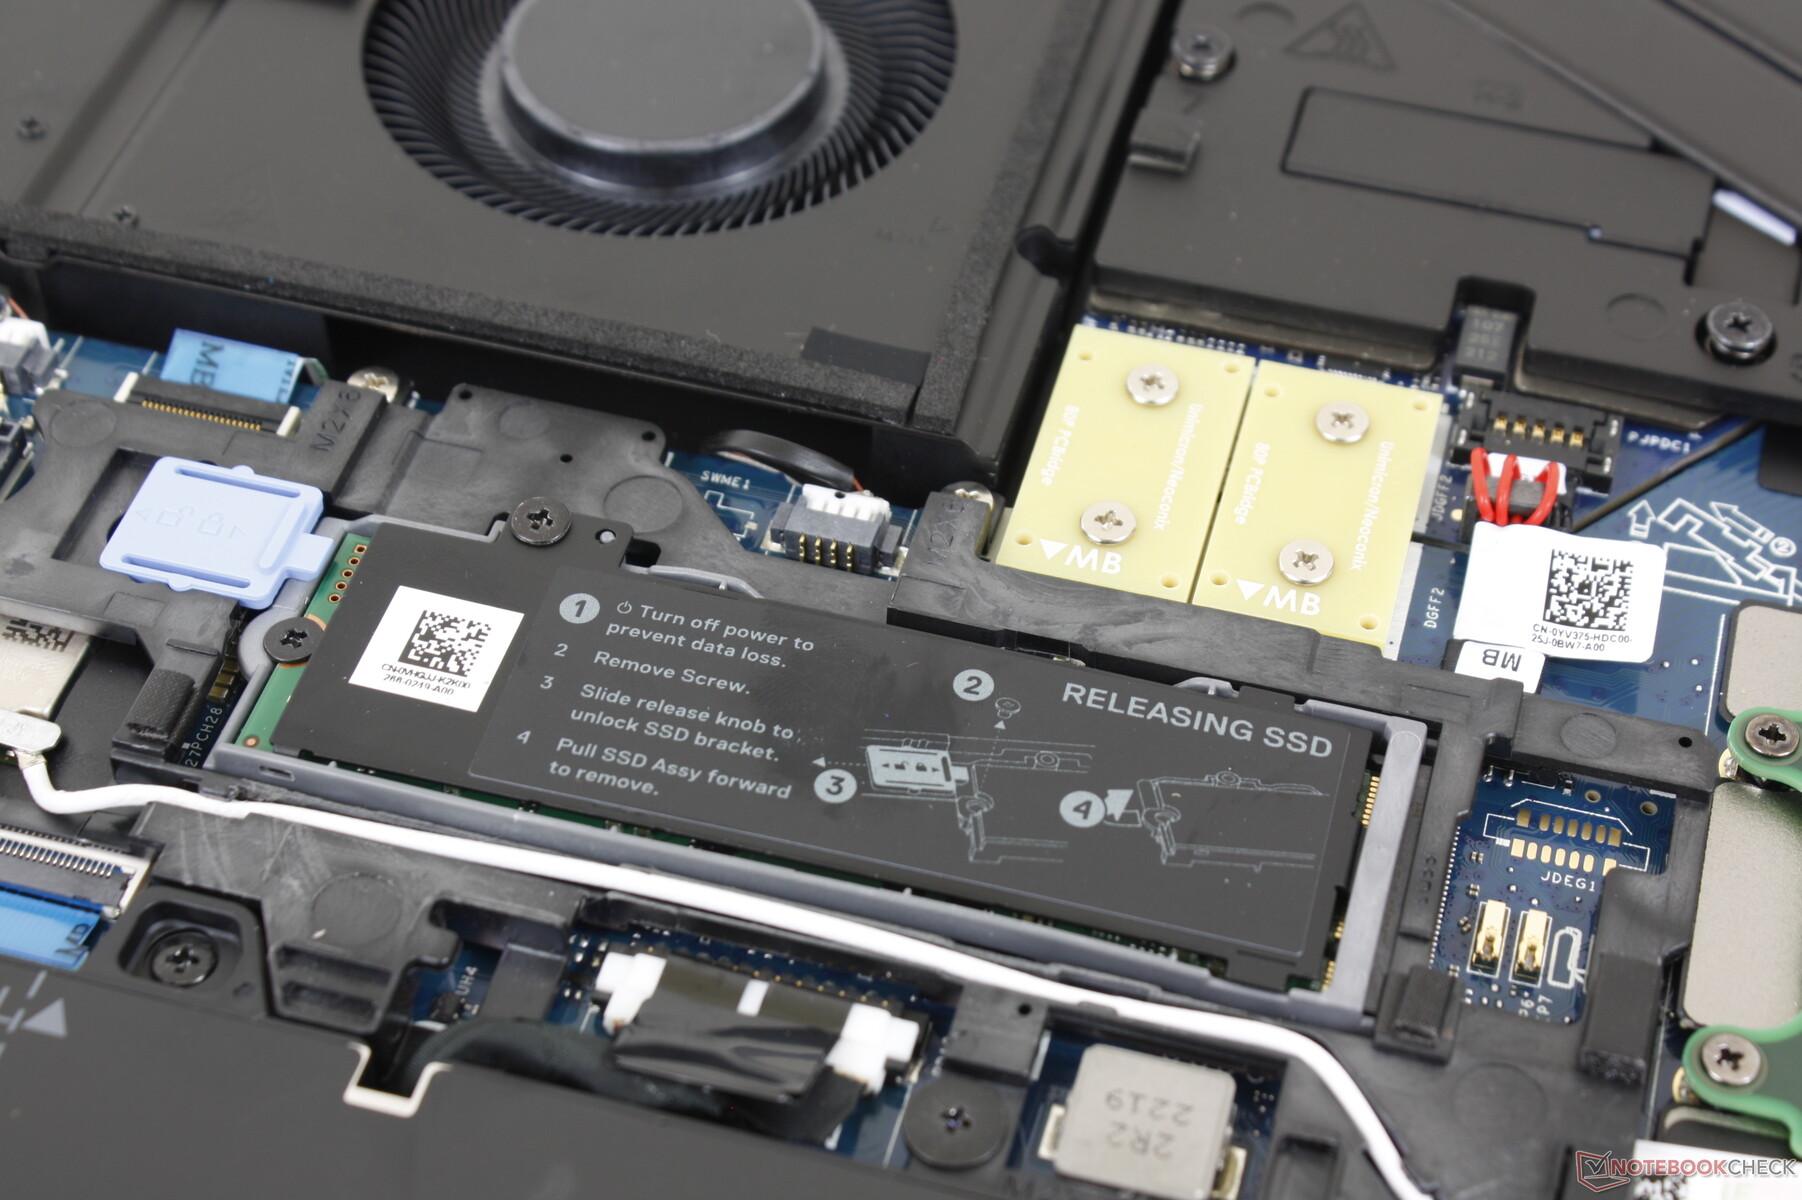
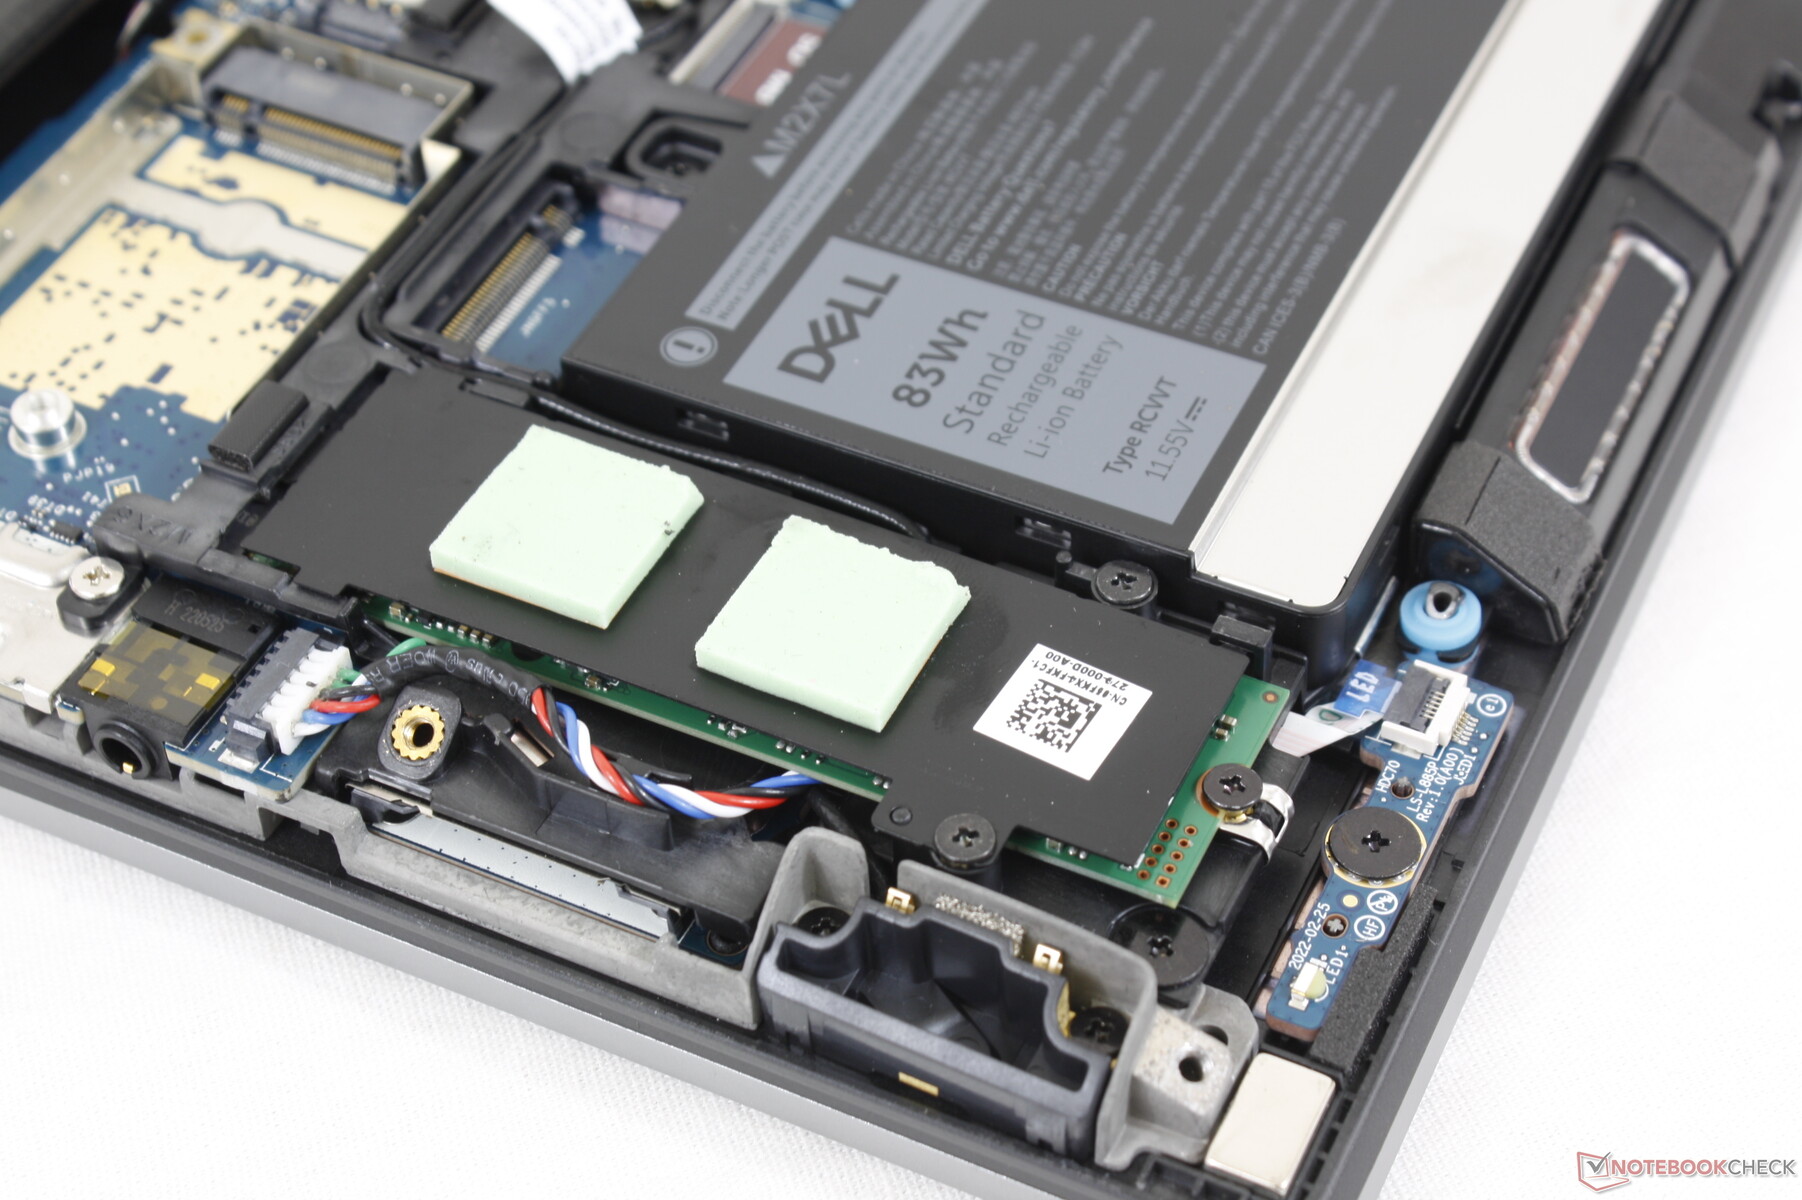
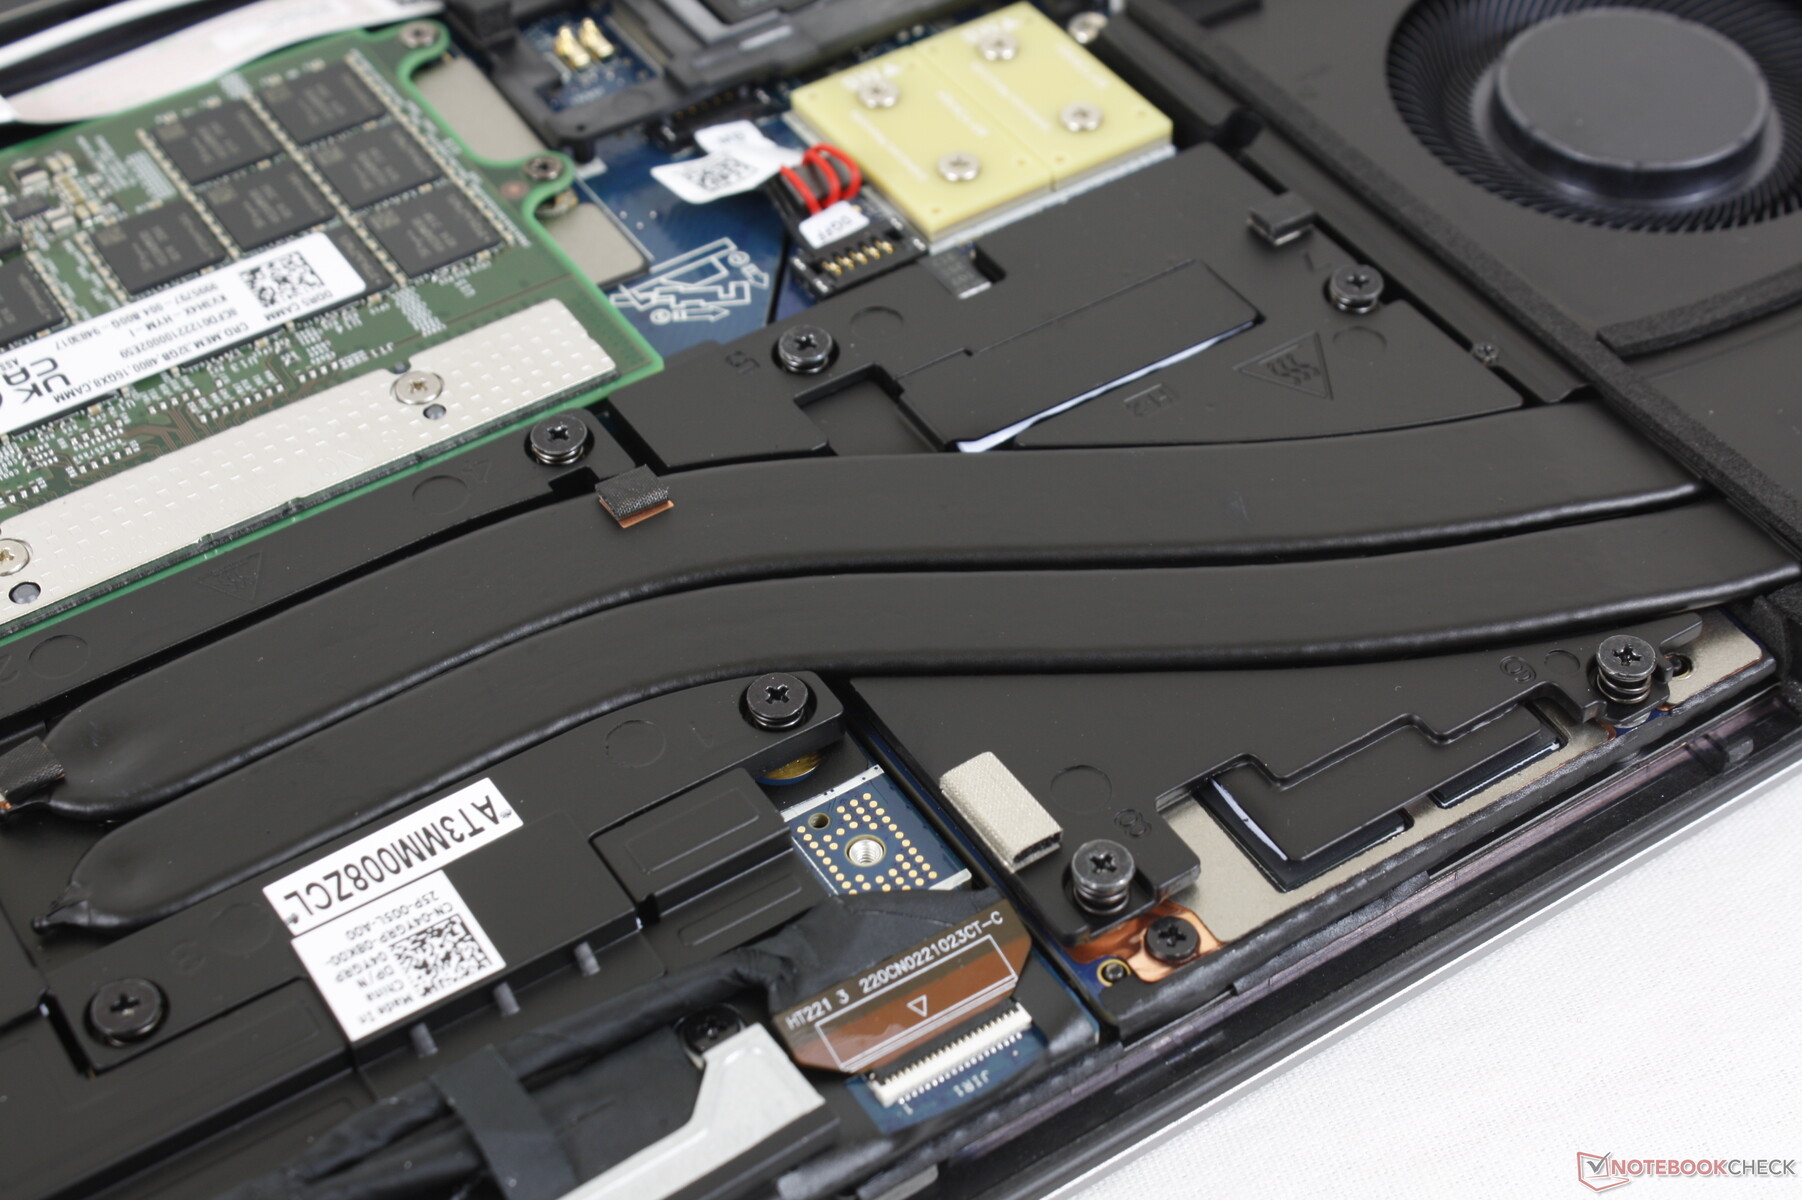
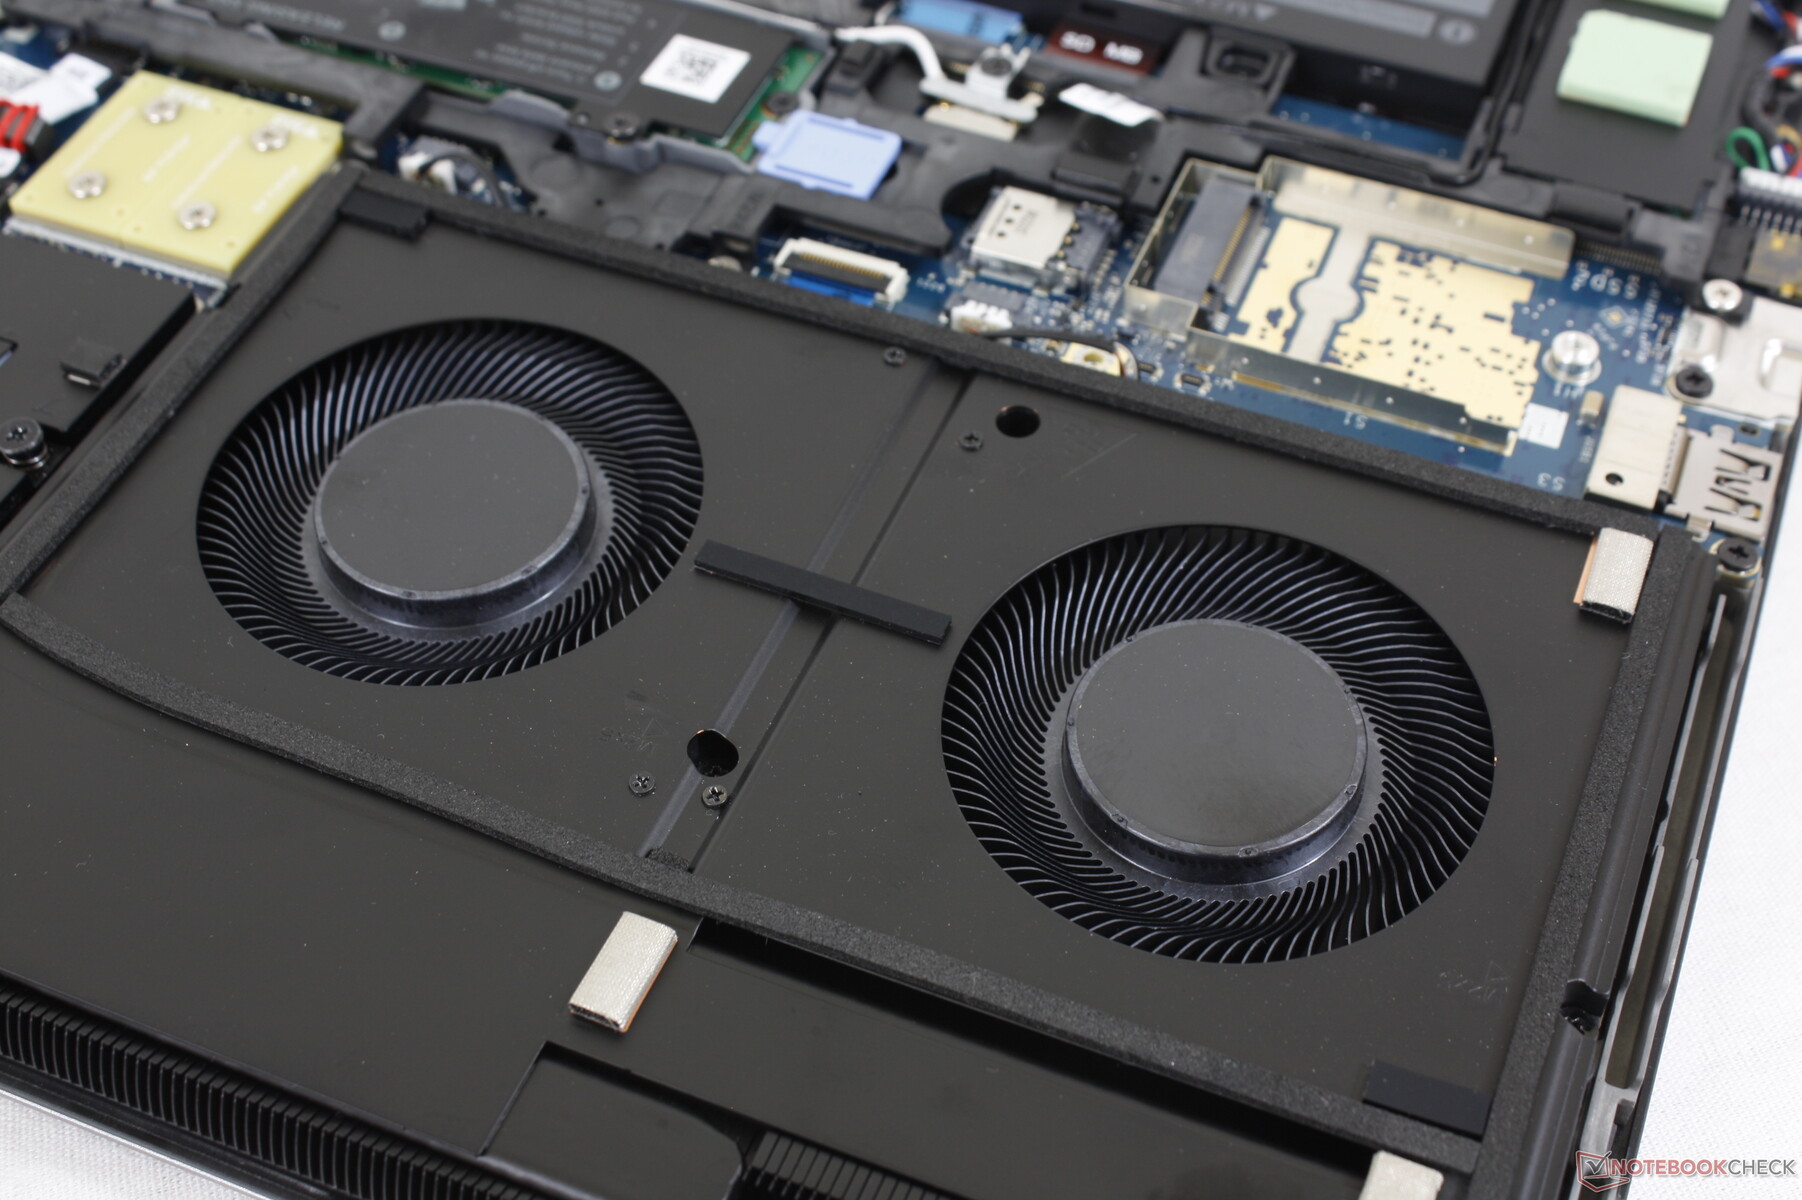
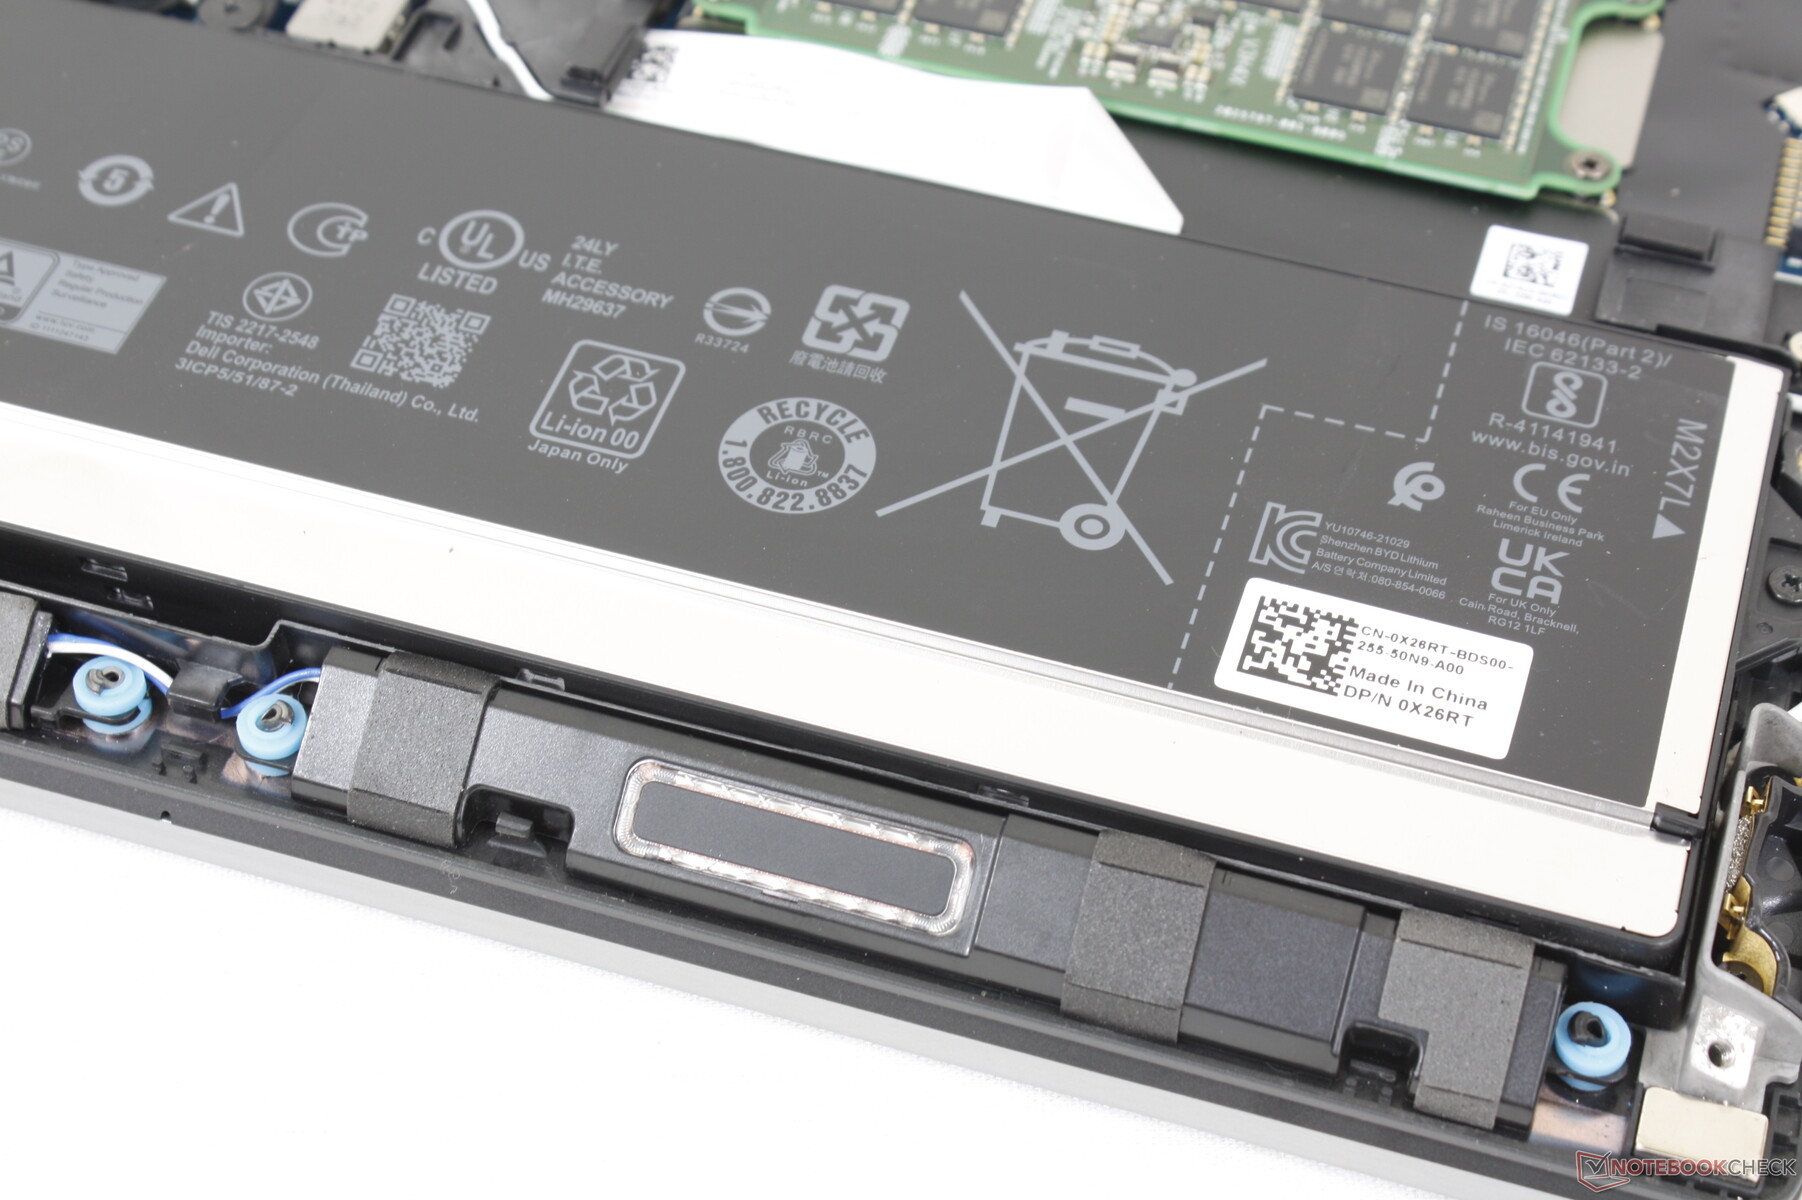
Manutenção - Fácil acesso
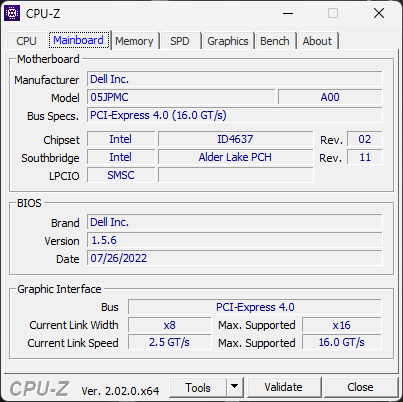
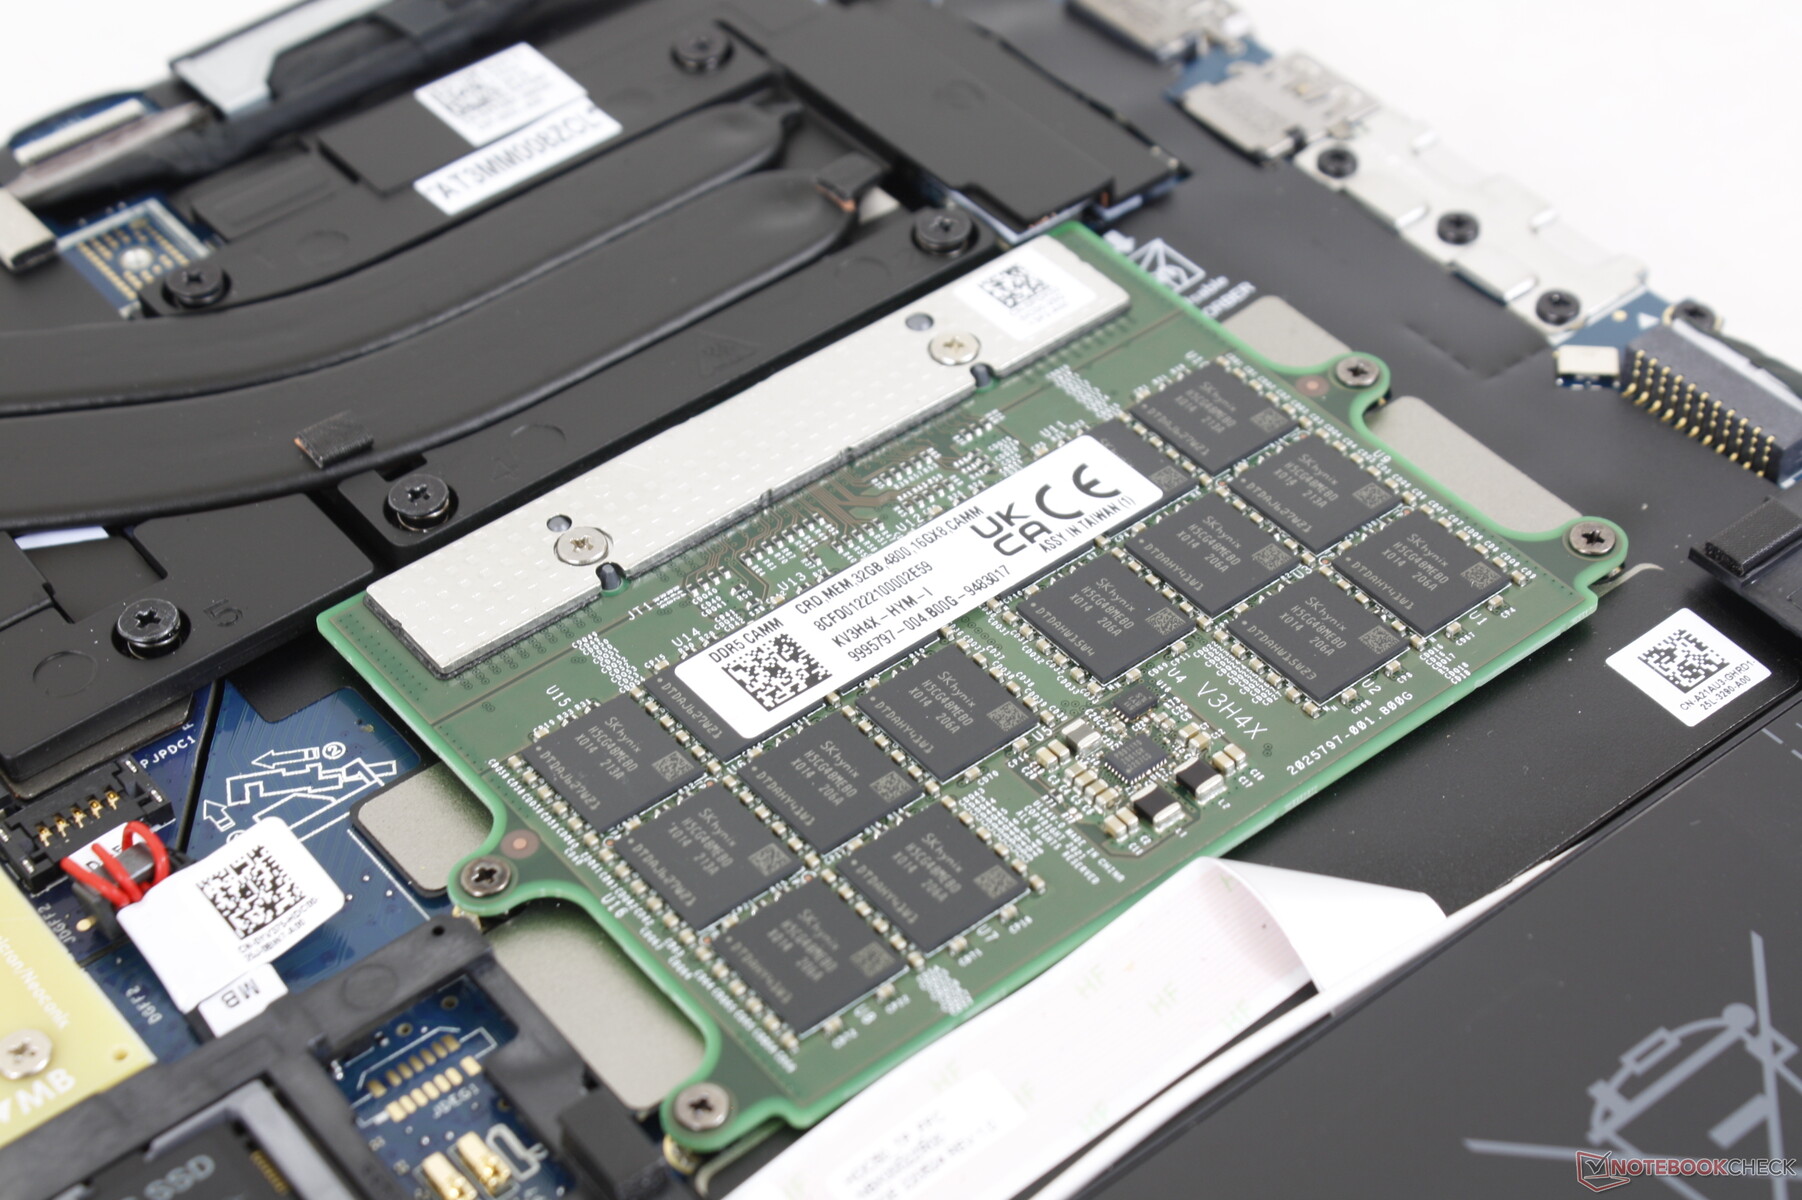
O painel inferior é fixado por 6 parafusos Philips para facilitar a manutenção. Os usuários têm acesso a dois slots M.2 PCIe4 x4 2280, slot WAN, slot Nano-SIM, e slots SODIMM ou CAMM dependendo da configuração. O módulo WLAN não é removível.
Certas configurações podem abrigar até três M.2 SSDs, como exemplificado pelo terceiro slot M.2 próximo à borda da bateria.
Mais informações sobre a RAM CAMM podem ser encontradas em nossa página de visualização aqui.
Acessórios e Garantia
Não há extras na caixa além do adaptador AC e da papelada. Uma garantia limitada de três anos do fabricante vem como padrão se comprada diretamente da Dell.
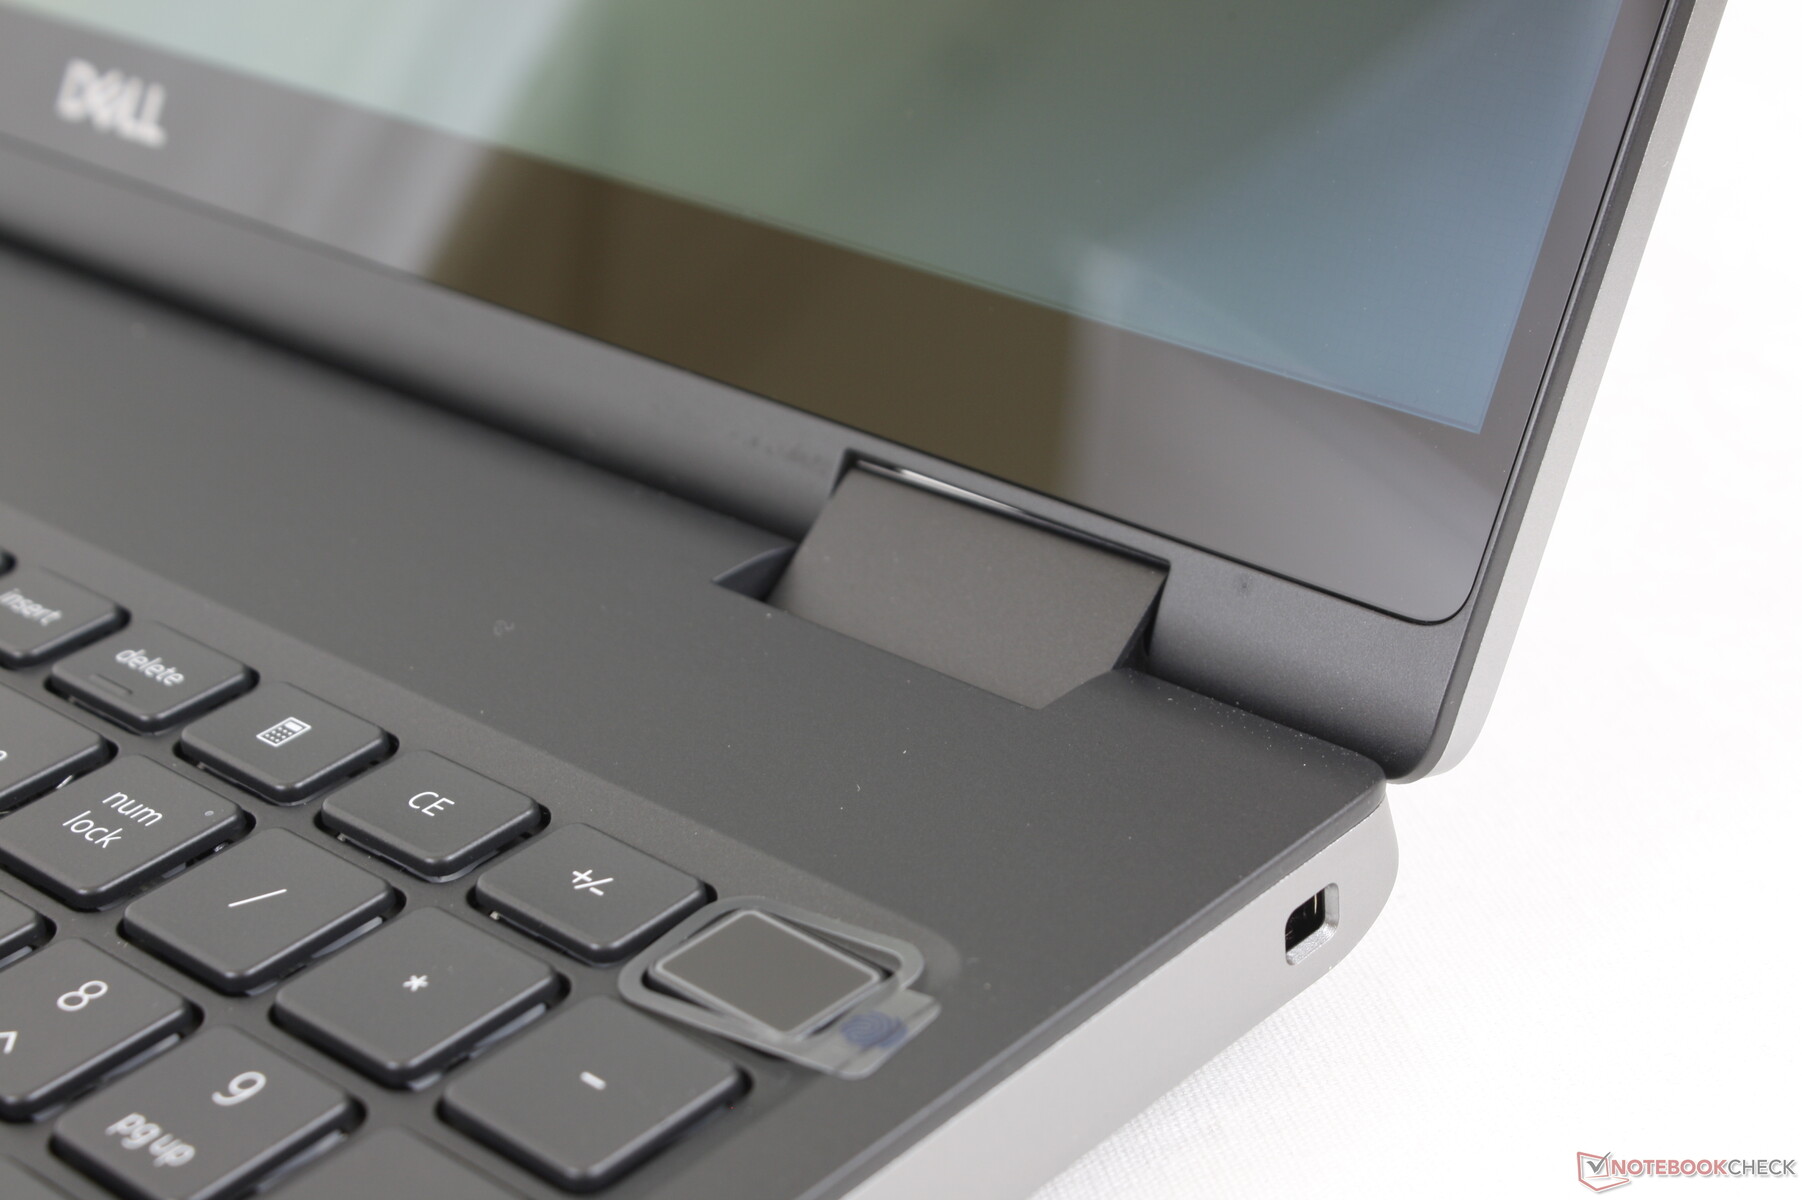
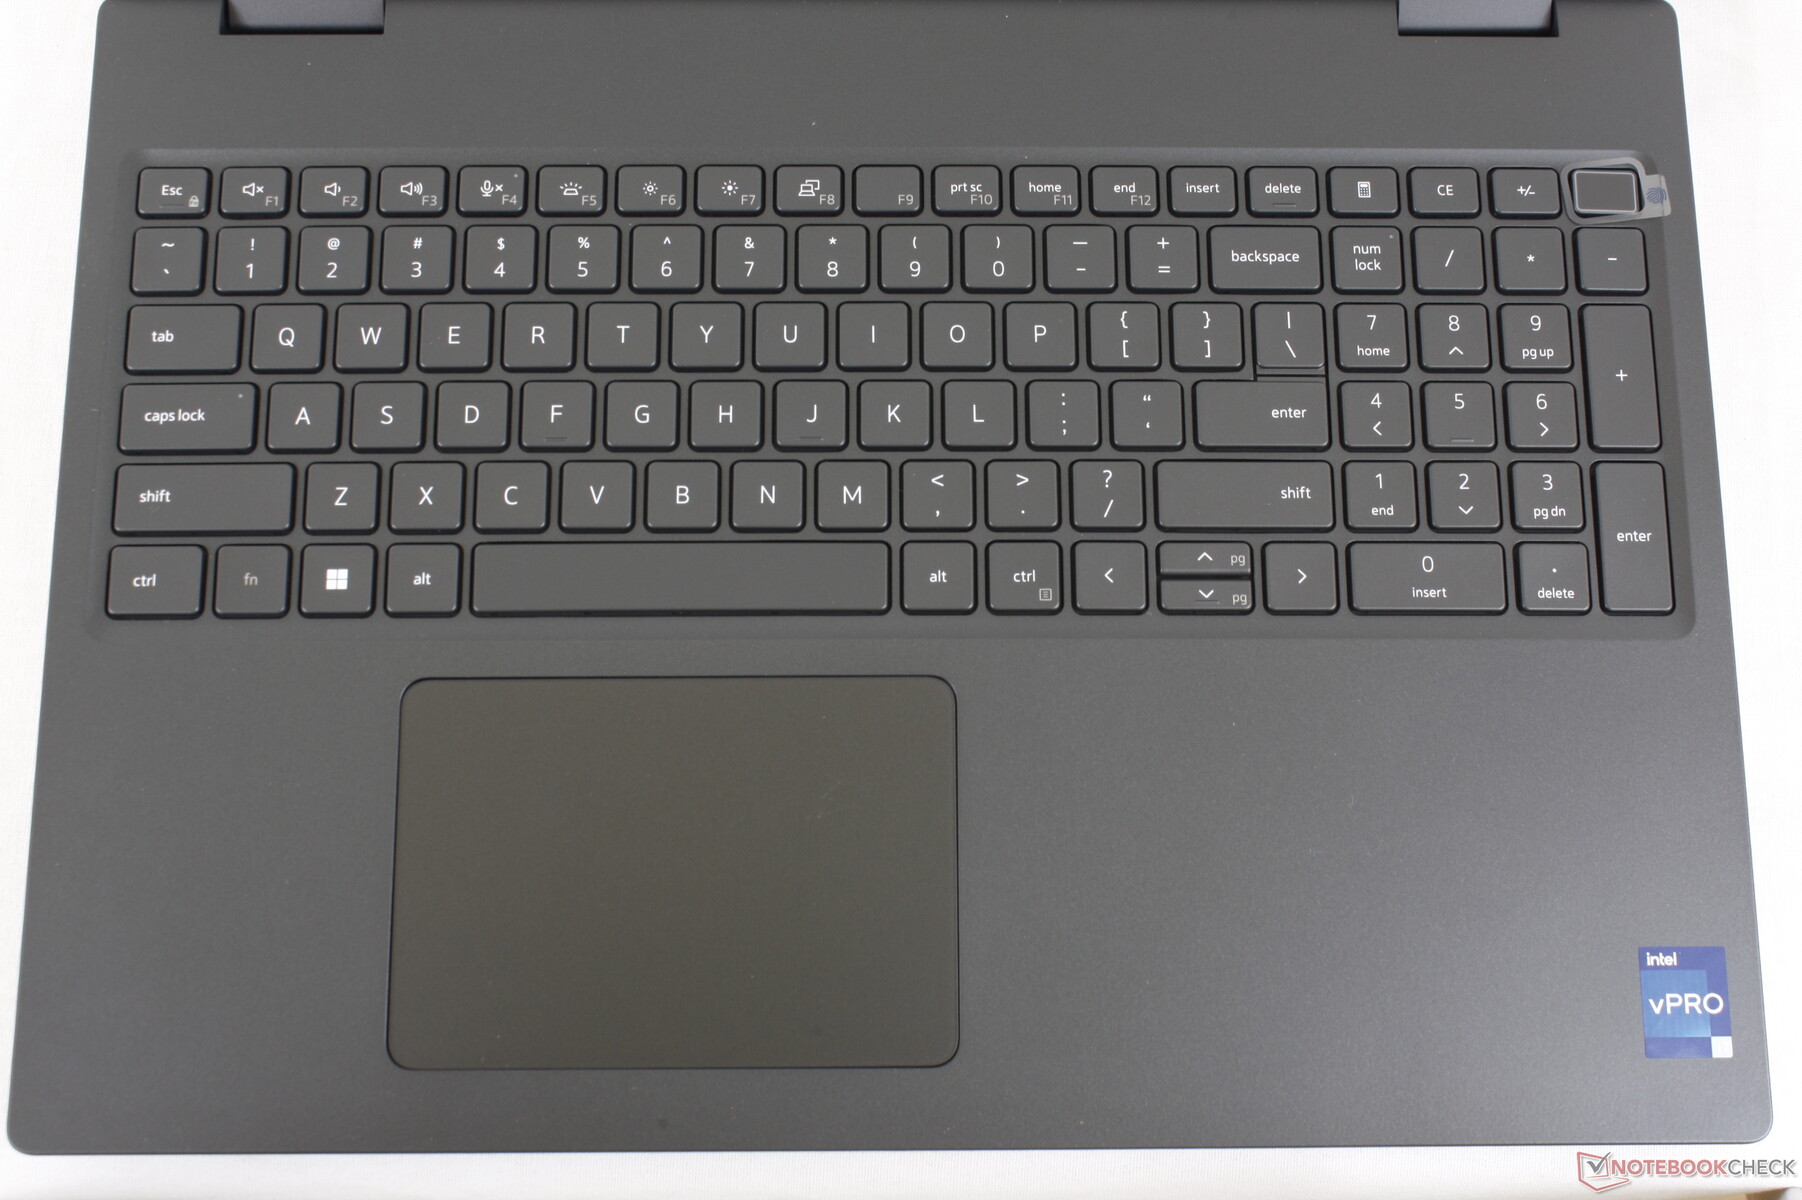
Dispositivos de entrada - Clickpad grande com um teclado confortável
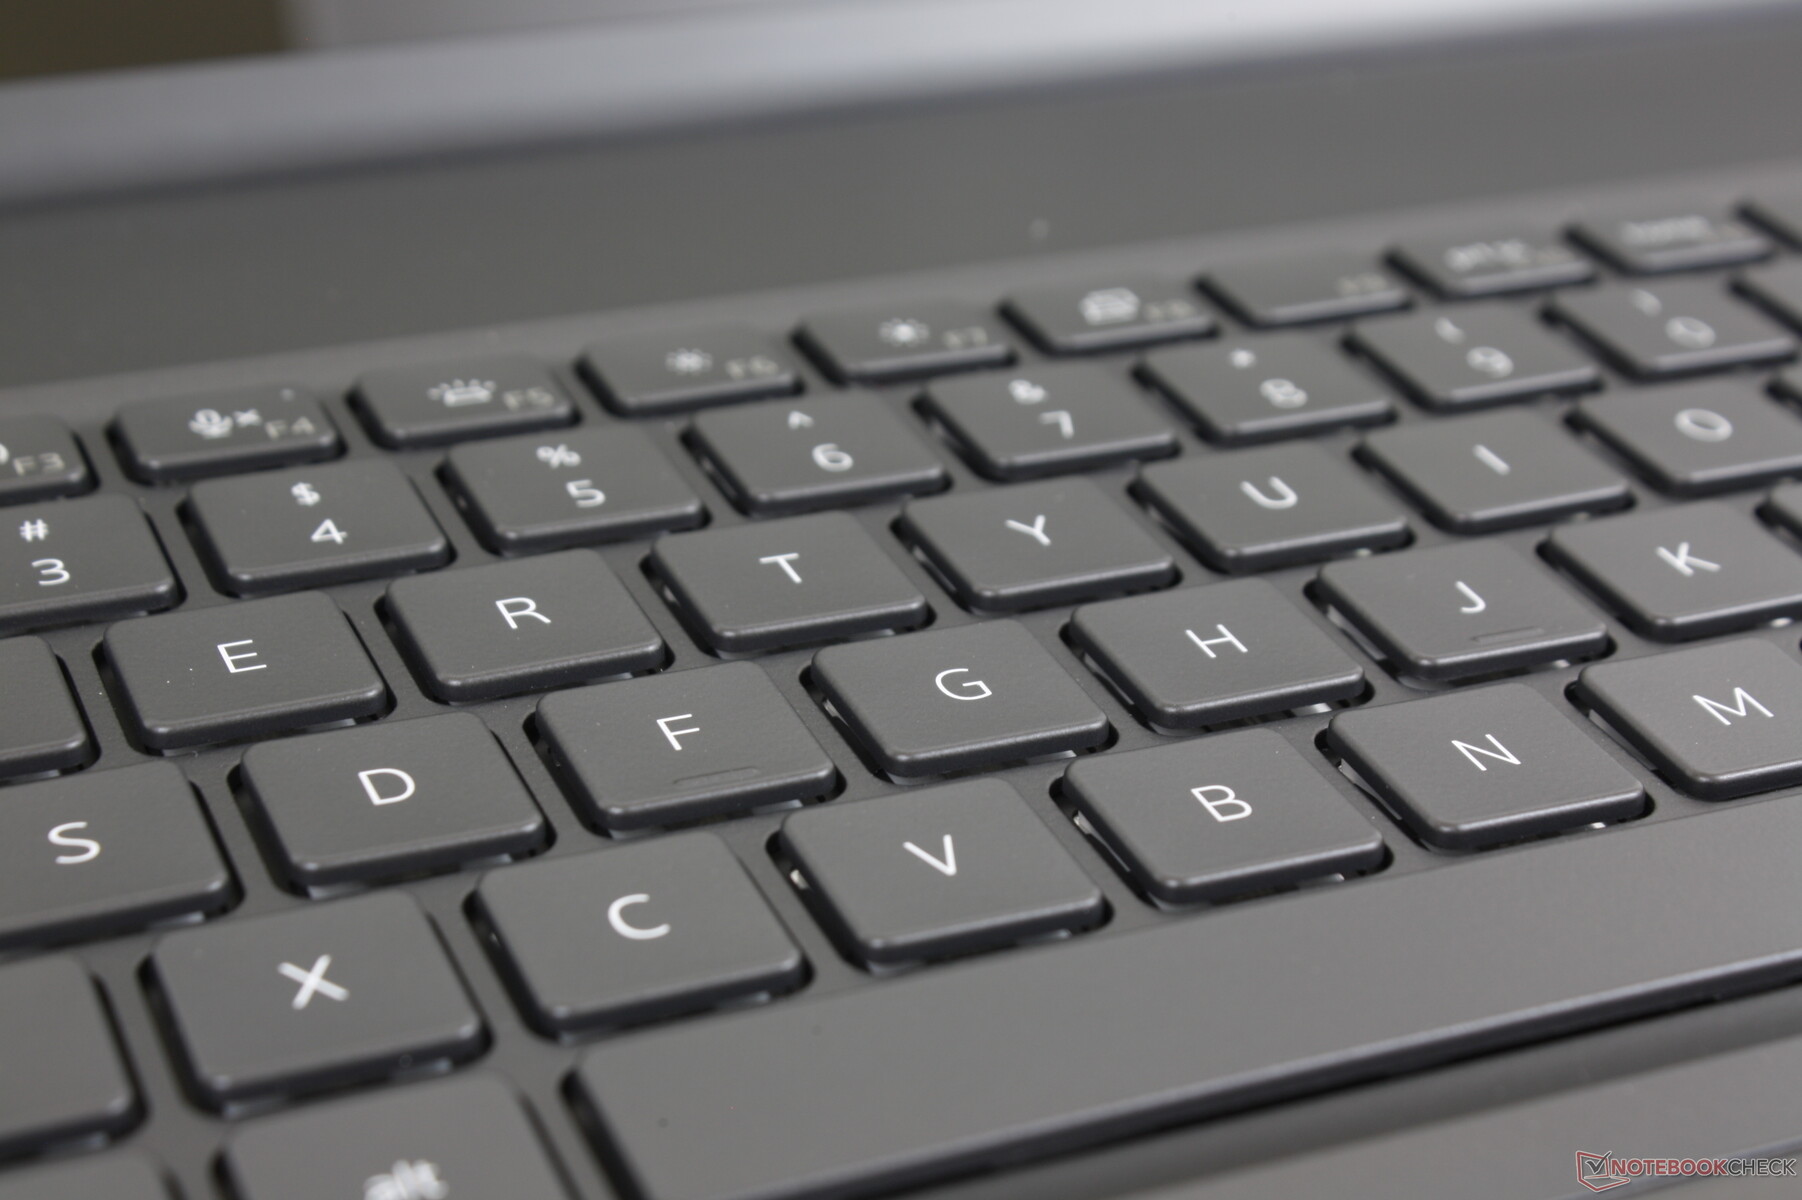
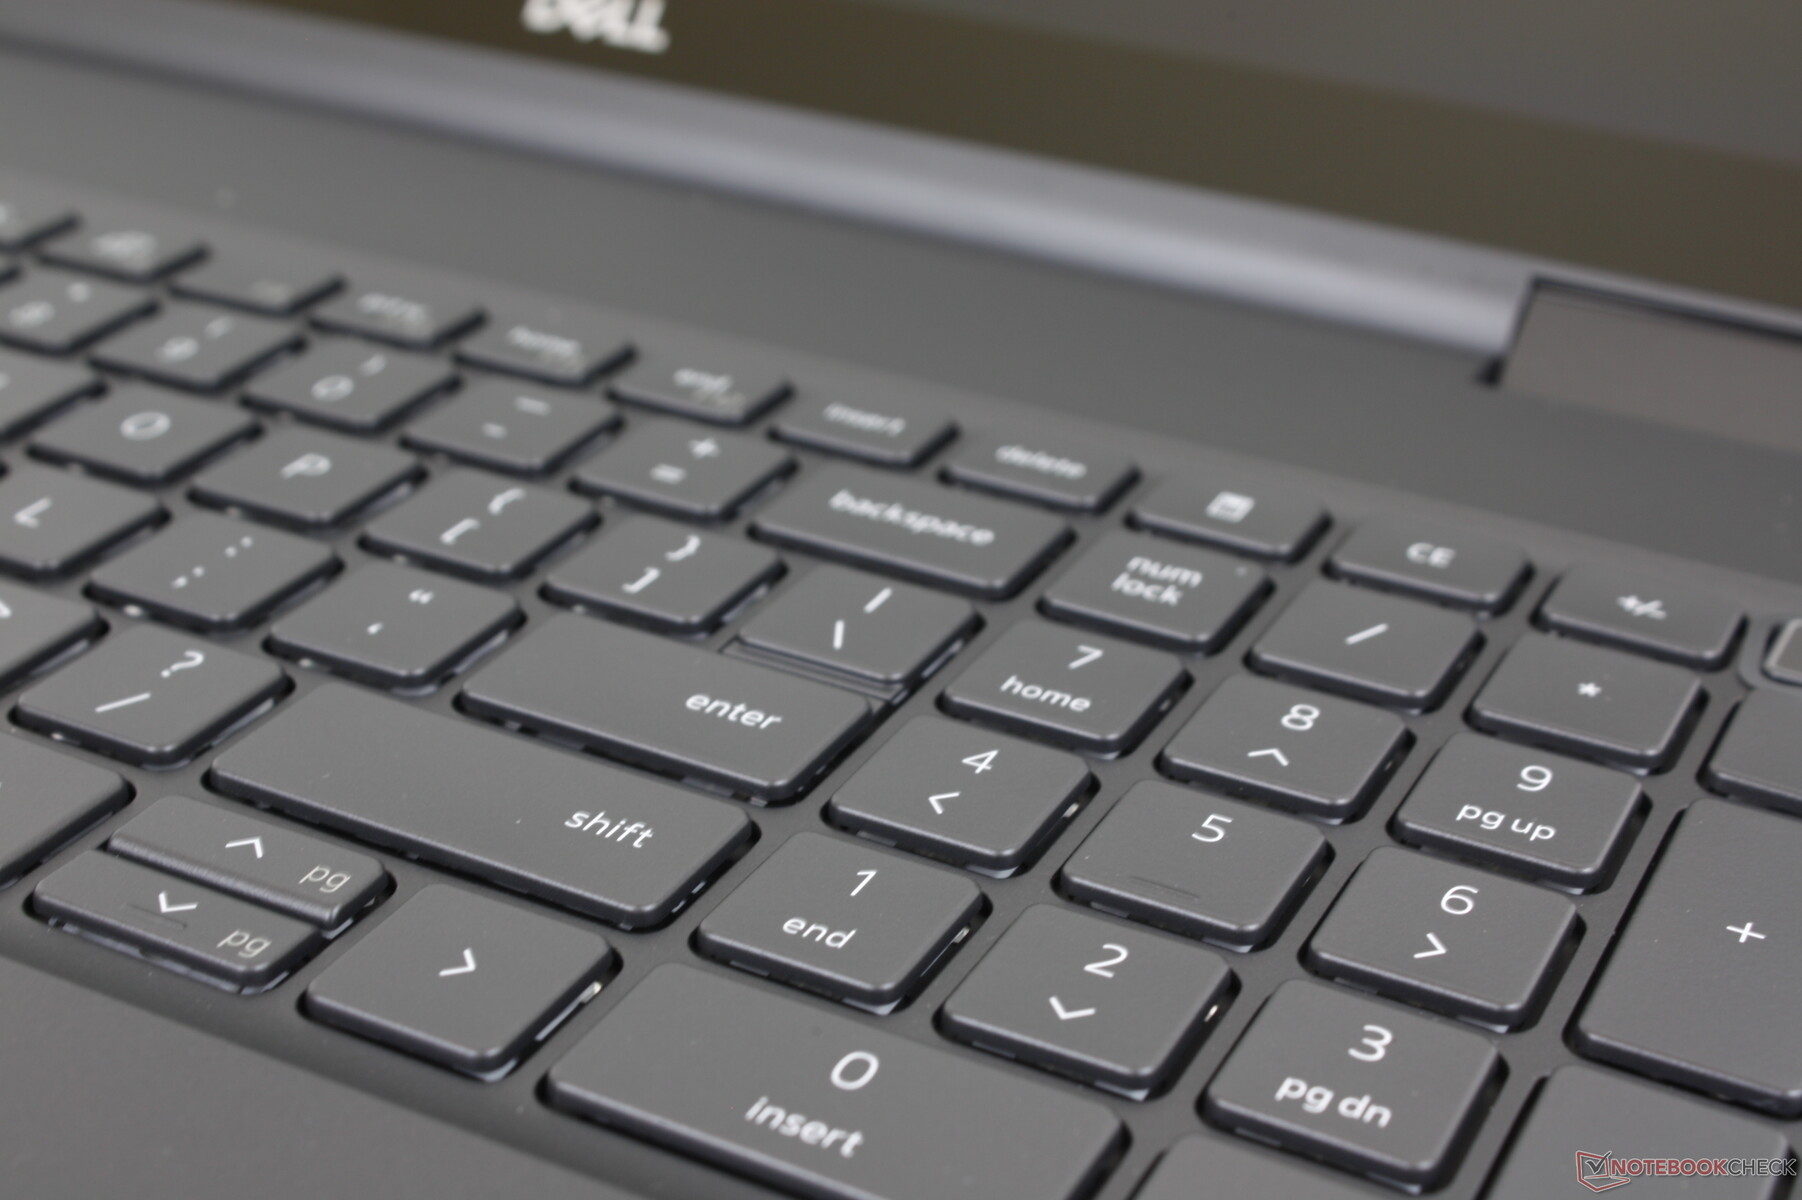
Teclado
O layout chave e o feedback não mudaram em relação ao Precision 7550. Achamos as chaves um pouco mais altas do que as chaves da série XPS, mas com um feedback mais forte e viagens mais profundas. Entretanto, as teclas de seta ainda estão apertadas ao contrário das teclas de seta maiores no ThinkPad P1 G4 ou no Asus ProArt StudioBook.
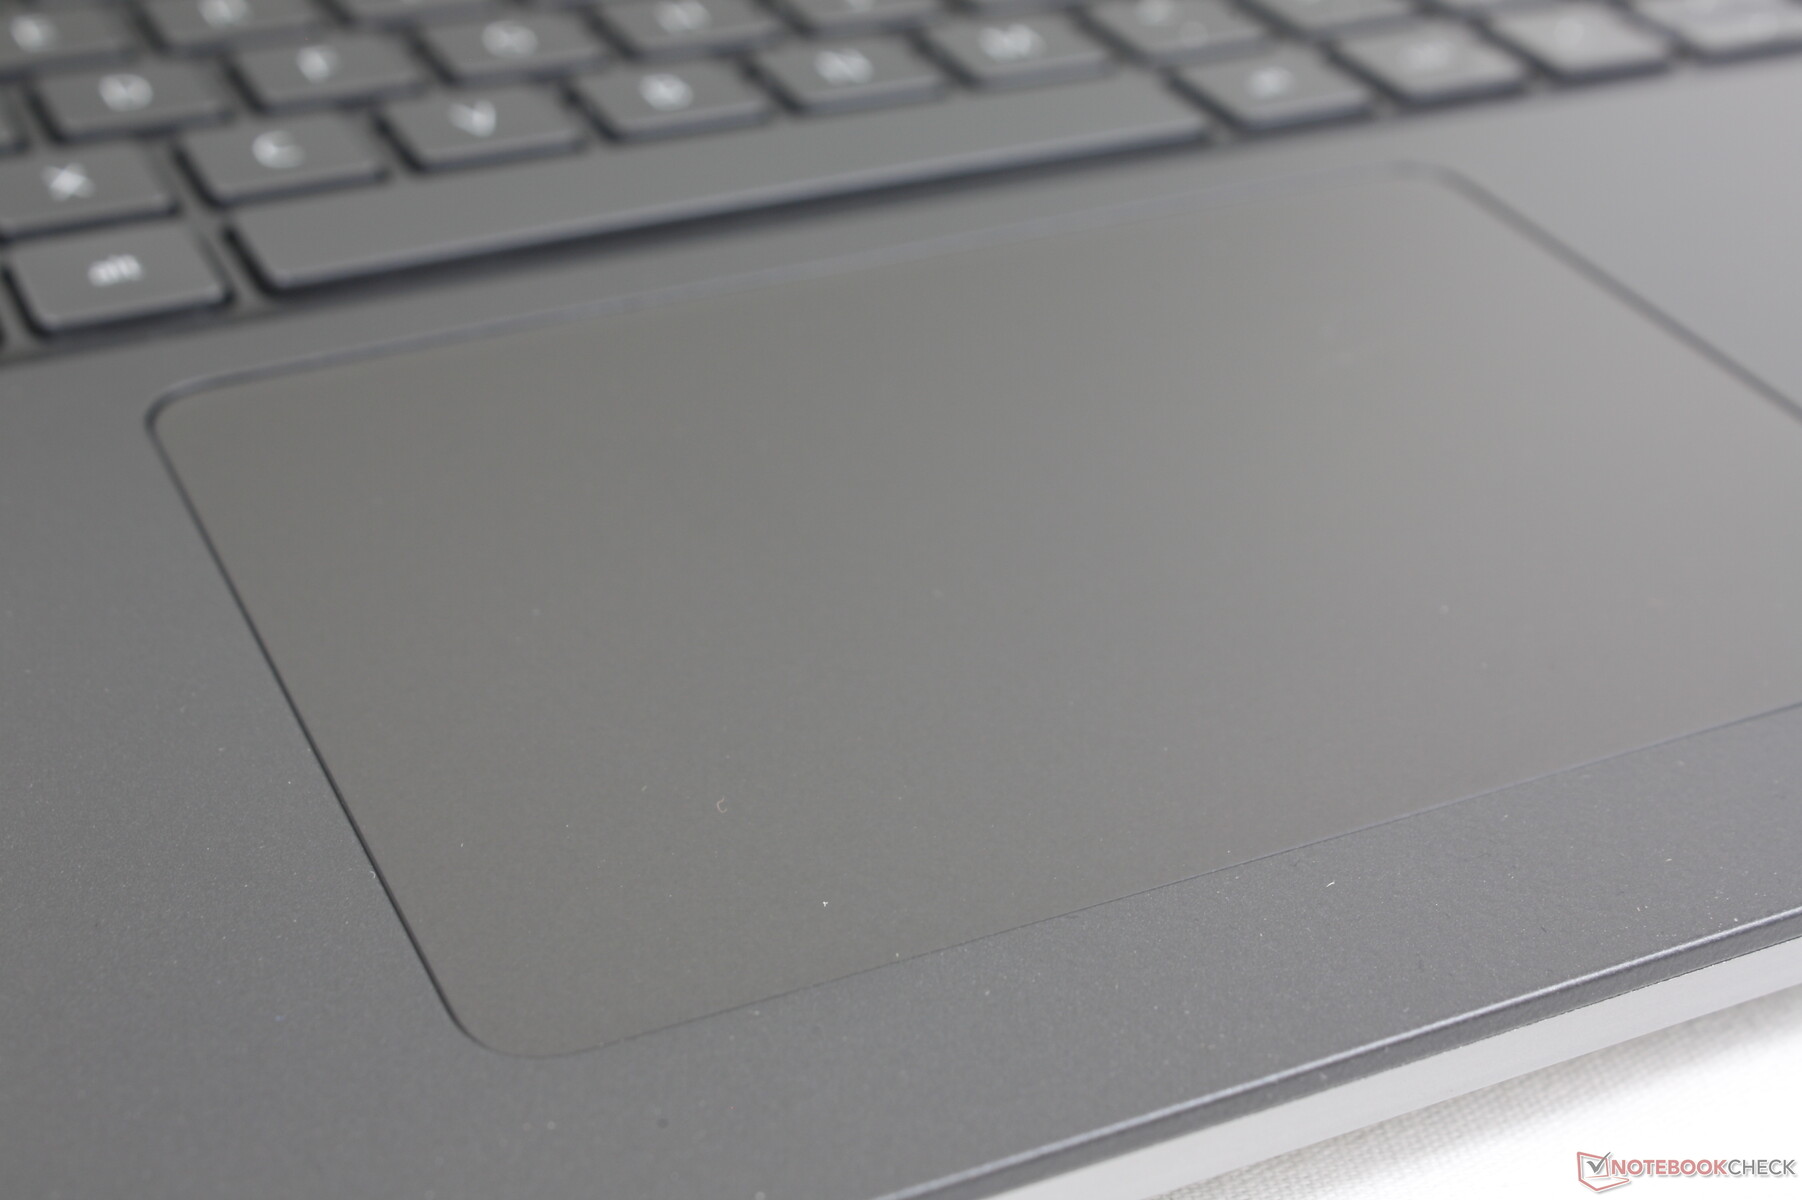
Touchpad
O clickpad é maior que o do Precision 7550 (11,5 x 8 cm vs. 10 x 6,5 cm). No entanto, não há botões de mouse mais dedicados e, portanto, a experiência do usuário é mais próxima de um Ultrabook tradicional do que de um ThinkPad ou ZBook centrado em negócios, onde os botões do mouse ainda são proeminentes. Nós pessoalmente preferimos botões dedicados, pois as ações de arrastar e soltar são facilitadas, mas a falta de botões resultou em uma superfície de clickpad maior, que outros podem apreciar.
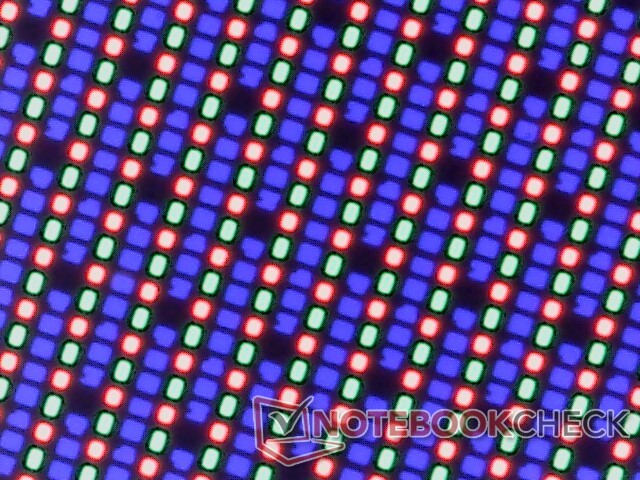
Mostrador - No 120 Hz Opções
A Dell oferece três opções de exibição a partir desta escrita
- 1200p, 60 Hz, 60 por cento sRGB, 250 lêndeas, sem contato
- 1200p, 60 Hz, 99 por cento DCI-P3, 500 lêndeas, sem contato, IPS
- 2400p, 60 Hz, 100 por cento DCI-P3, 400 lêndeas, toque, OLED
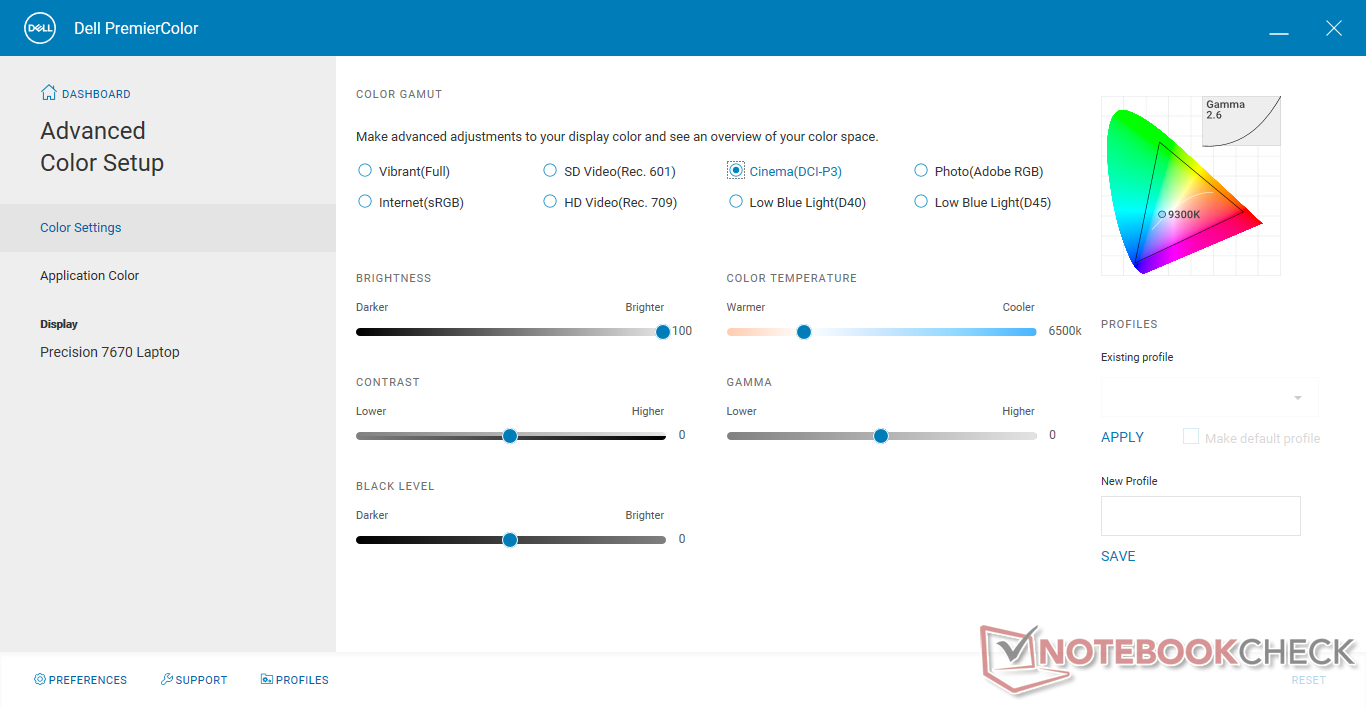
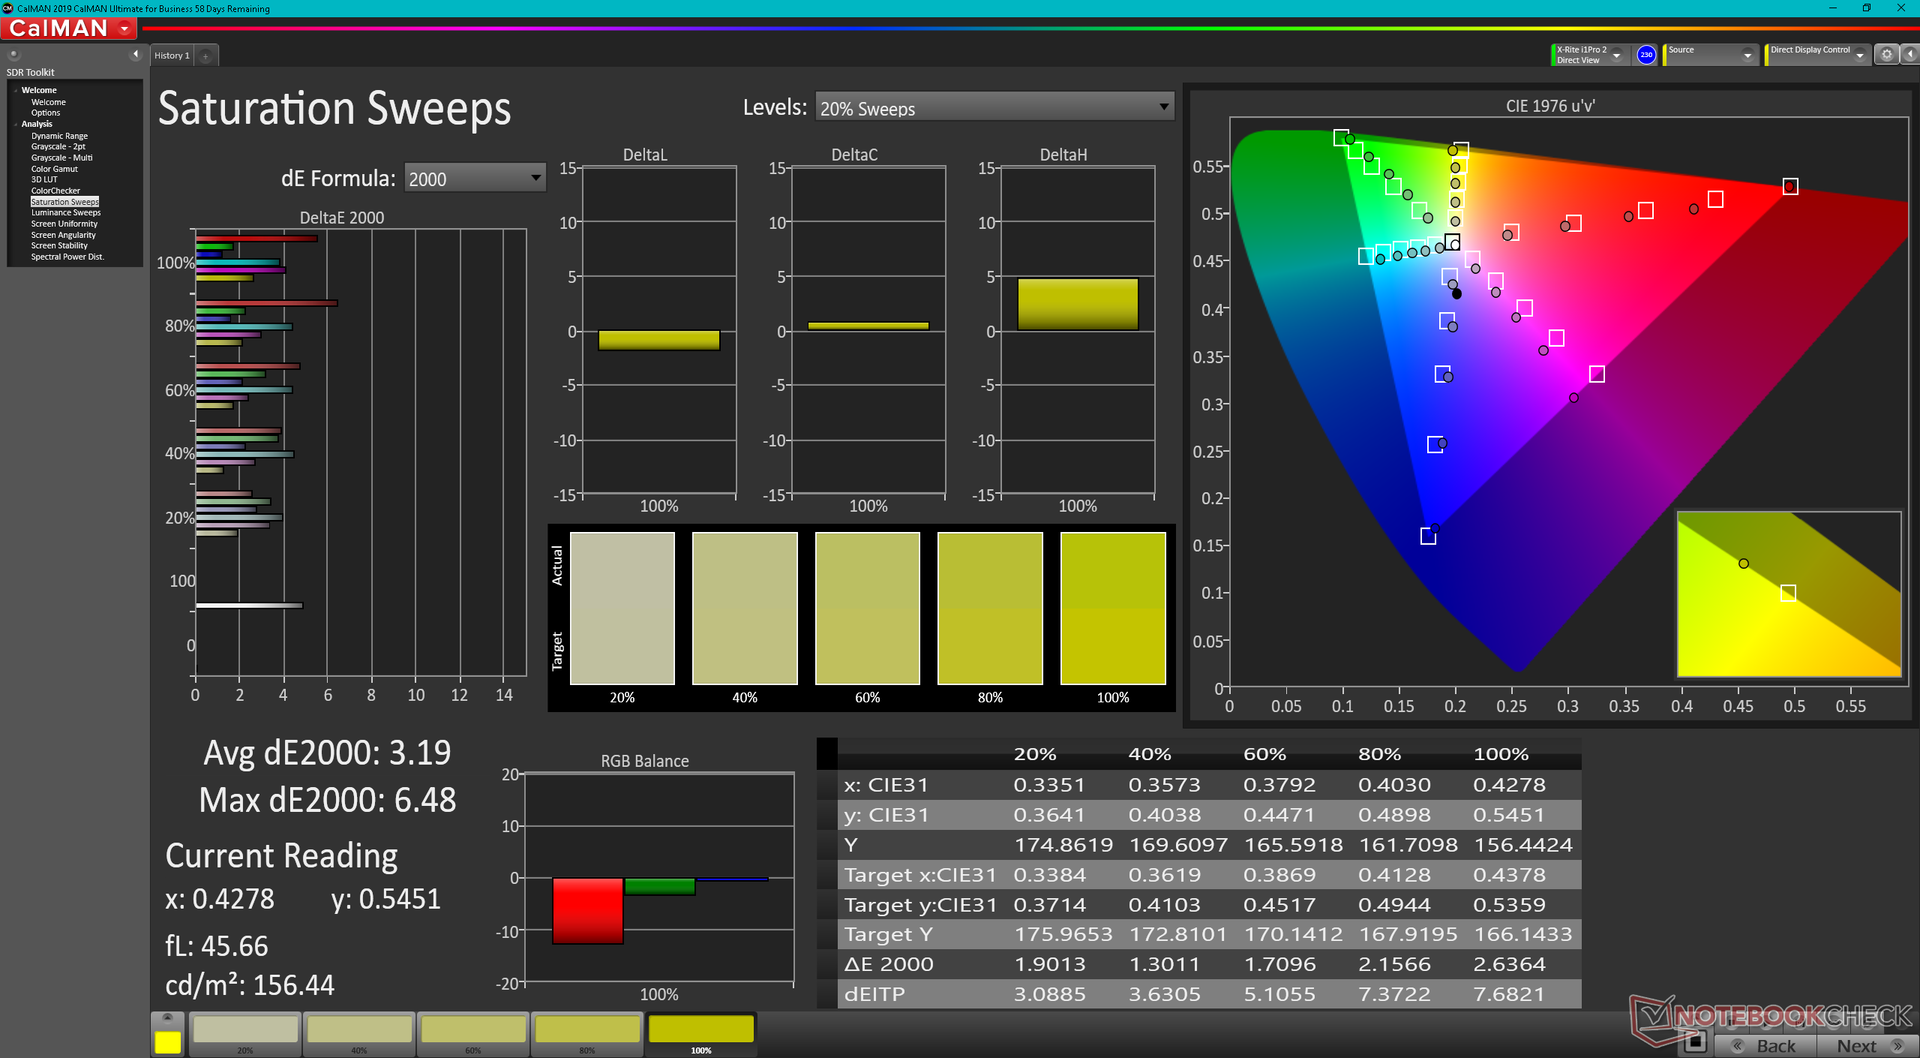
Nossas medidas independentes abaixo refletem apenas a opção ousada acima. Se as cores precisas são importantes para suas cargas de trabalho, então recomendamos fortemente evitar a opção base de 250-nit, pois sua reprodução de cores é tão pobre quanto muitos laptops econômicos de consumo. Os proprietários devem se familiarizar com o software Dell PremierColor para ajustar o perfil de cor da tela
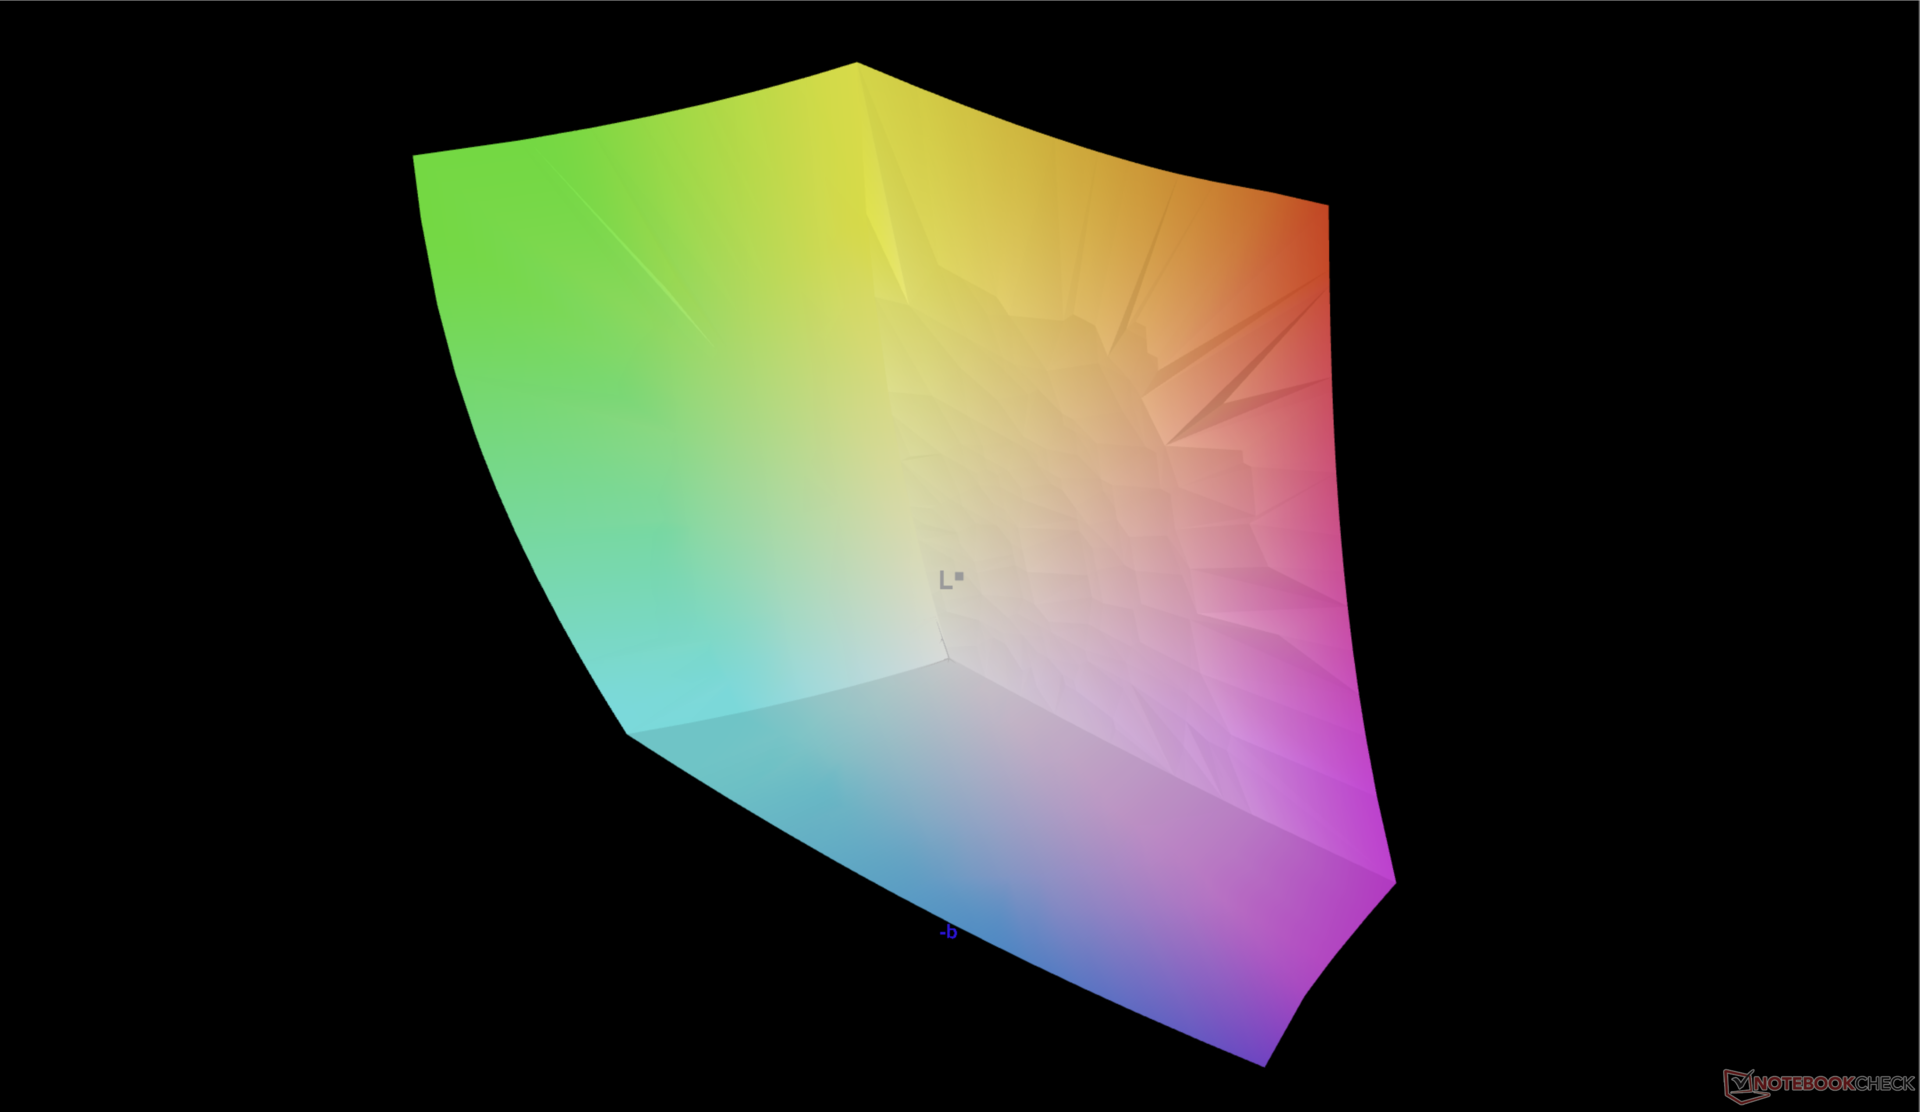
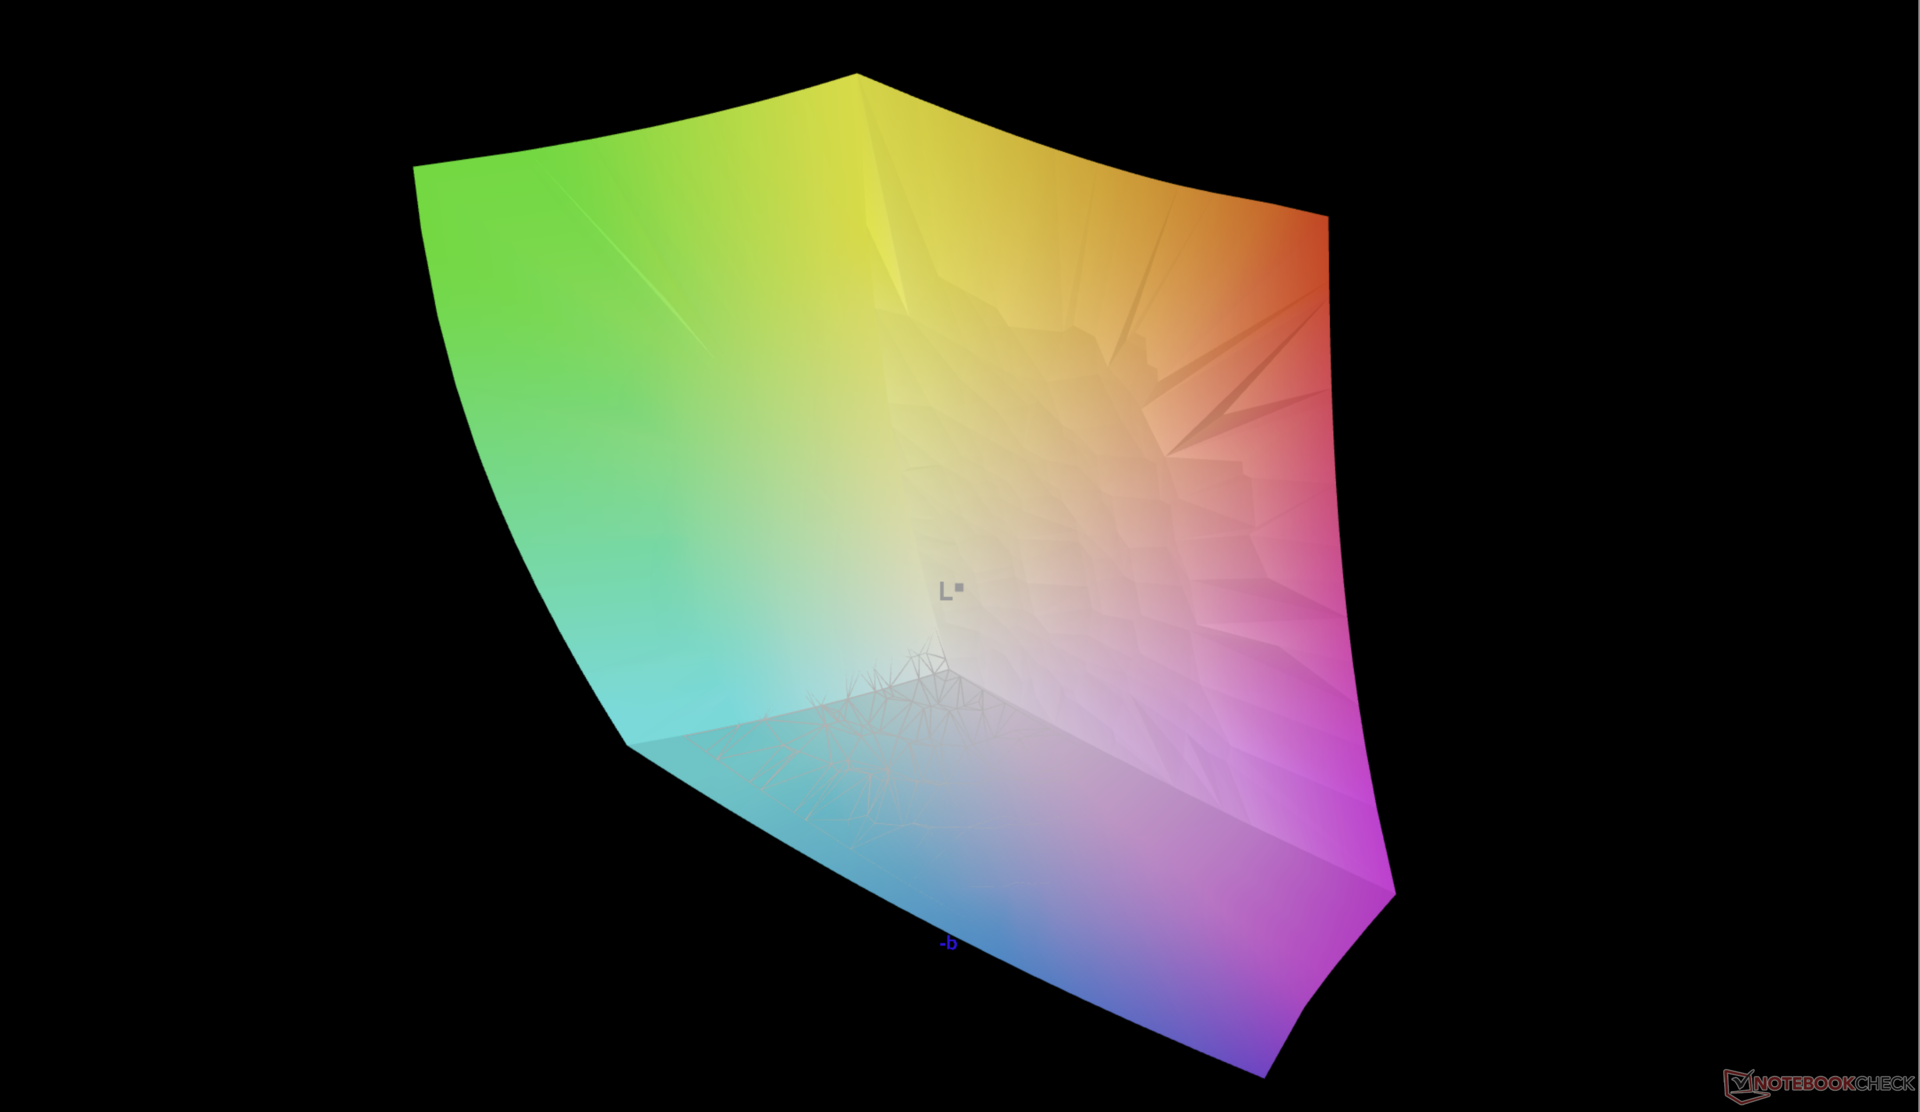
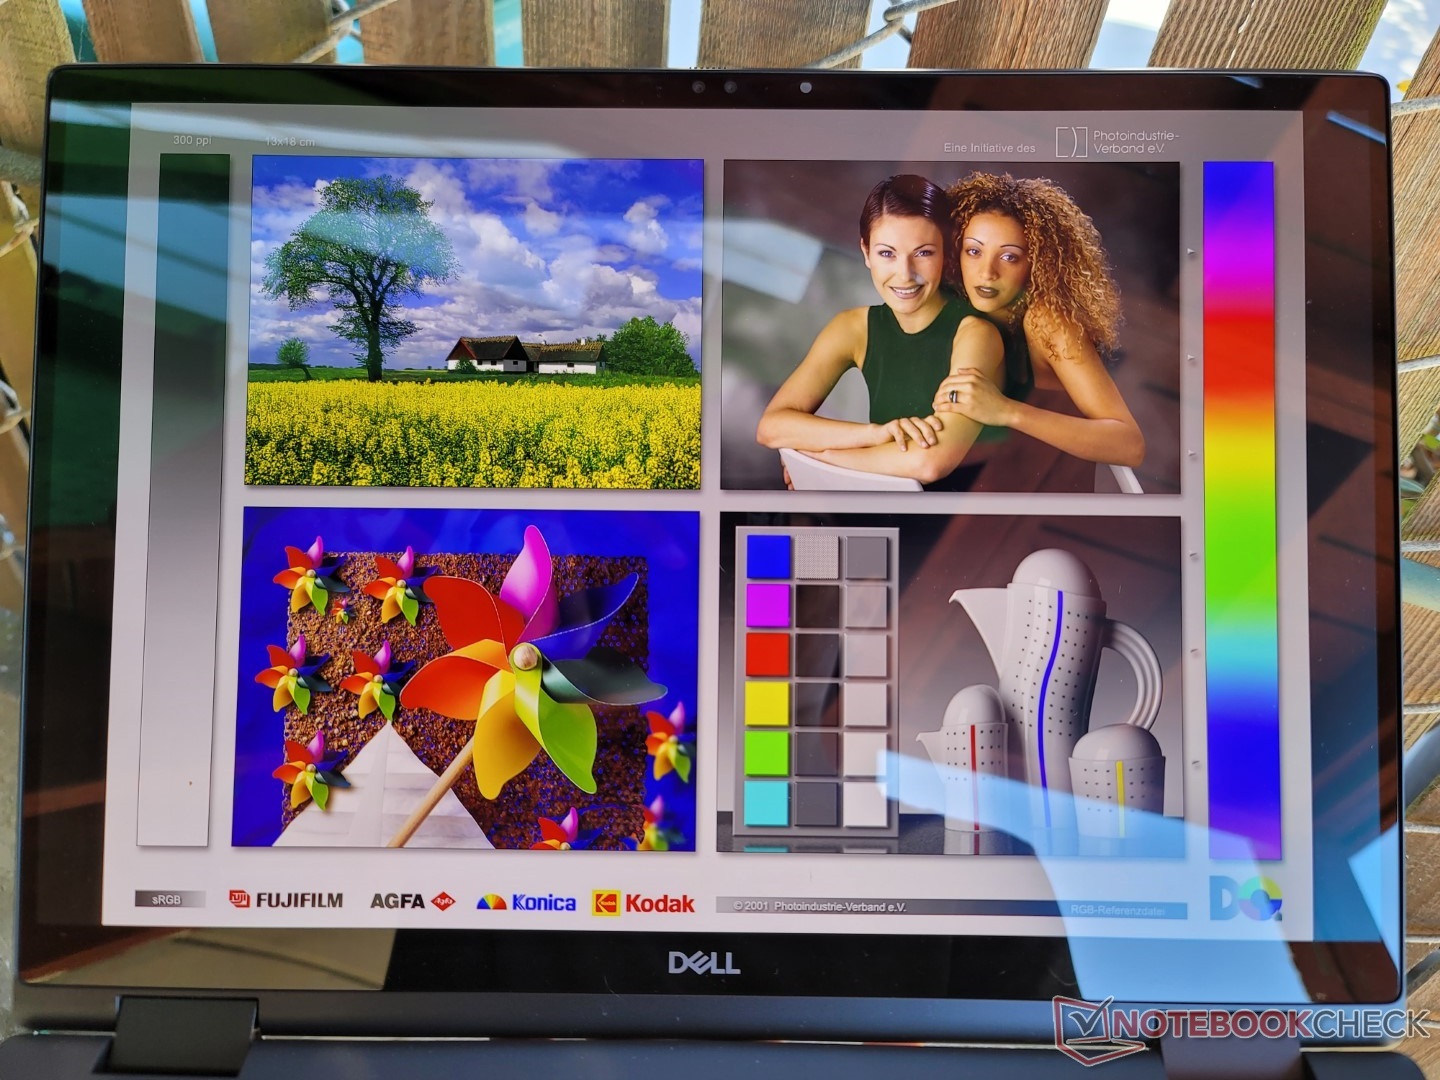
Embora possamos confirmar a cobertura total DCI-P3 do painel OLED com nosso próprio colorímetro X-Rite, o brilho máximo da tela é de apenas cerca de 340 lêndeas em comparação com as 400 lêndeas anunciadas, mesmo depois de desativar o controle automático de brilho. Isto torna nossa tela mais fraca do que na maioria das outras estações de trabalho onde um brilho de 450 lêndeas ou maior é comum.
| |||||||||||||||||||||||||
iluminação: 98 %
iluminação com acumulador: 340.1 cd/m²
Contraste: ∞:1 (Preto: 0 cd/m²)
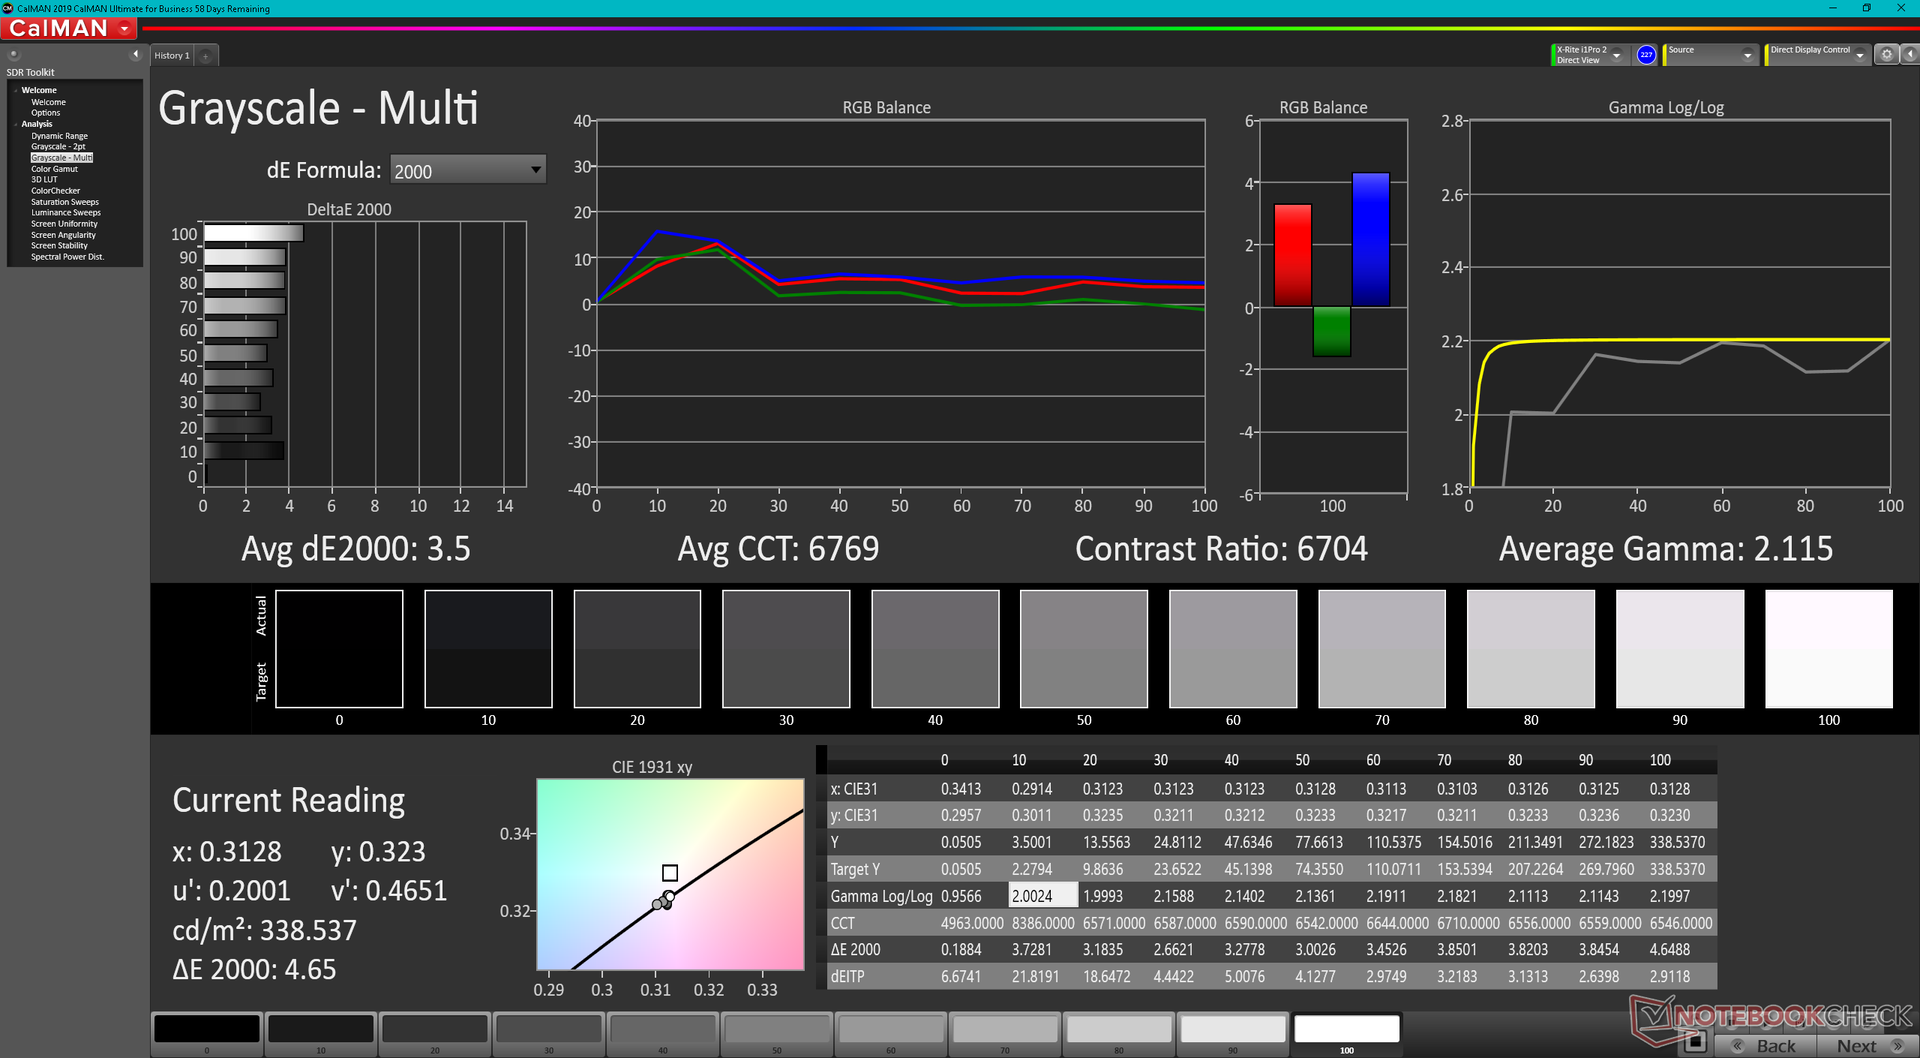
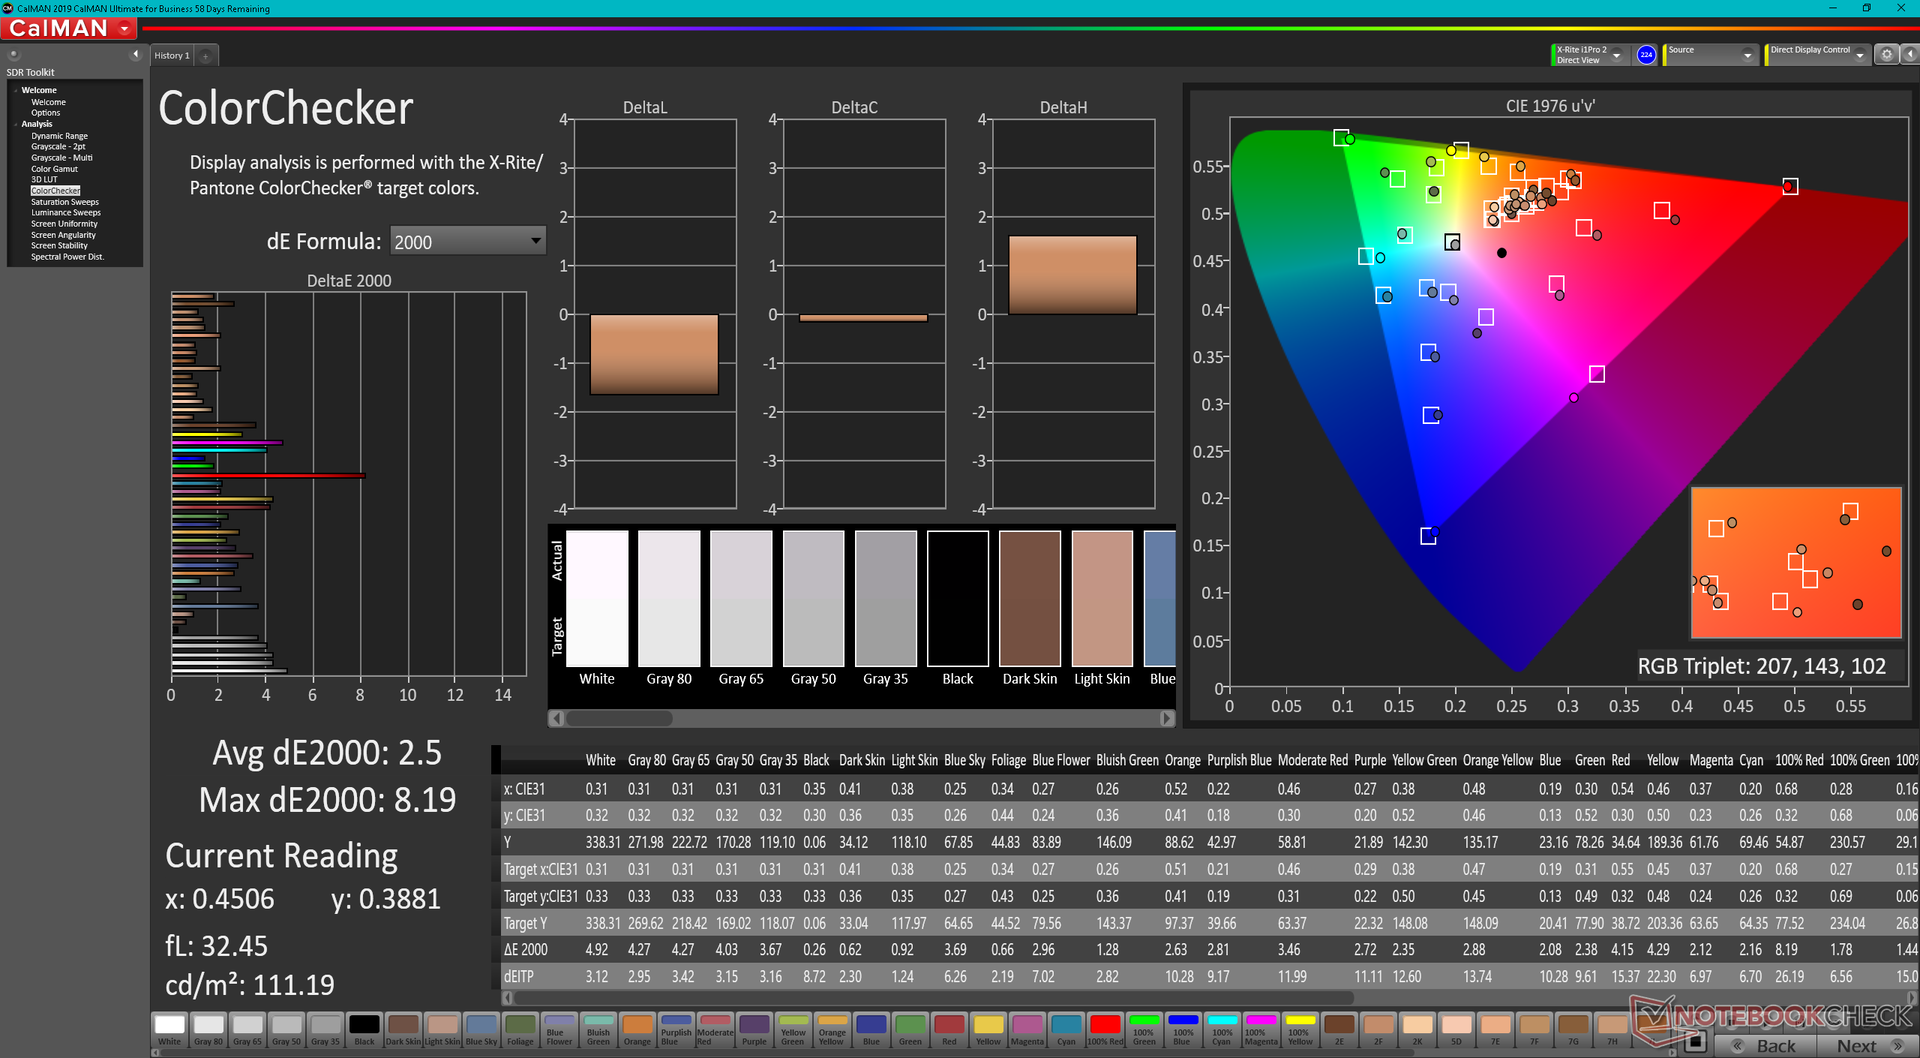
ΔE ColorChecker Calman: 2.5 | ∀{0.5-29.43 Ø4.71}
ΔE Greyscale Calman: 3.5 | ∀{0.09-98 Ø4.96}
97.5% AdobeRGB 1998 (Argyll 3D)
100% sRGB (Argyll 3D)
99.9% Display P3 (Argyll 3D)
Gamma: 2.12
CCT: 6704 K
| Dell Precision 7670 Samsung 160YV03, OLED, 3840x2400, 16" | Lenovo ThinkPad P1 G4-20Y4Z9DVUS NE160QDM-N63, IPS, 2560x1600, 16" | Asus ProArt StudioBook 16 W7600H5A-2BL2 ATNA60YV02-0, OLED, 3840x2400, 16" | Dell Precision 5000 5560 Sharp LQ156R1, IPS, 3840x2400, 15.6" | Dell Precision 7550 AU Optronics B156ZAN, IPS, 3840x2160, 15.6" | HP ZBook Fury 15 G8 BOE0969, IPS, 3840x2160, 15.6" | |
|---|---|---|---|---|---|---|
| Display | -17% | 0% | -1% | -6% | -5% | |
| Display P3 Coverage (%) | 99.9 | 72.7 -27% | 99.9 0% | 94.9 -5% | 82.1 -18% | 95.9 -4% |
| sRGB Coverage (%) | 100 | 99.3 -1% | 100 0% | 100 0% | 99.6 0% | 100 0% |
| AdobeRGB 1998 Coverage (%) | 97.5 | 74.7 -23% | 98.6 1% | 100 3% | 96.8 -1% | 87.3 -10% |
| Response Times | -1494% | -3% | -1902% | -2098% | -565% | |
| Response Time Grey 50% / Grey 80% * (ms) | 1.9 ? | 40.8 -2047% | 2 ? -5% | 47.2 ? -2384% | 51.2 ? -2595% | 14.8 ? -679% |
| Response Time Black / White * (ms) | 2 ? | 20.8 -940% | 2 ? -0% | 30.4 ? -1420% | 34 ? -1600% | 11 ? -450% |
| PWM Frequency (Hz) | 59.5 ? | 240 ? | ||||
| Screen | 7% | 18% | -4% | -16% | -10% | |
| Brightness middle (cd/m²) | 340.1 | 441 30% | 353 4% | 501.5 47% | 473.5 39% | 626 84% |
| Brightness (cd/m²) | 342 | 420 23% | 360 5% | 467 37% | 461 35% | 589 72% |
| Brightness Distribution (%) | 98 | 90 -8% | 96 -2% | 83 -15% | 90 -8% | 87 -11% |
| Black Level * (cd/m²) | 0.27 | 0.44 | 0.55 | 0.58 | ||
| Colorchecker dE 2000 * | 2.5 | 2.6 -4% | 2.45 2% | 4.73 -89% | 4.8 -92% | 5.41 -116% |
| Colorchecker dE 2000 max. * | 8.19 | 6 27% | 3.75 54% | 8.45 -3% | 8.73 -7% | 9.05 -11% |
| Greyscale dE 2000 * | 3.5 | 4.5 -29% | 1.88 46% | 3.6 -3% | 5.6 -60% | 6.2 -77% |
| Gamma | 2.12 104% | 2.18 101% | 2.31 95% | 2.08 106% | 2.34 94% | 2.66 83% |
| CCT | 6704 97% | 6623 98% | 6441 101% | 6447 101% | 7549 86% | 6101 107% |
| Contrast (:1) | 1633 | 1140 | 861 | 1079 | ||
| Colorchecker dE 2000 calibrated * | 1.2 | 2.77 | 0.51 | 3.08 | 0.6 | |
| Color Space (Percent of AdobeRGB 1998) (%) | 86.4 | |||||
| Color Space (Percent of sRGB) (%) | 99.7 | |||||
| Média Total (Programa/Configurações) | -501% /
-273% | 5% /
10% | -636% /
-348% | -707% /
-392% | -193% /
-109% |
* ... menor é melhor
Em nenhum dos anúncios ou materiais da Dell eles mencionam um display pré-calibrado na fábrica. A escala de cinza e as cores ainda são razoavelmente precisas em nosso painel OLED, porém com valores médios de deltaE de apenas 3,5 e 2,5, respectivamente.
Exibir tempos de resposta
| ↔ Tempo de resposta preto para branco | ||
|---|---|---|
| 2 ms ... ascensão ↗ e queda ↘ combinadas | ↗ 0.8 ms ascensão | 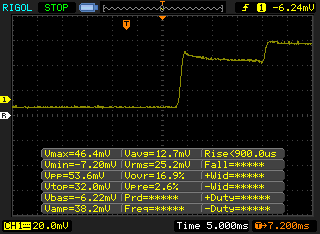 |
| ↘ 1.2 ms queda | ||
| A tela mostra taxas de resposta muito rápidas em nossos testes e deve ser muito adequada para jogos em ritmo acelerado. Em comparação, todos os dispositivos testados variam de 0.1 (mínimo) a 240 (máximo) ms. » 11 % de todos os dispositivos são melhores. Isso significa que o tempo de resposta medido é melhor que a média de todos os dispositivos testados (19.8 ms). | ||
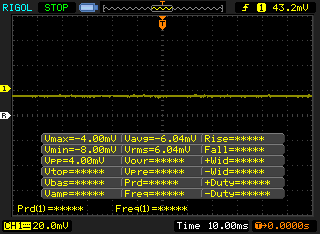
| ↔ Tempo de resposta 50% cinza a 80% cinza | ||
| 1.9 ms ... ascensão ↗ e queda ↘ combinadas | ↗ 1.1 ms ascensão | 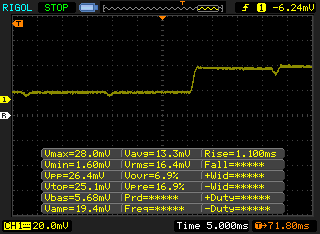 |
| ↘ 0.8 ms queda | ||
| A tela mostra taxas de resposta muito rápidas em nossos testes e deve ser muito adequada para jogos em ritmo acelerado. Em comparação, todos os dispositivos testados variam de 0.165 (mínimo) a 636 (máximo) ms. » 9 % de todos os dispositivos são melhores. Isso significa que o tempo de resposta medido é melhor que a média de todos os dispositivos testados (31 ms). | ||
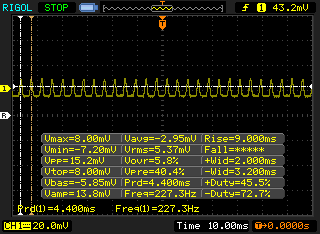
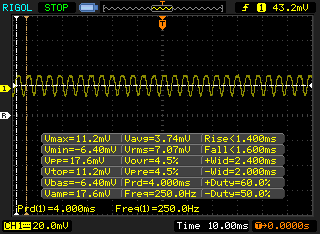
Cintilação da tela / PWM (modulação por largura de pulso)
| Tela tremeluzindo/PWM detectado | 59.5 Hz | ≤ 100 % configuração de brilho | 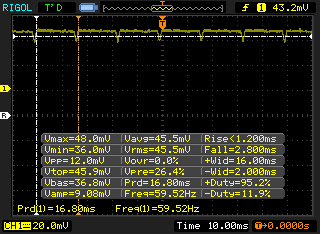 |
A luz de fundo da tela pisca em 59.5 Hz (pior caso, por exemplo, utilizando PWM) Cintilação detectada em uma configuração de brilho de 100 % e abaixo. Não deve haver cintilação ou PWM acima desta configuração de brilho. A frequência de 59.5 Hz é muito baixa, portanto a oscilação pode causar fadiga ocular e dores de cabeça após uso prolongado. [pwm_comparison] Em comparação: 52 % de todos os dispositivos testados não usam PWM para escurecer a tela. Se PWM foi detectado, uma média de 7757 (mínimo: 5 - máximo: 343500) Hz foi medida. | |||
A cintilação está presente em todos os níveis de luminosidade, como na maioria dos outros painéis OLED. Somos capazes de detectar uma freqüência de 250 Hz de 1 a 56% de luminosidade e 59,5 Hz de 57% de luminosidade ao máximo.

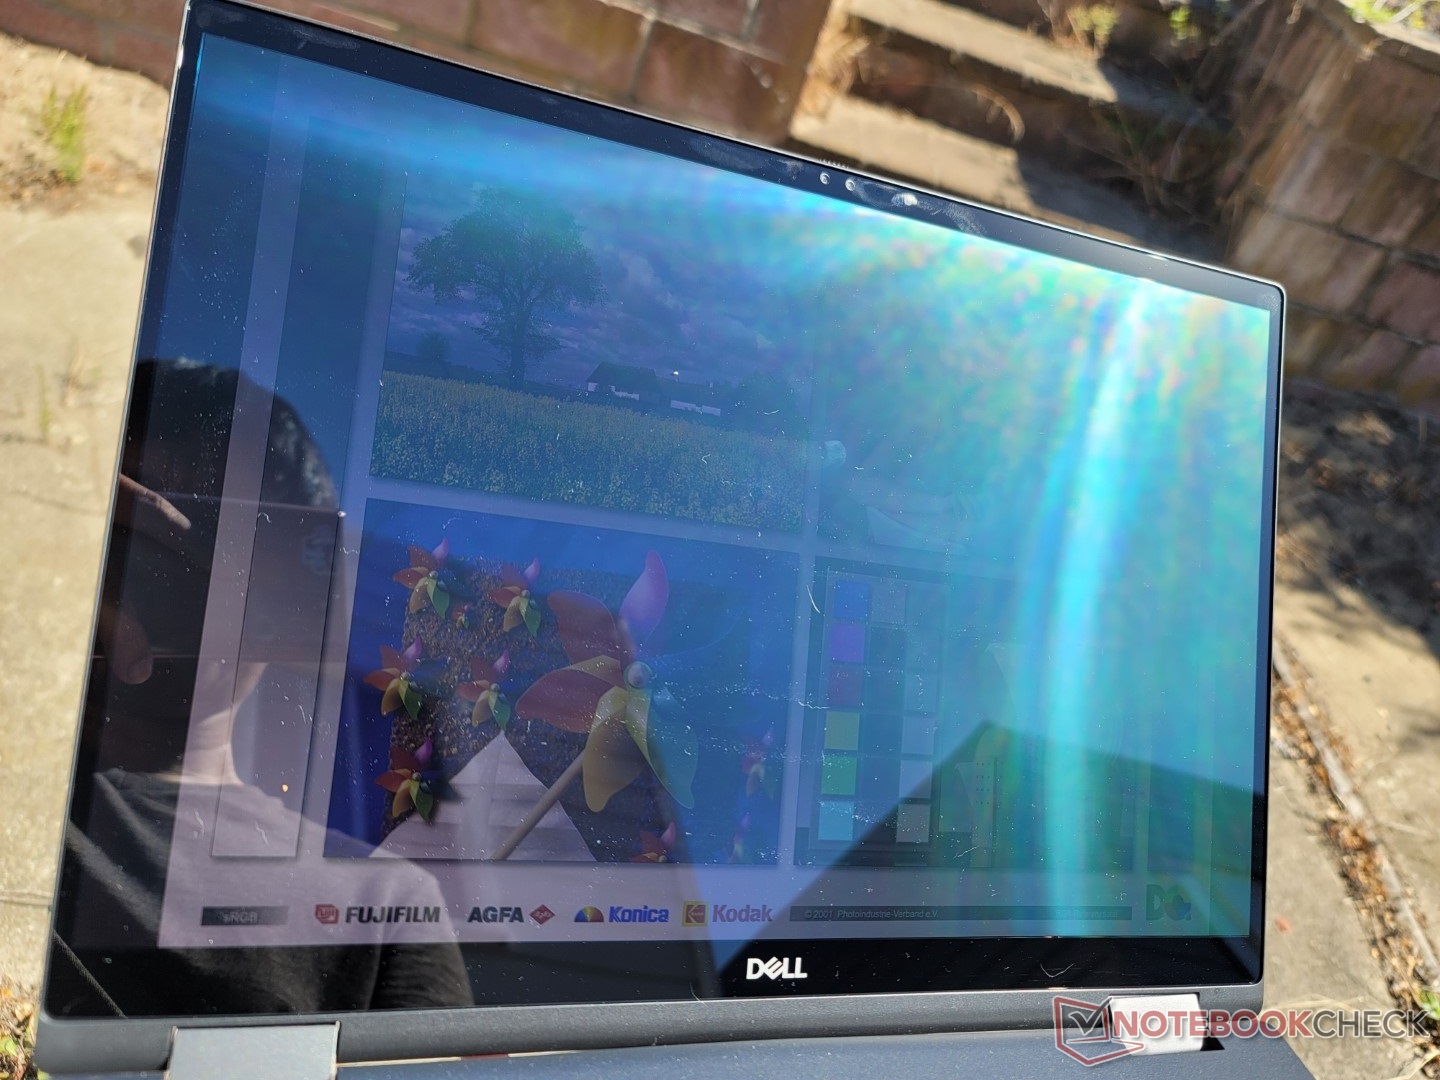
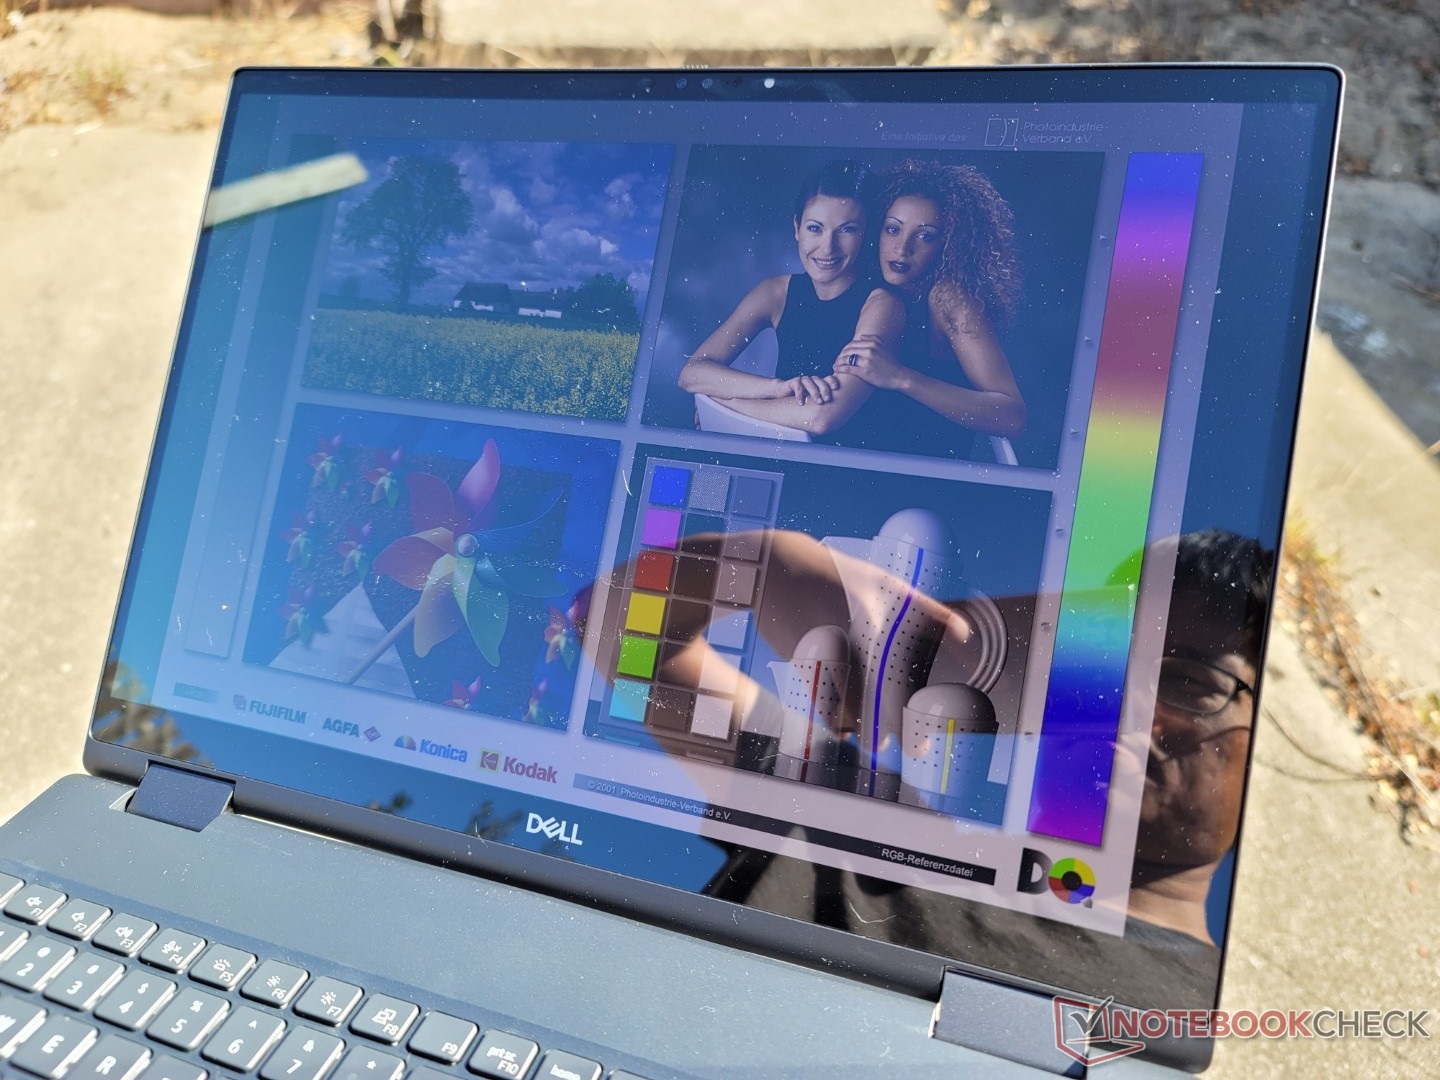
Há um forte ofuscamento, apesar de ser tecnicamente um visor "anti-ofuscante". A retroiluminação não é suficientemente brilhante para uma visualização confortável na maioria dos cenários ao ar livre, a menos que você esteja sob sombra. Se a visibilidade externa for importante, então recomendamos verificar oHP ZBook Fury 15 G8 que tem um display que é quase duas vezes mais brilhante que nossa unidade Precision.
Desempenho - Intel vPro para todos
Condições de teste
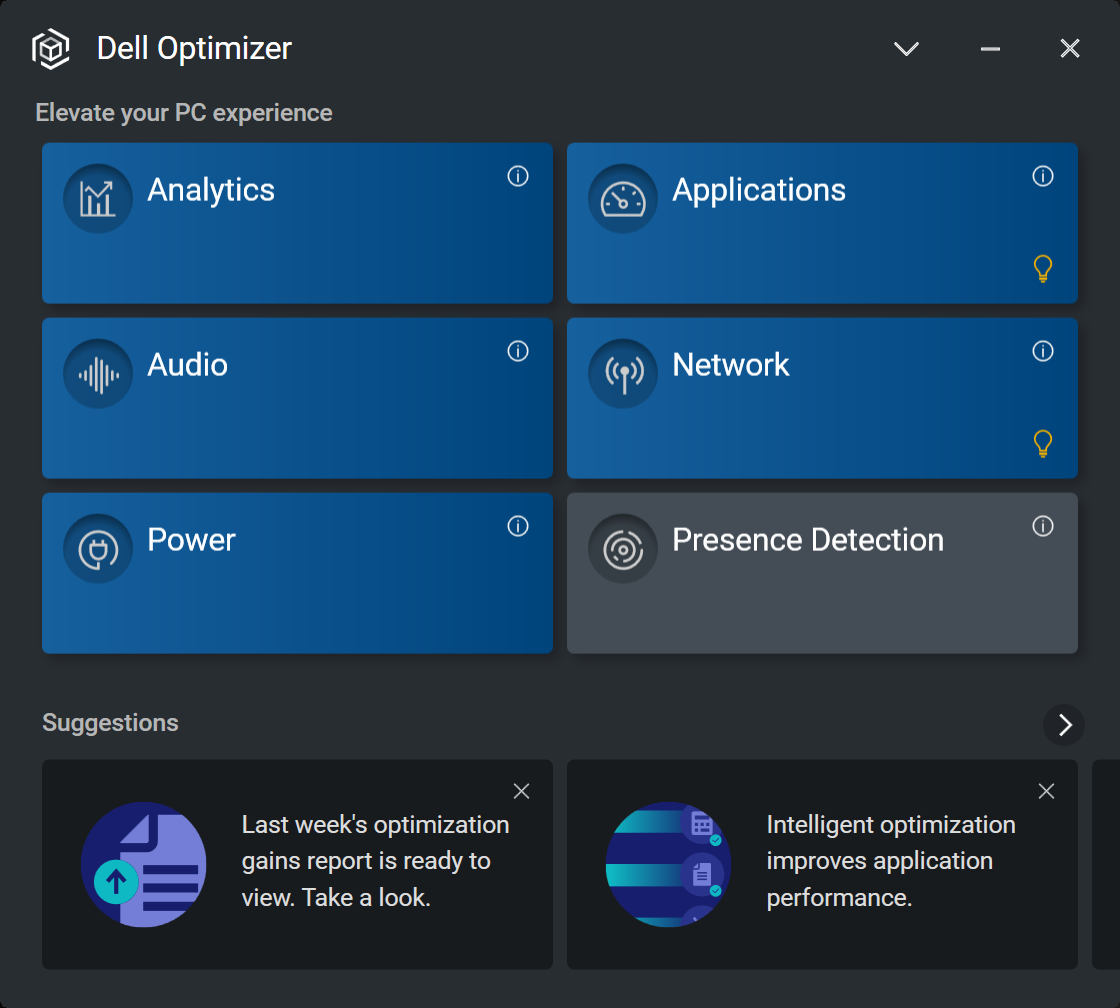
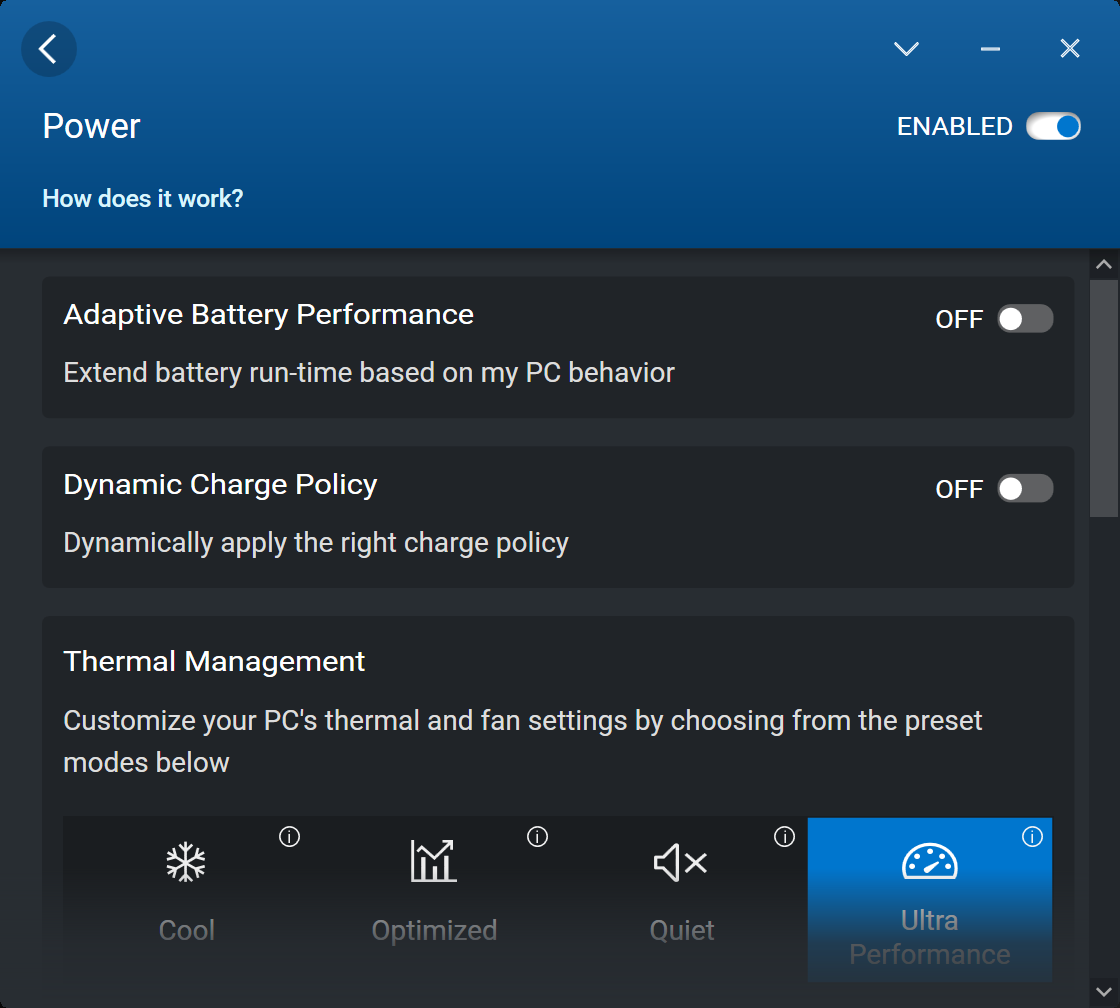
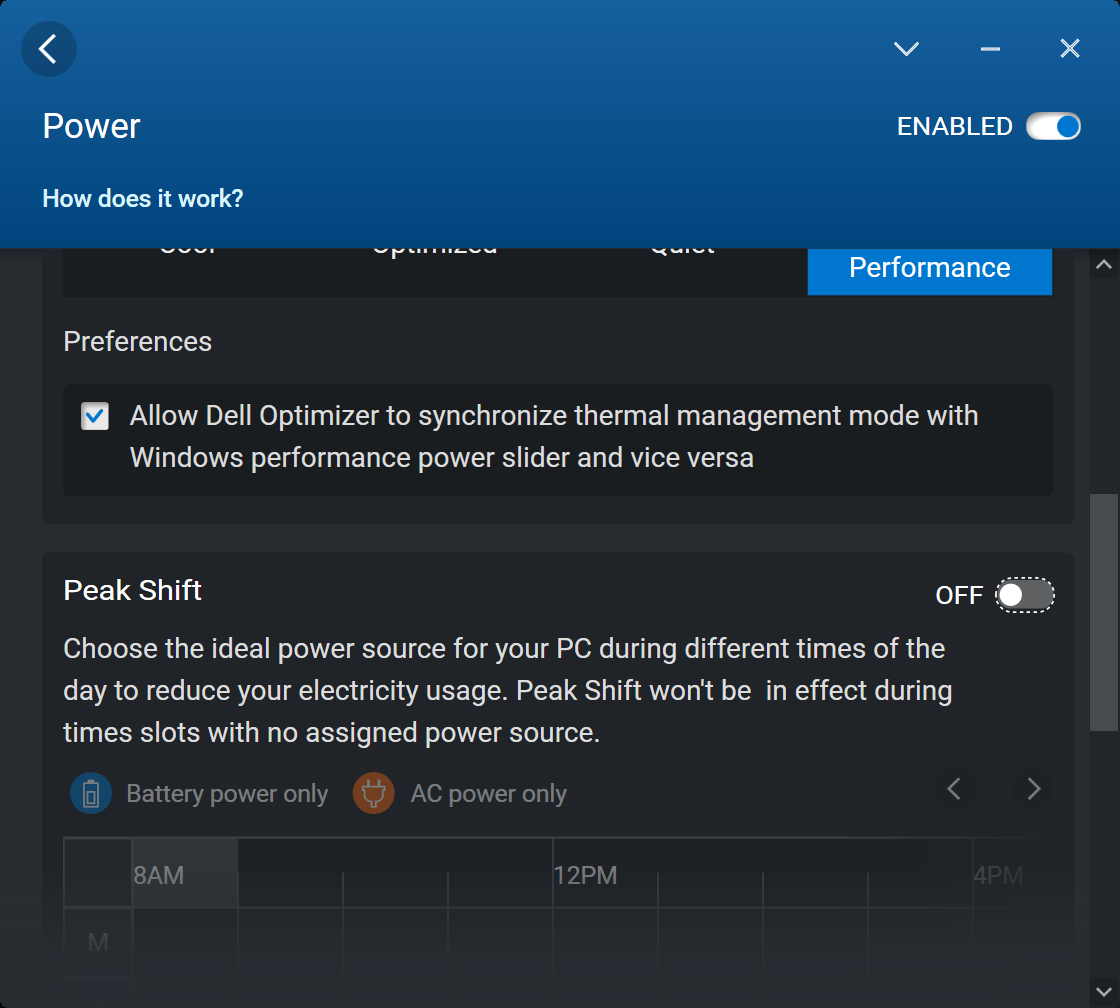
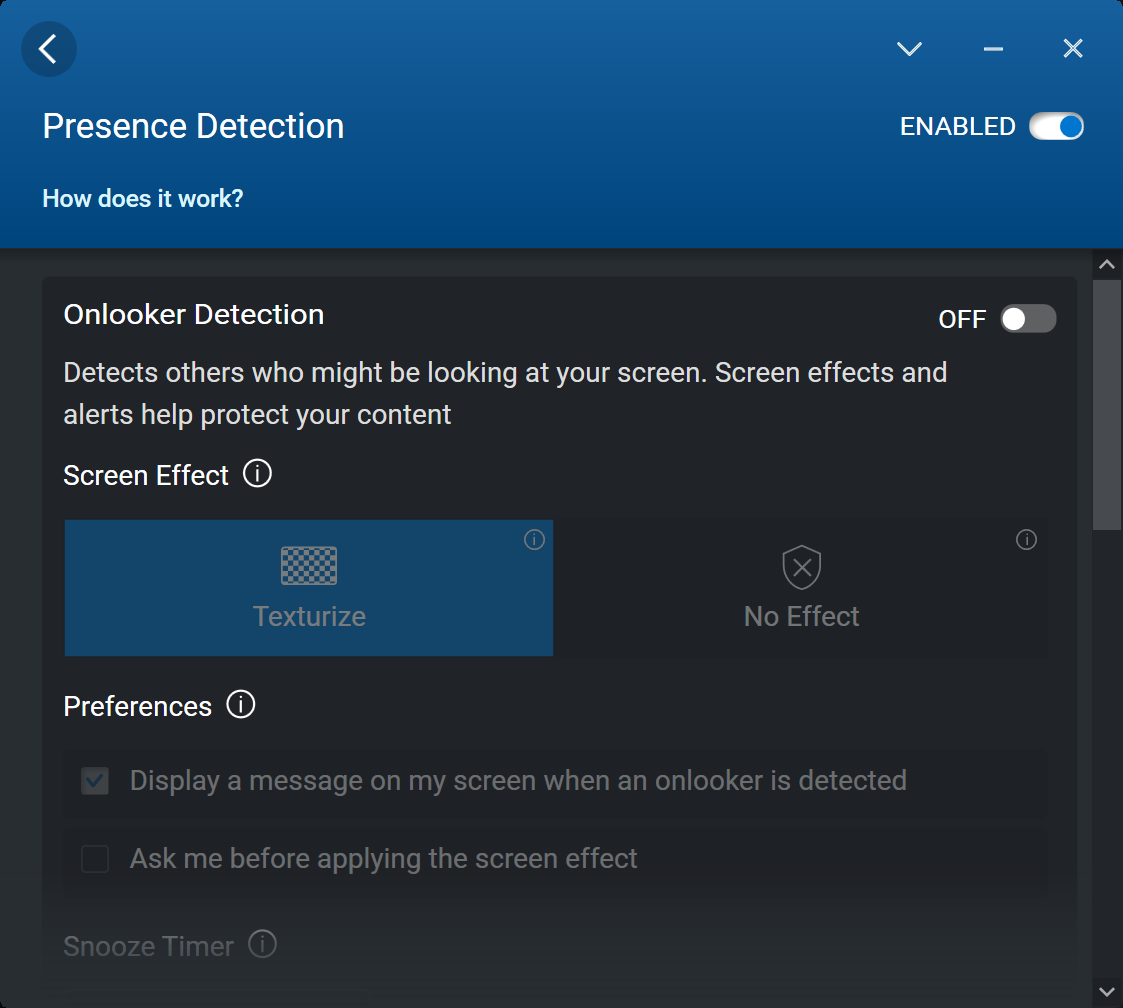
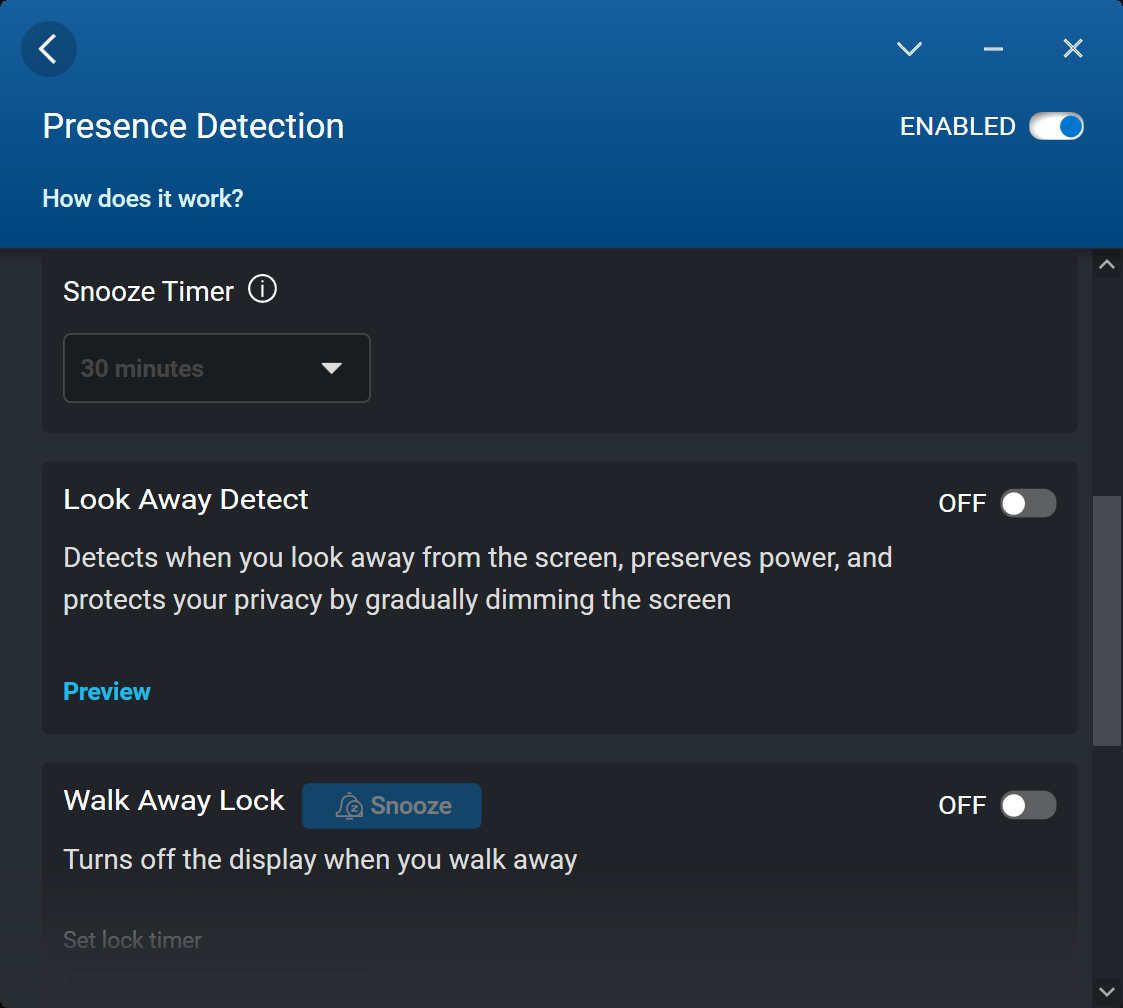
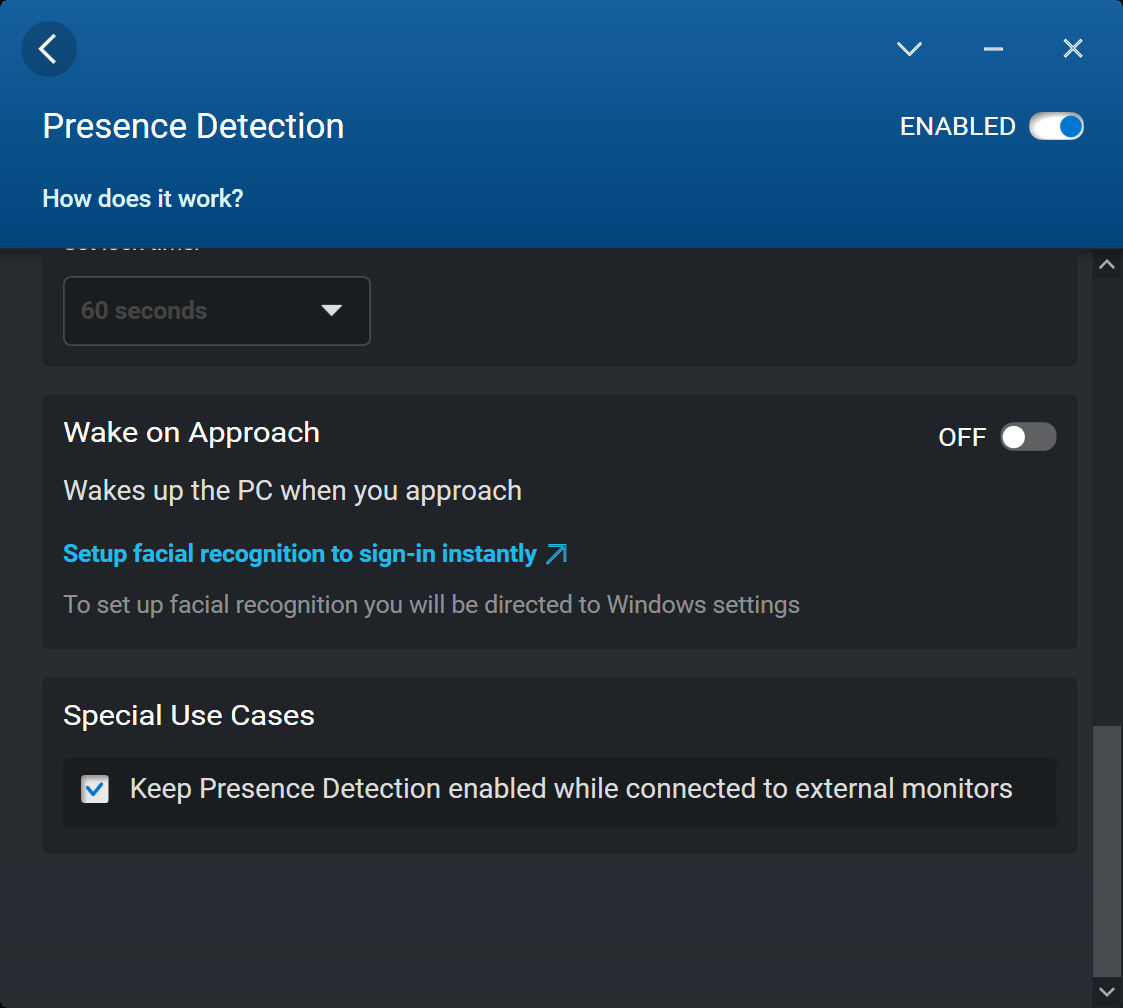
Ajustamos nossa unidade para o modo Ultra Performance através do software Dell Optimizer e a GPU para o modo discreto através do Painel de Controle Nvidia antes de executar quaisquer benchmarks abaixo. Curiosamente, o perfil de potência pode ser ajustado através do Windows, Dell Optimizer ou Dell Power Manager, o que pode tornar as coisas muito confusas. Recomendamos habilitar a sincronização do perfil de potência entre as três diferentes aplicações através do Optimizer, como mostra a captura de tela abaixo.
Processador
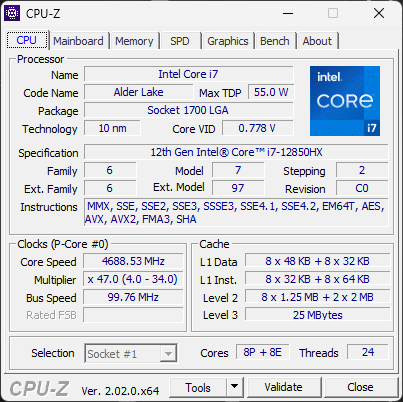
No papel, o Núcleo i7-12850HX compartilha taxas de relógio, contagem do núcleo e tamanhos de cache similares aos do i7-12800HX mas com suporte adicional de vPro. Na realidade, no entanto, seus desempenhos podem variar significativamente
O desempenho da CPU está mais próximo do Núcleo i7-12800H do que para o Core i7-12800HX. De fato, o desempenho multi-linhas é cerca de 30% mais lento do que o da i7-12800HX, conforme encontrado no MSI GE67 HXdevido a sua solução de resfriamento mais capaz. Mesmo assim, o desempenho ainda é um dos mais rápidos quando comparado com outras estações de trabalho, pois muitas ainda estão funcionando em CPUs Intel do 11º gênero.
A sustentabilidade do Turbo Boost poderia ter sido melhor. Ao executar o CineBench R15 xT em um loop, o desempenho cairia até 25% após duas ou três repetições, o que ajudaria a explicar o amplo déficit de desempenho contra o Core i7-12800HX mencionado acima.
Cinebench R15 Multi Loop
Cinebench R23: Multi Core | Single Core
Cinebench R15: CPU Multi 64Bit | CPU Single 64Bit
Blender: v2.79 BMW27 CPU
7-Zip 18.03: 7z b 4 | 7z b 4 -mmt1
Geekbench 5.5: Multi-Core | Single-Core
HWBOT x265 Benchmark v2.2: 4k Preset
LibreOffice : 20 Documents To PDF
R Benchmark 2.5: Overall mean
| Cinebench R20 / CPU (Multi Core) | |
| MSI GE67 HX 12UGS | |
| Média Intel Core i7-12850HX (6217 - 6764, n=2) | |
| Dell Precision 7670 | |
| Razer Blade 17 RTX 3080 Ti | |
| Lenovo Legion 7 16ARHA7 | |
| HP Envy 16 h0112nr | |
| Asus Zenbook Pro 15 OLED UM535Q | |
| Lenovo ThinkPad P1 G4-20Y4Z9DVUS | |
| HP ZBook Fury 15 G8 | |
| Dell Precision 5000 5470 | |
| Asus ProArt StudioBook 16 W7600H5A-2BL2 | |
| Dell Precision 7550 | |
| Dell Precision 5000 5560 | |
| Cinebench R20 / CPU (Single Core) | |
| Razer Blade 17 RTX 3080 Ti | |
| Média Intel Core i7-12850HX (687 - 708, n=2) | |
| Dell Precision 7670 | |
| Dell Precision 5000 5470 | |
| HP Envy 16 h0112nr | |
| MSI GE67 HX 12UGS | |
| HP ZBook Fury 15 G8 | |
| Lenovo Legion 7 16ARHA7 | |
| Lenovo ThinkPad P1 G4-20Y4Z9DVUS | |
| Dell Precision 5000 5560 | |
| Asus Zenbook Pro 15 OLED UM535Q | |
| Asus ProArt StudioBook 16 W7600H5A-2BL2 | |
| Dell Precision 7550 | |
| Cinebench R23 / Multi Core | |
| MSI GE67 HX 12UGS | |
| Média Intel Core i7-12850HX (15093 - 17510, n=2) | |
| Razer Blade 17 RTX 3080 Ti | |
| Dell Precision 7670 | |
| Lenovo Legion 7 16ARHA7 | |
| HP Envy 16 h0112nr | |
| Dell Precision 5000 5470 | |
| Asus Zenbook Pro 15 OLED UM535Q | |
| Lenovo ThinkPad P1 G4-20Y4Z9DVUS | |
| HP ZBook Fury 15 G8 | |
| Asus ProArt StudioBook 16 W7600H5A-2BL2 | |
| Dell Precision 5000 5560 | |
| Cinebench R23 / Single Core | |
| Razer Blade 17 RTX 3080 Ti | |
| MSI GE67 HX 12UGS | |
| Dell Precision 5000 5470 | |
| HP Envy 16 h0112nr | |
| Média Intel Core i7-12850HX (1596 - 1845, n=2) | |
| HP ZBook Fury 15 G8 | |
| Dell Precision 7670 | |
| Lenovo Legion 7 16ARHA7 | |
| Dell Precision 5000 5560 | |
| Lenovo ThinkPad P1 G4-20Y4Z9DVUS | |
| Asus ProArt StudioBook 16 W7600H5A-2BL2 | |
| Asus Zenbook Pro 15 OLED UM535Q | |
| Cinebench R15 / CPU Multi 64Bit | |
| MSI GE67 HX 12UGS | |
| Média Intel Core i7-12850HX (2432 - 2926, n=2) | |
| HP Envy 16 h0112nr | |
| Dell Precision 7670 | |
| Lenovo Legion 7 16ARHA7 | |
| Dell Precision 5000 5470 | |
| Razer Blade 17 RTX 3080 Ti | |
| Asus Zenbook Pro 15 OLED UM535Q | |
| Lenovo ThinkPad P1 G4-20Y4Z9DVUS | |
| Asus ProArt StudioBook 16 W7600H5A-2BL2 | |
| HP ZBook Fury 15 G8 | |
| Dell Precision 7550 | |
| Dell Precision 5000 5560 | |
| Cinebench R15 / CPU Single 64Bit | |
| Razer Blade 17 RTX 3080 Ti | |
| Média Intel Core i7-12850HX (253 - 268, n=2) | |
| MSI GE67 HX 12UGS | |
| HP Envy 16 h0112nr | |
| Dell Precision 7670 | |
| Lenovo Legion 7 16ARHA7 | |
| Dell Precision 5000 5470 | |
| HP ZBook Fury 15 G8 | |
| Asus Zenbook Pro 15 OLED UM535Q | |
| Dell Precision 5000 5560 | |
| Lenovo ThinkPad P1 G4-20Y4Z9DVUS | |
| Asus ProArt StudioBook 16 W7600H5A-2BL2 | |
| Dell Precision 7550 | |
| Blender / v2.79 BMW27 CPU | |
| Dell Precision 5000 5560 | |
| Dell Precision 7550 | |
| Asus ProArt StudioBook 16 W7600H5A-2BL2 | |
| HP ZBook Fury 15 G8 | |
| Lenovo ThinkPad P1 G4-20Y4Z9DVUS | |
| HP Envy 16 h0112nr | |
| Dell Precision 5000 5470 | |
| Asus Zenbook Pro 15 OLED UM535Q | |
| Razer Blade 17 RTX 3080 Ti | |
| Lenovo Legion 7 16ARHA7 | |
| Dell Precision 7670 | |
| Média Intel Core i7-12850HX (181 - 205, n=2) | |
| MSI GE67 HX 12UGS | |
| 7-Zip 18.03 / 7z b 4 | |
| MSI GE67 HX 12UGS | |
| Lenovo Legion 7 16ARHA7 | |
| Razer Blade 17 RTX 3080 Ti | |
| Média Intel Core i7-12850HX (53893 - 69464, n=2) | |
| Asus Zenbook Pro 15 OLED UM535Q | |
| HP Envy 16 h0112nr | |
| Dell Precision 7670 | |
| Dell Precision 5000 5470 | |
| Lenovo ThinkPad P1 G4-20Y4Z9DVUS | |
| HP ZBook Fury 15 G8 | |
| Dell Precision 7550 | |
| Asus ProArt StudioBook 16 W7600H5A-2BL2 | |
| Dell Precision 5000 5560 | |
| 7-Zip 18.03 / 7z b 4 -mmt1 | |
| Razer Blade 17 RTX 3080 Ti | |
| Média Intel Core i7-12850HX (5608 - 5916, n=2) | |
| HP ZBook Fury 15 G8 | |
| Dell Precision 5000 5560 | |
| HP Envy 16 h0112nr | |
| Lenovo Legion 7 16ARHA7 | |
| MSI GE67 HX 12UGS | |
| Dell Precision 7670 | |
| Lenovo ThinkPad P1 G4-20Y4Z9DVUS | |
| Asus Zenbook Pro 15 OLED UM535Q | |
| Dell Precision 5000 5470 | |
| Dell Precision 7550 | |
| Asus ProArt StudioBook 16 W7600H5A-2BL2 | |
| Geekbench 5.5 / Multi-Core | |
| MSI GE67 HX 12UGS | |
| Razer Blade 17 RTX 3080 Ti | |
| HP Envy 16 h0112nr | |
| Média Intel Core i7-12850HX (11509 - 13095, n=2) | |
| Dell Precision 5000 5470 | |
| Dell Precision 7670 | |
| Lenovo Legion 7 16ARHA7 | |
| Asus Zenbook Pro 15 OLED UM535Q | |
| Dell Precision 7550 | |
| Asus ProArt StudioBook 16 W7600H5A-2BL2 | |
| Lenovo ThinkPad P1 G4-20Y4Z9DVUS | |
| Geekbench 5.5 / Single-Core | |
| Dell Precision 5000 5470 | |
| Média Intel Core i7-12850HX (1777 - 1787, n=2) | |
| Dell Precision 7670 | |
| HP Envy 16 h0112nr | |
| MSI GE67 HX 12UGS | |
| Razer Blade 17 RTX 3080 Ti | |
| Lenovo Legion 7 16ARHA7 | |
| Lenovo ThinkPad P1 G4-20Y4Z9DVUS | |
| Asus Zenbook Pro 15 OLED UM535Q | |
| Asus ProArt StudioBook 16 W7600H5A-2BL2 | |
| Dell Precision 7550 | |
| HWBOT x265 Benchmark v2.2 / 4k Preset | |
| MSI GE67 HX 12UGS | |
| Lenovo Legion 7 16ARHA7 | |
| Dell Precision 7670 | |
| Média Intel Core i7-12850HX (17.2 - 17.3, n=2) | |
| Razer Blade 17 RTX 3080 Ti | |
| Asus Zenbook Pro 15 OLED UM535Q | |
| HP Envy 16 h0112nr | |
| HP ZBook Fury 15 G8 | |
| Lenovo ThinkPad P1 G4-20Y4Z9DVUS | |
| Asus ProArt StudioBook 16 W7600H5A-2BL2 | |
| Dell Precision 5000 5470 | |
| Dell Precision 7550 | |
| Dell Precision 5000 5560 | |
| LibreOffice / 20 Documents To PDF | |
| Lenovo Legion 7 16ARHA7 | |
| HP ZBook Fury 15 G8 | |
| Lenovo ThinkPad P1 G4-20Y4Z9DVUS | |
| Asus Zenbook Pro 15 OLED UM535Q | |
| Dell Precision 7670 | |
| Dell Precision 5000 5560 | |
| Média Intel Core i7-12850HX (46.9 - 48.6, n=2) | |
| Dell Precision 7550 | |
| Razer Blade 17 RTX 3080 Ti | |
| Dell Precision 5000 5470 | |
| HP Envy 16 h0112nr | |
| MSI GE67 HX 12UGS | |
| Asus ProArt StudioBook 16 W7600H5A-2BL2 | |
| R Benchmark 2.5 / Overall mean | |
| Dell Precision 7550 | |
| Asus ProArt StudioBook 16 W7600H5A-2BL2 | |
| Lenovo ThinkPad P1 G4-20Y4Z9DVUS | |
| HP ZBook Fury 15 G8 | |
| Dell Precision 5000 5560 | |
| Asus Zenbook Pro 15 OLED UM535Q | |
| Lenovo Legion 7 16ARHA7 | |
| Dell Precision 5000 5470 | |
| Dell Precision 7670 | |
| Média Intel Core i7-12850HX (0.45 - 0.4698, n=2) | |
| MSI GE67 HX 12UGS | |
| HP Envy 16 h0112nr | |
| Razer Blade 17 RTX 3080 Ti | |
Cinebench R23: Multi Core | Single Core
Cinebench R15: CPU Multi 64Bit | CPU Single 64Bit
Blender: v2.79 BMW27 CPU
7-Zip 18.03: 7z b 4 | 7z b 4 -mmt1
Geekbench 5.5: Multi-Core | Single-Core
HWBOT x265 Benchmark v2.2: 4k Preset
LibreOffice : 20 Documents To PDF
R Benchmark 2.5: Overall mean
* ... menor é melhor
AIDA64: FP32 Ray-Trace | FPU Julia | CPU SHA3 | CPU Queen | FPU SinJulia | FPU Mandel | CPU AES | CPU ZLib | FP64 Ray-Trace | CPU PhotoWorxx
| Performance rating | |
| Média Intel Core i7-12850HX | |
| HP ZBook Fury 15 G8 | |
| Lenovo ThinkPad P1 G4-20Y4Z9DVUS | |
| Dell Precision 7670 | |
| Asus ProArt StudioBook 16 W7600H5A-2BL2 -9! | |
| Dell Precision 5000 5560 -9! | |
| AIDA64 / FP32 Ray-Trace | |
| Lenovo ThinkPad P1 G4-20Y4Z9DVUS | |
| Média Intel Core i7-12850HX (12983 - 16752, n=2) | |
| HP ZBook Fury 15 G8 | |
| Dell Precision 7670 | |
| AIDA64 / FPU Julia | |
| Média Intel Core i7-12850HX (68219 - 87231, n=2) | |
| Dell Precision 7670 | |
| Lenovo ThinkPad P1 G4-20Y4Z9DVUS | |
| HP ZBook Fury 15 G8 | |
| AIDA64 / CPU SHA3 | |
| Lenovo ThinkPad P1 G4-20Y4Z9DVUS | |
| HP ZBook Fury 15 G8 | |
| Média Intel Core i7-12850HX (3098 - 3818, n=2) | |
| Dell Precision 7670 | |
| AIDA64 / CPU Queen | |
| HP ZBook Fury 15 G8 | |
| Lenovo ThinkPad P1 G4-20Y4Z9DVUS | |
| Média Intel Core i7-12850HX (26716 - 95664, n=2) | |
| Dell Precision 7670 | |
| AIDA64 / FPU SinJulia | |
| Média Intel Core i7-12850HX (9869 - 11286, n=2) | |
| HP ZBook Fury 15 G8 | |
| Dell Precision 7670 | |
| Lenovo ThinkPad P1 G4-20Y4Z9DVUS | |
| AIDA64 / FPU Mandel | |
| Média Intel Core i7-12850HX (34218 - 42580, n=2) | |
| Lenovo ThinkPad P1 G4-20Y4Z9DVUS | |
| HP ZBook Fury 15 G8 | |
| Dell Precision 7670 | |
| AIDA64 / CPU AES | |
| Lenovo ThinkPad P1 G4-20Y4Z9DVUS | |
| HP ZBook Fury 15 G8 | |
| Média Intel Core i7-12850HX (63362 - 80775, n=2) | |
| Dell Precision 7670 | |
| AIDA64 / CPU ZLib | |
| Média Intel Core i7-12850HX (817 - 1102, n=2) | |
| Dell Precision 7670 | |
| Lenovo ThinkPad P1 G4-20Y4Z9DVUS | |
| HP ZBook Fury 15 G8 | |
| Asus ProArt StudioBook 16 W7600H5A-2BL2 | |
| Asus ProArt StudioBook 16 W7600H5A-2BL2 | |
| Dell Precision 5000 5560 | |
| AIDA64 / FP64 Ray-Trace | |
| Média Intel Core i7-12850HX (7671 - 9145, n=2) | |
| Lenovo ThinkPad P1 G4-20Y4Z9DVUS | |
| HP ZBook Fury 15 G8 | |
| Dell Precision 7670 | |
| AIDA64 / CPU PhotoWorxx | |
| Dell Precision 7670 | |
| Média Intel Core i7-12850HX (33415 - 42035, n=2) | |
| HP ZBook Fury 15 G8 | |
| Lenovo ThinkPad P1 G4-20Y4Z9DVUS | |
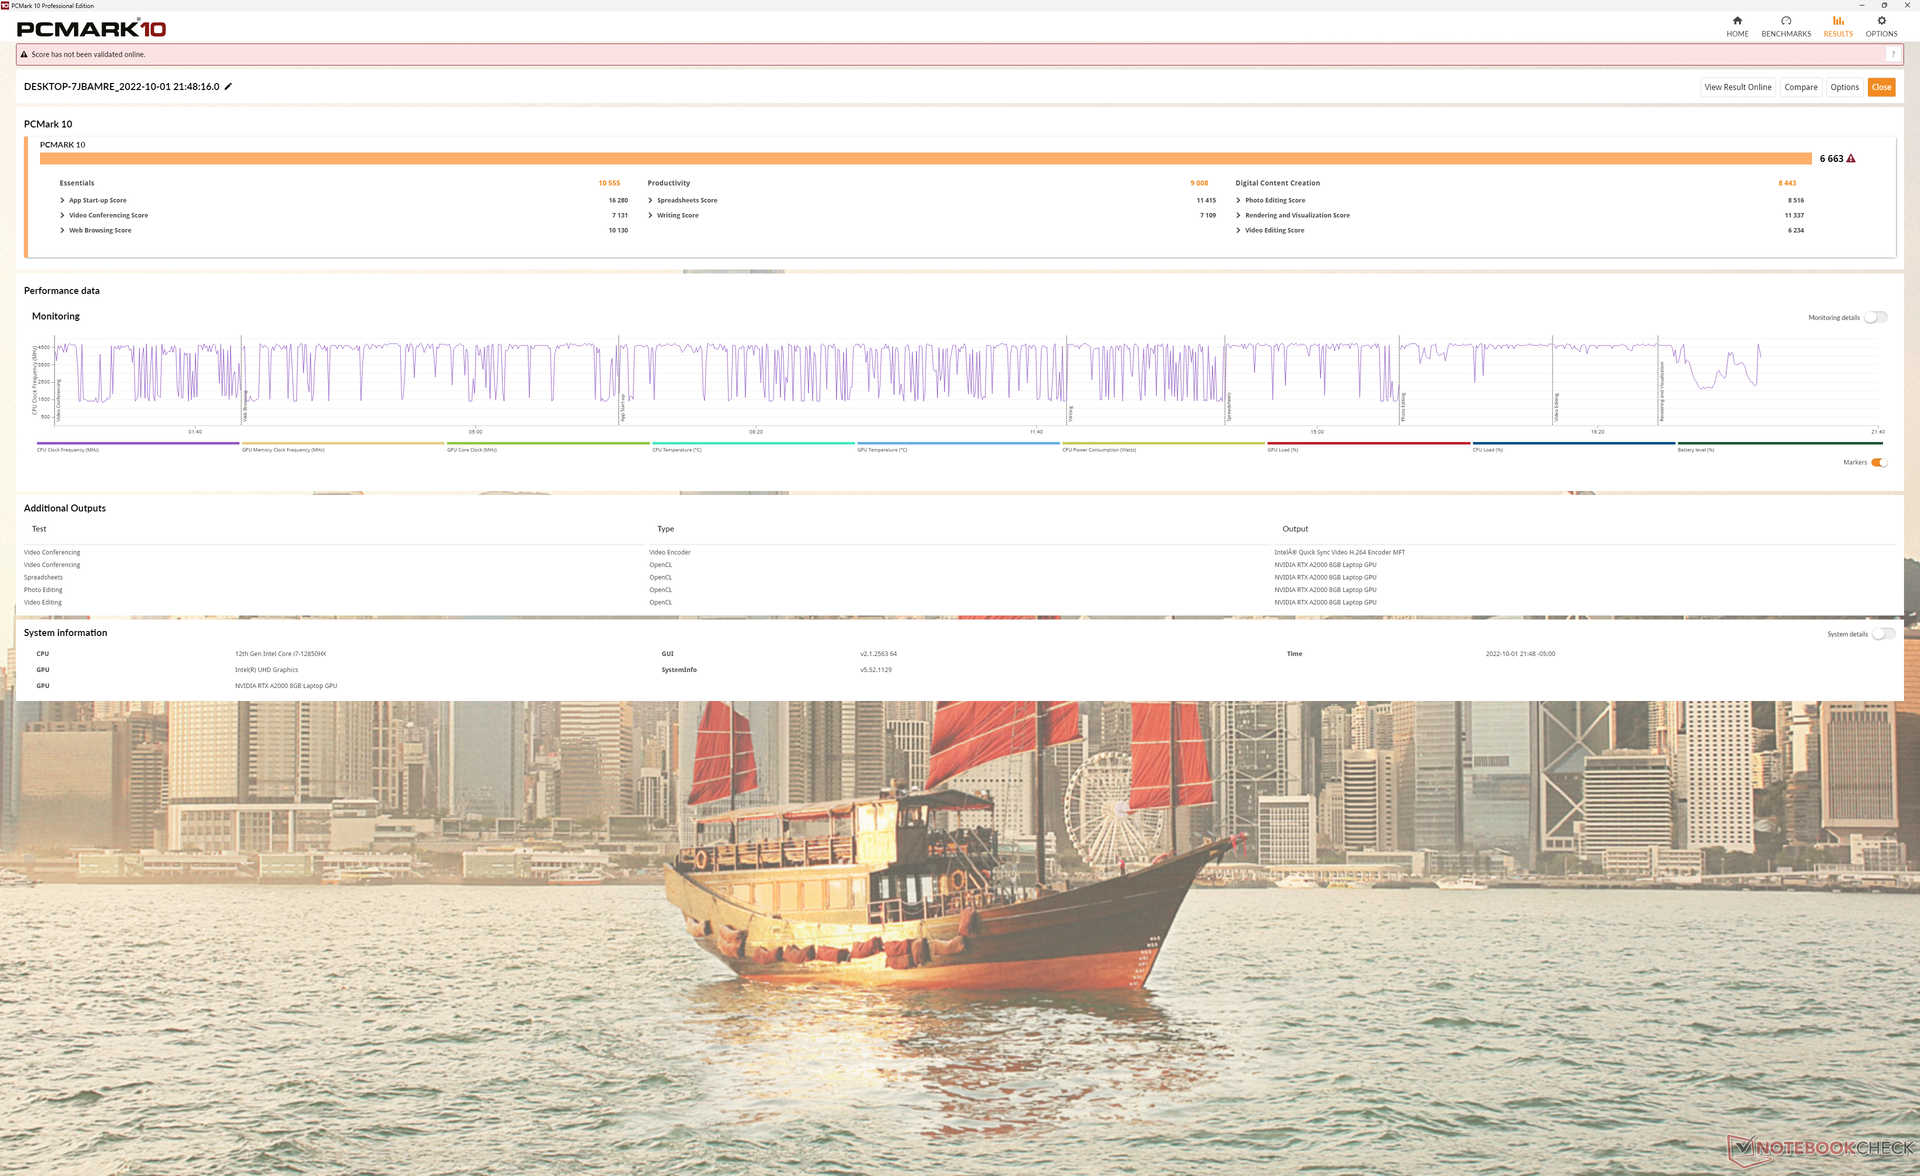
Desempenho do sistema
Os resultados do PCMark 10 são similares a outras estações de trabalho alimentadas por CPUs Core H-series e GPUs Nvidia Quadro. Modelos com o mais rápido RTX A5000 como o HP ZBook Fury 15 G8 ainda tem um desempenho superior ao de nossa unidade de teste Precision 7670 em referências pesadas de GPU como a Criação de Conteúdo Digital.
CrossMark: Overall | Productivity | Creativity | Responsiveness
| PCMark 10 / Score | |
| Asus ProArt StudioBook 16 W7600H5A-2BL2 | |
| HP ZBook Fury 15 G8 | |
| Dell Precision 5000 5560 | |
| Dell Precision 7670 | |
| Lenovo ThinkPad P1 G4-20Y4Z9DVUS | |
| Dell Precision 7550 | |
| PCMark 10 / Essentials | |
| Dell Precision 5000 5560 | |
| Dell Precision 7670 | |
| Asus ProArt StudioBook 16 W7600H5A-2BL2 | |
| HP ZBook Fury 15 G8 | |
| Lenovo ThinkPad P1 G4-20Y4Z9DVUS | |
| Dell Precision 7550 | |
| PCMark 10 / Productivity | |
| Dell Precision 7670 | |
| Dell Precision 5000 5560 | |
| Asus ProArt StudioBook 16 W7600H5A-2BL2 | |
| HP ZBook Fury 15 G8 | |
| Lenovo ThinkPad P1 G4-20Y4Z9DVUS | |
| Dell Precision 7550 | |
| PCMark 10 / Digital Content Creation | |
| Asus ProArt StudioBook 16 W7600H5A-2BL2 | |
| HP ZBook Fury 15 G8 | |
| Dell Precision 5000 5560 | |
| Dell Precision 7670 | |
| Lenovo ThinkPad P1 G4-20Y4Z9DVUS | |
| Dell Precision 7550 | |
| CrossMark / Overall | |
| Lenovo ThinkPad P1 G4-20Y4Z9DVUS | |
| Dell Precision 7670 | |
| CrossMark / Productivity | |
| Lenovo ThinkPad P1 G4-20Y4Z9DVUS | |
| Dell Precision 7670 | |
| CrossMark / Creativity | |
| Dell Precision 7670 | |
| Lenovo ThinkPad P1 G4-20Y4Z9DVUS | |
| CrossMark / Responsiveness | |
| Lenovo ThinkPad P1 G4-20Y4Z9DVUS | |
| Dell Precision 7670 | |
| PCMark 10 Score | 6663 pontos | |
Ajuda | ||
| AIDA64 / Memory Copy | |
| Dell Precision 7670 | |
| HP ZBook Fury 15 G8 | |
| Lenovo ThinkPad P1 G4-20Y4Z9DVUS | |
| AIDA64 / Memory Read | |
| Dell Precision 7670 | |
| HP ZBook Fury 15 G8 | |
| Lenovo ThinkPad P1 G4-20Y4Z9DVUS | |
| AIDA64 / Memory Write | |
| Dell Precision 7670 | |
| HP ZBook Fury 15 G8 | |
| Lenovo ThinkPad P1 G4-20Y4Z9DVUS | |
| AIDA64 / Memory Latency | |
| HP ZBook Fury 15 G8 | |
| Dell Precision 7670 | |
| Lenovo ThinkPad P1 G4-20Y4Z9DVUS | |
| Asus ProArt StudioBook 16 W7600H5A-2BL2 | |
| Asus ProArt StudioBook 16 W7600H5A-2BL2 | |
* ... menor é melhor
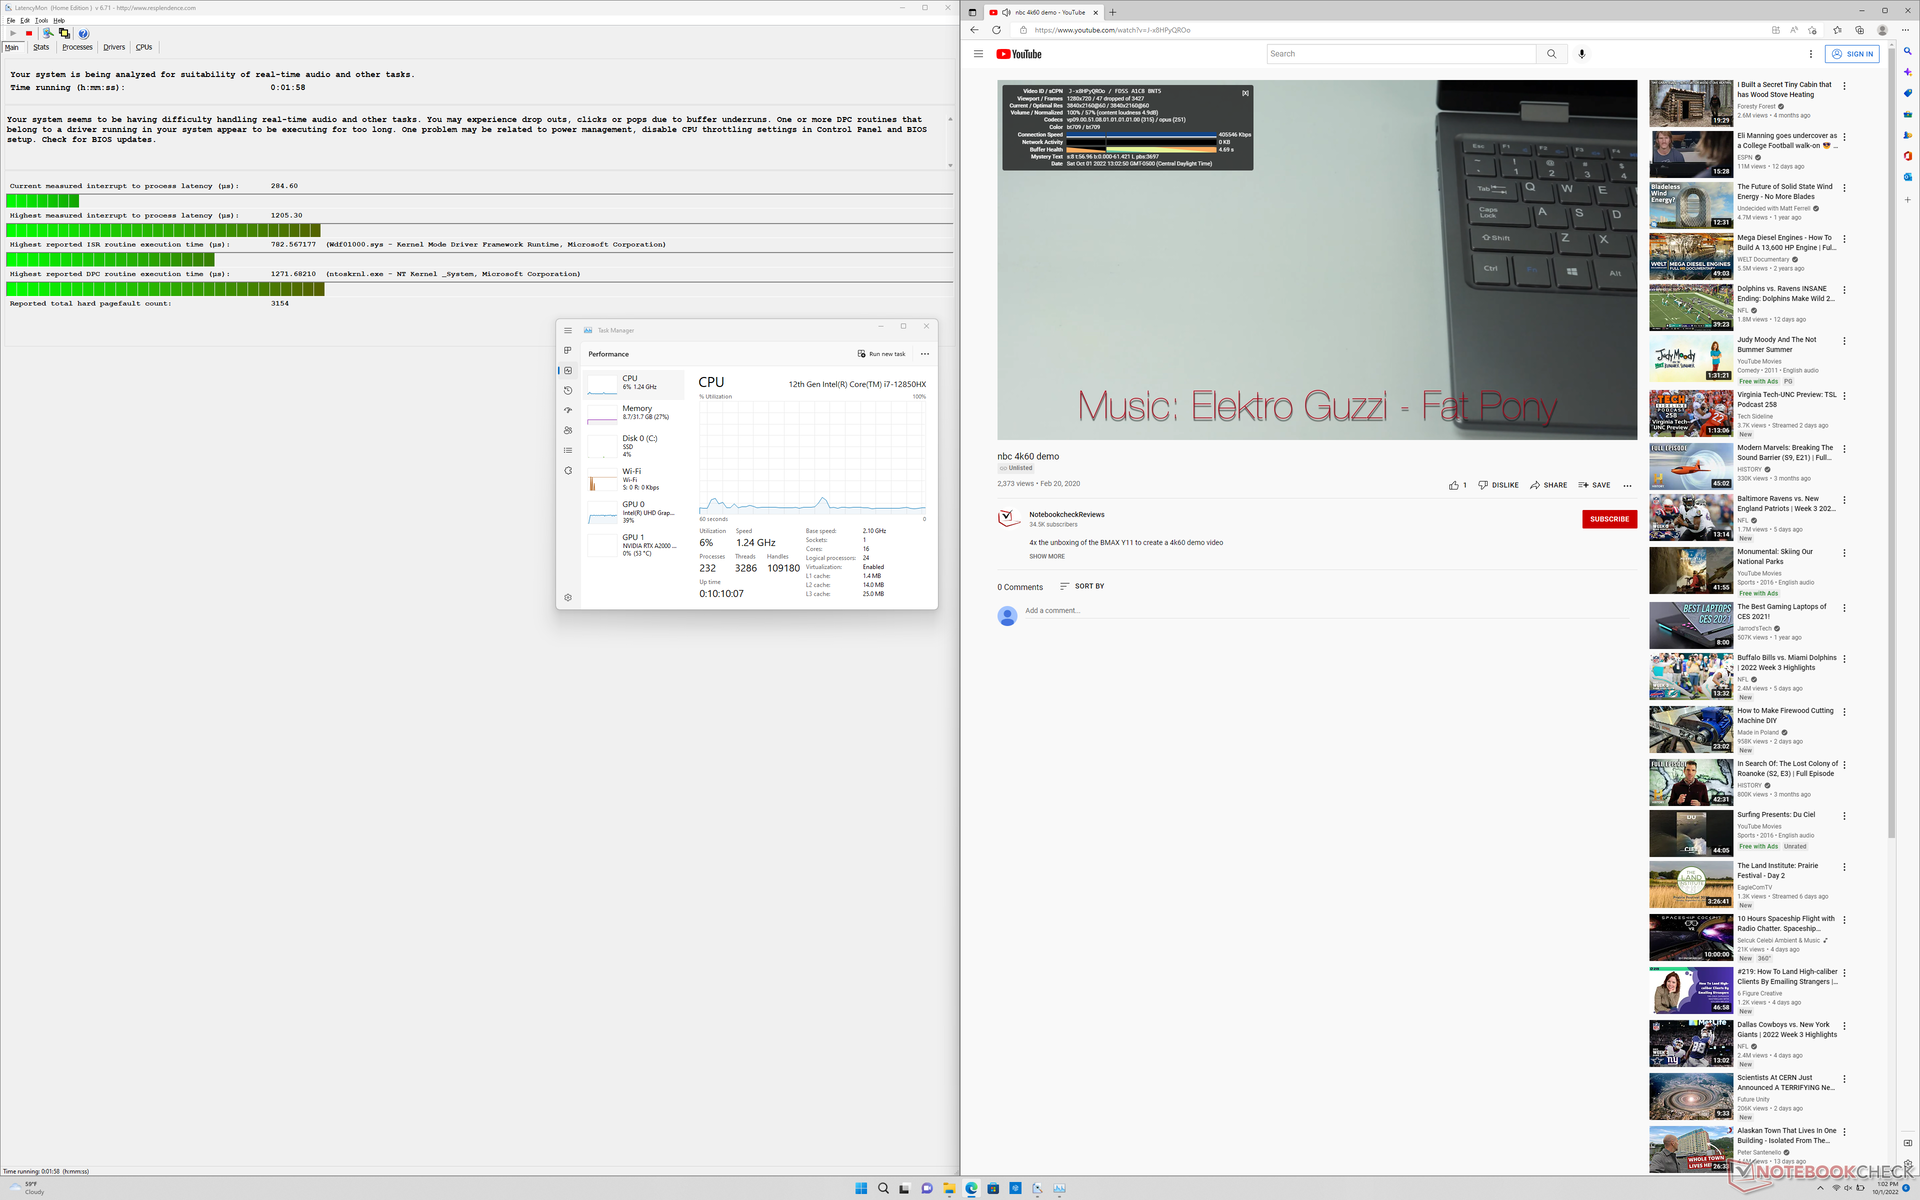
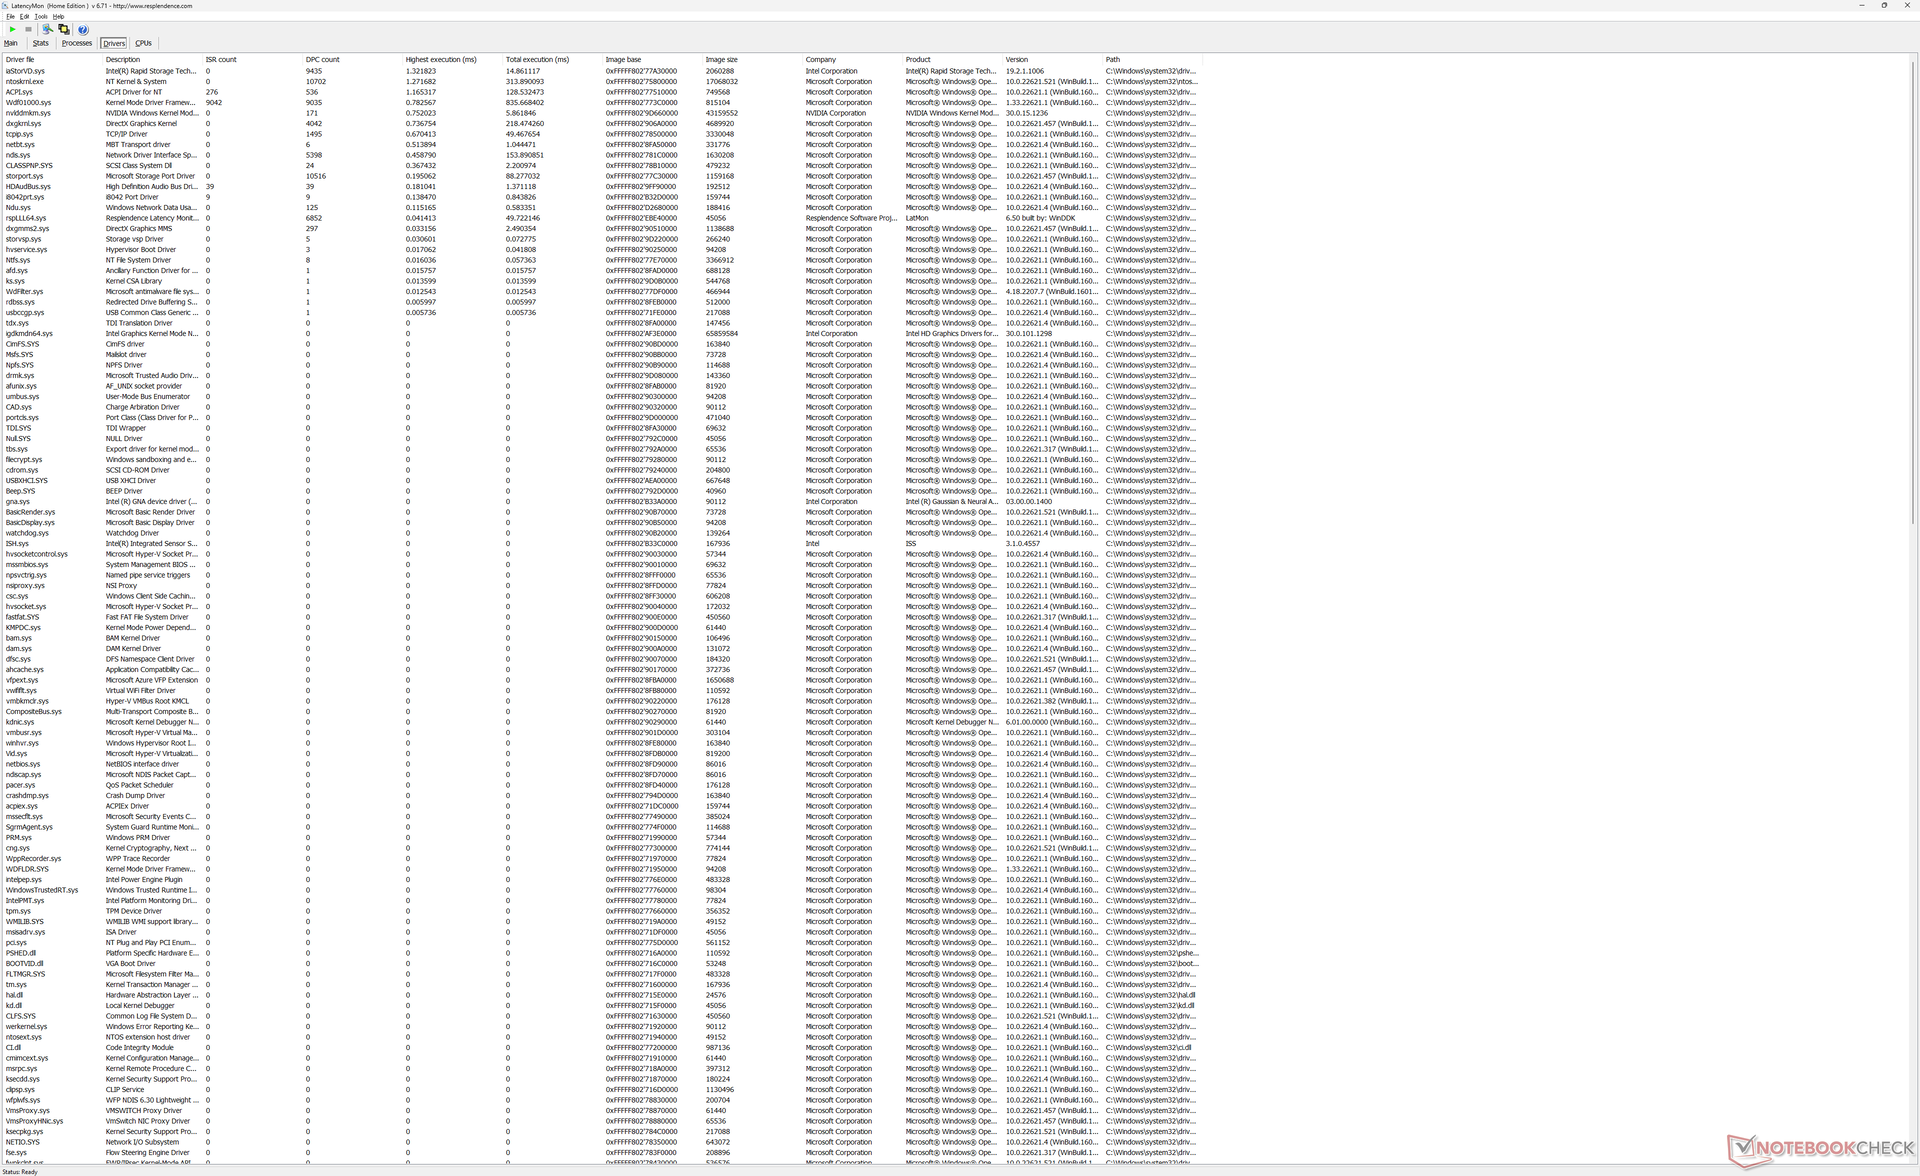
Latência do DPC
latencyMon revela pequenos problemas de DPC ao abrir várias abas do navegador em nossa página inicial. Além disso, a reprodução do vídeo de 4K a 60 FPS é imperfeita, com 47 quadros descartados durante nosso vídeo de teste de minutos.
| DPC Latencies / LatencyMon - interrupt to process latency (max), Web, Youtube, Prime95 | |
| Dell Precision 7550 | |
| Asus ProArt StudioBook 16 W7600H5A-2BL2 | |
| Lenovo ThinkPad P1 G4-20Y4Z9DVUS | |
| Dell Precision 7670 | |
| Dell Precision 5000 5560 | |
| HP ZBook Fury 15 G8 | |
* ... menor é melhor
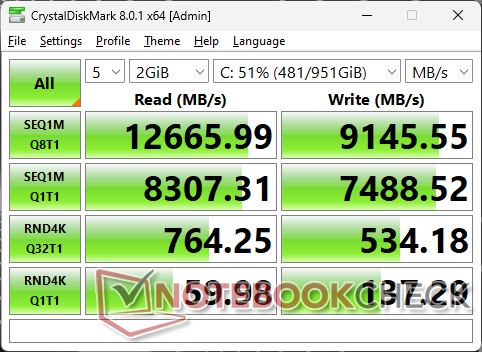
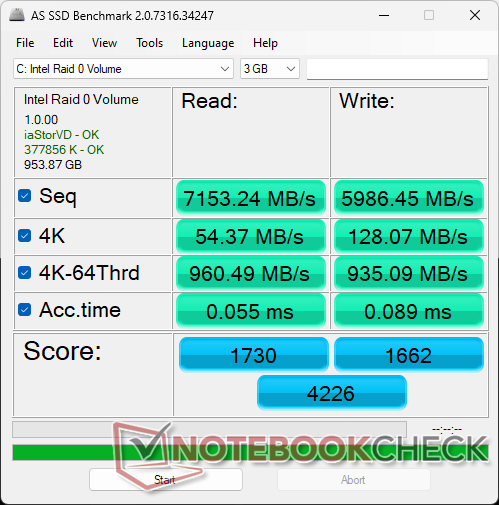
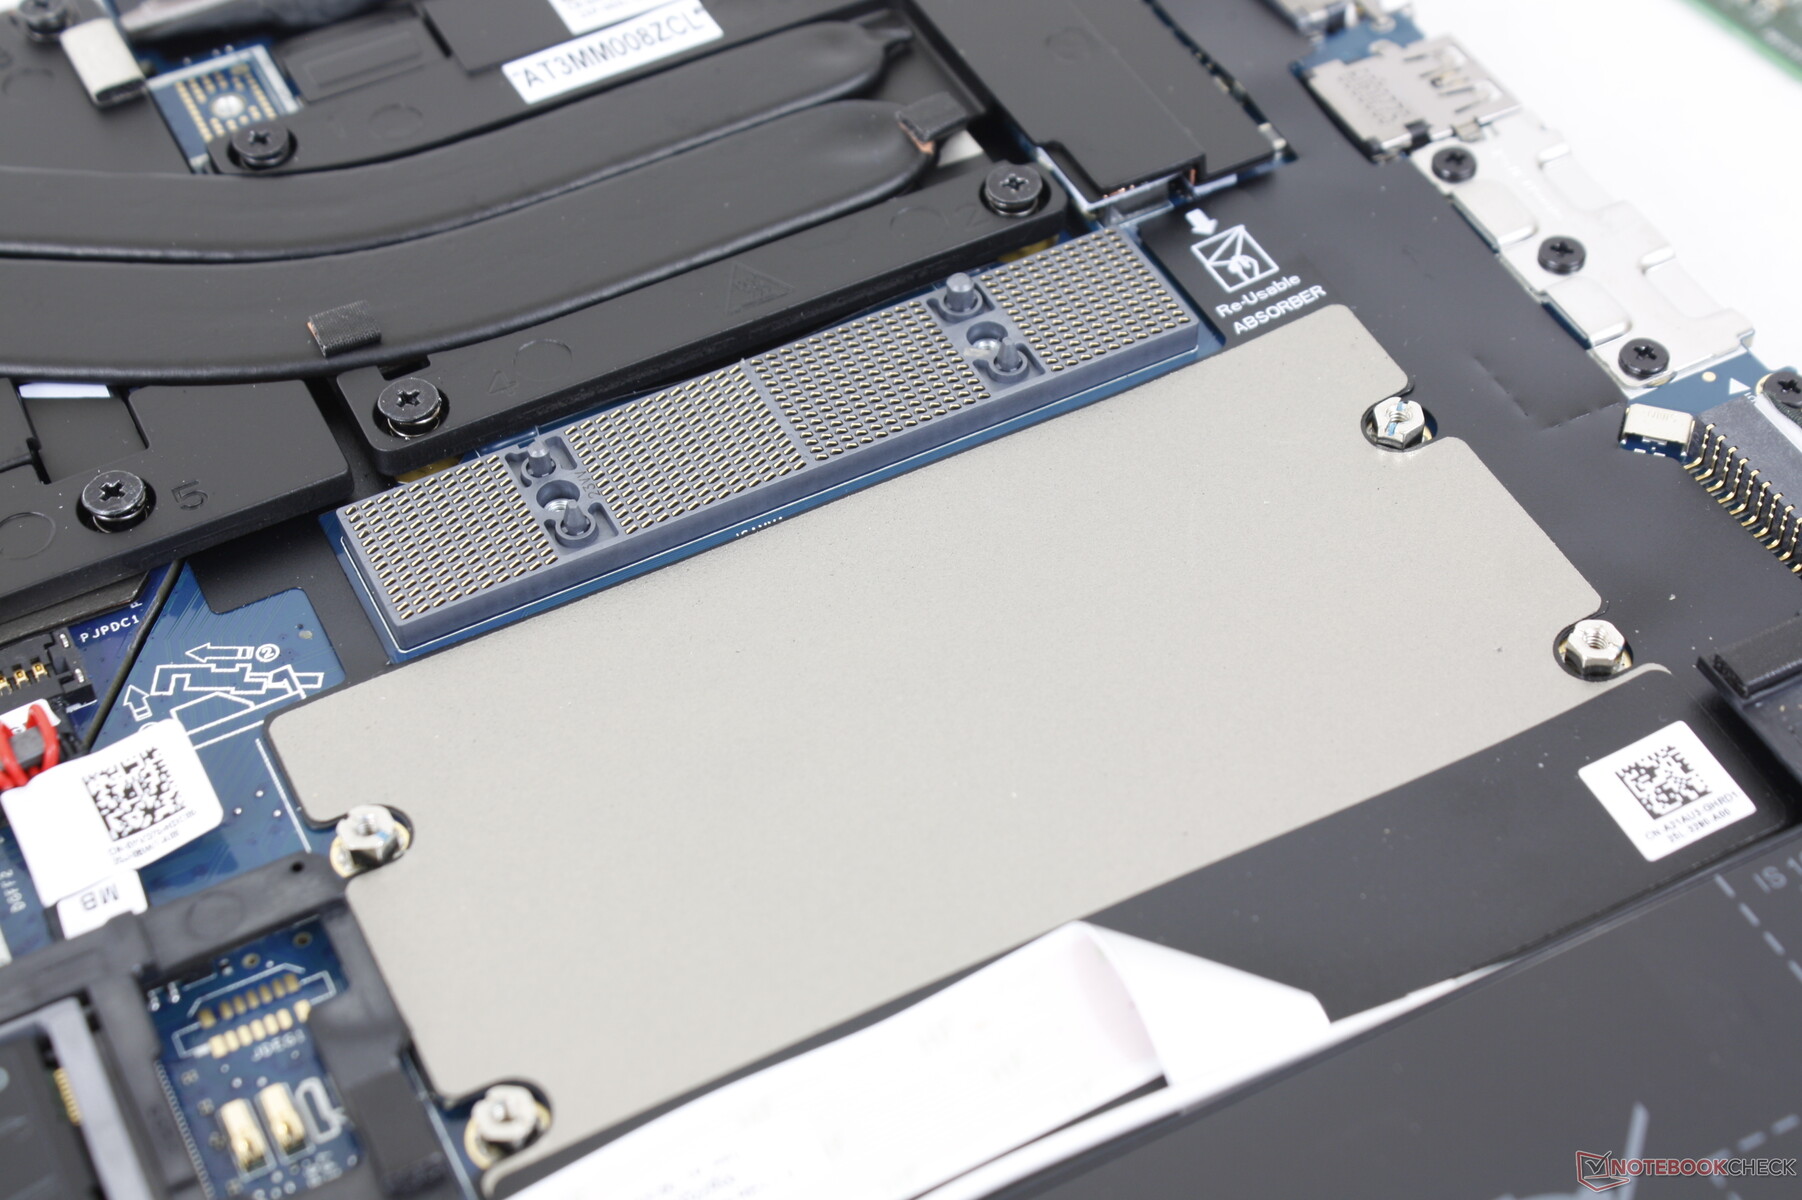
Dispositivos de armazenamento - Velocidades insanas com PCIe4 x4 RAID 0
Todas as configurações podem suportar até dois M.2 SSDs com alguns suportando até três. Nossa unidade de teste específica vem equipada com dois SK Hynix PC801 PCIe4 x4 NVMe SSDs em RAID 0 para taxas sequenciais de leitura e gravação de quase 13000 MB/s e 9200 MB/s, respectivamente. Quando estressados sob DiskSpd, os drives não mostrariam sinais de estrangulamento de desempenho, mesmo após longos períodos. Há difusores de calor ou almofadas térmicas sobre os SSDs incluídos para auxiliar na dissipação de calor.

| Drive Performance rating - Percent | |
| Dell Precision 5000 5560 | |
| Dell Precision 7670 | |
| Lenovo ThinkPad P1 G4-20Y4Z9DVUS | |
| Asus ProArt StudioBook 16 W7600H5A-2BL2 | |
| HP ZBook Fury 15 G8 | |
| Dell Precision 7550 | |
* ... menor é melhor
Disk Throttling: DiskSpd Read Loop, Queue Depth 8
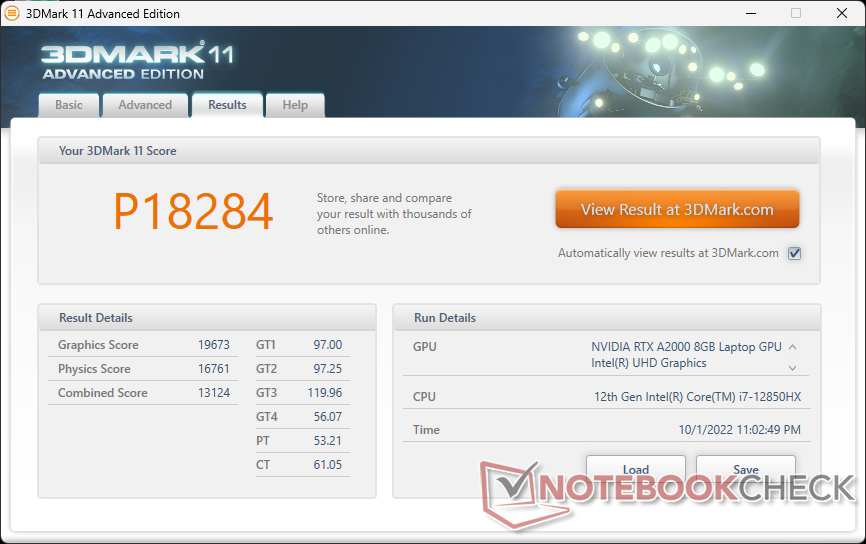
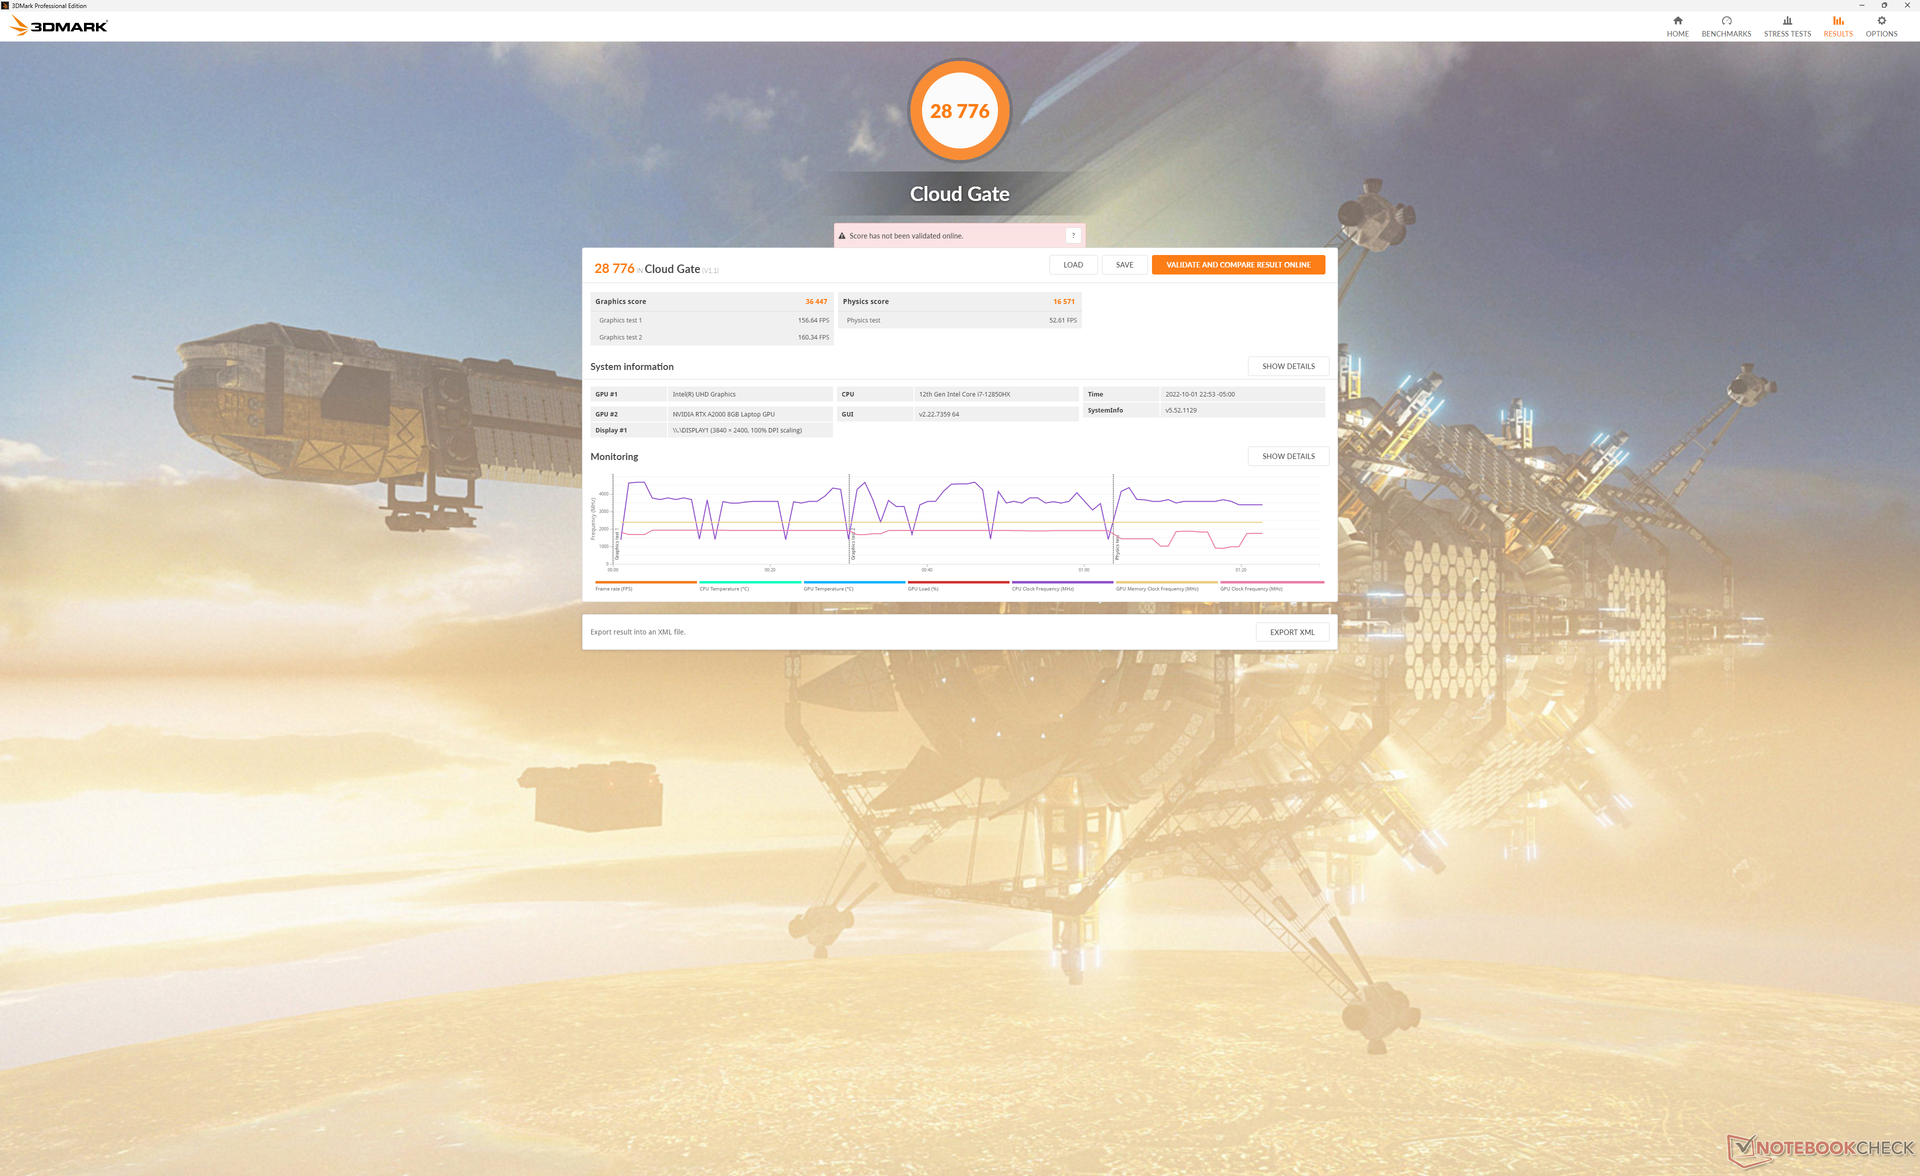
GPU Performance - 95 W TGP Graphics
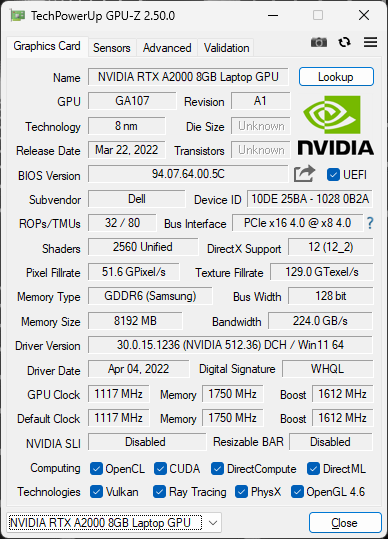
O RTX A2000 é derivado do GeForce RTX 3050 Ti e assim ambos os GPUs compartilham números de desempenho bruto similares. Atualizando para a RTX A3000 ou RTX A5500 espera-se que a opção aumente o desempenho em 15 a 20 por cento e 70 a 90 por cento, respectivamente.
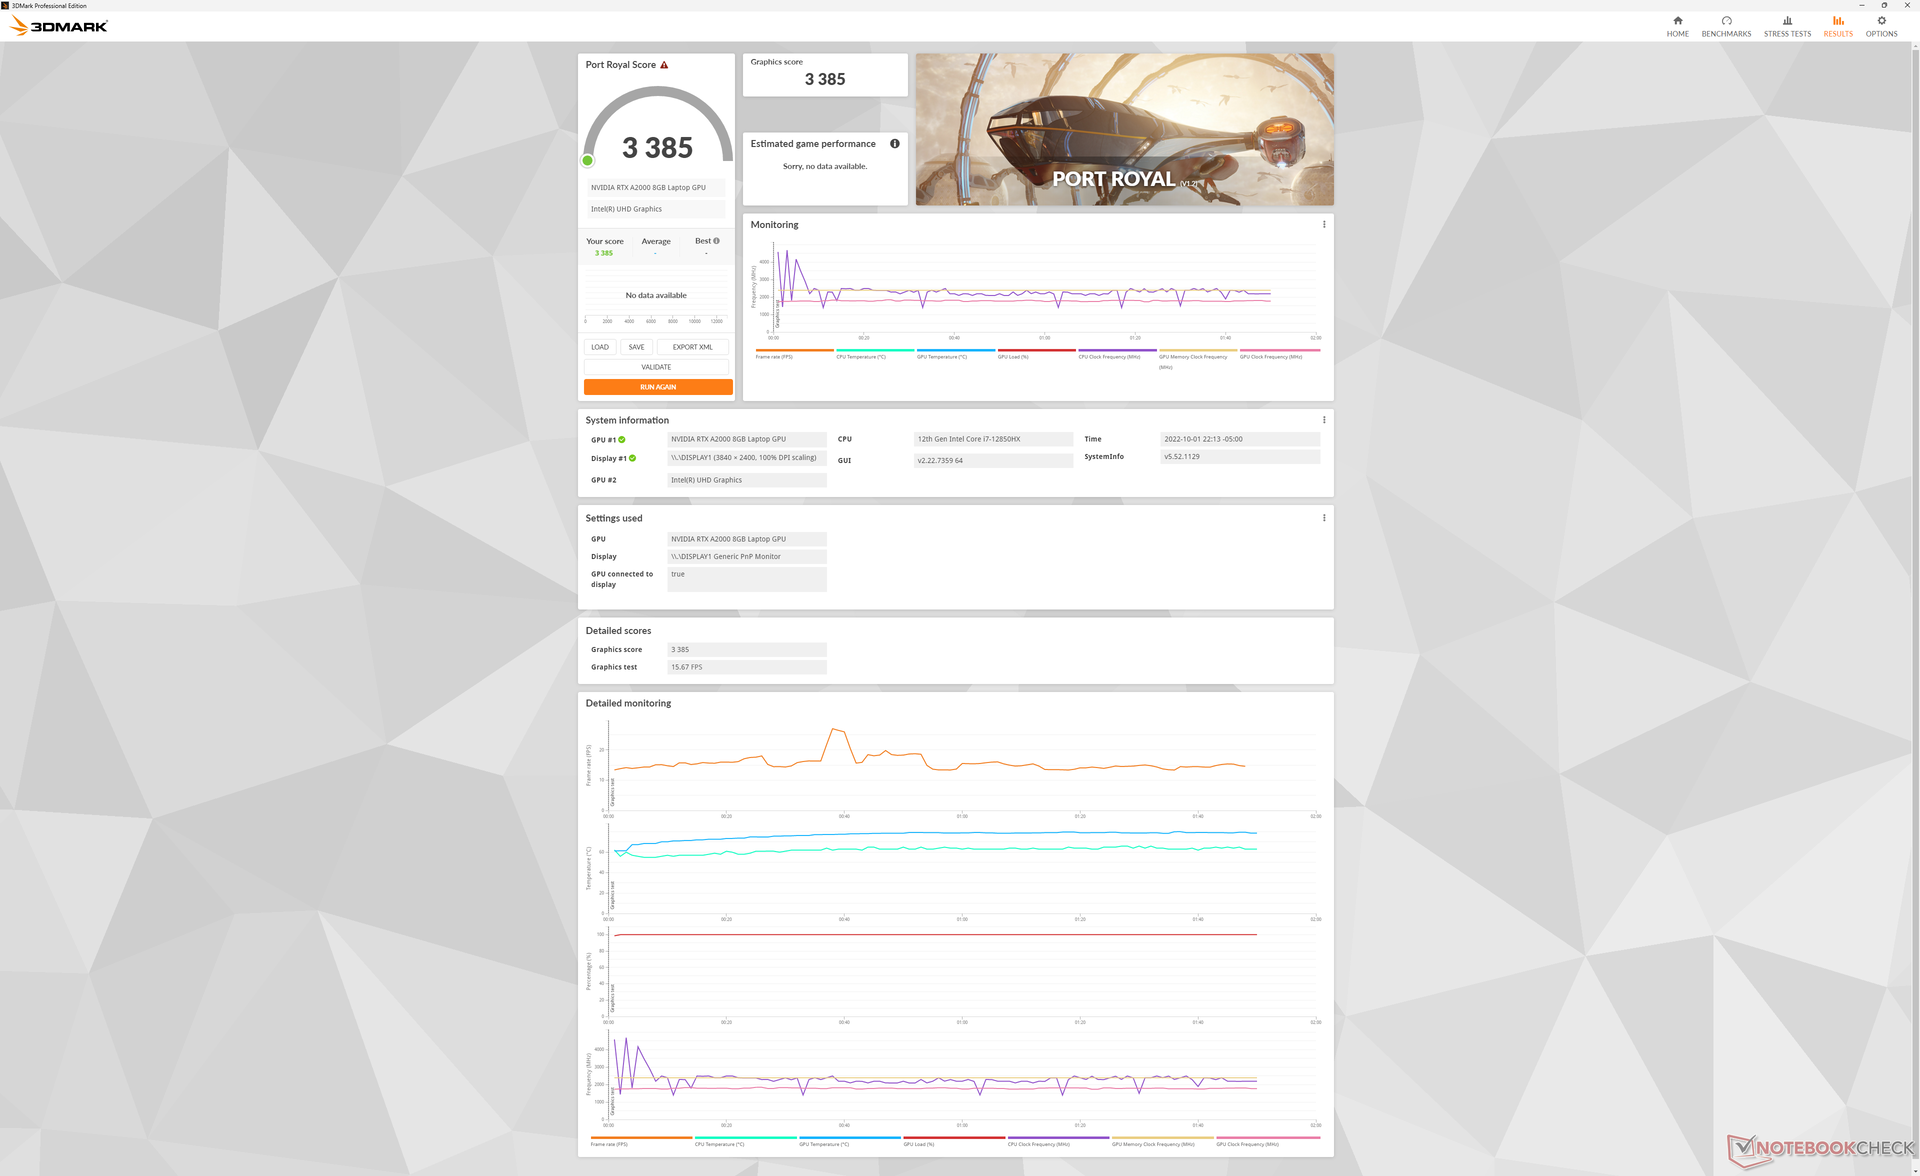
Curiosamente, o desempenho de Port Royal de traçado de raio é significativamente melhor do que o que registramos nosPrecision 5560 apesar de compartilharem a mesma GPU RTX A2000. Suspeitamos que isso possa ser devido tanto ao alvo TGP muito mais alto (95 W vs. 45 W) quanto ao novo driver Nvidia (512,36 vs. 472,12) de nosso Precision 7670.
| 3DMark 11 - 1280x720 Performance GPU | |
| MSI GE67 HX 12UGS | |
| HP ZBook Fury 15 G8 | |
| HP Envy 16 h0112nr | |
| Dell Precision 7550 | |
| HP ZBook Fury 17 G8-4A6A9EA | |
| Dell Precision 7670 | |
| Média NVIDIA RTX A2000 Laptop GPU (14831 - 19823, n=9) | |
| Asus Zenbook Pro 15 OLED UM535Q | |
| Dell Precision 5000 5560 | |
| Dell Precision 5000 5470 | |
| Lenovo ThinkPad P1 G4-20Y4Z9DVUS | |
| 3DMark 11 Performance | 18284 pontos | |
| 3DMark Cloud Gate Standard Score | 28776 pontos | |
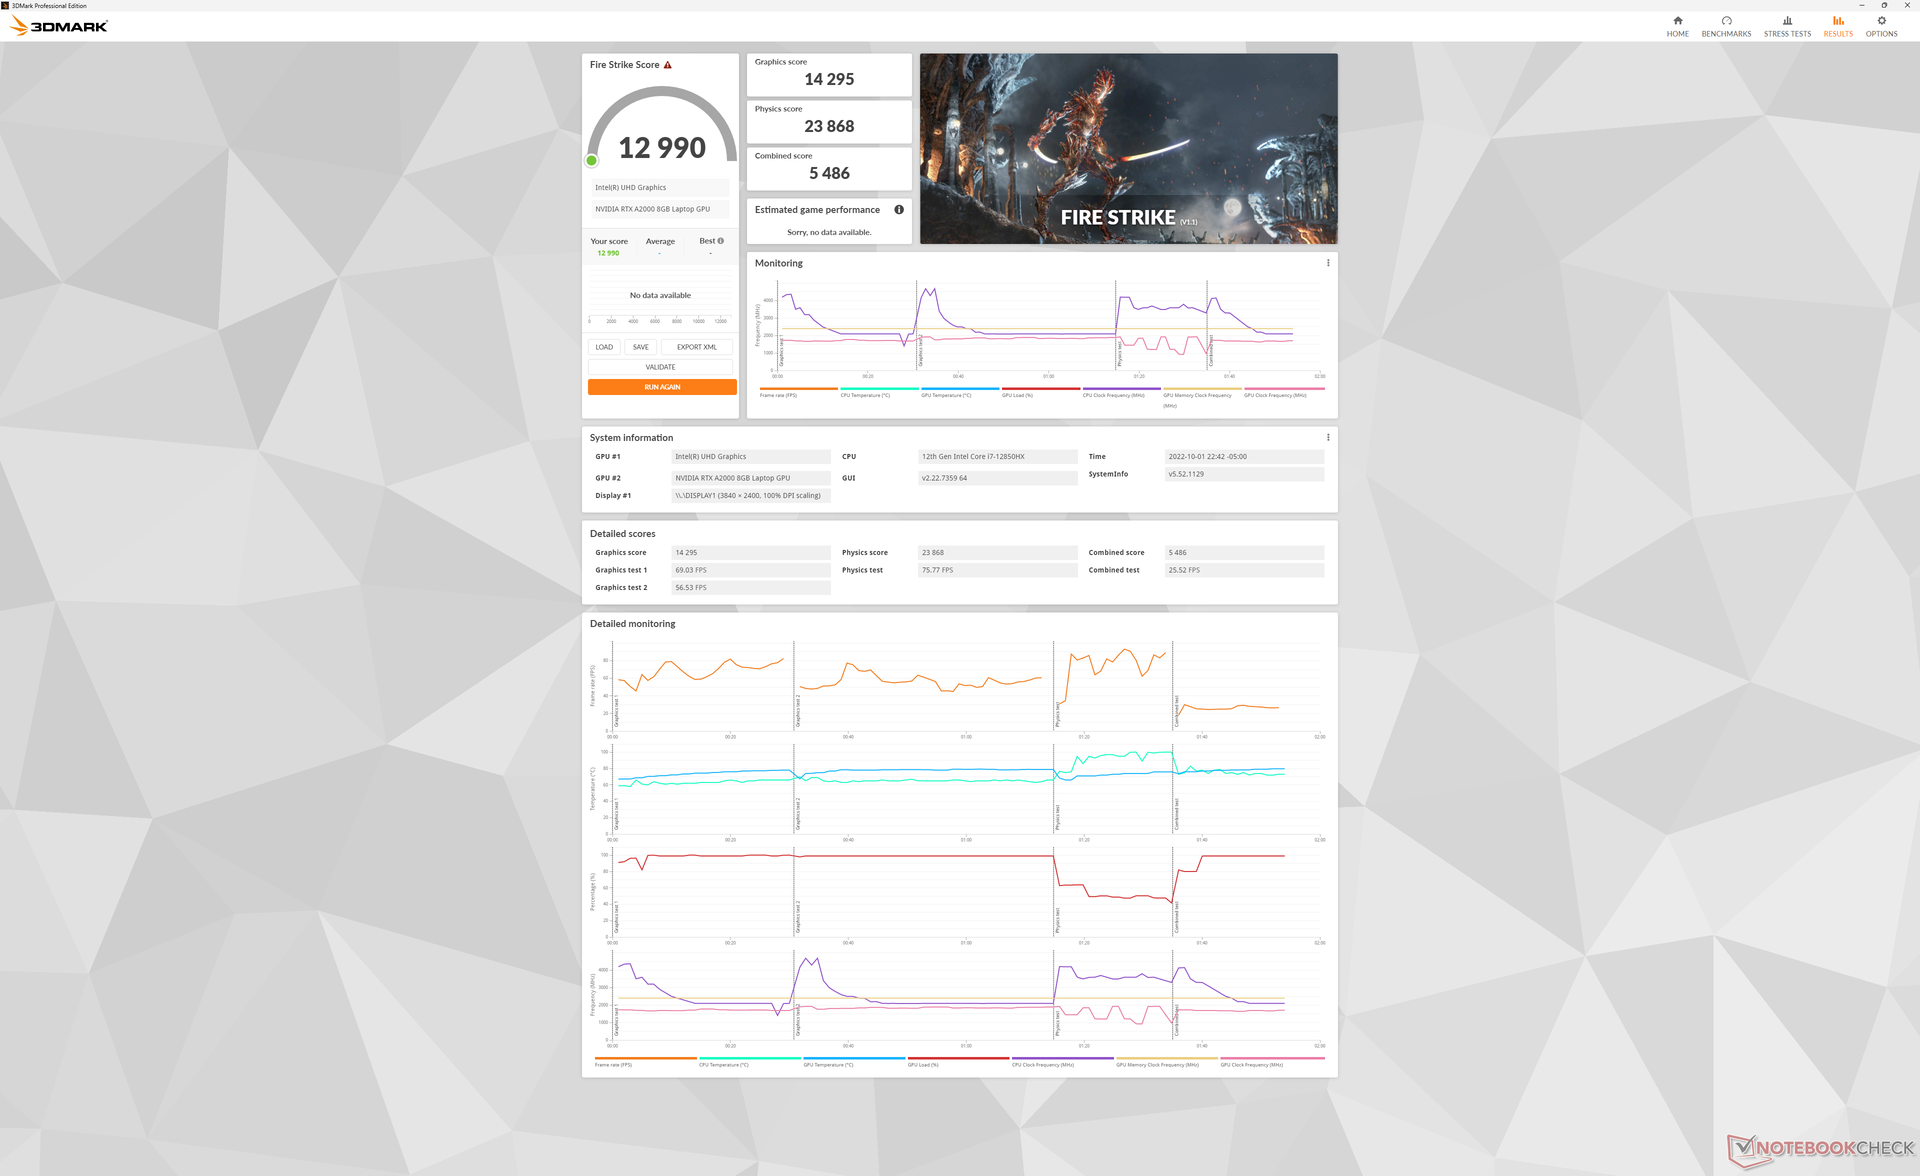
| 3DMark Fire Strike Score | 12990 pontos | |
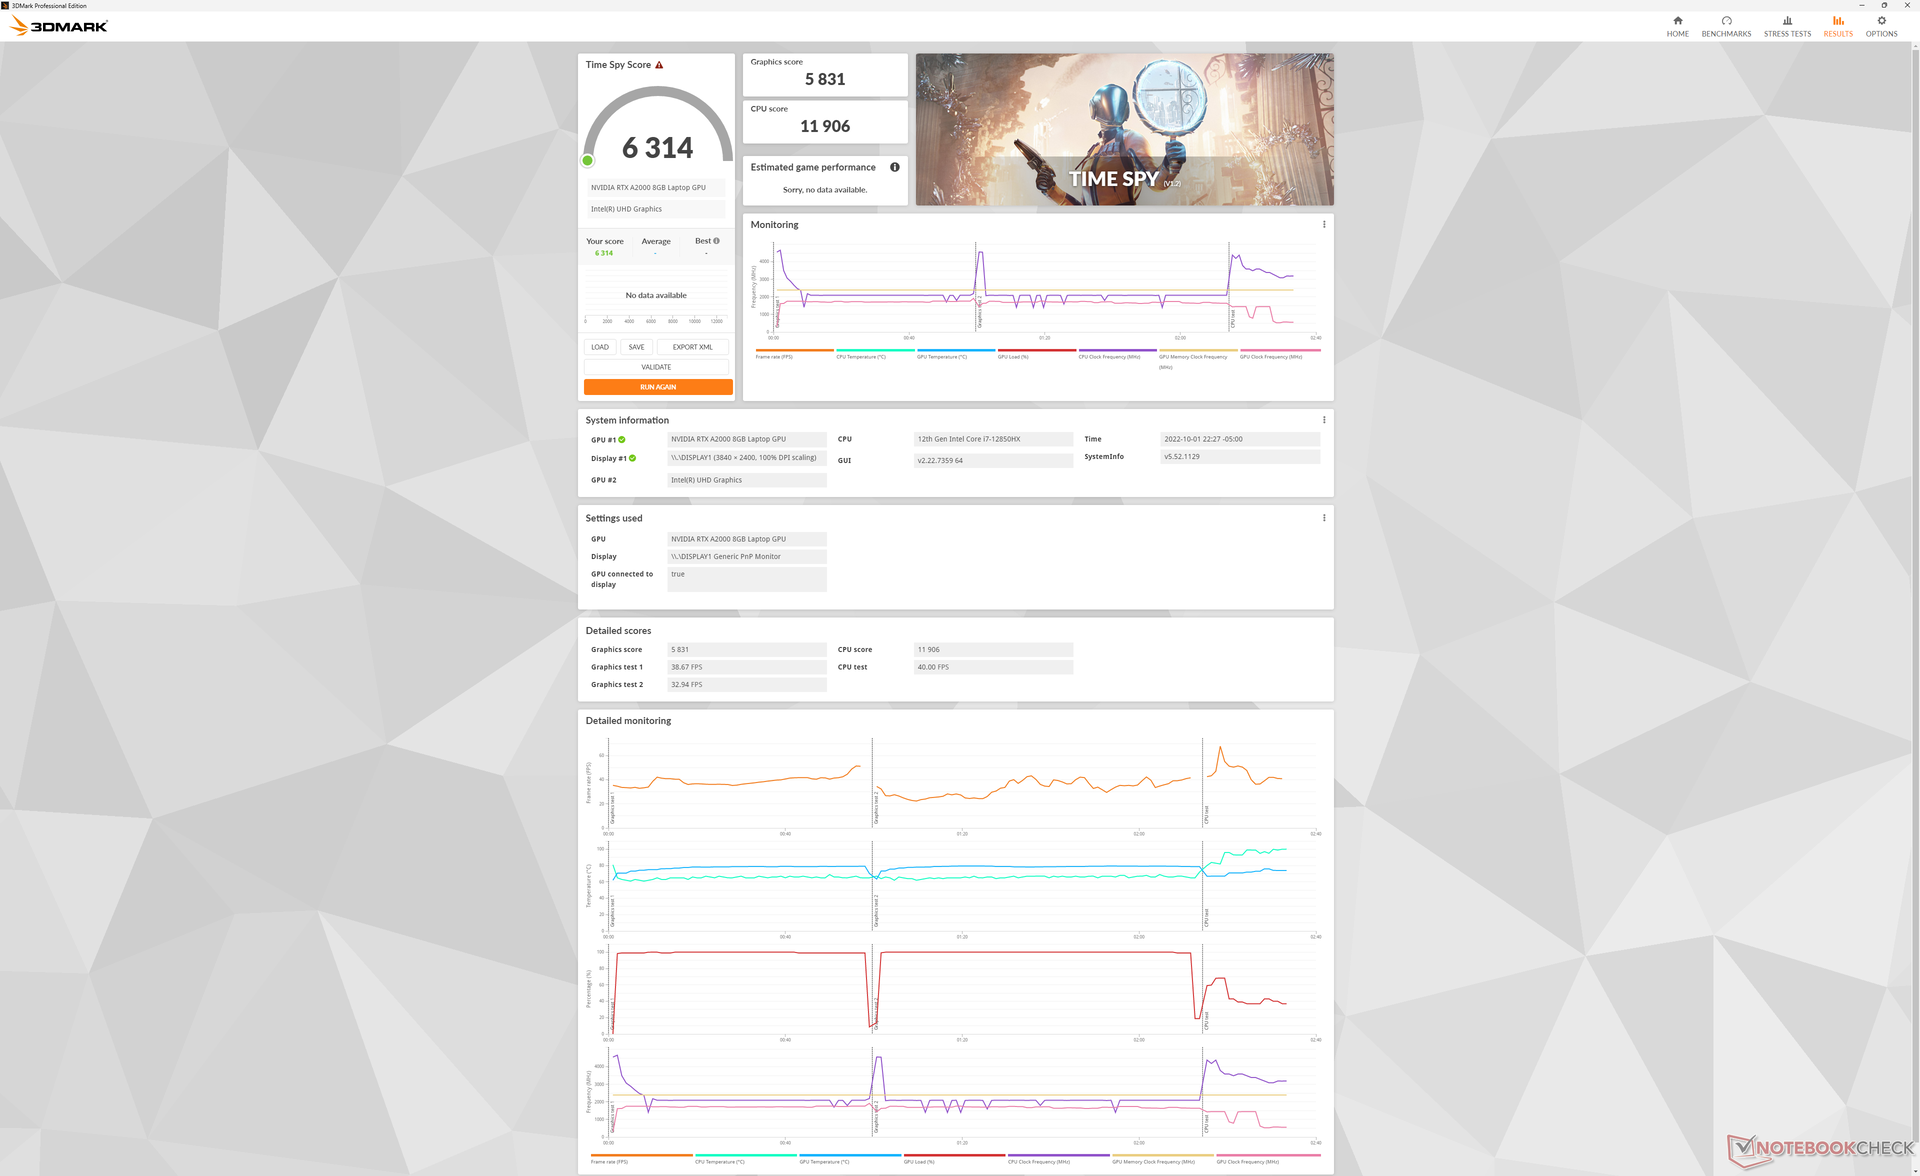
| 3DMark Time Spy Score | 6314 pontos | |
Ajuda | ||
| Blender | |
| v3.3 Classroom HIP/AMD | |
| Lenovo Legion 7 16ARHA7 | |
| v3.3 Classroom OPTIX/RTX | |
| Dell Precision 5000 5470 | |
| HP Envy 16 h0112nr | |
| Dell Precision 7670 | |
| v3.3 Classroom CUDA | |
| Dell Precision 5000 5470 | |
| HP Envy 16 h0112nr | |
| Dell Precision 7670 | |
| v3.3 Classroom CPU | |
| HP Envy 16 h0112nr | |
| Dell Precision 5000 5470 | |
| Lenovo Legion 7 16ARHA7 | |
| Dell Precision 7670 | |
* ... menor é melhor
Witcher 3 FPS Chart
| baixo | média | alto | ultra | QHD | 4K | |
|---|---|---|---|---|---|---|
| GTA V (2015) | 181.7 | 177.6 | 155.1 | 79.1 | 57.1 | |
| The Witcher 3 (2015) | 297.1 | 181.7 | 108.6 | 57.4 | ||
| Dota 2 Reborn (2015) | 180.8 | 159.3 | 145.1 | 128.8 | 78.5 | |
| Final Fantasy XV Benchmark (2018) | 129.5 | 80.4 | 60.6 | 44.4 | 26 | |
| X-Plane 11.11 (2018) | 135.2 | 104.1 | 85.5 | 55.1 | ||
| Strange Brigade (2018) | 325 | 151.2 | 120.9 | 103.5 | 76.8 | |
| Cyberpunk 2077 1.6 (2022) | 78.5 | 65.1 | 55 | 44.3 | 27.4 |
Emissões
Ruído do sistema
Os ventiladores quase nunca são silenciosos mesmo quando ociosos na área de trabalho, mas são silenciosos e difíceis de serem notados durante cargas baixas. Esperar que os níveis de ruído permaneçam abaixo de 28 dB(A) contra um fundo silencioso de 22,7 dB(A) durante a reprodução do vídeo. O ruído do ventilador é ainda mais silencioso a 24,5 dB(A) se a navegação na web ou o processamento de texto for semelhante ao que observamos no ZBook Fury 15 G8 ou Precision 5560
Os níveis de ruído aumentam um pouco rapidamente quando são introduzidas cargas mais altas. A primeira cena de referência do 3DMark 06, por exemplo, faria com que o ruído do ventilador fosse tão alto quanto 49 dB(A), mesmo quando ajustado para o perfil de potência Balanceado. O ruído dos ventiladores atingiria um pico de cerca de 52 dB(A) se as cargas extremas, como Prime95 e FurMark, fossem iguais às do Precision 5560. Em outras palavras, o Precision 7670 funciona silenciosamente na maioria das condições, mas fica bastante ruidoso se mesmo um pouco de estresse for introduzido.
Barulho
| Ocioso |
| 22.9 / 22.9 / 24.5 dB |
| Carga |
| 48.7 / 52.1 dB |
 | ||
30 dB silencioso 40 dB(A) audível 50 dB(A) ruidosamente alto |
||
min: | ||
| Dell Precision 7670 RTX A2000 Laptop GPU, i7-12850HX, SK Hynix HFS001TEJ9X115N | Lenovo ThinkPad P1 G4-20Y4Z9DVUS T1200 Laptop GPU, i7-11800H, Samsung PM9A1 MZVL2512HCJQ | Asus ProArt StudioBook 16 W7600H5A-2BL2 RTX A5000 Laptop GPU, W-11955M, 2x Micron 2300 2TB MTFDHBA2T0TDV (RAID 0) | Dell Precision 5000 5560 RTX A2000 Laptop GPU, i7-11850H, Samsung PM9A1 MZVL22T0HBLB | Dell Precision 7550 Quadro RTX 5000 Max-Q, W-10885M, SK Hynix PC601A NVMe 1TB | HP ZBook Fury 15 G8 RTX A5000 Laptop GPU, i9-11950H, Samsung PM981a MZVLB1T0HBLR | |
|---|---|---|---|---|---|---|
| Noise | -3% | -3% | 11% | -9% | 3% | |
| desligado / ambiente * (dB) | 22.7 | 24.3 -7% | 26 -15% | 23.4 -3% | 25.8 -14% | 24.1 -6% |
| Idle Minimum * (dB) | 22.9 | 24.3 -6% | 26 -14% | 23.6 -3% | 25.8 -13% | 24.1 -5% |
| Idle Average * (dB) | 22.9 | 24.3 -6% | 26 -14% | 23.6 -3% | 25.8 -13% | 24.1 -5% |
| Idle Maximum * (dB) | 24.5 | 26.6 -9% | 26.5 -8% | 23.6 4% | 25.9 -6% | 24.8 -1% |
| Load Average * (dB) | 48.7 | 46.8 4% | 42 14% | 25.8 47% | 51.2 -5% | 37.8 22% |
| Witcher 3 ultra * (dB) | 45.2 | 46.8 -4% | 40.1 11% | 51.9 -15% | 44.2 2% | |
| Load Maximum * (dB) | 52.1 | 46.8 10% | 43 17% | 41.4 21% | 51.9 -0% | 44.2 15% |
* ... menor é melhor
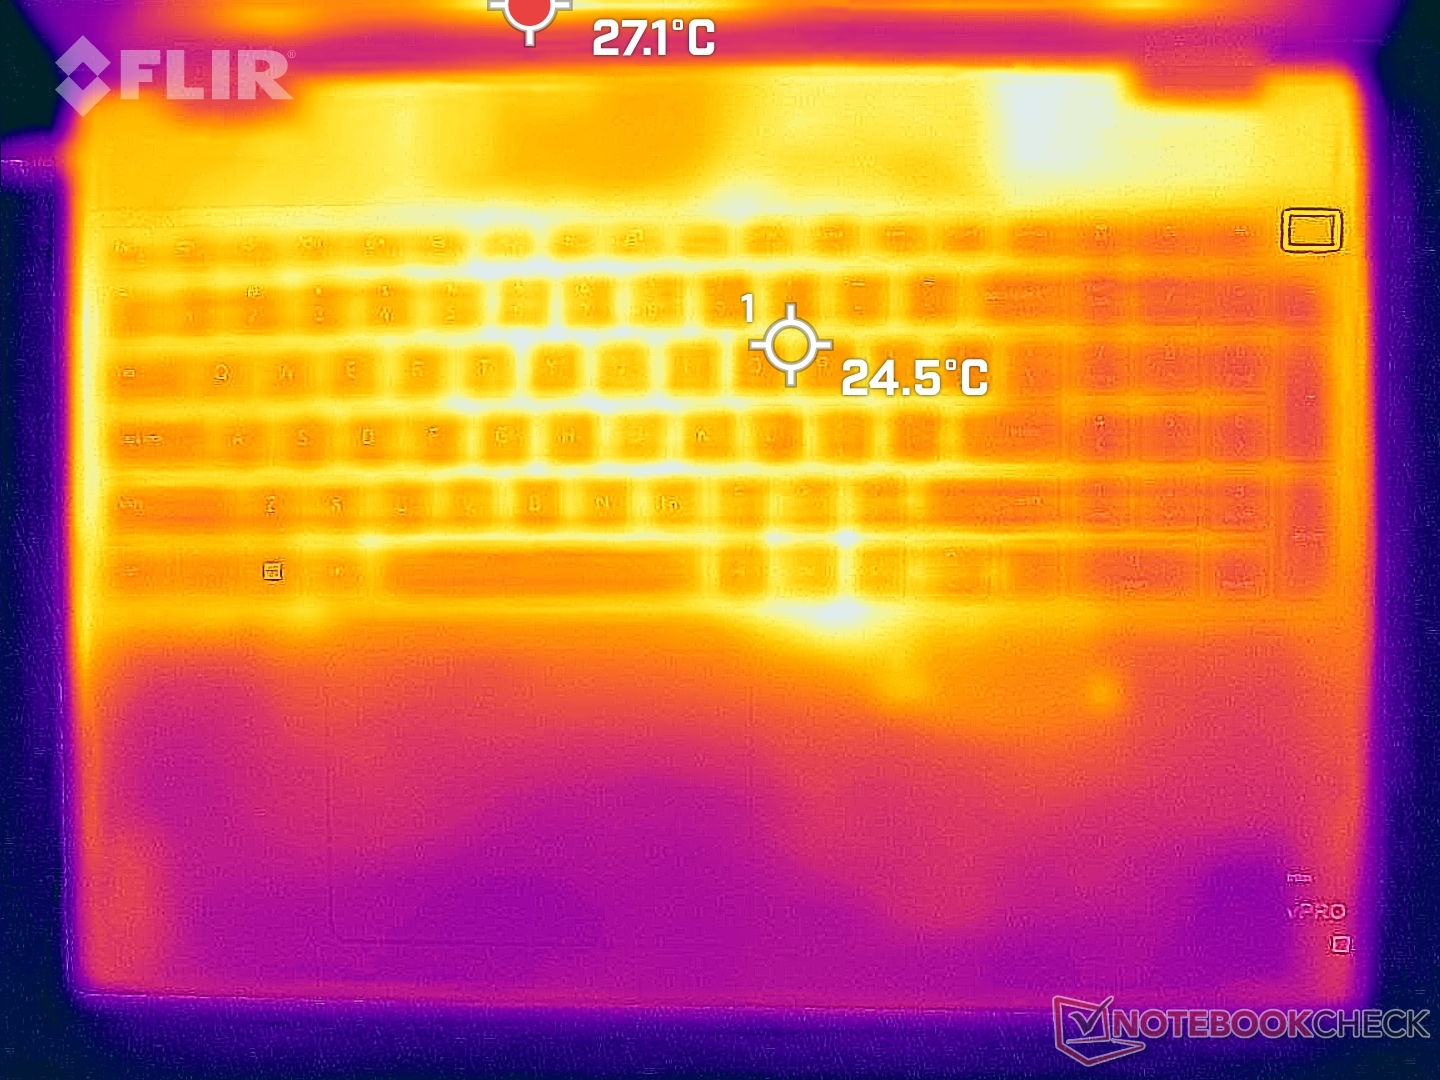
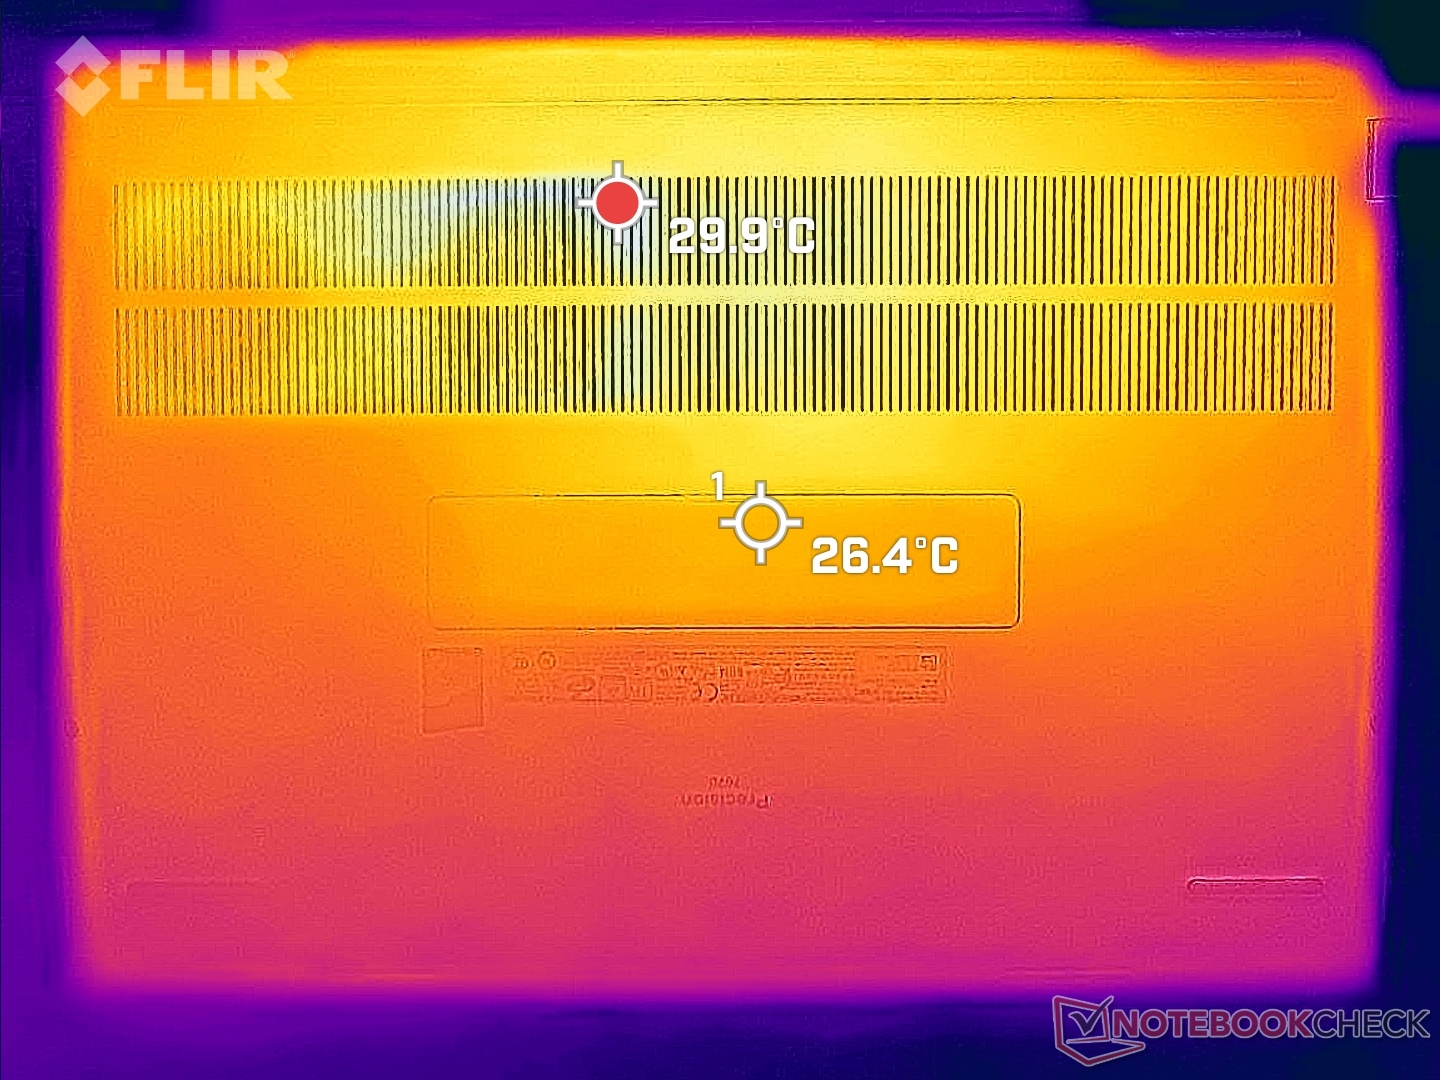
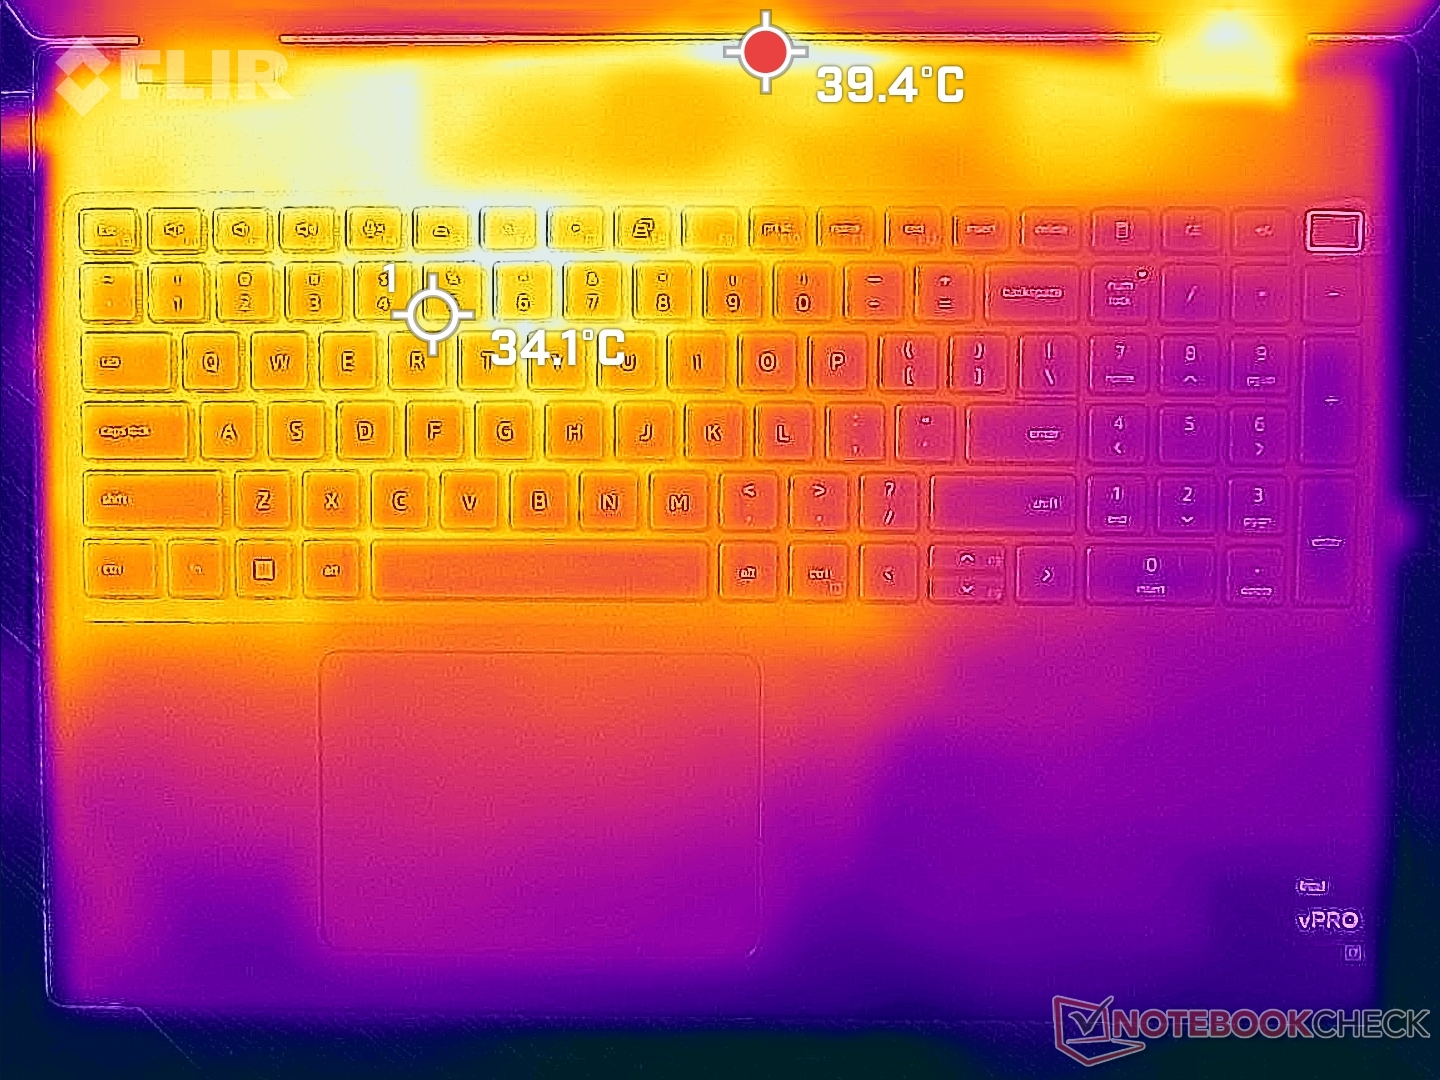
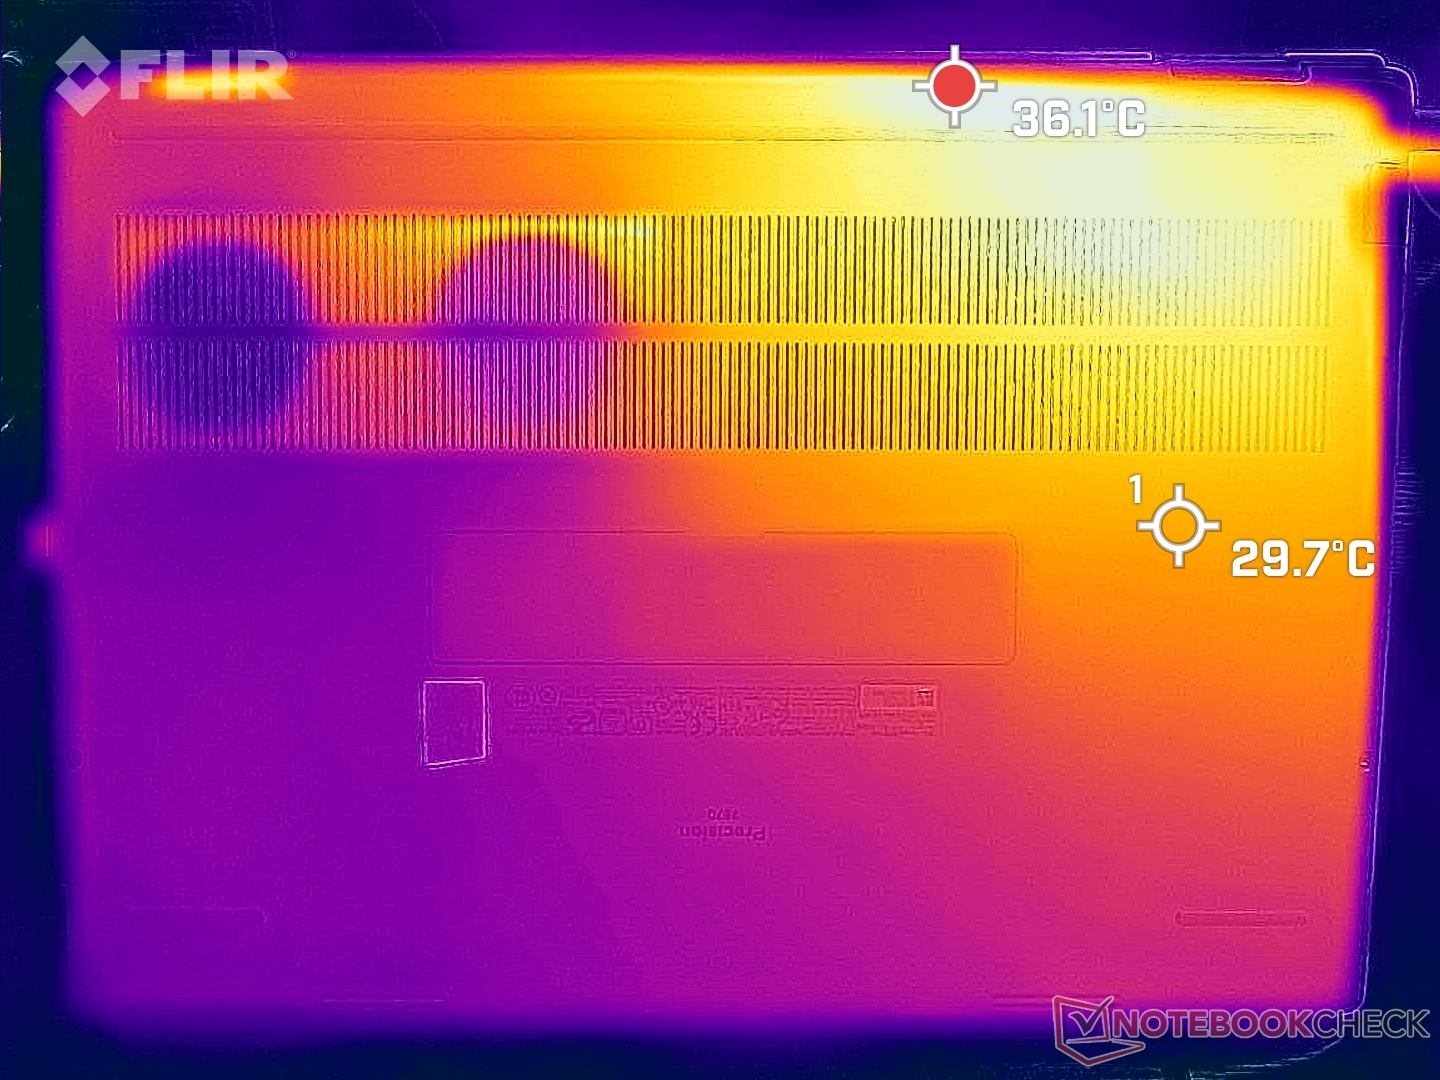
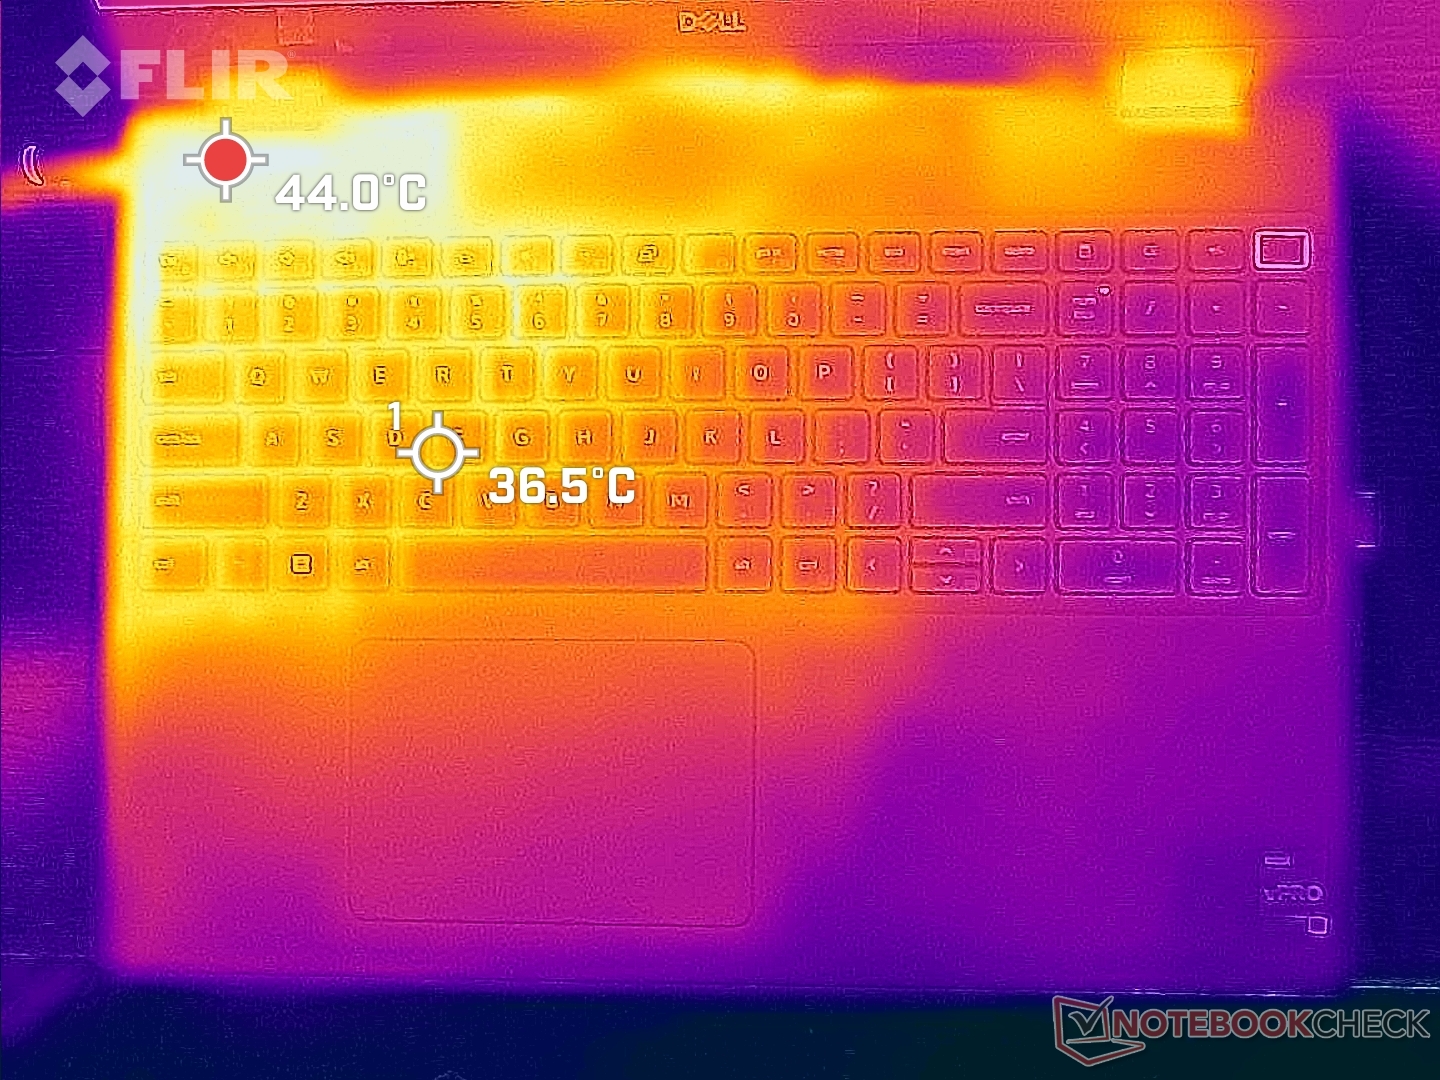
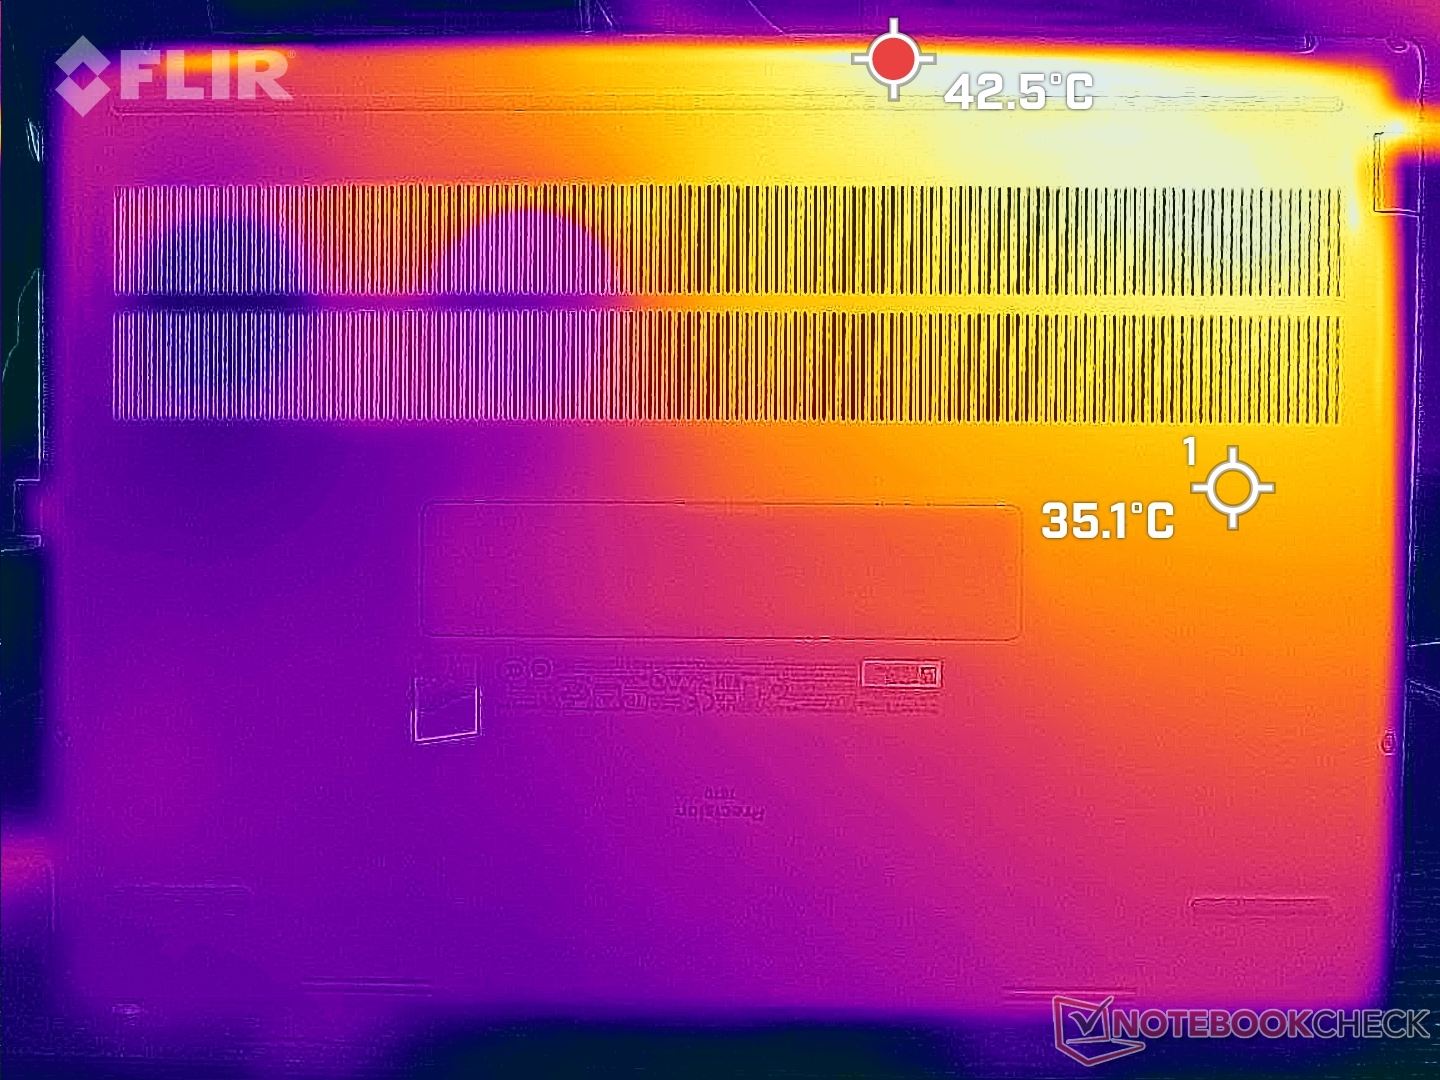
Temperatura
As temperaturas superficiais são sempre quentes, não importando a carga na tela. Quando ocioso no modo Power Saver, por exemplo, o deck e a parte inferior do teclado ficariam a 30 C cada, em comparação com 26 C no modoLenovo ThinkPad P1 G4. OAsus ProArt StudioBook Pro 16 pode ser ainda mais quente a quase 35 C em condições semelhantes.
Somos capazes de registrar pontos quentes de 51 C e 46 C na parte superior e inferior, respectivamente, quando executamos cargas extremas. A metade esquerda do chassi sempre será mais quente do que a direita devido à forma como a solução de resfriamento e os processadores estão posicionados no interior.
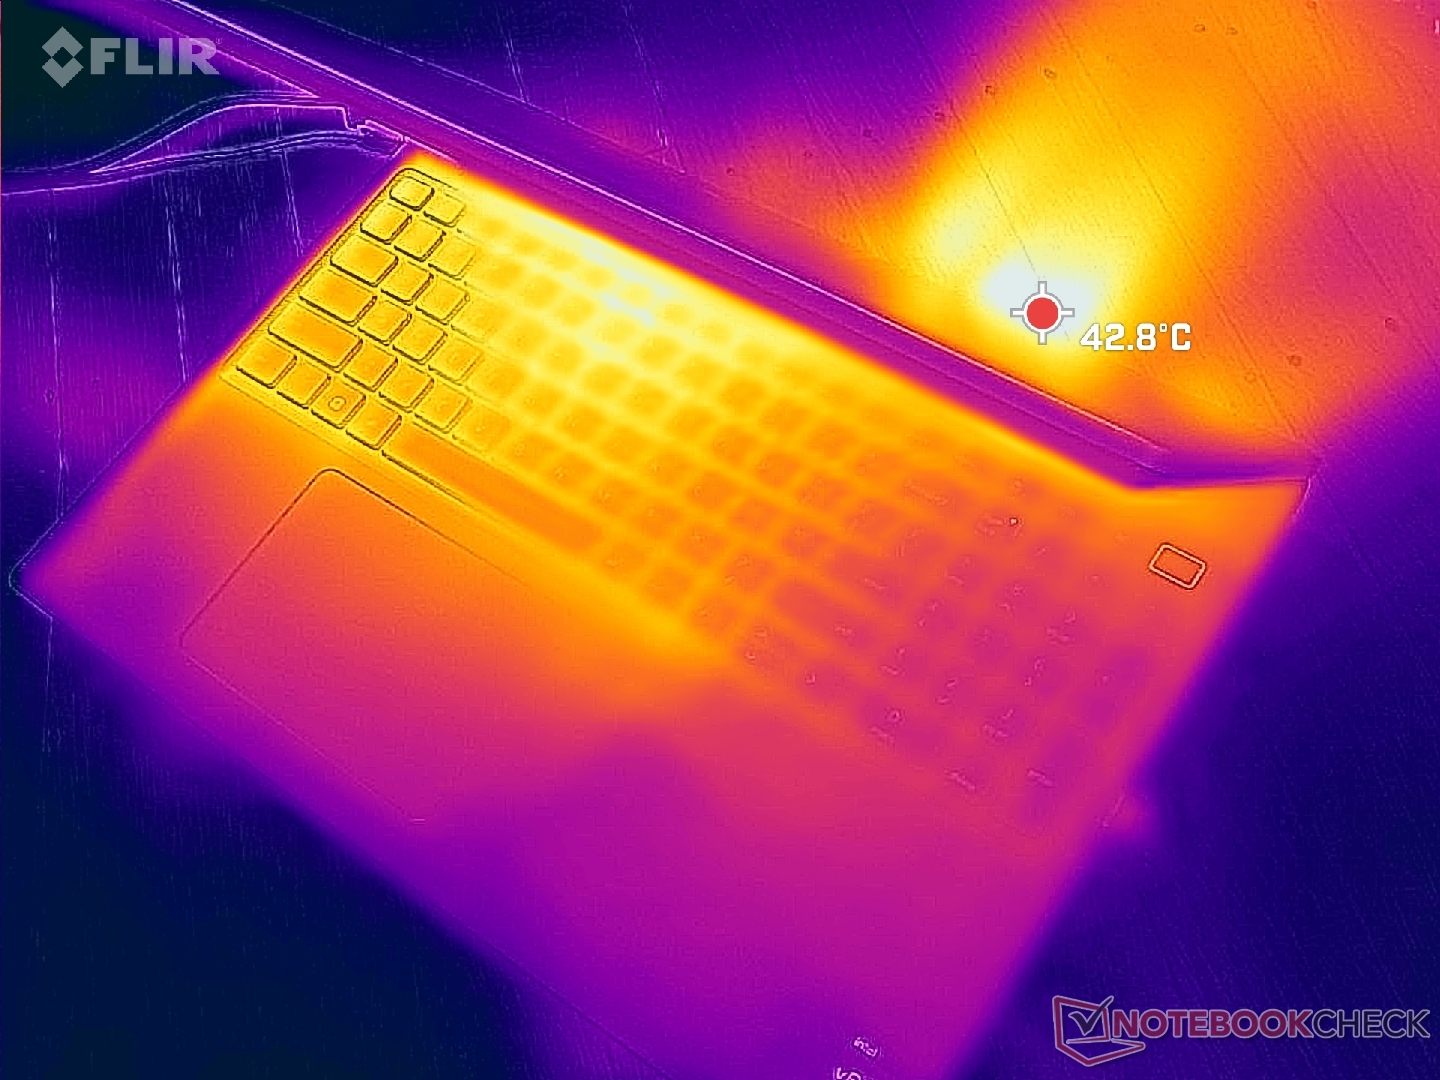
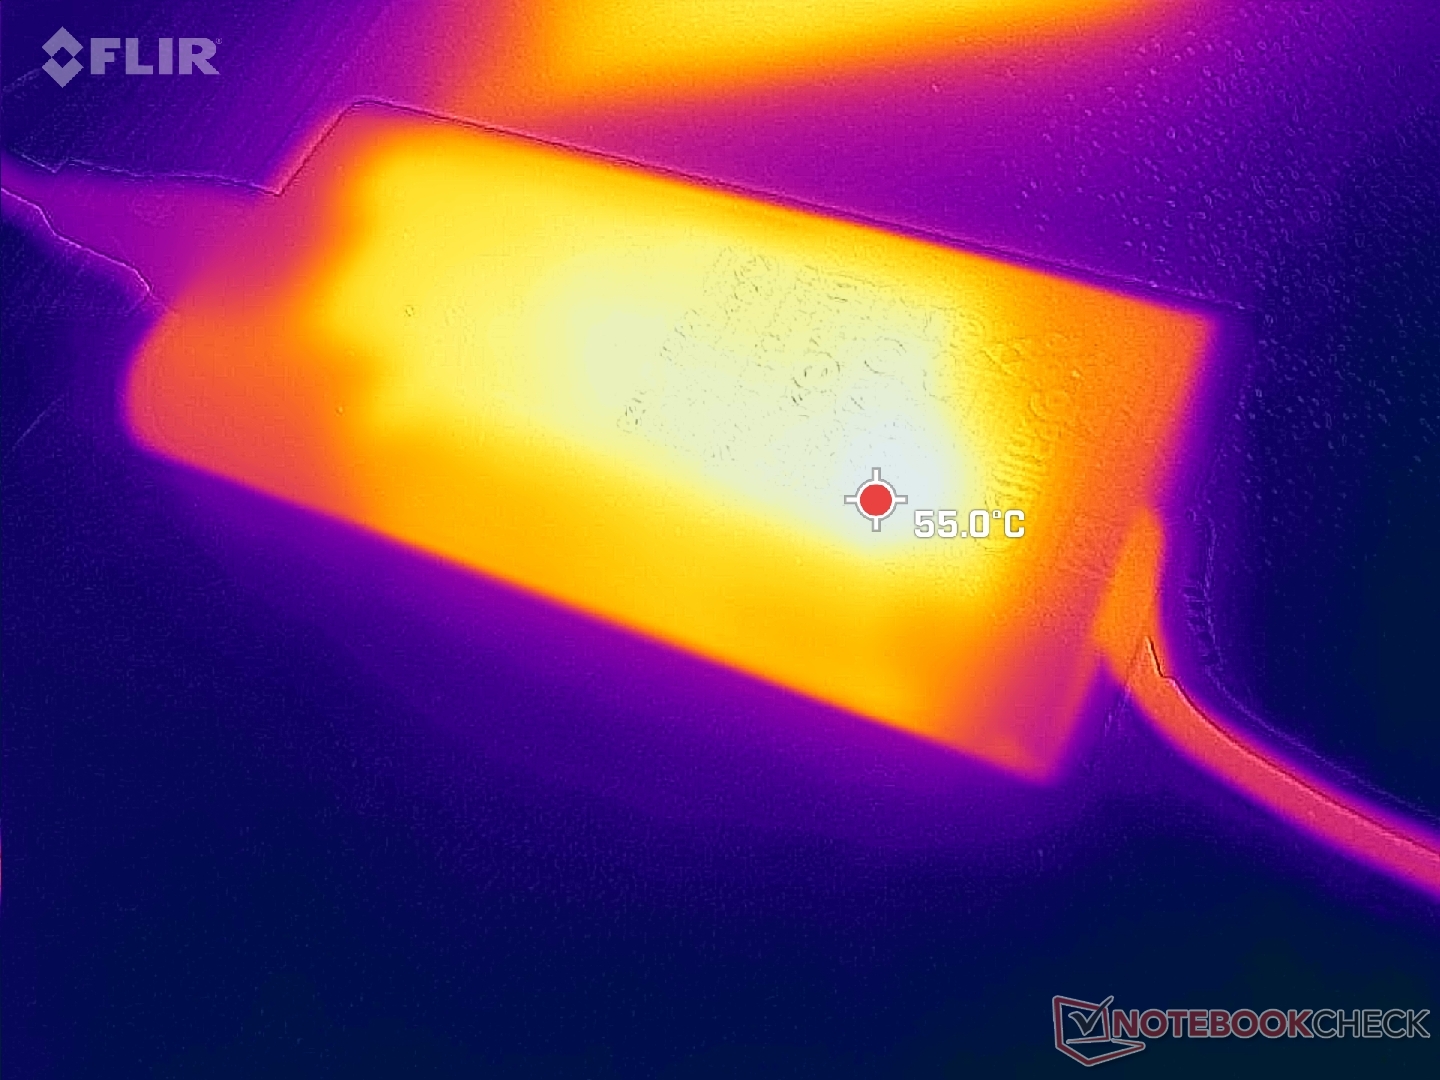
(-) A temperatura máxima no lado superior é 51 °C / 124 F, em comparação com a média de 38.2 °C / 101 F , variando de 22.2 a 69.8 °C para a classe Workstation.
(-) A parte inferior aquece até um máximo de 45.8 °C / 114 F, em comparação com a média de 41.1 °C / 106 F
(+) Em uso inativo, a temperatura média para o lado superior é 29.8 °C / 86 F, em comparação com a média do dispositivo de 32 °C / ### class_avg_f### F.
(±) Jogando The Witcher 3, a temperatura média para o lado superior é 37.1 °C / 99 F, em comparação com a média do dispositivo de 32 °C / ## #class_avg_f### F.
(+) Os apoios para as mãos e o touchpad estão atingindo a temperatura máxima da pele (34.2 °C / 93.6 F) e, portanto, não estão quentes.
(-) A temperatura média da área do apoio para as mãos de dispositivos semelhantes foi 27.8 °C / 82 F (-6.4 °C / -11.6 F).
| Dell Precision 7670 Intel Core i7-12850HX, NVIDIA RTX A2000 Laptop GPU | Lenovo ThinkPad P1 G4-20Y4Z9DVUS Intel Core i7-11800H, NVIDIA T1200 Laptop GPU | Asus ProArt StudioBook 16 W7600H5A-2BL2 Intel Xeon W-11955M, NVIDIA RTX A5000 Laptop GPU | Dell Precision 5000 5560 Intel Core i7-11850H, NVIDIA RTX A2000 Laptop GPU | Dell Precision 7550 Intel Xeon W-10885M, NVIDIA Quadro RTX 5000 Max-Q | HP ZBook Fury 15 G8 Intel Core i9-11950H, NVIDIA RTX A5000 Laptop GPU | |
|---|---|---|---|---|---|---|
| Heat | 5% | -3% | -1% | 2% | 4% | |
| Maximum Upper Side * (°C) | 51 | 49.9 2% | 45.7 10% | 48.2 5% | 49 4% | 45.6 11% |
| Maximum Bottom * (°C) | 45.8 | 56.7 -24% | 48.3 -5% | 42.6 7% | 51 -11% | 57.6 -26% |
| Idle Upper Side * (°C) | 31.8 | 25.5 20% | 35.3 -11% | 34.8 -9% | 28.2 11% | 26 18% |
| Idle Bottom * (°C) | 32.6 | 26.2 20% | 34.4 -6% | 35.2 -8% | 32 2% | 28.8 12% |
* ... menor é melhor
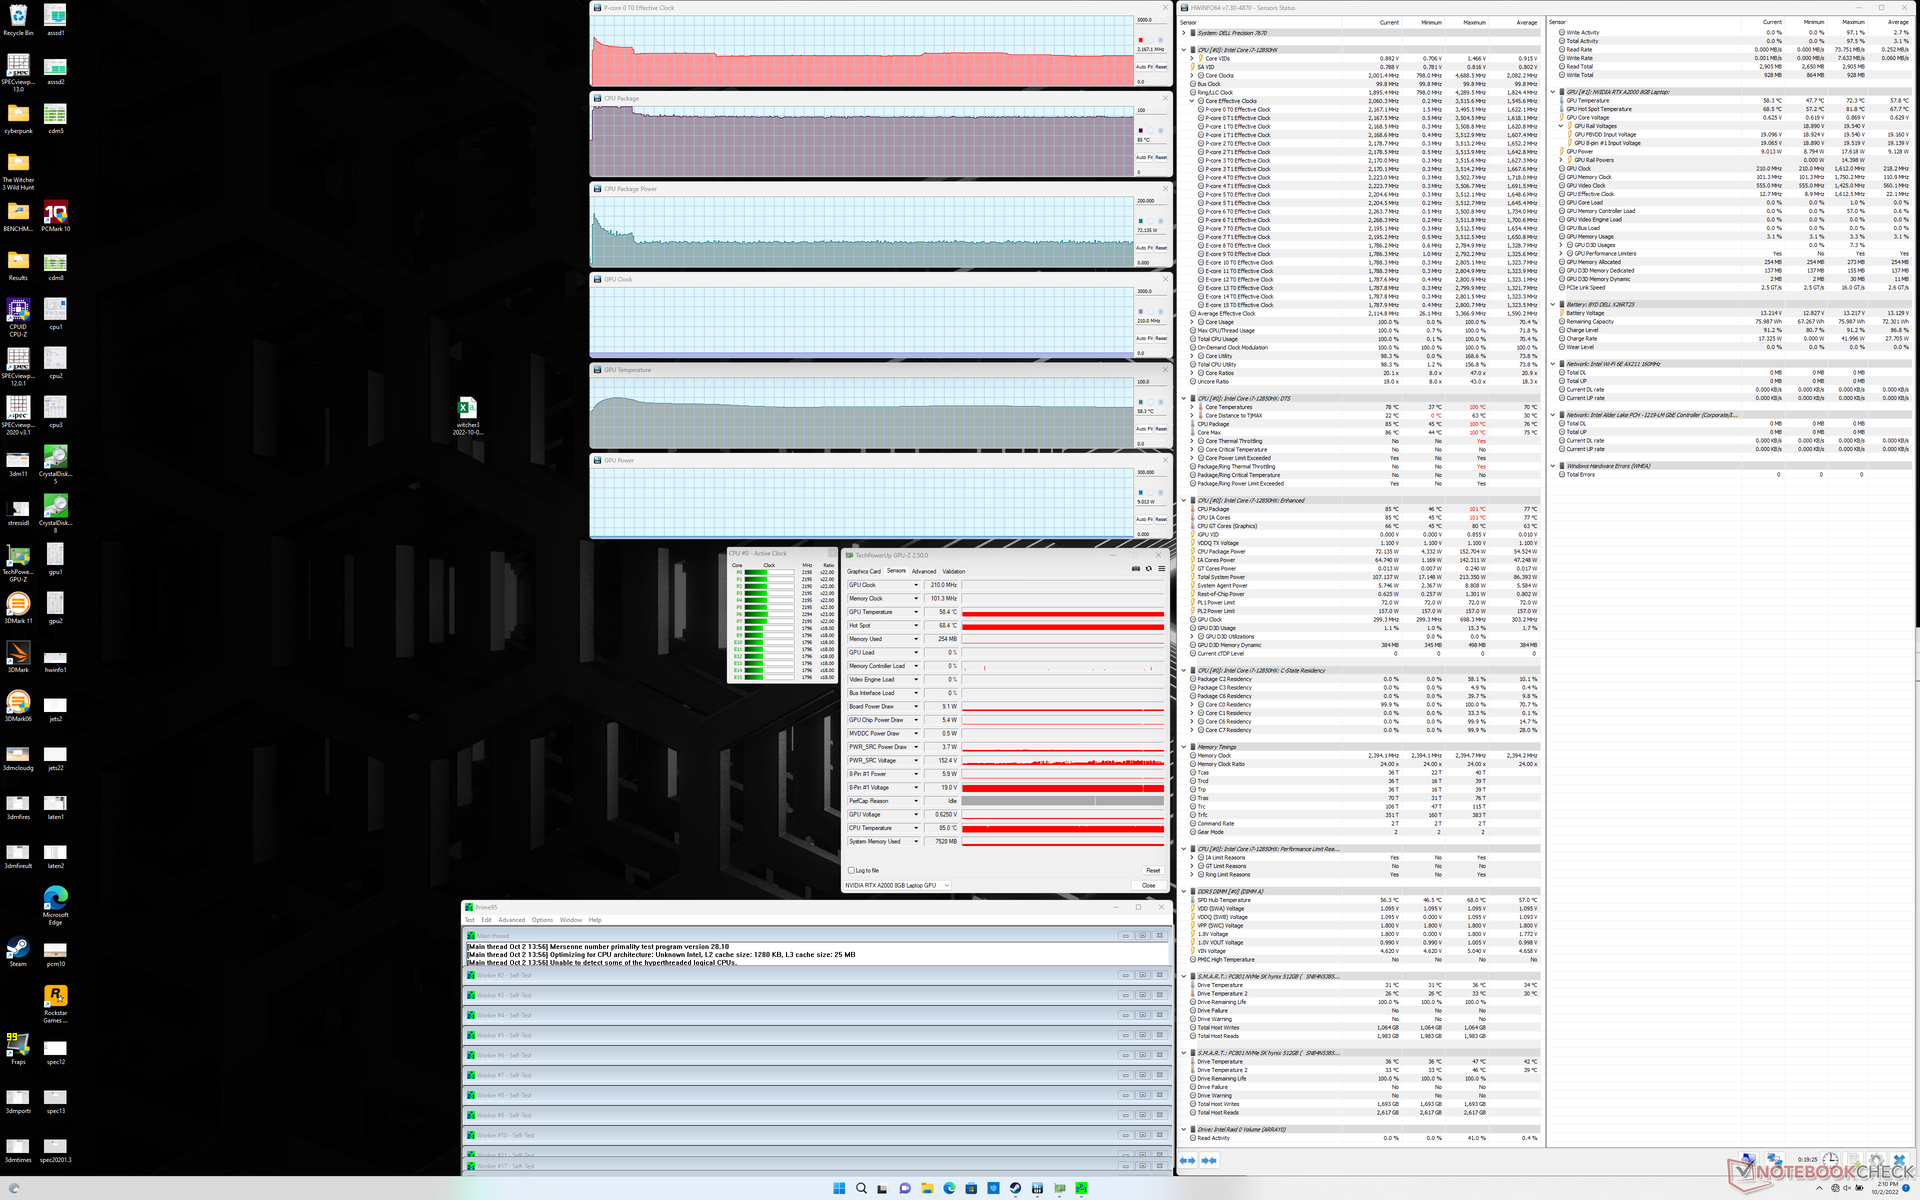
Teste de estresse
Ao executar Prime95 para enfatizar a CPU, as taxas de clock e o consumo de energia da placa aumentariam para 3,5 GHz e 153 W, respectivamente, durando apenas alguns segundos, no máximo. A temperatura central chegaria a 100 C durante este breve período. As taxas de relógios e o consumo de energia cairiam então constantemente antes de estabilizarem em 2,2 a 2,4 GHz e 73 W, respectivamente, a fim de manter uma temperatura central mais tolerável de 85 C. O desempenho do Turbo Boost não é, portanto, tão bom quanto esperávamos, considerando o tamanho desta estação de trabalho.
Ao rodar Witcher 3 para representar uma carga pesada constante, as taxas de relógio da GPU, temperatura e consumo de energia se estabilizariam em 1777 MHz, 80 C e 80 W, respectivamente, em comparação com 1462 MHz, 75 C e 45 W, respectivamente, no menor Precision 5560 com a mesma GPU RTX A2000.
Funcionando com o desempenho dos limites de potência da bateria. Um teste Fire Strike em baterias retornaria resultados de Física e Gráficos de 9820 e 6911 pontos, respectivamente, em comparação com 23868 e 14295 pontos quando em rede elétrica.
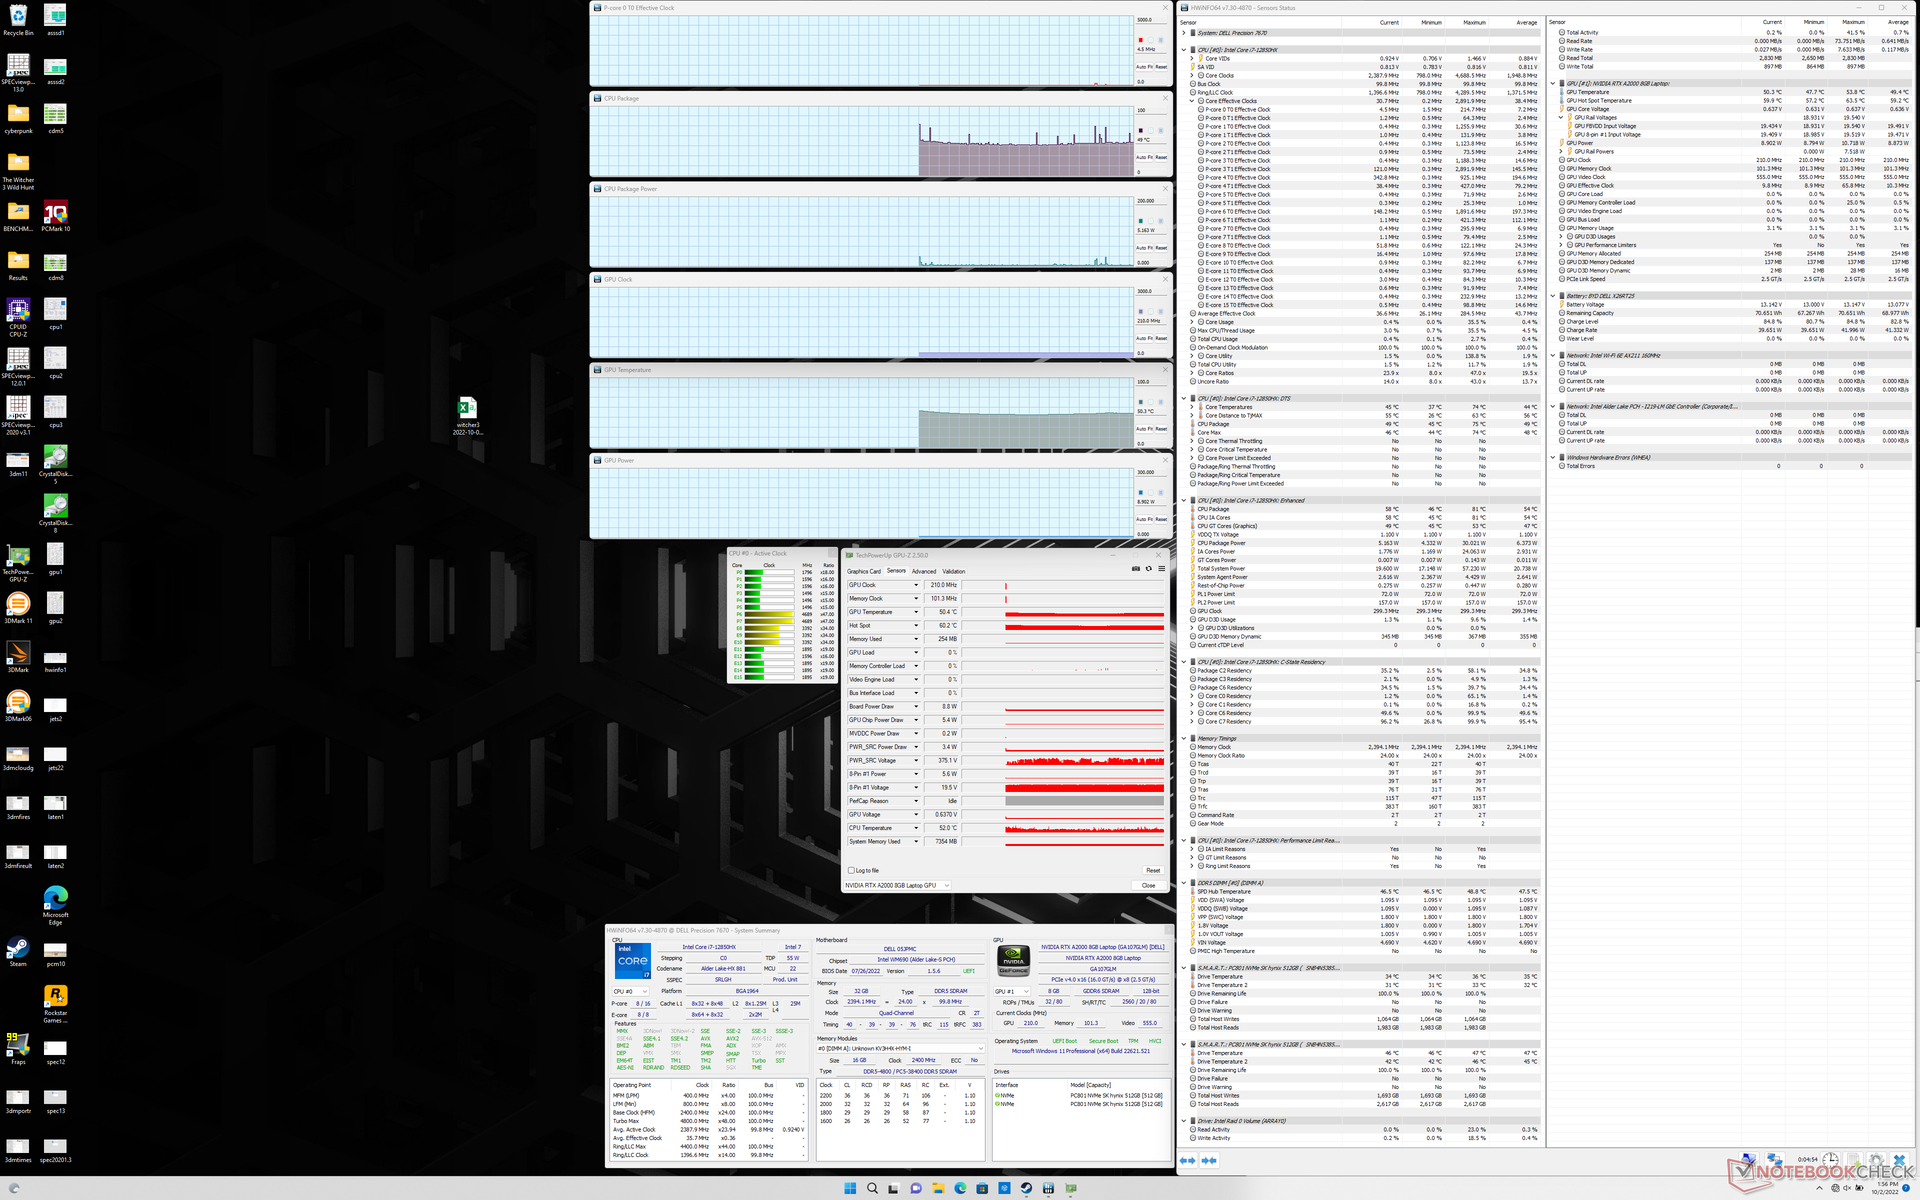
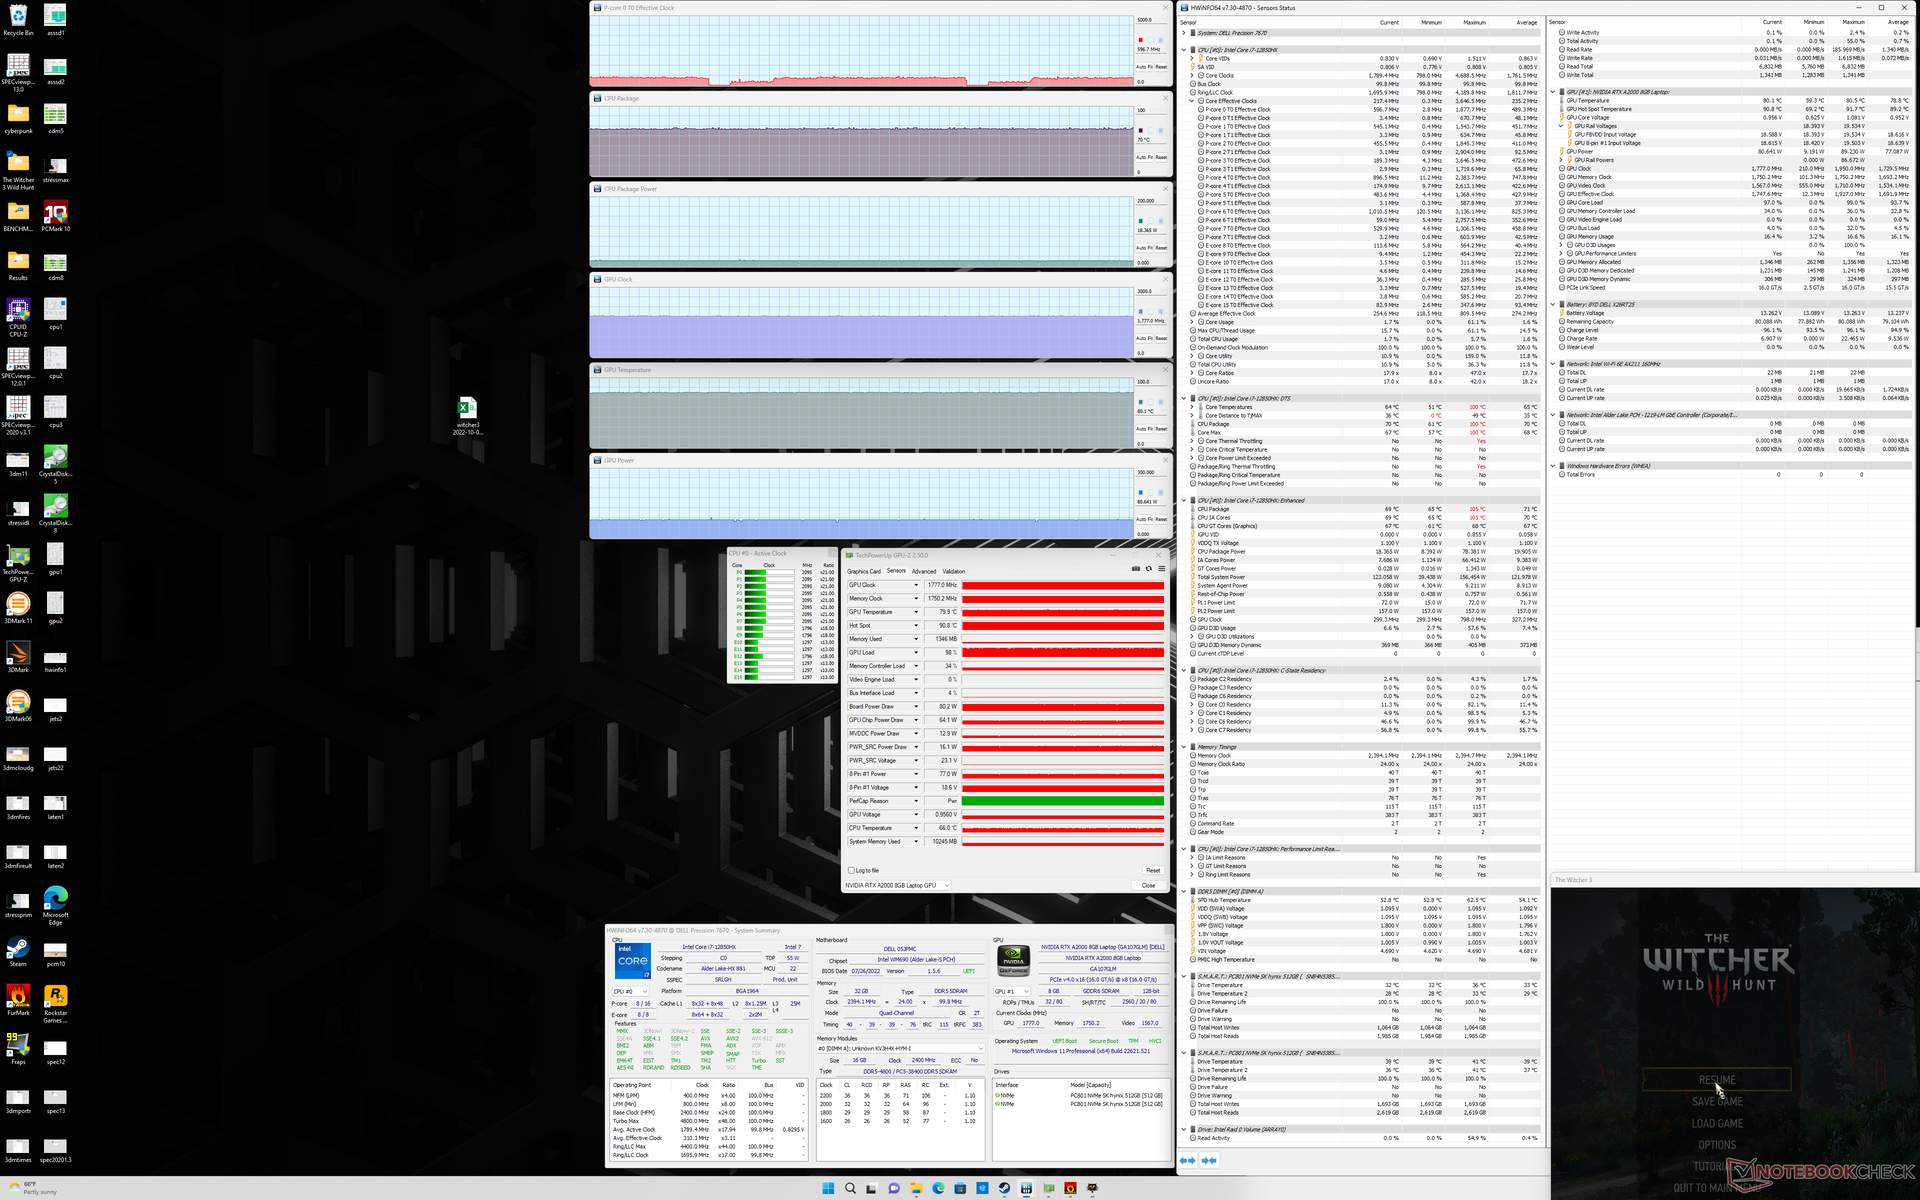
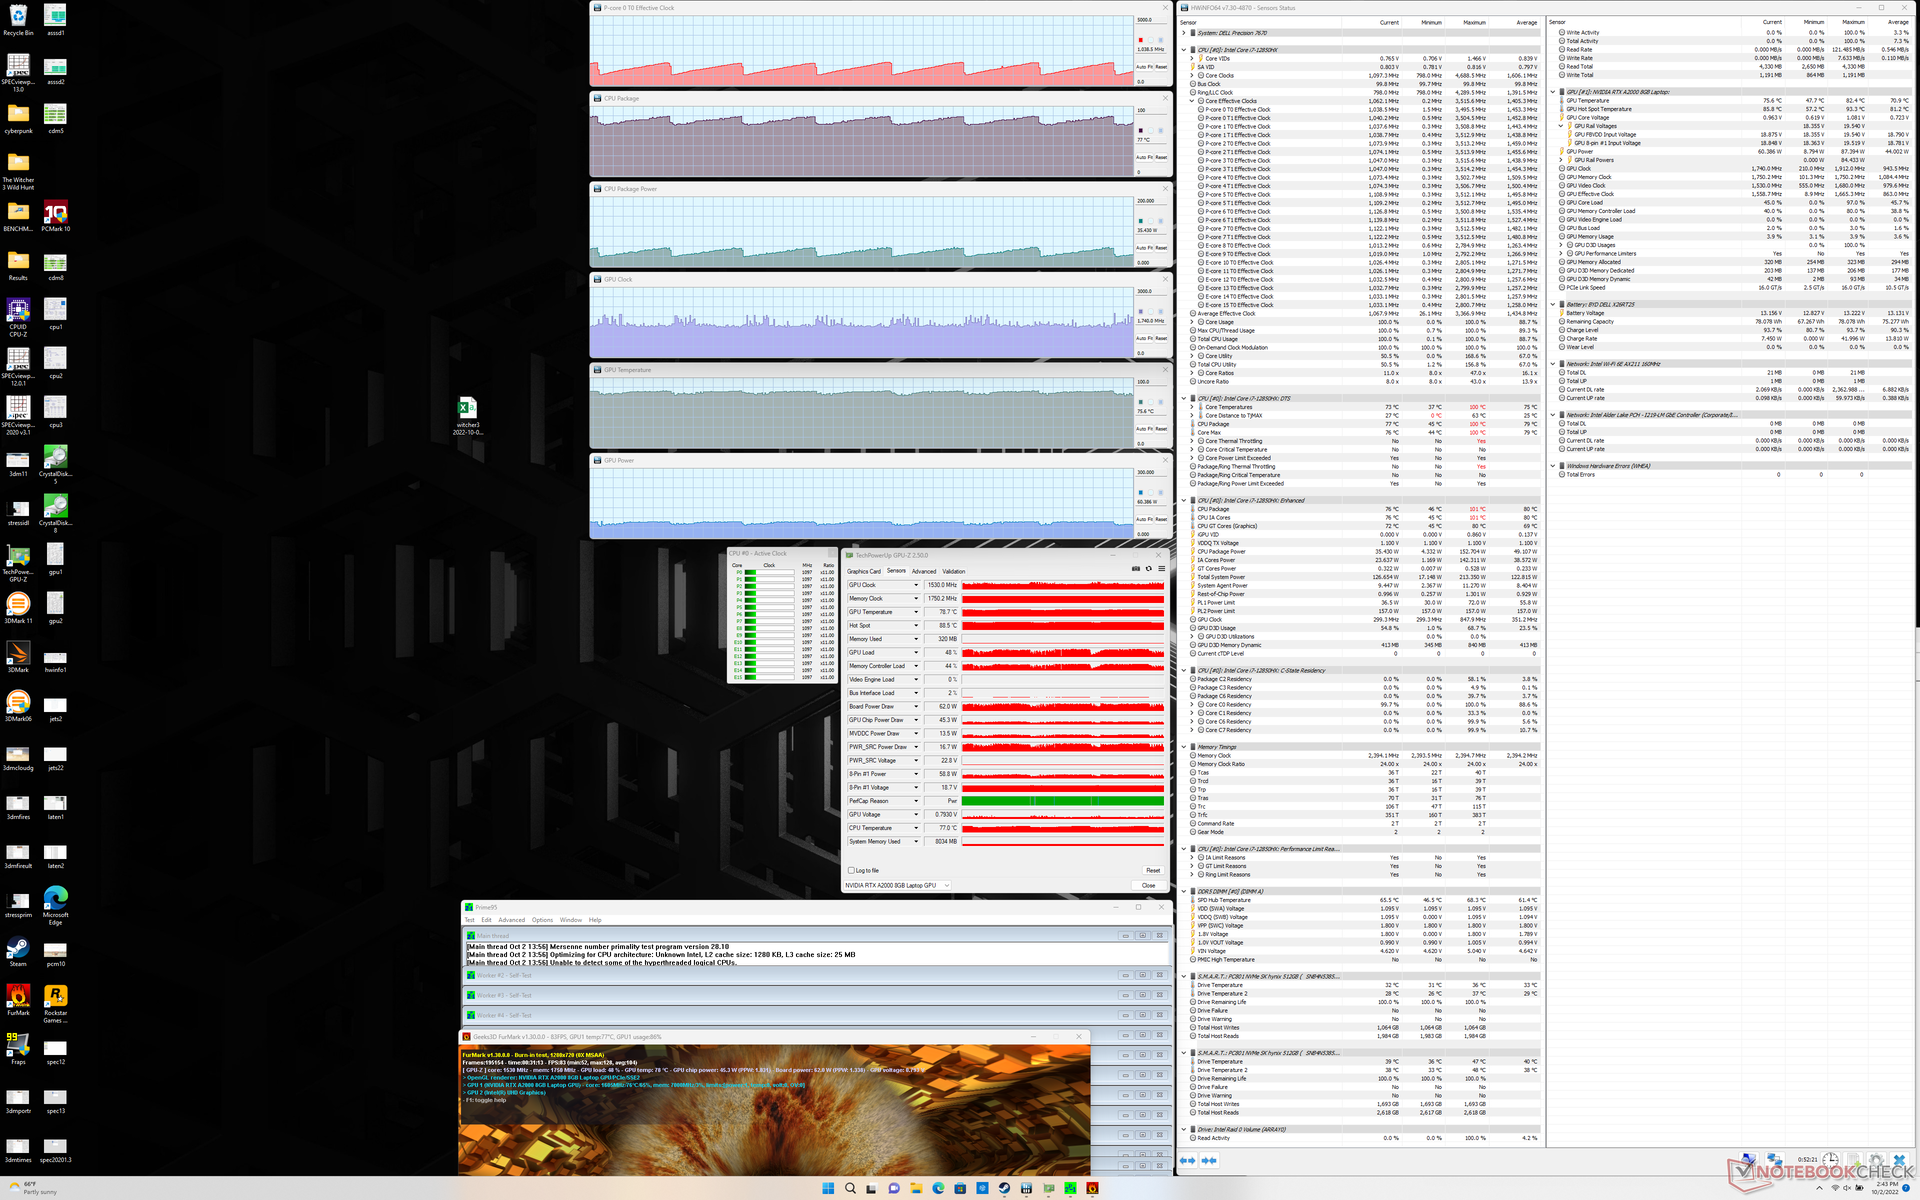
| Relógio CPU (GHz) | Relógio GPU (MHz) | Temperatura média da CPU (°C) | Temperatura média da GPU (°C) | |
| System Idle | -- | -- | 49 | 50 |
| Prime95 Stress | 2.2 | -- | 85 | 58 |
| Prime95 + FurMark Stress | 0.8 - 1.3 | ~1450 | 76 - 86 | 62 - 72 |
| Witcher 3 Stress | 0.6 | 1777 | 70 | 80 |
Oradores
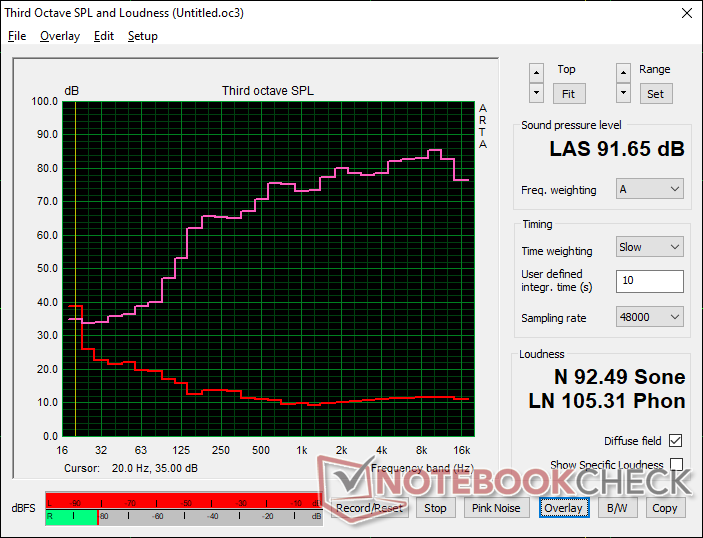
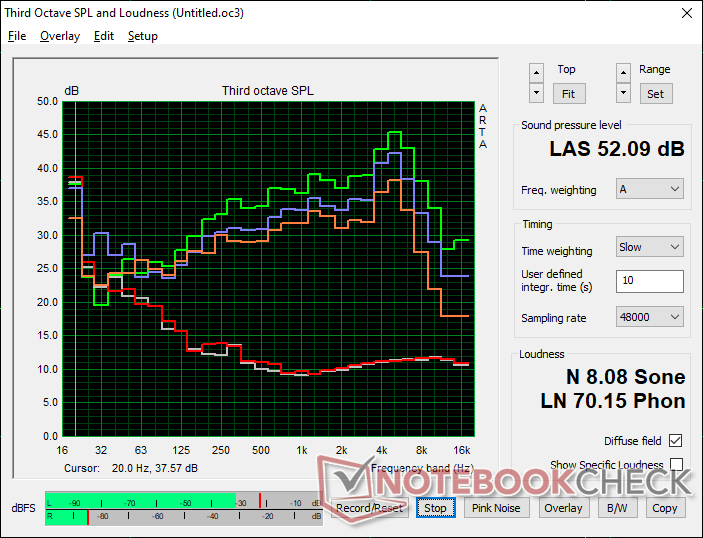
Dell Precision 7670 análise de áudio
(+) | os alto-falantes podem tocar relativamente alto (###valor### dB)
Graves 100 - 315Hz
(-) | quase nenhum baixo - em média 16.8% menor que a mediana
(+) | o baixo é linear (6.7% delta para a frequência anterior)
Médios 400 - 2.000 Hz
(+) | médios equilibrados - apenas 3.5% longe da mediana
(+) | médios são lineares (3.9% delta para frequência anterior)
Altos 2 - 16 kHz
(+) | agudos equilibrados - apenas 4.6% longe da mediana
(+) | os máximos são lineares (2% delta da frequência anterior)
Geral 100 - 16.000 Hz
(+) | o som geral é linear (12.2% diferença em relação à mediana)
Comparado com a mesma classe
» 18% de todos os dispositivos testados nesta classe foram melhores, 3% semelhantes, 79% piores
» O melhor teve um delta de 7%, a média foi 17%, o pior foi 35%
Comparado com todos os dispositivos testados
» 10% de todos os dispositivos testados foram melhores, 2% semelhantes, 88% piores
» O melhor teve um delta de 4%, a média foi 23%, o pior foi 134%
Apple MacBook Pro 16 2021 M1 Pro análise de áudio
(+) | os alto-falantes podem tocar relativamente alto (###valor### dB)
Graves 100 - 315Hz
(+) | bons graves - apenas 3.8% longe da mediana
(+) | o baixo é linear (5.2% delta para a frequência anterior)
Médios 400 - 2.000 Hz
(+) | médios equilibrados - apenas 1.3% longe da mediana
(+) | médios são lineares (2.1% delta para frequência anterior)
Altos 2 - 16 kHz
(+) | agudos equilibrados - apenas 1.9% longe da mediana
(+) | os máximos são lineares (2.7% delta da frequência anterior)
Geral 100 - 16.000 Hz
(+) | o som geral é linear (4.6% diferença em relação à mediana)
Comparado com a mesma classe
» 0% de todos os dispositivos testados nesta classe foram melhores, 0% semelhantes, 100% piores
» O melhor teve um delta de 5%, a média foi 17%, o pior foi 45%
Comparado com todos os dispositivos testados
» 0% de todos os dispositivos testados foram melhores, 0% semelhantes, 100% piores
» O melhor teve um delta de 4%, a média foi 23%, o pior foi 134%
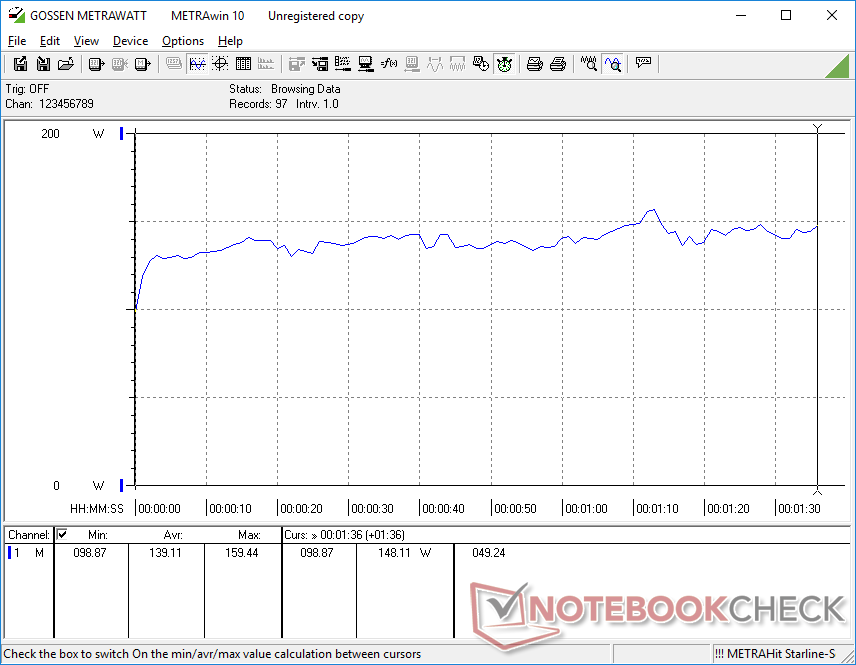
Gestão de energia - Muito exigente
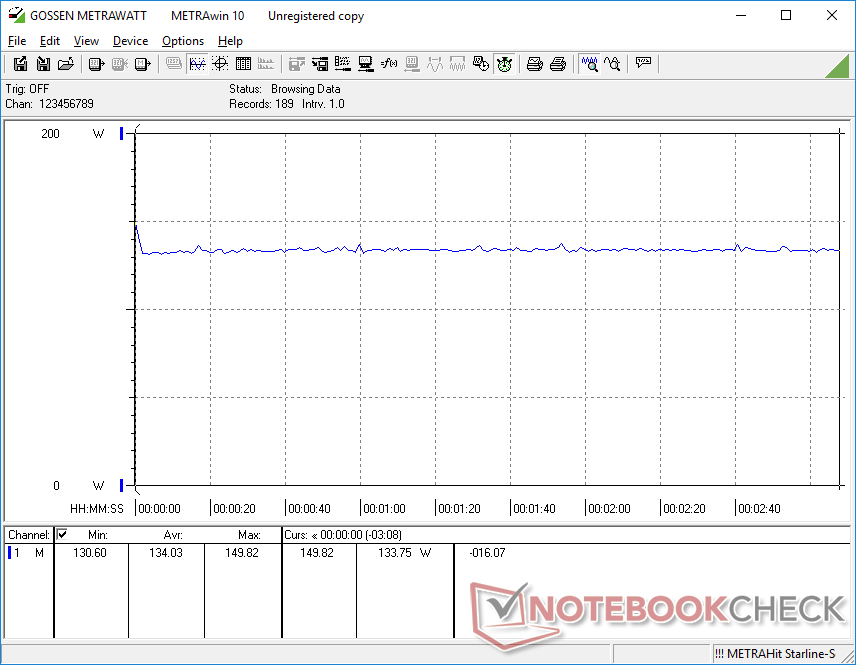
Consumo de energia
O sistema é bastante exigente sob a maioria das condições. O consumo de energia varia entre 7 W e 25 W quando ocioso na mesa de trabalho, enquanto cargas mais altas como 3DMark 06 ou Witcher 3 atrairia cerca de 140 W cada. O Asus ProArt StudioBook 16 ou Precision 5560 desenharia apenas 132 W ou 96 W em condições semelhantes em comparação
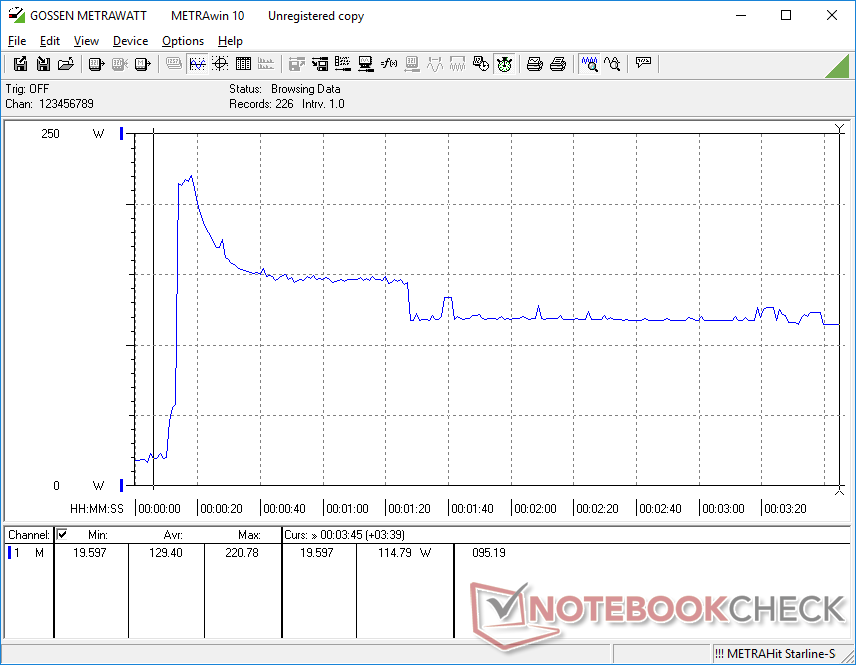
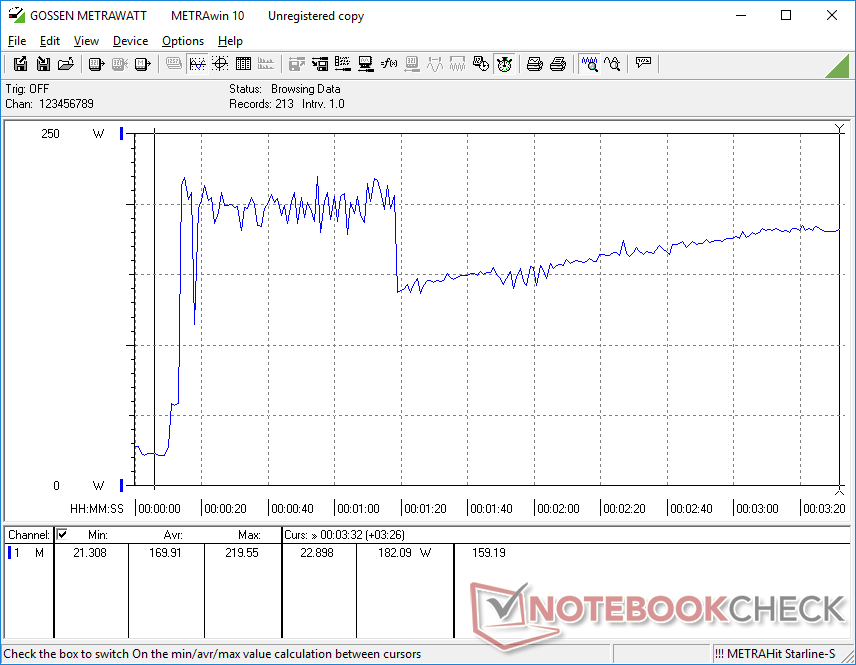
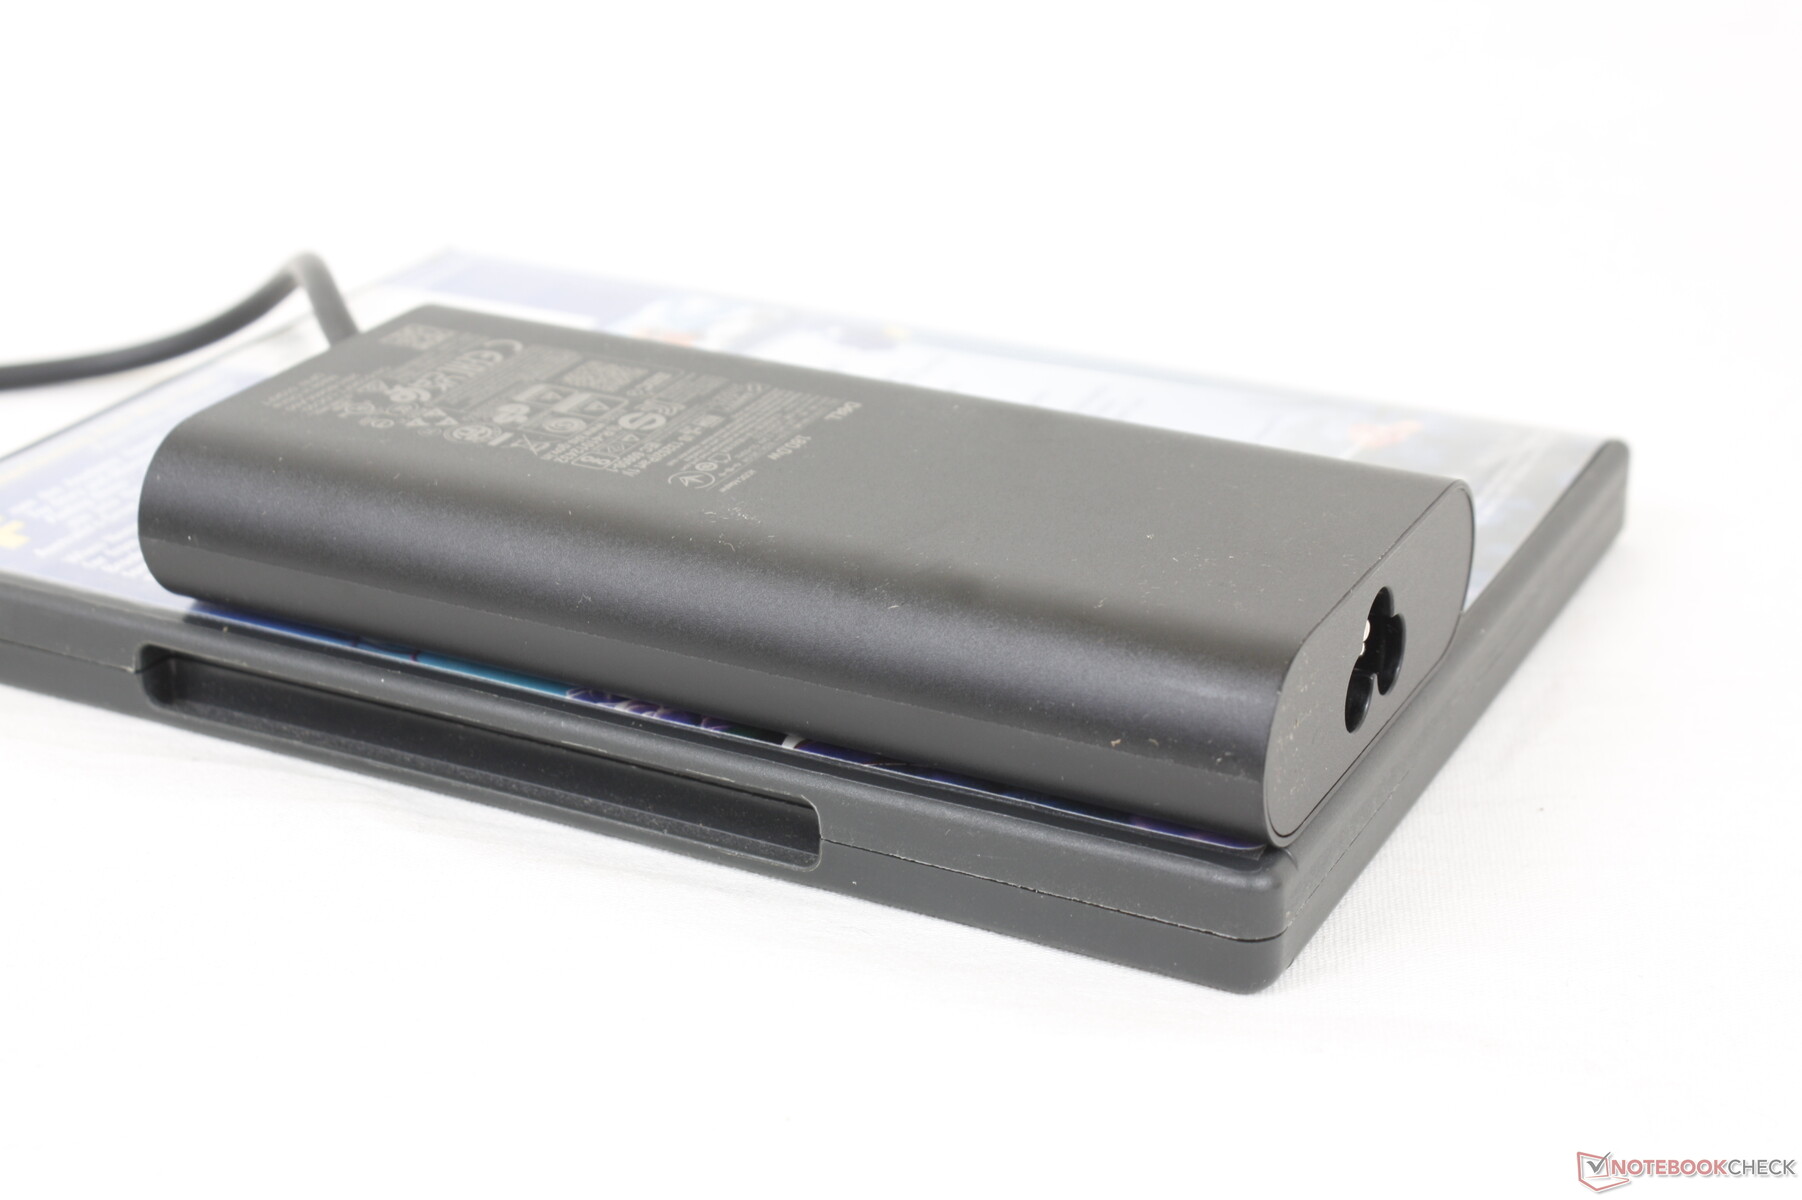
O consumo de energia pode chegar a 221 W quando a CPU e a GPU estão em utilização máxima, apesar do fato de que o adaptador AC de médio porte (~13,7 x 6,6 x 2,3 cm) é classificado para 180 W apenas. Esta taxa extremamente alta duraria apenas um minuto no máximo antes de cair para 114 W se a CPU estiver estressada ou 180 W se tanto a CPU quanto a GPU estiverem estressadas simultaneamente. A taxa de carregamento do laptop pode parar se, como resultado, sob tais condições extremas
A Dell oferece um adaptador AC de 240 W mais capaz se configurar o Precision 7670 com opções mais rápidas de GPU. Com base em nossas descobertas com o adaptador CA de 180 W, entretanto, talvez a opção de 240 W deva ser padrão em todas as configurações Nvidia RTX.
| desligado | |
| Ocioso | |
| Carga |
|
Key:
min: | |
| Dell Precision 7670 i7-12850HX, RTX A2000 Laptop GPU, SK Hynix HFS001TEJ9X115N, OLED, 3840x2400, 16" | Lenovo ThinkPad P1 G4-20Y4Z9DVUS i7-11800H, T1200 Laptop GPU, Samsung PM9A1 MZVL2512HCJQ, IPS, 2560x1600, 16" | Asus ProArt StudioBook 16 W7600H5A-2BL2 W-11955M, RTX A5000 Laptop GPU, 2x Micron 2300 2TB MTFDHBA2T0TDV (RAID 0), OLED, 3840x2400, 16" | Dell Precision 5000 5560 i7-11850H, RTX A2000 Laptop GPU, Samsung PM9A1 MZVL22T0HBLB, IPS, 3840x2400, 15.6" | Dell Precision 7550 W-10885M, Quadro RTX 5000 Max-Q, SK Hynix PC601A NVMe 1TB, IPS, 3840x2160, 15.6" | HP ZBook Fury 15 G8 i9-11950H, RTX A5000 Laptop GPU, Samsung PM981a MZVLB1T0HBLR, IPS, 3840x2160, 15.6" | |
|---|---|---|---|---|---|---|
| Power Consumption | 9% | -14% | 16% | -12% | -13% | |
| Idle Minimum * (Watt) | 7.5 | 9.9 -32% | 12.4 -65% | 6.2 17% | 8.2 -9% | 8.3 -11% |
| Idle Average * (Watt) | 9.5 | 13.9 -46% | 16.5 -74% | 13.9 -46% | 16.8 -77% | 19.9 -109% |
| Idle Maximum * (Watt) | 28.4 | 14.6 49% | 25 12% | 23.8 16% | 24.4 14% | 21.8 23% |
| Load Average * (Watt) | 139.1 | 95 32% | 132 5% | 95.7 31% | 131 6% | 110.9 20% |
| Witcher 3 ultra * (Watt) | 134 | 98.9 26% | 132 1% | 87 35% | 156.6 -17% | 165 -23% |
| Load Maximum * (Watt) | 220.8 | 170.8 23% | 134 39% | 132.6 40% | 201.8 9% | 171.8 22% |
* ... menor é melhor
Power Consumption Witcher 3 / Stresstest
Power Consumption external Monitor
Vida útil da bateria
O tempo de funcionamento da WLAN é apenas 6 horas para ser mais curto do que no Precision 5560 ou Precision 7550. Isto é em grande parte devido ao painel OLED que consome mais energia do que o IPS ao exibir cores brancas. Como a maioria dos sites são predominantemente brancos, a vida útil geralmente mais curta da bateria não é inesperada
O carregamento com o adaptador AC incluído leva cerca de 2 horas. O sistema não pode ser recarregado via USB-C porque não suporta PD-in.
| Dell Precision 7670 i7-12850HX, RTX A2000 Laptop GPU, 83 Wh | Lenovo ThinkPad P1 G4-20Y4Z9DVUS i7-11800H, T1200 Laptop GPU, 90 Wh | Asus ProArt StudioBook 16 W7600H5A-2BL2 W-11955M, RTX A5000 Laptop GPU, 90 Wh | Dell Precision 5000 5560 i7-11850H, RTX A2000 Laptop GPU, 86 Wh | Dell Precision 7550 W-10885M, Quadro RTX 5000 Max-Q, 95 Wh | HP ZBook Fury 15 G8 i9-11950H, RTX A5000 Laptop GPU, 94 Wh | |
|---|---|---|---|---|---|---|
| Duração da bateria | 49% | -15% | 32% | 23% | 5% | |
| Reader / Idle (h) | 7.9 | 12 52% | 11.1 41% | |||
| WiFi v1.3 (h) | 5.9 | 8.8 49% | 5 -15% | 6.3 7% | 8.9 51% | 6.2 5% |
| Load (h) | 1.3 | 1.8 38% | 1 -23% | |||
| H.264 (h) | 1.8 | |||||
| Witcher 3 ultra (h) | 1.6 |
Pro
Contra
Veredicto - Poderoso sem ser grande demais
O Precision 7670 compete diretamente contra o HP ZBook Fury 16 G9. Como ainda não revisamos o modelo HP, só podemos comparar nosso Precision com o modelo de 16 polegadasLenovo ThinkPad P1 G4 ouAsus ProArt StudioBook Pro 16 W7600. O modelo Dell é capaz de oferecer um desempenho de CPU significativamente mais rápido do que ambos ao lado de muito mais recursos auxiliares, incluindo facilidade de manutenção, conectividade WAN e mais opções de armazenamento.
O Precision 7670 está no seu melhor quando configurado com opções de CPU e GPU mais avançadas. Nas opções mais baixas, no entanto, é possível encontrar alternativas mais finas e leves que podem oferecer aproximadamente o mesmo nível de desempenho.
O peso é uma desvantagem importante do Precision 7670, pois o sistema é quase tão pesado quanto o maior, de 17,3 polegadas Precision 7550. Além disso, é um pouco decepcionante que o Core i7-12850HX não possa sustentar as taxas de relógio Turbo Boost por períodos prolongados, apesar do peso pesado. Ele ainda é rápido, mas a solução de resfriamento em excesso aqui está limitando seu potencial. A falta de qualquer opção de CPU Xeon faz com que o Precision 7670 se sinta mais como um laptop do tipo Studio do que uma estação de trabalho completa que é comercializada para ser.
O Precision 7670 ainda é ótimo para usuários de energia que podem se beneficiar de ter todos aqueles núcleos Intel da 12ª geração famintos de energia e uma GPU RTX A5500 de alta qualidade. Para configurações inferiores, porém, modelos mais finos e leves de 16 polegadas como o Lenovo ou o Asus acima mencionado ainda podem ser alternativas decentes.
Preço e Disponibilidade
O Precision 7670 está atualmente disponível em Newegg em apenas uma configuração. Recomendamos encomendar diretamente da Dell para uma seleção mais ampla de configurações e opções de garantia.
Dell Precision 7670
- 10/06/2022 v7 (old)
Allen Ngo
Price comparison

