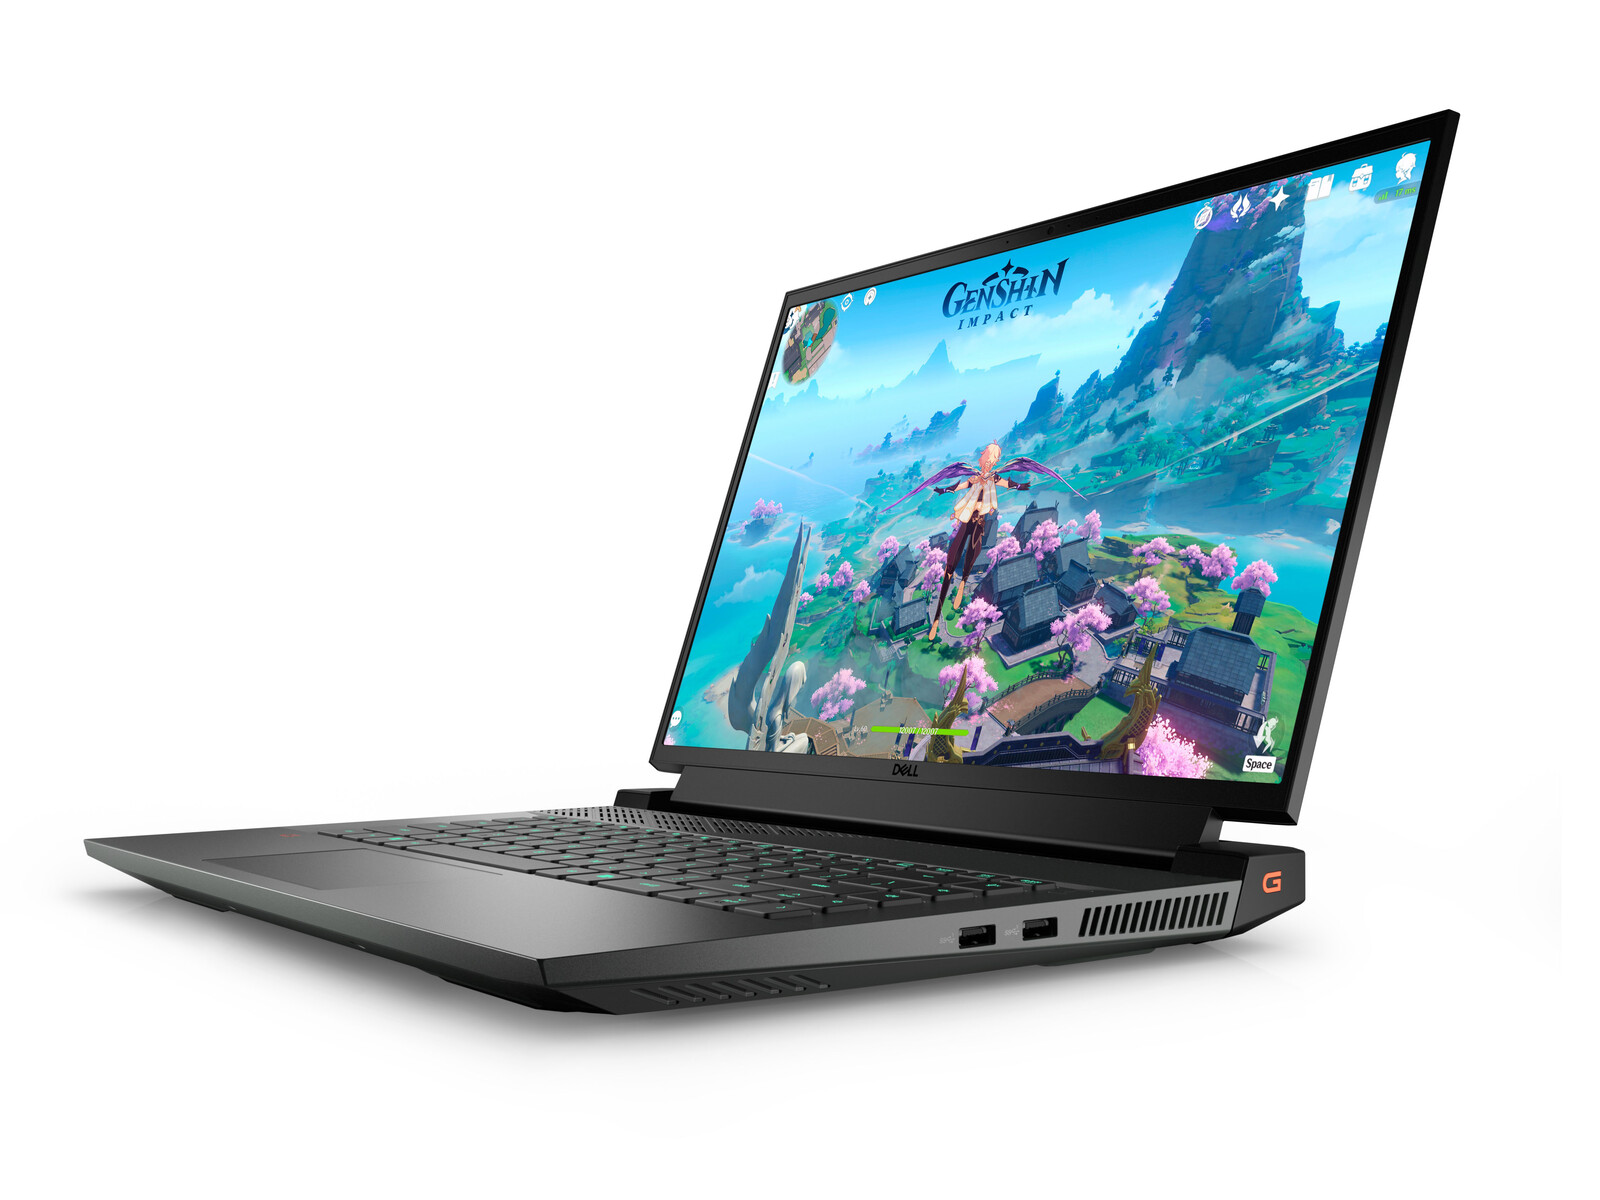
Revisão do laptop Dell G16 7620: Construção espessa para um desempenho rápido
A série G da Dell consiste de um orçamento para laptops para jogos de médio alcance em contraste com a série de computadores portáteis Alienware de alto nível. A série tem apenas alguns anos com os modelos iniciais G15 e G17 cobrindo os formatos de 15,6 e 17,3 polegadas, respectivamente. Para 2022, a Dell introduziu um modelo de 16 polegadas chamado G16 completo com as mais recentes CPUs Intel série 12th gen Core-H e GPUs Nvidia RTX Ampere
Nossa unidade em revisão é uma configuração de médio alcance com a CPU Core i7-12700H e 130 W GeForce GPU RTX 3060 por aproximadamente $1500 USD no varejo. Outras SKUs estão disponíveis com o mais lento RTX 3050 Ti, mais rápido RTX 3070 Ti, ou Core i9-12900H em seu lugar. Todas as configurações atuais, caso contrário, vêm com o mesmo display de 1600p 165 Hz
Os concorrentes neste espaço incluem outros laptops de 16 polegadas para jogos como o Lenovo Legion 7 16, HP Victus 16, Asus ROG Zephyrus M16ou Acer Swift X SFX16
Mais análises da Dell
Possíveis concorrentes em comparação
Avaliação | Data | Modelo | Peso | Altura | Size | Resolução | Preço |
|---|---|---|---|---|---|---|---|
| 86.1 % v7 (old) | 10/2022 | Dell G16 7620 i7-12700H, GeForce RTX 3060 Laptop GPU | 2.6 kg | 26.9 mm | 16.00" | 2560x1600 | |
| 90.8 % v7 (old) | 09/2022 | Lenovo Legion 7 16ARHA7 R9 6900HX, Radeon RX 6850M XT | 2.6 kg | 19.4 mm | 16.00" | 2560x1600 | |
| 82.3 % v7 (old) | 05/2022 | HP Victus 16-e0145ng R5 5600H, GeForce RTX 3050 Ti Laptop GPU | 2.4 kg | 23.5 mm | 16.10" | 1920x1080 | |
| 85.6 % v7 (old) | 07/2021 | Asus ROG Zephyrus M16 GU603H i9-11900H, GeForce RTX 3070 Laptop GPU | 2 kg | 20 mm | 16.00" | 2560x1600 | |
| 86.6 % v7 (old) | 07/2022 | Lenovo Legion 5 Pro 16IAH7H i7-12700H, GeForce RTX 3060 Laptop GPU | 2.6 kg | 27 mm | 16.00" | 2560x1600 | |
| 86.2 % v7 (old) | 07/2022 | Acer Swift X SFX16-51G-5388 i5-11320H, GeForce RTX 3050 4GB Laptop GPU | 1.8 kg | 18.9 mm | 16.10" | 1920x1080 |
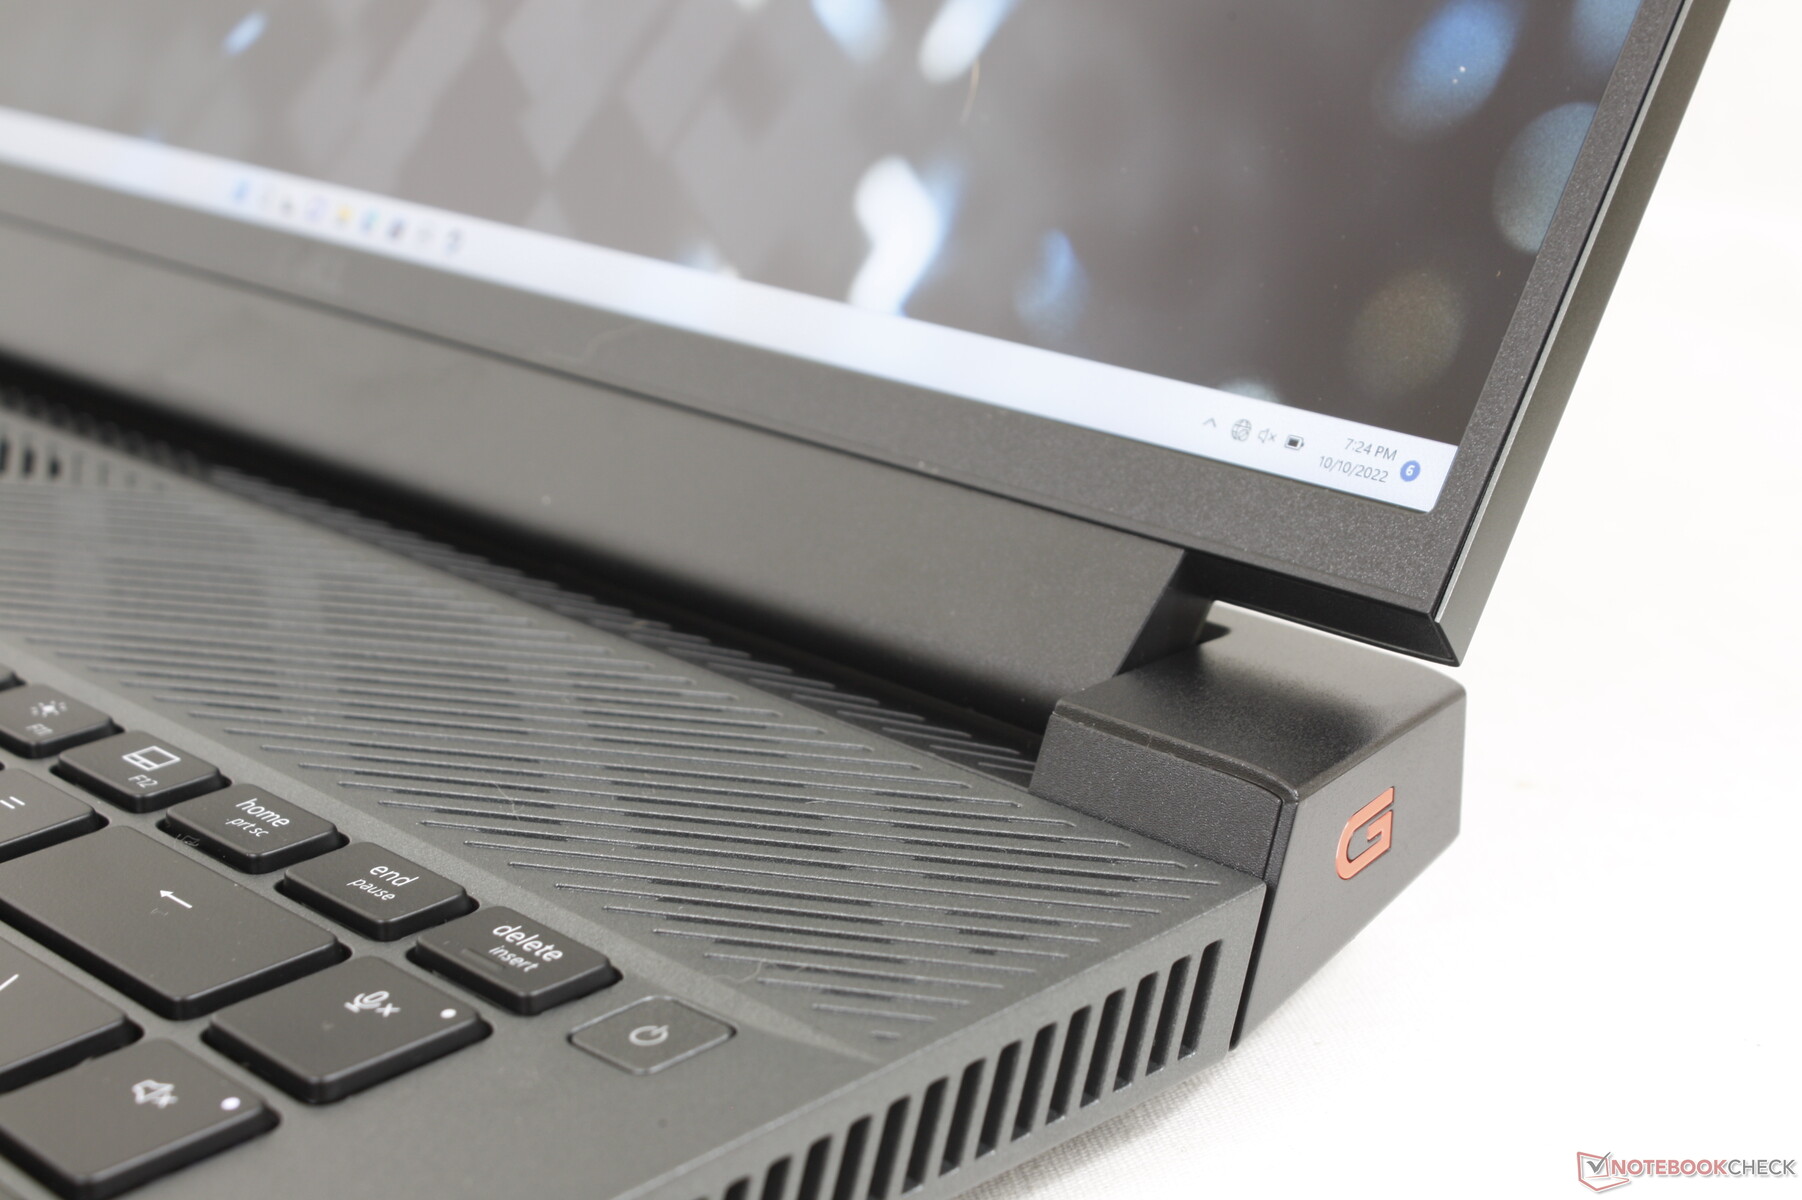
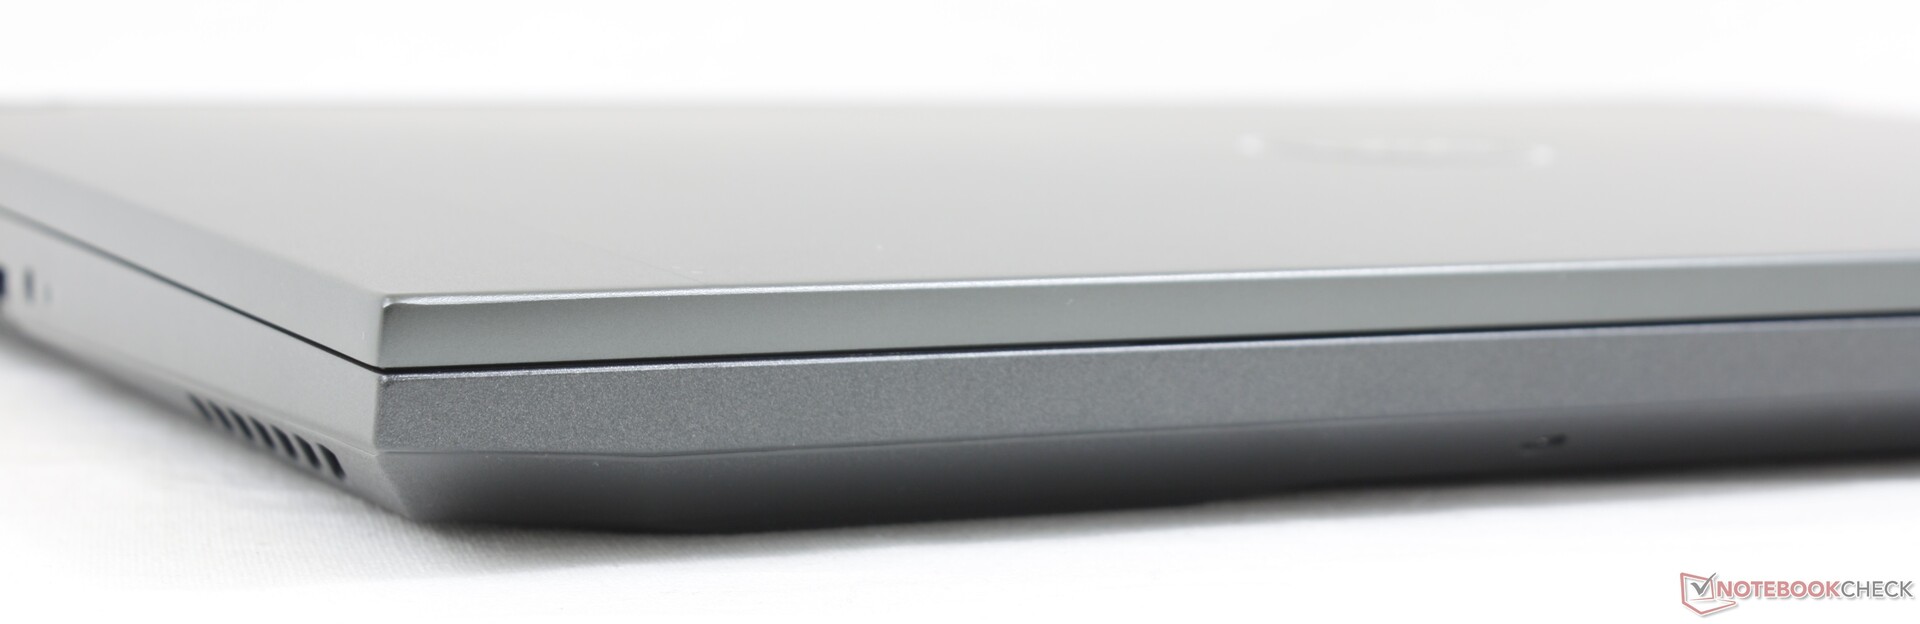
Estojo - Um G15 maior
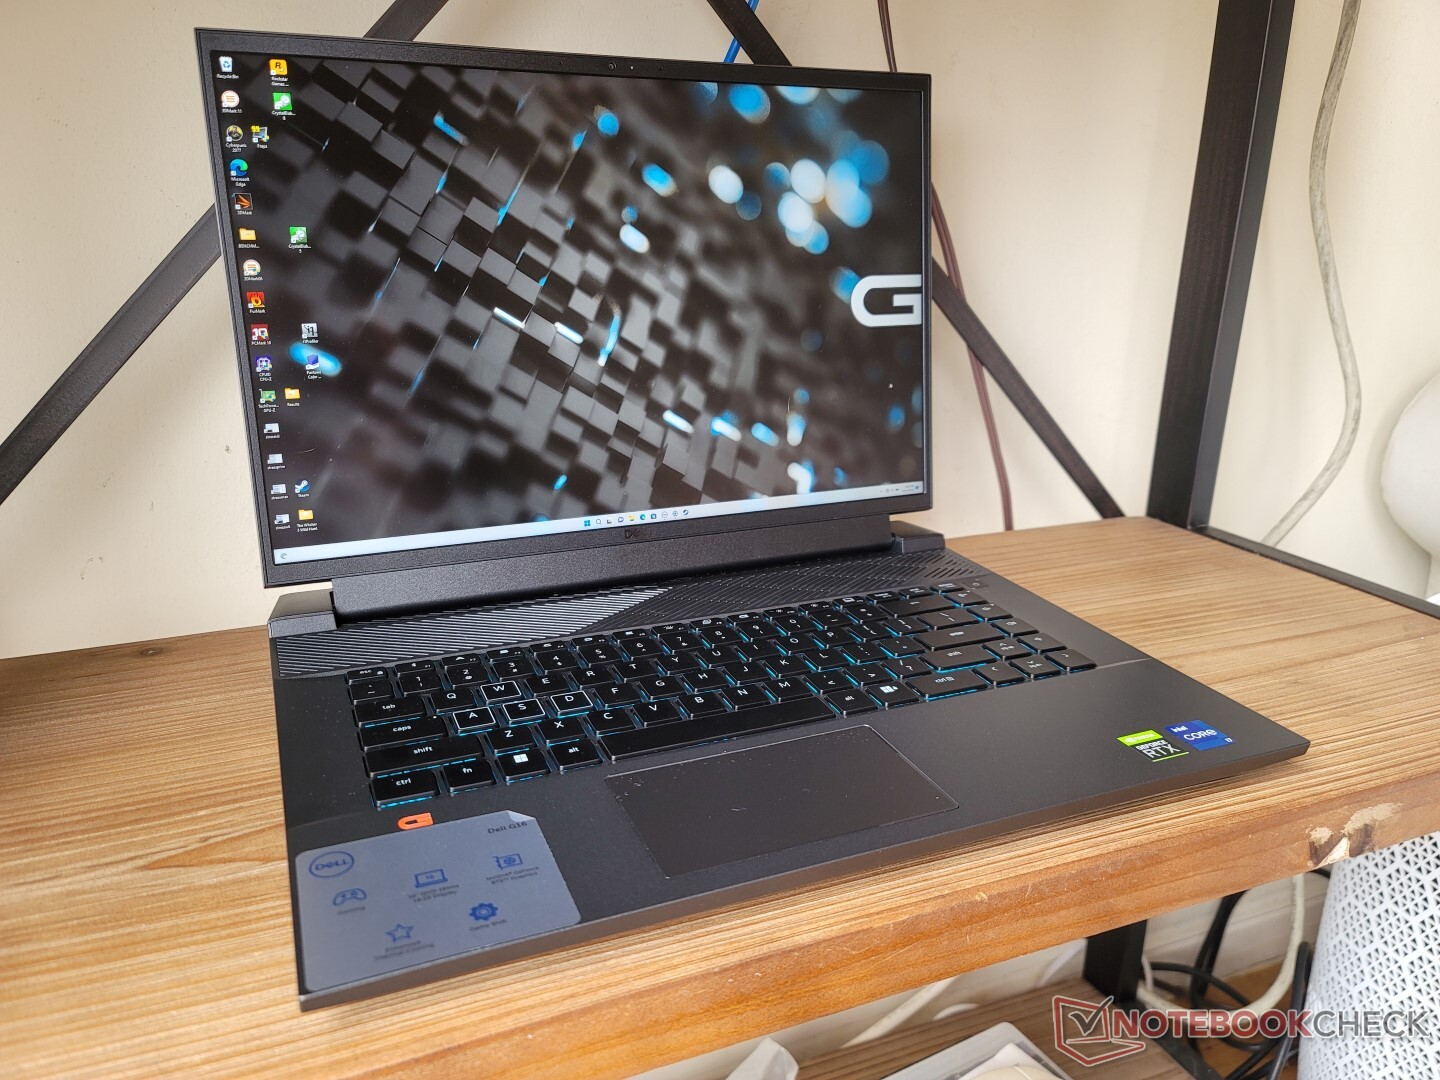
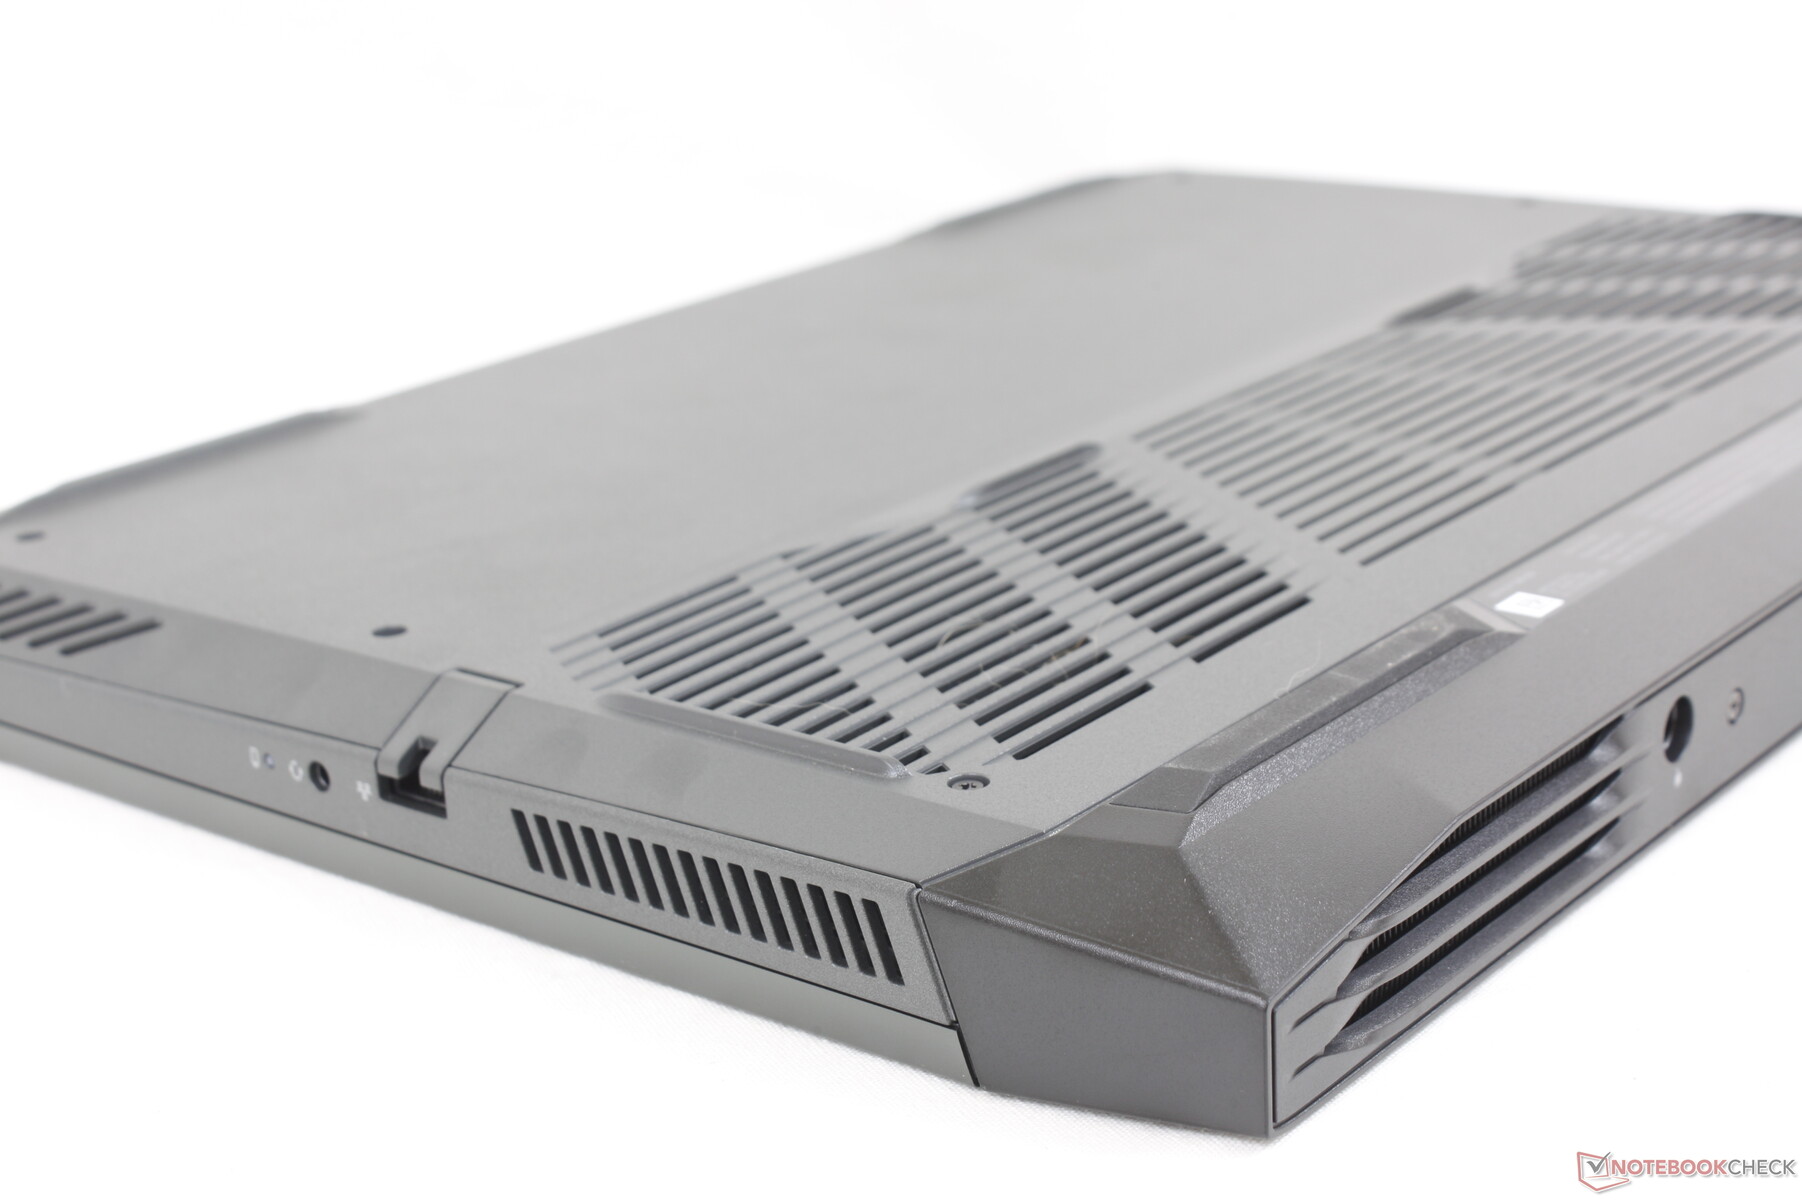
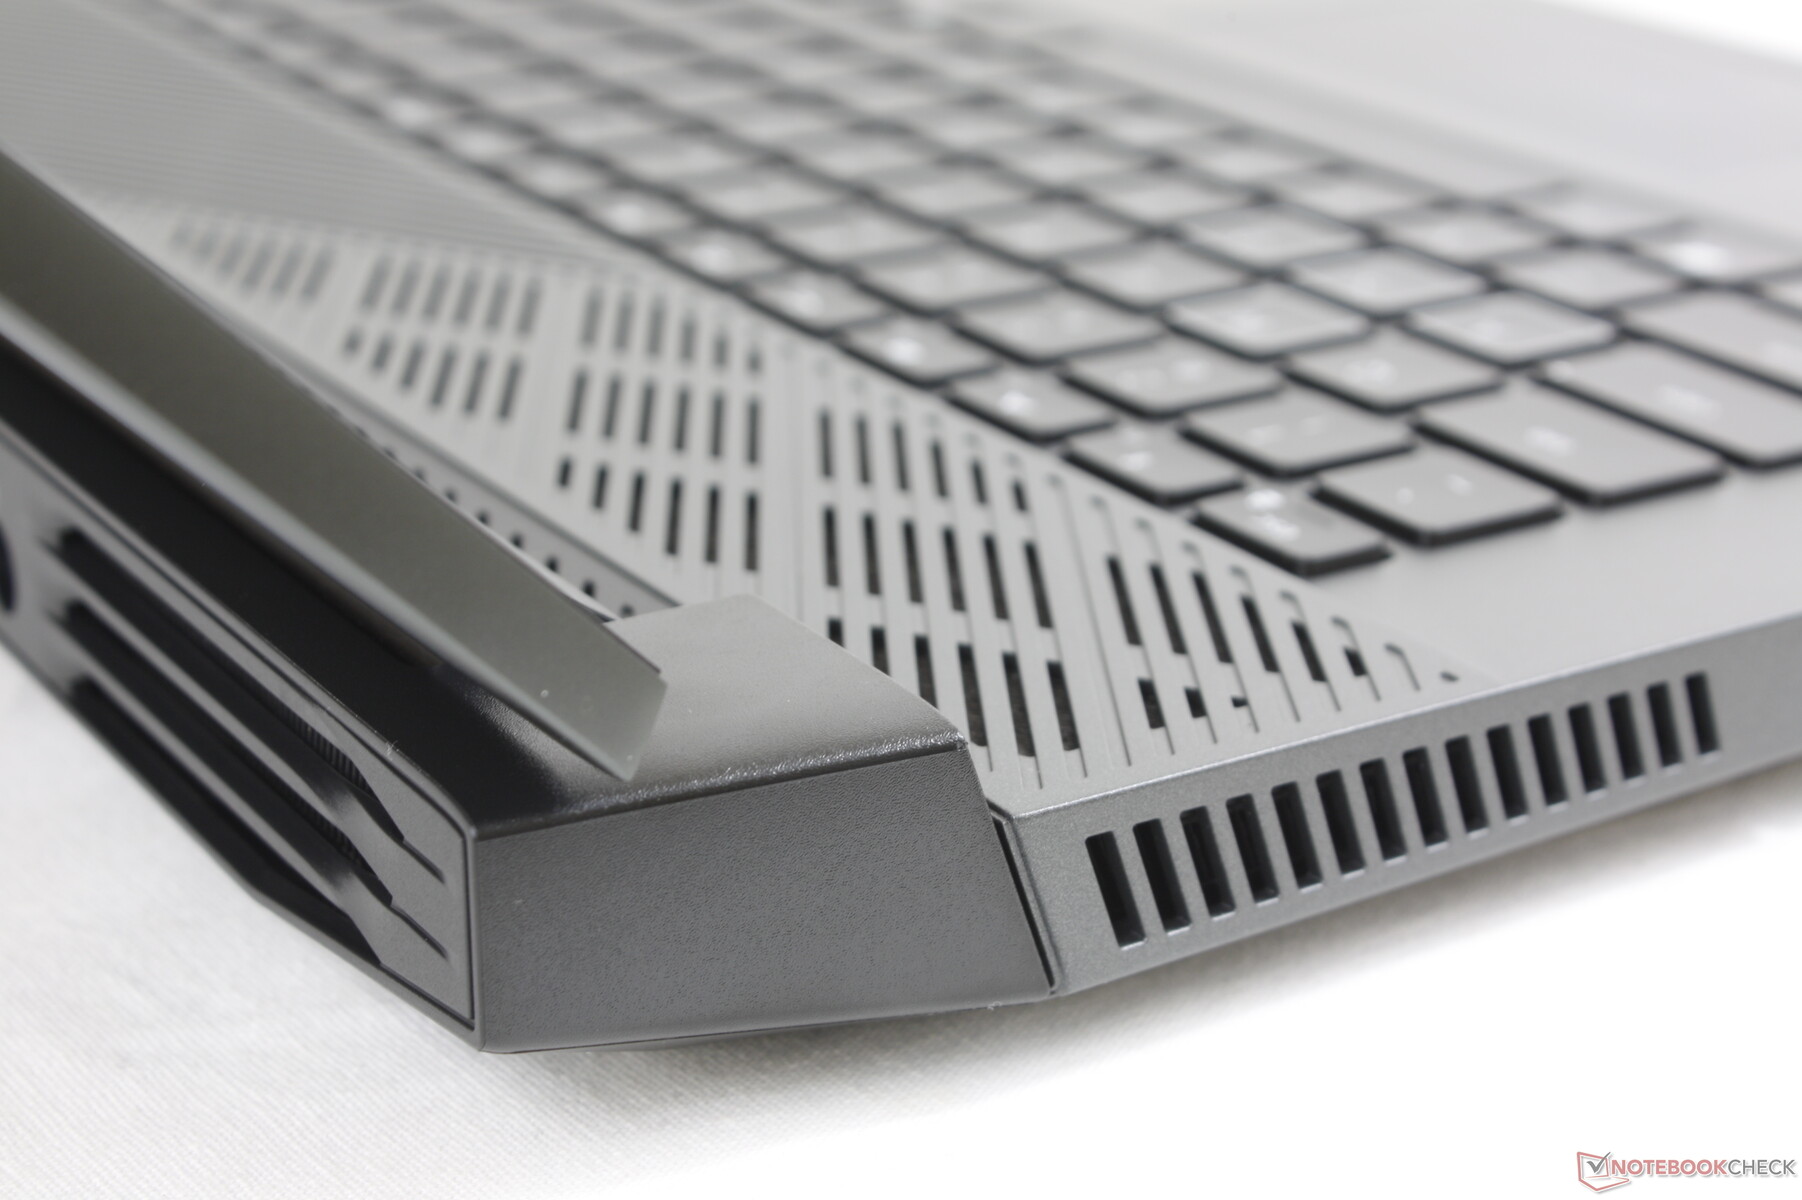
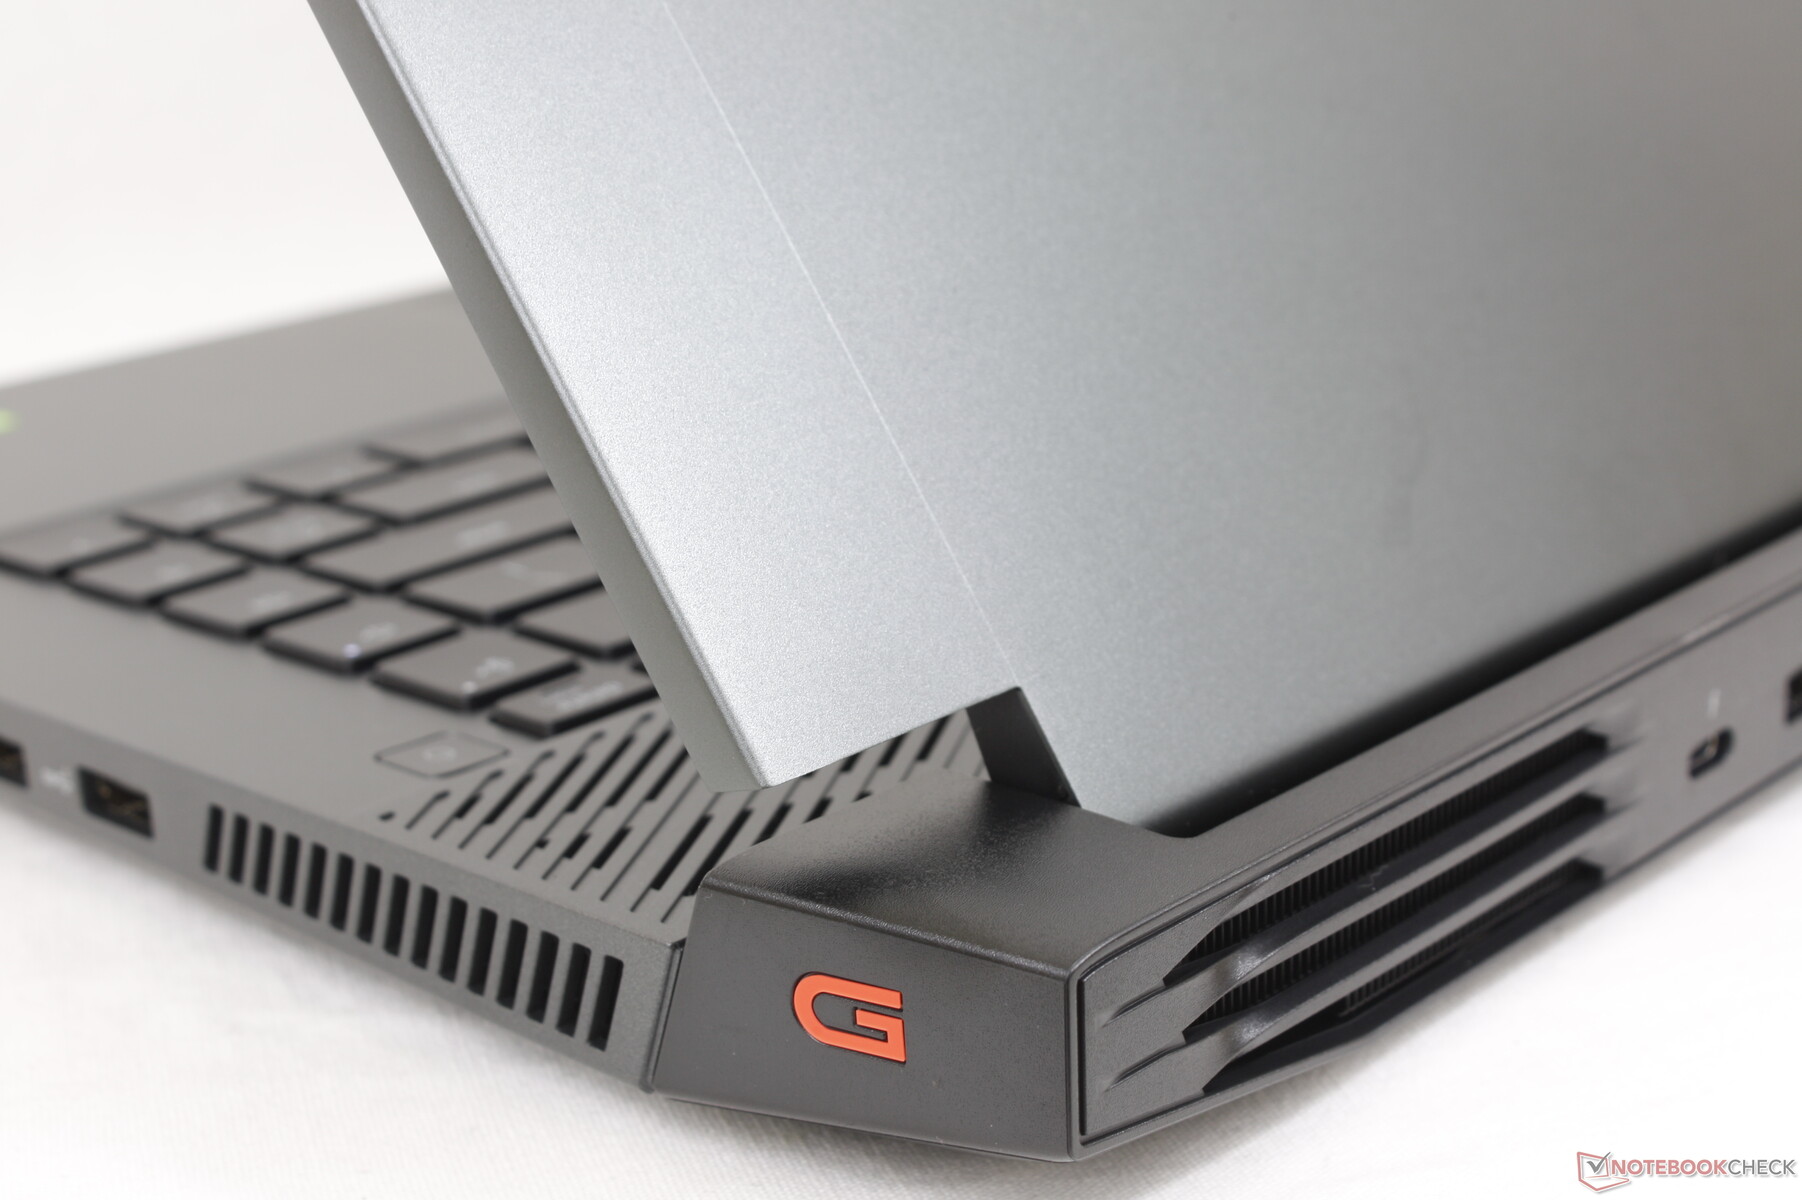
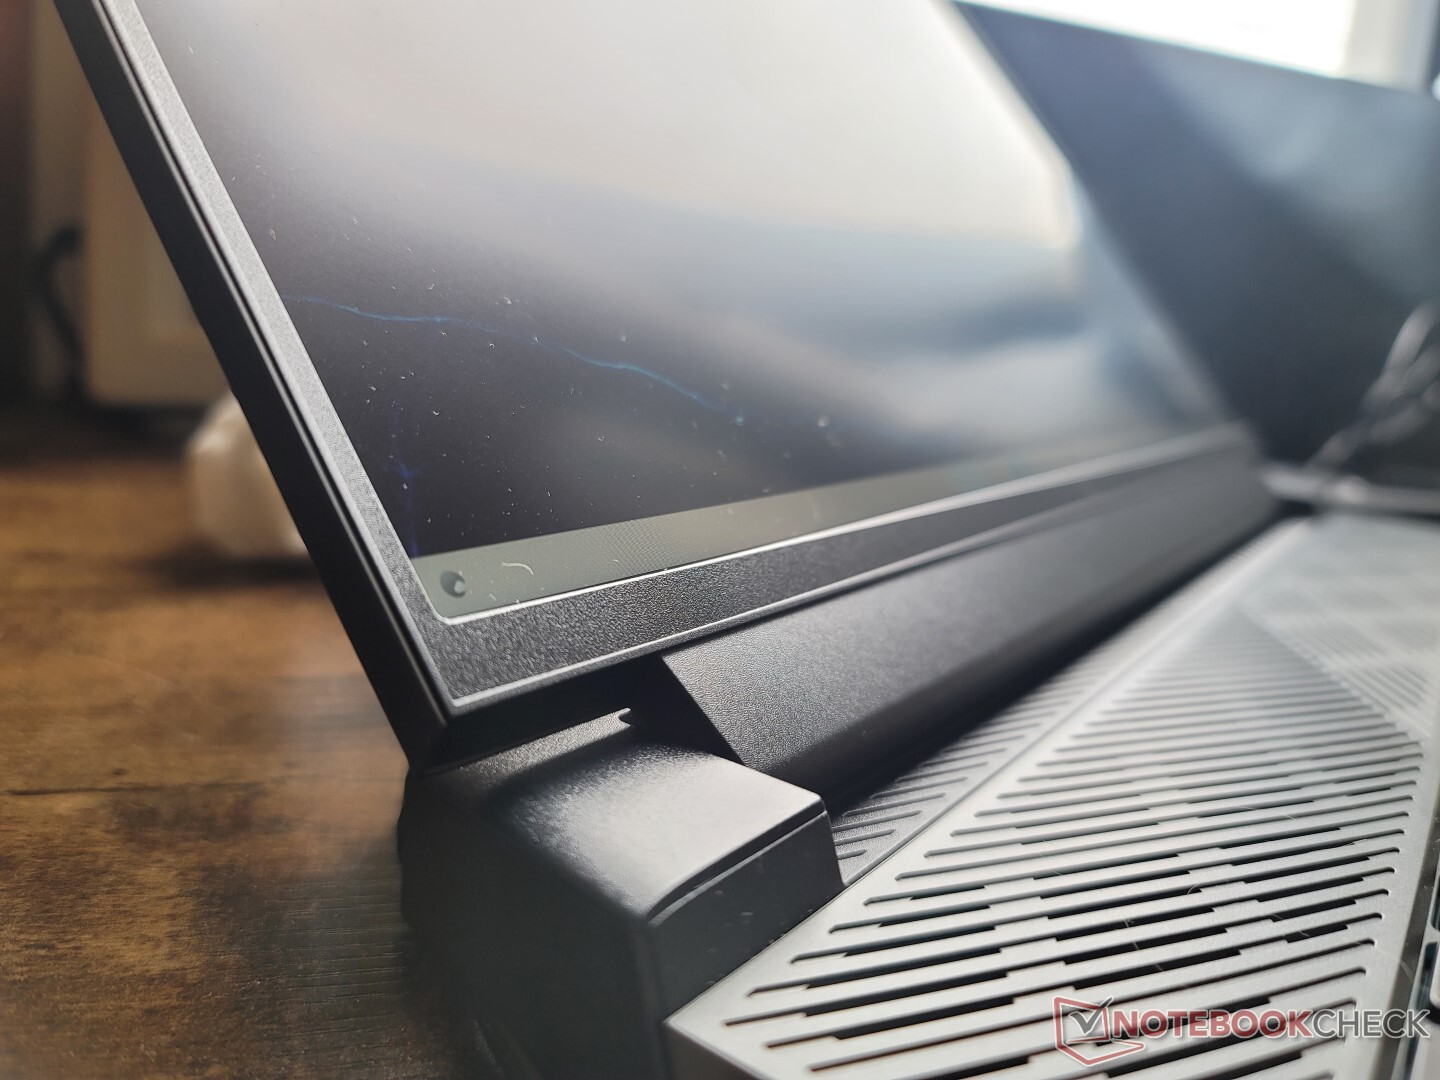
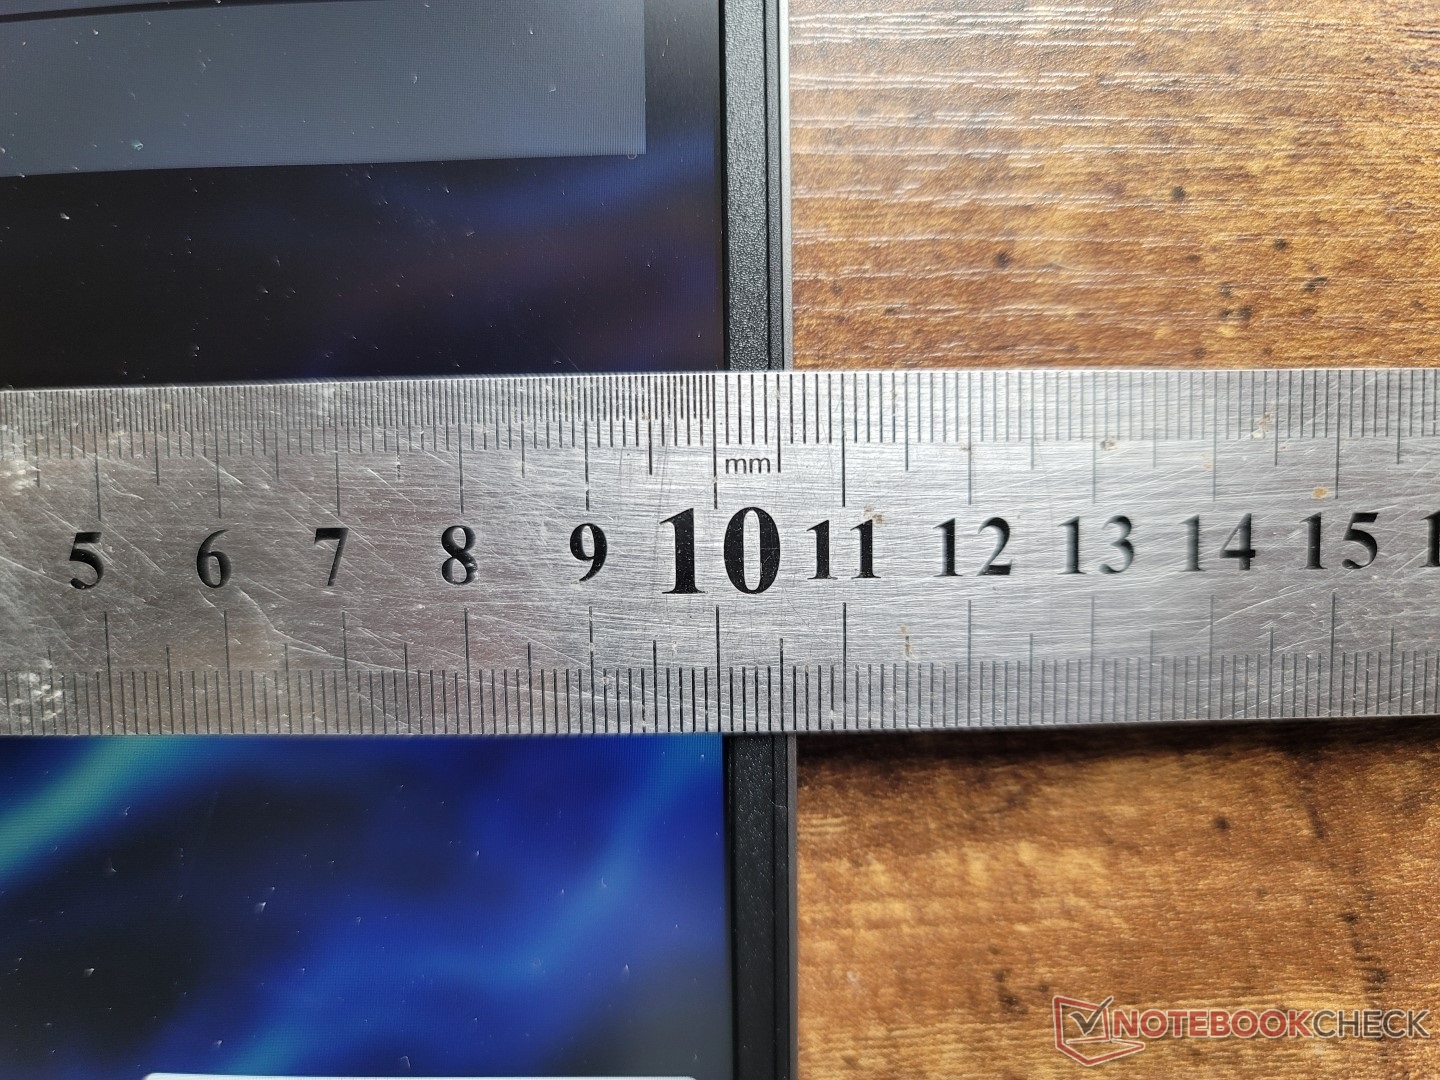
O projeto geral tem muitas semelhanças com o projeto existente de 16:9 15,6 polegadas Dell G15 mas renovado para o novo fator de forma 16:10. A base plástica obsidiana e os materiais da tampa de alumínio anodizado permanecem os mesmos para a textura lisa e a sensação familiar. a estética "Gamer" como a luneta interna brilhante da tela ou o anel RGB dos laptops Alienware não estão presentes na série G.
A rigidez do chassi é firme em torno da base e do centro do teclado onde a flexão e a torção são mínimas. A tampa apresenta relativamente mais flexionamento, mas não por margens significativas para ser de qualquer preocupação.
Os laptops para jogos da Dell são tipicamente mais pesados do que a concorrência e o G16 não é exceção. Com 2,6 kg, o modelo é mais pesado do que o HP Victus 16acer Swift X, e Asus Zephyrus M16 por várias centenas de gramas cada um. O G16 é consequentemente mais espesso que a maioria dos outros laptops para jogos em sua categoria de tamanho também.
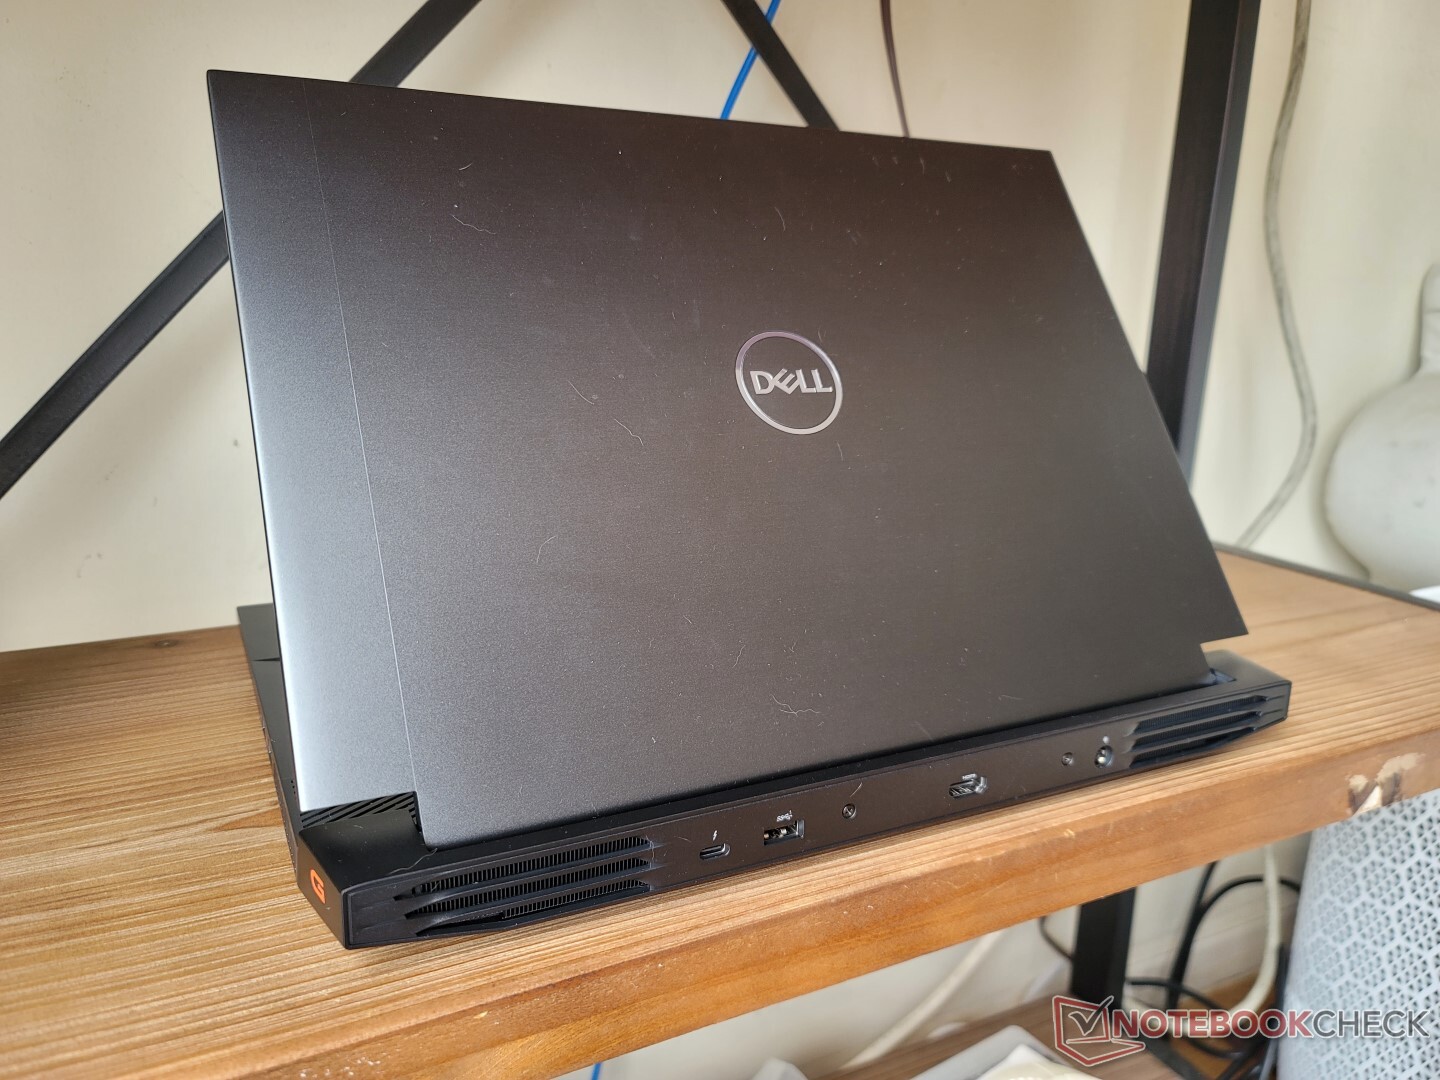
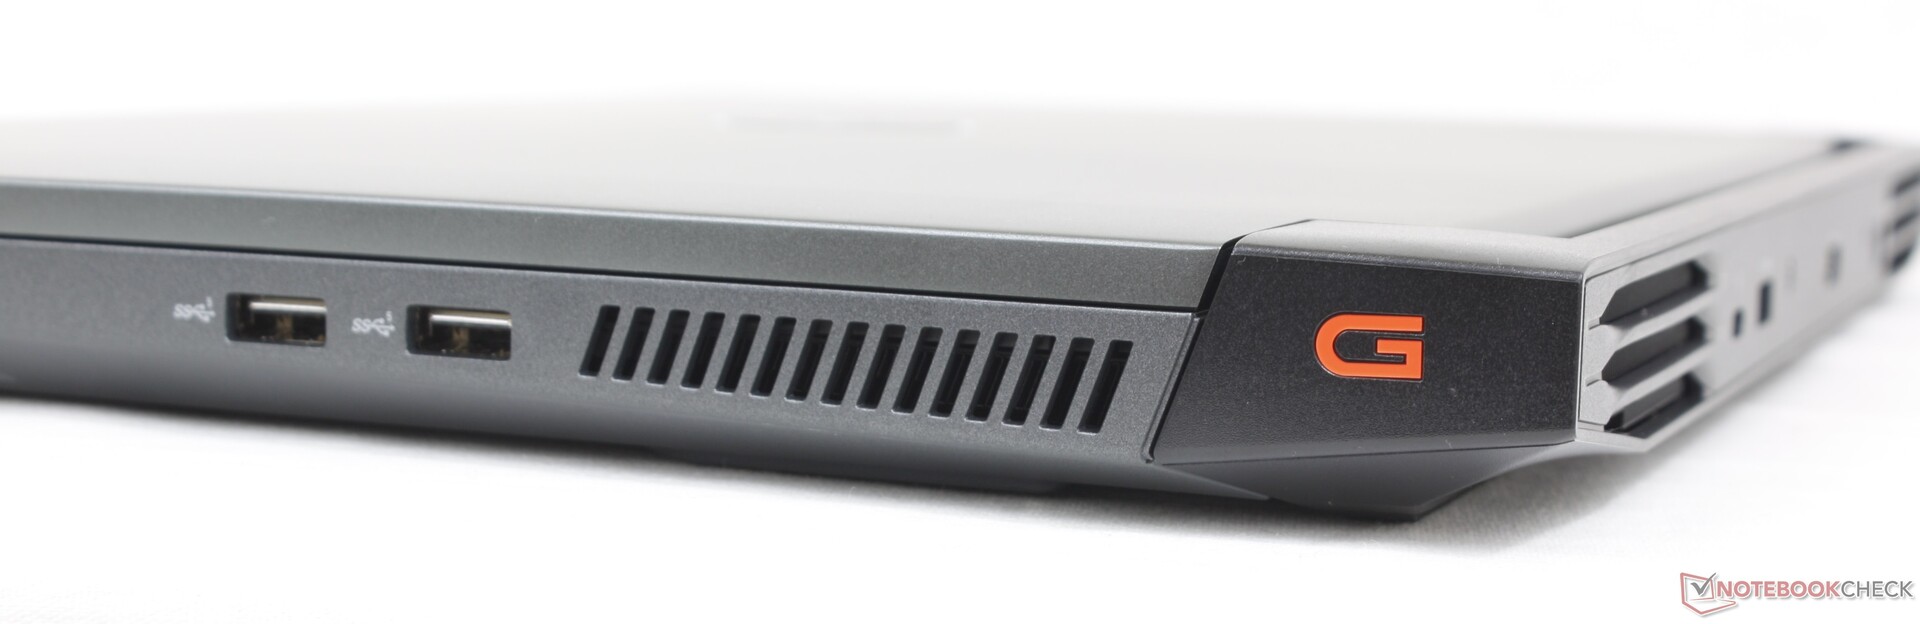
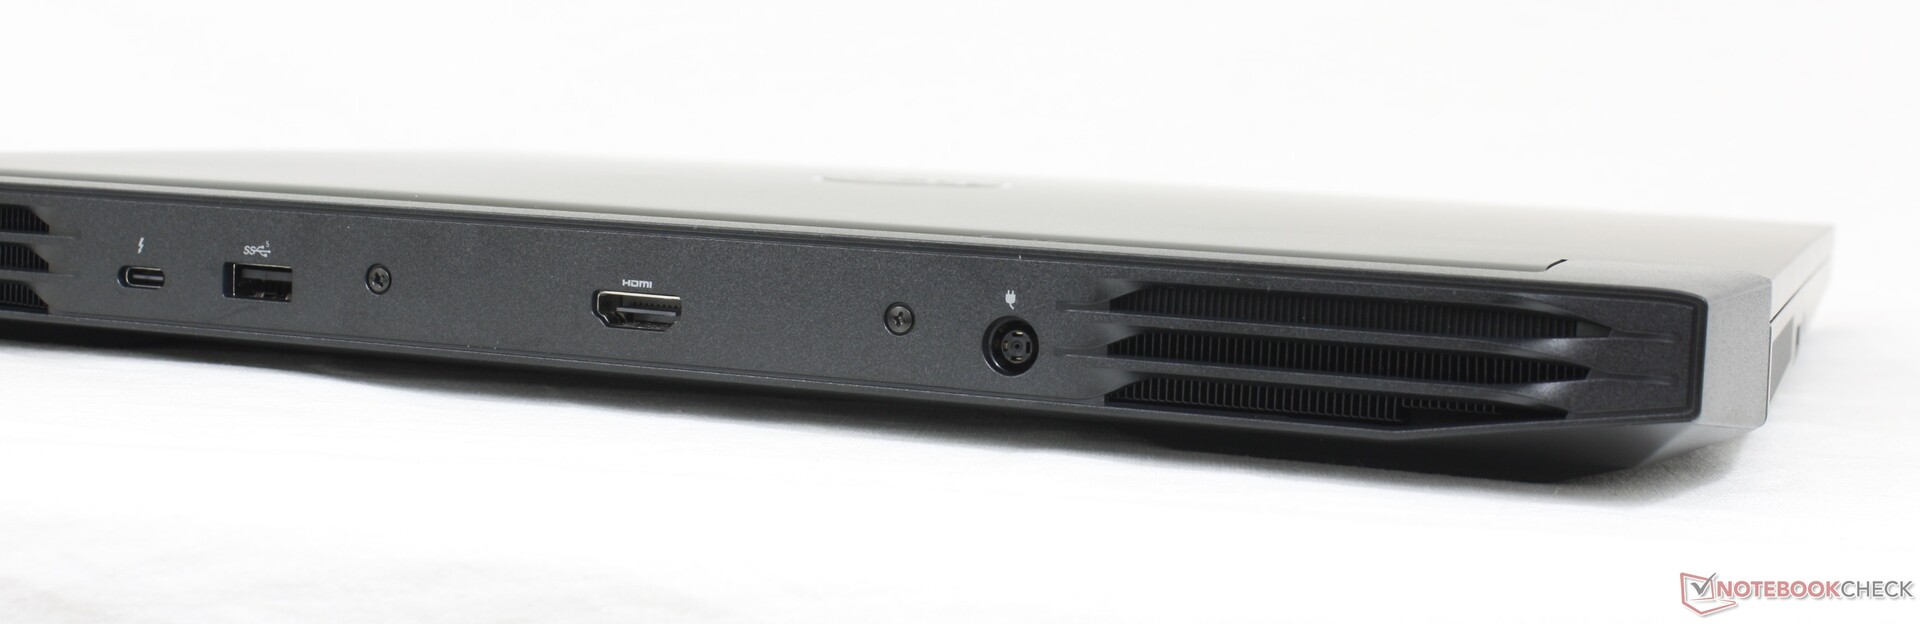
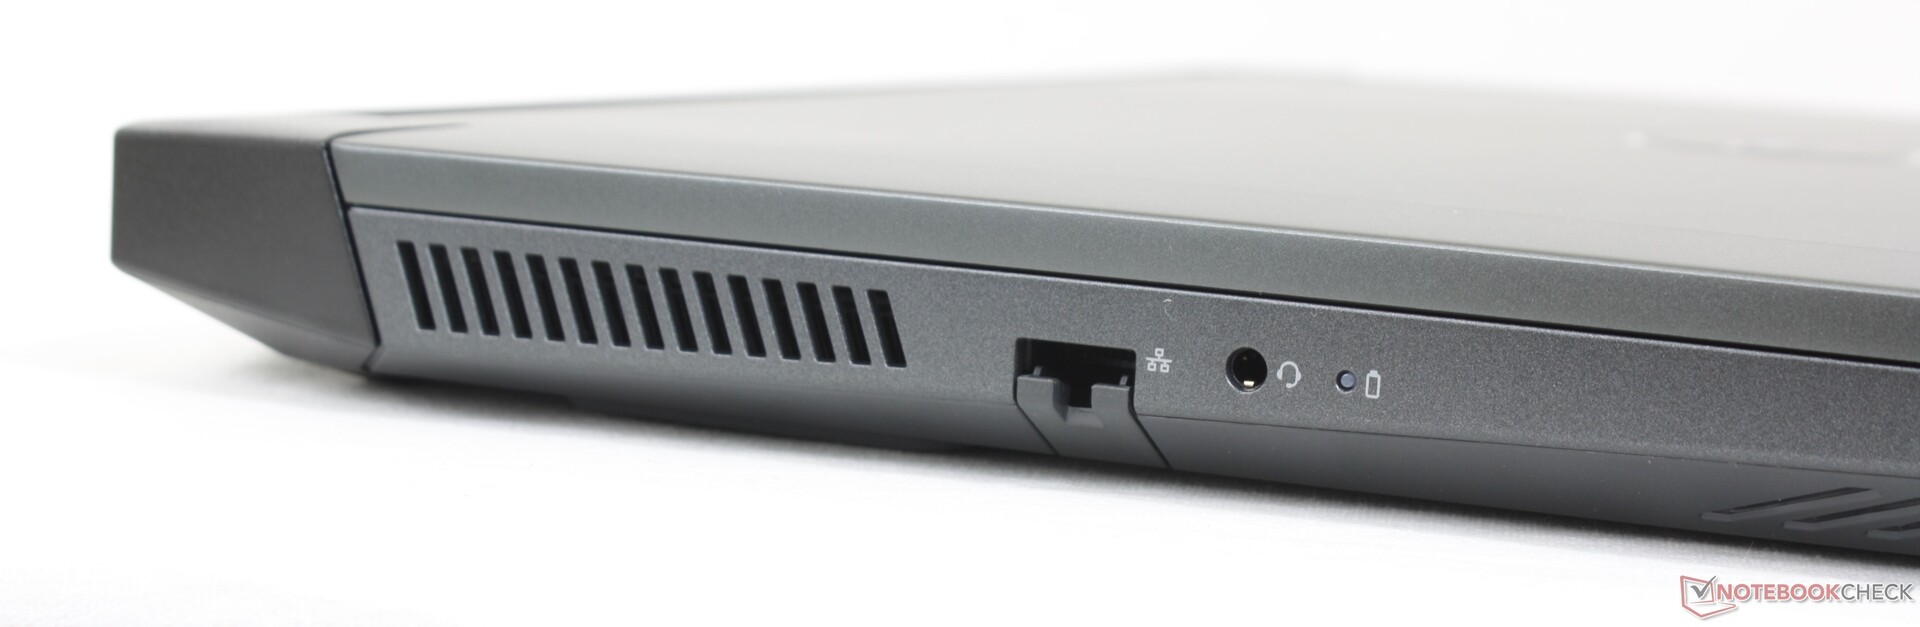
Conectividade - Suporte Thunderbolt 4
As opções de porta são mais parecidas com a HP Victus 16, embora rearranjadas. Na verdade, metade das portas do G16 estão ao longo da traseira devido às grandes grelhas de ventilação nas bordas esquerda e direita. Gostaríamos de ver mais portas USB-C no futuro, pois há apenas uma em comparação com três nas portas concorrentesLenovo Legion 5 Pro.
Comunicação - 6 GHz Não Incluso
Um Intel AX201 vem como padrão para conectividade Wi-Fi 6 e Bluetooth 5.2. Não há opções de Wi-Fi 6E que possam economizar em custos. As taxas de transferência são estáveis, se não pouco expressivas, quando emparelhadas com nosso roteador AXE11000.
| Networking | |
| iperf3 transmit AX12 | |
| Acer Swift X SFX16-51G-5388 | |
| Asus ROG Zephyrus M16 GU603H | |
| iperf3 receive AX12 | |
| Acer Swift X SFX16-51G-5388 | |
| Asus ROG Zephyrus M16 GU603H | |
| iperf3 receive AXE11000 6GHz | |
| Lenovo Legion 5 Pro 16IAH7H | |
| Lenovo Legion 7 16ARHA7 | |
| iperf3 receive AXE11000 | |
| Dell G16 7620 | |
| HP Victus 16-e0145ng | |
| iperf3 transmit AXE11000 6GHz | |
| Lenovo Legion 7 16ARHA7 | |
| Lenovo Legion 5 Pro 16IAH7H | |
| iperf3 transmit AXE11000 | |
| Dell G16 7620 | |
| HP Victus 16-e0145ng | |
Webcam
A webcam é um 1 MP decepcionante para uma imagem muito barrenta. Também não há sensor de infravermelho ou obturador de privacidade.


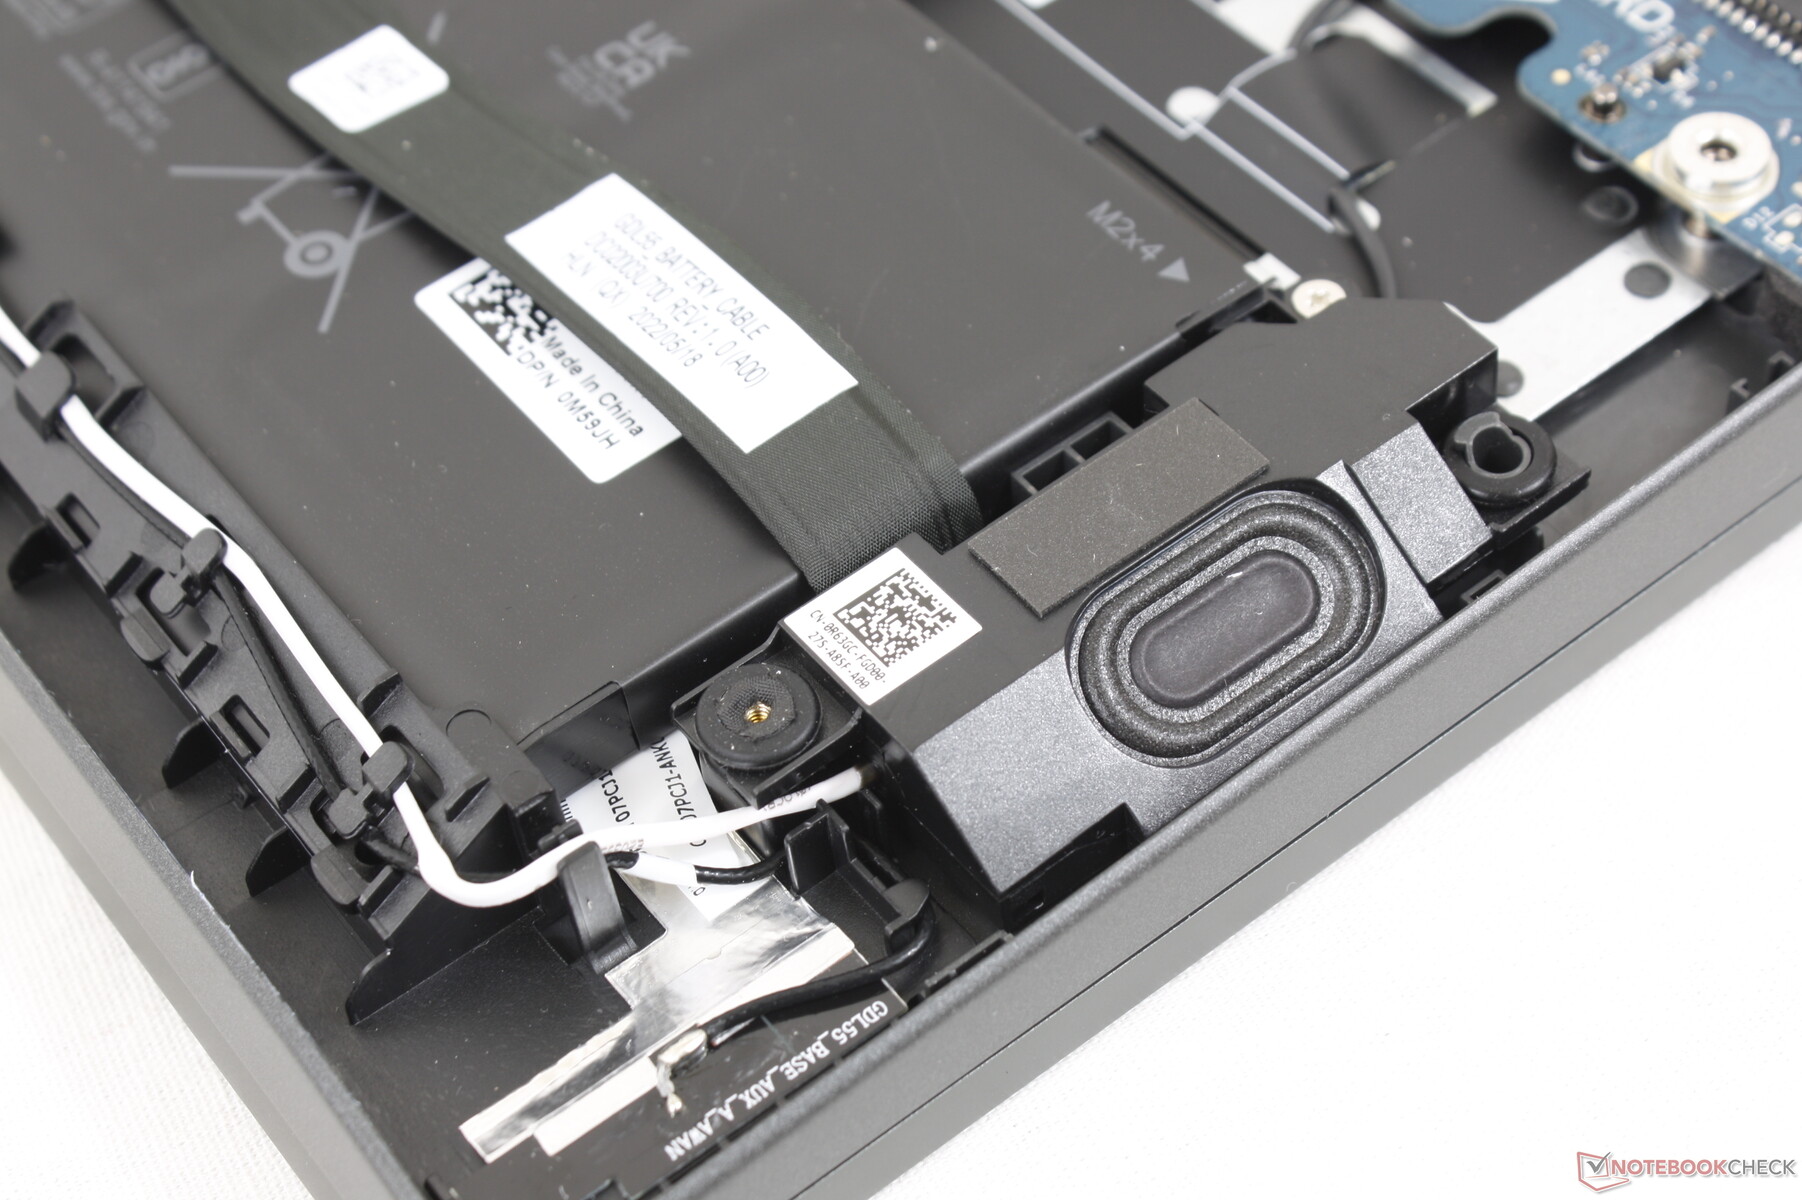
Manutenção
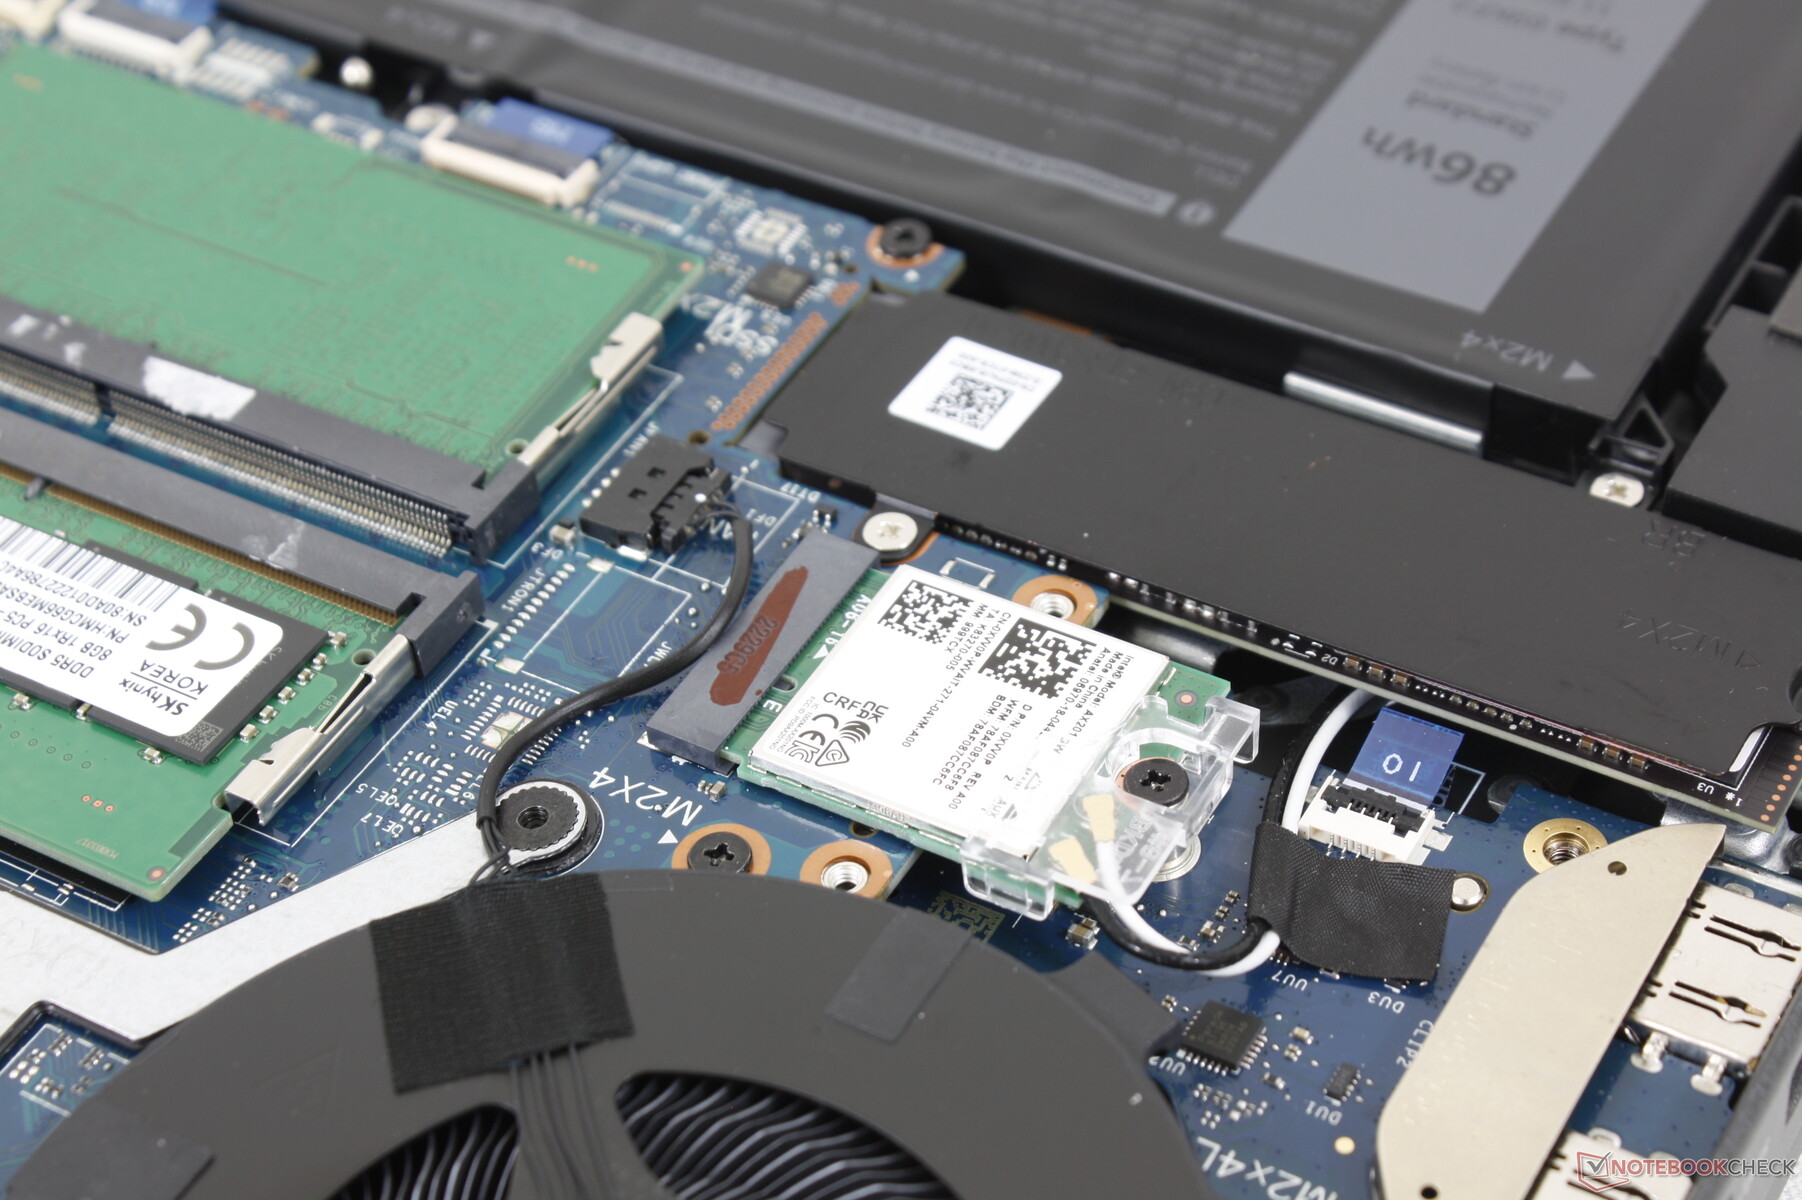
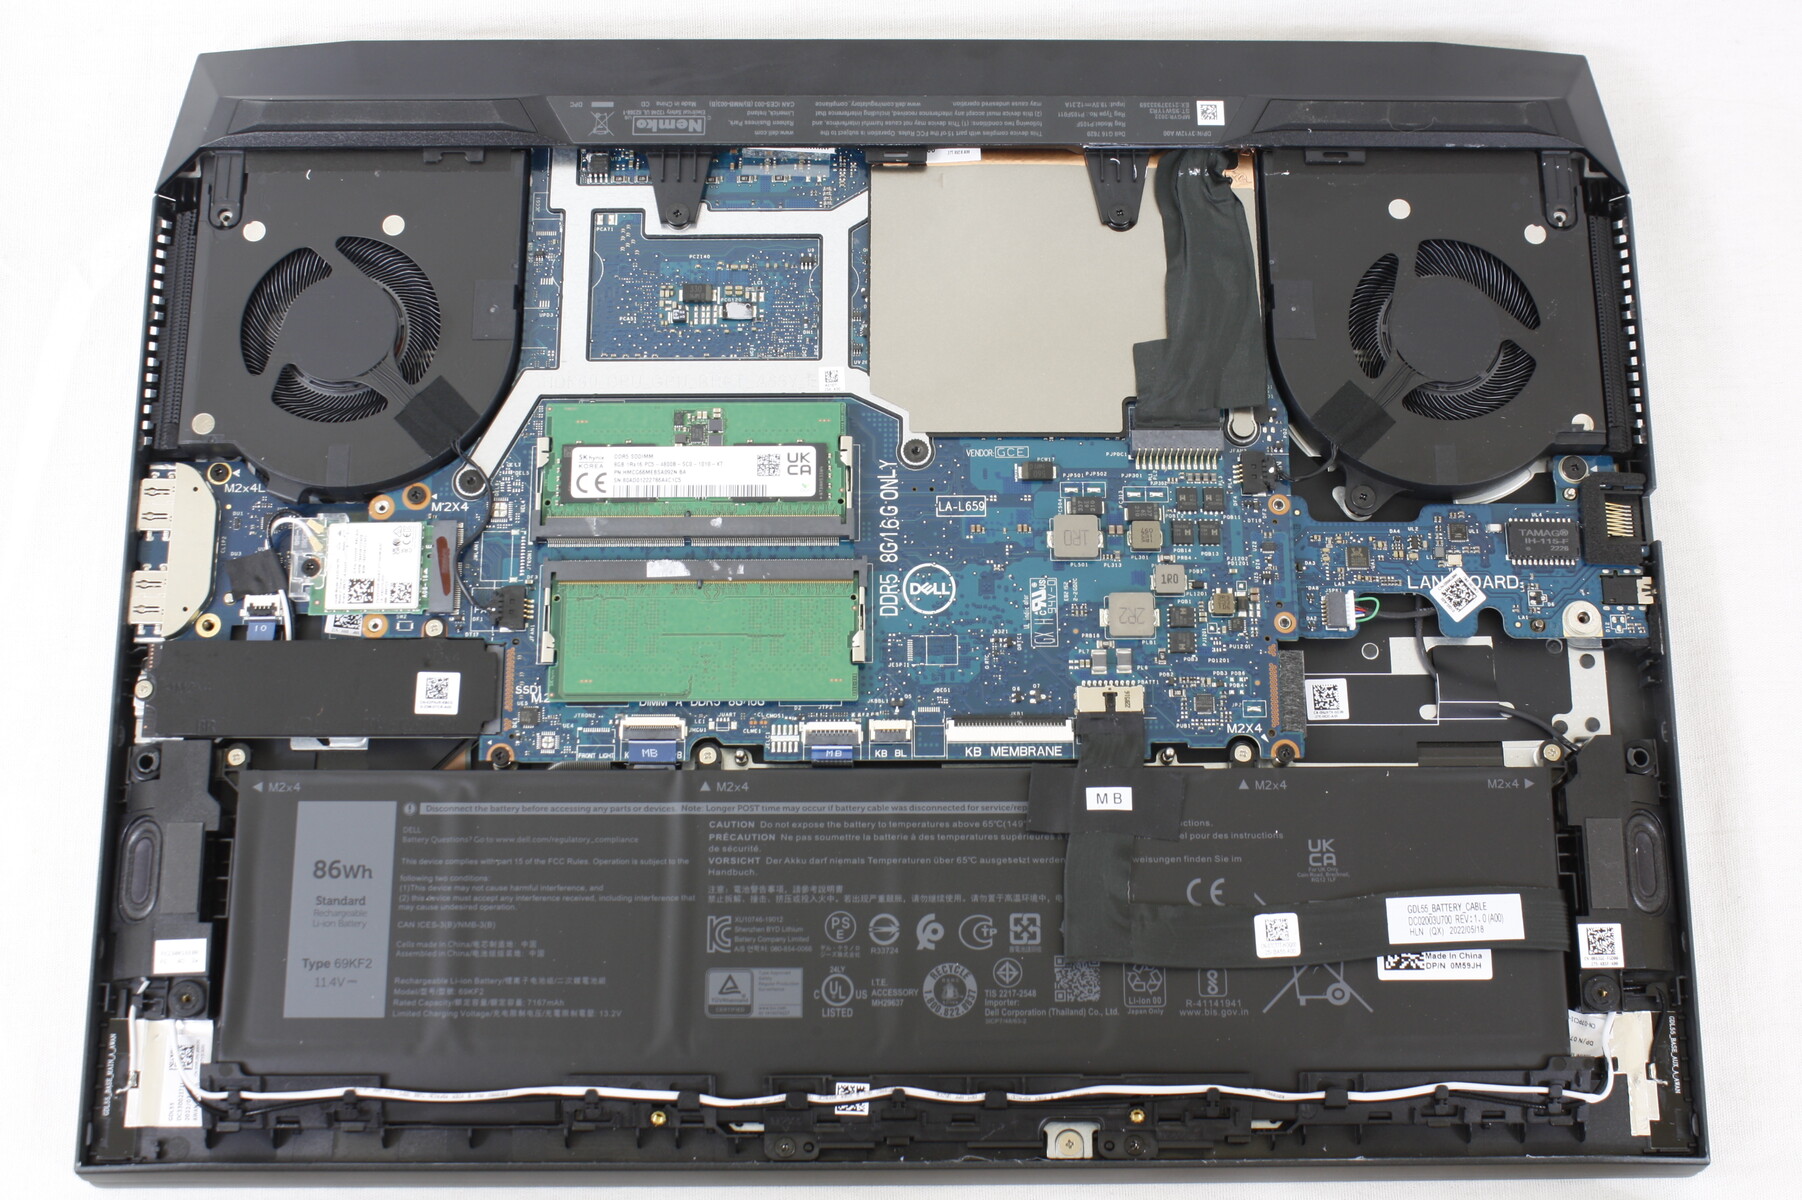
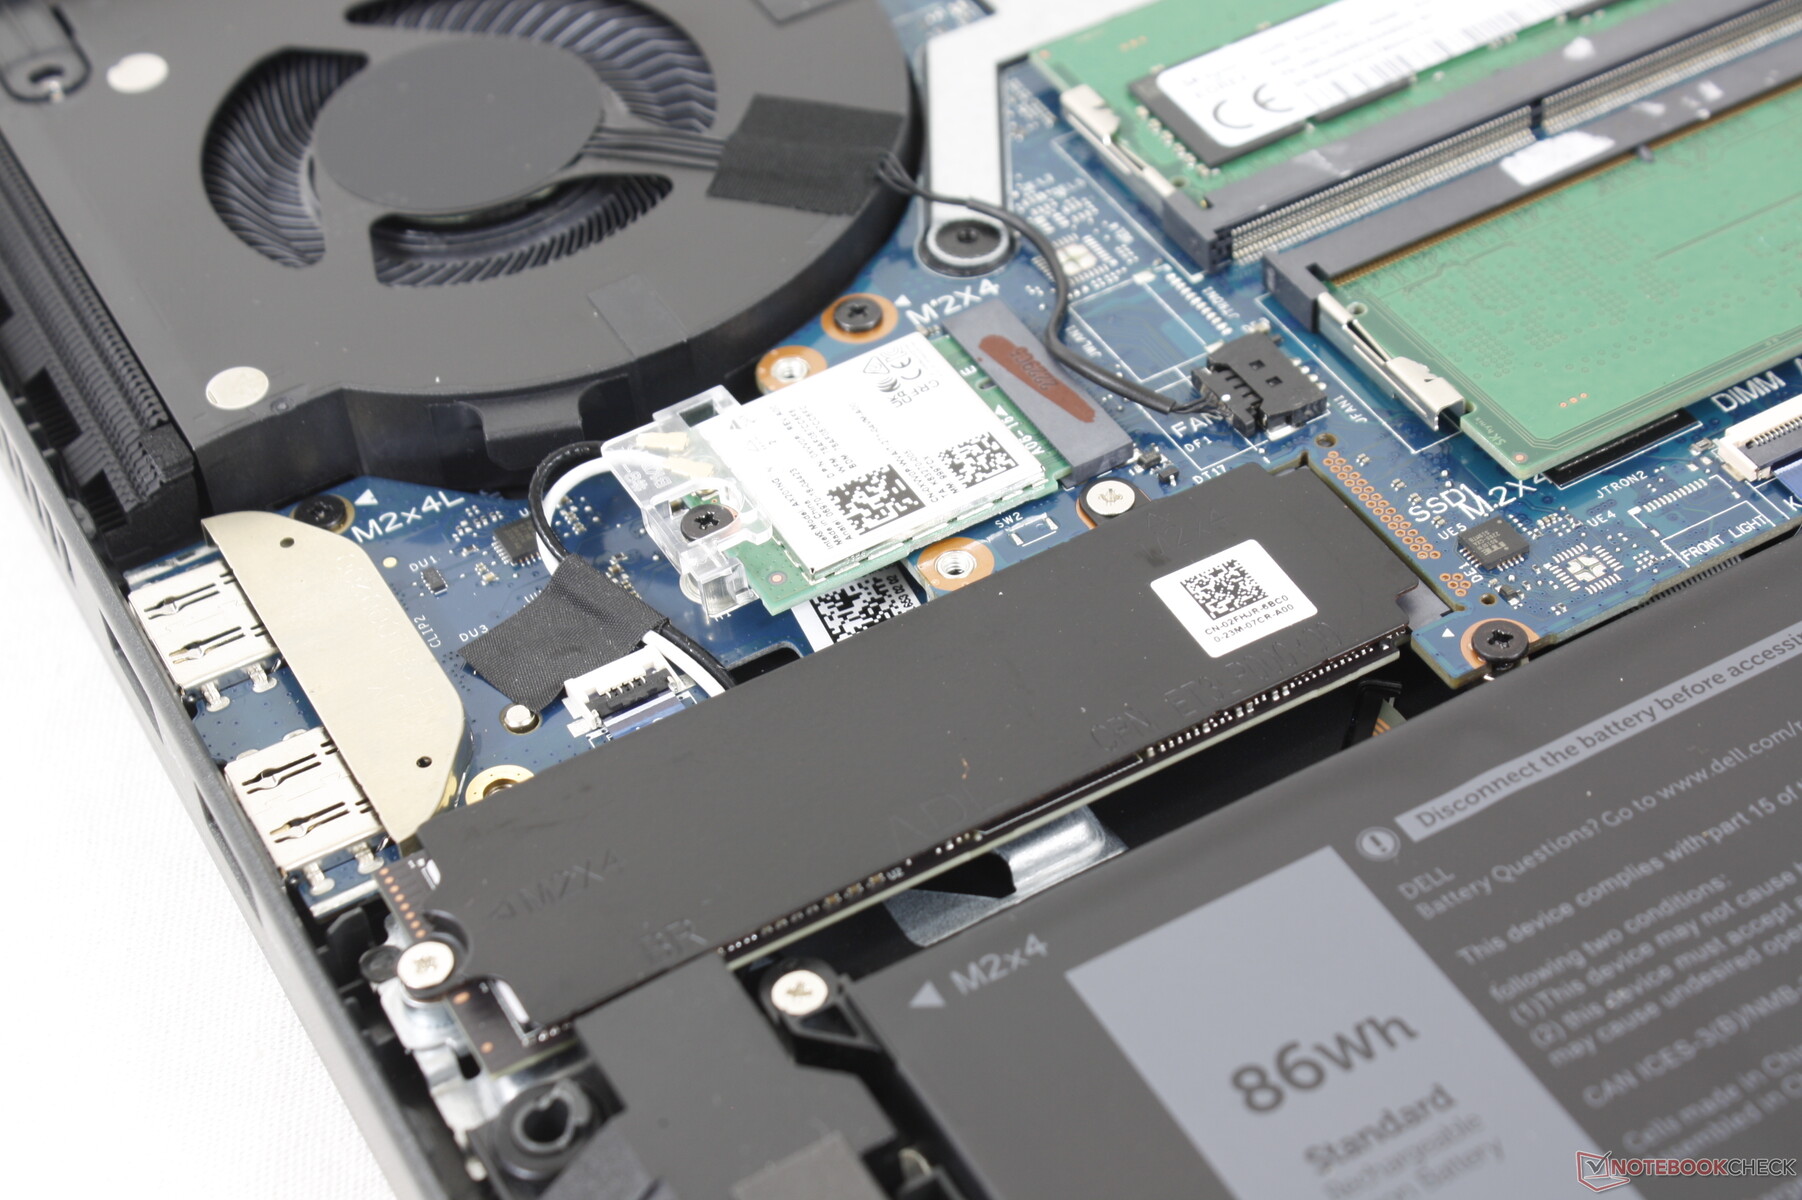
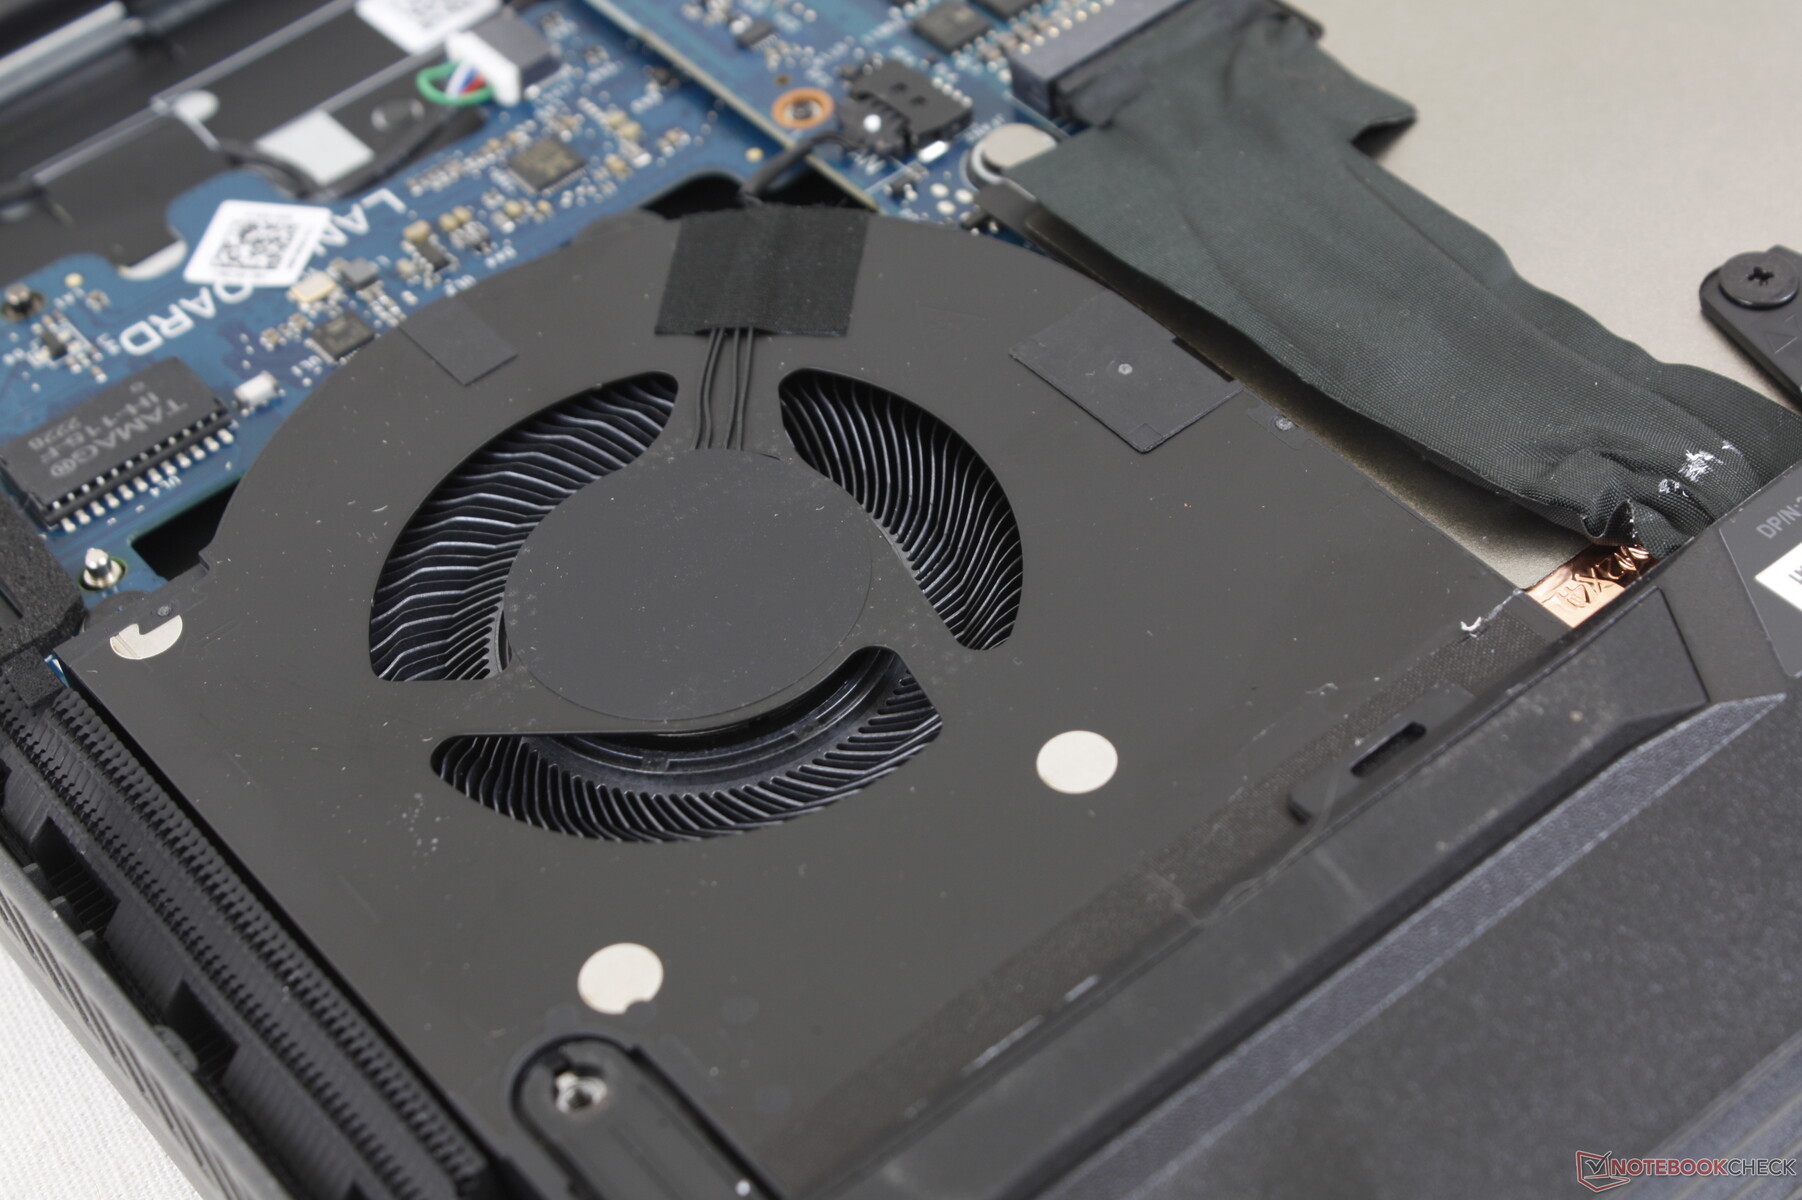
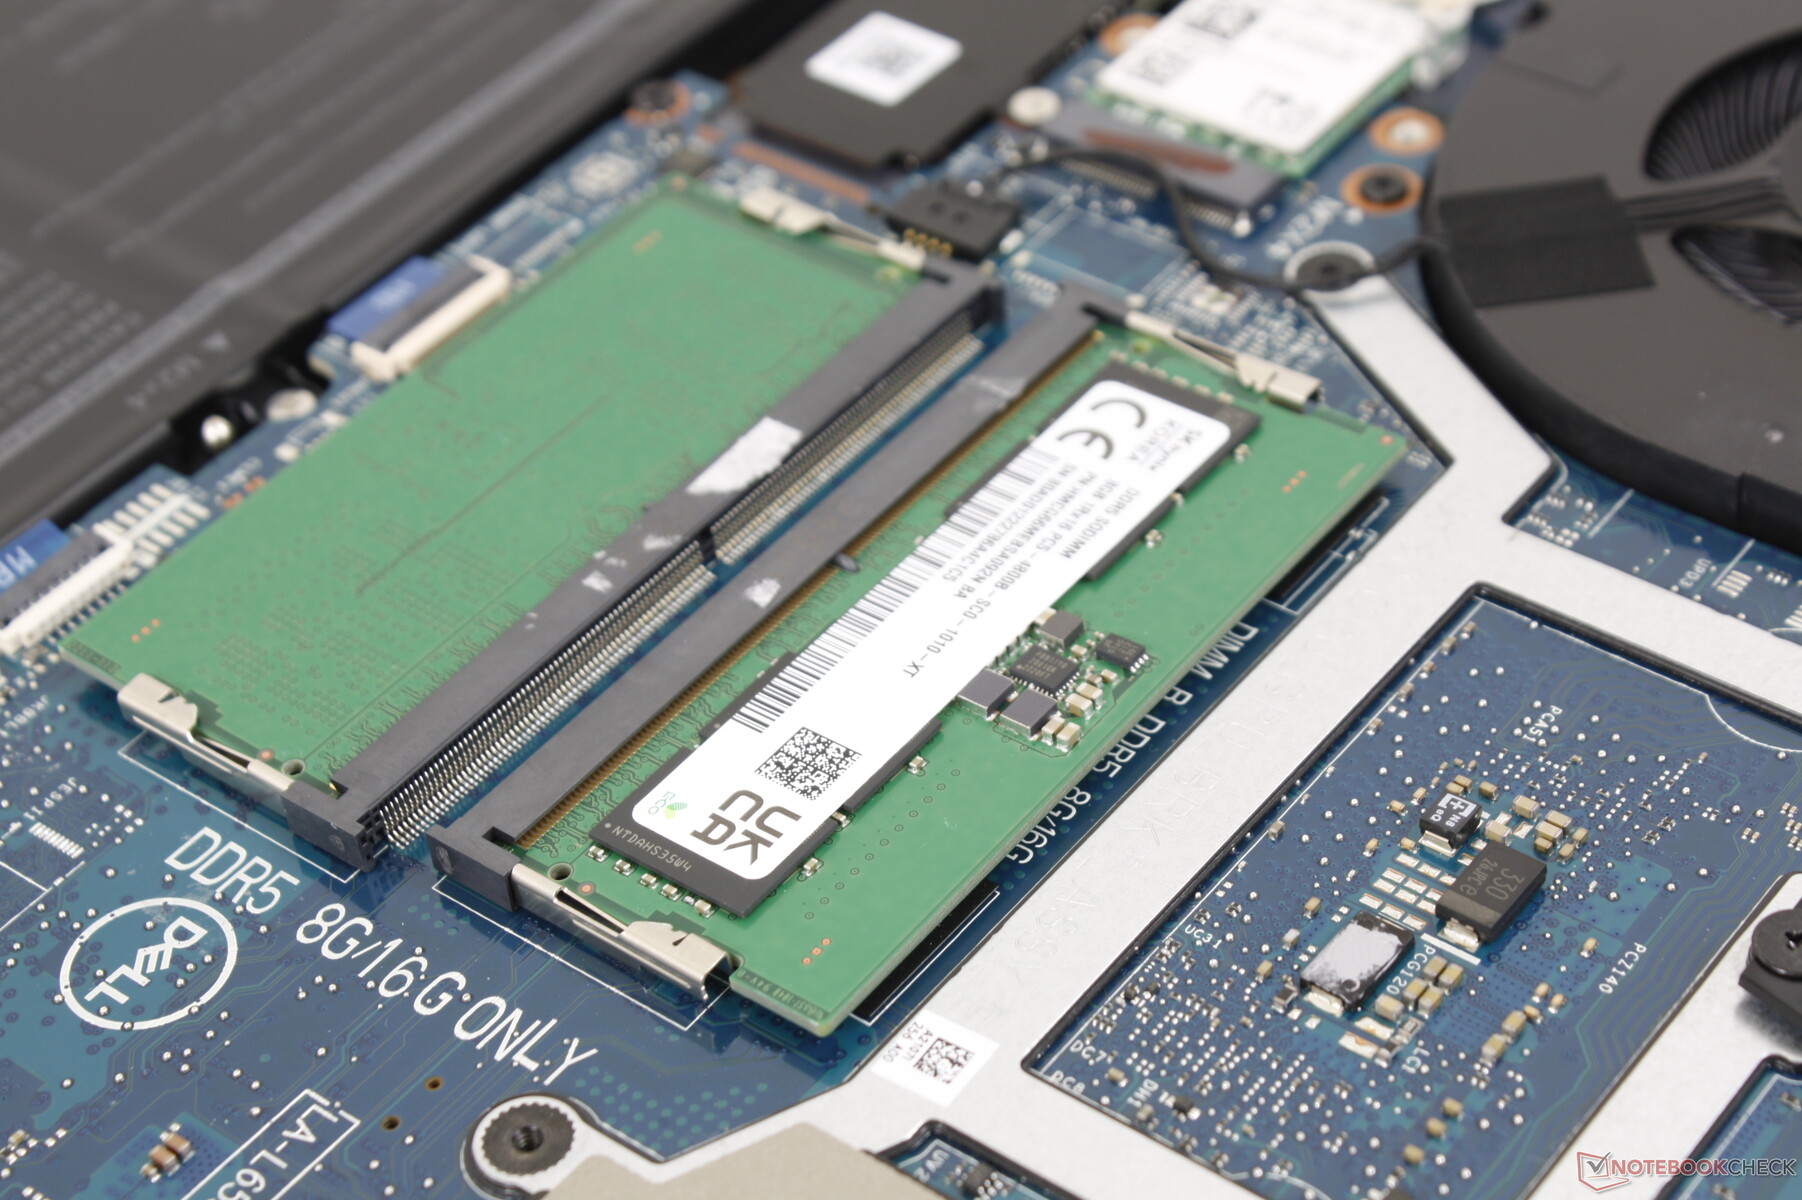
O painel inferior é fixado por 8 parafusos Philips para facilitar a manutenção. Os usuários têm acesso direto a 2x slots DDR5 SODIMM, 1x slot M.2 2280 SSD, bateria, e módulo removível M.2 WLAN. Os tubos de calor e os processadores estão do lado oposto e requerem desmontagem adicional para acesso.
Acessórios e Garantia
Não há extras na caixa além do adaptador AC e da papelada. A habitual garantia limitada de um ano do fabricante se aplica se adquirido nos EUA.
Dispositivos de entrada - Não mais Numpad
Teclado
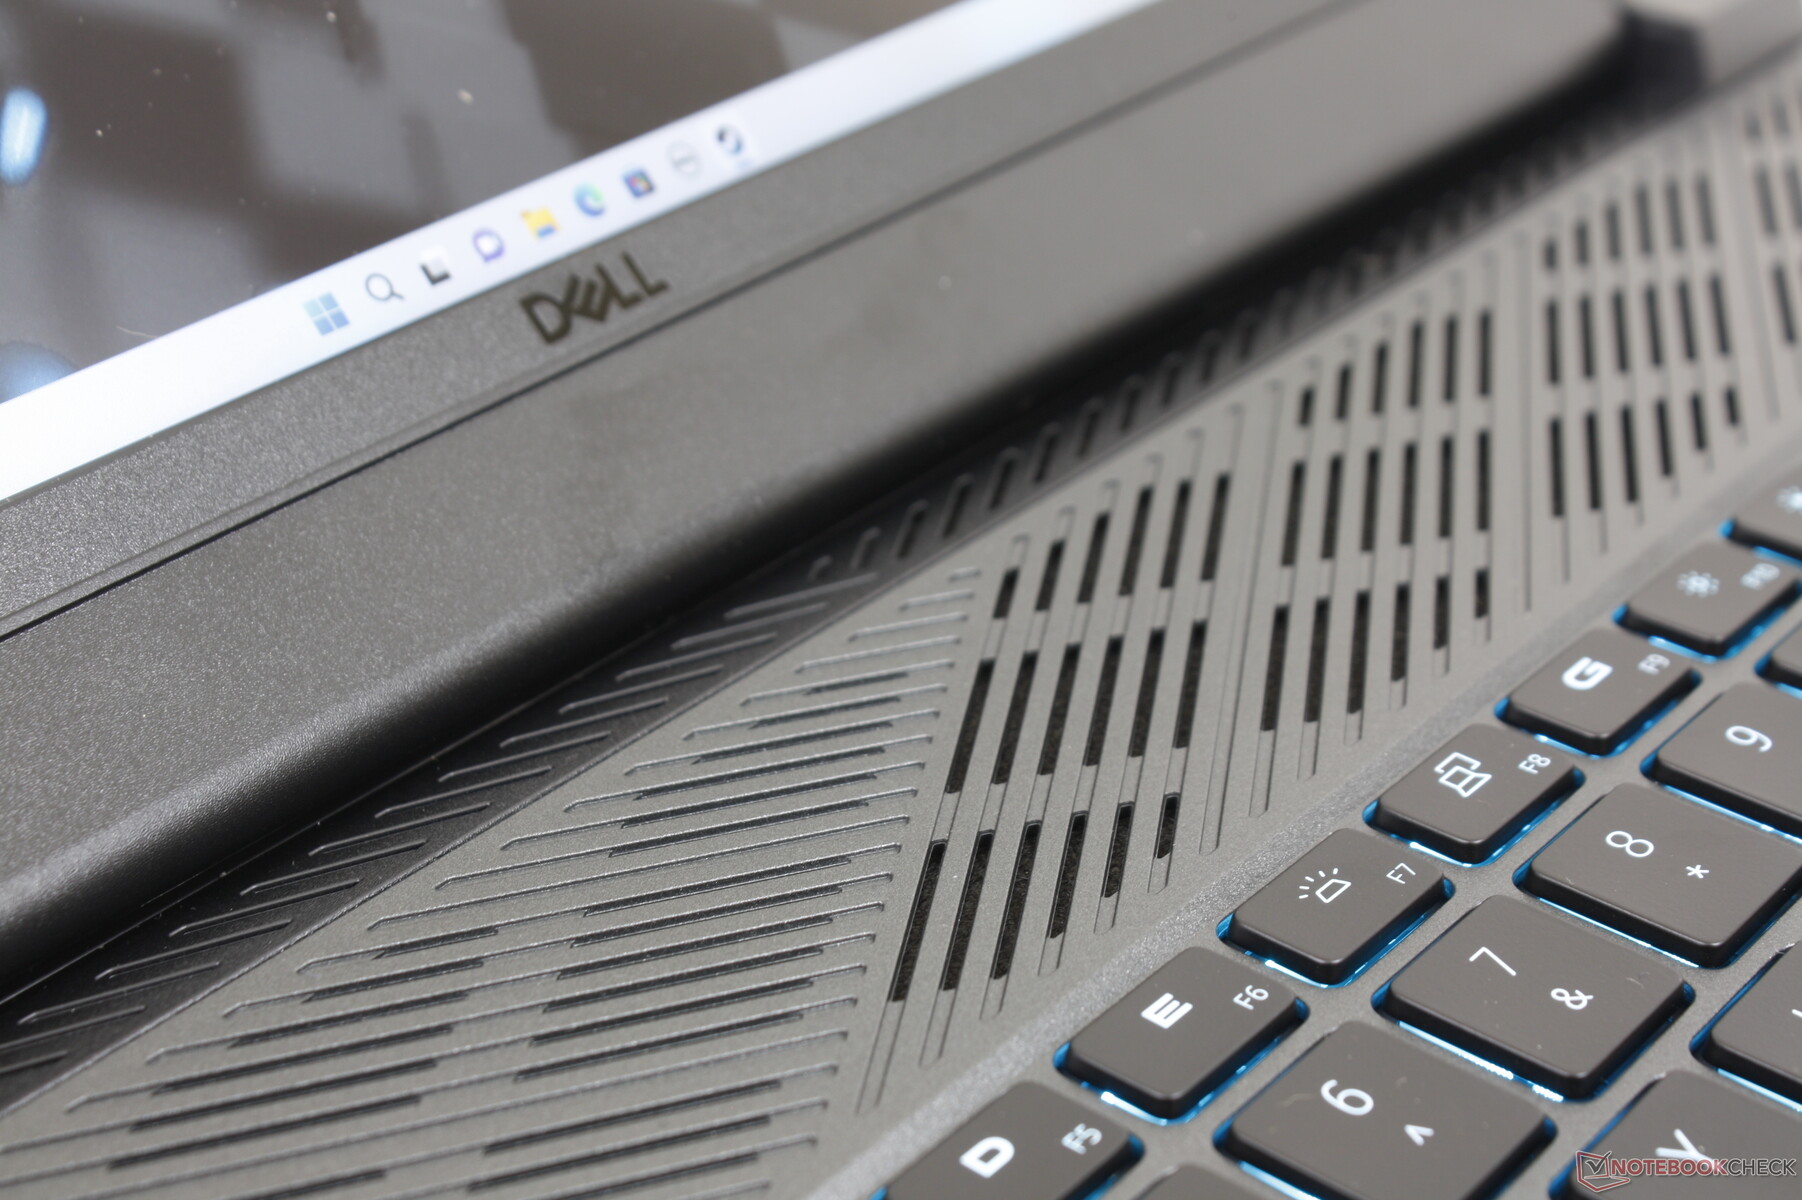
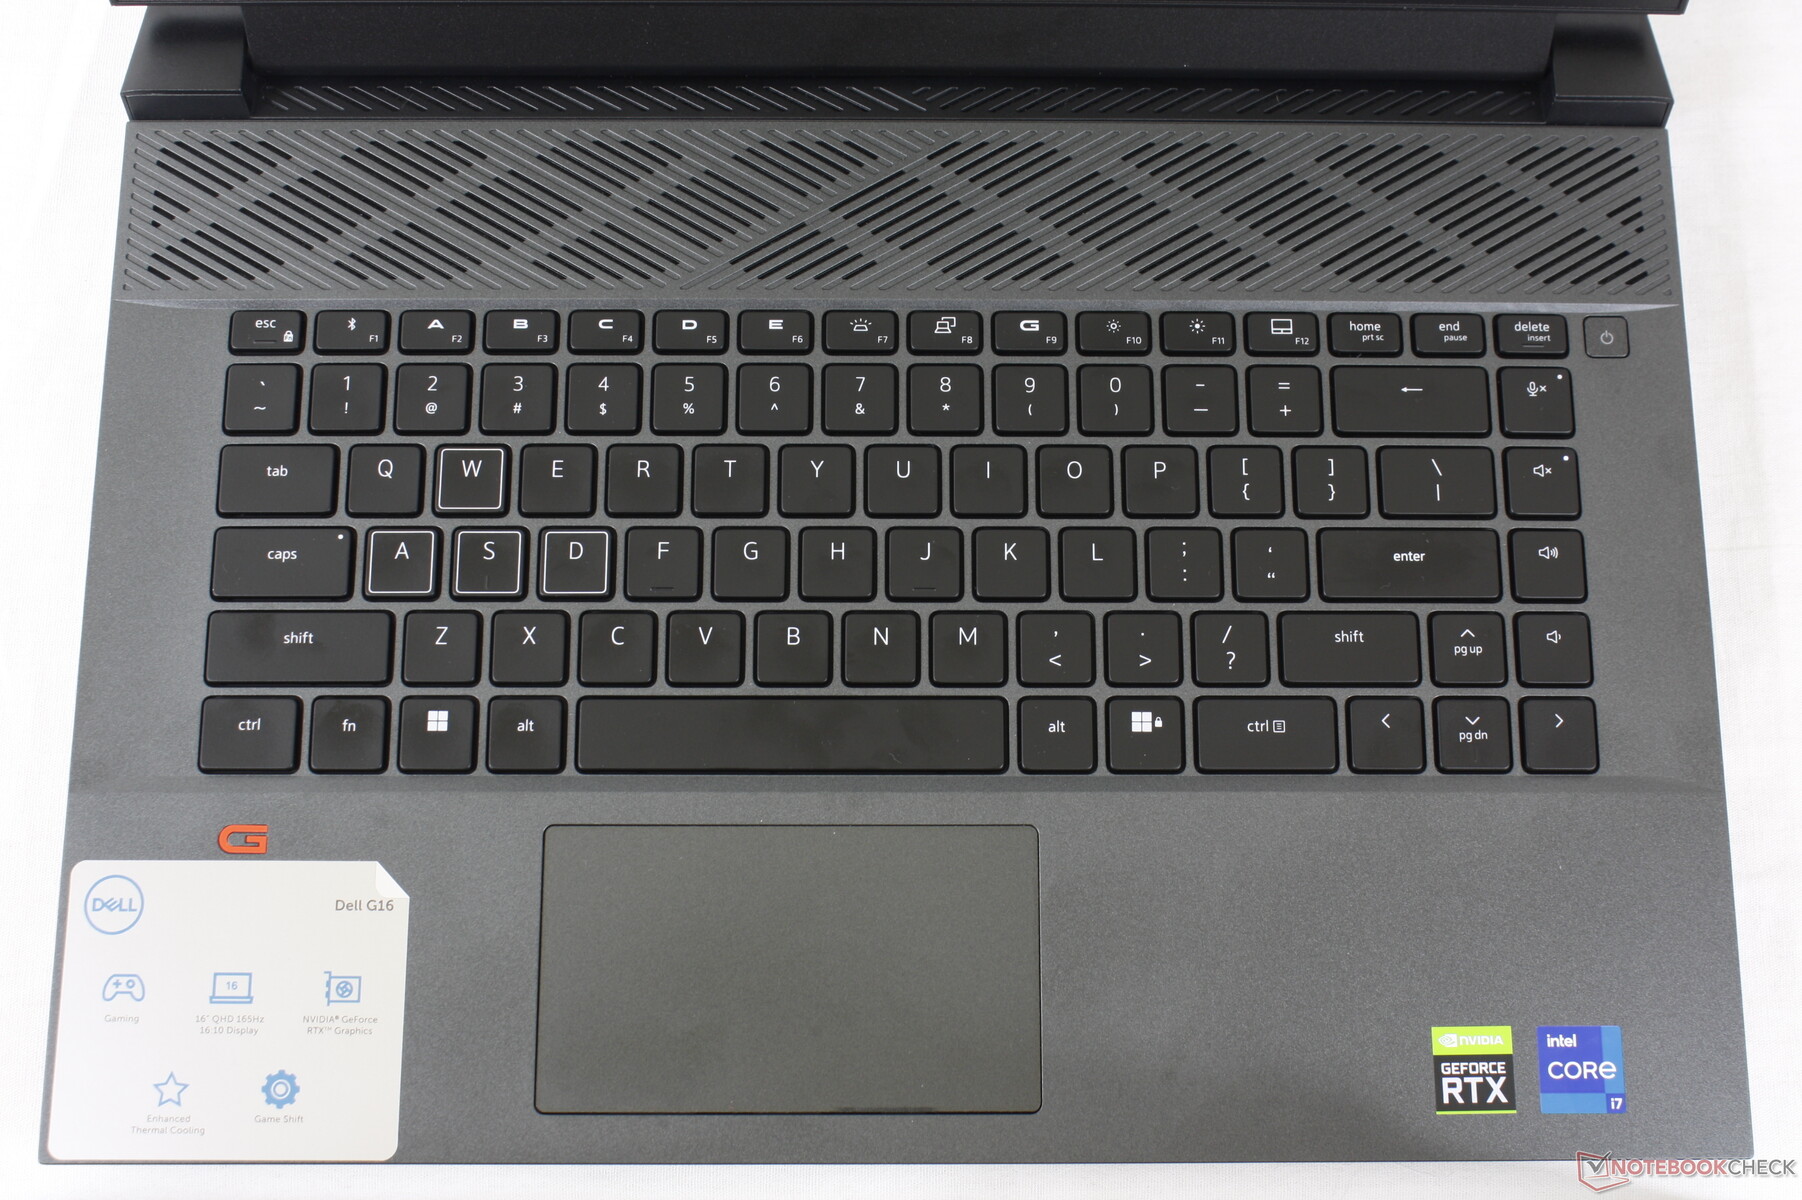
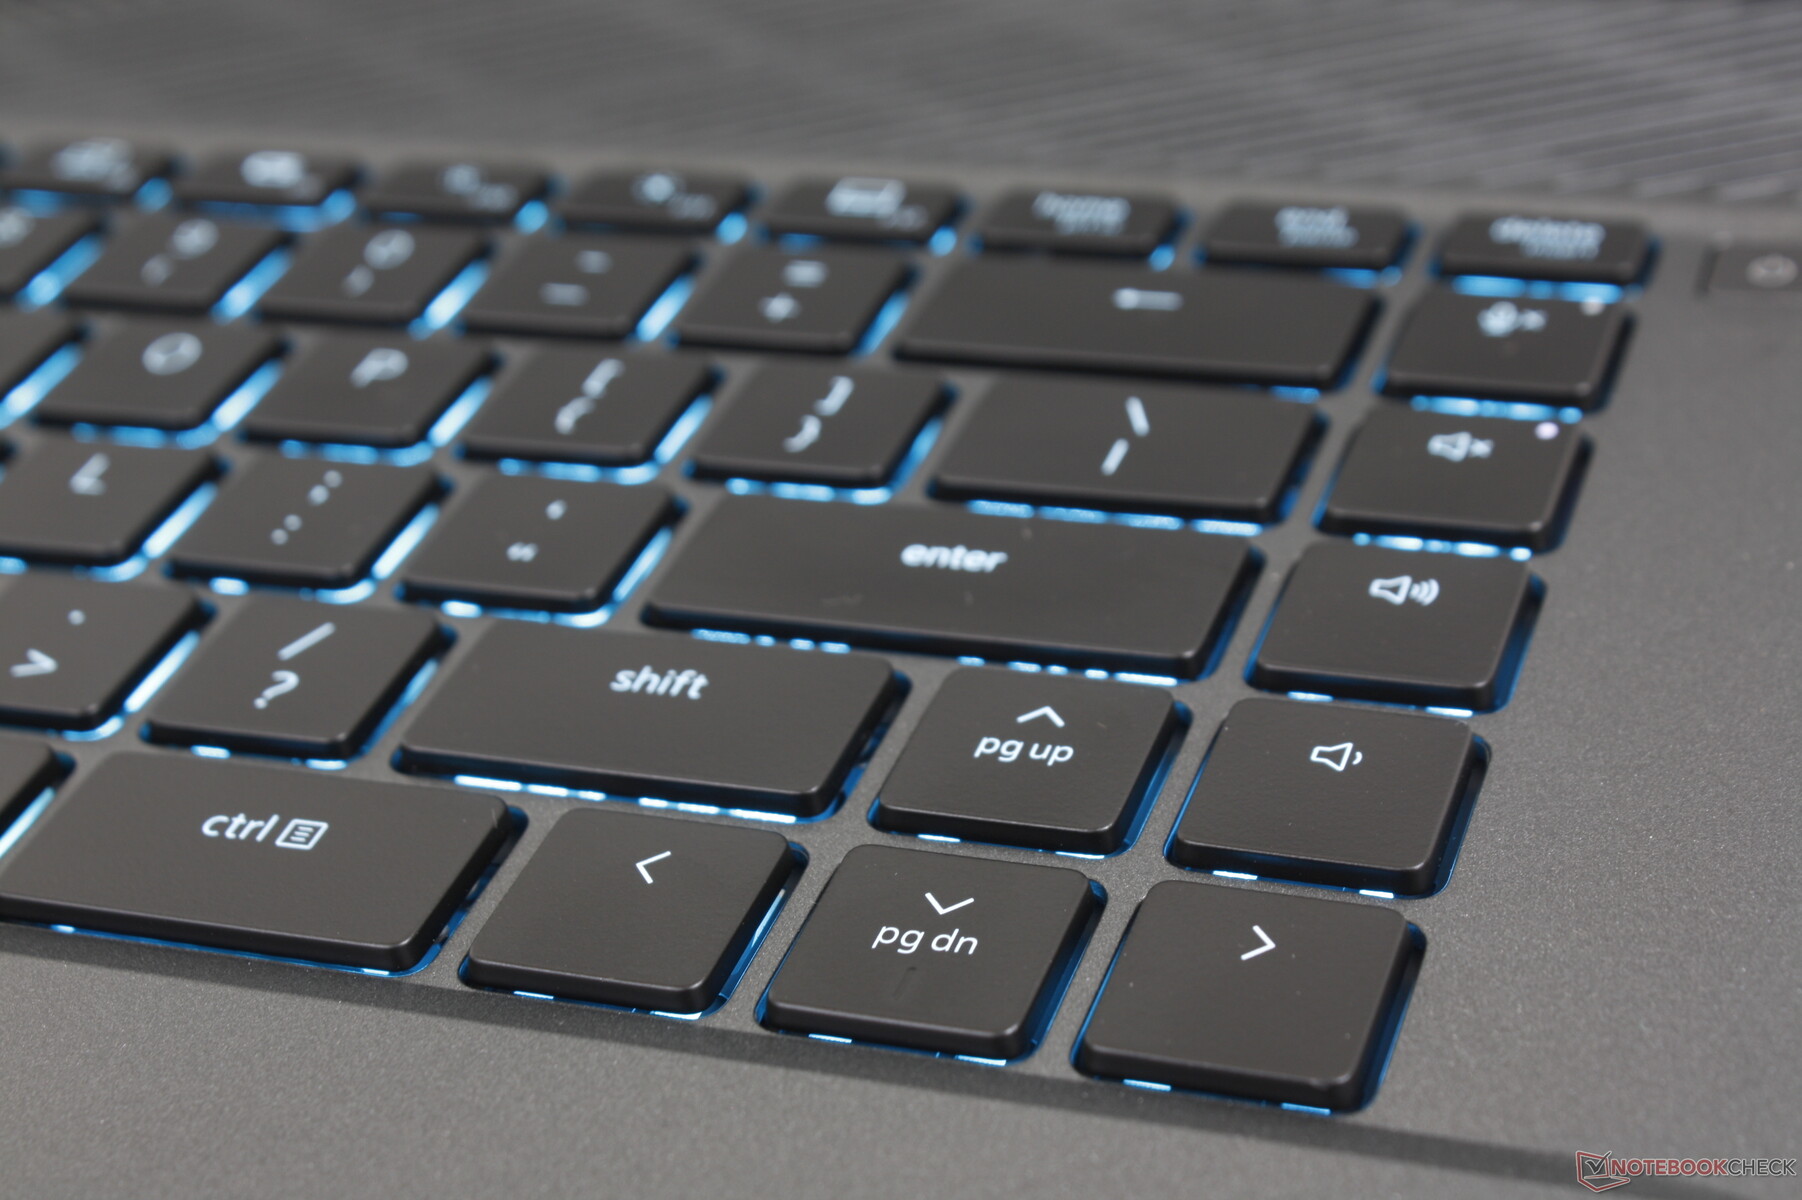
Embora a Dell pudesse facilmente ter usado exatamente o mesmo teclado G15 para seu novo modelo G16, eles optaram por um modelo completamente diferente. O teclado G16 deixou cair o teclado numérico para teclas de seta de tamanho completo, que é uma bolsa mista, dependendo da aplicação ou do jogo. No lado positivo, o feedback das teclas parece mais nítido e firme do que no G15 para uma experiência de digitação mais satisfatória.
Curiosamente, os usuários terão que pagar mais pelo recurso de iluminação RGB por tecla no G16. Caso contrário, o modelo vem com uma luz de fundo LED azul de uma zona, como mostrado por nossas imagens abaixo.
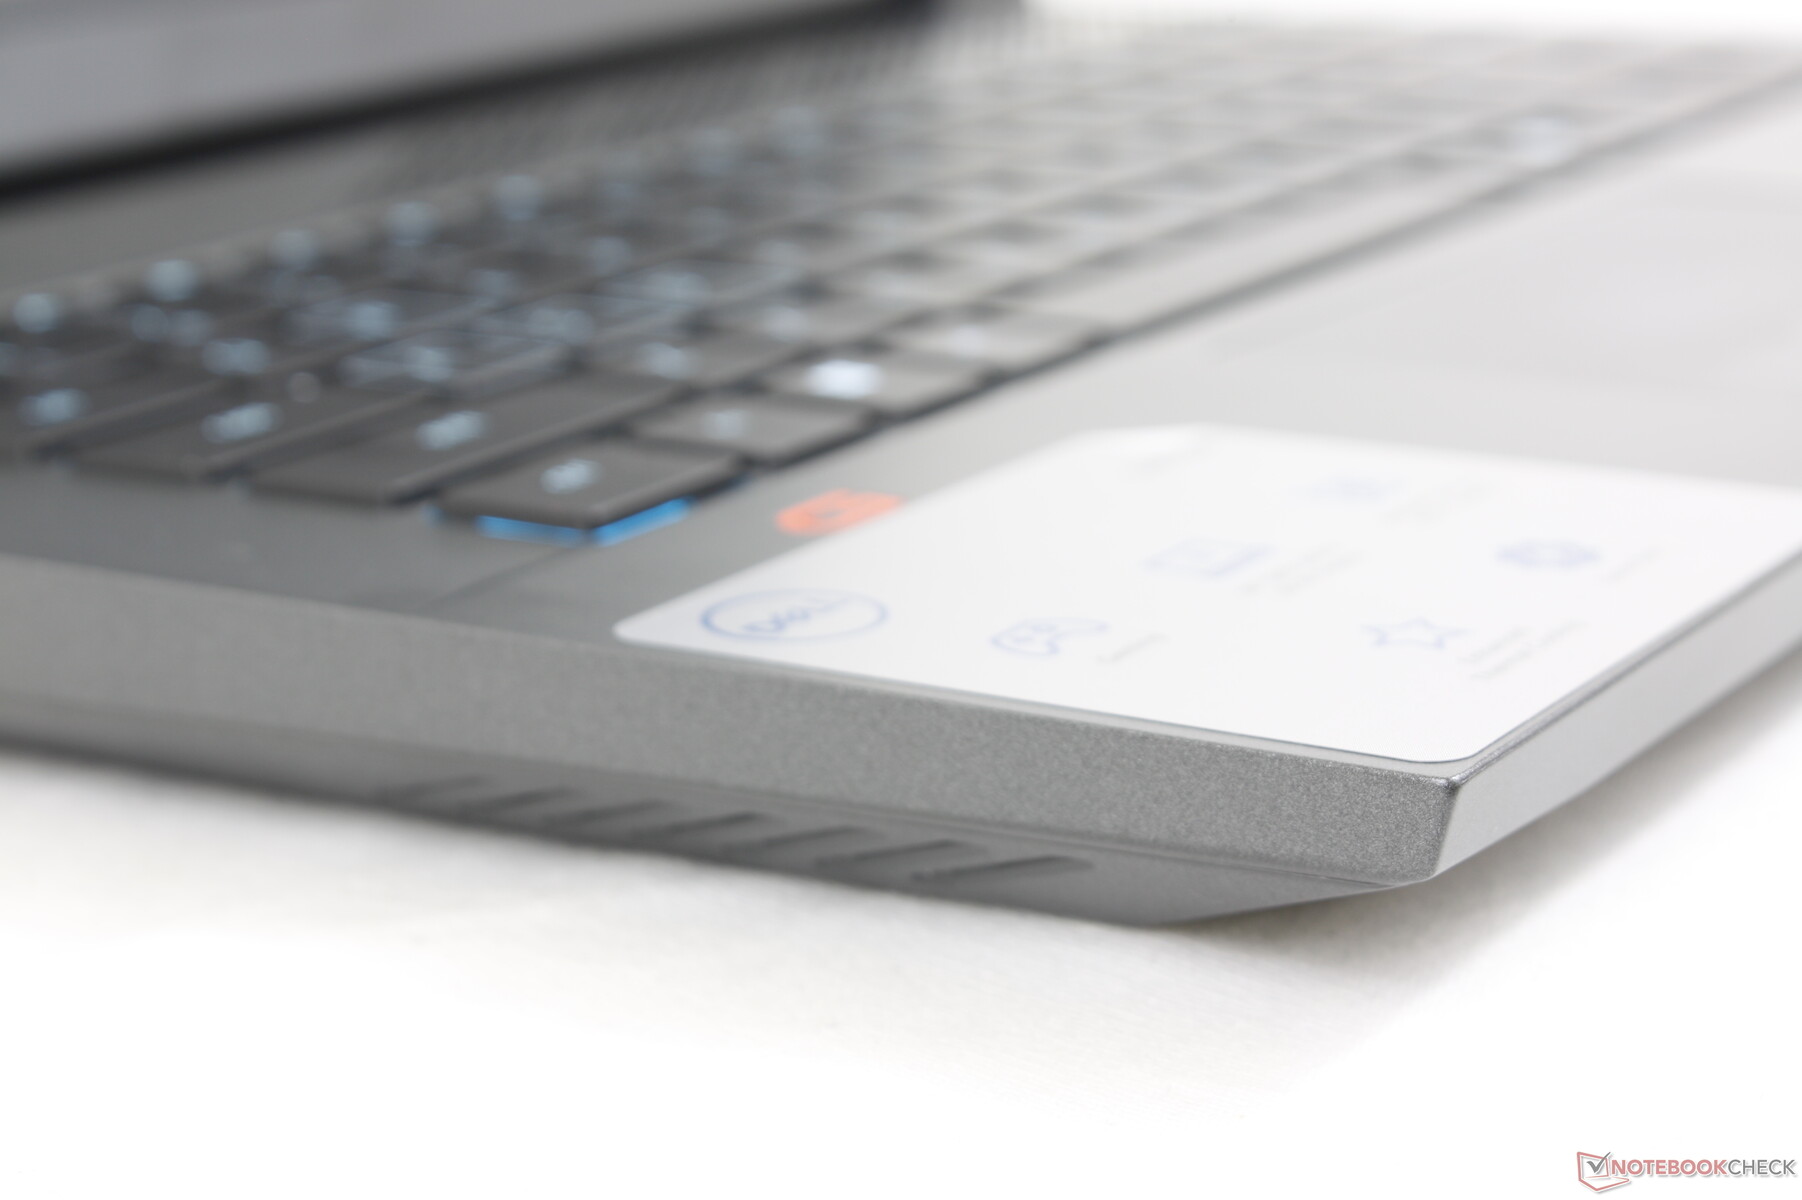
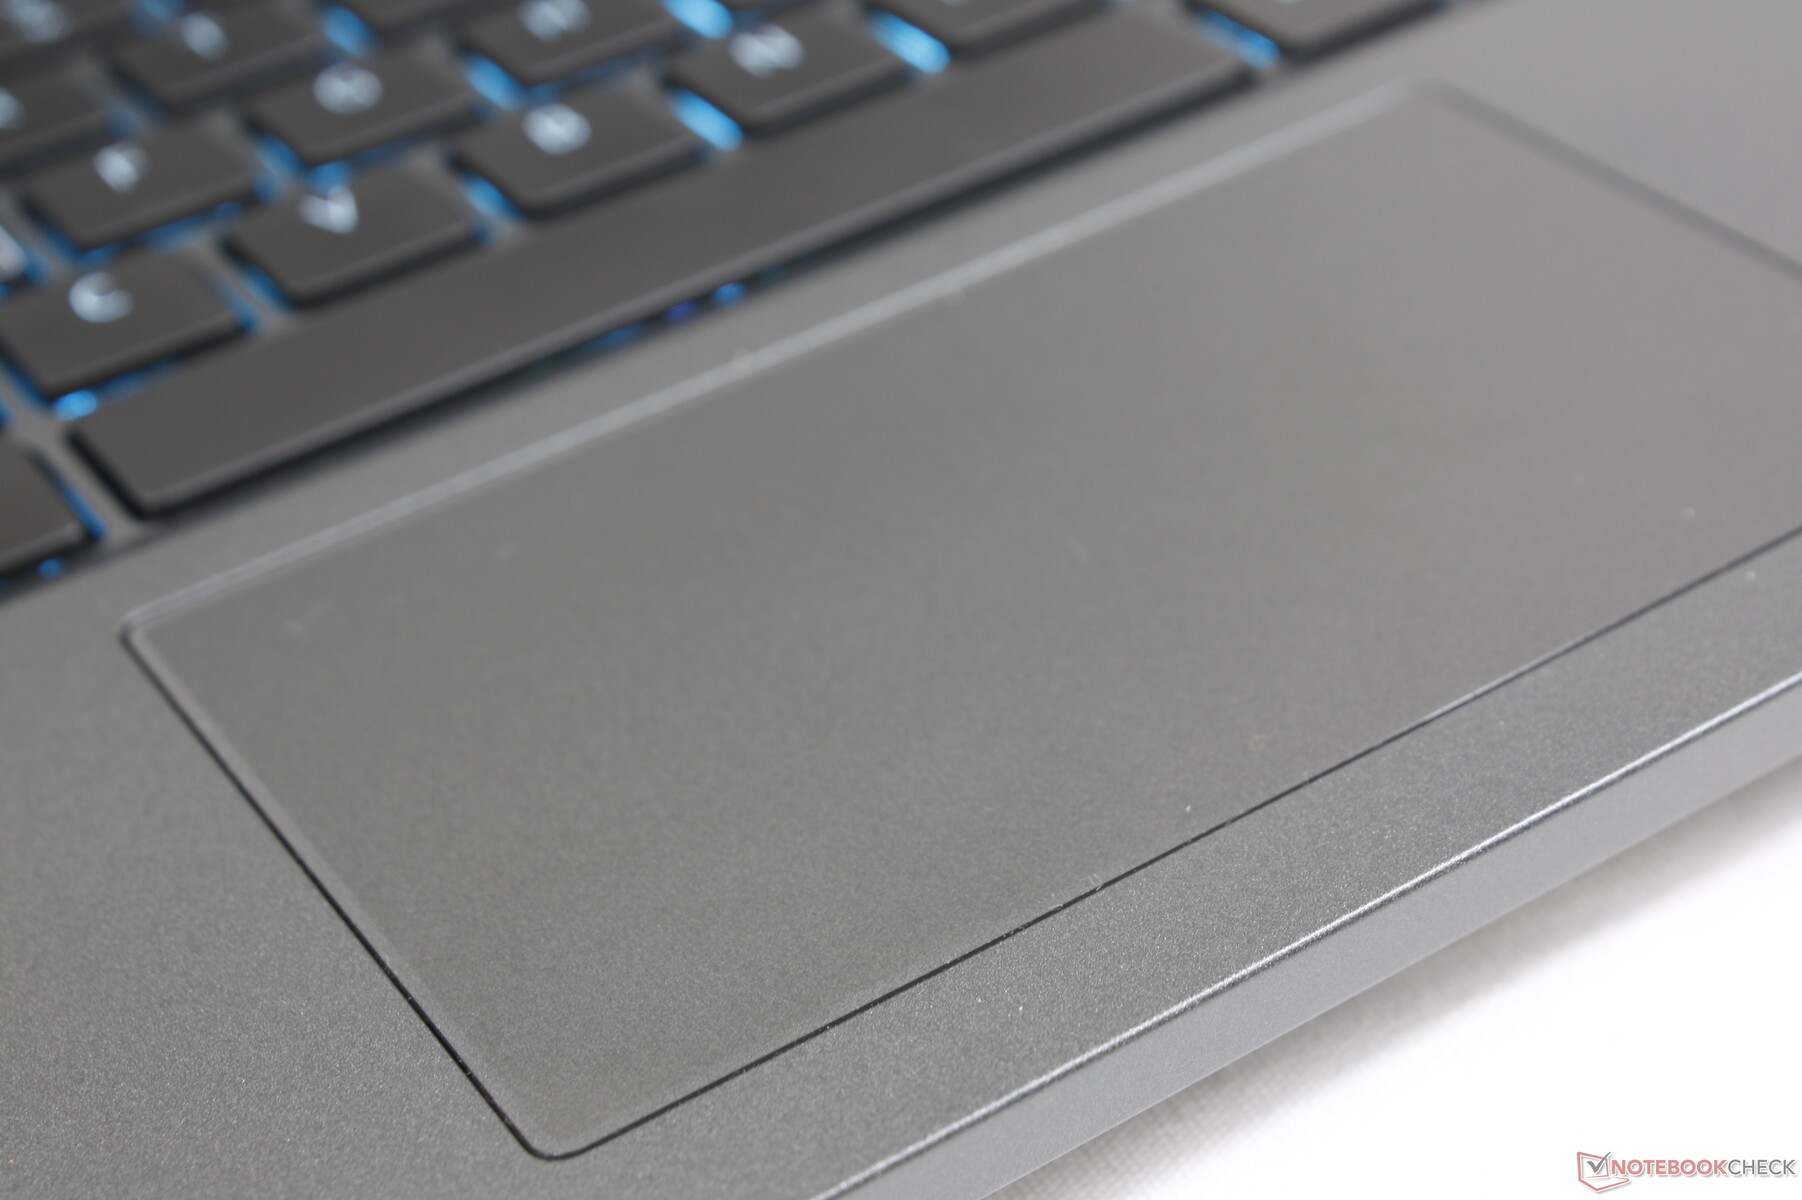
Touchpad
Com apenas 10,5 x 6 cm, o clickpad G16 é um dos menores clickpads que já vimos em qualquer laptop nesta faixa de preço. O clickpad no Inspiron 16 Plus 7620 é de 11,5 x 8 cm em comparação. O tamanho pequeno não é um quebra-galho, porém, já que o público alvo dos jogadores provavelmente terá um mouse pronto o tempo todo, de qualquer forma.

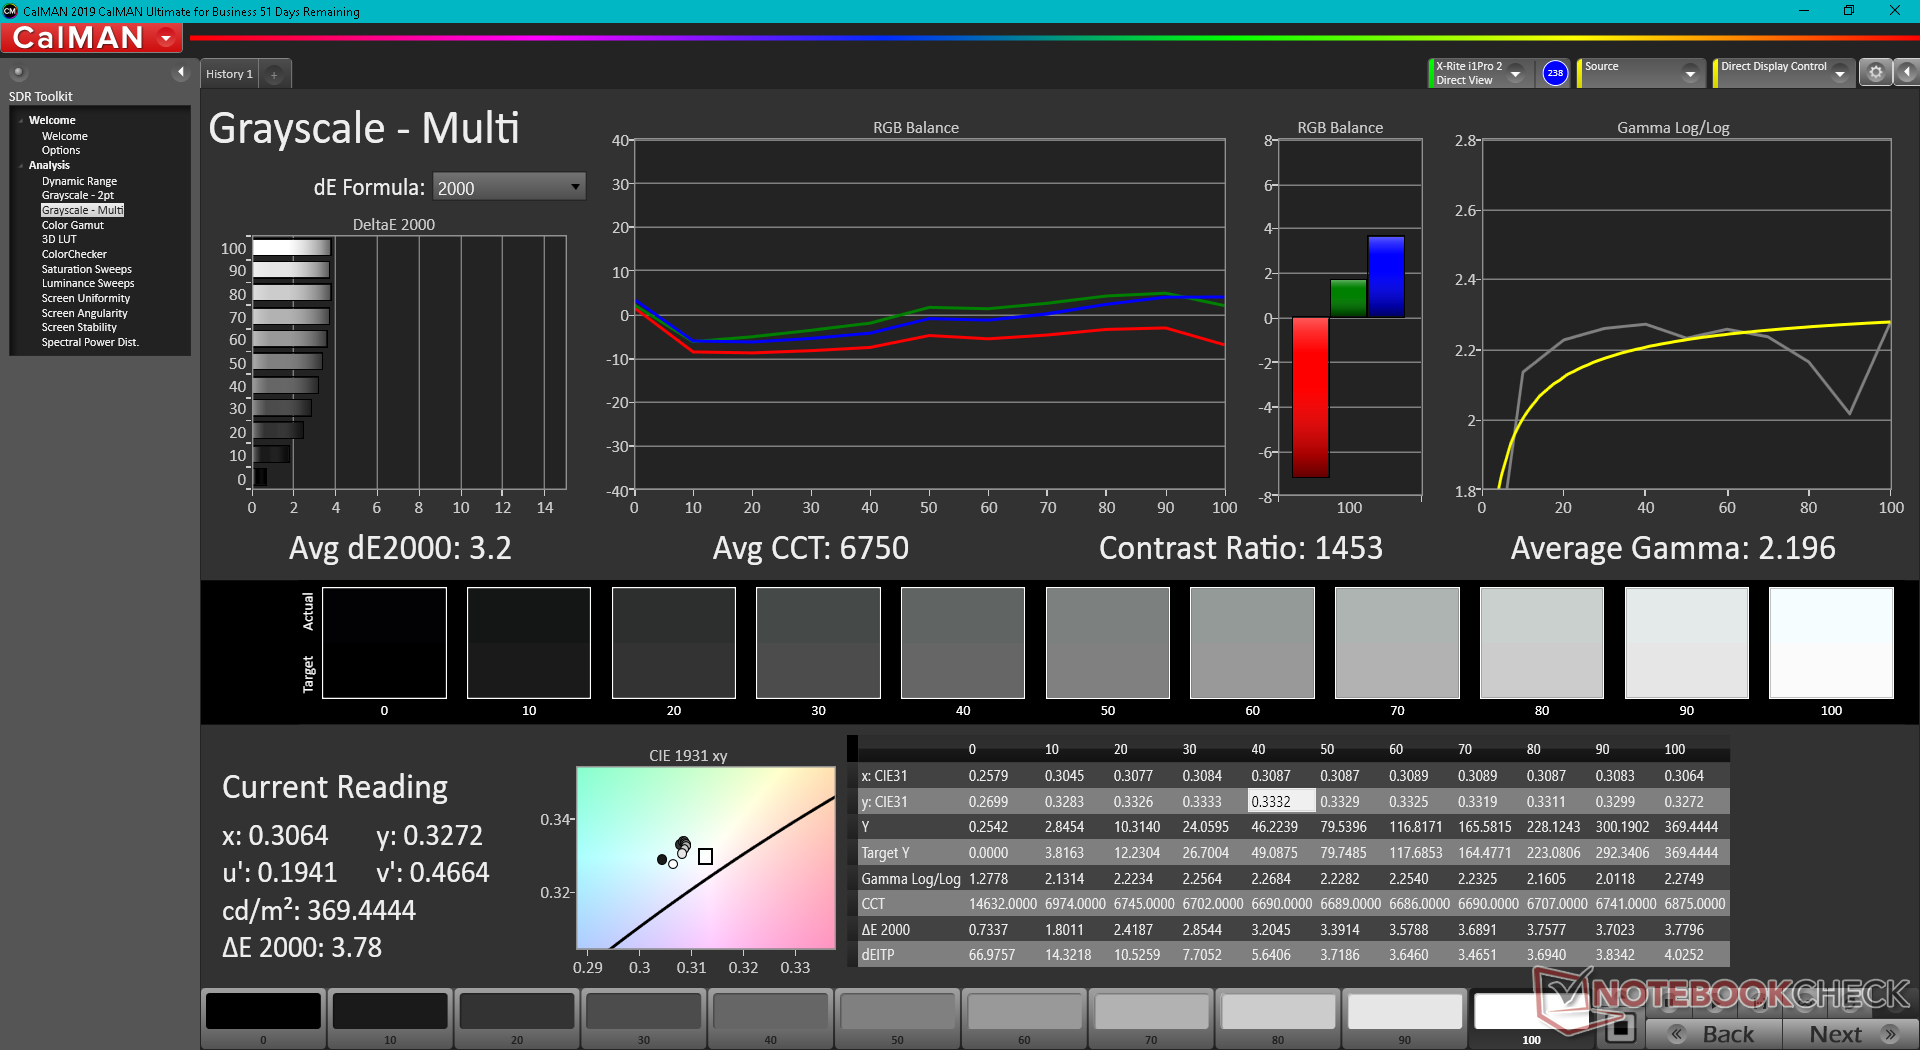
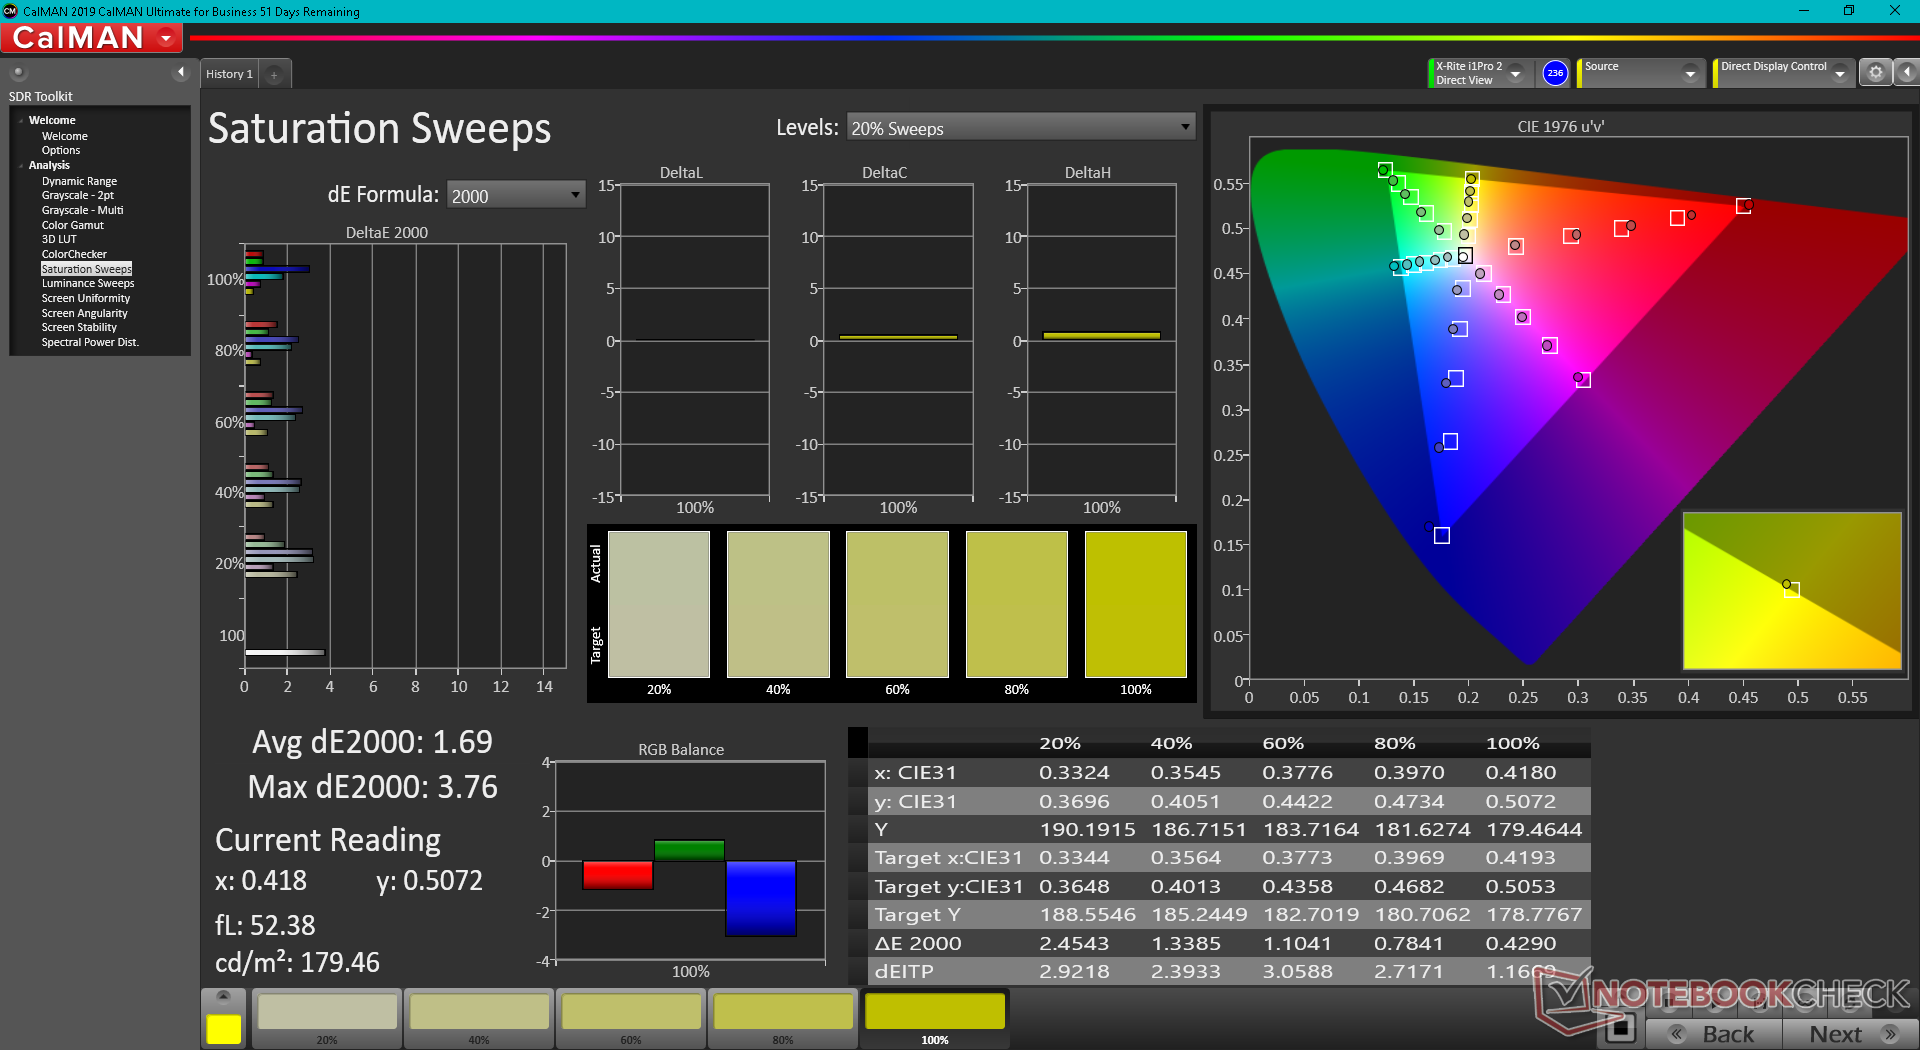
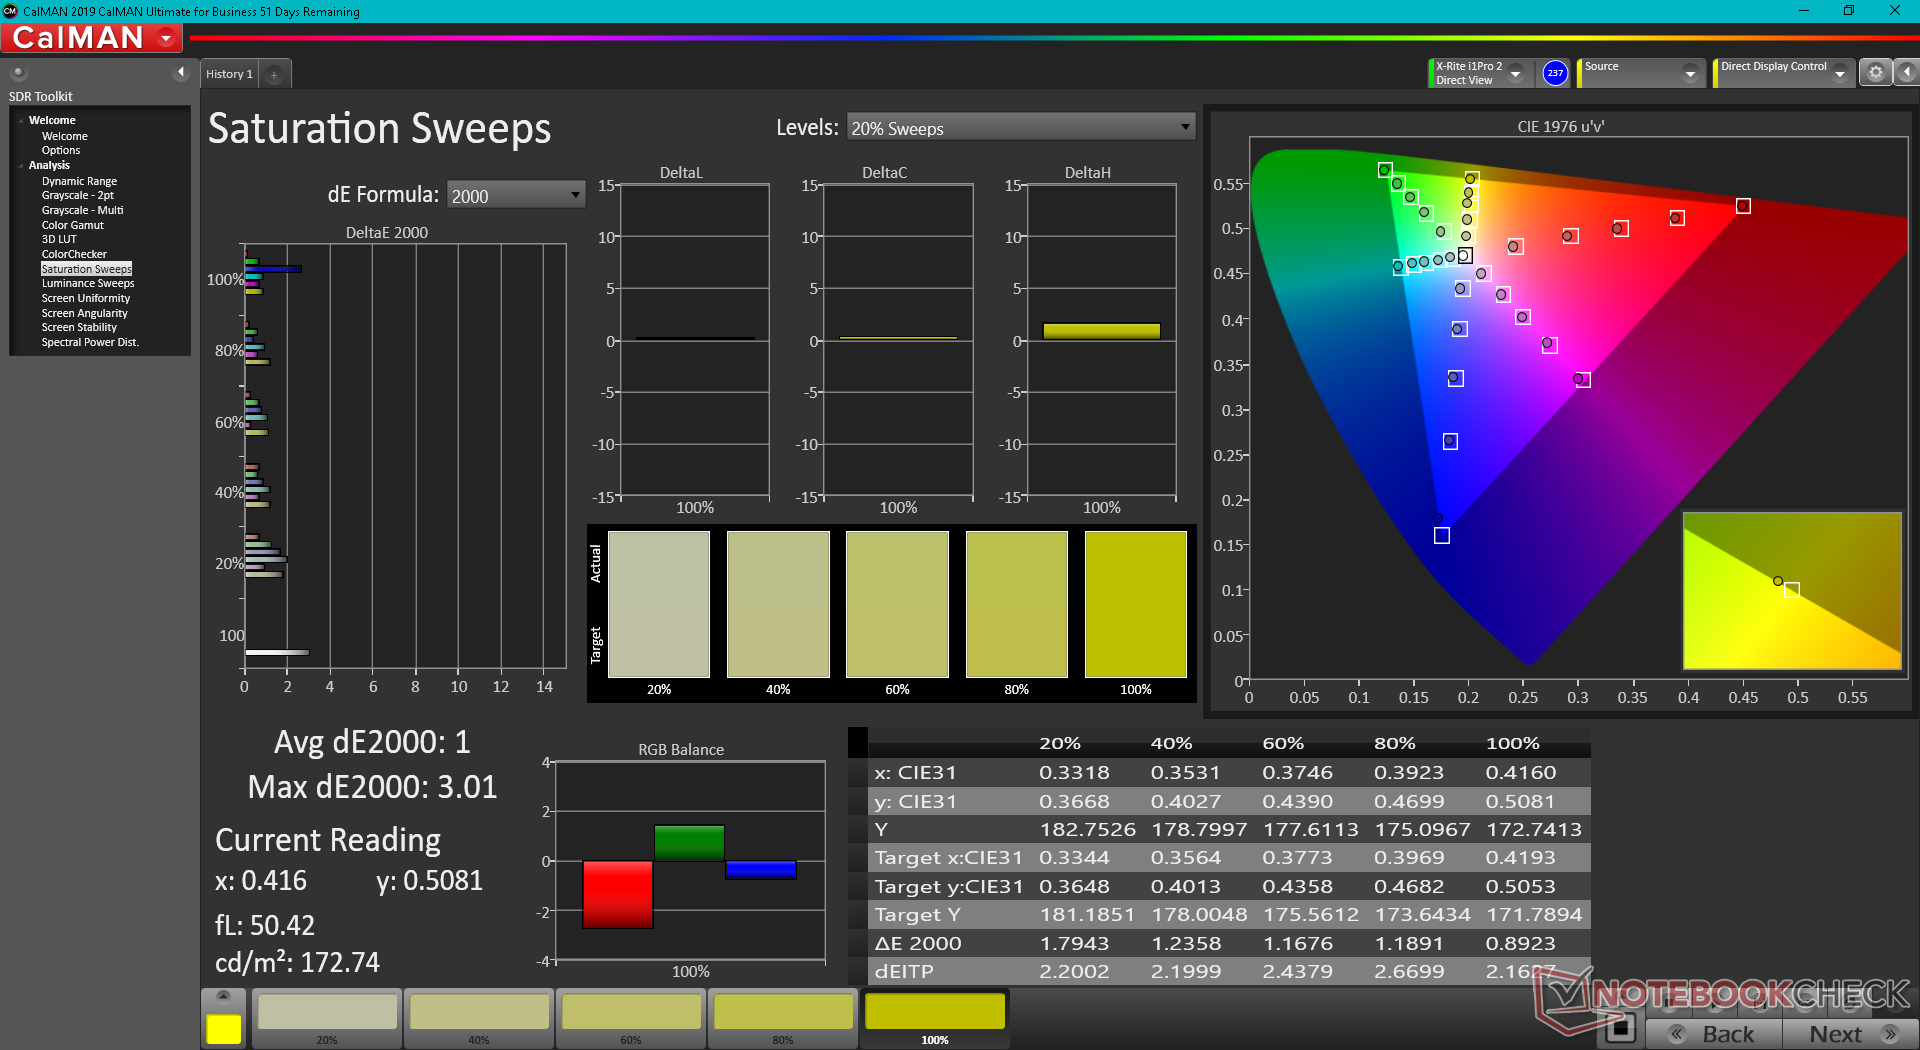
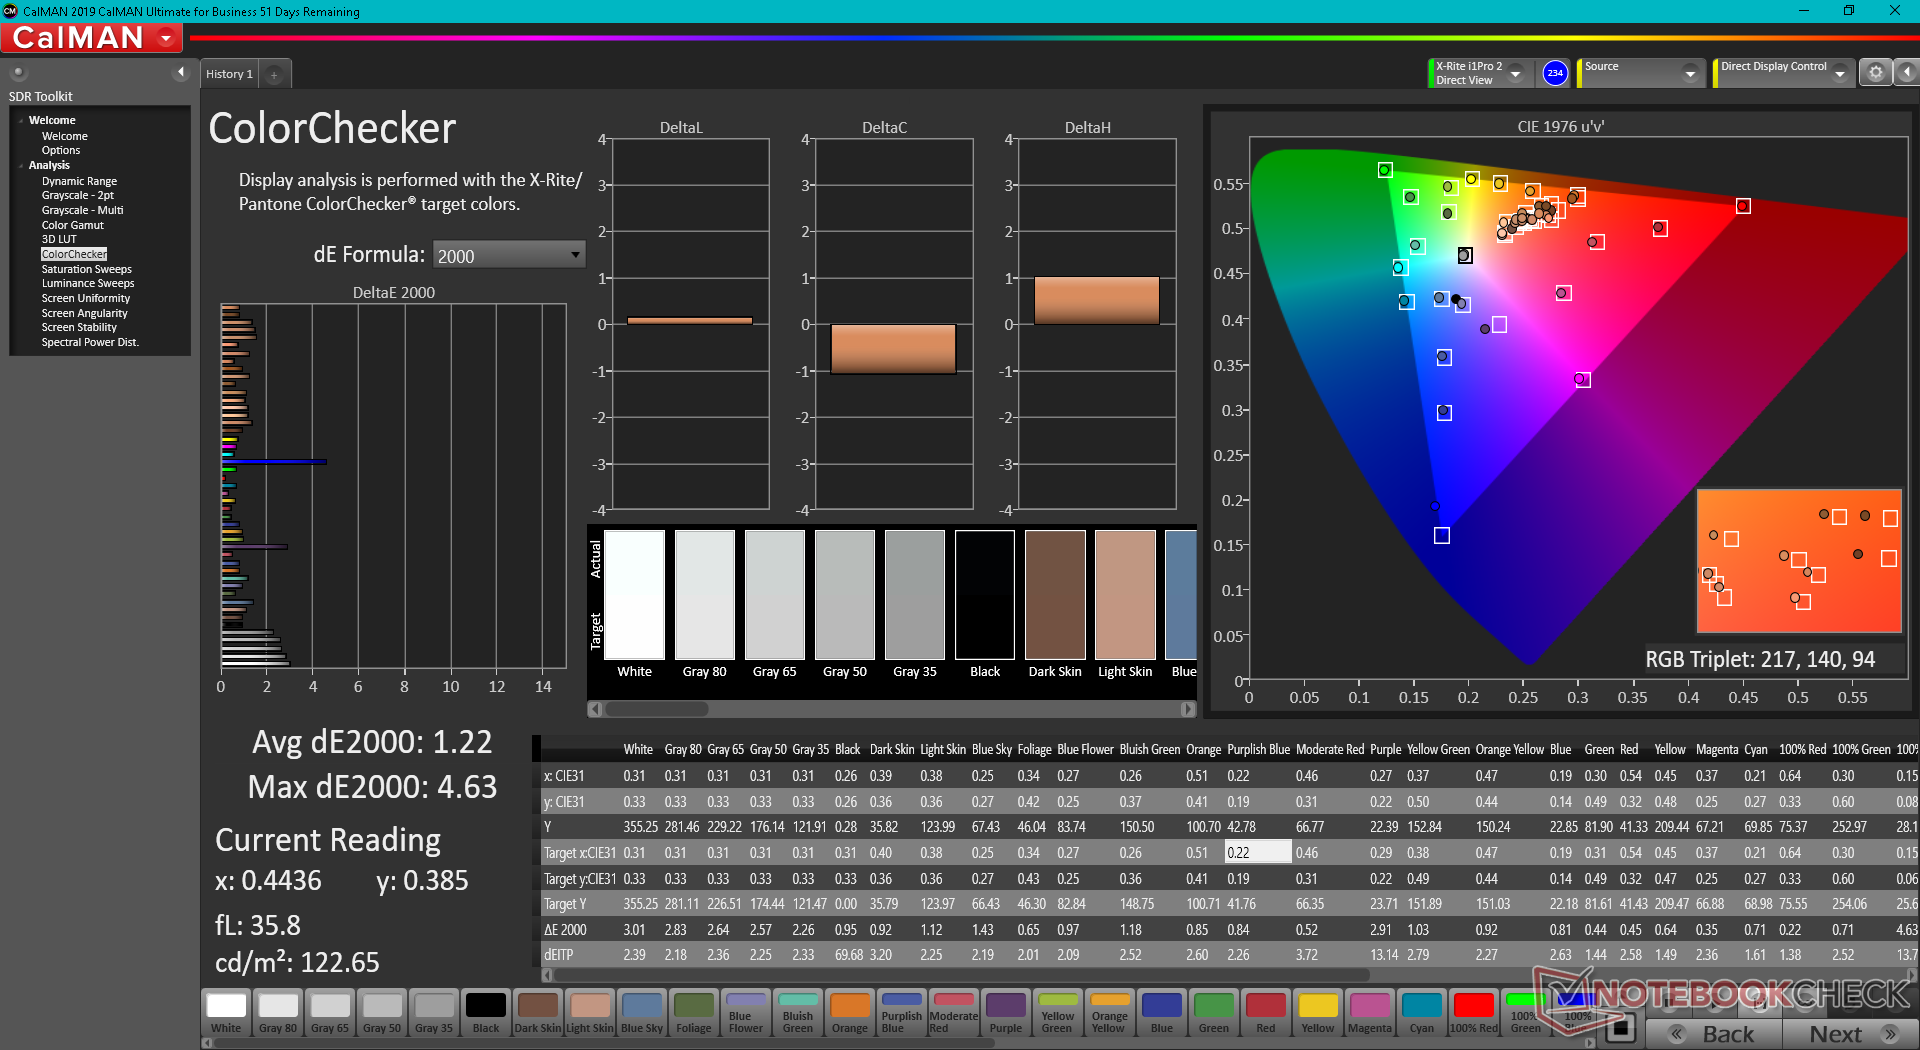
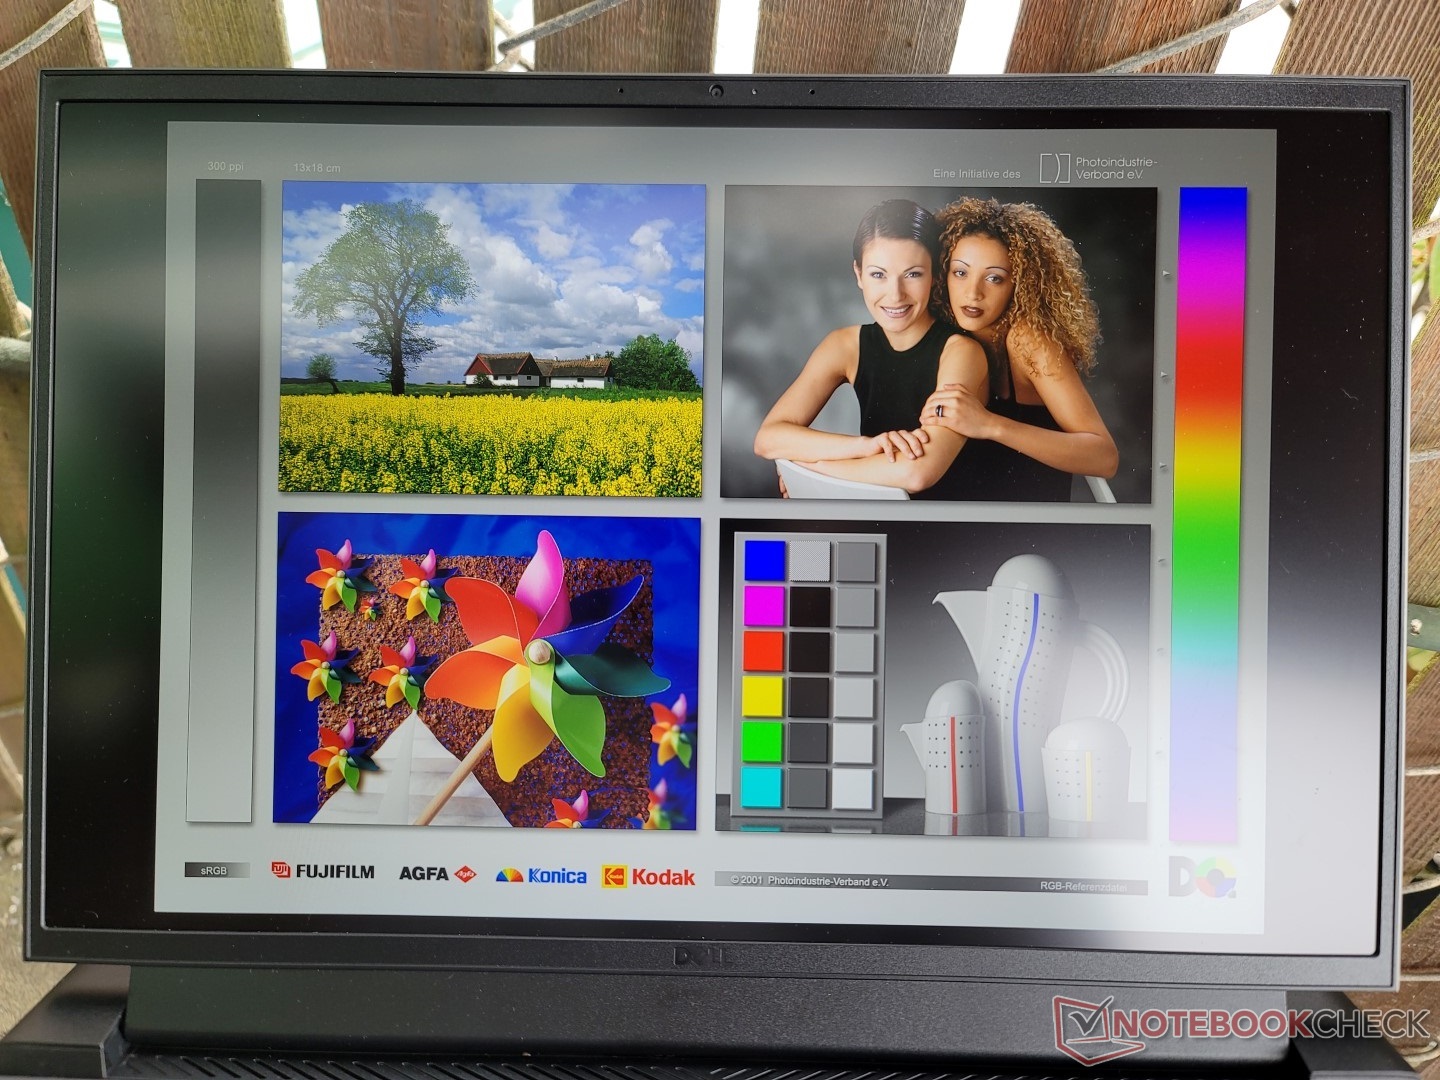
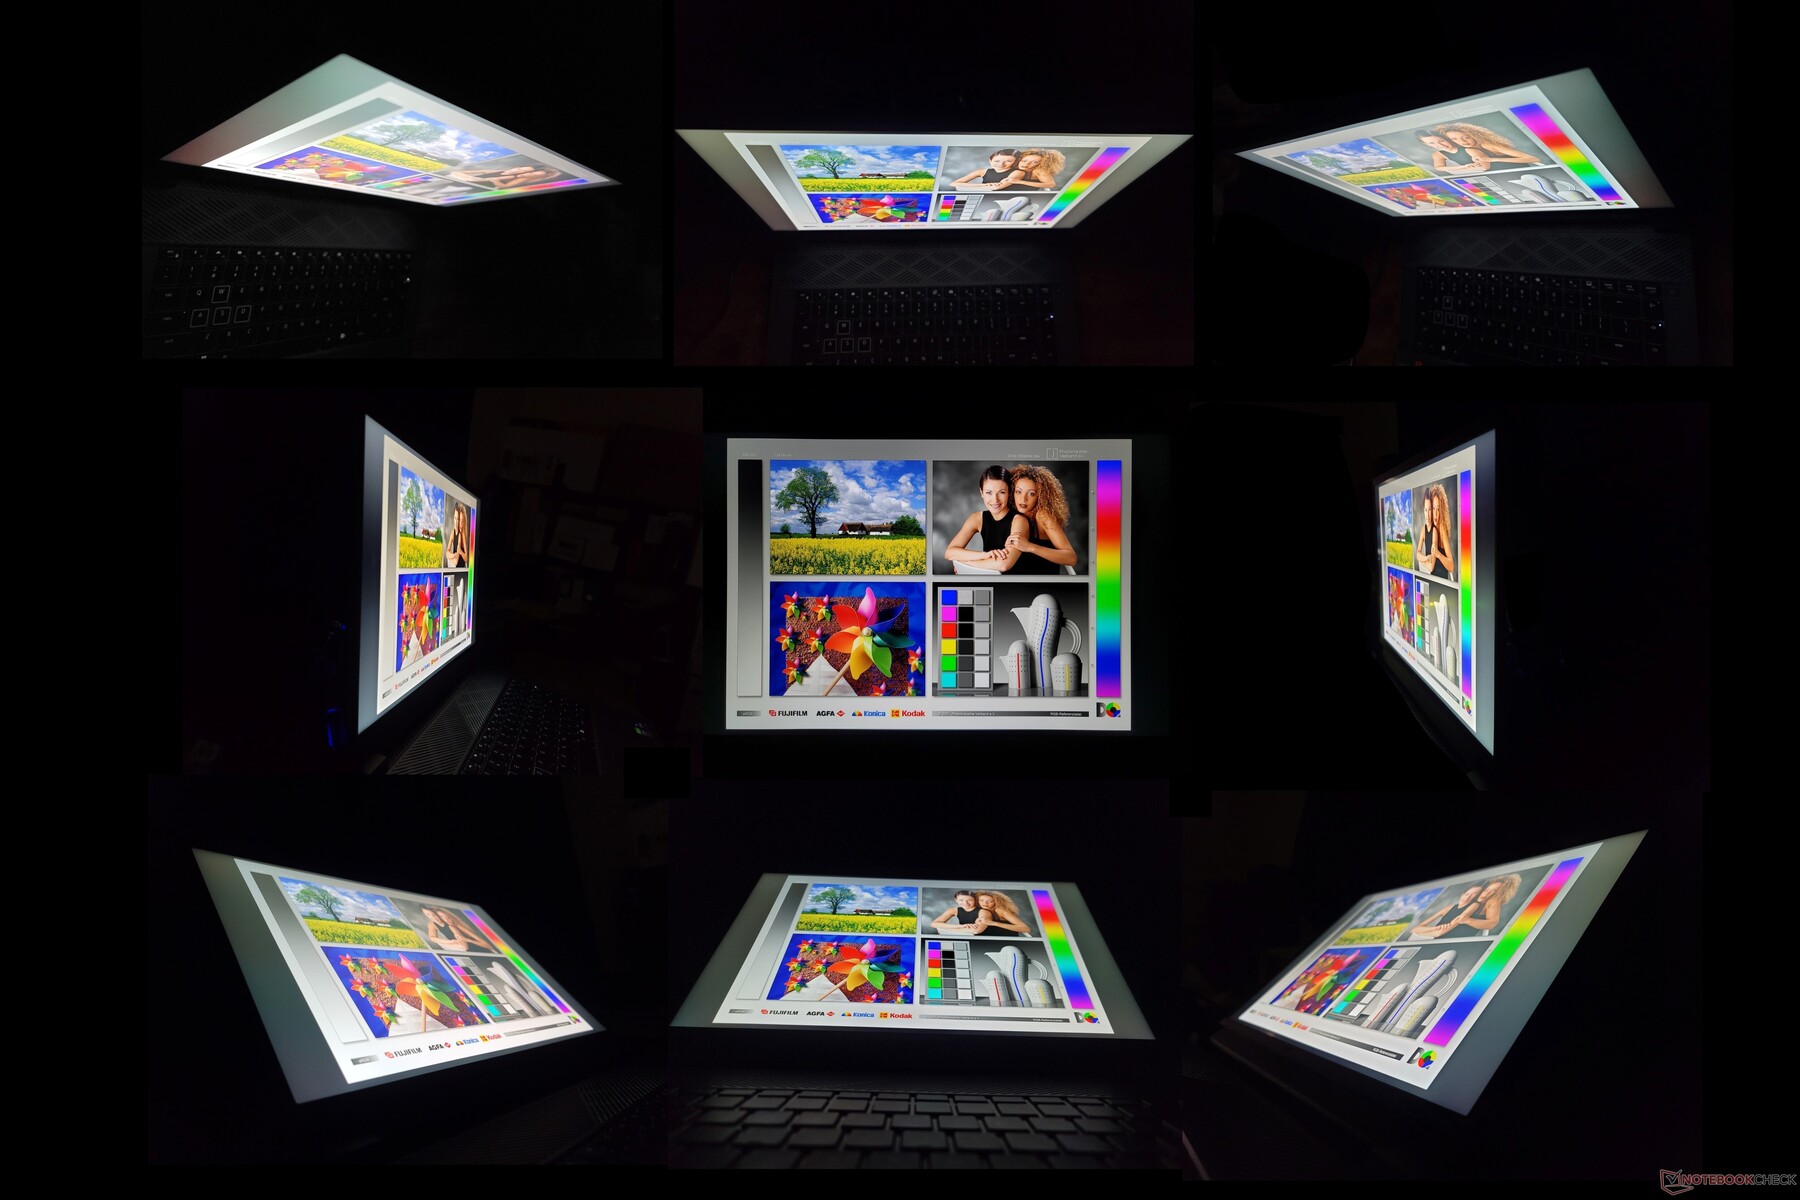
Visor - IPS, sRGB completo, 165 Hz, e tempos de resposta rápida
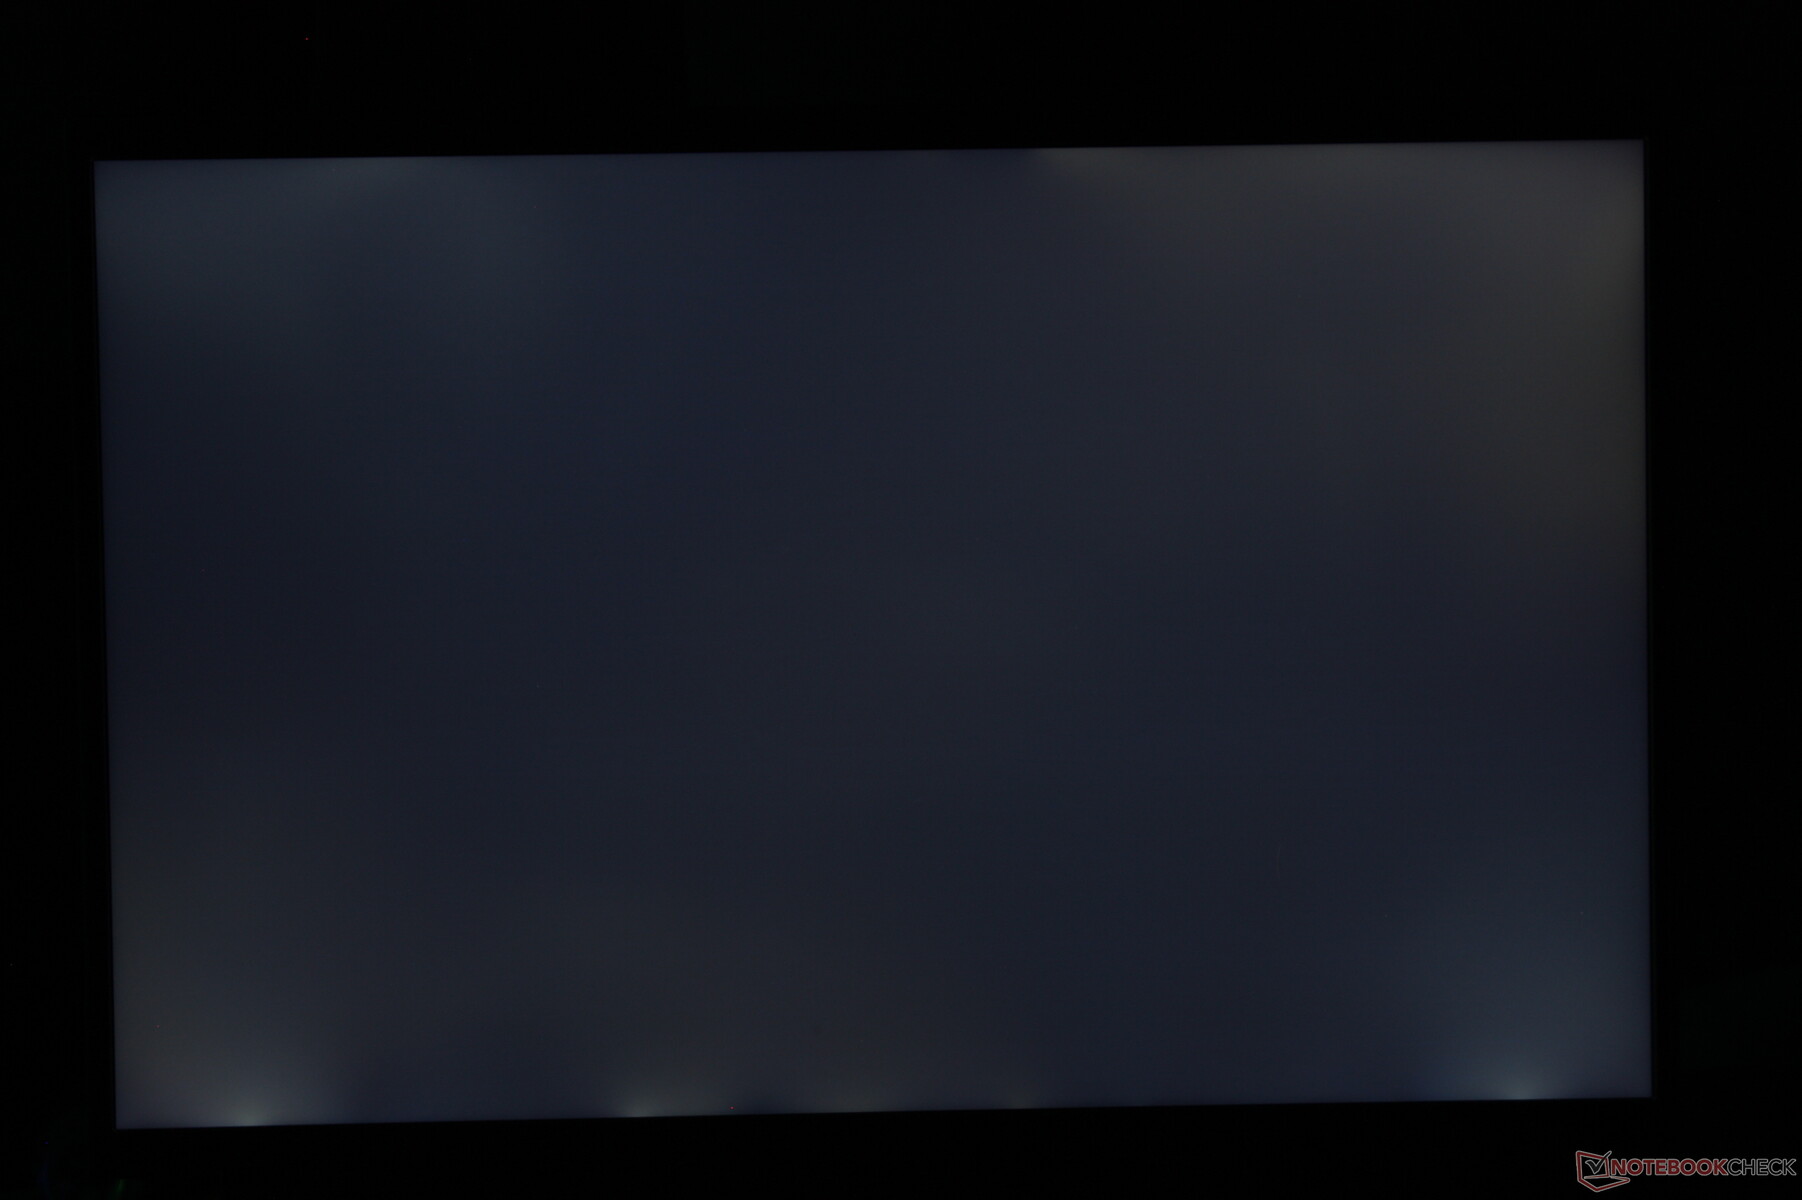
O painel aqui é semelhante ao que é enviado atualmente com a Lenovo Legion 7 16ARHA7 pois compartilham o mesmo fabricante, a mesma alta taxa de atualização, a mesma resolução, a mesma meta de 100% sRGB, e até mesmo relações de contraste quase idênticas e tempos de resposta preto-e-branco. A qualidade da imagem é significativamente melhor do que a do painel Chi Mei, conforme encontrado no HP Victus 16. Embora seja um pouco aborrecido que não haja outras opções de escolha, isso significa pelo menos que todos os proprietários de G16 deveriam estar obtendo a mesma excelente experiência de visualização, sem configurações inesperadas de tela de baixo nível.
| |||||||||||||||||||||||||
iluminação: 83 %
iluminação com acumulador: 369.4 cd/m²
Contraste: 1154:1 (Preto: 0.32 cd/m²)
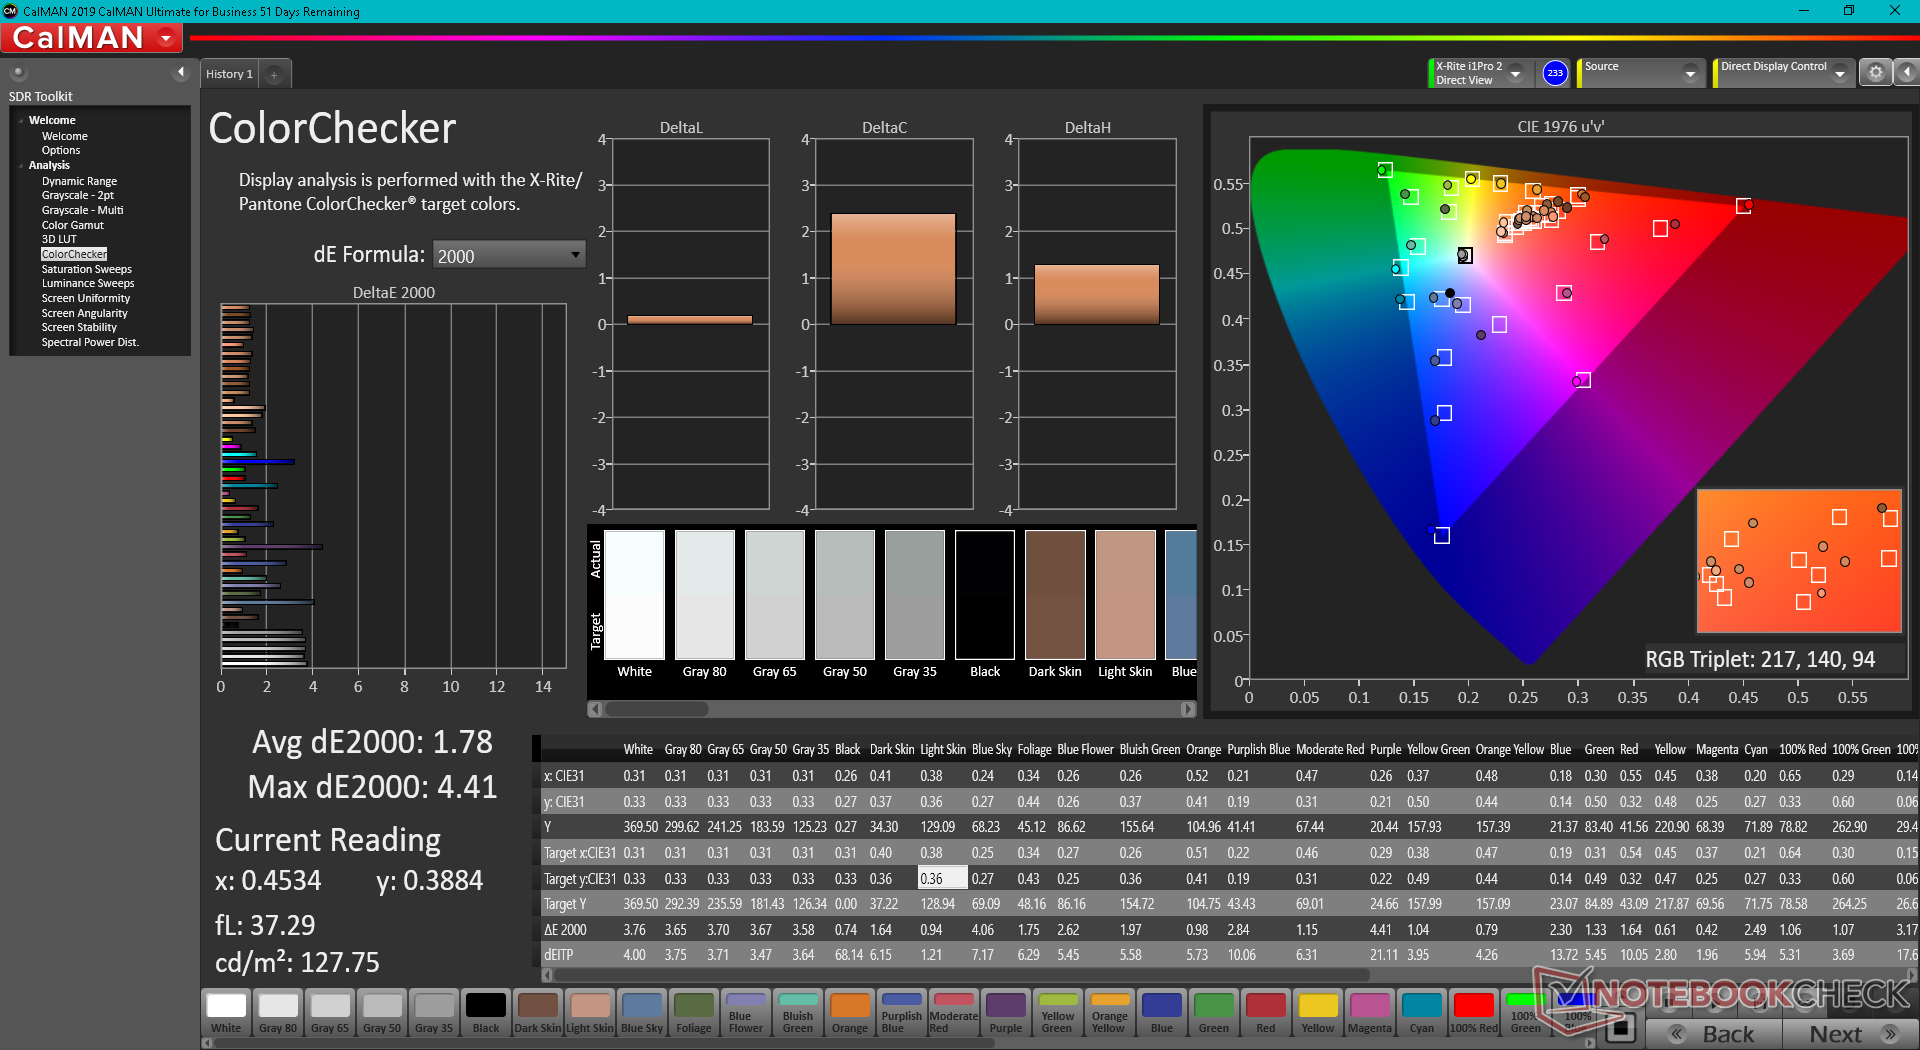
ΔE ColorChecker Calman: 1.78 | ∀{0.5-29.43 Ø4.71}
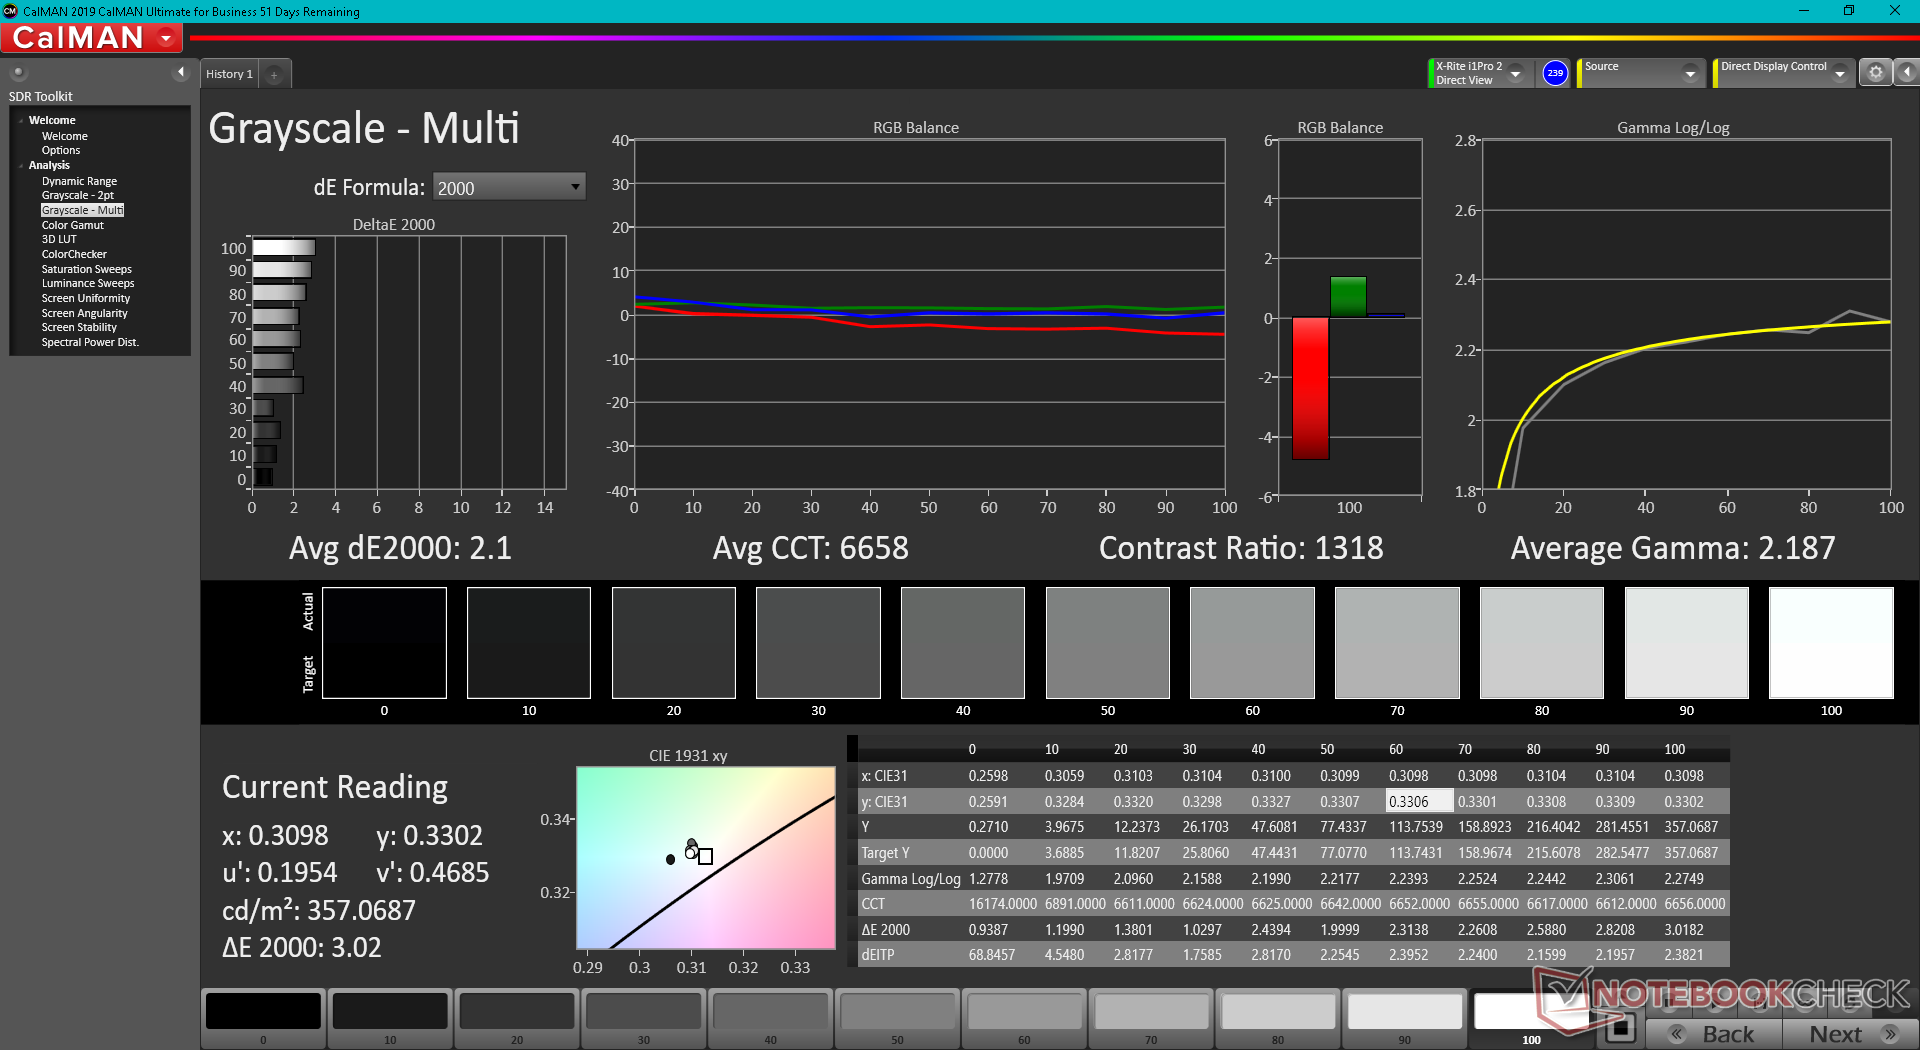
calibrated: 1.22
ΔE Greyscale Calman: 3.2 | ∀{0.09-98 Ø4.96}
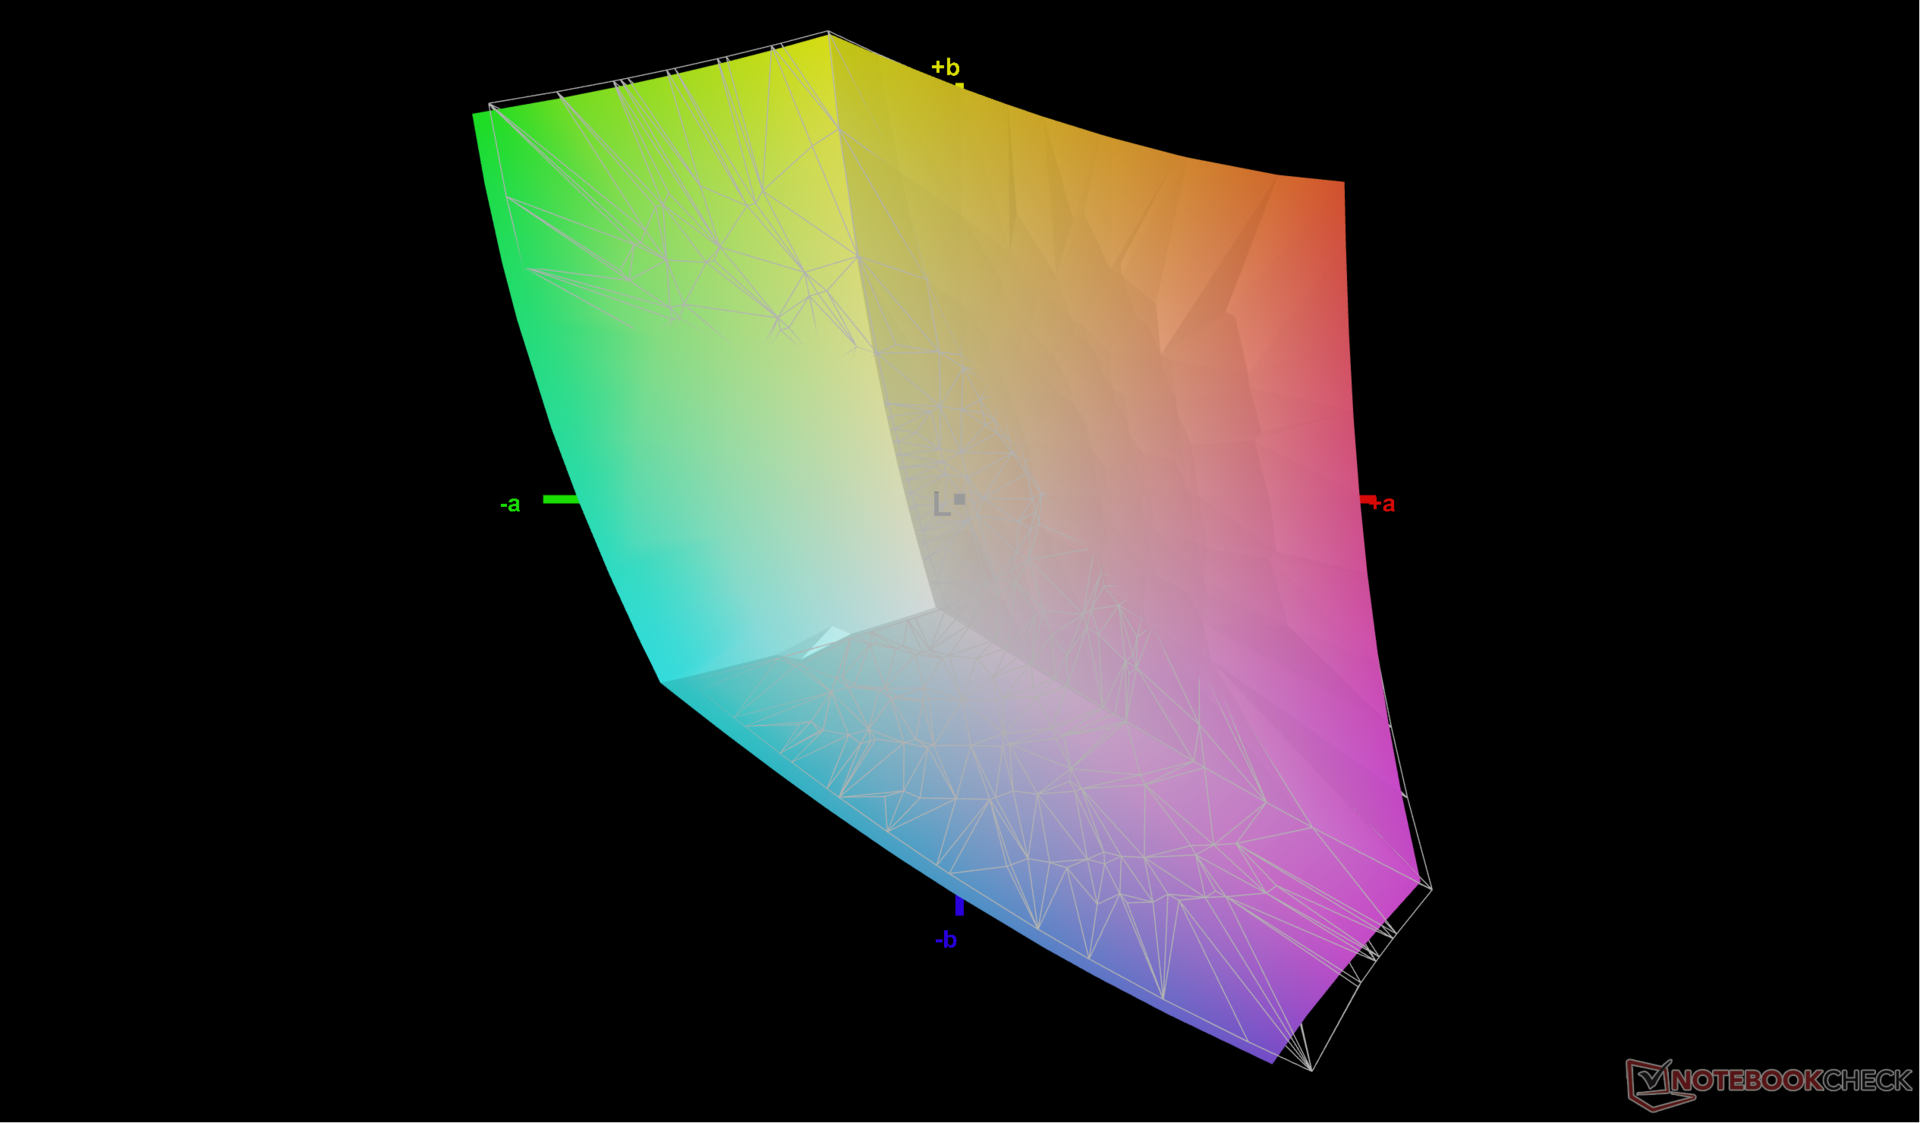
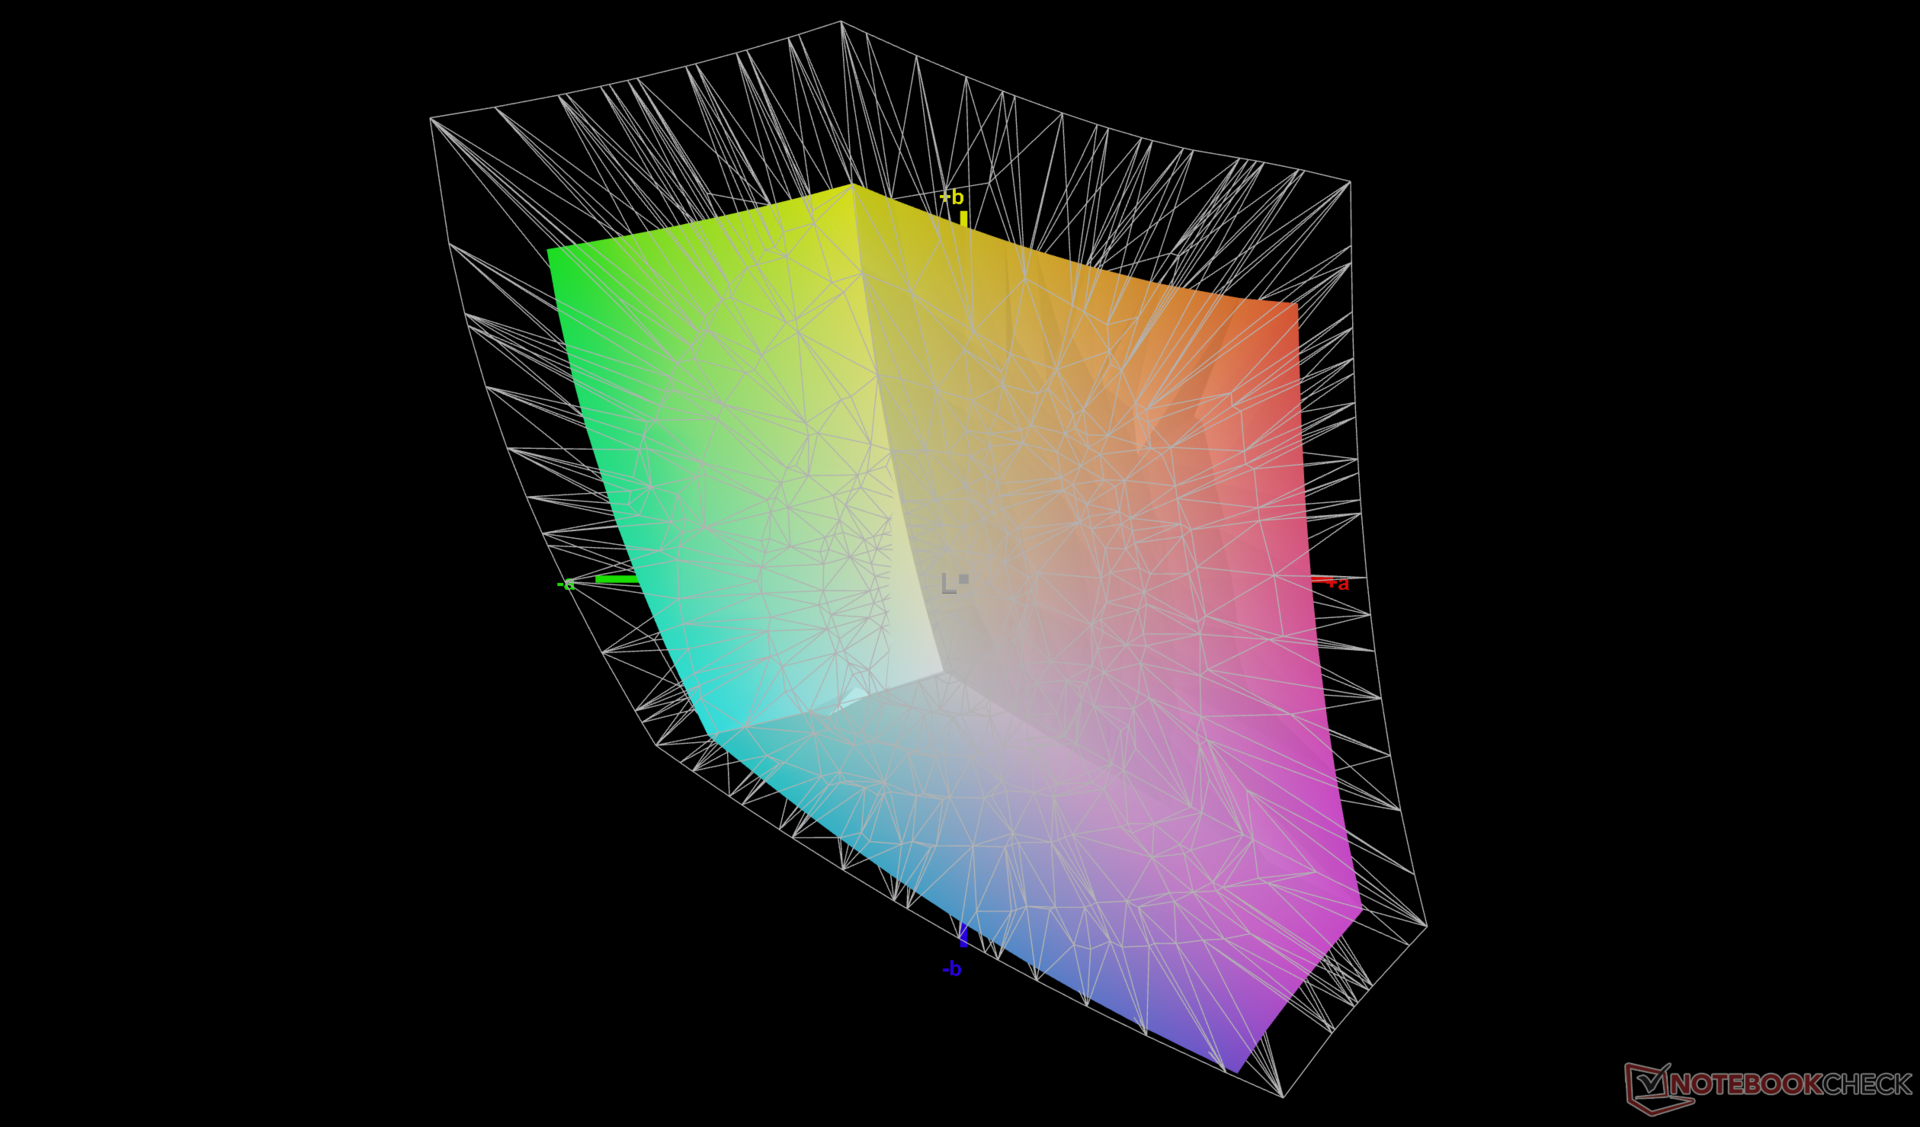
70.5% AdobeRGB 1998 (Argyll 3D)
98% sRGB (Argyll 3D)
68.3% Display P3 (Argyll 3D)
Gamma: 2.2
CCT: 6750 K
| Dell G16 7620 BOE NE16QDM, IPS, 2560x1600, 16" | Lenovo Legion 7 16ARHA7 BOE CQ NE160QDM-NY1, IPS, 2560x1600, 16" | HP Victus 16-e0145ng CMN1609, IPS, 1920x1080, 16.1" | Asus ROG Zephyrus M16 GU603H AU Optronics AUOC199, IPS, 2560x1600, 16" | Lenovo Legion 5 Pro 16IAH7H BOE CCQ_NE160QDM_NY1, IPS, 2560x1600, 16" | Acer Swift X SFX16-51G-5388 Chi Mei N161HCA-EA3, , 1920x1080, 16.1" | |
|---|---|---|---|---|---|---|
| Display | -6% | -38% | 0% | -4% | ||
| Display P3 Coverage (%) | 68.3 | 63.7 -7% | 41.6 -39% | 68.53 0% | 65.1 -5% | |
| sRGB Coverage (%) | 98 | 95.3 -3% | 61.9 -37% | 98.38 0% | 95.65 -2% | |
| AdobeRGB 1998 Coverage (%) | 70.5 | 65.7 -7% | 43 -39% | 70.45 0% | 66.75 -5% | |
| Response Times | 1% | -166% | 43% | -11% | -171% | |
| Response Time Grey 50% / Grey 80% * (ms) | 8.6 ? | 9.2 ? -7% | 29.6 ? -244% | 4.8 ? 44% | 14 ? -63% | 30 ? -249% |
| Response Time Black / White * (ms) | 10.4 ? | 9.6 ? 8% | 19.4 ? -87% | 6 ? 42% | 6 ? 42% | 20 ? -92% |
| PWM Frequency (Hz) | ||||||
| Screen | -2% | -119% | -29% | 3% | 14% | |
| Brightness middle (cd/m²) | 369.4 | 478.8 30% | 257 -30% | 448 21% | 515 39% | 276 -25% |
| Brightness (cd/m²) | 348 | 477 37% | 239 -31% | 446 28% | 475 36% | 264 -24% |
| Brightness Distribution (%) | 83 | 90 8% | 88 6% | 86 4% | 85 2% | 85 2% |
| Black Level * (cd/m²) | 0.32 | 0.43 -34% | 0.25 22% | 0.48 -50% | 0.45 -41% | 0.16 50% |
| Contrast (:1) | 1154 | 1113 -4% | 1028 -11% | 933 -19% | 1144 -1% | 1725 49% |
| Colorchecker dE 2000 * | 1.78 | 2.24 -26% | 6.91 -288% | 2.76 -55% | 2.38 -34% | 1.8 -1% |
| Colorchecker dE 2000 max. * | 4.41 | 4.49 -2% | 22.27 -405% | 7.09 -61% | 4.37 1% | 3.77 15% |
| Colorchecker dE 2000 calibrated * | 1.22 | 1.89 -55% | 3.61 -196% | 2.86 -134% | 1.1 10% | 0.63 48% |
| Greyscale dE 2000 * | 3.2 | 2.3 28% | 7.5 -134% | 3.1 3% | 2.71 15% | 2.76 14% |
| Gamma | 2.2 100% | 2.25 98% | 2.125 104% | 2.153 102% | 2.49 88% | 2.37 93% |
| CCT | 6750 96% | 6955 93% | 6025 108% | 6826 95% | 6117 106% | 6564 99% |
| Color Space (Percent of AdobeRGB 1998) (%) | 87 | |||||
| Color Space (Percent of sRGB) (%) | 100 | |||||
| Média Total (Programa/Configurações) | -2% /
-2% | -108% /
-108% | 7% /
-16% | -3% /
0% | -54% /
-16% |
* ... menor é melhor
As cores são decentemente calibradas para fora da caixa, embora a Dell não execute procedimentos de pré-calibração para o G16. Calibrar nós mesmos o painel com um colorímetro X-Rite melhoraria os valores médios de escala de cinza e DeltaE de cor apenas marginalmente de 3,2 e 1,78 para 2,1 e 1,22, respectivamente. Uma calibração do usuário final não é, portanto, necessária para a maioria dos proprietários.
Os usuários podem aplicar nosso perfil calibrado acima para uma visualização mais precisa.
Exibir tempos de resposta
| ↔ Tempo de resposta preto para branco | ||
|---|---|---|
| 10.4 ms ... ascensão ↗ e queda ↘ combinadas | ↗ 5.2 ms ascensão | 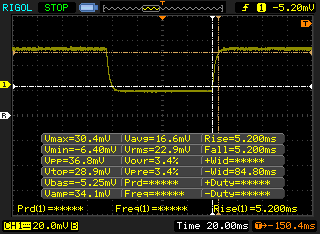 |
| ↘ 5.2 ms queda | ||
| A tela mostra boas taxas de resposta em nossos testes, mas pode ser muito lenta para jogadores competitivos. Em comparação, todos os dispositivos testados variam de 0.1 (mínimo) a 240 (máximo) ms. » 28 % de todos os dispositivos são melhores. Isso significa que o tempo de resposta medido é melhor que a média de todos os dispositivos testados (19.8 ms). | ||
| ↔ Tempo de resposta 50% cinza a 80% cinza | ||
| 8.6 ms ... ascensão ↗ e queda ↘ combinadas | ↗ 3.4 ms ascensão | 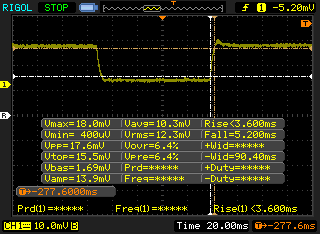 |
| ↘ 5.2 ms queda | ||
| A tela mostra taxas de resposta rápidas em nossos testes e deve ser adequada para jogos. Em comparação, todos os dispositivos testados variam de 0.165 (mínimo) a 636 (máximo) ms. » 22 % de todos os dispositivos são melhores. Isso significa que o tempo de resposta medido é melhor que a média de todos os dispositivos testados (31 ms). | ||
Cintilação da tela / PWM (modulação por largura de pulso)
| Tela tremeluzindo / PWM não detectado | 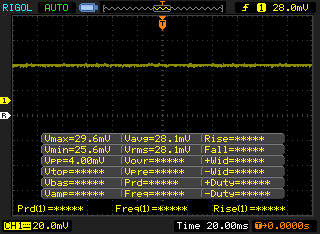 | ||
[pwm_comparison] Em comparação: 52 % de todos os dispositivos testados não usam PWM para escurecer a tela. Se PWM foi detectado, uma média de 7754 (mínimo: 5 - máximo: 343500) Hz foi medida. | |||
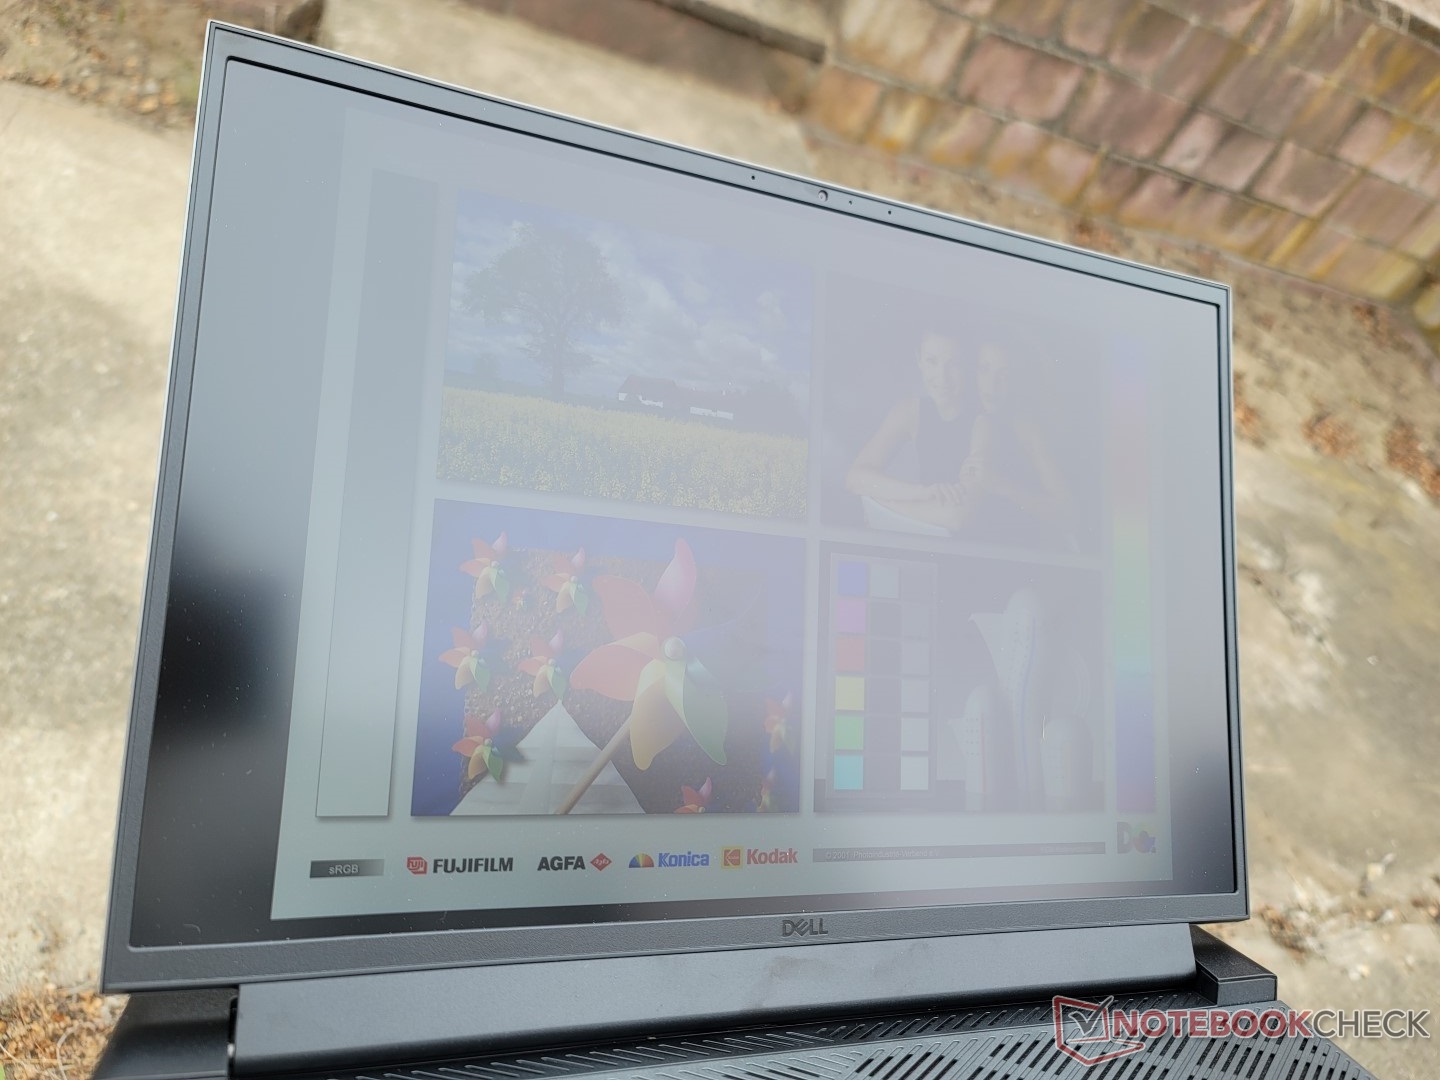
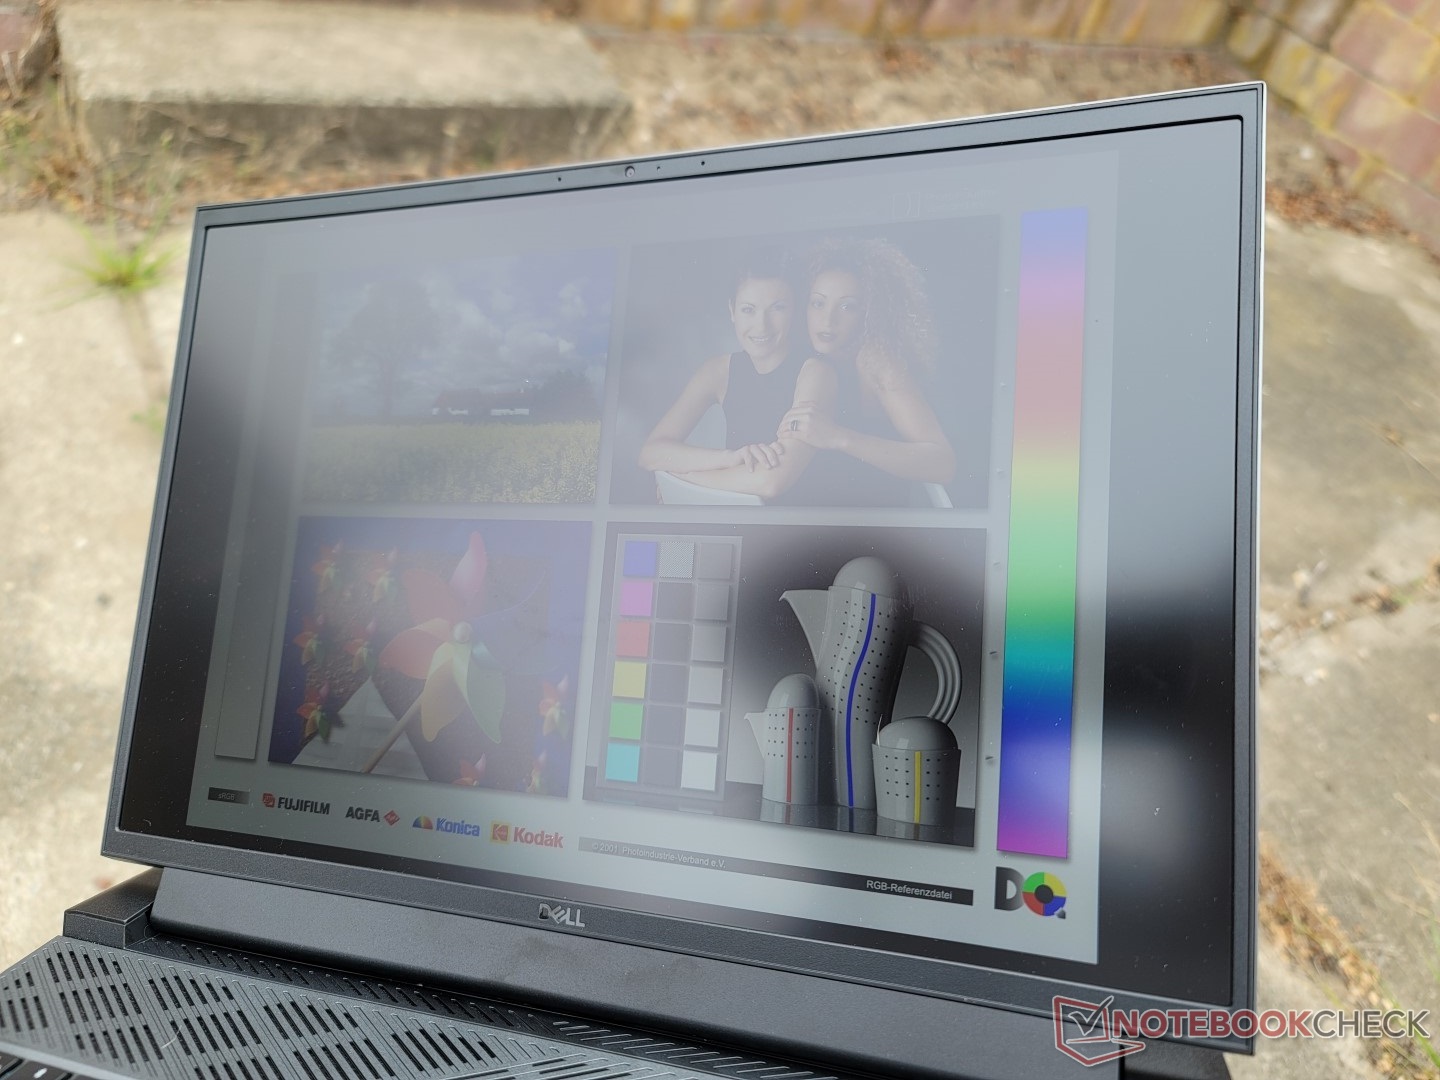
A visibilidade ao ar livre é decente se sob a sombra, mas o brilho se torna muito pesado se sob uma iluminação ambiente mais brilhante. Alternativas como a Lenovo Legion 5 Pro 16 ou Legion 7 16 têm muito mais brilho com cerca de 500 lêndeas cada uma se a visibilidade externa for uma preocupação.
Desempenho - Mais rápido que a média
Condições de teste
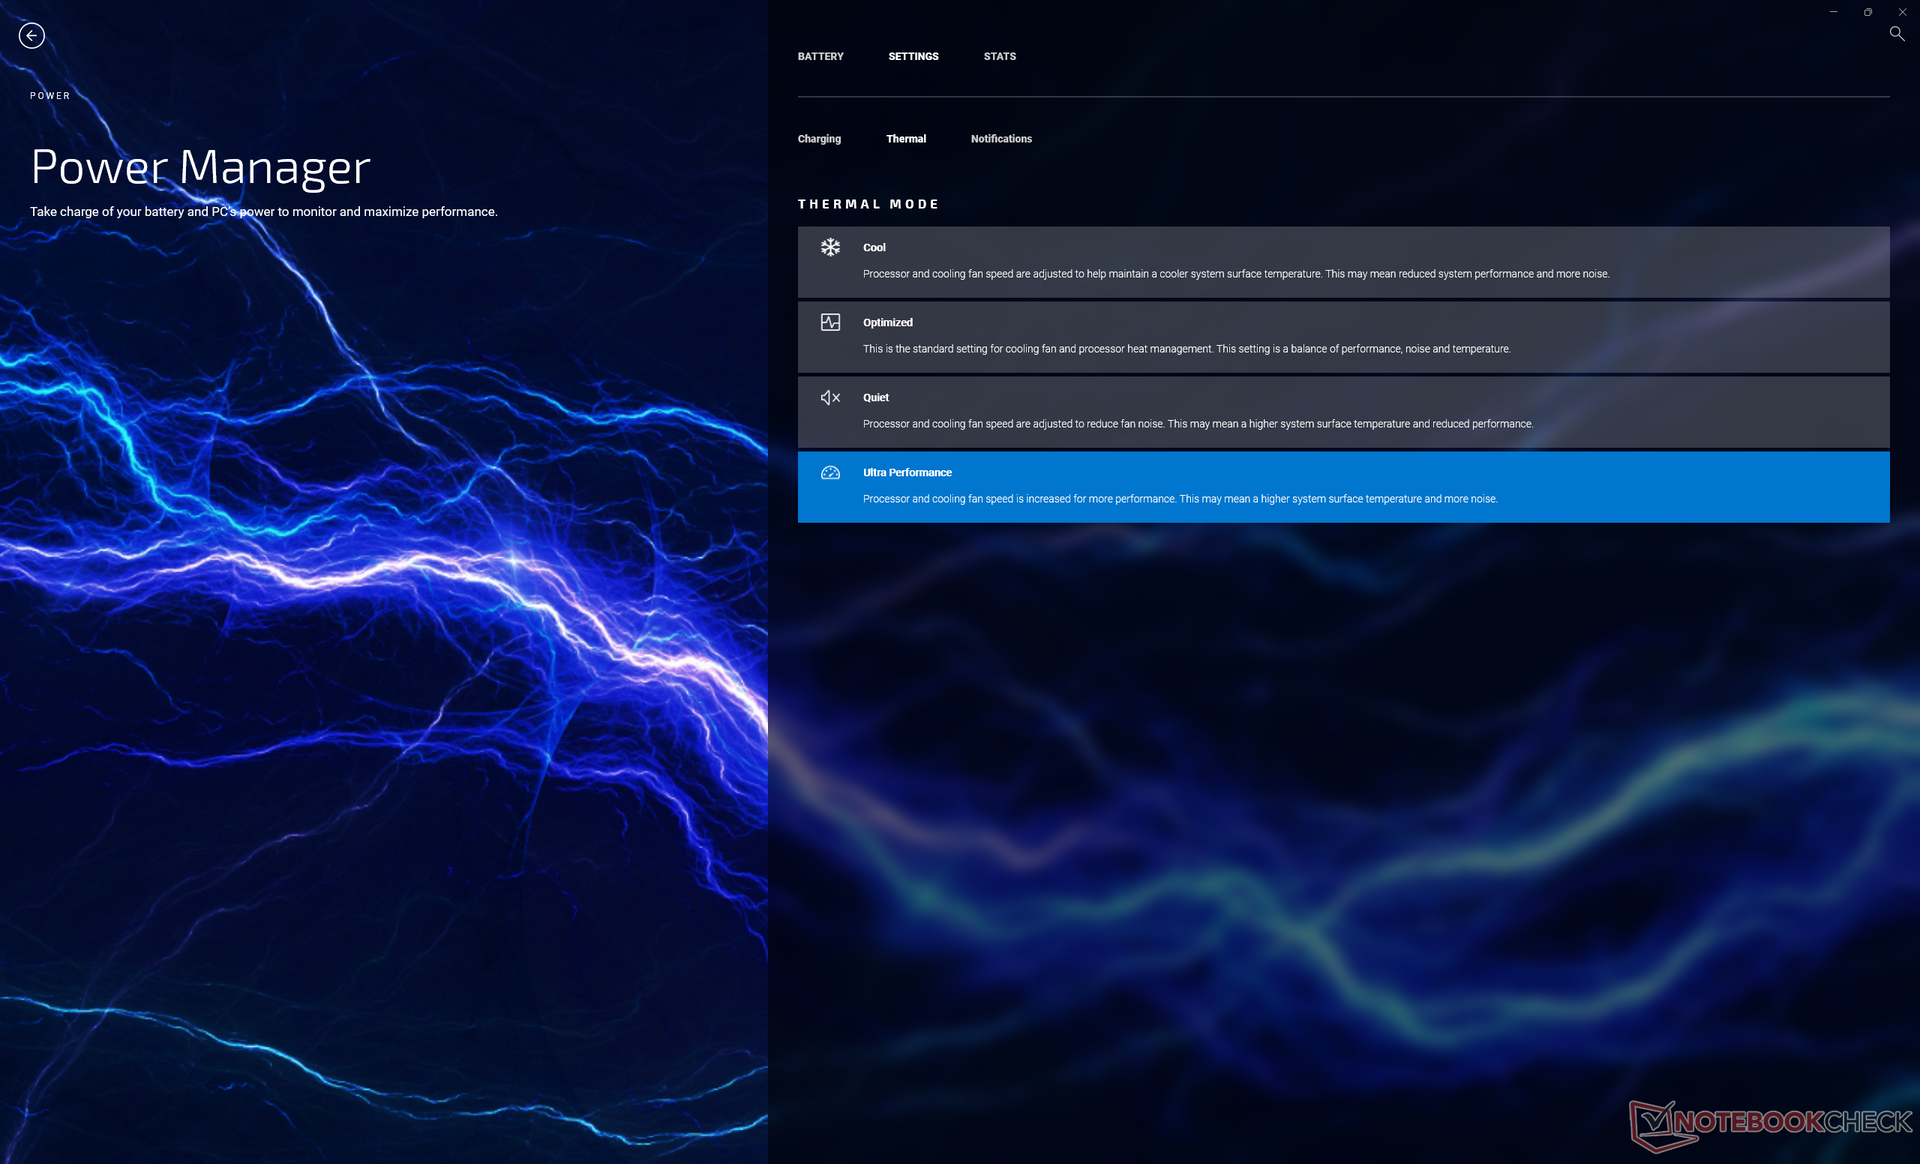
Ajustamos nossa unidade para o modo Performance via Windows e Ultra Performance via o software My Dell antes de executar quaisquer benchmarks abaixo. Também nos certificamos de desativar o Optimus e configurar o sistema para o modo GPU discreto através do Painel de Controle Nvidia. É recomendado que os proprietários se familiarizem com My Dell e Dell Update, pois estas duas aplicações pré-instaladas são vitais para ajustar o comportamento do sistema.
Processador
O desempenho multitarefa é excelente, com resultados 5 a 10% mais rápidos do que a média do laptop em nosso banco de dados com o mesmo Núcleo i7-12700H CPU. A CPU é cerca de 20 a 30 por cento mais rápida que até a última geração Núcleo i9-11900H em cargas de trabalho com várias roscas, mas o desempenho de uma única rosca pode ser mais lento em até 10%
Espera-se que a atualização para o Core i9-12900H aumente o desempenho apenas em cerca de 5%, com base em nossa experiência com oAlienware x15 R2. Assim, o Core i7-12700H é a opção muito melhor em termos de desempenho por dólar
A sustentabilidade do desempenho é excelente e melhor do que noDell Inspiron 16 Plus 7620 equipado com a mesma CPU como mostrado por nosso gráfico de comparação de teste de loop do CineBench R15 xT abaixo.
Cinebench R15 Multi Loop
Cinebench R23: Multi Core | Single Core
Cinebench R15: CPU Multi 64Bit | CPU Single 64Bit
Blender: v2.79 BMW27 CPU
7-Zip 18.03: 7z b 4 | 7z b 4 -mmt1
Geekbench 5.5: Multi-Core | Single-Core
HWBOT x265 Benchmark v2.2: 4k Preset
LibreOffice : 20 Documents To PDF
R Benchmark 2.5: Overall mean
* ... menor é melhor
AIDA64: FP32 Ray-Trace | FPU Julia | CPU SHA3 | CPU Queen | FPU SinJulia | FPU Mandel | CPU AES | CPU ZLib | FP64 Ray-Trace | CPU PhotoWorxx
| Performance rating | |
| Lenovo Legion 7 16ARHA7 | |
| Dell G16 7620 | |
| Lenovo Legion 5 Pro 16IAH7H | |
| Média Intel Core i7-12700H | |
| HP Victus 16-e0145ng | |
| Acer Swift X SFX16-51G-5388 | |
| Asus ROG Zephyrus M16 GU603H -9! | |
| AIDA64 / FP32 Ray-Trace | |
| Lenovo Legion 7 16ARHA7 | |
| Dell G16 7620 | |
| Lenovo Legion 5 Pro 16IAH7H | |
| Lenovo Legion 5 Pro 16IAH7H | |
| HP Victus 16-e0145ng | |
| Média Intel Core i7-12700H (2585 - 17957, n=64) | |
| Acer Swift X SFX16-51G-5388 | |
| AIDA64 / FPU Julia | |
| Lenovo Legion 7 16ARHA7 | |
| Dell G16 7620 | |
| Lenovo Legion 5 Pro 16IAH7H | |
| Lenovo Legion 5 Pro 16IAH7H | |
| HP Victus 16-e0145ng | |
| Média Intel Core i7-12700H (12439 - 90760, n=64) | |
| Acer Swift X SFX16-51G-5388 | |
| AIDA64 / CPU SHA3 | |
| Dell G16 7620 | |
| Lenovo Legion 7 16ARHA7 | |
| Lenovo Legion 5 Pro 16IAH7H | |
| Lenovo Legion 5 Pro 16IAH7H | |
| Média Intel Core i7-12700H (833 - 4242, n=64) | |
| HP Victus 16-e0145ng | |
| Acer Swift X SFX16-51G-5388 | |
| AIDA64 / CPU Queen | |
| Lenovo Legion 7 16ARHA7 | |
| Dell G16 7620 | |
| Lenovo Legion 5 Pro 16IAH7H | |
| Média Intel Core i7-12700H (57923 - 103202, n=63) | |
| HP Victus 16-e0145ng | |
| Acer Swift X SFX16-51G-5388 | |
| AIDA64 / FPU SinJulia | |
| Lenovo Legion 7 16ARHA7 | |
| Lenovo Legion 5 Pro 16IAH7H | |
| Lenovo Legion 5 Pro 16IAH7H | |
| Dell G16 7620 | |
| Média Intel Core i7-12700H (3249 - 9939, n=64) | |
| HP Victus 16-e0145ng | |
| Acer Swift X SFX16-51G-5388 | |
| AIDA64 / FPU Mandel | |
| Lenovo Legion 7 16ARHA7 | |
| HP Victus 16-e0145ng | |
| Lenovo Legion 5 Pro 16IAH7H | |
| Lenovo Legion 5 Pro 16IAH7H | |
| Dell G16 7620 | |
| Média Intel Core i7-12700H (7135 - 44760, n=64) | |
| Acer Swift X SFX16-51G-5388 | |
| AIDA64 / CPU AES | |
| Lenovo Legion 7 16ARHA7 | |
| Lenovo Legion 5 Pro 16IAH7H | |
| Lenovo Legion 5 Pro 16IAH7H | |
| Média Intel Core i7-12700H (31839 - 144360, n=64) | |
| Dell G16 7620 | |
| Acer Swift X SFX16-51G-5388 | |
| HP Victus 16-e0145ng | |
| AIDA64 / CPU ZLib | |
| Lenovo Legion 5 Pro 16IAH7H | |
| Lenovo Legion 5 Pro 16IAH7H | |
| Dell G16 7620 | |
| Média Intel Core i7-12700H (305 - 1171, n=64) | |
| Lenovo Legion 7 16ARHA7 | |
| HP Victus 16-e0145ng | |
| Acer Swift X SFX16-51G-5388 | |
| Asus ROG Zephyrus M16 GU603H | |
| AIDA64 / FP64 Ray-Trace | |
| Lenovo Legion 7 16ARHA7 | |
| Dell G16 7620 | |
| Lenovo Legion 5 Pro 16IAH7H | |
| Lenovo Legion 5 Pro 16IAH7H | |
| HP Victus 16-e0145ng | |
| Média Intel Core i7-12700H (1437 - 9692, n=64) | |
| Acer Swift X SFX16-51G-5388 | |
| AIDA64 / CPU PhotoWorxx | |
| Acer Swift X SFX16-51G-5388 | |
| Dell G16 7620 | |
| Lenovo Legion 5 Pro 16IAH7H | |
| Lenovo Legion 5 Pro 16IAH7H | |
| Média Intel Core i7-12700H (12863 - 52207, n=64) | |
| Lenovo Legion 7 16ARHA7 | |
| HP Victus 16-e0145ng | |
Desempenho do sistema
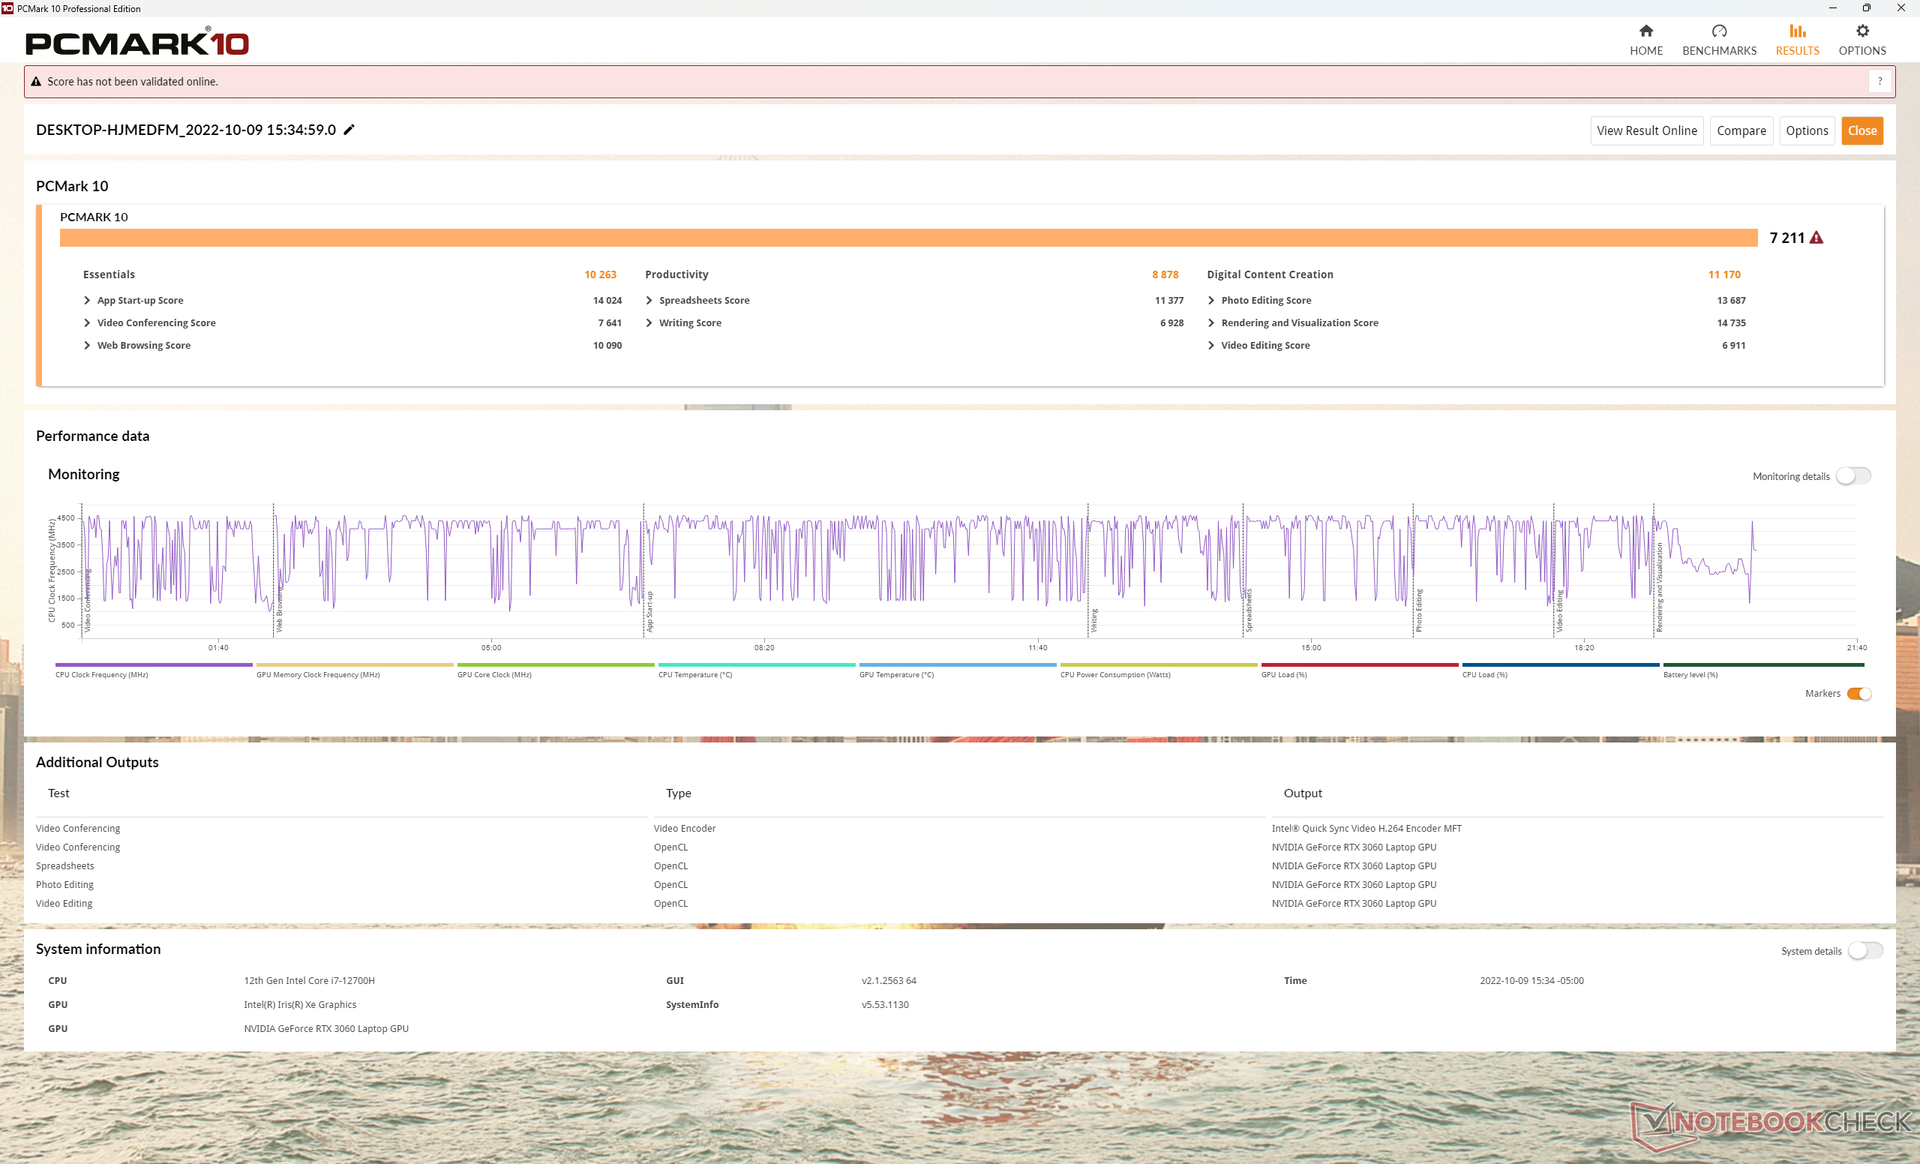
Os resultados da PCMark estão a poucos pontos percentuais de outros laptops com a mesma CPU Core i7-12700H e GPU RTX 3060. As pontuações também são em média mais altas do que as do ano passado Alienware m15 R5 com a mesma GPU mas mais lenta AMD Ryzen 7 5800H.
CrossMark: Overall | Productivity | Creativity | Responsiveness
| PCMark 10 / Score | |
| Lenovo Legion 5 Pro 16IAH7H | |
| Lenovo Legion 7 16ARHA7 | |
| Média Intel Core i7-12700H, NVIDIA GeForce RTX 3060 Laptop GPU (5986 - 8156, n=12) | |
| Dell G16 7620 | |
| Asus ROG Zephyrus M16 GU603H | |
| HP Victus 16-e0145ng | |
| Acer Swift X SFX16-51G-5388 | |
| PCMark 10 / Essentials | |
| Lenovo Legion 5 Pro 16IAH7H | |
| Média Intel Core i7-12700H, NVIDIA GeForce RTX 3060 Laptop GPU (9289 - 12144, n=12) | |
| Asus ROG Zephyrus M16 GU603H | |
| Lenovo Legion 7 16ARHA7 | |
| Dell G16 7620 | |
| HP Victus 16-e0145ng | |
| Acer Swift X SFX16-51G-5388 | |
| PCMark 10 / Productivity | |
| Lenovo Legion 5 Pro 16IAH7H | |
| Média Intel Core i7-12700H, NVIDIA GeForce RTX 3060 Laptop GPU (6161 - 10362, n=12) | |
| Asus ROG Zephyrus M16 GU603H | |
| Lenovo Legion 7 16ARHA7 | |
| Dell G16 7620 | |
| Acer Swift X SFX16-51G-5388 | |
| HP Victus 16-e0145ng | |
| PCMark 10 / Digital Content Creation | |
| Lenovo Legion 7 16ARHA7 | |
| Lenovo Legion 5 Pro 16IAH7H | |
| Dell G16 7620 | |
| Média Intel Core i7-12700H, NVIDIA GeForce RTX 3060 Laptop GPU (8950 - 12554, n=12) | |
| Asus ROG Zephyrus M16 GU603H | |
| HP Victus 16-e0145ng | |
| Acer Swift X SFX16-51G-5388 | |
| CrossMark / Overall | |
| Média Intel Core i7-12700H, NVIDIA GeForce RTX 3060 Laptop GPU (1649 - 2017, n=11) | |
| Dell G16 7620 | |
| Lenovo Legion 5 Pro 16IAH7H | |
| Lenovo Legion 7 16ARHA7 | |
| Acer Swift X SFX16-51G-5388 | |
| CrossMark / Productivity | |
| Média Intel Core i7-12700H, NVIDIA GeForce RTX 3060 Laptop GPU (1536 - 1958, n=11) | |
| Lenovo Legion 5 Pro 16IAH7H | |
| Dell G16 7620 | |
| Lenovo Legion 7 16ARHA7 | |
| Acer Swift X SFX16-51G-5388 | |
| CrossMark / Creativity | |
| Média Intel Core i7-12700H, NVIDIA GeForce RTX 3060 Laptop GPU (1816 - 2084, n=11) | |
| Dell G16 7620 | |
| Lenovo Legion 5 Pro 16IAH7H | |
| Lenovo Legion 7 16ARHA7 | |
| Acer Swift X SFX16-51G-5388 | |
| CrossMark / Responsiveness | |
| Lenovo Legion 5 Pro 16IAH7H | |
| Média Intel Core i7-12700H, NVIDIA GeForce RTX 3060 Laptop GPU (1210 - 2207, n=11) | |
| Dell G16 7620 | |
| Lenovo Legion 7 16ARHA7 | |
| Acer Swift X SFX16-51G-5388 | |
| PCMark 10 Score | 7211 pontos | |
Ajuda | ||
| AIDA64 / Memory Copy | |
| Acer Swift X SFX16-51G-5388 | |
| Lenovo Legion 5 Pro 16IAH7H | |
| Lenovo Legion 5 Pro 16IAH7H | |
| Dell G16 7620 | |
| Média Intel Core i7-12700H (25615 - 80511, n=64) | |
| Lenovo Legion 7 16ARHA7 | |
| HP Victus 16-e0145ng | |
| AIDA64 / Memory Read | |
| Dell G16 7620 | |
| Lenovo Legion 5 Pro 16IAH7H | |
| Lenovo Legion 5 Pro 16IAH7H | |
| Média Intel Core i7-12700H (25586 - 79442, n=64) | |
| Acer Swift X SFX16-51G-5388 | |
| Lenovo Legion 7 16ARHA7 | |
| HP Victus 16-e0145ng | |
| AIDA64 / Memory Write | |
| Acer Swift X SFX16-51G-5388 | |
| Lenovo Legion 5 Pro 16IAH7H | |
| Lenovo Legion 5 Pro 16IAH7H | |
| Dell G16 7620 | |
| Lenovo Legion 7 16ARHA7 | |
| Média Intel Core i7-12700H (23679 - 88660, n=64) | |
| HP Victus 16-e0145ng | |
| AIDA64 / Memory Latency | |
| Lenovo Legion 5 Pro 16IAH7H | |
| Lenovo Legion 5 Pro 16IAH7H | |
| Acer Swift X SFX16-51G-5388 | |
| Dell G16 7620 | |
| Lenovo Legion 7 16ARHA7 | |
| Média Intel Core i7-12700H (76.2 - 133.9, n=62) | |
| HP Victus 16-e0145ng | |
| Asus ROG Zephyrus M16 GU603H | |
* ... menor é melhor
Latência do DPC
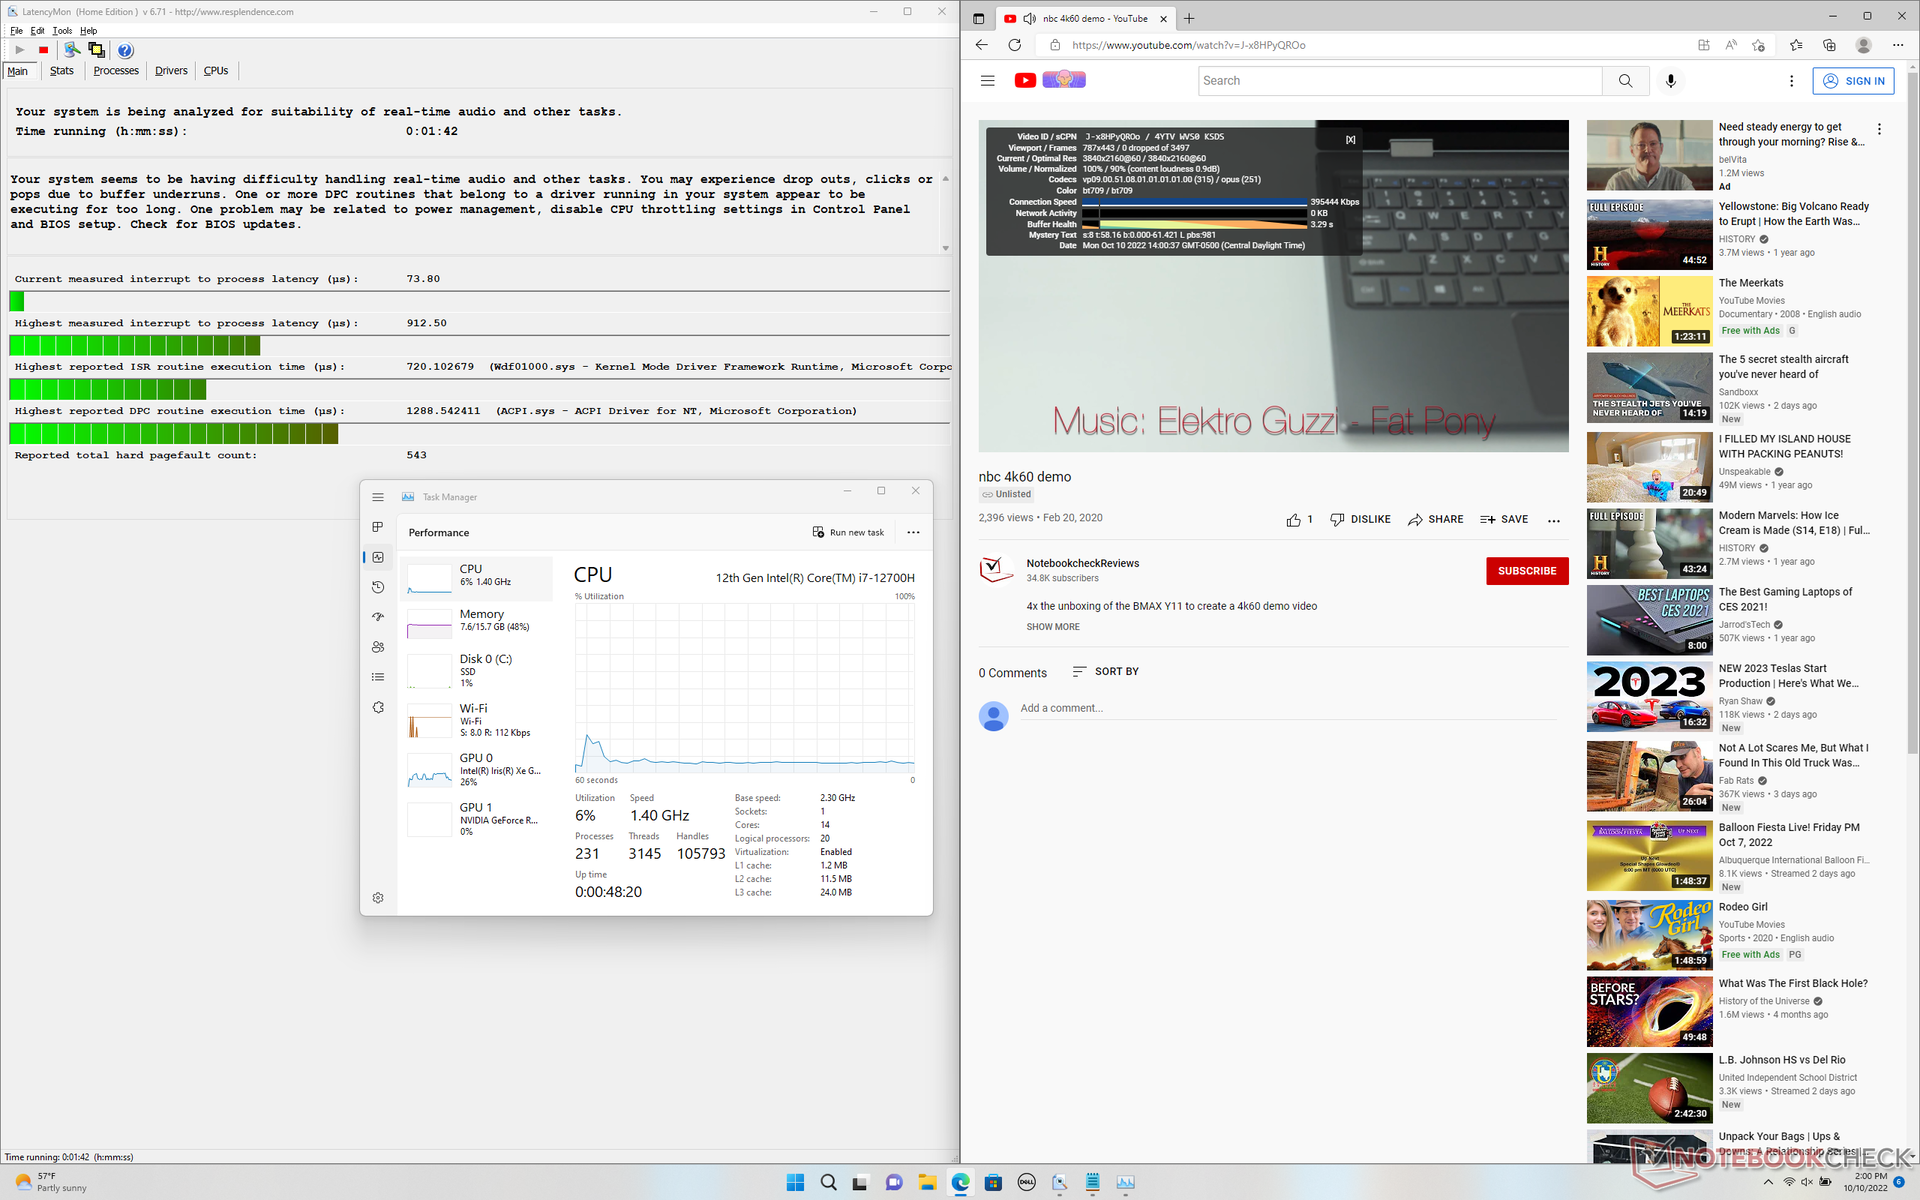
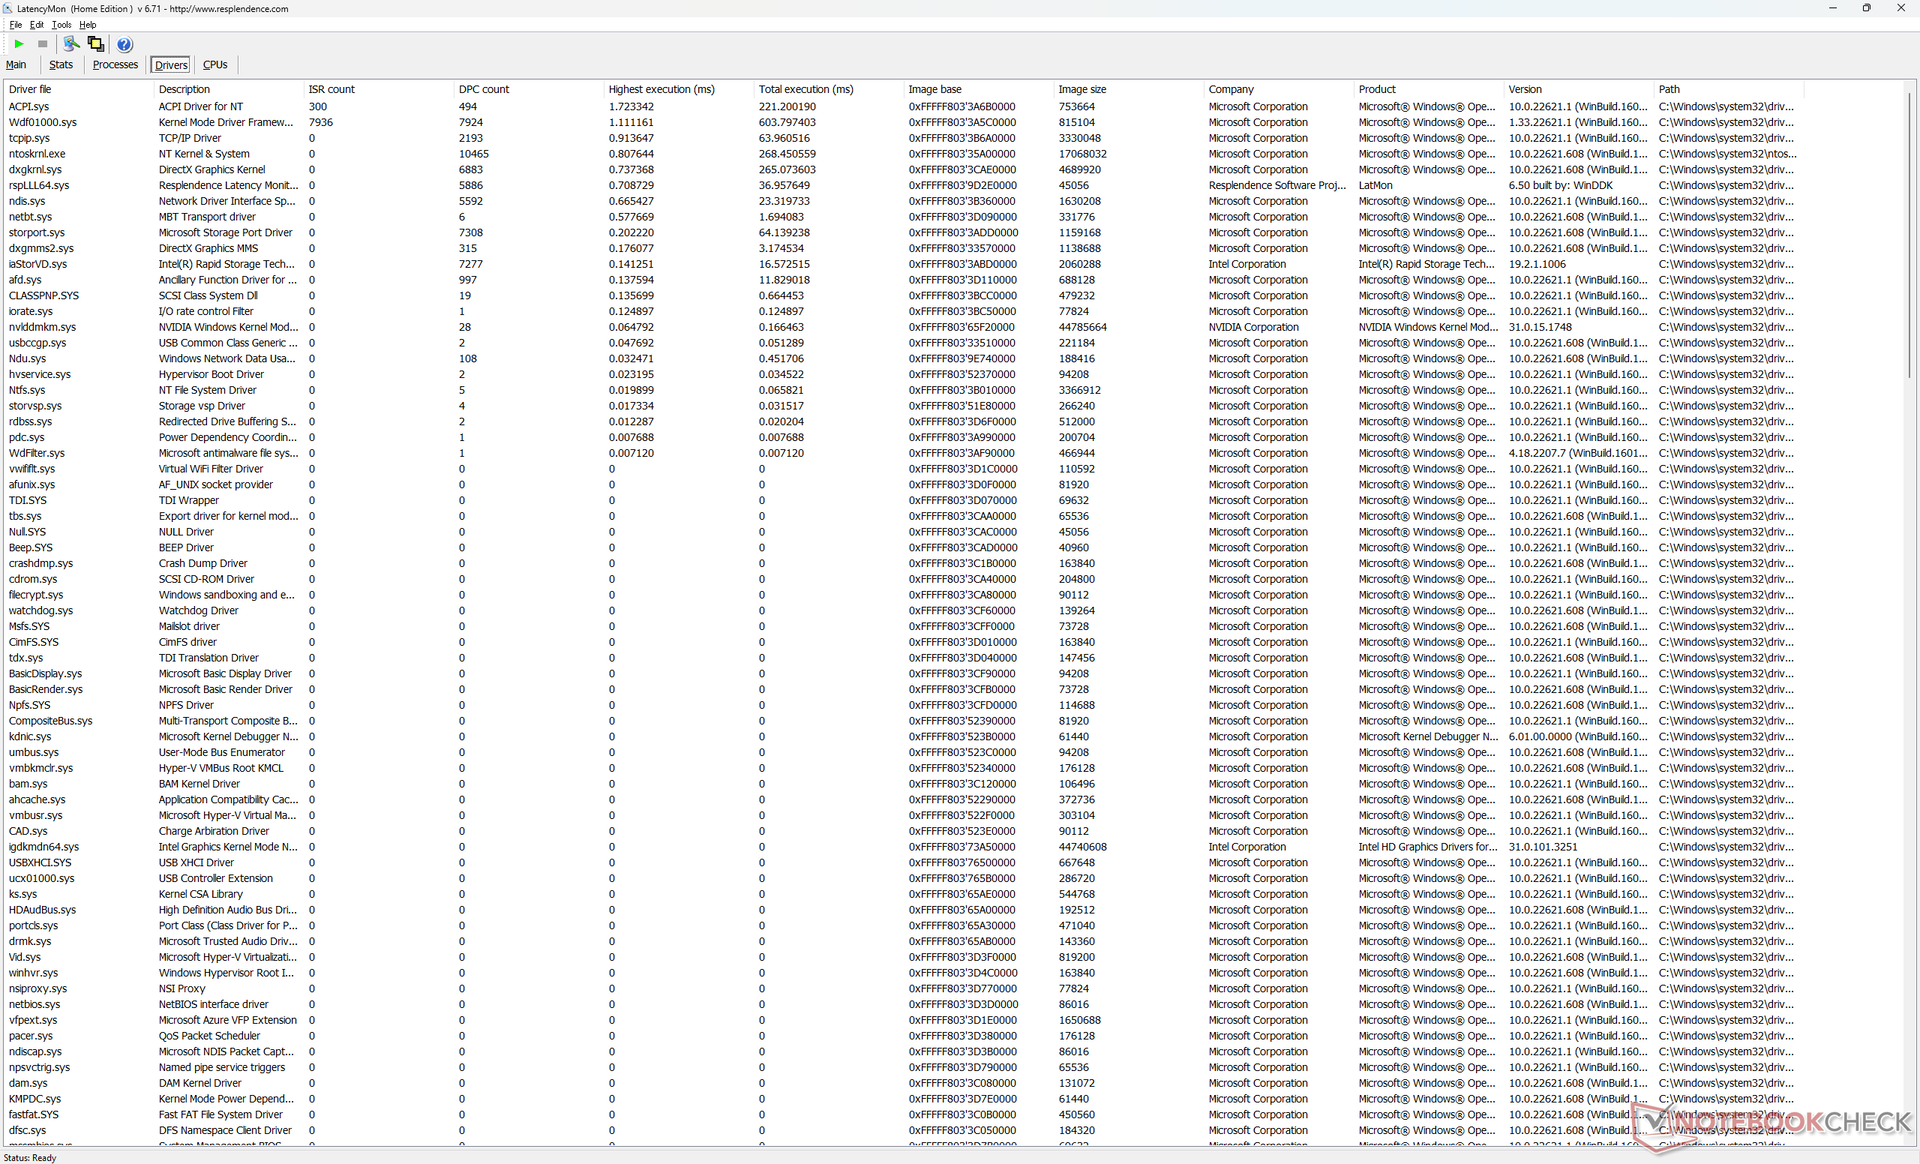
LatencyMon revela pequenos problemas de DPC ao abrir várias abas do navegador em nossa página inicial. a reprodução de vídeo de 4K a 60 FPS é perfeita, sem queda de quadros.
| DPC Latencies / LatencyMon - interrupt to process latency (max), Web, Youtube, Prime95 | |
| Acer Swift X SFX16-51G-5388 | |
| Lenovo Legion 7 16ARHA7 | |
| Asus ROG Zephyrus M16 GU603H | |
| Dell G16 7620 | |
| HP Victus 16-e0145ng | |
| Lenovo Legion 5 Pro 16IAH7H | |
* ... menor é melhor
Dispositivos de armazenamento
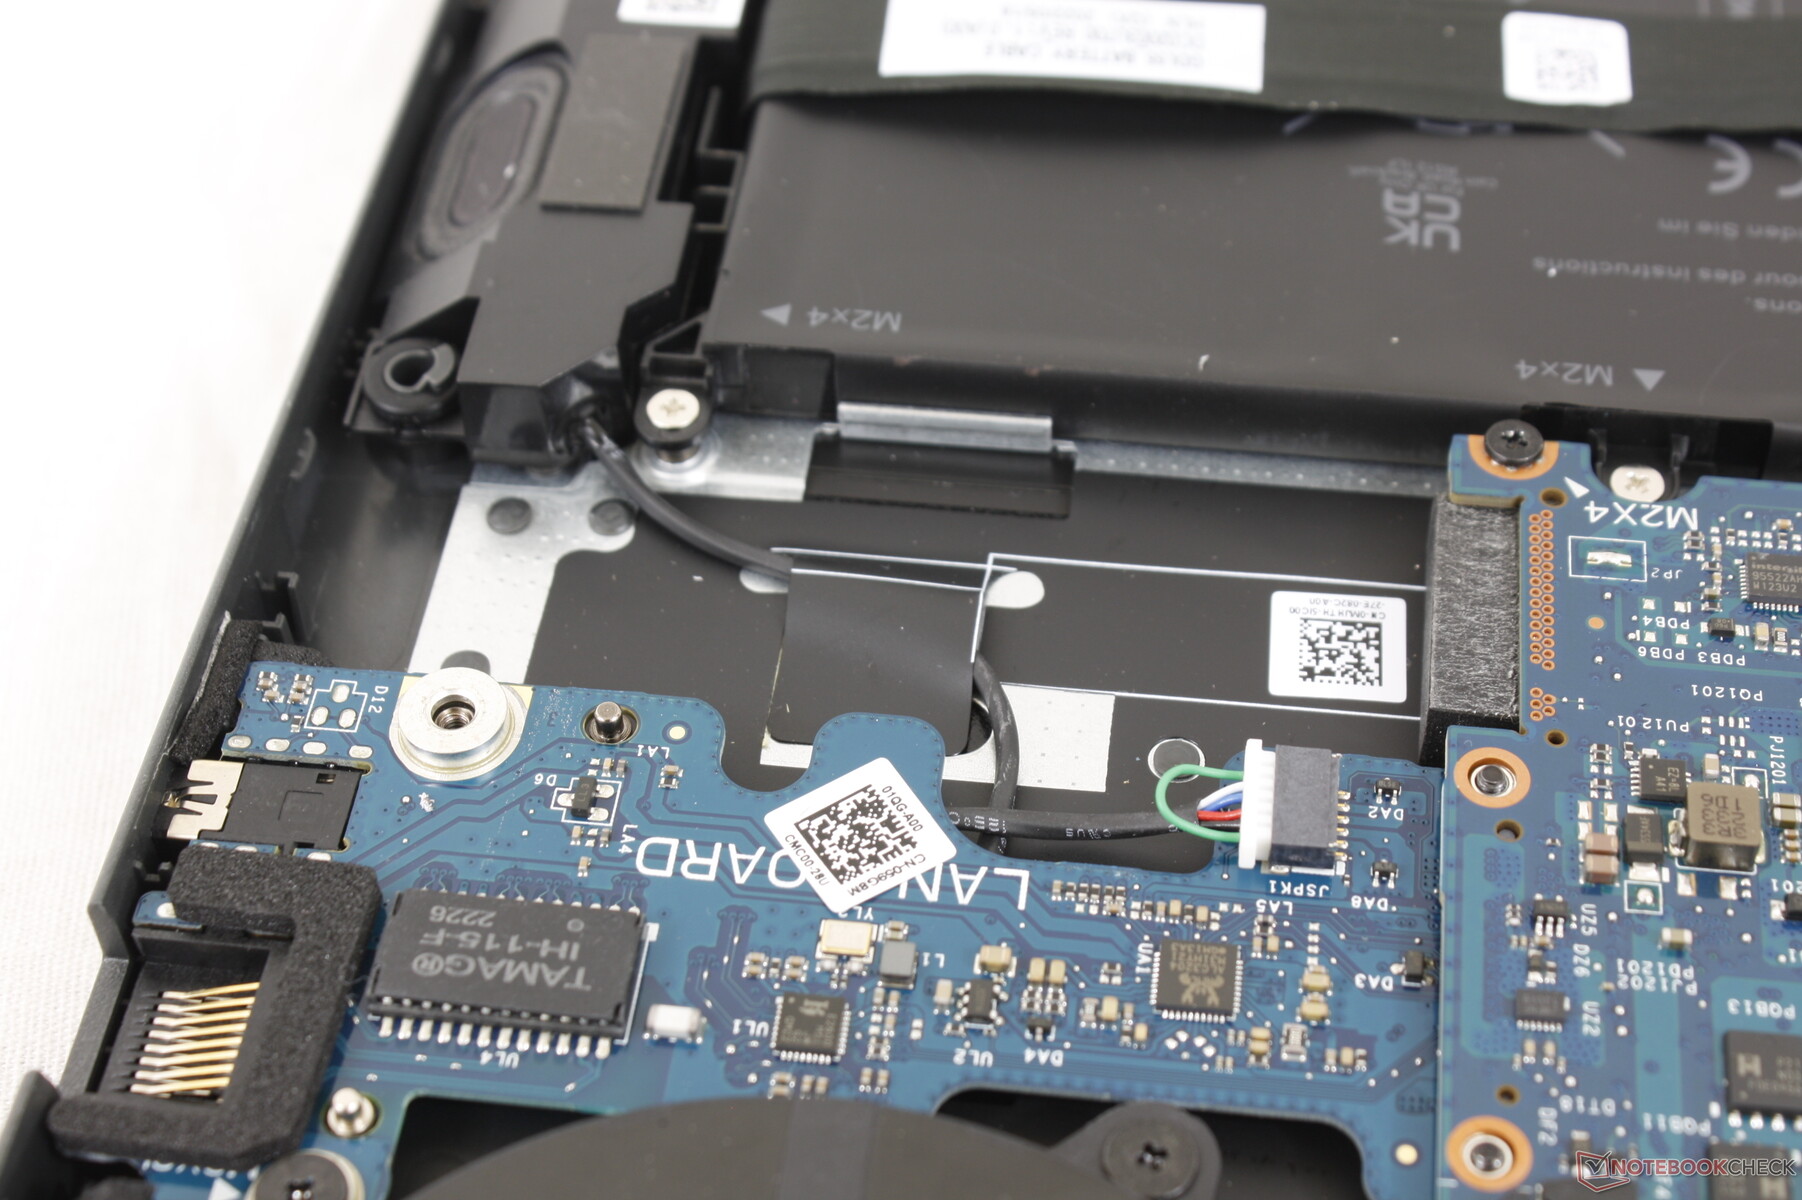
A placa-mãe tem espaço para até dois M.2 2280 SSDs, como mostram nossas imagens abaixo. No entanto, todas as configurações no momento estão sendo enviadas com o segundo conector removido, o que significa que o G16 pode suportar até um M.2 2280 SSD interno apenas
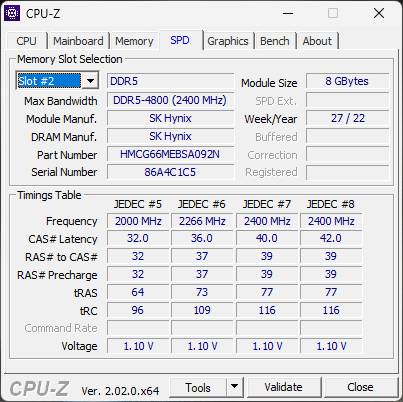
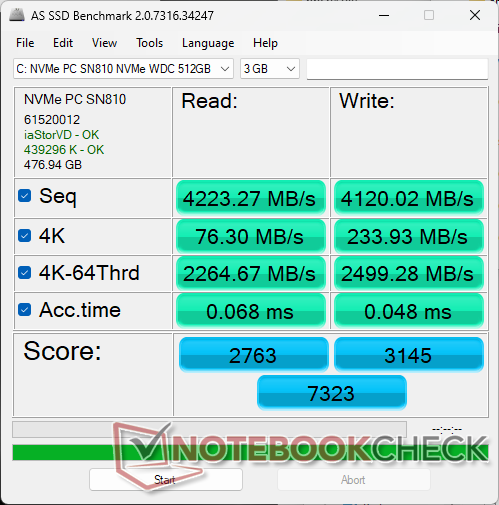
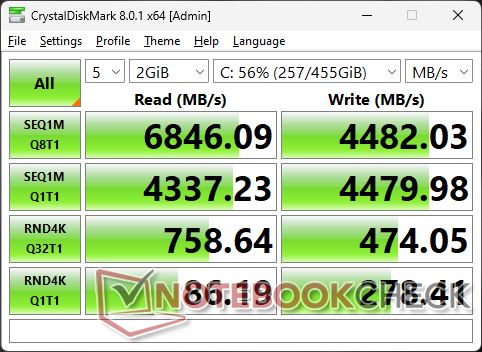
Nossa unidade de teste é enviada com a faixa média superior WDC PC SN810 PCIe4 x4 NVMe SSD para taxas teóricas seqüenciais de leitura e escrita de até 6000 MB/s e 4000 MB/s, respectivamente, de acordo com o fabricante. O acionamento em nossa unidade é capaz de atingir 6700 MB/s, mas é incapaz de sustentar estas velocidades rápidas por períodos prolongados. Ao executar o DiskSpd em laço, por exemplo, as taxas de leitura acabariam por ser reduzidas a 3500 MB/s.

| Drive Performance rating - Percent | |
| Lenovo Legion 5 Pro 16IAH7H | |
| Asus ROG Zephyrus M16 GU603H | |
| Dell G16 7620 | |
| Lenovo Legion 7 16ARHA7 | |
| HP Victus 16-e0145ng | |
| Acer Swift X SFX16-51G-5388 | |
* ... menor é melhor
Disk Throttling: DiskSpd Read Loop, Queue Depth 8
GPU Performance - gráficos TGP de 130 W
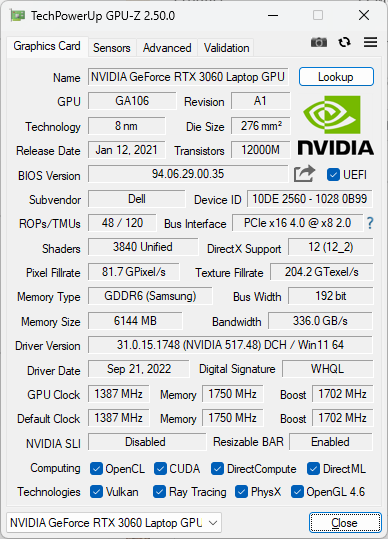
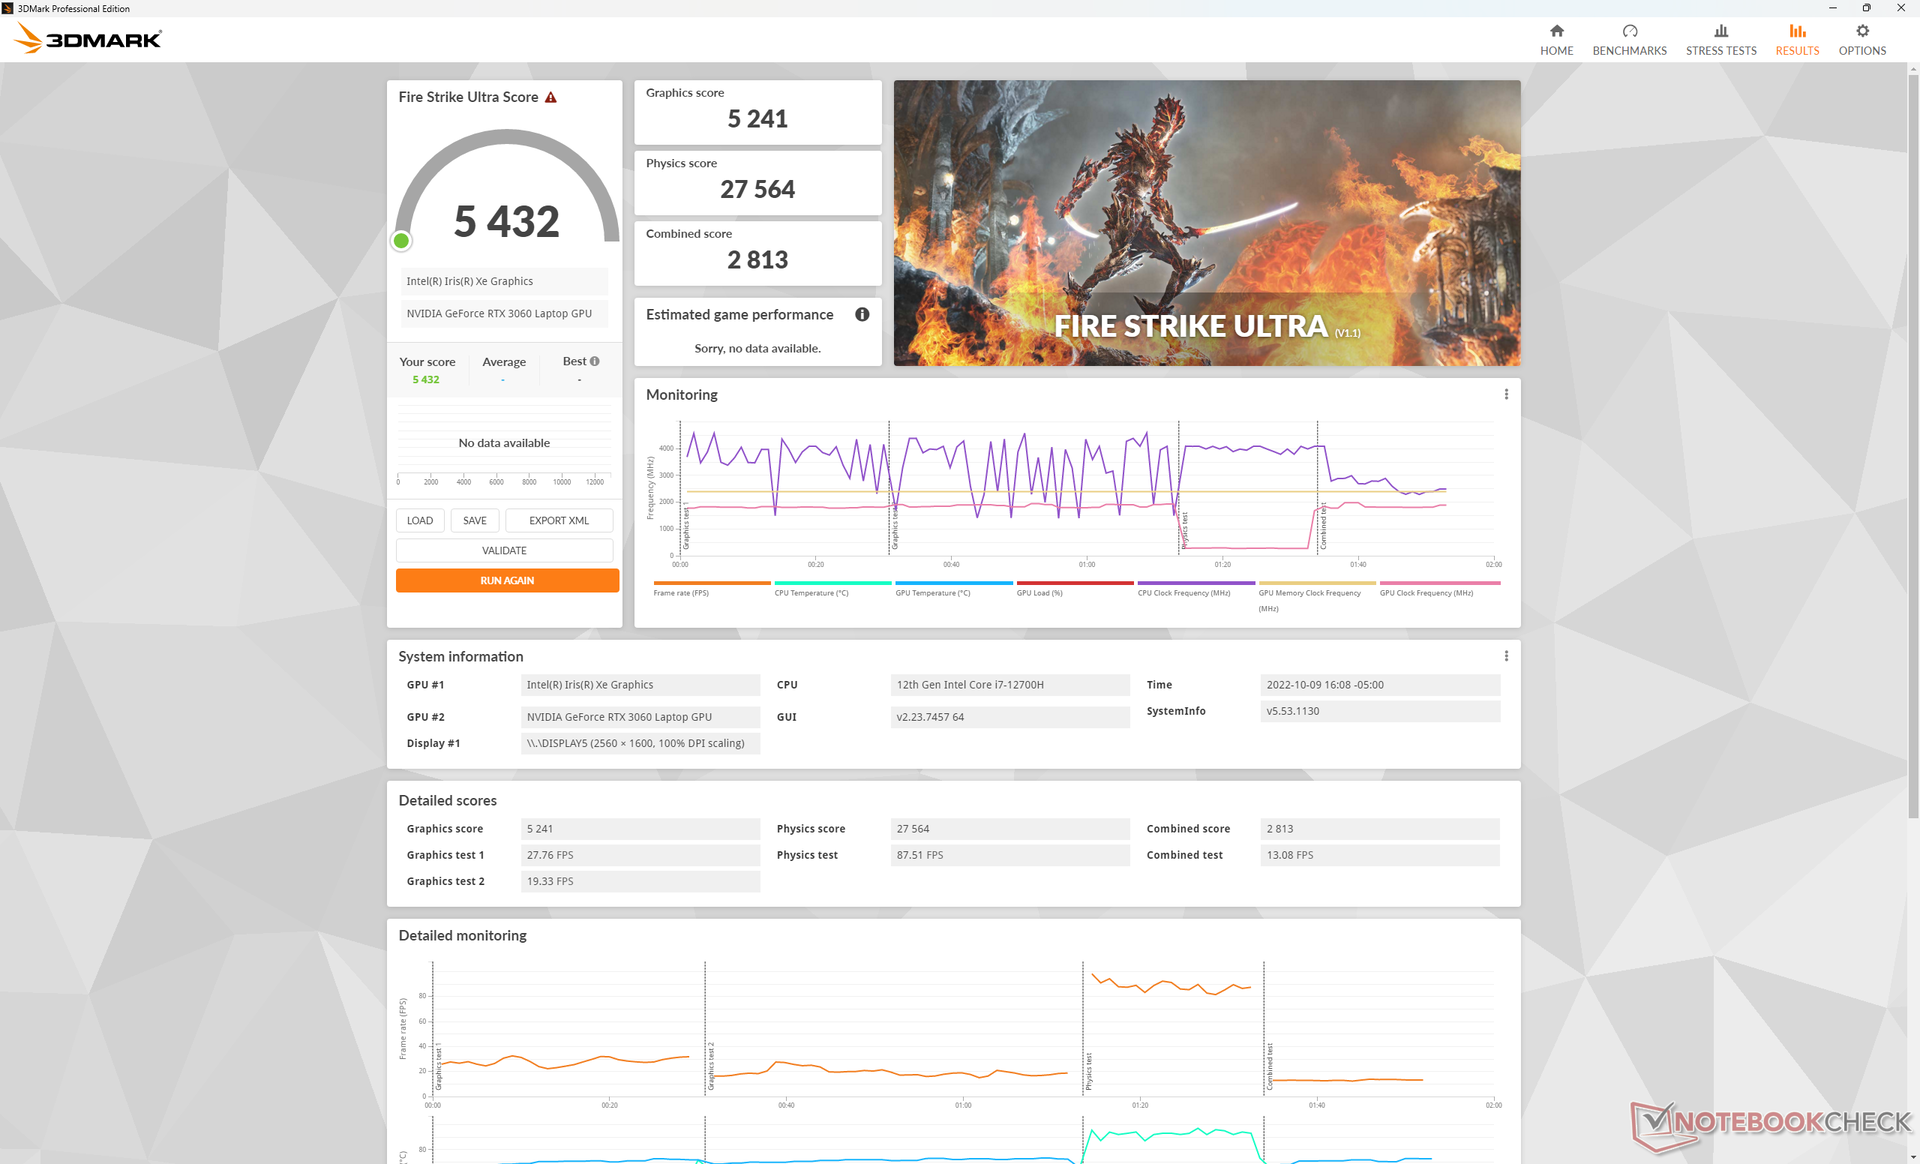
O desempenho gráfico é excelente, com resultados 5 a 10% mais rápidos do que a média do laptop em nosso banco de dados equipado com o mesmo GeForce RTX 3060 GPU. O desempenho geral agora está dentro de 10% de uma área de trabalho RTX 3060 apropriada. Isto se deve em parte à meta de 130 W TGP da Dell G16, que está na parte superior do espectro quando se trata de laptops para jogos.
Atualização para o RTX 3070 Ti de gráficos em cerca de 20 a 30 por cento, ao mesmo tempo em que se reduz a RTX 3050 Ti diminuirá o desempenho em cerca de 30 a 35 por cento.
A execução no modo Otimizado ao invés do modo Ultra Performance tem um impacto muito pequeno no desempenho. Um teste Fire Strike no modo Otimizado retornaria pontuações de 26289 e 21492 pontos, respectivamente, em relação a 27735 e 21584 pontos no modo Ultra Desempenho.
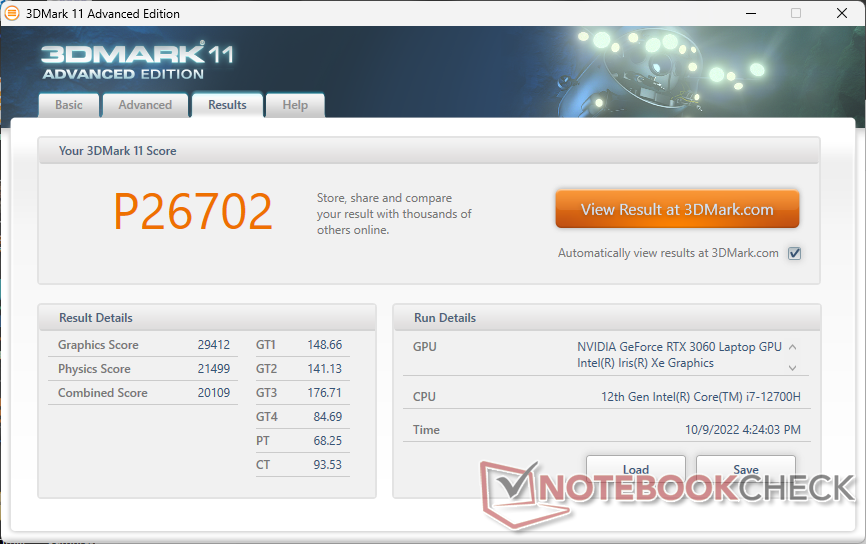
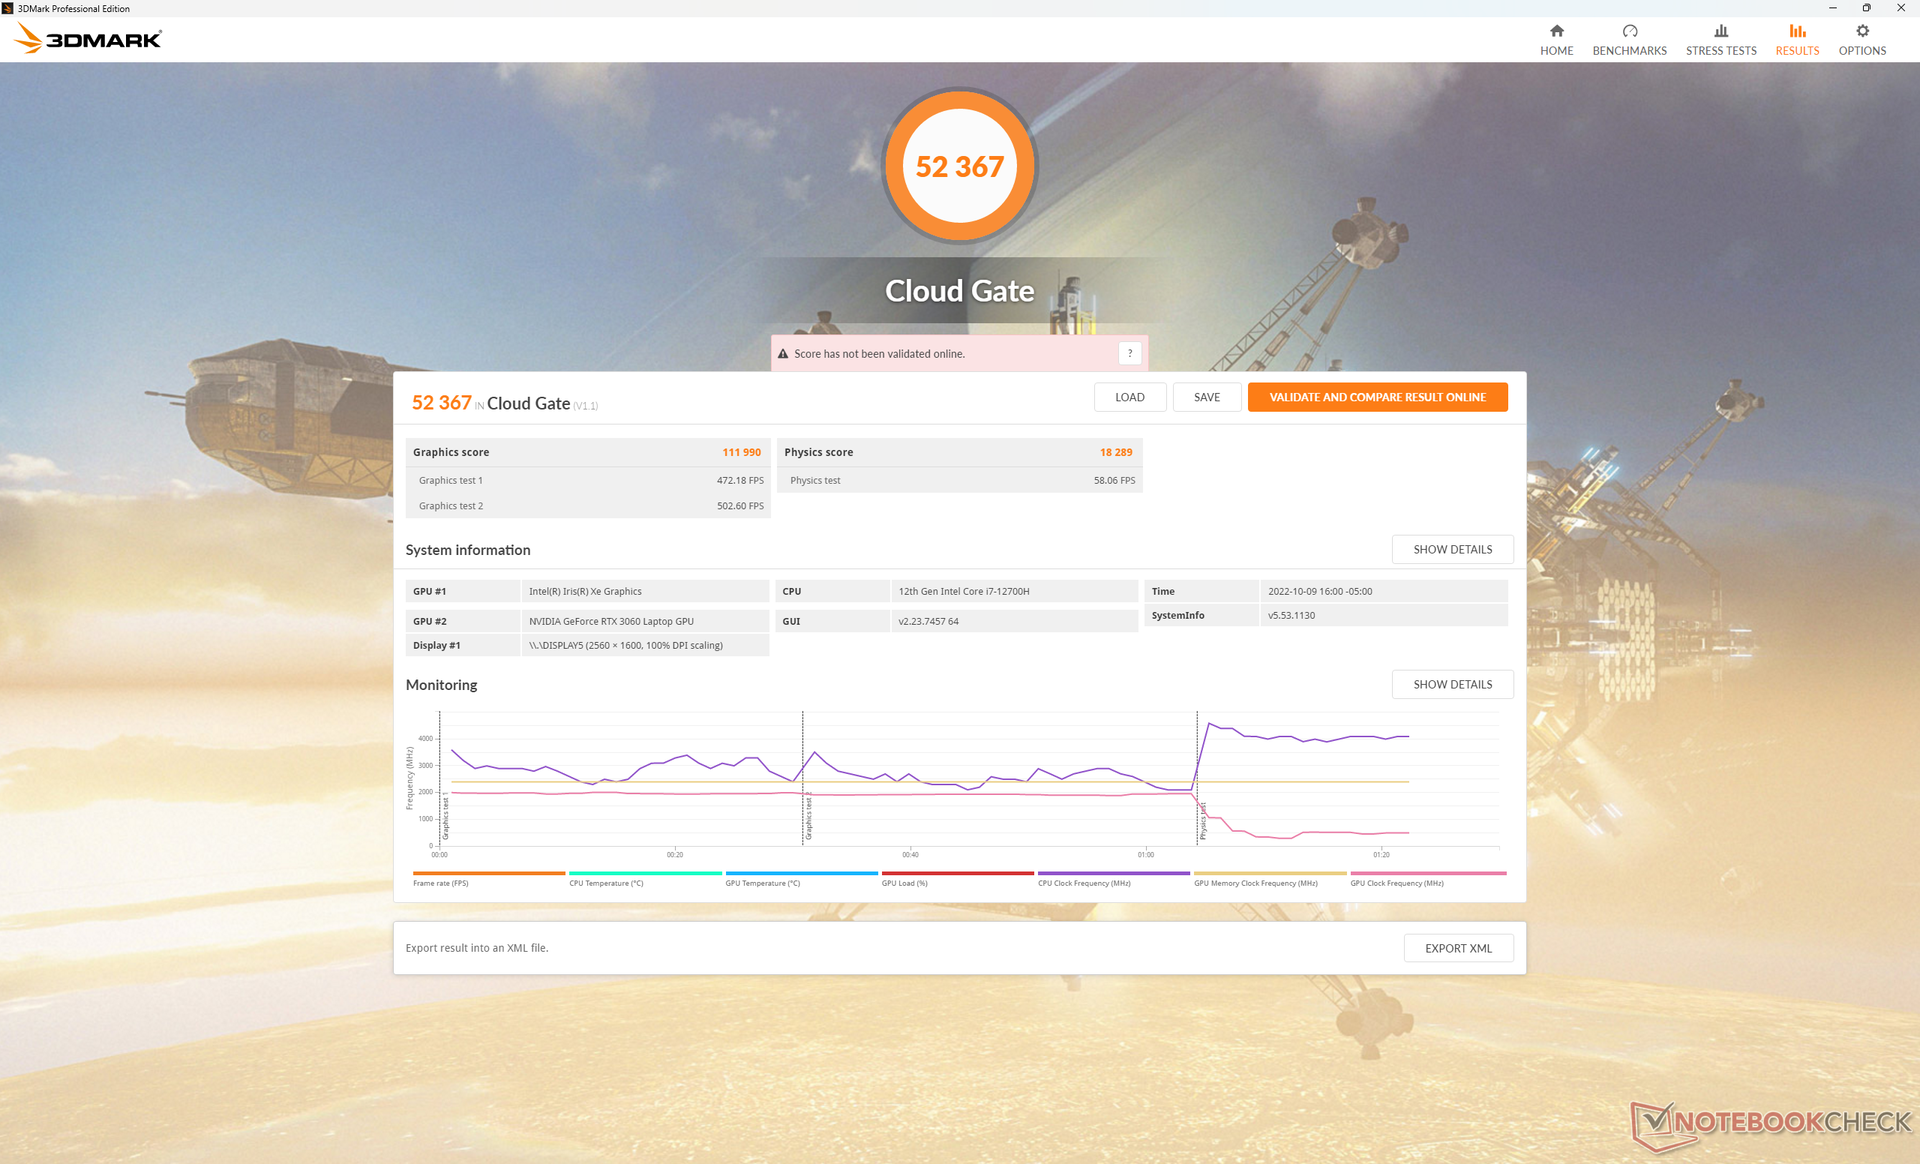
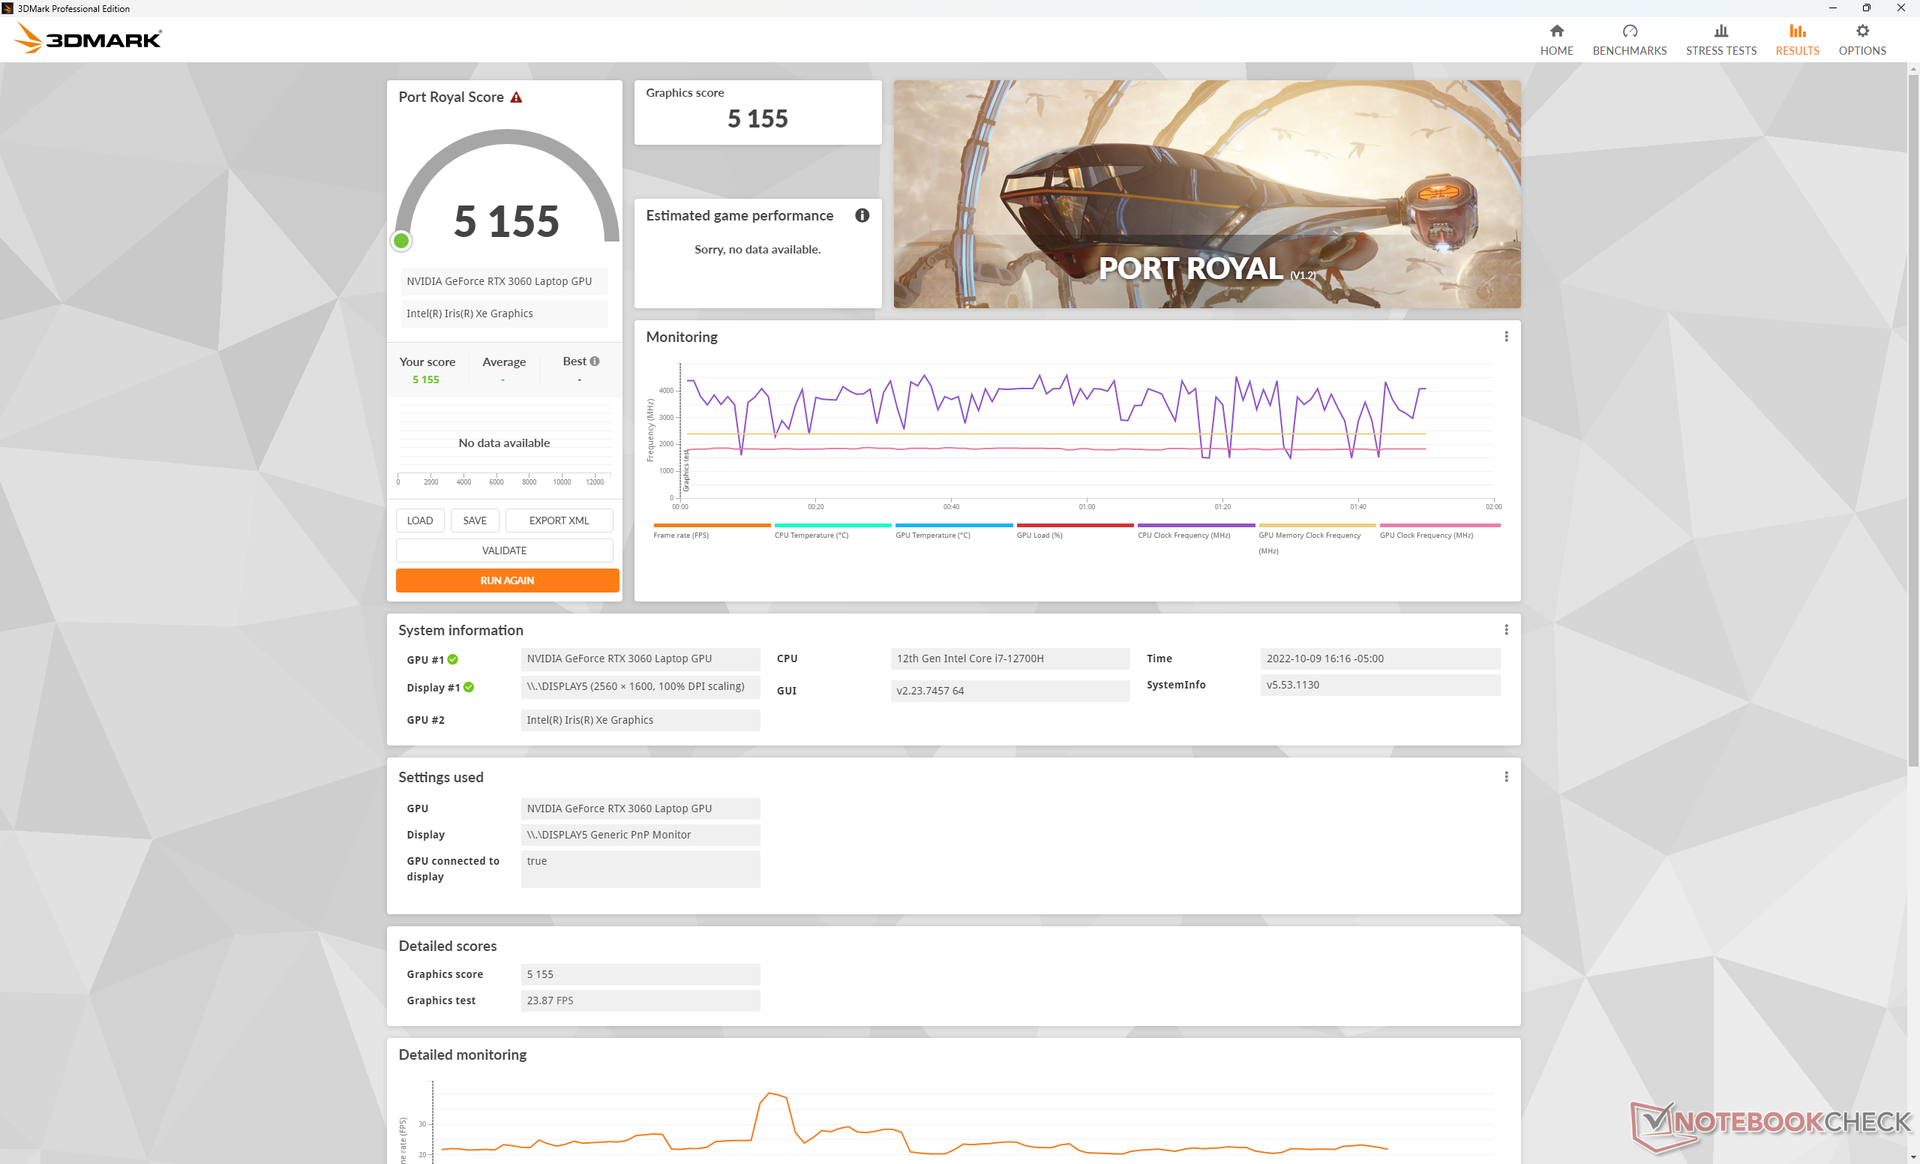
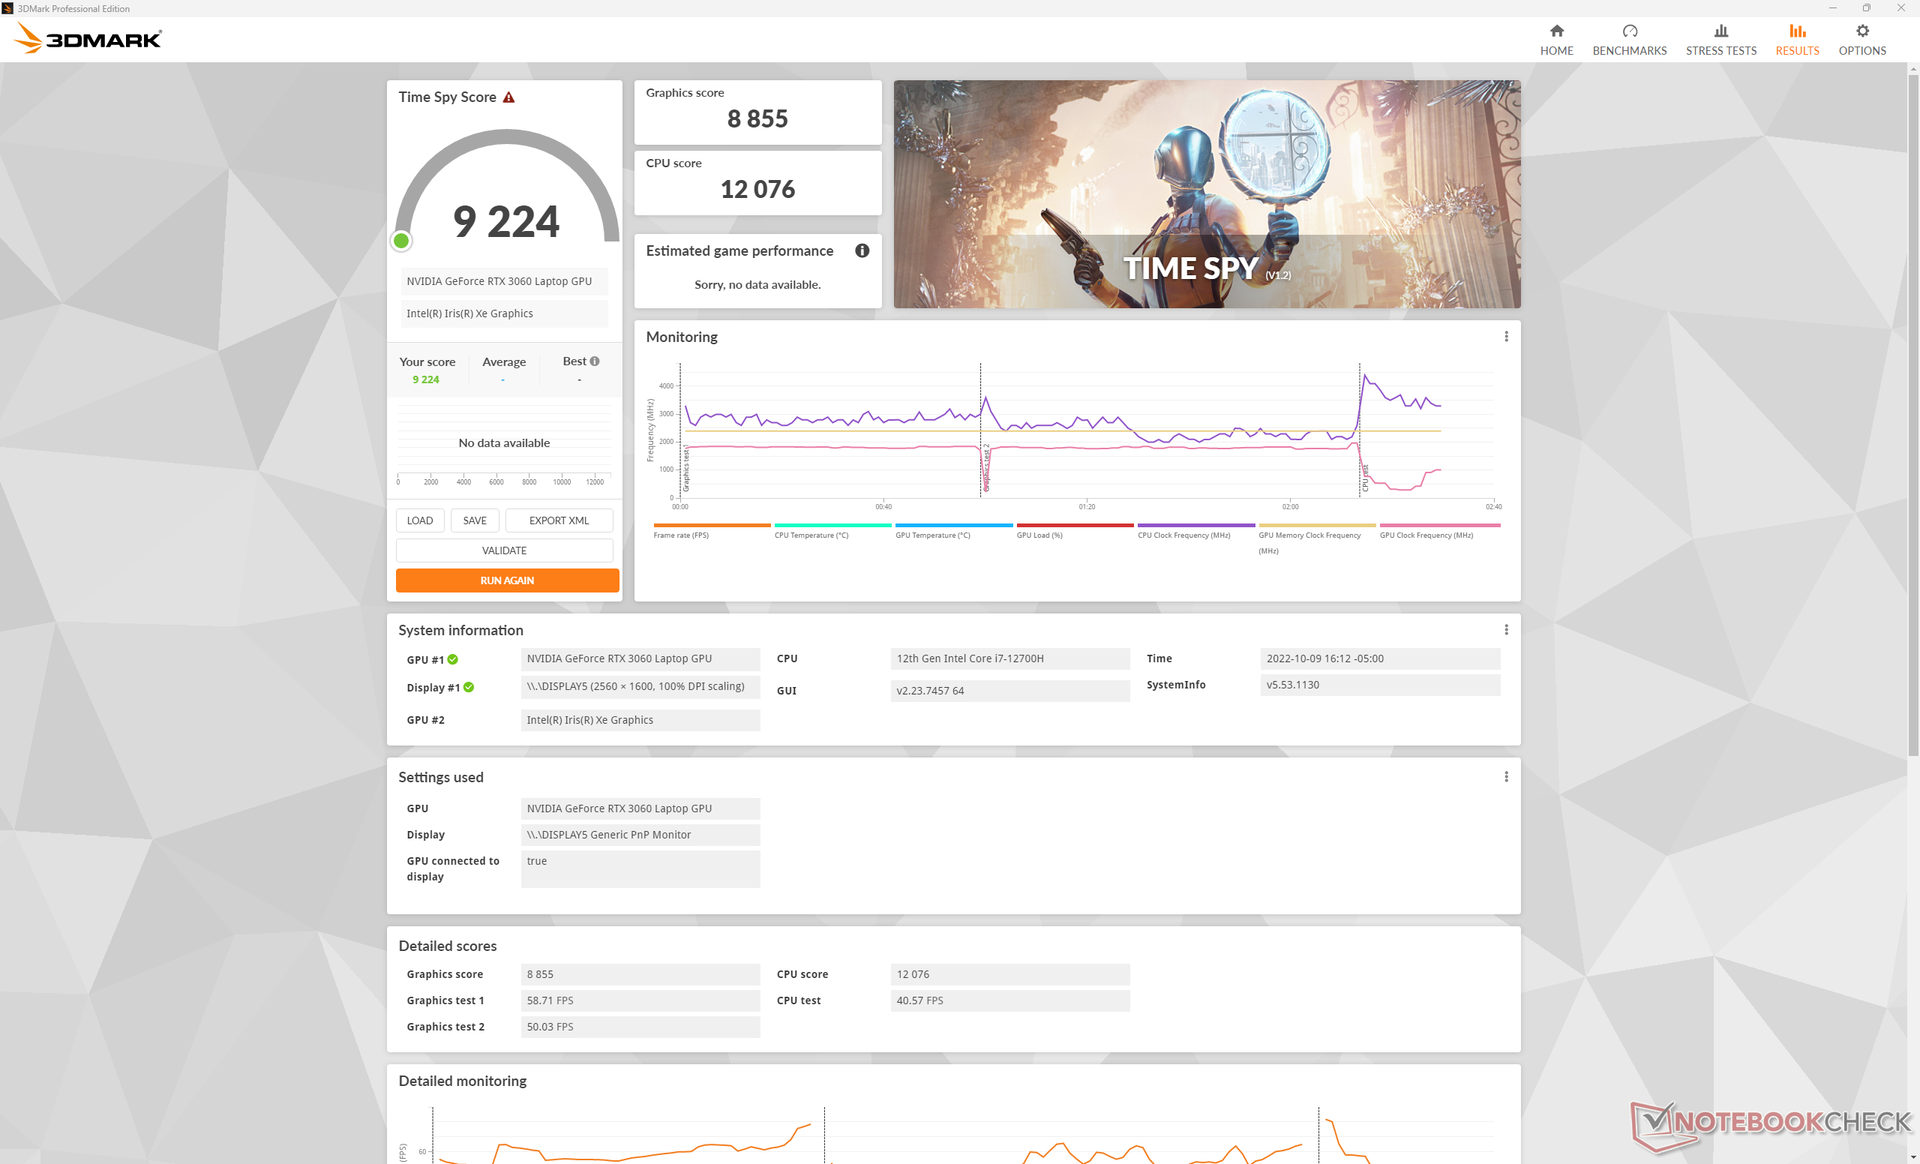
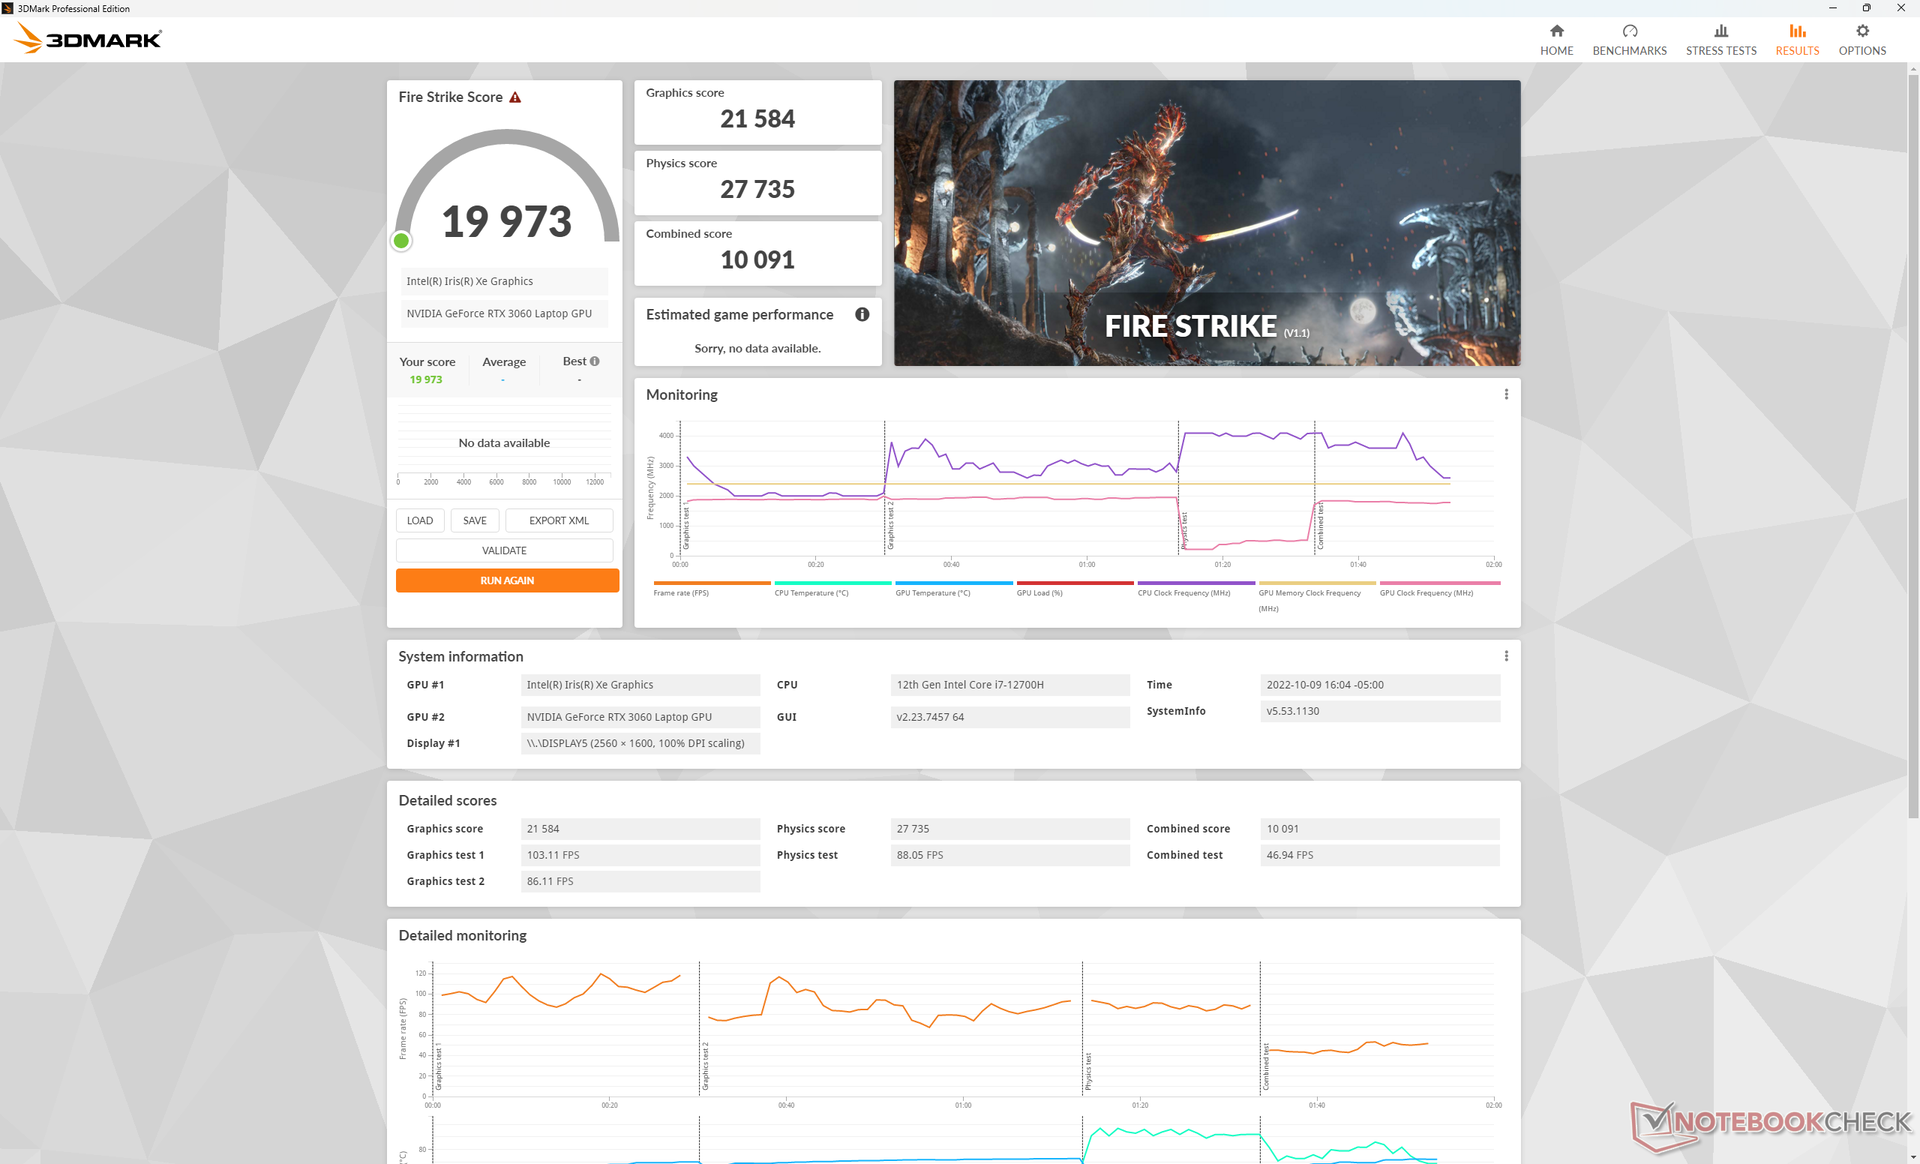
| 3DMark 11 Performance | 26702 pontos | |
| 3DMark Cloud Gate Standard Score | 52367 pontos | |
| 3DMark Fire Strike Score | 19973 pontos | |
| 3DMark Time Spy Score | 9224 pontos | |
Ajuda | ||
* ... menor é melhor
Um mergulho temporário de desempenho até 43 FPS pode ser observado ao rodar Witcher 3 como mostra nosso gráfico abaixo. A mudança repentina é geralmente causada por uma má gestão de recursos de certas aplicações de fundo, como qualquer software pré-instalado do fabricante, que interrompem a aplicação atual em foco.
Witcher 3 FPS Chart
| baixo | média | alto | ultra | QHD | |
|---|---|---|---|---|---|
| GTA V (2015) | 185.6 | 179.9 | 176.2 | 108.7 | 82.1 |
| The Witcher 3 (2015) | 415.2 | 260.5 | 167.2 | 86.6 | |
| Dota 2 Reborn (2015) | 171.8 | 159.3 | 159 | 147.2 | |
| Final Fantasy XV Benchmark (2018) | 176.7 | 123.3 | 89.4 | 67.1 | |
| X-Plane 11.11 (2018) | 147.8 | 130.5 | 102.6 | ||
| Strange Brigade (2018) | 395 | 228 | 180.2 | 155.5 | 113 |
| Cyberpunk 2077 1.6 (2022) | 125.1 | 105.4 | 80.4 | 66.8 | 41.6 |
Emissões
Ruído do Sistema - Quase Nunca Silencioso
Os ventiladores internos do G16 quase nunca estão ociosos, mesmo quando ajustados ao perfil de potência mais baixo. Quando no modo "Silencioso", por exemplo, ainda somos capazes de gravar um ruído do ventilador de 28 dB(A) contra um fundo silencioso de 23 dB(A). Isto é suficientemente alto para ser notado quando há transmissão de vídeo e também mais alto que muitos outros laptops de jogos em condições semelhantes, como o Lenovo Legion 7 16 ou HP Victus 16.
A boa notícia de que o alto ruído do piso significa que os ventiladores subirão mais lentamente quando cargas mais altas forem introduzidas. Ao rodar a primeira cena de referência do 3DMark 06, por exemplo, o ruído dos ventiladores seria de 32 dB(A) comparado a 40 dB(A) ou superior no Acer Swift X SFX16 HP Victus 16.
O ruído do ventilador se estabilizaria em 45,7 dB(A) e 48,3 dB(A) quando em funcionamento Witcher 3 no modo Equilibrado e no modo Performance, respectivamente.
Barulho
| Ocioso |
| 28.3 / 28.8 / 28.9 dB |
| Carga |
| 32.4 / 48.1 dB |
 | ||
30 dB silencioso 40 dB(A) audível 50 dB(A) ruidosamente alto |
||
min: | ||
| Dell G16 7620 GeForce RTX 3060 Laptop GPU, i7-12700H, WDC PC SN810 512GB | Lenovo Legion 7 16ARHA7 Radeon RX 6850M XT, R9 6900HX, Samsung PM9A1 MZVL22T0HBLB | HP Victus 16-e0145ng GeForce RTX 3050 Ti Laptop GPU, R5 5600H, Samsung SSD PM981a MZVLB512HBJQ | Asus ROG Zephyrus M16 GU603H GeForce RTX 3070 Laptop GPU, i9-11900H, Samsung PM9A1 MZVL22T0HBLB | Lenovo Legion 5 Pro 16IAH7H GeForce RTX 3060 Laptop GPU, i7-12700H, 2x Samsung PM9A1 MZVL21T0HCLR (RAID 0) | Acer Swift X SFX16-51G-5388 GeForce RTX 3050 4GB Laptop GPU, i5-11320H, Samsung PM991 MZVLQ512HBLU | |
|---|---|---|---|---|---|---|
| Noise | 8% | -9% | -17% | -14% | -1% | |
| desligado / ambiente * (dB) | 23.2 | 22.8 2% | 26 -12% | 25 -8% | 24.6 -6% | 25.4 -9% |
| Idle Minimum * (dB) | 28.3 | 23 19% | 26 8% | 25 12% | 28.7 -1% | 25.4 10% |
| Idle Average * (dB) | 28.8 | 23 20% | 28 3% | 31 -8% | 32 -11% | 25.4 12% |
| Idle Maximum * (dB) | 28.9 | 23 20% | 34 -18% | 42 -45% | 32 -11% | 27.8 4% |
| Load Average * (dB) | 32.4 | 26.8 17% | 44 -36% | 48 -48% | 45.2 -40% | 41 -27% |
| Witcher 3 ultra * (dB) | 48.3 | 54.3 -12% | 48 1% | 52 -8% | ||
| Load Maximum * (dB) | 48.1 | 54.2 -13% | 53 -10% | 56 -16% | 54.4 -13% | 47 2% |
* ... menor é melhor
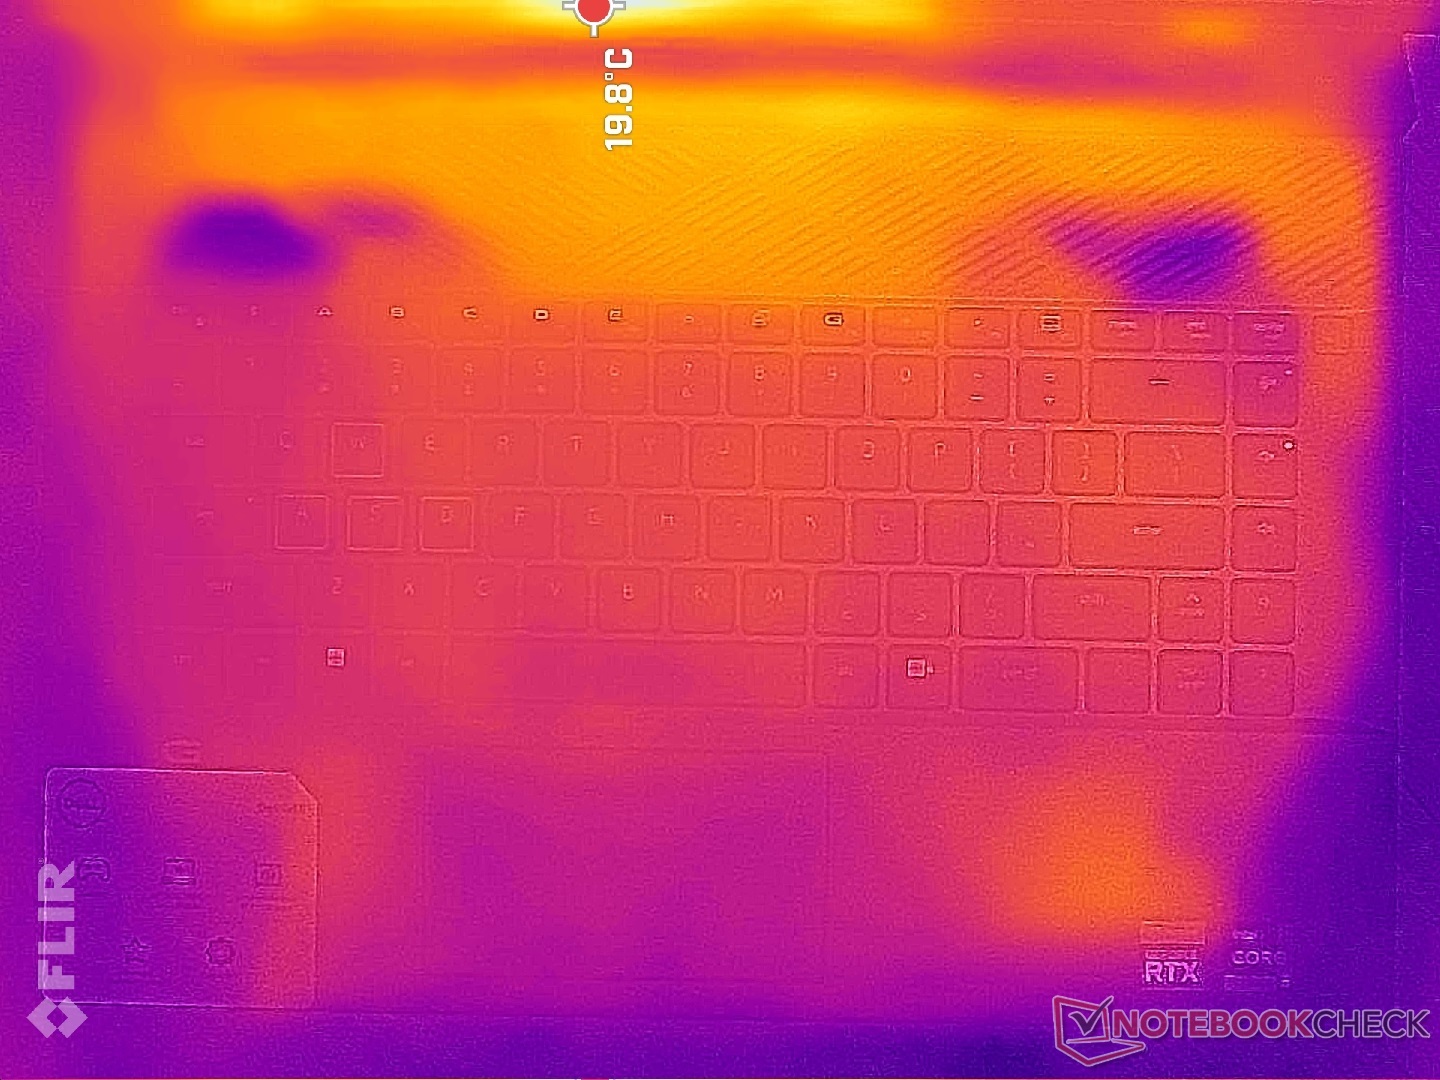
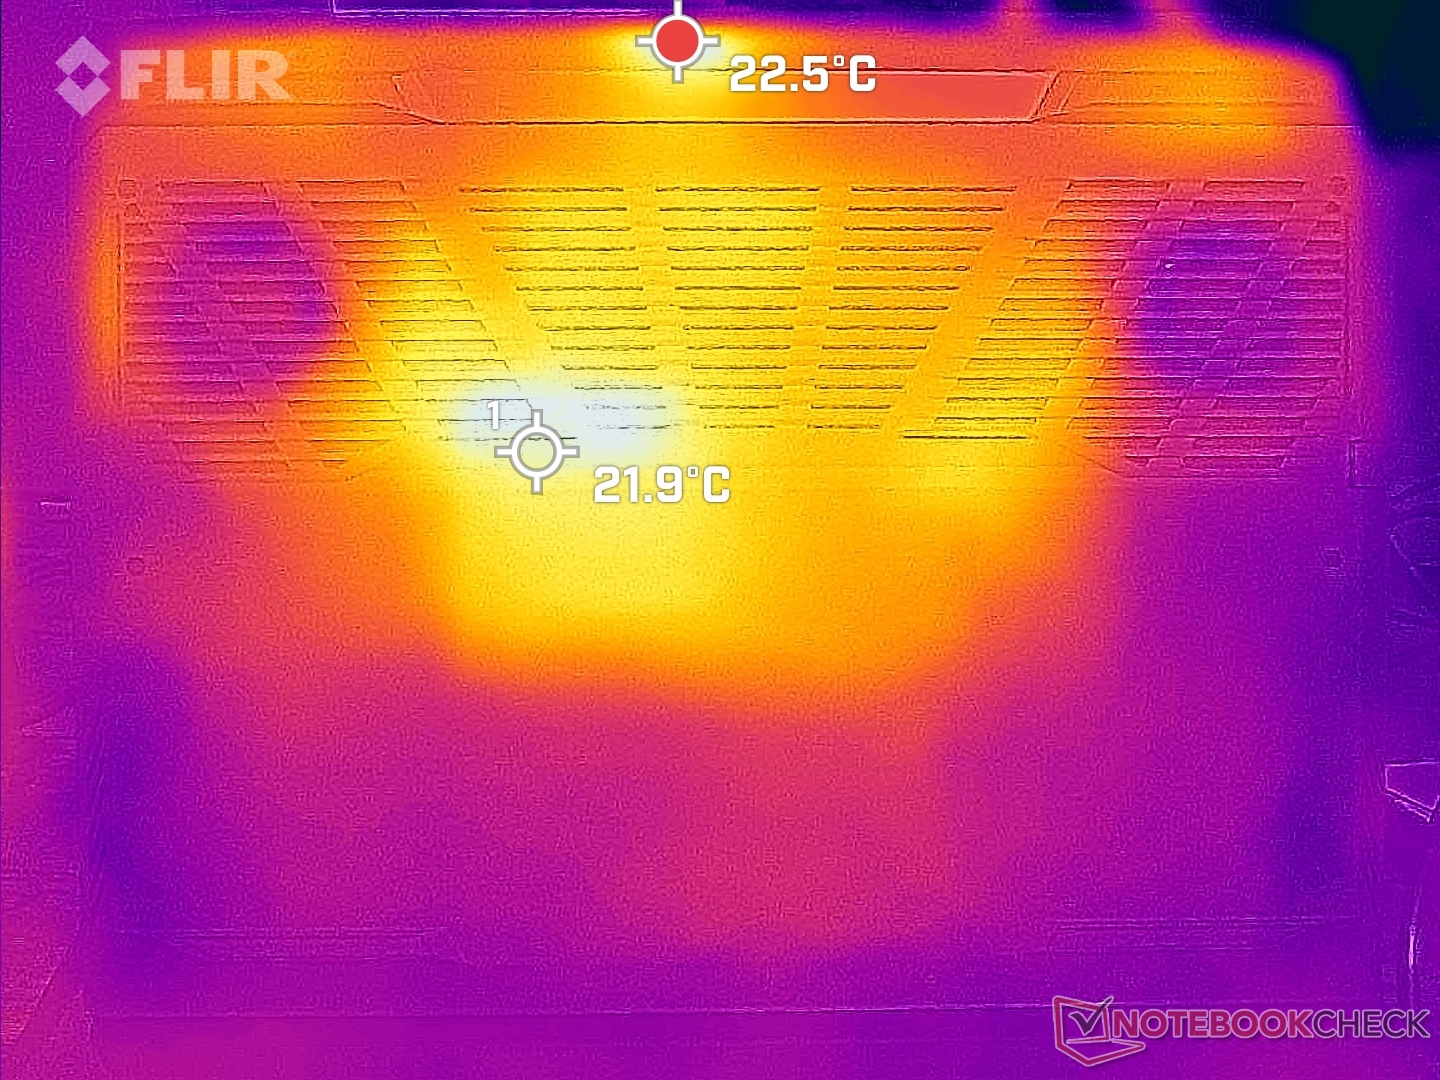
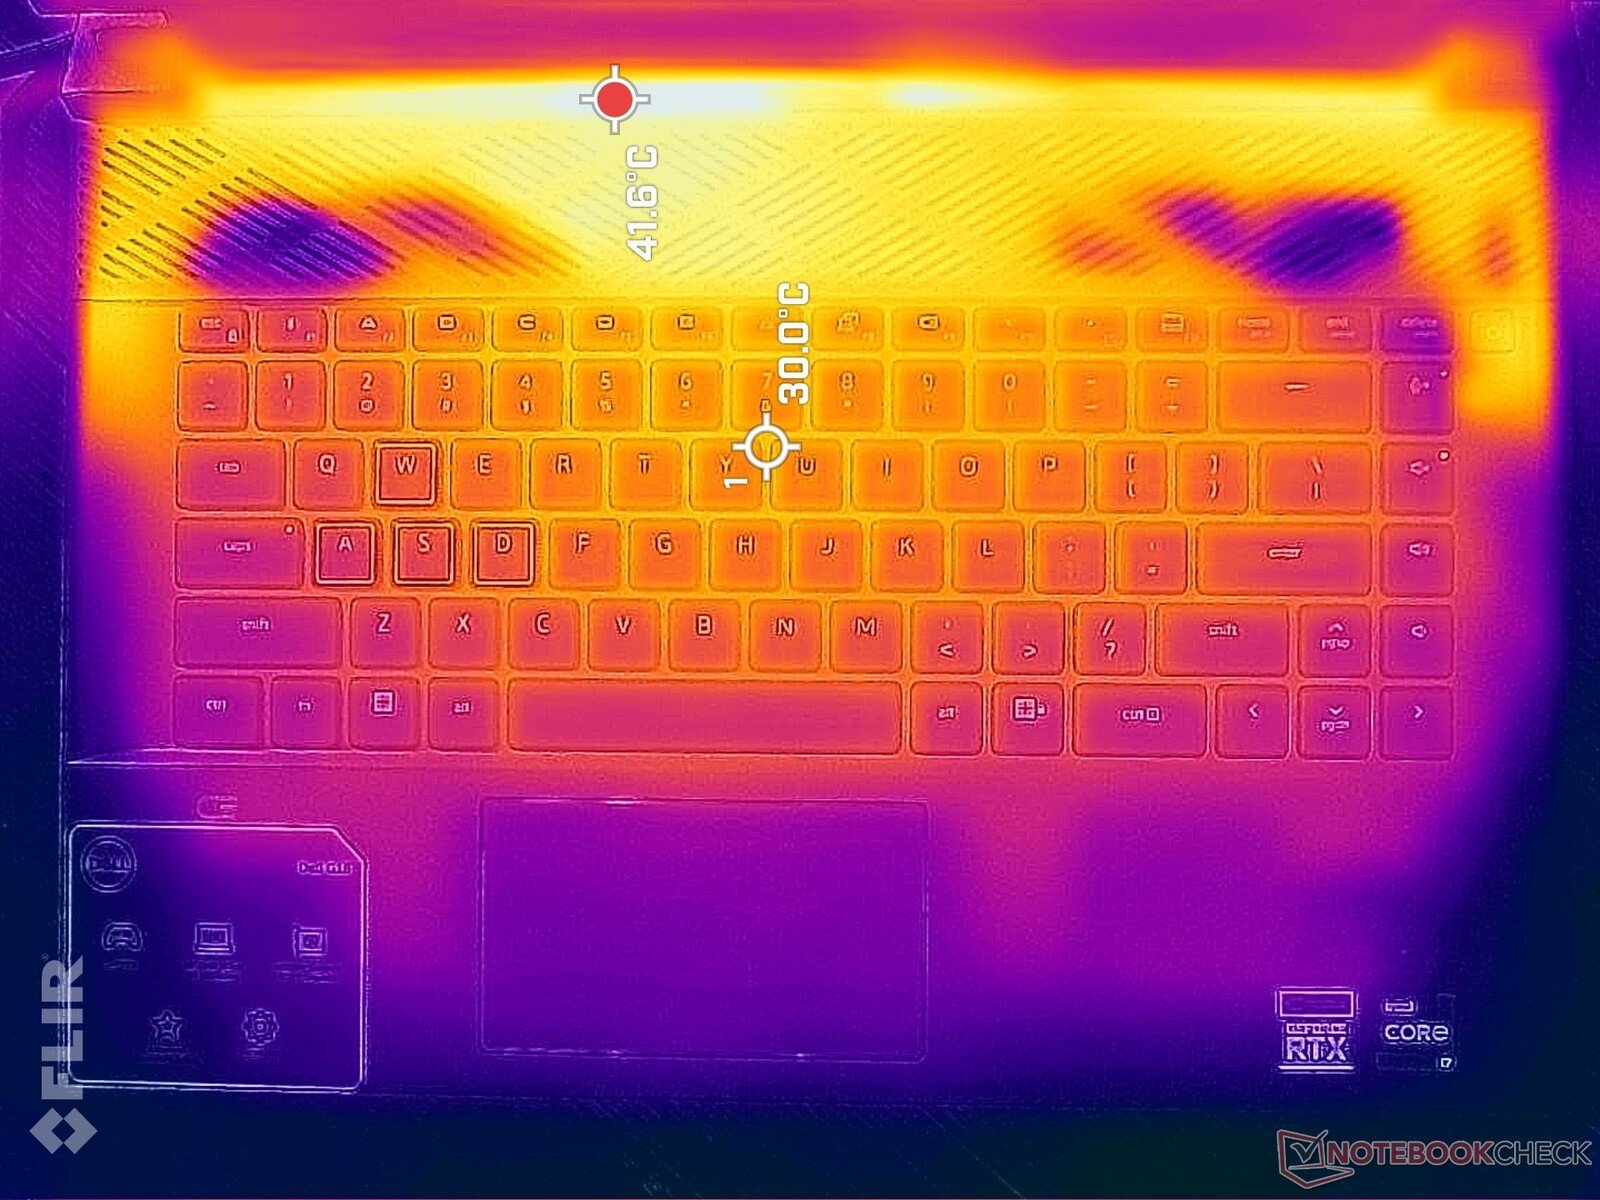
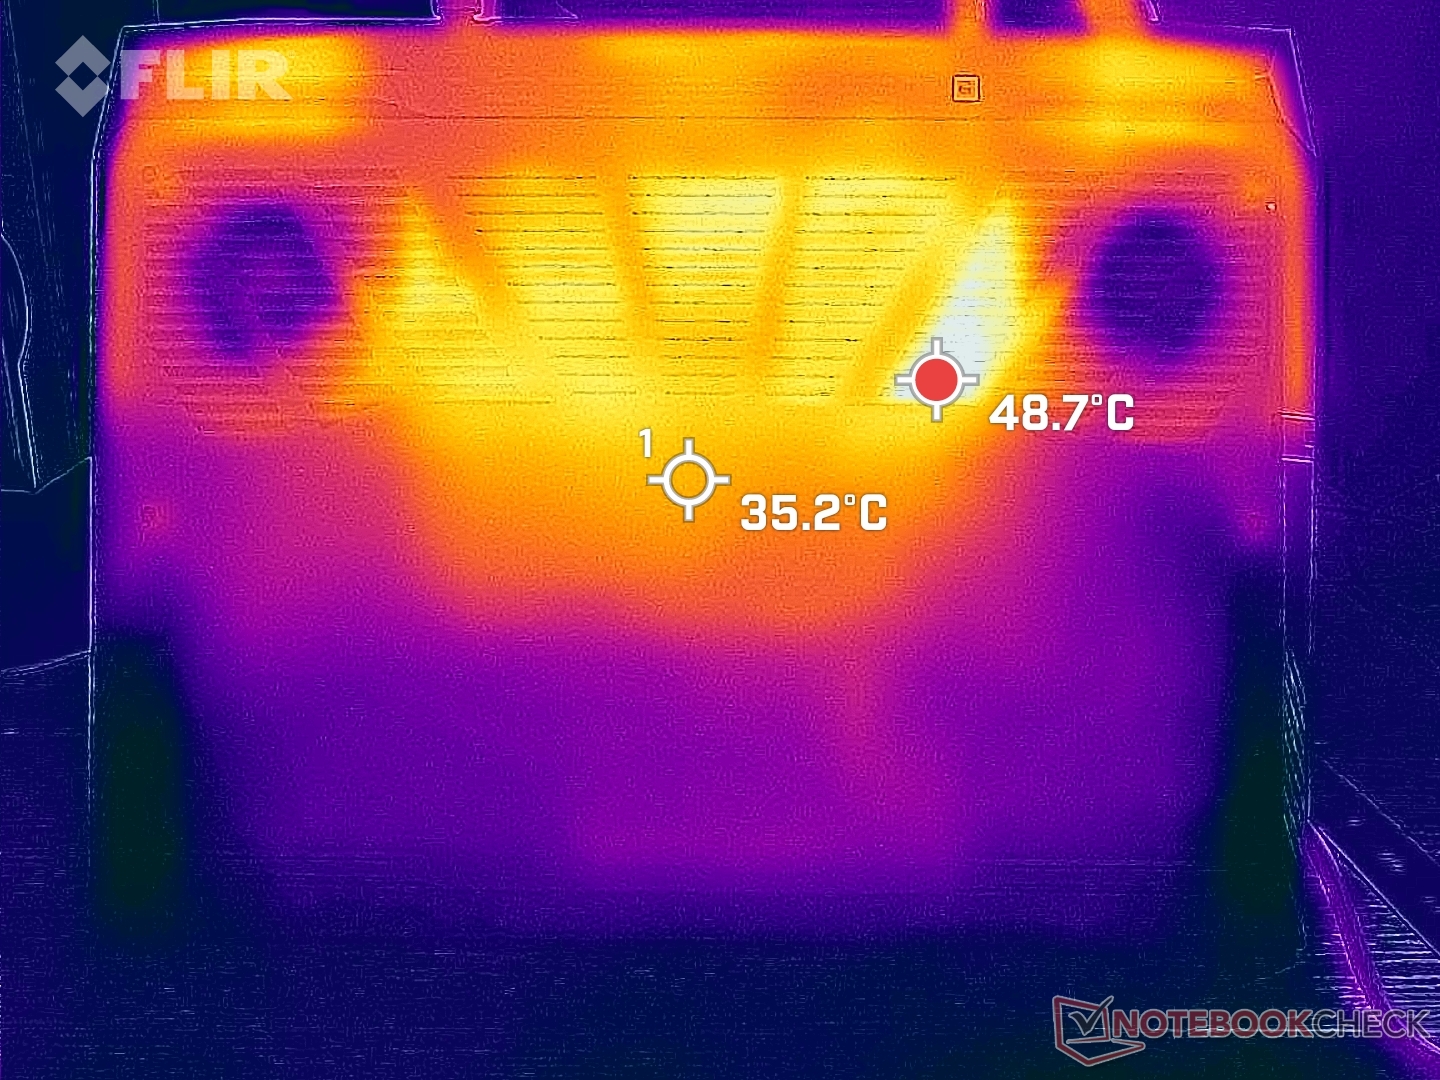
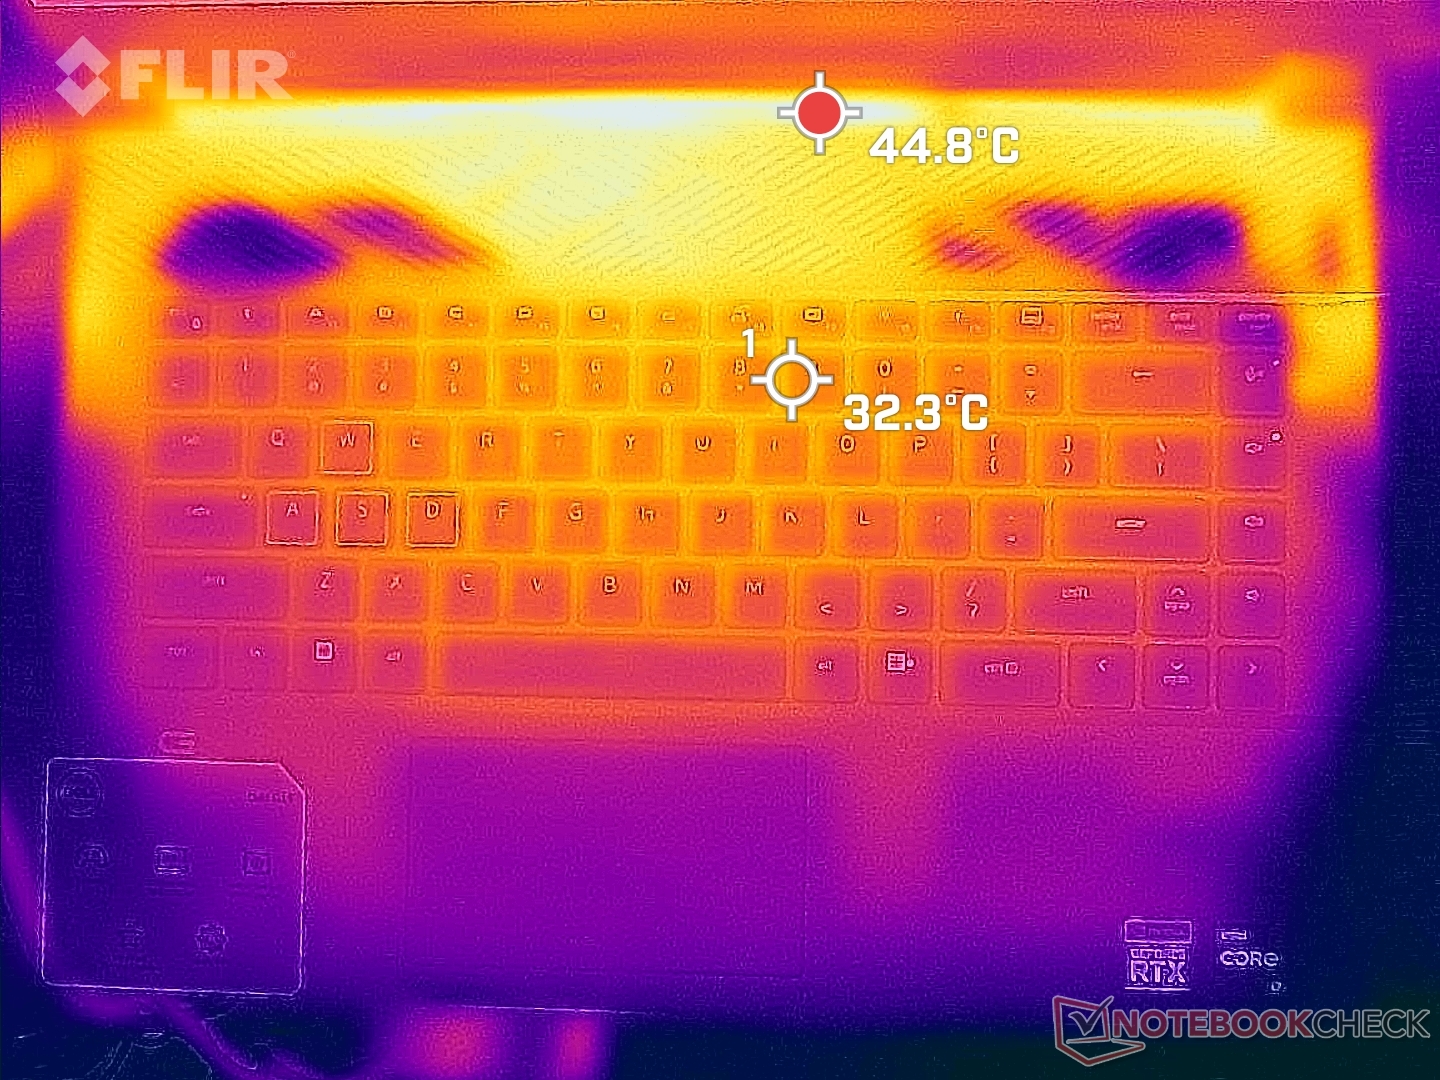
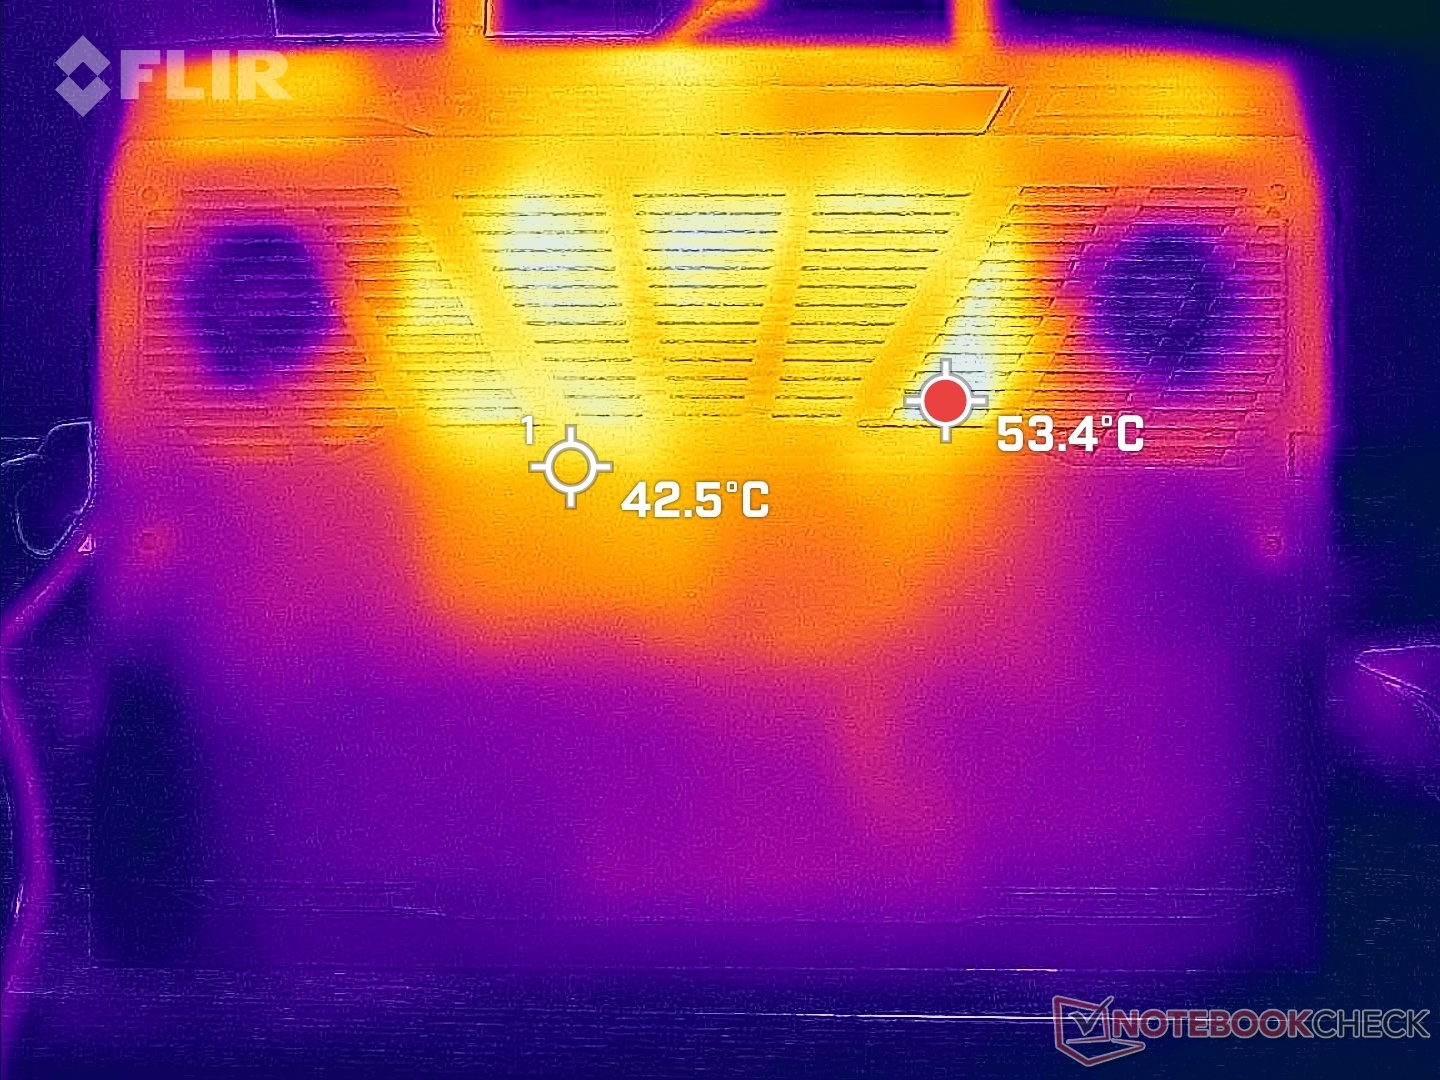
Temperatura - Muito quente em direção às costas
Temperaturas de superfície quando o jogo pode atingir até 48 C e 51 C na parte superior e inferior, respectivamente, em comparação com 54 C e 46 C na parte superior e inferior do HP Victus 16 quando em condições semelhantes. Os pontos quentes estão felizmente em direção à parte traseira e longe das teclas do teclado ou das áreas frontais. Assim, o descanso da palma da mão e as teclas nunca se tornam desconfortavelmente quentes quando se joga.
Grande parte da parte traseira é dedicada à ventilação como é evidente pelas muitas grelhas em todos os lados da base.
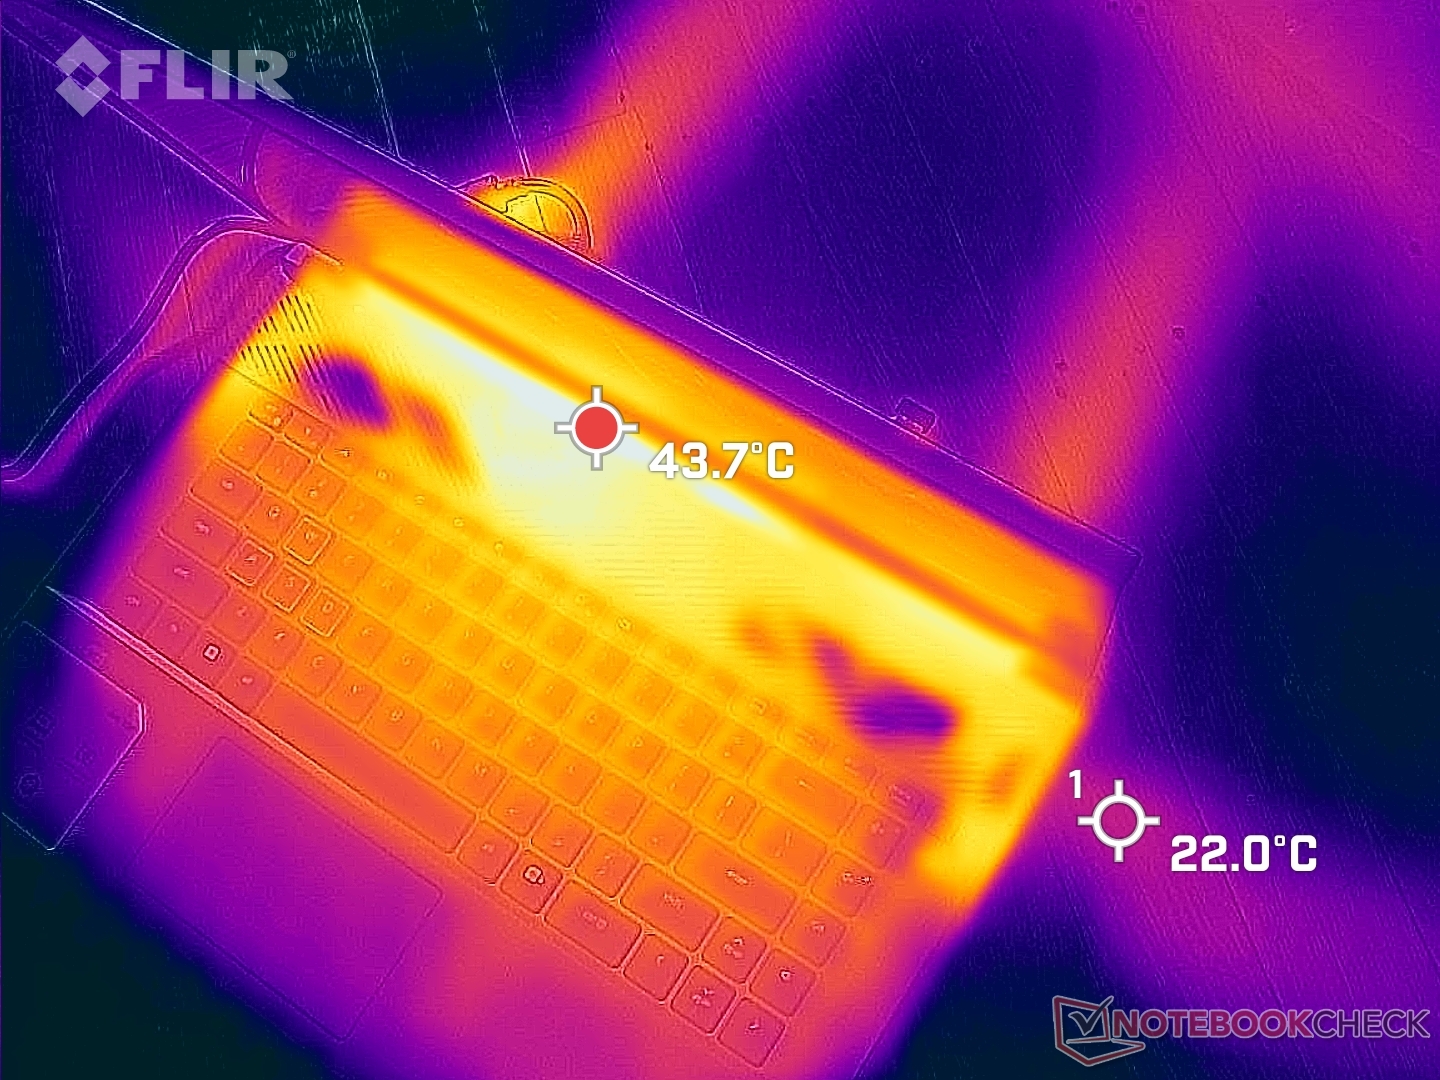
(-) A temperatura máxima no lado superior é 47.6 °C / 118 F, em comparação com a média de 40.4 °C / 105 F , variando de 21.2 a 68.8 °C para a classe Gaming.
(-) A parte inferior aquece até um máximo de 54 °C / 129 F, em comparação com a média de 43.2 °C / 110 F
(+) Em uso inativo, a temperatura média para o lado superior é 21.8 °C / 71 F, em comparação com a média do dispositivo de 33.9 °C / ### class_avg_f### F.
(±) Jogando The Witcher 3, a temperatura média para o lado superior é 33.7 °C / 93 F, em comparação com a média do dispositivo de 33.9 °C / ## #class_avg_f### F.
(+) Os apoios para as mãos e o touchpad são mais frios que a temperatura da pele, com um máximo de 30.2 °C / 86.4 F e, portanto, são frios ao toque.
(±) A temperatura média da área do apoio para as mãos de dispositivos semelhantes foi 28.8 °C / 83.8 F (-1.4 °C / -2.6 F).
| Dell G16 7620 Intel Core i7-12700H, NVIDIA GeForce RTX 3060 Laptop GPU | Lenovo Legion 7 16ARHA7 AMD Ryzen 9 6900HX, AMD Radeon RX 6850M XT | HP Victus 16-e0145ng AMD Ryzen 5 5600H, NVIDIA GeForce RTX 3050 Ti Laptop GPU | Asus ROG Zephyrus M16 GU603H Intel Core i9-11900H, NVIDIA GeForce RTX 3070 Laptop GPU | Lenovo Legion 5 Pro 16IAH7H Intel Core i7-12700H, NVIDIA GeForce RTX 3060 Laptop GPU | Acer Swift X SFX16-51G-5388 Intel Core i5-11320H, NVIDIA GeForce RTX 3050 4GB Laptop GPU | |
|---|---|---|---|---|---|---|
| Heat | -10% | -26% | -35% | -19% | -15% | |
| Maximum Upper Side * (°C) | 47.6 | 37.2 22% | 54 -13% | 52 -9% | 45.8 4% | 52.4 -10% |
| Maximum Bottom * (°C) | 54 | 43 20% | 47 13% | 53 2% | 66.3 -23% | 50 7% |
| Idle Upper Side * (°C) | 23 | 34 -48% | 41 -78% | 38 -65% | 30.4 -32% | 30.3 -32% |
| Idle Bottom * (°C) | 24.6 | 32.8 -33% | 31 -26% | 41 -67% | 30.4 -24% | 30.4 -24% |
* ... menor é melhor
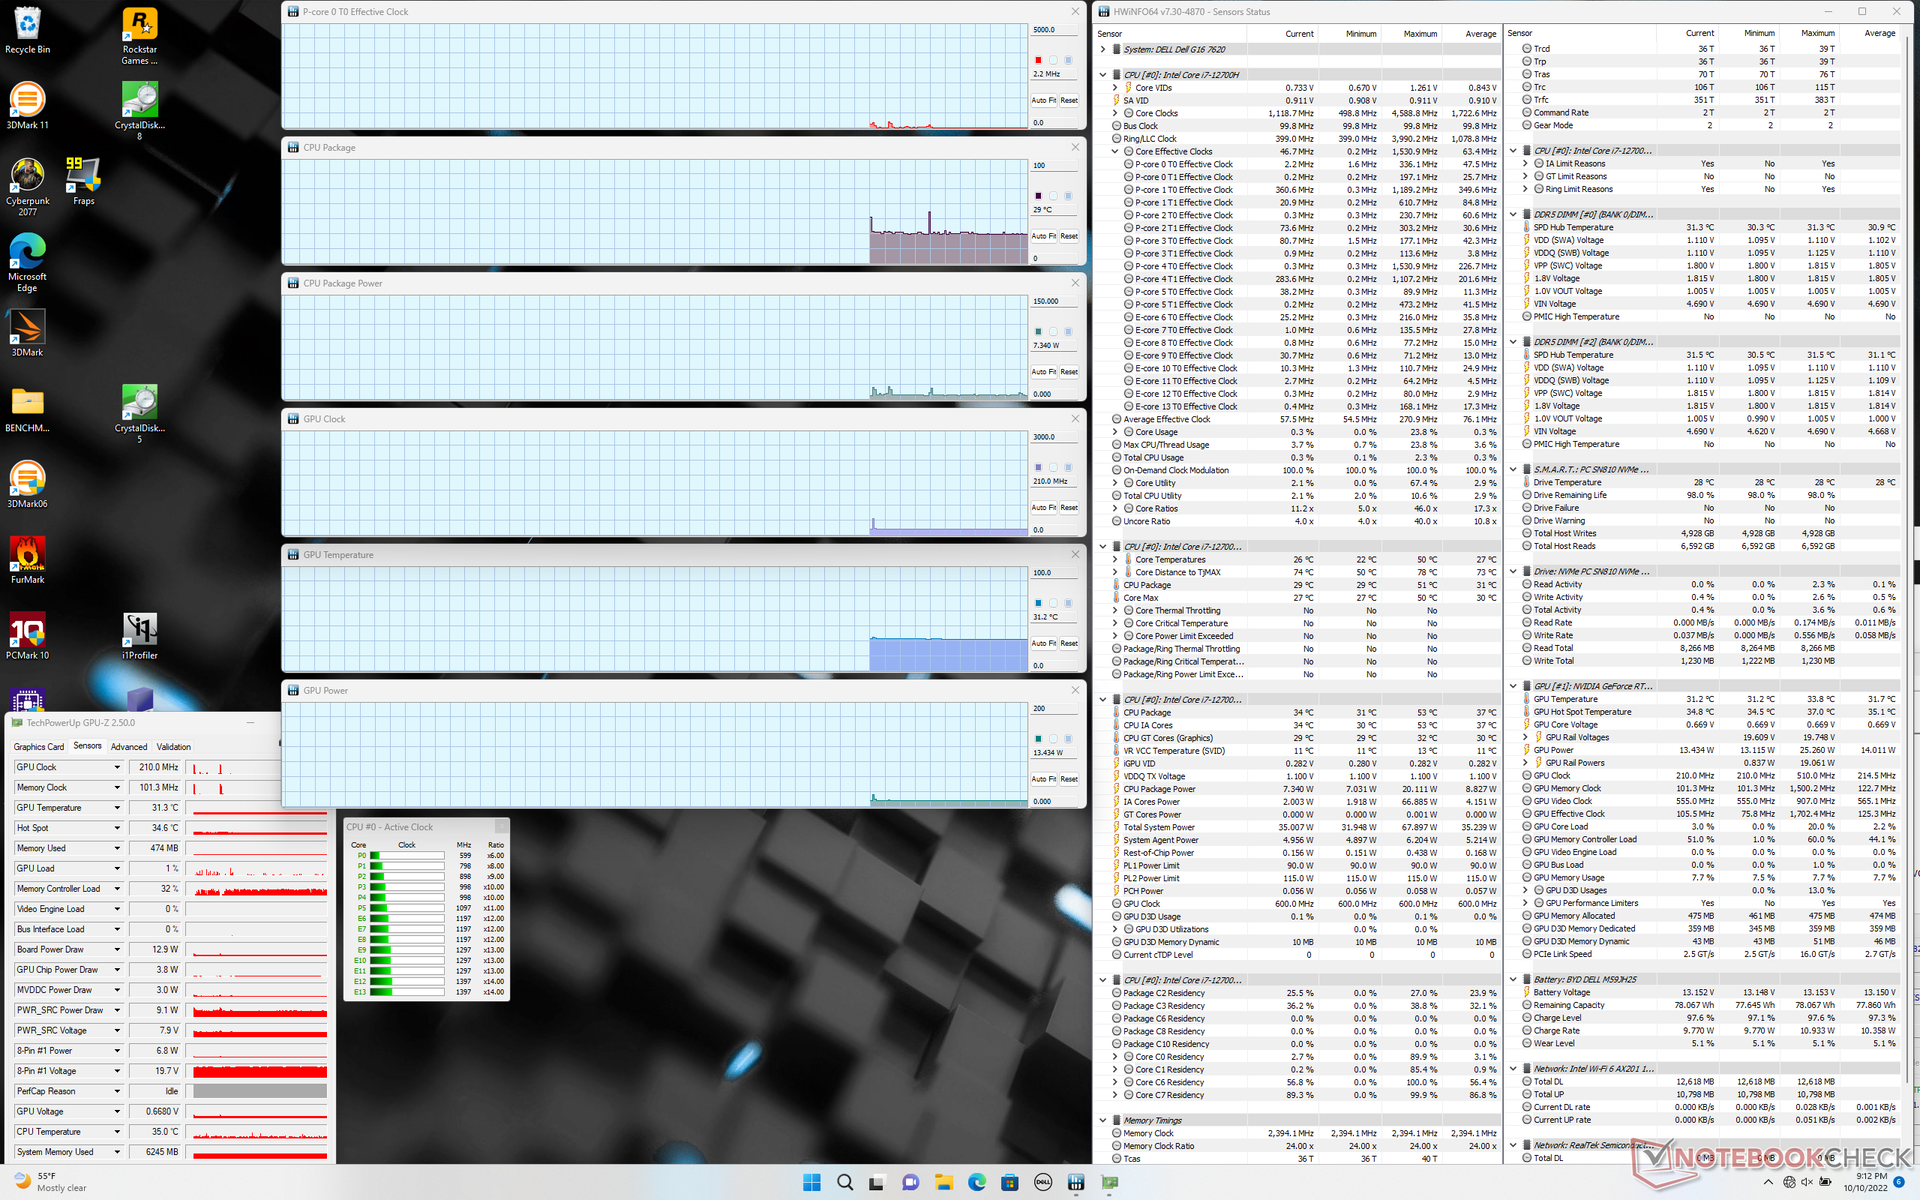
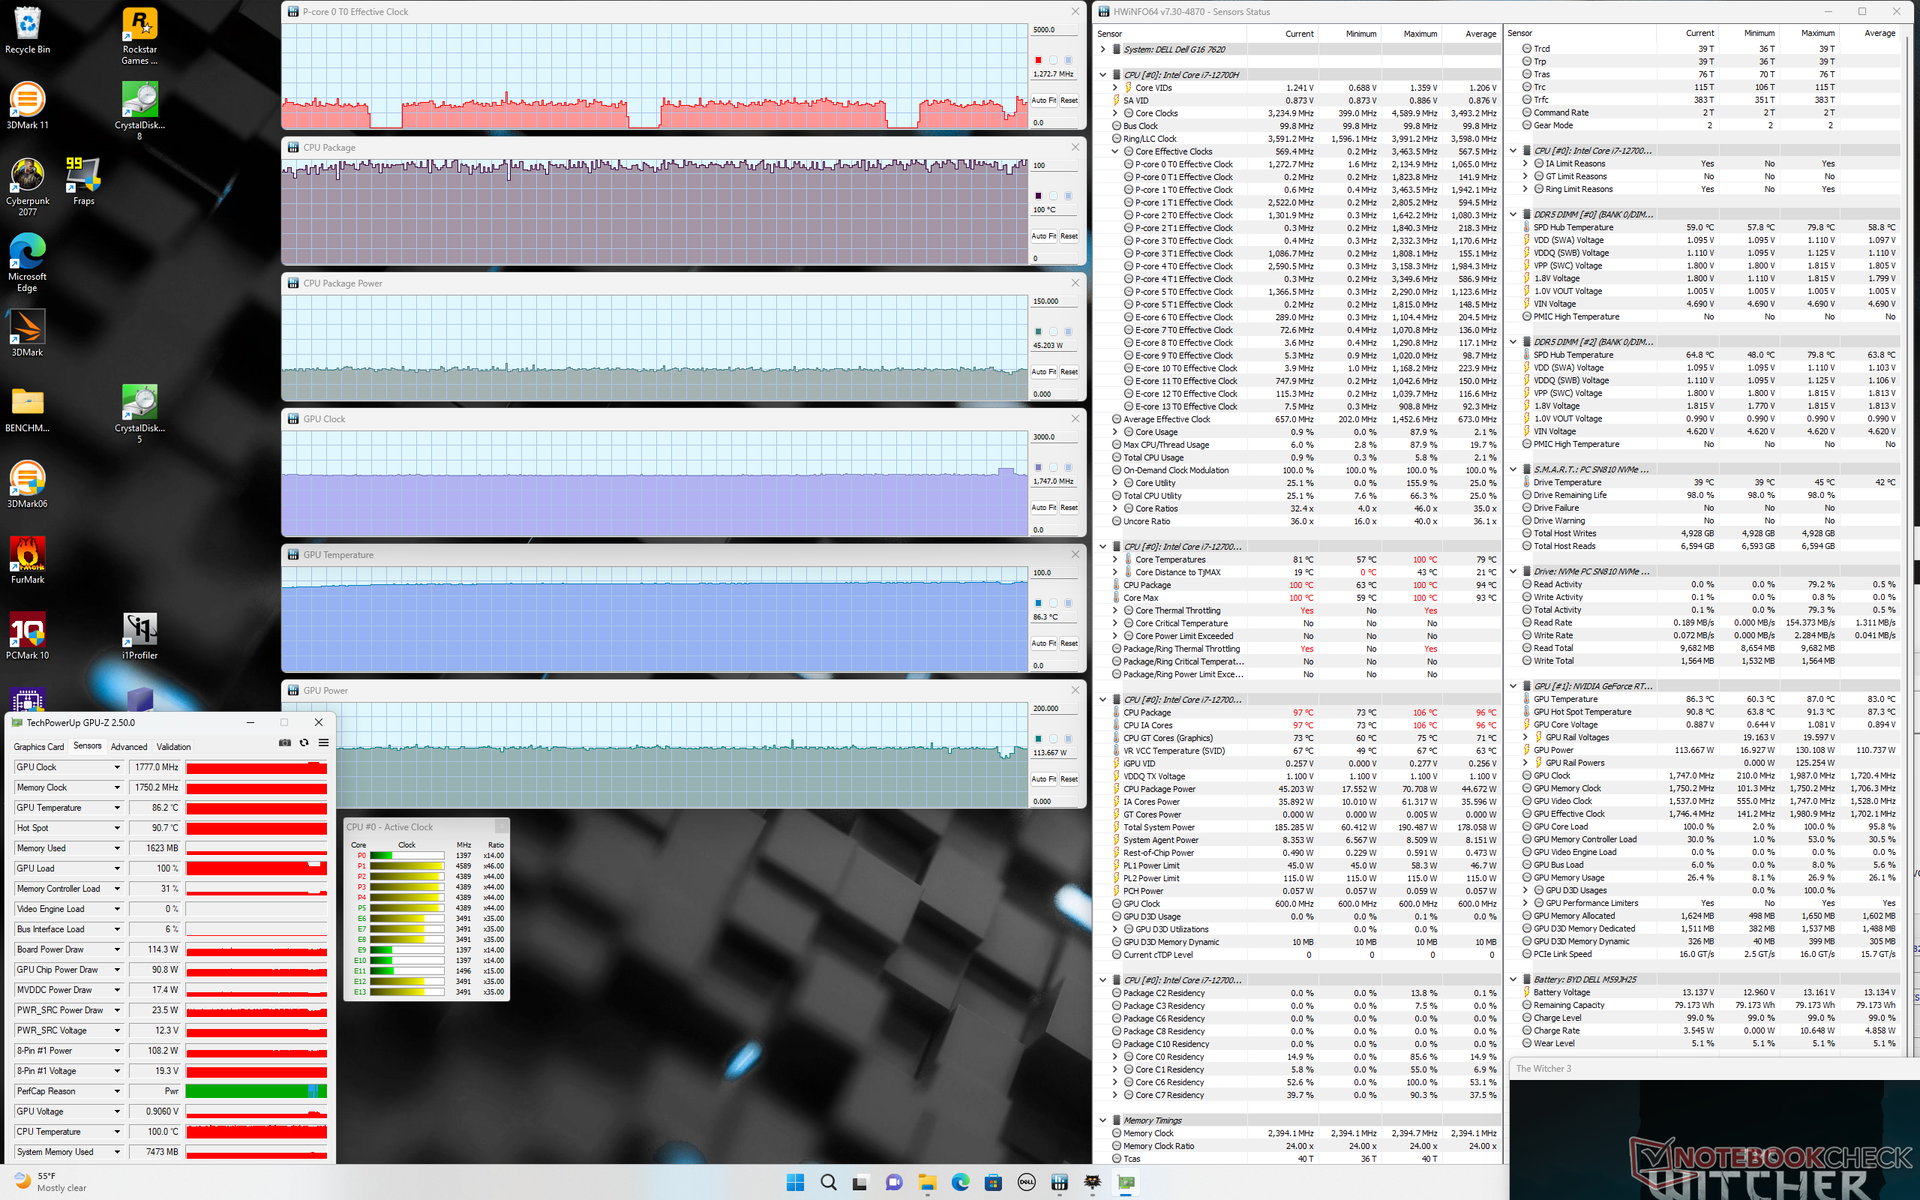
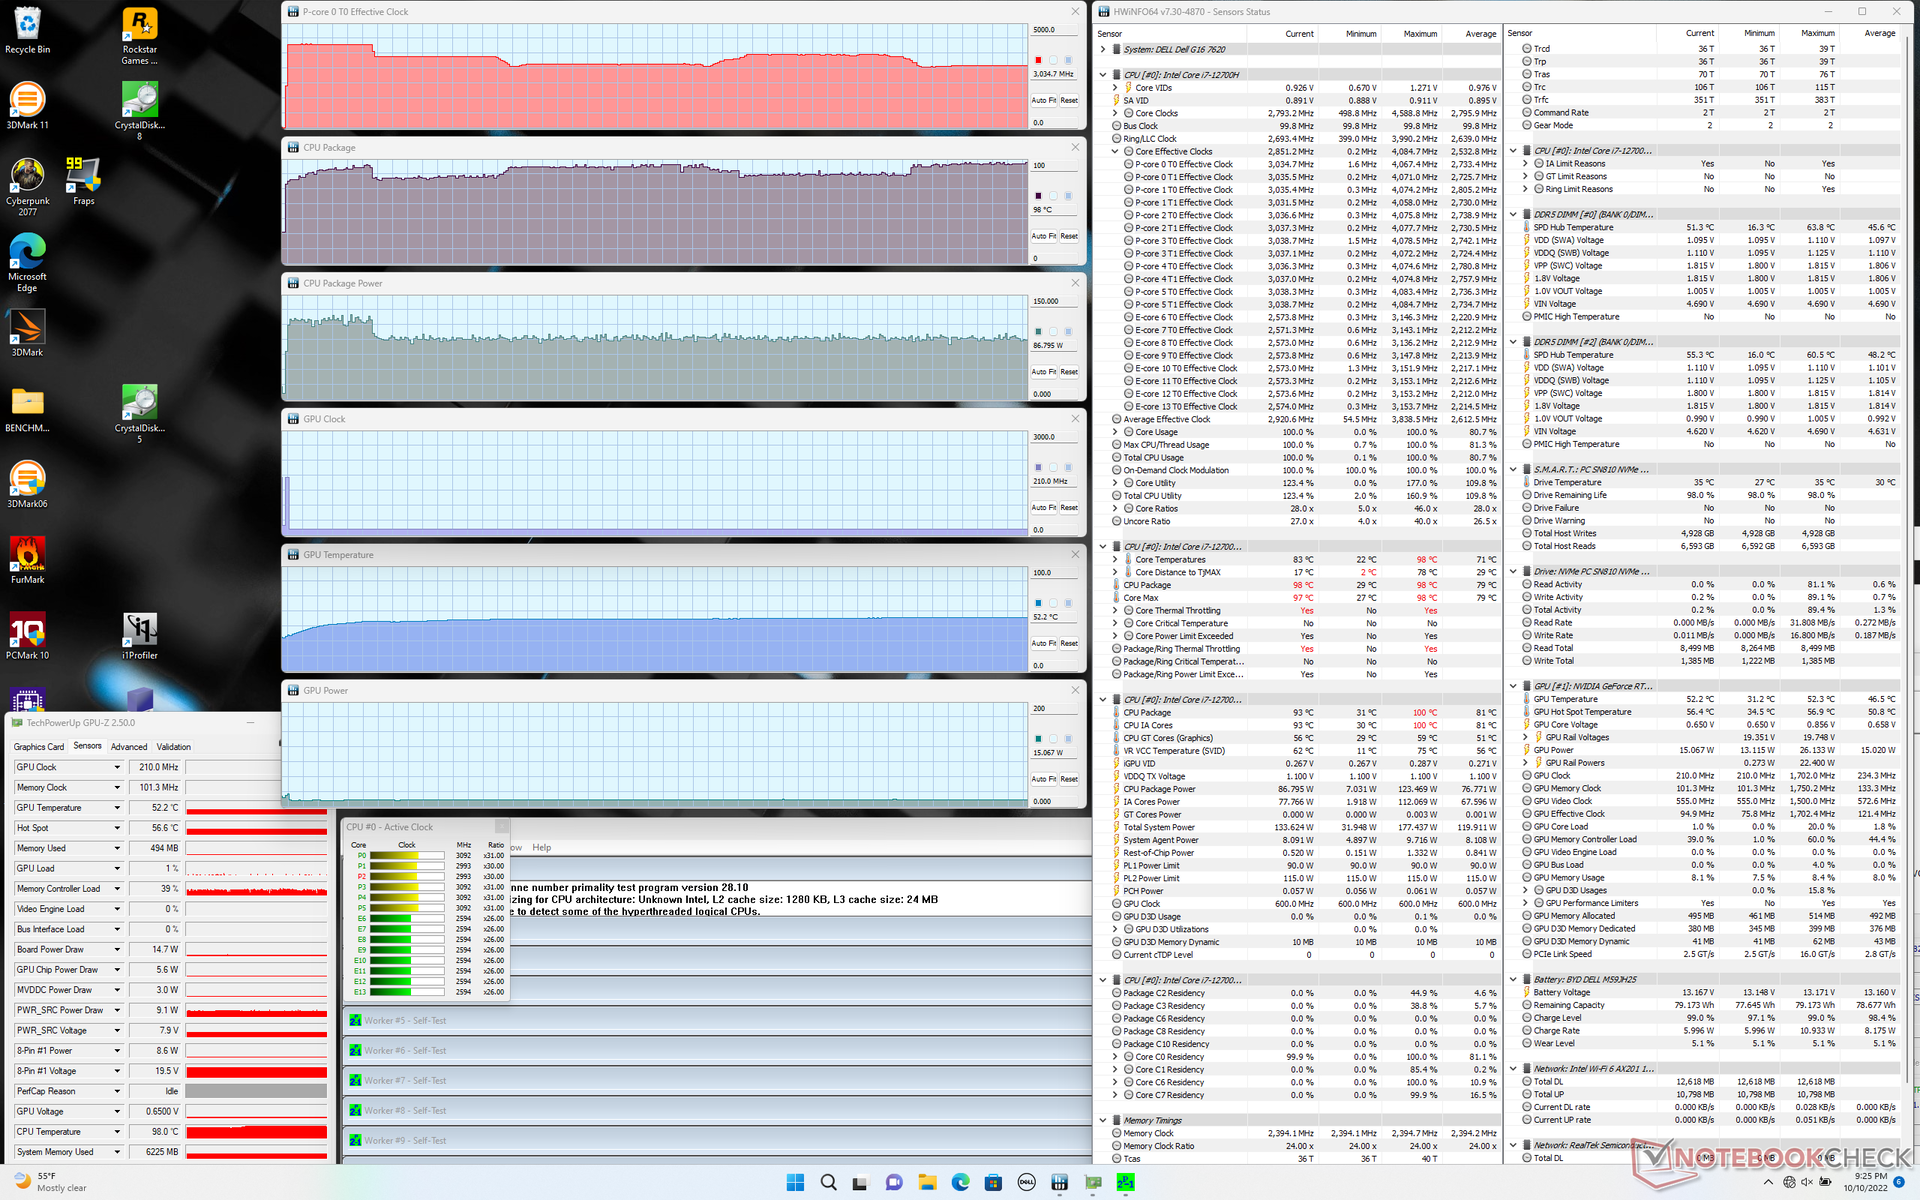
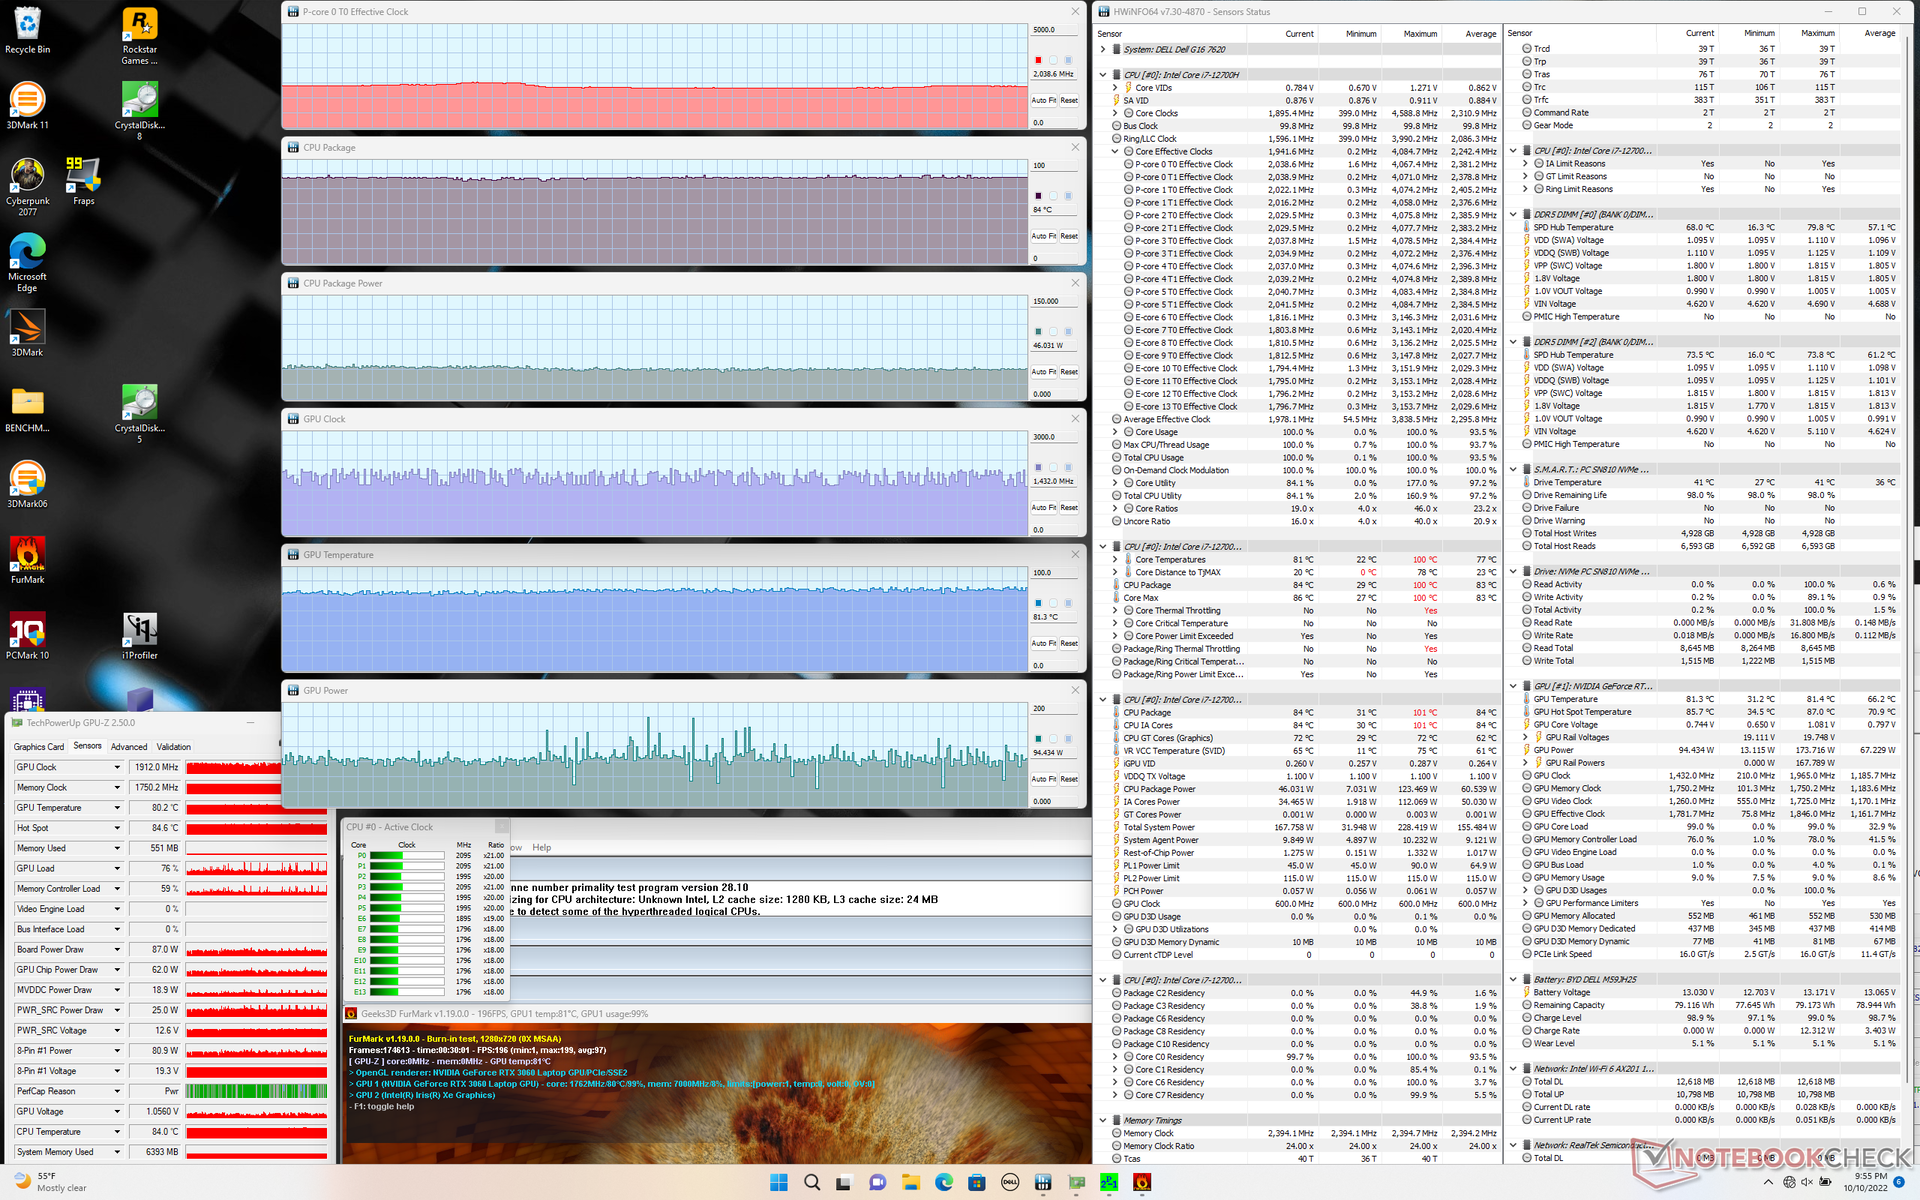
Teste de estresse
As temperaturas da CPU se tornam muito quentes quando o sistema está estressado. Ao executar Prime95, por exemplo, as taxas de clock e o consumo de energia da placa aumentariam para 4,1 GHz e 117 W, respectivamente, durando cerca de um minuto a até 99 C. A CPU cairia então para a faixa de 3,1 a 3,5 GHz e com um consumo de energia da placa mais baixo de 88 W para evitar que as temperaturas centrais chegassem a 100 C. Em comparação, executar este mesmo teste na HP Envy 16 com a mesma CPU Core i7-12700H e GeForce GPU resultaria em uma temperatura core de apenas 66 C. A já alta temperatura core do G16 sugere que o Core i9-12900H SKU mais caro provavelmente trará apenas pequenos incrementos de desempenho na melhor das hipóteses.
A execução Witcher 3 resultaria em um relógio de núcleo GPU estável, temperatura e potência de placa de 1777 MHz, 86 C e 114 W, respectivamente, contra o alvo TGP de 130 W. A repetição deste mesmo teste na inveja 16 acima mencionada resultaria em taxas de relógio de núcleo um pouco mais lentas e em temperaturas e demandas de energia mais baixas. Mais preocupante, porém, é que a temperatura da CPU no G16 está novamente acima de 90 C para ser muito mais quente do que nos laptops de jogos concorrentes.
Funcionando com energia de bateria limita severamente o desempenho. Um teste Fire Strike em baterias retornaria pontuações de Física e gráficos de 19465 e 4162 pontos, respectivamente, em comparação com 27735 e 21584 pontos quando em rede elétrica.
| Relógio CPU (GHz) | Relógio GPU (MHz) | Temperatura média da CPU (°C) | Temperatura média da GPU (°C) | |
| System Idle | -- | -- | 29 | 31 |
| Prime95 Stress | 3.1 - 3.6 | -- | 86 - 98 | 52 |
| Prime95 + FurMark Stress | 2.0 | ~1432 - ~1912 | 84 | 81 |
| Witcher 3 Stress | ~1.3 | 1777 | ~99 | 86 |
Oradores
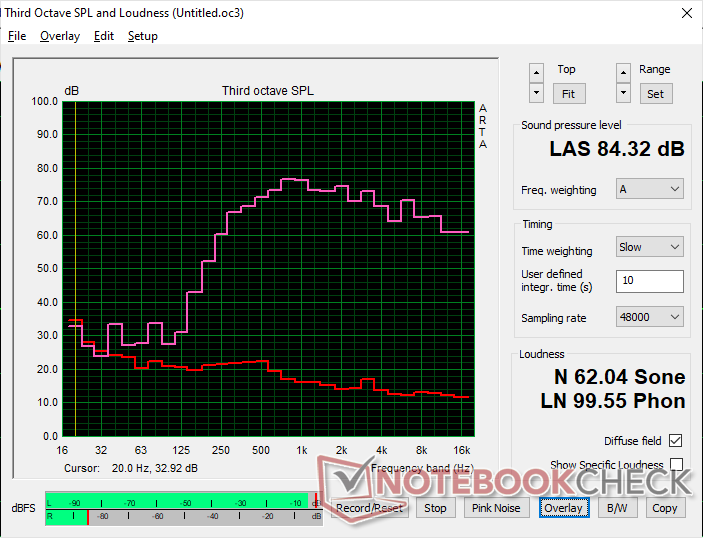
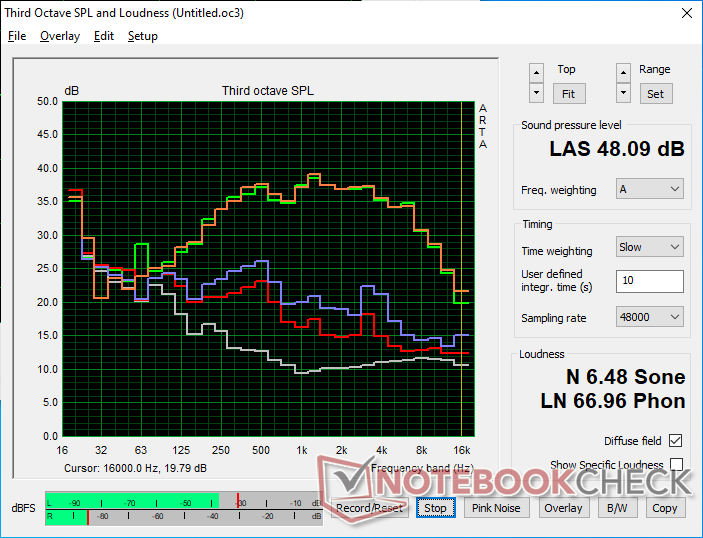
Dell G16 7620 análise de áudio
(+) | os alto-falantes podem tocar relativamente alto (###valor### dB)
Graves 100 - 315Hz
(-) | quase nenhum baixo - em média 21.8% menor que a mediana
(±) | a linearidade dos graves é média (14.5% delta para a frequência anterior)
Médios 400 - 2.000 Hz
(+) | médios equilibrados - apenas 4.9% longe da mediana
(+) | médios são lineares (3.5% delta para frequência anterior)
Altos 2 - 16 kHz
(+) | agudos equilibrados - apenas 2.6% longe da mediana
(±) | a linearidade dos máximos é média (7.7% delta para frequência anterior)
Geral 100 - 16.000 Hz
(±) | a linearidade do som geral é média (17.2% diferença em relação à mediana)
Comparado com a mesma classe
» 47% de todos os dispositivos testados nesta classe foram melhores, 11% semelhantes, 42% piores
» O melhor teve um delta de 6%, a média foi 18%, o pior foi 132%
Comparado com todos os dispositivos testados
» 32% de todos os dispositivos testados foram melhores, 8% semelhantes, 60% piores
» O melhor teve um delta de 4%, a média foi 23%, o pior foi 134%
Apple MacBook Pro 16 2021 M1 Pro análise de áudio
(+) | os alto-falantes podem tocar relativamente alto (###valor### dB)
Graves 100 - 315Hz
(+) | bons graves - apenas 3.8% longe da mediana
(+) | o baixo é linear (5.2% delta para a frequência anterior)
Médios 400 - 2.000 Hz
(+) | médios equilibrados - apenas 1.3% longe da mediana
(+) | médios são lineares (2.1% delta para frequência anterior)
Altos 2 - 16 kHz
(+) | agudos equilibrados - apenas 1.9% longe da mediana
(+) | os máximos são lineares (2.7% delta da frequência anterior)
Geral 100 - 16.000 Hz
(+) | o som geral é linear (4.6% diferença em relação à mediana)
Comparado com a mesma classe
» 0% de todos os dispositivos testados nesta classe foram melhores, 0% semelhantes, 100% piores
» O melhor teve um delta de 5%, a média foi 17%, o pior foi 45%
Comparado com todos os dispositivos testados
» 0% de todos os dispositivos testados foram melhores, 0% semelhantes, 100% piores
» O melhor teve um delta de 4%, a média foi 23%, o pior foi 134%
Gerenciamento de energia - Exigindo sob a maioria dos cenários
Consumo de energia
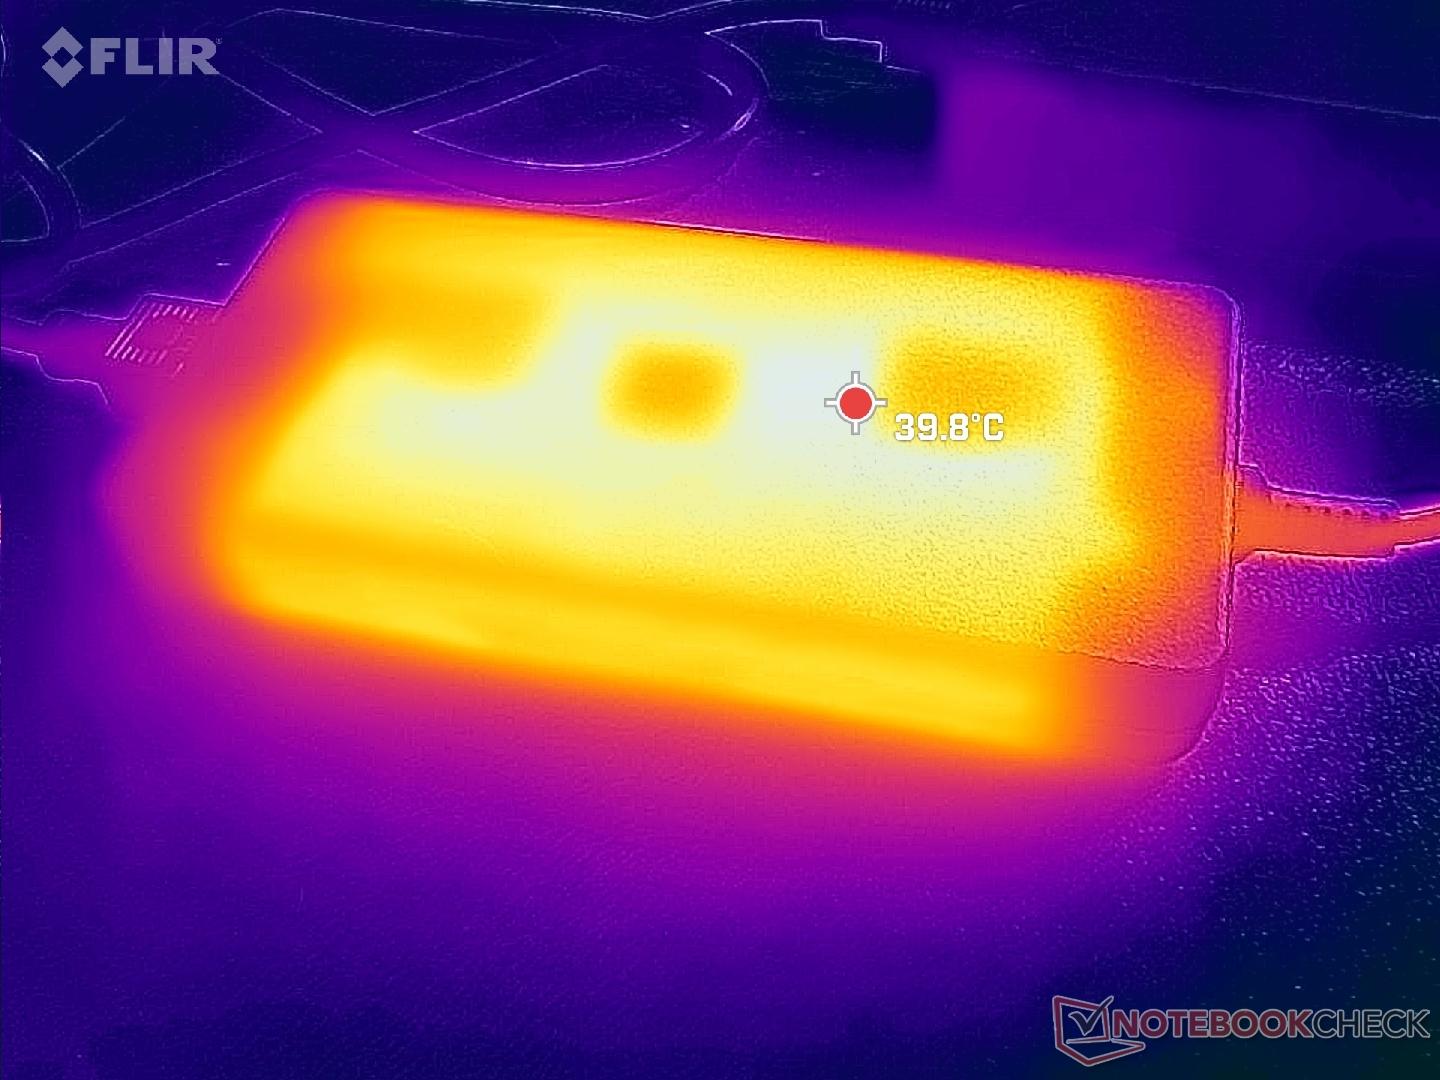
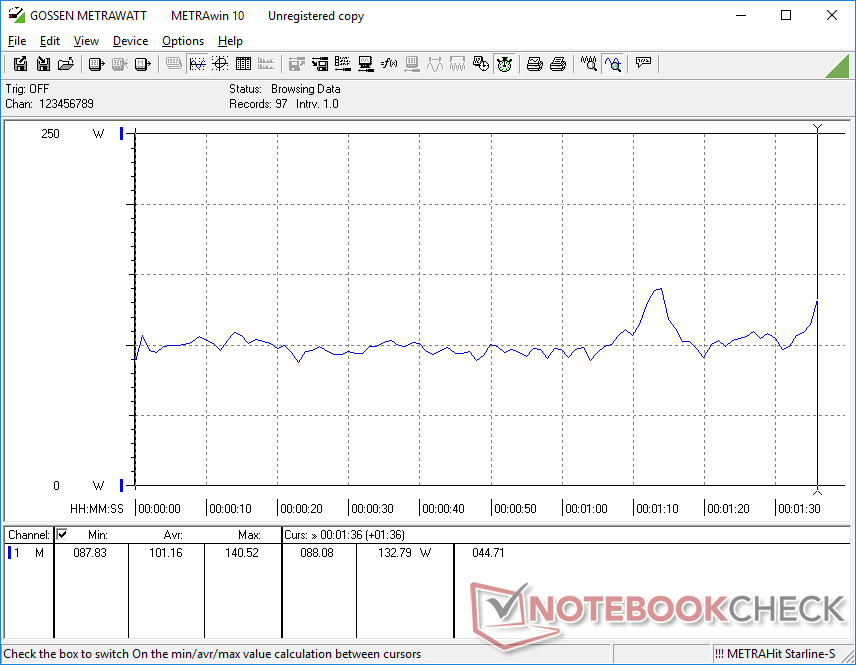
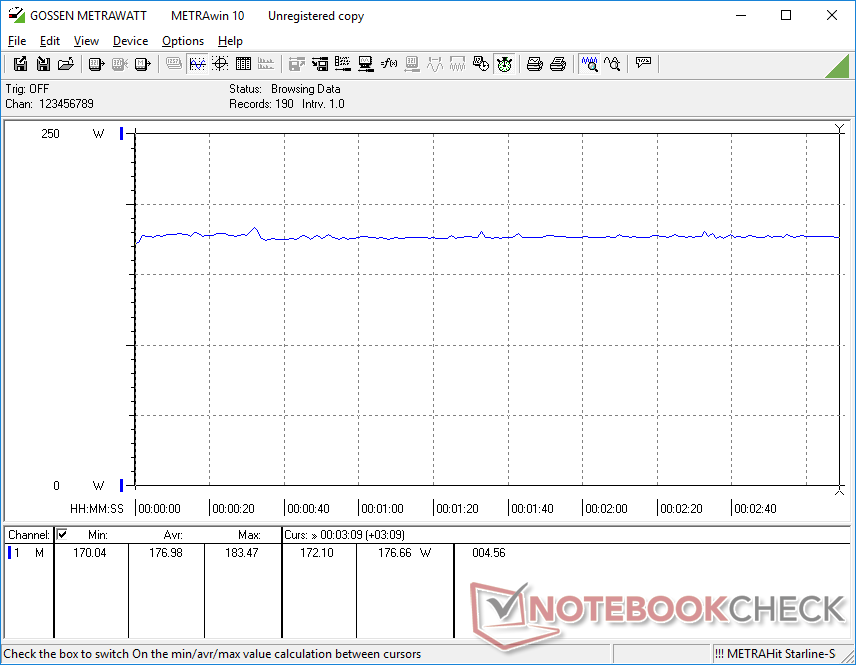
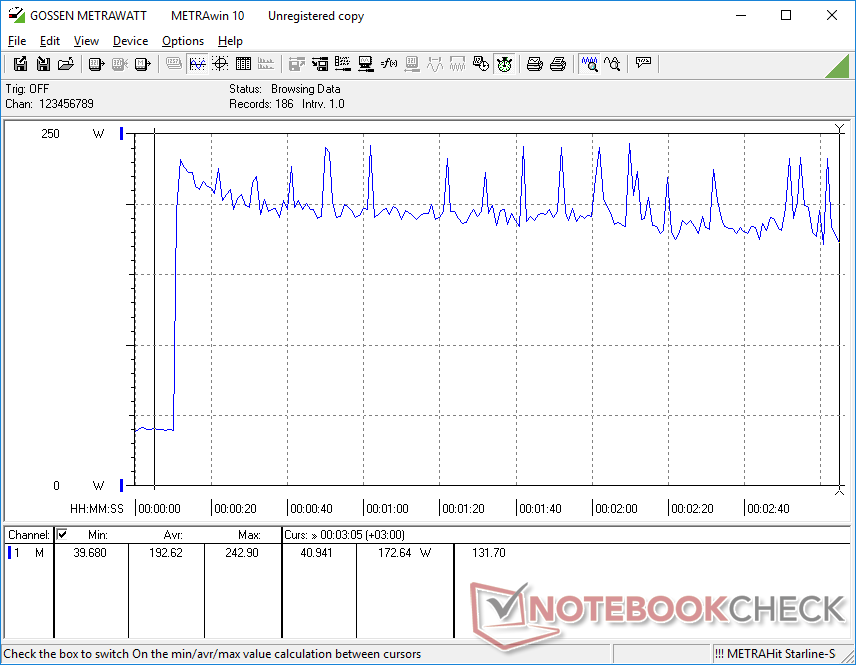
O consumo de energia é relativamente alto quando ocioso no desktop de 14 a 32 W. No entanto, esta faixa é apenas ligeiramente maior que na HP Envy 16 com a mesma CPU e GPU. Espere que o consumo seja tão alto quanto 177 W quando estiver rodando jogos ou cerca de 20 W a menos do que no Lenovo Legion 5 Pro ou Asus ROG Strix Scar 15
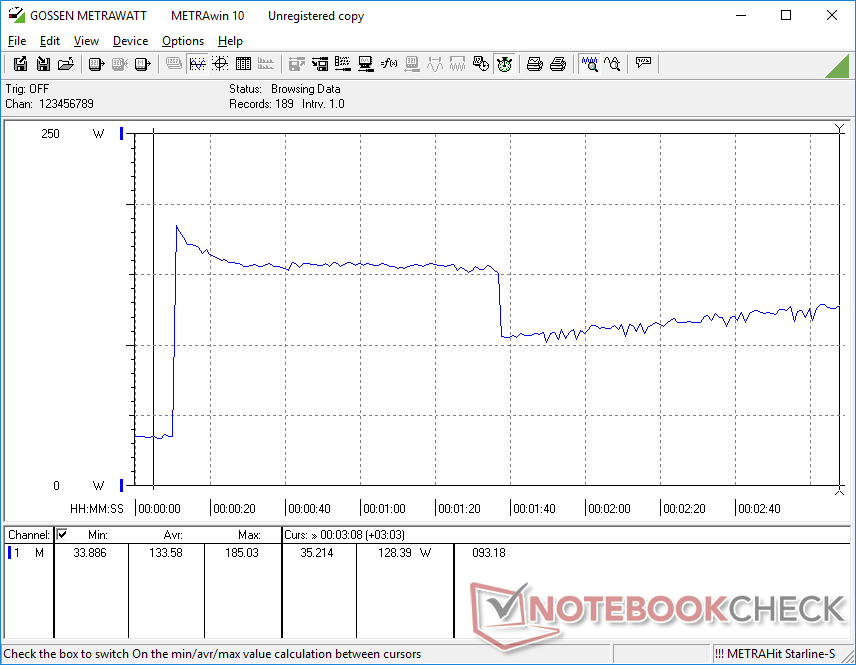
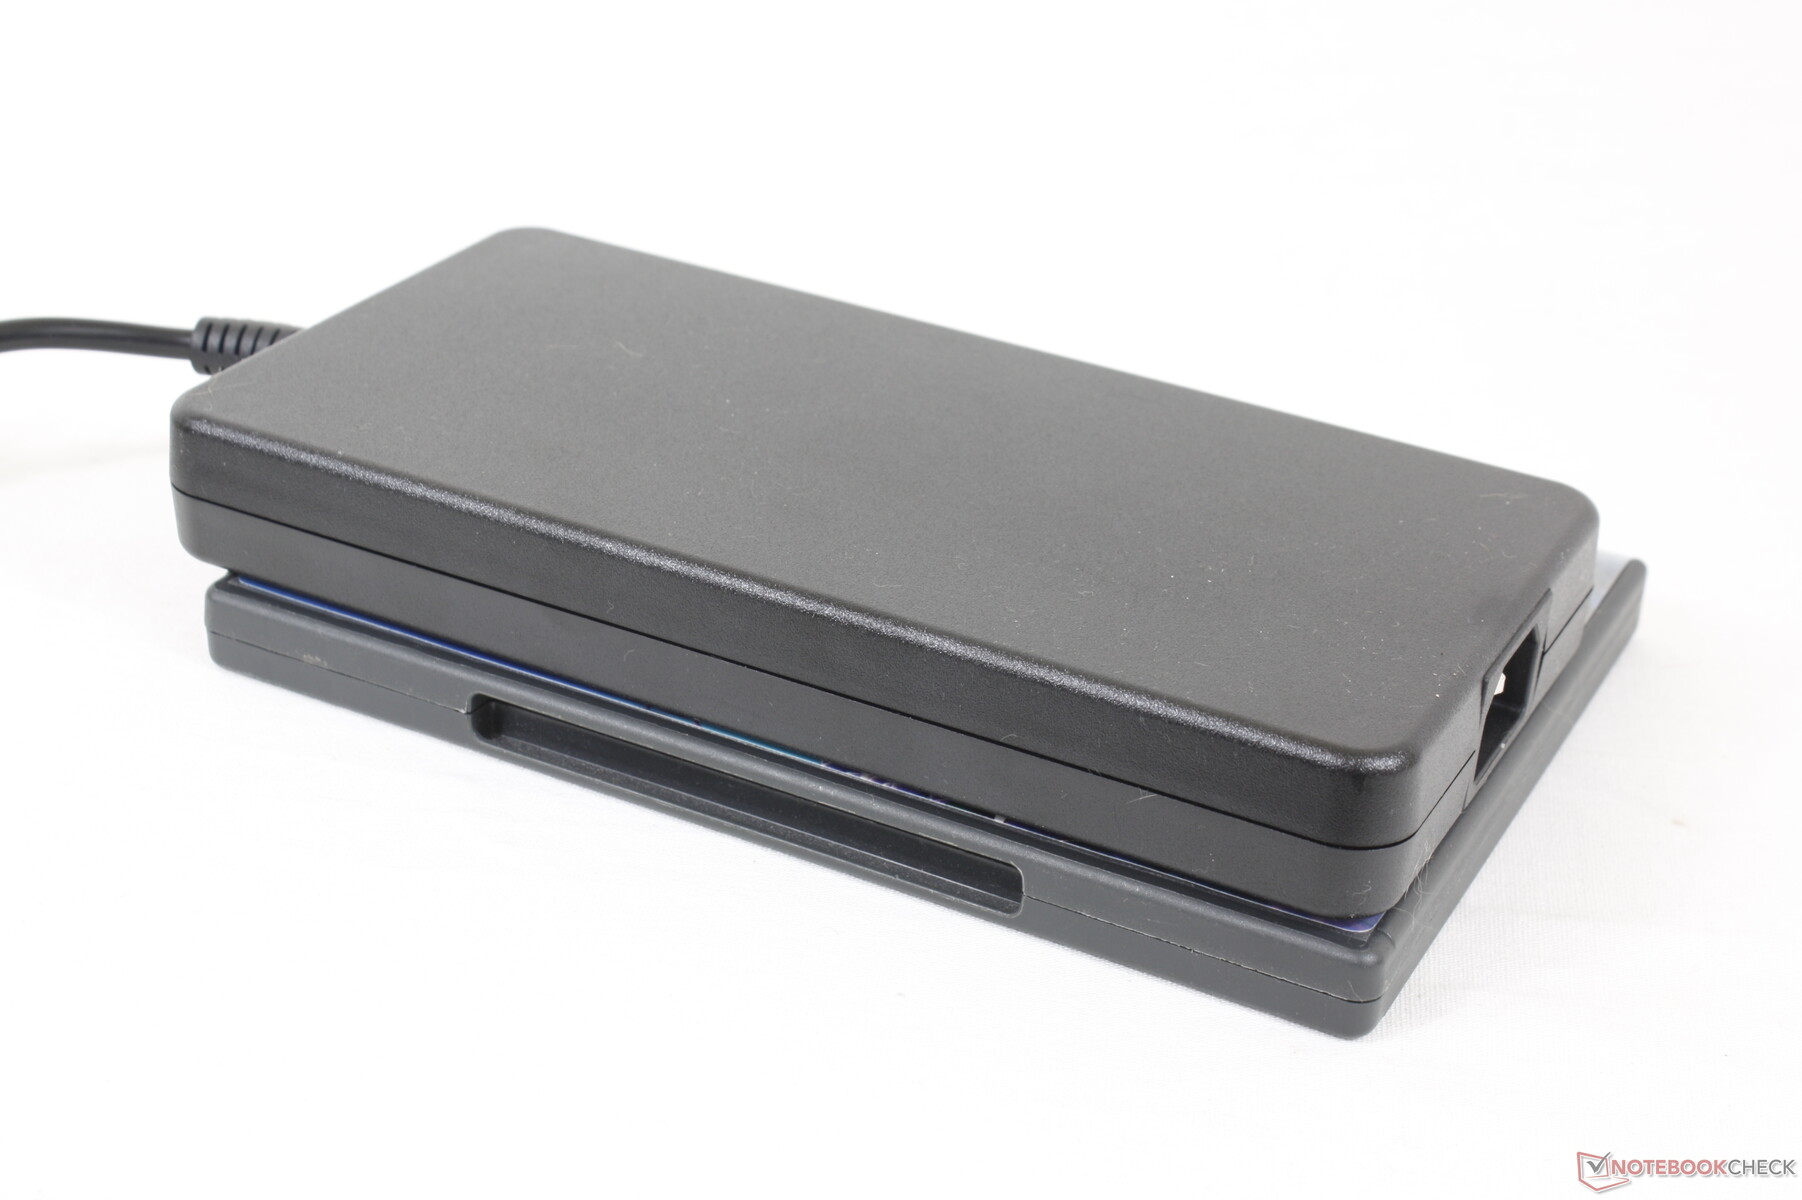
Somos capazes de registrar um consumo máximo de 243 W do grande (~19,9 x 10 x 2,5 cm) adaptador AC de 240 W quando a CPU e a GPU estão cada uma com 100% de utilização. O consumo ciclaria entre 180 W e 240 W quando sob tais condições, provavelmente devido a limitações térmicas.
| desligado | |
| Ocioso | |
| Carga |
|
Key:
min: | |
| Dell G16 7620 i7-12700H, GeForce RTX 3060 Laptop GPU, WDC PC SN810 512GB, IPS, 2560x1600, 16" | Lenovo Legion 7 16ARHA7 R9 6900HX, Radeon RX 6850M XT, Samsung PM9A1 MZVL22T0HBLB, IPS, 2560x1600, 16" | HP Victus 16-e0145ng R5 5600H, GeForce RTX 3050 Ti Laptop GPU, Samsung SSD PM981a MZVLB512HBJQ, IPS, 1920x1080, 16.1" | Asus ROG Zephyrus M16 GU603H i9-11900H, GeForce RTX 3070 Laptop GPU, Samsung PM9A1 MZVL22T0HBLB, IPS, 2560x1600, 16" | Lenovo Legion 5 Pro 16IAH7H i7-12700H, GeForce RTX 3060 Laptop GPU, 2x Samsung PM9A1 MZVL21T0HCLR (RAID 0), IPS, 2560x1600, 16" | Acer Swift X SFX16-51G-5388 i5-11320H, GeForce RTX 3050 4GB Laptop GPU, Samsung PM991 MZVLQ512HBLU, , 1920x1080, 16.1" | |
|---|---|---|---|---|---|---|
| Power Consumption | -2% | 35% | 6% | -39% | 51% | |
| Idle Minimum * (Watt) | 14.4 | 9.9 31% | 7 51% | 11 24% | 22.8 -58% | 7 51% |
| Idle Average * (Watt) | 17.8 | 22 -24% | 9 49% | 20 -12% | 26.5 -49% | 10.1 43% |
| Idle Maximum * (Watt) | 31.5 | 23.1 27% | 15 52% | 30 5% | 41 -30% | 15 52% |
| Load Average * (Watt) | 101.2 | 94.4 7% | 93 8% | 111 -10% | 191 -89% | 63.3 37% |
| Witcher 3 ultra * (Watt) | 176.9 | 249 -41% | 134.5 24% | 156 12% | 194.7 -10% | 63.3 64% |
| Load Maximum * (Watt) | 242.9 | 276 -14% | 185 24% | 197 19% | 238 2% | 94 61% |
* ... menor é melhor
Power Consumption Witcher 3 / Stresstest
Power Consumption external Monitor
Vida útil da bateria - Não tão grande assim
Os tempos de execução são apenas médios, mesmo para um grande laptop para jogos. A duração da bateria WLAN dura pouco menos de 5 horas em comparação com as 7 horas noLenovo Legion 7 16ARHA7 ou HP Victus 16.
O carregamento da capacidade vazia à plena leva cerca de 2 horas. O modelo não suporta USB-PD e por isso não pode ser recarregado via USB-C.
| Dell G16 7620 i7-12700H, GeForce RTX 3060 Laptop GPU, 84 Wh | Lenovo Legion 7 16ARHA7 R9 6900HX, Radeon RX 6850M XT, 99 Wh | HP Victus 16-e0145ng R5 5600H, GeForce RTX 3050 Ti Laptop GPU, 70 Wh | Asus ROG Zephyrus M16 GU603H i9-11900H, GeForce RTX 3070 Laptop GPU, 90 Wh | Lenovo Legion 5 Pro 16IAH7H i7-12700H, GeForce RTX 3060 Laptop GPU, 80 Wh | Acer Swift X SFX16-51G-5388 i5-11320H, GeForce RTX 3050 4GB Laptop GPU, 58.7 Wh | |
|---|---|---|---|---|---|---|
| Duração da bateria | 57% | 42% | 90% | -21% | 88% | |
| Reader / Idle (h) | 7.1 | 4.9 -31% | 13.3 87% | |||
| WiFi v1.3 (h) | 5 | 7.3 46% | 7.1 42% | 7.7 54% | 3.6 -28% | 8.1 62% |
| Load (h) | 0.7 | 1.8 157% | 1.6 129% | 0.6 -14% | 1.5 114% | |
| H.264 (h) | 4.1 | 8.4 | ||||
| Witcher 3 ultra (h) | 2.1 | |||||
| Gaming (h) | 1.1 |
Pro
Contra
Veredicto - Grande e rápido
O G16 tem muitas semelhanças com algumas das mais recentes Computadores portáteis alienígenas para o melhor ou para o pior. Mais especificamente, o sistema é maior e mais pesado do que muitos concorrentes e funciona até muito mais quente, com temperaturas centrais oscilando em torno de 90 C quando se joga. O G16, portanto, não é a melhor solução para usuários que desejam uma experiência de jogo com laptop fino e leve. Alternativas tais como oLenovo Legion 7 16 ou Asus ROG Zephyrus M16 são mais finos, leves, ou mesmo ambos, enquanto oferecem opções similares de visualização e processador.
O Dell G16 se sobressai quando se trata de desempenho ao custo de uma pegada maior, peso mais pesado e temperaturas centrais mais quentes.
Onde o sistema Dell se esforça para compensar o seu desempenho. O sistema é mais rápido do que a maioria dos outros laptops com exatamente a mesma CPU e GPU como resultado direto de seu perfil mais grosso e temperaturas mais quentes. Mesmo assim, a vida média da bateria, a falta de suporte SSD secundário, a câmara web pobre e o tijolo de energia inconvenientemente grande significam que ainda há muito espaço para melhorias.
Preço e Disponibilidade
O Dell G16 7620 é agora enviado através de Best Buy em nossa configuração atual por $1600 USD. Ainda não está na Amazônia a partir desta redação. Mais SKUs podem ser encomendadas diretamente da Dell variando de $1140 a $1935.
Dell G16 7620
- 10/18/2022 v7 (old)
Allen Ngo
Price comparison

