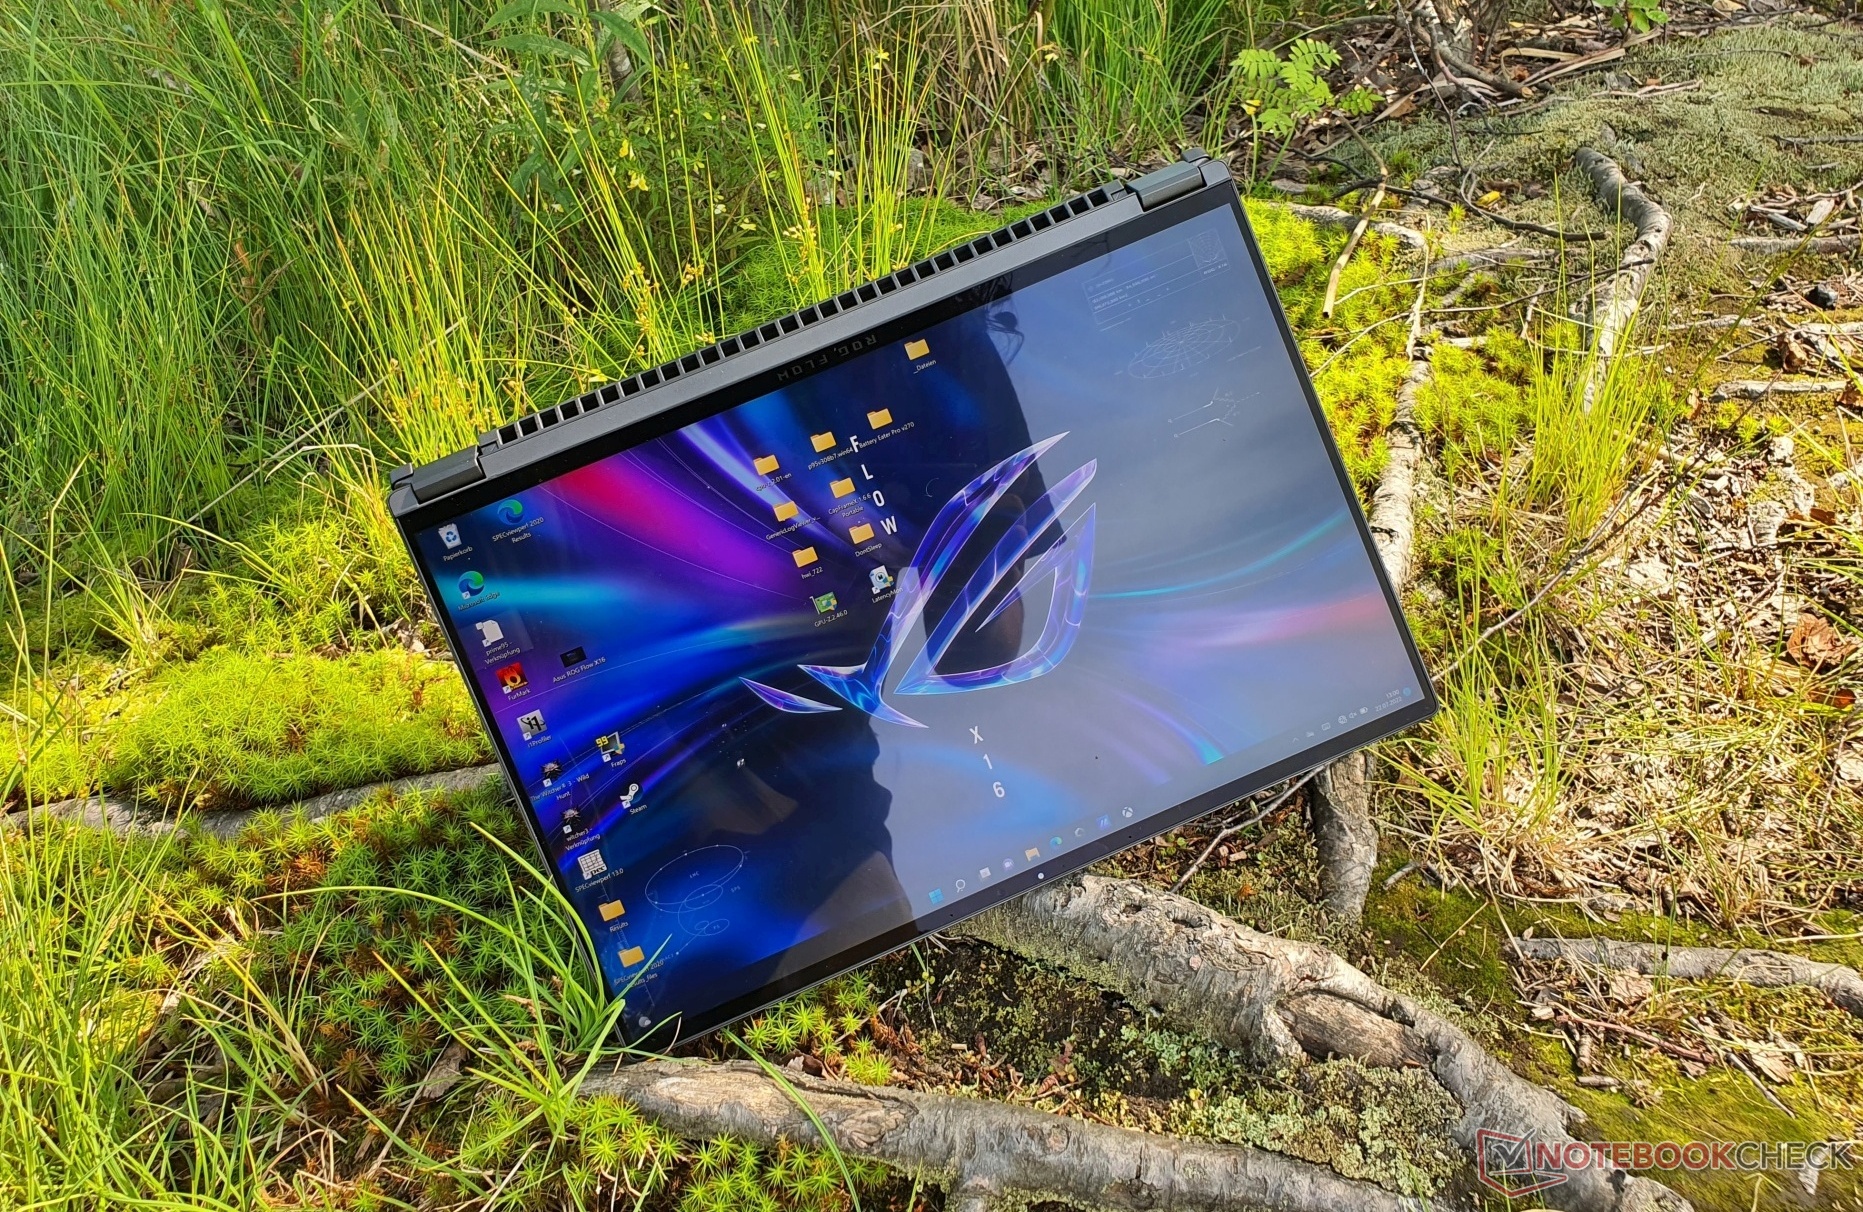
Revisão do laptop Asus ROG Flow X16: jogador 2-em-1 com mini-LED
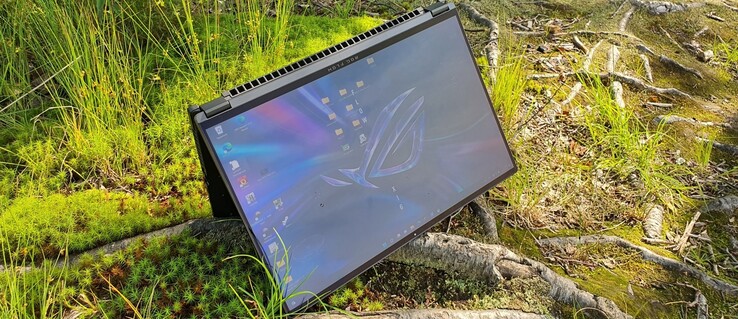
Um display de 1.100 mini-LED nit-strong faz sua estréia no Asus ROG Flow X16, que também deriva sua singularidade de seu design conversível. Um RTX 3070 Ti com um TGP de 125 watts faz dele um verdadeiro caderno de jogos com recursos multimídia de alta qualidade, muito aguardado por muitos
.Conseguimos examinar minuciosamente um dispositivo de amostra de pré-produção em detalhes. Como este modelo de revisão é representativo do modelo de produção (de acordo com a Asus), tomamos a liberdade de dar-lhe uma classificação. São esperadas pequenas mudanças no dispositivo até a versão final de produção, que serão refletidas adequadamente nas atualizações desta revisão. Também estamos revendo a doca gráfica ROG XG Mobile (disponível separadamente) com seu GeForce RTX 3080 Laptop GPU no fluxo X16 (um teste semelhante também foi realizado com o ROG Flow X13 no ano passado), e forneceremos os resultados como uma atualização nesta revisão em breve
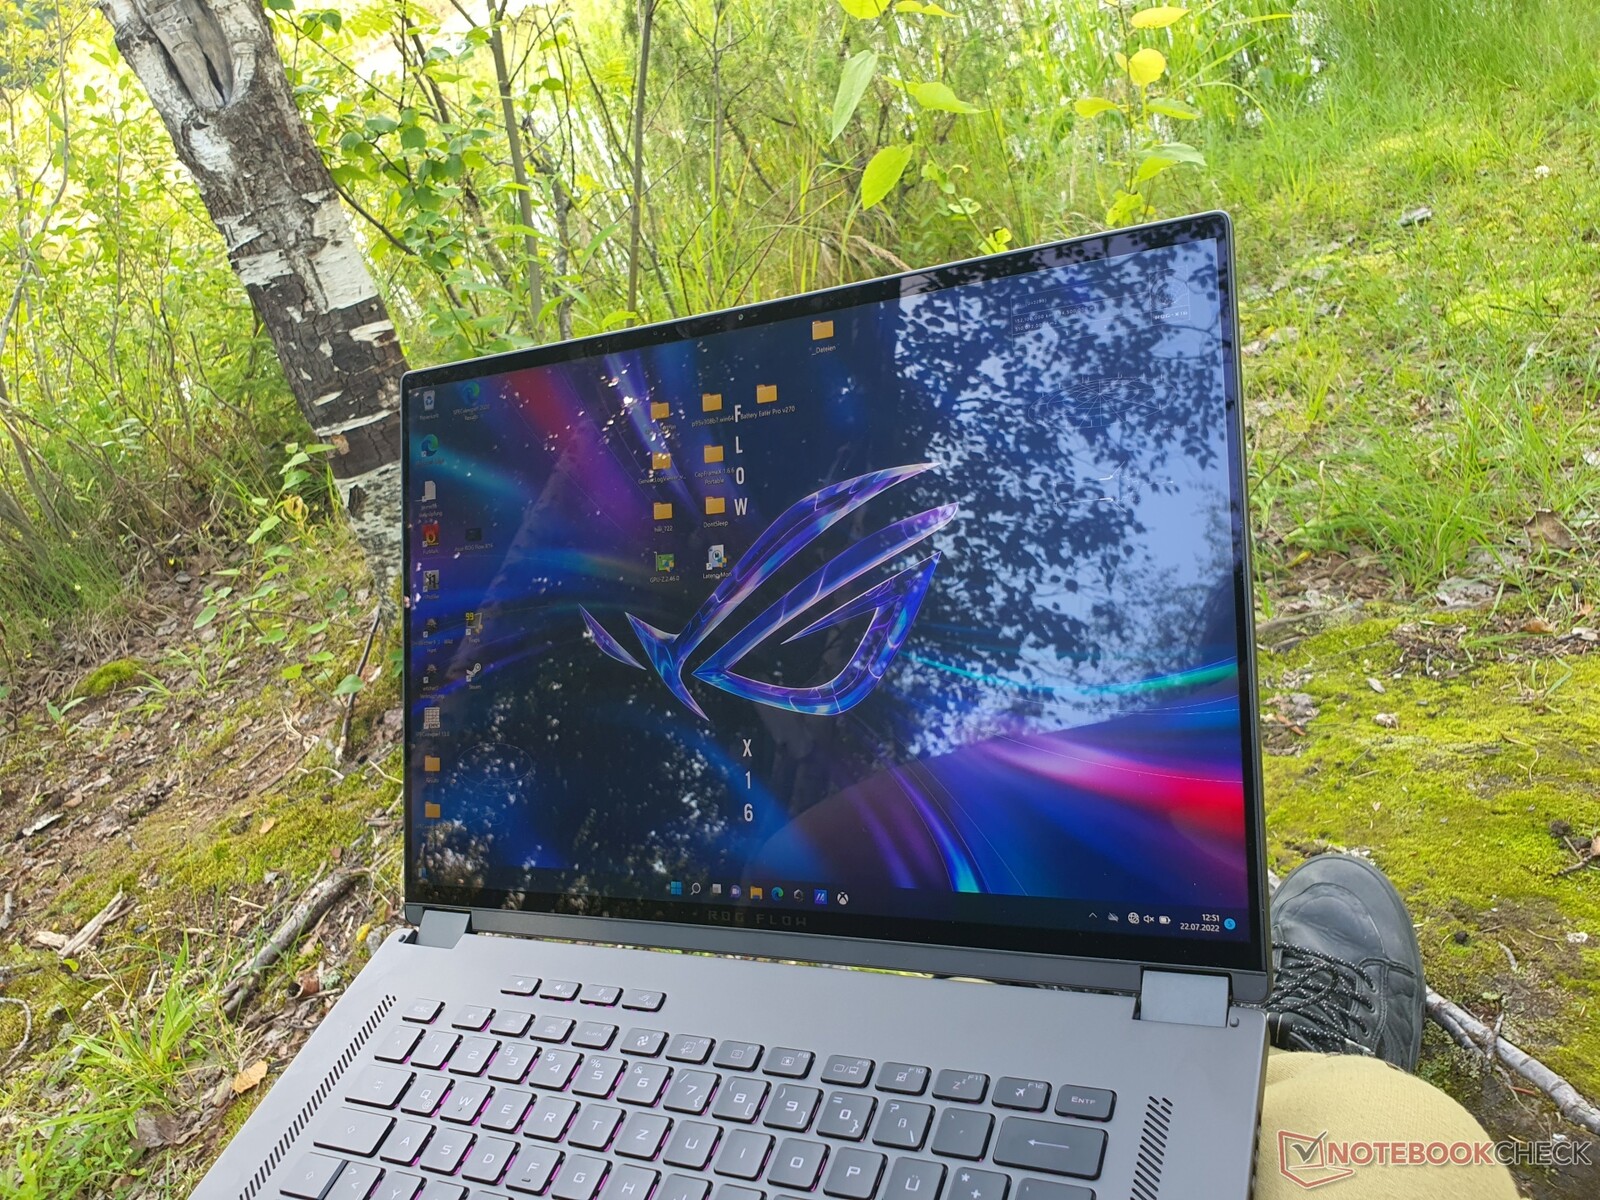
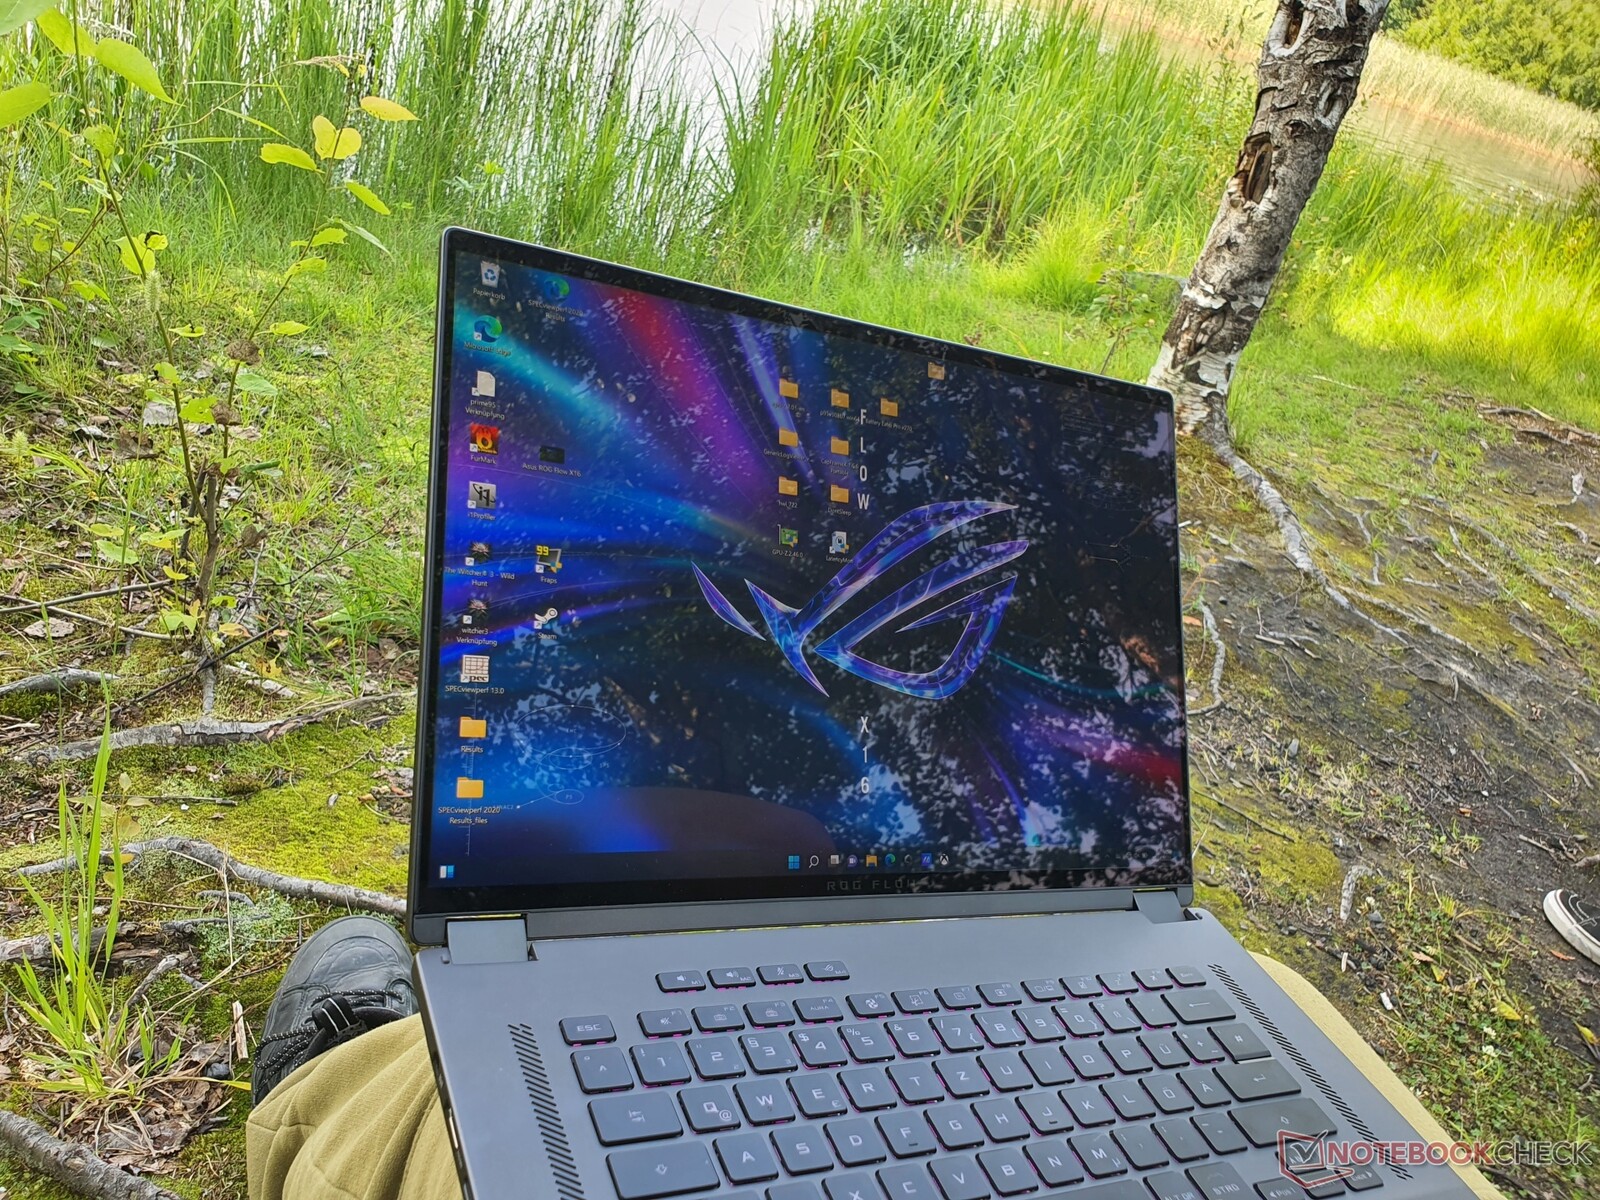
.O Asus ROG Flow X16 forma a série de laptops para jogos 2 em 1 da Asus juntamente com seu popular e quase como um irmão único, oFluxo ROG X13do ano passado, bem como o Fluxo ROG Z13 (2 em 1 comprimidos)o display QHD de 16 polegadas no formato 16:10 oferece um nível de preto semelhante ao OLED graças ao mini-LED e também anuncia a cobertura de espaço em cores DCI-P3 para edição profissional de imagens. A tela sensível ao toque com suporte para entrada de caneta é concebivelmente útil para o trabalho criativo, e AMD's Ryzen 6900HS também promete um grande potencial. Enquanto todas estas especificações são lidas maravilhosamente no papel, nossa revisão revela até que ponto este poder bruto pode ser plenamente utilizado no Asus conversível compacto e quais podem ser os eventuais inconvenientes
Nosso modelo de amostra do Asus Rog Flow X16 com um Nvidia GeForce RTX 3070 Ti, 32 GB de RAM e um SSD de 1 TB ainda não parece estar amplamente disponível. Dependendo de sua localização, configurações idênticas (ou seja, hardware idêntico com um layout de teclado específico da região) ou ligeiramente diferentes podem estar disponíveis a preços variáveis, geralmente a partir de US$2500,00. Consulte "Preço e Disponibilidade" no final desta análise para obter mais detalhes.
Os concorrentes diretos para os exclusivos jogos compactos de 16 polegadas conversíveis estão longe e poucos no meio. No entanto, o Asus Rog Flow X16 foi projetado principalmente para tarefas criativas, multimídia e jogos, por isso o comparamos com os seguintes cadernos: Gigabyte Aero 16, MSI Stealth GS66, Lenovo Legion 5 Pro, Lenovo ThinkPad X1 Extreme, MacBook Pro 16 (2021), Microsoft's Surface Laptop Studio, Dell's compact XPS 17 e Asus' in-house Zephyrus M16.
Este último é semelhante ao ROG X16 Flow de muitas maneiras, que apontamos em vários pontos de nossa revisão. A comparação com o menor ROG Flow X13 é certamente interessante, assim como a comparação com os tradicionais e espessos gigantes de jogos como Asus' ROG Strix Scar 15. O HP Spectre 16 conversível com um Intel Core i7-12700H, gráficos de arco médio e uma tela sensível ao toque 3K OLED estará disponível por volta do final de agosto e também pode ser de interesse para um grupo alvo não interessado principalmente em jogos. A Lenovo's Legion Slim 7i também utilizará o mini-LED.
Possíveis concorrentes em comparação
Avaliação | Data | Modelo | Peso | Altura | Size | Resolução | Preço |
|---|---|---|---|---|---|---|---|
| 89.5 % v7 (old) | 08/2022 | Asus ROG Flow X16 GV601RW-M5082W R9 6900HS, GeForce RTX 3070 Ti Laptop GPU | 2.1 kg | 19.4 mm | 16.10" | 2560x1600 | |
| 85.6 % v7 (old) | 07/2021 | Asus ROG Zephyrus M16 GU603H i9-11900H, GeForce RTX 3070 Laptop GPU | 2 kg | 20 mm | 16.00" | 2560x1600 | |
| 86.3 % v7 (old) | 06/2022 | Asus ROG Strix Scar 15 G533ZW-LN106WS i9-12900H, GeForce RTX 3070 Ti Laptop GPU | 2.3 kg | 27.2 mm | 15.60" | 2560x1440 | |
| 84.7 % v7 (old) | 03/2022 | Gigabyte Aero 16 YE5 i9-12900HK, GeForce RTX 3080 Ti Laptop GPU | 2.3 kg | 22.4 mm | 16.00" | 3840x2400 | |
| 88 % v7 (old) | 03/2022 | Lenovo Legion 5 Pro 16 G7 i7 RTX 3070Ti i7-12700H, GeForce RTX 3070 Ti Laptop GPU | 2.6 kg | 26.6 mm | 16.00" | 2560x1600 | |
| 84.5 % v7 (old) | 02/2022 | MSI Stealth GS66 12UGS i7-12700H, GeForce RTX 3070 Ti Laptop GPU | 2.2 kg | 19.8 mm | 15.60" | 2560x1440 | |
| 93.2 % v7 (old) | 11/2021 | Apple MacBook Pro 16 2021 M1 Pro M1 Pro, M1 Pro 16-Core GPU | 2.2 kg | 16.8 mm | 16.20" | 3456x2234 | |
| 88.3 % v7 (old) | 12/2021 | Lenovo ThinkPad X1 Extreme G4-20Y50040GE i9-11950H, GeForce RTX 3080 Laptop GPU | 1.9 kg | 18.2 mm | 16.00" | 3840x2400 | |
| 88.8 % v7 (old) | 06/2022 | Dell XPS 17 9720 RTX 3060 i7-12700H, GeForce RTX 3060 Laptop GPU | 2.5 kg | 19.5 mm | 17.00" | 3840x2400 | |
| 89 % v7 (old) | 03/2022 | Microsoft Surface Laptop Studio i7 RTX 3050 Ti i7-11370H, GeForce RTX 3050 Ti Laptop GPU | 1.8 kg | 19 mm | 14.40" | 2400x1600 | |
| 84.7 % v7 (old) | 02/2021 | Asus ROG Flow X13 GV301QH R9 5980HS, GeForce GTX 1650 Max-Q | 1.4 kg | 15.8 mm | 13.40" | 3840x2400 |
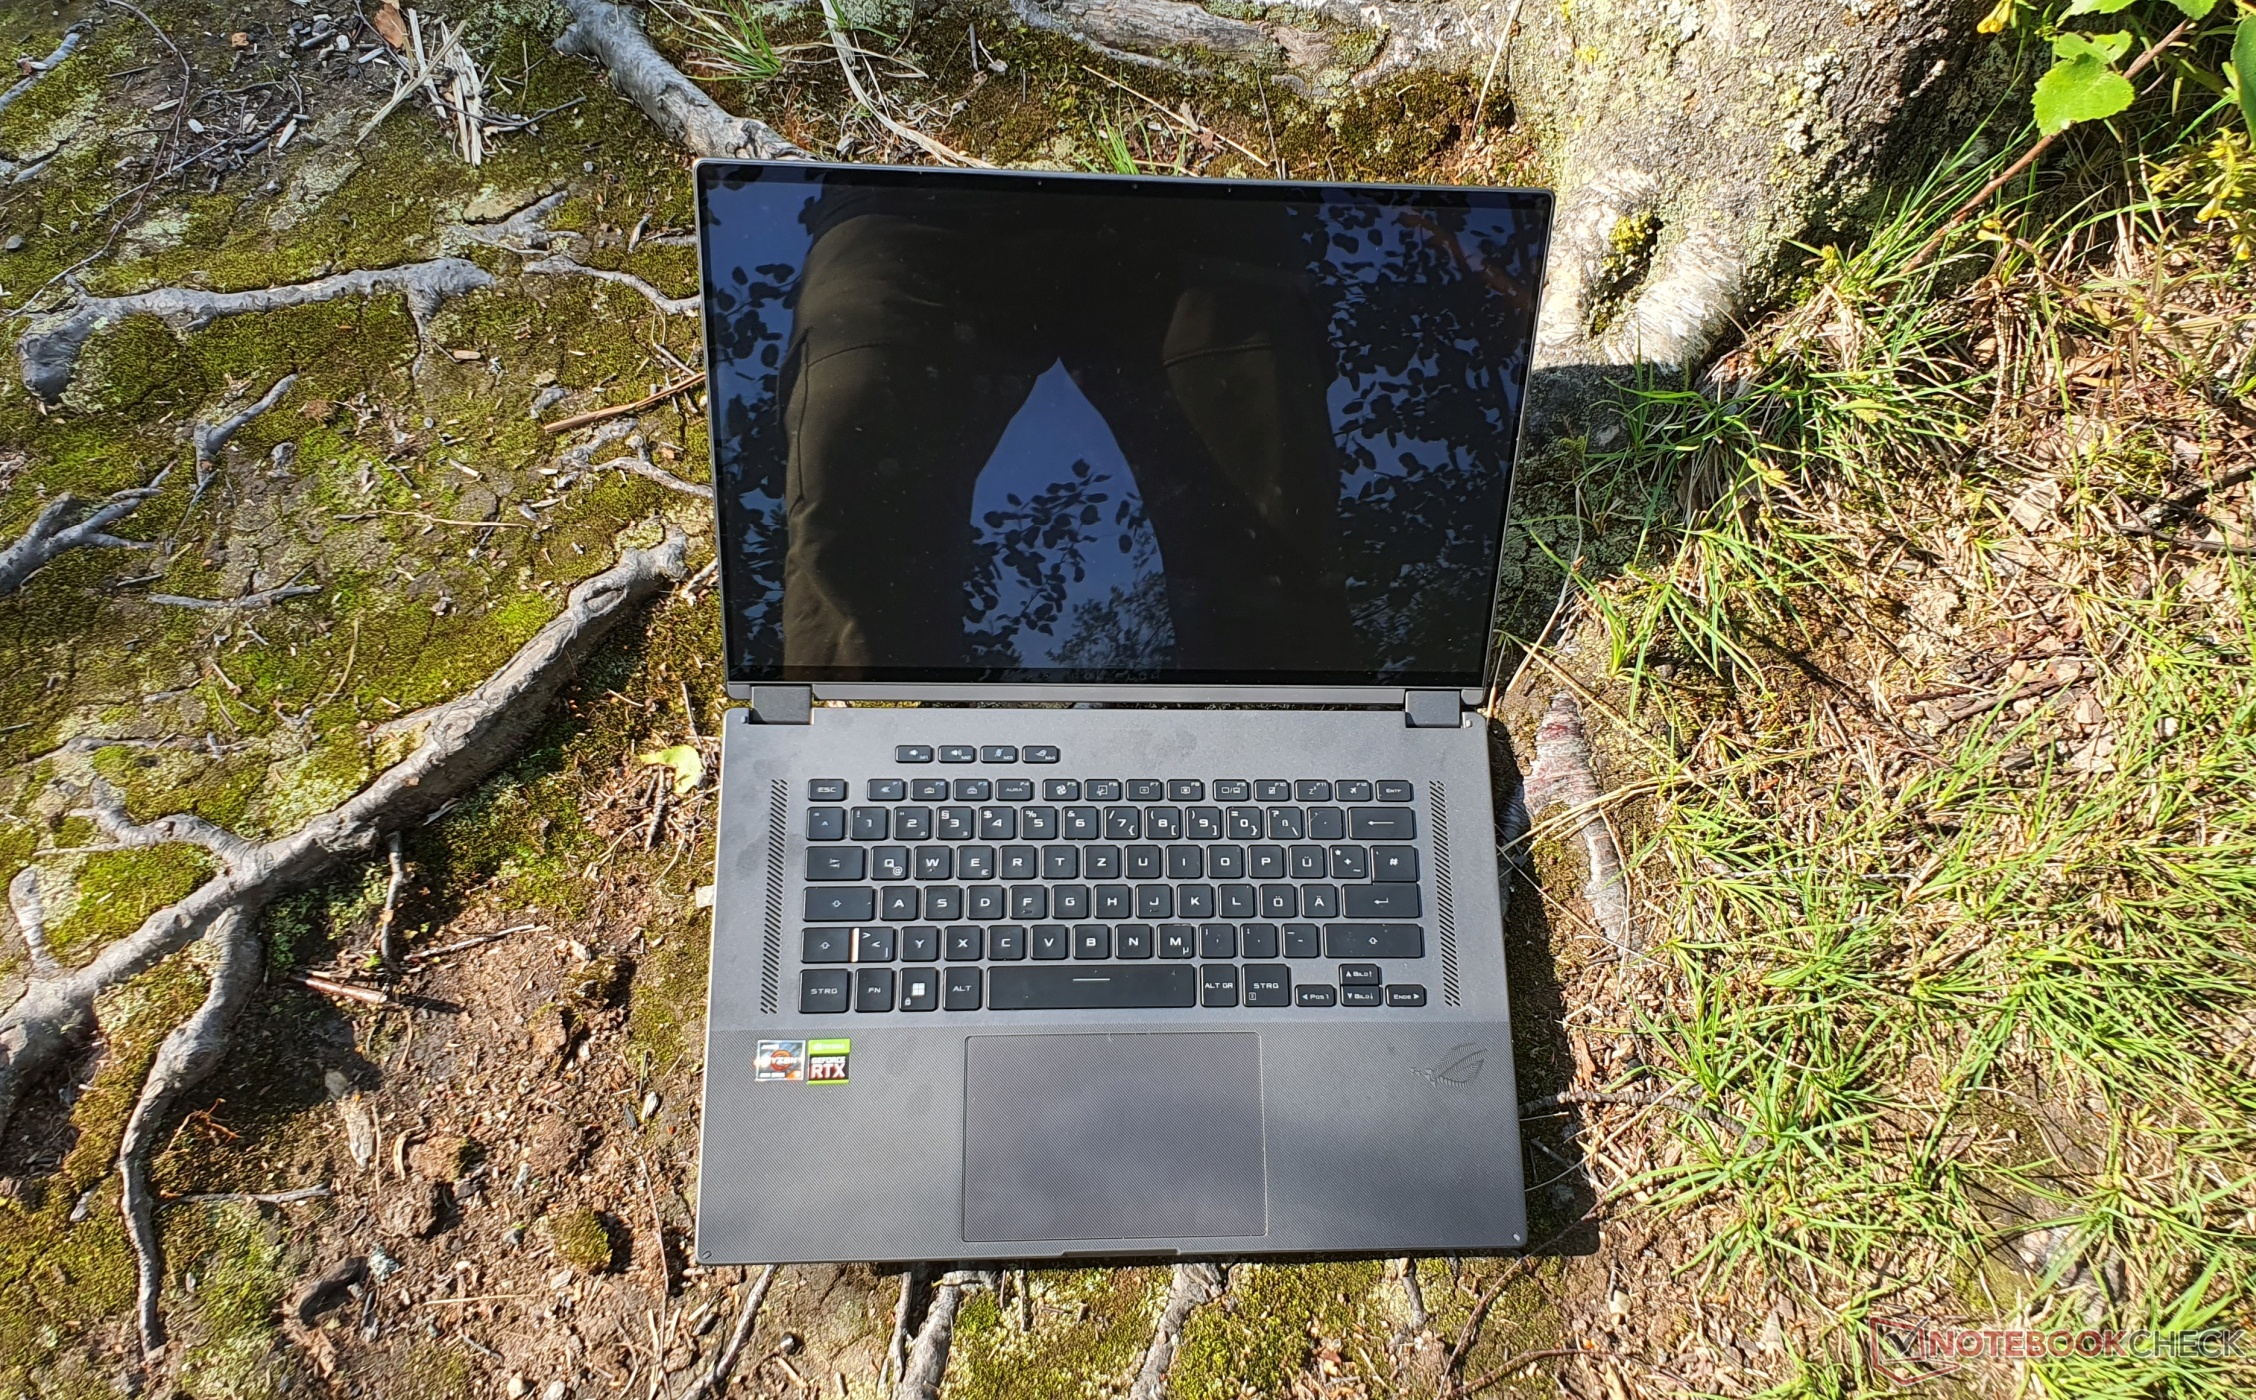
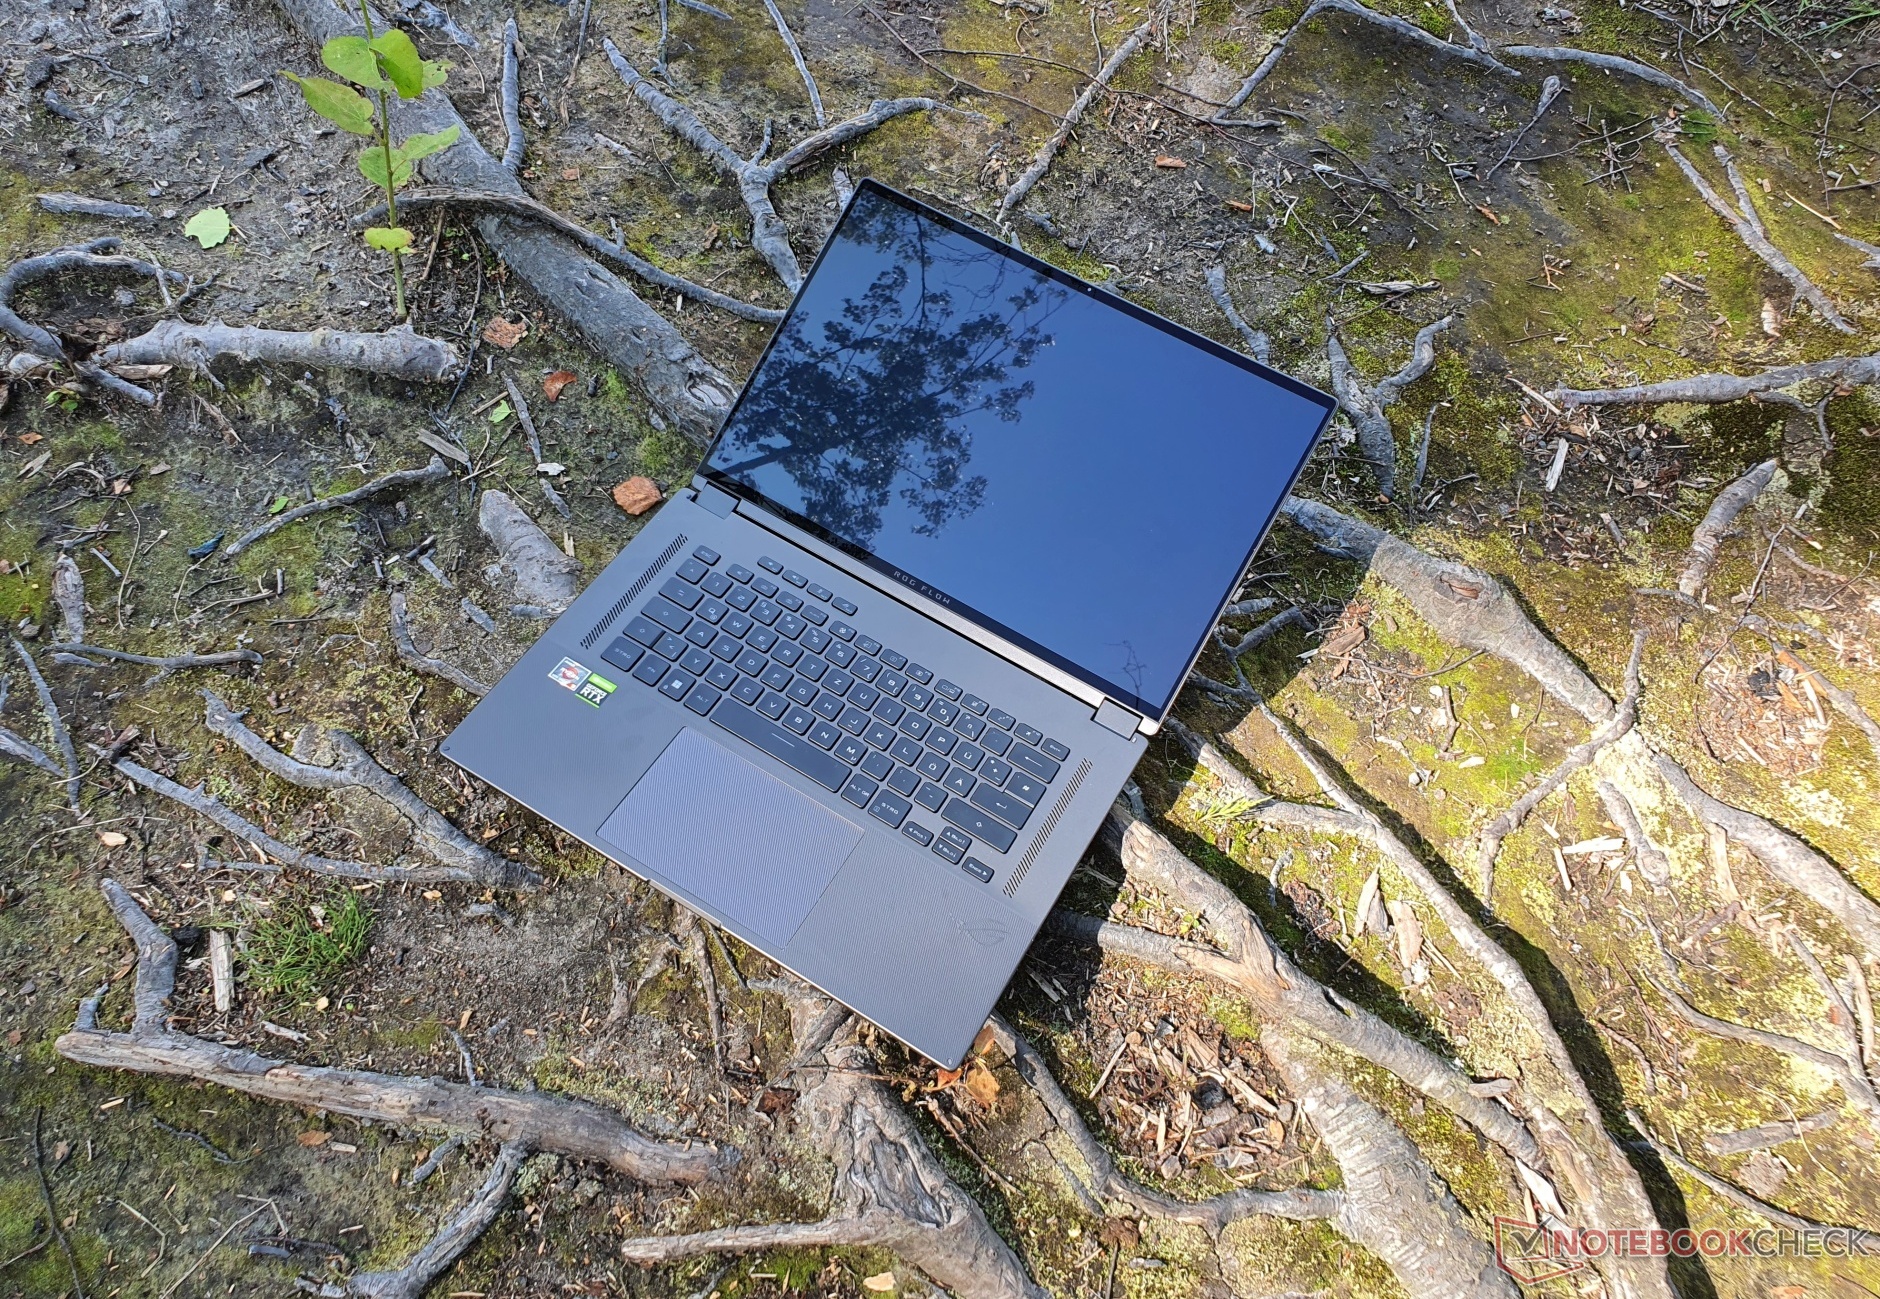
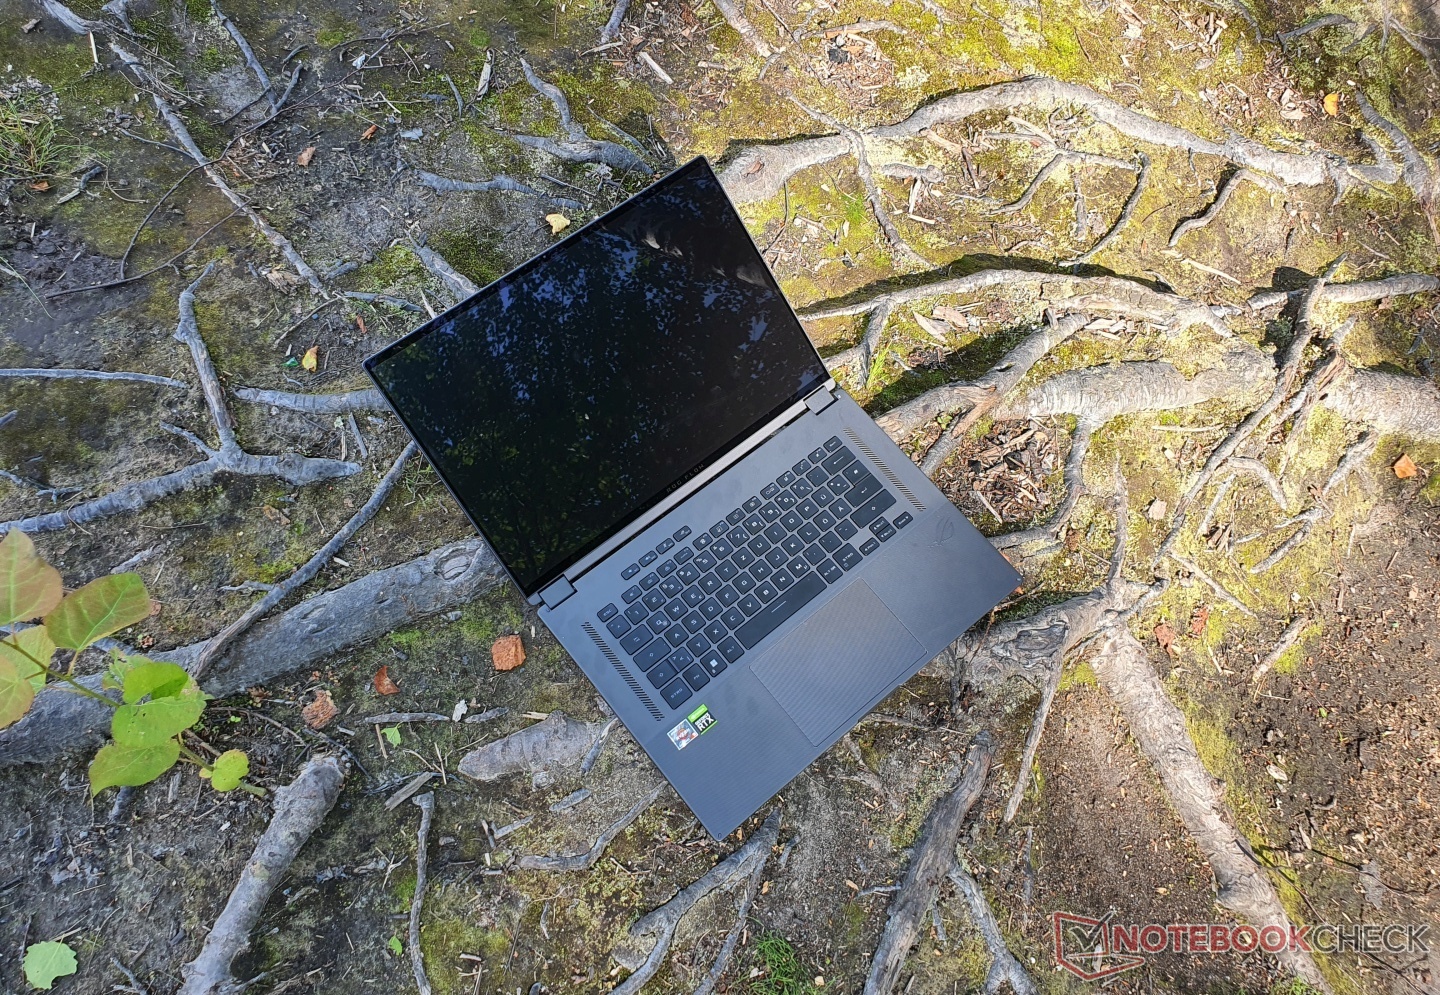
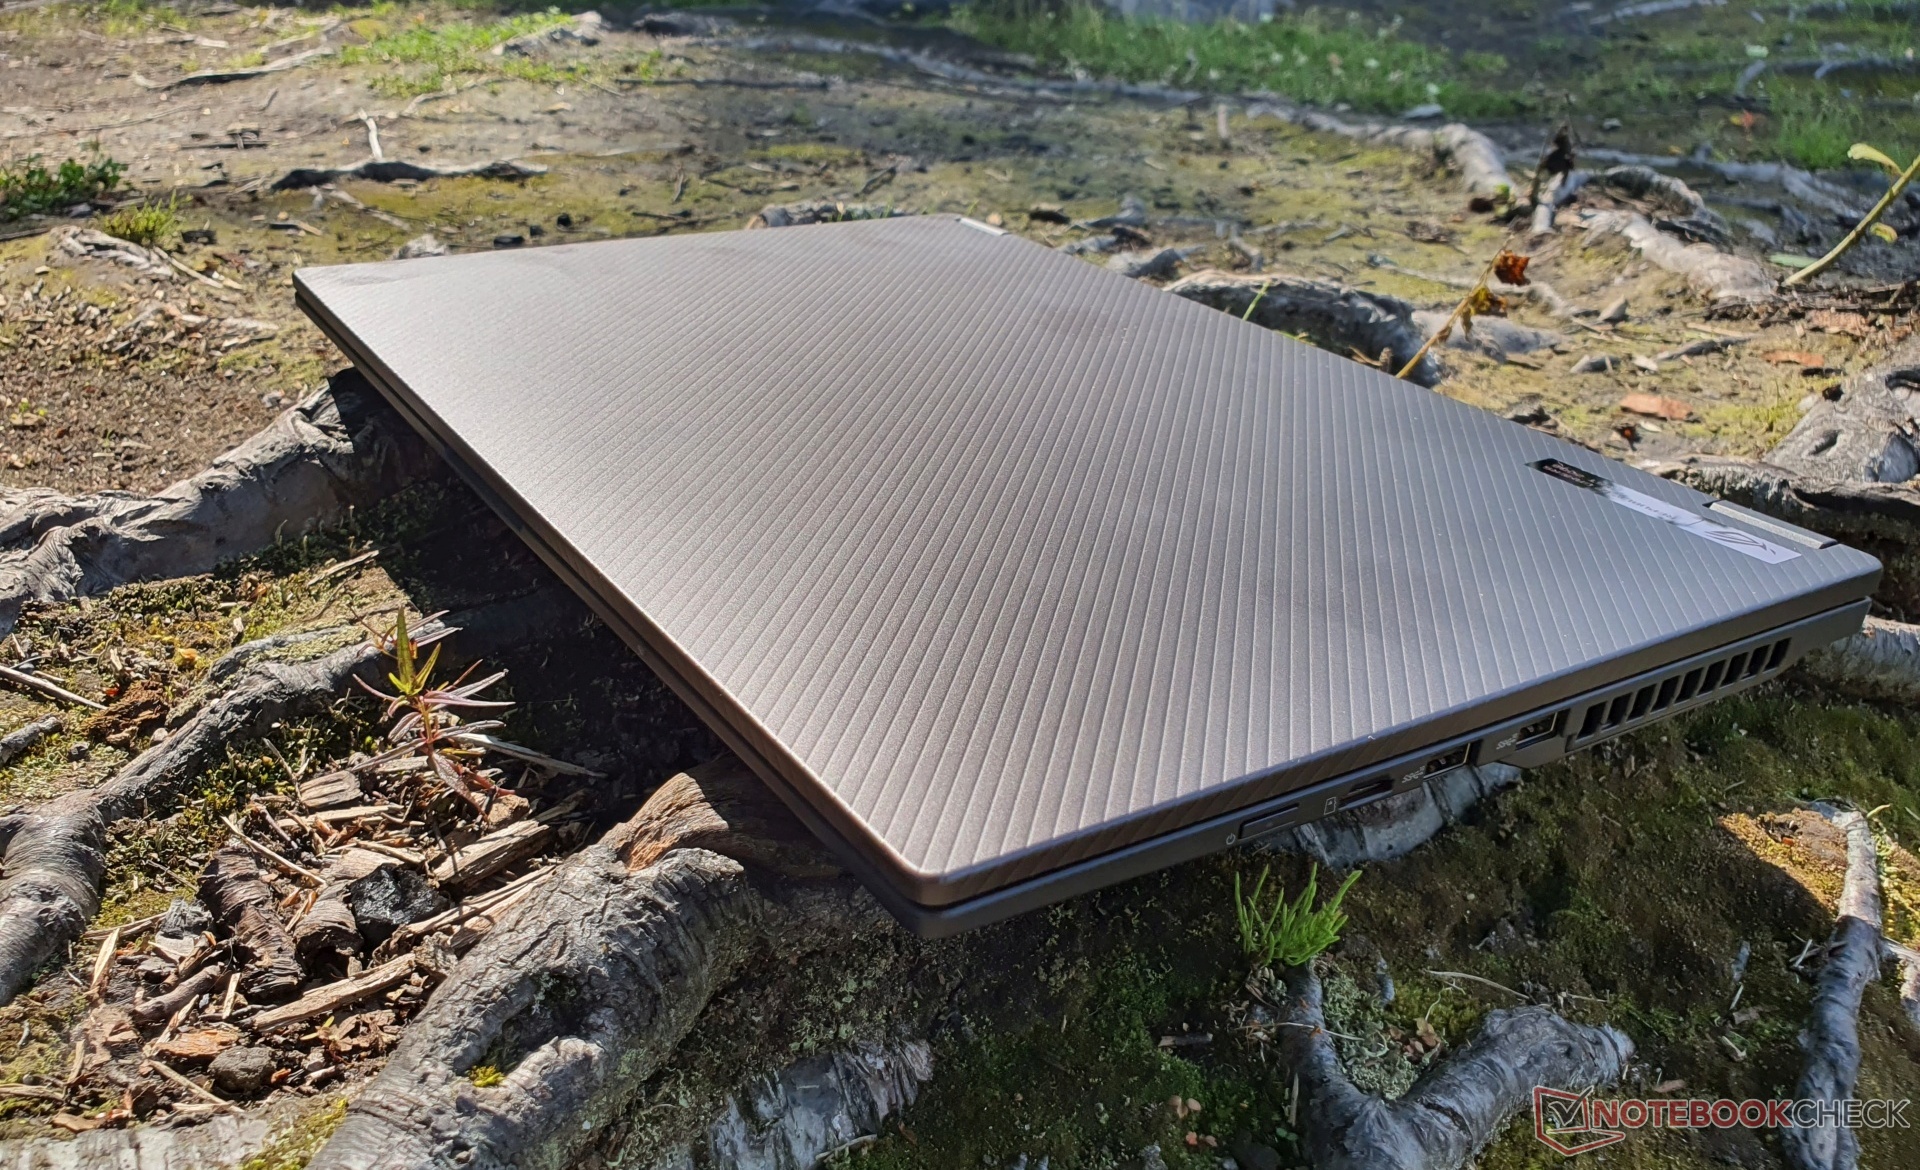
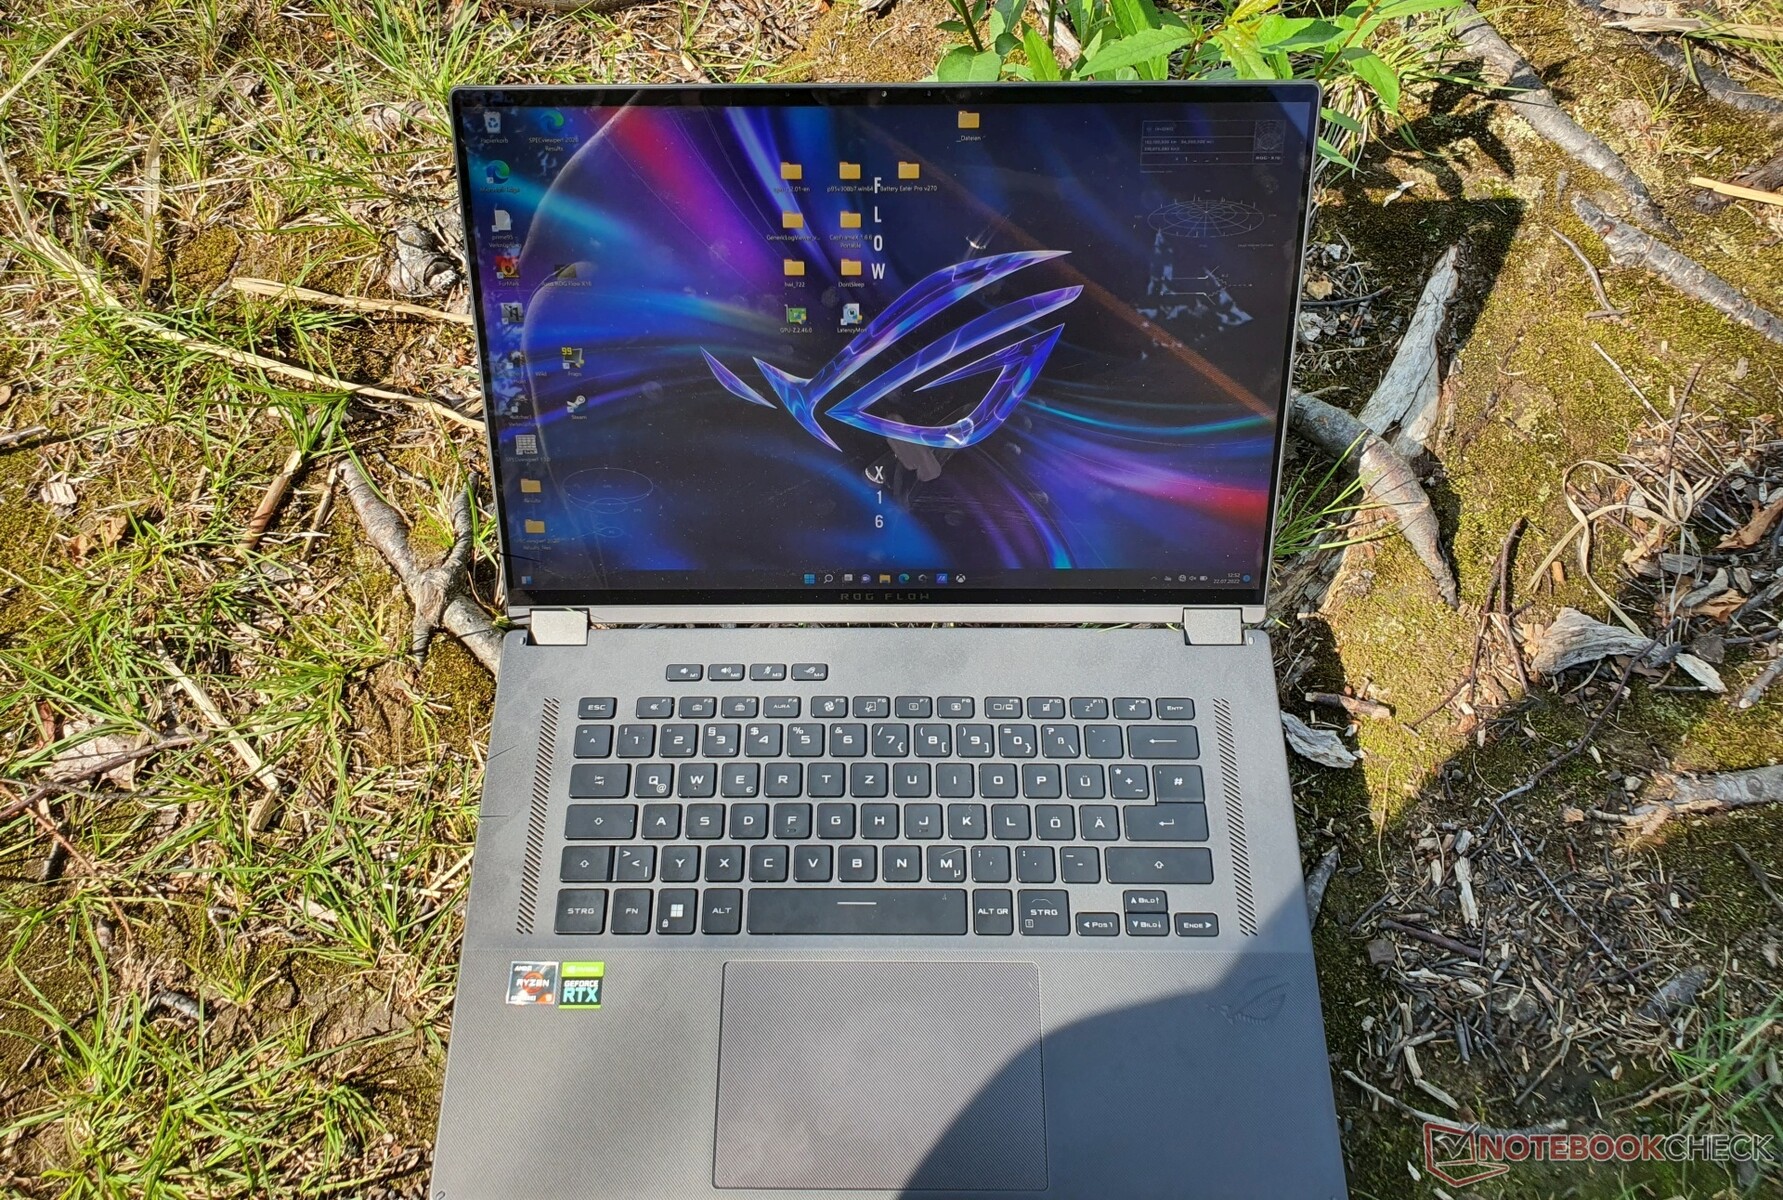
Case - Laptop de jogos estável da Asus
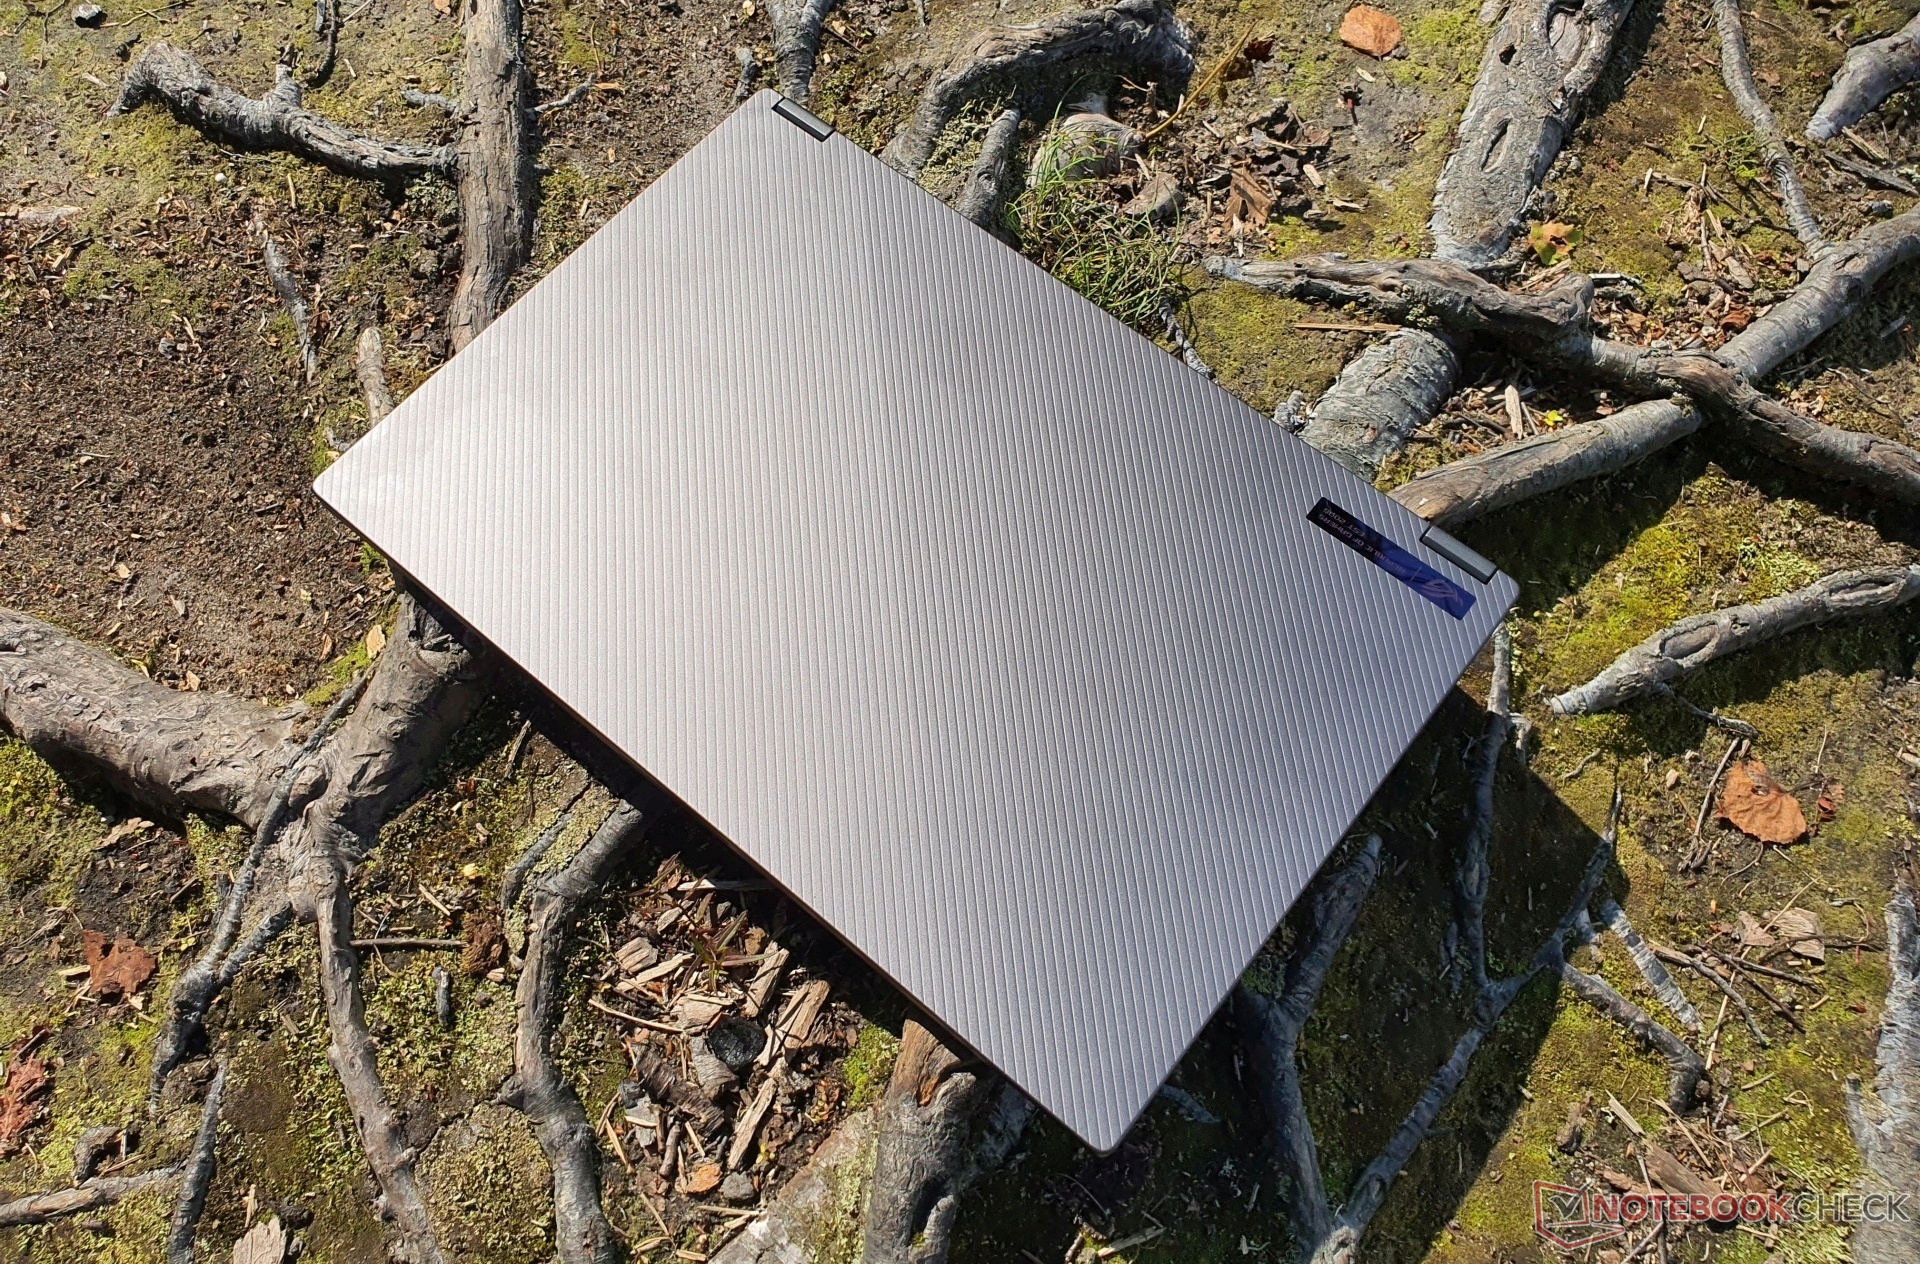
Em princípio, o ROG Flow X16 é uma mistura do menorFluxo X13 e o Zephyrus M16: A canelura característica na tampa de plástico cinza-ferro da primeira foi replicada, assim como a forma geral e a silhueta, que são apenas em tamanho maior. A unidade base, incluindo a placa base, assemelha-se ao Zephyrus M16.
O Asus usa muito magnésio, de modo que o dispositivo parece de alta qualidade em geral. Entretanto, a tampa e a placa de base são feitas de plástico macio e são especialmente suscetíveis a arranhões. Isto reduz um pouco nossa impressão inicial positiva.
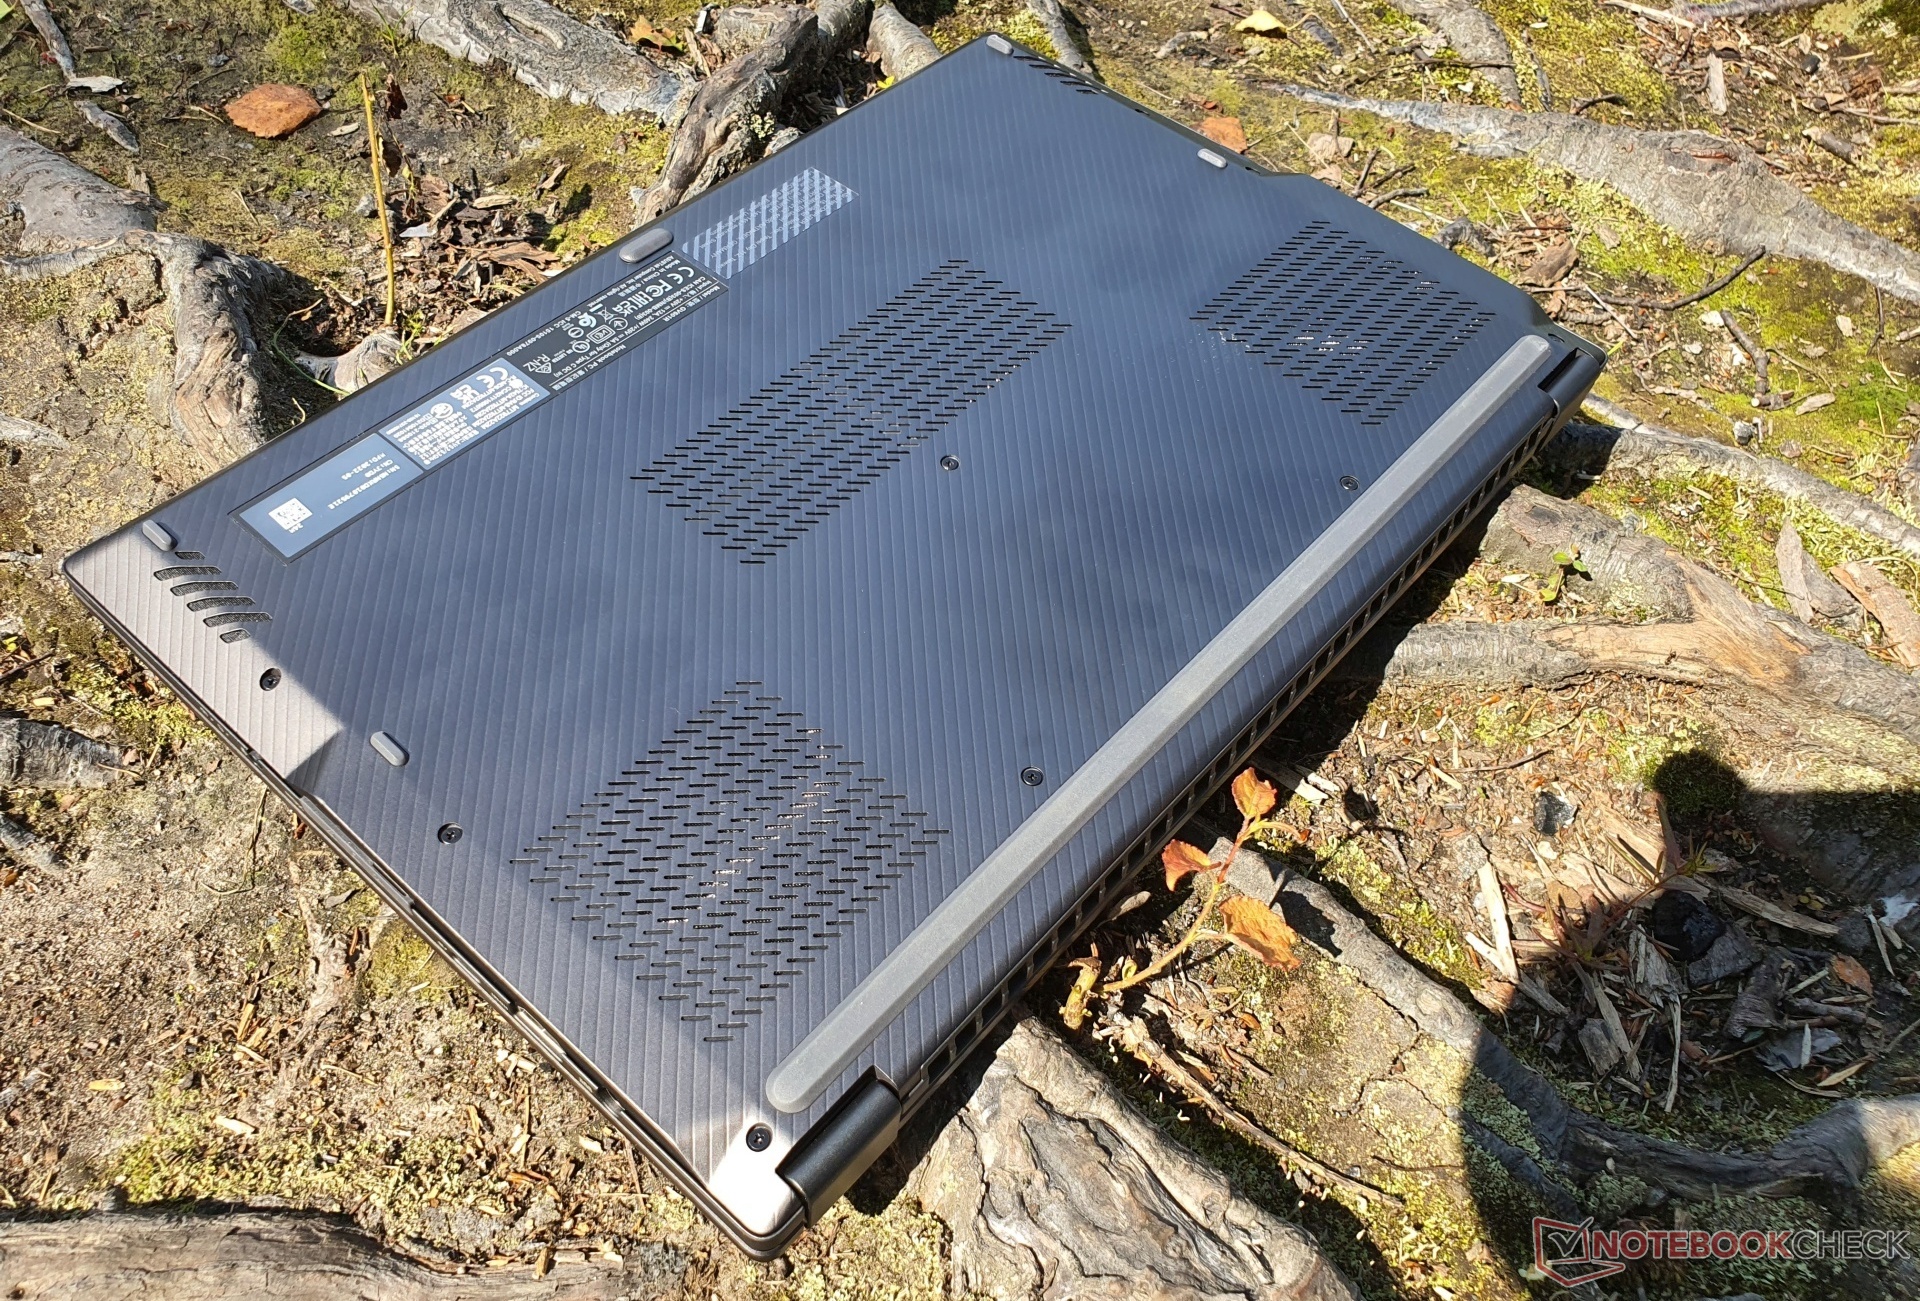
A pressão direcionada na parte de trás do visor não causa distorções na imagem e a placa de base é mantida no lugar por 13 parafusos. Quando separada da unidade, no entanto, a placa de base acaba se tornando uma peça flexível de plástico.
O acabamento está em um nível alto, a unidade base não pode ser torcida e o visor também deixa pouco espaço para torção. Felizmente, as superfícies ligeiramente ásperas são muito boas. A remendação da tampa também é replicada de forma exclusivamente óptica no apoio da palma, incluindo o touchpad. As impressões digitais são imediatamente visíveis, mas não se espera que a versão final do Flow X16 adote o padrão corrugado, em vez disso, usando um revestimento especial para manter as impressões digitais à distância.
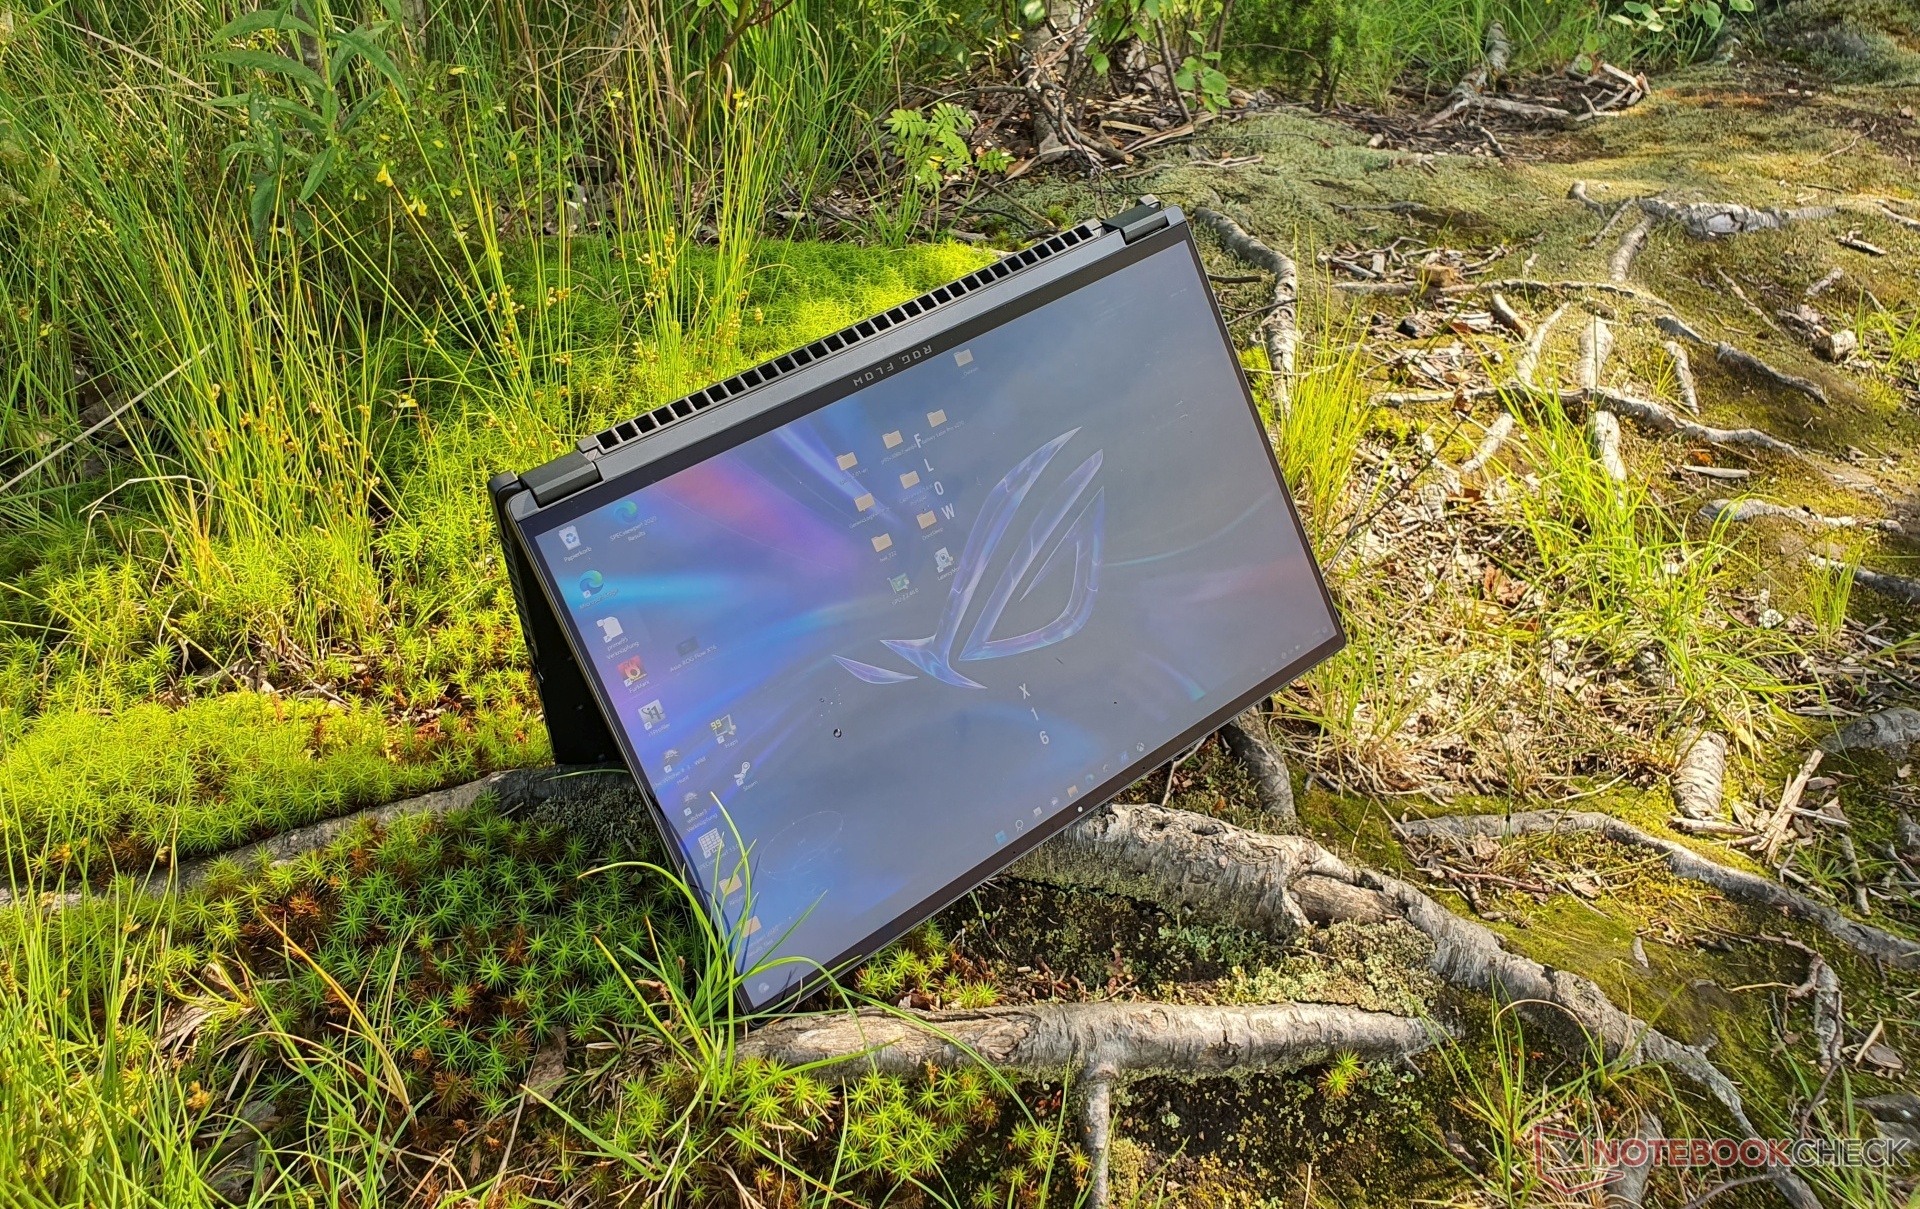
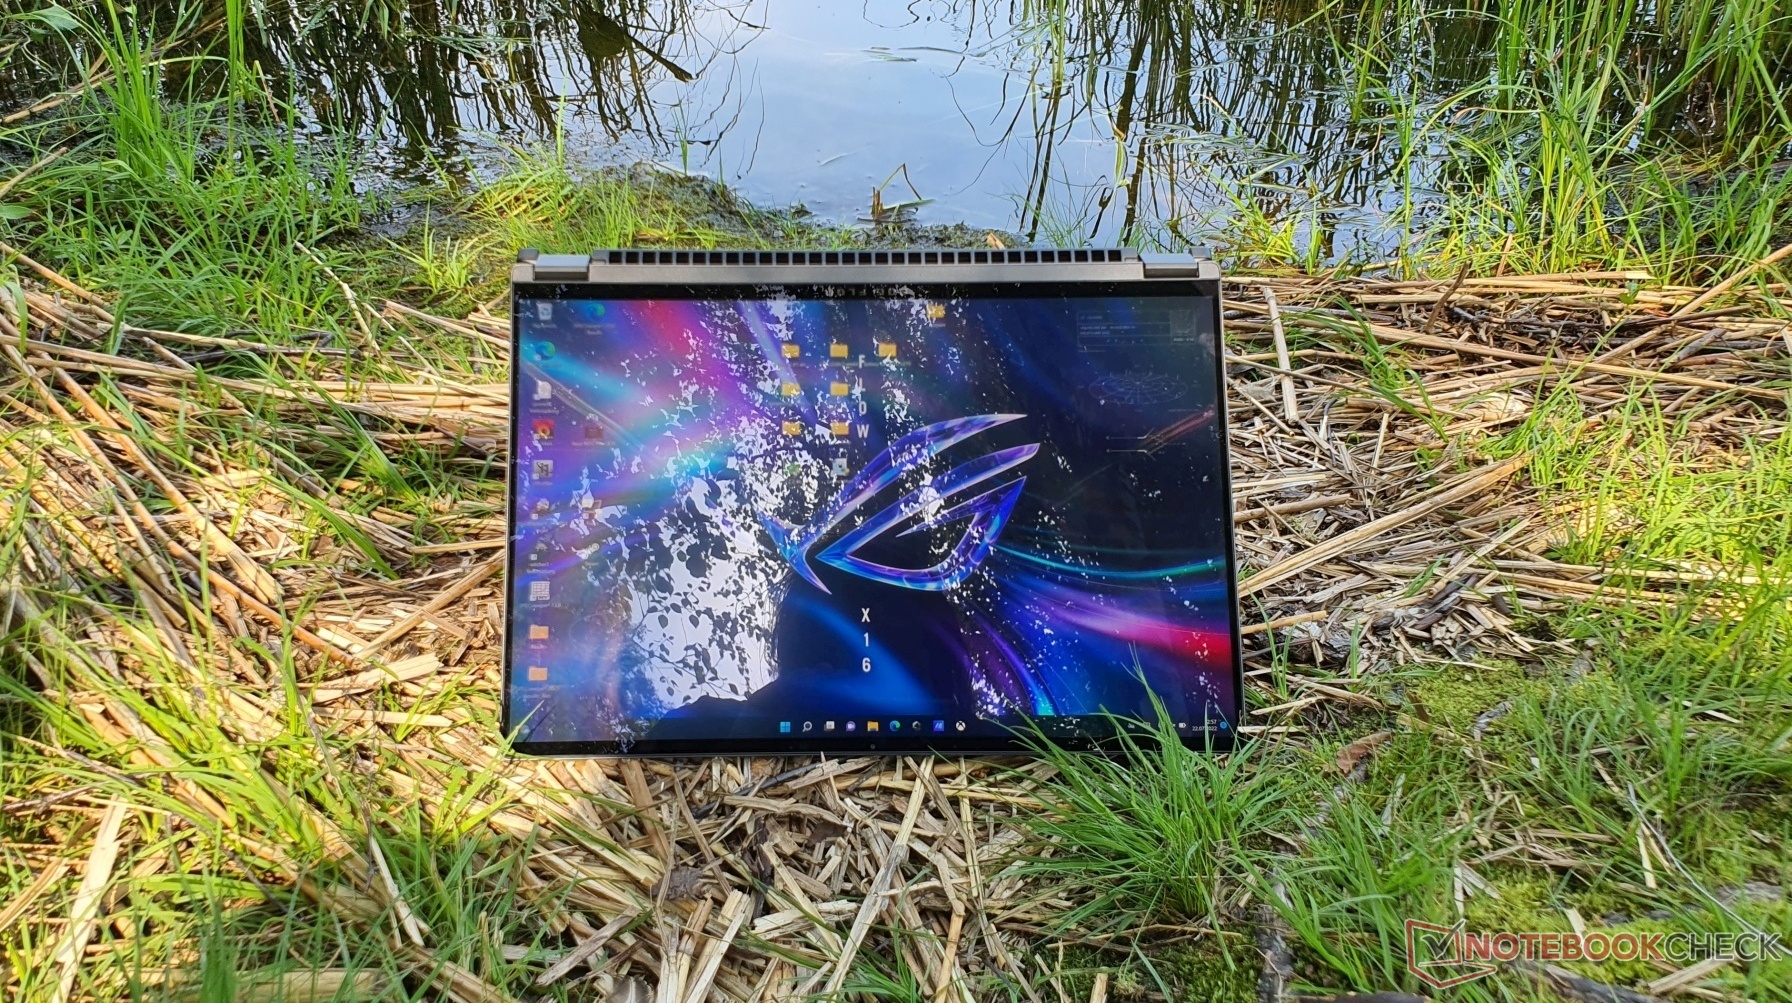
As duas dobradiças do conversível permitem uma rotação de 360° do visor e o mantêm firmemente na posição. O fato de que a exibição de um bobs conversível um pouco nem sempre pode ser completamente evitada. Em geral, foi alcançado um bom equilíbrio entre suavidade e estabilidade. O ROG Flow X16 também pode ser aberto com uma mão. Pequenos espaçadores protegem a unidade base no modo tablet e tenda.


Com o ROG Flow X16, a Asus consegue criar um laptop com as menores dimensões entre os laptops de 16 polegadas, superando até mesmo cerca de 15 polegadas em nosso campo de comparação, embora oGigabyte Aero 16 e o MSI Stealth GS66já são modelos muito compactos. Os de 14,4 polegadas Estúdio de Laptops de Superfície é obviamente mais compacto, mas também não é um verdadeiro jogador.
Apenas oThinkPad X1 Extremeé superior em termos de peso entre os dispositivos com uma GPU potente, mas seus 80 W de TGP exigem uma solução de resfriamento menos elaborada. Asus".Zephyrus M16está aproximadamente no mesmo nível devido ao caso semelhante.
Equipamentos - A série Asus' Flow oferece eGPU especial
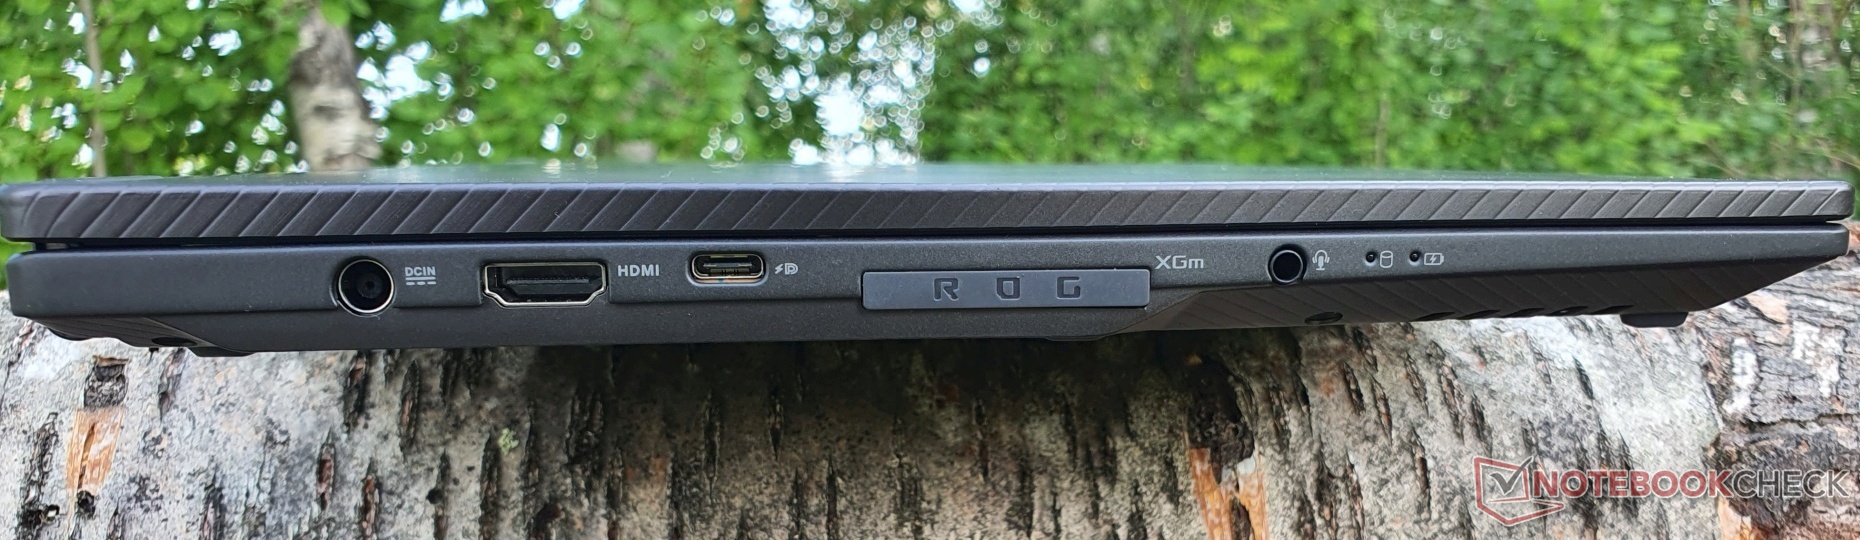
O Asus ROG Flow X16 oferece quatro portas USB 3.2 Gen2, duas das quais são Tipo A, enquanto as outras duas são Tipo C e ambas suportam DisplayPort e Power Delivery até 100 watts. A DisplayPort da porta USB-C na porta xGM é conectada à GPU dedicada Nvidia, enquanto a outra porta USB-C é conectada à GPU Radeon, assim como a porta HDMI 2.0b, que suporta G-Sync. No final do ano, a Asus pode fornecer uma atualização de software para USB 4.0.
Um leitor de cartão SD só está disponível na versão micro e uma porta LAN está ausente. A série ROG Flow apresenta a porta xGM para uma doca gráfica opcional (eGPU) que acomoda um GeForce RTX 3080 (GPU para laptop). Esta é a única opção para a doca até agora, é mais compacta que as eGPUs convencionais e está conectada ao dobro da largura de banda (64 GBit/s @PCIe 3.0 8x contra 32 GBit/s @Thunderbolt 3/4).
Naturalmente, os ganhos de desempenho provavelmente serão marginais em nosso modelo com um RTX 3070 Ti móvel integrado, e ainda não está claro se a doca receberá atualizações no futuro. No entanto, mediremos quaisquer diferenças e as comunicaremos em breve. Além disso, o ROG XG Móvel (que analisamos anteriormente) oferece portos adicionais, tais como GBit LAN e um DisplayPort em tamanho real.
Além disso, há também uma tomada de áudio de 3,5 mm, bem como a tomada para a fonte de alimentação de 240 watts. O espaçamento entre as portas é adequado, mas o botão de energia do lado direito fica solto na caixa em nossa versão de pré-lançamento. O leitor de impressões digitais foi omitido.
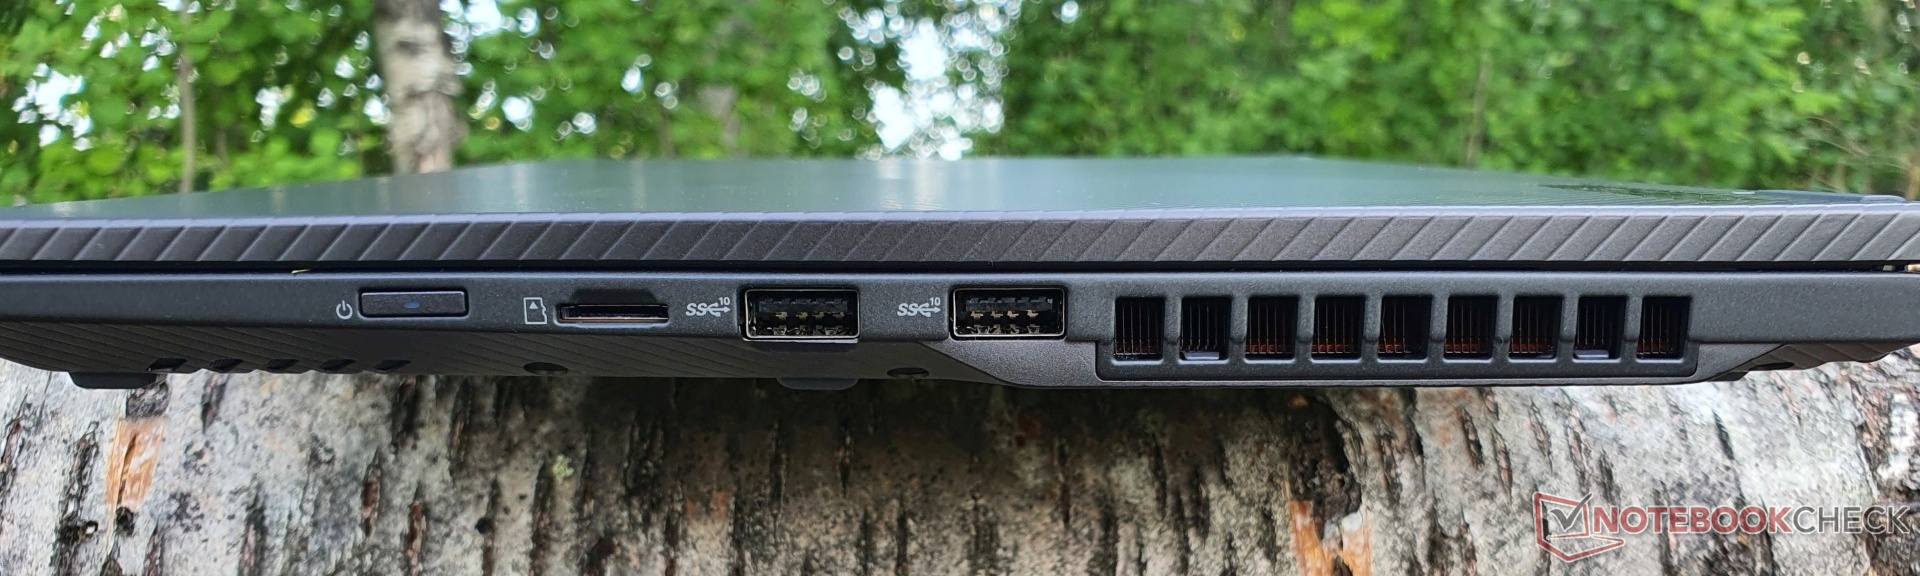
Leitor de cartões SD
O leitor de cartão microSD UHS-II atinge resultados muito bons de 158 MB/s no teste de cópia e ~183 MB/s em leitura sequencial com nosso cartão microSD de referência (AV PRO microSD 128 GB V60). Particularmente no teste de cópia, o ROG Flow X16 está muito à frente da concorrência. Somente o XPS 17 da Dell atinge taxas de cópia mais altas (~205 MB/s).
| SD Card Reader | |
| average JPG Copy Test (av. of 3 runs) | |
| Dell XPS 17 9720 RTX 3060 (Toshiba Exceria Pro SDXC 64 GB UHS-II) | |
| Asus ROG Flow X16 GV601RW-M5082W (AV Pro SD microSD 128 GB V60) | |
| Média da turma Gaming (20.9 - 210, n=54, últimos 2 anos) | |
| Apple MacBook Pro 16 2021 M1 Pro (Angelbird AV Pro V60) | |
| Asus ROG Zephyrus M16 GU603H (AV PRO microSD 128 GB V60) | |
| maximum AS SSD Seq Read Test (1GB) | |
| Dell XPS 17 9720 RTX 3060 (Toshiba Exceria Pro SDXC 64 GB UHS-II) | |
| Asus ROG Zephyrus M16 GU603H (AV PRO microSD 128 GB V60) | |
| Asus ROG Flow X16 GV601RW-M5082W (AV Pro SD microSD 128 GB V60) | |
| Média da turma Gaming (25.5 - 261, n=51, últimos 2 anos) | |
Comunicação
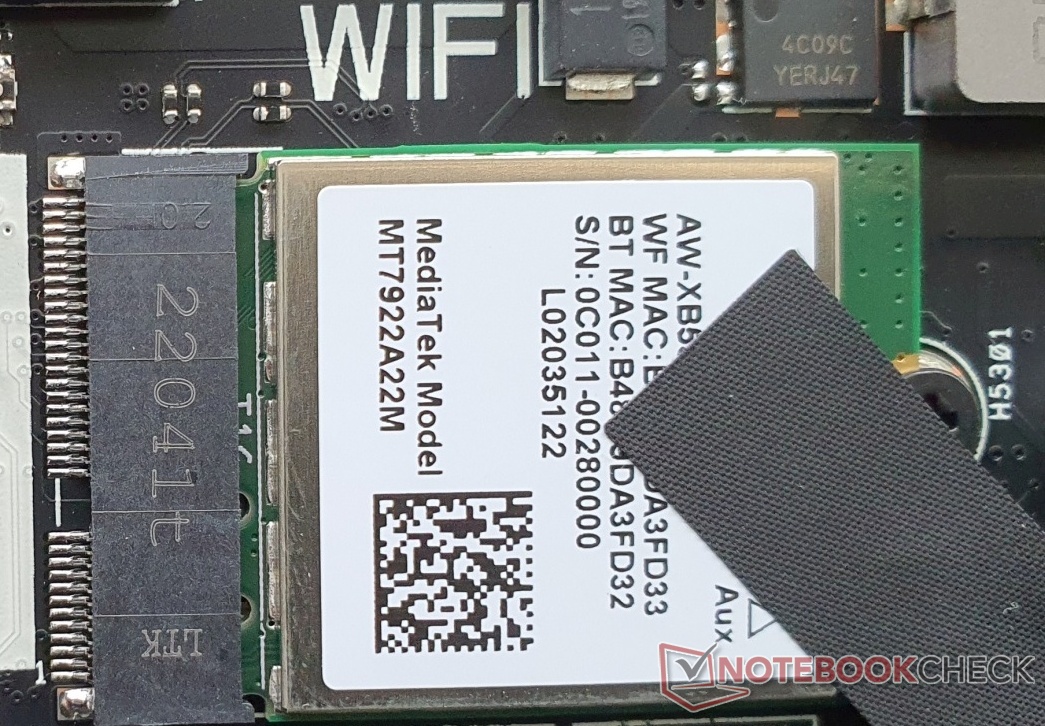
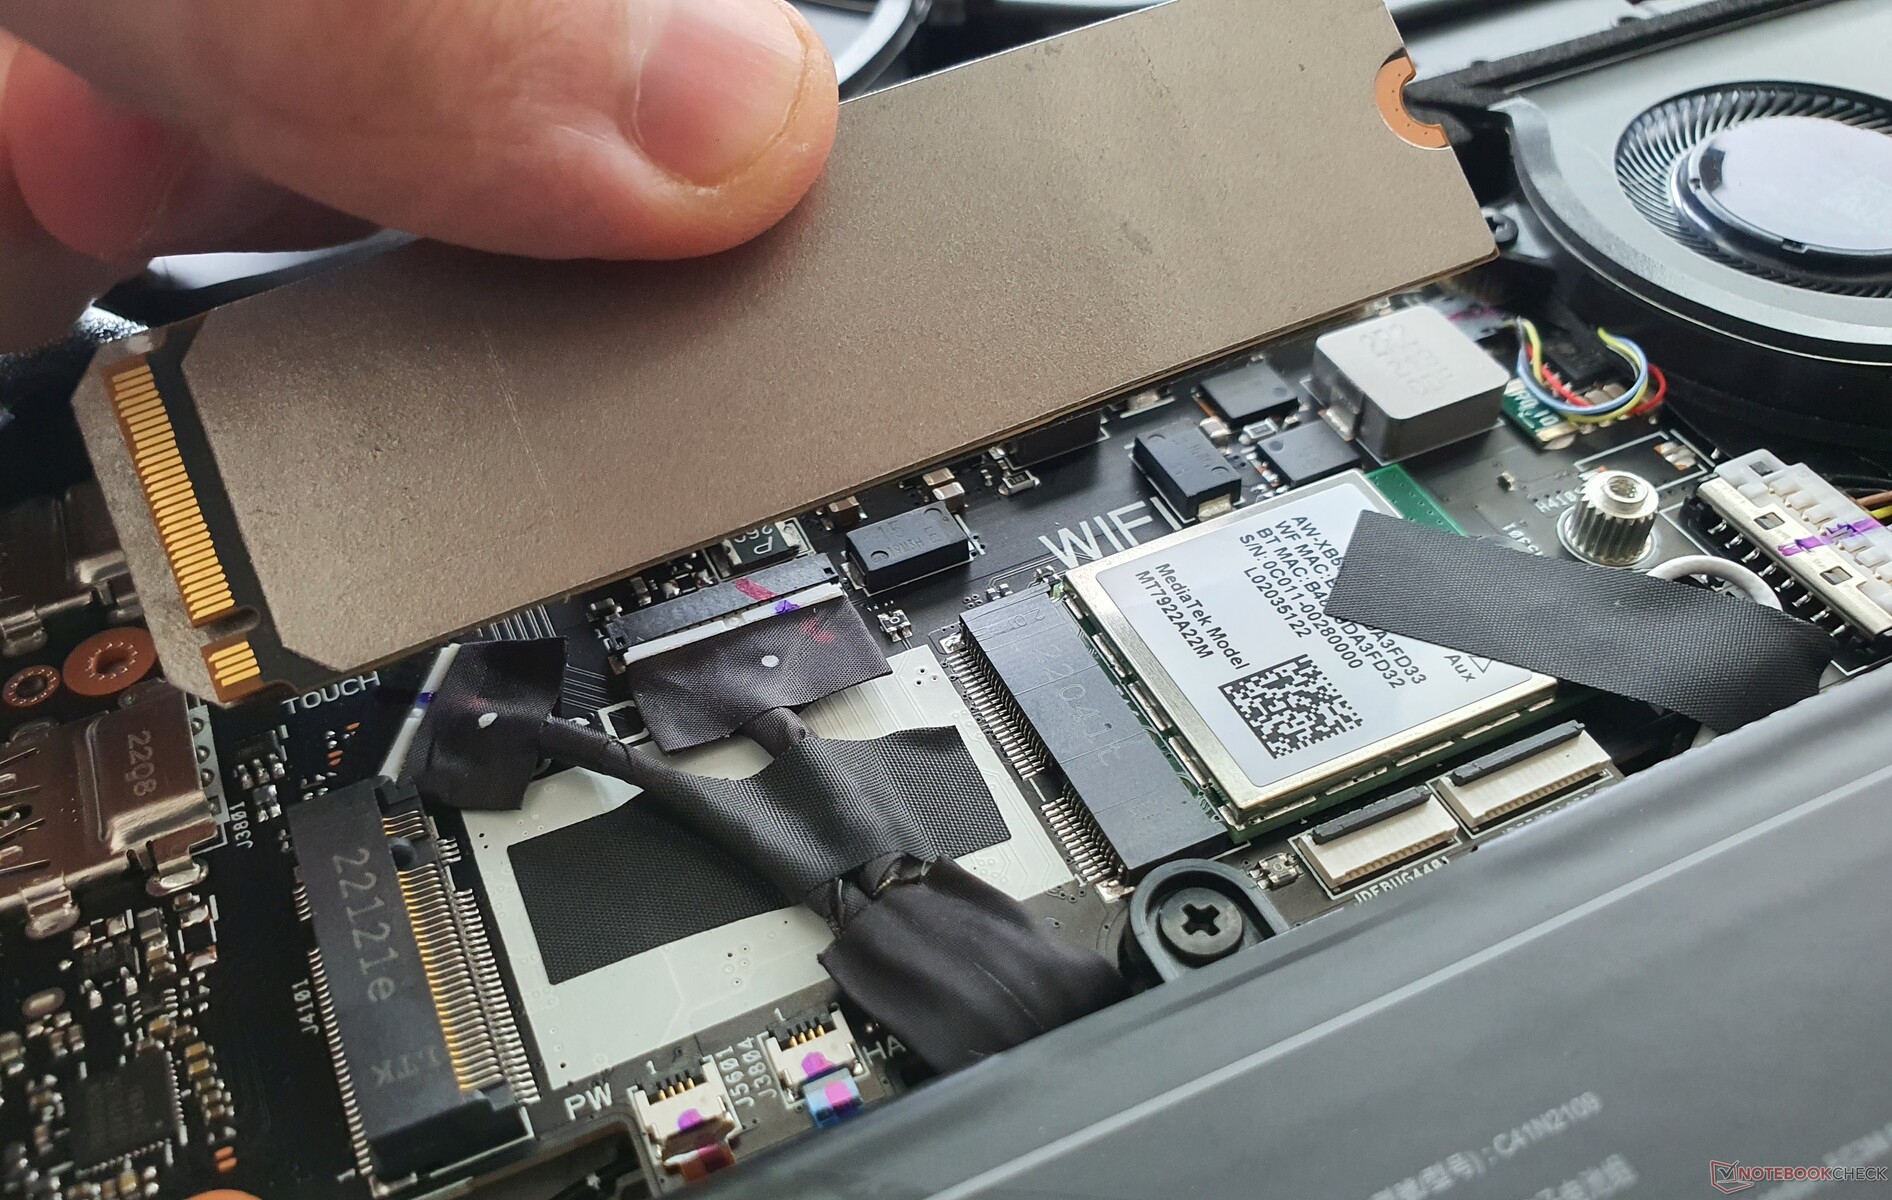
O módulo WiFi 6E instalado vem do MediaTek e oferece velocidades decentes em ambas as direções. O MT7922 é assim duas vezes mais potente que o MT7921 no Zephyrus M16 e o MacBook Pro 16.
Webcam

Uma variante 720p (1280x720) é usada como webcam, mas oferece melhor nitidez e menos distorção do que o normal. Não há obturador mecânico, mas há infravermelho para Windows Olá.


Acessórios
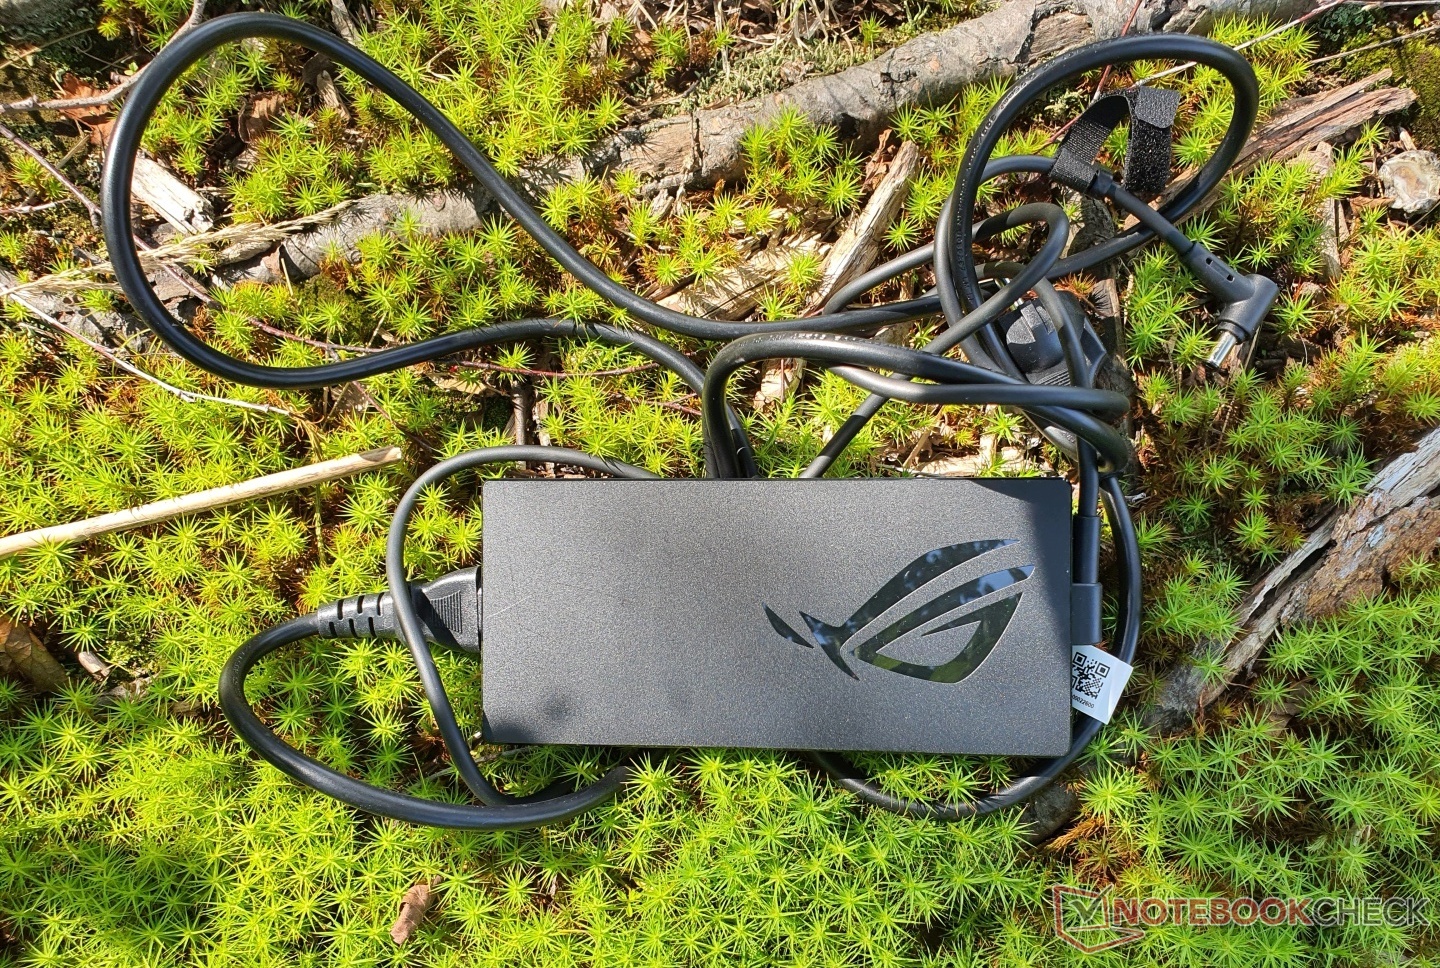
Em nosso pacote de revisão, a Asus fornece um adaptador de energia de 240 watts, bem como a caneta Asus SA201H https://www.asus.com/Accessories/Stylus/All-series/ASUS-PEN-SA201H/para entrada de tela sensível ao toque (incluída no escopo da entrega). Também recebemos uma mochila para laptop ROG BP4071encomendamos a doca gráfica externa e a fonte de alimentação ROG 100 watt USB-C separadamente
Manutenção
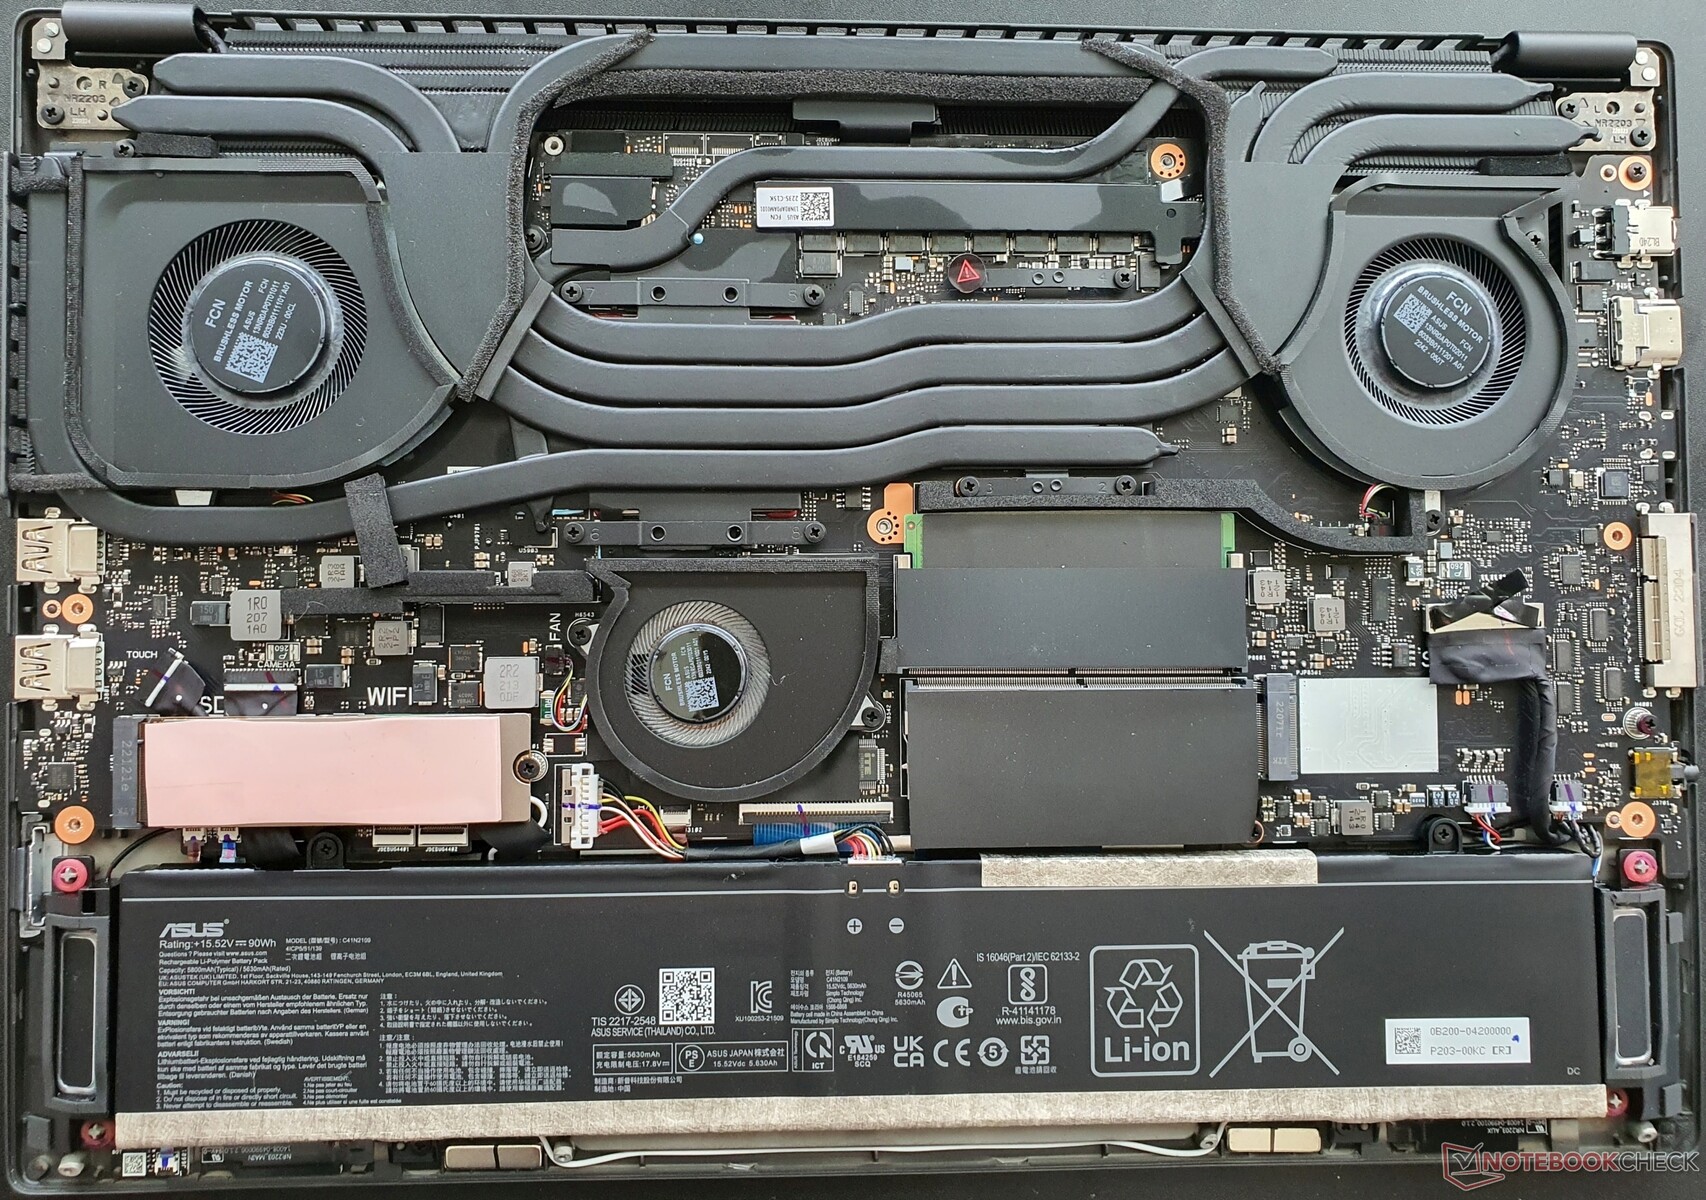
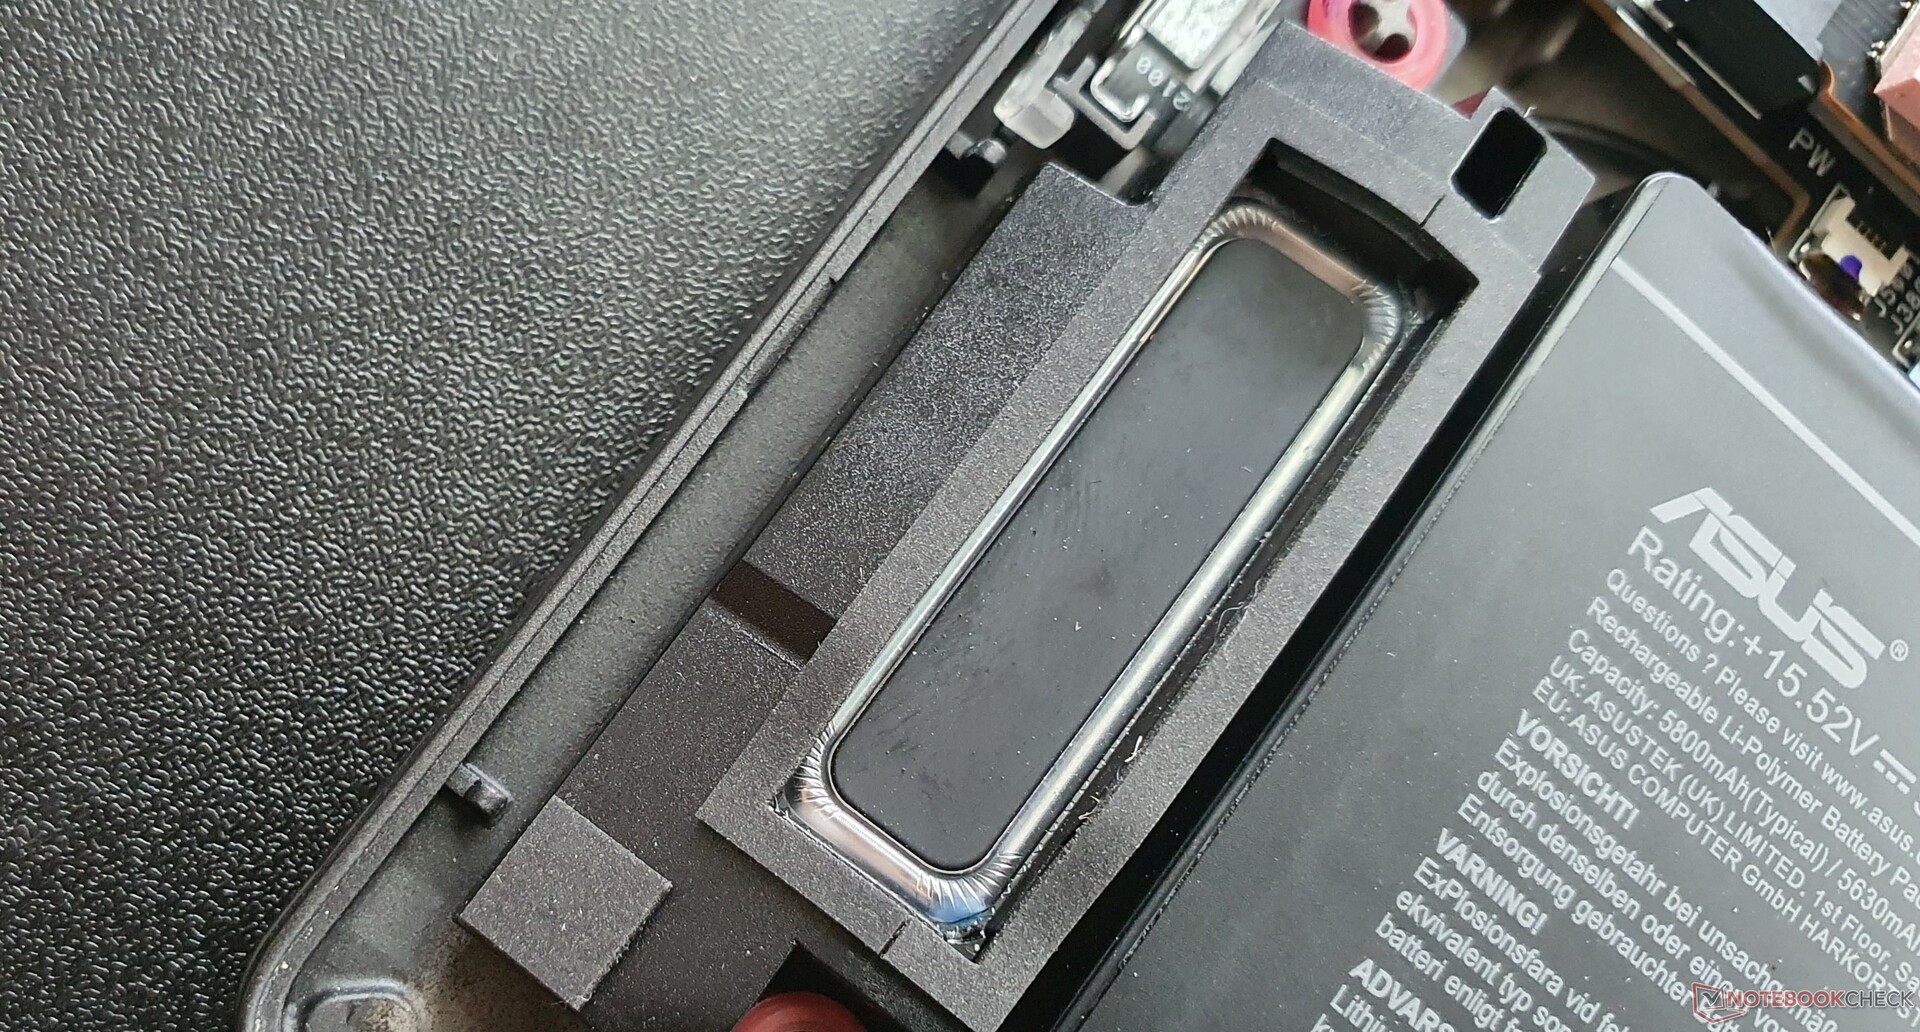
13 Os parafusos Phillips têm que ser afrouxados para remover a placa de base plástica. Além disso, alguns clipes têm que ser afrouxados com uma espátula ou uma palheta. Três ventiladores (1x CPU, 1x GPU e 1x ventilador do sistema) nos esperam no interior, que podem ser limpos. A bateria é parafusada e pode, portanto, ser substituída.
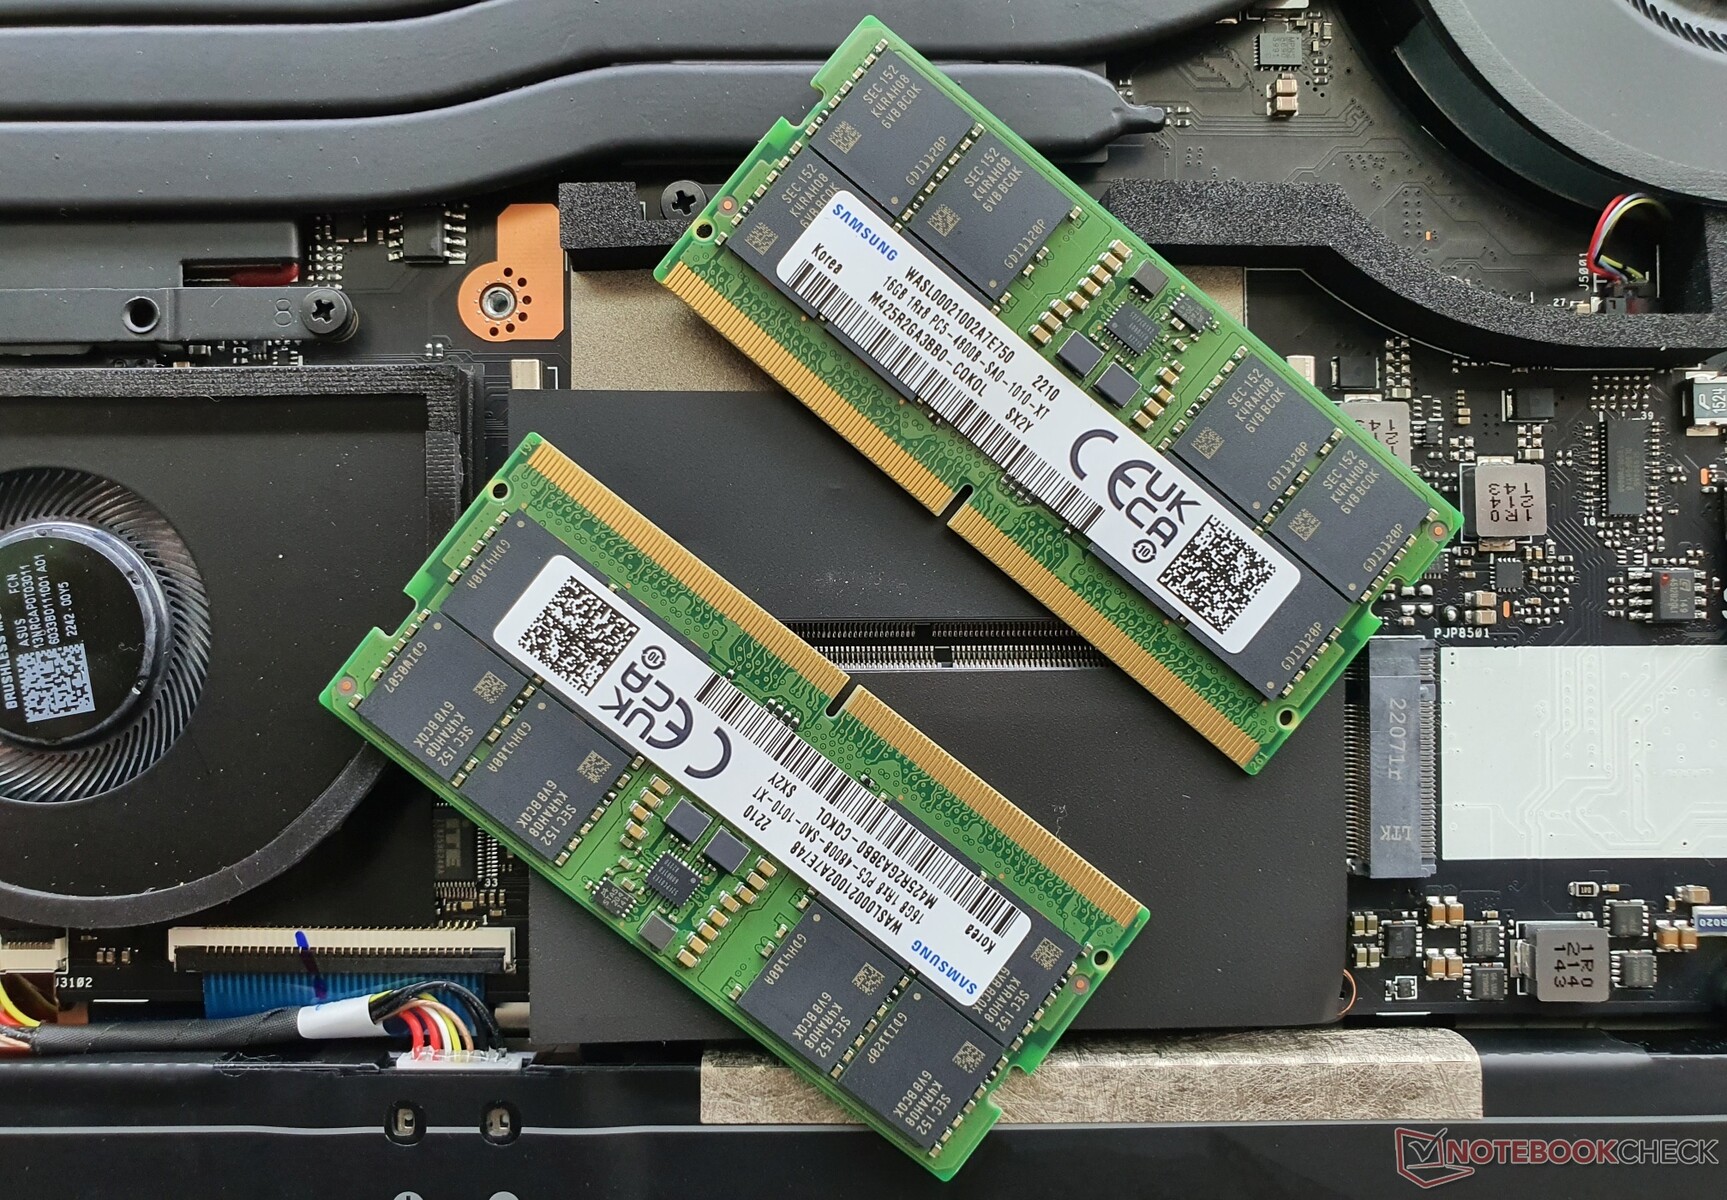
Além disso, a RAM (dois slots) pode ser atualizada e um SSD maior pode ser usado no slot M.2-2280 (PCIe 4.0). Um slot M.2-2242 é gratuito para outro SSD.
Garantia
Na Alemanha, a Asus fornece uma garantia de 24 meses com serviço de coleta e devolução para o ROG Flow X16. Isto pode variar de acordo com o local, portanto, certifique-se de verificar com seu fornecedor antes de comprar
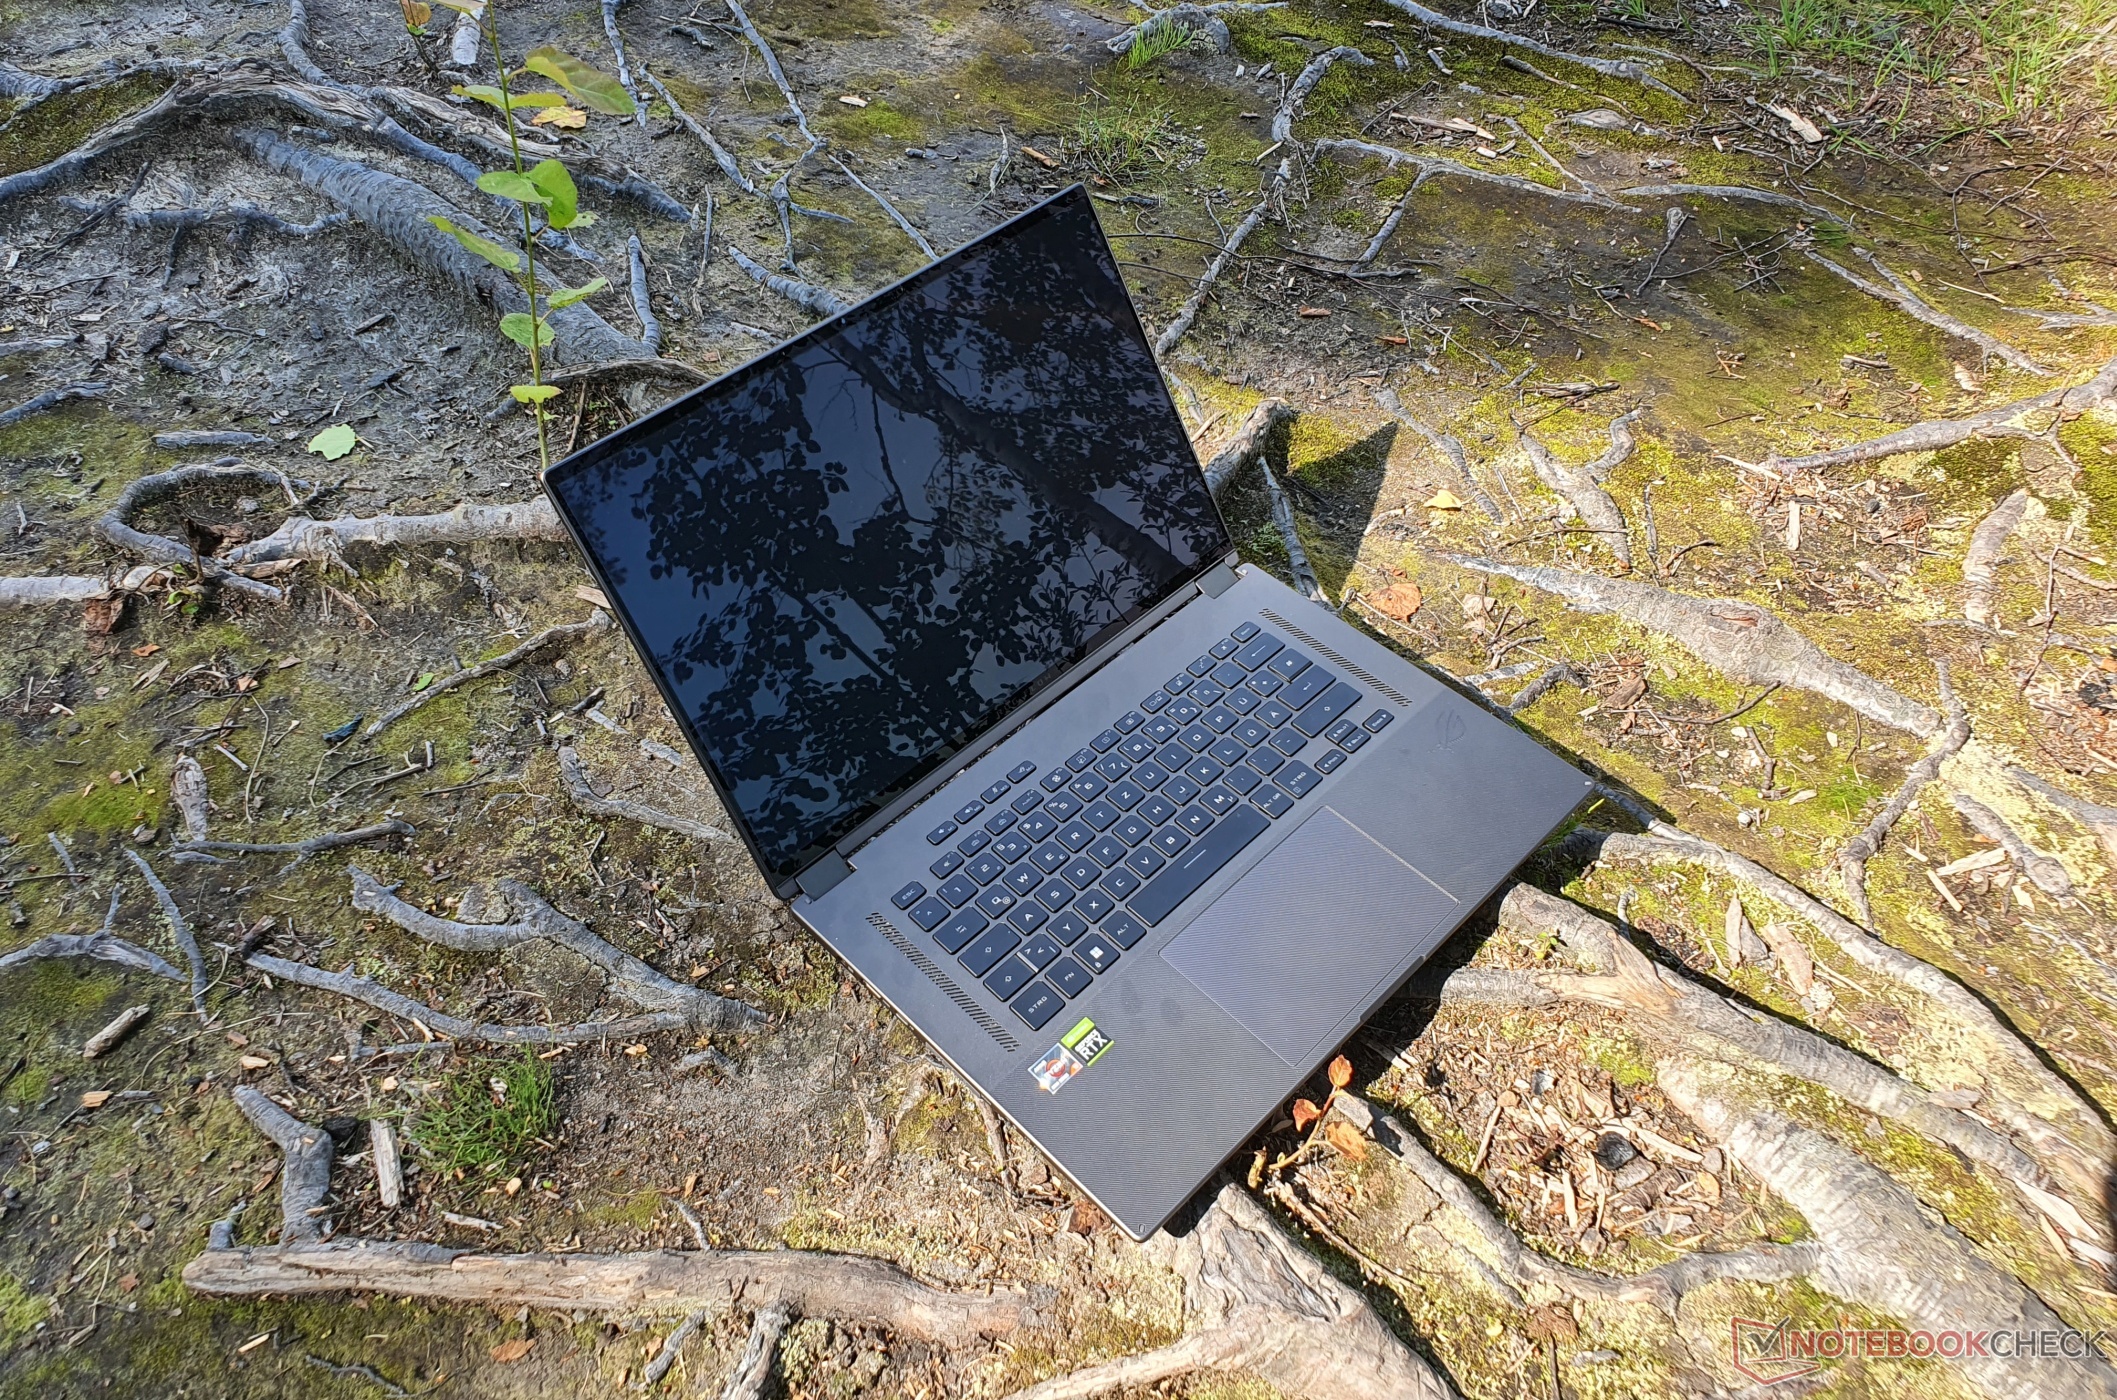
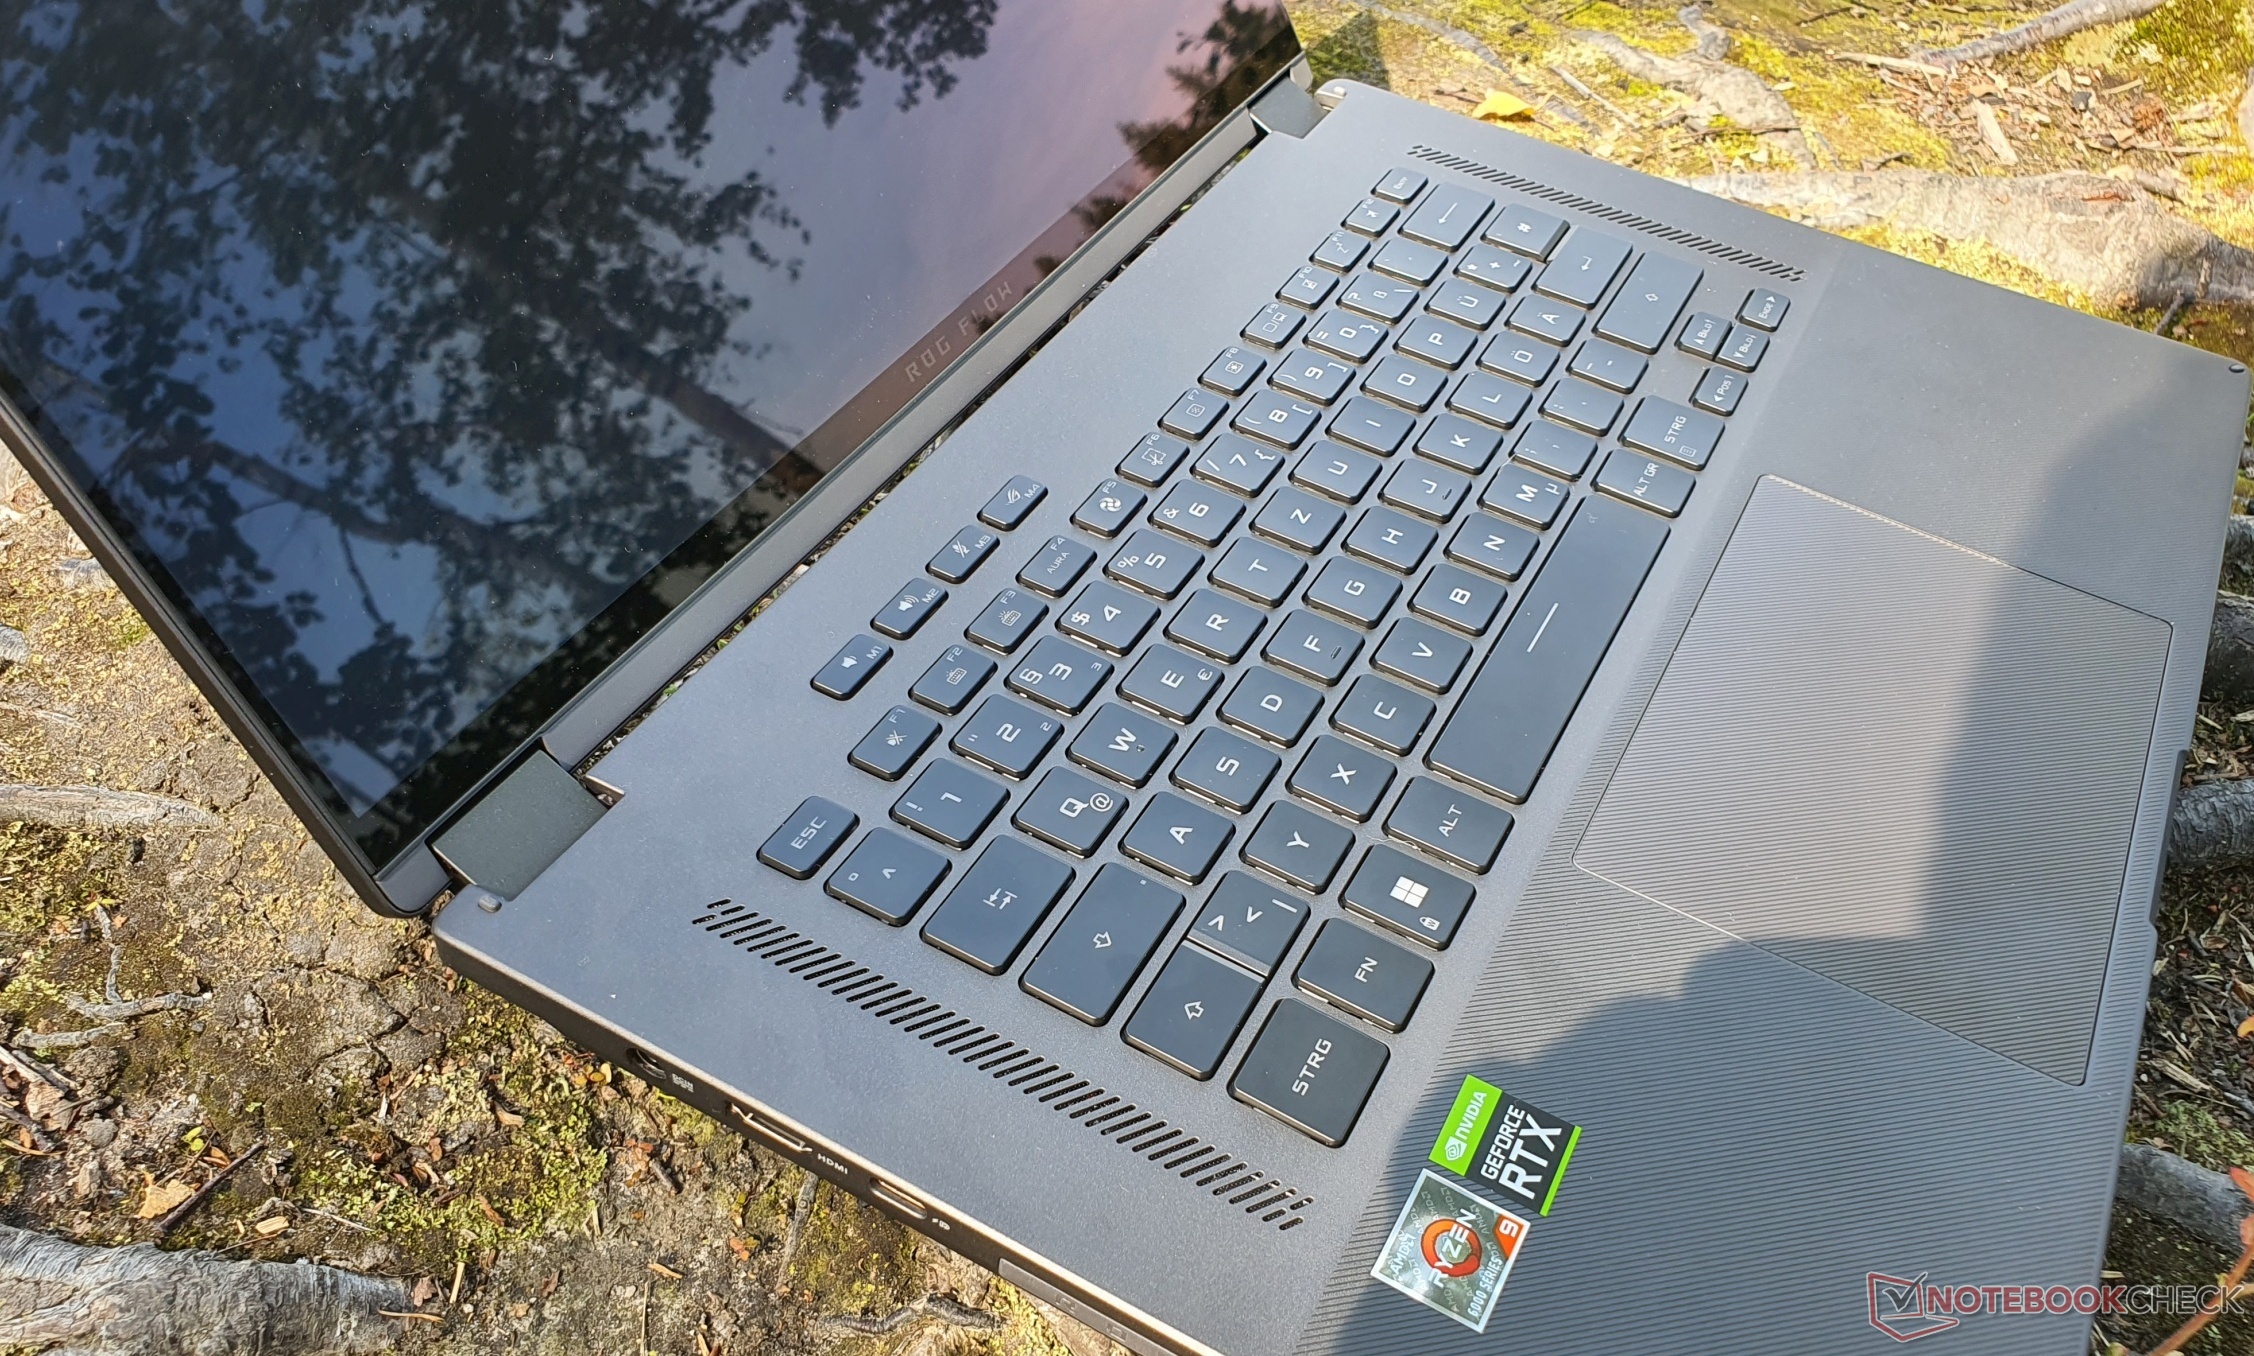
Dispositivos de entrada - teclado RGB retroiluminado com curso de 1,7 mm
Teclado
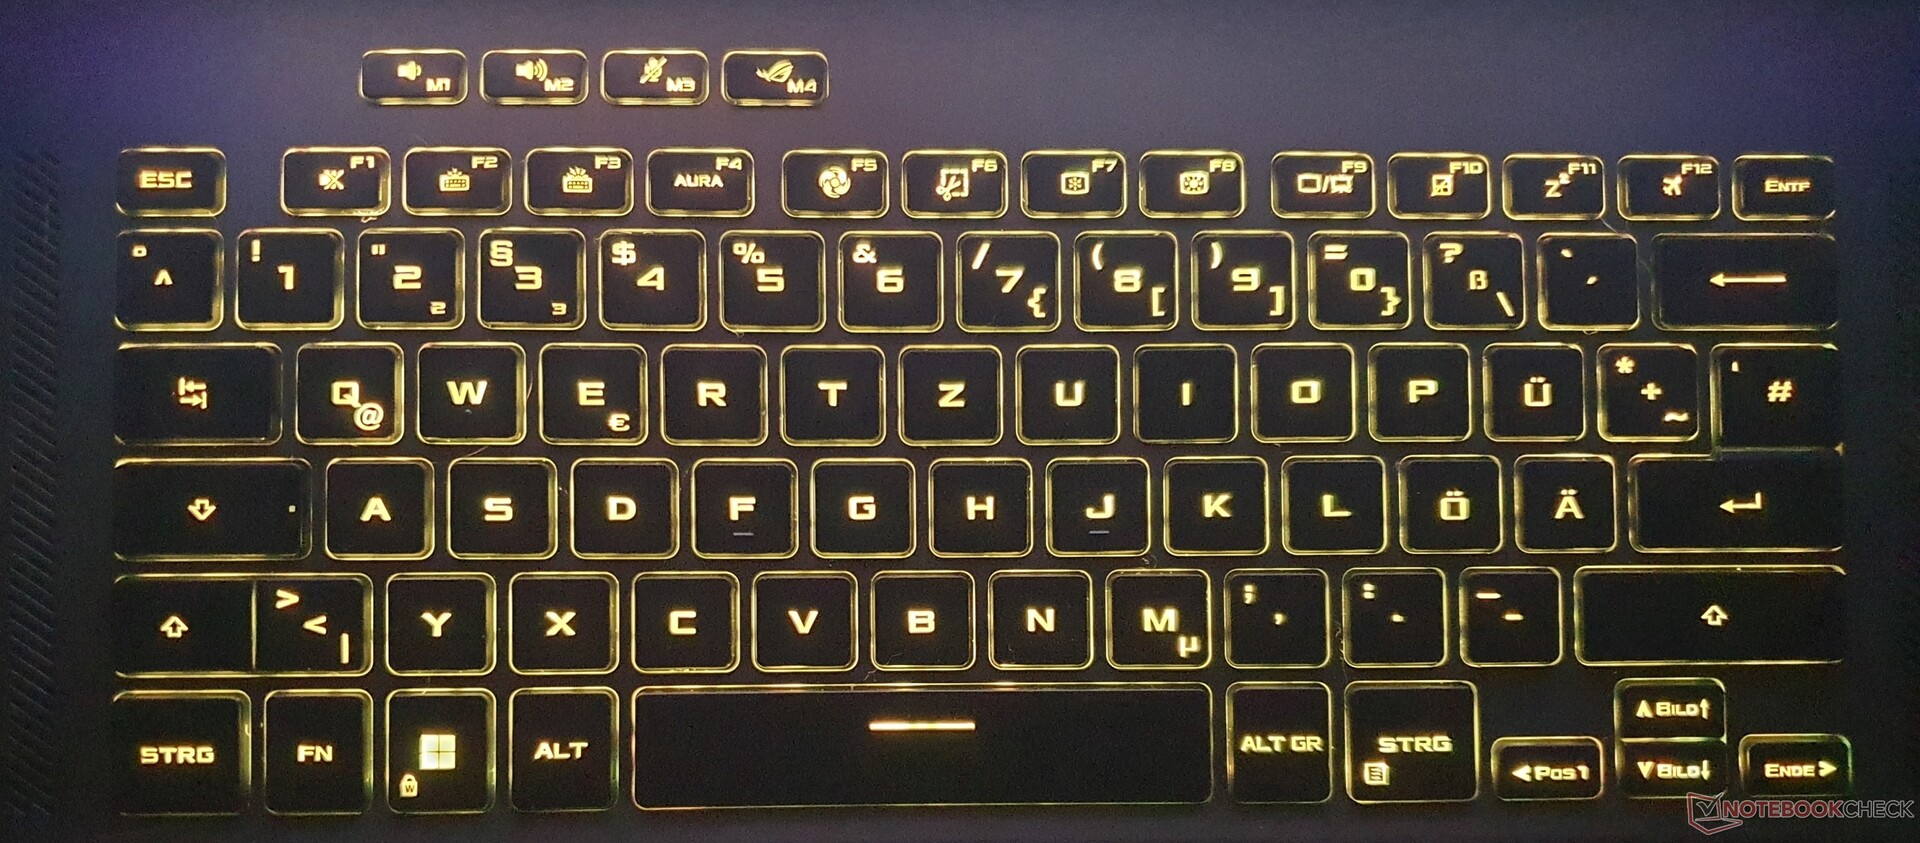
A Asus instala um teclado chiclet de 6 linhas no ROG Flow X16, cujas teclas são um pouco menores a 15 x 15 mm. As letras são ainda maiores e apresentam uma tipografia especial. Laptop típico de jogos
O percurso de 1,7 mm é generoso e o ponto de pressão perceptível com traços claros, mas a resistência da tecla pode ser um pouco baixa demais para algumas pessoas, o que subjetivamente parece um pouco esponjoso. As chaves não são côncavas, ao contrário de alguns cadernos comerciais, mas nada impede a digitação rápida após um curto período de familiarização. Basicamente, o mesmo teclado é instalado como no Zephyrus M16. O capotamento N-key é suportado para permitir o registro correto de vários toques de tecla simultaneamente.
A iluminação RGB pode ser ajustada em três níveis de intensidade. Entretanto, as teclas não podem ser programadas individualmente (ou seja, por tecla RGB). O layout é bom e sem surpresas. As teclas de setas têm metade do tamanho, a tecla Enter é dividida, e as habituais atribuições duplas foram alocadas.
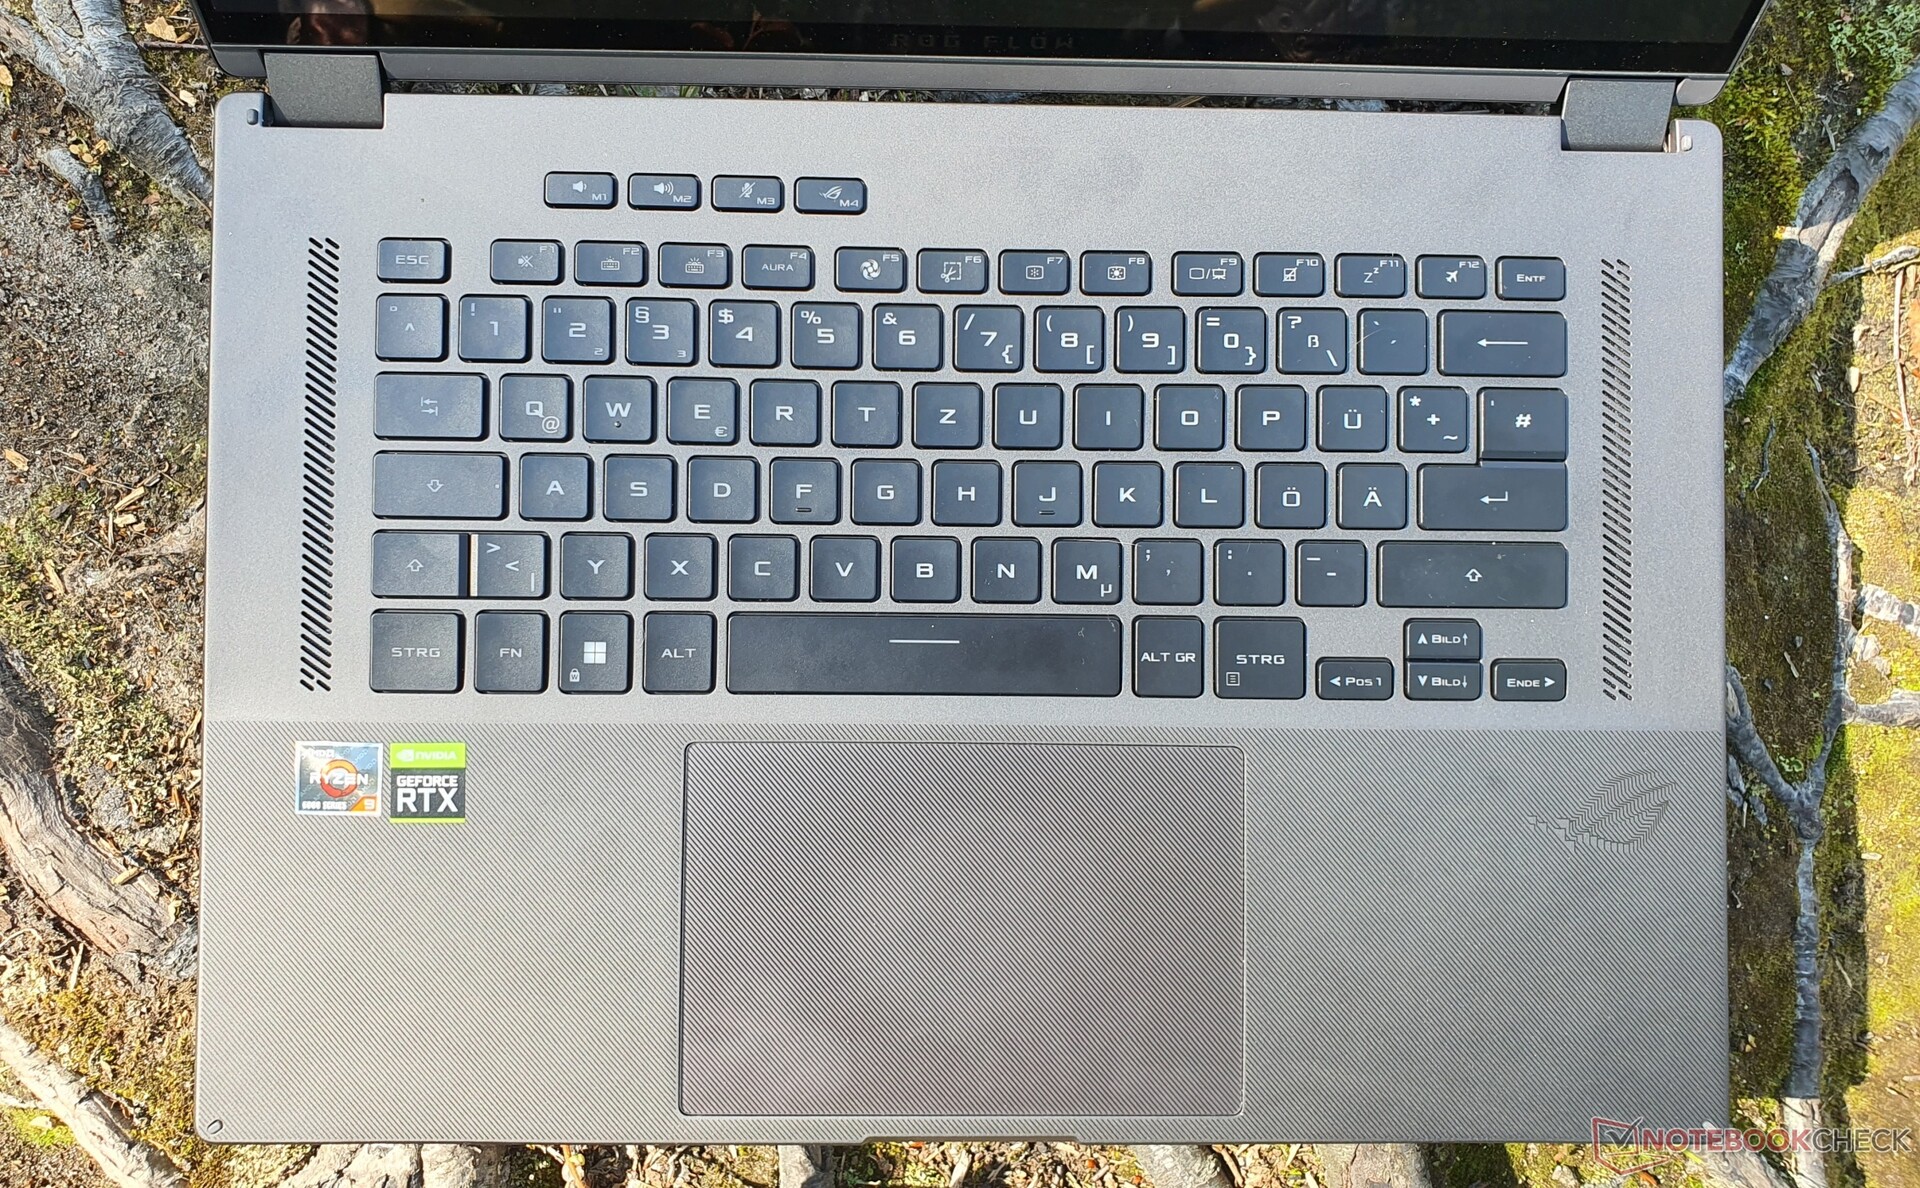
Touchpad & Touchscreen
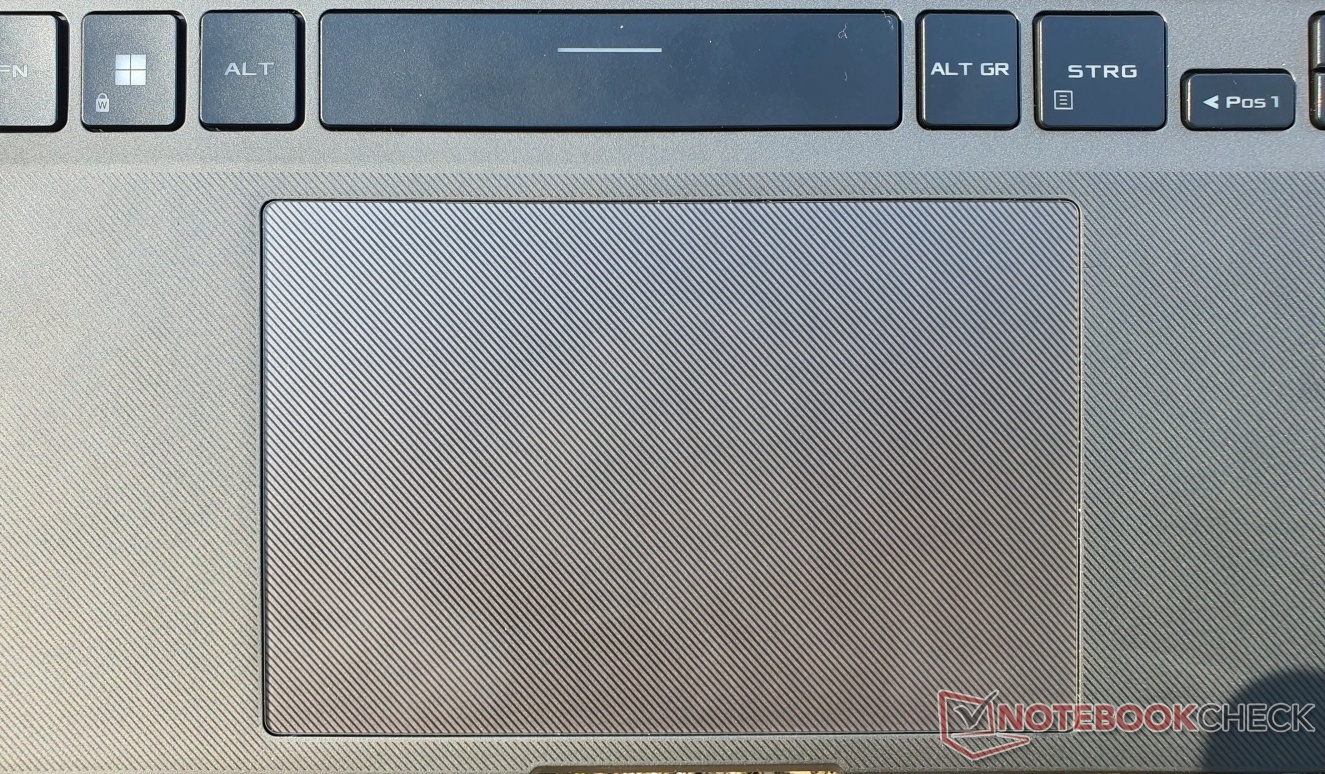
O grande touchpad de vidro mede 13 x 8,5 cm e oferece excelentes propriedades de deslizamento. A resposta e precisão estão em um nível elevado. Gestos multi-toque e função de rolagem sem problemas
As teclas integradas clicam silenciosamente, têm um curso curto e um feedback satisfatório. Entretanto, o touchpad falhou após pouco tempo e não pôde ser reativado. Suspeitamos que isto se deva a um problema do motorista que só se aplica ao nosso modelo de pré-produção.
Todos os modelos do ROG X16 Flow vêm com uma tela sensível ao toque. A resposta e a precisão são boas - a rolagem é especialmente divertida com a taxa de atualização de 165 Hz. O estilete incluído (Asus SA201H) tem 4.096 níveis de pressão e é alimentado por uma bateria AAAA. Ela desliza rápida e precisamente sobre a tela sensível ao toque e a ponta da caneta oferece feedback adequado, assim como os dois botões integrados no lado inferior.
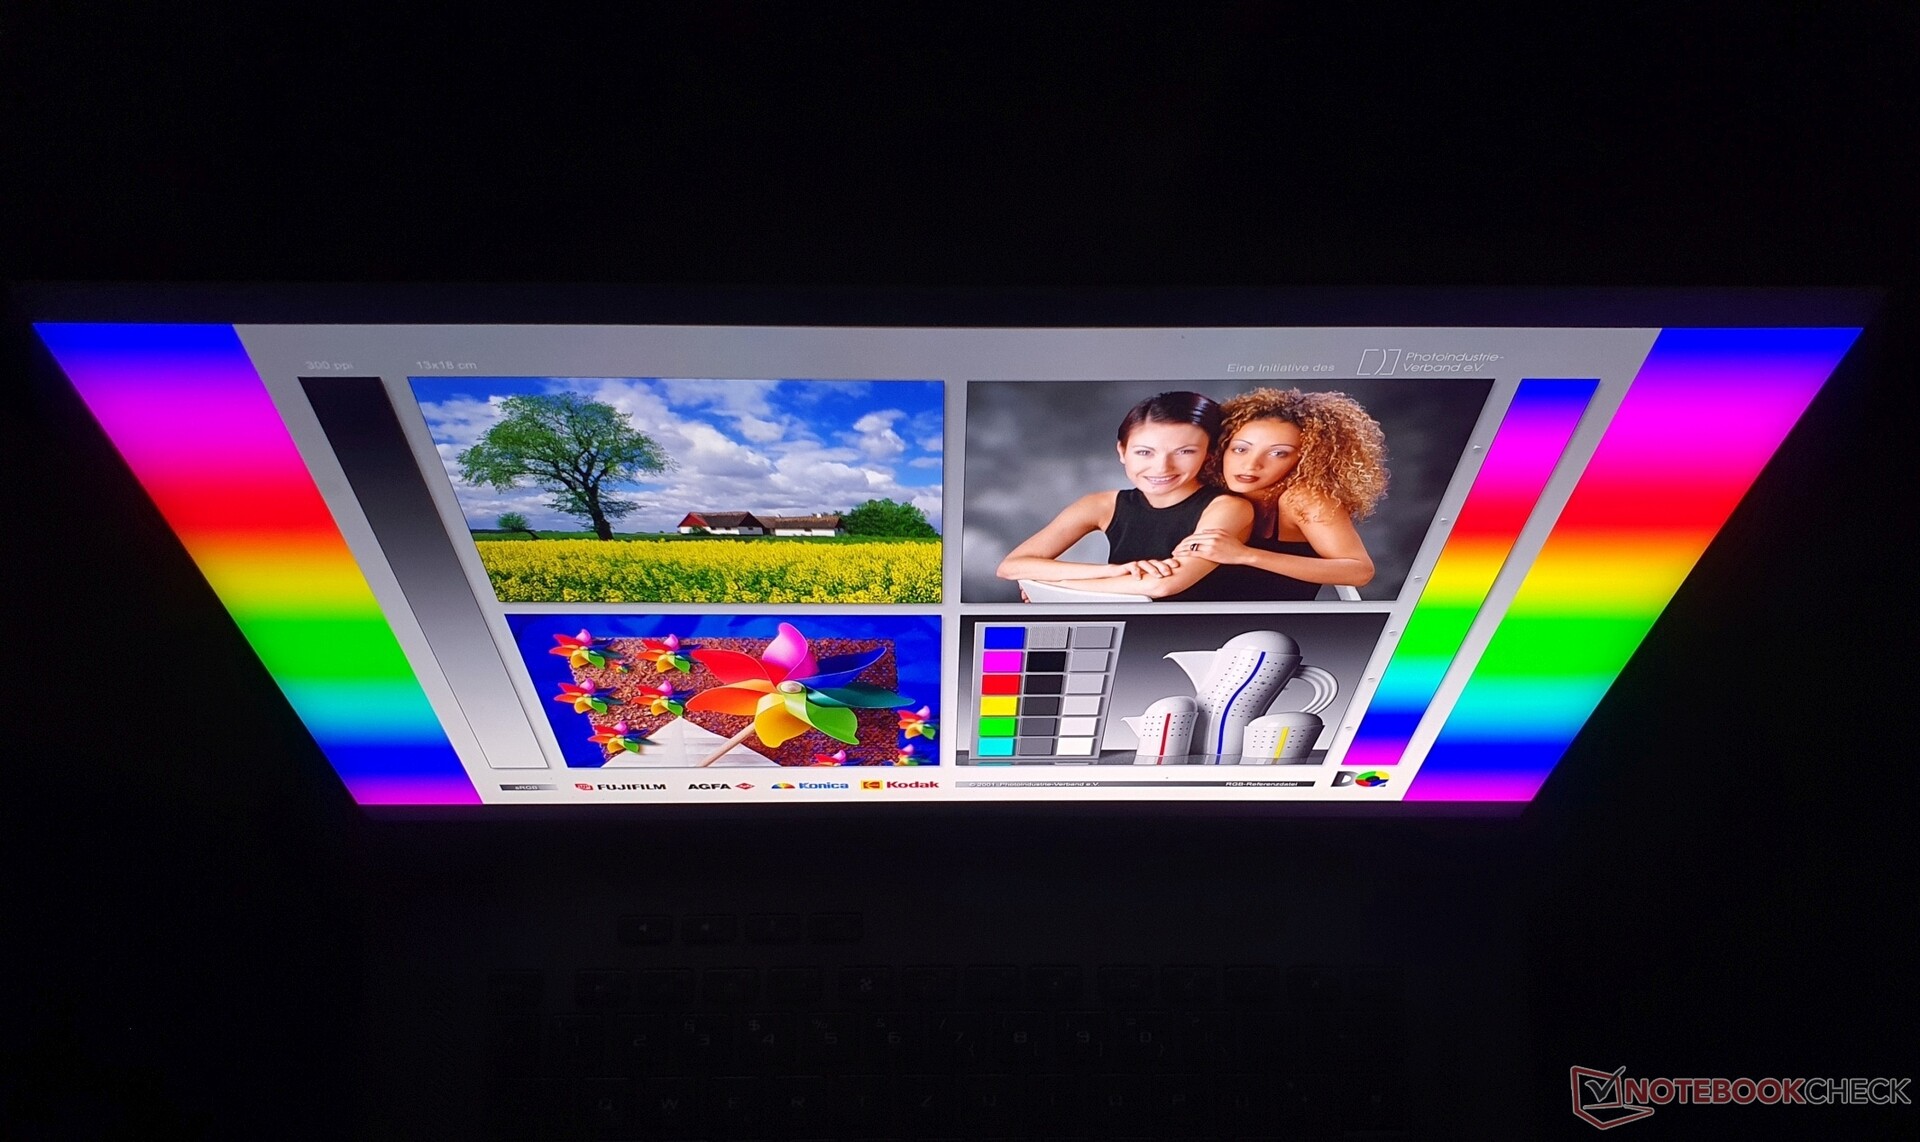
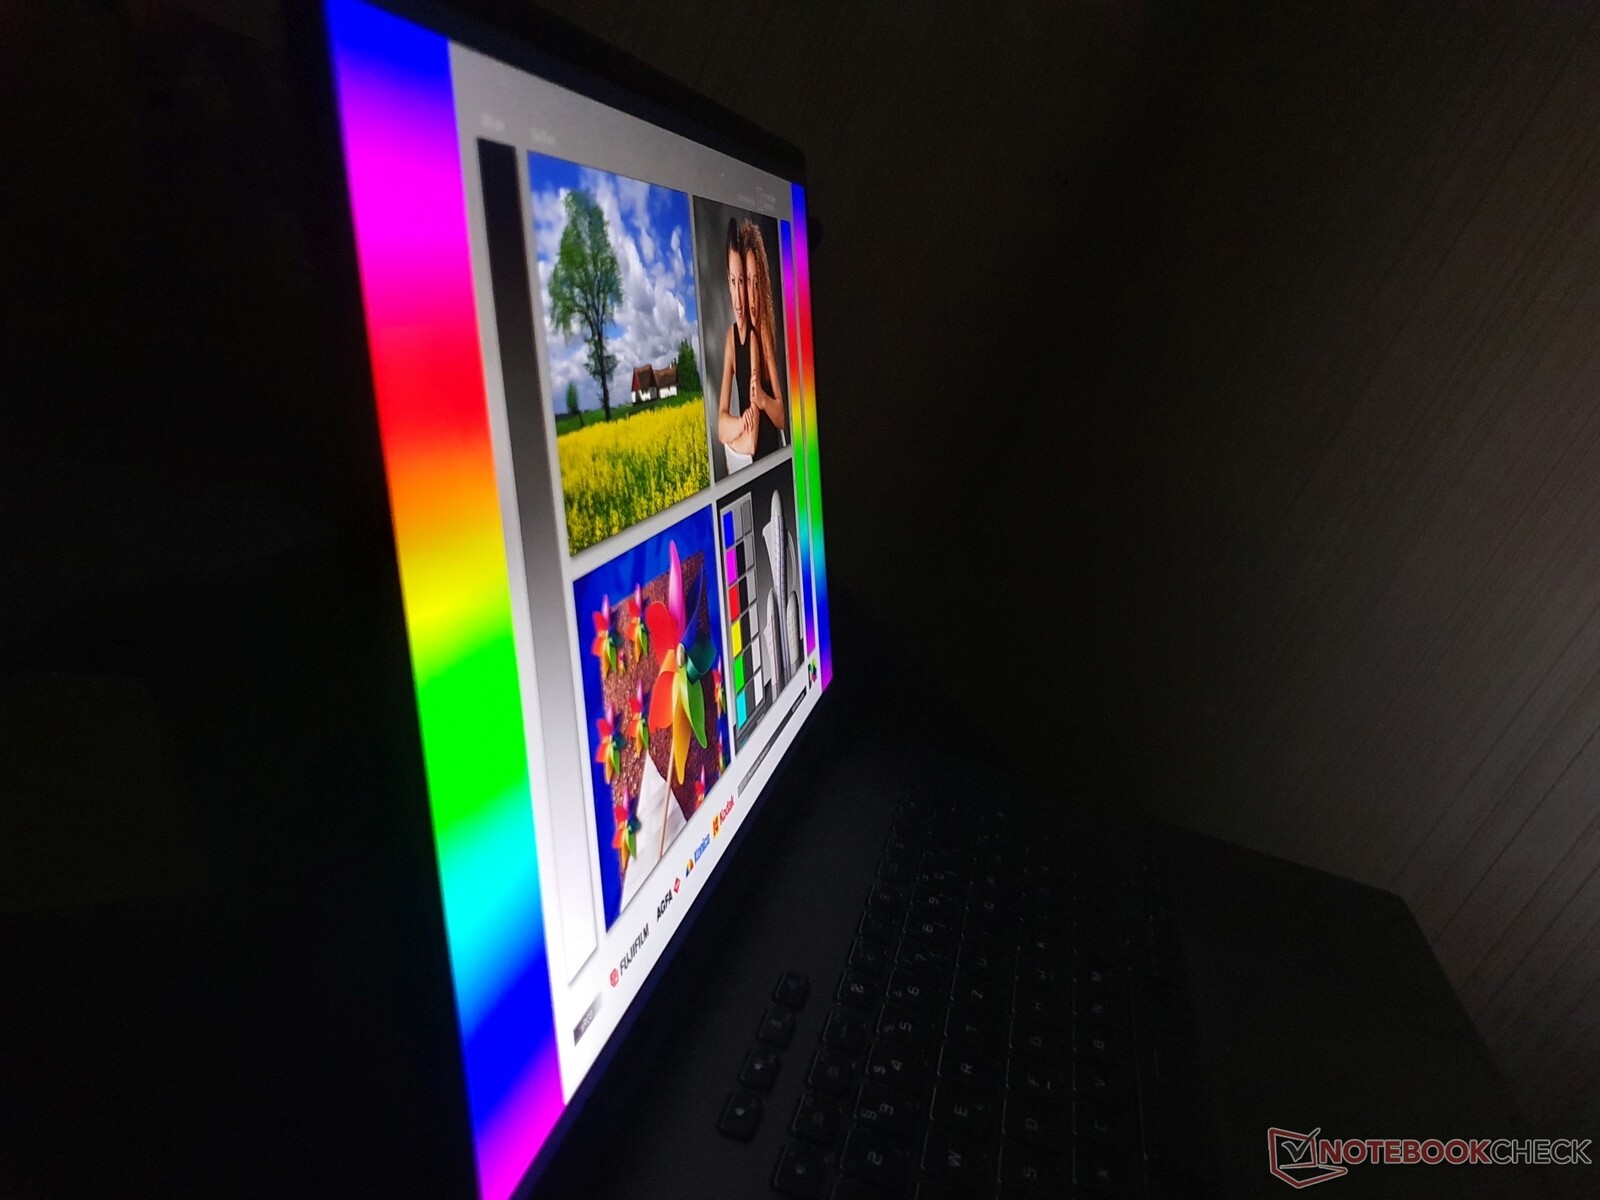
A melhor exibição de jogos? Mini-LED com HDR 1000

O ROG Flow X16 pode ser encomendado com ou sem uma mini-luz de fundo LED. Algumas características permanecem inalteradas: a resolução de 2560x1600 no formato 16:10, uma taxa de atualização de 165 Hz e uma tela sensível ao toque brilhante com suporte de estilete.
A mini-LED instalada em nossa variante suporte DisplayHDR 1000 pela primeira vez em um notebook de jogos, juntamente com o próprio Zephyrus Duo 16. Entretanto, este último modelo também oferece uma variante mate sem toque.
O conteúdo parece ainda mais atraente com o DisplayHDR 1000 ativado, em comparação com os laptops anteriores que só suportavam HDR 400 com melhorias de imagem significativamente menores. Os únicos outros laptops com DisplayHDR 1000 até agora foram o MSI Creator 17 (2020) e Apple's MacBook Pro 16 (2021). O Legion Slim 7i da Lenovo com um display mini-LED também deverá estar disponível ainda este ano
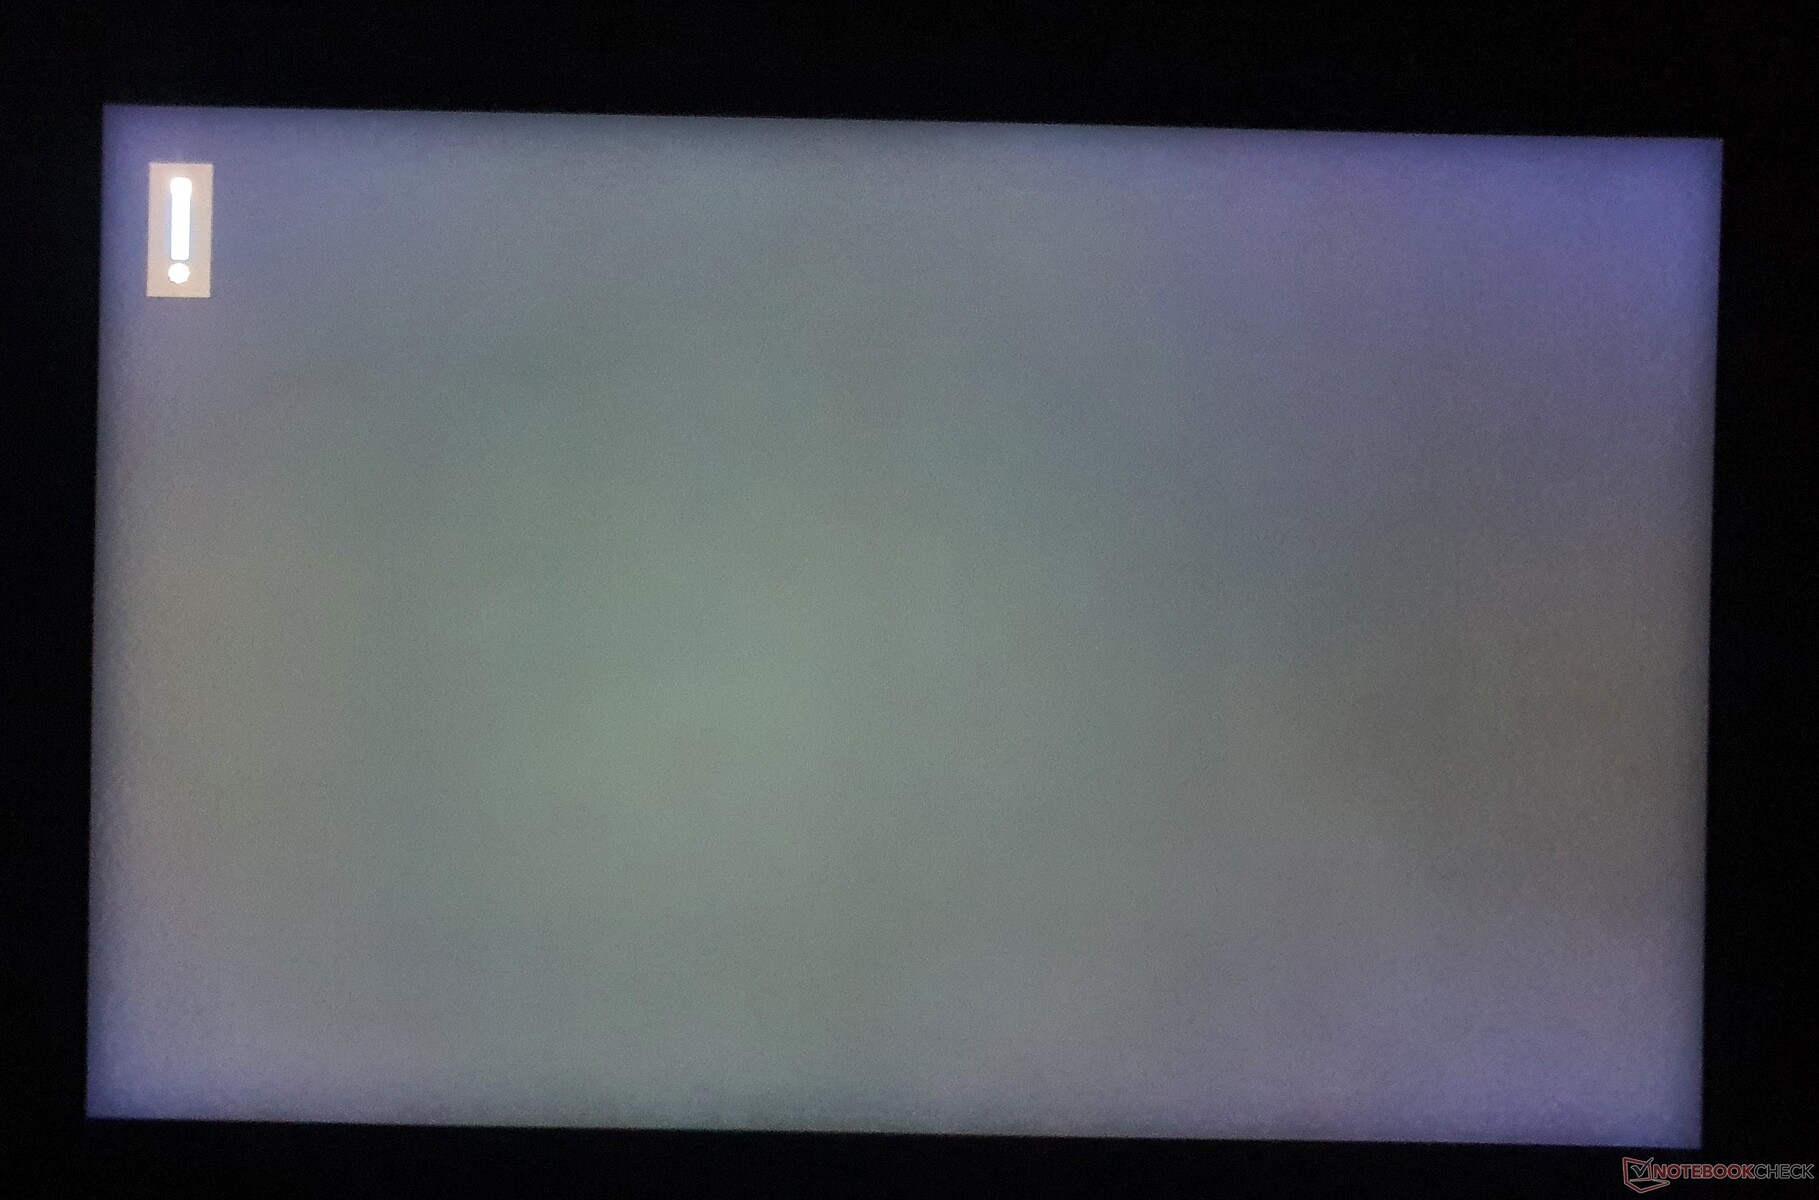
A percepção subjetiva da imagem é excelente. As cores são exibidas muito bem, o pico de brilho de ~1.100 lêndeas com HDR habilitado (também funciona em modo desktop normal) é excelente, e o nível de preto de 0,11 lêndeas é quase tão rico quanto no OLED, enquanto a relação de contraste de 4.527:1 é muito boa, como é típico para o mini-LED. Nossas medidas foram realizadas no modo SDR. No modo HDR, a relação de contraste é tipicamente muito mais alta, particularmente devido às 512 zonas de escurecimento locais ativadas de nossa tela: As áreas de pixels individuais desligam-se completamente assim que o preto é exibido, ou as áreas brilham muito intensamente com o conteúdo HDR. Não há halos, o que também explica a homogeneidade de iluminação muito sólida de 95%. O brilho médio do HDR é normalmente cerca de 20% abaixo do brilho de pico (não medido).
Juntamente com uma taxa de quadros de 165 Hz e bons tempos de resposta de 11 ms cada (cinza a cinza e preto a branco), a tela é inigualável em jogos HDR. O Adaptive Sync é suportado. Apenas aqueles que jogam, em sua maioria, atiradores de ritmo rápido, provavelmente procuram alternativas com taxas de quadros ainda mais altas e tempos de resposta mais baixos, tais como oMSI Stealth GS66e pode preferir uma resolução Full HD mais baixa, já que o FPS máximo e a velocidade têm prioridade absoluta em atiradores de ritmo rápido. Mas como o ROG X16 Flow também é projetado para criadores, ele não é apenas ideal para conteúdo HDR em jogos, mas também em edição
No geral, apenas Apple's MacBook Pro 16 com sua própria tela Mini LED chega perto da qualidade de exibição. Os painéis OLED, como no Gigabyte Aero 16, não são suficientemente brilhantes para DisplayHDR 1000. Por outro lado, o Mini LED exibe "florescendo" (ou seja, a luz dos LEDs brilhantes brilha no conteúdo circundante, mais escuro, semelhante ao sangramento de luz de fundo, uma vez que as zonas locais de escurecimento são maiores que os pixels) em nosso dispositivo de revisão, mas isto é um pouco menos pronunciado que no MacBook ou no iPad Pro 12.9 com o chip M1. O PWM é algo que sempre observamos em displays mini LED até agora, mas a freqüência muito alta de 7.400 MHz não deve causar nenhum problema, mesmo para usuários sensíveis.
| |||||||||||||||||||||||||
iluminação: 94 %
iluminação com acumulador: 502 cd/m²
Contraste: 4527:1 (Preto: 0.11 cd/m²)
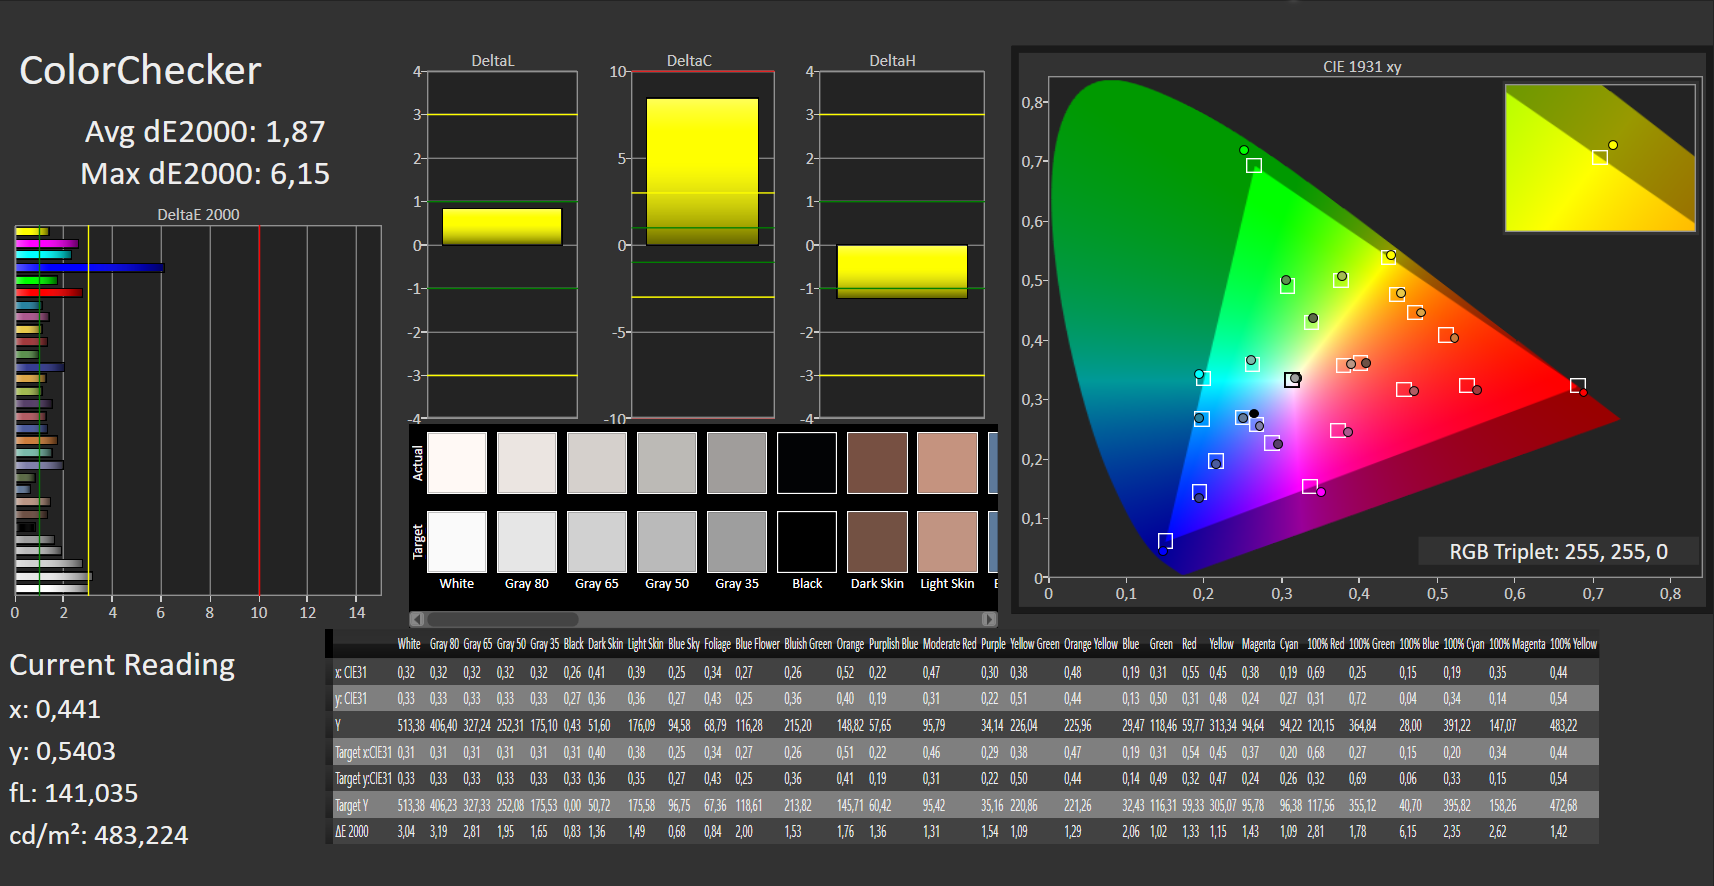
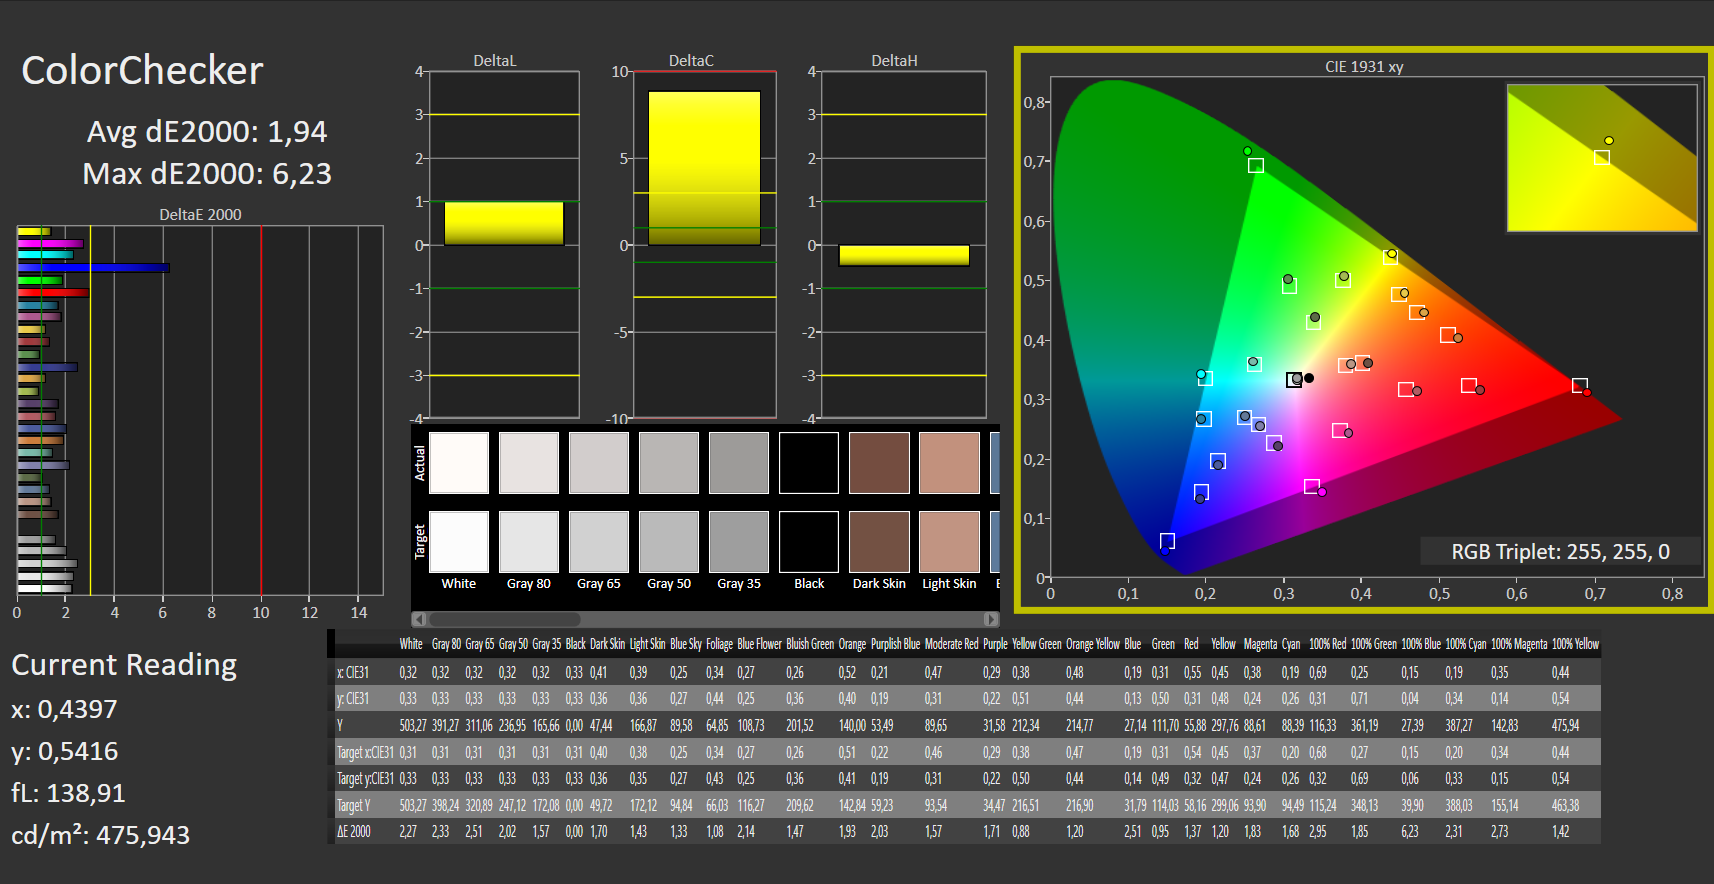
ΔE ColorChecker Calman: 1.87 | ∀{0.5-29.43 Ø4.71}
calibrated: 1.94
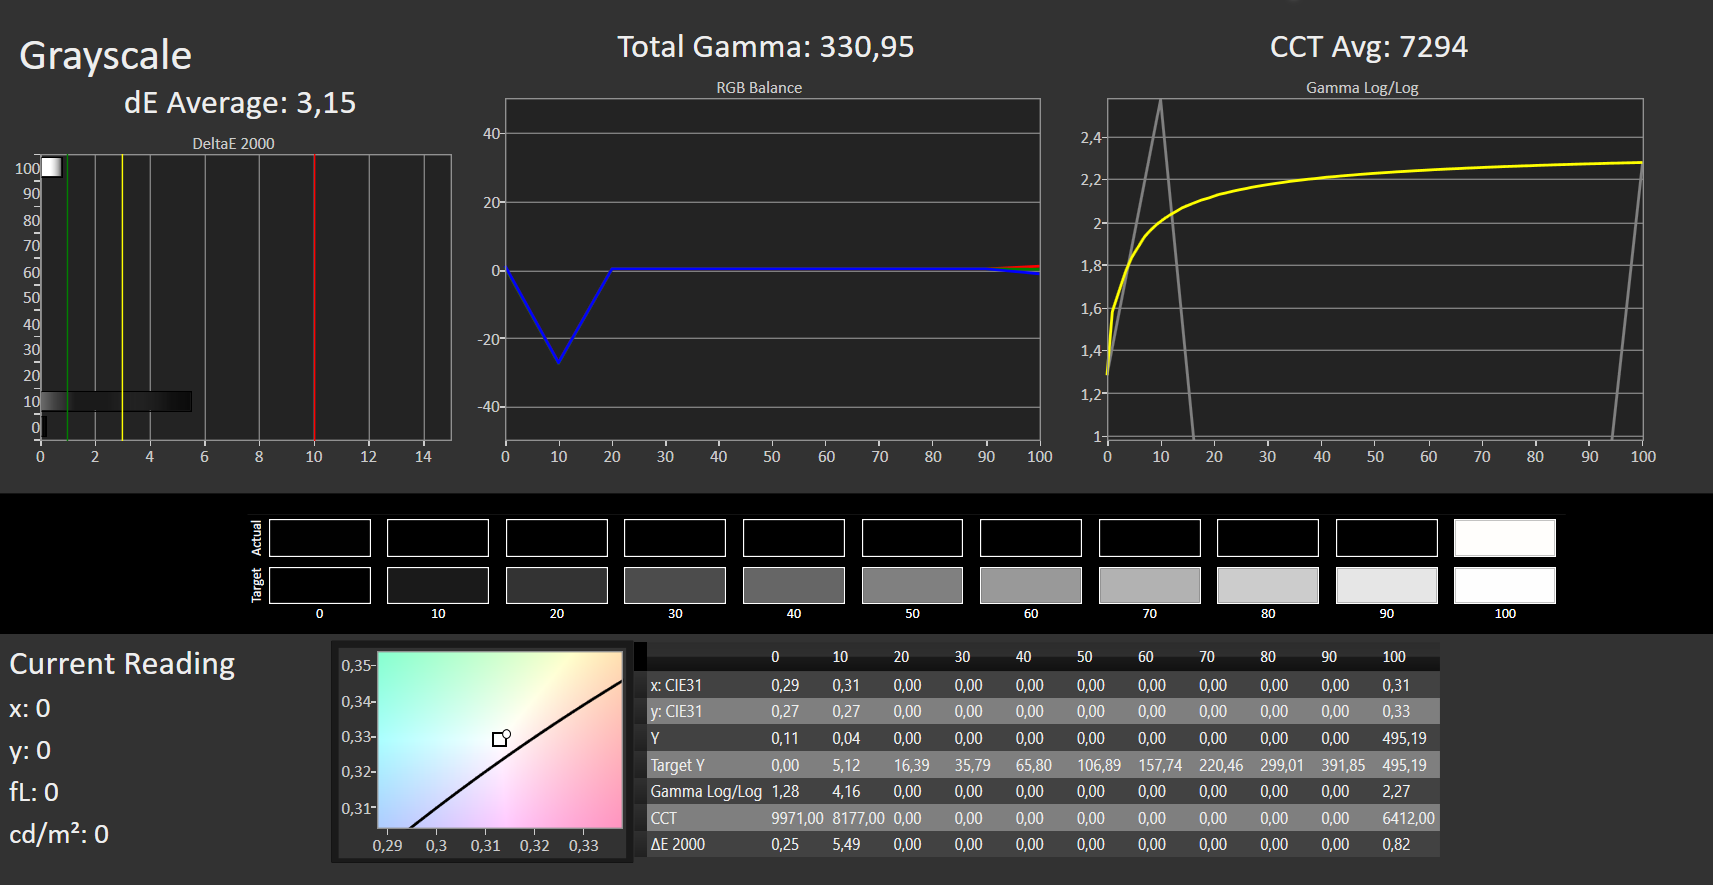
ΔE Greyscale Calman: 3.15 | ∀{0.09-98 Ø4.96}
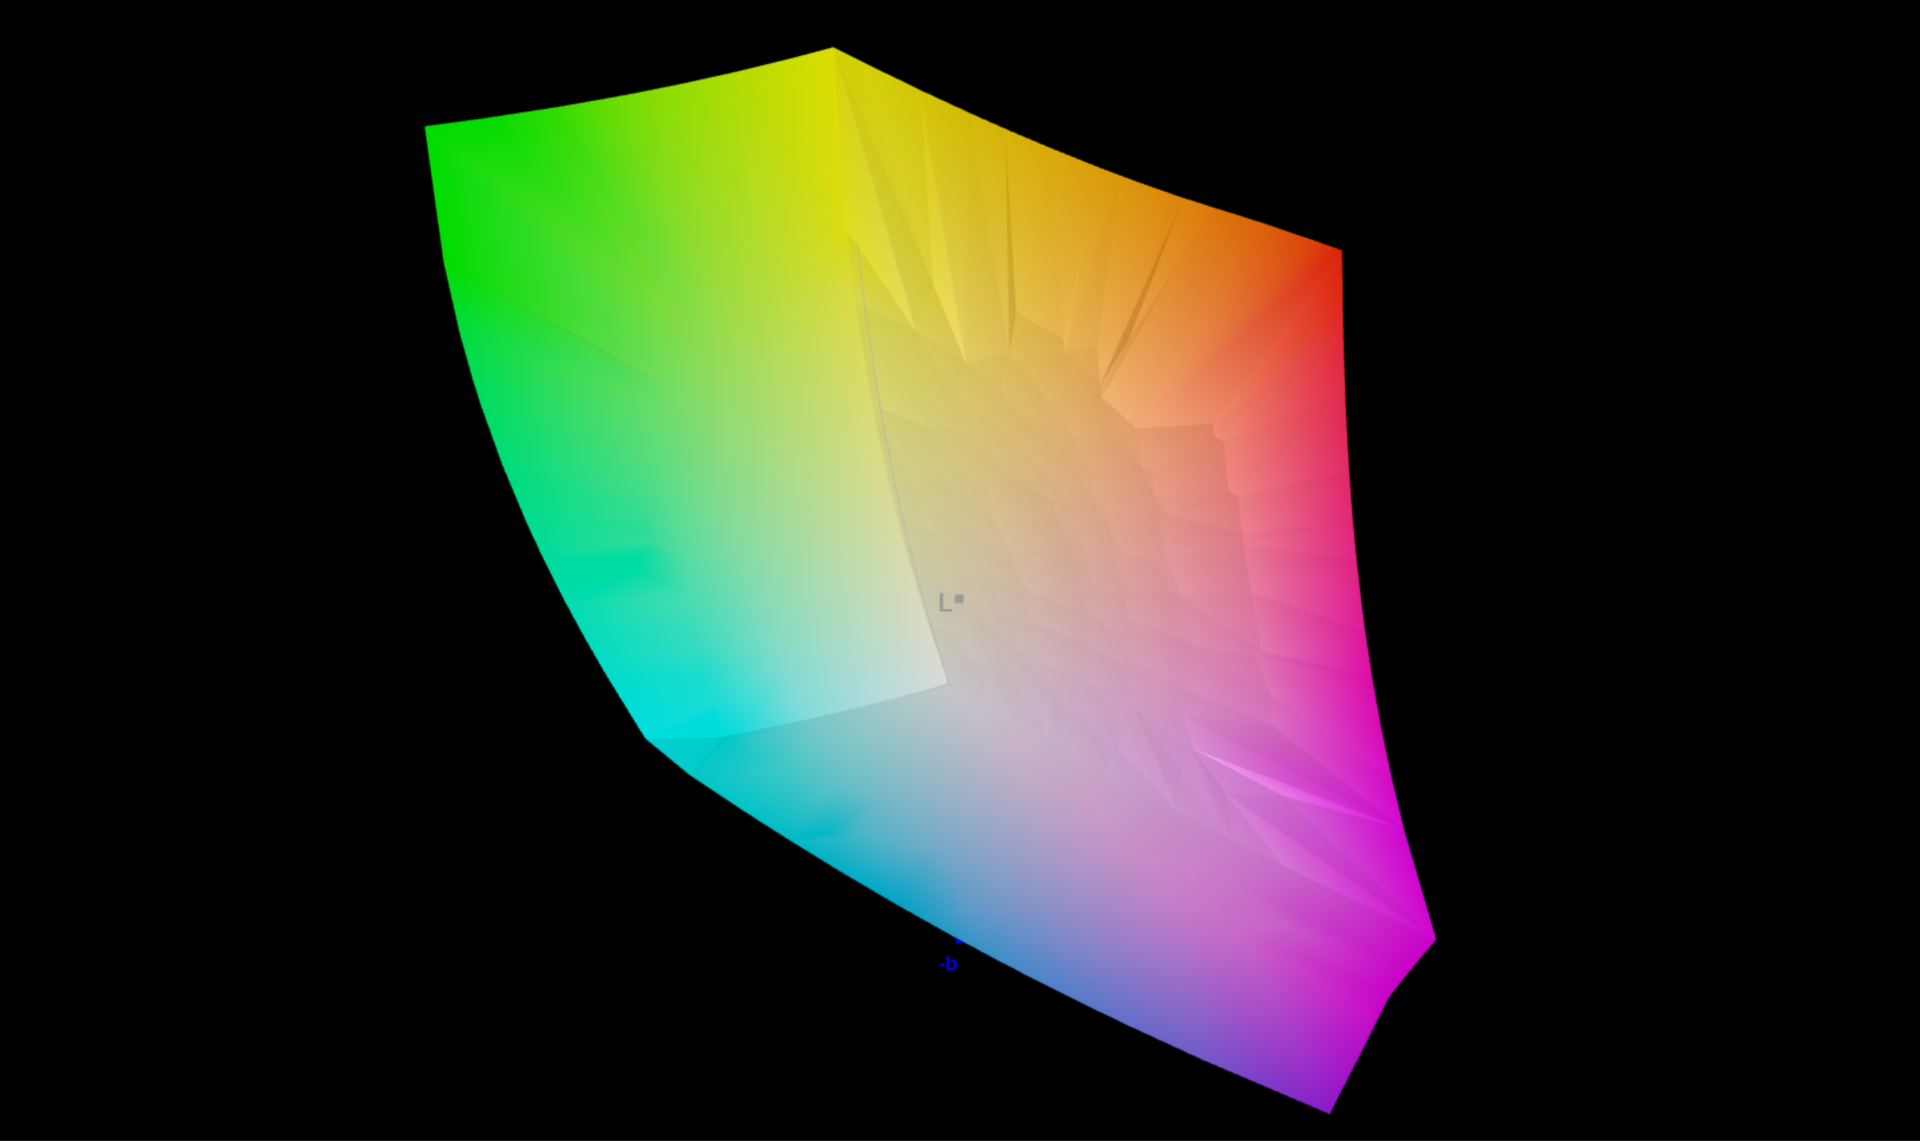
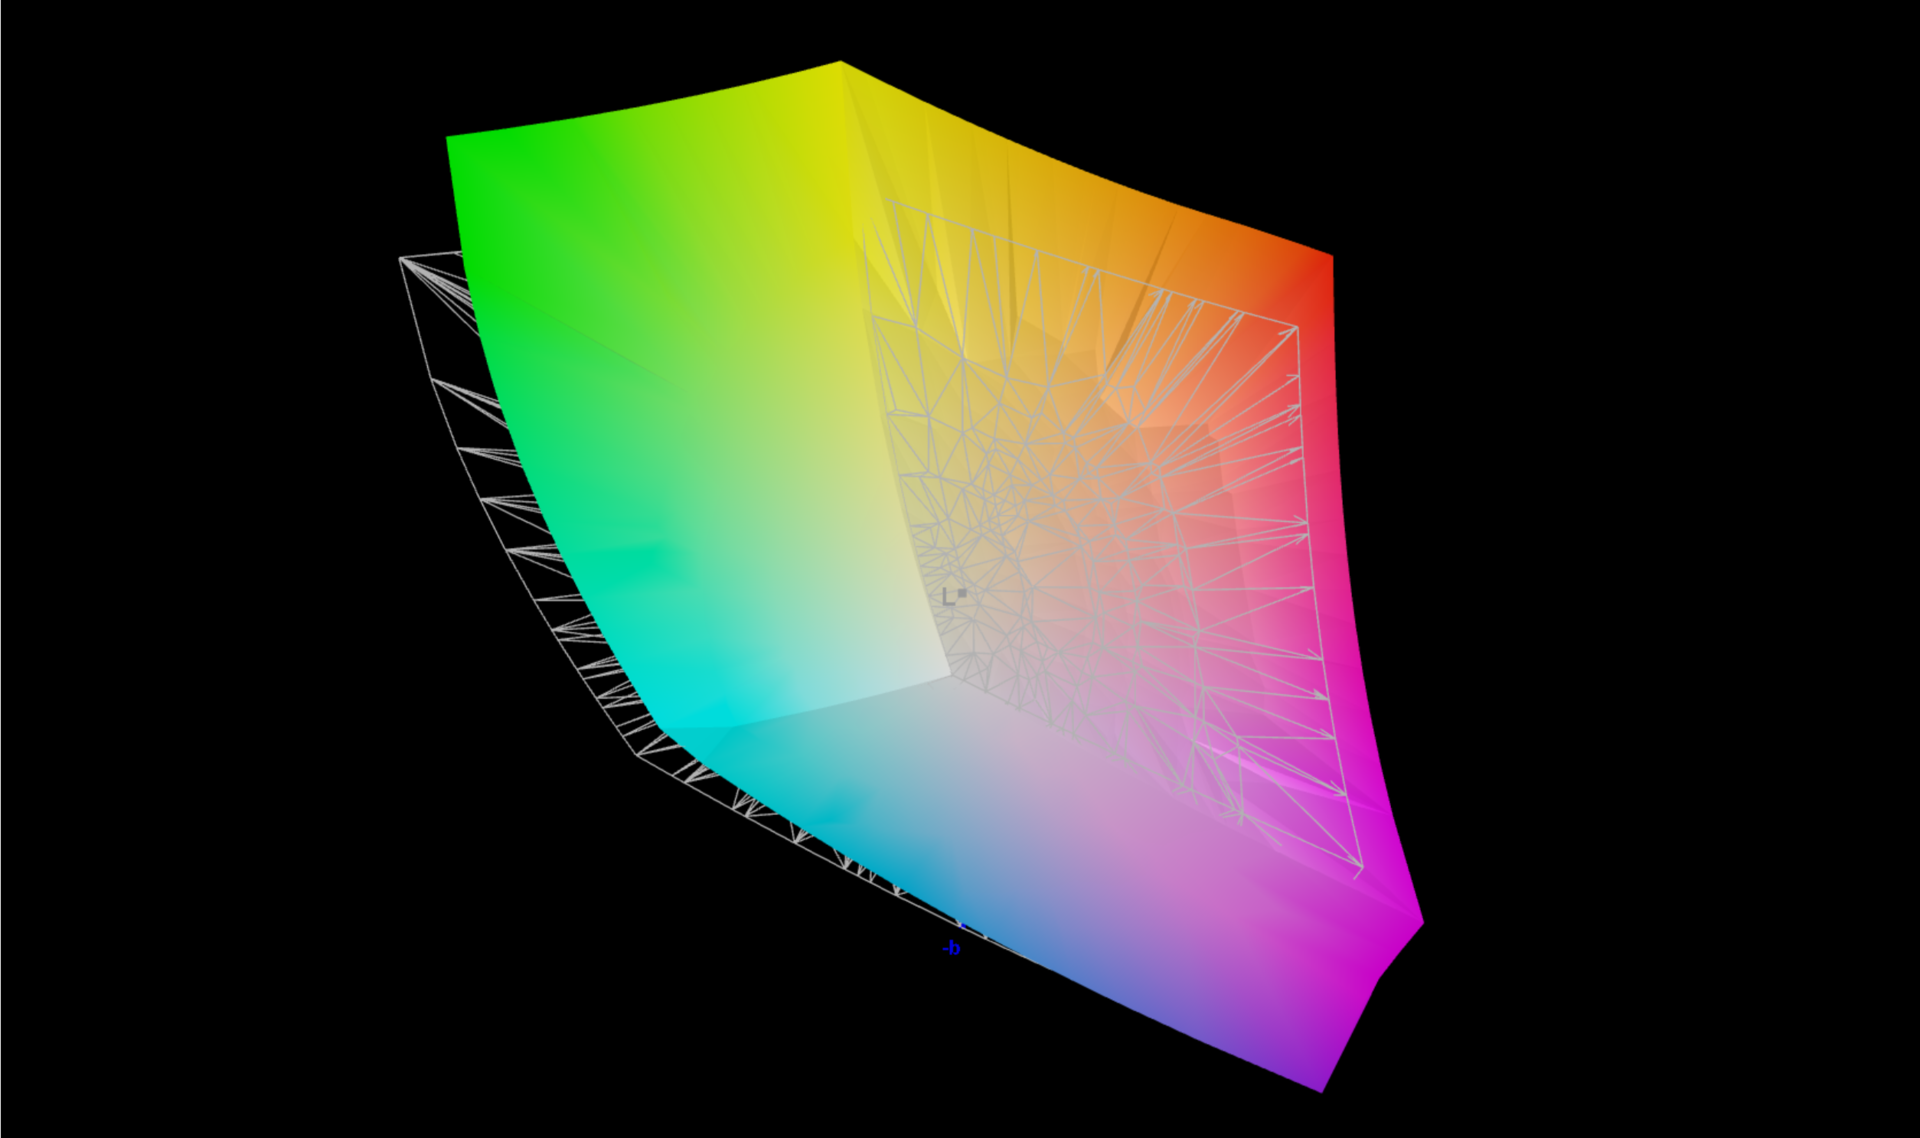
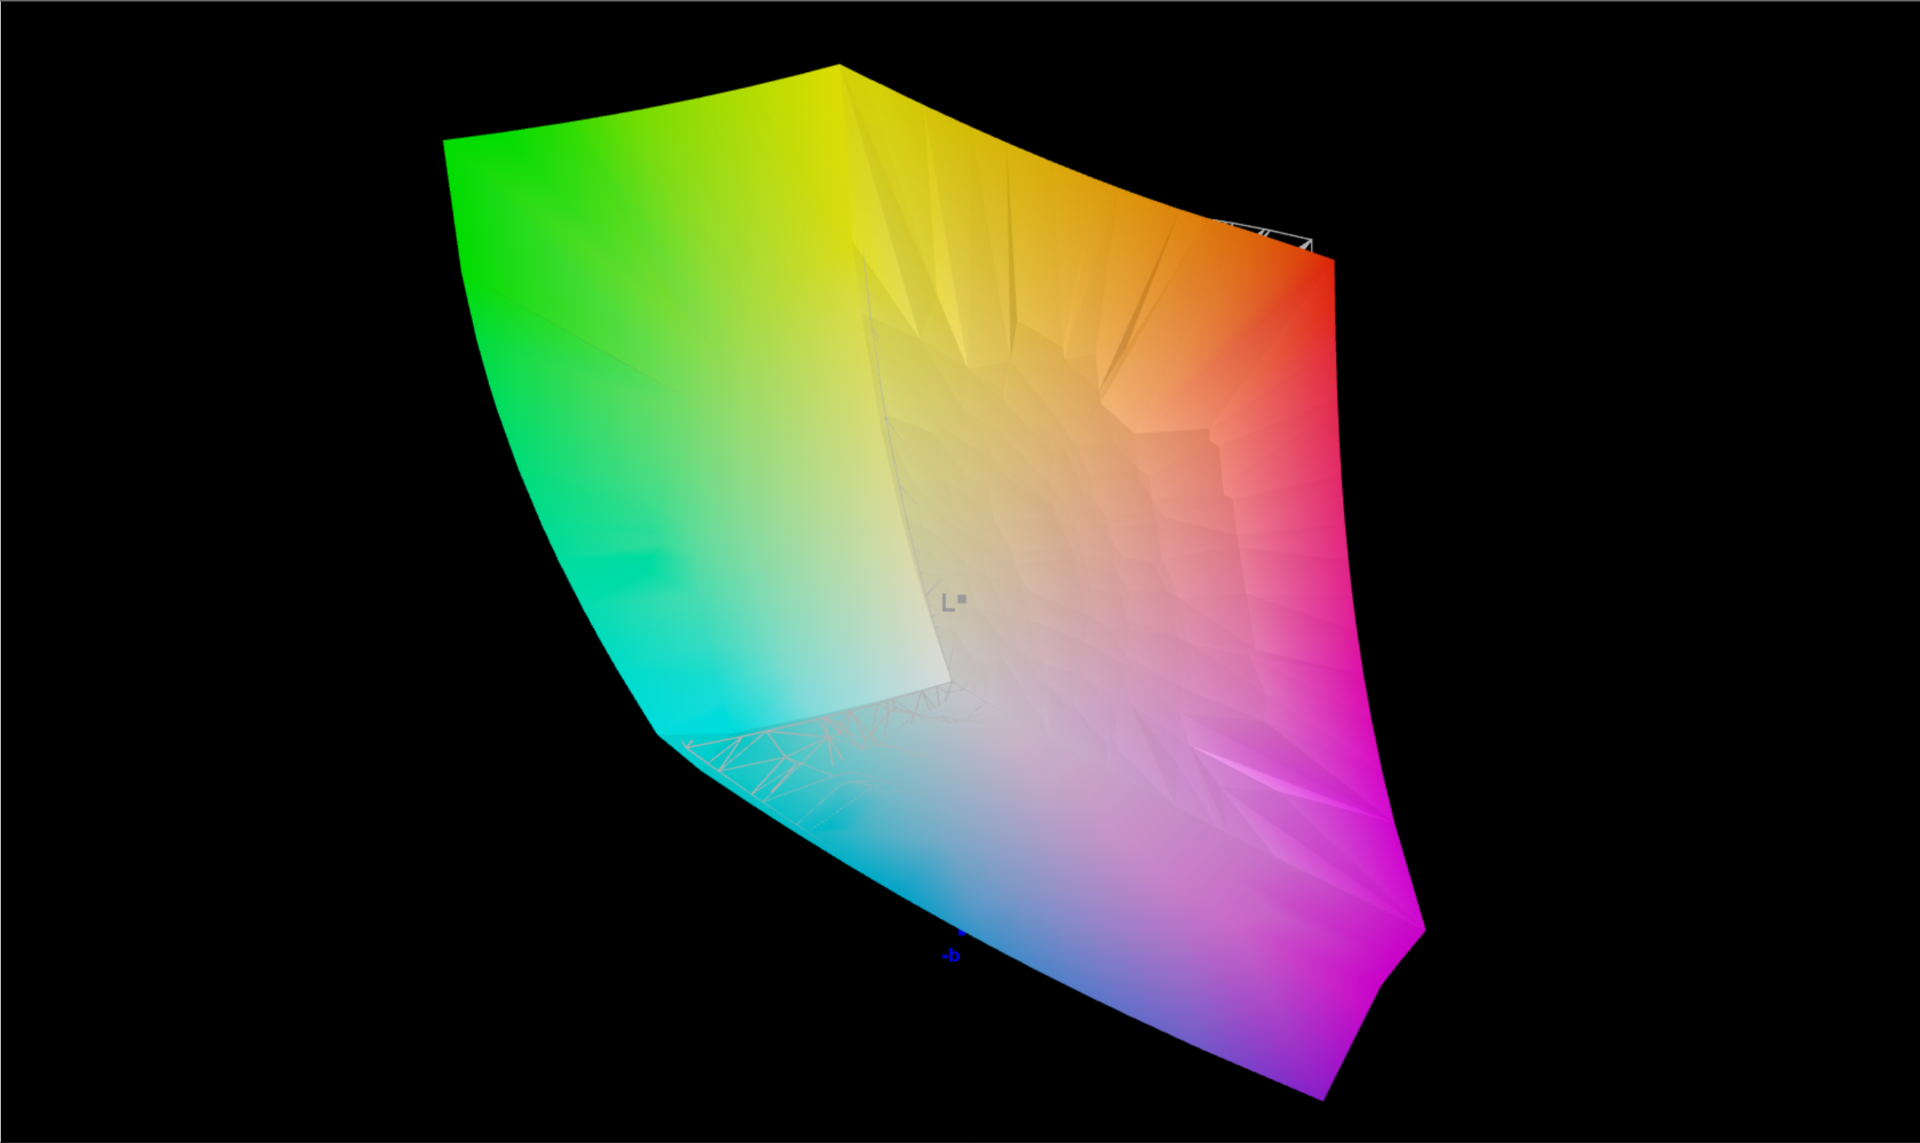
90.21% AdobeRGB 1998 (Argyll 3D)
99.99% sRGB (Argyll 3D)
99.82% Display P3 (Argyll 3D)
Gamma: 330.95
CCT: 7294 K
| Asus ROG Flow X16 GV601RW-M5082W AUO B160QAN02.S, Mini LED, 2560x1600, 16.1" | Asus ROG Zephyrus M16 GU603H AU Optronics AUOC199, IPS, 2560x1600, 16" | Gigabyte Aero 16 YE5 Samsung SDC416B, AMOLED, 3840x2400, 16" | MSI Stealth GS66 12UGS Sharp LQ156T1JW04 (SHP153C), IPS-Level, 2560x1440, 15.6" | Lenovo Legion 5 Pro 16 G7 i7 RTX 3070Ti NE160QDM-NY1, IPS, 2560x1600, 16" | Apple MacBook Pro 16 2021 M1 Pro Liquid Retina XDR, Mini-LED, 3456x2234, 16.2" | Lenovo ThinkPad X1 Extreme G4-20Y5CTO1WW (3050 Ti) LP160UQ1-SPB1, IPS LED, 3840x2400, 16" | Dell XPS 17 9720 RTX 3060 Sharp LQ170R1, IPS, 3840x2400, 17" | Microsoft Surface Laptop Studio i7 RTX 3050 Ti LQ144P1JX01, IPS, 2400x1600, 14.4" | |
|---|---|---|---|---|---|---|---|---|---|
| Display | -3% | -18% | -1% | -3% | -4% | -11% | |||
| Display P3 Coverage (%) | 99.82 | 96.4 -3% | 68.7 -31% | 99.1 -1% | 84.3 -16% | 92.9 -7% | 80.6 -19% | ||
| sRGB Coverage (%) | 99.99 | 99.7 0% | 97.6 -2% | 100 0% | 98.3 -2% | 100 0% | 99.9 0% | ||
| AdobeRGB 1998 Coverage (%) | 90.21 | 85.6 -5% | 70.9 -21% | 88 -2% | 97.8 8% | 85.3 -5% | 78.5 -13% | ||
| Response Times | 51% | 80% | 35% | -15% | -511% | -364% | -293% | -275% | |
| Response Time Grey 50% / Grey 80% * (ms) | 11 ? | 4.8 ? 56% | 2.4 ? 78% | 6 ? 45% | 17.6 ? -60% | 42.8 ? -289% | 60 ? -445% | 51.2 ? -365% | 58.4 ? -431% |
| Response Time Black / White * (ms) | 11 ? | 6 ? 45% | 2 ? 82% | 8.4 ? 24% | 7.6 ? 31% | 91.6 ? -733% | 42 ? -282% | 35.2 ? -220% | 24 ? -118% |
| PWM Frequency (Hz) | 7400 ? | 60 ? | 14880 | 5000 ? | |||||
| Screen | -61% | 104% | -57% | -32% | 82% | -32% | -90% | -5% | |
| Brightness middle (cd/m²) | 498 | 448 -10% | 368 -26% | 272 -45% | 502 1% | 514 3% | 639 28% | 512.7 3% | 497 0% |
| Brightness (cd/m²) | 502 | 446 -11% | 368 -27% | 253 -50% | 491 -2% | 497 -1% | 612 22% | 463 -8% | 491 -2% |
| Brightness Distribution (%) | 94 | 86 -9% | 93 -1% | 87 -7% | 91 -3% | 95 1% | 84 -11% | 85 -10% | 92 -2% |
| Black Level * (cd/m²) | 0.11 | 0.48 -336% | 0.01 91% | 0.25 -127% | 0.37 -236% | 0.02 82% | 0.47 -327% | 0.32 -191% | 0.29 -164% |
| Contrast (:1) | 4527 | 933 -79% | 36800 713% | 1088 -76% | 1357 -70% | 25700 468% | 1360 -70% | 1602 -65% | 1714 -62% |
| Colorchecker dE 2000 * | 1.87 | 2.76 -48% | 2.33 -25% | 3.73 -99% | 2.7 -44% | 1.4 25% | 2.2 -18% | 5.98 -220% | 1.2 36% |
| Colorchecker dE 2000 max. * | 6.15 | 7.09 -15% | 4.34 29% | 9.43 -53% | 4.5 27% | 2.8 54% | 5.3 14% | 12.09 -97% | 2.8 54% |
| Colorchecker dE 2000 calibrated * | 1.94 | 2.86 -47% | 0.98 49% | 1.4 28% | 1.4 28% | 0.8 59% | |||
| Greyscale dE 2000 * | 3.15 | 3.1 2% | 0.8 75% | 6.5 -106% | 2.7 14% | 2.3 27% | 1.7 46% | 7.2 -129% | 1.9 40% |
| Gamma | 330.95 1% | 2.153 102% | 2.119 104% | 2.172 101% | 2.44 90% | 2.27 97% | 2.31 95% | 2.54 87% | 2.14 103% |
| CCT | 7294 89% | 6826 95% | 6569 99% | 6485 100% | 6326 103% | 6792 96% | 6390 102% | 6914 94% | 6821 95% |
| Color Space (Percent of AdobeRGB 1998) (%) | 87 | ||||||||
| Color Space (Percent of sRGB) (%) | 100 | ||||||||
| Média Total (Programa/Configurações) | -5% /
-41% | 92% /
99% | -8% /
-32% | -22% /
-26% | -143% /
-28% | -133% /
-73% | -129% /
-101% | -97% /
-44% |
* ... menor é melhor
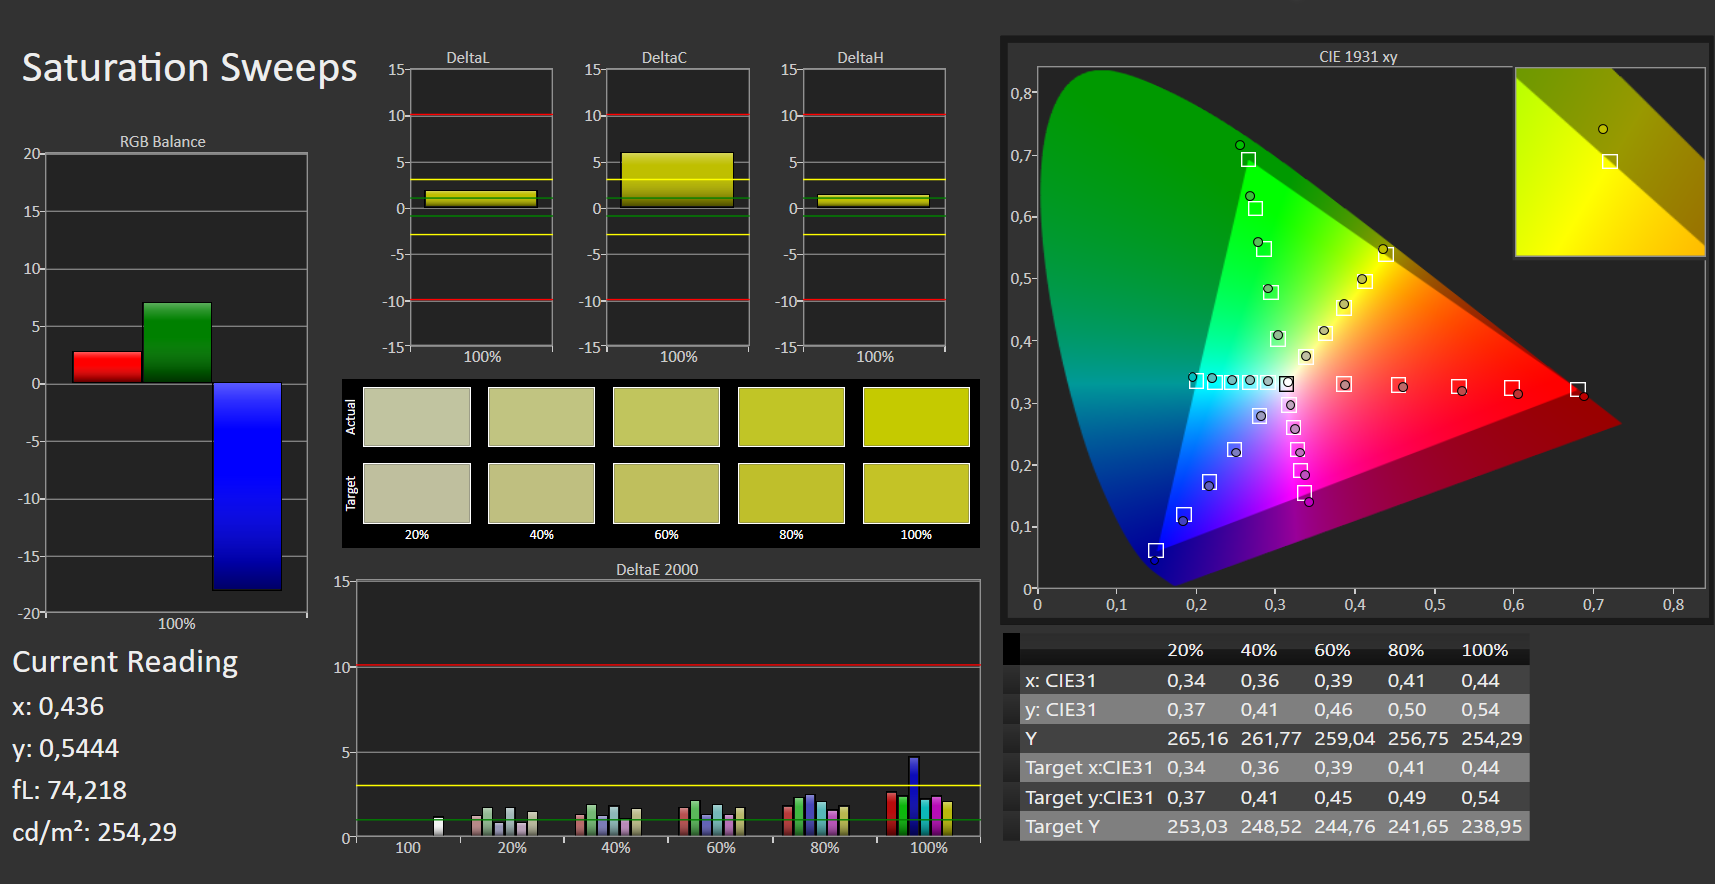
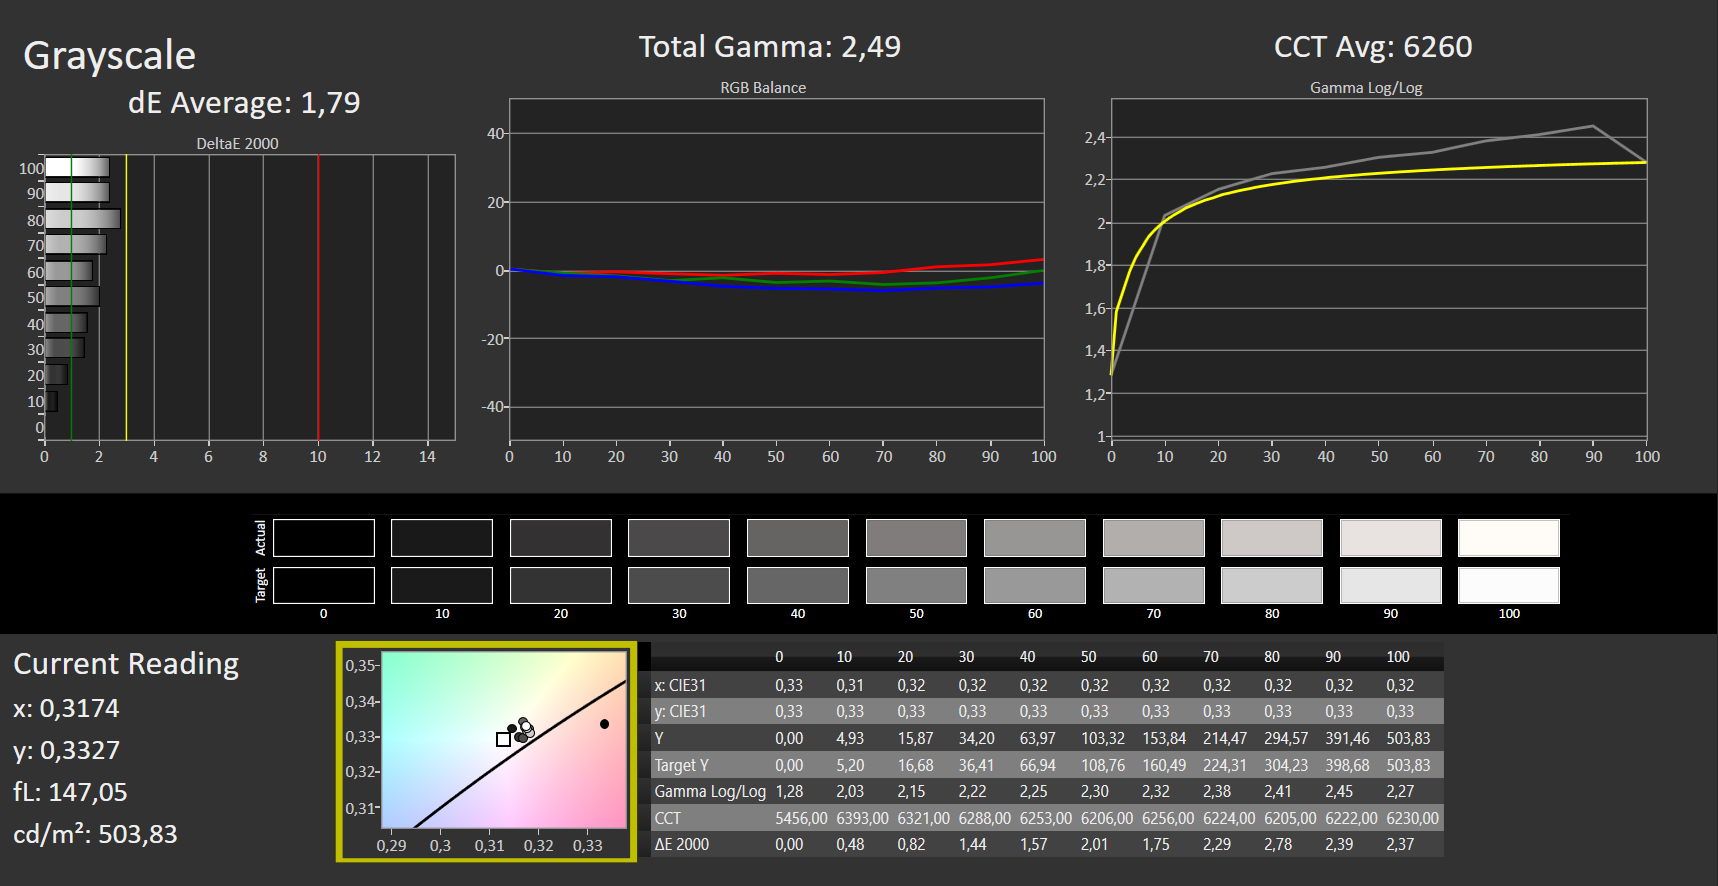
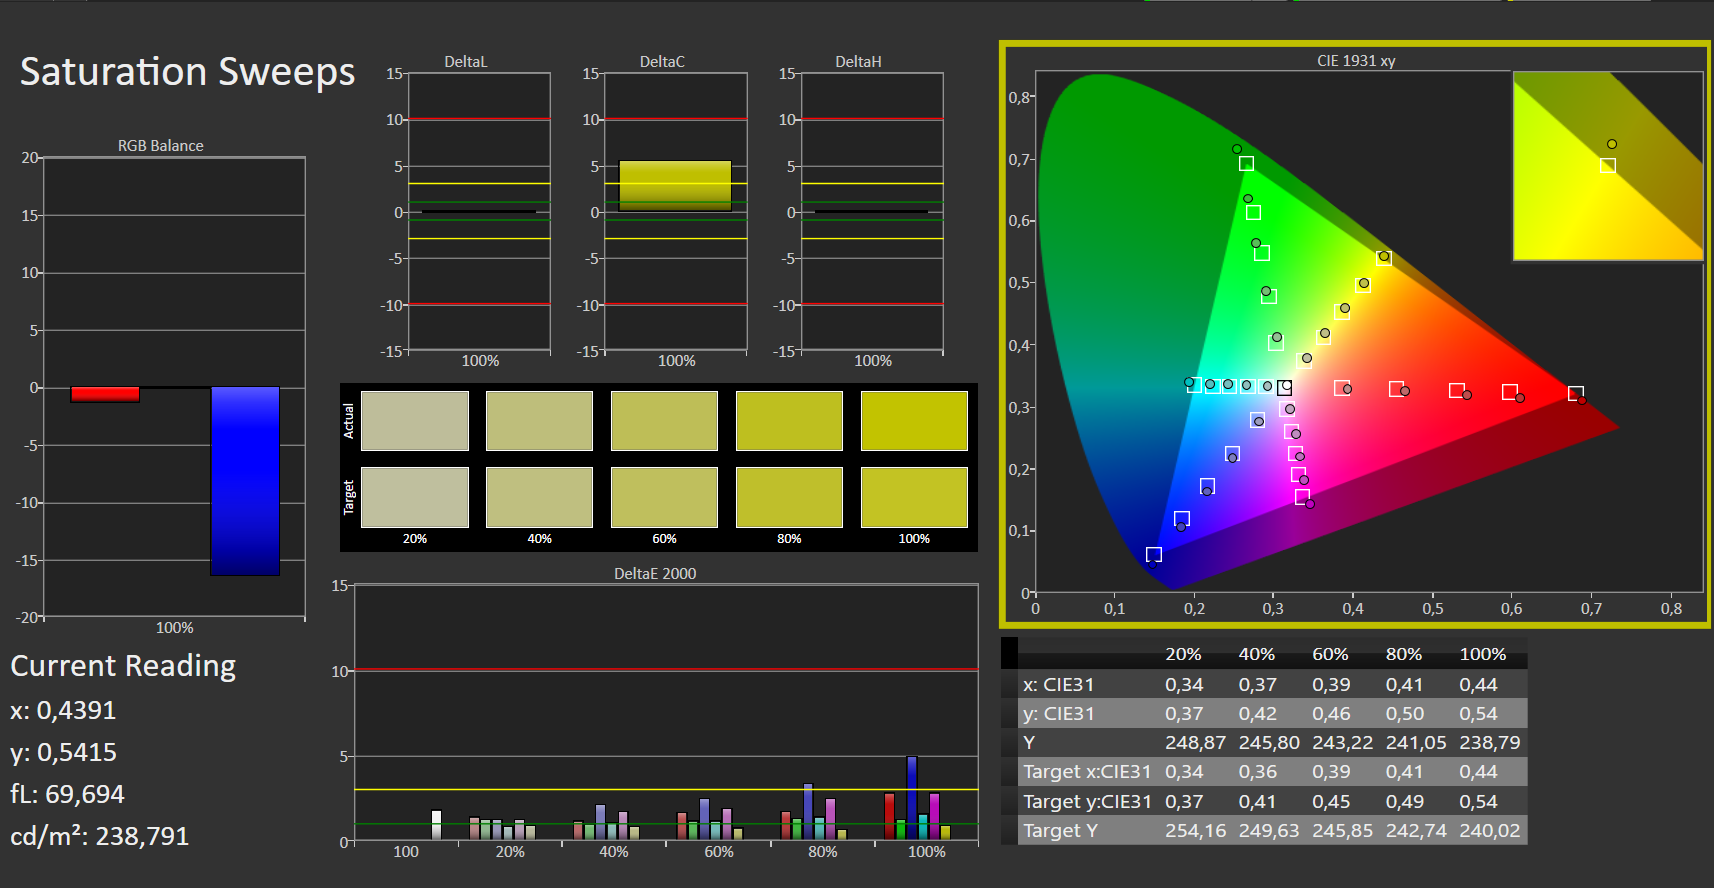
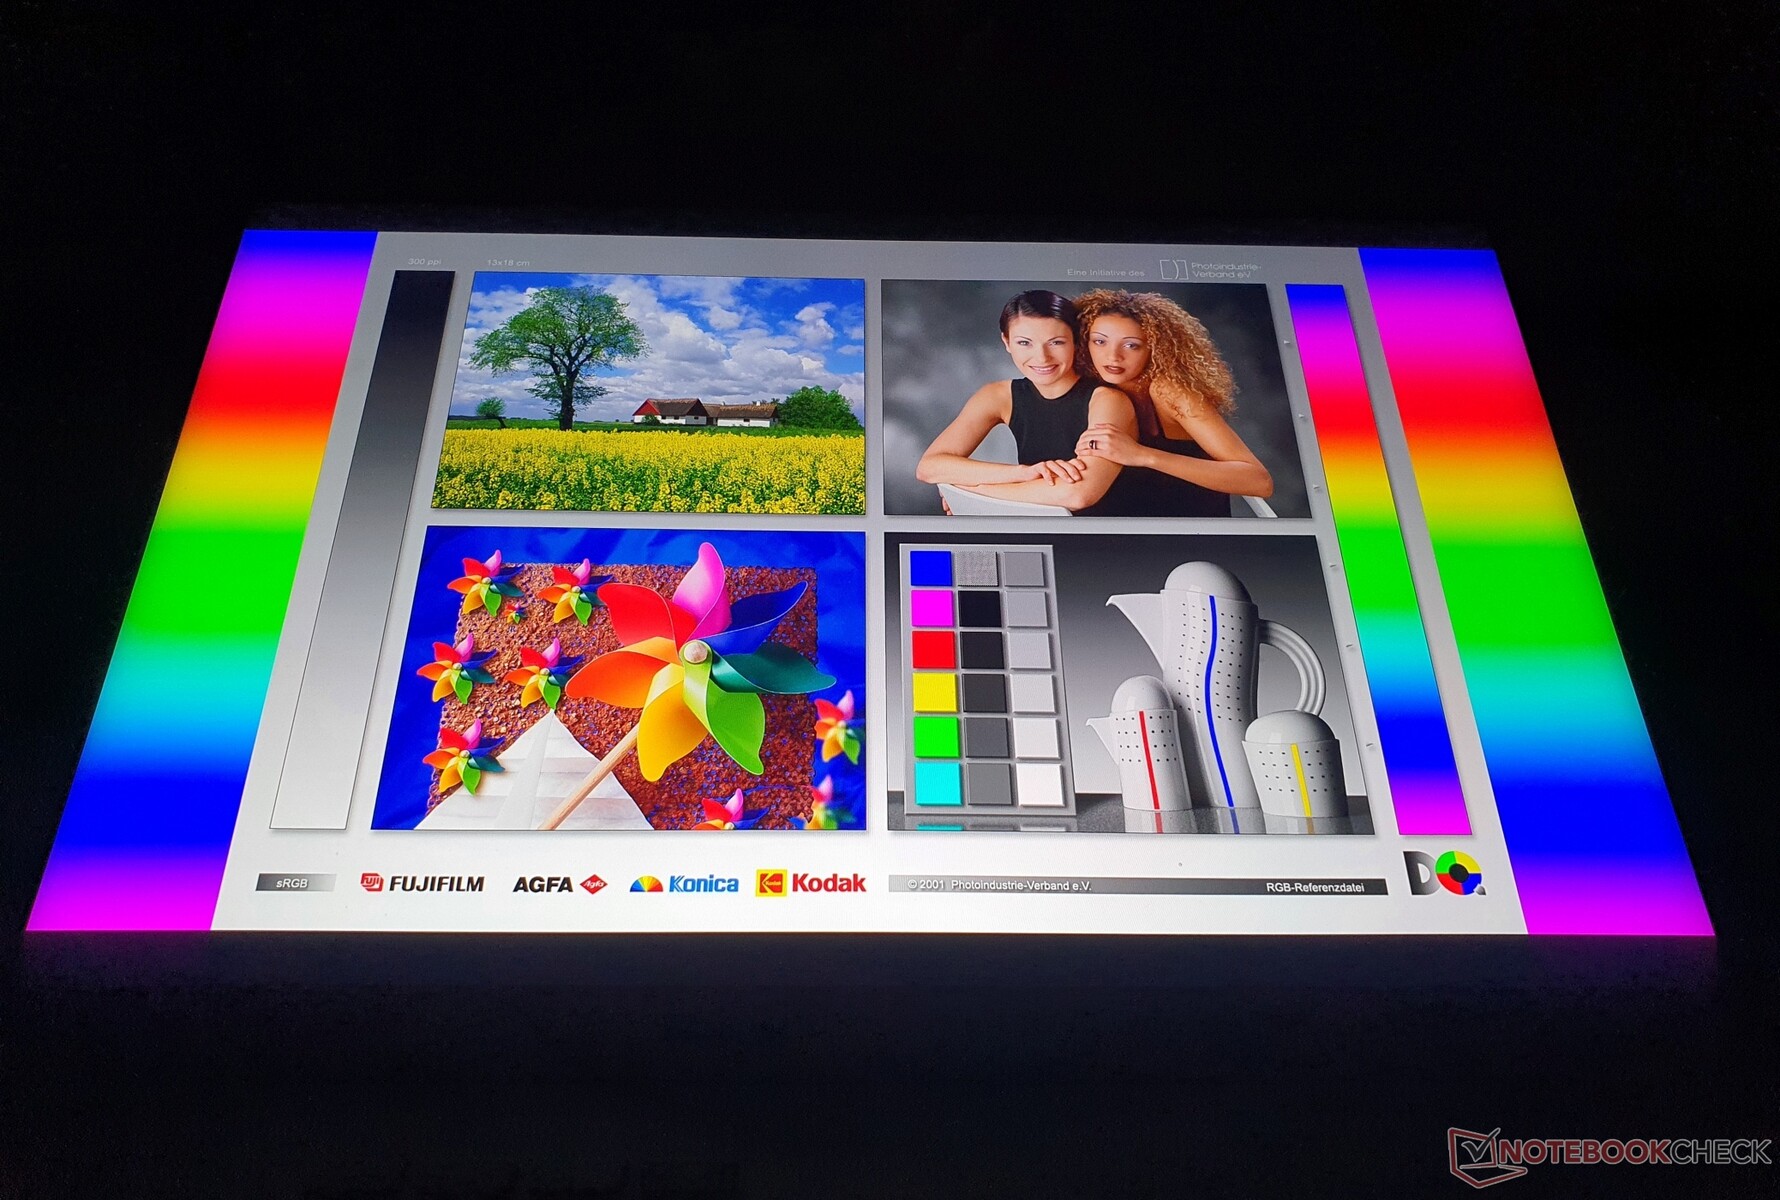
Em nosso campo de teste, o ROG Flow X16 é o único notebook que cobre mais de 90% do espaço de cor Adobe RGB (90,2%). sRGB e DCI-P3 são cobertos até ~100%. Portanto, nada se opõe a exigir a edição de imagens e vídeos.
Os valores DeltaE-2000 do visor de mini LED calibrado de fábrica (certificação Pantone) estão abaixo do limiar de 3 para cores e para escala de cinza. No entanto, o azul se desvia com um valor de 6,15, que não conseguimos melhorar através da calibração. O equilíbrio de vermelho, verde e azul pode ser descrito como perfeito. Portanto, não há absolutamente nenhum elenco de cores.
Como sempre, o perfil de cor calibrado está disponível para download ao lado do gráfico de iluminação.
Exibir tempos de resposta
| ↔ Tempo de resposta preto para branco | ||
|---|---|---|
| 11 ms ... ascensão ↗ e queda ↘ combinadas | ↗ 1 ms ascensão |  |
| ↘ 10 ms queda | ||
| A tela mostra boas taxas de resposta em nossos testes, mas pode ser muito lenta para jogadores competitivos. Em comparação, todos os dispositivos testados variam de 0.1 (mínimo) a 240 (máximo) ms. » 30 % de todos os dispositivos são melhores. Isso significa que o tempo de resposta medido é melhor que a média de todos os dispositivos testados (19.8 ms). | ||
| ↔ Tempo de resposta 50% cinza a 80% cinza | ||
| 11 ms ... ascensão ↗ e queda ↘ combinadas | ↗ 1 ms ascensão |   |
| ↘ 10 ms queda | ||
| A tela mostra boas taxas de resposta em nossos testes, mas pode ser muito lenta para jogadores competitivos. Em comparação, todos os dispositivos testados variam de 0.165 (mínimo) a 636 (máximo) ms. » 25 % de todos os dispositivos são melhores. Isso significa que o tempo de resposta medido é melhor que a média de todos os dispositivos testados (30.9 ms). | ||
Cintilação da tela / PWM (modulação por largura de pulso)
| Tela tremeluzindo/PWM detectado | 7400 Hz | ≤ 100 % configuração de brilho |    |
A luz de fundo da tela pisca em 7400 Hz (pior caso, por exemplo, utilizando PWM) Cintilação detectada em uma configuração de brilho de 100 % e abaixo. Não deve haver cintilação ou PWM acima desta configuração de brilho. A frequência de 7400 Hz é bastante alta, então a maioria dos usuários sensíveis ao PWM não deve notar nenhuma oscilação. [pwm_comparison] Em comparação: 52 % de todos os dispositivos testados não usam PWM para escurecer a tela. Se PWM foi detectado, uma média de 7741 (mínimo: 5 - máximo: 343500) Hz foi medida. | |||
A tela reflete muito fortemente, de modo que mesmo 500 lêndeas de brilho são necessárias para uso em sombra (parcial). O uso do HDR com um brilho máximo de até 1.100 lêndeas permaneceu desativado no modo de bateria para fins de economia de energia.
As telas OLED ainda têm uma pequena vantagem na estabilidade do ângulo de visão, mas como é típico do IPS, a tela do Asus ROG Flow X16 está em um nível elevado
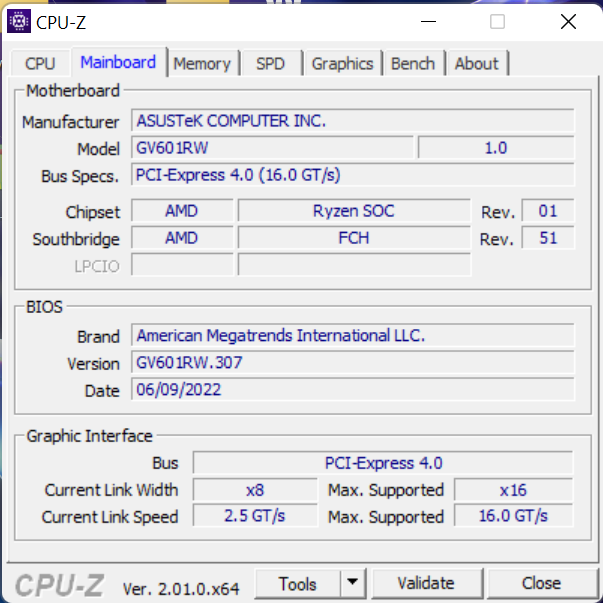
Desempenho - RTX 3070 Ti com 125 W em um laptop compacto para jogos
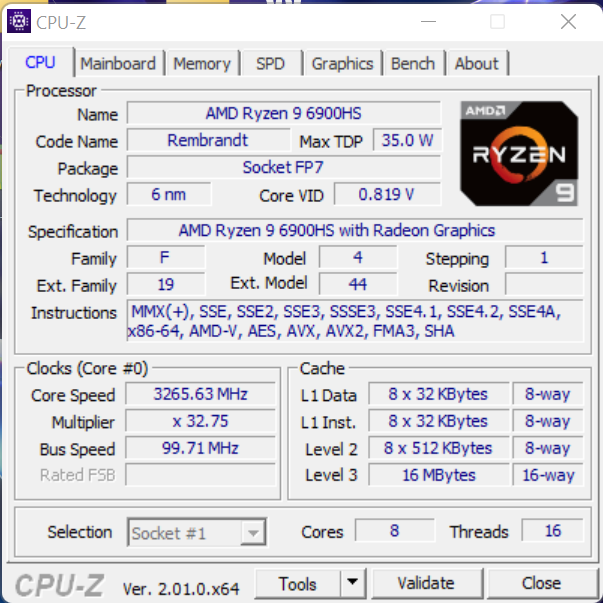
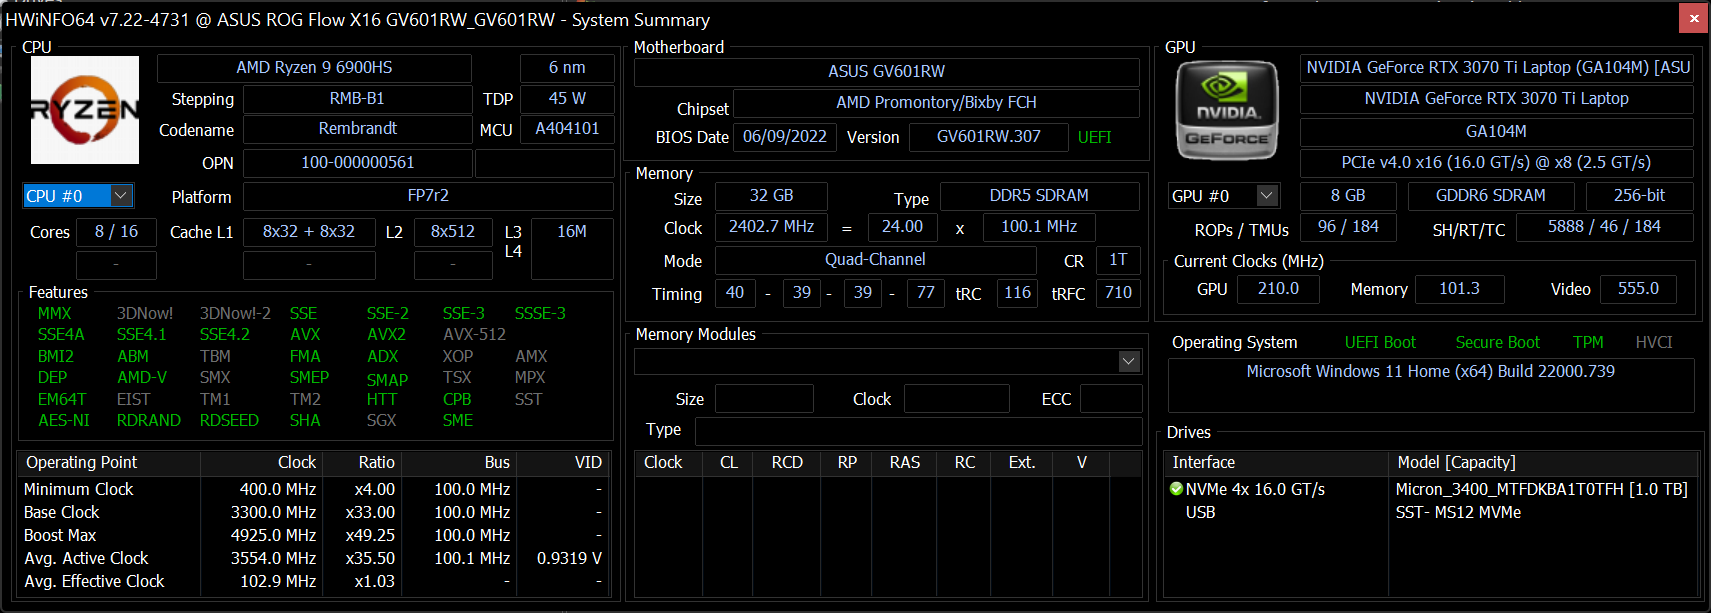
Nossa configuração é equipada com um AMD Ryzen 9 6900HS processador octa-core e um Nvidia GeForce RTX 3070 Ti com 125 watts de TGP (incluindo o Dynamic Boost). Um interruptor MUX também foi integrado.
Os modelos mais baratos apresentam umRTX 3060 ou um RTX 3050 Tieste último sempre vem com um Ryzen 7 6800HS(relógio inferior de 200 MHz).
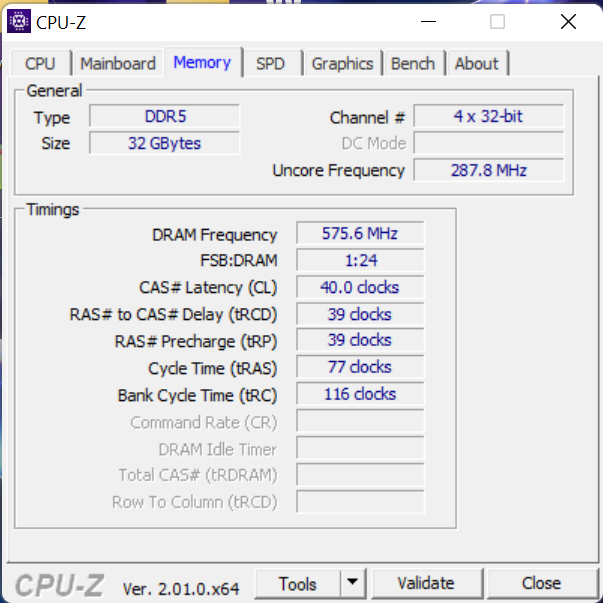
O ROG Flow X16 é enviado com 8 a 32 GB de DDR5-4800 RAM. Nossa unidade de revisão tem 32 GB de RAM (2 módulos de 16 GB em modo de canal duplo) e acomoda um SSD de 1 TB, que é a capacidade mínima oferecida. Um máximo de 2 TB pode ser encomendado e até dois SSDs PCIe 4.0 podem ser operados.
Condições de teste
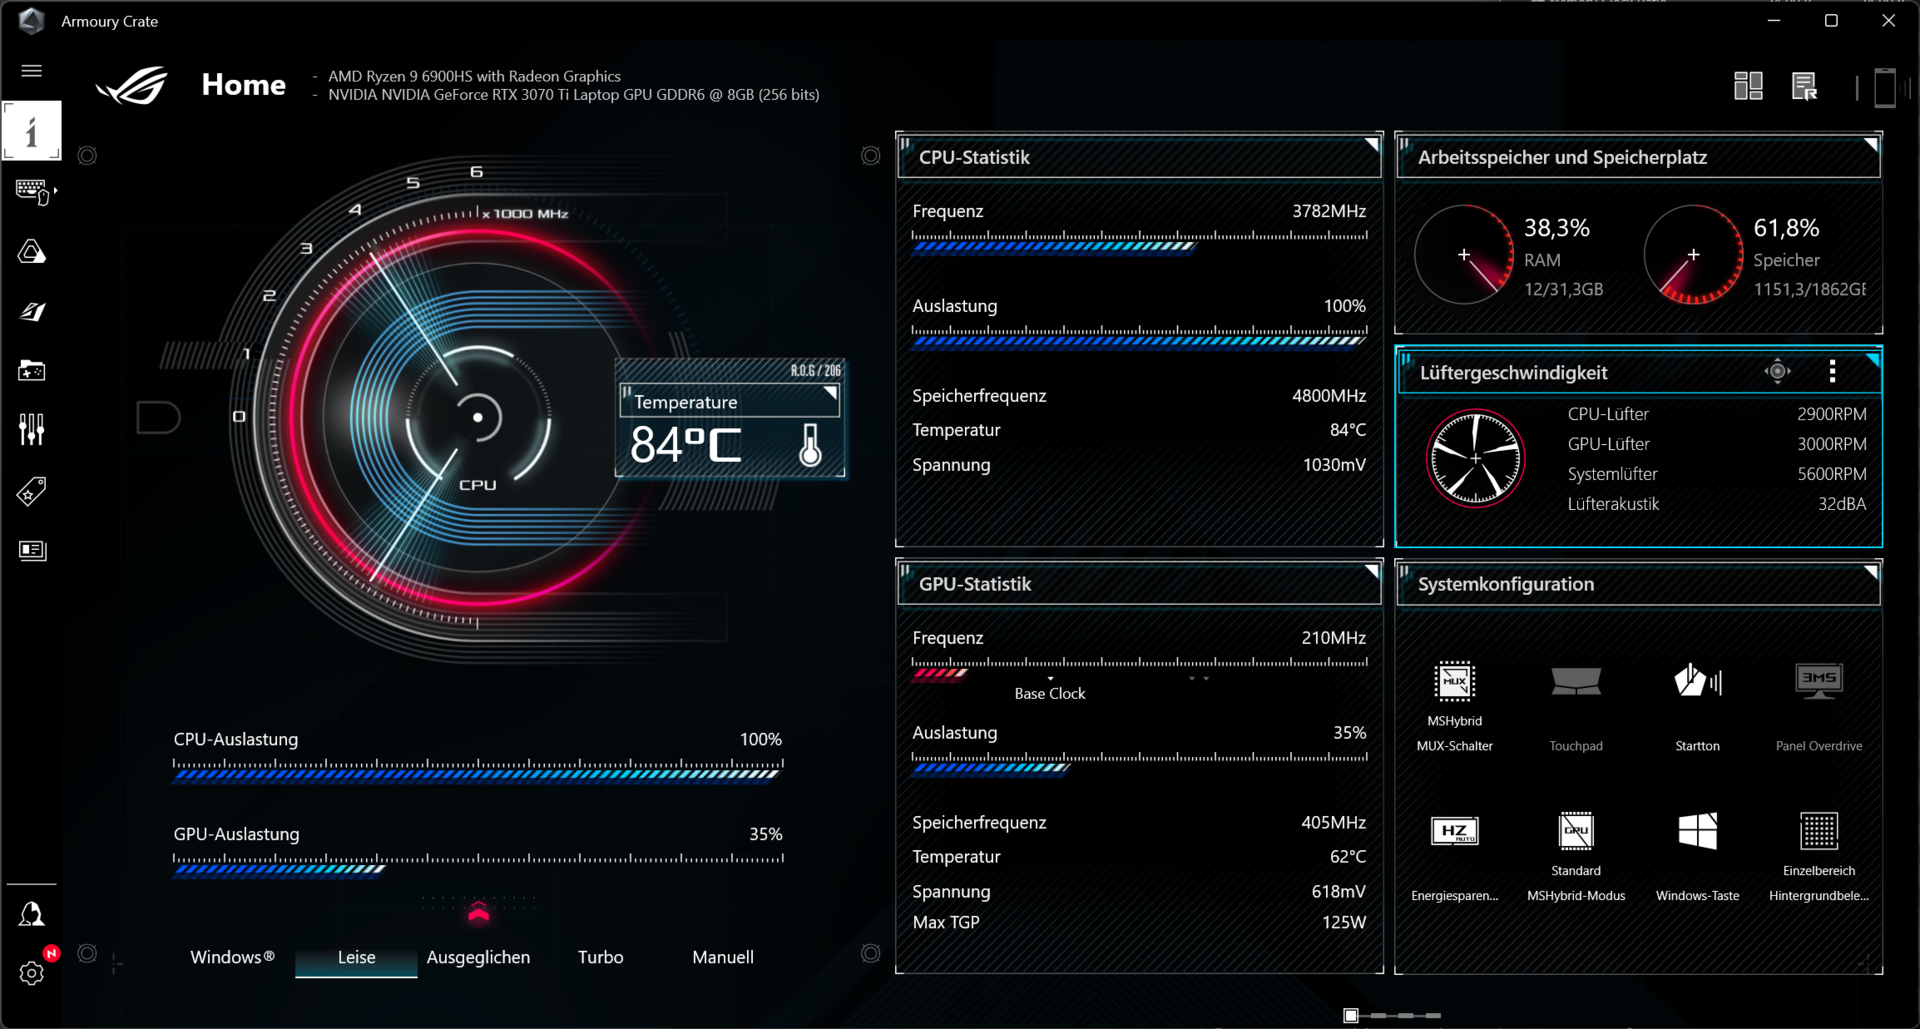
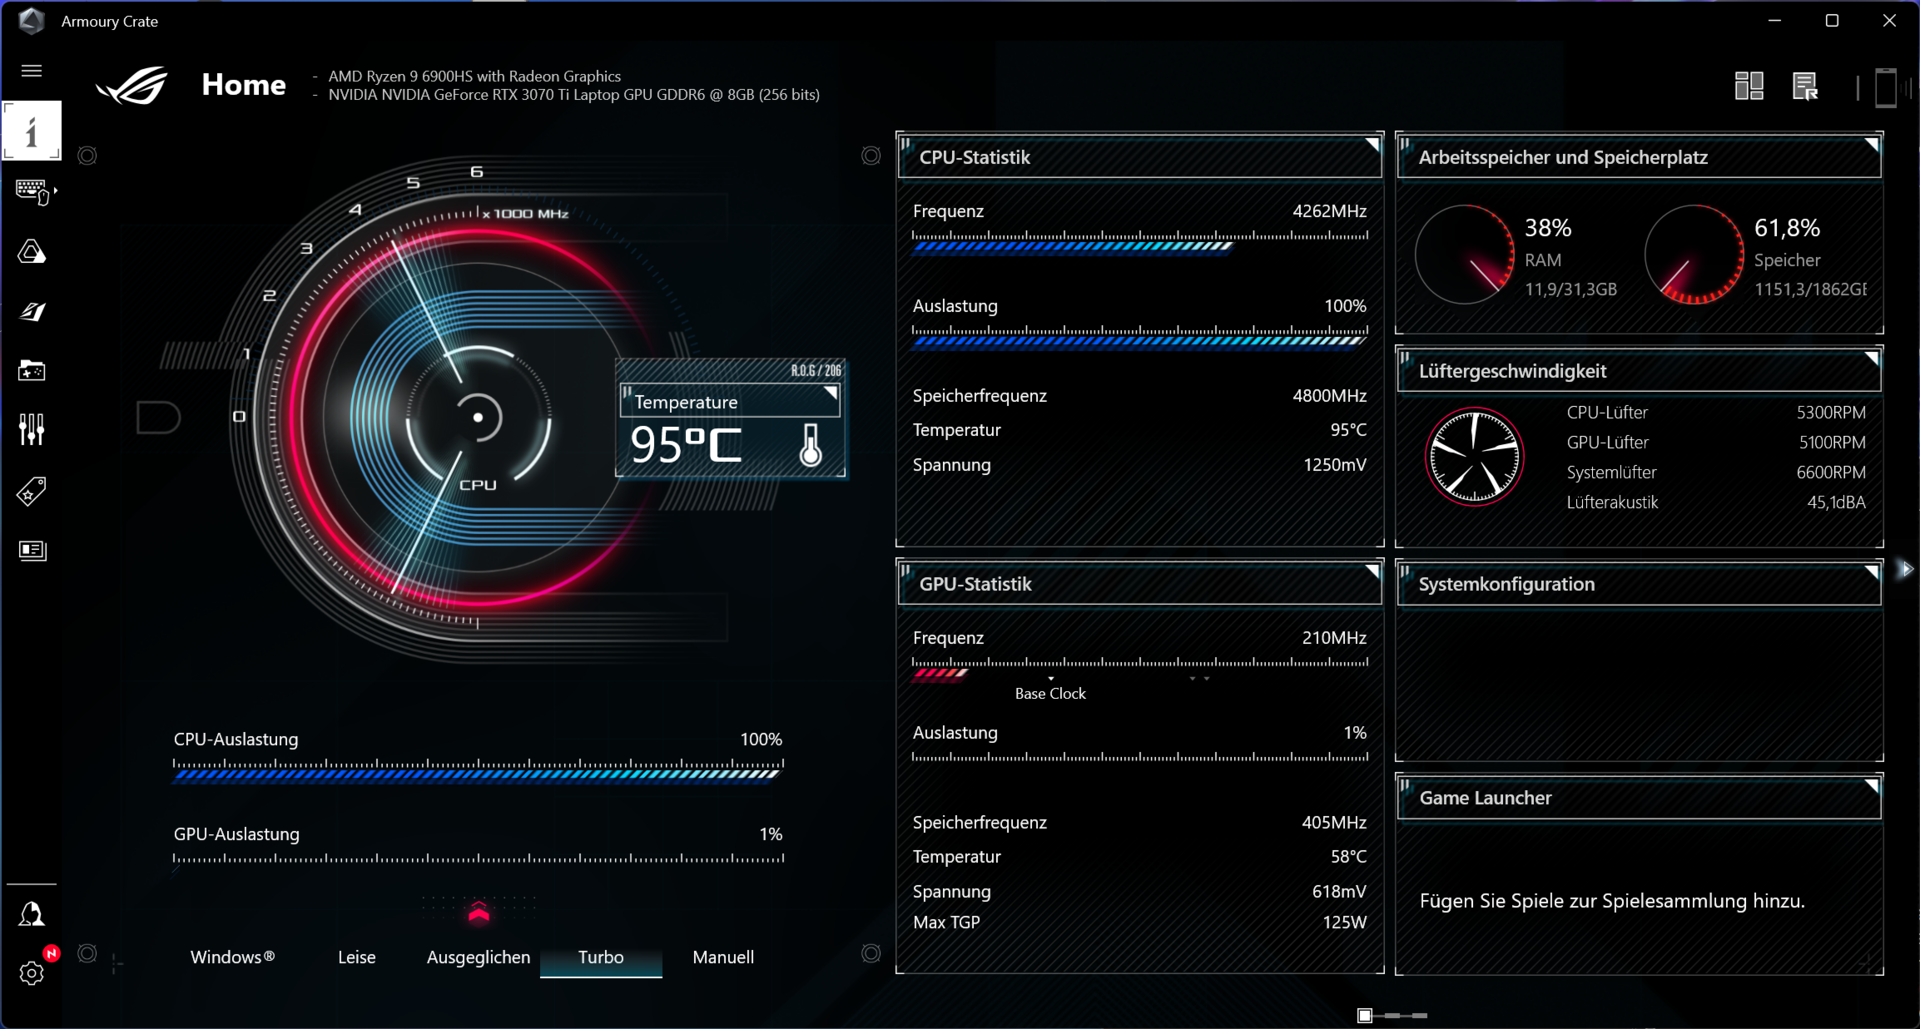
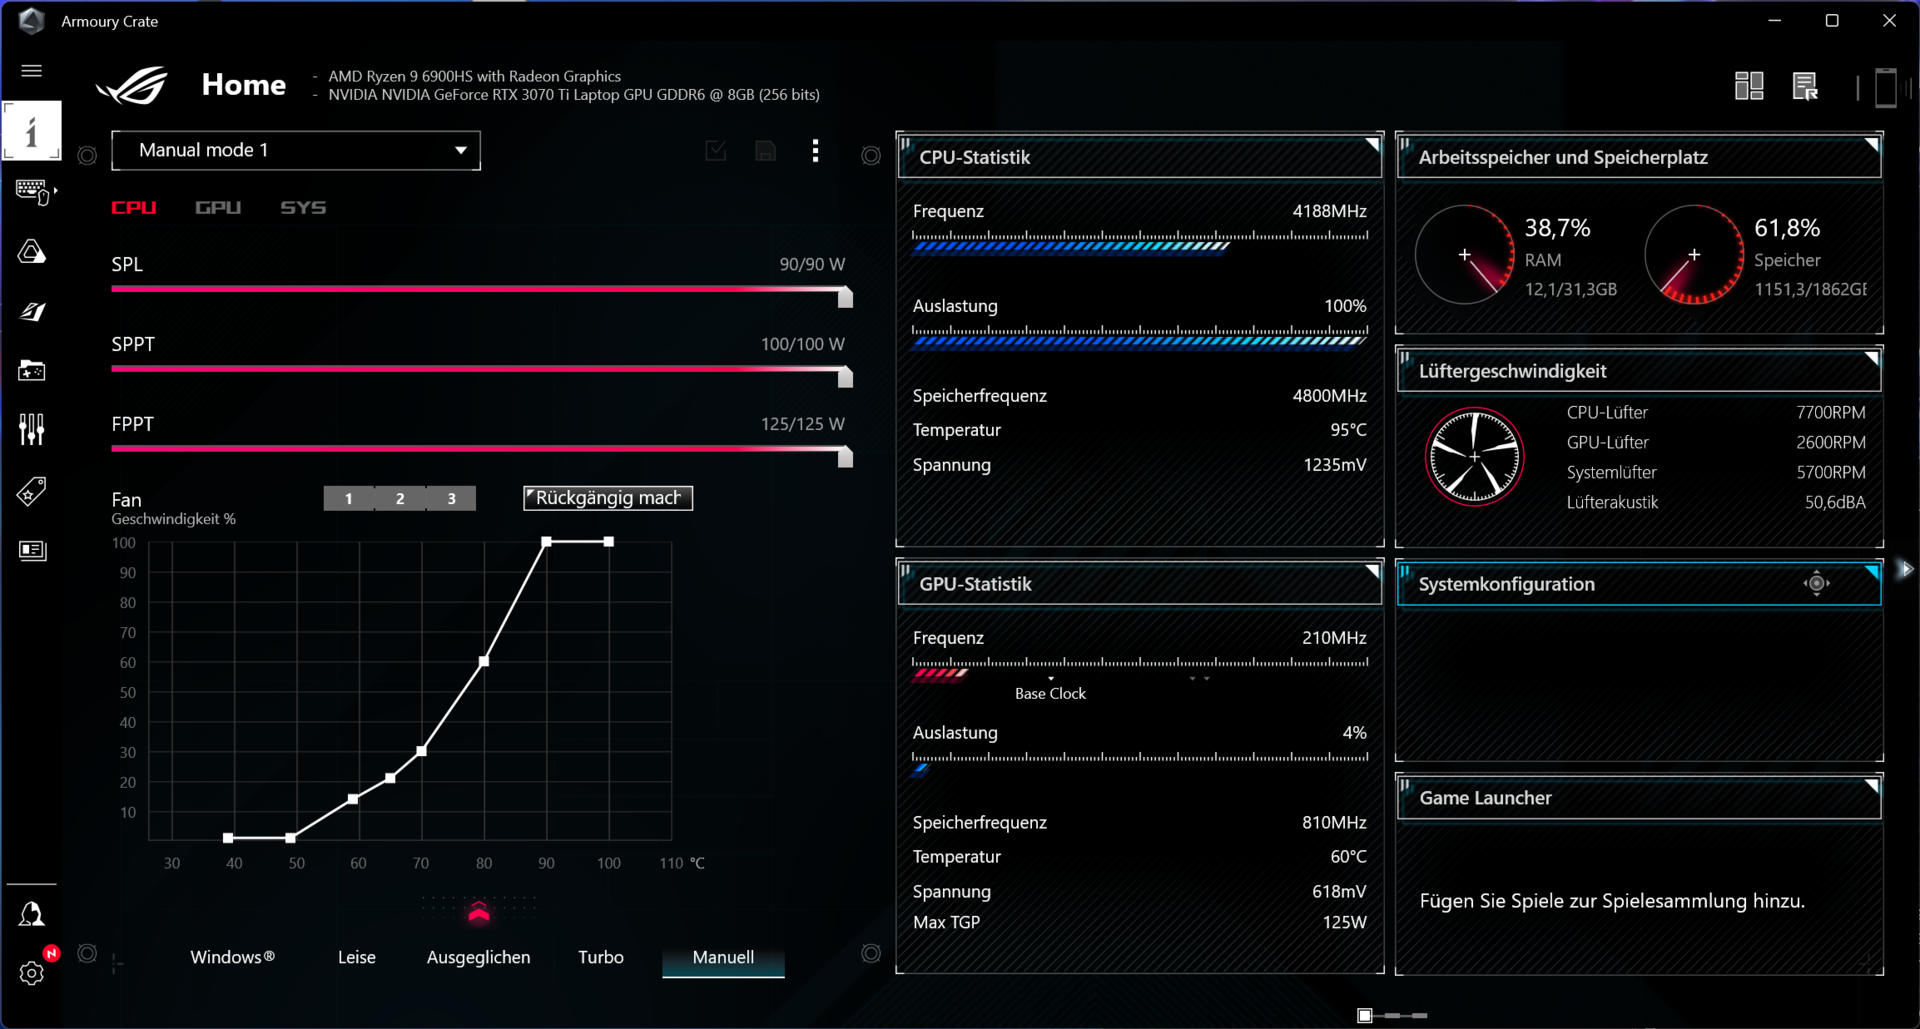
O software Asus Armoury Crate da Asus oferece quatro modos de desempenho diferentes: Silencioso, Balanceado ( "Performance" desde a versão 5.2.12), Turbo e Manual, dos quais Manual permite que você defina suas próprias curvas de ventilação e ajuste as configurações do TDP, bem como overclock do dGPU.
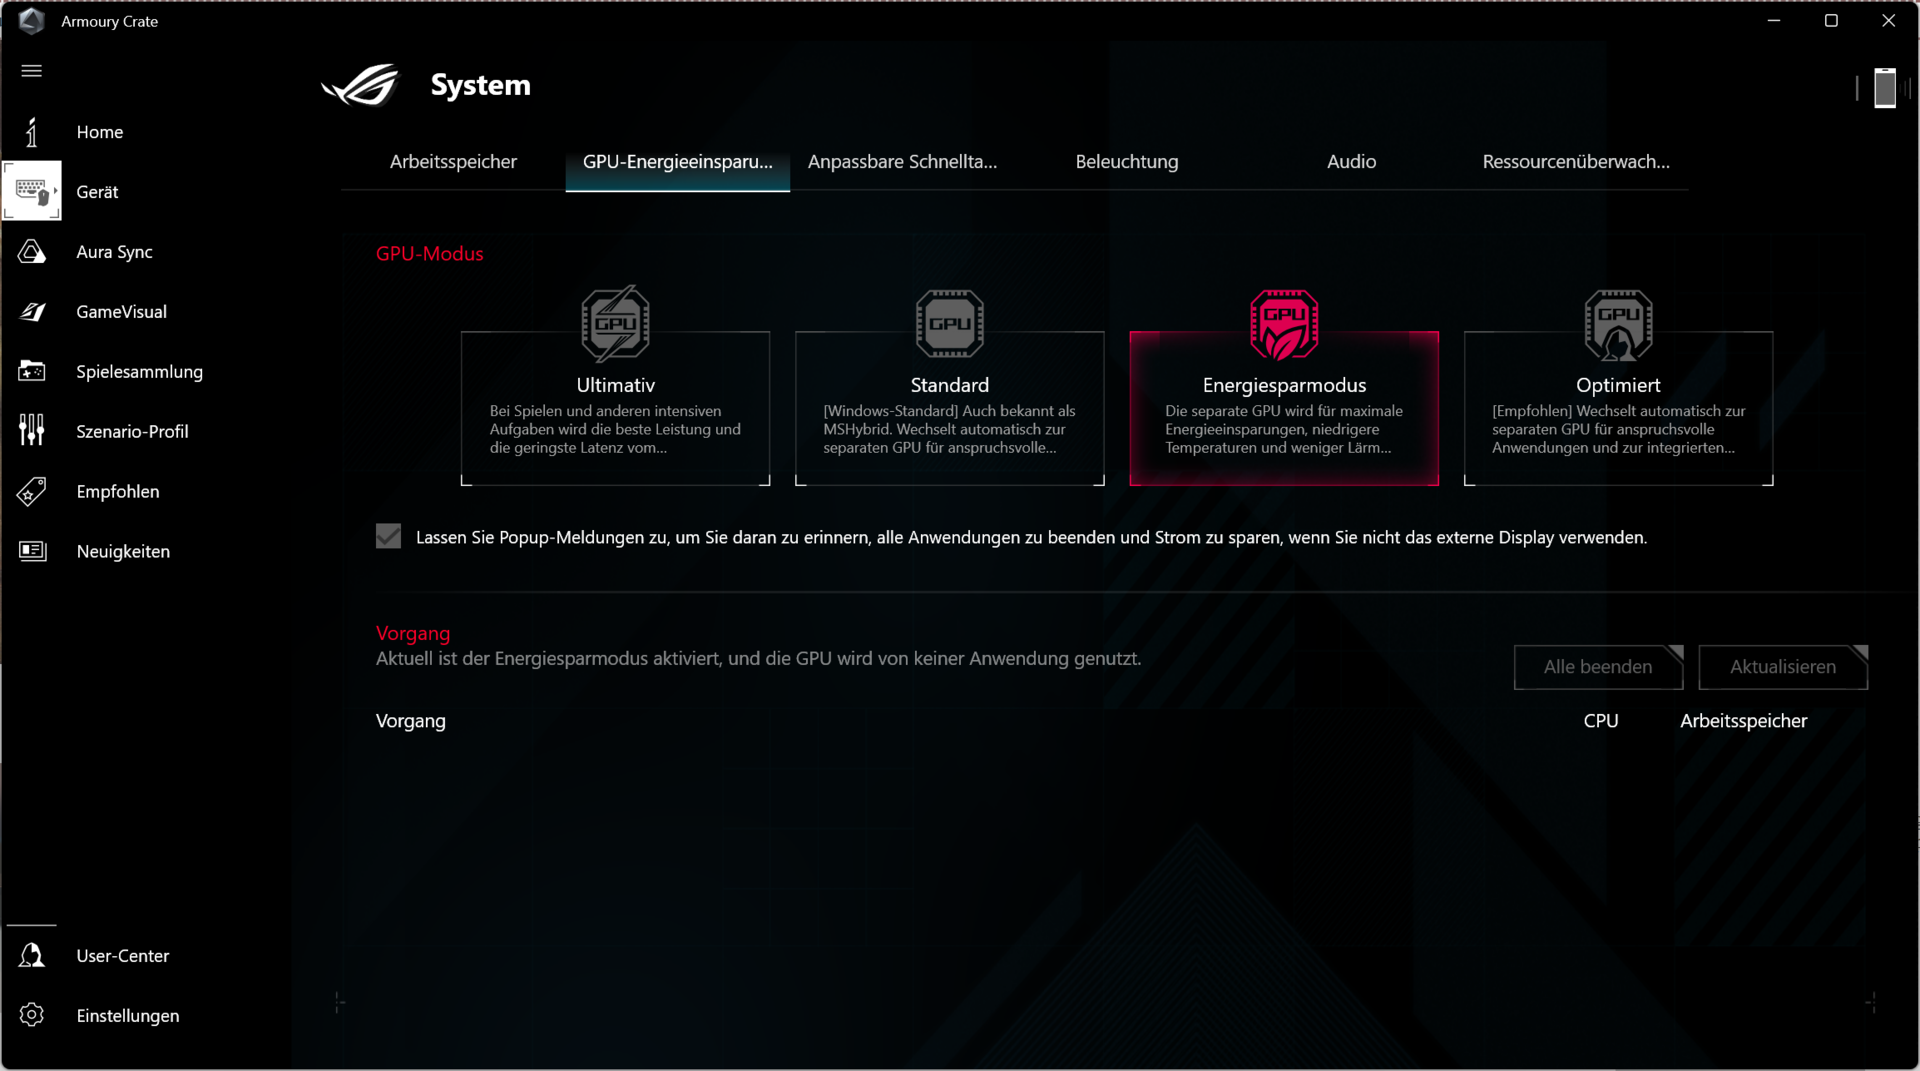
Há também quatro modos de GPU: Ultimate, Standard, Energy Saving e Optimized. "Ultimate" permite a chave MUX, que mantém oRTX 3070 Ti como GPU ativo o tempo todo e o conecta diretamente à tela interna em vez de fazer desvios através do iGPU da Radeon. A ativação requer um reinício (sem Advanced Optimus). No modo Standard , você pode alternar entre a unidade gráfica integrada e dedicada conforme necessário (Optimus / "MSHybrid"), enquanto no modo de Economia de Energia a GPU Nvidia é desativada (também em operação de rede) e a iGPU é usada. O modo otimizado corresponde ao modo Standard, com a diferença de que a GPU Nvidia está completamente desativada no modo de bateria.
Os efeitos dos diferentes modos no TDP/TGP, taxas de relógio, temperaturas e comportamento do ventilador são discutidos nas seções correspondentes "Processador", "Placa Gráfica" e "Emissões". Realizamos nossos benchmarks relacionados ao desempenho no modo Turbo e no modo Standard para a GPU. Os testes dos outros modos são discutidos durante toda a revisão. Os tempos de funcionamento da bateria no modo WLAN foram determinados em modo Balanceado e com o modo de economia de energia da GPU habilitado.
Muito poderia ser feito para melhorar o Amoury Crate, os valores de performance e os tempos de execução da bateria até o lançamento. Nosso dispositivo de revisão funciona na versão 5.1.8(Atualização: Para que o Armoury Crate permanecesse utilizável, uma atualização para a versão 5.2.12 teve que ser instalada), BIOS versão 307 e driver 512.78 GeForce.

Processador
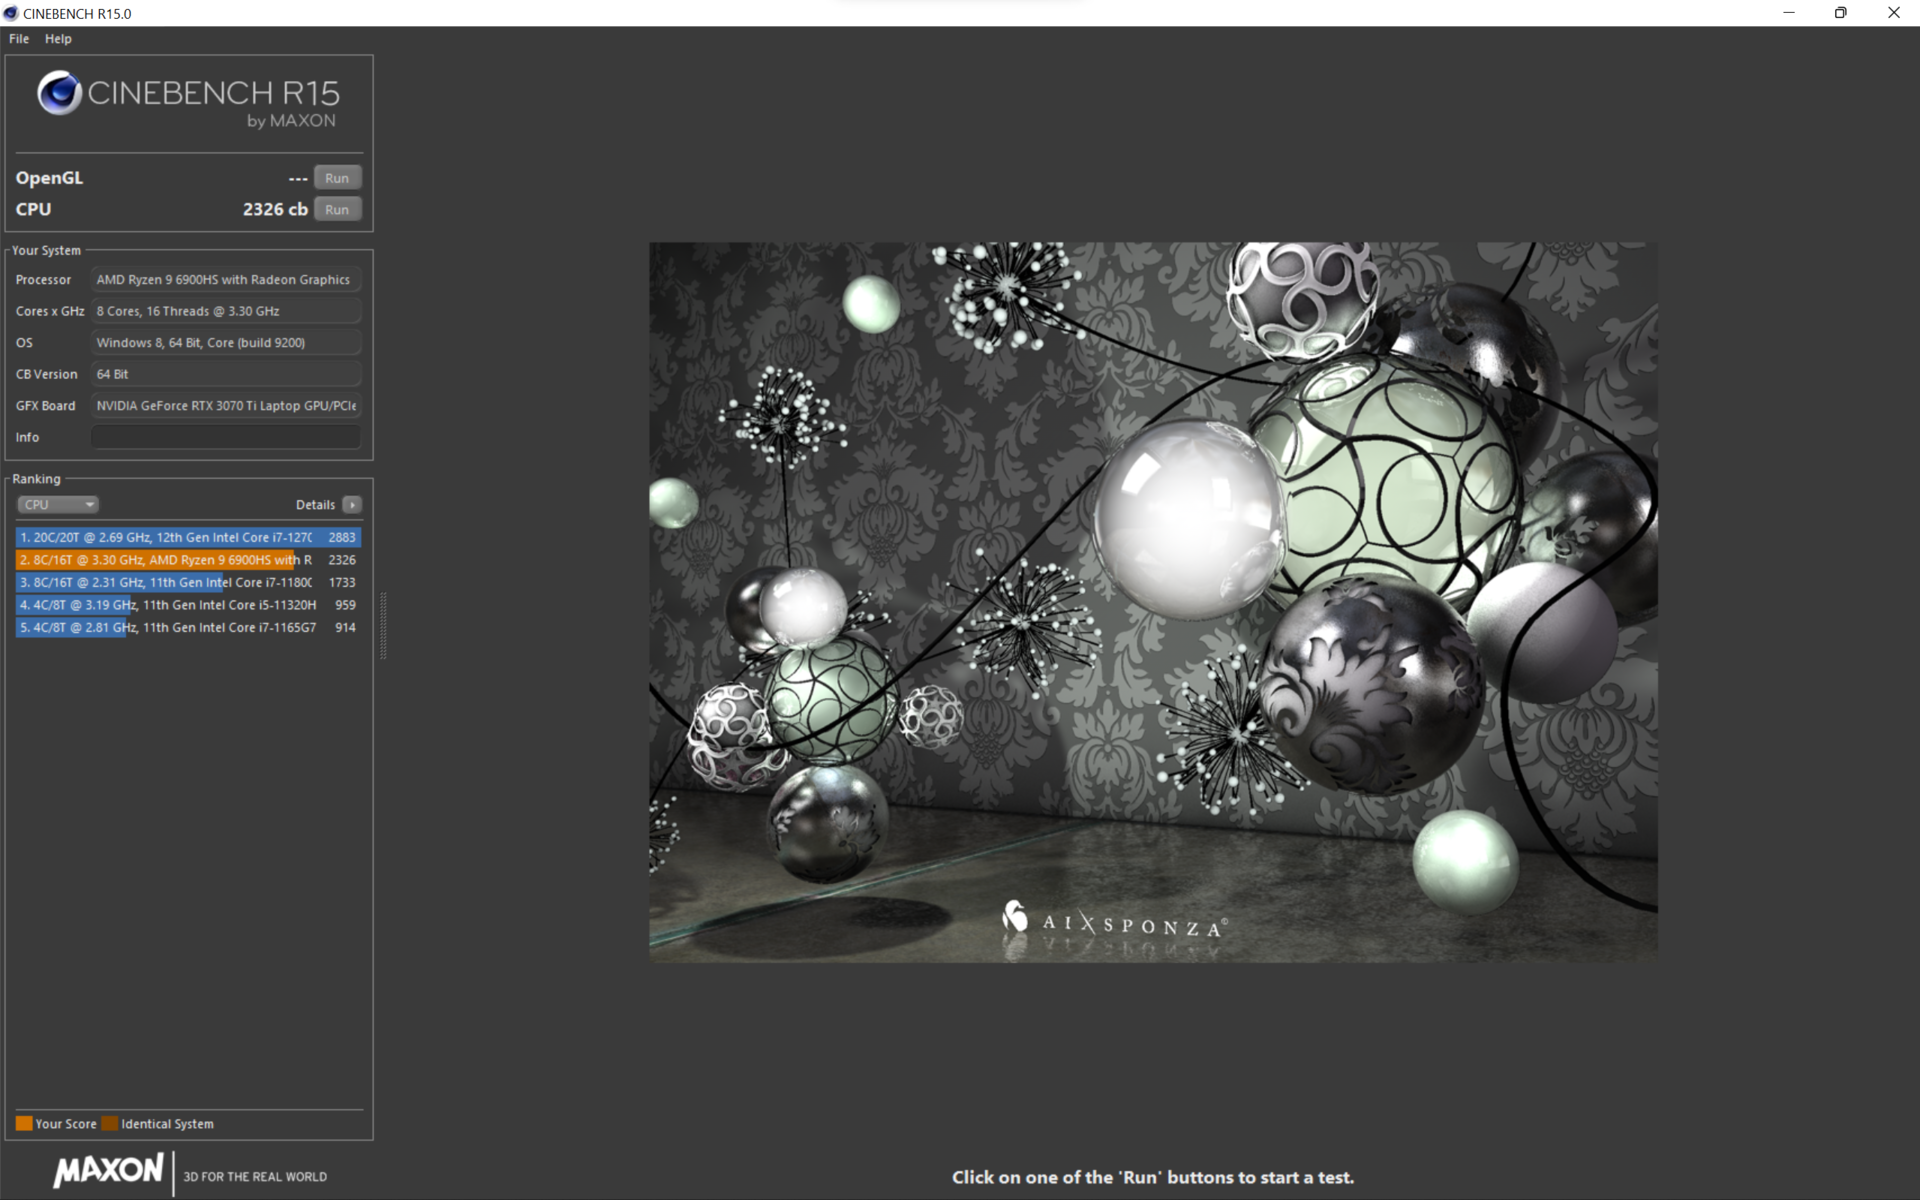
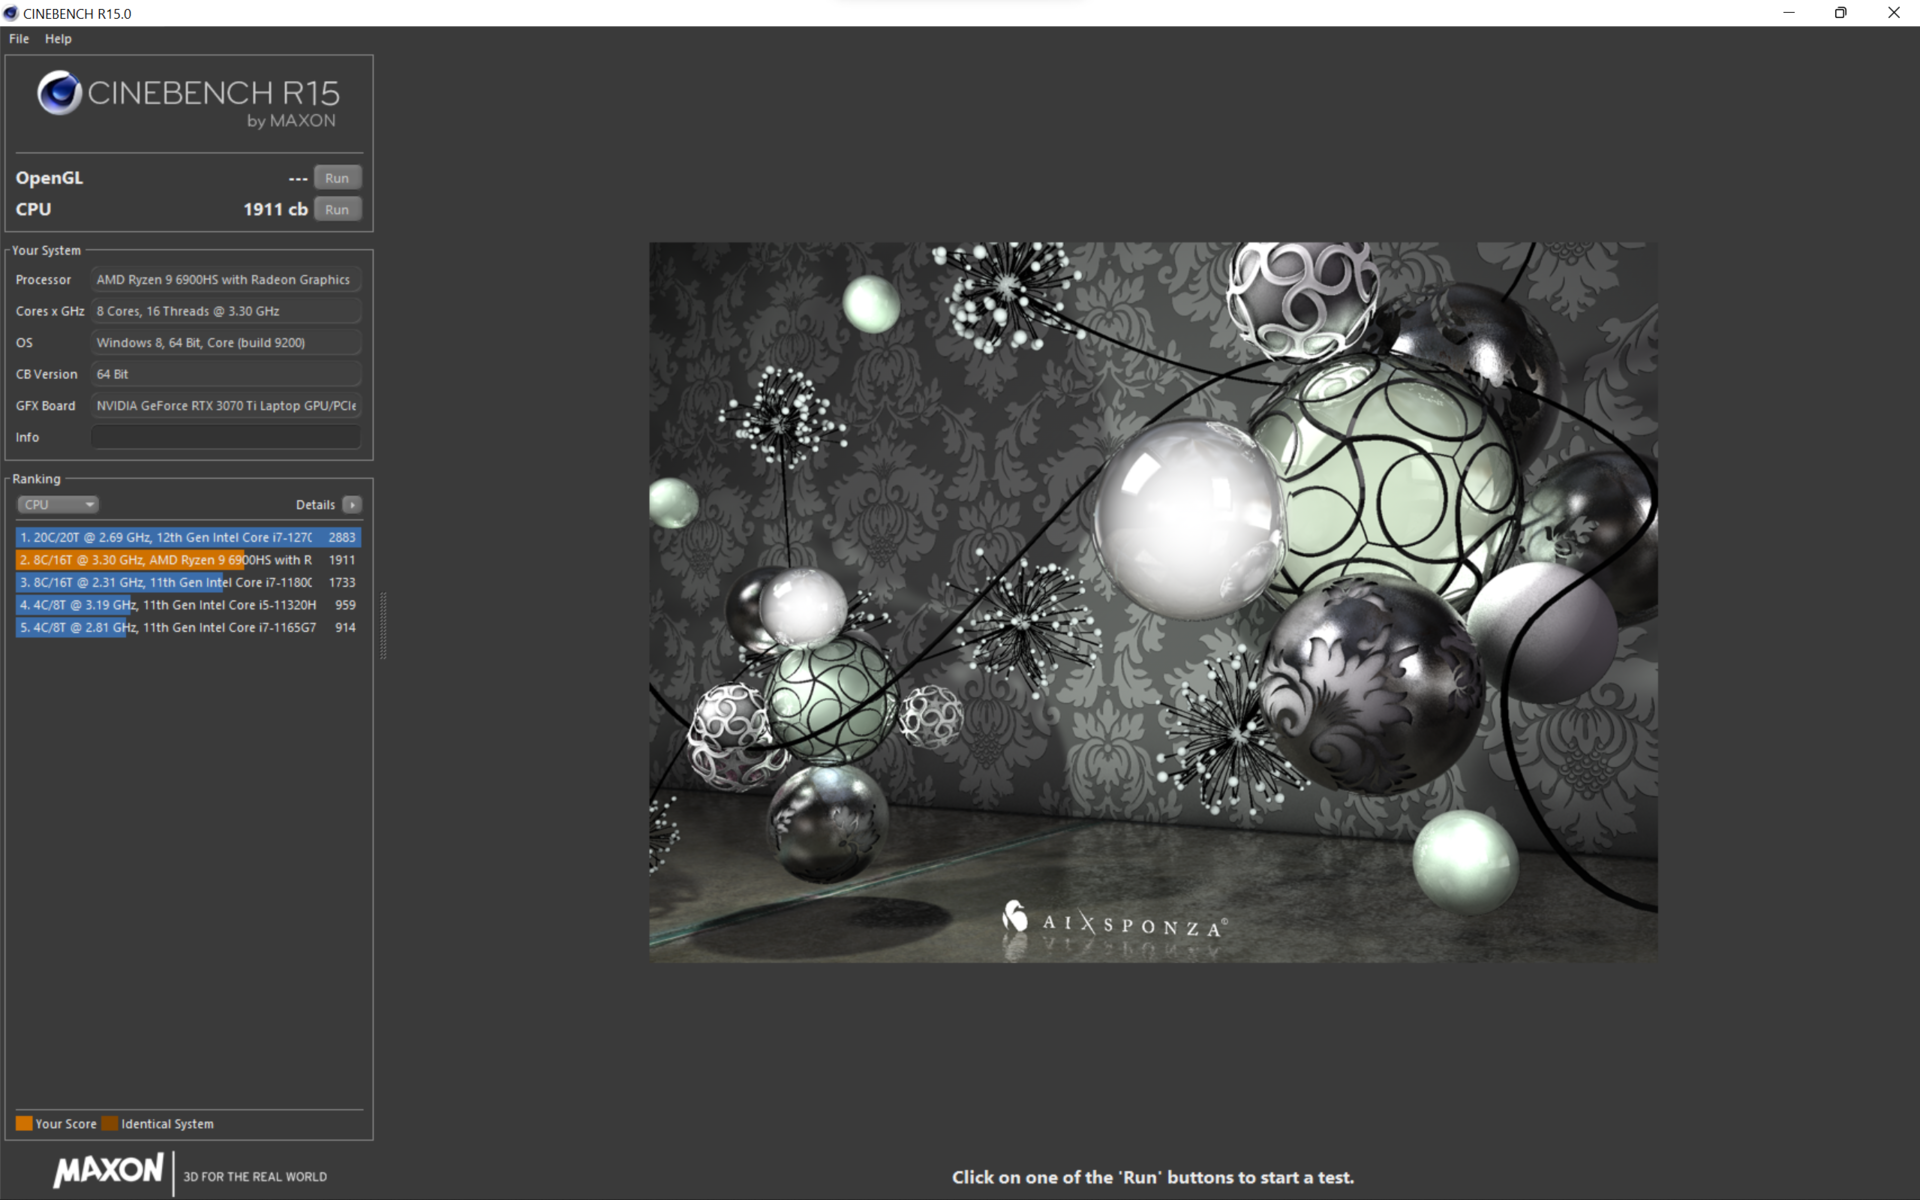
A AMD Ryzen 6900HS é uma CPU octa-core com um relógio base 8x 3,3 GHz, assim como um Turbo de 4,9 GHz em 1 núcleo e um Turbo de 4,36 GHz medido em 8 núcleos. Destes, 4,26 GHz são mantidos permanentemente no modo Turbo enquanto a CPU consome continuamente 74 watts e aquece até 91 °C
A CPU de 35 W é, portanto, muito bem utilizada. O consumo inicial é de cerca de 90 watts a 4,36 GHz. O limite de potência de curto prazo "SPPT" (chamado "PL2" pela Intel), definido em 100 watts, não é assim alcançado, nem o limite de potência de longo prazo "SPL" (PL1) de 90 watts. A AMD ainda tem o FPPT (Fast Package Power Tracking) com 125 watts ajustado aqui.
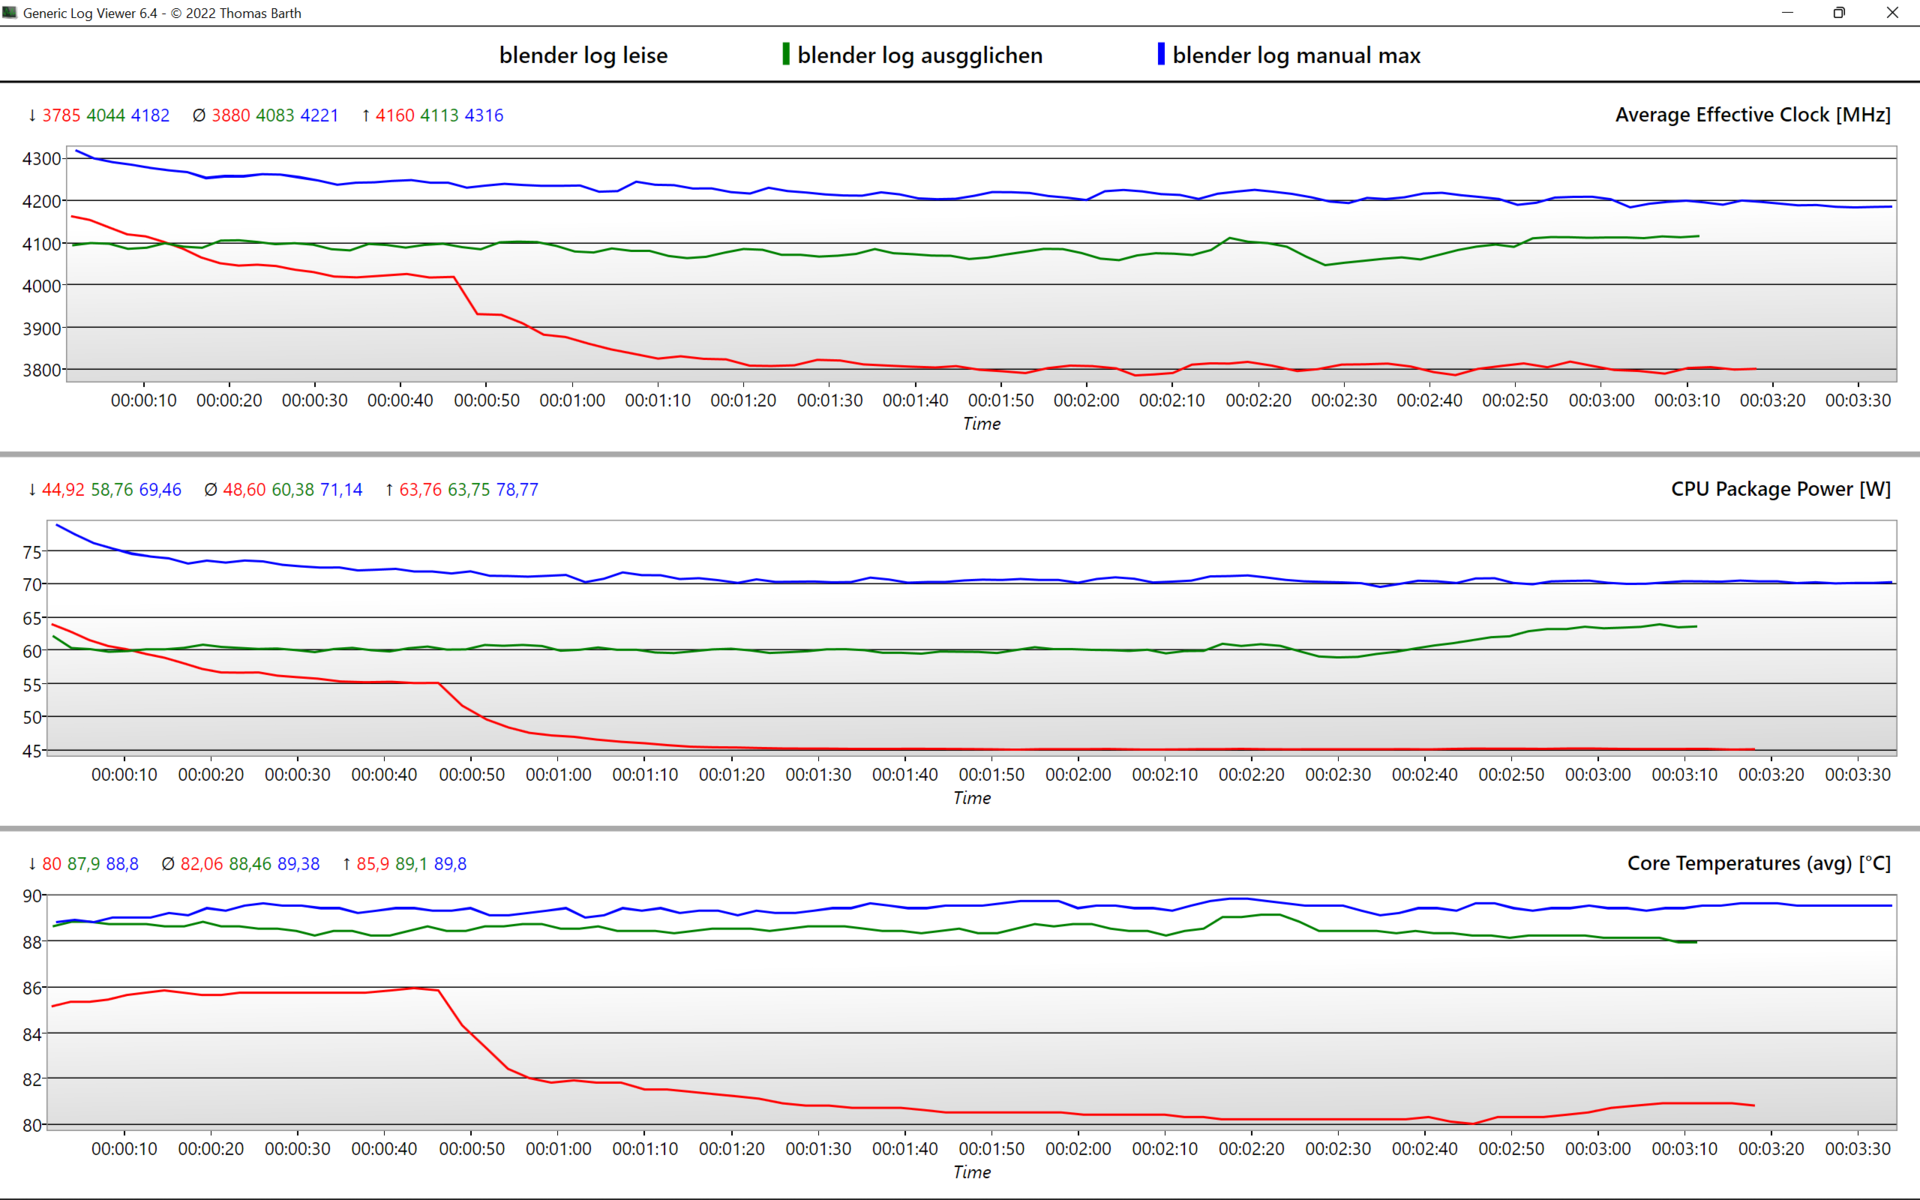
No modo balanceado
, o relógio da CPU cai ligeiramente para 4,1 GHz, o que reduz o desempenho em apenas 3%, mas melhora notavelmente o ruído do ventilador: 35.7 db(A) versus 45,1 db(A). O limite de potência é reduzido em 10 watts para 65 watts e a CPU permanece cerca de 2 °C mais fria.No modo silencioso
, o relógio cai para 8x 3,8 GHz após 50 segundos e o consumo de energia cai de um inicial de 65 a 45 watts. Os ventiladores então se tornam muito agradáveis a 32 db(A) e a temperatura da CPU é significativamente mais fria a 80 °C. O desempenho a longo prazo é cerca de 15 por cento menor.No modo de bateria, não há nenhum impulso e todos os limites de potência estão restritos a 35 watts, o que leva a uma redução de desempenho de cerca de 20%. As contrapartes da Intel frequentemente vêem uma queda muito mais significativa no desempenho em modo de bateria, especialmente com um limite de 35 watts (50% e mais). Os ventiladores são ainda mais silenciosos sob carga.
Na CBR15, o Ryzen 9 é assim capaz de vencer os rivais do Lago Alder, tais como o maior Dell XPS 17. O GS66 e Aero 16 são 20% mais rápidos, já que o Alder Lake se beneficia fortemente do alto consumo de energia. Os laptops mais espessos como o Scar 15 ou o Legion 5 Pro são ainda mais rápidos.
Na classificação geral, nosso dispositivo de teste cai no meio-campo. O Apple M1 Pro é 36% mais rápido no Geekbench 5.4
.


| Modo de alimentação | Relógio da CPU (GHz) | Temperatura da CPU (°C) | Consumo de energia da CPU (W) | Luminosidade em db(A) @Blender |
|---|---|---|---|---|
| Manual (Max) | 4,2 | 89 | 70 | 50,6 |
| Turbo | 4,26 | 91 | 75 | 45,1 |
| Equilibrado / Desempenho | 4,1 | 89 | 60 | 36 |
| Silencioso | 3,8 | 80 | 45 | 32 |
| Bateria | 3,5 | 72 | 35 | 26,7 - 30,7 |
Cinebench R15 Multi Sustained Load
Cinebench R23: Multi Core | Single Core
Cinebench R20: CPU (Multi Core) | CPU (Single Core)
Cinebench R15: CPU Multi 64Bit | CPU Single 64Bit
Blender: v2.79 BMW27 CPU | v3.3 Classroom CPU | v3.3 Classroom CUDA
7-Zip 18.03: 7z b 4 | 7z b 4 -mmt1
Geekbench 5.5: Multi-Core | Single-Core | OpenCL Score
HWBOT x265 Benchmark v2.2: 4k Preset
LibreOffice : 20 Documents To PDF
R Benchmark 2.5: Overall mean
V-Ray 5 Benchmark: CPU | GPU CUDA | GPU RTX
V-Ray Benchmark Next 4.10: CPU | GPU
Mozilla Kraken 1.1: Total
WebXPRT 3: Overall
WebXPRT 4: Overall
Octane V2: Total Score
Jetstream 2: 2.0 Total
Sunspider: 1.0 Total Score
Speedometer 2.0: Result 2.0
| CPU Performance rating | |
| Média da turma Gaming -1! | |
| Asus ROG Strix Scar 15 G533ZW-LN106WS -11! | |
| Lenovo Legion 5 Pro 16 G7 i7 RTX 3070Ti -7! | |
| MSI Stealth GS66 12UGS -10! | |
| Gigabyte Aero 16 YE5 -3! | |
| Dell XPS 17 9720 RTX 3060 -10! | |
| Asus ROG Zephyrus M16 GU603H -12! | |
| Asus ROG Flow X16 GV601RW-M5082W | |
| Lenovo ThinkPad X1 Extreme G4-20Y50040GE -9! | |
| Apple MacBook Pro 16 2021 M1 Pro -11! | |
| Asus ROG Flow X13 GV301QH -5! | |
| Média AMD Ryzen 9 6900HS | |
| Microsoft Surface Laptop Studio i7 RTX 3050 Ti -7! | |
| Blender / v3.3 Classroom CPU | |
| Média AMD Ryzen 9 6900HS (378 - 469, n=3) | |
| Asus ROG Flow X16 GV601RW-M5082W | |
| Média da turma Gaming (122 - 565, n=99, últimos 2 anos) | |
| Blender / v3.3 Classroom CUDA | |
| Média AMD Ryzen 9 6900HS (42 - 116, n=2) | |
| Asus ROG Flow X16 GV601RW-M5082W | |
| Média da turma Gaming (15 - 228, n=103, últimos 2 anos) | |
| V-Ray 5 Benchmark / CPU | |
| Média da turma Gaming (5864 - 30302, n=28, últimos 2 anos) | |
| Dell XPS 17 9720 RTX 3060 | |
| Gigabyte Aero 16 YE5 | |
| Asus ROG Flow X16 GV601RW-M5082W | |
| Lenovo ThinkPad X1 Extreme G4-20Y50040GE | |
| Média AMD Ryzen 9 6900HS (8067 - 9648, n=3) | |
| Apple MacBook Pro 16 2021 M1 Pro | |
| Asus ROG Flow X13 GV301QH | |
| V-Ray 5 Benchmark / GPU CUDA | |
| Média da turma Gaming (1202 - 3288, n=29, últimos 2 anos) | |
| Gigabyte Aero 16 YE5 | |
| Asus ROG Flow X16 GV601RW-M5082W | |
| Lenovo ThinkPad X1 Extreme G4-20Y50040GE | |
| Média AMD Ryzen 9 6900HS (210 - 1224, n=3) | |
| Apple MacBook Pro 16 2021 M1 Pro | |
| Asus ROG Flow X13 GV301QH | |
| V-Ray 5 Benchmark / GPU RTX | |
| Média da turma Gaming (1524 - 4363, n=29, últimos 2 anos) | |
| Asus ROG Flow X13 GV301QH | |
| Lenovo ThinkPad X1 Extreme G4-20Y50040GE | |
| Gigabyte Aero 16 YE5 | |
| Asus ROG Flow X16 GV601RW-M5082W | |
| Média AMD Ryzen 9 6900HS (538 - 1510, n=2) | |
| V-Ray Benchmark Next 4.10 / CPU | |
| Média da turma Gaming (10048 - 45327, n=94, últimos 2 anos) | |
| Lenovo Legion 5 Pro 16 G7 i7 RTX 3070Ti | |
| Asus ROG Strix Scar 15 G533ZW-LN106WS | |
| MSI Stealth GS66 12UGS | |
| Gigabyte Aero 16 YE5 | |
| Asus ROG Zephyrus M16 GU603H | |
| Média AMD Ryzen 9 6900HS (13527 - 15533, n=4) | |
| Asus ROG Flow X16 GV601RW-M5082W | |
| Asus ROG Flow X13 GV301QH | |
| Microsoft Surface Laptop Studio i7 RTX 3050 Ti | |
| V-Ray Benchmark Next 4.10 / GPU | |
| Média da turma Gaming (427 - 1627, n=96, últimos 2 anos) | |
| Lenovo Legion 5 Pro 16 G7 i7 RTX 3070Ti | |
| Gigabyte Aero 16 YE5 | |
| MSI Stealth GS66 12UGS | |
| Asus ROG Flow X16 GV601RW-M5082W | |
| Asus ROG Zephyrus M16 GU603H | |
| Asus ROG Strix Scar 15 G533ZW-LN106WS | |
| Microsoft Surface Laptop Studio i7 RTX 3050 Ti | |
| Média AMD Ryzen 9 6900HS (75 - 427, n=4) | |
| Asus ROG Flow X13 GV301QH | |
| WebXPRT 4 / Overall | |
| Média da turma Gaming (165 - 354, n=98, últimos 2 anos) | |
| Asus ROG Flow X16 GV601RW-M5082W | |
| Média AMD Ryzen 9 6900HS (184.4 - 225, n=3) | |
| Octane V2 / Total Score | |
| Média da turma Gaming (93292 - 139447, n=26, últimos 2 anos) | |
| Gigabyte Aero 16 YE5 | |
| Lenovo Legion 5 Pro 16 G7 i7 RTX 3070Ti | |
| Lenovo ThinkPad X1 Extreme G4-20Y50040GE | |
| Asus ROG Flow X16 GV601RW-M5082W | |
| Média AMD Ryzen 9 6900HS (n=1) | |
| Asus ROG Flow X13 GV301QH | |
| Apple MacBook Pro 16 2021 M1 Pro | |
| Microsoft Surface Laptop Studio i7 RTX 3050 Ti | |
| Sunspider / 1.0 Total Score | |
| Média AMD Ryzen 9 6900HS (94 - 119.2, n=2) | |
| Gigabyte Aero 16 YE5 | |
| Asus ROG Flow X16 GV601RW-M5082W | |
| Apple MacBook Pro 16 2021 M1 Pro | |
| Speedometer 2.0 / Result 2.0 | |
| Média da turma Gaming (29 - 736, n=26, últimos 2 anos) | |
| Apple MacBook Pro 16 2021 M1 Pro | |
| Gigabyte Aero 16 YE5 | |
| Lenovo Legion 5 Pro 16 G7 i7 RTX 3070Ti | |
| Média AMD Ryzen 9 6900HS (n=1) | |
| Asus ROG Flow X16 GV601RW-M5082W | |
| Lenovo ThinkPad X1 Extreme G4-20Y50040GE | |
| Microsoft Surface Laptop Studio i7 RTX 3050 Ti | |
* ... menor é melhor
AIDA64: FP32 Ray-Trace | FPU Julia | CPU SHA3 | CPU Queen | FPU SinJulia | FPU Mandel | CPU AES | CPU ZLib | FP64 Ray-Trace | CPU PhotoWorxx
Desempenho do sistema
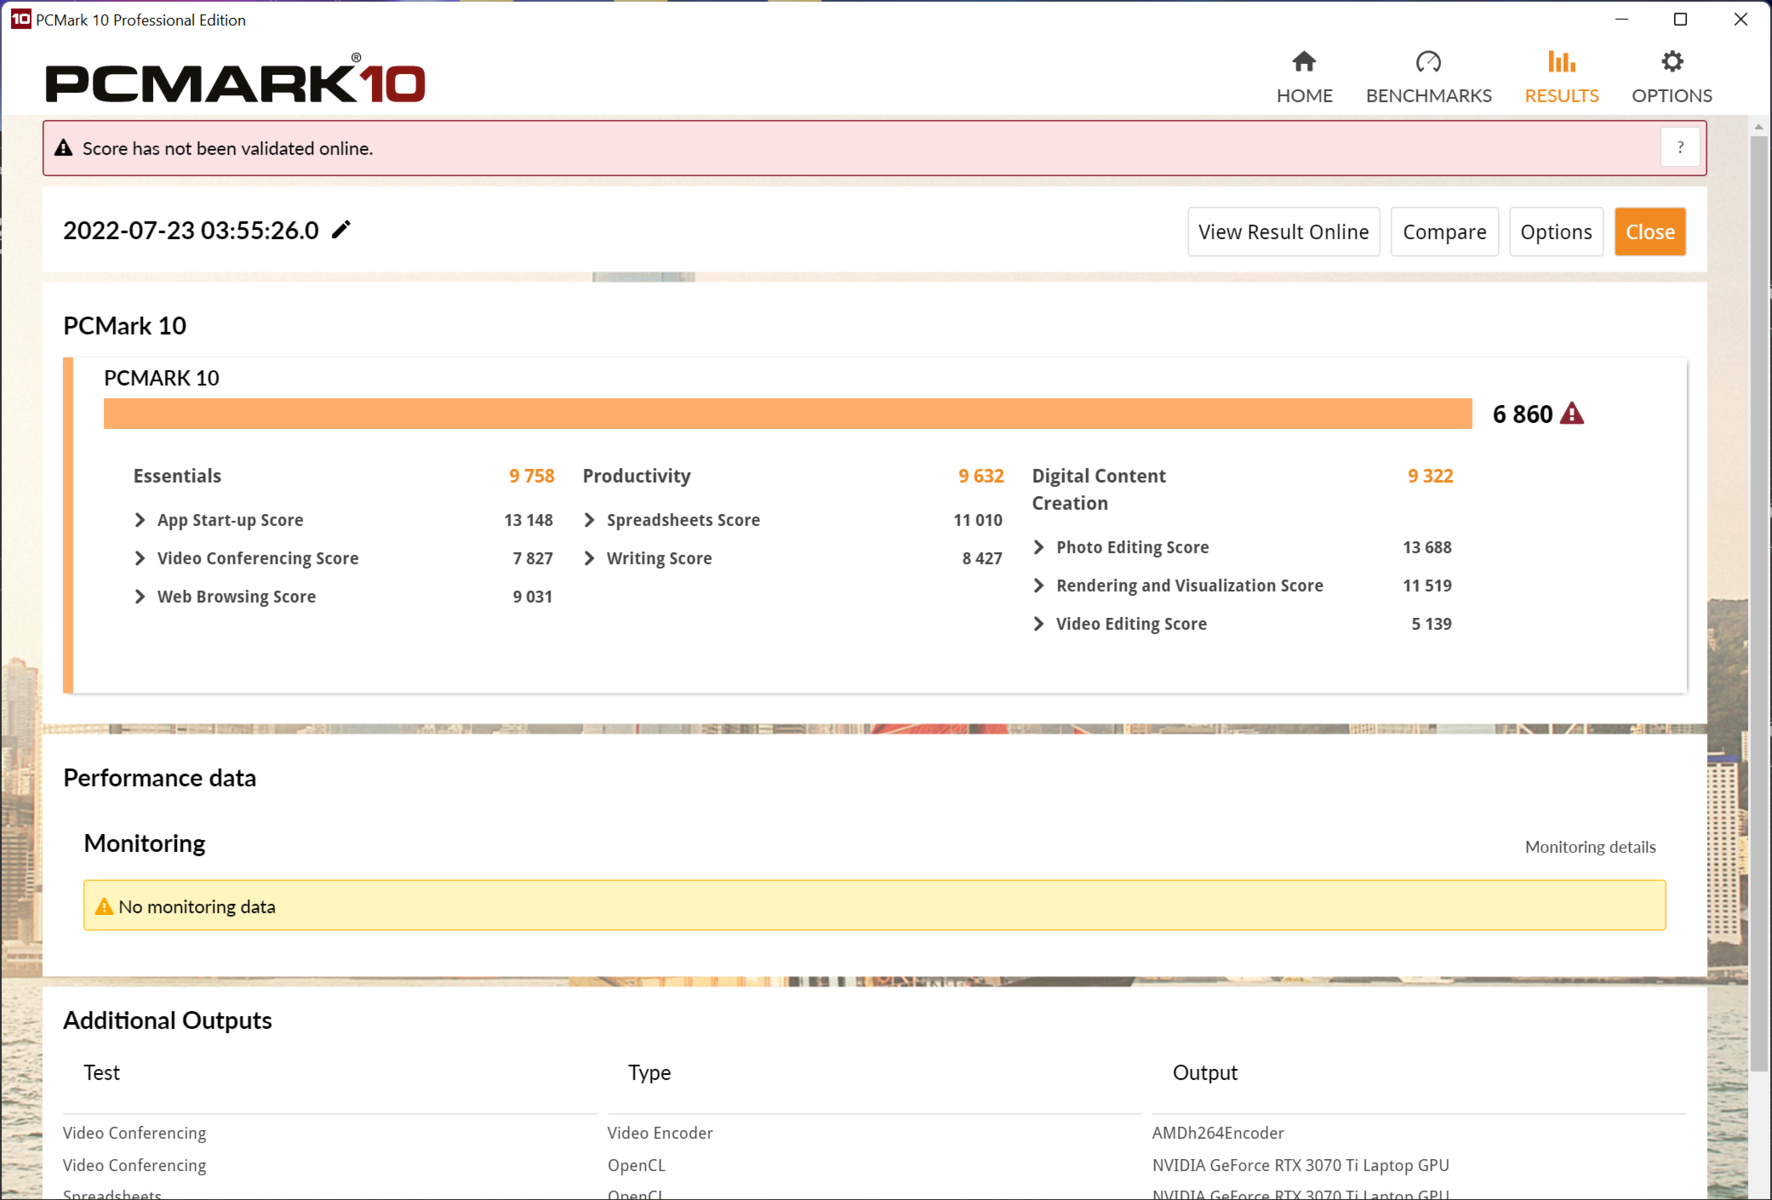
PCMark 10: O fluxo ROG X16 está no meio-campo aqui. O desempenho subjetivo do sistema é muito bom e completamente sem atrasos. Qualquer entrada não poderia ser mais rápida sob o MS Windows. A navegação intensiva com várias abas enquanto se reproduz um vídeo de 4K YouTube não é um problema para o laptop AMD. Há até mesmo potência suficiente para a transmissão de jogos.
CrossMark: Overall | Productivity | Creativity | Responsiveness
| PCMark 10 / Score | |
| Média da turma Gaming (5828 - 12414, n=93, últimos 2 anos) | |
| Asus ROG Strix Scar 15 G533ZW-LN106WS | |
| Gigabyte Aero 16 YE5 | |
| MSI Stealth GS66 12UGS | |
| Lenovo Legion 5 Pro 16 G7 i7 RTX 3070Ti | |
| Dell XPS 17 9720 RTX 3060 | |
| Asus ROG Zephyrus M16 GU603H | |
| Lenovo ThinkPad X1 Extreme G4-20Y50040GE | |
| Asus ROG Flow X16 GV601RW-M5082W | |
| Média AMD Ryzen 9 6900HS, NVIDIA GeForce RTX 3070 Ti Laptop GPU (n=1) | |
| Asus ROG Flow X13 GV301QH | |
| Microsoft Surface Laptop Studio i7 RTX 3050 Ti | |
| PCMark 10 / Essentials | |
| Gigabyte Aero 16 YE5 | |
| MSI Stealth GS66 12UGS | |
| Dell XPS 17 9720 RTX 3060 | |
| Asus ROG Strix Scar 15 G533ZW-LN106WS | |
| Média da turma Gaming (8810 - 11935, n=97, últimos 2 anos) | |
| Asus ROG Zephyrus M16 GU603H | |
| Lenovo ThinkPad X1 Extreme G4-20Y50040GE | |
| Lenovo Legion 5 Pro 16 G7 i7 RTX 3070Ti | |
| Asus ROG Flow X13 GV301QH | |
| Asus ROG Flow X16 GV601RW-M5082W | |
| Média AMD Ryzen 9 6900HS, NVIDIA GeForce RTX 3070 Ti Laptop GPU (n=1) | |
| Microsoft Surface Laptop Studio i7 RTX 3050 Ti | |
| PCMark 10 / Productivity | |
| Média da turma Gaming (6845 - 25323, n=95, últimos 2 anos) | |
| Asus ROG Strix Scar 15 G533ZW-LN106WS | |
| Gigabyte Aero 16 YE5 | |
| Lenovo Legion 5 Pro 16 G7 i7 RTX 3070Ti | |
| Asus ROG Flow X16 GV601RW-M5082W | |
| Média AMD Ryzen 9 6900HS, NVIDIA GeForce RTX 3070 Ti Laptop GPU (n=1) | |
| MSI Stealth GS66 12UGS | |
| Dell XPS 17 9720 RTX 3060 | |
| Asus ROG Zephyrus M16 GU603H | |
| Lenovo ThinkPad X1 Extreme G4-20Y50040GE | |
| Asus ROG Flow X13 GV301QH | |
| Microsoft Surface Laptop Studio i7 RTX 3050 Ti | |
| PCMark 10 / Digital Content Creation | |
| Média da turma Gaming (7602 - 19954, n=95, últimos 2 anos) | |
| Asus ROG Strix Scar 15 G533ZW-LN106WS | |
| Lenovo Legion 5 Pro 16 G7 i7 RTX 3070Ti | |
| Gigabyte Aero 16 YE5 | |
| MSI Stealth GS66 12UGS | |
| Dell XPS 17 9720 RTX 3060 | |
| Asus ROG Zephyrus M16 GU603H | |
| Lenovo ThinkPad X1 Extreme G4-20Y50040GE | |
| Asus ROG Flow X16 GV601RW-M5082W | |
| Média AMD Ryzen 9 6900HS, NVIDIA GeForce RTX 3070 Ti Laptop GPU (n=1) | |
| Asus ROG Flow X13 GV301QH | |
| Microsoft Surface Laptop Studio i7 RTX 3050 Ti | |
| CrossMark / Overall | |
| Gigabyte Aero 16 YE5 | |
| Asus ROG Strix Scar 15 G533ZW-LN106WS | |
| Média da turma Gaming (1366 - 2409, n=94, últimos 2 anos) | |
| Lenovo Legion 5 Pro 16 G7 i7 RTX 3070Ti | |
| Dell XPS 17 9720 RTX 3060 | |
| Asus ROG Flow X16 GV601RW-M5082W | |
| Média AMD Ryzen 9 6900HS, NVIDIA GeForce RTX 3070 Ti Laptop GPU (n=1) | |
| Lenovo ThinkPad X1 Extreme G4-20Y50040GE | |
| Apple MacBook Pro 16 2021 M1 Pro | |
| Microsoft Surface Laptop Studio i7 RTX 3050 Ti | |
| CrossMark / Productivity | |
| Gigabyte Aero 16 YE5 | |
| Asus ROG Strix Scar 15 G533ZW-LN106WS | |
| Lenovo Legion 5 Pro 16 G7 i7 RTX 3070Ti | |
| Média da turma Gaming (1386 - 2254, n=94, últimos 2 anos) | |
| Dell XPS 17 9720 RTX 3060 | |
| Lenovo ThinkPad X1 Extreme G4-20Y50040GE | |
| Asus ROG Flow X16 GV601RW-M5082W | |
| Média AMD Ryzen 9 6900HS, NVIDIA GeForce RTX 3070 Ti Laptop GPU (n=1) | |
| Microsoft Surface Laptop Studio i7 RTX 3050 Ti | |
| Apple MacBook Pro 16 2021 M1 Pro | |
| CrossMark / Creativity | |
| Média da turma Gaming (1343 - 2786, n=94, últimos 2 anos) | |
| Gigabyte Aero 16 YE5 | |
| Asus ROG Strix Scar 15 G533ZW-LN106WS | |
| Dell XPS 17 9720 RTX 3060 | |
| Apple MacBook Pro 16 2021 M1 Pro | |
| Lenovo Legion 5 Pro 16 G7 i7 RTX 3070Ti | |
| Asus ROG Flow X16 GV601RW-M5082W | |
| Média AMD Ryzen 9 6900HS, NVIDIA GeForce RTX 3070 Ti Laptop GPU (n=1) | |
| Lenovo ThinkPad X1 Extreme G4-20Y50040GE | |
| Microsoft Surface Laptop Studio i7 RTX 3050 Ti | |
| CrossMark / Responsiveness | |
| Gigabyte Aero 16 YE5 | |
| Asus ROG Strix Scar 15 G533ZW-LN106WS | |
| Lenovo Legion 5 Pro 16 G7 i7 RTX 3070Ti | |
| Dell XPS 17 9720 RTX 3060 | |
| Média da turma Gaming (1226 - 2334, n=94, últimos 2 anos) | |
| Lenovo ThinkPad X1 Extreme G4-20Y50040GE | |
| Asus ROG Flow X16 GV601RW-M5082W | |
| Média AMD Ryzen 9 6900HS, NVIDIA GeForce RTX 3070 Ti Laptop GPU (n=1) | |
| Microsoft Surface Laptop Studio i7 RTX 3050 Ti | |
| Apple MacBook Pro 16 2021 M1 Pro | |
| PCMark 10 Score | 6860 pontos | |
Ajuda | ||
* ... menor é melhor
Latência do DPC
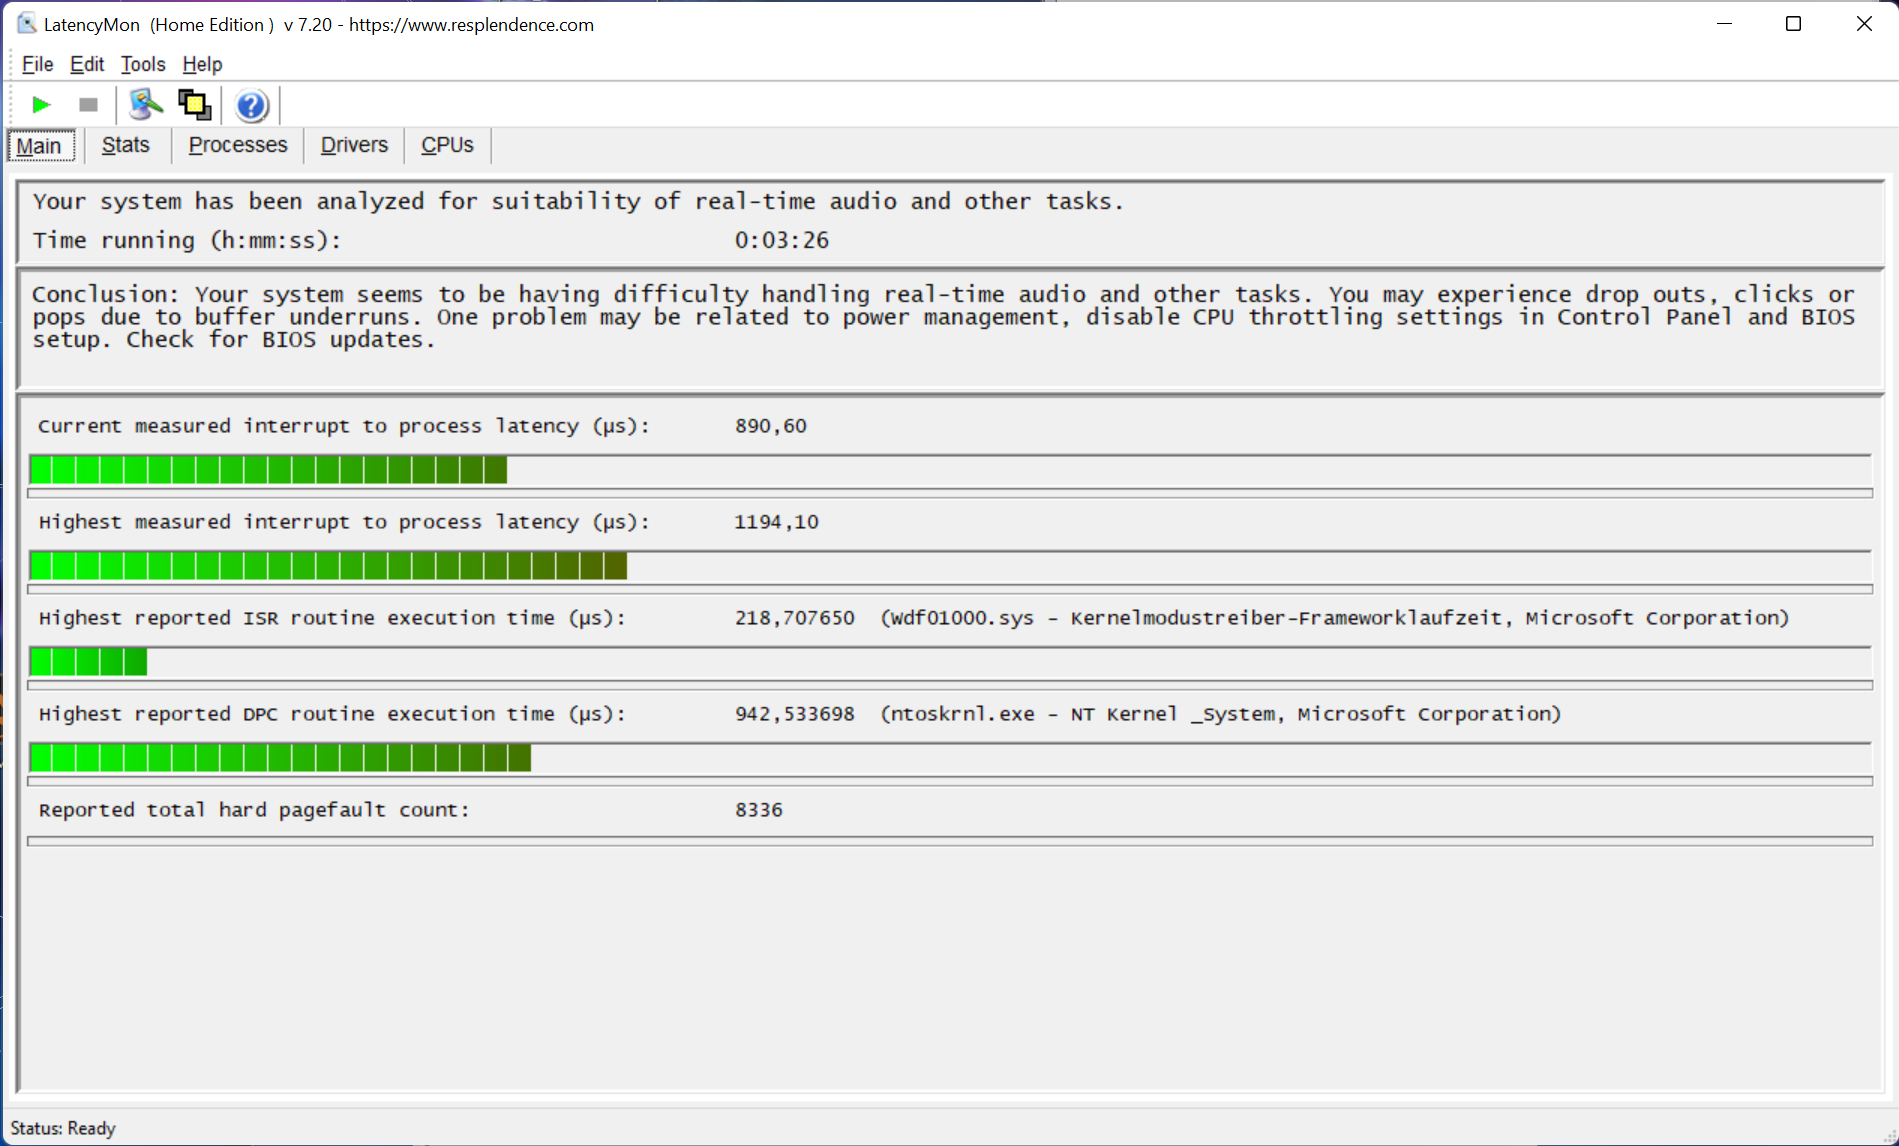
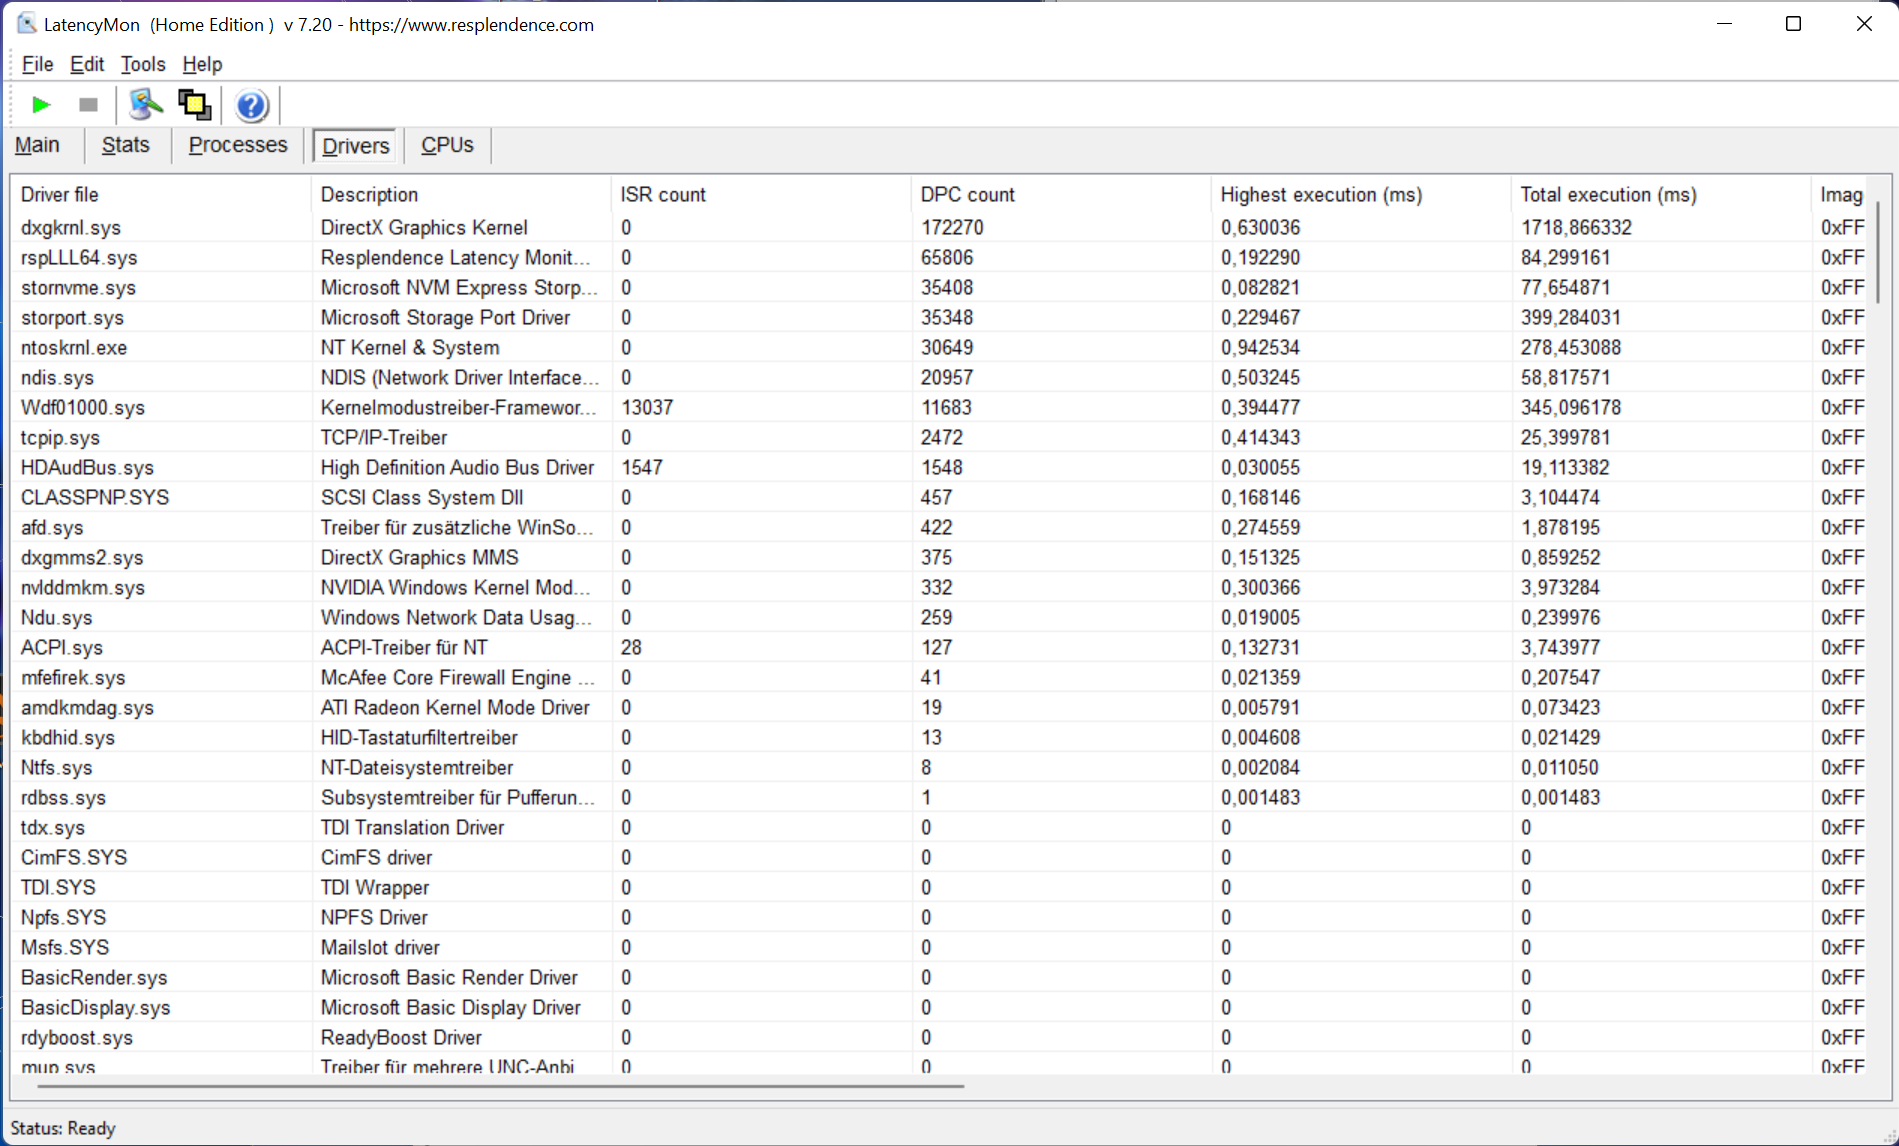
O ROG Flow X16, ou seja, nosso modelo de revisão, parece ter problemas para gerenciar a edição de áudio e vídeo em tempo real. O núcleo gráfico do DirectX é o principal responsável aqui. As futuras atualizações da BIOS podem melhorar isso.
a reprodução de 4K YouTube causa uma carga de CPU de 4% e ~20% no iGPU da Radeon. Nenhum frame pulado foi registrado.
| DPC Latencies / LatencyMon - interrupt to process latency (max), Web, Youtube, Prime95 | |
| Asus ROG Flow X13 GV301QH | |
| MSI Stealth GS66 12UGS | |
| Lenovo ThinkPad X1 Extreme G4-20Y50040GE | |
| Asus ROG Flow X16 GV601RW-M5082W | |
| Asus ROG Zephyrus M16 GU603H | |
| Asus ROG Strix Scar 15 G533ZW-LN106WS | |
| Microsoft Surface Laptop Studio i7 RTX 3050 Ti | |
| Lenovo Legion 5 Pro 16 G7 i7 RTX 3070Ti | |
| Gigabyte Aero 16 YE5 | |
| Dell XPS 17 9720 RTX 3060 | |
* ... menor é melhor
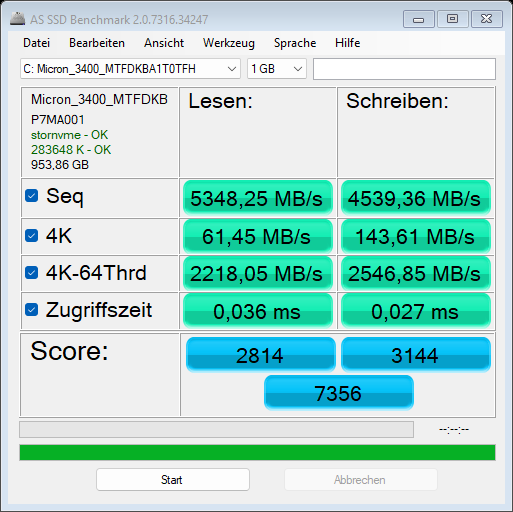
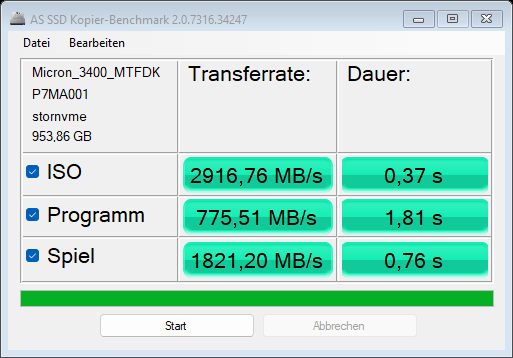
Dispositivos de armazenamento
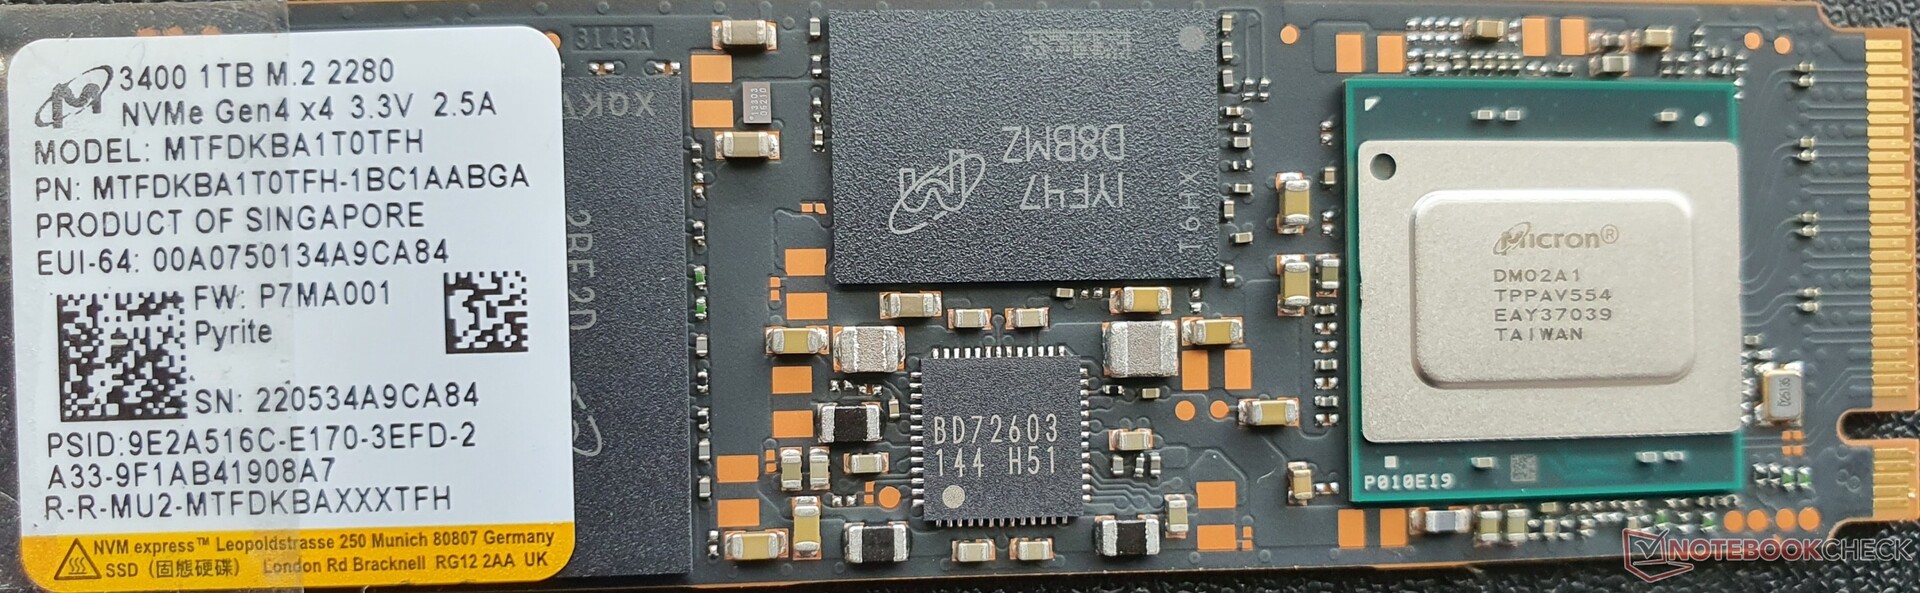
O 1 terabyteMicron 3400 é conectado via PCIe 4.0 e é capaz de funcionar em alta velocidade. Nosso teste de resistência de desempenho de leitura não mostra nenhuma queda. Entretanto, os valores 4K estão um pouco atrasados em relação à concorrência.
| Asus ROG Flow X16 GV601RW-M5082W GeForce RTX 3070 Ti Laptop GPU, R9 6900HS, Micron 3400 1TB MTFDKBA1T0TFH | Asus ROG Zephyrus M16 GU603H GeForce RTX 3070 Laptop GPU, i9-11900H, Samsung PM9A1 MZVL22T0HBLB | Asus ROG Strix Scar 15 G533ZW-LN106WS GeForce RTX 3070 Ti Laptop GPU, i9-12900H, Samsung PM9A1 MZVL22T0HBLB | Gigabyte Aero 16 YE5 GeForce RTX 3080 Ti Laptop GPU, i9-12900HK, Phison ESR01TBMFCT | Lenovo Legion 5 Pro 16 G7 i7 RTX 3070Ti GeForce RTX 3070 Ti Laptop GPU, i7-12700H, Samsung PM9A1 MZVL21T0HCLR | Lenovo ThinkPad X1 Extreme G4-20Y50040GE GeForce RTX 3080 Laptop GPU, i9-11950H, Kioxia XG7 KXG7AZNV1T02 | Dell XPS 17 9720 RTX 3060 GeForce RTX 3060 Laptop GPU, i7-12700H, Samsung PM9A1 MZVL21T0HCLR | Microsoft Surface Laptop Studio i7 RTX 3050 Ti GeForce RTX 3050 Ti Laptop GPU, i7-11370H, SK Hynix PC711 1TB HFS001TDE9X084N | |
|---|---|---|---|---|---|---|---|---|
| AS SSD | 9% | 15% | 26% | 24% | -4% | -14% | -21% | |
| Seq Read (MB/s) | 5348.25 | 5615 5% | 5563.48 4% | 5588 4% | 5036 -6% | 5386 1% | 5241.84 -2% | 2768 -48% |
| Seq Write (MB/s) | 4539.36 | 4297 -5% | 4045.87 -11% | 3267 -28% | 3784 -17% | 4218 -7% | 2208.41 -51% | 1683 -63% |
| 4K Read (MB/s) | 61.45 | 55.3 -10% | 81.3 32% | 109.4 78% | 88.1 43% | 65.9 7% | 79.6 30% | 63.7 4% |
| 4K Write (MB/s) | 143.61 | 170.5 19% | 248.96 73% | 321.6 124% | 240.4 67% | 223.2 55% | 221.57 54% | 191.1 33% |
| 4K-64 Read (MB/s) | 2218.05 | 2591 17% | 2740.24 24% | 2966 34% | 2788 26% | 2757 24% | 1264.16 -43% | 917 -59% |
| 4K-64 Write (MB/s) | 2546.85 | 3190 25% | 3345.62 31% | 3342 31% | 3424 34% | 1736 -32% | 3070.83 21% | 1983 -22% |
| Access Time Read * (ms) | 0.036 | 0.04 -11% | 0.022 39% | 0.056 -56% | 0.02 44% | 0.049 -36% | 0.031 14% | 0.024 33% |
| Access Time Write * (ms) | 0.027 | 0.025 7% | 0.017 37% | 0.012 56% | 0.018 33% | 0.02 26% | 0.056 -107% | 0.019 30% |
| Score Read (Points) | 2814 | 3208 14% | 3378 20% | 3634 29% | 3380 20% | 3361 19% | 1868 -34% | 1257 -55% |
| Score Write (Points) | 3144 | 3790 21% | 3999 27% | 3991 27% | 4043 29% | 2381 -24% | 3513 12% | 2343 -25% |
| Score Total (Points) | 7356 | 8563 16% | 9031 23% | 9380 28% | 9094 24% | 7397 1% | 6203 -16% | 4206 -43% |
| Copy ISO MB/s (MB/s) | 2916.76 | 2358.18 -19% | 2352 -19% | 3221 10% | 2598 -11% | 2874.04 -1% | 1991 -32% | |
| Copy Program MB/s (MB/s) | 775.51 | 466.47 -40% | 1031 33% | 939 21% | 434.7 -44% | 447.82 -42% | 606 -22% | |
| Copy Game MB/s (MB/s) | 1821.2 | 1211.65 -33% | 2188 20% | 1995 10% | 1230 -32% | 1327.42 -27% | 1435 -21% |
* ... menor é melhor
* ... menor é melhor
Sustained Performance Read: DiskSpd Read Loop, Queue Depth 8
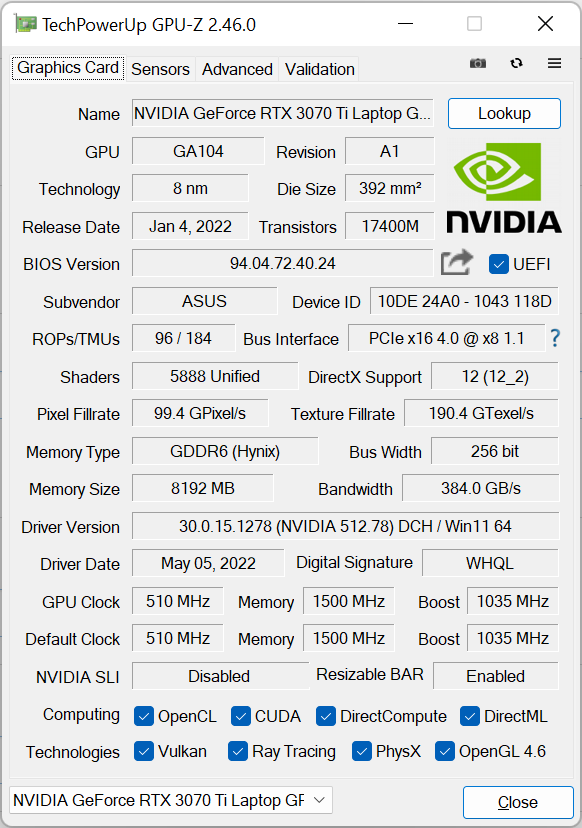
Placa Gráfica
Nvidia's GeForce RTX 3070 Ti é usada como unidade gráfica dedicada, que tem acesso a 8 GB de GDDR6 VRAM. O desempenho está em um alto nível graças à variante mais potente (TGP de 125 watts, incluindo Dynamic Boost), que não é necessariamente o que se espera de um conversível compacto e leve de 16 polegadas
Mesmo oMSI Stealth GS66tem que admitir a derrota como um puro caderno de jogos devido a seu TGP mais baixo de 105 watts, e o Gigabyte Aero 16 com seu RTX 3080 Ti fica cerca de 10% atrás, já que resfria apenas 90 watts apesar de uma construção semelhante. Somente laptops de jogo mais espessos, como o Legion 5 Pro e o ROG Strix Scar 15 são capazes de operar o RTX 3070 Ti com um TGP ainda maior de 150 watts (125 W + 25 W Dynamic Boost) e estão, portanto, 10 a 15% acima do ROG Flow X16 nos 3DMark benchmarks
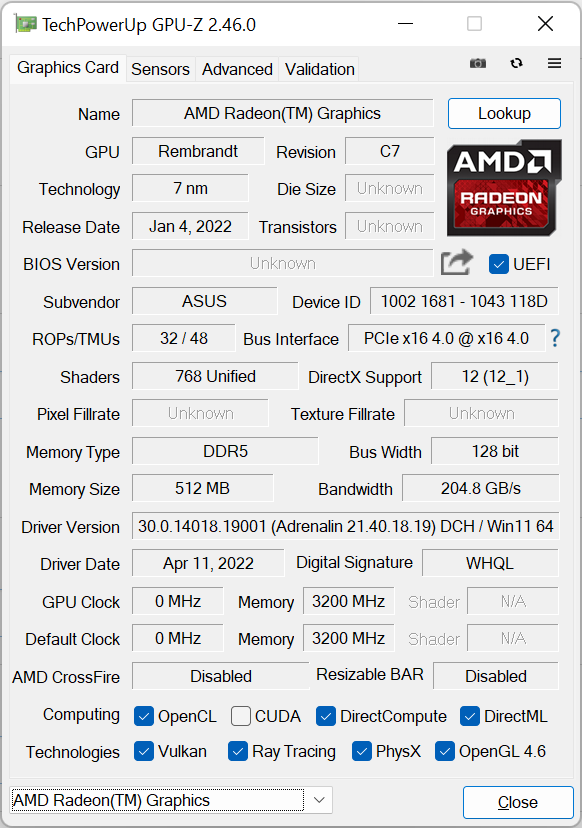
Usando o Radeon 680M iGPU, o Fluxo X16 dura quase duas vezes mais tempo enquanto joga com bateria do que com o RTX 3070 Ti ativado (2:06 h versus 0:56 h). O desempenho do dGPU ainda é duas vezes maior que o do iGPU e pelo menos 50% do desempenho original do dGPU ainda está disponível. Em comparação, oXMG Neo 15 limita seu desempenho gráfico em 90% no modo de bateria. Com uma fonte de alimentação USB-C de 100 watts, apenas metade do desempenho do dGPU está disponível
Embora o RTX 3070 Ti não seja uma GPU profissional, a performance correspondente, como nos testes SpecViewPerf, é impressionante e os benchmarks da CUDA também estão em um nível elevado. Entretanto, o ROG Flow X16 não é projetado como uma estação de trabalho portátil, para a qual faltam drivers especiais.
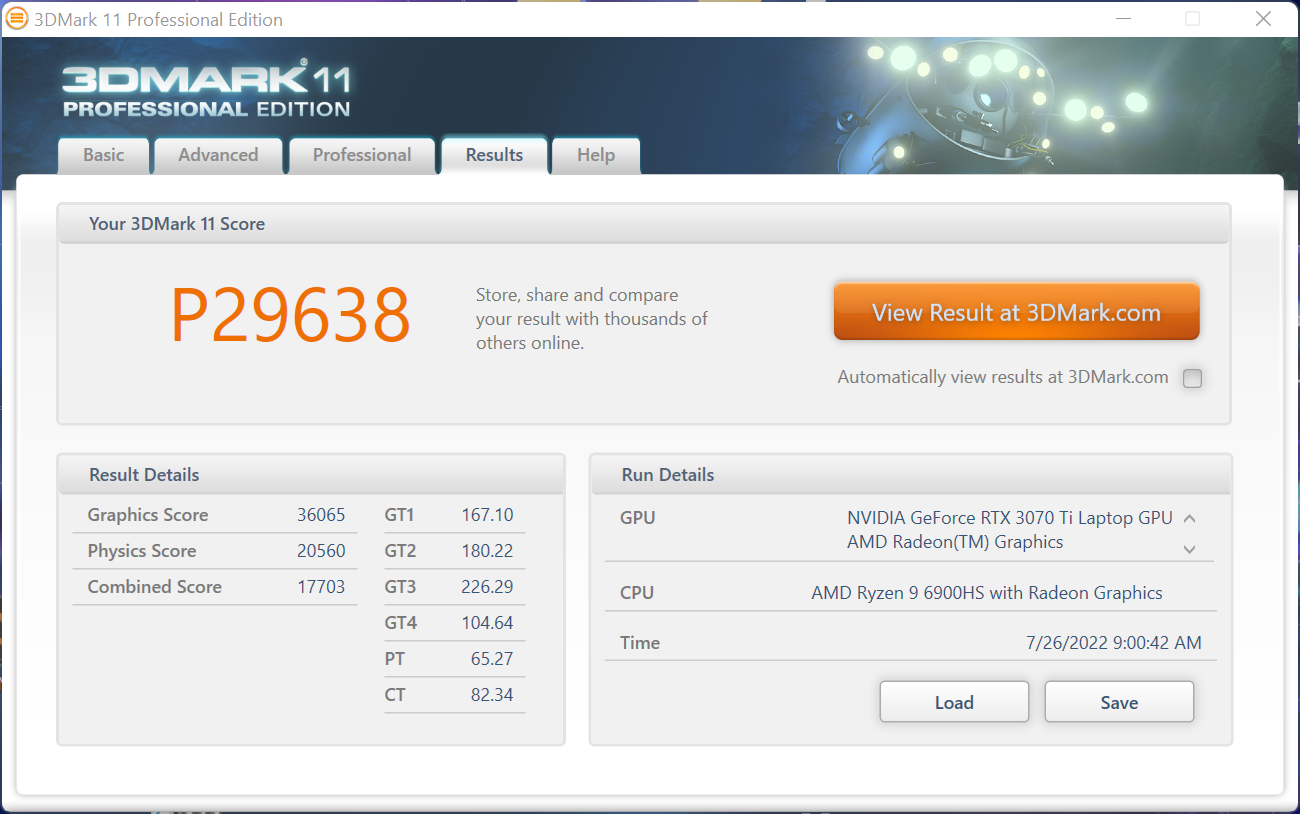


| 3DMark 11 Performance | 29638 pontos | |
| 3DMark Cloud Gate Standard Score | 51280 pontos | |
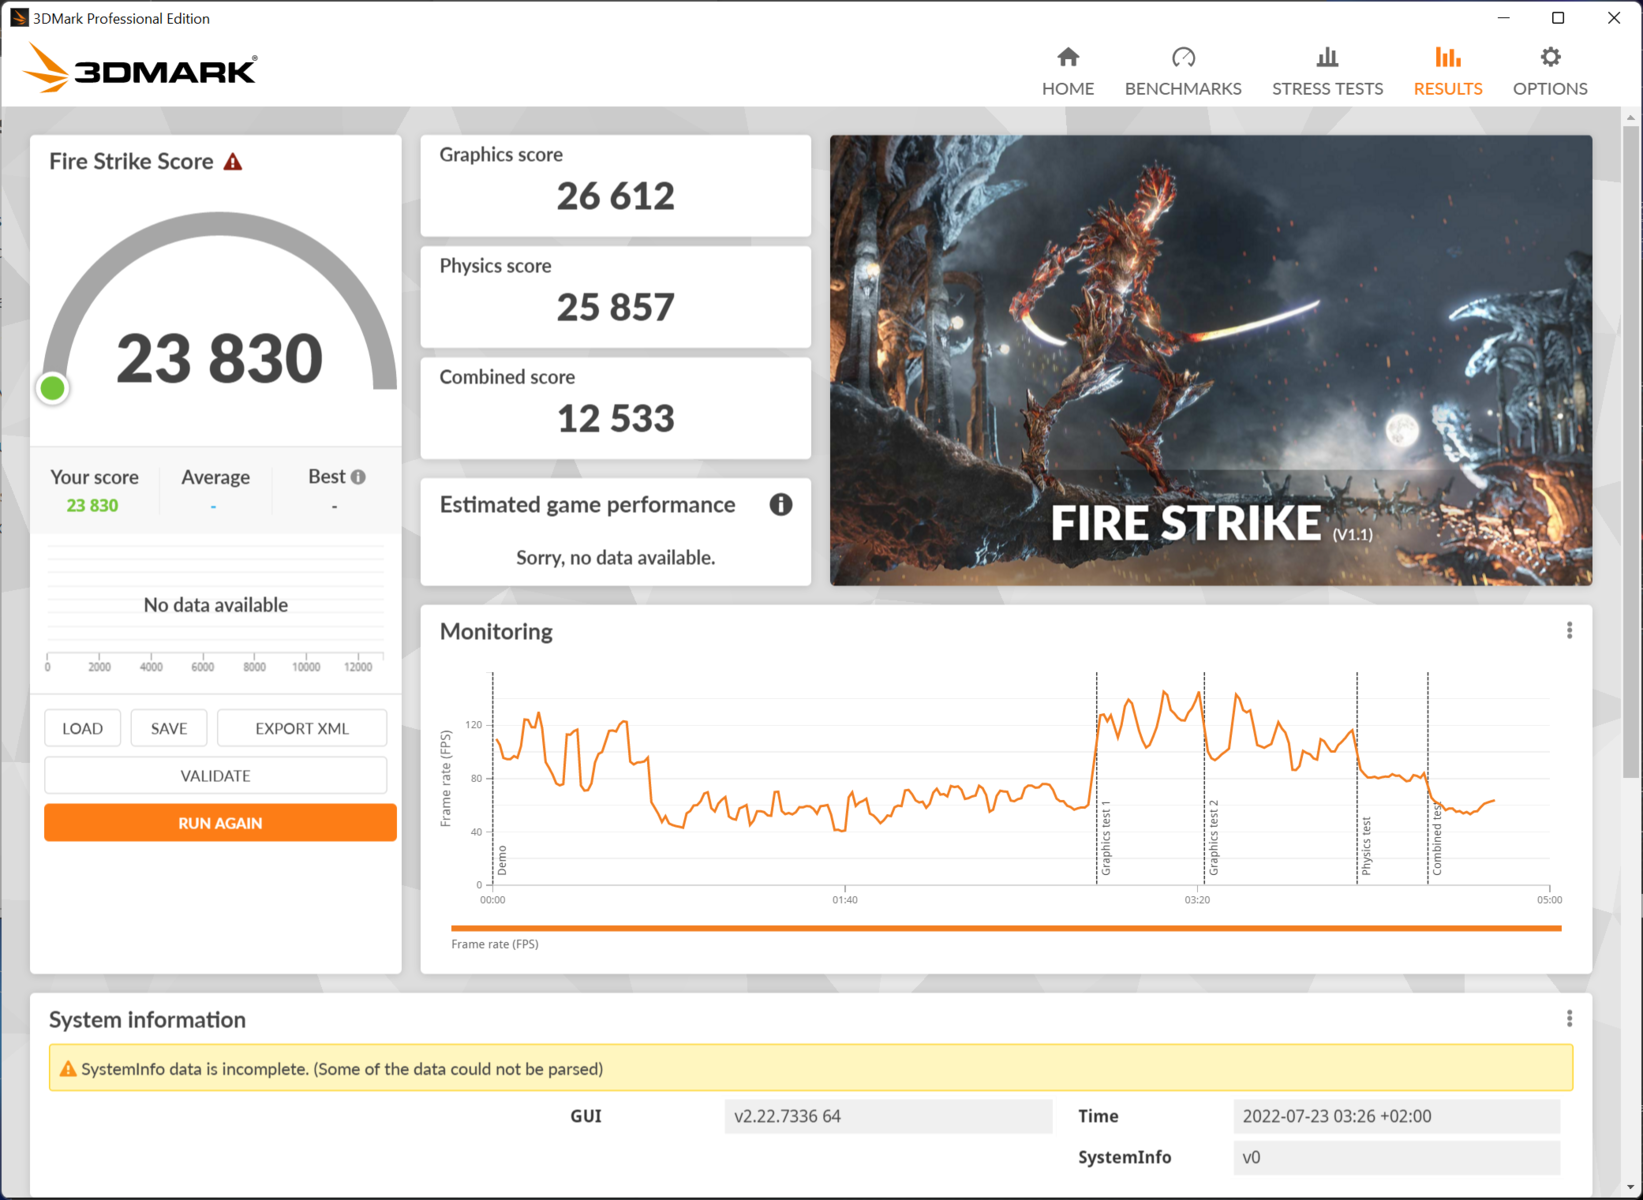
| 3DMark Fire Strike Score | 23830 pontos | |
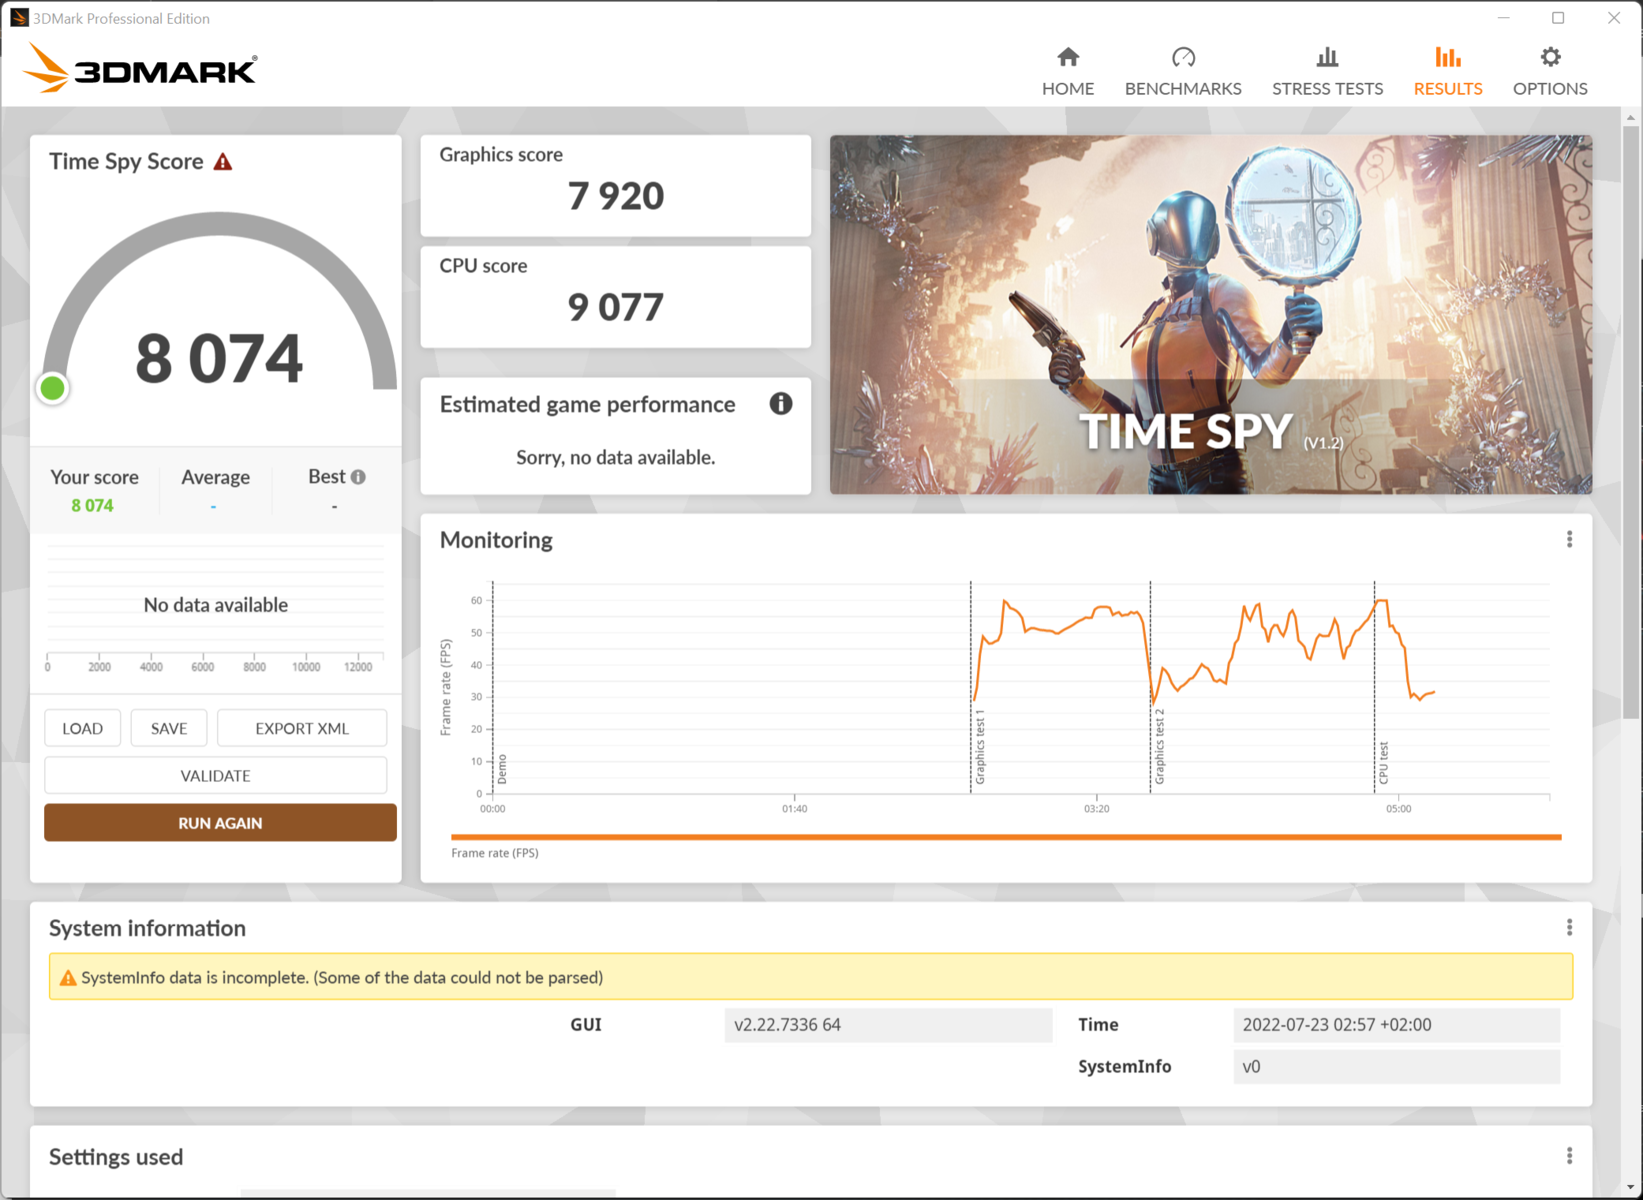
| 3DMark Time Spy Score | 10352 pontos | |
Ajuda | ||
| Blender - v3.3 Classroom CUDA | |
| Asus ROG Flow X16 GV601RW-M5082W | |
| MSI Raider GE77 HX 12UHS | |
* ... menor é melhor
Desempenho nos jogos
Os dispositivos concorrentes só rodam 5 a 10% mais rápido em média em altas resoluções com o GeForce RTX 3070 Ti (ROG Strix Scar 15, Legion 5 Pro, Acer Predator Triton 500 SE), e a lacuna para o Legion 5 Pro no The Witcher 3 até fecha quando fazemos overclock da GPU via caixa de armário Asus ou ativamos o interruptor MUX.
Um RTX 3080 Ti com 105 W de TGP, como no MSI Steath GS77é apenas ~10 por cento mais rápido. No mais fino Aero 16ele funciona ainda mais lentamente do que em nosso ROG Flow X16, uma vez que o Aero 16 só consegue esfriar ~90 watts.
Com cerca de 150 W de TGP (XMG Pro 17, Lâmina Razer 17, Medion Erazer Beast X30), ithe RTX 3080 Ti é 15 a 20 por cento mais rápido. Os melhores resultados em nosso banco de dados para GPUs móveis são cerca de 30% mais altos do que nosso dispositivo de revisão, alcançados pelos poucos notebooks de jogos puros que têm 165 a 175 W de TGP devido a mais espaço para sistemas de resfriamento mais fortes (MSI Raider GE77 HX, Alienware x17 R2em geral, este é um resultado muito bom para um conversível compacto de 16 polegadas que pode facilmente rodar jogos mais novos em resolução QHD. Jogos Full HD em detalhes altos ainda são possíveis com a energia da bateria.
O desempenho dos jogos é de 6 a 7% maior ao ativar o MUX Switch, e o overclocking no "Modo Manual" atinge um aumento semelhante. Entretanto, a combinação de ambos não aumenta mais o desempenho. Todos os efeitos dos diferentes modos podem ser vistos na tabela abaixo. A chave MUX sem overclocking oferece o melhor resultado, o que também mantém o sistema mais silencioso a 45,4 db(A). No modo silencioso , você perde 30% da performance da GPU em troca de um silencioso 35,5 db(A).
| Modos de potência | Witcher 3 Ultra (FPS) | Relógio GPU (MHz) | GPU Temperatura (°C) | GPU Power Draw (W) | Altura em db(A) |
|---|---|---|---|---|---|
| MUX +200MHz | 104,4 | 1.550 | 75 | 116 | 51,2 |
| MUX @Turbo | 104,9 | 1.500 | 71 | 116 | 45,4 |
| Manual +200MHz | 102,3 | 1.550 | 75 | 116 | 51,2 |
| Turbo | 97,8 | 1.500 | 71 | 116 | 45,4 |
| Equilibrado / Desempenho | 89,3 | 1.270 | 72 | 100 | 42,4 |
| Silencioso | 59,9 | 1.000 | 69 | 65 | 35,5 |
| Bateria @Silent | 48,4 | 600 | 64 | 55 | 32 |
| Radeon 680M iGPU | 25,6 | 2.200 | 65 | 35 | 25,8 |
| Shadow of the Tomb Raider | |
| 1920x1080 Highest Preset AA:T | |
| Média NVIDIA GeForce RTX 3070 Ti Laptop GPU (119 - 129, n=2) | |
| Asus ROG Flow X16 GV601RW-M5082W | |
| Média da turma Gaming (96 - 116, n=2, últimos 2 anos) | |
| Apple MacBook Pro 16 2021 M1 Max | |
| Apple MacBook Pro 16 2021 M1 Pro | |
| 2560x1440 Highest Preset AA:T | |
| Asus ROG Flow X16 GV601RW-M5082W | |
| Média NVIDIA GeForce RTX 3070 Ti Laptop GPU (n=1) | |
| Dying Light 2 | |
| 1920x1080 High Quality | |
| Média NVIDIA GeForce RTX 3070 Ti Laptop GPU (66 - 85.5, n=7) | |
| Asus ROG Flow X16 GV601RW-M5082W | |
| MSI Stealth GS66 12UGS | |
| Gigabyte Aero 16 YE5 | |
| 1920x1080 High Quality Raytracing | |
| Asus ROG Flow X16 GV601RW-M5082W | |
| Média NVIDIA GeForce RTX 3070 Ti Laptop GPU (28.7 - 54.9, n=6) | |
| Gigabyte Aero 16 YE5 | |
| MSI Stealth GS66 12UGS | |
| 2560x1440 High Quality | |
| Média NVIDIA GeForce RTX 3070 Ti Laptop GPU (46.7 - 60, n=7) | |
| MSI Stealth GS66 12UGS | |
| Gigabyte Aero 16 YE5 | |
| Asus ROG Flow X16 GV601RW-M5082W | |
| Ghostwire Tokyo | |
| 1920x1080 Highest Settings | |
| Média NVIDIA GeForce RTX 3070 Ti Laptop GPU (115.4 - 145.1, n=4) | |
| Asus ROG Flow X16 GV601RW-M5082W | |
| 2560x1440 Highest Settings | |
| Média NVIDIA GeForce RTX 3070 Ti Laptop GPU (83.9 - 93.1, n=2) | |
| Asus ROG Flow X16 GV601RW-M5082W | |
| 1920x1080 Highest Settings + Maximum Ray Tracing | |
| Asus ROG Flow X16 GV601RW-M5082W | |
| Média NVIDIA GeForce RTX 3070 Ti Laptop GPU (48.9 - 59.9, n=3) | |
| Tiny Tina's Wonderlands | |
| 1920x1080 High Preset (DX12) | |
| Média da turma Gaming (72.1 - 203, n=4, últimos 2 anos) | |
| Média NVIDIA GeForce RTX 3070 Ti Laptop GPU (115 - 118.3, n=3) | |
| Asus ROG Flow X16 GV601RW-M5082W | |
| 1920x1080 Badass Preset (DX12) | |
| Média da turma Gaming (55 - 159.4, n=4, últimos 2 anos) | |
| Média NVIDIA GeForce RTX 3070 Ti Laptop GPU (89.8 - 93.7, n=4) | |
| Asus ROG Flow X16 GV601RW-M5082W | |
| 2560x1440 Badass Preset (DX12) | |
| Média da turma Gaming (58.9 - 111.2, n=3, últimos 2 anos) | |
| Média NVIDIA GeForce RTX 3070 Ti Laptop GPU (59.3 - 63.9, n=3) | |
| Asus ROG Flow X16 GV601RW-M5082W | |
| God of War | |
| 1920x1080 High Preset | |
| Média NVIDIA GeForce RTX 3070 Ti Laptop GPU (76.6 - 92, n=5) | |
| Asus ROG Flow X16 GV601RW-M5082W | |
| MSI Stealth GS66 12UGS | |
| 1920x1080 Ultra Preset | |
| Média NVIDIA GeForce RTX 3070 Ti Laptop GPU (55.1 - 64.3, n=5) | |
| Asus ROG Flow X16 GV601RW-M5082W | |
| MSI Stealth GS66 12UGS | |
| 2560x1440 Ultra Preset | |
| MSI Stealth GS66 12UGS | |
| Média NVIDIA GeForce RTX 3070 Ti Laptop GPU (44.7 - 45.2, n=2) | |
| Asus ROG Flow X16 GV601RW-M5082W | |
| Borderlands 3 | |
| 1920x1080 High Overall Quality (DX11) | |
| Asus ROG Flow X16 GV601RW-M5082W | |
| Média NVIDIA GeForce RTX 3070 Ti Laptop GPU (n=1) | |
| Apple MacBook Pro 16 2021 M1 Max | |
| Apple MacBook Pro 16 2021 M1 Pro | |
| 1920x1080 Badass Overall Quality (DX11) | |
| Asus ROG Flow X16 GV601RW-M5082W | |
| Média NVIDIA GeForce RTX 3070 Ti Laptop GPU (n=1) | |
| Apple MacBook Pro 16 2021 M1 Max | |
| Apple MacBook Pro 16 2021 M1 Pro | |
| 2560x1440 Badass Overall Quality (DX11) | |
| Asus ROG Flow X16 GV601RW-M5082W | |
| Média NVIDIA GeForce RTX 3070 Ti Laptop GPU (n=1) | |
| Assassin´s Creed Valhalla | |
| 1920x1080 High Preset | |
| Asus ROG Strix Scar 15 G533ZW-LN106WS | |
| Média NVIDIA GeForce RTX 3070 Ti Laptop GPU (85 - 94, n=4) | |
| Asus ROG Flow X16 GV601RW-M5082W | |
| MSI Stealth GS66 12UGS | |
| 1920x1080 Ultra High Preset | |
| Asus ROG Strix Scar 15 G533ZW-LN106WS | |
| Asus ROG Flow X16 GV601RW-M5082W | |
| Média NVIDIA GeForce RTX 3070 Ti Laptop GPU (73 - 80, n=4) | |
| MSI Stealth GS66 12UGS | |
| 2560x1440 Ultra High Preset | |
| Asus ROG Strix Scar 15 G533ZW-LN106WS | |
| Asus ROG Flow X16 GV601RW-M5082W | |
| Média NVIDIA GeForce RTX 3070 Ti Laptop GPU (56 - 62, n=3) | |
| MSI Stealth GS66 12UGS | |
| Metro Exodus | |
| 1920x1080 Ultra Quality AF:16x | |
| Média NVIDIA GeForce RTX 3070 Ti Laptop GPU (71 - 77.2, n=2) | |
| Asus ROG Flow X16 GV601RW-M5082W | |
| 1920x1080 Ultra Quality DXR AF:16x | |
| Média NVIDIA GeForce RTX 3070 Ti Laptop GPU (61.3 - 65.1, n=2) | |
| Asus ROG Flow X16 GV601RW-M5082W | |
| 2560x1440 Ultra Quality AF:16x | |
| Asus ROG Flow X16 GV601RW-M5082W | |
| Média NVIDIA GeForce RTX 3070 Ti Laptop GPU (n=1) | |
| Hunt Showdown | |
| 1920x1080 High Preset | |
| Asus ROG Flow X16 GV601RW-M5082W | |
| Média NVIDIA GeForce RTX 3070 Ti Laptop GPU (116 - 125.9, n=2) | |
| MSI Stealth GS66 12UGS | |
| 2560x1440 High Preset | |
| Asus ROG Flow X16 GV601RW-M5082W | |
| Média NVIDIA GeForce RTX 3070 Ti Laptop GPU (75.1 - 82.5, n=2) | |
| MSI Stealth GS66 12UGS | |
Nosso teste de uma hora Witcher 3 mostra uma taxa de moldura estável sem nenhuma imersão.
Witcher 3 FPS Chart
| baixo | média | alto | ultra | QHD | |
|---|---|---|---|---|---|
| GTA V (2015) | 179.3 | 156.3 | 94.6 | 83.7 | |
| The Witcher 3 (2015) | 264 | 189 | 97.8 | ||
| Dota 2 Reborn (2015) | 135.4 | 128.9 | 116 | 112.1 | |
| Final Fantasy XV Benchmark (2018) | 170.6 | 123.5 | 94.9 | 75.5 | |
| X-Plane 11.11 (2018) | 97.4 | 87.9 | 70.8 | ||
| Far Cry 5 (2018) | 113 | 109 | 88 | ||
| Strange Brigade (2018) | 304 | 214 | 184 | 167.2 | |
| Shadow of the Tomb Raider (2018) | 124 | 119 | 83 | ||
| Metro Exodus (2019) | 149.2 | 114.3 | 88.3 | 71 | 52.7 |
| Borderlands 3 (2019) | 104.2 | 92.4 | 80.9 | 58.7 | |
| Hunt Showdown (2020) | 125.9 | 82.5 | |||
| Assassin´s Creed Valhalla (2020) | 88 | 79 | 61 | ||
| God of War (2022) | 83.6 | 59.8 | 44.7 | ||
| Dying Light 2 (2022) | 119.6 | 80.7 | 71.1 | 48.7 | |
| Cyberpunk 2077 1.6 (2022) | 108.8 | 89.2 | 75.6 | 43.1 | |
| Ghostwire Tokyo (2022) | 131 | 130.2 | 83.9 | ||
| Tiny Tina's Wonderlands (2022) | 115.2 | 90.7 | 59.3 |
Emissões - Jogador silencioso graças à solução de ventilador triplo da Asus
Ruído do sistema
Quando ociosos, somos confrontados com um laptop silencioso. Os ventiladores permanecem parados. Somente sob carga multi-core eles pulam de vez em quando, mas mesmo assim eles são restringidos, como quando navegando com múltiplas abas.
Sob carga permanente no modo Performance , o ruído dos ventiladores, dependendo do cenário, paira em torno de 36 db(A) (@Blender CPU benchmark) ou 42,4 db(A) nos jogos. No modo Turbo , o laptop emite em média 45 db(A) em ambos os cenários, mas pode aumentar para pouco menos de 50db(A) sob alta carga combinada. Isto chega a 55 db(A) no teste de estresse (Prime95 + FurMark). Pelo menos os ventiladores não emitem nenhum ruído em altas freqüências. Também não foi detectada nenhuma lamúria da bobina.
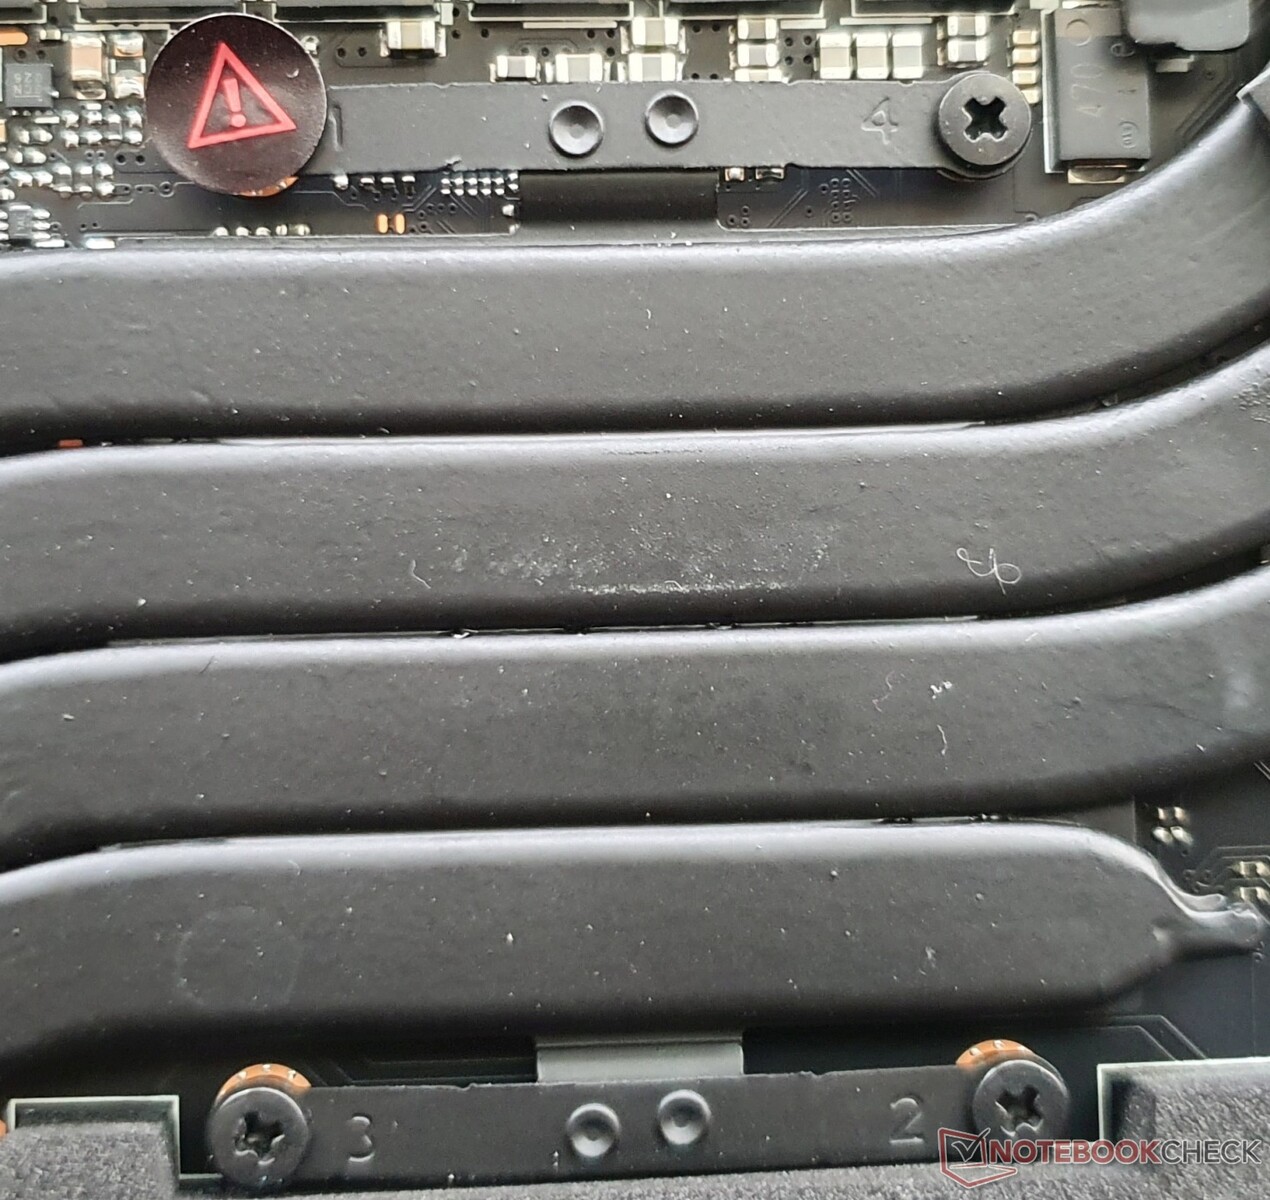
Os valores relativamente bons são devidos a uma combinação de vários fatores: cinco tubos de calor, três ventiladores, pasta térmica de metal líquido, uma saída de ventilador borda a borda na parte de trás do dispositivo e elementos de espuma no interior que concentram e direcionam o fluxo de ar. Tal sistema consegue resfriar 140 watts (15-40 W para CPU e 100-125 W para GPU), o que é muito bom para um conversível compacto de 16 polegadas.
Os laptops de jogos puros em nosso campo de comparação também não têm ventiladores que permanecem parados quando ociosos e geram volumes similares sob carga. O representante mais silencioso, de longe, é o MacBook Pro 16graças a seu eficiente processador Apple M1 ARM.
Barulho
| Ocioso |
| 25.5 / 25.5 / 27.4 dB |
| Carga |
| 49.9 / 55 dB |
 | ||
30 dB silencioso 40 dB(A) audível 50 dB(A) ruidosamente alto |
||
min: | ||
| Asus ROG Flow X16 GV601RW-M5082W GeForce RTX 3070 Ti Laptop GPU, R9 6900HS, Micron 3400 1TB MTFDKBA1T0TFH | Asus ROG Zephyrus M16 GU603H GeForce RTX 3070 Laptop GPU, i9-11900H, Samsung PM9A1 MZVL22T0HBLB | Asus ROG Strix Scar 15 G533ZW-LN106WS GeForce RTX 3070 Ti Laptop GPU, i9-12900H, Samsung PM9A1 MZVL22T0HBLB | Gigabyte Aero 16 YE5 GeForce RTX 3080 Ti Laptop GPU, i9-12900HK, Phison ESR01TBMFCT | Lenovo Legion 5 Pro 16 G7 i7 RTX 3070Ti GeForce RTX 3070 Ti Laptop GPU, i7-12700H, Samsung PM9A1 MZVL21T0HCLR | MSI Stealth GS66 12UGS GeForce RTX 3070 Ti Laptop GPU, i7-12700H, WDC PC SN810 1TB | Apple MacBook Pro 16 2021 M1 Pro M1 Pro 16-Core GPU, M1 Pro, Apple SSD AP1024R | Lenovo ThinkPad X1 Extreme G4-20Y50040GE GeForce RTX 3080 Laptop GPU, i9-11950H, Kioxia XG7 KXG7AZNV1T02 | Dell XPS 17 9720 RTX 3060 GeForce RTX 3060 Laptop GPU, i7-12700H, Samsung PM9A1 MZVL21T0HCLR | |
|---|---|---|---|---|---|---|---|---|---|
| Noise | -12% | -27% | -8% | -3% | -9% | 17% | 4% | 9% | |
| desligado / ambiente * (dB) | 25.5 | 25 2% | 26.86 -5% | 25 2% | 24.6 4% | 24 6% | 24.7 3% | 24.7 3% | 23.8 7% |
| Idle Minimum * (dB) | 25.5 | 25 2% | 39.07 -53% | 30 -18% | 28.4 -11% | 31 -22% | 24.7 3% | 24.7 3% | 24.1 5% |
| Idle Average * (dB) | 25.5 | 31 -22% | 39.07 -53% | 32 -25% | 28.4 -11% | 32 -25% | 24.7 3% | 24.7 3% | 24.1 5% |
| Idle Maximum * (dB) | 27.4 | 42 -53% | 39.07 -43% | 33 -20% | 28.4 -4% | 35 -28% | 24.7 10% | 28.1 -3% | 24.1 12% |
| Load Average * (dB) | 49.9 | 48 4% | 53.34 -7% | 45 10% | 49.4 1% | 48 4% | 26.1 48% | 42.5 15% | 43.2 13% |
| Load Maximum * (dB) | 55 | 56 -2% | 56.6 -3% | 52 5% | 54.7 1% | 48 13% | 37.4 32% | 52.1 5% | 48 13% |
| Witcher 3 ultra * (dB) | 52 | 56.6 | 50 | 49.4 | 43 | 46.4 | 48 |
* ... menor é melhor
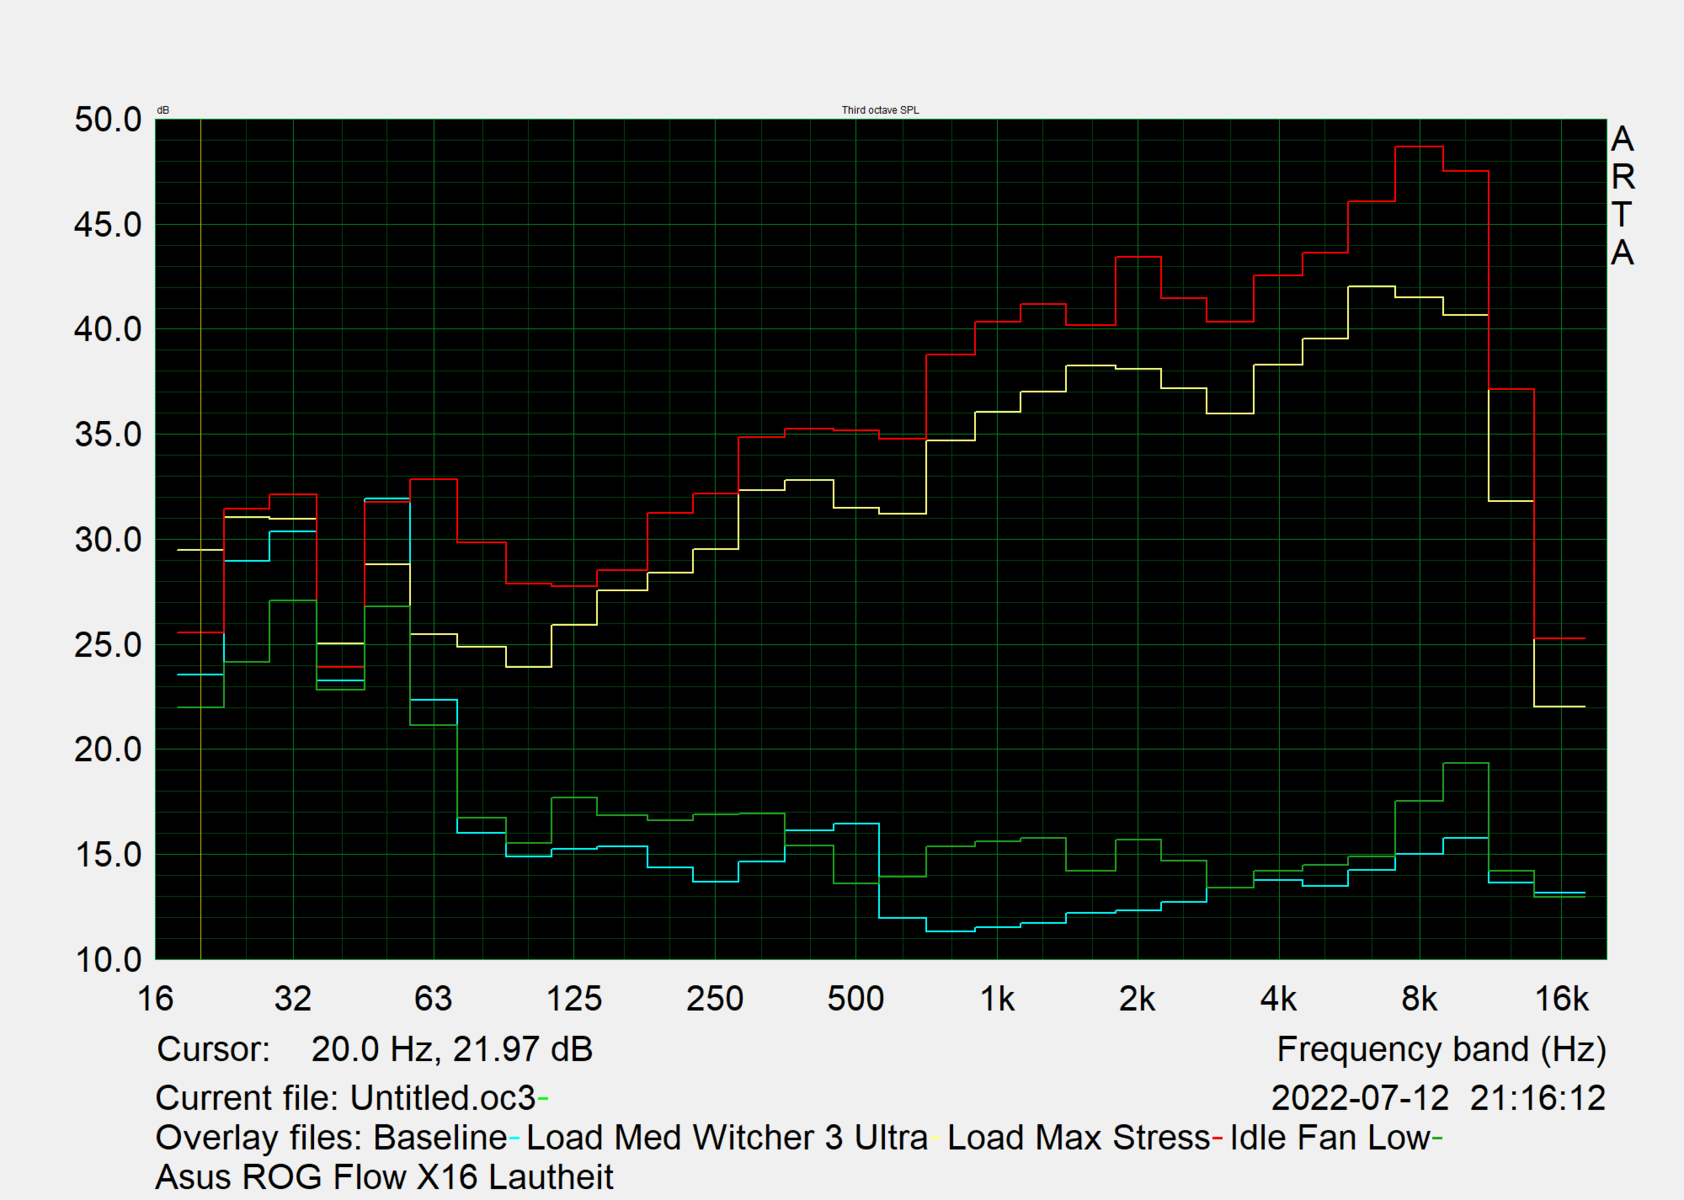
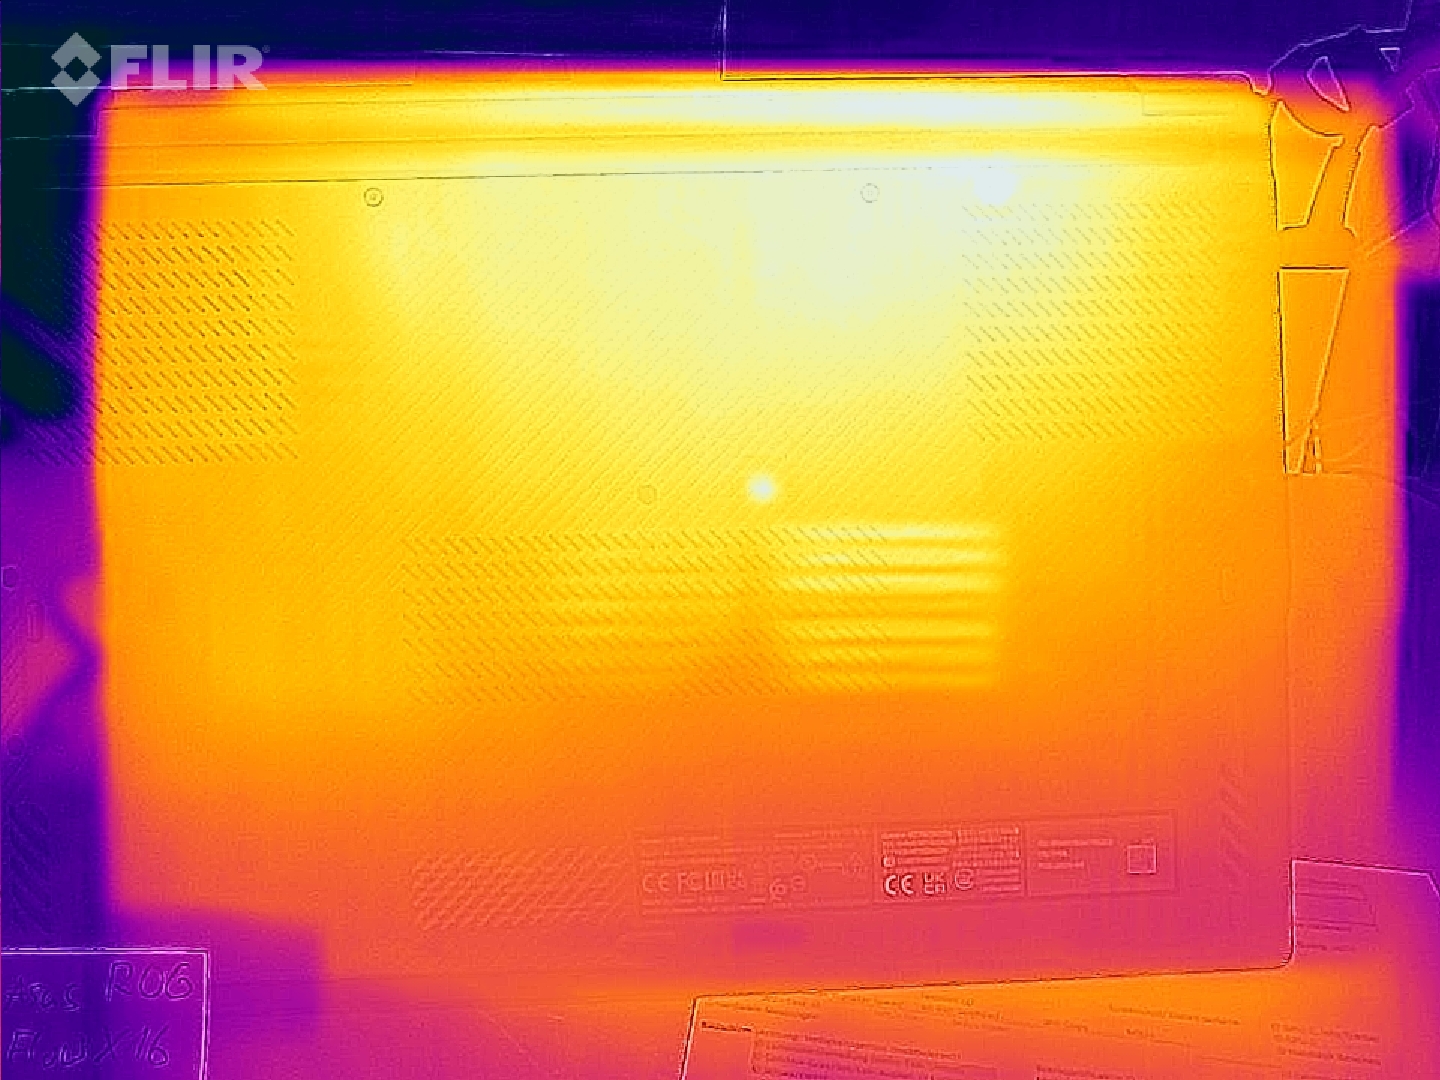
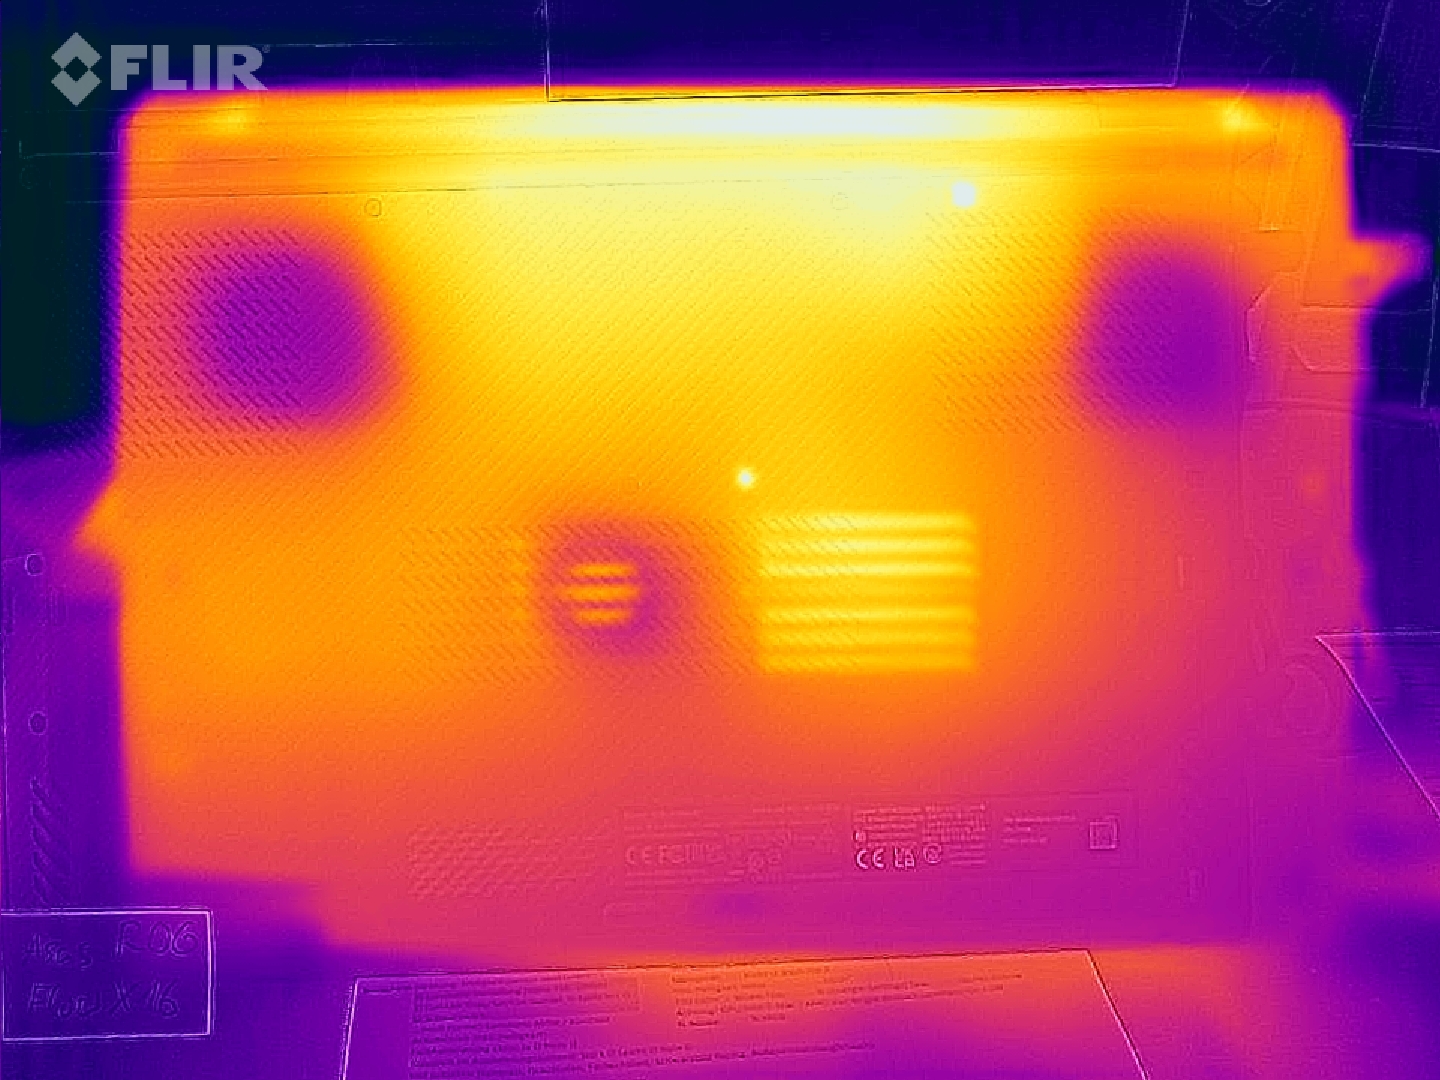
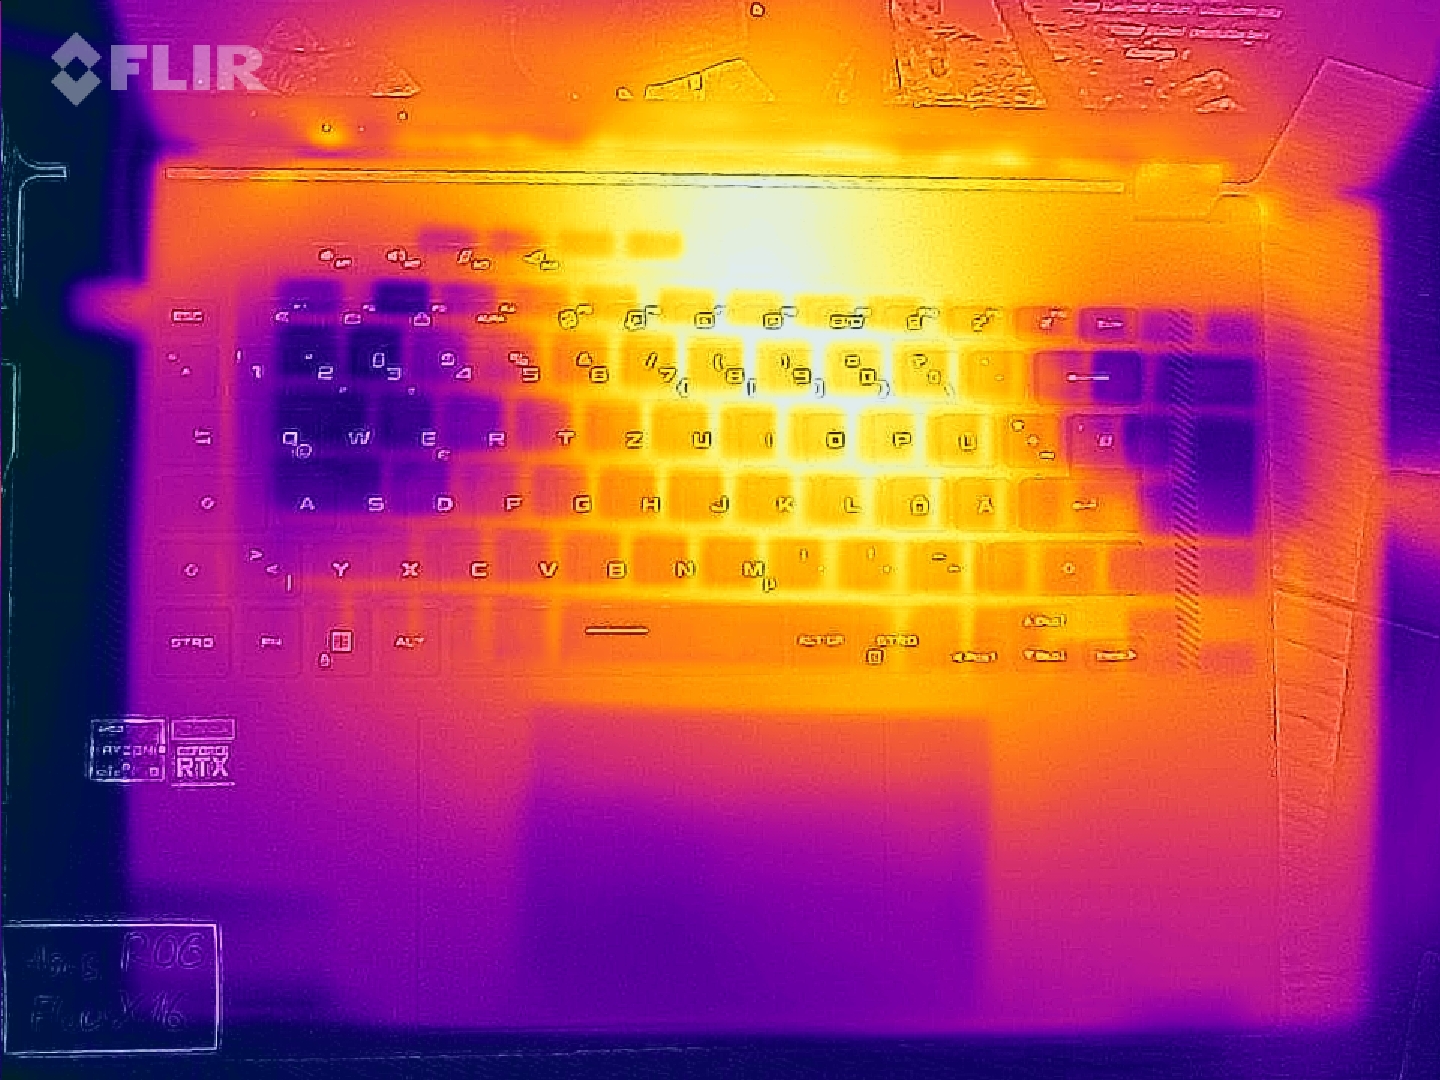
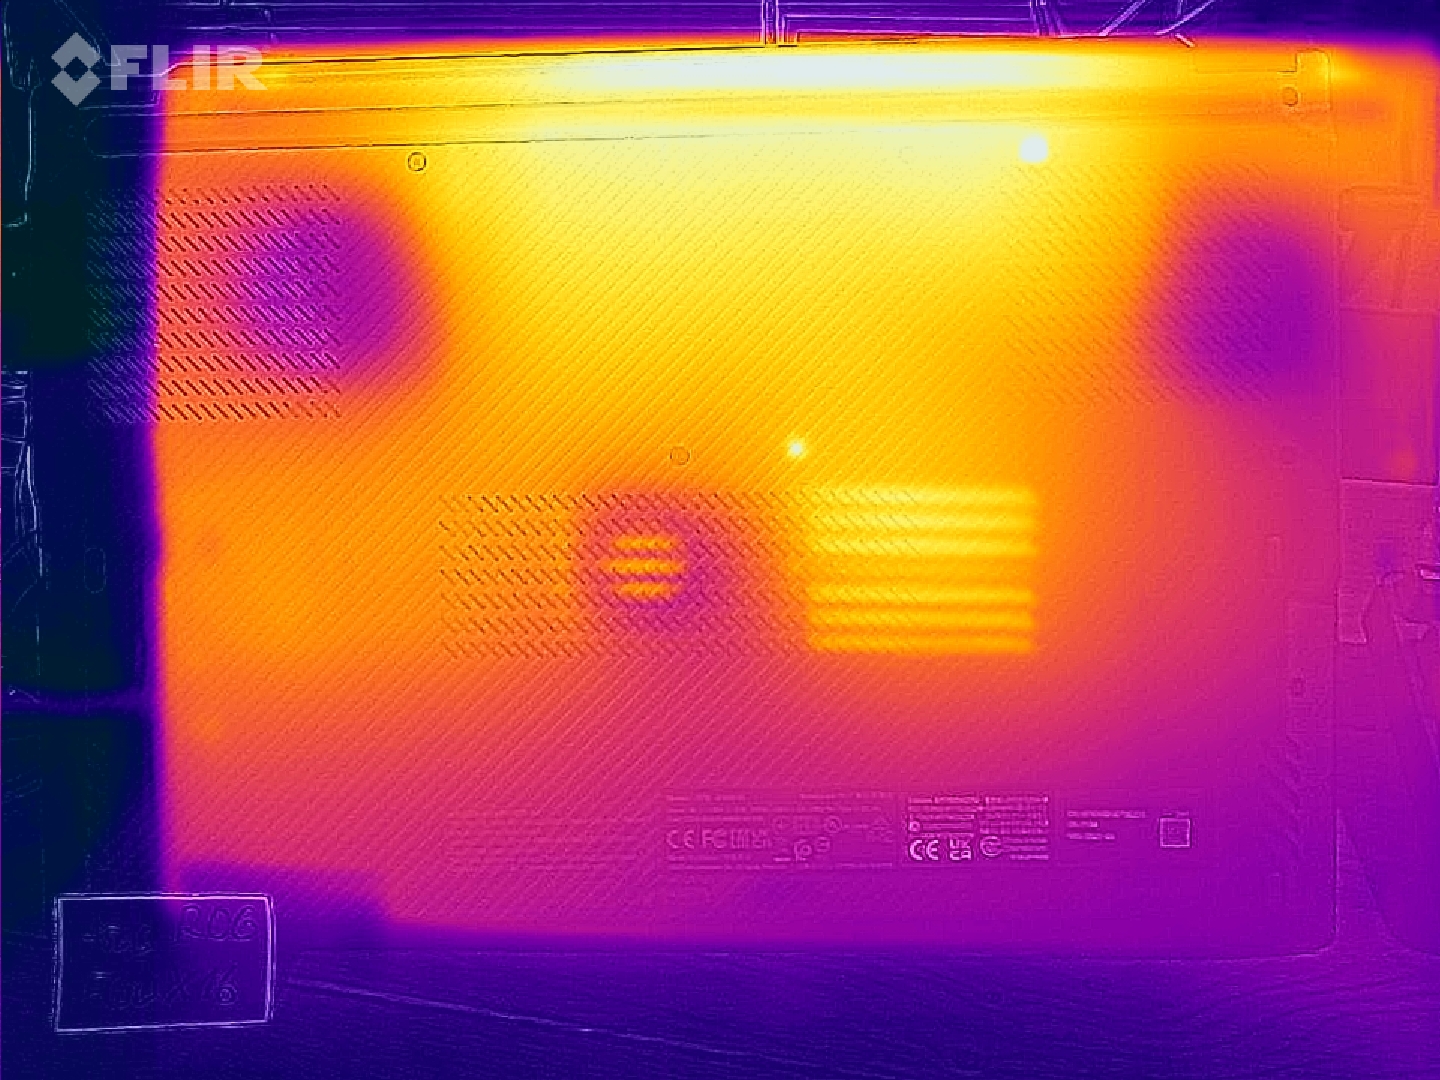
Temperatura
As temperaturas da superfície podem se tornar bastante quentes no centro acima do teclado. Medimos 55 °C na carga máxima e 52,8 °C durante os jogos. Estes pontos quentes permanecem visivelmente mais frios quando o conversível é apoiado na parte de trás para que os ventiladores na parte de baixo tenham um melhor suprimento de ar. Da mesma forma, os portáteis finos com hardware potente aquecem de forma semelhante sob carga (Furtivo GS66, Aero 16 und ThinkPad X1 Extreme).
A tela também pode aquecer durante longos períodos de exibição do conteúdo HDR no brilho máximo (devido ao alto consumo de energia), mas não a um grau que seja incômodo.
(-) A temperatura máxima no lado superior é 55.1 °C / 131 F, em comparação com a média de 40.4 °C / 105 F , variando de 21.2 a 68.8 °C para a classe Gaming.
(-) A parte inferior aquece até um máximo de 50.3 °C / 123 F, em comparação com a média de 43.2 °C / 110 F
(±) Em uso inativo, a temperatura média para o lado superior é 32.8 °C / 91 F, em comparação com a média do dispositivo de 33.9 °C / ### class_avg_f### F.
(-) Jogando The Witcher 3, a temperatura média para o lado superior é 40.5 °C / 105 F, em comparação com a média do dispositivo de 33.9 °C / ## #class_avg_f### F.
(-) Os apoios para as mãos e o touchpad podem ficar muito quentes ao toque, com um máximo de 40.8 °C / 105.4 F.
(-) A temperatura média da área do apoio para as mãos de dispositivos semelhantes foi 28.8 °C / 83.8 F (-12 °C / -21.6 F).
| Asus ROG Flow X16 GV601RW-M5082W AMD Ryzen 9 6900HS, NVIDIA GeForce RTX 3070 Ti Laptop GPU | Asus ROG Strix Scar 15 G533ZW-LN106WS Intel Core i9-12900H, NVIDIA GeForce RTX 3070 Ti Laptop GPU | Gigabyte Aero 16 YE5 Intel Core i9-12900HK, NVIDIA GeForce RTX 3080 Ti Laptop GPU | Lenovo Legion 5 Pro 16 G7 i7 RTX 3070Ti Intel Core i7-12700H, NVIDIA GeForce RTX 3070 Ti Laptop GPU | MSI Stealth GS66 12UGS Intel Core i7-12700H, NVIDIA GeForce RTX 3070 Ti Laptop GPU | Apple MacBook Pro 16 2021 M1 Pro Apple M1 Pro, Apple M1 Pro 16-Core GPU | Lenovo ThinkPad X1 Extreme G4-20Y50040GE Intel Core i9-11950H, NVIDIA GeForce RTX 3080 Laptop GPU | Dell XPS 17 9720 RTX 3060 Intel Core i7-12700H, NVIDIA GeForce RTX 3060 Laptop GPU | Microsoft Surface Laptop Studio i7 RTX 3050 Ti Intel Core i7-11370H, NVIDIA GeForce RTX 3050 Ti Laptop GPU | |
|---|---|---|---|---|---|---|---|---|---|
| Heat | 3% | 5% | 7% | 9% | 29% | 10% | 7% | 29% | |
| Maximum Upper Side * (°C) | 55.1 | 42.6 23% | 49 11% | 45.3 18% | 54 2% | 41 26% | 51.4 7% | 51.8 6% | 42.3 23% |
| Maximum Bottom * (°C) | 50.3 | 50.2 -0% | 55 -9% | 61.2 -22% | 59 -17% | 39 22% | 55.9 -11% | 44.2 12% | 38.2 24% |
| Idle Upper Side * (°C) | 35.5 | 36.2 -2% | 33 7% | 28.6 19% | 26 27% | 24 32% | 27.2 23% | 34.8 2% | 23.4 34% |
| Idle Bottom * (°C) | 36.1 | 40.2 -11% | 33 9% | 31.4 13% | 27 25% | 24 34% | 28.8 20% | 33.2 8% | 23.5 35% |
* ... menor é melhor
Teste de estresse
Sob pura tensão da CPU, oRyzen 9 6900HSainda relógios a 3,9 GHz e a temperatura permanece em torno de 90 °C. Sob tensão combinada (Prime95 + FurMark), o relógio permanece em 3 GHz, que está 300 MHz abaixo do relógio de base. A GPU alterna entre 800 MHz e 1,4 GHz, enquanto a RTX 3070 Ti relógios a 1,5 GHz no teste de estresse Witcher 3. Sua temperatura está bem abaixo de 90 °C em todos os cenários.
| Relógio da CPU (GHz) | Relógio da GPU (MHz) | Temperatura da CPU (°C) | Temperatura da GPU (°C) | Tomada de força da CPU (W) | Tomada de força da GPU (W) | Tomada de força combinada (W) | |
| System Idle | 0.07 | 0.2 | 43 | 39 | 7,5 | 13 | 20,5 |
| Prime95 Stress | 3,9 | - | 87 | -- | 75 | - | 75 |
| Prime95 + FurMark Stress | 3 | 800 - 1.400 | 87 | 81 | 40 | 100 | 140 |
| FurMark Stress | 0,2 | 1.150 | 75 | 83 | 20 | 120 | 140 |
| Witcher 3 Estresse | 0,75 | 1.500 | 70 | 74 | 15 | 125 | 140 |
Oradores
O Asus basicamente usa o mesmo sistema de som que noZephyrus M16 e o ROG Strix G15o que significa que há quatro woofers, mas faltam os dois tweeters adicionais. Os alto-falantes produzem uma pressão sonora máxima de 80,7 db(A), o que é decente para um laptop, mas não é suficiente para jogos com ventiladores altos.
O baixo está faltando apenas em um pequeno grau, os médios são muito equilibrados e os agudos ultrapassam um pouco. Subjetivamente, não há muitos laptops que dão melhor qualidade de som; de acordo com nosso banco de dados, apenas 6% de todos os dispositivos revisados podem fazer melhor.
Asus ROG Flow X16 GV601RW-M5082W análise de áudio
(±) | o volume do alto-falante é médio, mas bom (###valor### dB)
Graves 100 - 315Hz
(±) | graves reduzidos - em média 12.7% menor que a mediana
(±) | a linearidade dos graves é média (13.8% delta para a frequência anterior)
Médios 400 - 2.000 Hz
(+) | médios equilibrados - apenas 1.3% longe da mediana
(+) | médios são lineares (4.7% delta para frequência anterior)
Altos 2 - 16 kHz
(±) | máximos mais altos - em média 6.4% maior que a mediana
(+) | os máximos são lineares (6.8% delta da frequência anterior)
Geral 100 - 16.000 Hz
(+) | o som geral é linear (12.9% diferença em relação à mediana)
Comparado com a mesma classe
» 17% de todos os dispositivos testados nesta classe foram melhores, 4% semelhantes, 79% piores
» O melhor teve um delta de 6%, a média foi 18%, o pior foi 132%
Comparado com todos os dispositivos testados
» 12% de todos os dispositivos testados foram melhores, 3% semelhantes, 85% piores
» O melhor teve um delta de 4%, a média foi 23%, o pior foi 134%
Apple MacBook Pro 16 2021 M1 Pro análise de áudio
(+) | os alto-falantes podem tocar relativamente alto (###valor### dB)
Graves 100 - 315Hz
(+) | bons graves - apenas 3.8% longe da mediana
(+) | o baixo é linear (5.2% delta para a frequência anterior)
Médios 400 - 2.000 Hz
(+) | médios equilibrados - apenas 1.3% longe da mediana
(+) | médios são lineares (2.1% delta para frequência anterior)
Altos 2 - 16 kHz
(+) | agudos equilibrados - apenas 1.9% longe da mediana
(+) | os máximos são lineares (2.7% delta da frequência anterior)
Geral 100 - 16.000 Hz
(+) | o som geral é linear (4.6% diferença em relação à mediana)
Comparado com a mesma classe
» 0% de todos os dispositivos testados nesta classe foram melhores, 0% semelhantes, 100% piores
» O melhor teve um delta de 5%, a média foi 17%, o pior foi 45%
Comparado com todos os dispositivos testados
» 0% de todos os dispositivos testados foram melhores, 0% semelhantes, 100% piores
» O melhor teve um delta de 4%, a média foi 23%, o pior foi 134%
Gestão de energia - Valores ociosos anormalmente elevados
Consumo de energia

Enquanto ociosos, são necessários 12,2 watts no modo Silencioso + GPU Economia de Energia. No modo Silencioso + GPU Balanceado , o sistema precisa de 25,5 watts completos e pouco menos de 30 watts no modo Turbo . Estes são valores excepcionalmente elevados, mesmo para um laptop de jogos, o que pode ser em parte devido à tela mini-LED.
O Scar 15, Legion 5 Pro e MSI Stealth GS66 todos requerem significativamente menos energia quando ociosos. Os laptops OLED, por outro lado, compartilham os altos valores de ociosidade do ROG Flow X16.
Como a CPU e a GPU juntas requerem cerca de 140 watts no The Witcher 3,
isto deixa 43 watts restantes para o resto do sistema. O teste de estresse máximo exige inicialmente 253 watts do adaptador de potência de 240 watts. Entretanto, o valor cai acentuadamente após apenas alguns segundos e se fixa em 217 watts aceitáveis após um minuto.| desligado | |
| Ocioso | |
| Carga |
|
Key:
min: | |
| Asus ROG Flow X16 GV601RW-M5082W R9 6900HS, GeForce RTX 3070 Ti Laptop GPU, Micron 3400 1TB MTFDKBA1T0TFH, Mini LED, 2560x1600, 16.1" | Asus ROG Zephyrus M16 GU603H i9-11900H, GeForce RTX 3070 Laptop GPU, Samsung PM9A1 MZVL22T0HBLB, IPS, 2560x1600, 16" | Asus ROG Strix Scar 15 G533ZW-LN106WS i9-12900H, GeForce RTX 3070 Ti Laptop GPU, Samsung PM9A1 MZVL22T0HBLB, IPS-level, 2560x1440, 15.6" | Gigabyte Aero 16 YE5 i9-12900HK, GeForce RTX 3080 Ti Laptop GPU, Phison ESR01TBMFCT, AMOLED, 3840x2400, 16" | Lenovo Legion 5 Pro 16 G7 i7 RTX 3070Ti i7-12700H, GeForce RTX 3070 Ti Laptop GPU, Samsung PM9A1 MZVL21T0HCLR, IPS, 2560x1600, 16" | MSI Stealth GS66 12UGS i7-12700H, GeForce RTX 3070 Ti Laptop GPU, WDC PC SN810 1TB, IPS-Level, 2560x1440, 15.6" | Apple MacBook Pro 16 2021 M1 Pro M1 Pro, M1 Pro 16-Core GPU, Apple SSD AP1024R, Mini-LED, 3456x2234, 16.2" | Lenovo ThinkPad X1 Extreme G4-20Y50040GE i9-11950H, GeForce RTX 3080 Laptop GPU, Kioxia XG7 KXG7AZNV1T02, IPS, 3840x2400, 16" | Dell XPS 17 9720 RTX 3060 i7-12700H, GeForce RTX 3060 Laptop GPU, Samsung PM9A1 MZVL21T0HCLR, IPS, 3840x2400, 17" | Média NVIDIA GeForce RTX 3070 Ti Laptop GPU | Média da turma Gaming | |
|---|---|---|---|---|---|---|---|---|---|---|---|
| Power Consumption | 18% | 24% | -19% | 17% | 23% | 56% | 27% | 37% | 10% | 14% | |
| Idle Minimum * (Watt) | 12.2 | 11 10% | 7.56 38% | 26 -113% | 8.6 30% | 11 10% | 5 59% | 12.3 -1% | 5.9 52% | 14.2 ? -16% | 13.1 ? -7% |
| Idle Average * (Watt) | 25.5 | 20 22% | 13.5 47% | 30 -18% | 17.6 31% | 16 37% | 15.1 41% | 22.8 11% | 15.8 38% | 19.9 ? 22% | 19 ? 25% |
| Idle Maximum * (Watt) | 29.8 | 30 -1% | 16.87 43% | 37 -24% | 18.5 38% | 23 23% | 15.5 48% | 13.9 53% | 26.7 10% | 26.2 ? 12% | 24.6 ? 17% |
| Load Average * (Watt) | 183 | 111 39% | 128.9 30% | 127 31% | 110 40% | 110 40% | 54 70% | 95.4 48% | 117.4 36% | 125.8 ? 31% | 111.3 ? 39% |
| Witcher 3 ultra * (Watt) | 183.6 | 156 15% | 196.2 -7% | 176 4% | 227 -24% | 151 18% | 154 16% | 114.8 37% | |||
| Load Maximum * (Watt) | 253 | 197 22% | 274.86 -9% | 236 7% | 294.6 -16% | 230 9% | 90 64% | 170.7 33% | 136.6 46% | 248 ? 2% | 260 ? -3% |
* ... menor é melhor
Power consumption Witcher 3 / Stress test
Power consumption with an external monitor
Vida útil da bateria
Medimos os tempos de funcionamento da bateria WLAN com o HDR desligado e no modo Balanceado do Armoury Crate e no modo de Economia de Energia GPU (dGPU desabilitado). A taxa de quadros é automaticamente ajustada para 60 Hz no modo de bateria (este recurso pode ser desativado), enquanto o brilho foi de 173 lêndeas durante o teste. Em seguida, executamos um script padronizado que chama páginas da web em diferentes intervalos, percorre-as onde necessário, clica em links, olha imagens e animações e o que quer que as pessoas façam em websites.
O resultado é medíocre: uma comparação com um modelo idêntico sem um mini-LED seria interessante aqui. Um pouco mais de 5:39 h é nosso resultado (1 hora a menos a 165 Hz). Com um brilho total de 500 lêndeas, perdemos quase mais 2 horas (3:45 h), enquanto os jogos com bateria acabam após cerca de 50 minutos.
O mais ou menos idênticoZephyrus M16com o mesmo tamanho de bateria e um processador Intel com mais de 7 horas e meia de fome. Entretanto, há muitos laptops para jogos entre a concorrência que não duram 6 horas no teste WLAN, o que não é incomum para esta classe de laptops. As atualizações de firmware e BIOS podem melhorar a vida útil da bateria do Flow X16. Uma recarga completa da bateria de 90 Wh leva uma hora e meia.
Apple's MacBook Pro 16 se destaca com quase 17 horas de vida útil da bateria, o que é ainda mais impressionante quando se considera que ela também ostenta uma mini-LED.
| Asus ROG Flow X16 GV601RW-M5082W R9 6900HS, GeForce RTX 3070 Ti Laptop GPU, 90 Wh | Asus ROG Zephyrus M16 GU603H i9-11900H, GeForce RTX 3070 Laptop GPU, 90 Wh | Asus ROG Strix Scar 15 G533ZW-LN106WS i9-12900H, GeForce RTX 3070 Ti Laptop GPU, 90 Wh | Gigabyte Aero 16 YE5 i9-12900HK, GeForce RTX 3080 Ti Laptop GPU, 99 Wh | Lenovo Legion 5 Pro 16 G7 i7 RTX 3070Ti i7-12700H, GeForce RTX 3070 Ti Laptop GPU, 80 Wh | MSI Stealth GS66 12UGS i7-12700H, GeForce RTX 3070 Ti Laptop GPU, 99.9 Wh | Apple MacBook Pro 16 2021 M1 Pro M1 Pro, M1 Pro 16-Core GPU, 99.6 Wh | Lenovo ThinkPad X1 Extreme G4-20Y50040GE i9-11950H, GeForce RTX 3080 Laptop GPU, 90 Wh | Dell XPS 17 9720 RTX 3060 i7-12700H, GeForce RTX 3060 Laptop GPU, 97 Wh | Asus ROG Flow X13 GV301QH R9 5980HS, GeForce GTX 1650 Max-Q, 62 Wh | Média da turma Gaming | |
|---|---|---|---|---|---|---|---|---|---|---|---|
| Duração da bateria | 57% | 27% | 45% | -19% | 37% | 196% | 21% | 32% | 51% | 45% | |
| WiFi v1.3 (h) | 5.7 | 7.7 35% | 8.4 47% | 6.4 12% | 5.4 -5% | 5.4 -5% | 16.9 196% | 6.8 19% | 8.7 53% | 5.8 2% | 7.08 ? 24% |
| Witcher 3 ultra (h) | 0.9 | 1.2 33% | |||||||||
| Load (h) | 0.9 | 1.6 78% | 0.9 0% | 1.6 78% | 0.6 -33% | 1.6 78% | 1.1 22% | 1 11% | 1.8 100% | 1.496 ? 66% | |
| Reader / Idle (h) | 13.3 | 8.9 | 7.8 | 10.4 | 7.84 ? | ||||||
| H.264 (h) | 8.5 | 7.5 | 6.3 | 17.5 | 6.9 | 6.9 | 8.27 ? |
Pro
Contra
Veredicto - Asus ROG Flow X16: Conversível para jogos bem sucedidos

A Asus consegue criar um híbrido completo de laptop para jogos e multimídia conversível na forma do ROG Flow X16. As temperaturas e os níveis de ruído permanecem dentro dos limites, apesar do design compacto, graças a um design especial de resfriamento. Isto também permite o uso de um GeForce RTX 3070 Ti com 125 W de TGP, enquanto muitos laptops multimídia da classe alta, tais como o Dell XPS 17 ou o Gigabyte Aero 16a potência de 80 a 105 watts.
Conseqüentemente, o desempenho do Fluxo X16 é bom, o que é auxiliado pelo interruptor MUX existente. O frugal da AMD Ryzen 9 6900HS também fornece energia suficiente, que permanece altamente acessível mesmo em modo de bateria, ao contrário de muitas contrapartes da Intel.
Outro fator essencial para jogos e tarefas criativas é a tela, e o Asus não poderia ter feito muito melhor aqui, já que as telas de mini LED estão entre as melhores de seu tipo e são superiores às telas OLED de igualmente alto contraste em termos de brilho, mesmo que isto não possa ser totalmente utilizado com a energia da bateria. Ainda assim, o DisplayHDR 1000 torna o conteúdo correspondente (por exemplo, quando se joga) incrivelmente bonito de se ver e também melhora o contraste e os valores de preto no modo desktop (512 zonas locais de escurecimento são ativadas). A cobertura quase 100% do espaço de cores DCI-P3 de um painel QHD bem calibrado em estado de entrega é uma vantagem garantida para a edição profissional de imagens, enquanto o leve efeito de floração é apenas um pouco incômodo.
As dobradiças de 360° também são vantajosas para situações como jogos em modo barraca com um controlador ou quando você está em movimento, desde que você não pretenda fazê-lo por mais de várias horas de cada vez. A isto se somam os bons alto-falantes e as possibilidades de atualização para 64 GB de RAM DDR5 e a instalação de um segundo SSD. O acabamento é de alto nível e os dispositivos de entrada são bons, mesmo que alguns preferissem que o teclado silencioso com seu curso generoso de 1,7 mm fosse mais nítido, enquanto outros teriam gostado que a iluminação RGB fosse programável individualmente.
O ROG Flow X16 convence como um jogador 2 em 1 único com seu alto desempenho, um sistema de resfriamento bem pensado e a brilhante tela mini-LED - não apenas em jogos, mas em todas as tarefas multimídia. A vida útil da bateria é nosso principal ponto de crítica.
Falta o USB 4, mas a porta xGM do Asus dá esperança para eGPUs mais potentes no futuro. Também gostaríamos de ter uma porta LAN, assim como um leitor de impressões digitais, um leitor de cartões SD completo e uma webcam de 1080p. Você também tem que viver com alto consumo de energia quando ocioso, que pode ser reduzido com os perfis de economia de energia da Asus. Os tempos de funcionamento da bateria não são bons, mas normais para a classe do dispositivo e podem ser melhorados com futuras atualizações.
No final das contas, apenas dois aspectos impedem uma decisão: O preço de pouco menos de US$3.000 (ou US$2.000 na configuração básica sem Mini LED e com um RTX 3050 Ti) e a questão do que você realmente precisa: Um jogador clássico com TGP máximo, os melhores tempos de resposta e o FPS mais alto possível? Então você ficaria melhor com o MSI Raider GE77 HX. Os poderosos Legion 5 Proo ROG Flow X16, também é consideravelmente mais barato em torno de US$ 1.900, mas menos compacto e luta com emissões mais elevadas do que o ROG Flow X16.
Dito isto, o desempenho da GPU do Flow X16 não está disponível em nenhum outro notebook com estas dimensões compactas, sem mencionar a funcionalidade 2-em-1. Para aqueles que podem passar sem Windows e, portanto, sem a maioria dos jogos, o MacBook Pro 16 com seu M1 SoC oferece numerosas vantagens, tais como tempos de funcionamento muito longos da bateria, operação em sua maioria silenciosa e um muito bom visor mini-LED.
Preço e Disponibilidade
Nossa amostra de revisão (GV601RW-M5082W) com Ryzen 9 6900HS, 32 GB RAM, 1 TB SSD, RTX 3070 Ti e visor mini-LED é um modelo de pré-lançamento destinado ao mercado de língua alemã, onde ainda não está disponível.
Outros modelos em diferentes configurações já estão disponíveis em alguns países. Por exemplo, uma configuração quase idêntica (com 16GB de RAM ao invés de 32) está disponível no site USA por US$2.699,99. Uma configuração completamente idêntica está disponível no UK via Amazonmas atualmente está listado como fora de estoque. A Índia lista dois modelos com configurações diferentes a preços diferentes. A Austrália, por sua vez, oferece uma configuração idêntica por AU$4.099,00. Os preços e a disponibilidade no momento da redação (04.08.2022) estão sujeitos a alterações
Os exemplos acima não são exaustivos: Os usuários são aconselhados a verificar (quando aplicável) diretamente através do website da Asus Republic of Gamers. Basta procurar por ROG Flow X 16 em Produtos -> Laptops, depois clicar em Onde comprar.
Asus ROG Flow X16 GV601RW-M5082W
- 08/03/2022 v7 (old)
Marvin Gollor
Price comparison

