Soluções de exibição de impacto IMP-3713-V2-16-500 Fanless PC Review
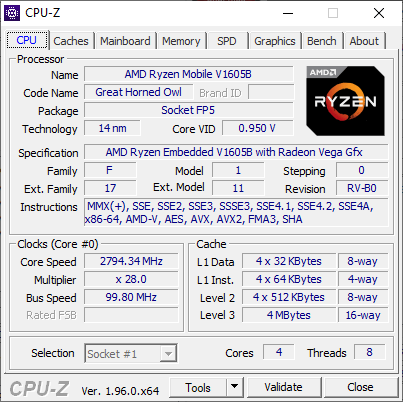
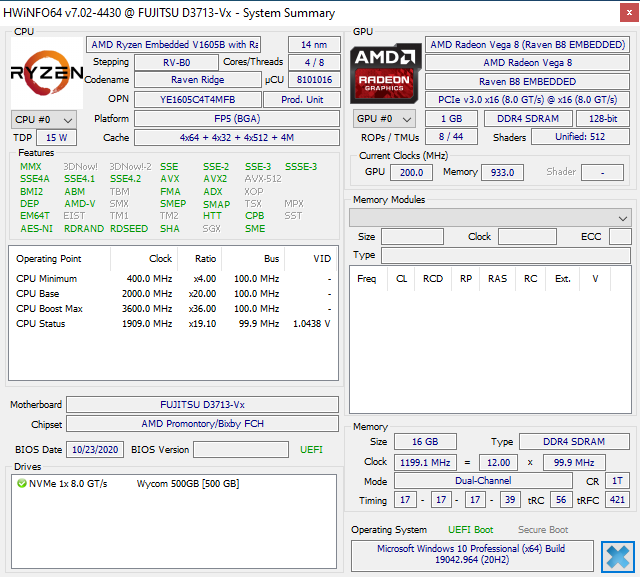
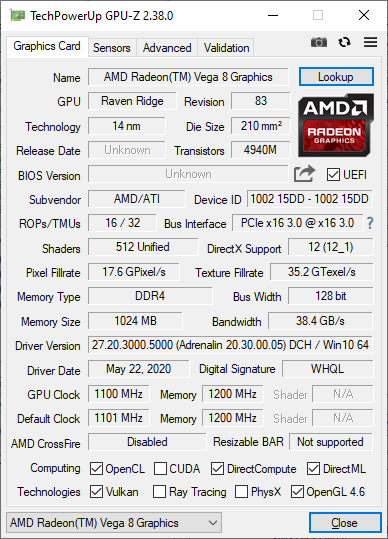
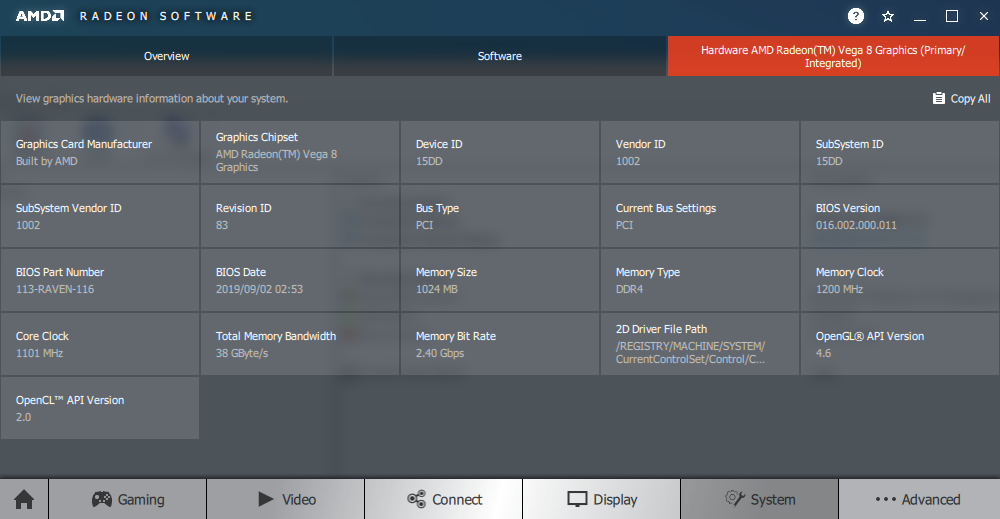
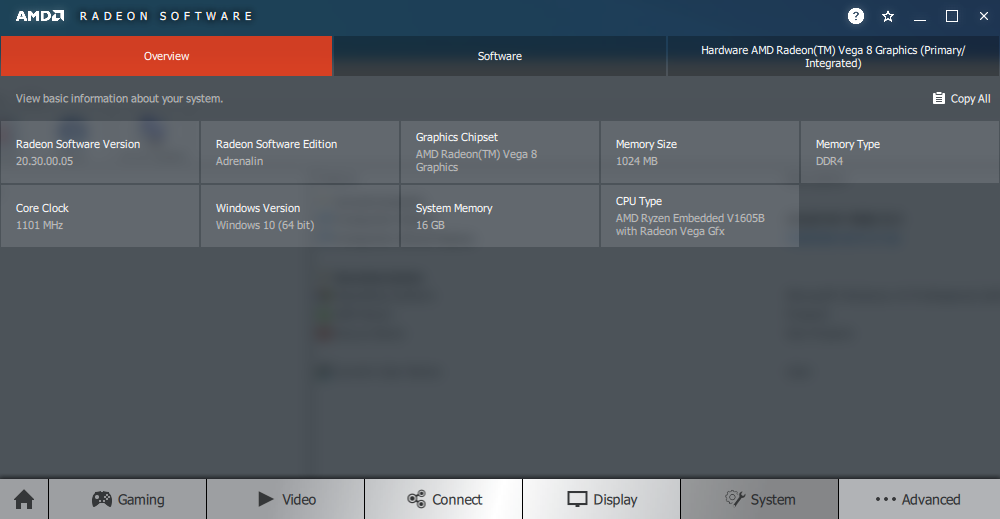
Componentes de impacto é especializada em construir PCs industriais com hardware especializado e placas-mãe. Alguns modelos têm refrigeração ativa enquanto a unidade de revisão aqui é sem ventilador. Vamos enfatizar e comparar o sistema para ver como um chassi resfriado passivamente pode lidar com uma CPU Ryzen Embedded V1605B de baixa potência de 12 a 25 W AMD Ryzen
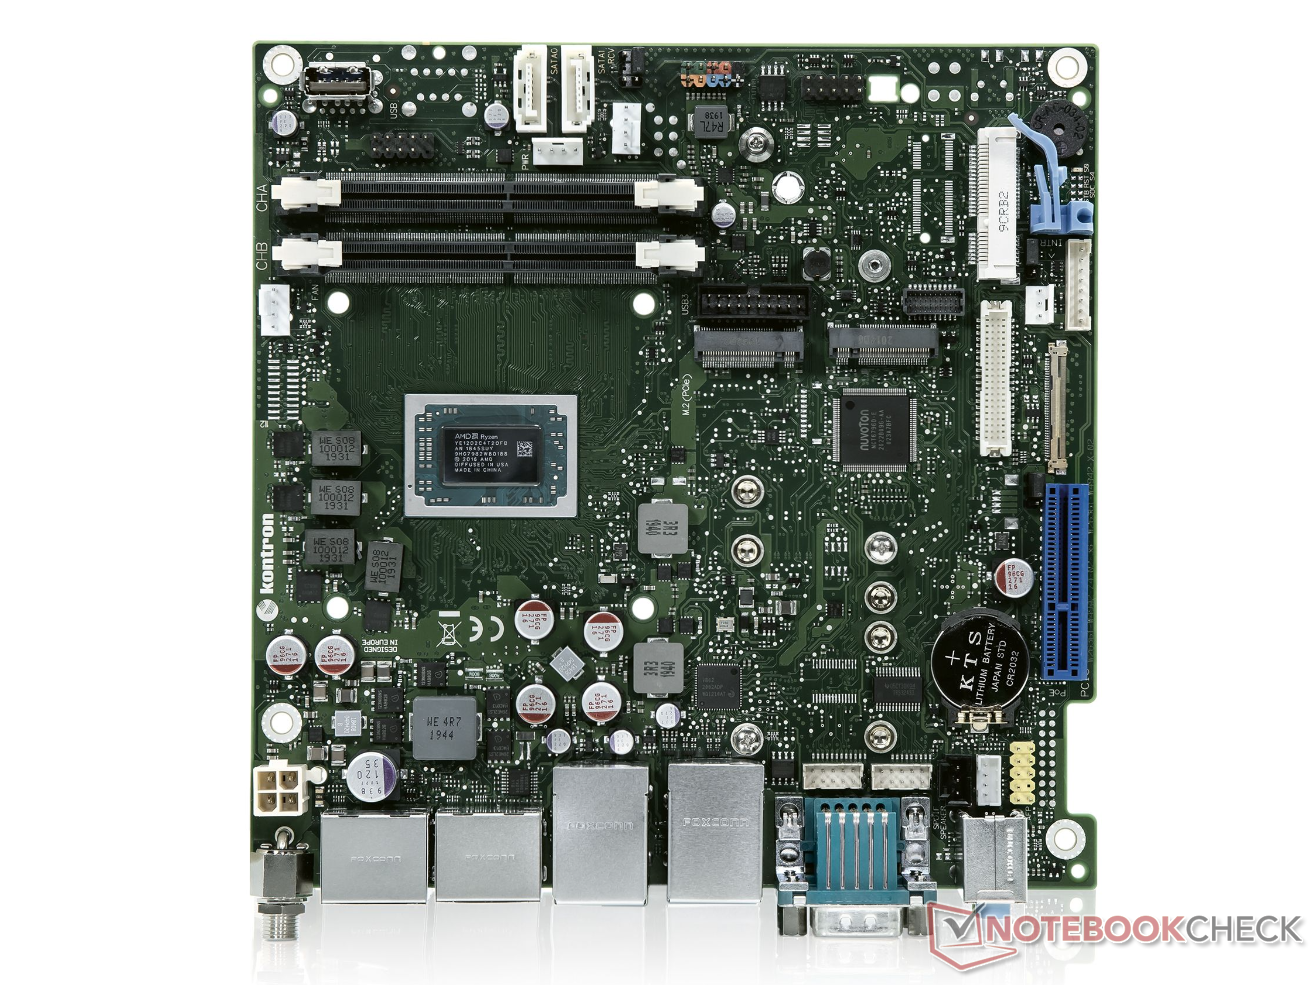
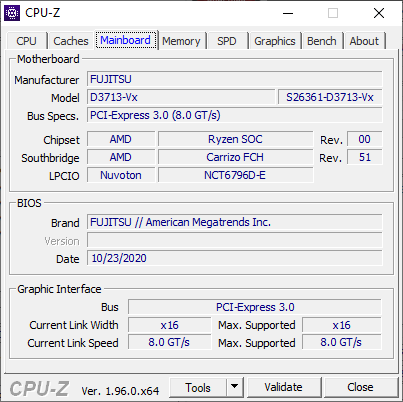
Especificações mais detalhadas sobre o PC e sua placa-mãe D3713-V/R mITX podem ser encontradas via https://www.kontron.com/en/products/d3713-v-r-mitx/p158681 respectivo páginas de produtos.
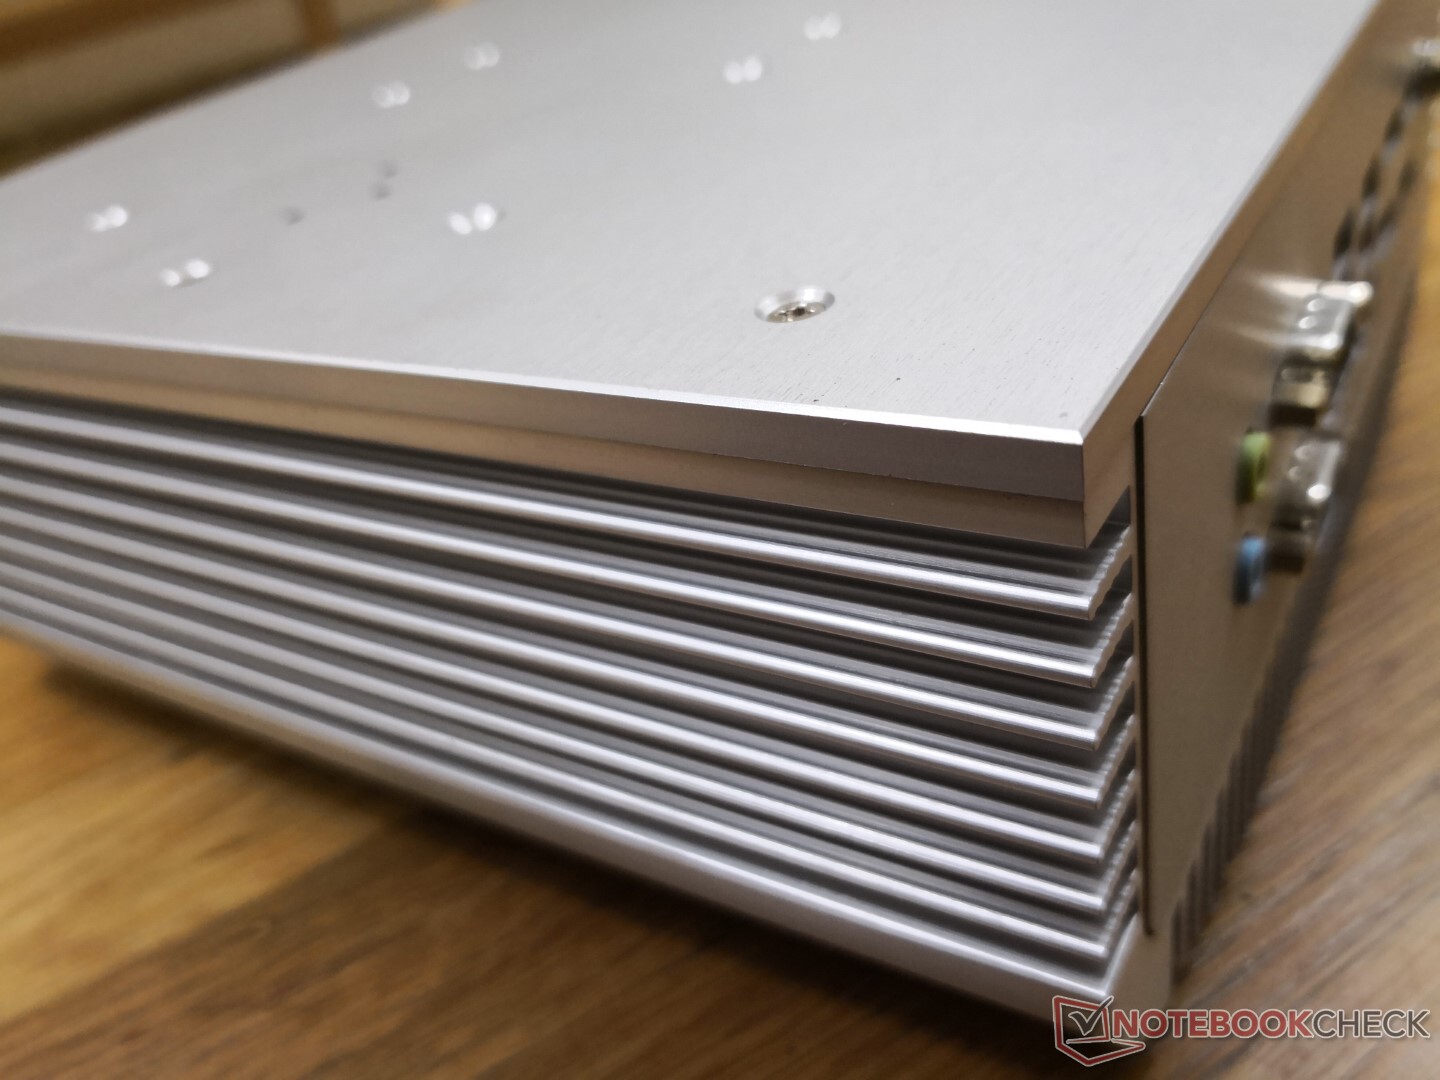
Caso
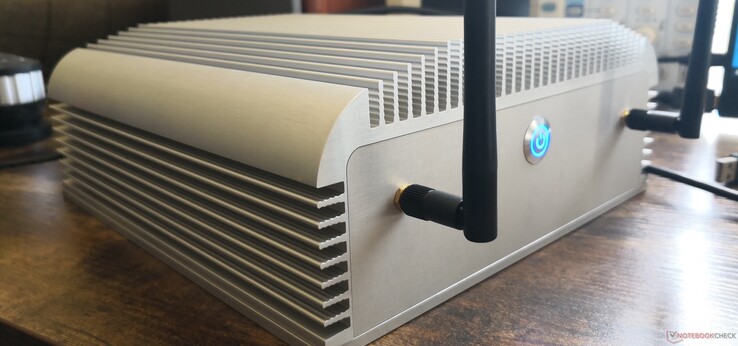
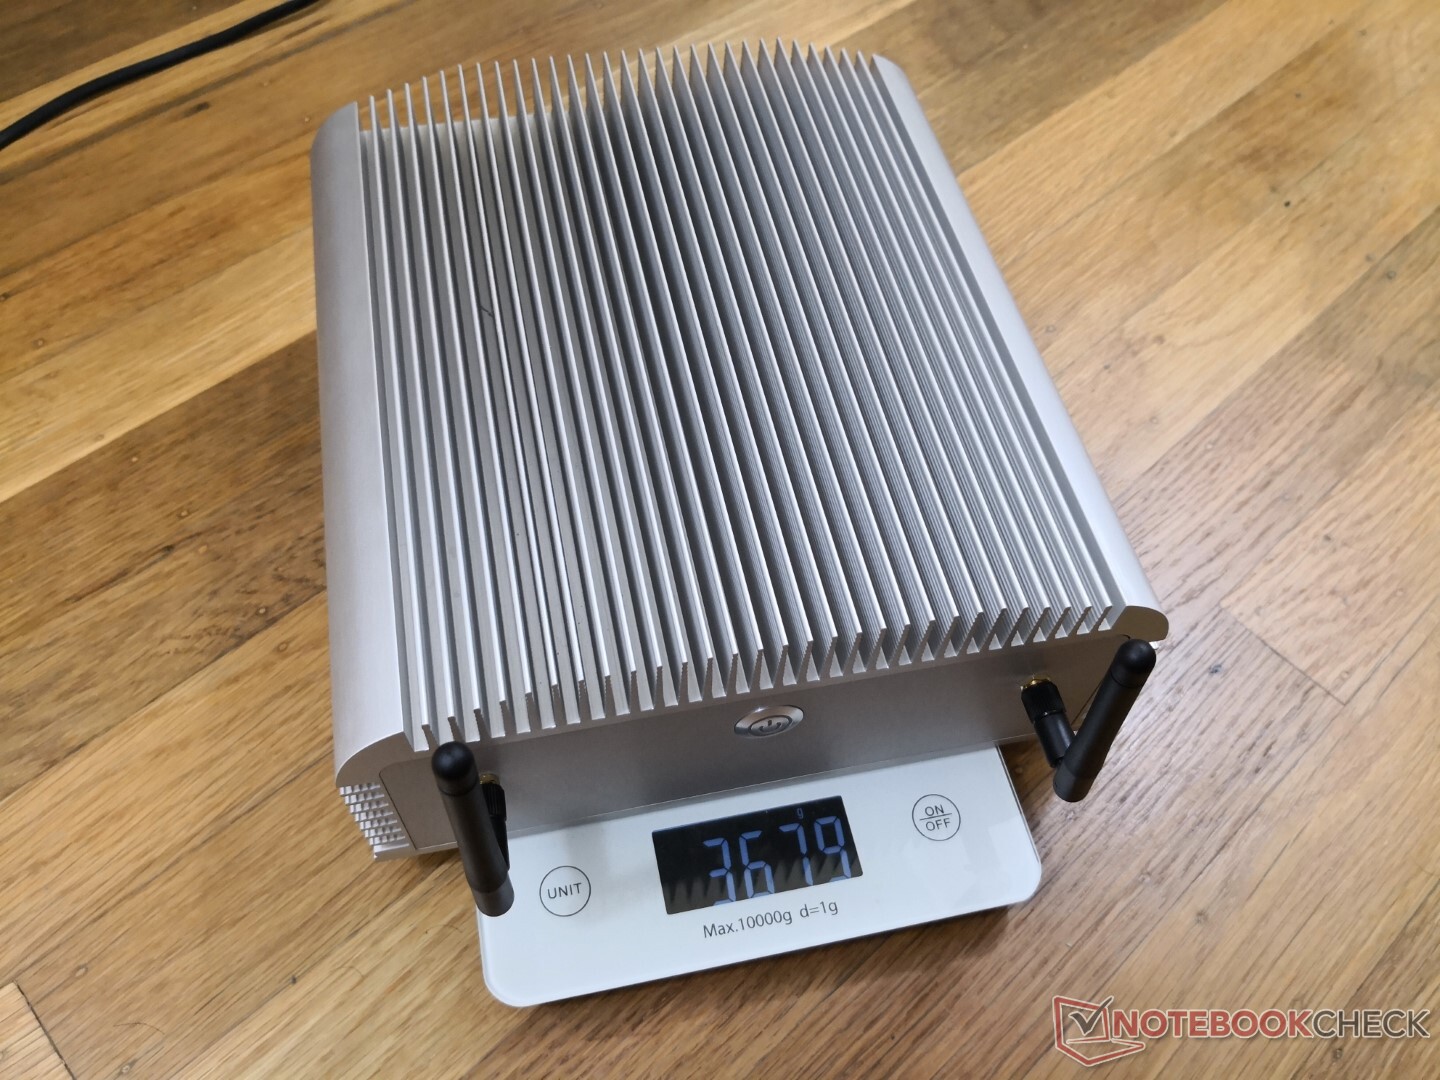
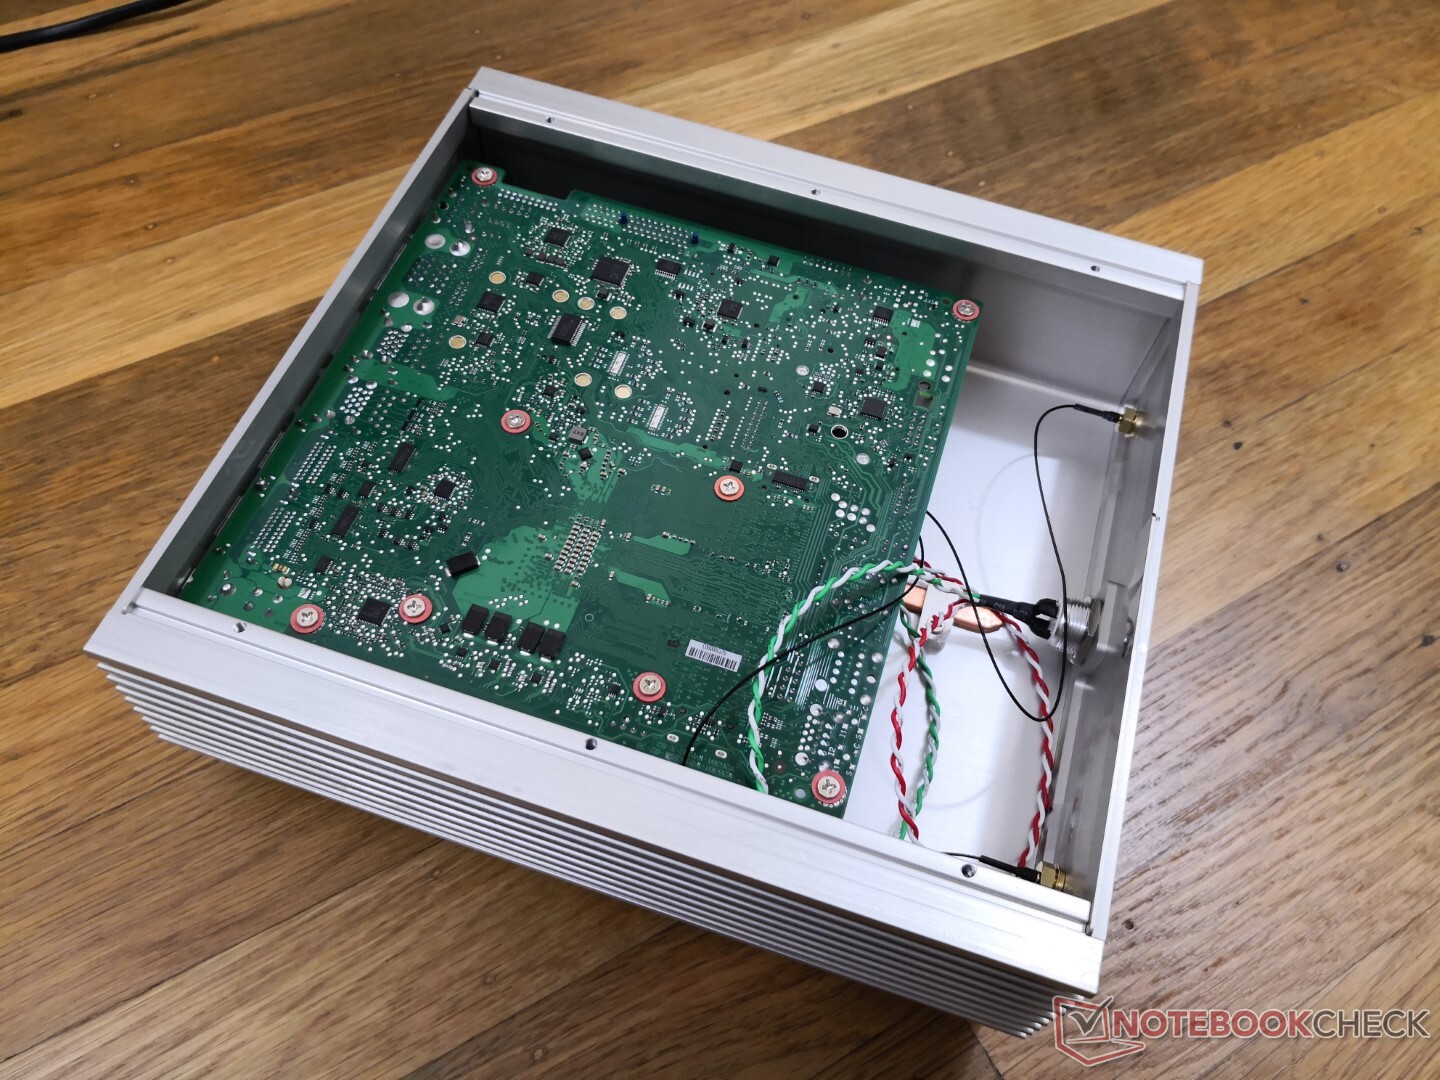
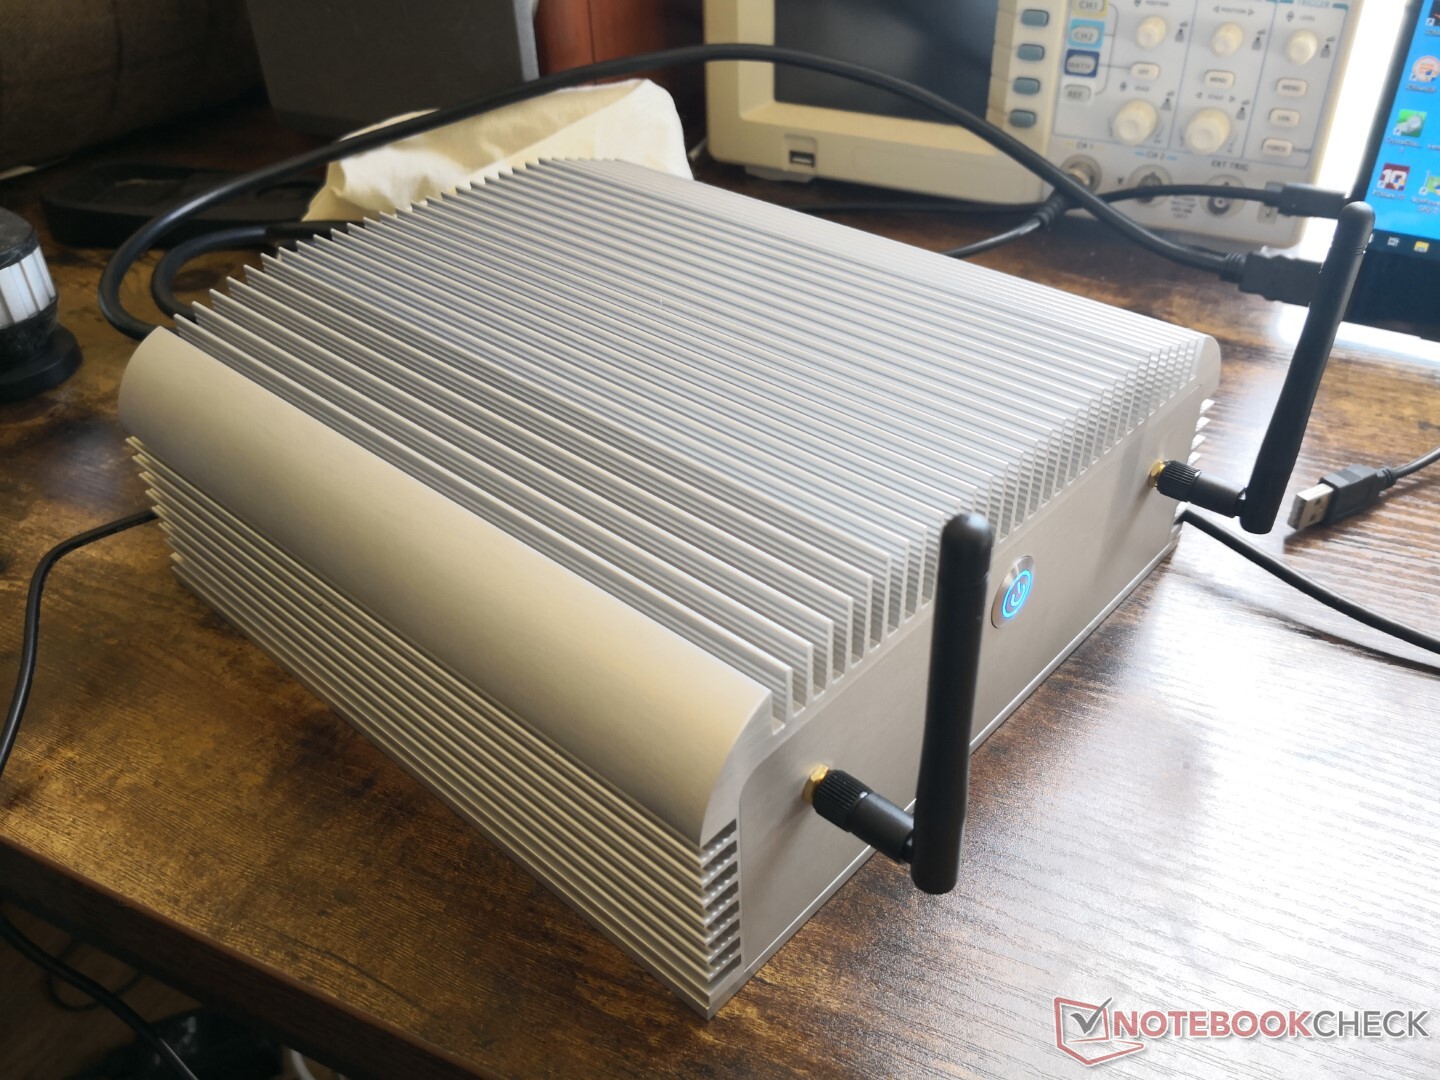
O estojo inteiro é de alumínio anodizado de cima para baixo e certificado IP50 para proteção contra poeira, mas não para proteção contra água. Ele é significativamente maior e mais pesado que oIMP-3654-B1-R fizemos o check-out no início do ano passado, o que esperamos que leve a um melhor resfriamento e a uma maior absorção térmica.
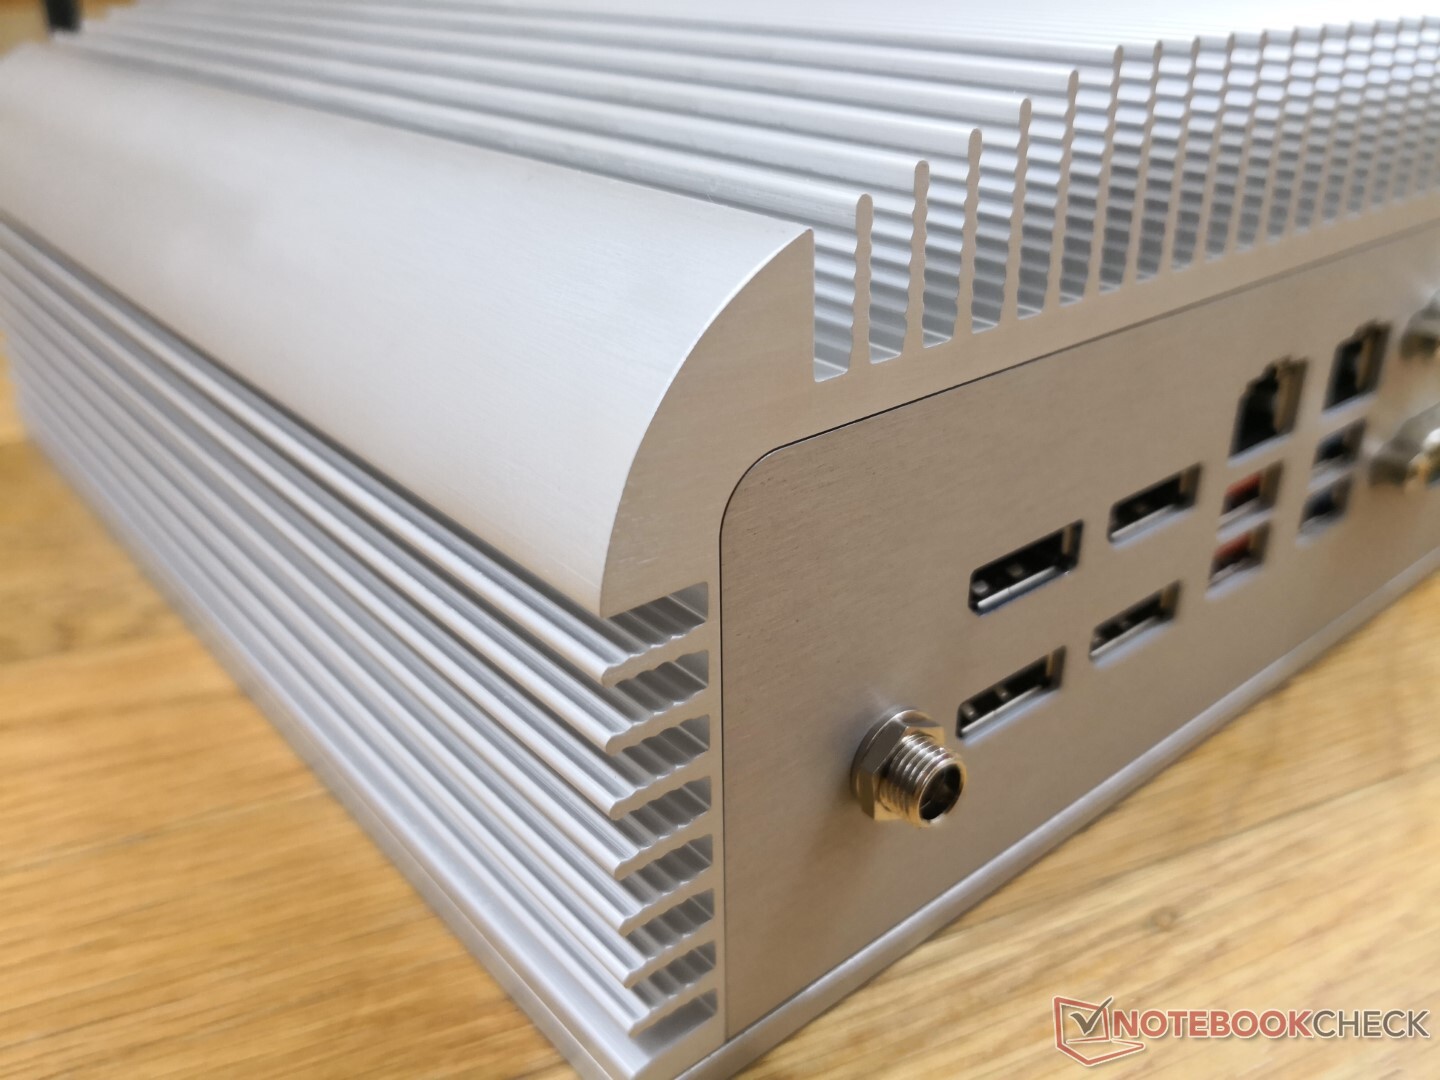
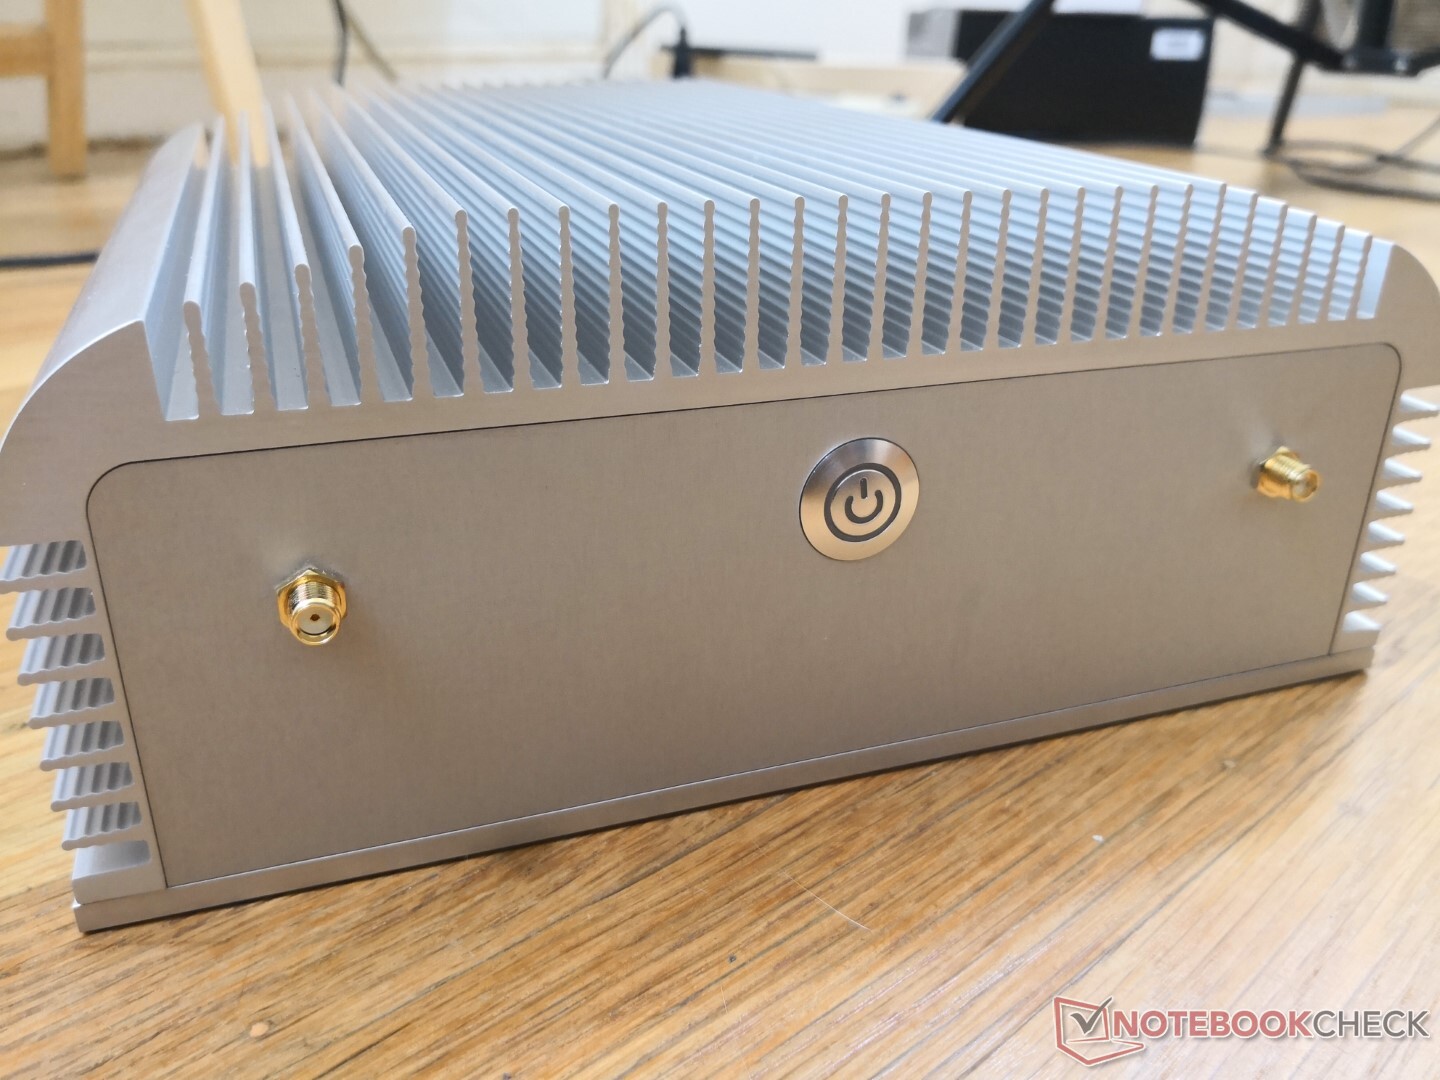
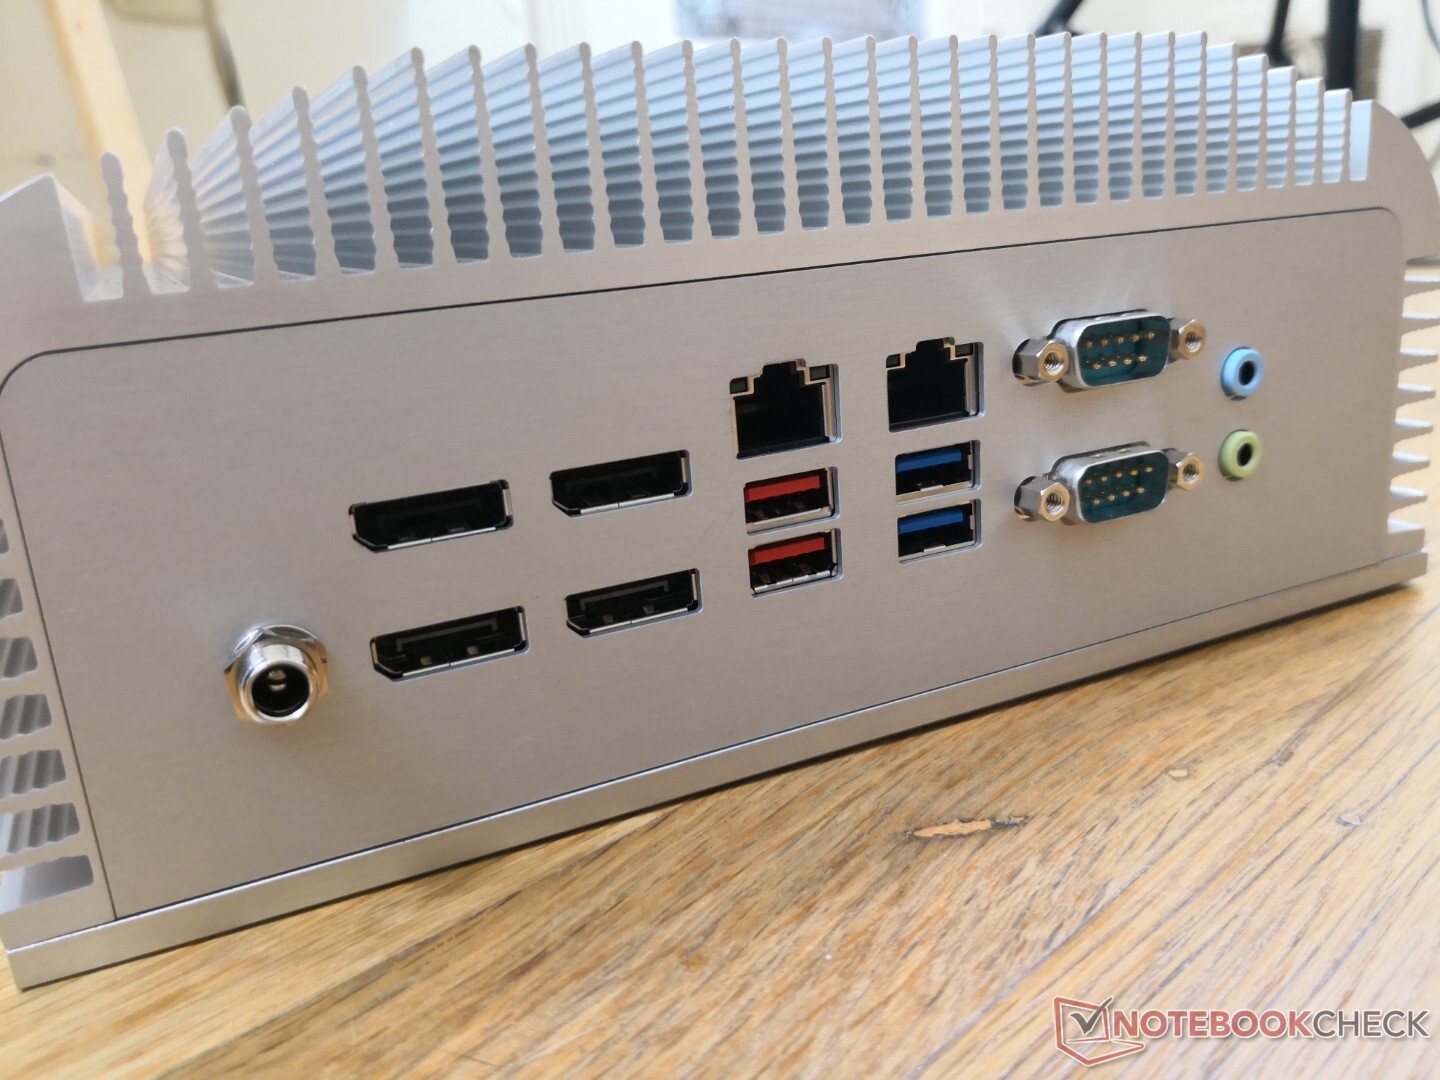
Conectividade
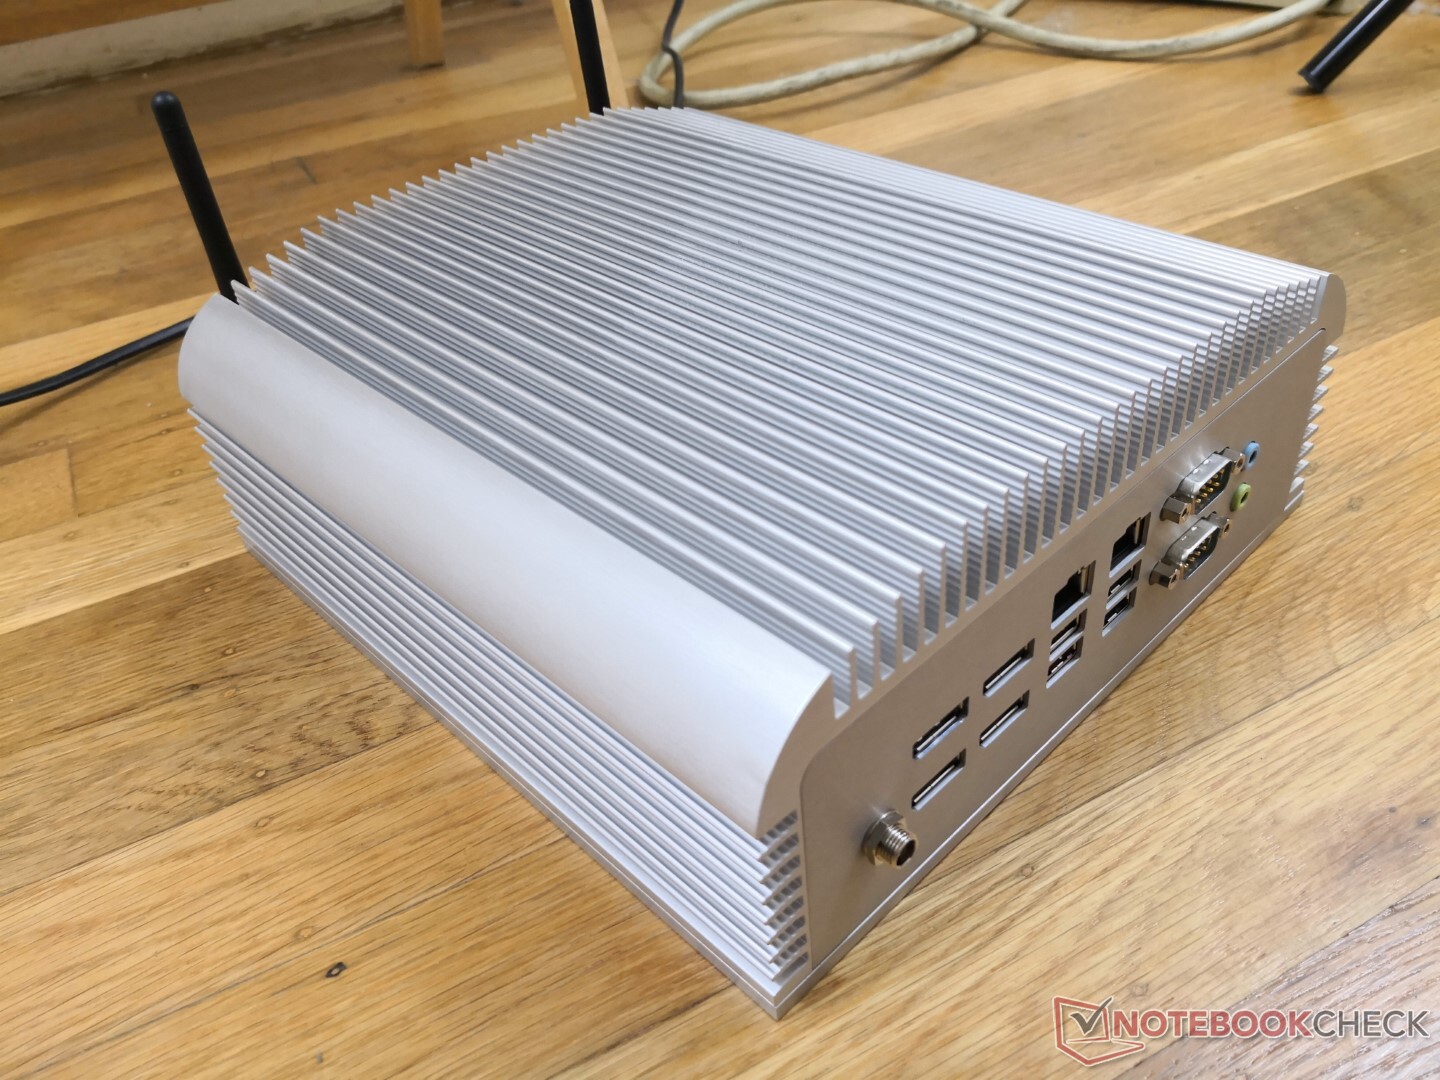
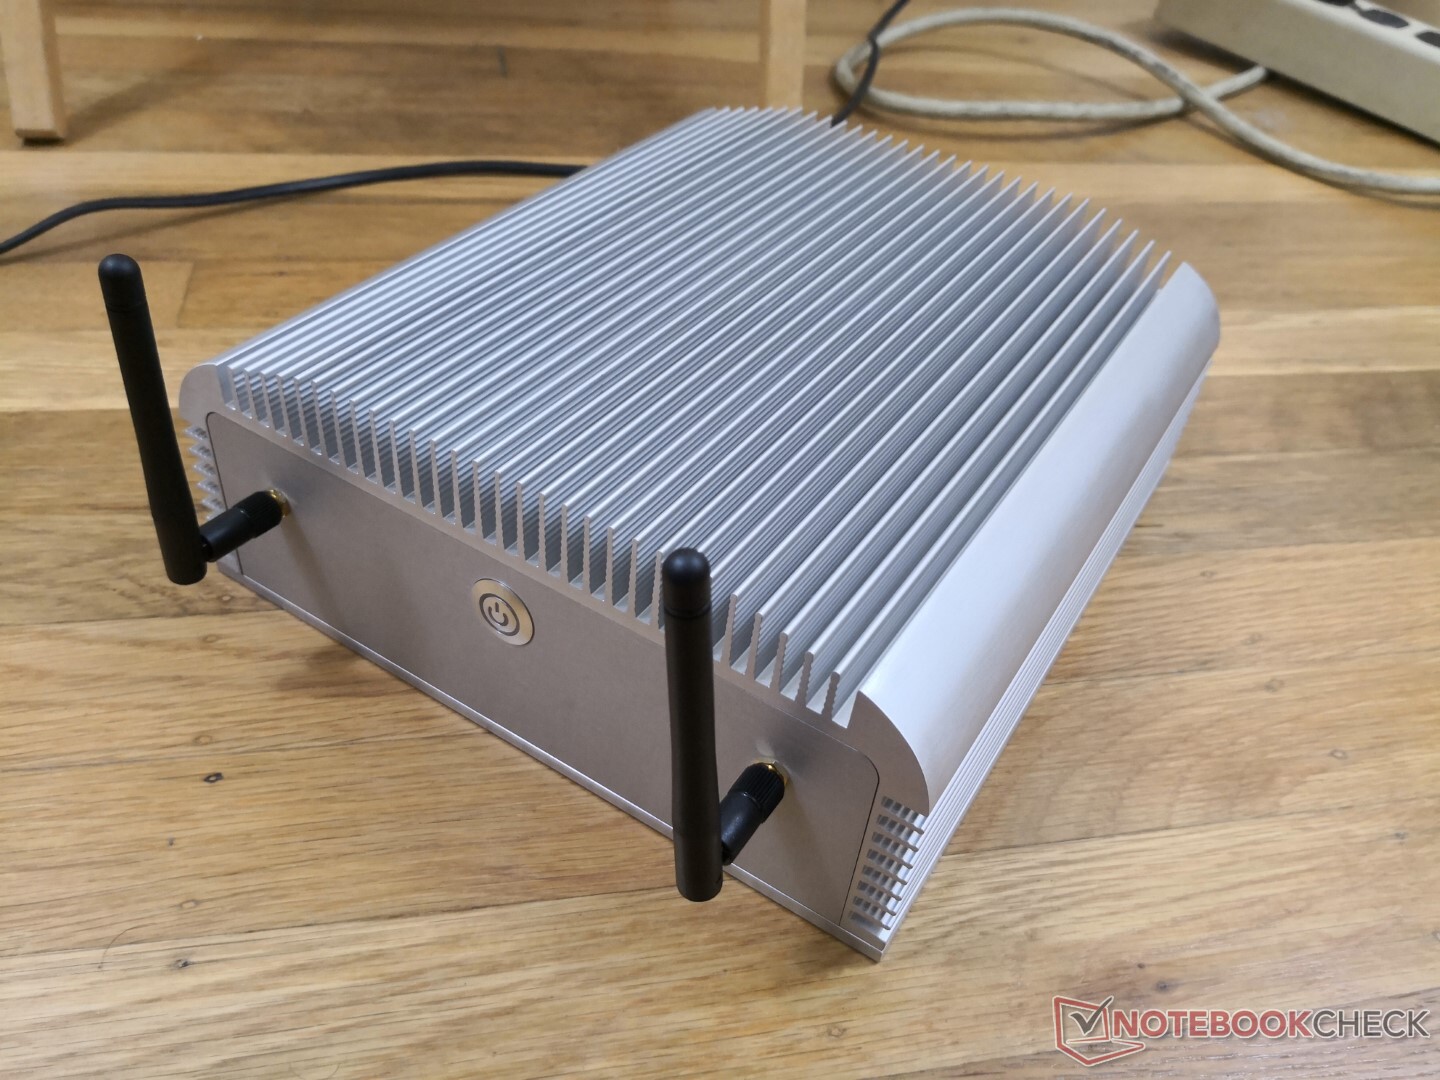
As duas antenas se fixam à frente do dispositivo em vez de atrás. Curiosamente, não há portas HDMI ou USB-C.
Comunicação
Módulos embutidos de comunicação com e sem fio, soluções alternativas disponíveis (UMTS)?, Irregularidades (recepção de rádio)?
| Networking | |
| iperf3 transmit AX12 | |
| Intel NUC11PHKi7C | |
| Impact Display Solutions IMP-3713-V2-16-500 | |
| Intel NUC11PAQi7 | |
| Zotac ZBox MI643 | |
| Impact Display Solutions IMP-3654-B1-R Core i9-9900T | |
| iperf3 receive AX12 | |
| Impact Display Solutions IMP-3713-V2-16-500 | |
| Intel NUC11PHKi7C | |
| Intel NUC11PAQi7 | |
| Impact Display Solutions IMP-3654-B1-R Core i9-9900T | |
| Zotac ZBox MI643 | |
Manutenção
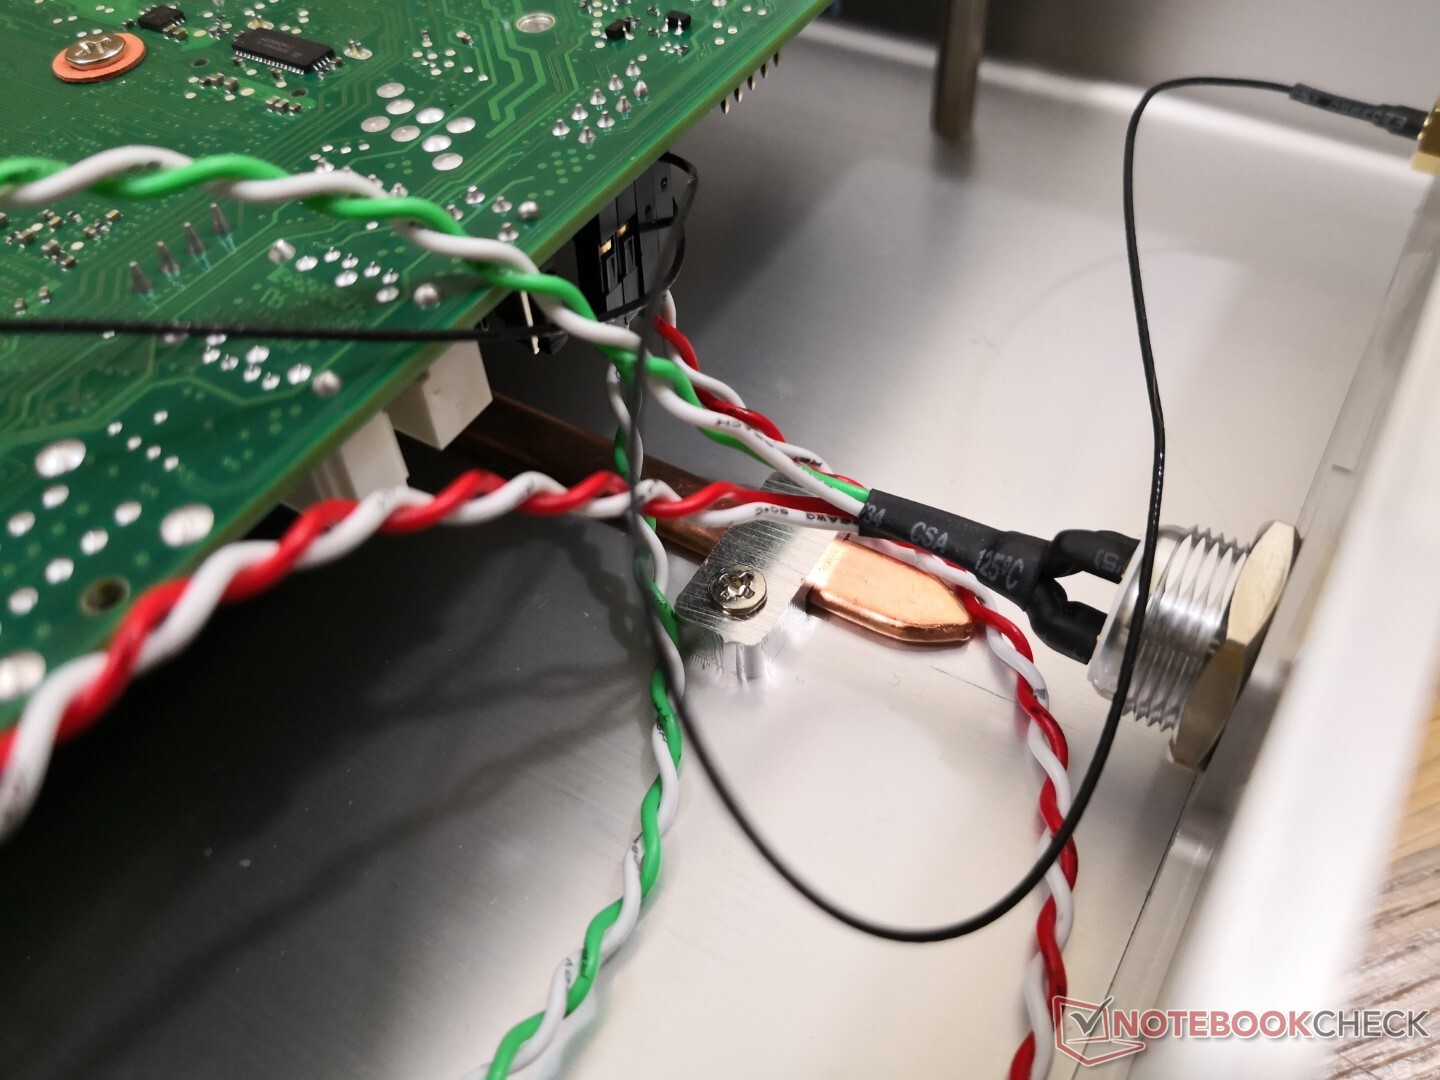
O painel inferior é facilmente removível com apenas uma chave de fenda Philips para revelar a parte inferior da placa-mãe. O acesso ao restante da placa-mãe, entretanto, requer desmontagem adicional.
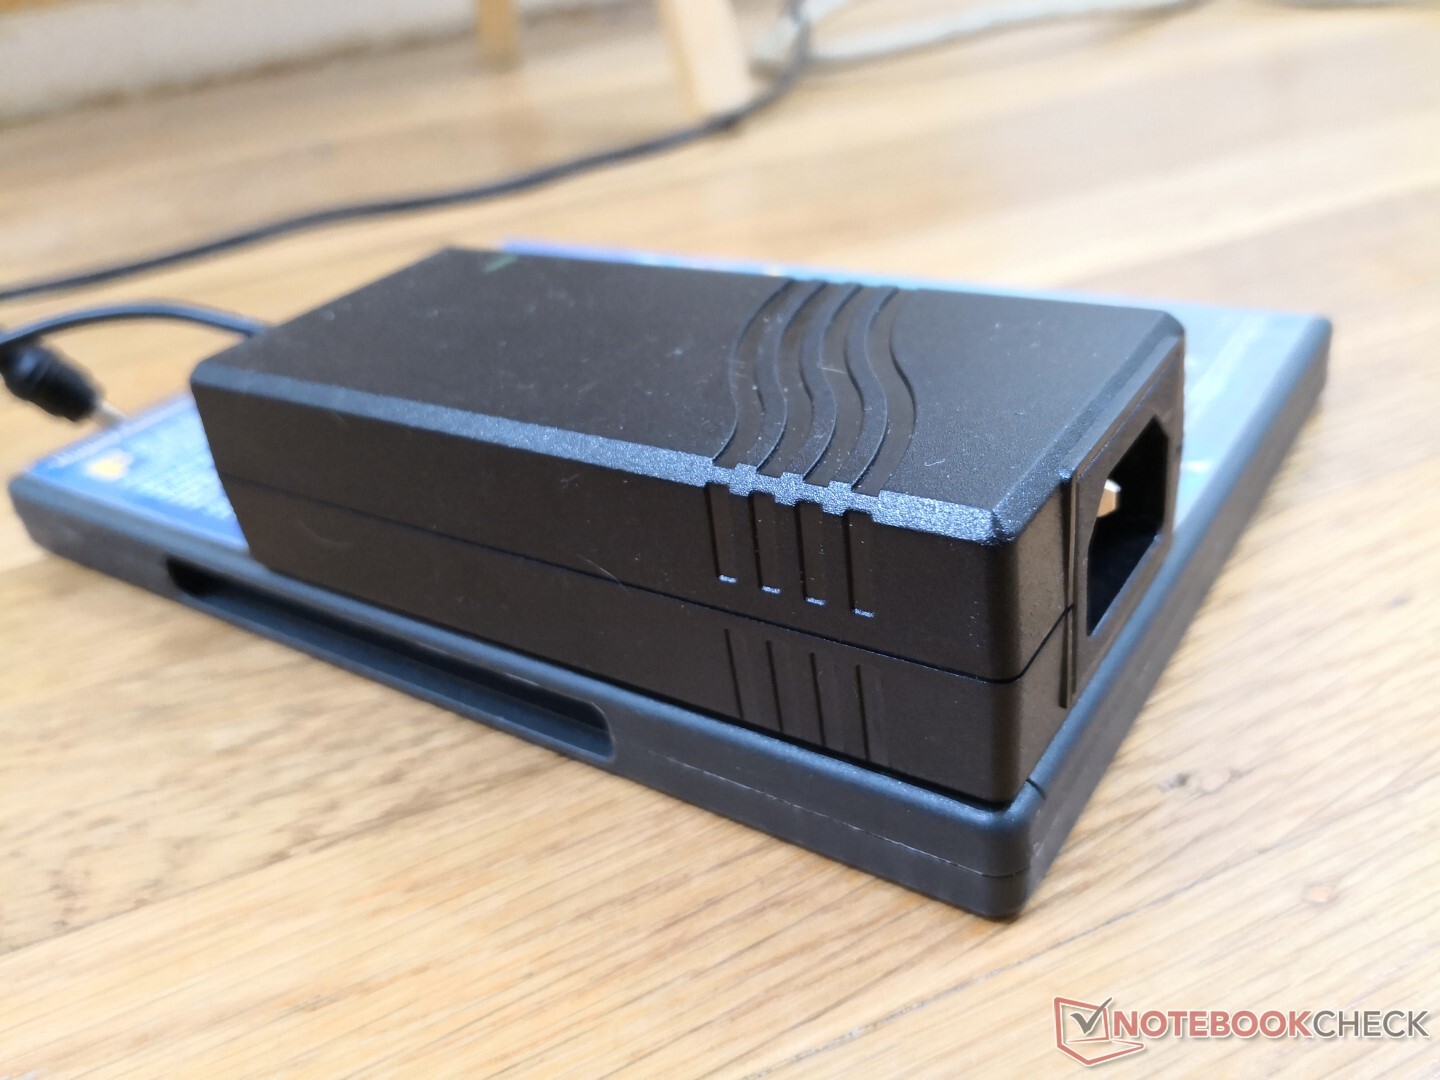
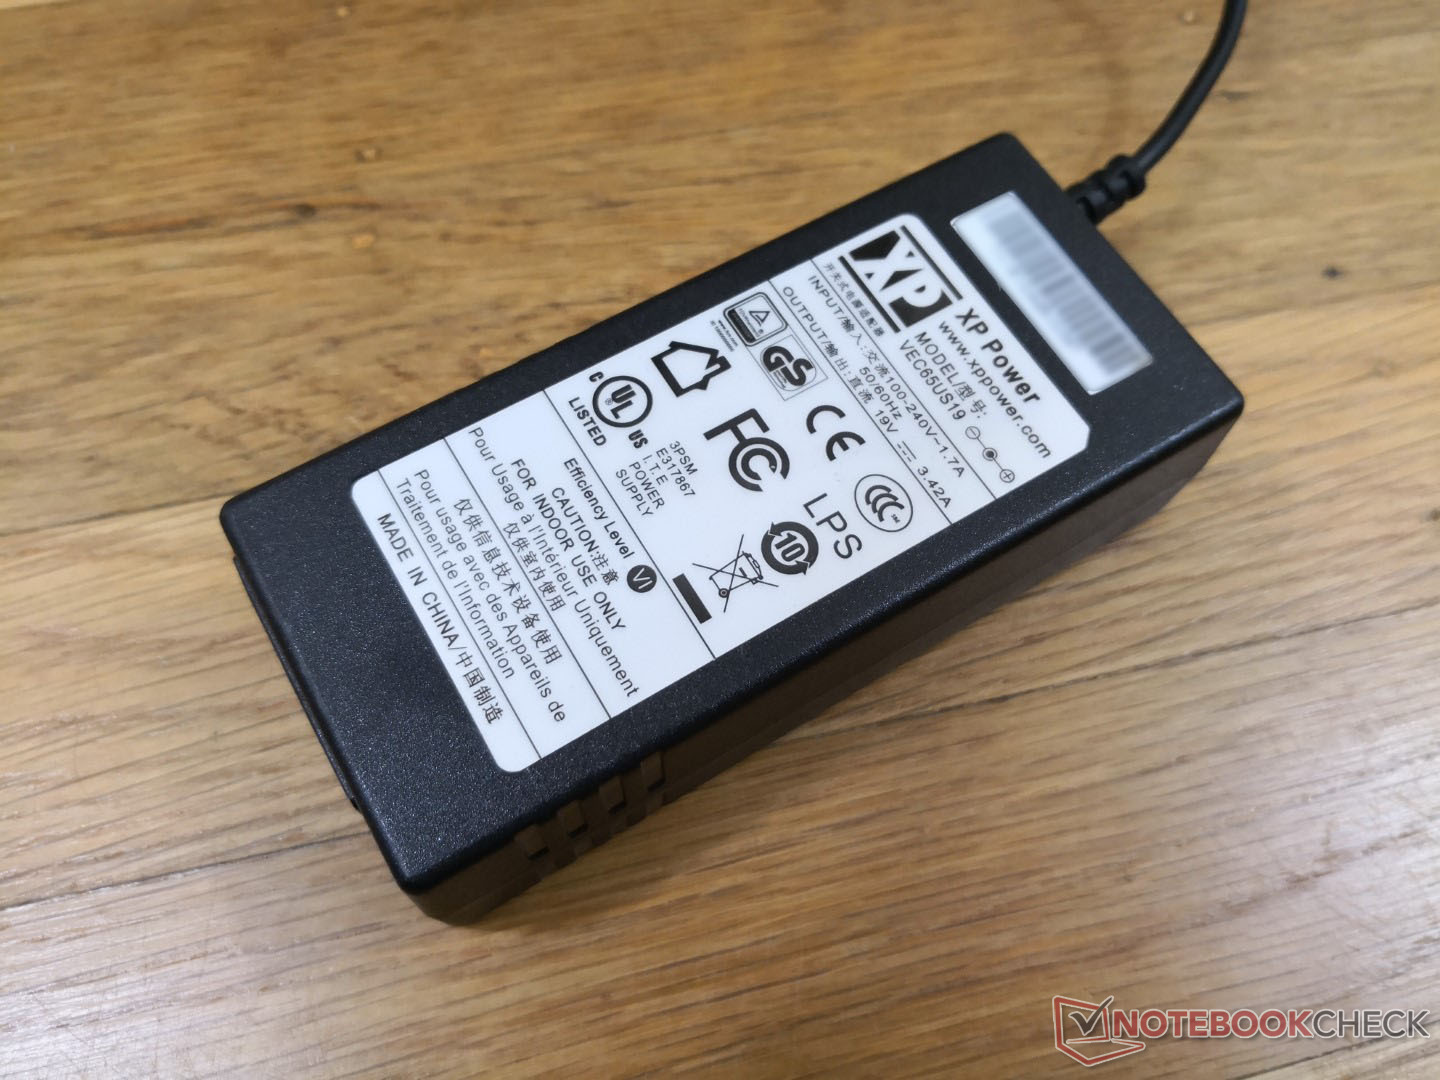
Acessórios e Garantia
A caixa inclui duas antenas, além de um adaptador AC. Aplica-se a garantia padrão limitada de um ano do fabricante.
Desempenho
Processador
O desempenho bruto da CPU é cerca de 14% e 22% mais lento que o da Ryzen 3 4300U em cargas de trabalho de múltiplas e mono-fios, respectivamente, para representar um processador de nível básico.
Cinebench R23: Multi Core | Single Core
Cinebench R15: CPU Multi 64Bit | CPU Single 64Bit
Blender: v2.79 BMW27 CPU
7-Zip 18.03: 7z b 4 -mmt1 | 7z b 4
Geekbench 5.5: Single-Core | Multi-Core
HWBOT x265 Benchmark v2.2: 4k Preset
LibreOffice : 20 Documents To PDF
R Benchmark 2.5: Overall mean
| Cinebench R20 / CPU (Multi Core) | |
| Intel NUC11PAQi7 | |
| Impact Display Solutions IMP-3654-B1-R Core i9-9900T | |
| HP ProBook 455 G7-175W8EA | |
| HP ProBook 445 G7 175W4EA | |
| Intel NUC11TNKi5 | |
| Intel NUC11PHKi7C | |
| Honor MagicBook Pro 10210U | |
| Asus Zenbook S UX393JA | |
| Acer Swift 3 SF314-42-R27B | |
| HP Envy 13-ba0001ng | |
| Impact Display Solutions IMP-3713-V2-16-500 | |
| Zotac ZBox MI643 | |
| Dell Inspiron 15 5000 5502 | |
| Beelink SEi10 | |
| Asus Vivobook 15 F512DA-SH31 | |
| Cinebench R20 / CPU (Single Core) | |
| Intel NUC11PHKi7C | |
| Intel NUC11PAQi7 | |
| Dell Inspiron 15 5000 5502 | |
| Intel NUC11TNKi5 | |
| HP ProBook 455 G7-175W8EA | |
| HP ProBook 445 G7 175W4EA | |
| Asus Zenbook S UX393JA | |
| Impact Display Solutions IMP-3654-B1-R Core i9-9900T | |
| HP Envy 13-ba0001ng | |
| Acer Swift 3 SF314-42-R27B | |
| Honor MagicBook Pro 10210U | |
| Zotac ZBox MI643 | |
| Beelink SEi10 | |
| Impact Display Solutions IMP-3713-V2-16-500 | |
| Asus Vivobook 15 F512DA-SH31 | |
| Cinebench R23 / Multi Core | |
| Intel NUC11PAQi7 | |
| Intel NUC11PHKi7C | |
| Intel NUC11TNKi5 | |
| Honor MagicBook Pro 10210U | |
| Impact Display Solutions IMP-3713-V2-16-500 | |
| Cinebench R23 / Single Core | |
| Intel NUC11PHKi7C | |
| Intel NUC11TNKi5 | |
| Honor MagicBook Pro 10210U | |
| Impact Display Solutions IMP-3713-V2-16-500 | |
| Cinebench R15 / CPU Multi 64Bit | |
| Impact Display Solutions IMP-3654-B1-R Core i9-9900T | |
| HP ProBook 455 G7-175W8EA | |
| Intel NUC11PHKi7C | |
| Intel NUC11PAQi7 | |
| HP ProBook 445 G7 175W4EA | |
| Intel NUC11TNKi5 | |
| Honor MagicBook Pro 10210U | |
| Impact Display Solutions IMP-3713-V2-16-500 | |
| Asus Zenbook S UX393JA | |
| Acer Swift 3 SF314-42-R27B | |
| HP Envy 13-ba0001ng | |
| Zotac ZBox MI643 | |
| Beelink SEi10 | |
| Dell Inspiron 15 5000 5502 | |
| Asus Vivobook 15 F512DA-SH31 | |
| Cinebench R15 / CPU Single 64Bit | |
| Intel NUC11PAQi7 | |
| Intel NUC11PHKi7C | |
| Intel NUC11TNKi5 | |
| Dell Inspiron 15 5000 5502 | |
| Impact Display Solutions IMP-3654-B1-R Core i9-9900T | |
| HP ProBook 455 G7-175W8EA | |
| Asus Zenbook S UX393JA | |
| HP Envy 13-ba0001ng | |
| HP ProBook 445 G7 175W4EA | |
| Zotac ZBox MI643 | |
| Acer Swift 3 SF314-42-R27B | |
| Honor MagicBook Pro 10210U | |
| Beelink SEi10 | |
| Impact Display Solutions IMP-3713-V2-16-500 | |
| Asus Vivobook 15 F512DA-SH31 | |
| Blender / v2.79 BMW27 CPU | |
| Asus Vivobook 15 F512DA-SH31 | |
| Dell Inspiron 15 5000 5502 | |
| Beelink SEi10 | |
| Acer Swift 3 SF314-42-R27B | |
| Zotac ZBox MI643 | |
| HP Envy 13-ba0001ng | |
| Impact Display Solutions IMP-3713-V2-16-500 | |
| Asus Zenbook S UX393JA | |
| Honor MagicBook Pro 10210U | |
| HP ProBook 445 G7 175W4EA | |
| Intel NUC11TNKi5 | |
| Intel NUC11PHKi7C | |
| HP ProBook 455 G7-175W8EA | |
| Intel NUC11PAQi7 | |
| Impact Display Solutions IMP-3654-B1-R Core i9-9900T | |
| 7-Zip 18.03 / 7z b 4 -mmt1 | |
| Intel NUC11PAQi7 | |
| Intel NUC11PHKi7C | |
| Impact Display Solutions IMP-3654-B1-R Core i9-9900T | |
| Intel NUC11TNKi5 | |
| HP Envy 13-ba0001ng | |
| Dell Inspiron 15 5000 5502 | |
| Zotac ZBox MI643 | |
| Asus Zenbook S UX393JA | |
| Honor MagicBook Pro 10210U | |
| HP ProBook 445 G7 175W4EA | |
| HP ProBook 455 G7-175W8EA | |
| Beelink SEi10 | |
| Acer Swift 3 SF314-42-R27B | |
| Asus Vivobook 15 F512DA-SH31 | |
| Impact Display Solutions IMP-3713-V2-16-500 | |
| 7-Zip 18.03 / 7z b 4 | |
| Impact Display Solutions IMP-3654-B1-R Core i9-9900T | |
| HP ProBook 455 G7-175W8EA | |
| Intel NUC11PAQi7 | |
| Intel NUC11PHKi7C | |
| HP ProBook 445 G7 175W4EA | |
| Intel NUC11TNKi5 | |
| Honor MagicBook Pro 10210U | |
| Asus Zenbook S UX393JA | |
| Zotac ZBox MI643 | |
| Impact Display Solutions IMP-3713-V2-16-500 | |
| HP Envy 13-ba0001ng | |
| Acer Swift 3 SF314-42-R27B | |
| Dell Inspiron 15 5000 5502 | |
| Beelink SEi10 | |
| Asus Vivobook 15 F512DA-SH31 | |
| Geekbench 5.5 / Single-Core | |
| Intel NUC11PAQi7 | |
| Intel NUC11PHKi7C | |
| Intel NUC11TNKi5 | |
| Asus Zenbook S UX393JA | |
| Dell Inspiron 15 5000 5502 | |
| HP Envy 13-ba0001ng | |
| Impact Display Solutions IMP-3654-B1-R Core i9-9900T | |
| Zotac ZBox MI643 | |
| Beelink SEi10 | |
| HP ProBook 455 G7-175W8EA | |
| HP ProBook 445 G7 175W4EA | |
| Honor MagicBook Pro 10210U | |
| Acer Swift 3 SF314-42-R27B | |
| Impact Display Solutions IMP-3713-V2-16-500 | |
| Asus Vivobook 15 F512DA-SH31 | |
| Geekbench 5.5 / Multi-Core | |
| Impact Display Solutions IMP-3654-B1-R Core i9-9900T | |
| Intel NUC11PHKi7C | |
| Intel NUC11PAQi7 | |
| HP ProBook 455 G7-175W8EA | |
| Asus Zenbook S UX393JA | |
| Intel NUC11TNKi5 | |
| HP ProBook 445 G7 175W4EA | |
| Honor MagicBook Pro 10210U | |
| HP Envy 13-ba0001ng | |
| Zotac ZBox MI643 | |
| Acer Swift 3 SF314-42-R27B | |
| Impact Display Solutions IMP-3713-V2-16-500 | |
| Dell Inspiron 15 5000 5502 | |
| Beelink SEi10 | |
| Asus Vivobook 15 F512DA-SH31 | |
| HWBOT x265 Benchmark v2.2 / 4k Preset | |
| Intel NUC11PAQi7 | |
| Intel NUC11PHKi7C | |
| HP ProBook 455 G7-175W8EA | |
| Intel NUC11TNKi5 | |
| Honor MagicBook Pro 10210U | |
| Impact Display Solutions IMP-3654-B1-R Core i9-9900T | |
| Asus Zenbook S UX393JA | |
| Acer Swift 3 SF314-42-R27B | |
| HP Envy 13-ba0001ng | |
| Zotac ZBox MI643 | |
| Impact Display Solutions IMP-3713-V2-16-500 | |
| Beelink SEi10 | |
| Dell Inspiron 15 5000 5502 | |
| Asus Vivobook 15 F512DA-SH31 | |
| LibreOffice / 20 Documents To PDF | |
| HP ProBook 455 G7-175W8EA | |
| Asus Vivobook 15 F512DA-SH31 | |
| Impact Display Solutions IMP-3713-V2-16-500 | |
| HP ProBook 445 G7 175W4EA | |
| Dell Inspiron 15 5000 5502 | |
| Acer Swift 3 SF314-42-R27B | |
| Impact Display Solutions IMP-3654-B1-R Core i9-9900T | |
| Zotac ZBox MI643 | |
| Honor MagicBook Pro 10210U | |
| HP Envy 13-ba0001ng | |
| Beelink SEi10 | |
| Intel NUC11TNKi5 | |
| Asus Zenbook S UX393JA | |
| Intel NUC11PHKi7C | |
| Intel NUC11PAQi7 | |
| R Benchmark 2.5 / Overall mean | |
| Impact Display Solutions IMP-3654-B1-R Core i9-9900T | |
| Asus Vivobook 15 F512DA-SH31 | |
| Impact Display Solutions IMP-3713-V2-16-500 | |
| Beelink SEi10 | |
| Honor MagicBook Pro 10210U | |
| Acer Swift 3 SF314-42-R27B | |
| Asus Zenbook S UX393JA | |
| HP Envy 13-ba0001ng | |
| Zotac ZBox MI643 | |
| Dell Inspiron 15 5000 5502 | |
| HP ProBook 455 G7-175W8EA | |
| Intel NUC11TNKi5 | |
| Intel NUC11PHKi7C | |
| Intel NUC11PAQi7 | |
Cinebench R23: Multi Core | Single Core
Cinebench R15: CPU Multi 64Bit | CPU Single 64Bit
Blender: v2.79 BMW27 CPU
7-Zip 18.03: 7z b 4 -mmt1 | 7z b 4
Geekbench 5.5: Single-Core | Multi-Core
HWBOT x265 Benchmark v2.2: 4k Preset
LibreOffice : 20 Documents To PDF
R Benchmark 2.5: Overall mean
* ... menor é melhor
Desempenho do sistema
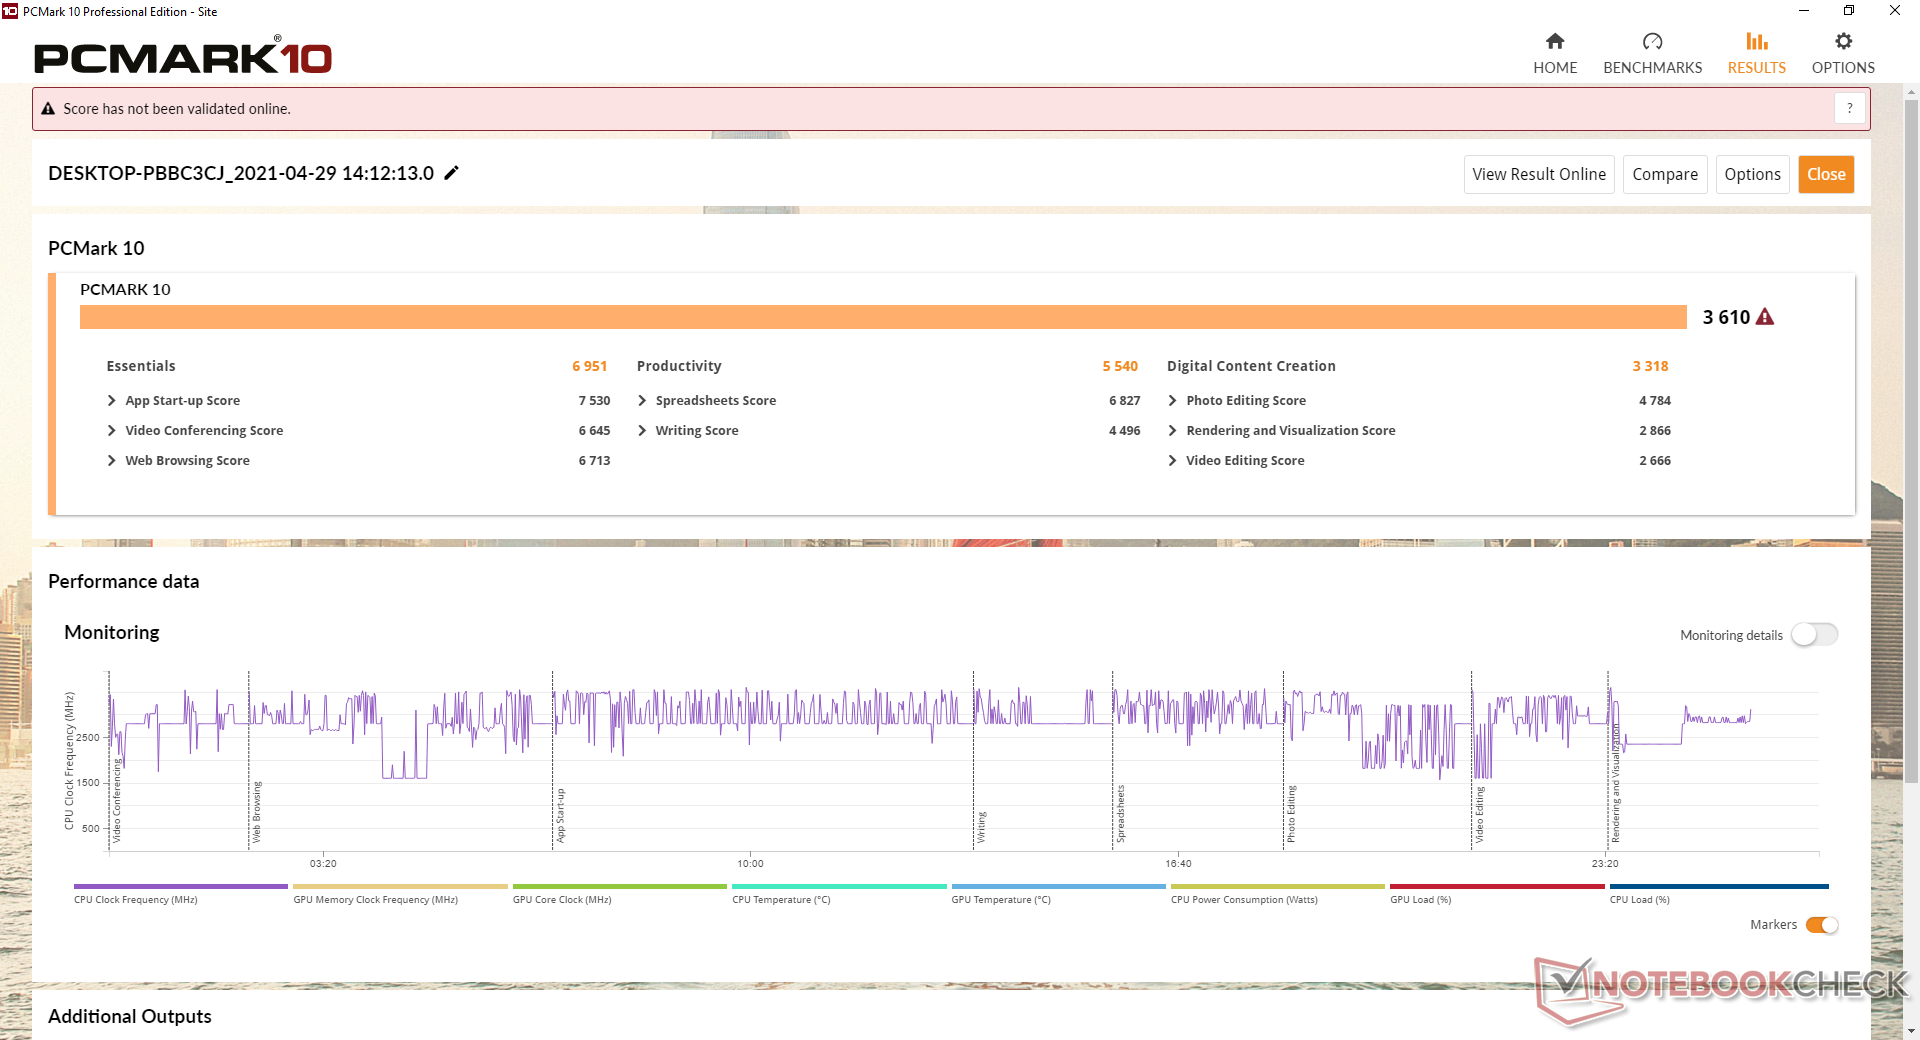
| PCMark 10 | |
| Score | |
| Intel NUC11PHKi7C | |
| Intel NUC11PAQi7 | |
| Zotac ZBox MI643 | |
| Impact Display Solutions IMP-3654-B1-R Core i9-9900T | |
| Impact Display Solutions IMP-3713-V2-16-500 | |
| Essentials | |
| Intel NUC11PAQi7 | |
| Zotac ZBox MI643 | |
| Intel NUC11PHKi7C | |
| Impact Display Solutions IMP-3654-B1-R Core i9-9900T | |
| Impact Display Solutions IMP-3713-V2-16-500 | |
| Productivity | |
| Intel NUC11PHKi7C | |
| Intel NUC11PAQi7 | |
| Impact Display Solutions IMP-3654-B1-R Core i9-9900T | |
| Zotac ZBox MI643 | |
| Impact Display Solutions IMP-3713-V2-16-500 | |
| Digital Content Creation | |
| Intel NUC11PHKi7C | |
| Intel NUC11PAQi7 | |
| Impact Display Solutions IMP-3654-B1-R Core i9-9900T | |
| Impact Display Solutions IMP-3713-V2-16-500 | |
| Zotac ZBox MI643 | |
| PCMark 10 Score | 3610 pontos | |
Ajuda | ||
Latência do DPC
LatencyMon mostra problemas de latência DPC ao abrir várias abas em nossa página inicial ou quando a CPU está totalmente estressada sob Prime95. A reprodução de 4K UHD a 60 FPS é, de outra forma, suave, com apenas quatro quadros descartados durante nosso teste de vídeo de minutos.
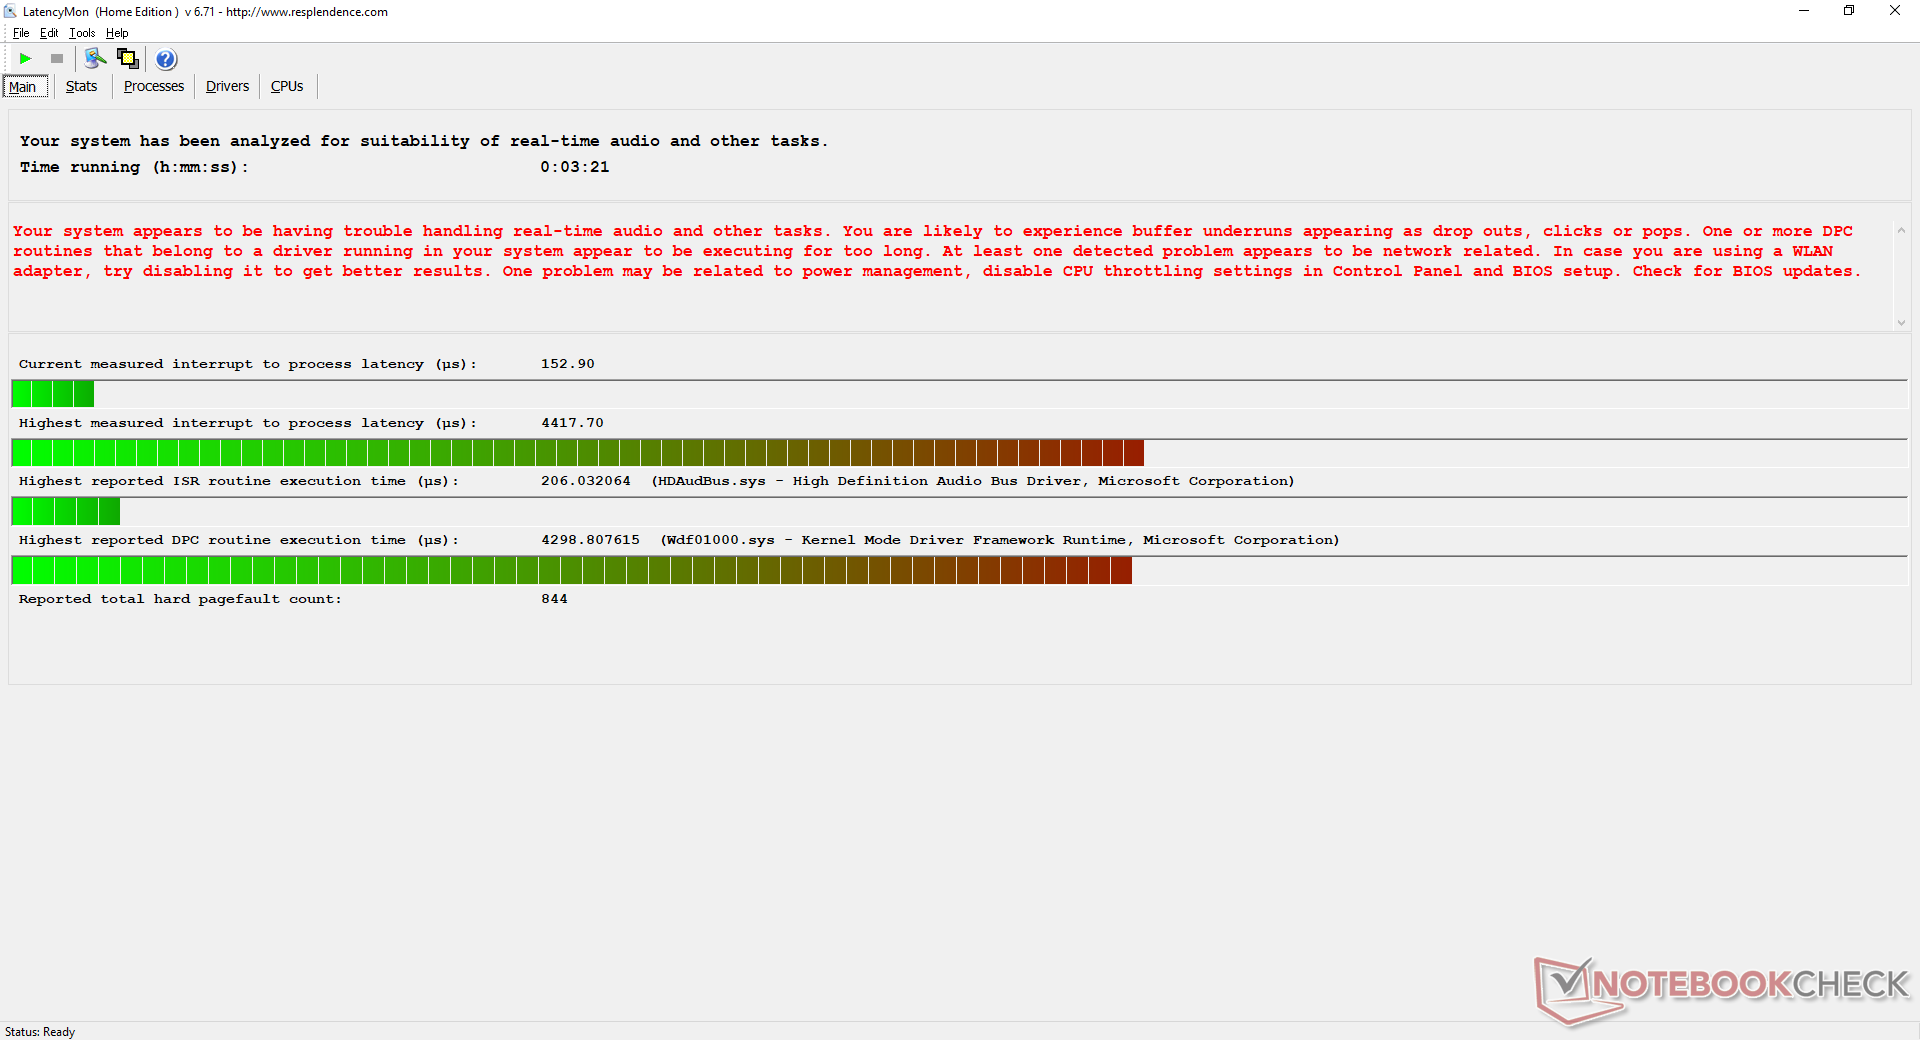
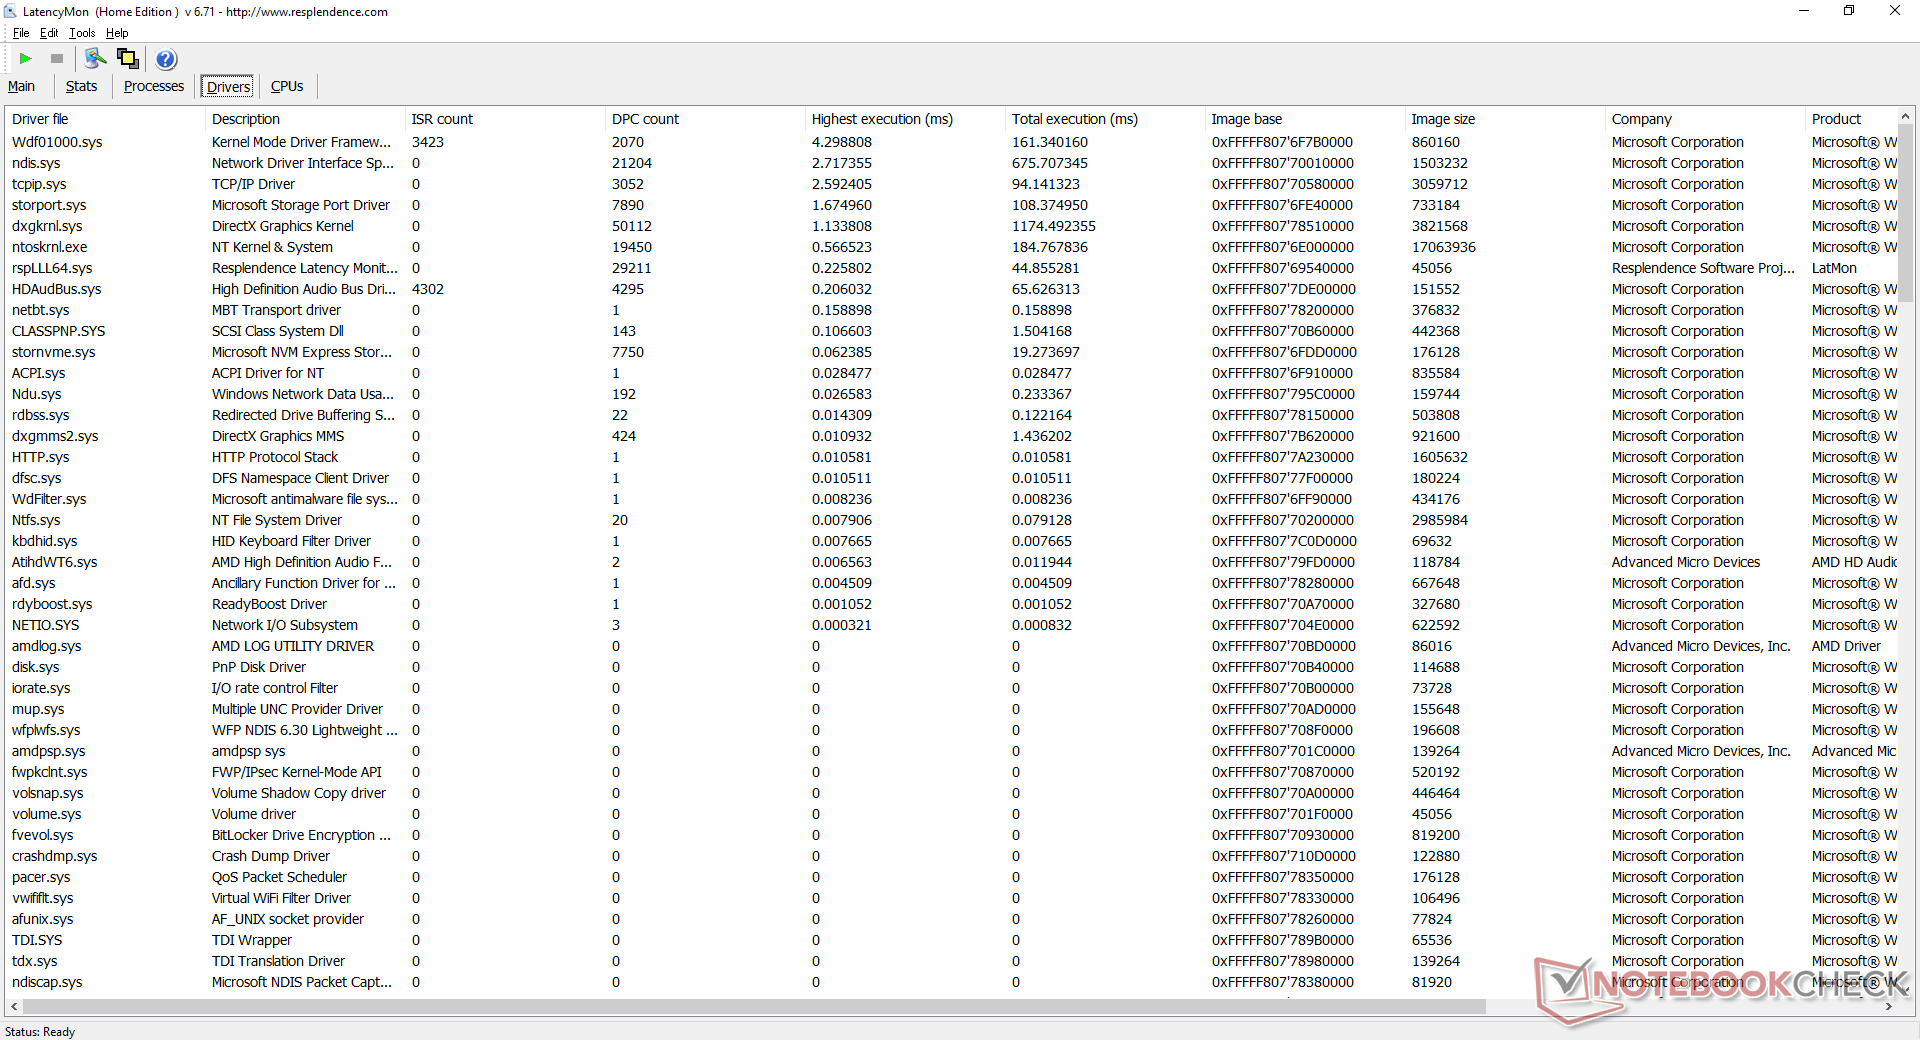
| DPC Latencies / LatencyMon - interrupt to process latency (max), Web, Youtube, Prime95 | |
| Impact Display Solutions IMP-3713-V2-16-500 | |
| HP Envy 13-ba0001ng | |
| Intel NUC11PAQi7 | |
* ... menor é melhor
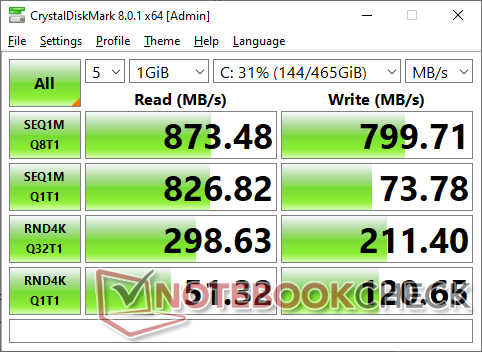
Dispositivos de armazenamento
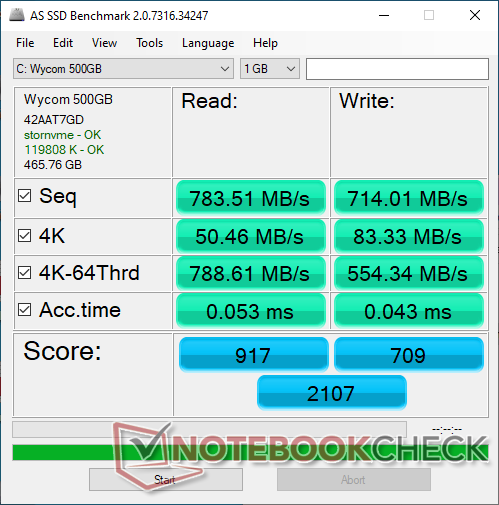
O SSD Wycom 500 GB c/ controlador Silicon Motion SM2262EN oferece taxas de transferência mais rápidas do que o SATA III, mas ainda está bem abaixo da maioria dos outros SSDs NVMe. As taxas de leitura e gravação seqüenciais são superiores na faixa de 800 a 900 MB/s, enquanto a maioria das unidades NVMe são pelo menos duas vezes mais rápidas.
Até dois SSDs M.2 são suportados na placa-mãe, mas apenas um dos dois slots é PCIe x4 completo, enquanto o outro é PCIe x2.
| Impact Display Solutions IMP-3713-V2-16-500 | Impact Display Solutions IMP-3654-B1-R Core i9-9900T EDGE NextGen SSD 1TB | HP Envy 13-ba0001ng Intel SSD 660p SSDPEKNW512G8 | LG Gram 17 17Z90N-V.AA77G Samsung PM981a MZVLB1T0HBLR | |
|---|---|---|---|---|
| AS SSD | -39% | 17% | 79% | |
| Seq Read (MB/s) | 784 | 1218 55% | 1587 102% | 2722 247% |
| Seq Write (MB/s) | 714 | 1306 83% | 709 -1% | 2649 271% |
| 4K Read (MB/s) | 50.5 | 25.97 -49% | 52 3% | 52.2 3% |
| 4K Write (MB/s) | 83.3 | 43.25 -48% | 144 73% | 132.4 59% |
| 4K-64 Read (MB/s) | 789 | 578 -27% | 322.8 -59% | 886 12% |
| 4K-64 Write (MB/s) | 554 | 520 -6% | 835 51% | 1074 94% |
| Access Time Read * (ms) | 0.053 | 0.118 -123% | 0.103 -94% | 0.041 23% |
| Access Time Write * (ms) | 0.043 | 0.286 -565% | 0.045 -5% | 0.03 30% |
| Score Read (Points) | 917 | 726 -21% | 533 -42% | 1211 32% |
| Score Write (Points) | 709 | 694 -2% | 1050 48% | 1471 107% |
| Score Total (Points) | 2107 | 1800 -15% | 1832 -13% | 3309 57% |
| Copy ISO MB/s (MB/s) | 1007 | 2082 107% | 1483 47% | 2096 108% |
| Copy Program MB/s (MB/s) | 386.3 | 422.8 9% | 730 89% | 395.6 2% |
| Copy Game MB/s (MB/s) | 705 | 1072 52% | 943 34% | 1096 55% |
| CrystalDiskMark 5.2 / 6 | 85% | 78% | 174% | |
| Write 4K (MB/s) | 36.03 | 111.8 210% | 146.3 306% | 162.8 352% |
| Read 4K (MB/s) | 58.5 | 56.8 -3% | 55.7 -5% | 51 -13% |
| Write Seq (MB/s) | 764 | 1148 50% | 949 24% | 2078 172% |
| Read Seq (MB/s) | 838 | 1522 82% | 1494 78% | 1991 138% |
| Write 4K Q32T1 (MB/s) | 210.7 | 399.7 90% | 408.5 94% | 440.1 109% |
| Read 4K Q32T1 (MB/s) | 298.9 | 570 91% | 304 2% | 450.1 51% |
| Write Seq Q32T1 (MB/s) | 798 | 1375 72% | 984 23% | 2998 276% |
| Read Seq Q32T1 (MB/s) | 879 | 1626 85% | 1779 102% | 3562 305% |
| Média Total (Programa/Configurações) | 23% /
6% | 48% /
39% | 127% /
113% |
* ... menor é melhor

Disk Throttling: DiskSpd Read Loop, Queue Depth 8
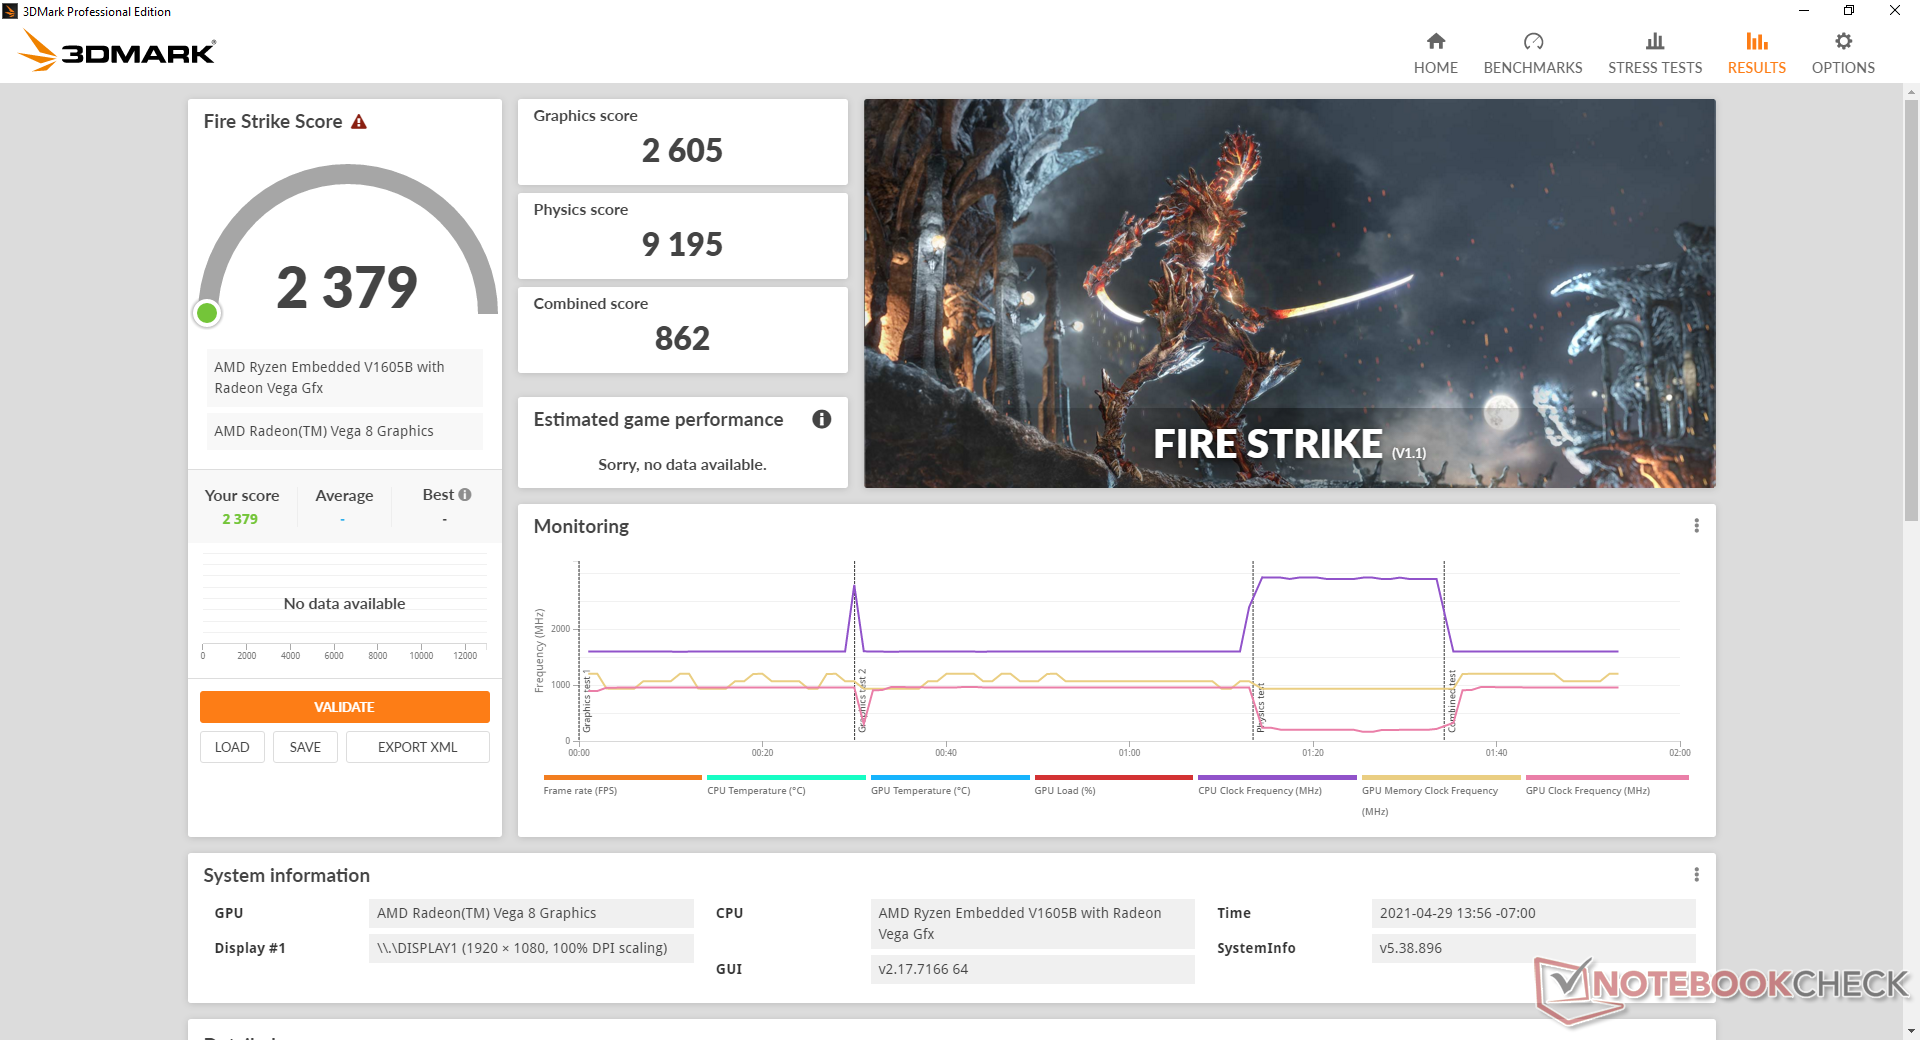
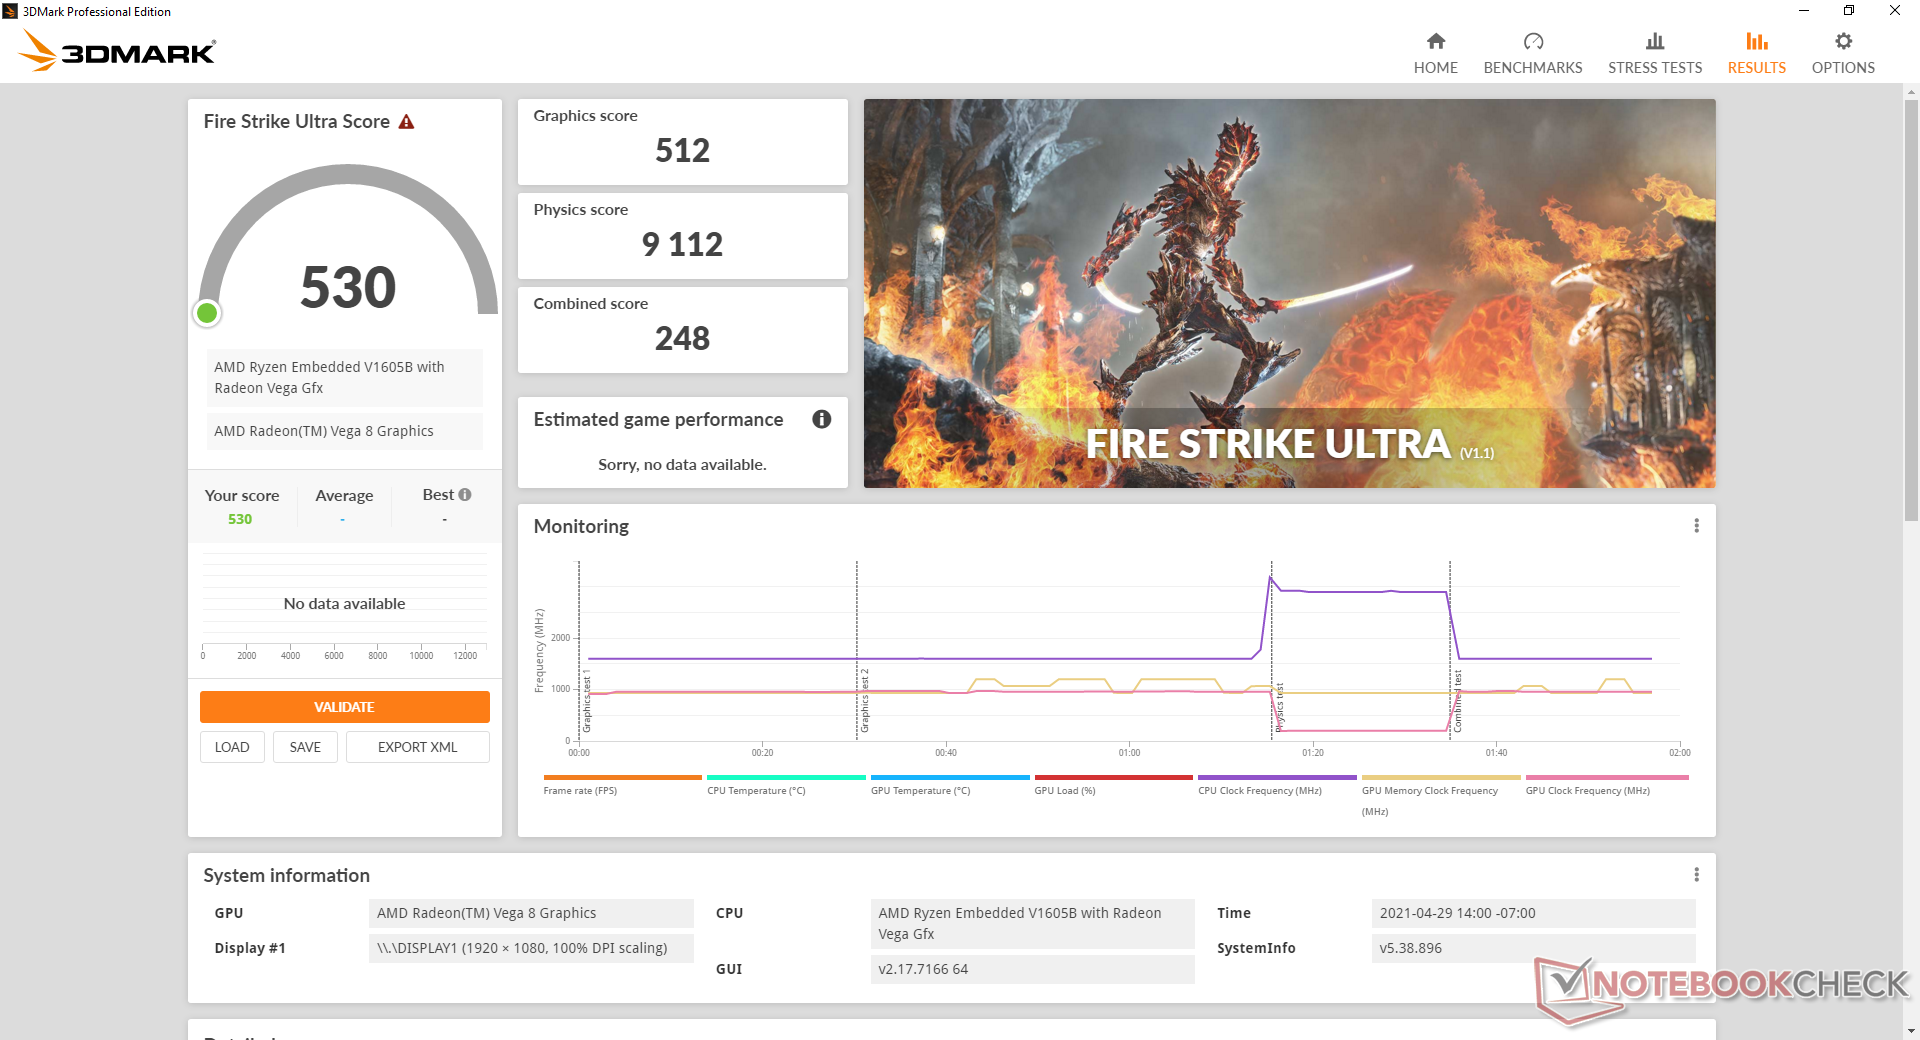
Desempenho da GPU
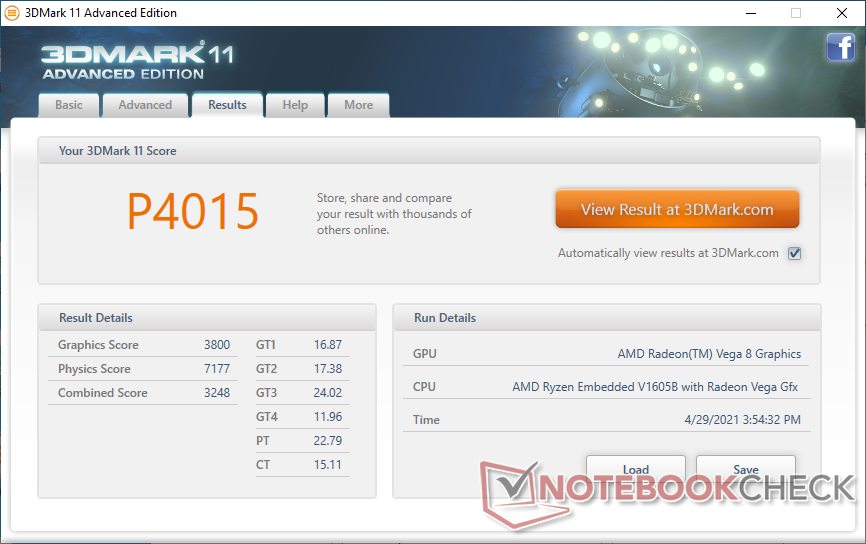
O Radeon RX Vega 8 integrado executa onde esperamos que seja quando comparado aos laptops com CPUs Ryzen série 2000U ou 3000U. Embora seja uma enorme atualização em relação aos antigos Intel UHD 620 gráficos, mais atuais Soluções i7 Iris Xe superará nosso PC sem ventilador em 30 a 50 por cento.
| 3DMark 11 | |
| 1280x720 Performance GPU | |
| Lenovo ThinkPad T15 Gen2-20W5S00100 | |
| Honor MagicBook Pro 10210U | |
| Intel NUC11PAQi7 | |
| Intel NUC11TNKi5 | |
| HP Envy 13-ba0001ng | |
| Asus Zenbook S UX393JA | |
| HP ProBook 455 G7-175W8EA | |
| HP 17-ca1149ng | |
| Impact Display Solutions IMP-3713-V2-16-500 | |
| HP ProBook 445 G7 175W4EA | |
| Acer Swift 3 SF314-42-R27B | |
| Dell Inspiron 15 5000 5502 | |
| Zotac ZBox MI643 | |
| Beelink SEi10 | |
| Asus Vivobook 15 F512DA-SH31 | |
| Apple MacBook 12 (Early 2016) 1.1 GHz | |
| Impact Display Solutions IMP-3654-B1-R Core i9-9900T | |
| 1280x720 Performance Combined | |
| Lenovo ThinkPad T15 Gen2-20W5S00100 | |
| Honor MagicBook Pro 10210U | |
| HP Envy 13-ba0001ng | |
| Intel NUC11PAQi7 | |
| Intel NUC11TNKi5 | |
| Asus Zenbook S UX393JA | |
| Acer Swift 3 SF314-42-R27B | |
| Impact Display Solutions IMP-3713-V2-16-500 | |
| HP 17-ca1149ng | |
| HP ProBook 445 G7 175W4EA | |
| HP ProBook 455 G7-175W8EA | |
| Dell Inspiron 15 5000 5502 | |
| Zotac ZBox MI643 | |
| Impact Display Solutions IMP-3654-B1-R Core i9-9900T | |
| Asus Vivobook 15 F512DA-SH31 | |
| Beelink SEi10 | |
| Apple MacBook 12 (Early 2016) 1.1 GHz | |
| 3DMark 11 Performance | 4015 pontos | |
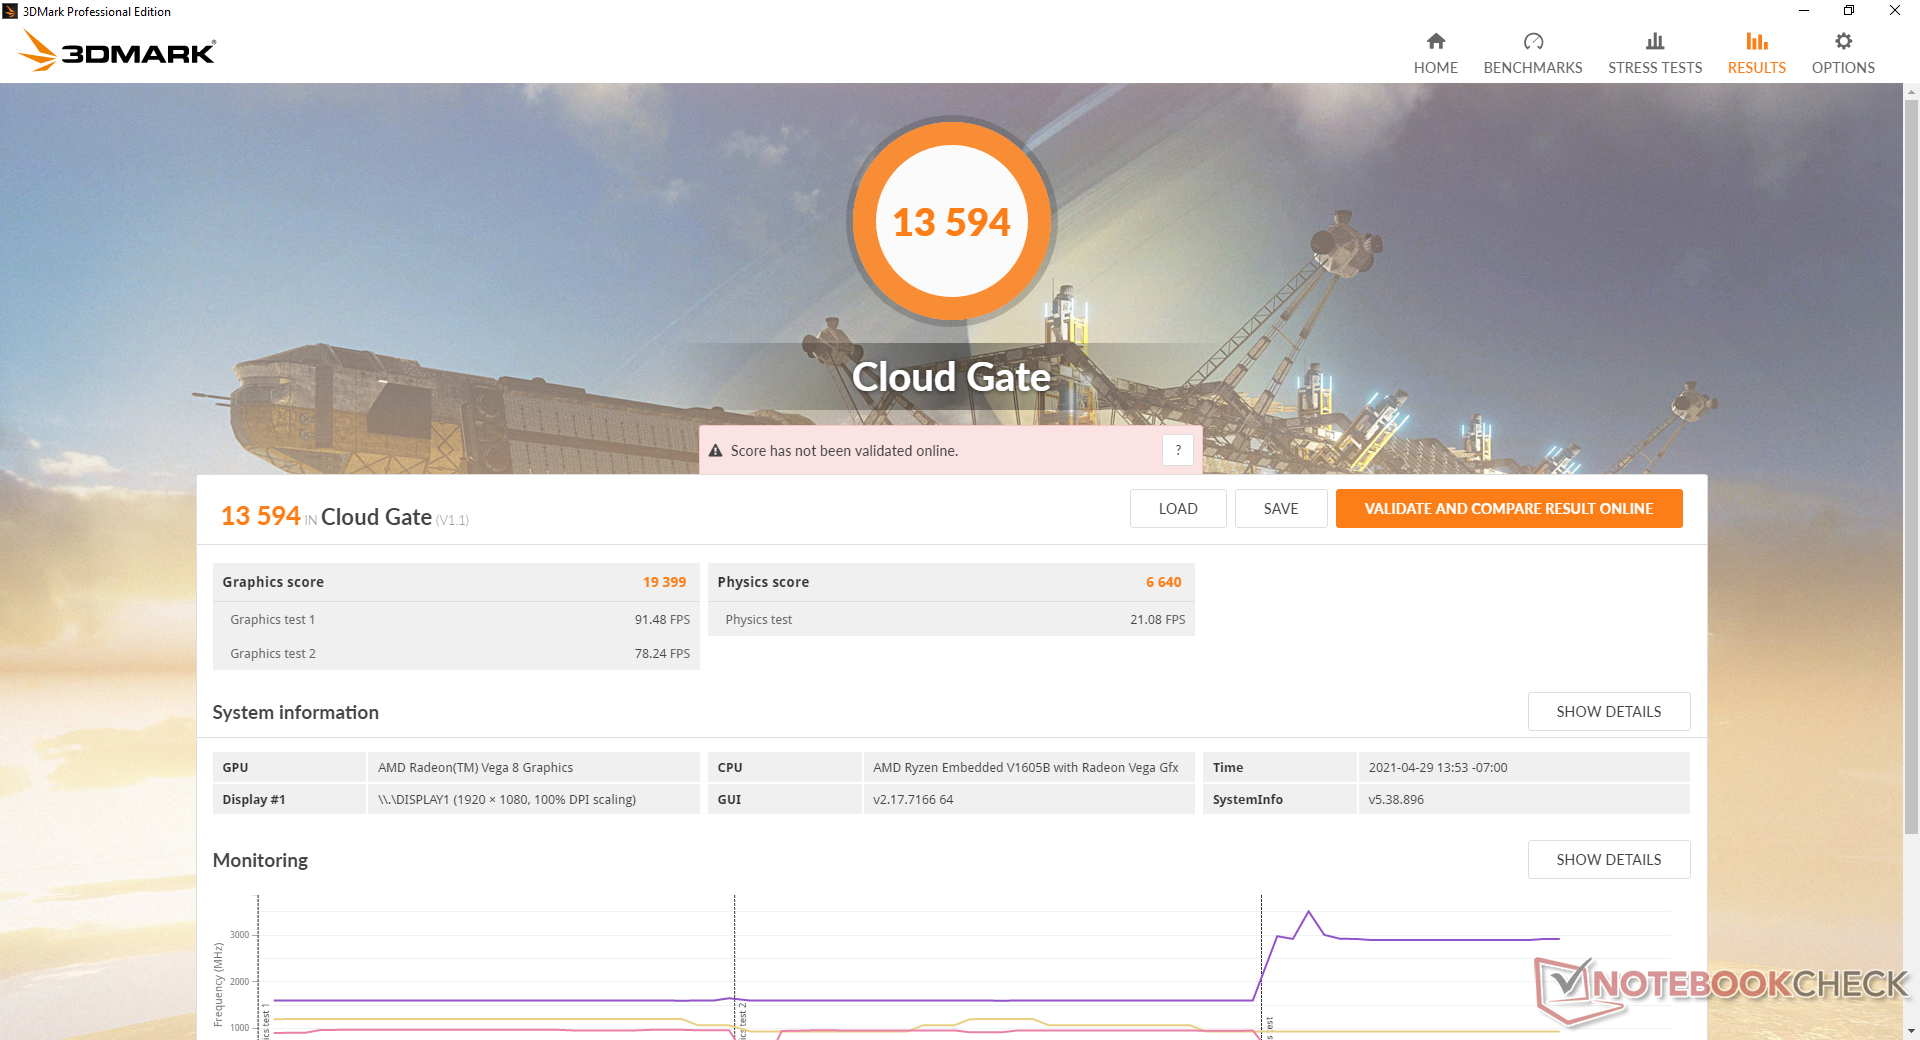
| 3DMark Cloud Gate Standard Score | 13594 pontos | |
| 3DMark Fire Strike Score | 2379 pontos | |
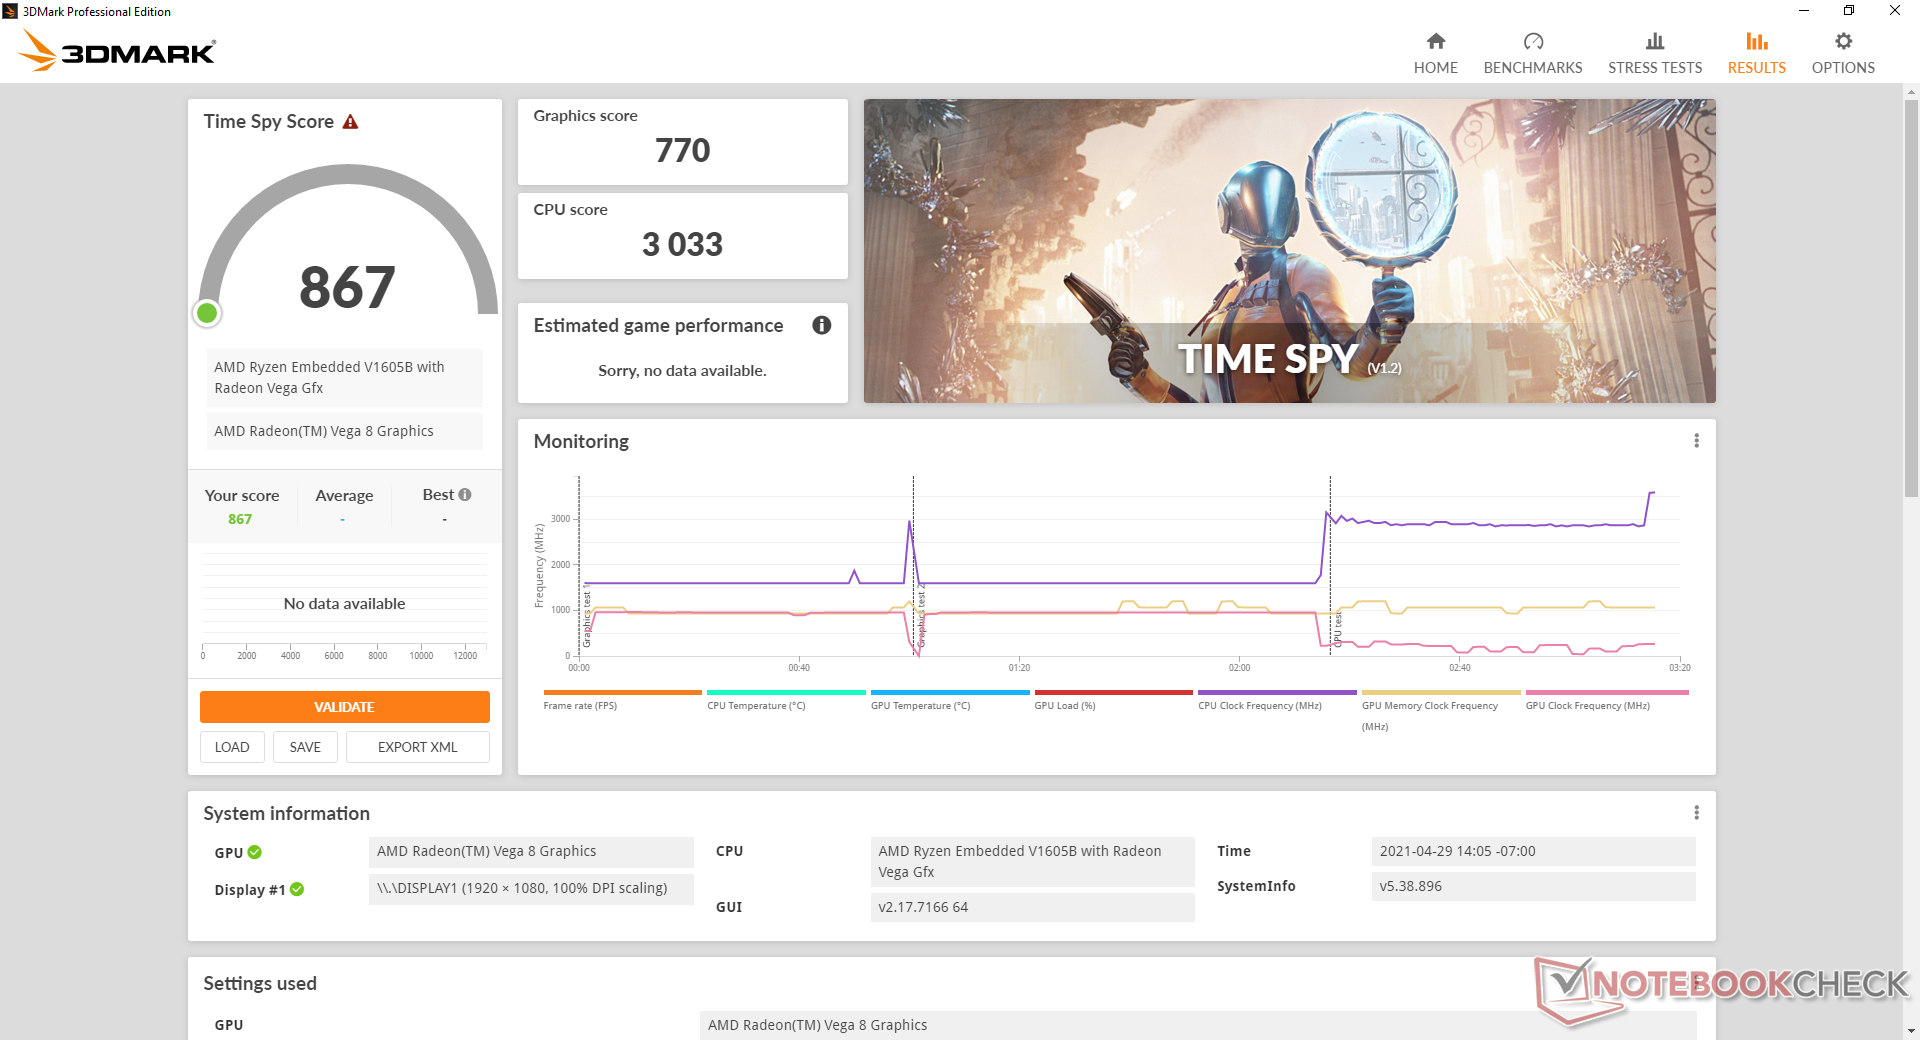
| 3DMark Time Spy Score | 867 pontos | |
Ajuda | ||
| baixo | média | alto | ultra | |
|---|---|---|---|---|
| The Witcher 3 (2015) | 23 | |||
| Dota 2 Reborn (2015) | 76.6 | 65.9 | 44.4 | 41.4 |
| Final Fantasy XV Benchmark (2018) | 26.4 | 13.6 | 9.22 | |
| X-Plane 11.11 (2018) | 21.2 | 21.2 | 15.9 |
Emissions
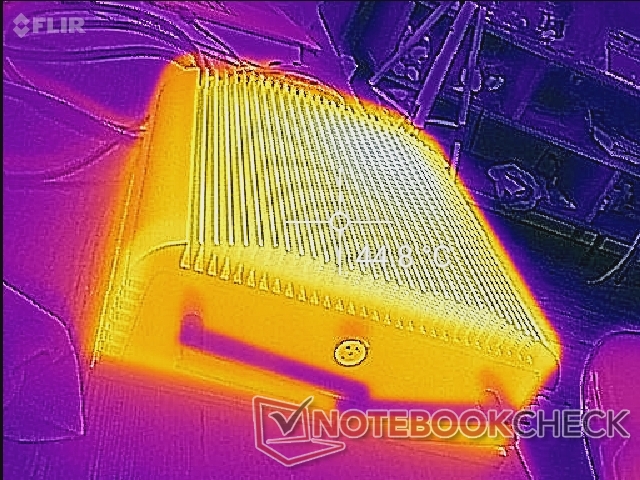
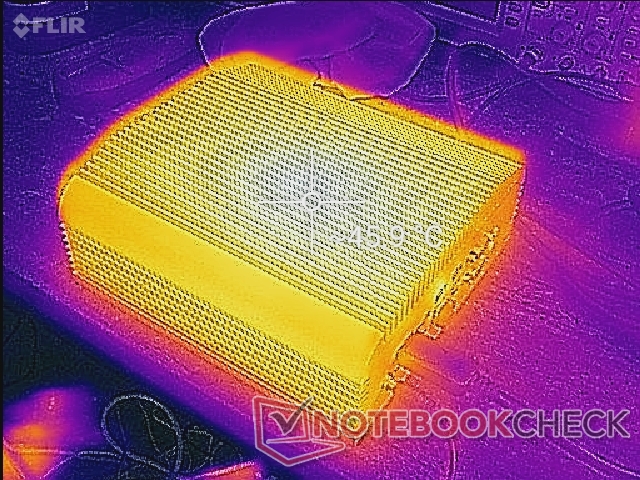
Temperatura
As temperaturas de superfície atingem 46 C após cargas extremas durante mais de uma hora.
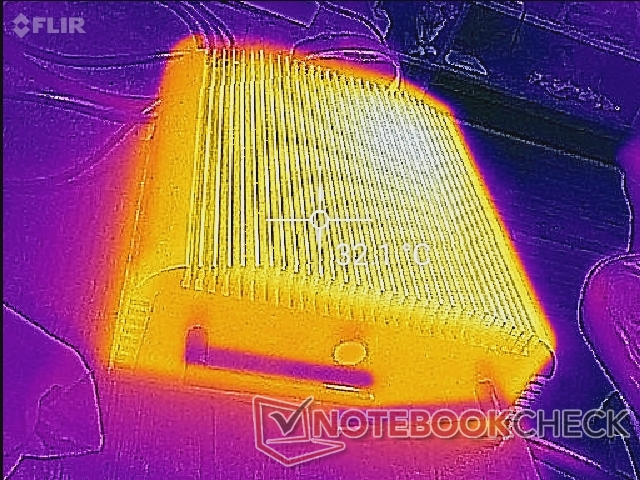
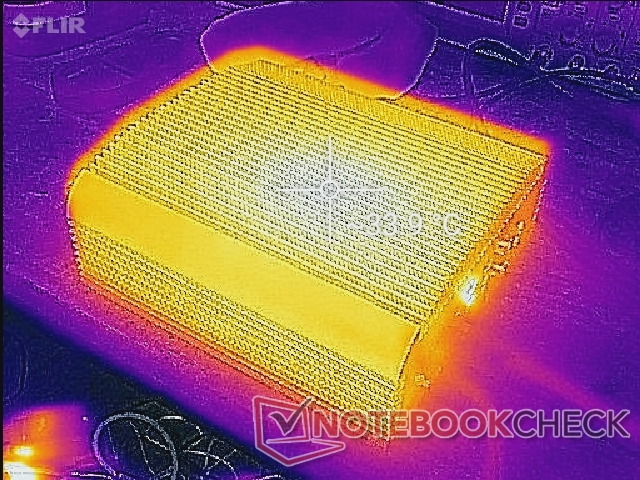
Teste de estresse
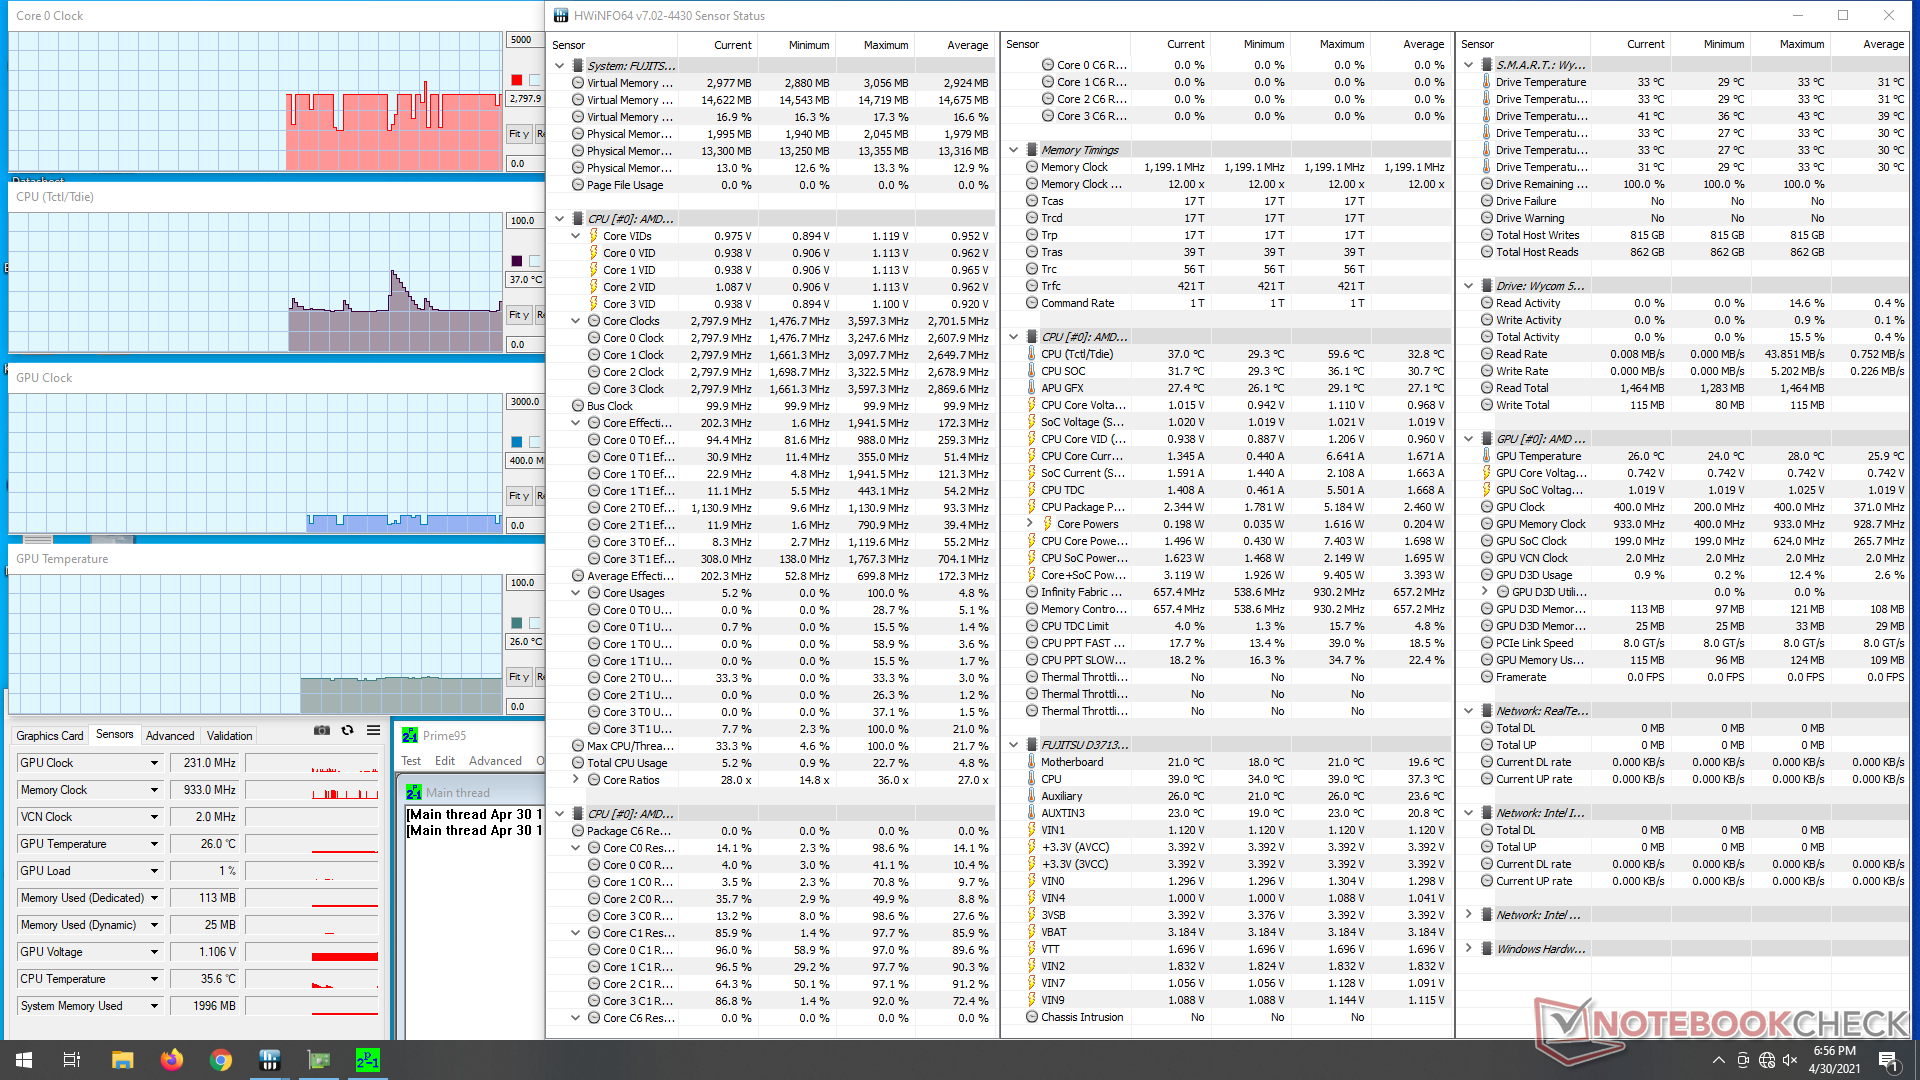
Ao executar Prime95 para enfatizar a CPU, as taxas de relógio aumentariam para 2,9 GHz por apenas alguns segundos antes de mergulhar ligeiramente e estabilizar em 2,8 GHz. Após cerca de 20 minutos, no entanto, a temperatura central eventualmente atinge 100 C, o que obriga as taxas de relógio a cair muito mais acentuadamente para a faixa de 1,8 GHz a 2,4 GHz, como mostram as imagens abaixo
Rodando Witcher 3 é mais representativa das cargas do mundo real. Neste cenário, a temperatura central permanece estável a 75ºC.
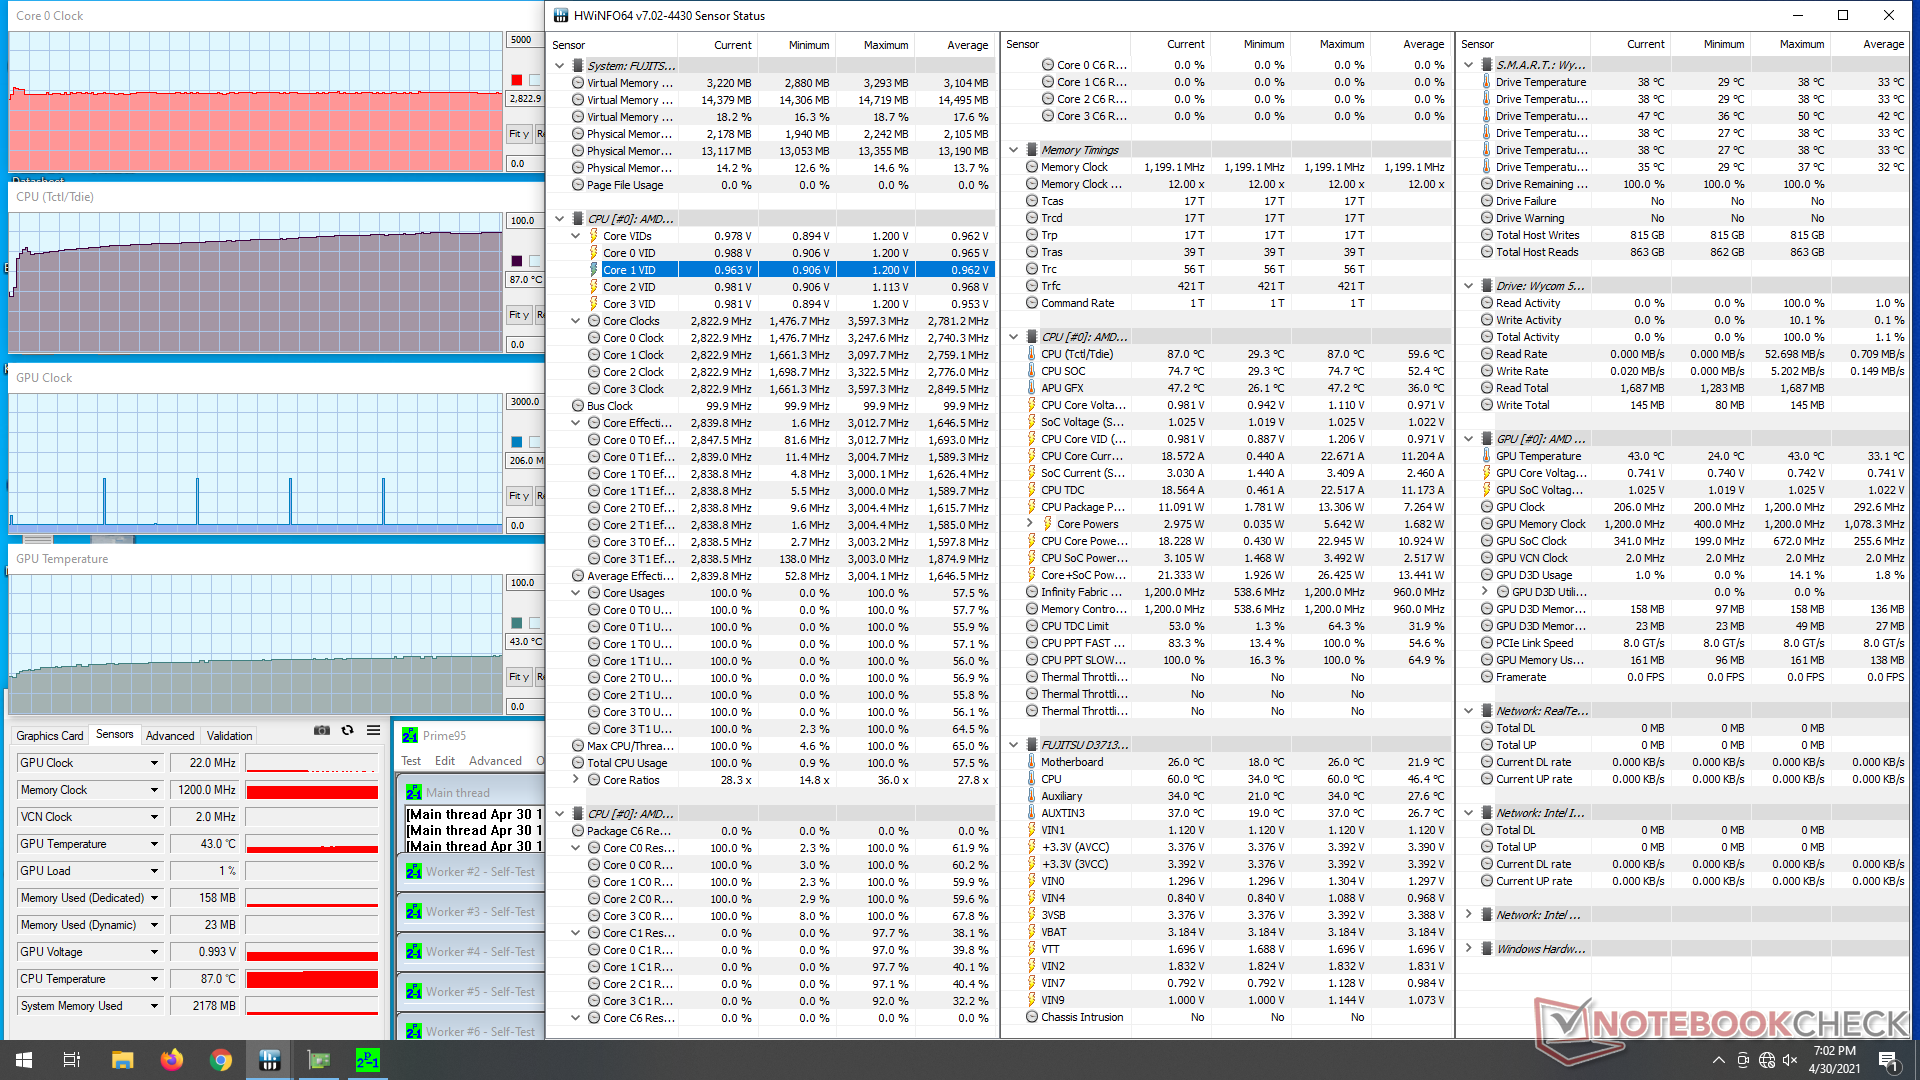
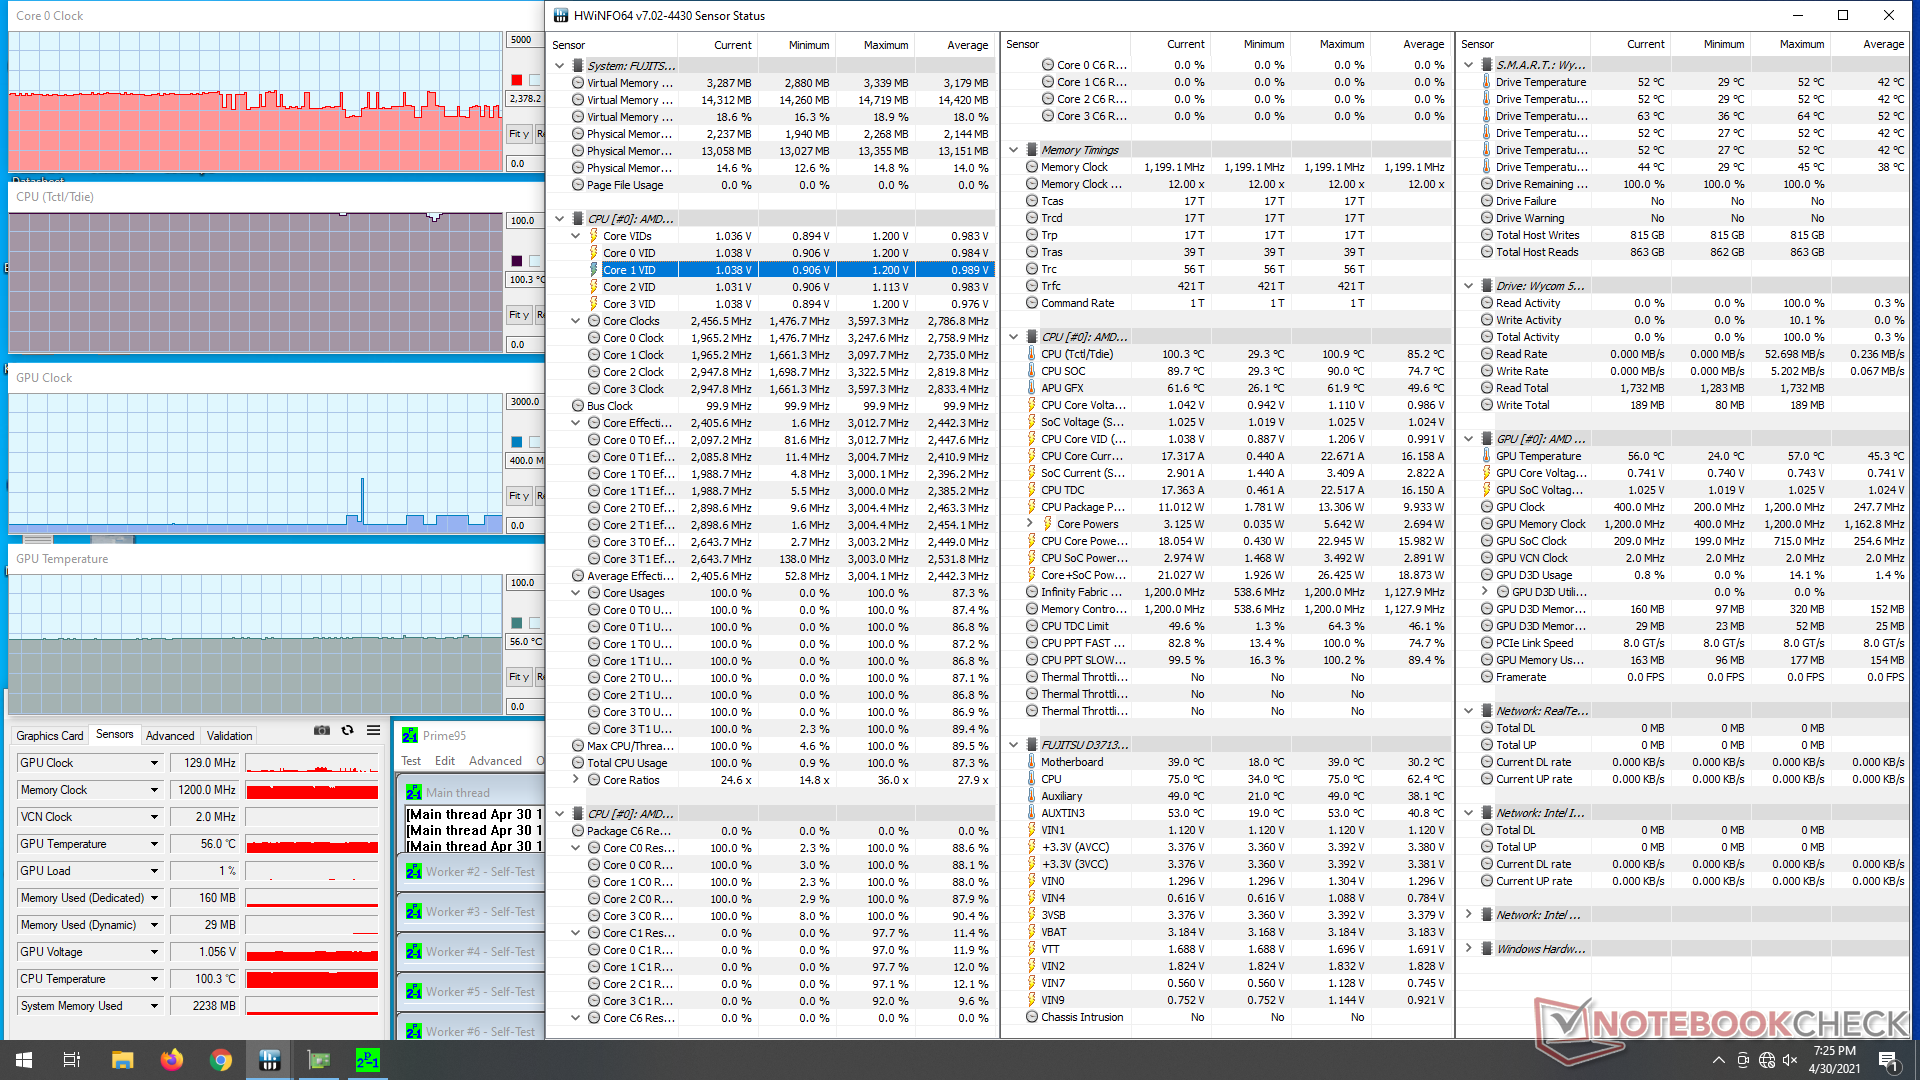
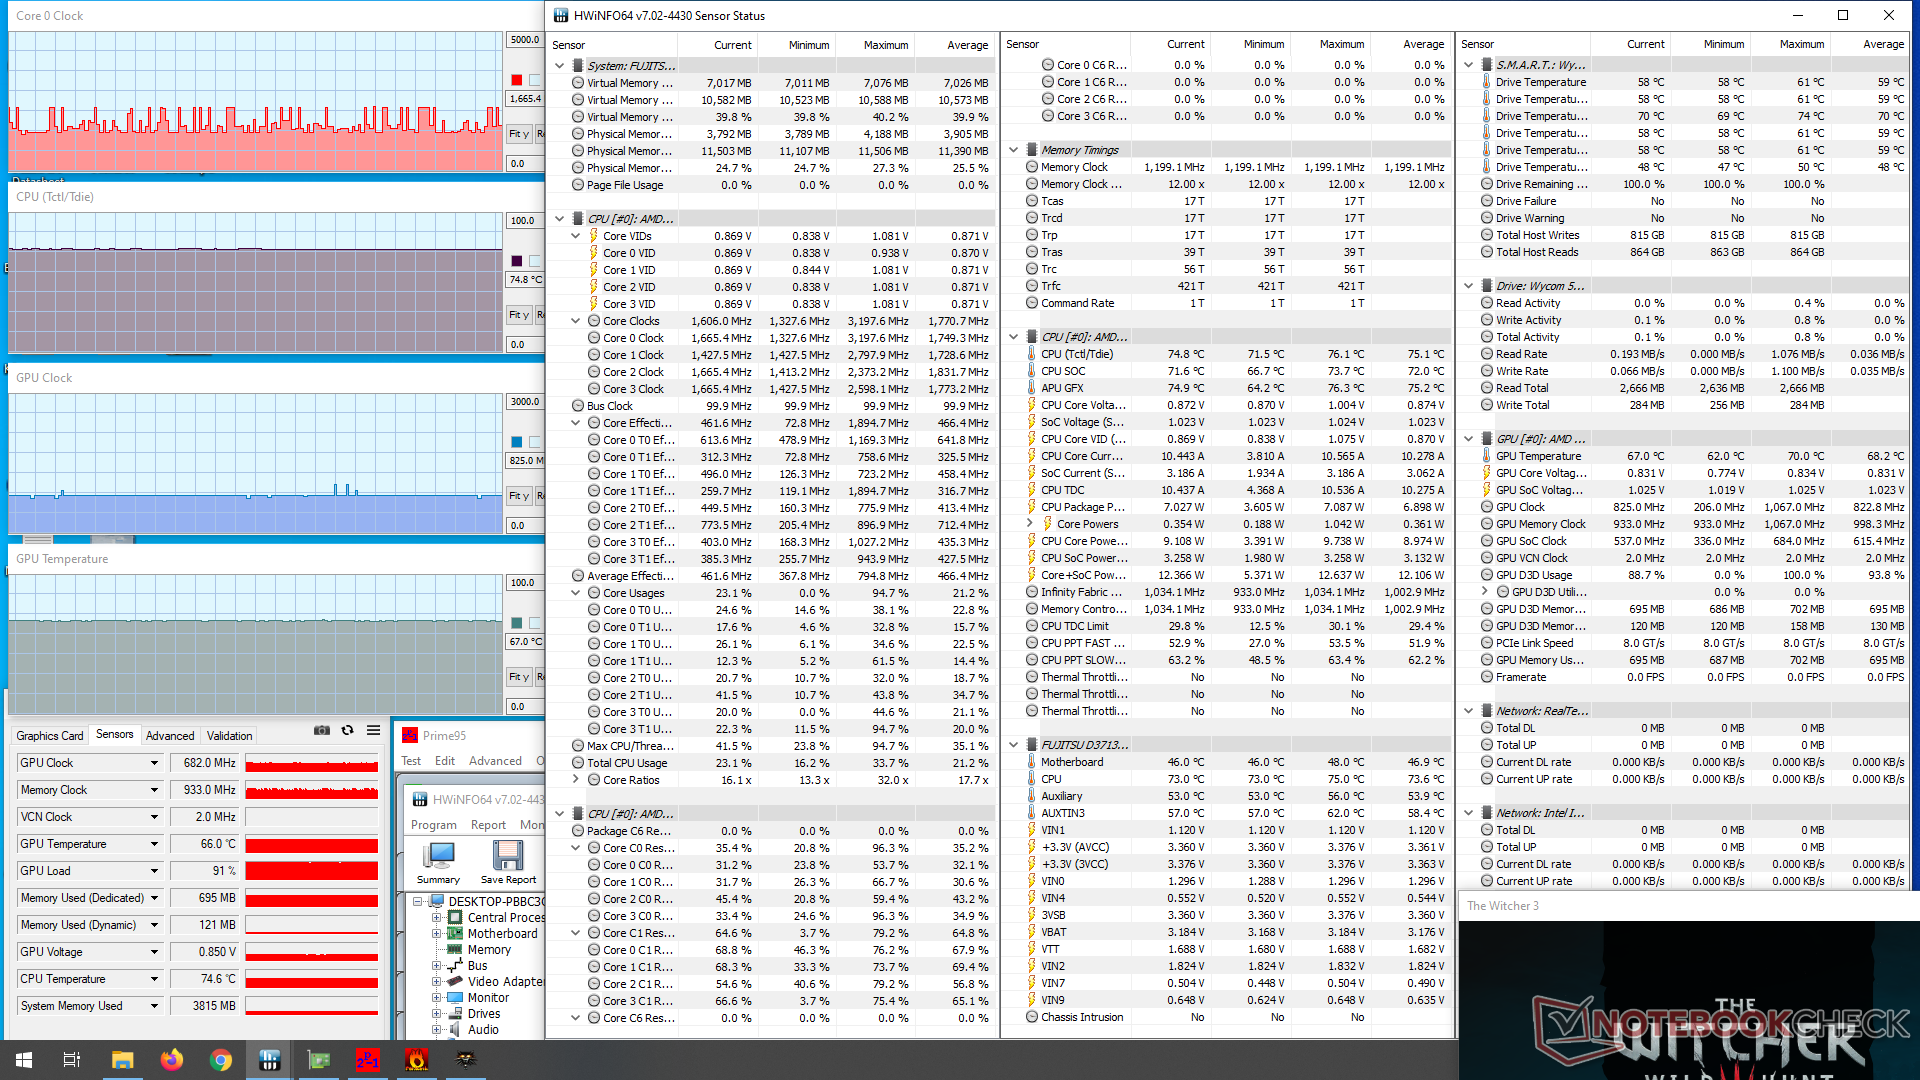
| RelógioCPU (GHz) | RelógioGPU (MHz) | Temperaturamédiada CPU (°C) | |
| System Idle | -- | --35 | |
| Prime95 Stress | 1.8 - 2.4 | --100 | |
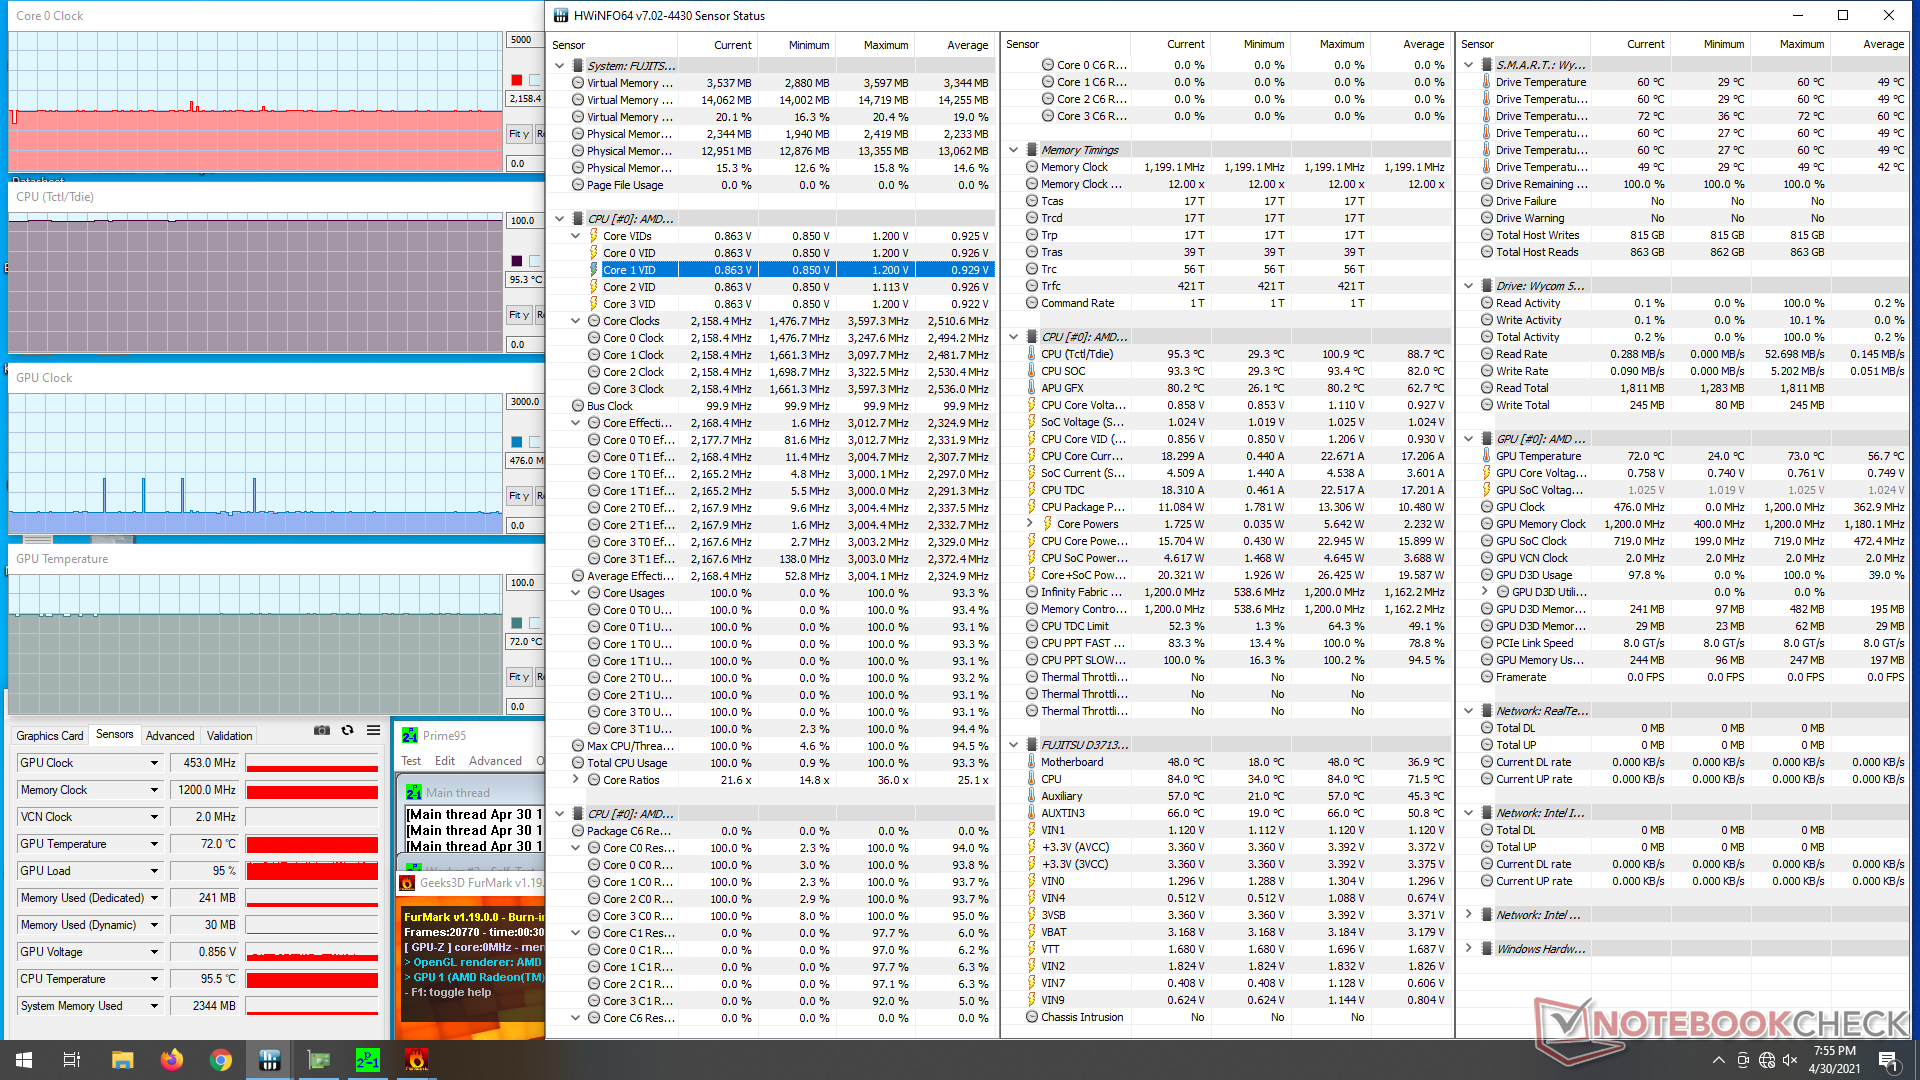
| Prime95 + FurMark Stress | 2.1 | 453 | 96 |
| Witcher 3 Stress | 1.7 - 2.1 | 682 | 75 |
Energy Management
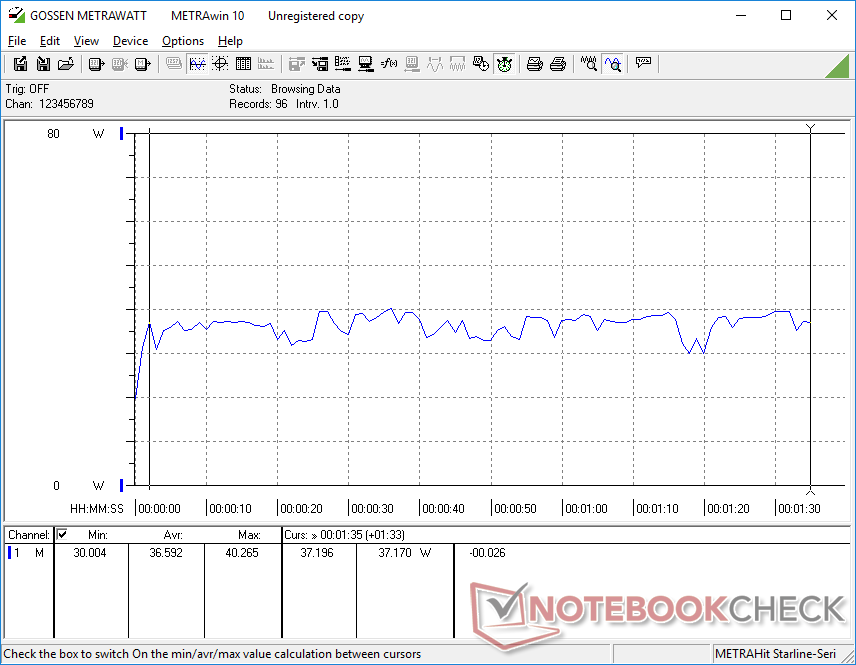
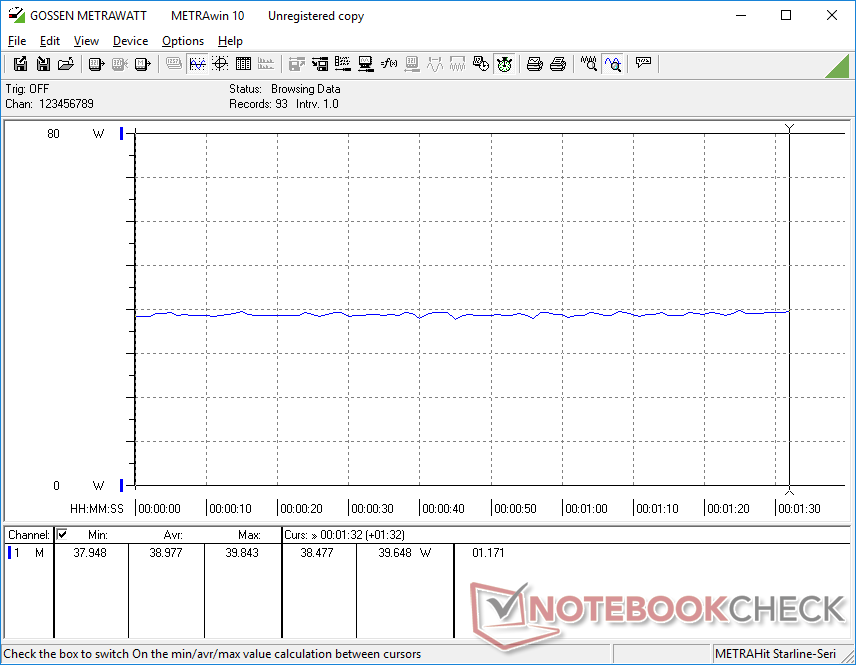
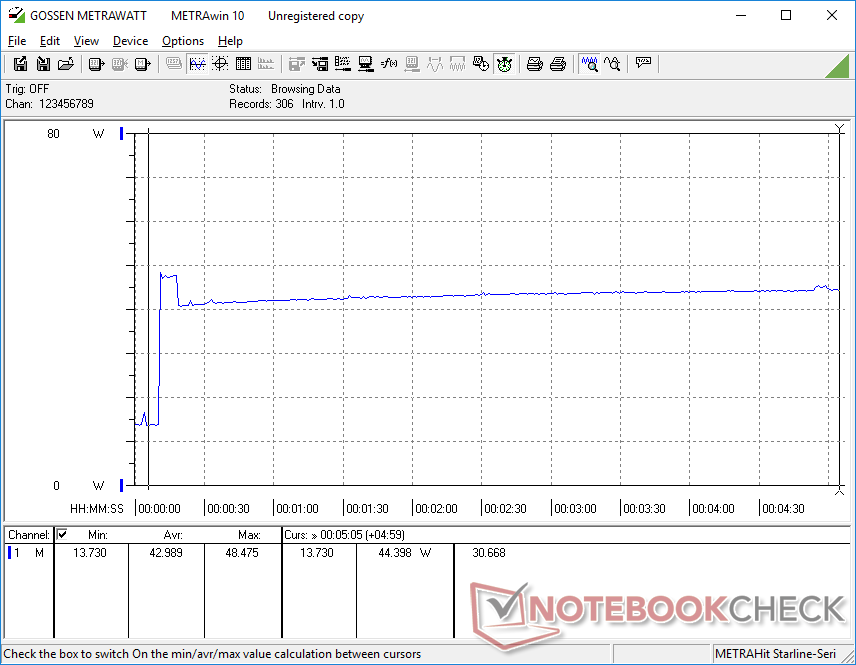
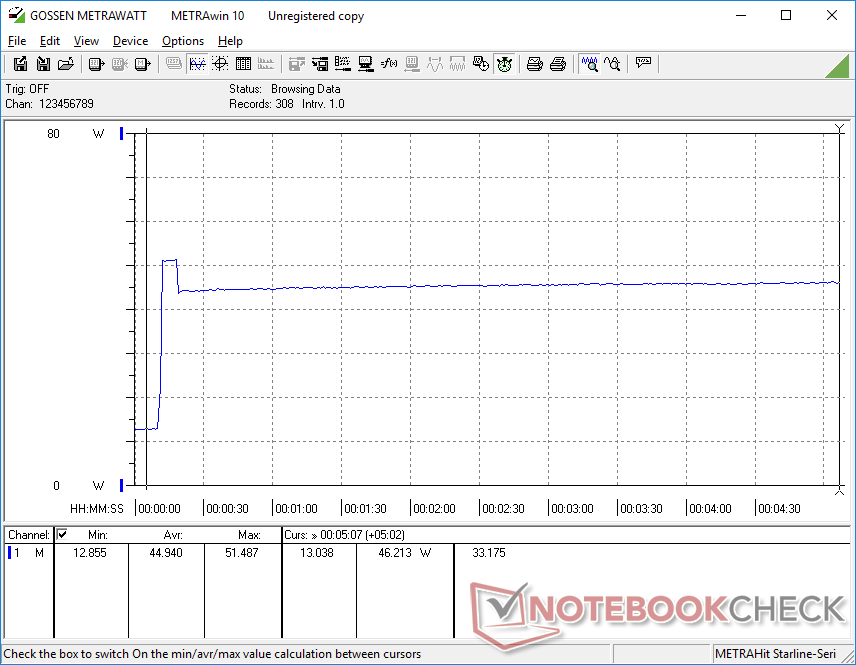
Consumo de energia
O desempenho por watt é ligeiramente inferior ao dos mini PCs rodando na mais recente plataforma Intel da 11ª geração. A manipulação no desktop, por exemplo, consome entre 11 W e 13 W, em comparação com apenas metade do que na Intel NUC11PAQi7. Cargas maiores como jogos consomem cerca de 36 W a 39 W em comparação com 31 W a 39 W na NUC acima mencionada, embora o desempenho da GPU em nosso PC AMD seja visivelmente mais lento.
| desligado | |
| Ocioso | |
| Carga |
|
Key:
min: | |
| Impact Display Solutions IMP-3713-V2-16-500 Ryzen V1605B, Vega 8, , , x, | Impact Display Solutions IMP-3654-B1-R Core i9-9900T i9-9900T, UHD Graphics 630, EDGE NextGen SSD 1TB, , x, | Intel NUC11PHKi7C i7-1165G7, GeForce RTX 2060 Mobile, Samsung SSD 980 Pro 500GB MZ-V8P500BW, , x, | Intel NUC11PAQi7 i7-1165G7, Iris Xe G7 96EUs, Samsung SSD 980 Pro 500GB MZ-V8P500BW, , x, | Zotac ZBox MI643 i5-10210U, UHD Graphics 620, Lexar NM610 1TB, , x, | |
|---|---|---|---|---|---|
| Power Consumption | 8% | -143% | 19% | 14% | |
| Idle Minimum * (Watt) | 11.5 | 6.6 43% | 5.8 50% | 5.6 51% | 7.5 35% |
| Idle Average * (Watt) | 12 | 8.3 31% | 5.9 51% | 5.6 53% | 9.2 23% |
| Idle Maximum * (Watt) | 12.4 | 8.8 29% | 20.7 -67% | 6 52% | 9.6 23% |
| Load Average * (Watt) | 36.6 | 46.2 -26% | 130.8 -257% | 31.4 14% | 34.4 6% |
| Witcher 3 ultra * (Watt) | 39 | 154.4 -296% | 39 -0% | ||
| Load Maximum * (Watt) | 51.5 | 69.7 -35% | 225.2 -337% | 80.5 -56% | 60.6 -18% |
* ... menor é melhor
Pro
Contra
Veredicto
Prime95 mostra que o resfriamento passivo do chassi não é suficiente para suportar totalmente as taxas de relógio da CPU Turbo por períodos prolongados. As taxas de relógio podem começar tão altas quanto 2,9 GHz antes de cair inevitavelmente para tão baixos quanto 1,8 GHz quando a temperatura central atingir inevitavelmente 100 C. Parece que mesmo um enorme dissipador de calor de alumínio não é capaz de operar a CPU ULV com desempenho máximo indefinidamente. A Lenovo oferece seu próprio Mini PC sem ventilador baseado em Intel que é muito menor que nossa unidade AMD, embora com menos características expansíveis
Preço e disponibilidade
As cotações de preços estão disponíveis diretamente em Componentes de impacto
Price comparison

