A Aorus Gaming Box GeForce RTX 2080 Ti transformou nossa minúscula Intel NUC em uma casa de força 4K
")
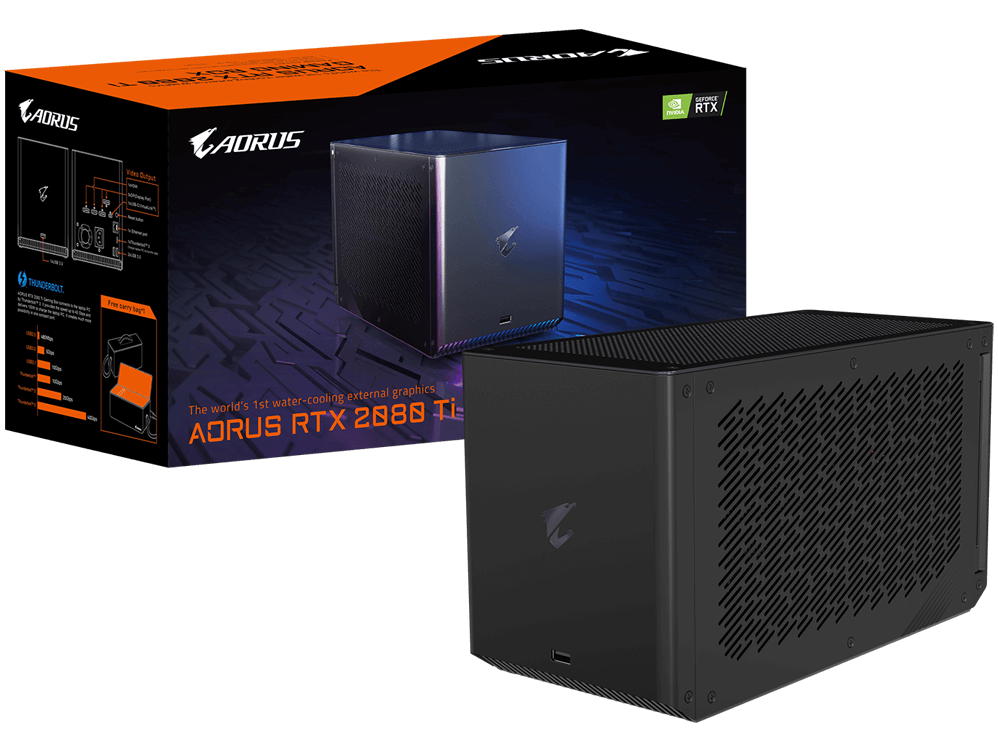
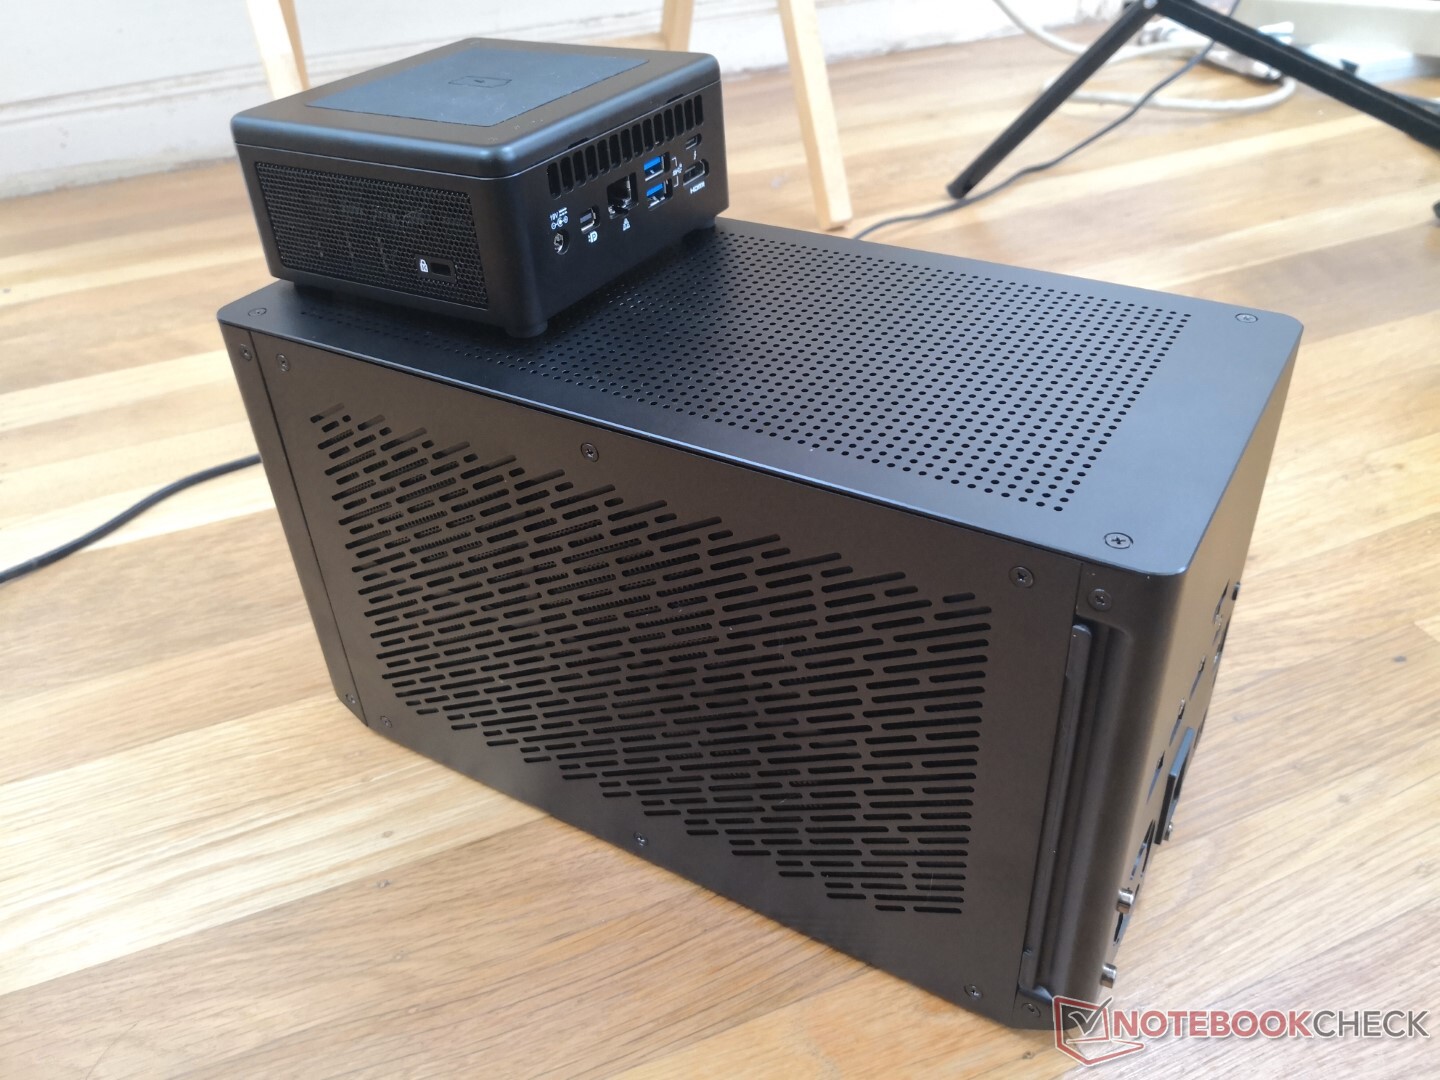
A Gigabyte Aorus GeForce RTX 2080 Ti Gaming Box é uma das GPUs externas (eGPUs) mais rápidas disponíveis juntamente com a recente estação de acoplamento Asus ROG XG. Ao contrário da solução Asus, entretanto, a série Gaming Box refrigerada a líquido não usa conectores proprietários para ser compatível com qualquer PC Windows ou laptop desde que tenham uma porta Thunderbolt 3. A Gaming Box está mesmo disponível com as opções GeForce RTX 3090, embora em quantidades limitadas.
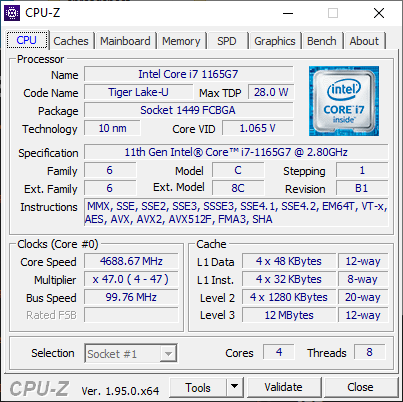
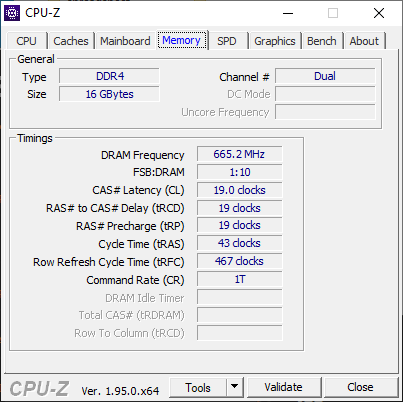
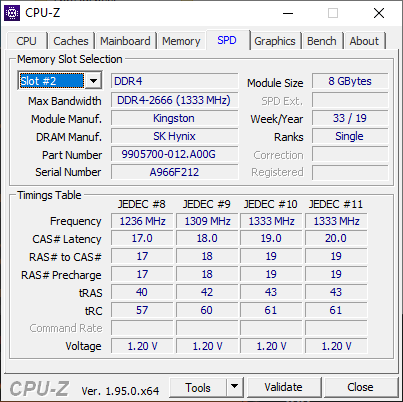
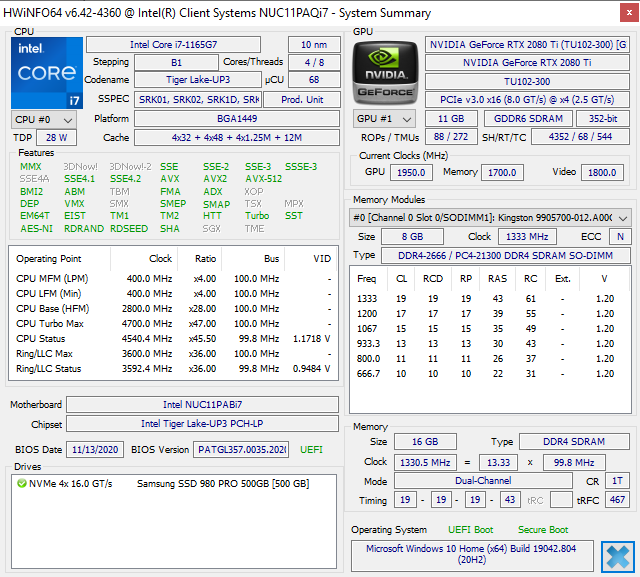
Para nosso PC anfitrião de escolha, emparelhamos a Gigabyte Gaming Box com a Intel NUC 11 Panther Canyon, conforme analisado aqui. Também atualizamos a memória principal do NUC para 16 GB de canal duplo a partir de 16 GB de canal único. O NUC 11 é notável por carregar o mais recente Core i7-1165G7 da 11ª geração Tiger Lake CPU e suporte a dispositivos Thunderbolt 4 a até 40 Gbps, o que o torna um objeto de teste perfeito para um eGPU. Acontece também que ele é um dos mais rápidos Tiger Lake-U sistemas que o dinheiro pode comprar no momento. Todos os testes abaixo foram completados com um monitor de 4K conectado diretamente à Caixa de Jogos em vez do NUC para evitar que os dados de vídeo ficassem estrangulados no desempenho.
Veja a página do produto aqui para as especificações oficiais.
Mais revisões Gigabyte:
Configuração
A fase de preparação é relativamente suave, mas não sem nenhum soluço. De acordo com o livreto, os proprietários devem primeiro conectar a Caixa de Jogos a uma tomada antes de conectar a um PC laptop com o cabo Thunderbolt de 500 milímetros incluído. Depois, o Windows deve detectar automaticamente o eGPU e notificar o usuário para aprovar o dispositivo Thunderbolt. Em nosso caso, a NUC não pôde detectar a Caixa de Jogos até que tivéssemos atualizado seus drivers Thunderbolt. Somente então os usuários podem baixar e instalar os últimos drivers Nvidia através do software GeForce Experience. Note que as portas de saída de vídeo na Caixa de Jogos não funcionarão até que esta etapa final esteja concluída
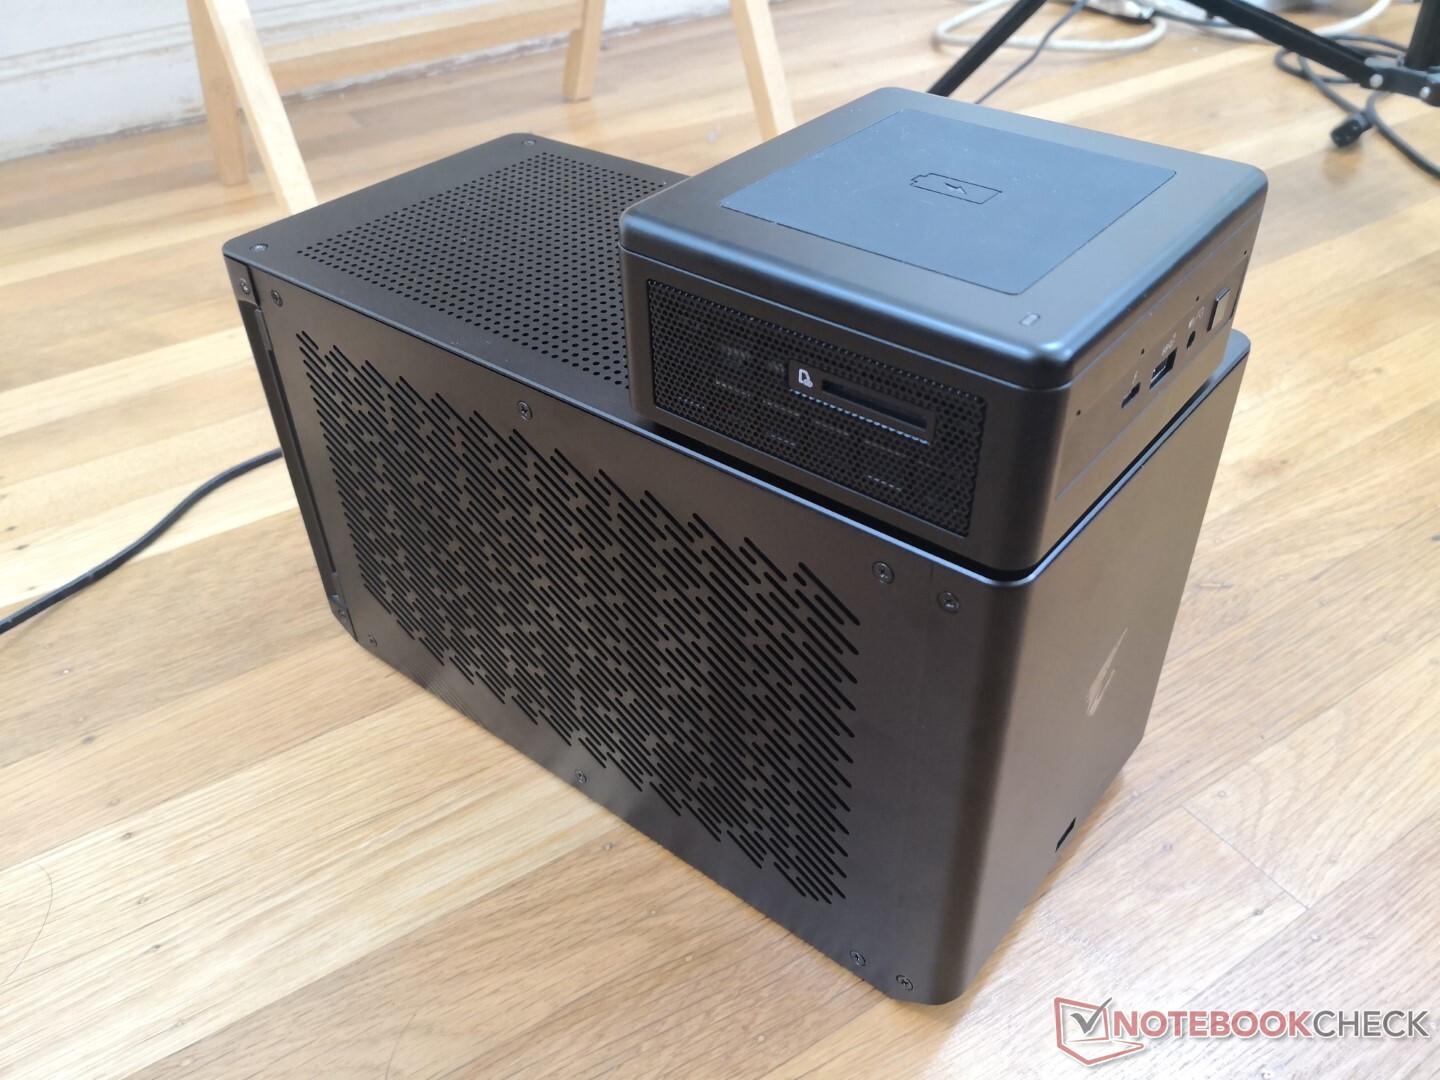
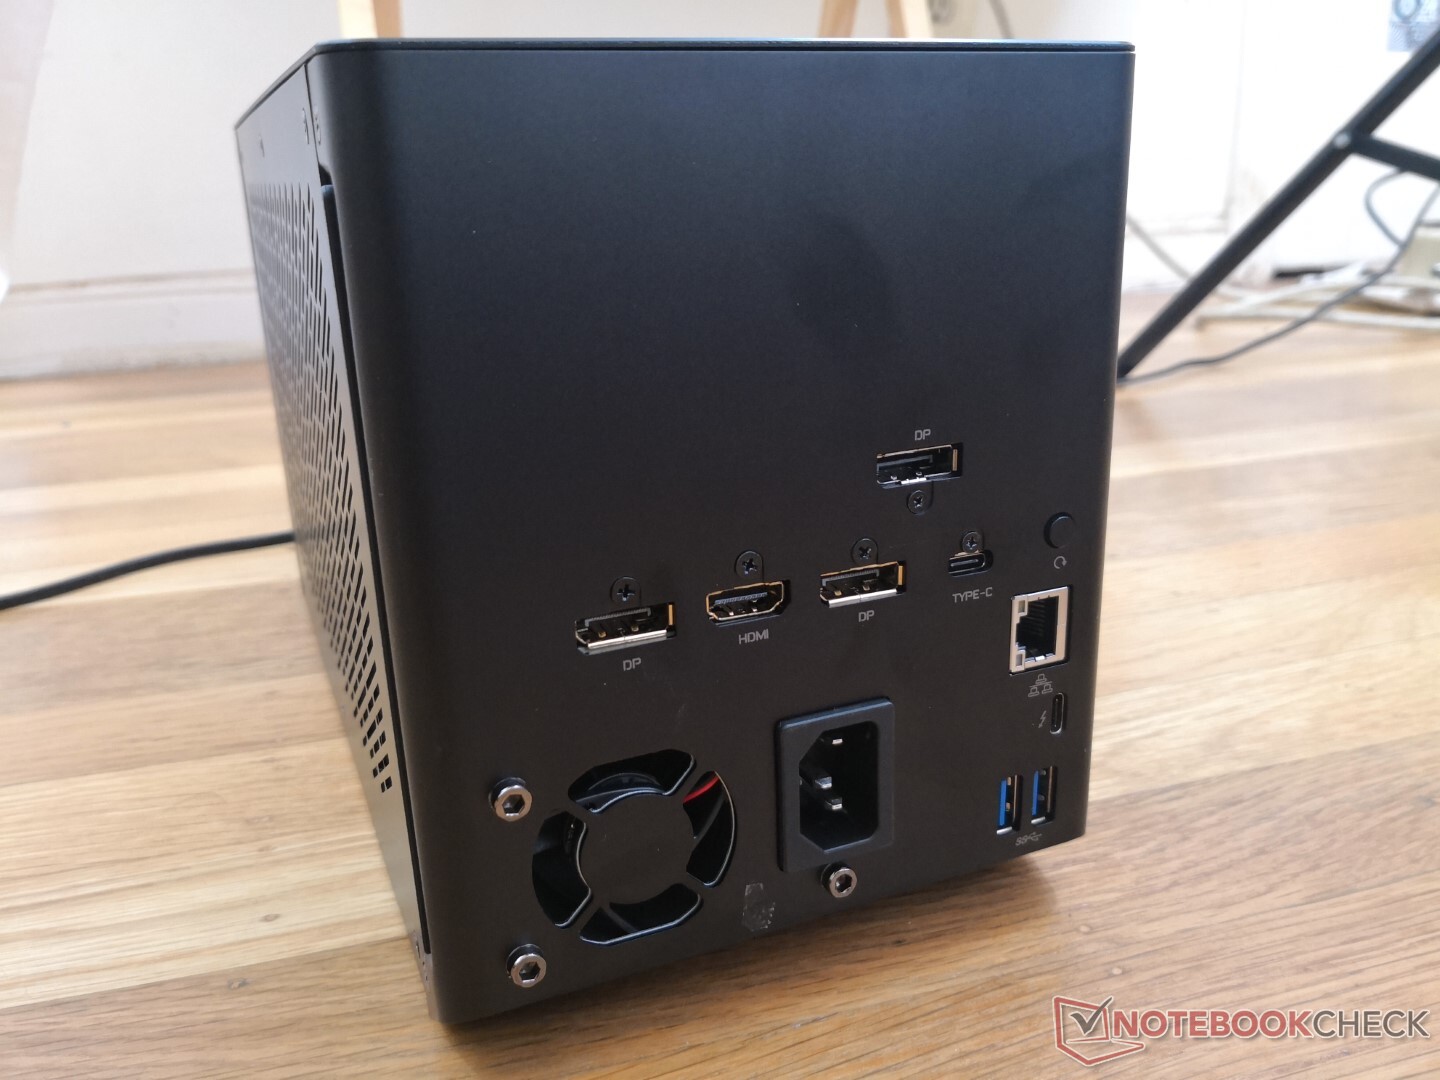
Conectividade
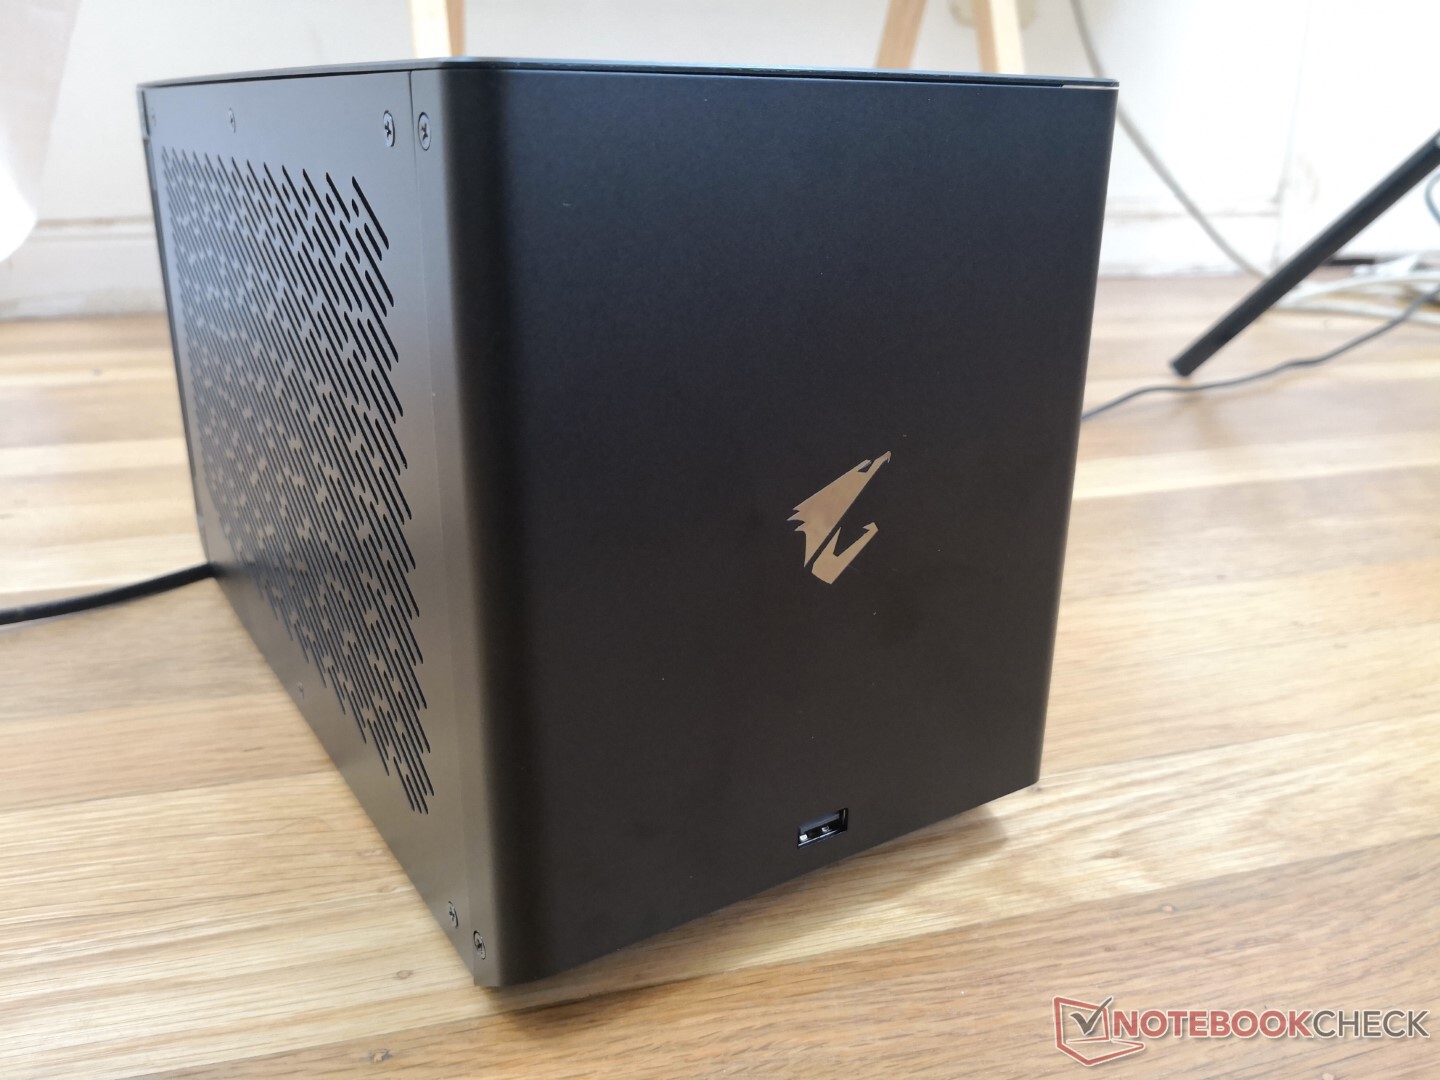
A maioria das portas estão ao longo da traseira com apenas uma porta USB-A na frente. Não há botão de energia e por isso o eGPU está sempre "ligado", mesmo que o PC principal esteja desligado. O consumo de energia é preocupantemente alto como resultado, conforme detalhado em nossa seção Consumo de energia abaixo.
Um botão de "reset" na parte de trás emula a religação do cabo de energia CA. Entretanto, um botão de energia real teria sido melhor.
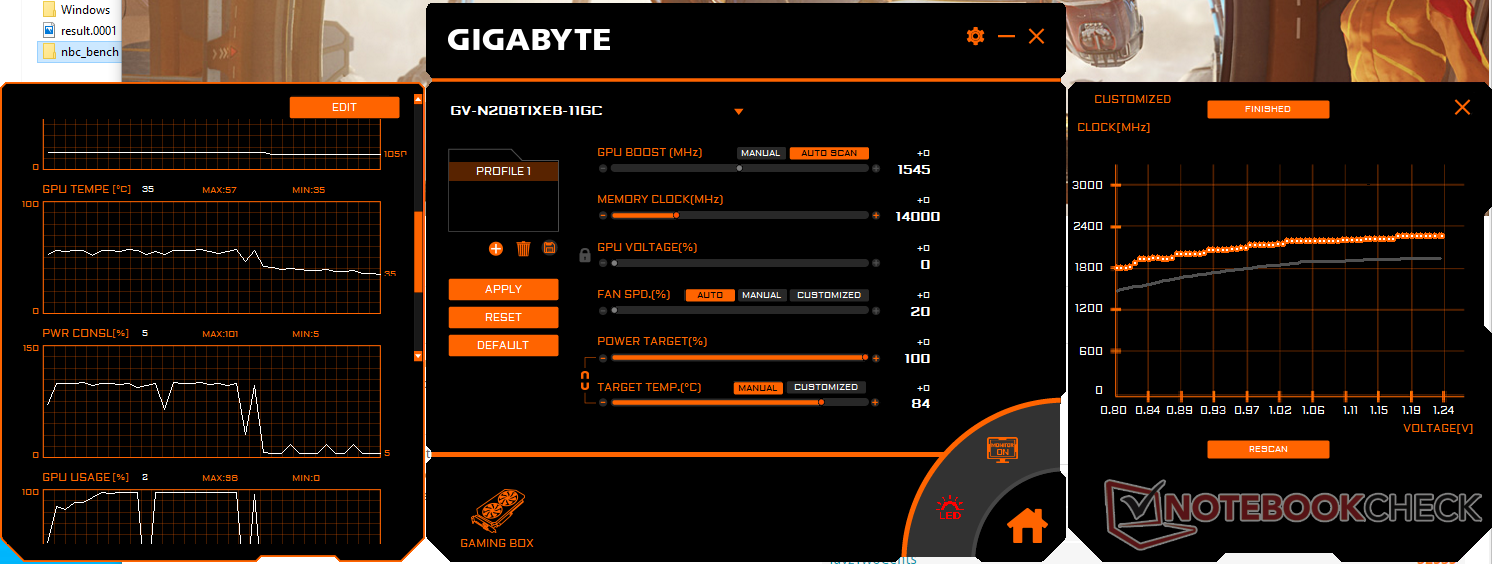
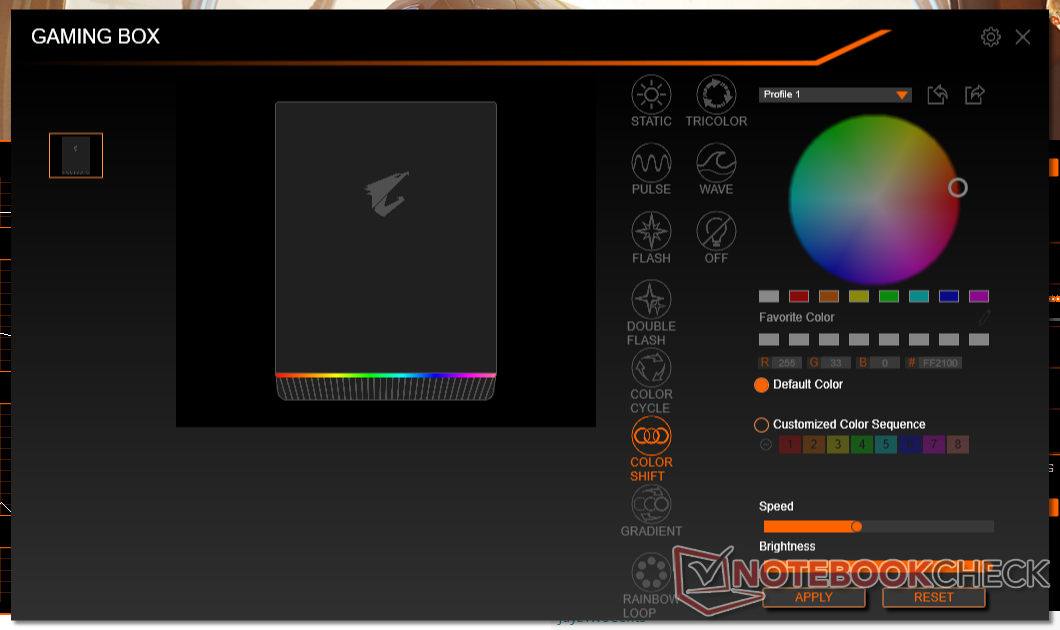
Software
O software UI Gaming Box é pobre. Sua janela é fixa e, portanto, não pode ser maximizada enquanto seus botões e gráficos também são muito pequenos. O recurso de overclocking automático 'Auto Scan GPU Boost' também falhou o software em nossa primeira tentativa e parecia não ter nenhum impacto sobre a performance da Gaming Box. A interface horrível é uma vergonha porque suas características e gravação de dados são, de outra forma, bastante úteis para os entusiastas.
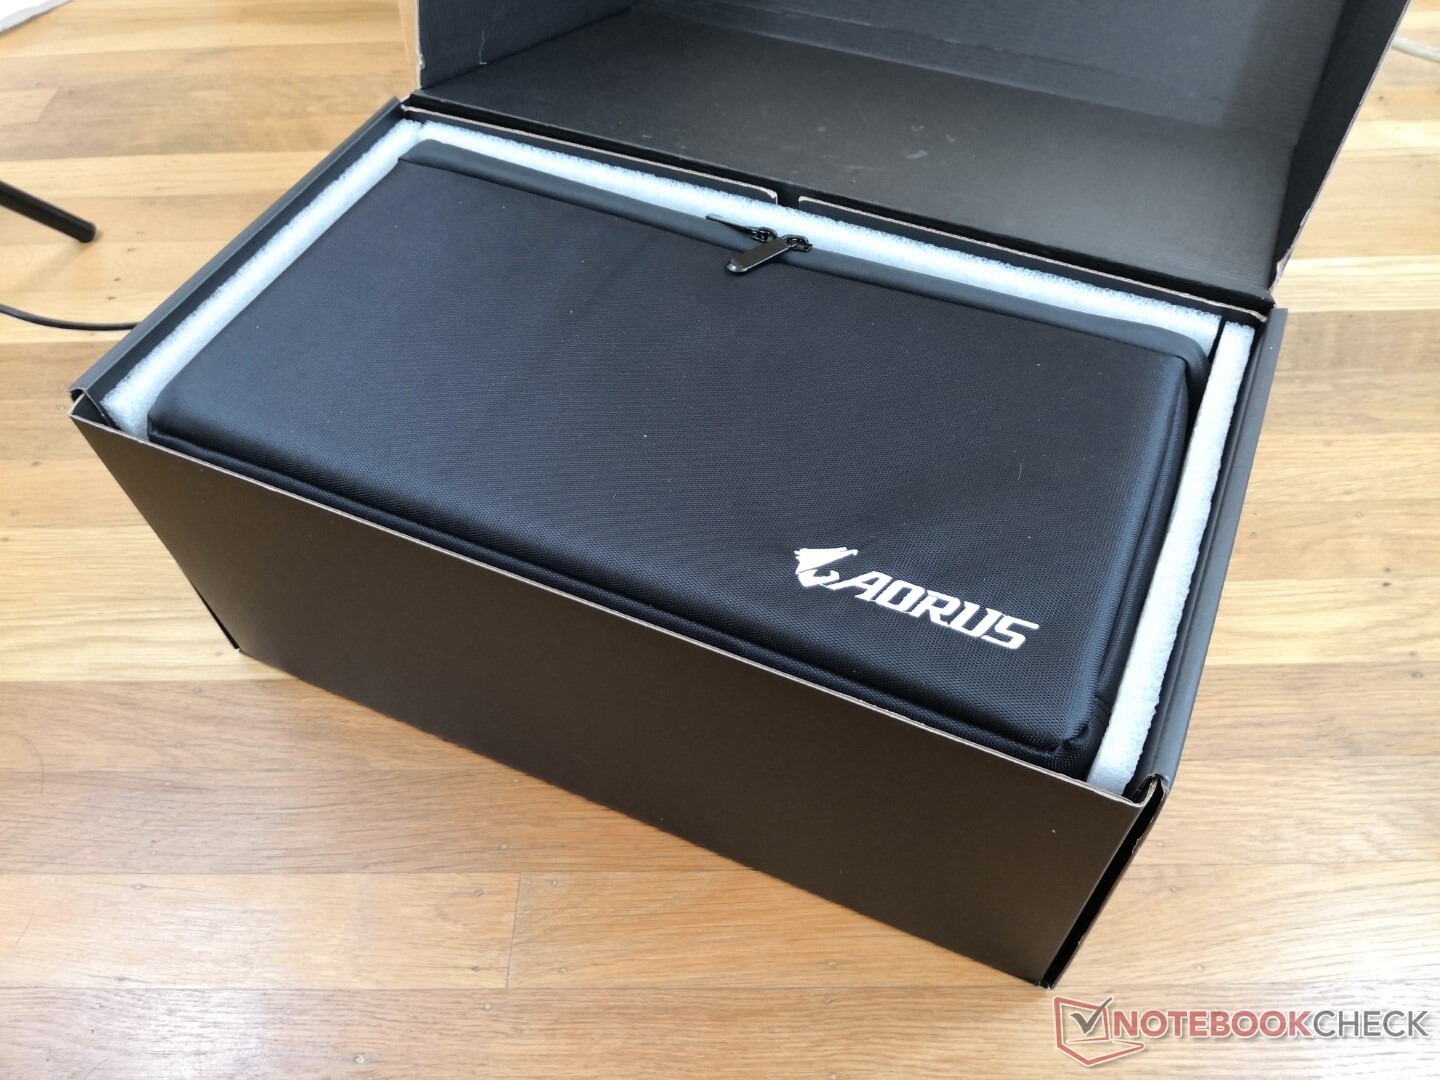
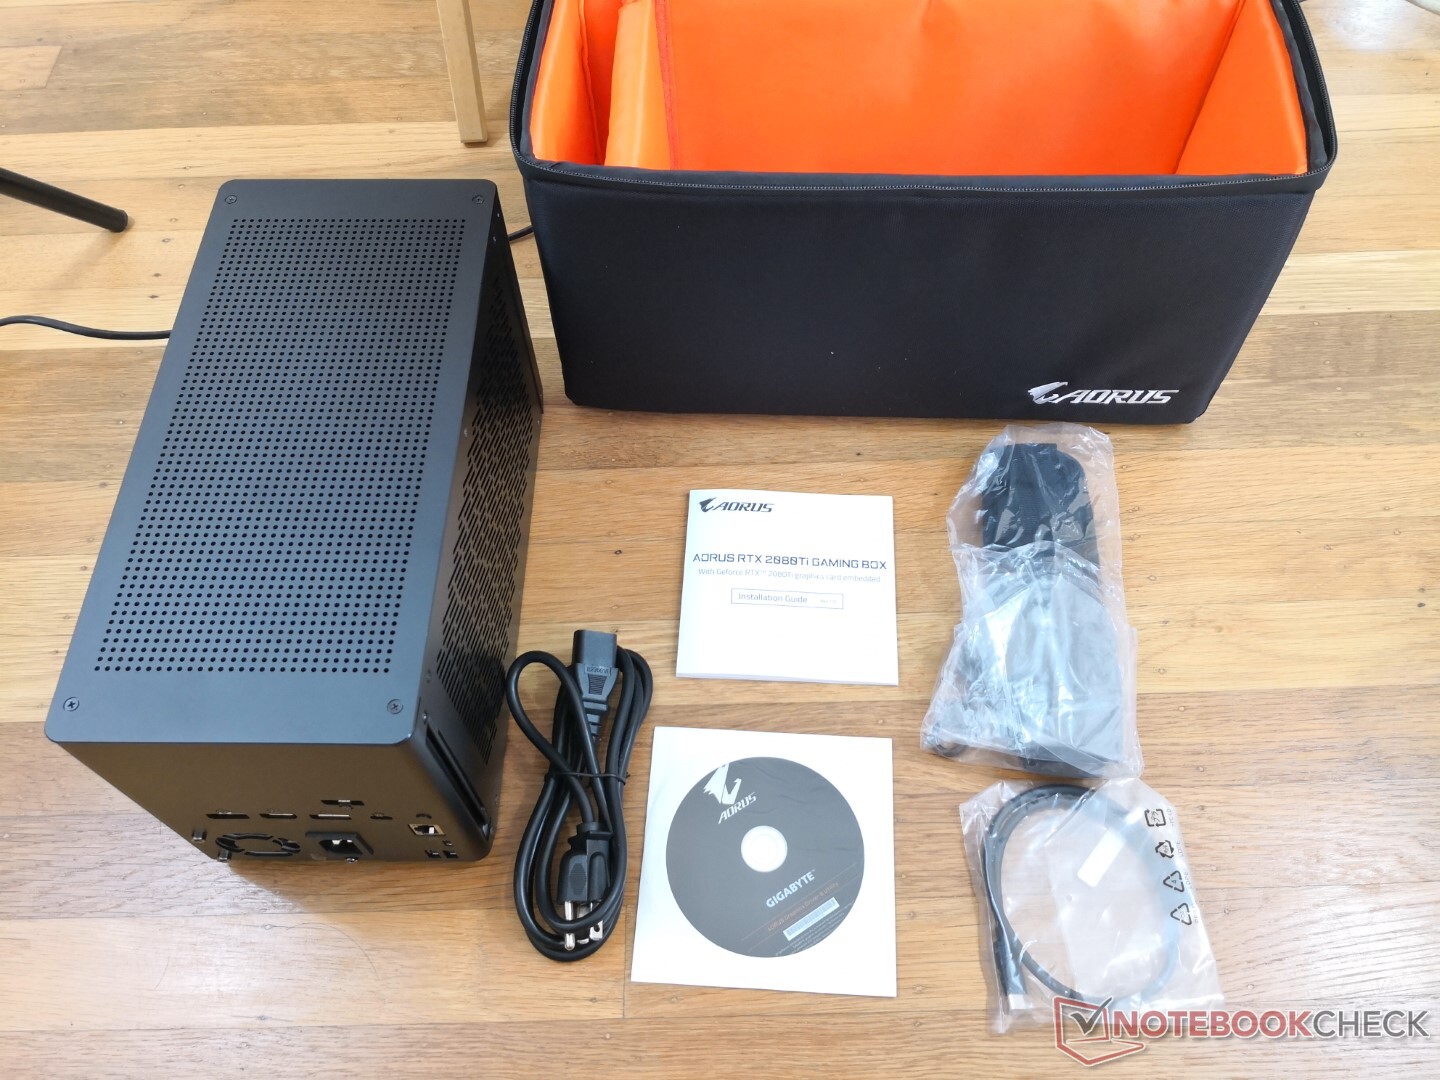
Acessórios
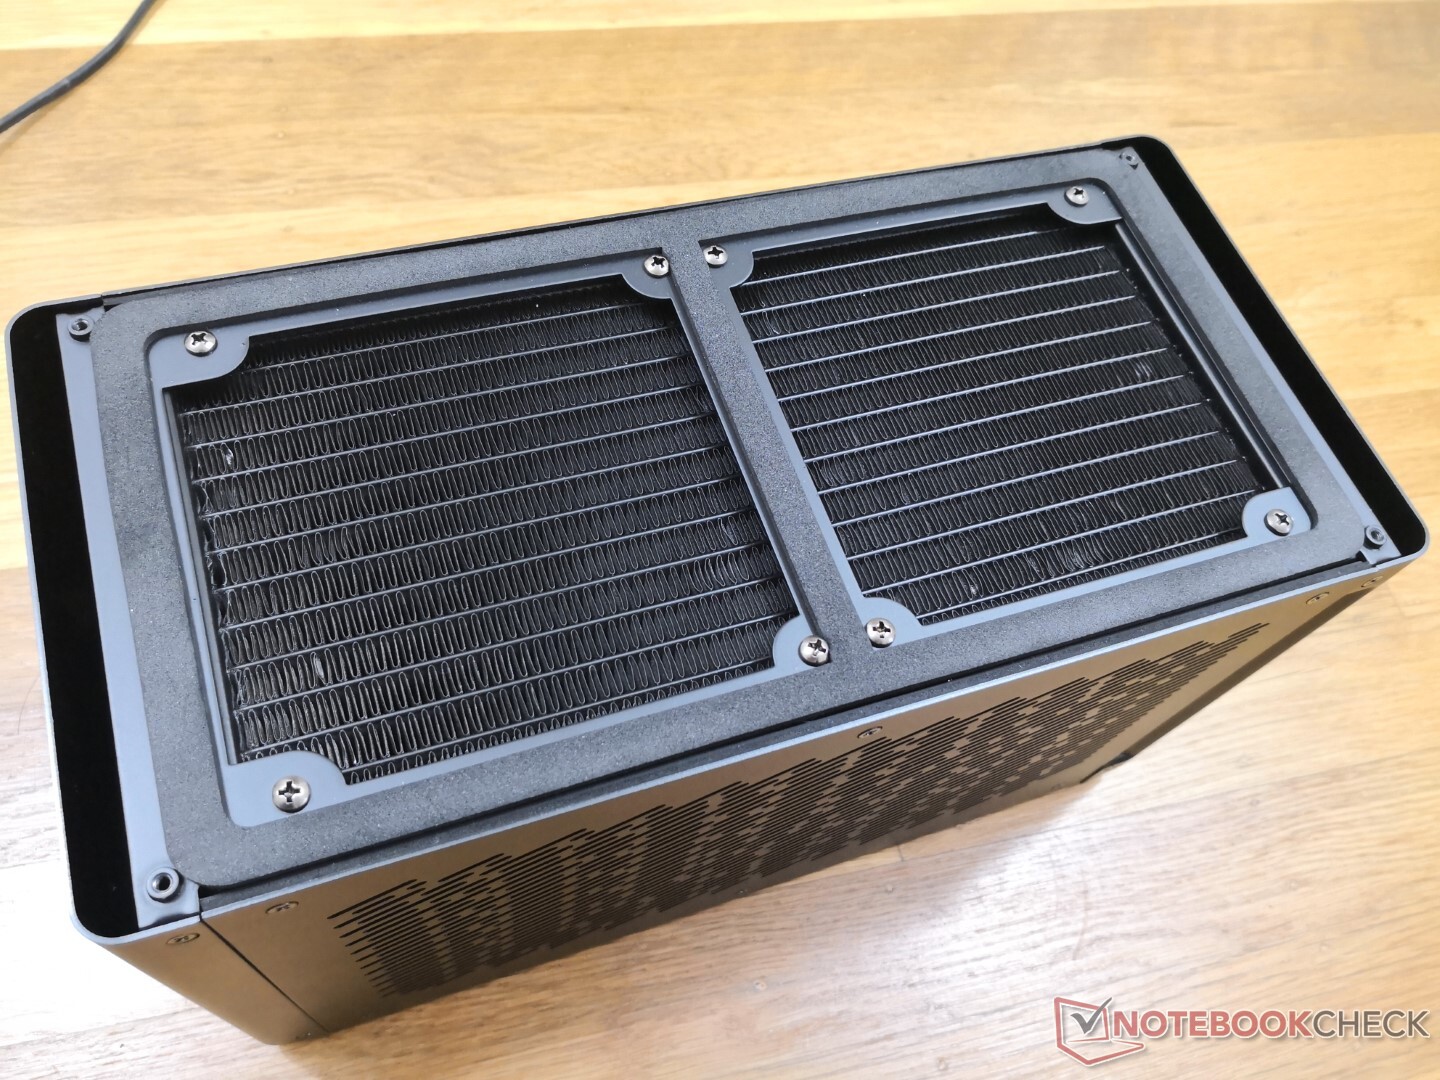
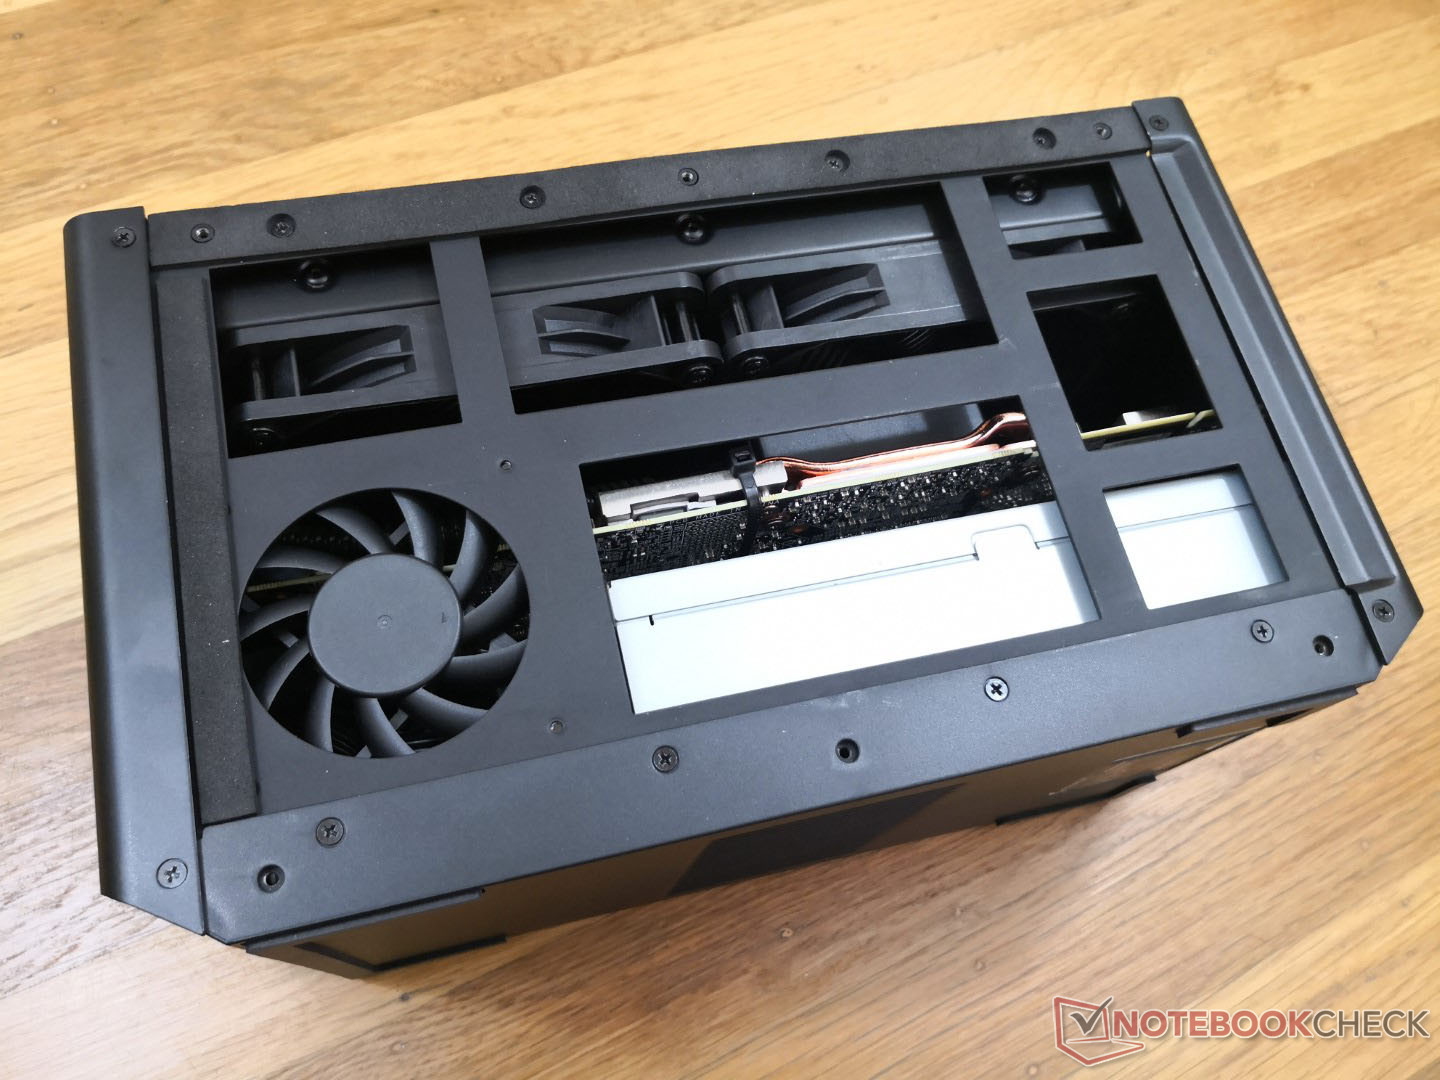
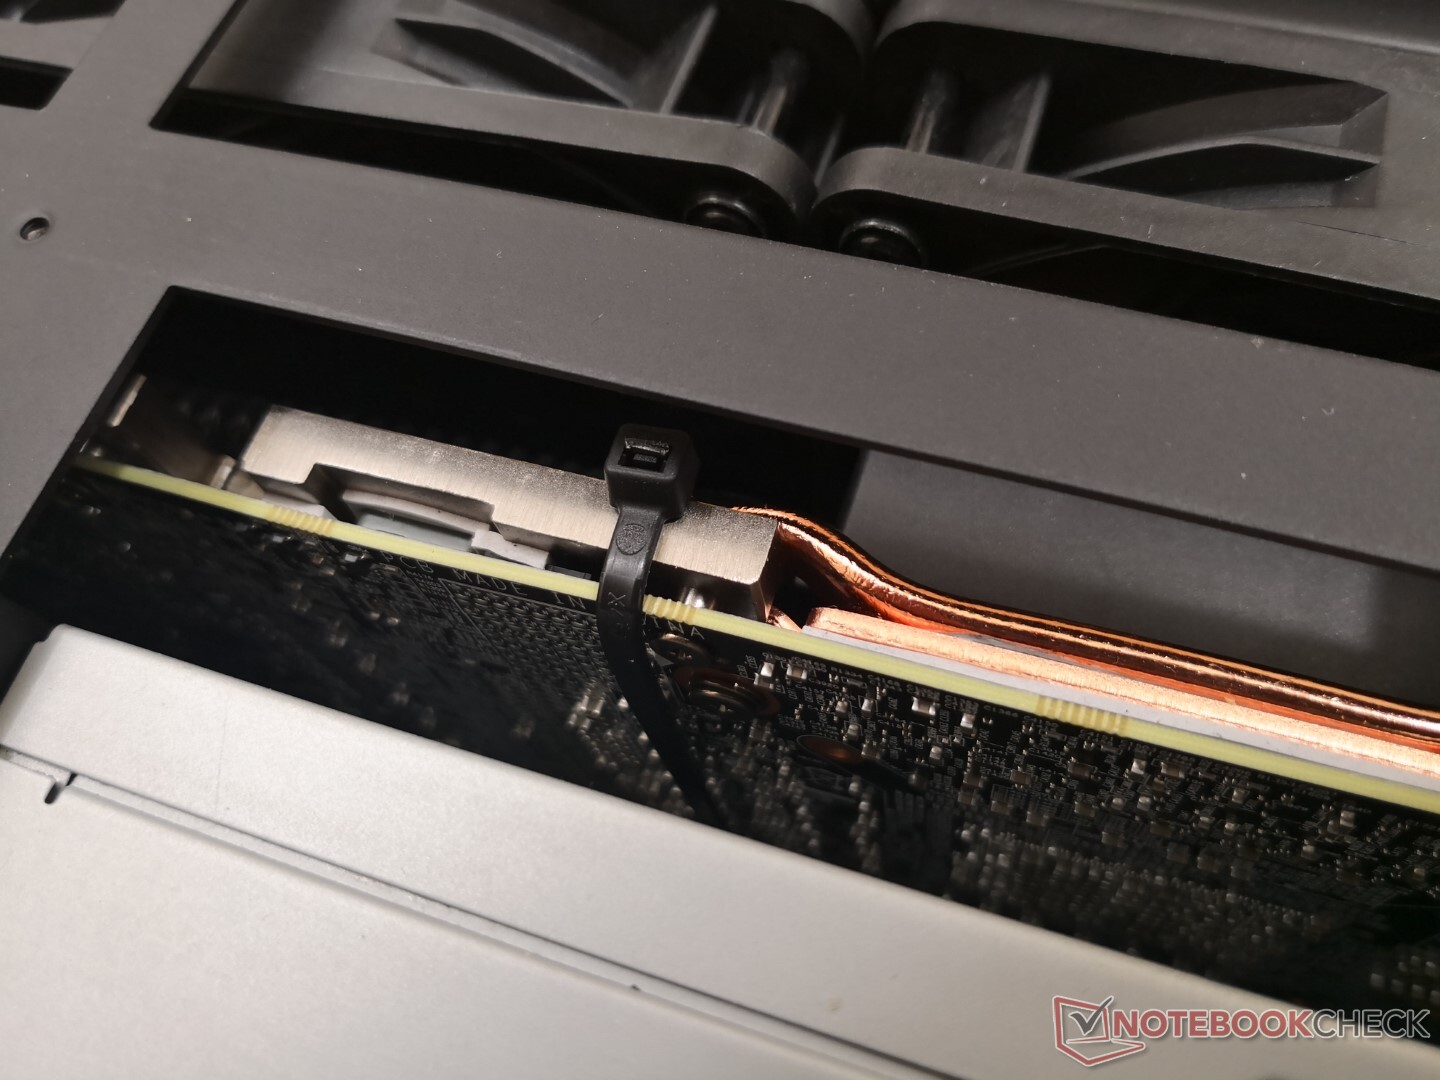
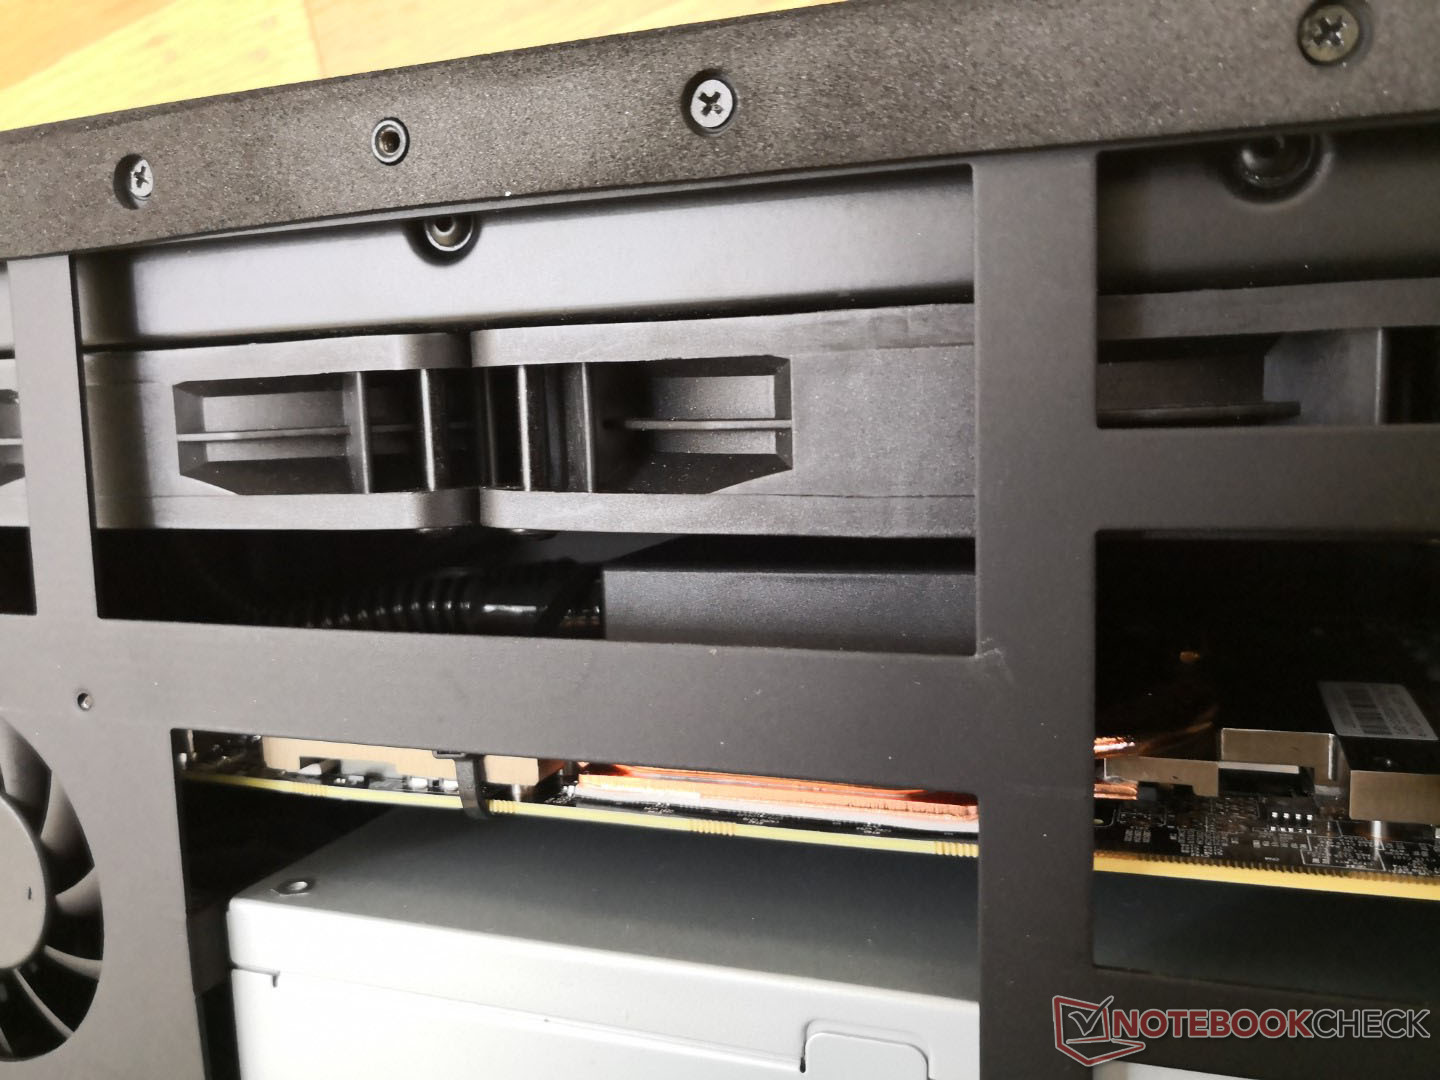
Manutenção
A primeira pergunta que a maioria dos jogadores irá fazer é se a GPU na Caixa de Jogo pode ser removida ou substituída. A resposta curta é sim, mas a resposta longa é mais complicada. A Gigabyte não projetou sua Caixa de Jogo para ser facilmente atualizável, ao contrário do Razer Core X ou Alienware eGPU. Além disso, o aparelho de resfriamento de líquidos foi projetado especificamente para o chassi da Gaming Box, o que significa que os proprietários precisarão modificar suas torres de PC para acomodar o resfriador de líquidos ou instalar suas próprias soluções de resfriamento setransferirem o RTX 2080 Ti para seus desktops. Se a troca de GPU for sua intenção principal, então o Razer ou Alienware mencionado acima seria uma opção melhor, pois seus projetos o incentivam mais ativamente.
Garantia
A Gigabyte oferece garantias de base de 2 e 3 anos para seus periféricos e placas gráficas, respectivamente. Entretanto, não temos certeza se a Caixa de Jogo é classificada como periférico ou placa gráfica e contatamos a Gigabyte para esclarecimento.
Desempenho
Antes de saltarmos para os dados, vale a pena mencionar que tivemos alguns problemas estranhos com nossa unidade, incluindo alguns acidentes ao executar o GTA V e o Far Cry New Dawn. O ruído de bobina ou eletrônico era muito aparente durante as primeiras horas de uso. Isto acabaria diminuindo de intensidade com o tempo, mas nunca desapareceria completamente. Também notamos cliques fracos mas periódicos da PSU interna seguidos de micro gagueira perceptível quando se jogava. Felizmente, uma reinicialização a frio resolveu o problema. No entanto, recomendamos vivamente que os novos proprietários verifiquem estas anormalidades imediatamente após a compra.
Desempenho do sistema
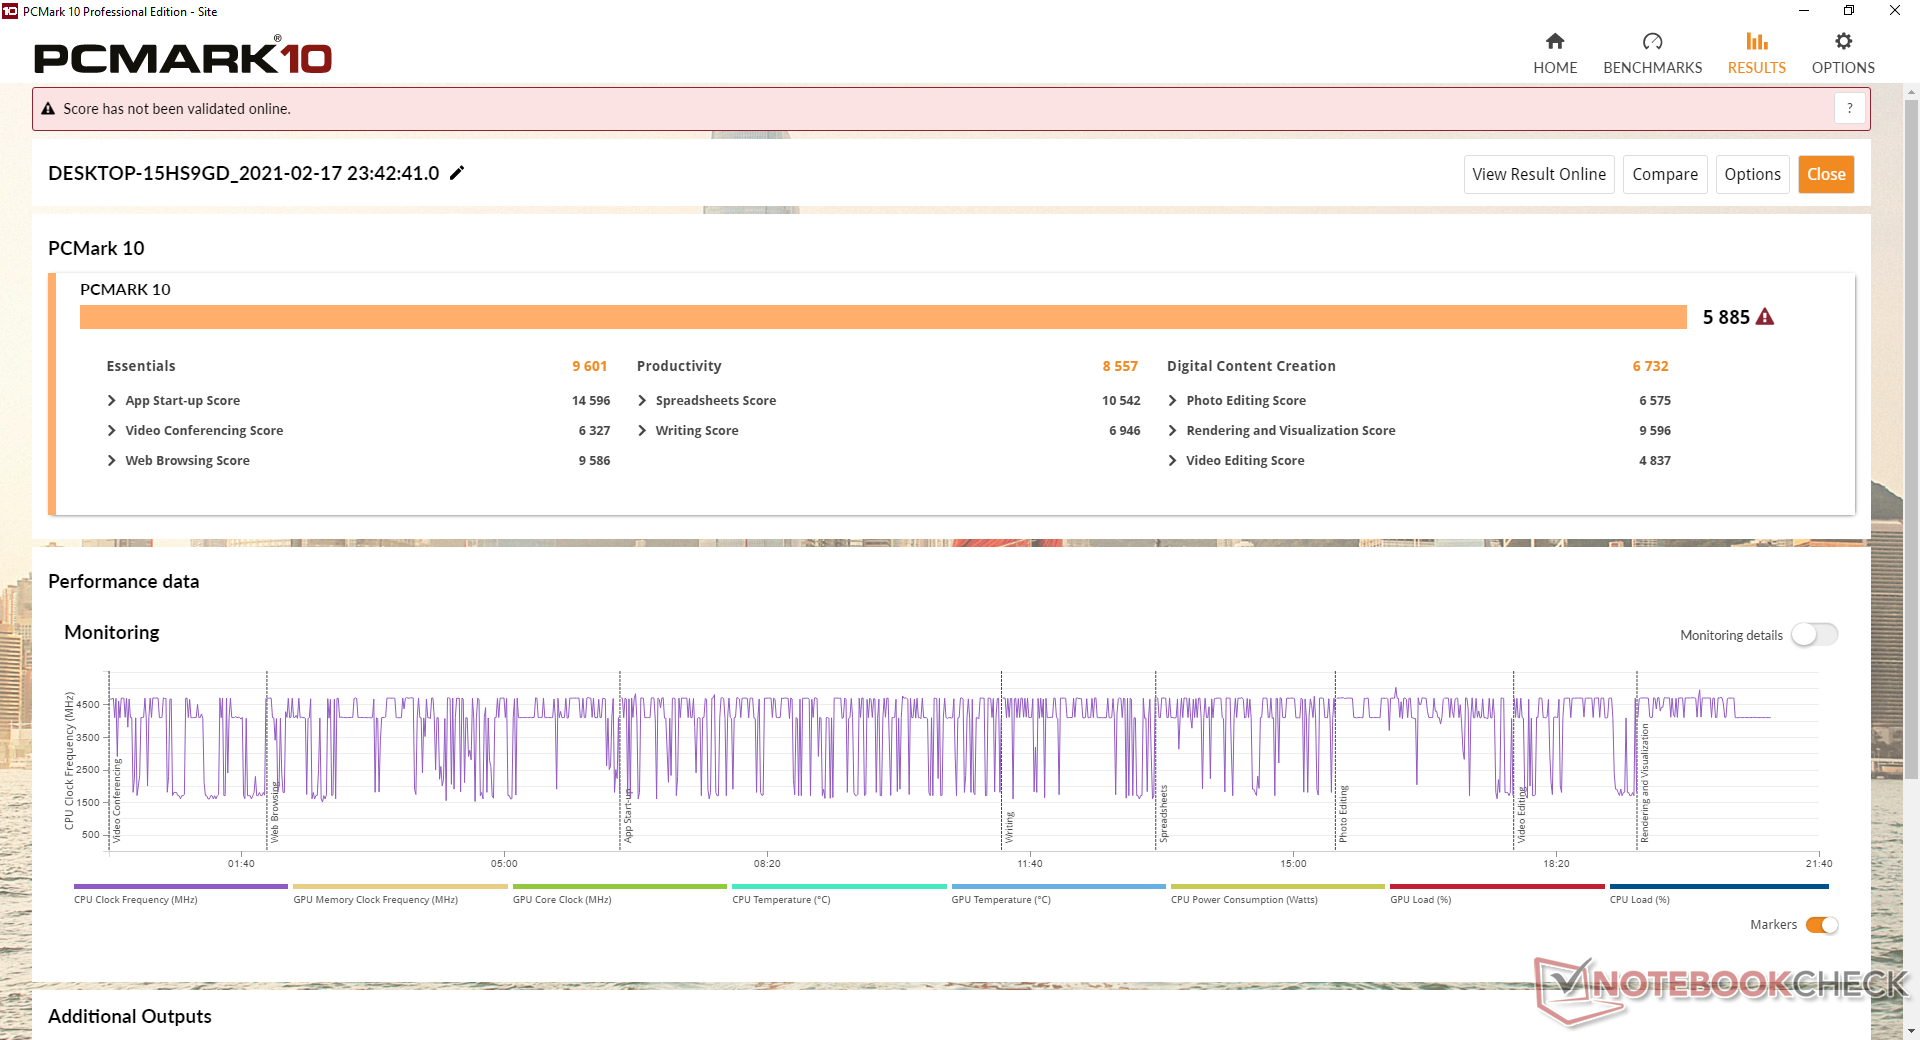
| PCMark 10 Score | 5885 pontos | |
Ajuda | ||
Desempenho da GPU
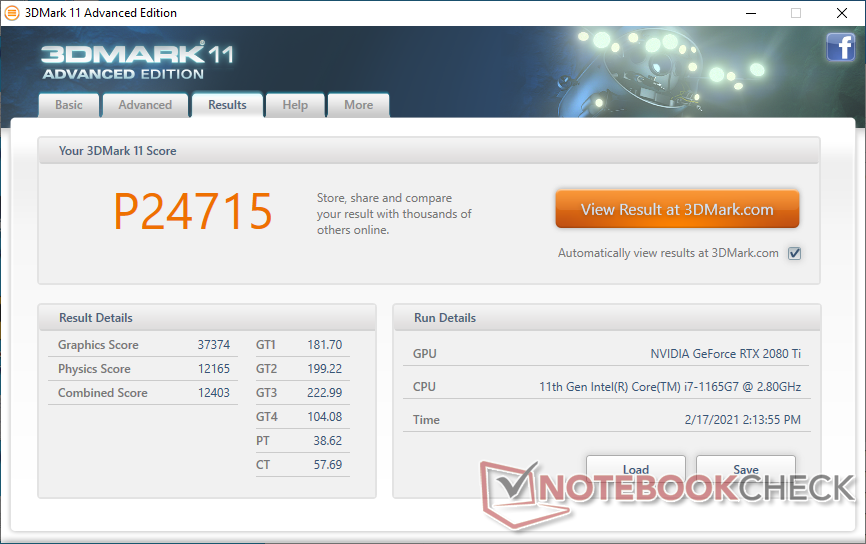
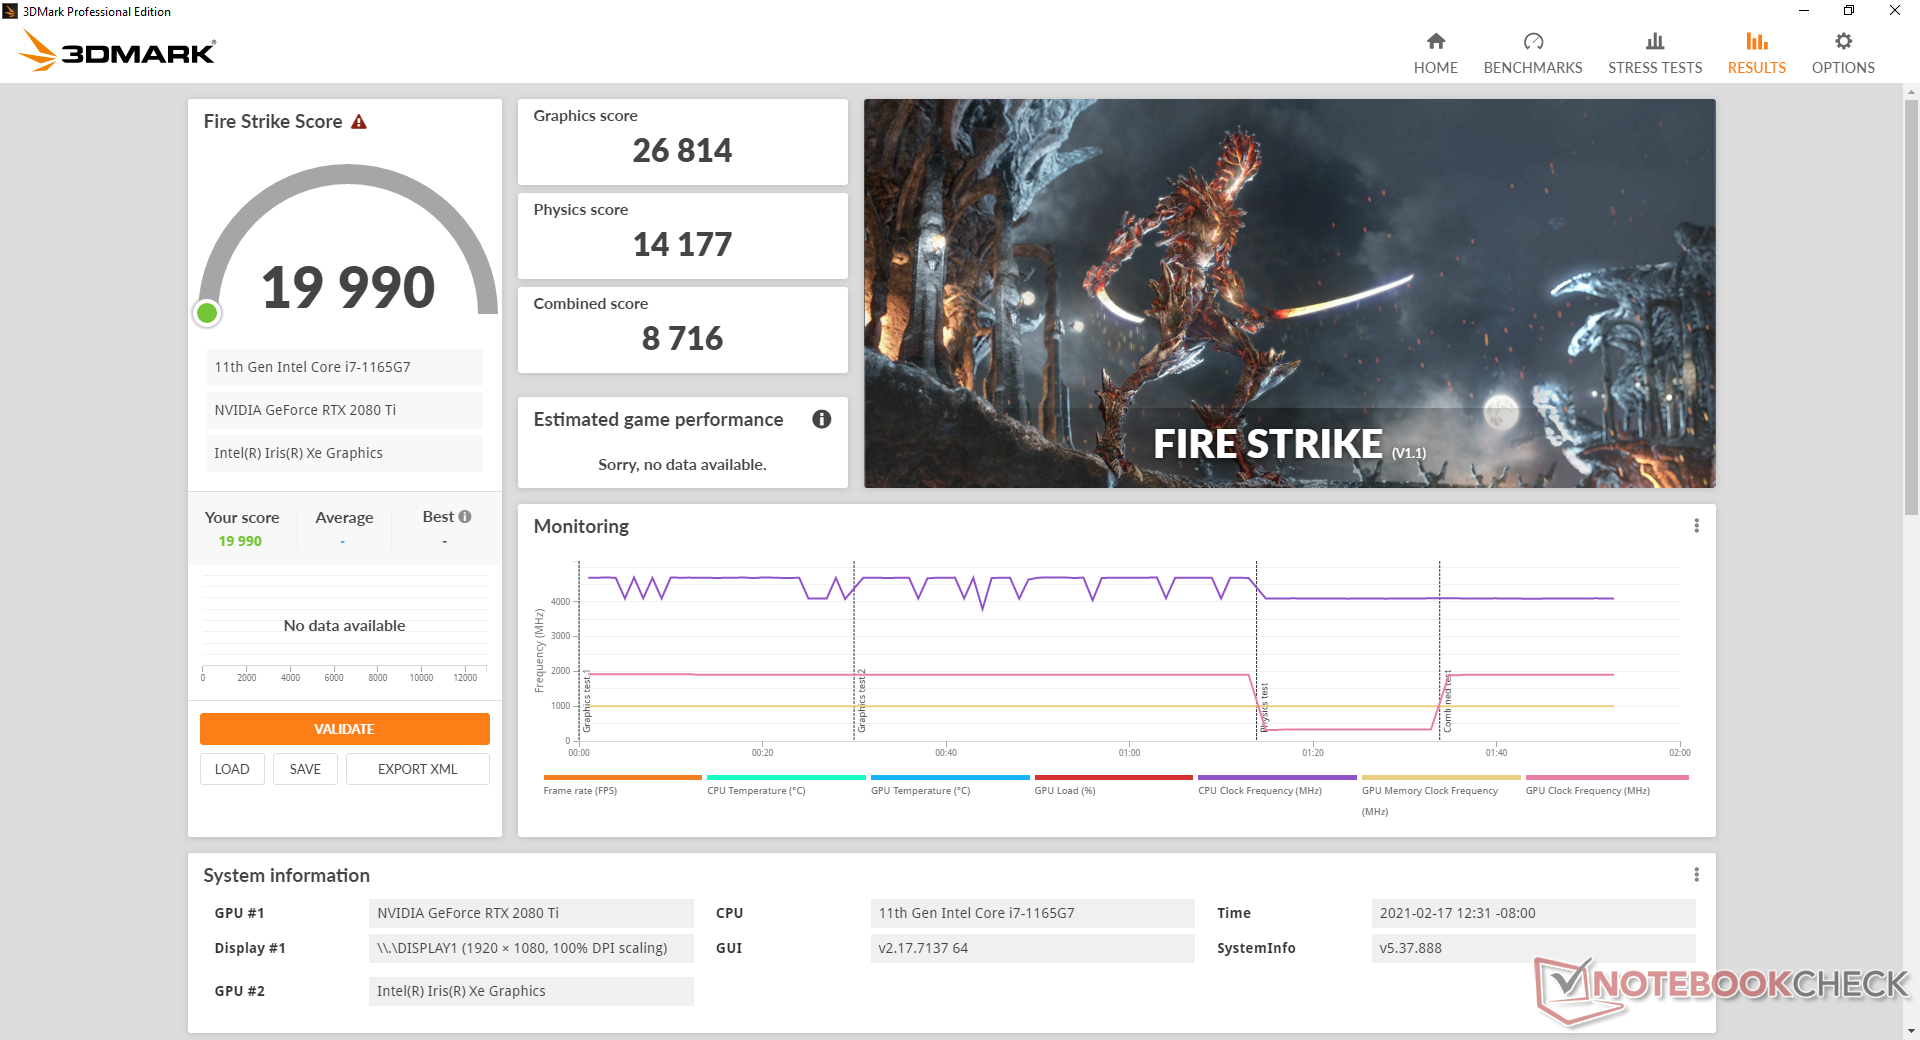
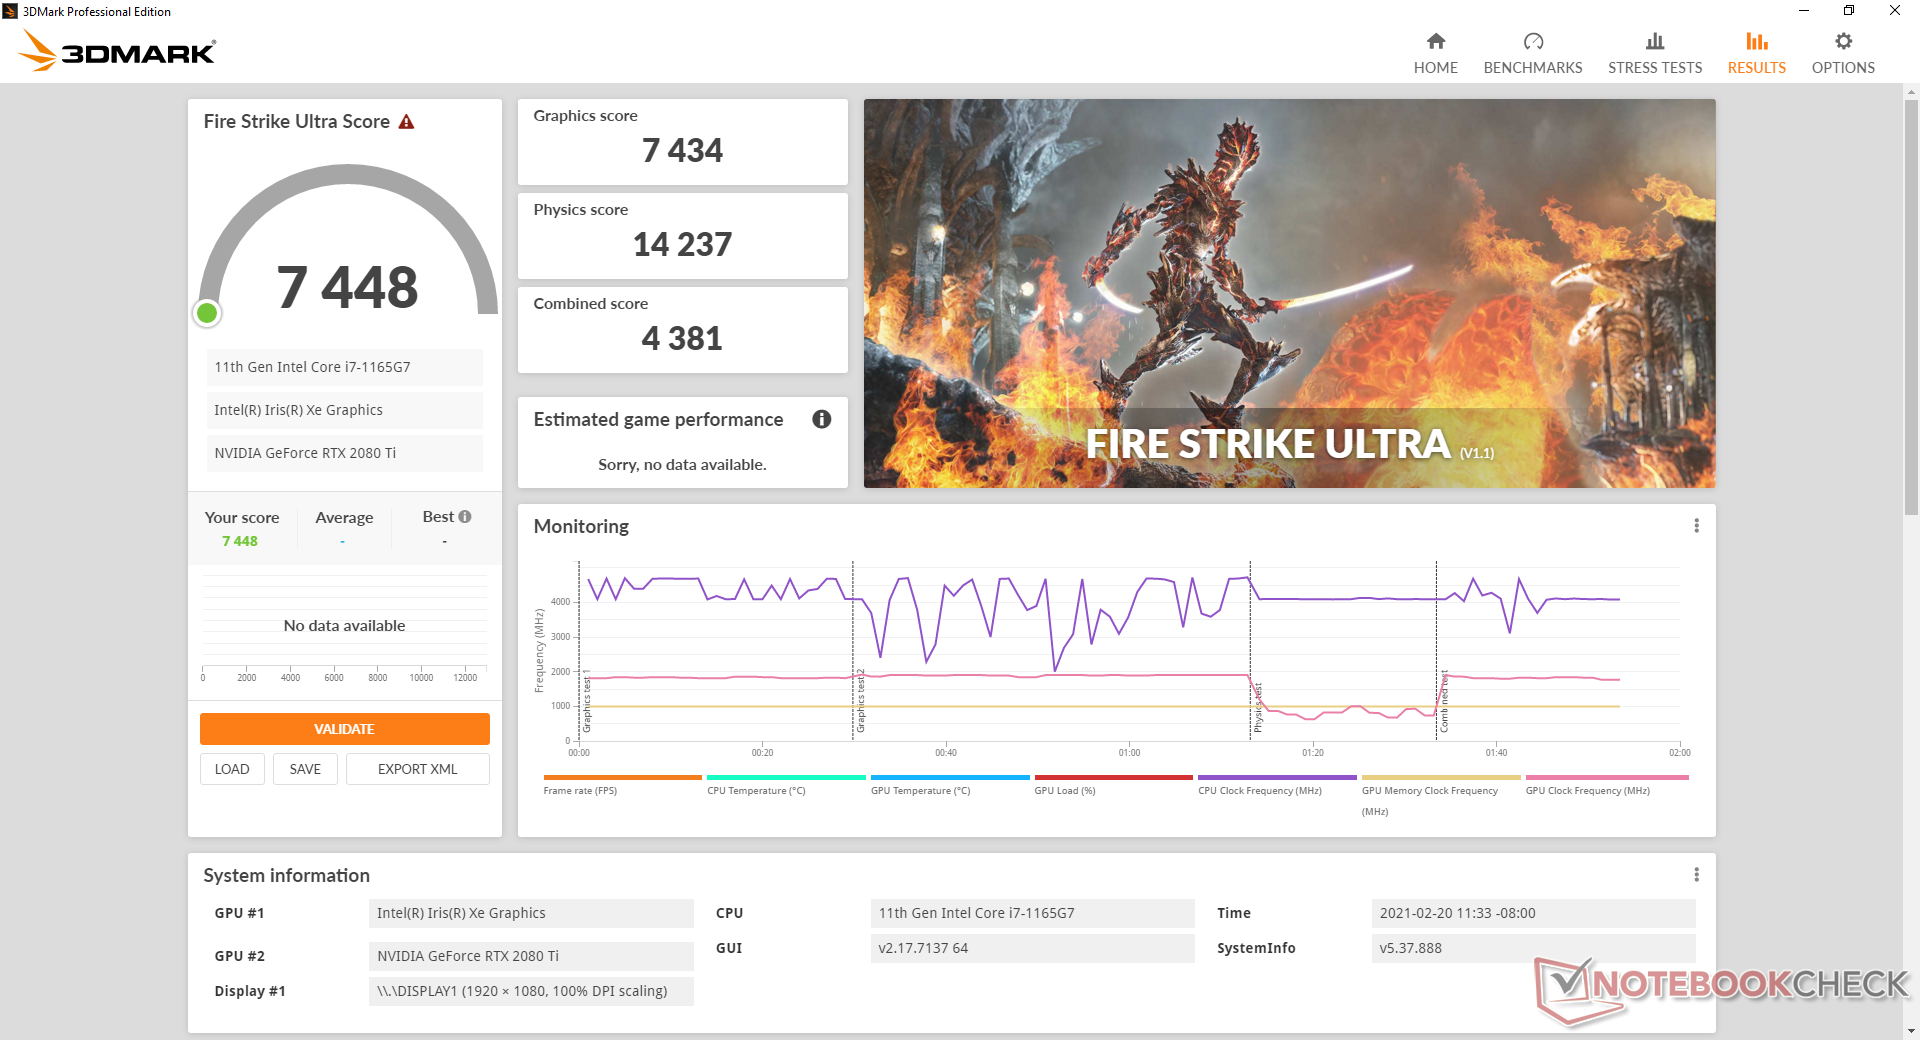
Os resultados da 3DMark estão impressionantemente próximos a um PC desktop com um "próprio" GeForce RTX 2080 Ti. Fire Strike 4K está apenas 7% atrás da referência de nosso PC desktop, enquanto Fire Strike na FHD está 21% atrás para sugerir que o déficit de desempenho contra um PC desktop RTX 2080 Ti será mais estreito quando se joga em resoluções 4K. Estes resultados são consistentes com o que observamos na Caixa de Jogos RTX 2070 dois anos atrás. O potencial gráfico bruto pode variar entre 8 a 30 por cento mais rápido do que um laptop com o não-Max-Q GeForce RTX 2080.
O desempenho gráfico é ainda mais reduzido se o monitor for conectado diretamente ao NUC ao invés do eGPU. A perda de desempenho é novamente maior em resoluções mais baixas, como mostra nossa tabela abaixo.


| Benchmark | DesktopPC GeForce RTX 2080 Ti Referência | AorusGaming Box GeForce RTX 2080 Ti c/ monitor conectado ao eGPU | AorusGaming Box GeForce RTX 2080 Ti c/ monitor conectado ao NUC |
| Fire Strike Pontuação gráfica | 34141 | 26814(-21%) | 23252 (-32%) |
| Fire Strike Ultra Graphics Score | 8226 | 7632(-7%) | 7434 (-10%) |
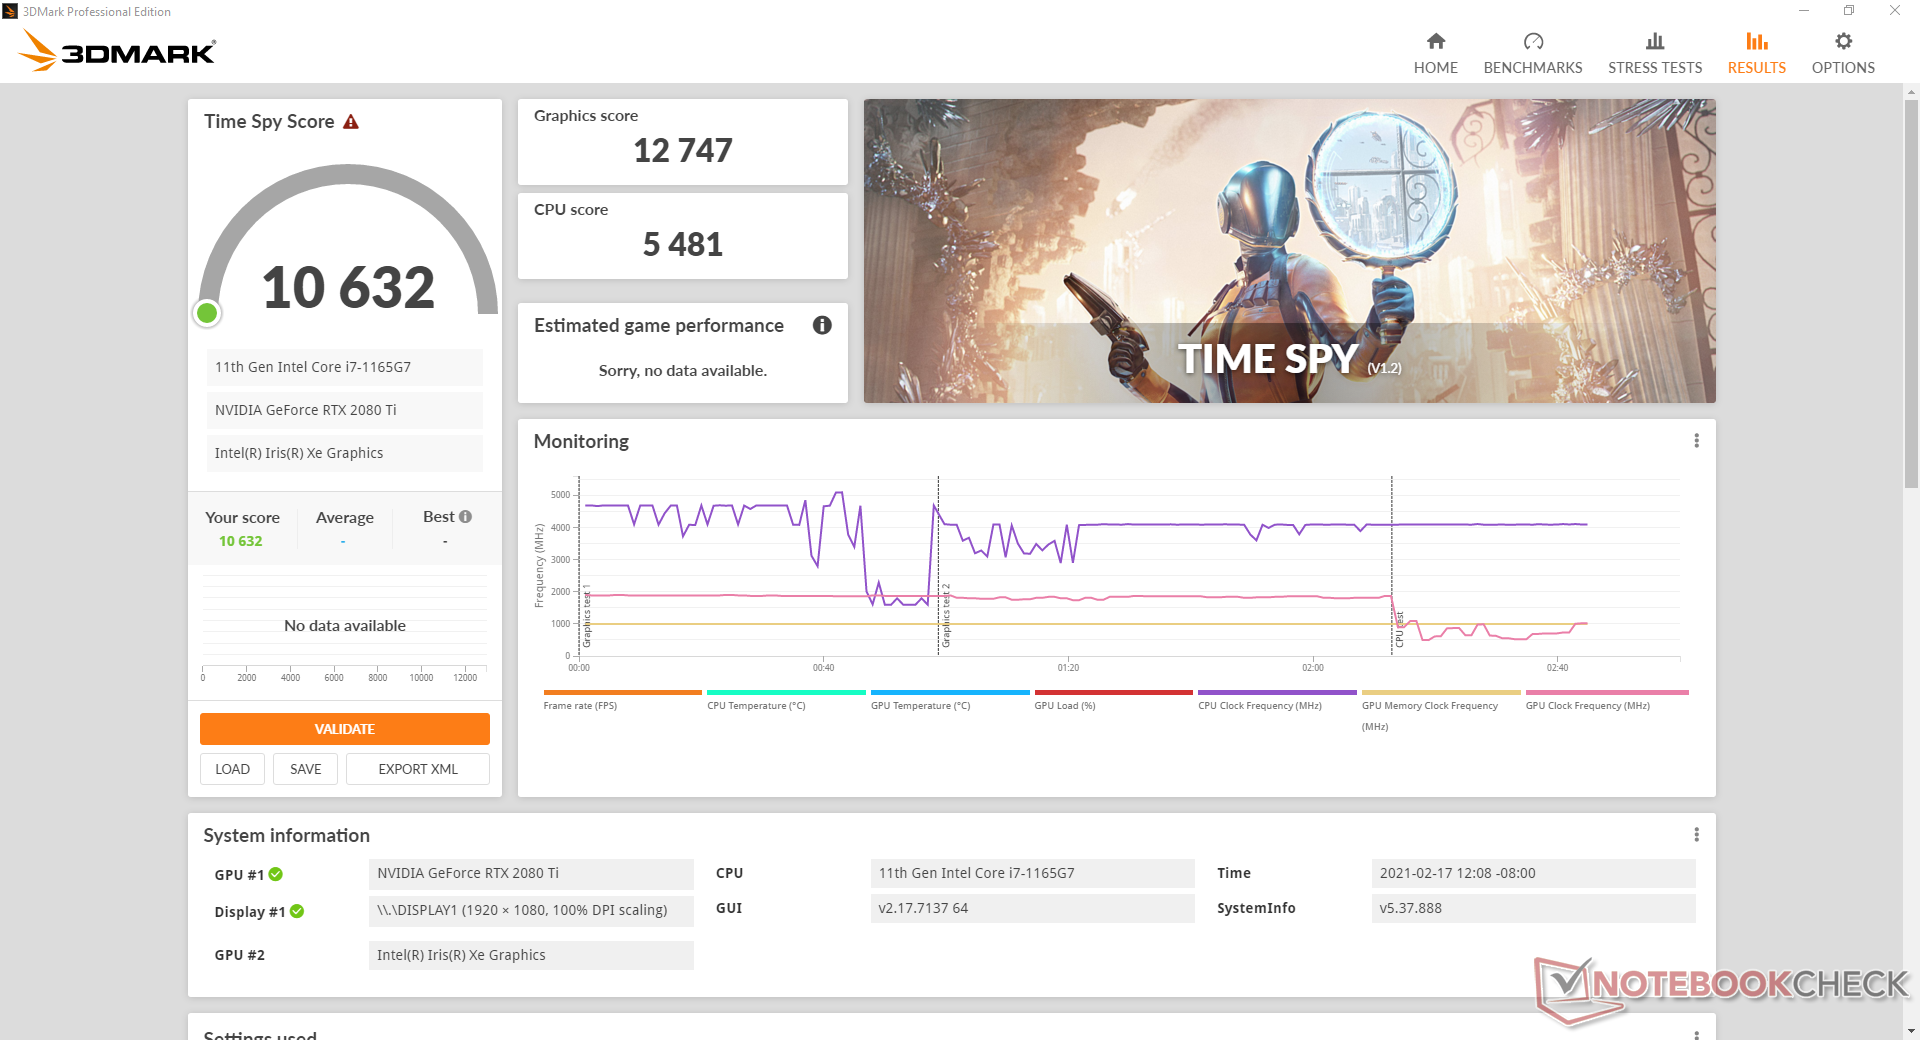
| Time Spy Pontuação Gráfica | 14283 | 12747(-11%) | 11803 (-17%) |
| 3DMark 11 Performance | 24715 pontos | |
| 3DMark Cloud Gate Standard Score | 33660 pontos | |
| 3DMark Fire Strike Score | 19990 pontos | |
| 3DMark Time Spy Score | 10632 pontos | |
Ajuda | ||
Desempenho nos jogos
O desempenho em jogos do mundo real é semelhante ao que os resultados do 3DMark sugerem - as taxas médias de quadros serão muito mais próximas de um desktop RTX 2080 Ti se estiver rodando a 4K do que se estiver rodando a 1080p. A diferença dependerá muito do jogo, no entanto, com títulos pesados comoGuerra Total: Três Reinos rodando até 30% mais lento na configuração de nossa caixa de jogos, comparado a apenas 7% quando rodando Final FantasyXV. Mesmo assim, a maioria dos títulos modernos pode manter um 4K 60 FPS bloqueado em configurações Médias, o que é impressionante para um Core U-series Intel NUC.
| baixo | média | alto | ultra | QHD | 4K | |
|---|---|---|---|---|---|---|
| GTA V (2015) | 173 | 167 | 146 | 81 | 105 | |
| The Witcher 3 (2015) | 292.2 | 196.6 | 145.1 | 80.1 | 83.1 | |
| Dota 2 Reborn (2015) | 126 | 127 | 122 | 118 | 114 | |
| Final Fantasy XV Benchmark (2018) | 152 | 131 | 101 | 83.2 | 53.5 | |
| X-Plane 11.11 (2018) | 95.7 | 88.7 | 73.8 | 74.1 | ||
| Strange Brigade (2018) | 196 | 155 | 152 | 151 | 133 | 90.8 |
| Shadow of the Tomb Raider (2018) | 107 | 94 | 93 | 91 | 85 | 60 |
| Far Cry New Dawn (2019) | 113 | 97 | 93 | 84 | 81 | 65 |
| Total War: Three Kingdoms (2019) | 246.4 | 143.7 | 99.4 | 76.9 | 56.7 | 32.1 |
| F1 2020 (2020) | 188 | 157 | 147 | 116 | 103 | 74 |
Emissions
Ruído do sistema
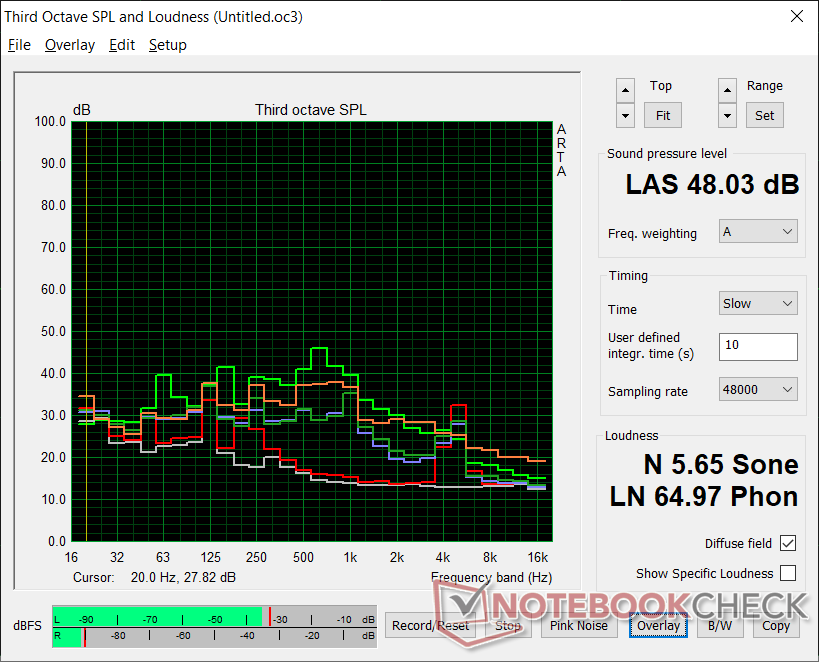
Nossa unidade de teste exibe um chorrilho pesado de bobina de cerca de 5K Hz, desde que permaneça conectado a uma tomada CA. É muito perceptível a 34,7 dB(A) contra um fundo silencioso de 26,5 dB(A). O ruído do ventilador aumentaria para 44 dB(A) quando se joga ou 48 dB(A) quando menos de 100% de utilização. O lamuriar da bobina, entretanto, permaneceria incômodo. Os ventiladores em laptops para jogos são geralmente mais notados porque são menores e, portanto, mais agudos, mas é difícil ignorar a questão do choramingar da bobina em nossa caixa de jogos.
| Aorus Gaming Box GeForce RTX 2080 Ti , i7-1165G7 | MSI GT76 Titan DT 10SGS GeForce RTX 2080 Super Mobile, i9-10900K, 2x WDC PC SN730 SDBPNTY-1T00 (RAID 0) | Alienware m17 R3 P45E GeForce RTX 2080 Super Mobile, i9-10980HK, 2x Micron 2200S 512 GB (RAID 0) | Asus ROG Zephyrus Duo 15 SE GX551QS GeForce RTX 3080 Laptop GPU, R9 5900HX, 2x Samsung PM981a MZVLB1T0HBLR (RAID 0) | Asus ROG Strix G15 G513QR GeForce RTX 3070 Laptop GPU, R9 5900HX, SK Hynix HFM001TD3JX013N | Intel NUC11PAQi7 Iris Xe G7 96EUs, i7-1165G7, Samsung SSD 980 Pro 500GB MZ-V8P500BW | |
|---|---|---|---|---|---|---|
| Noise | 3% | 1% | 13% | 7% | 18% | |
| desligado / ambiente * (dB) | 26.5 | 26.4 -0% | 26.5 -0% | 27 -2% | 24 9% | 25.6 3% |
| Idle Minimum * (dB) | 34.7 | 27.5 21% | 27.8 20% | 27 22% | 25 28% | 25.6 26% |
| Idle Average * (dB) | 39.1 | 27.5 30% | 27.8 29% | 27 31% | 31 21% | 25.6 35% |
| Idle Maximum * (dB) | 39.1 | 29.8 24% | 27.8 29% | 27 31% | 33 16% | 25.6 35% |
| Load Average * (dB) | 39.5 | 30.9 22% | 52.1 -32% | 31.2 21% | 45 -14% | 33.6 15% |
| Witcher 3 ultra * (dB) | 43.7 | 60.7 -39% | 51.8 -19% | 44.5 -2% | 48 -10% | 33.6 23% |
| Load Maximum * (dB) | 48 | 66.6 -39% | 59.1 -23% | 53.5 -11% | 50 -4% | 54.5 -14% |
* ... menor é melhor
Barulho
| Ocioso |
| 34.7 / 39.1 / 39.1 dB |
| Carga |
| 39.5 / 48 dB |
 | ||
30 dB silencioso 40 dB(A) audível 50 dB(A) ruidosamente alto |
||
min: | ||
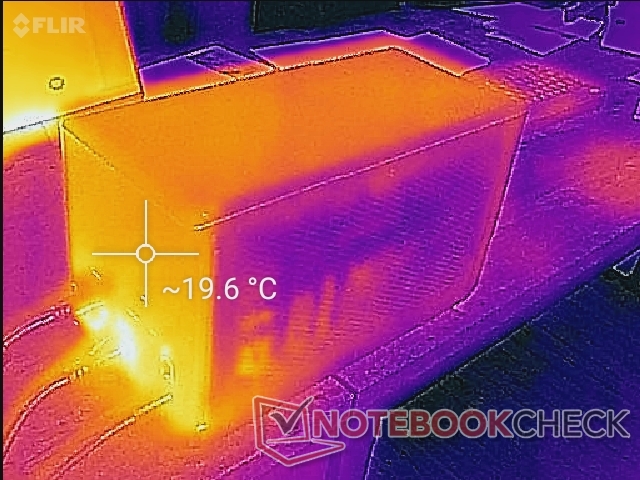
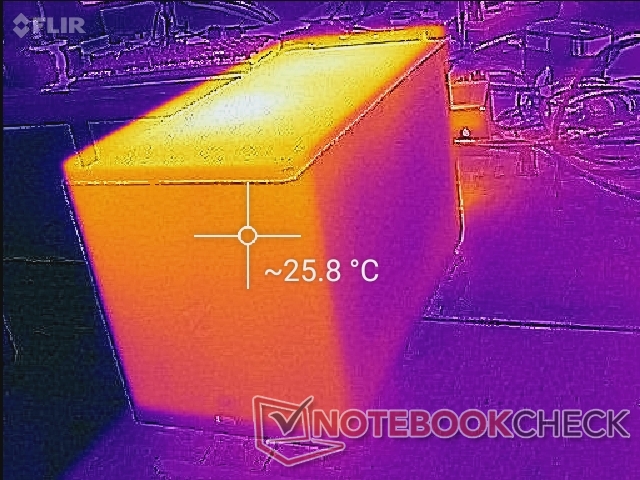
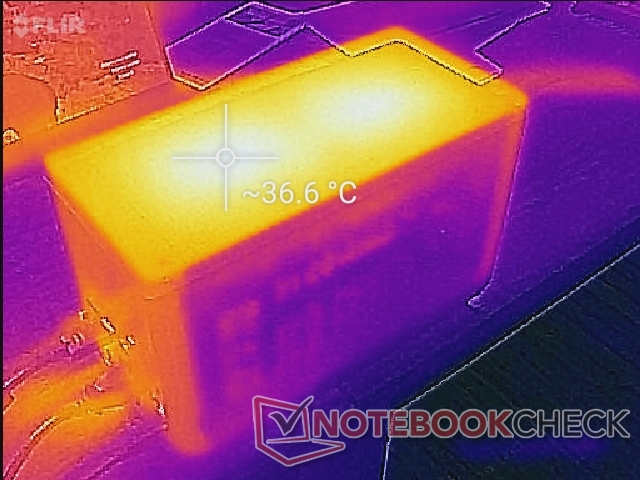
Temperatura
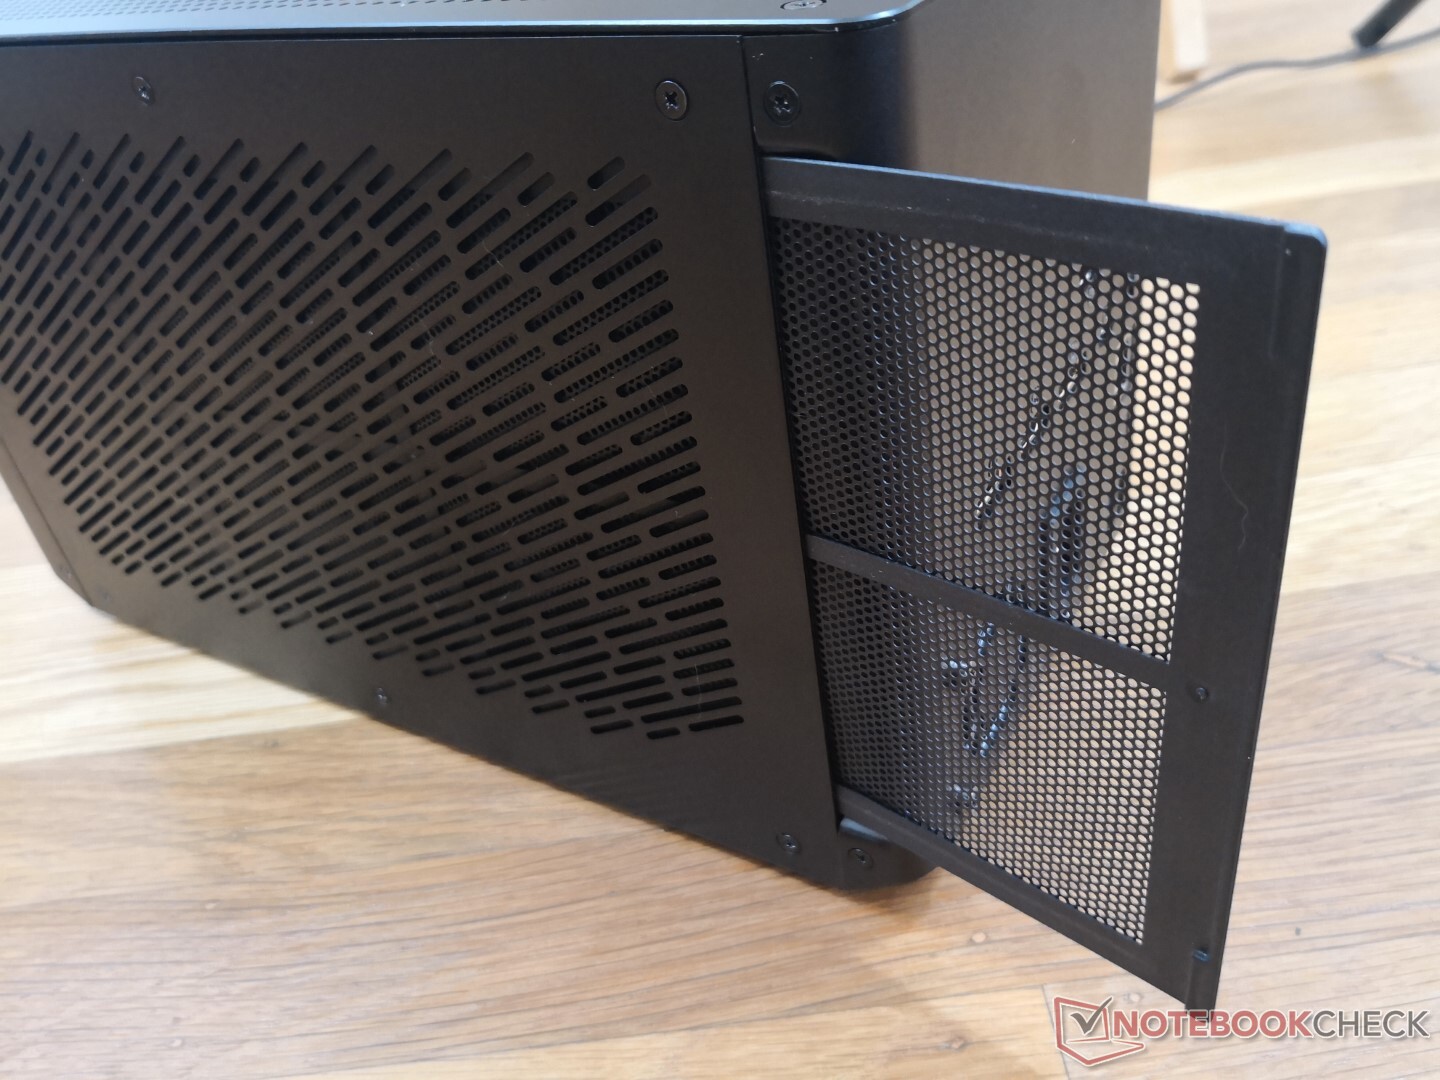
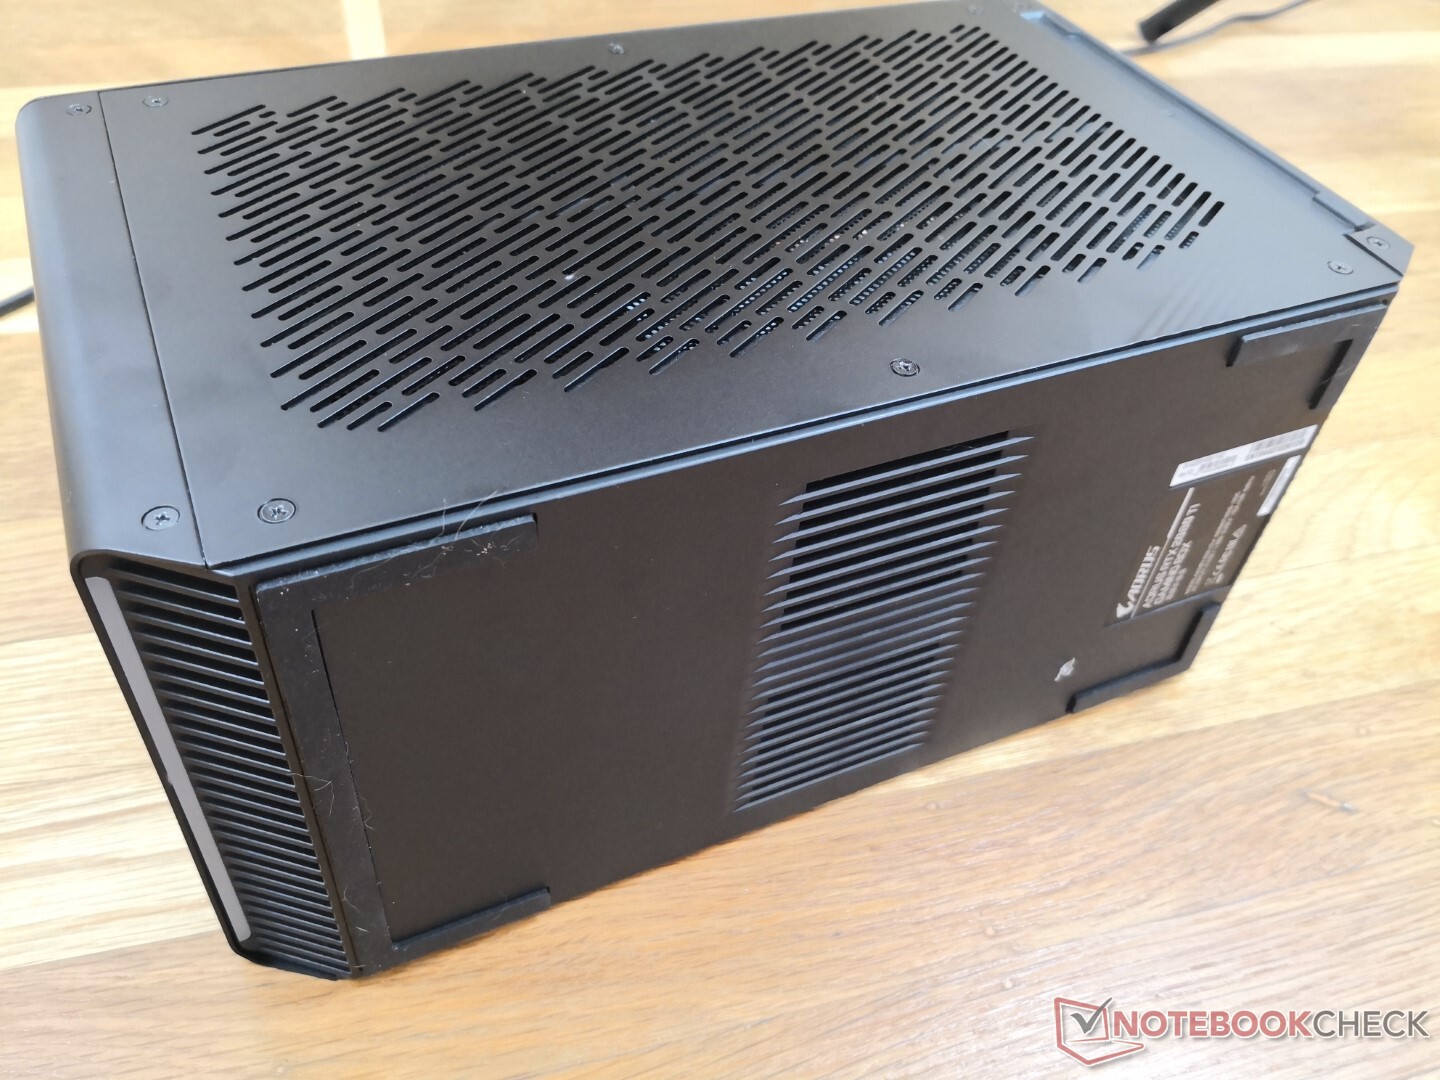
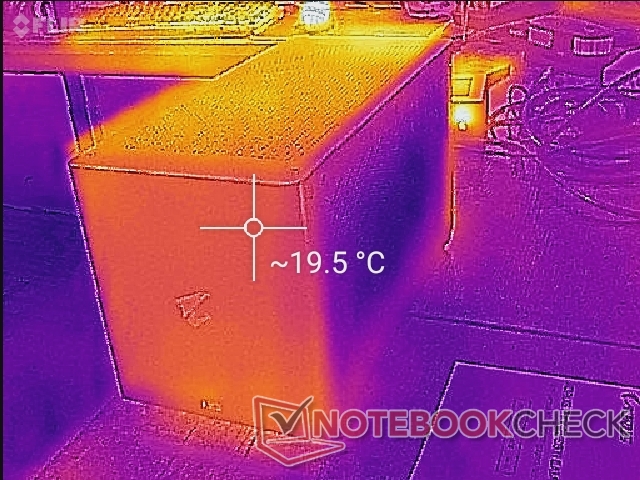
O ar frio entra por três lados enquanto as grelhas no topo servem de escape. Assim, não é recomendado colocar nenhum item em cima da caixa de jogo ou orientá-la em seus lados, caso contrário, o resfriamento será dificultado.
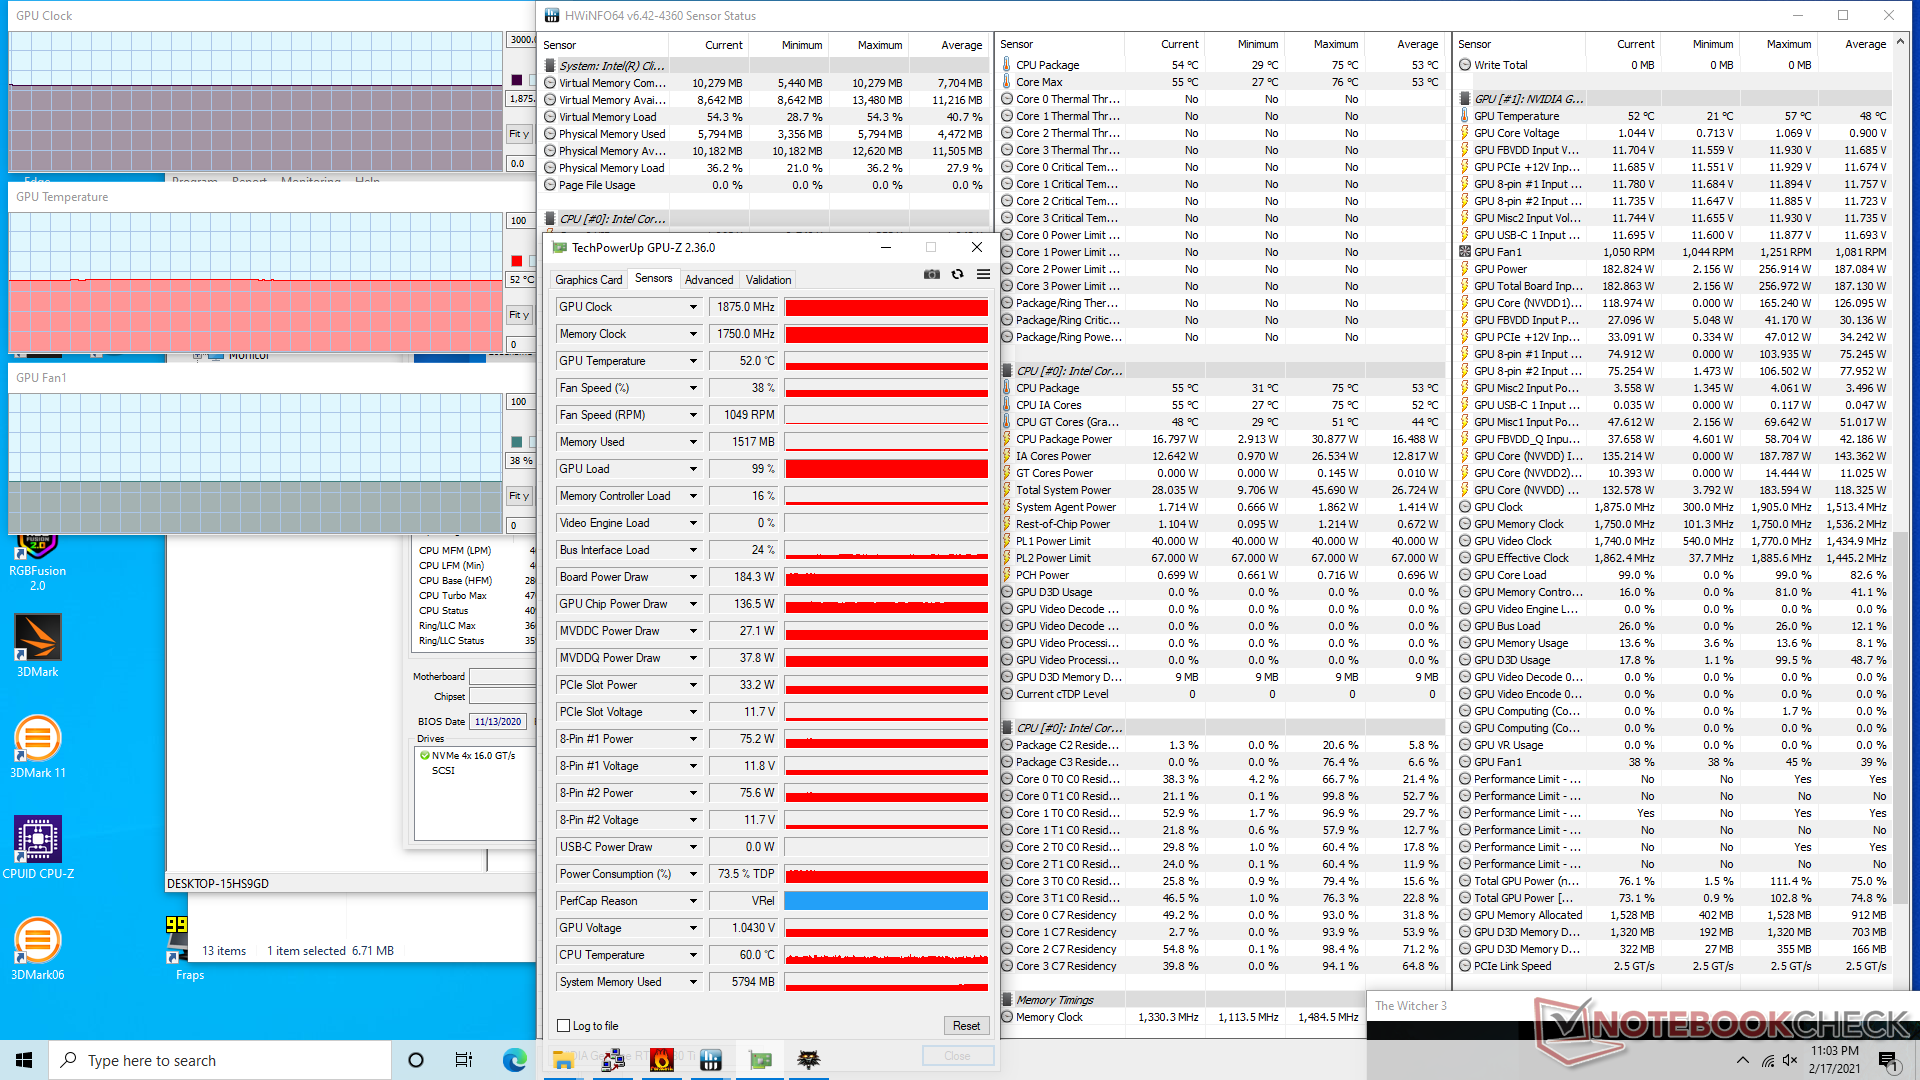
Teste de estresse
Em funcionamento Witcher 3 resulta em um relógio GPU estável e uma temperatura de 1875 MHz e 52 C, respectivamente. A temperatura central se elevaria a pouco menos de 60 C, mesmo quando a utilização do FurMark é inferior a 100%.
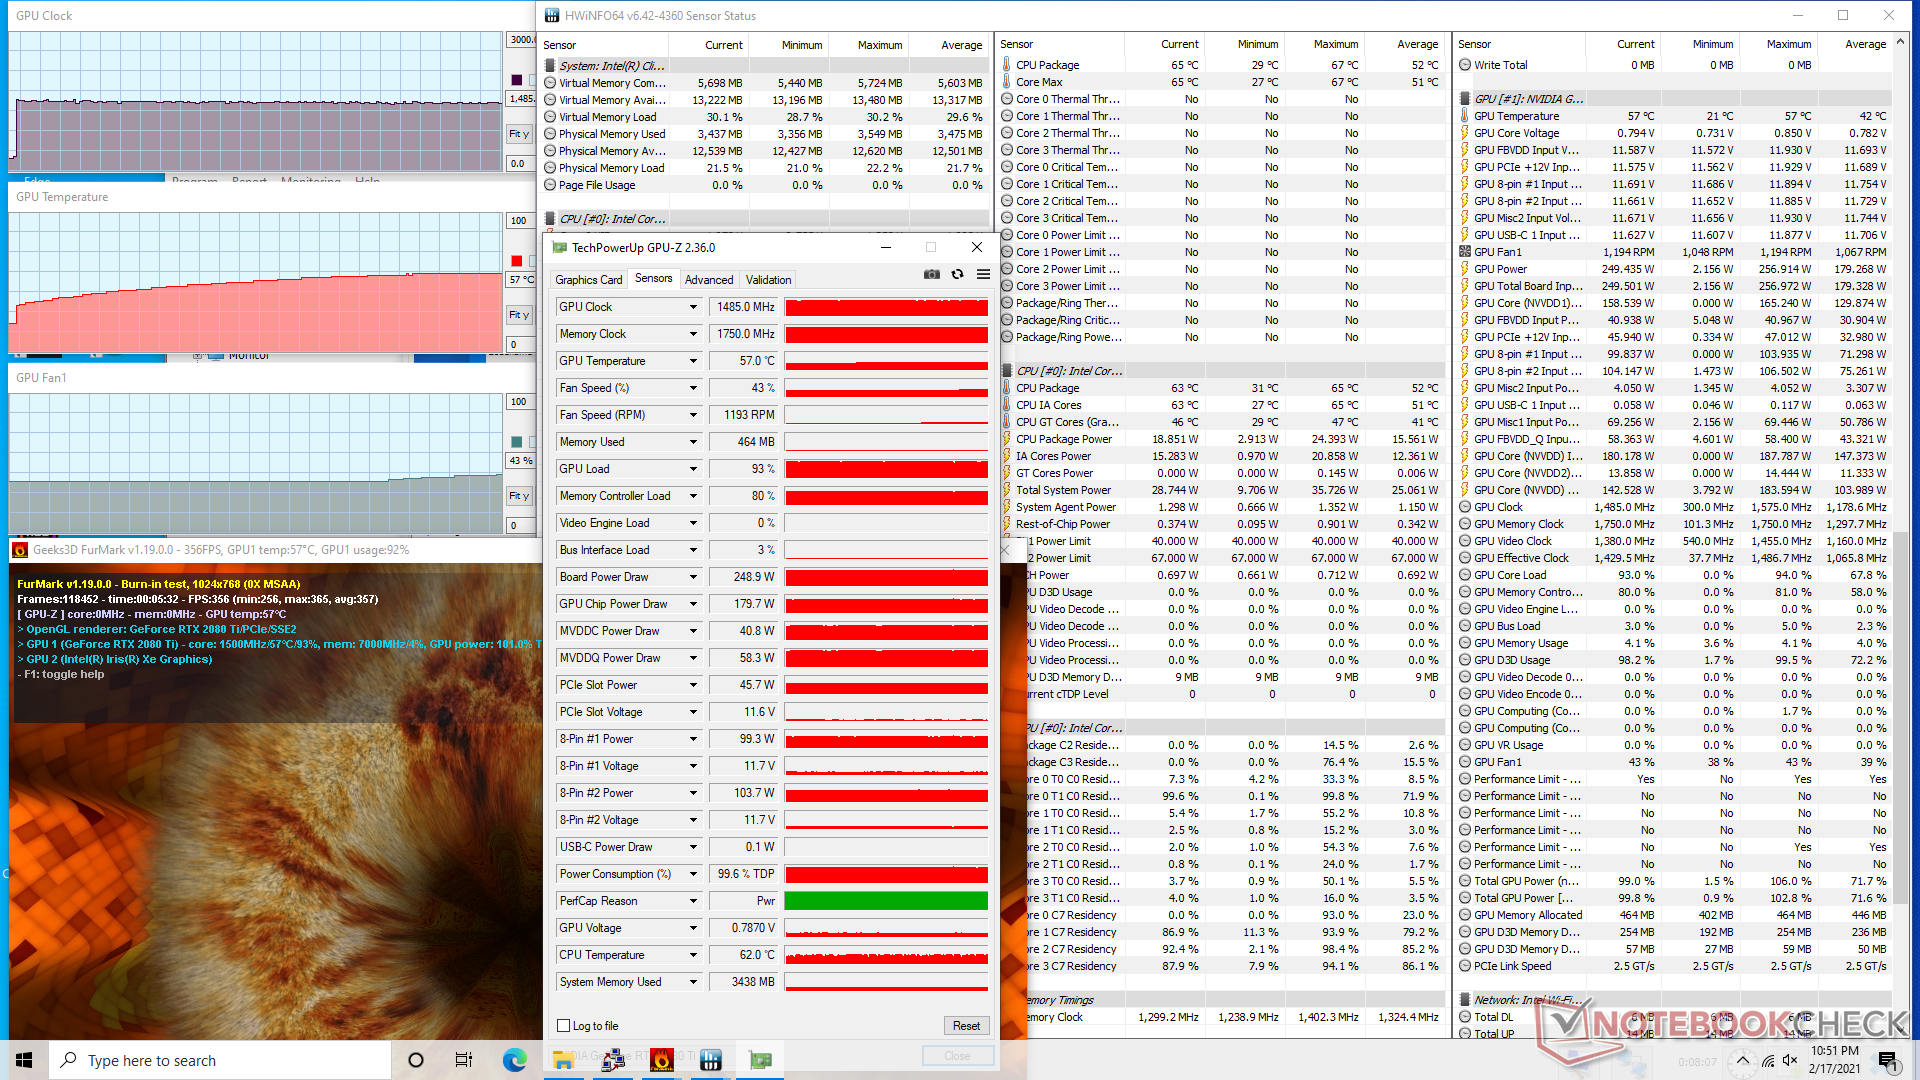
| RelógioCPU (GHz) | RelógioGPU (MHz) | Temperaturamédiada CPU (°C) | Temperaturamédiada GPU (°C) | |
| System Idle | -- | --34 | 21 | |
| FurMark Stress | -- | 1485 | 62 | 57 |
| Witcher 3 Stress | -- | 1875 | 60 | 52 |
Energy Management
Consumo de energia
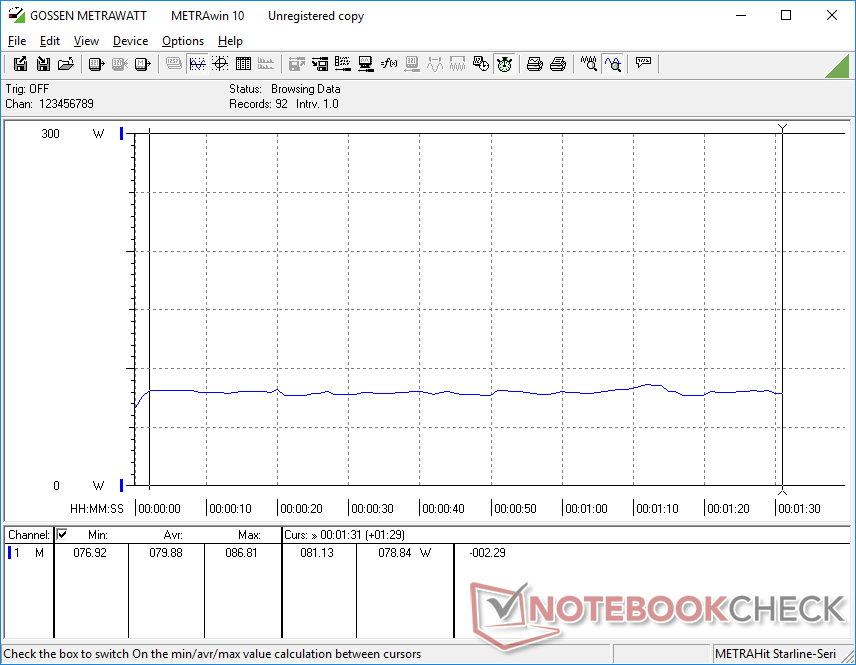
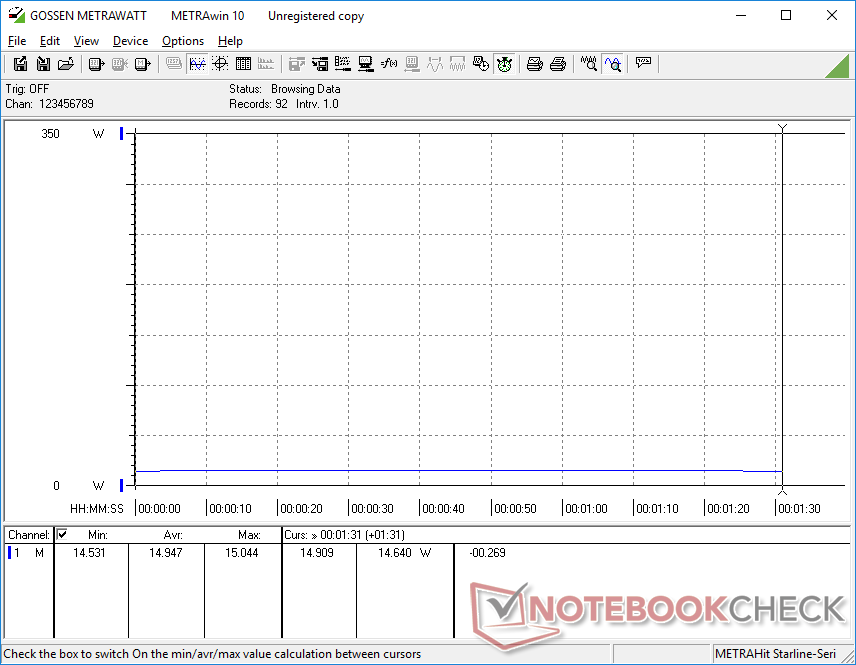
A caixa de jogos consome 29,6 W quando ocioso na área de trabalho. Se o PC estiver dormindo ou desligado, o eGPU continuará consumindo 27 W e 14,9 W, respectivamente. O fato de não haver botão de "desligar" na Caixa de Jogos é muito frustrante, especialmente porque a bobina continua sendo audível, mesmo quando o PC principal está desligado.
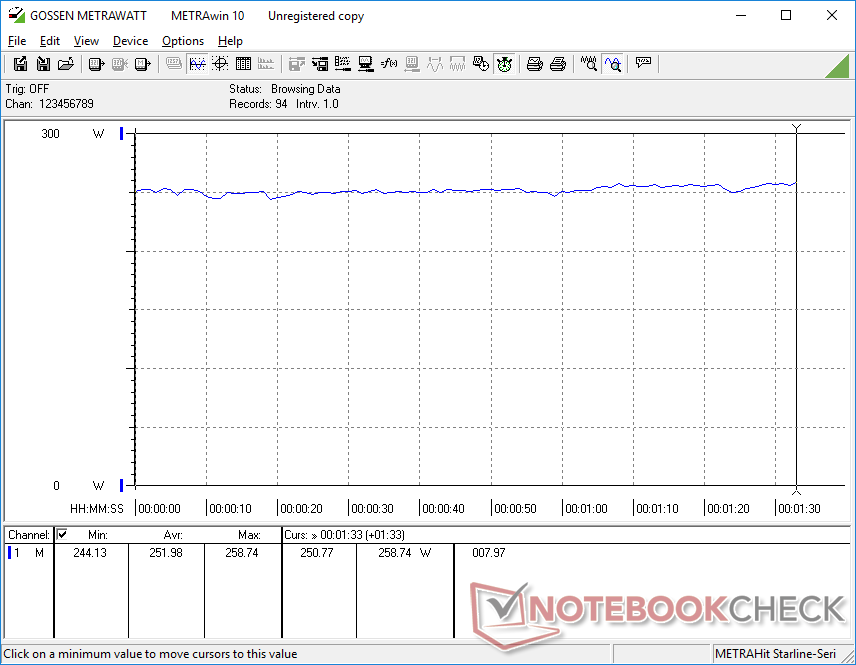
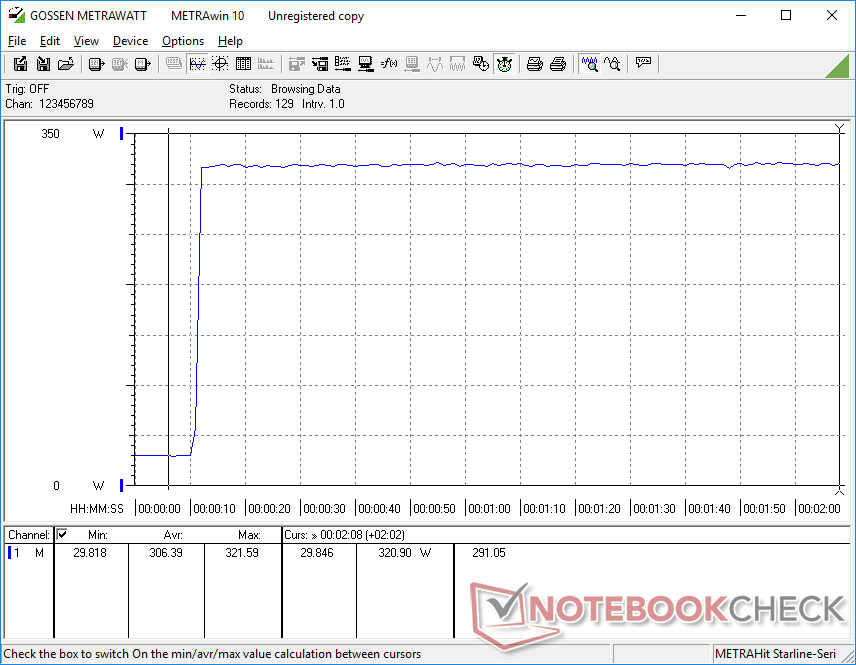
Em funcionamento Witcher 3 consome significativamente mais energia do que a maioria dos computadores portáteis para jogos GeForce RTX 20 ou RTX 30. Só a Caixa de Jogos tiraria 252 W mais aproximadamente 30 W da NUC para um total de ~282 W em comparação com apenas 181 W na tela dupla Asus ROG Zephyrus Duo SE com o RTX 3080.
| desligado | |
| Ocioso | |
| Carga |
|
Key:
min: | |
| Aorus Gaming Box GeForce RTX 2080 Ti i7-1165G7, , , , x, | MSI GT76 Titan DT 10SGS i9-10900K, GeForce RTX 2080 Super Mobile, 2x WDC PC SN730 SDBPNTY-1T00 (RAID 0), IPS, 3840x2160, 17.3" | Alienware m17 R3 P45E i9-10980HK, GeForce RTX 2080 Super Mobile, 2x Micron 2200S 512 GB (RAID 0), IPS, 1920x1080, 17.3" | Asus ROG Zephyrus Duo 15 SE GX551QS R9 5900HX, GeForce RTX 3080 Laptop GPU, 2x Samsung PM981a MZVLB1T0HBLR (RAID 0), IPS, 3840x2160, 15.6" | Asus ROG Strix G15 G513QR R9 5900HX, GeForce RTX 3070 Laptop GPU, SK Hynix HFM001TD3JX013N, IPS, 1920x1080, 15.6" | Intel NUC11PAQi7 i7-1165G7, Iris Xe G7 96EUs, Samsung SSD 980 Pro 500GB MZ-V8P500BW, , x, | |
|---|---|---|---|---|---|---|
| Power Consumption | -36% | -38% | 9% | 22% | 77% | |
| Idle Minimum * (Watt) | 29.6 | 25.9 13% | 33.6 -14% | 16.3 45% | 4 86% | 5.6 81% |
| Idle Average * (Watt) | 29.6 | 38 -28% | 43.9 -48% | 22.5 24% | 9 70% | 5.6 81% |
| Idle Maximum * (Watt) | 29.6 | 53.2 -80% | 59 -99% | 39.9 -35% | 36 -22% | 6 80% |
| Load Average * (Watt) | 79.9 | 123.8 -55% | 134.9 -69% | 116.1 -45% | 130 -63% | 31.4 61% |
| Witcher 3 ultra * (Watt) | 252 | 312.5 -24% | 242 4% | 181.2 28% | 174 31% | 39 85% |
| Load Maximum * (Watt) | 319.8 | 459.8 -44% | 320 -0% | 196.7 38% | 227 29% | 80.5 75% |
* ... menor é melhor
Pro
Contra
Veredicto
Os dados falam por si mesmos. O desempenho é notavelmente próximo a um PC desktop alimentado pelo mesmo GeForce RTX 2080 Ti. A diferença aumenta se jogar a 1080p, onde as taxas de quadros mais altas são obstruídas pelo PCIe x4 Thunderbolt 3 pistas estreitas e CPU série U mais fraca. Os proprietários são encorajados a jogar com resolução de 4K para obter o máximo da Caixa de Jogo.
O desempenho é extraordinário ao ponto de poder melhor até mesmo o mais recente GeForce RTX 2080 ou 3080 laptops para jogos. Entretanto, os proprietários devem estar atentos a alguns bugs de software e às peculiaridades da bobina ao longo do caminho.
A portabilidade e o tamanho pequeno da Caixa de Jogo são dignos de menção, especialmente quando comparados com as alternativas maiores do Razer ou Alienware. No entanto, o preço a pagar é uma GPU que é mais difícil de remover ou atualizar. O software também poderia usar um facelift, pois sua interface de usuário parece um produto inacabado.
Não podemos ignorar o choramingar proeminente da bobina ou o ruído eletrônico de nossa unidade de teste que os novos proprietários devem absolutamente verificar. Há definitivamente espaço para melhorias em relação ao consumo de energia quando a caixa de jogos está ociosa sem atividade de PC.
Preço e disponibilidade
A Gigabyte Aorus Gaming Box está agora disponível em Newegg por mais de $2300 USD no momento em que foi escrito. Os suprimentos são baixos, no entanto, o que significa que a disponibilidade e os preços continuarão a flutuar nos próximos meses
Price comparison

