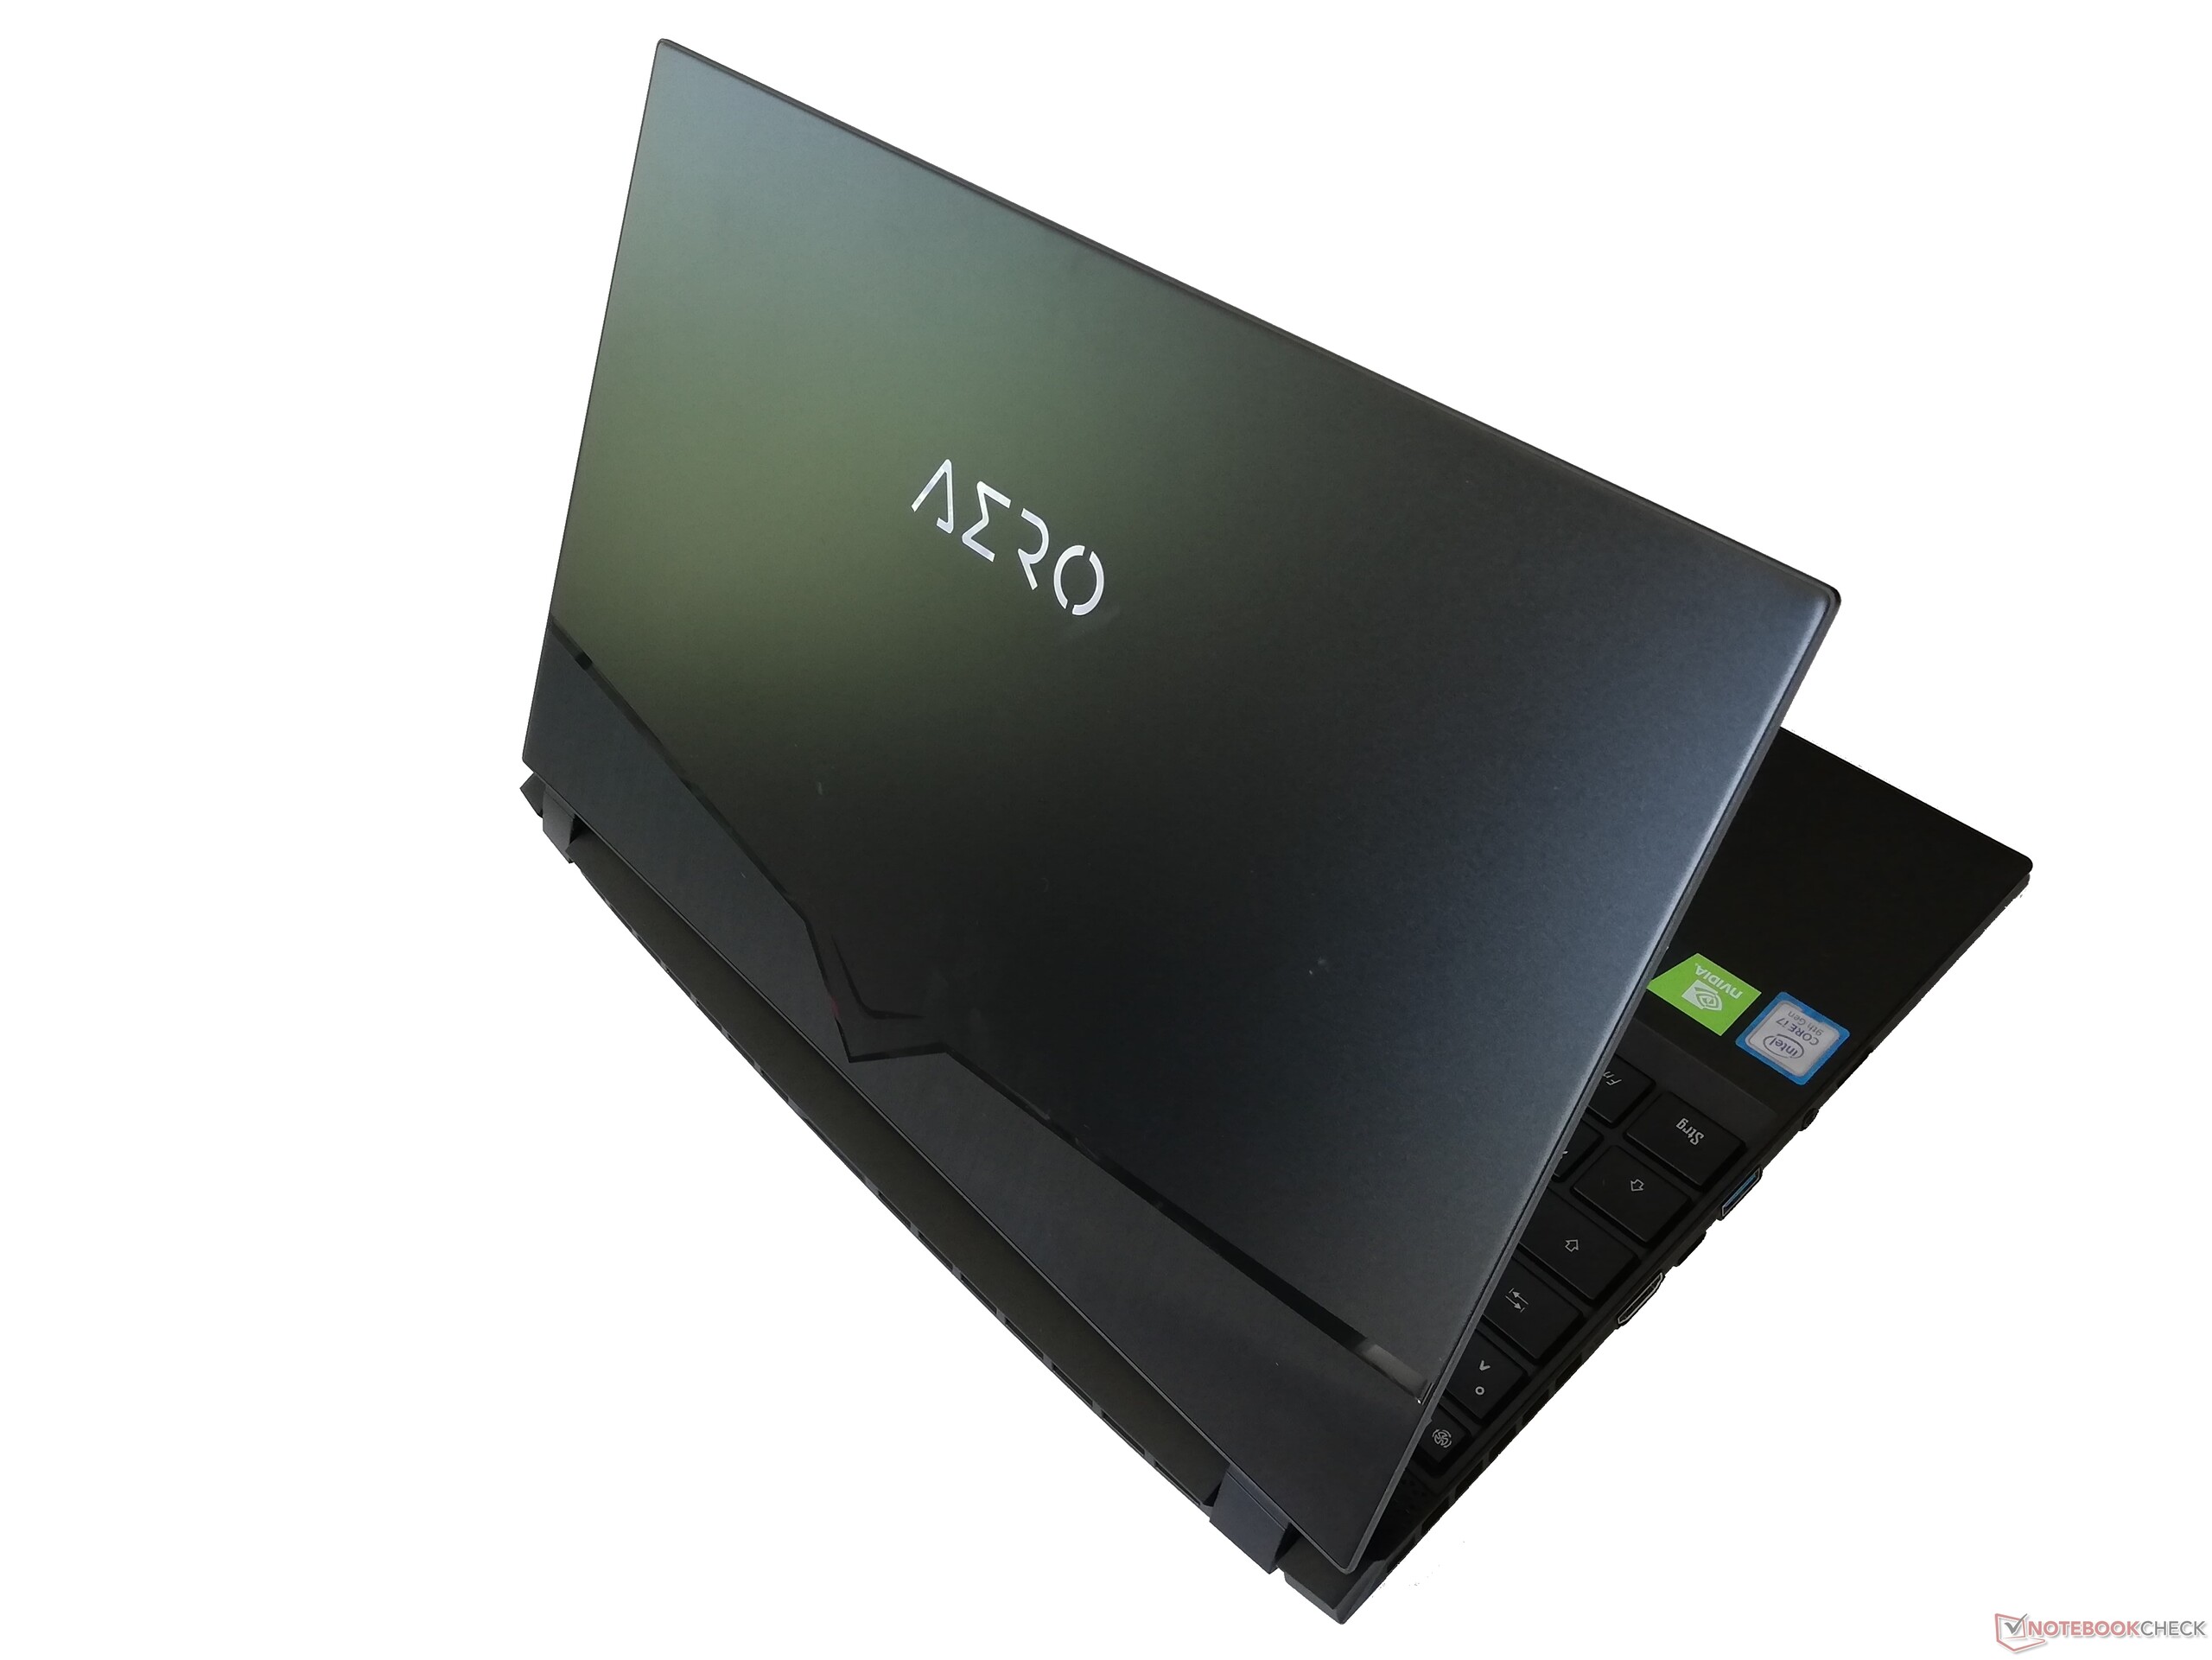
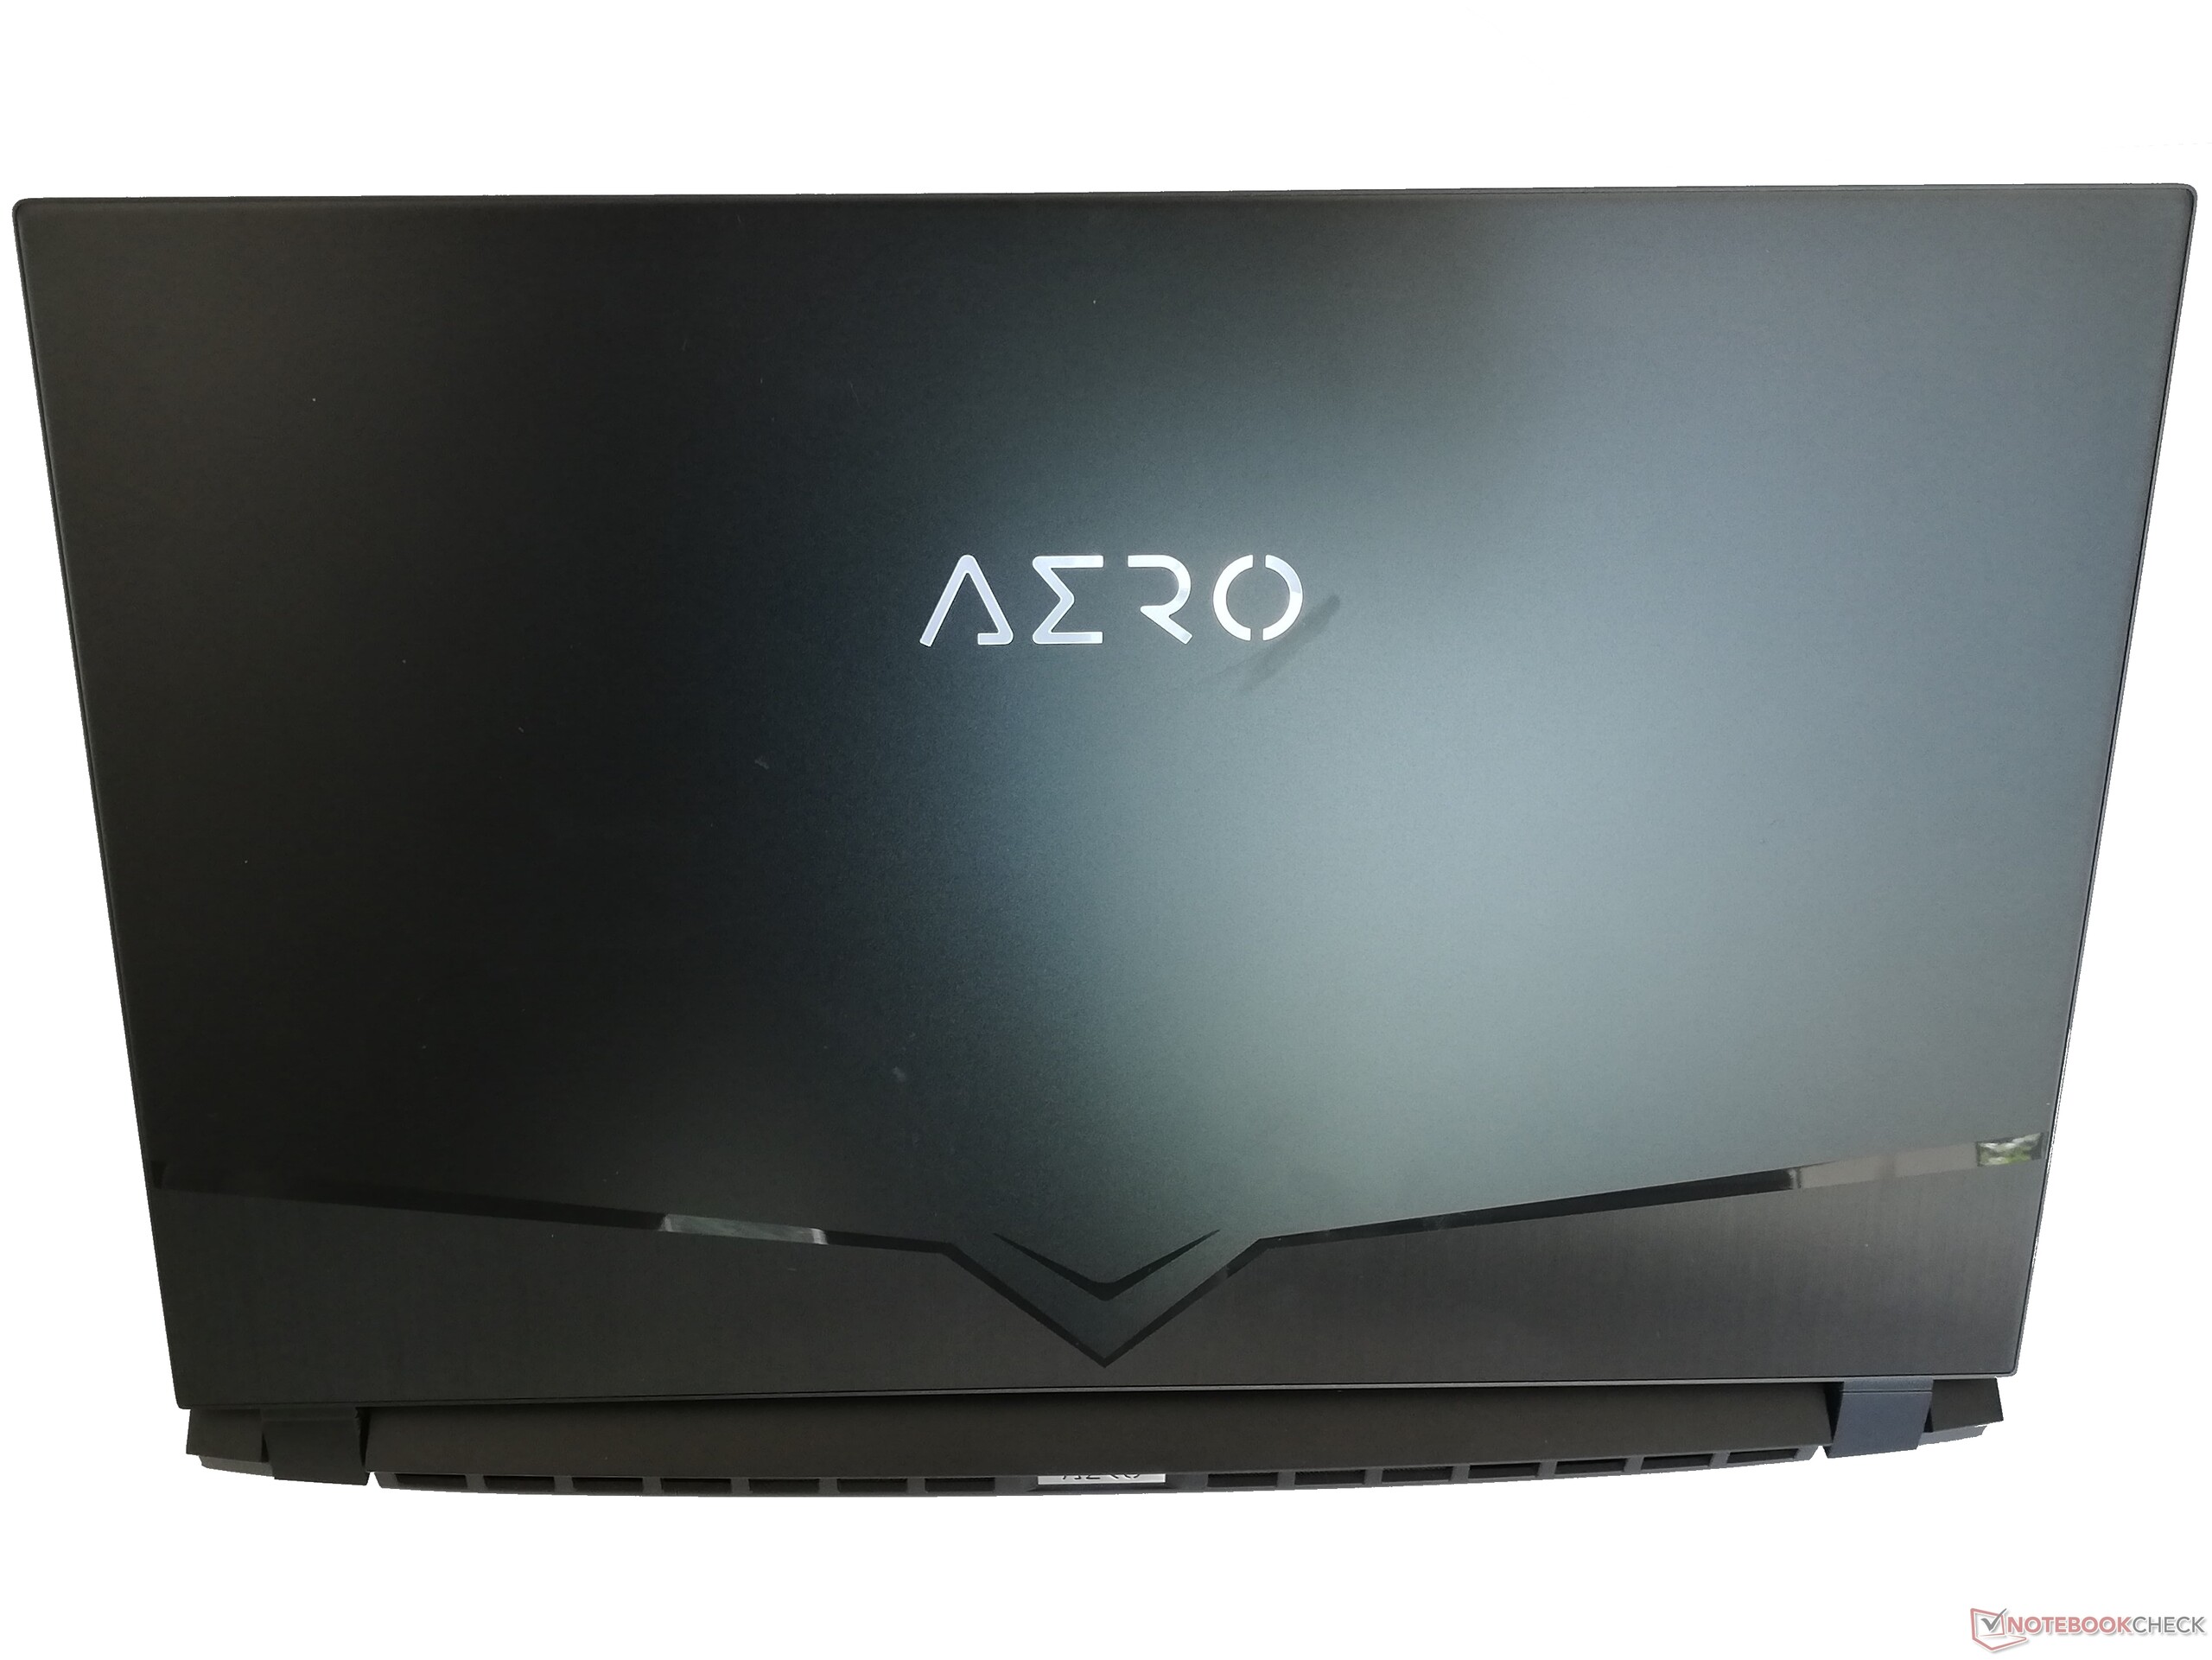
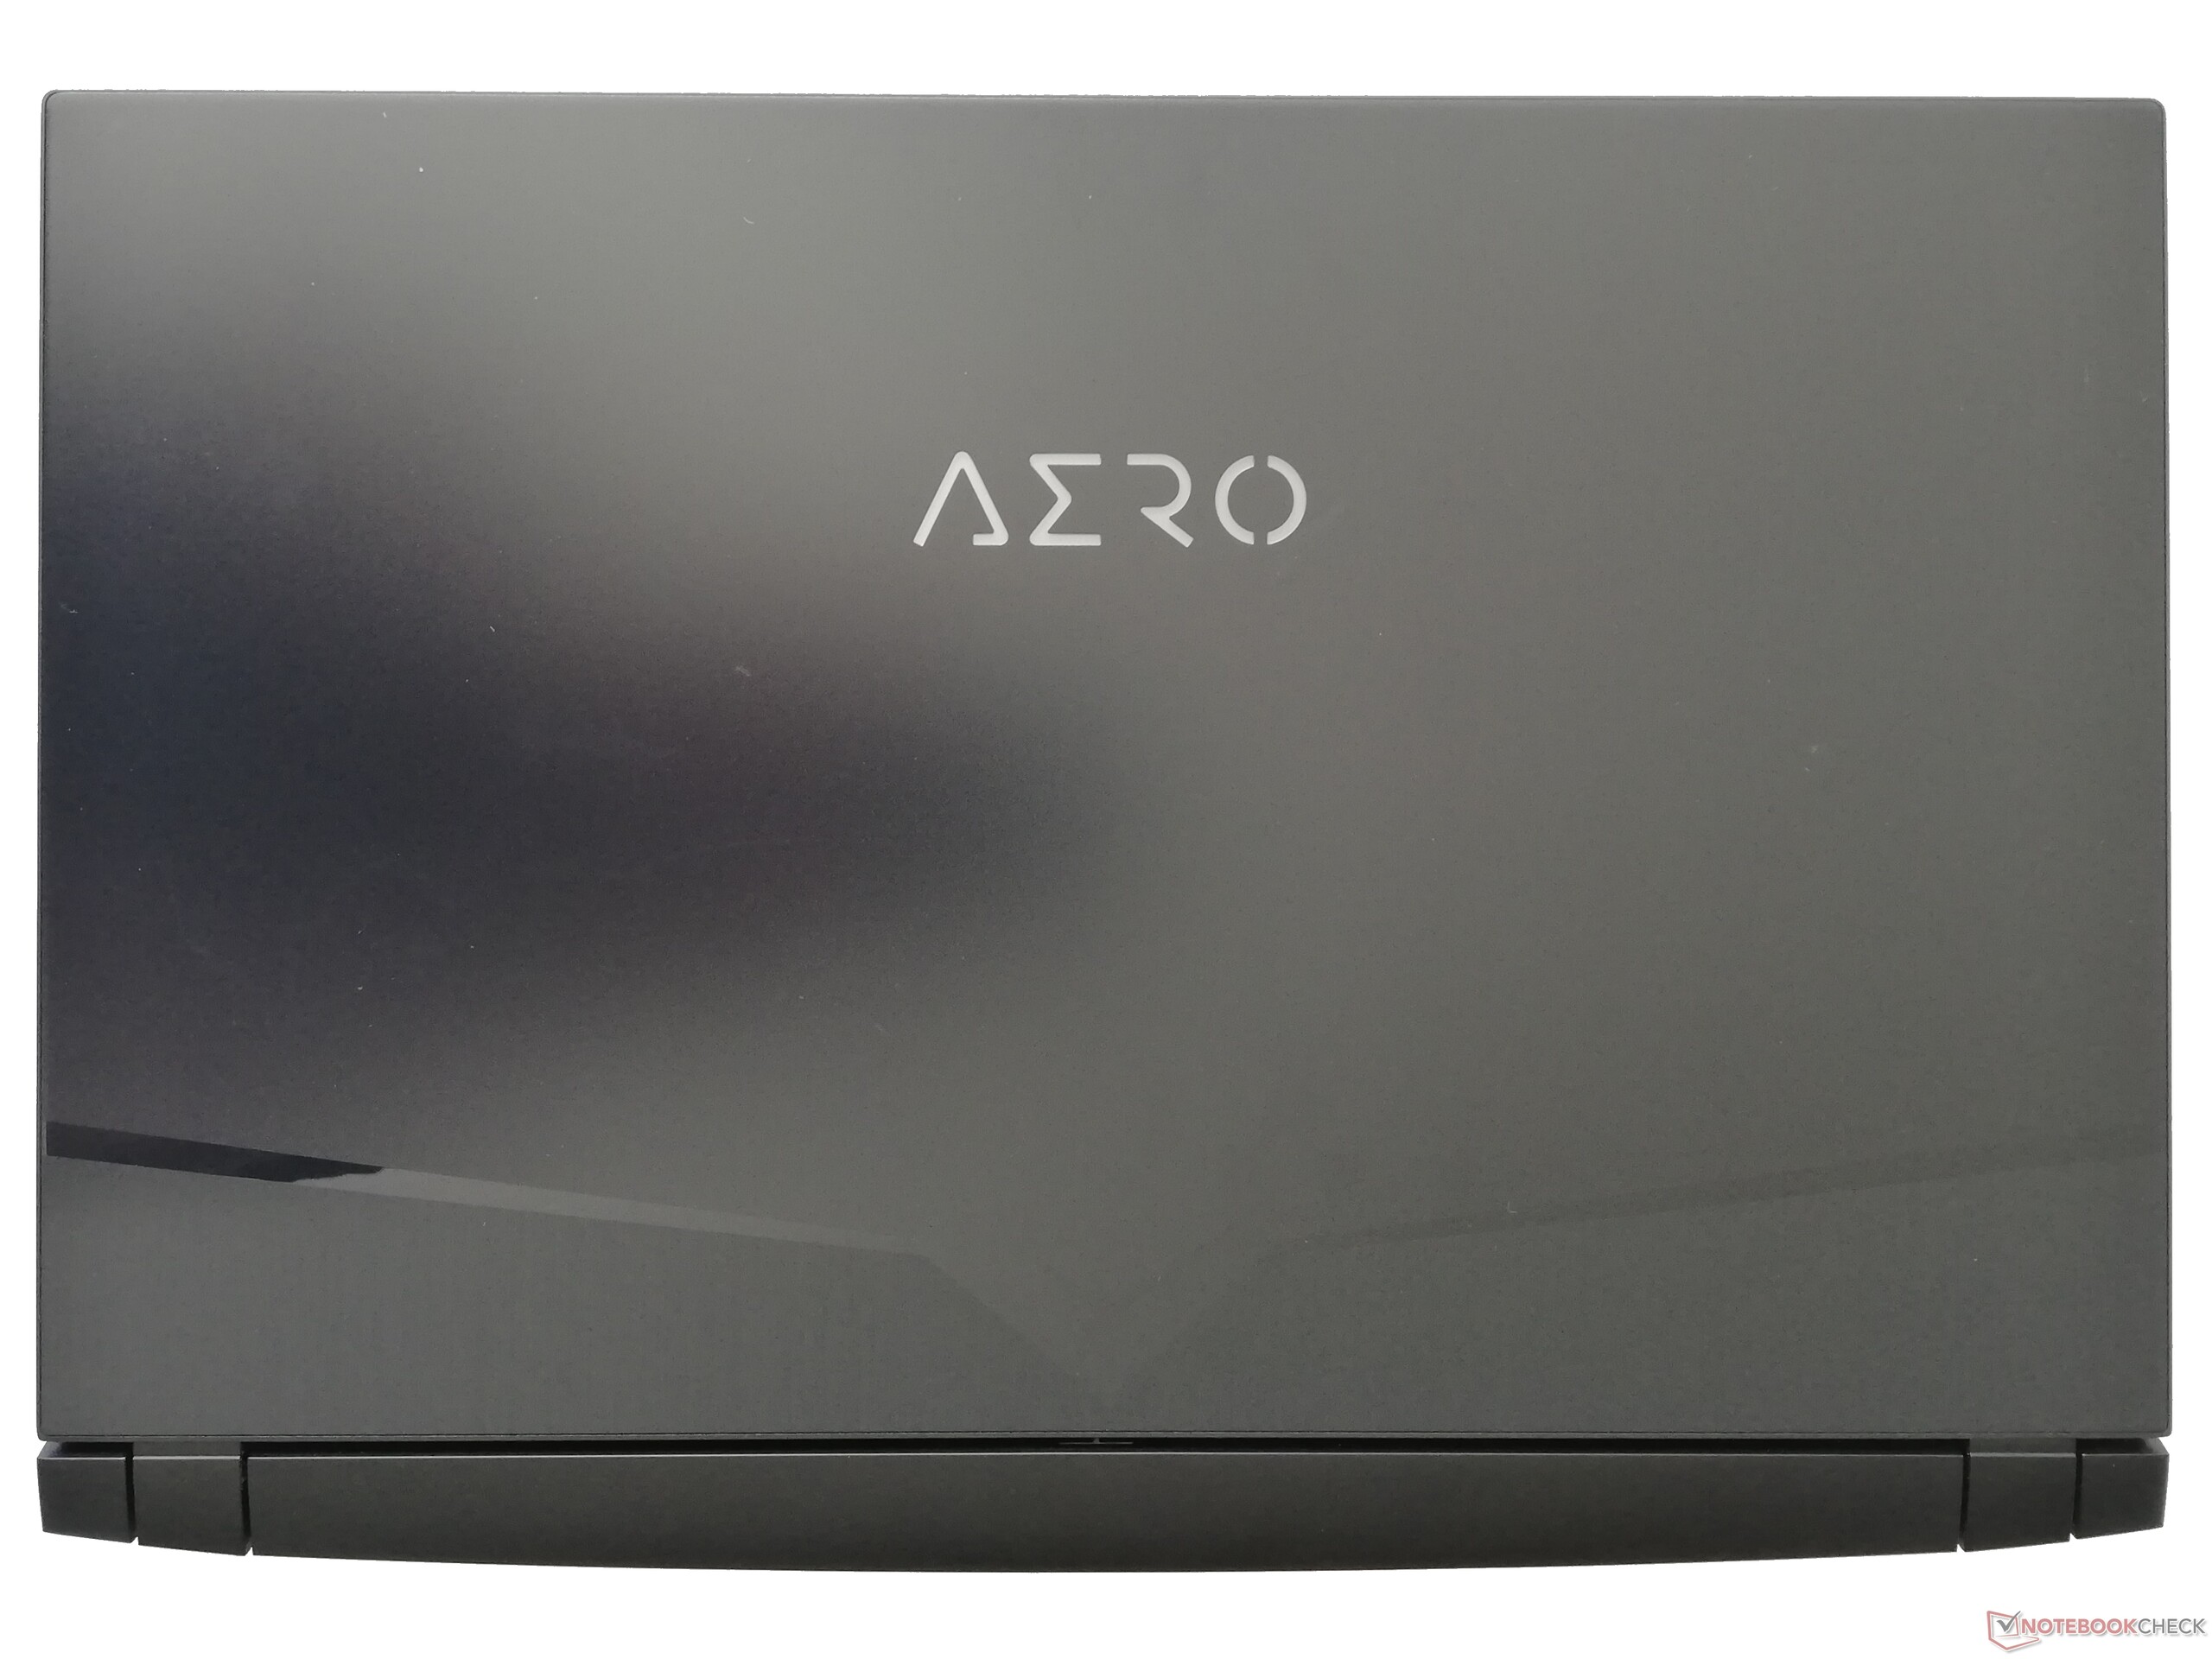
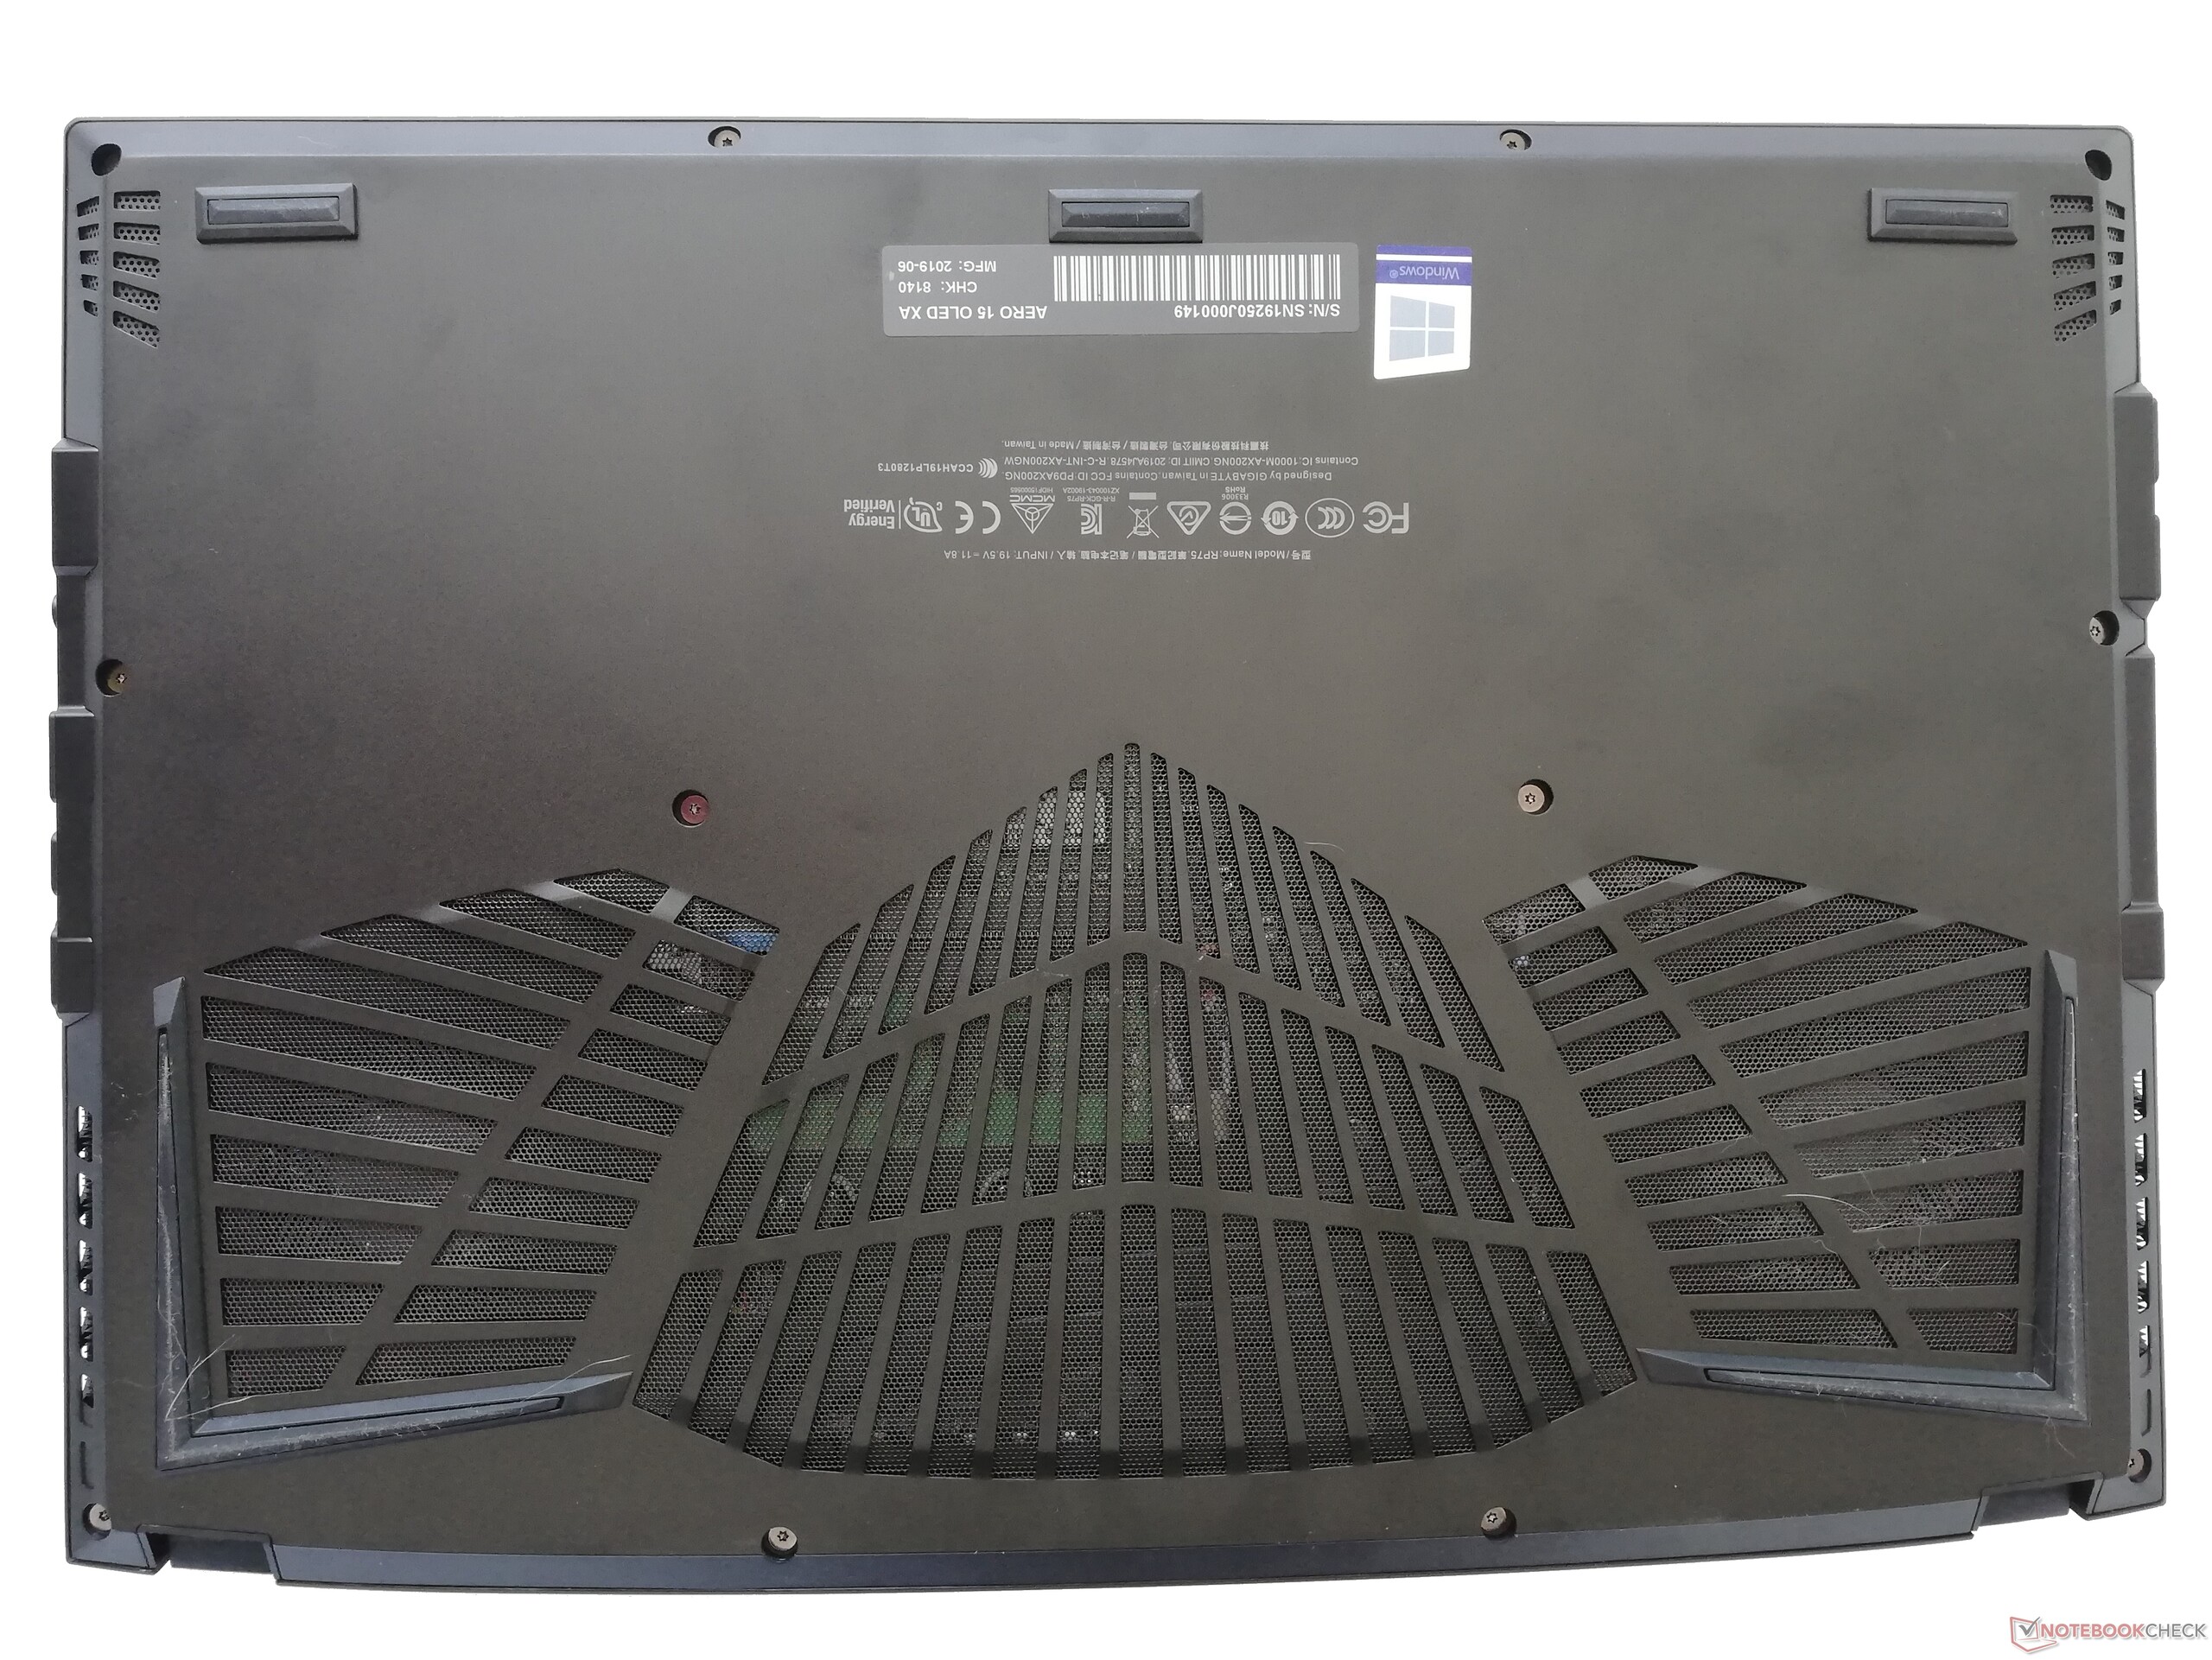
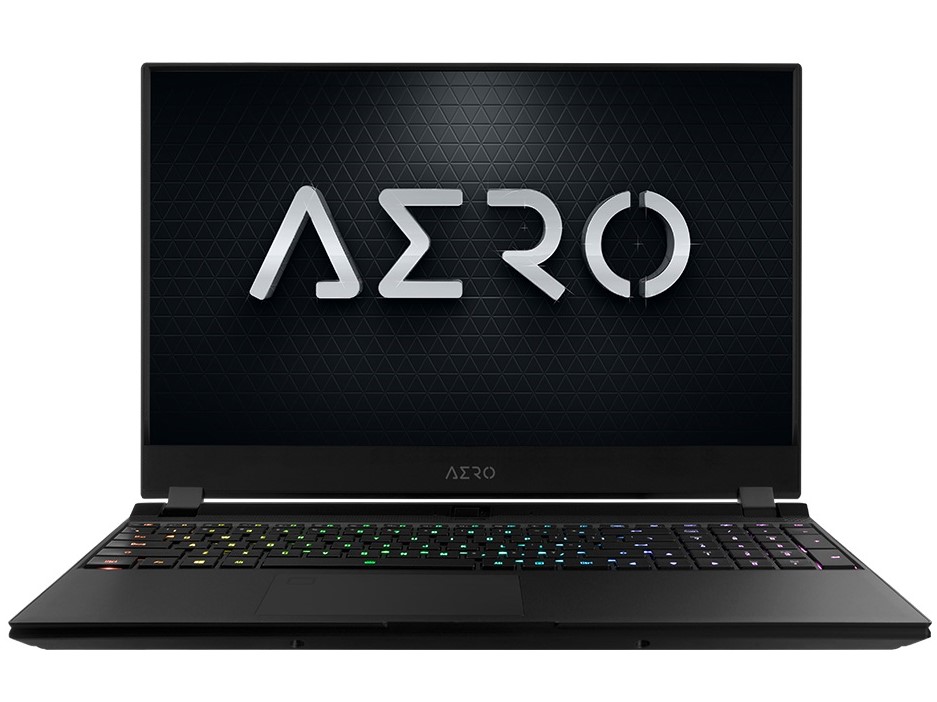
Breve Análise do Portátil Gigabyte Aero 15 XA: Com painel OLED e 4K em um novo design
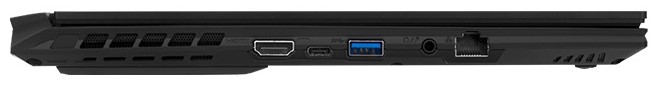
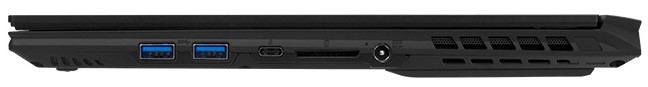
| SD Card Reader | |
| average JPG Copy Test (av. of 3 runs) | |
| Gigabyte Aero 15 Classic-XA (Toshiba Exceria Pro SDXC 64 GB UHS-II) | |
| Gigabyte Aero 15 OLED XA (Toshiba Exceria Pro SDXC 64 GB UHS-II) | |
| Média da turma Gaming (20.9 - 210, n=54, últimos 2 anos) | |
| Medion Erazer X15805 (Toshiba Exceria Pro SDXC 64 GB UHS-II) | |
| maximum AS SSD Seq Read Test (1GB) | |
| Gigabyte Aero 15 Classic-XA (Toshiba Exceria Pro SDXC 64 GB UHS-II) | |
| Gigabyte Aero 15 OLED XA (Toshiba Exceria Pro SDXC 64 GB UHS-II) | |
| Média da turma Gaming (25.5 - 261, n=51, últimos 2 anos) | |
| Medion Erazer X15805 (Toshiba Exceria Pro SDXC 64 GB UHS-II) | |
| |||||||||||||||||||||||||
iluminação: 93 %
iluminação com acumulador: 373 cd/m²
Contraste: ∞:1 (Preto: 0 cd/m²)
ΔE ColorChecker Calman: 3.98 | ∀{0.5-29.43 Ø4.72}
ΔE Greyscale Calman: 2.81 | ∀{0.09-98 Ø4.97}
97% sRGB (Argyll 1.6.3 3D)
78% AdobeRGB 1998 (Argyll 1.6.3 3D)
Gamma: 2.62
CCT: 6434 K
| Gigabyte Aero 15 OLED XA Samsung SDCA029, OLED, 3840x2160 | Medion Erazer X15805 LG Philips LP156WFG-SPB2, IPS, 1920x1080 | Gigabyte Aero 15 Classic-XA Sharp LQ156M1JW03 (SHP14C5), IGZO, 1920x1080 | Asus Zephyrus S GX502GW AU Optronics B156HAN08.2 (AUO82ED), IPS, 1920x1080 | MSI GS65 Stealth 9SG Sharp LQ156M1JW03 (SHP14C5), IPS, 1920x1080 | Aorus 15 W9 LG Philips LP156WFG-SPB2 (LGD05E8), IPS, 1920x1080 | |
|---|---|---|---|---|---|---|
| Display | ||||||
| Display P3 Coverage (%) | 61.7 | 65.3 | 64.9 | 67.6 | 64.3 | |
| sRGB Coverage (%) | 91.9 | 95.5 | 91 | 97.5 | 93.5 | |
| AdobeRGB 1998 Coverage (%) | 63 | 66.5 | 65.9 | 68.9 | 65.6 | |
| Response Times | -396% | -471% | -250% | -456% | -541% | |
| Response Time Grey 50% / Grey 80% * (ms) | 2.4 ? | 14 ? -483% | 15.2 ? -533% | 7.2 ? -200% | 13.6 ? -467% | 16.8 ? -600% |
| Response Time Black / White * (ms) | 2.2 ? | 9 ? -309% | 11.2 ? -409% | 8.8 ? -300% | 12 ? -445% | 12.8 ? -482% |
| PWM Frequency (Hz) | 60 ? | 23580 ? | 23260 ? | |||
| Screen | -24% | -10% | 2% | 13% | -22% | |
| Brightness middle (cd/m²) | 373 | 343 -8% | 266 -29% | 286 -23% | 282.3 -24% | 295 -21% |
| Brightness (cd/m²) | 375 | 290 -23% | 248 -34% | 275 -27% | 269 -28% | 292 -22% |
| Brightness Distribution (%) | 93 | 74 -20% | 89 -4% | 90 -3% | 90 -3% | 80 -14% |
| Black Level * (cd/m²) | 0.37 | 0.31 | 0.37 | 0.32 | 0.34 | |
| Colorchecker dE 2000 * | 3.98 | 4.22 -6% | 2.78 30% | 2.19 45% | 1.17 71% | 3.89 2% |
| Colorchecker dE 2000 max. * | 6.28 | 7.83 -25% | 5.96 5% | 4.4 30% | 3.29 48% | 7.28 -16% |
| Greyscale dE 2000 * | 2.81 | 5.1 -81% | 3.58 -27% | 2.2 22% | 1.3 54% | 4.98 -77% |
| Gamma | 2.62 84% | 2.2 100% | 2.46 89% | 2.41 91% | 2.2 100% | 2.45 90% |
| CCT | 6434 101% | 6970 93% | 7186 90% | 6405 101% | 6643 98% | 6407 101% |
| Color Space (Percent of AdobeRGB 1998) (%) | 78 | 58 -26% | 62 -21% | 59 -24% | 63.8 -18% | 60 -23% |
| Color Space (Percent of sRGB) (%) | 97 | 92 -5% | 96 -1% | 91 -6% | 97.5 1% | 93 -4% |
| Contrast (:1) | 927 | 858 | 773 | 882 | 868 | |
| Colorchecker dE 2000 calibrated * | 1.33 | 0.91 | 2.27 | 1.06 | 1.44 | |
| Média Total (Programa/Configurações) | -210% /
-99% | -241% /
-102% | -124% /
-49% | -222% /
-81% | -282% /
-126% |
* ... menor é melhor
Exibir tempos de resposta
| ↔ Tempo de resposta preto para branco | ||
|---|---|---|
| 2.2 ms ... ascensão ↗ e queda ↘ combinadas | ↗ 1.2 ms ascensão | 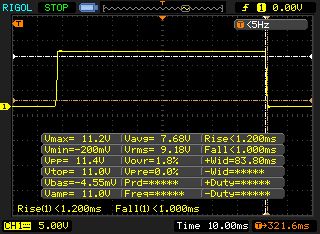 |
| ↘ 1 ms queda | ||
| A tela mostra taxas de resposta muito rápidas em nossos testes e deve ser muito adequada para jogos em ritmo acelerado. Em comparação, todos os dispositivos testados variam de 0.1 (mínimo) a 240 (máximo) ms. » 12 % de todos os dispositivos são melhores. Isso significa que o tempo de resposta medido é melhor que a média de todos os dispositivos testados (19.8 ms). | ||
| ↔ Tempo de resposta 50% cinza a 80% cinza | ||
| 2.4 ms ... ascensão ↗ e queda ↘ combinadas | ↗ 1 ms ascensão | 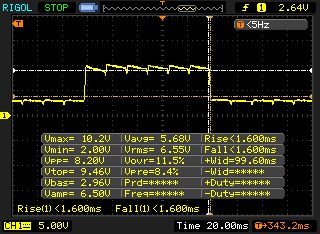 |
| ↘ 1.4 ms queda | ||
| A tela mostra taxas de resposta muito rápidas em nossos testes e deve ser muito adequada para jogos em ritmo acelerado. Em comparação, todos os dispositivos testados variam de 0.165 (mínimo) a 636 (máximo) ms. » 11 % de todos os dispositivos são melhores. Isso significa que o tempo de resposta medido é melhor que a média de todos os dispositivos testados (31 ms). | ||
Cintilação da tela / PWM (modulação por largura de pulso)
| Tela tremeluzindo/PWM detectado | 60 Hz | ≤ 80 % configuração de brilho | 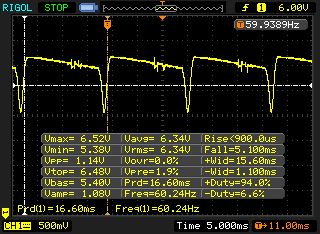 |
A luz de fundo da tela pisca em 60 Hz (pior caso, por exemplo, utilizando PWM) Cintilação detectada em uma configuração de brilho de 80 % e abaixo. Não deve haver cintilação ou PWM acima desta configuração de brilho. A frequência de 60 Hz é muito baixa, portanto a oscilação pode causar fadiga ocular e dores de cabeça após uso prolongado. [pwm_comparison] Em comparação: 52 % de todos os dispositivos testados não usam PWM para escurecer a tela. Se PWM foi detectado, uma média de 7769 (mínimo: 5 - máximo: 343500) Hz foi medida. | |||
| PCMark 8 Home Score Accelerated v2 | 3638 pontos | |
| PCMark 8 Work Score Accelerated v2 | 4520 pontos | |
| PCMark 10 Score | 5439 pontos | |
Ajuda | ||
| Gigabyte Aero 15 OLED XA Intel SSD 600p SSDPEKKW512G8L | Medion Erazer X15805 Samsung SSD PM981 MZVLB512HAJQ | Gigabyte Aero 15 Classic-XA Intel SSD 760p SSDPEKKW512G8 | Asus Zephyrus S GX502GW 2x Intel SSD 660p SSDPEKNW512G8 (RAID 0) | MSI GS65 Stealth 9SG Samsung SSD PM981 MZVLB512HAJQ | Aorus 15 W9 Intel SSD 760p SSDPEKKW512G8 | |
|---|---|---|---|---|---|---|
| CrystalDiskMark 5.2 / 6 | 2% | -4% | -6% | -6% | -14% | |
| Write 4K (MB/s) | 126.7 | 116.8 -8% | 115.5 -9% | 97 -23% | 91.3 -28% | 99.2 -22% |
| Read 4K (MB/s) | 66.1 | 41.42 -37% | 58 -12% | 49.58 -25% | 40.73 -38% | 54.1 -18% |
| Write Seq (MB/s) | 1538 | 1994 30% | 1555 1% | 1838 20% | 1915 25% | 1524 -1% |
| Read Seq (MB/s) | 2269 | 2392 5% | 2590 14% | 2421 7% | 2051 -10% | 2325 2% |
| Write 4K Q32T1 (MB/s) | 456.7 | 394.9 -14% | 369.3 -19% | 326.9 -28% | 308.3 -32% | 259.2 -43% |
| Read 4K Q32T1 (MB/s) | 554 | 438.2 -21% | 441.7 -20% | 372.9 -33% | 417.4 -25% | 328.9 -41% |
| Write Seq Q32T1 (MB/s) | 1541 | 1987 29% | 1547 0% | 1894 23% | 1922 25% | 1566 2% |
| Read Seq Q32T1 (MB/s) | 2567 | 3457 35% | 2969 16% | 2828 10% | 3395 32% | 2767 8% |

| 3DMark 11 Performance | 19110 pontos | |
| 3DMark Cloud Gate Standard Score | 29711 pontos | |
| 3DMark Fire Strike Score | 16110 pontos | |
| 3DMark Time Spy Score | 6512 pontos | |
Ajuda | ||
| The Witcher 3 - 1920x1080 Ultra Graphics & Postprocessing (HBAO+) | |
| Média da turma Gaming (95 - 240, n=8, últimos 2 anos) | |
| Asus Zephyrus S GX502GW | |
| MSI GS65 Stealth 9SG | |
| Gigabyte Aero 15 Classic-XA | |
| Medion Erazer X15805 | |
| Gigabyte Aero 15 OLED XA | |
| Aorus 15 W9 | |
| BioShock Infinite - 1920x1080 Ultra Preset, DX11 (DDOF) | |
| MSI GS65 Stealth 9SG | |
| Gigabyte Aero 15 OLED XA | |
| Medion Erazer X15805 | |
| Gigabyte Aero 15 Classic-XA | |
| Aorus 15 W9 | |
| Thief - 1920x1080 Very High Preset AA:FXAA & High SS AF:8x | |
| Gigabyte Aero 15 OLED XA | |
| Rise of the Tomb Raider - 3840x2160 High Preset AA:FX AF:4x | |
| Gigabyte Aero 15 OLED XA | |
| baixo | média | alto | ultra | 4K | |
|---|---|---|---|---|---|
| BioShock Infinite (2013) | 152 | ||||
| Thief (2014) | 103 | ||||
| GTA V (2015) | 173 | 165 | 136 | 77 | 69 |
| The Witcher 3 (2015) | 63.5 | ||||
| Rise of the Tomb Raider (2016) | 43.4 | ||||
| Shadow of the Tomb Raider (2018) | 119.4 | 94.6 | 89.6 | 80.6 | 28.3 |
| Metro Exodus (2019) | 123 | 78 | 58 | 46 | 22 |
| The Division 2 (2019) | 150 | 105 | 86 | 63 | 23 |
| Anno 1800 (2019) | 36.4 | 21.6 | |||
| Control (2019) | 220 | 81 | 59.3 | 18.1 |
Barulho
| Ocioso |
| 34 / 35 / 45 dB |
| Carga |
| 43 / 54 dB |
 | ||
30 dB silencioso 40 dB(A) audível 50 dB(A) ruidosamente alto |
||
min: | ||
(-) A temperatura máxima no lado superior é 49 °C / 120 F, em comparação com a média de 40.4 °C / 105 F , variando de 21.2 a 68.8 °C para a classe Gaming.
(-) A parte inferior aquece até um máximo de 59 °C / 138 F, em comparação com a média de 43.2 °C / 110 F
(+) Em uso inativo, a temperatura média para o lado superior é 30.6 °C / 87 F, em comparação com a média do dispositivo de 33.9 °C / ### class_avg_f### F.
(-) Jogando The Witcher 3, a temperatura média para o lado superior é 42.1 °C / 108 F, em comparação com a média do dispositivo de 33.9 °C / ## #class_avg_f### F.
(-) Os apoios para as mãos e o touchpad podem ficar muito quentes ao toque, com um máximo de 41 °C / 105.8 F.
(-) A temperatura média da área do apoio para as mãos de dispositivos semelhantes foi 28.8 °C / 83.8 F (-12.2 °C / -22 F).
Gigabyte Aero 15 OLED XA análise de áudio
(+) | os alto-falantes podem tocar relativamente alto (###valor### dB)
Graves 100 - 315Hz
(-) | quase nenhum baixo - em média 19.7% menor que a mediana
(±) | a linearidade dos graves é média (12.5% delta para a frequência anterior)
Médios 400 - 2.000 Hz
(±) | médios mais altos - em média 7% maior que a mediana
(+) | médios são lineares (6.8% delta para frequência anterior)
Altos 2 - 16 kHz
(+) | agudos equilibrados - apenas 2.7% longe da mediana
(+) | os máximos são lineares (5.7% delta da frequência anterior)
Geral 100 - 16.000 Hz
(±) | a linearidade do som geral é média (18.8% diferença em relação à mediana)
Comparado com a mesma classe
» 62% de todos os dispositivos testados nesta classe foram melhores, 8% semelhantes, 30% piores
» O melhor teve um delta de 6%, a média foi 18%, o pior foi 132%
Comparado com todos os dispositivos testados
» 43% de todos os dispositivos testados foram melhores, 8% semelhantes, 49% piores
» O melhor teve um delta de 4%, a média foi 24%, o pior foi 134%
Gigabyte Aero 15 Classic-XA análise de áudio
(+) | os alto-falantes podem tocar relativamente alto (###valor### dB)
Graves 100 - 315Hz
(-) | quase nenhum baixo - em média 17% menor que a mediana
(±) | a linearidade dos graves é média (10.2% delta para a frequência anterior)
Médios 400 - 2.000 Hz
(+) | médios equilibrados - apenas 4.7% longe da mediana
(+) | médios são lineares (6.2% delta para frequência anterior)
Altos 2 - 16 kHz
(+) | agudos equilibrados - apenas 2.3% longe da mediana
(+) | os máximos são lineares (5.5% delta da frequência anterior)
Geral 100 - 16.000 Hz
(±) | a linearidade do som geral é média (15.5% diferença em relação à mediana)
Comparado com a mesma classe
» 35% de todos os dispositivos testados nesta classe foram melhores, 7% semelhantes, 58% piores
» O melhor teve um delta de 6%, a média foi 18%, o pior foi 132%
Comparado com todos os dispositivos testados
» 23% de todos os dispositivos testados foram melhores, 4% semelhantes, 73% piores
» O melhor teve um delta de 4%, a média foi 24%, o pior foi 134%
| desligado | |
| Ocioso | |
| Carga |
|
Key:
min: | |
| Gigabyte Aero 15 OLED XA i7-9750H, GeForce RTX 2070 Max-Q | Medion Erazer X15805 i9-8950HK, GeForce RTX 2070 Max-Q | Gigabyte Aero 15 Classic-XA i7-9750H, GeForce RTX 2070 Max-Q | Asus Zephyrus S GX502GW i7-9750H, GeForce RTX 2070 Mobile | MSI GS65 Stealth 9SG i7-9750H, GeForce RTX 2080 Max-Q | Aorus 15 W9 i7-8750H, GeForce RTX 2060 Mobile | Média da turma Gaming | |
|---|---|---|---|---|---|---|---|
| Power Consumption | 14% | 4% | -10% | 9% | 16% | 10% | |
| Idle Minimum * (Watt) | 23 | 15.1 34% | 21 9% | 24 -4% | 18.3 20% | 18 22% | 13.2 ? 43% |
| Idle Average * (Watt) | 25 | 19.2 23% | 23 8% | 27 -8% | 22 12% | 20 20% | 18.9 ? 24% |
| Idle Maximum * (Watt) | 33 | 22.9 31% | 32 3% | 33 -0% | 28.8 13% | 28 15% | 24.5 ? 26% |
| Load Average * (Watt) | 96 | 107 -11% | 97 -1% | 129 -34% | 93 3% | 87 9% | 108.8 ? -13% |
| Witcher 3 ultra * (Watt) | 168 | 148 12% | 176 -5% | 142.6 15% | 135 20% | ||
| Load Maximum * (Watt) | 197 | 213 -8% | 213 -8% | 216 -10% | 215.9 -10% | 175 11% | 254 ? -29% |
* ... menor é melhor
| Gigabyte Aero 15 OLED XA i7-9750H, GeForce RTX 2070 Max-Q, 94.24 Wh | Medion Erazer X15805 i9-8950HK, GeForce RTX 2070 Max-Q, 46.74 Wh | Gigabyte Aero 15 Classic-XA i7-9750H, GeForce RTX 2070 Max-Q, 94.24 Wh | Asus Zephyrus S GX502GW i7-9750H, GeForce RTX 2070 Mobile, 76 Wh | MSI GS65 Stealth 9SG i7-9750H, GeForce RTX 2080 Max-Q, 82 Wh | Aorus 15 W9 i7-8750H, GeForce RTX 2060 Mobile, 62 Wh | Média da turma Gaming | |
|---|---|---|---|---|---|---|---|
| Duração da bateria | -46% | 12% | -45% | 5% | -58% | -10% | |
| Reader / Idle (h) | 9.9 | 9.1 -8% | 5.9 -40% | 2.9 -71% | 8.71 ? -12% | ||
| WiFi v1.3 (h) | 5.7 | 3.1 -46% | 7 23% | 3.7 -35% | 6 5% | 2.4 -58% | 6.96 ? 22% |
| Load (h) | 2.5 | 3 20% | 1 -60% | 1.4 -44% | 1.47 ? -41% |
Pro
Contra
Veredicto - A Gigabyte melhora o Aero 15 discretamente, mas também herda algumas fraquezas antigas
Em nosso teste, o Gigabyte Aero 15 OLED XA mostra-se com um desempenho sólido no meio do campo de dispositivos comparáveis. Embora o desempenho do sistema nos benchmarks sintéticos permaneça um pouco abaixo do desempenho dos concorrentes, os desempenhos do processador, gráficos e armazenamento não dão motivos para reclamações. Além disso, há bom equipamento de conexão e um adaptador WLAN com WiFi 6 ou o padrão 802.11 ax preparado para o futuro. O design retrabalhado é orientado sobre os pontos fortes dos modelos predecessores, mas ainda é igual de suscetível à sujeira e às digitais.
A Gigabyte melhorou discretamente o Aero 15 e continua a oferecer um portátil digno de recomendação com design fino e bom desempenho.
O destaque é claro que é o painel OLED 4K. As vantagens no contraste e valor de preto não podem ser negadas. Mas aqui as fraquezas também se mostram, como a PWM, que é particularmente chata para usuários com olhos sensíveis. Além disso, devido à superfície refletiva da tela, o uso do dispositivo se torna difícil em exteriores. Finalmente, devemos mencionar o bom sistema de resfriamento e também a boa duração da bateria, fazendo com que o Gigabyte Aero 15 OLED XA mereça a atenção de quem procura um portátil fino e potente.
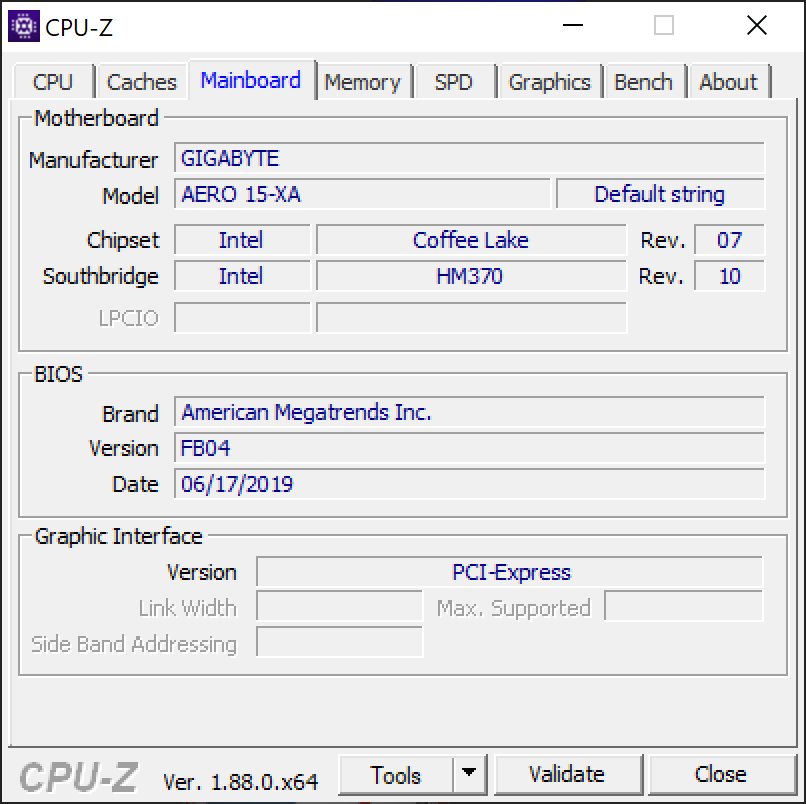
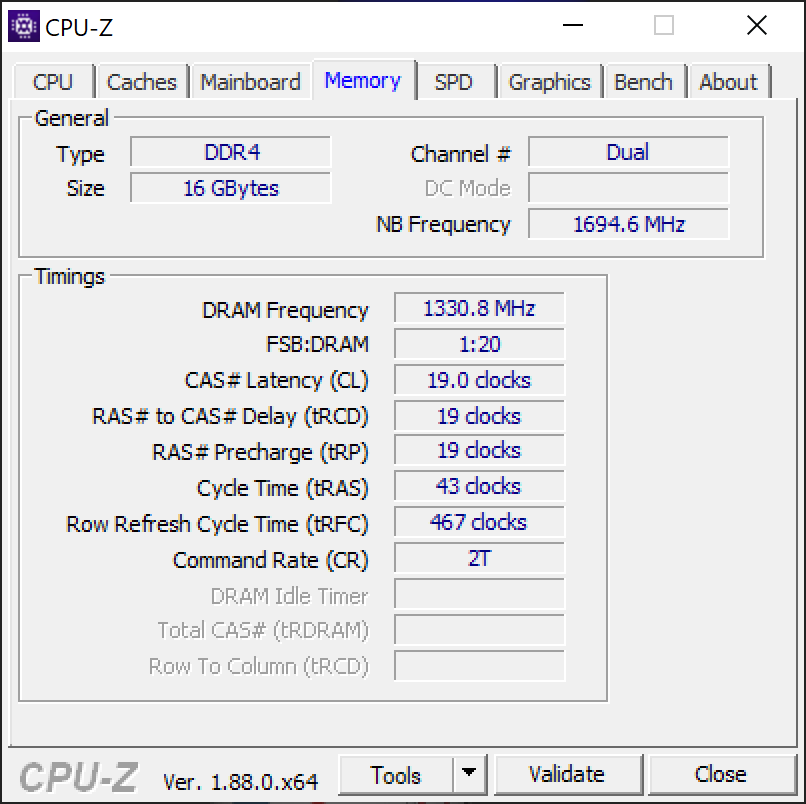
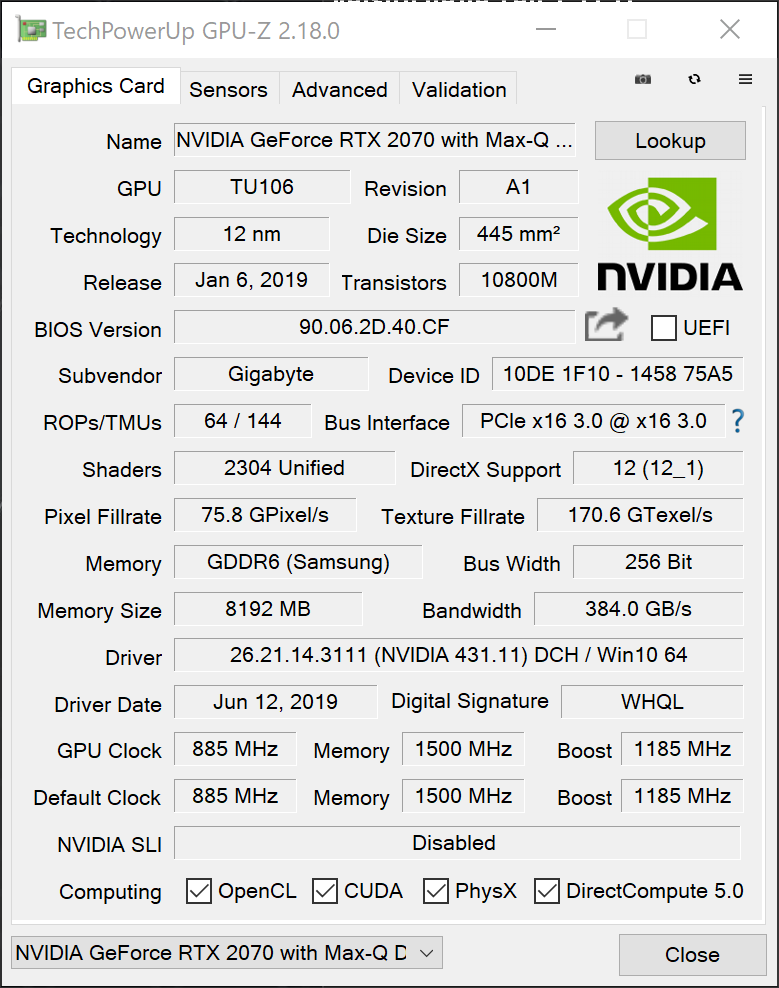
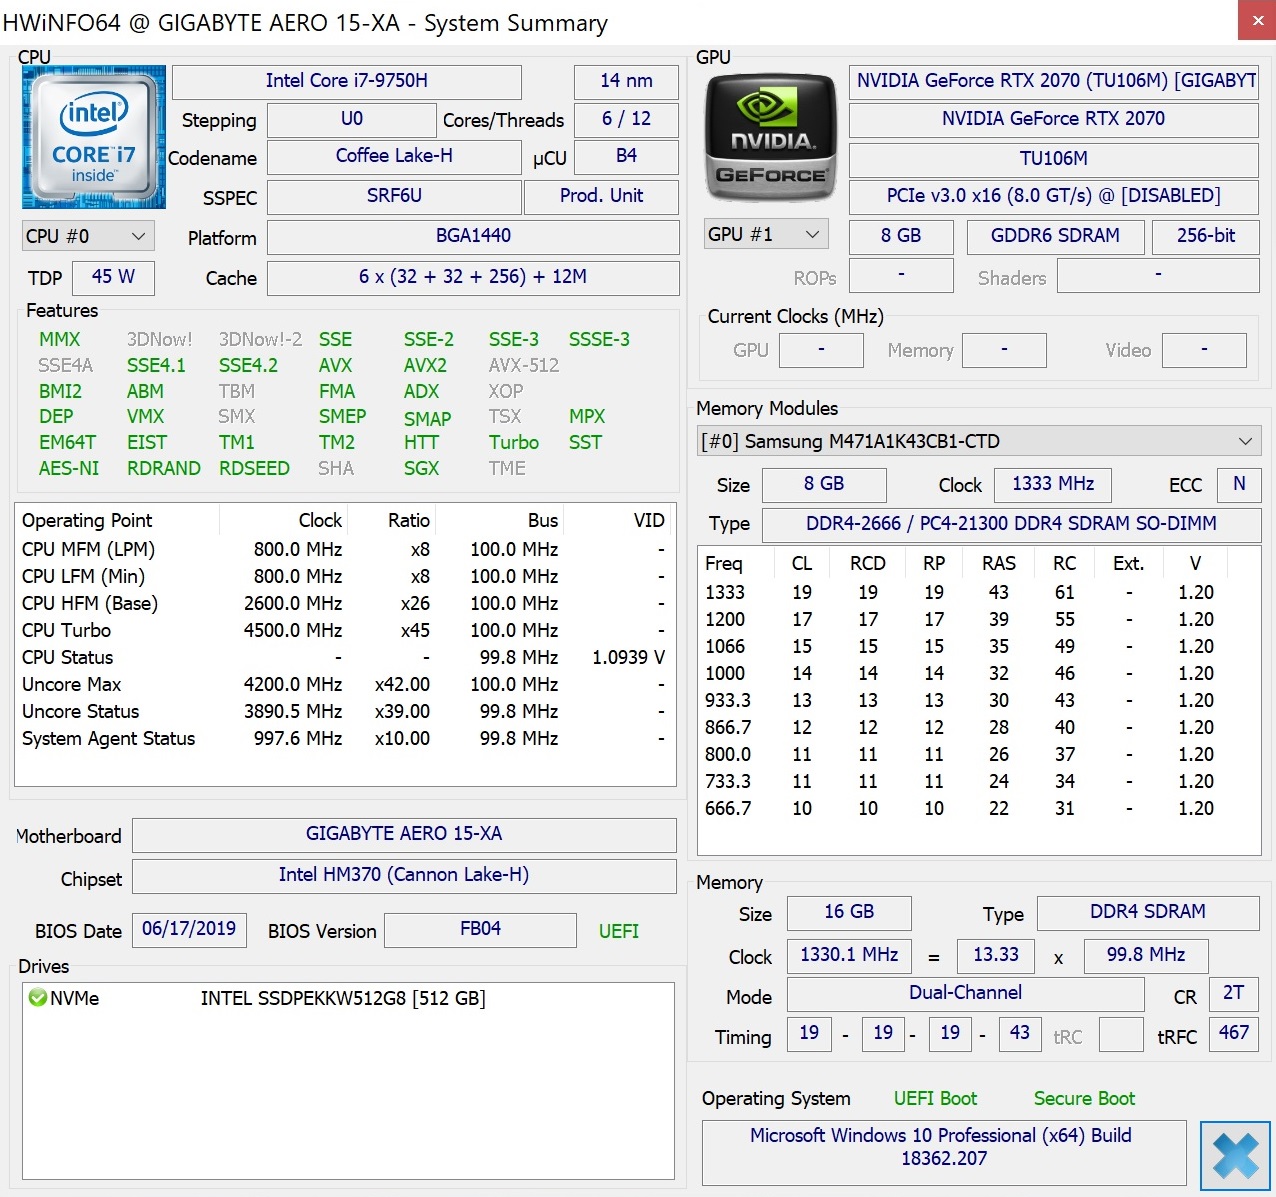
Gigabyte Aero 15 OLED XA
- 08/31/2022 v7 (old)
Mike Wobker
Price comparison
