Análise do conversível Lenovo ThinkPad L13 Yoga G4 Intel: Vida útil da bateria mais curta que a da AMD
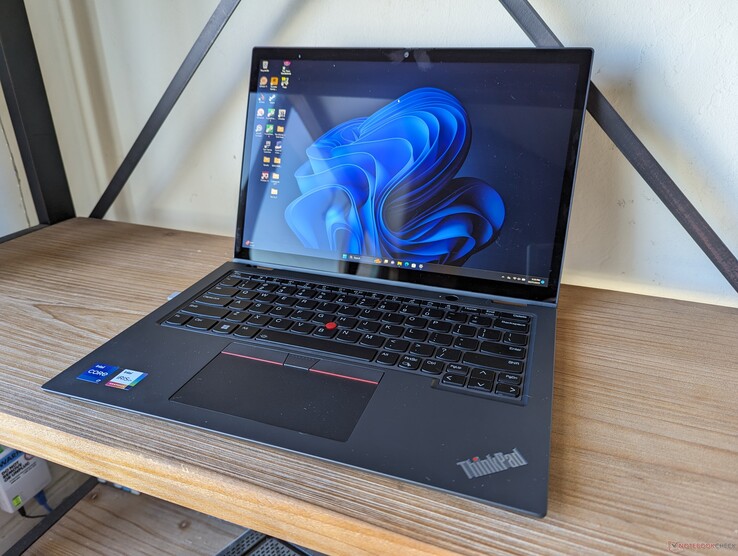
O ThinkPad L13 Yoga Gen 4 está disponível nas versões Intel e AMD para atrair usuários de ambos os lados do muro. Esta página de análise se concentrará na versão Intel, já que analisamos recentemente a versão Versão AMD em agosto. Todos os nossos comentários sobre os recursos físicos da versão AMD se aplicam aqui, pois as duas versões são visualmente idênticas.
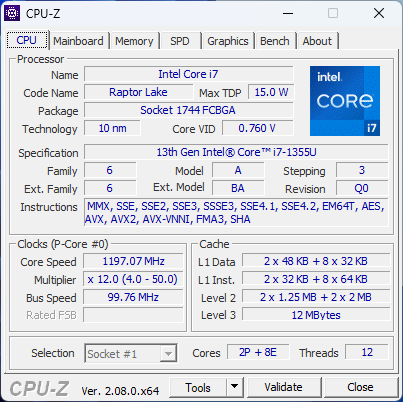
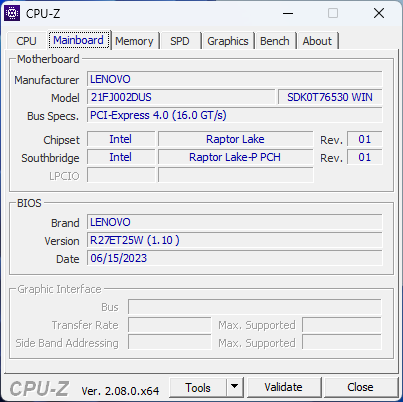
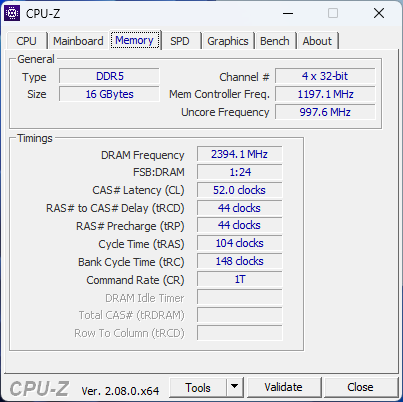
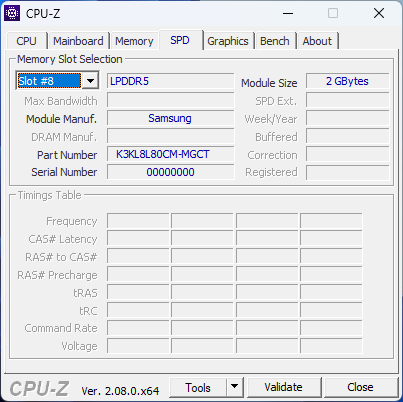
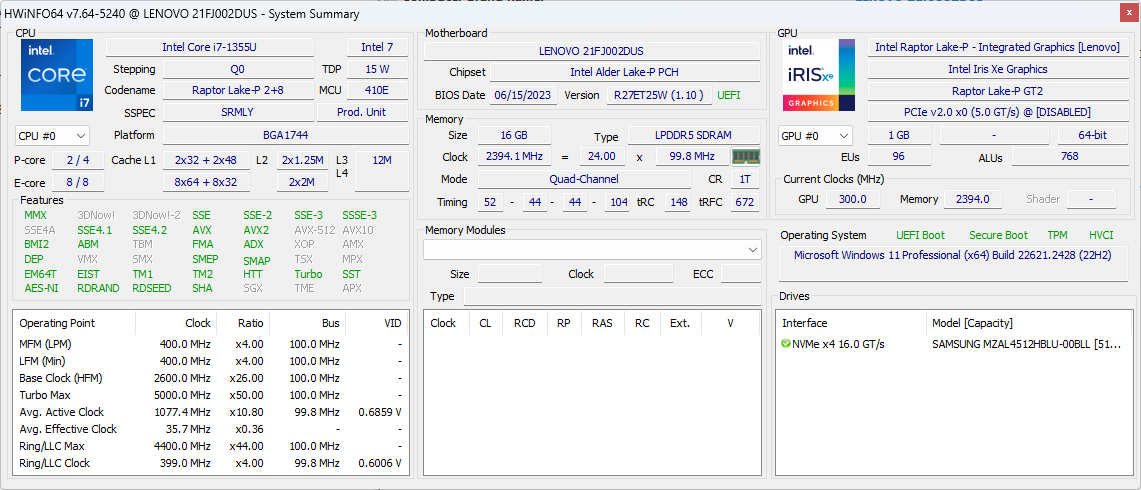
Nossa unidade de análise da Intel é uma configuração de ponta com a CPU Raptor Lake-U Core i7-1355U de 13ª geração, 16 GB de RAM e tela sensível ao toque IPS de 1200p por aproximadamente US$ 1.400 a US$ 600 no varejo. Outras configurações vão desde o Core i3-1315U até o Core i7-1365U com vPro, mas todas as opções são limitadas a gráficos integrados e uma tela de 1200p.
As alternativas ao ThinkPad L13 Yoga G4 incluem outros conversíveis voltados para negócios, como o MSI Summit E13 Flip Evo,HP Elite Dragonfly Folio 13.5ou o Dell Latitude 7330 2 em 1.
Mais análises da Lenovo:
Possíveis concorrentes em comparação
Avaliação | Data | Modelo | Peso | Altura | Size | Resolução | Preço |
|---|---|---|---|---|---|---|---|
| 88.1 % v7 (old) | 11/2023 | Lenovo ThinkPad L13 Yoga G4 i7-1355U i7-1355U, Iris Xe G7 96EUs | 1.4 kg | 17.1 mm | 13.30" | 1920x1200 | |
| 88.7 % v7 (old) | 08/2023 | Lenovo ThinkPad L13 Yoga G4 21FSS00100 R5 7530U, Vega 7 | 1.4 kg | 17.1 mm | 13.30" | 1920x1200 | |
| 90.3 % v7 (old) | 12/2022 | HP Elite Dragonfly Folio 13.5 G3 i7-1265U, Iris Xe G7 96EUs | 1.4 kg | 17.8 mm | 13.50" | 1920x1280 | |
| 89 % v7 (old) | 11/2022 | Dell Latitude 9330 i7-1260U, Iris Xe G7 96EUs | 1.2 kg | 14.1 mm | 13.30" | 2560x1600 | |
| 86.9 % v7 (old) | 04/2021 | MSI Summit E13 Flip Evo A11MT i7-1185G7, Iris Xe G7 96EUs | 1.4 kg | 14.9 mm | 13.40" | 1920x1200 | |
| 87.5 % v7 (old) | 10/2023 | Framework Laptop 13.5 Ryzen 7 7840U R7 7840U, Radeon 780M | 1.3 kg | 15.85 mm | 13.50" | 2256x1504 |
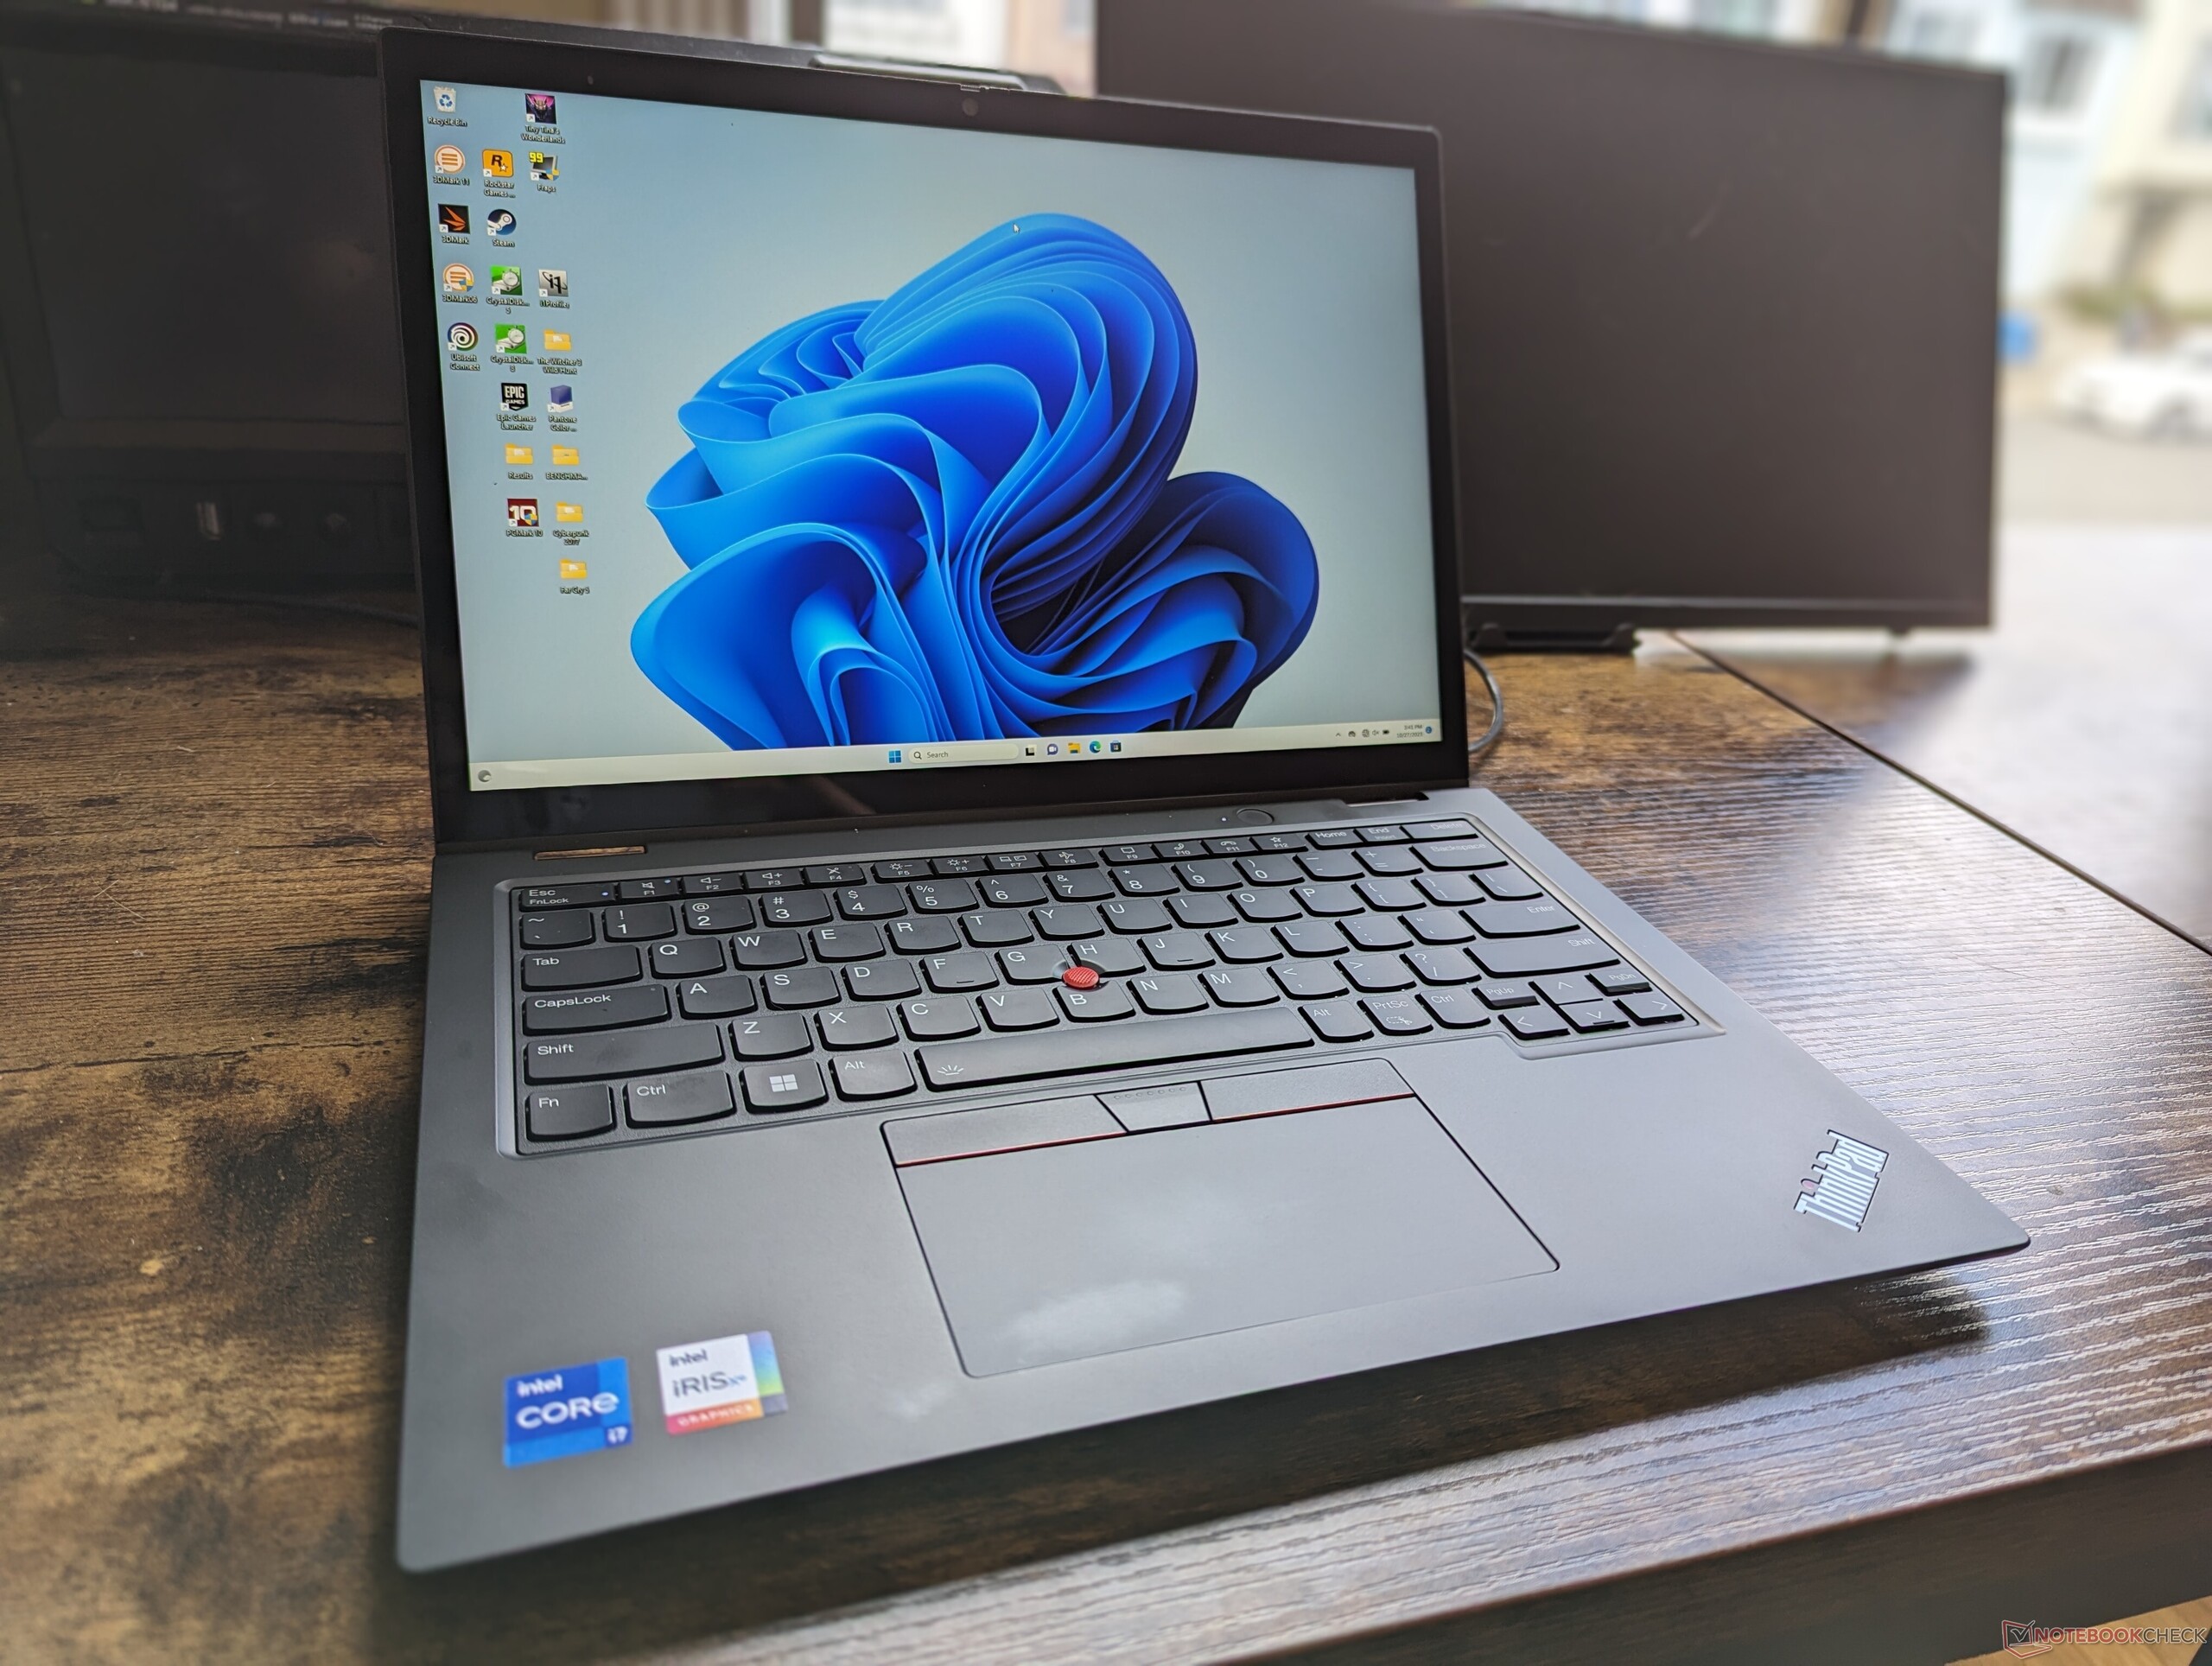
Caso
Assim como no recente ThinkPad E14 G5, a maneira mais rápida de identificar a versão Intel da AMD é procurar o logotipo Thunderbolt ao longo da borda esquerda, pois as opções da AMD não possuem esse recurso. Observe que, embora o modelo seja fornecido com duas portas USB-C, apenas a porta esquerda é compatível com dispositivos Thunderbolt, como eGPUs.
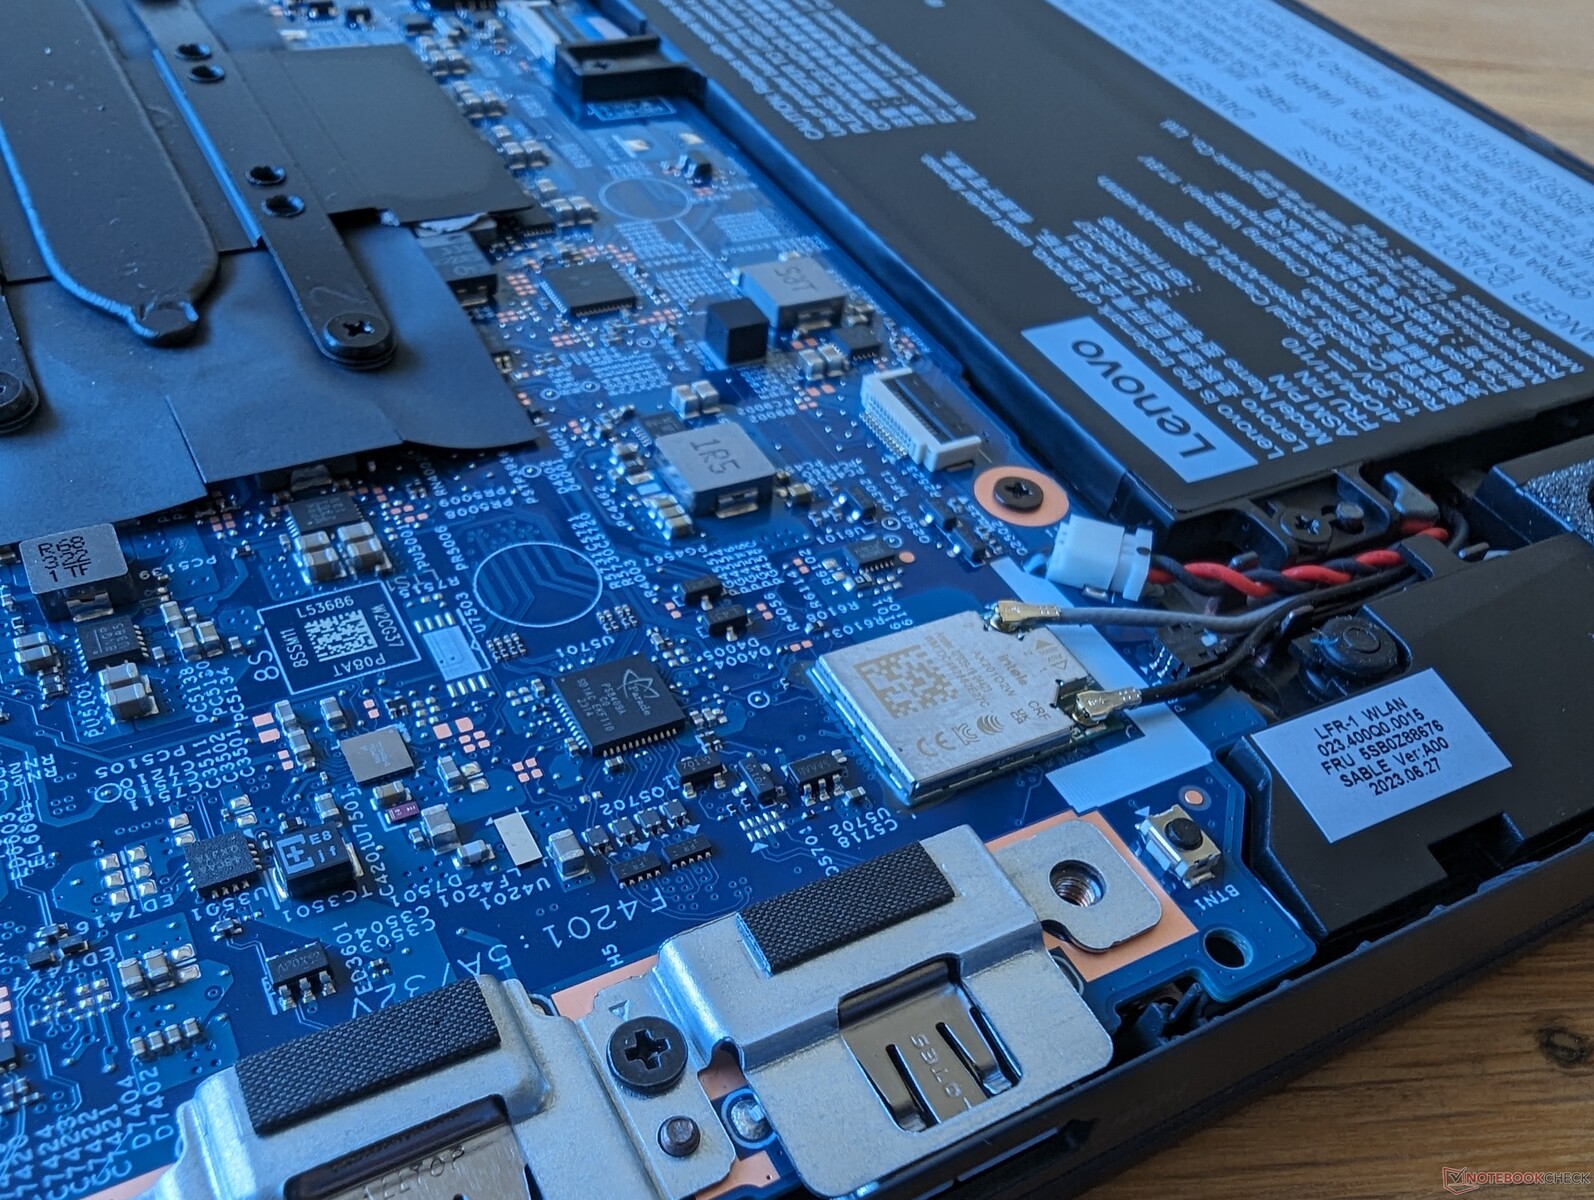
Comunicação
Um Intel AX201 vem como padrão para suporte a Wi-Fi 6 e Bluetooth 5.1, enquanto o Intel AX211 com Wi-Fi 6E é opcional.
| Networking | |
| iperf3 transmit AX12 | |
| MSI Summit E13 Flip Evo A11MT | |
| iperf3 receive AX12 | |
| MSI Summit E13 Flip Evo A11MT | |
| iperf3 transmit AXE11000 | |
| Framework Laptop 13.5 Ryzen 7 7840U | |
| Lenovo ThinkPad L13 Yoga G4 i7-1355U | |
| HP Elite Dragonfly Folio 13.5 G3 | |
| Dell Latitude 9330 | |
| Lenovo ThinkPad L13 Yoga G4 21FSS00100 | |
| iperf3 receive AXE11000 | |
| Lenovo ThinkPad L13 Yoga G4 21FSS00100 | |
| Framework Laptop 13.5 Ryzen 7 7840U | |
| Lenovo ThinkPad L13 Yoga G4 i7-1355U | |
| HP Elite Dragonfly Folio 13.5 G3 | |
| Dell Latitude 9330 | |
| iperf3 transmit AXE11000 6GHz | |
| Framework Laptop 13.5 Ryzen 7 7840U | |
| HP Elite Dragonfly Folio 13.5 G3 | |
| Dell Latitude 9330 | |
| Lenovo ThinkPad L13 Yoga G4 21FSS00100 | |
| iperf3 receive AXE11000 6GHz | |
| Lenovo ThinkPad L13 Yoga G4 21FSS00100 | |
| HP Elite Dragonfly Folio 13.5 G3 | |
| Framework Laptop 13.5 Ryzen 7 7840U | |
| Dell Latitude 9330 | |
Webcam
O IR é opcional, enquanto o obturador de privacidade é padrão. As SKUs de baixo custo vêm apenas com uma webcam de 720p, enquanto as SKUs de alto custo oferecem 1080p.


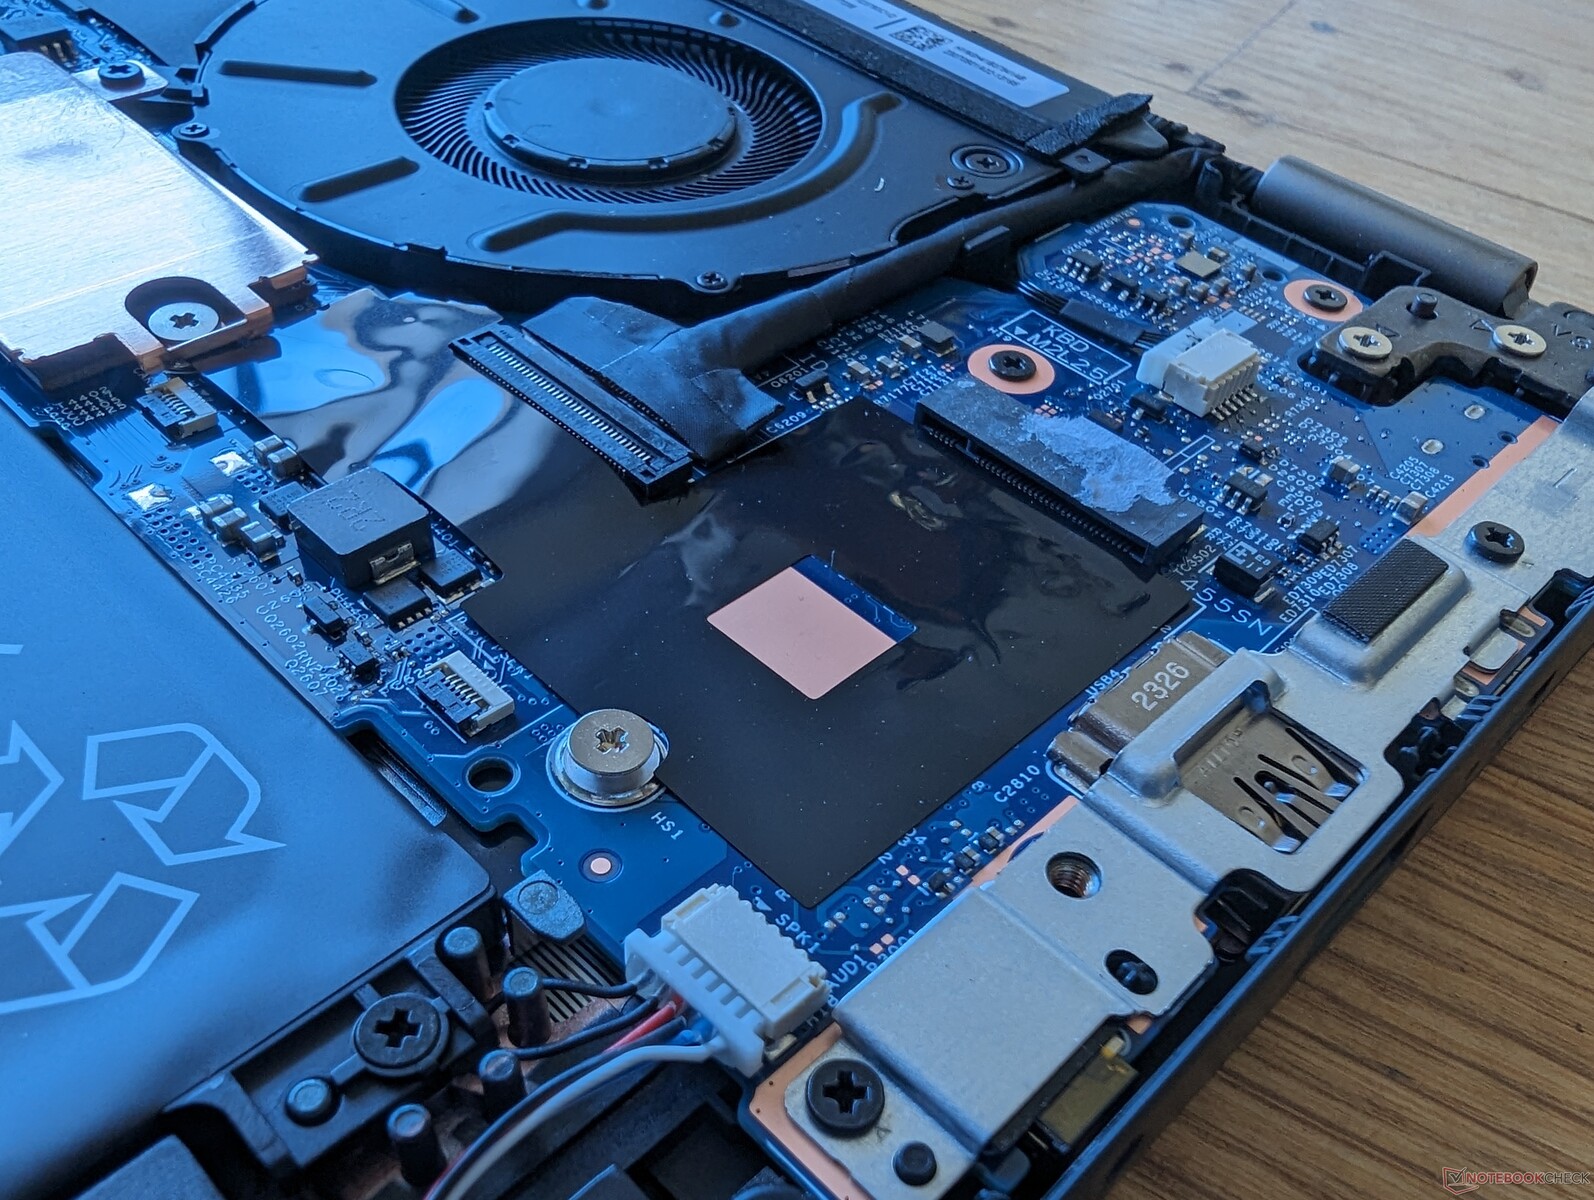
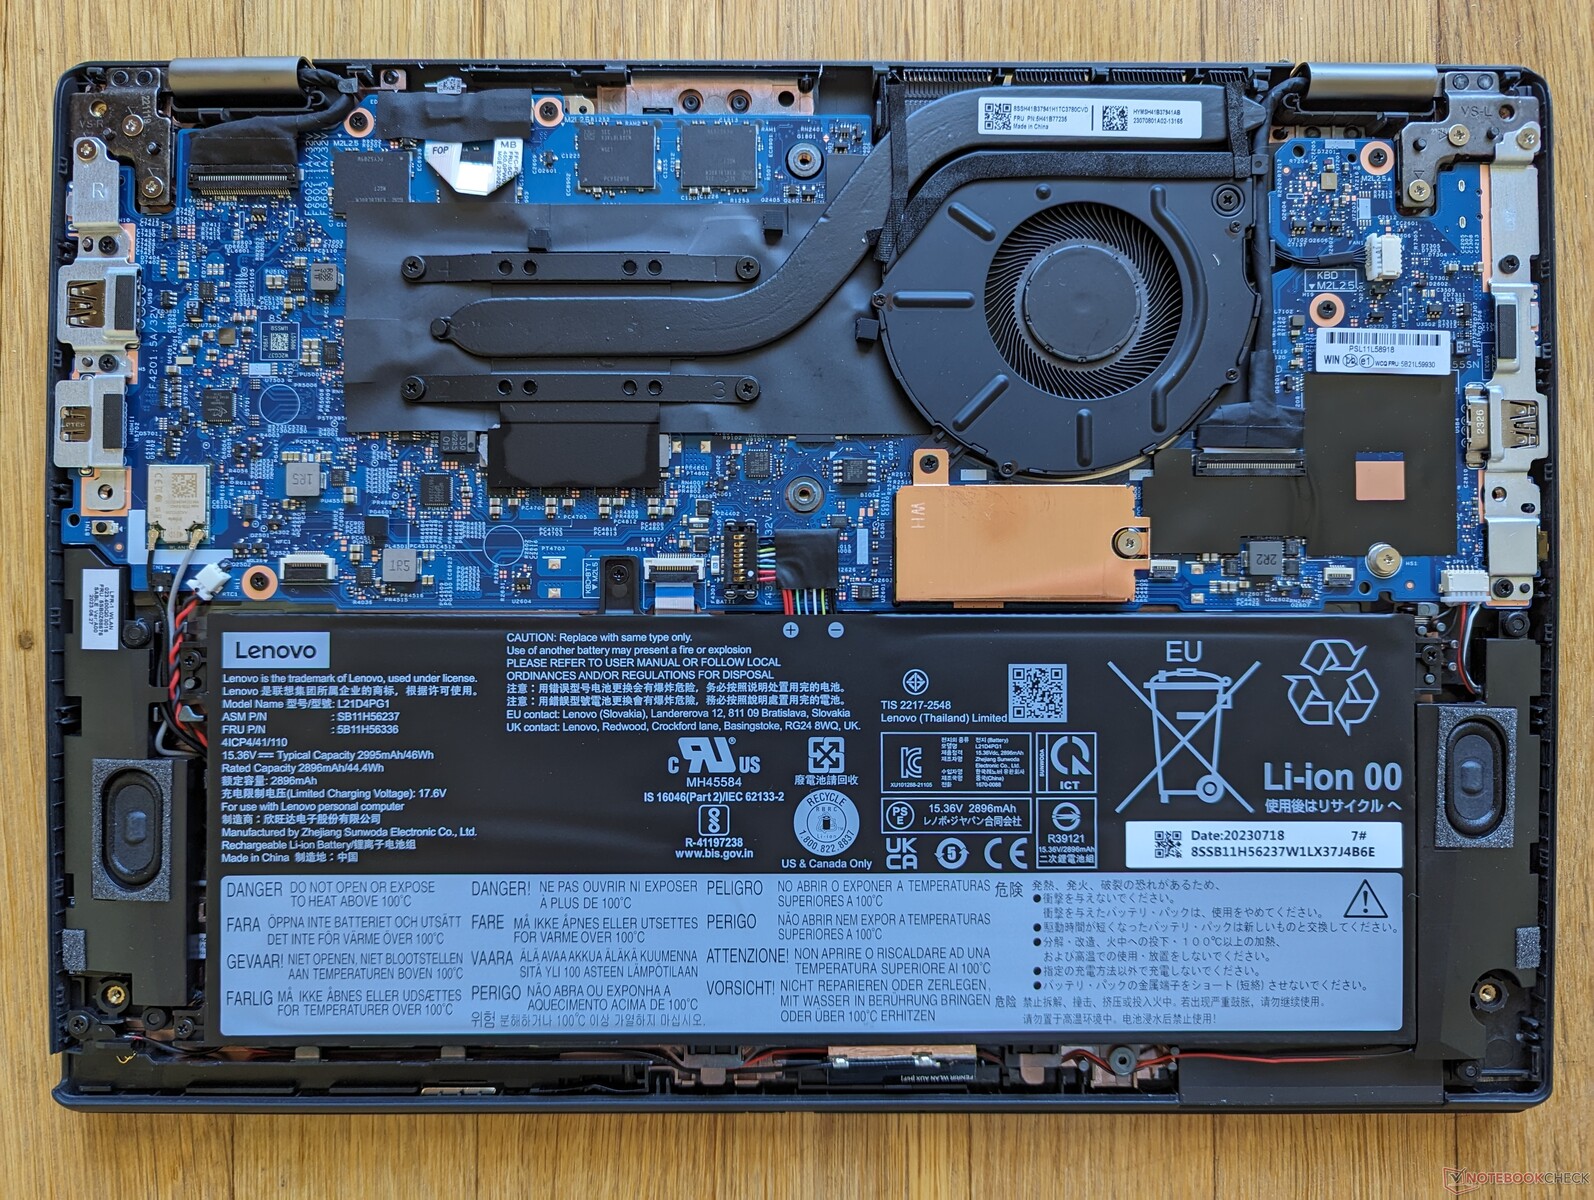
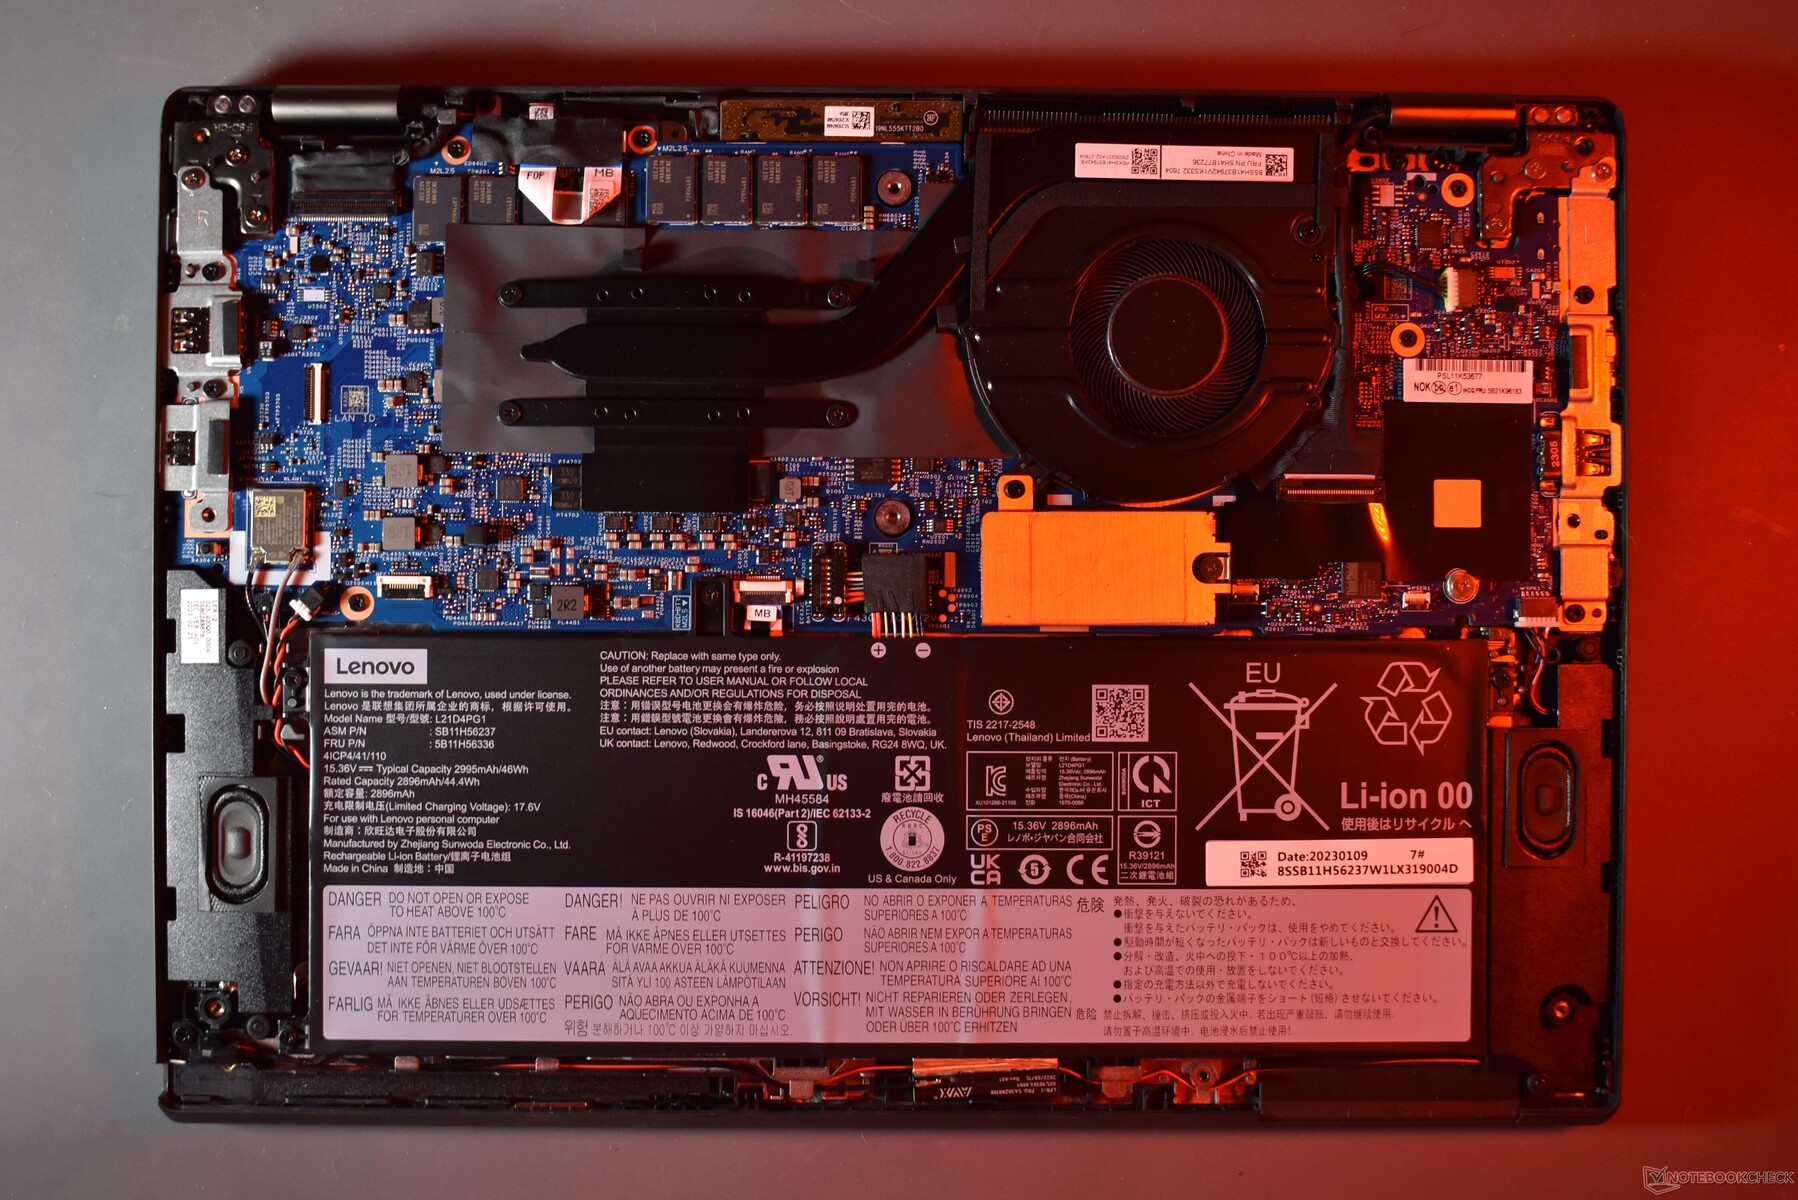
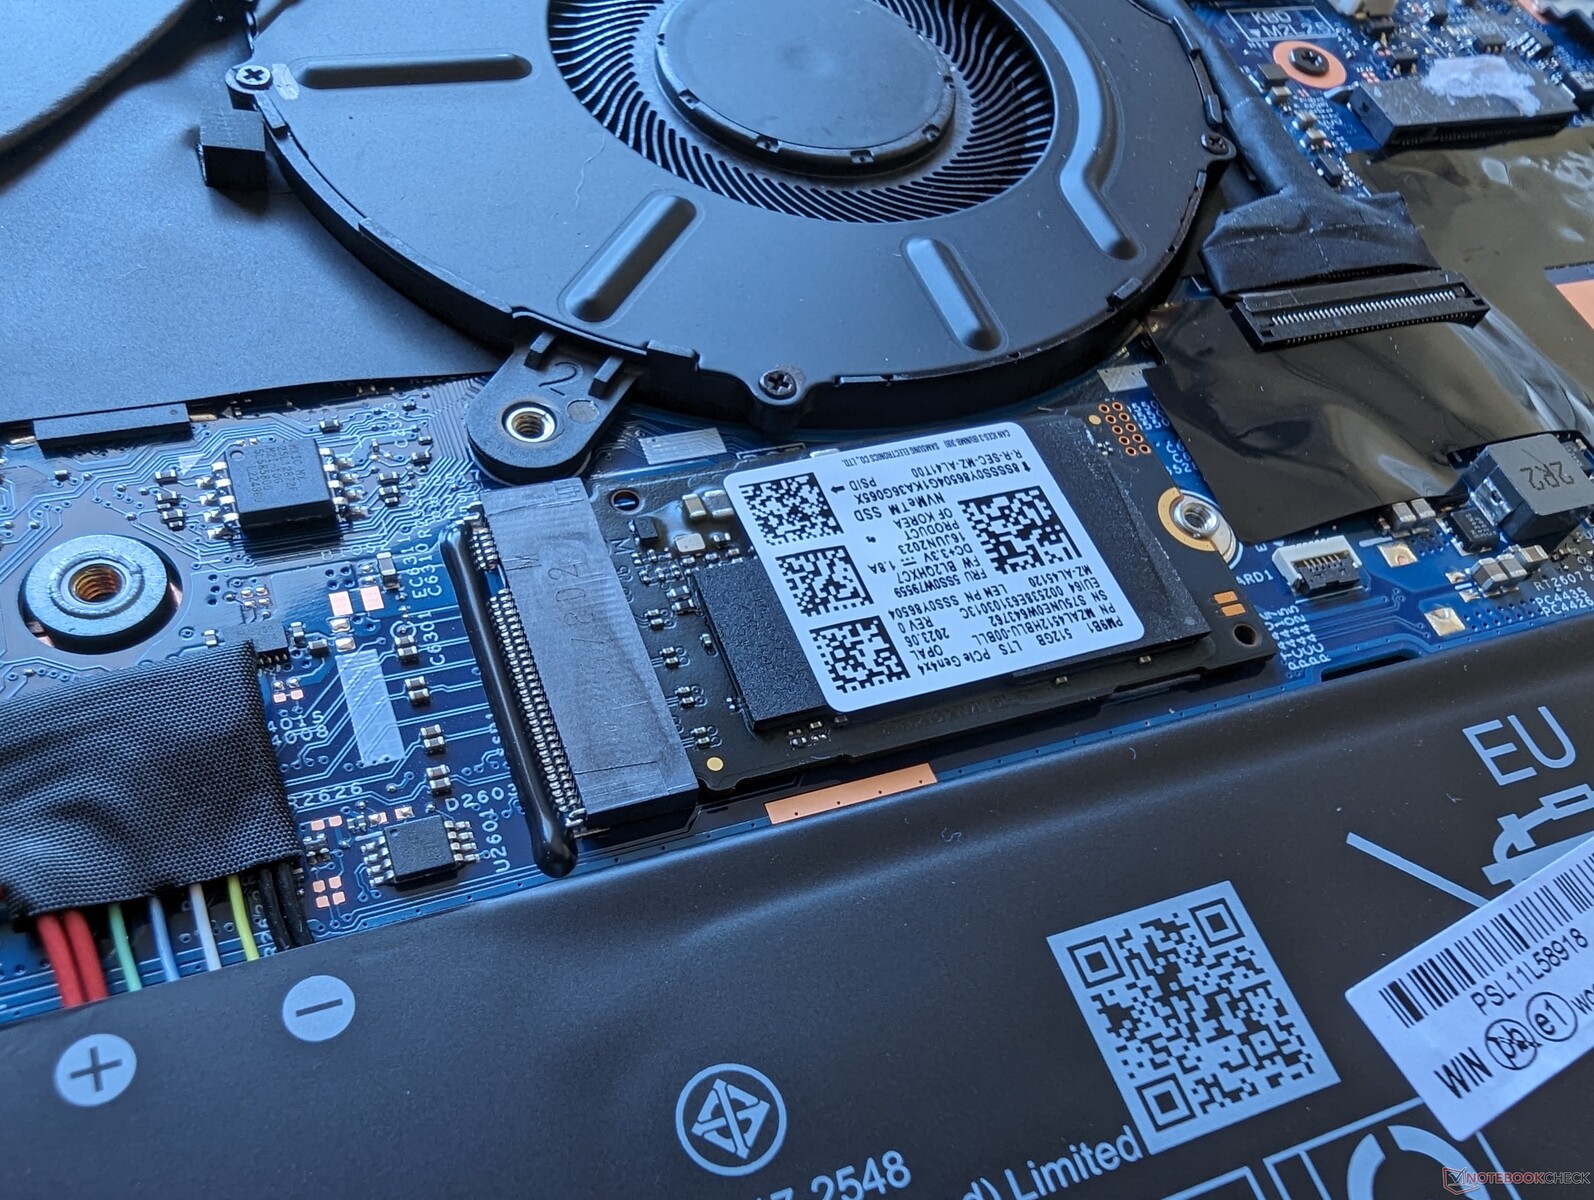
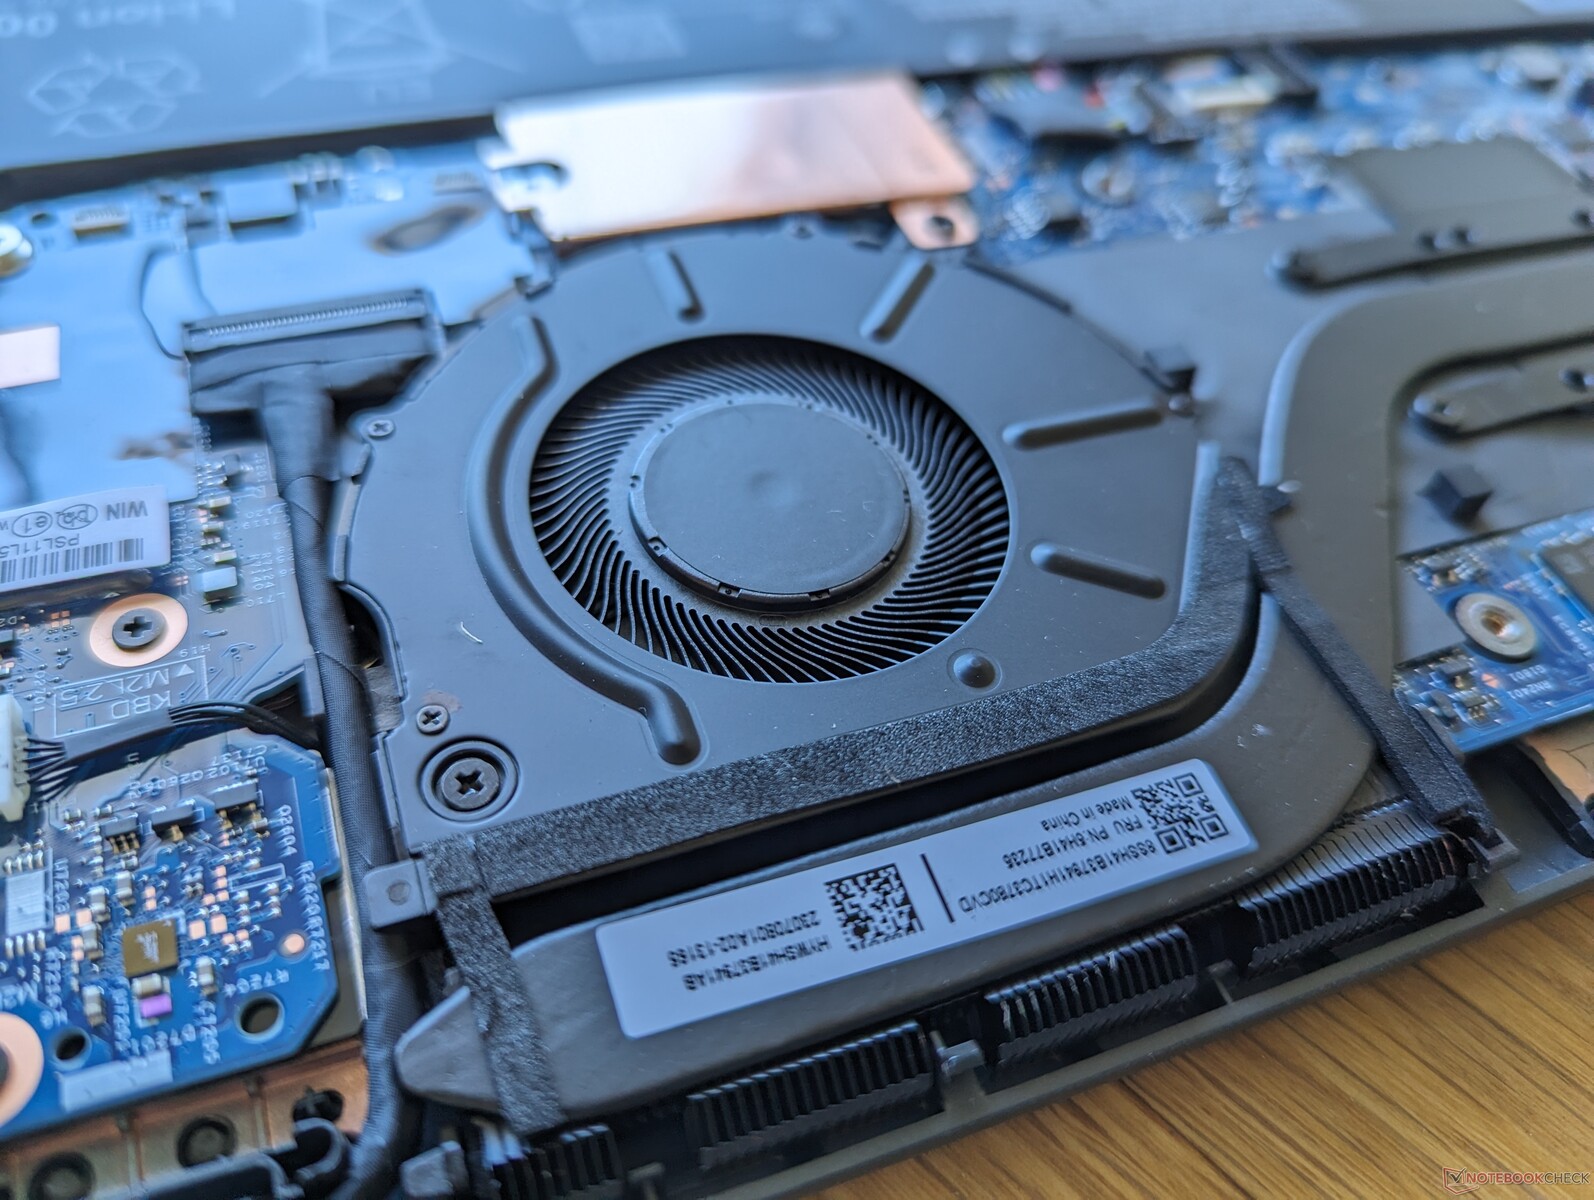
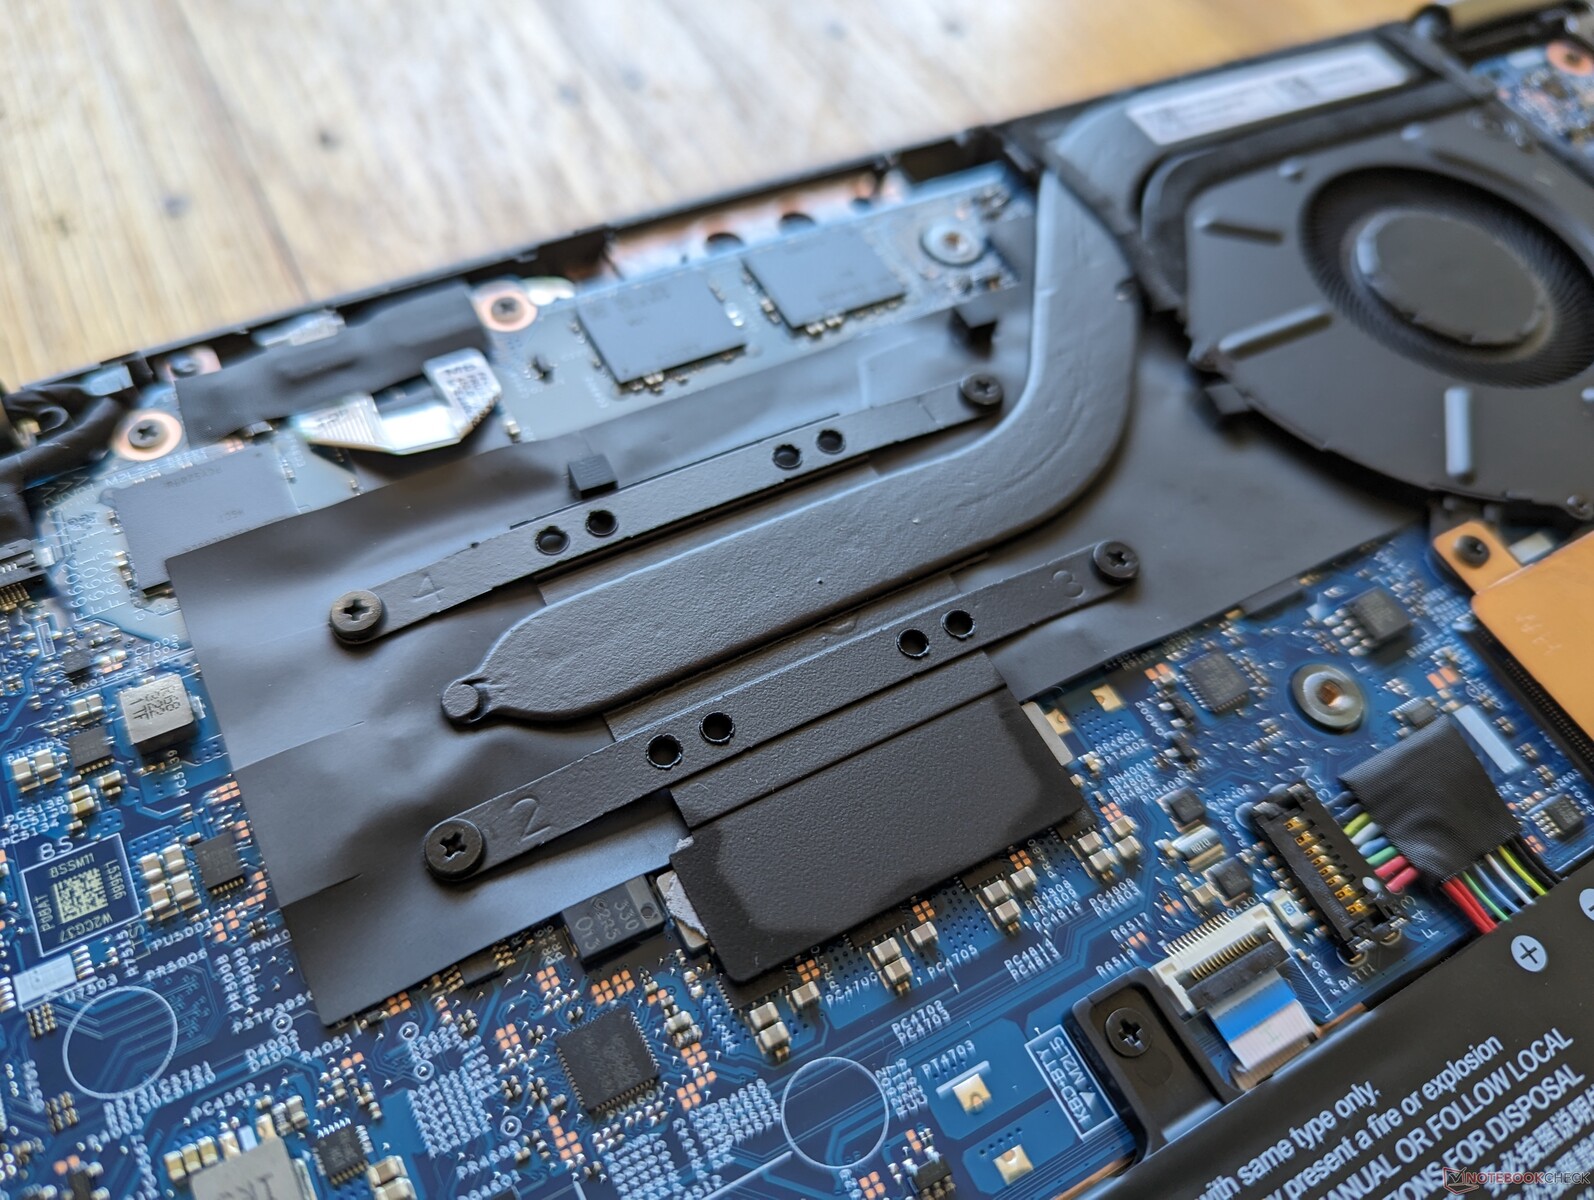
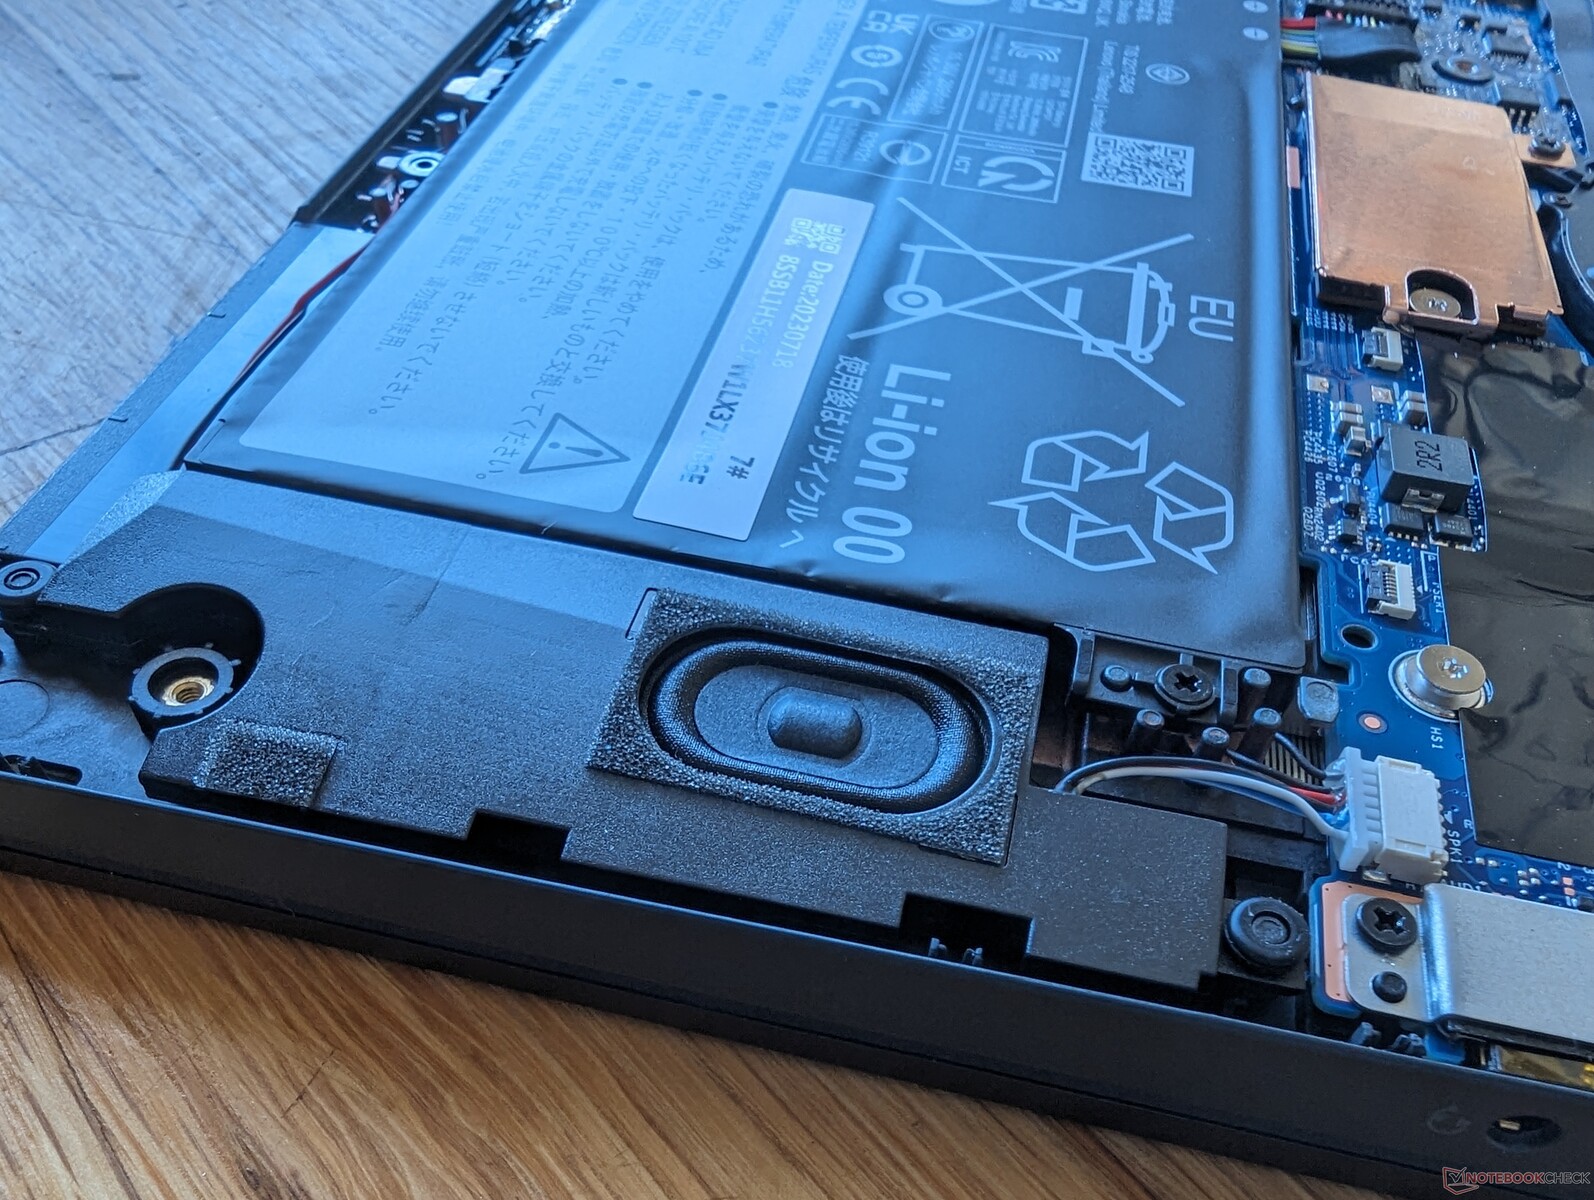
Manutenção
Não há grandes diferenças internas em termos de capacidade de atualização entre as versões AMD e Intel, como mostram as imagens de comparação abaixo.
Acessórios e garantia
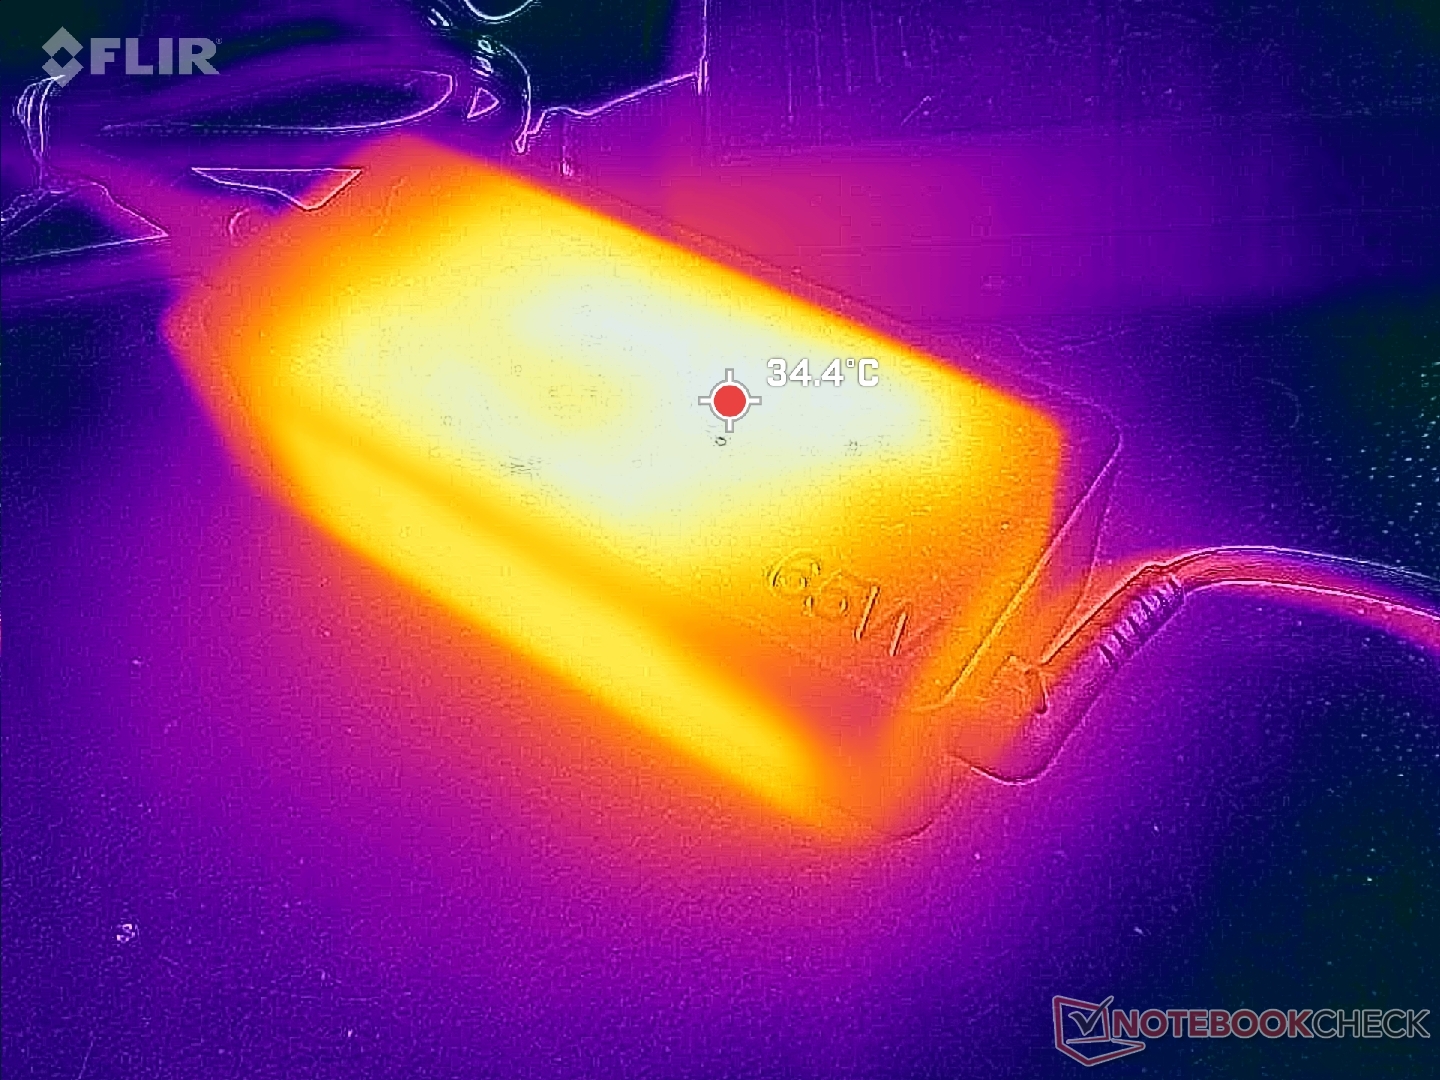
A caixa de varejo inclui um adaptador CA e uma caneta stylus ativa. A caneta está alojada dentro do próprio laptop para maior praticidade e carregamento.
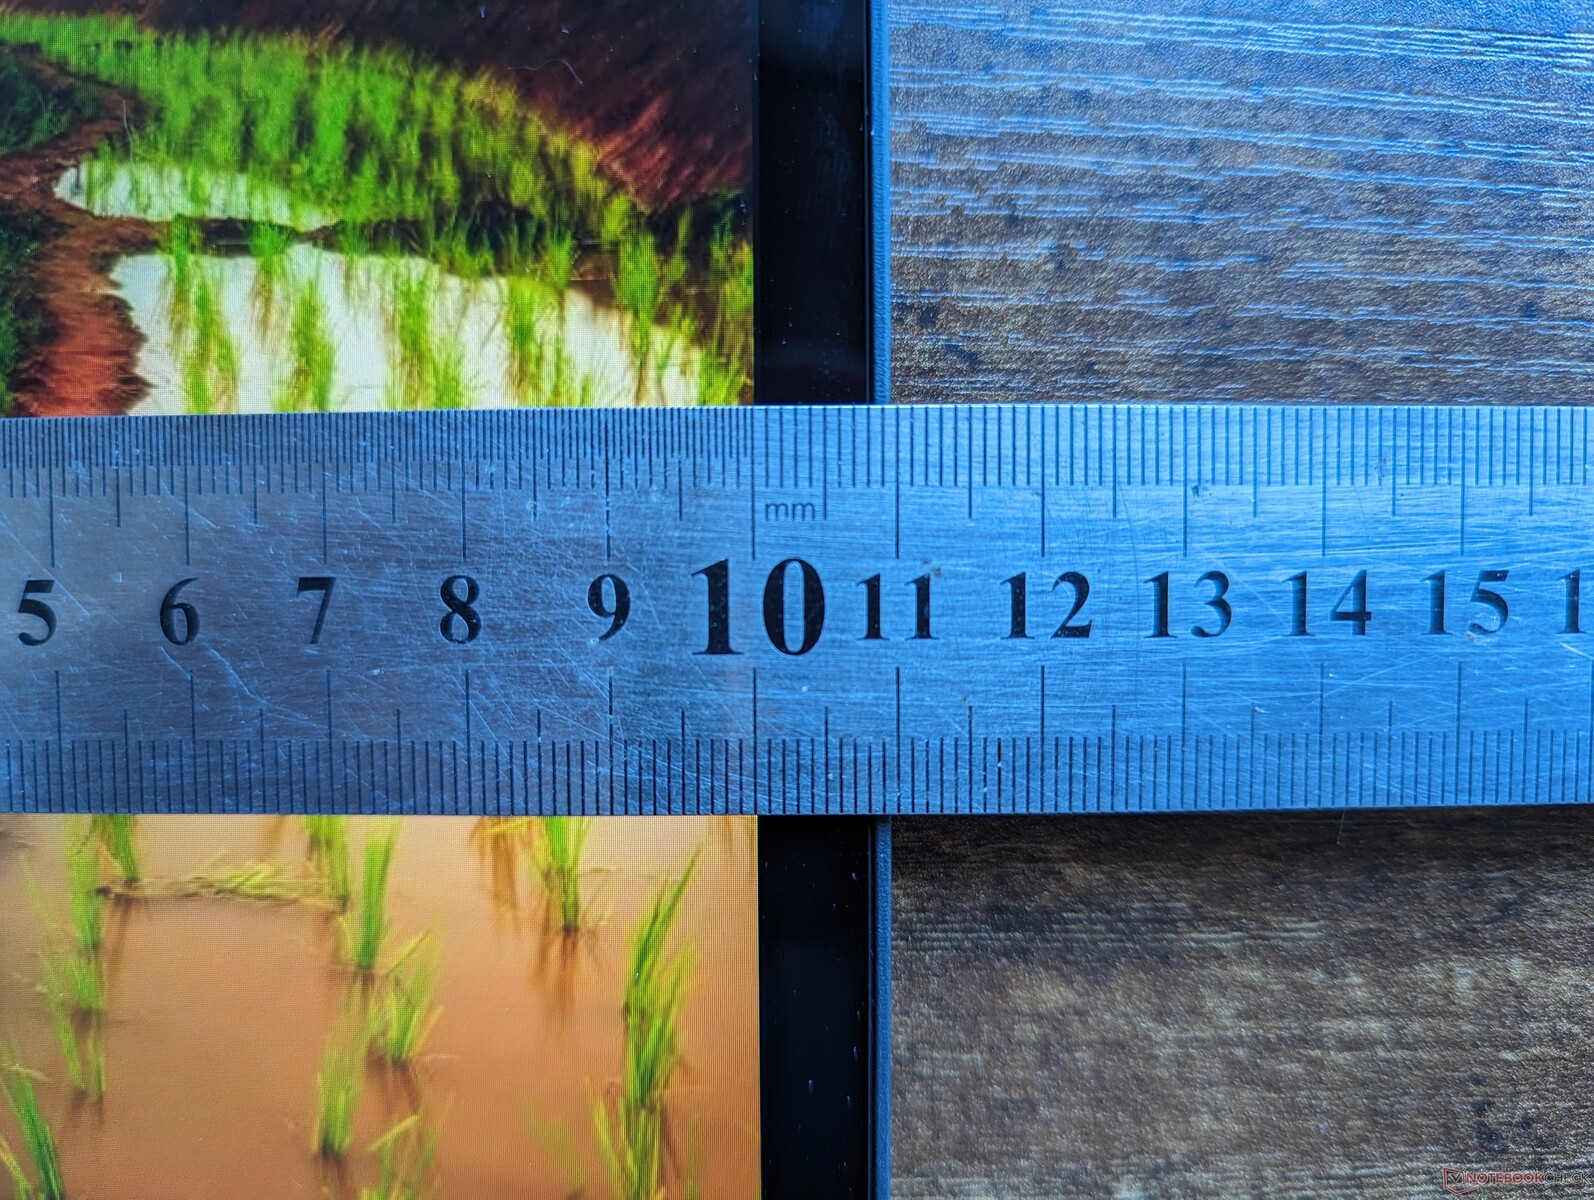
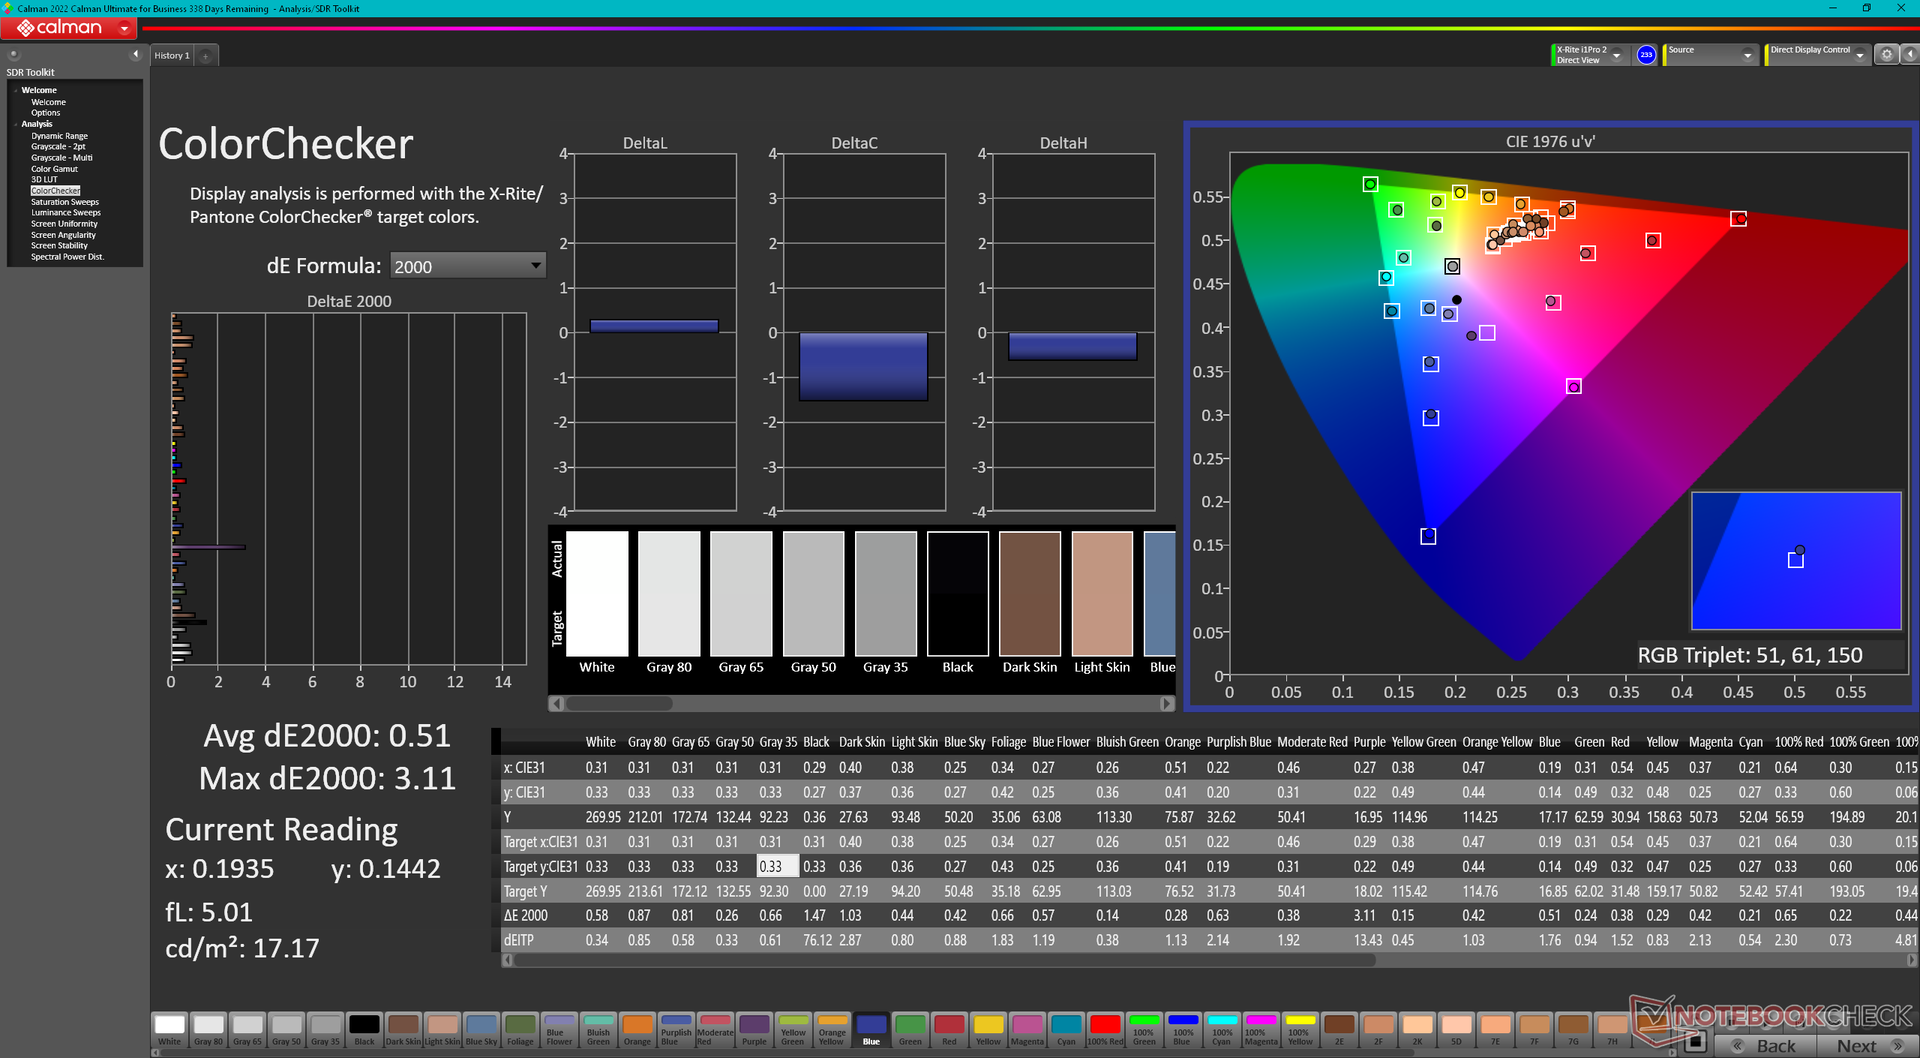
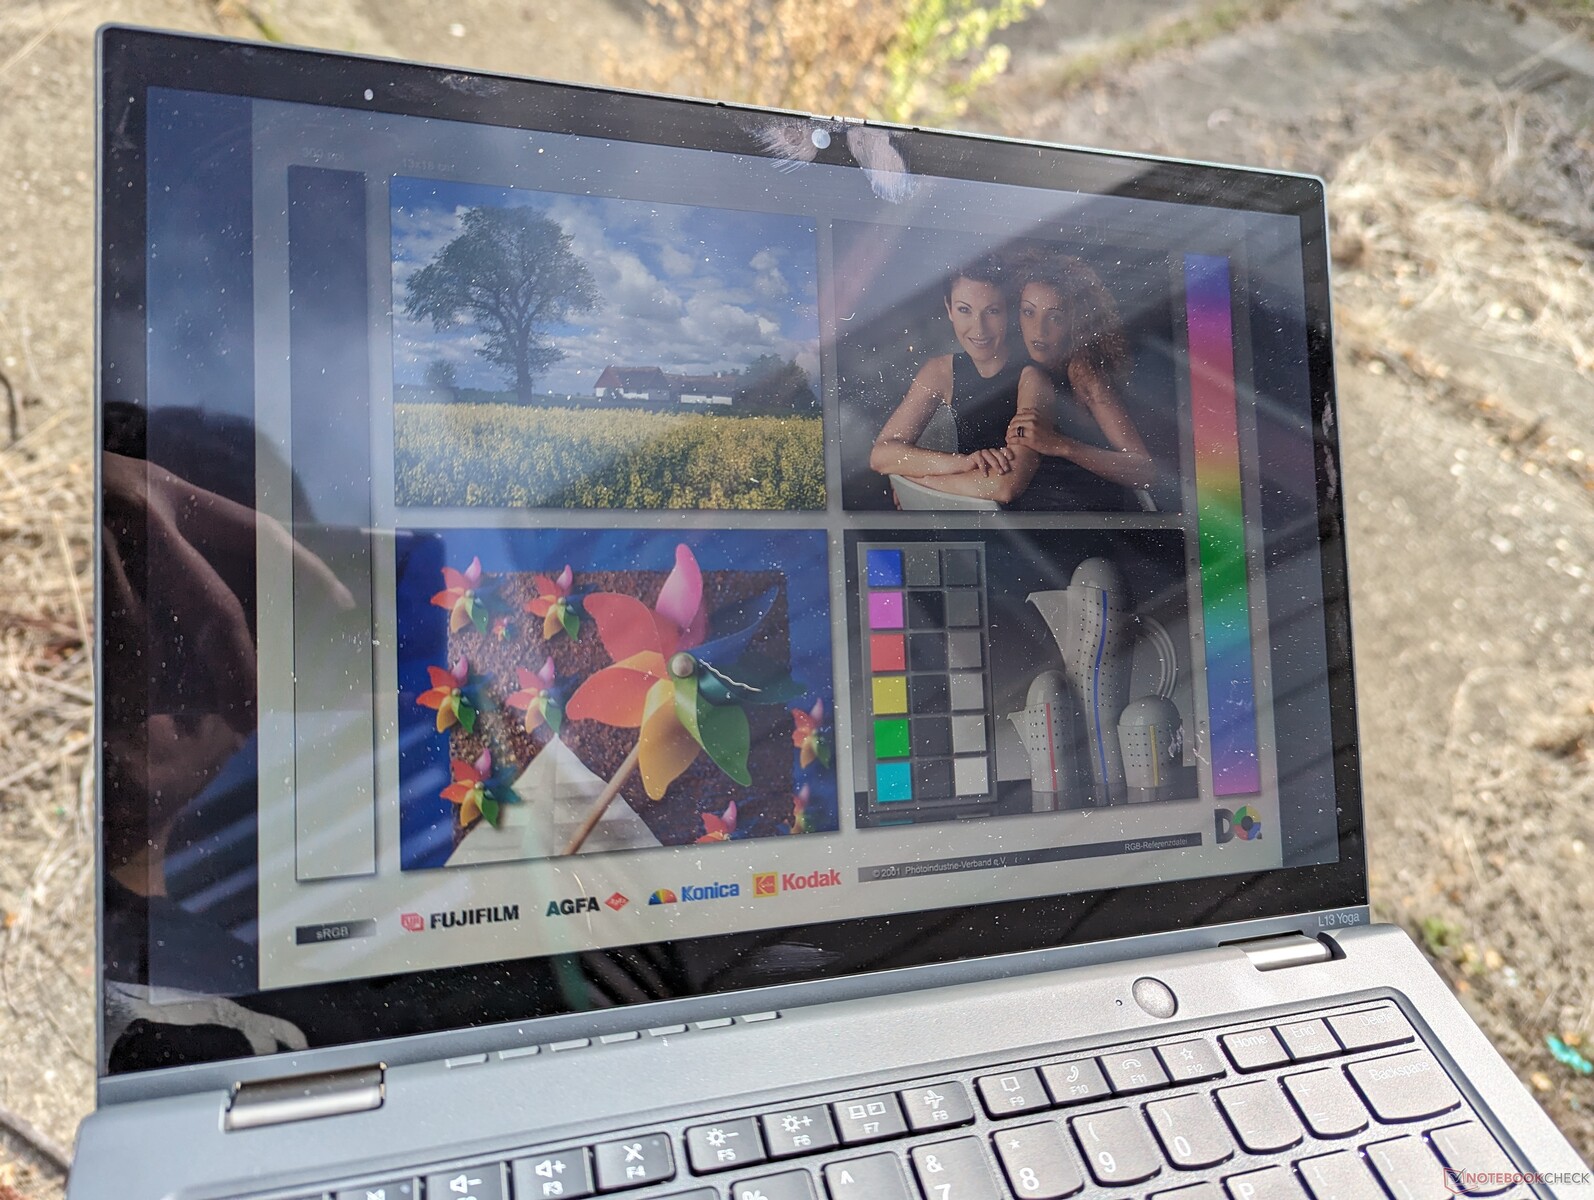
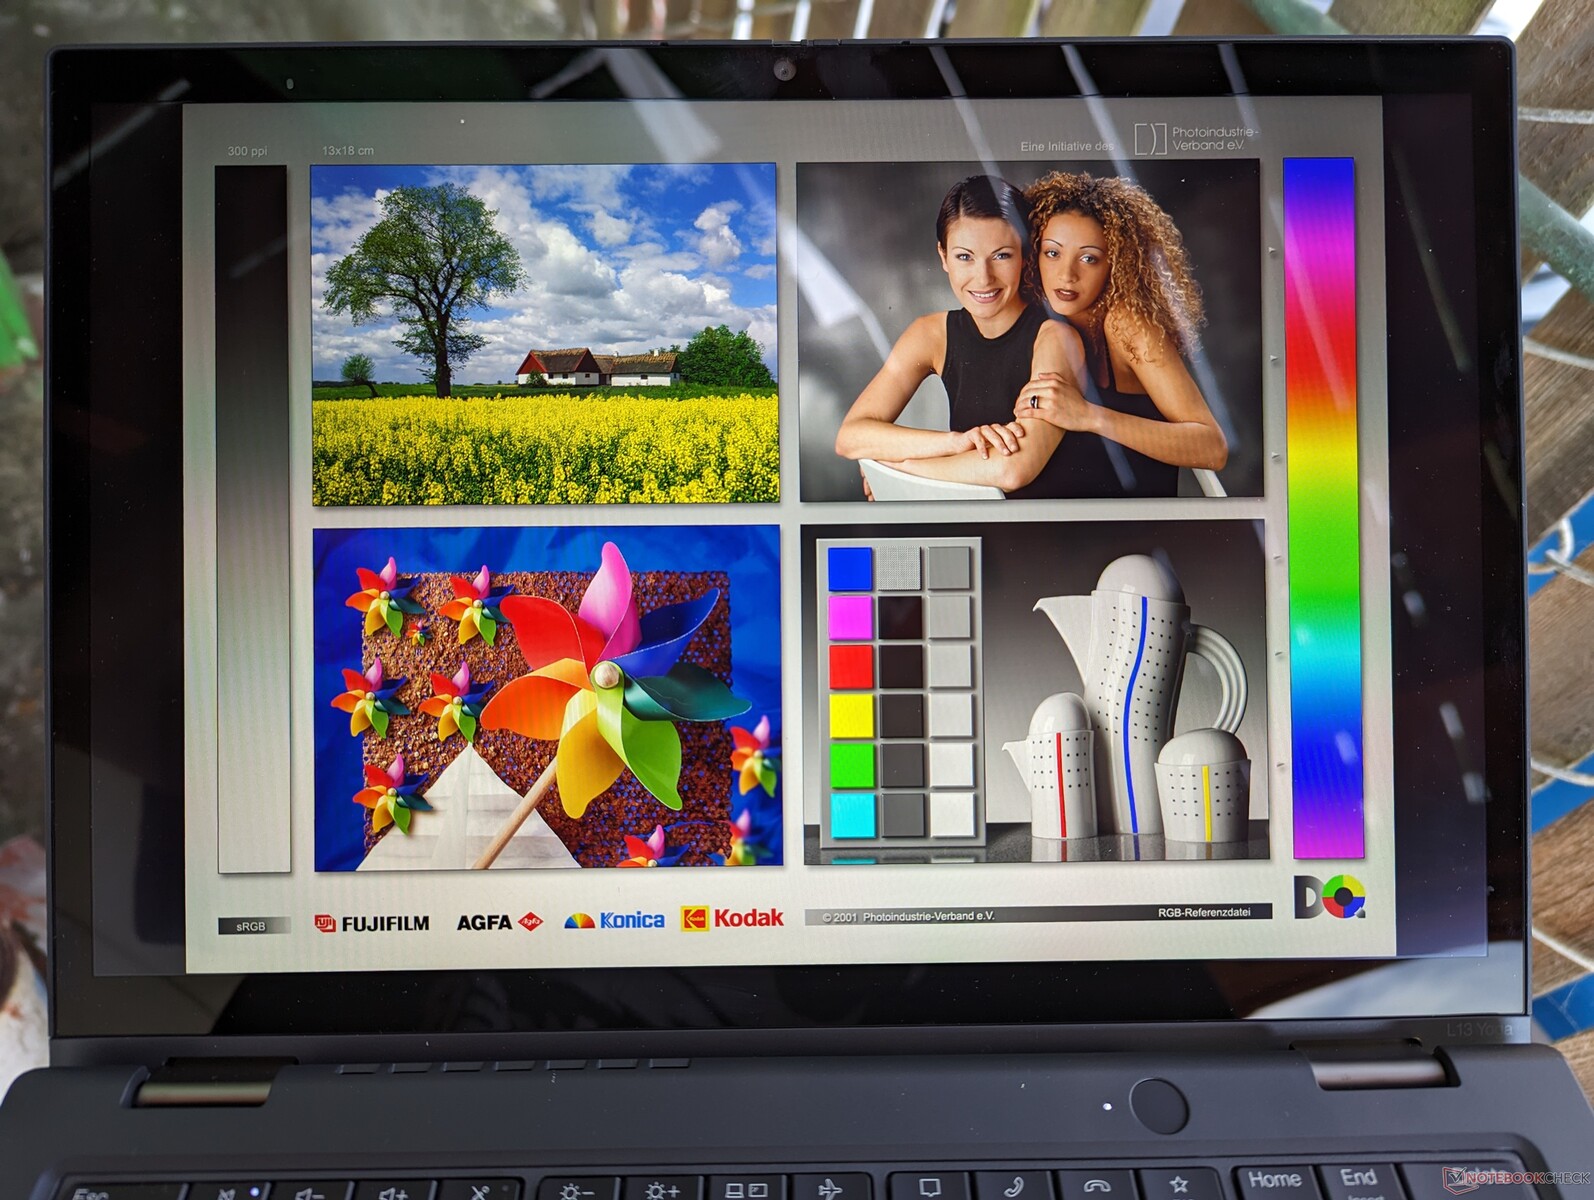
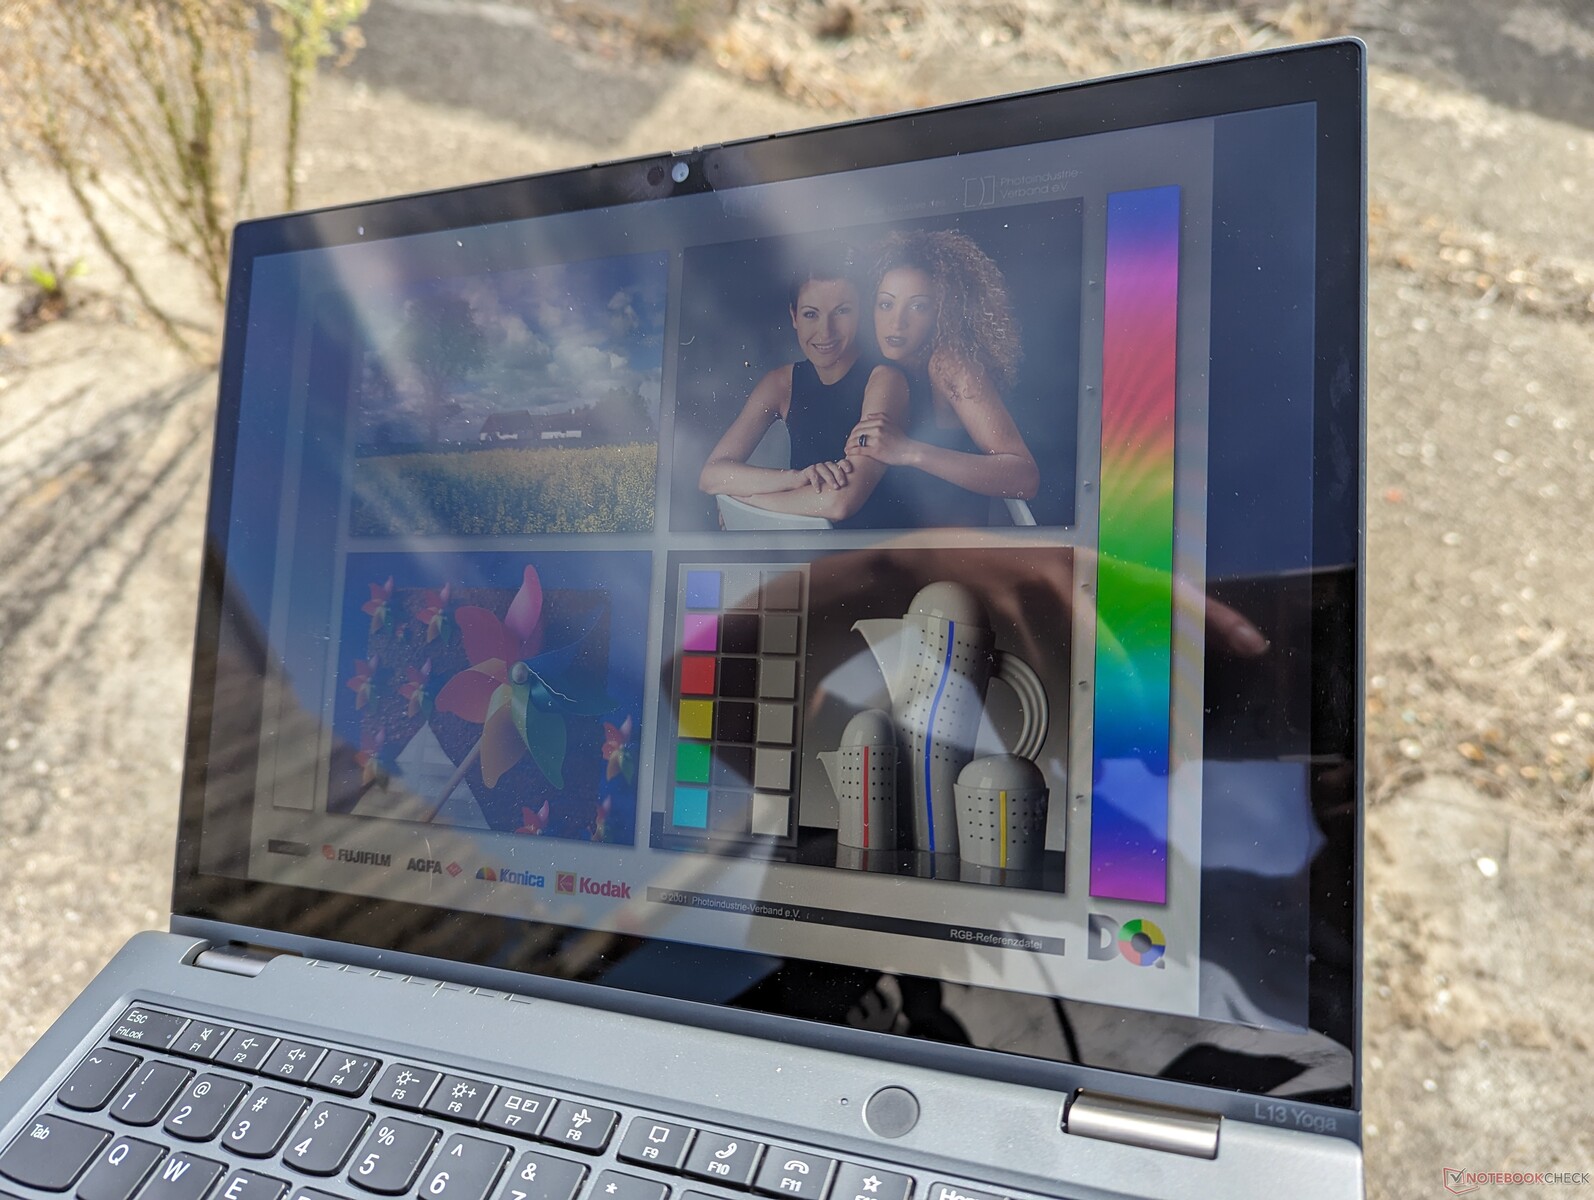
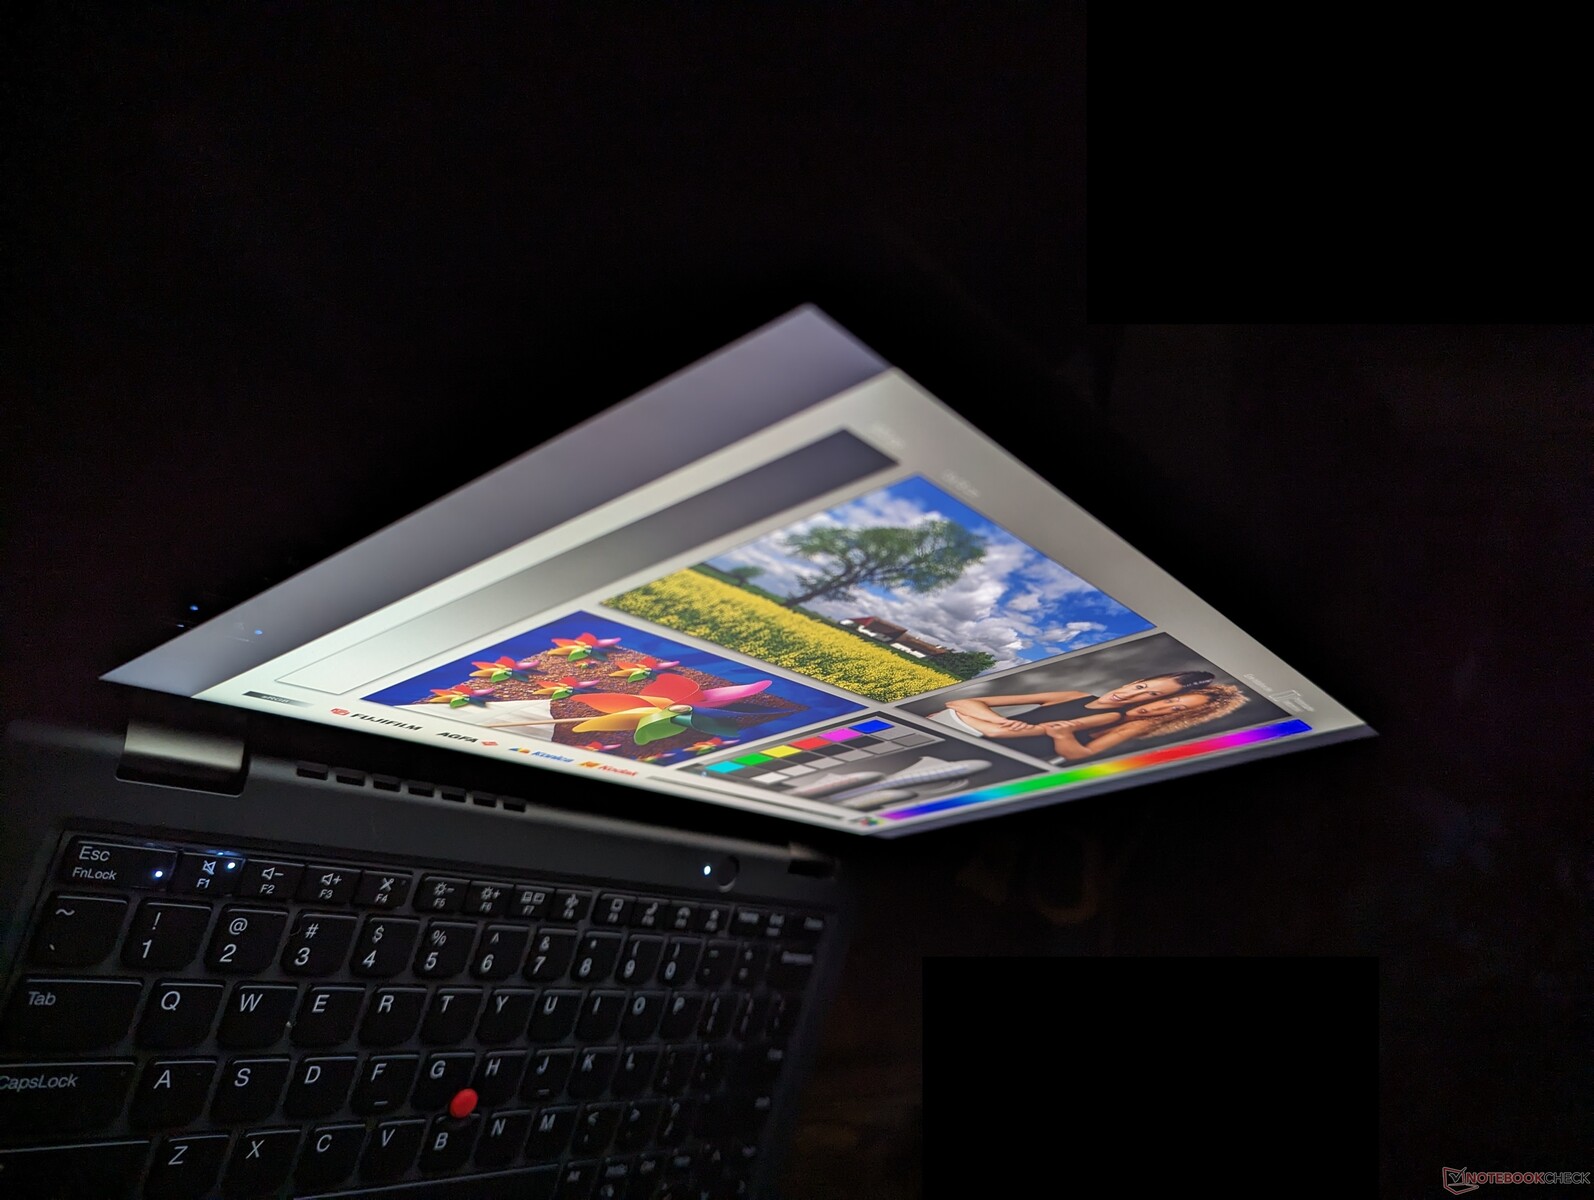
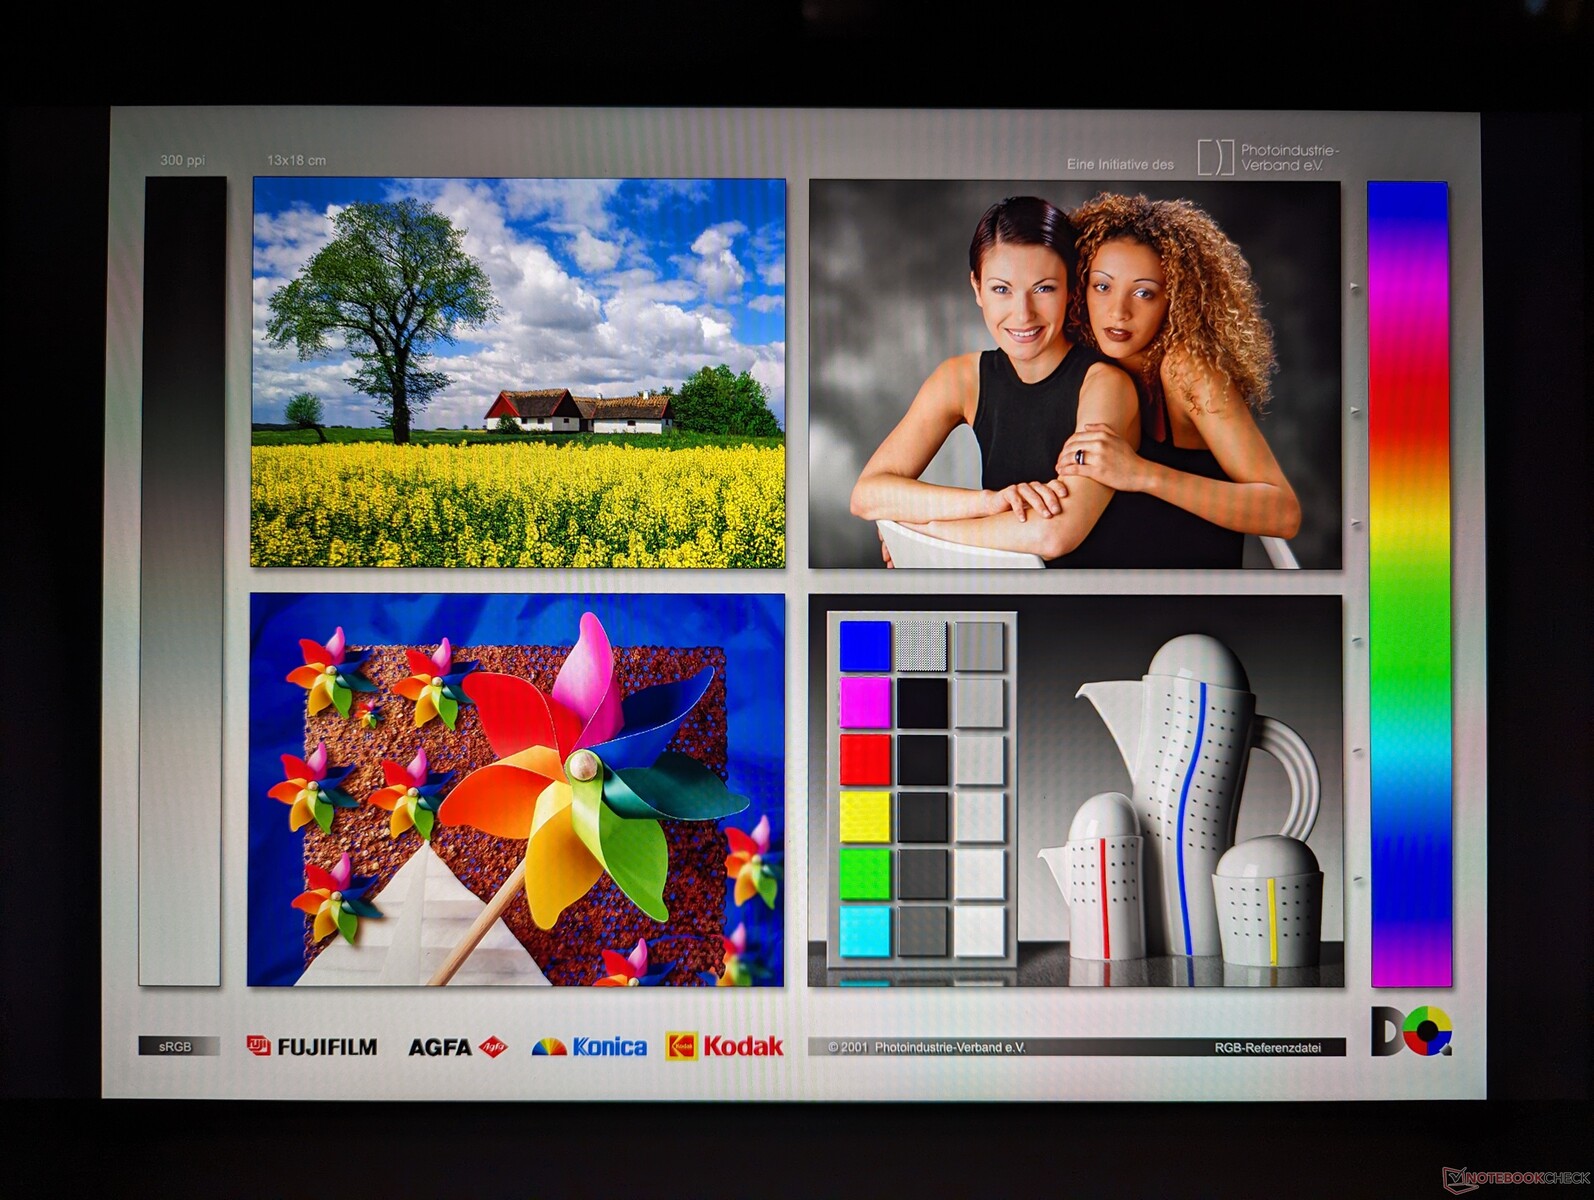
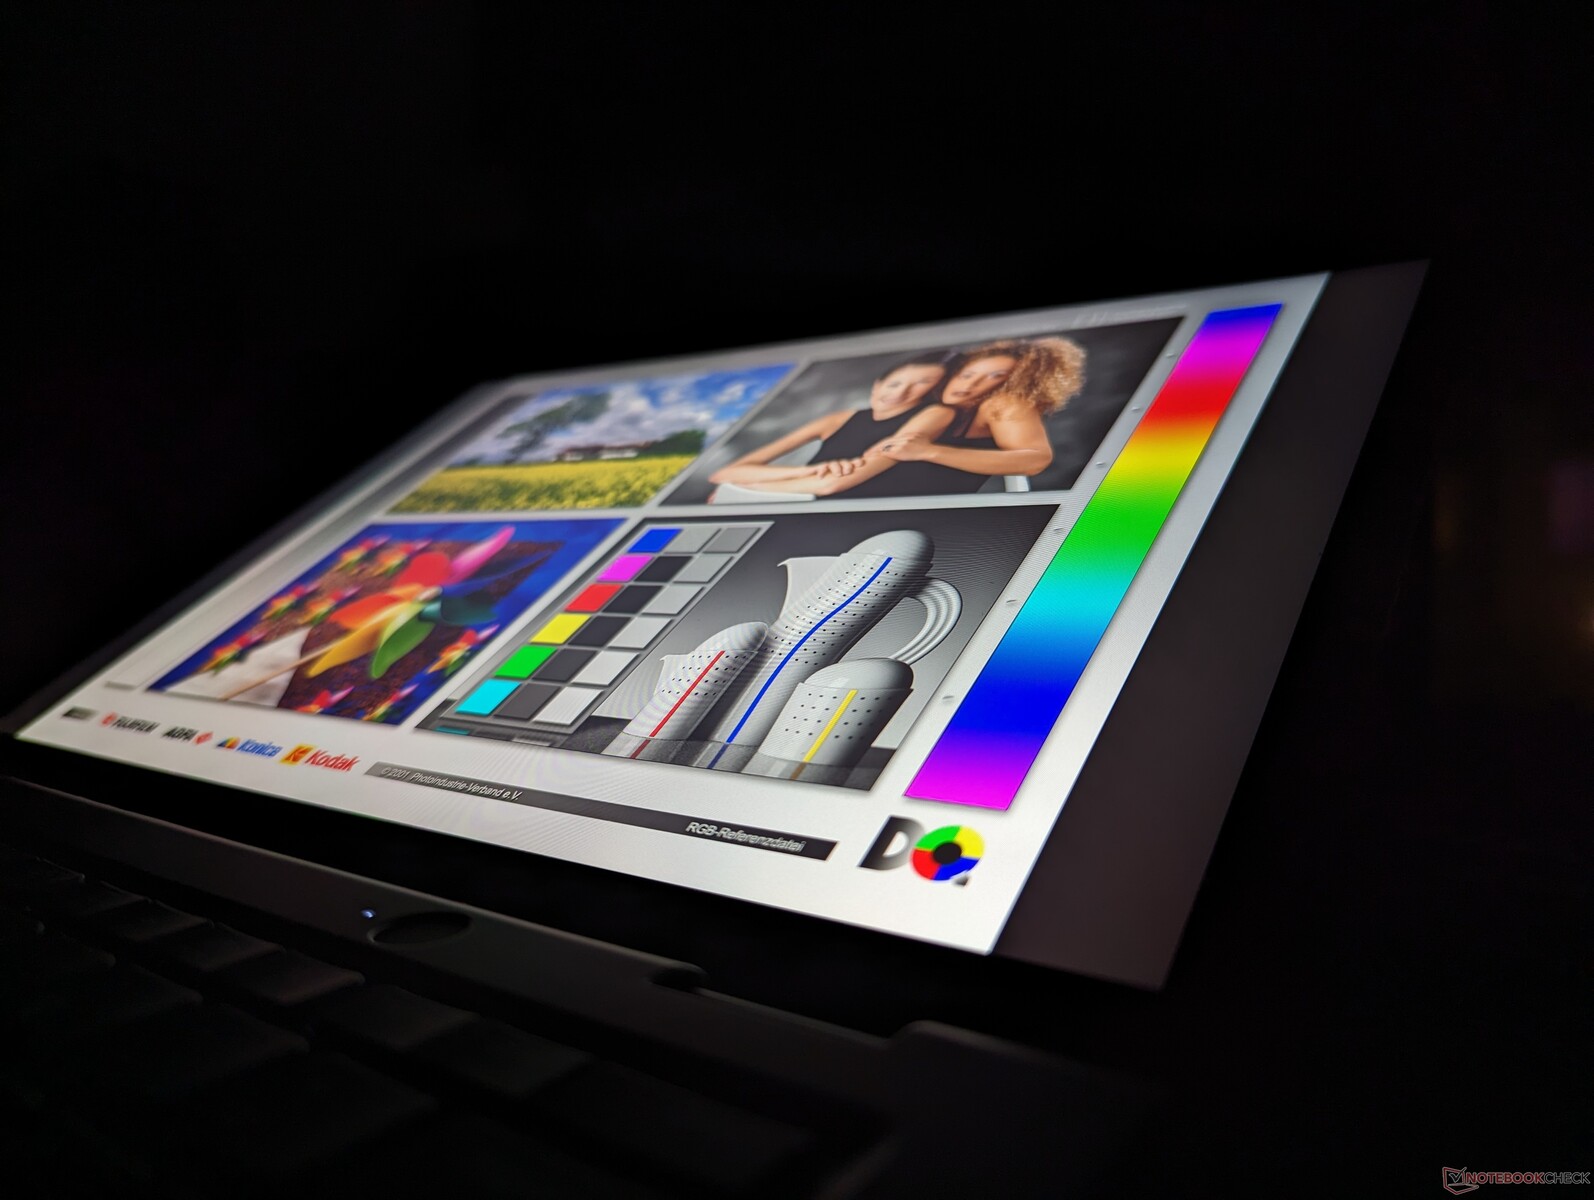
Tela
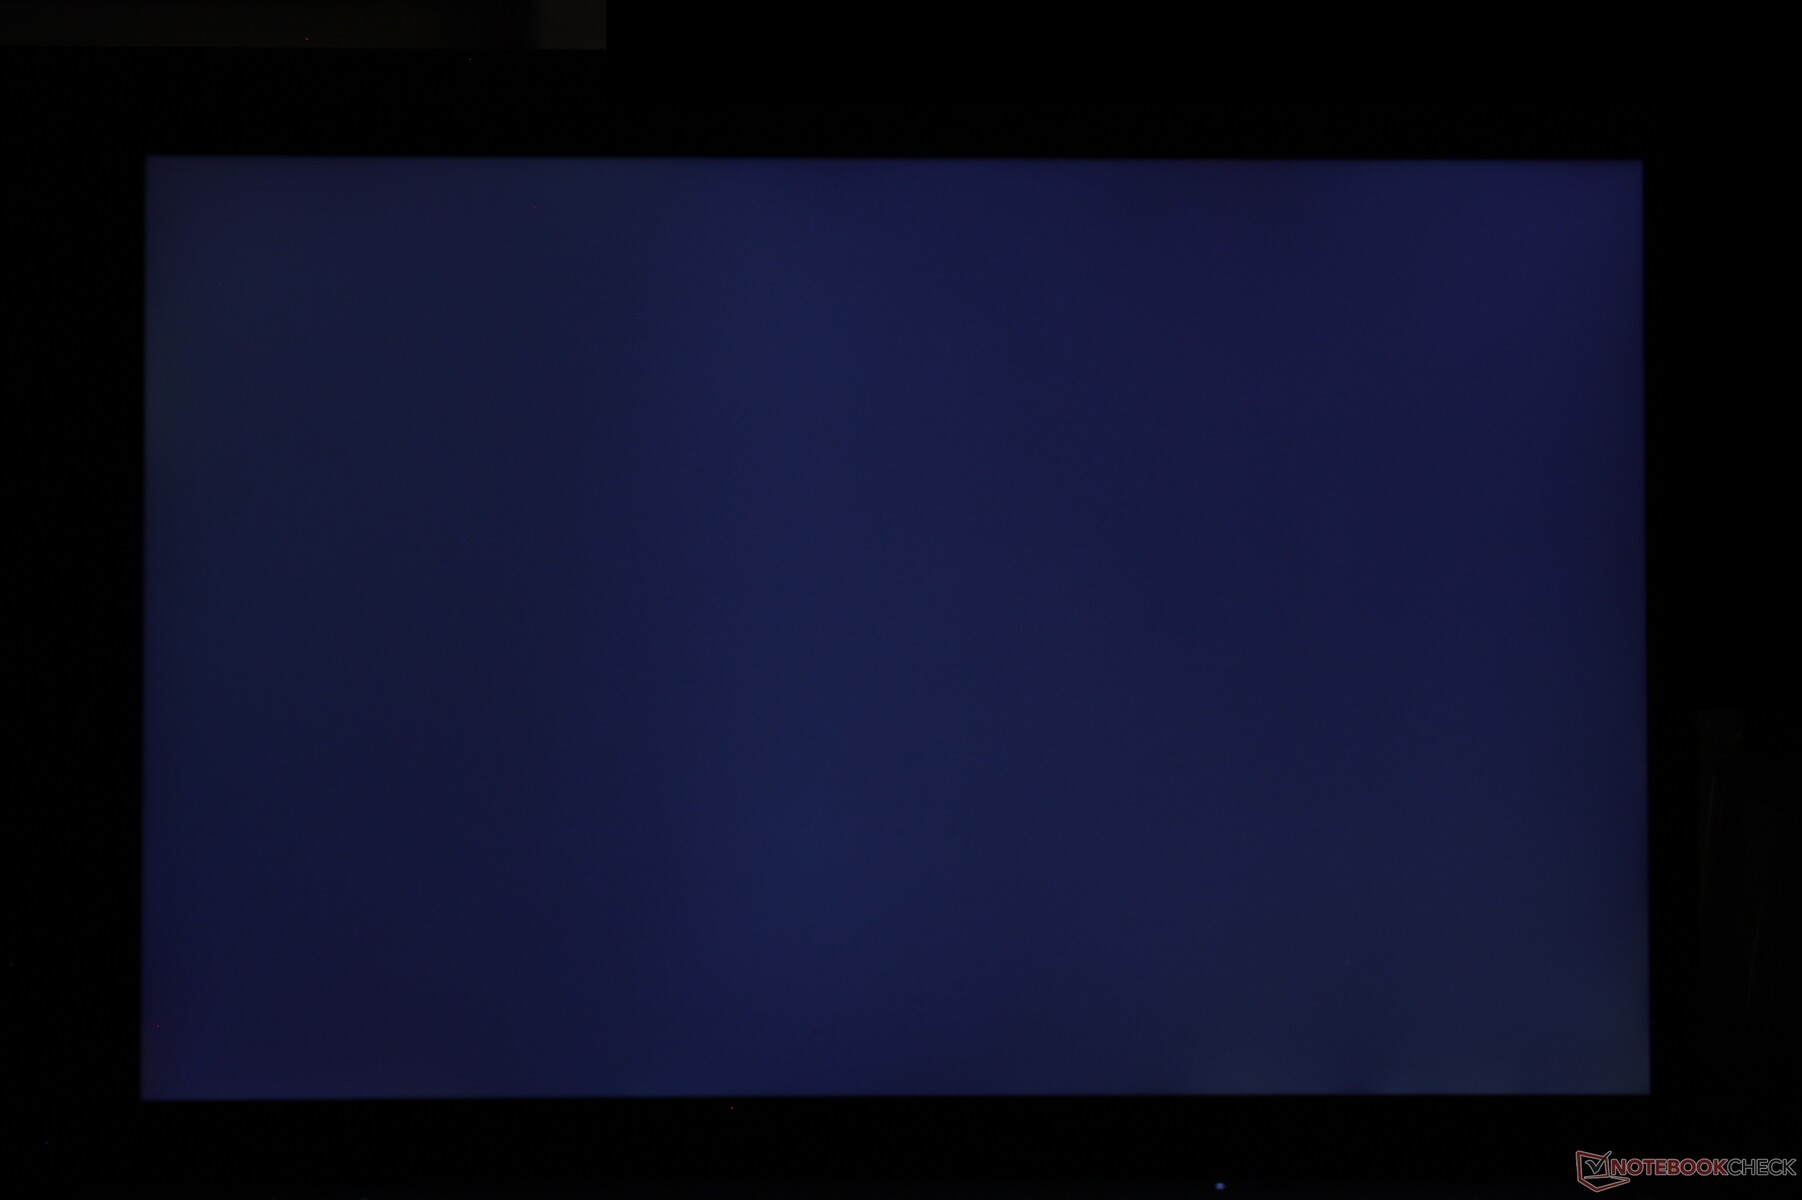
Nossa unidade Intel vem com um painel IPS de 1200p diferente do encontrado em nossa unidade AMD (NV133WUM-N61 vs. B133UAN01.2). Esse painel em particular parece ser um pouco mais escuro, com cerca de 50 a 60 nits, ao mesmo tempo em que oferece tempos de resposta mais rápidos em preto e branco e cinza e cinza para minimizar o efeito fantasma. A cor e a qualidade da imagem são muito semelhantes entre os dois modelos.
É lamentável que a Lenovo não ofereça opções de taxa de atualização de 90 Hz ou 120 Hz, considerando o alto preço pedido de mais de US$ 1.500.

| |||||||||||||||||||||||||
iluminação: 92 %
iluminação com acumulador: 278.1 cd/m²
Contraste: 818:1 (Preto: 0.34 cd/m²)
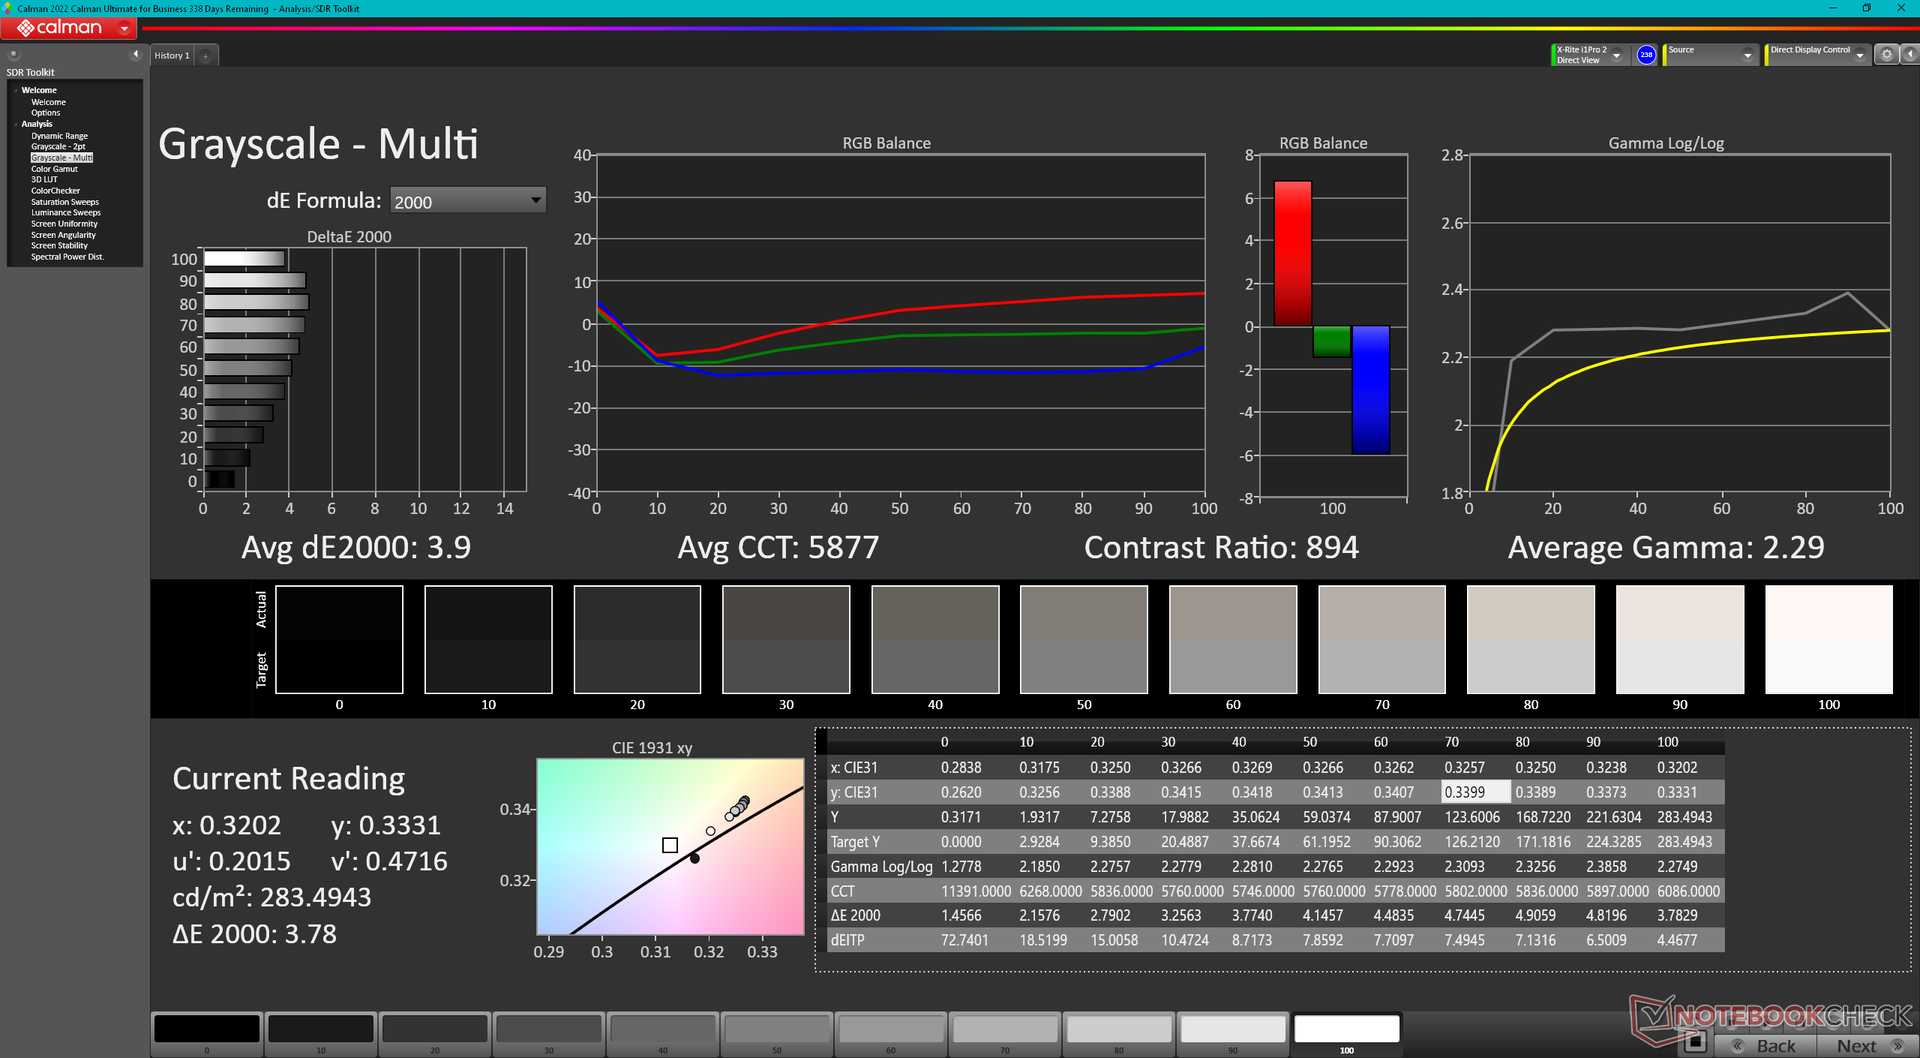
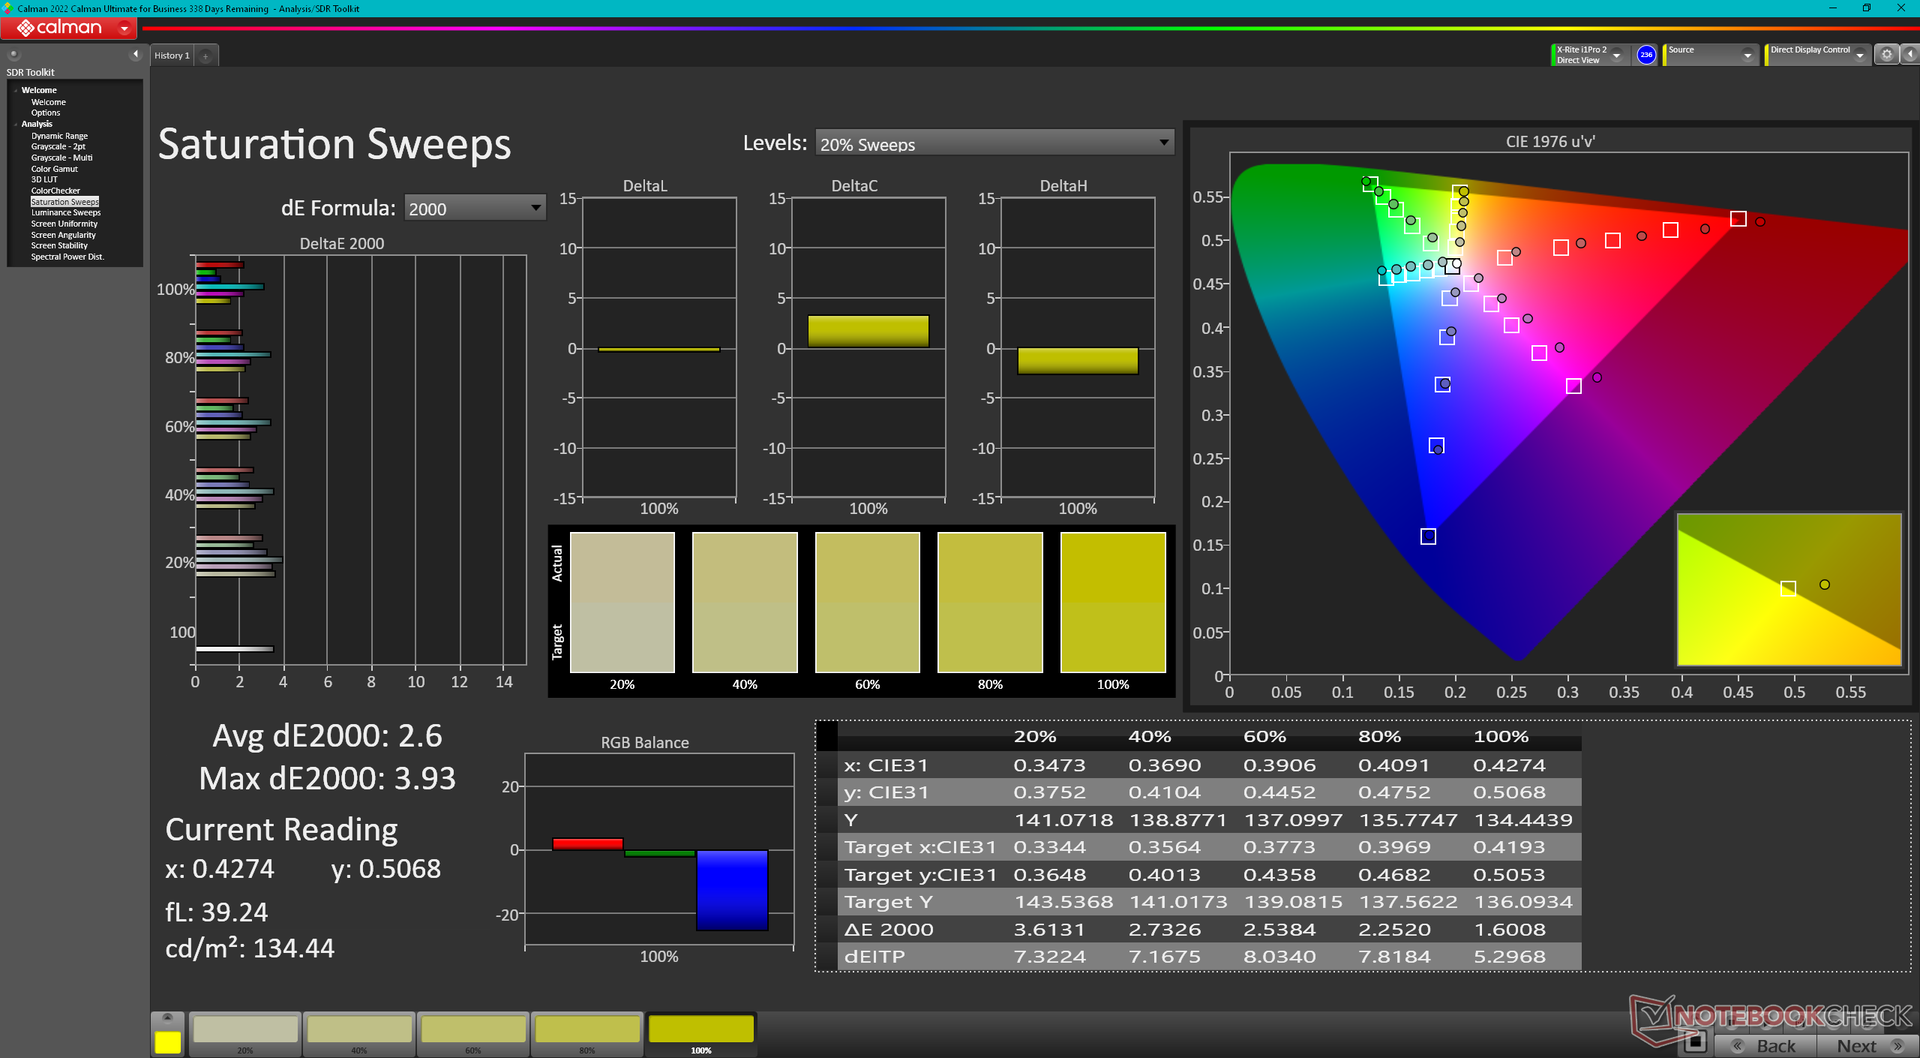
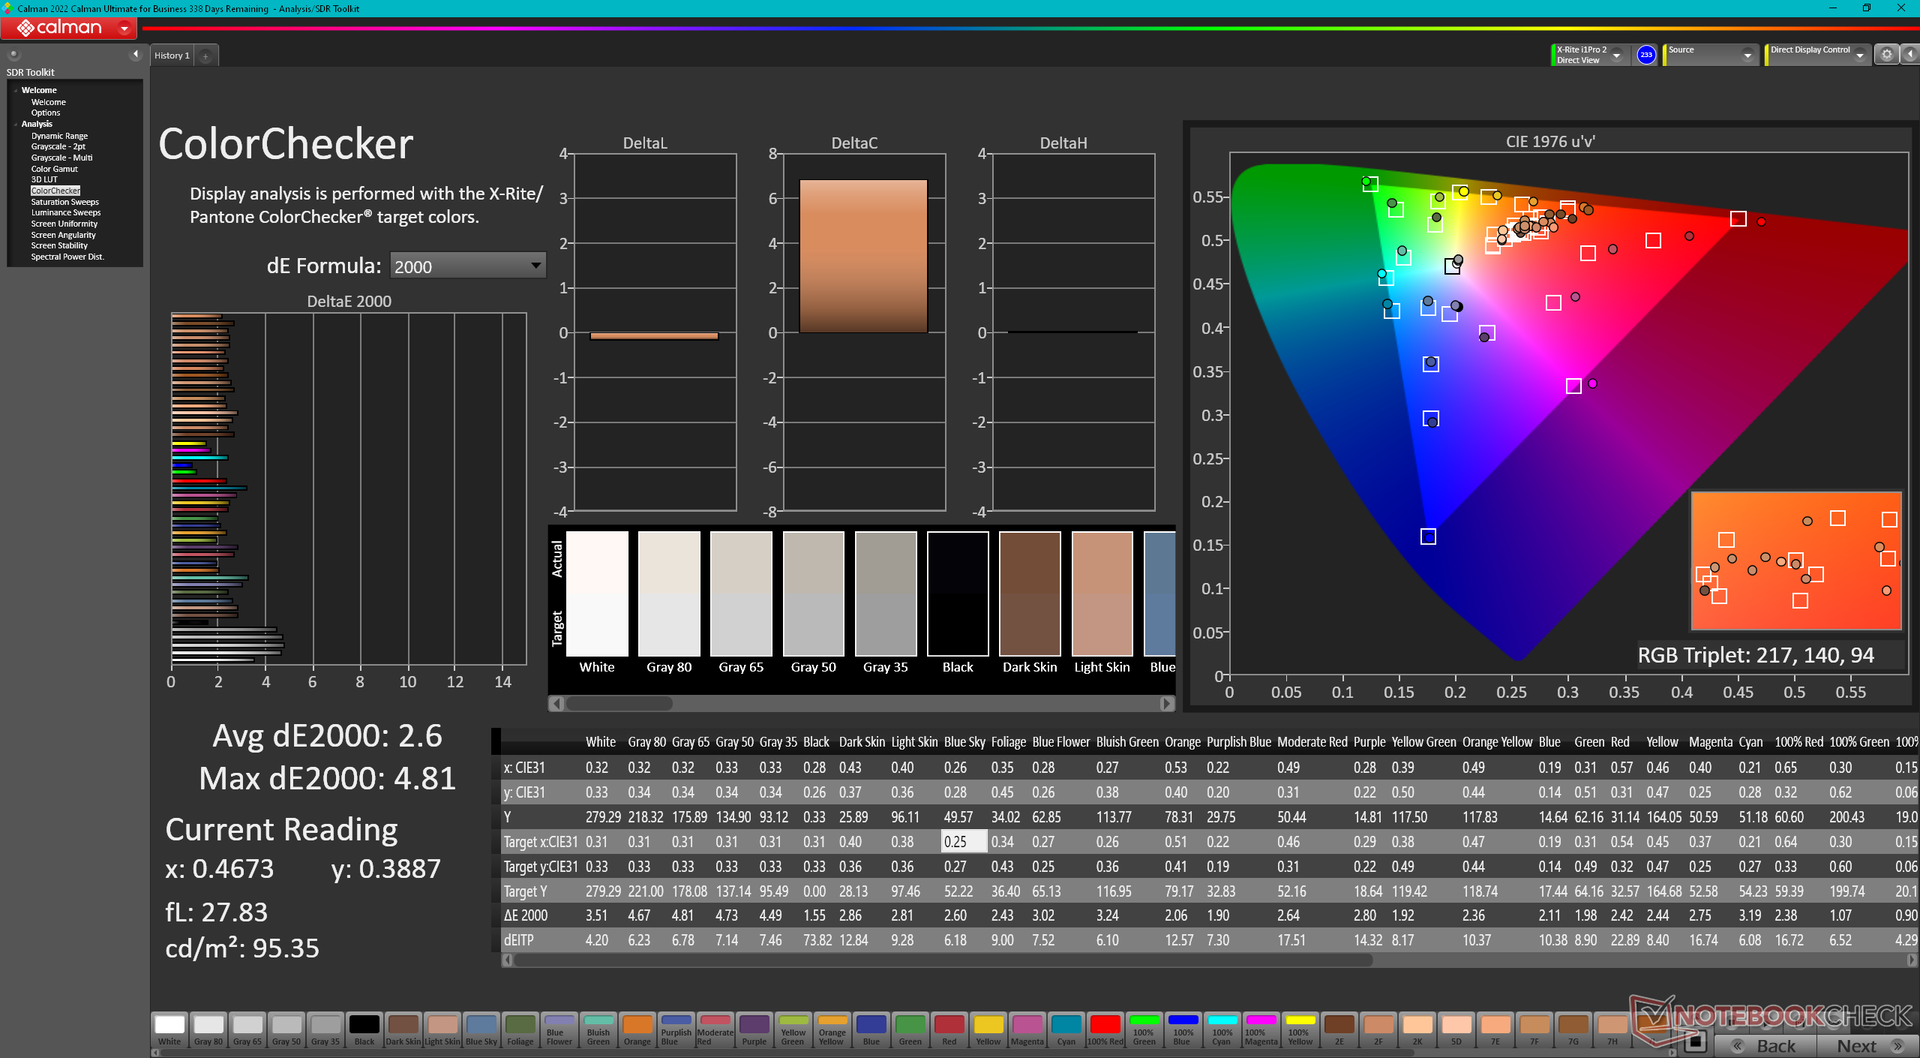
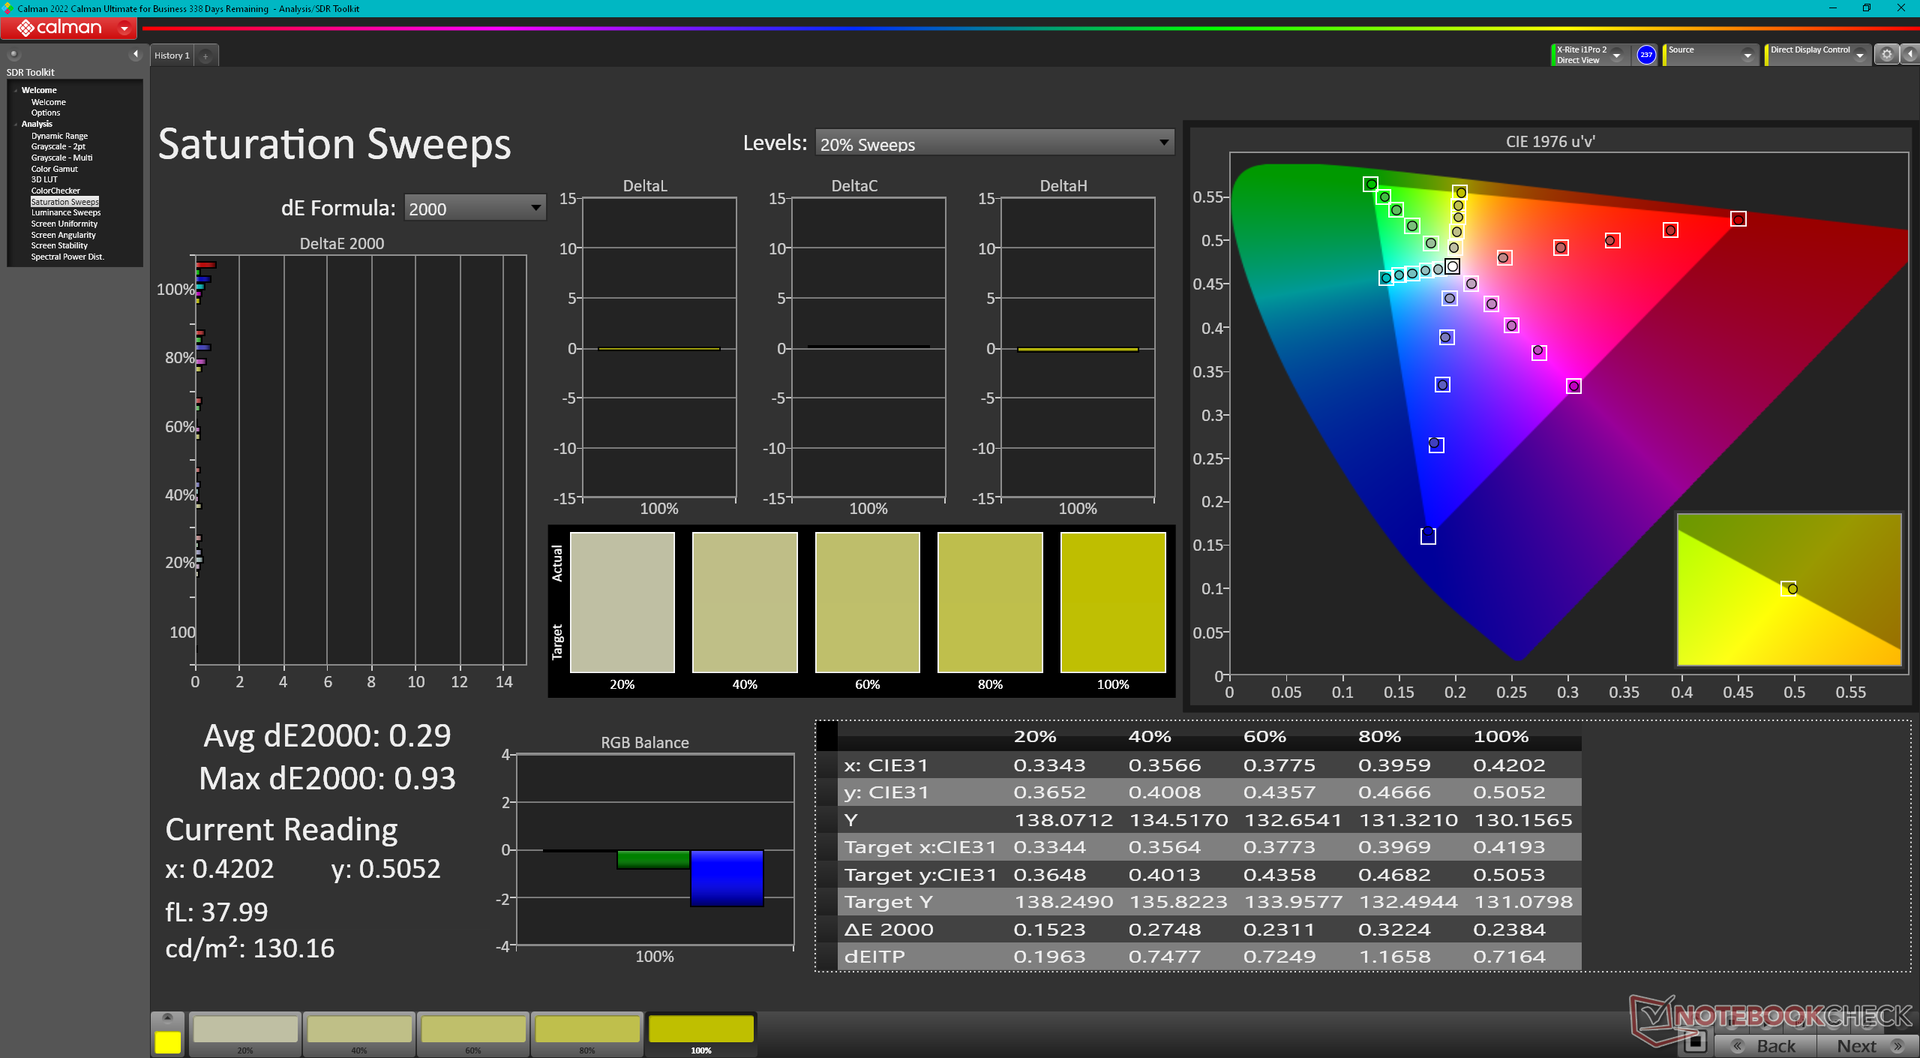
ΔE ColorChecker Calman: 2.6 | ∀{0.5-29.43 Ø4.72}
calibrated: 0.51
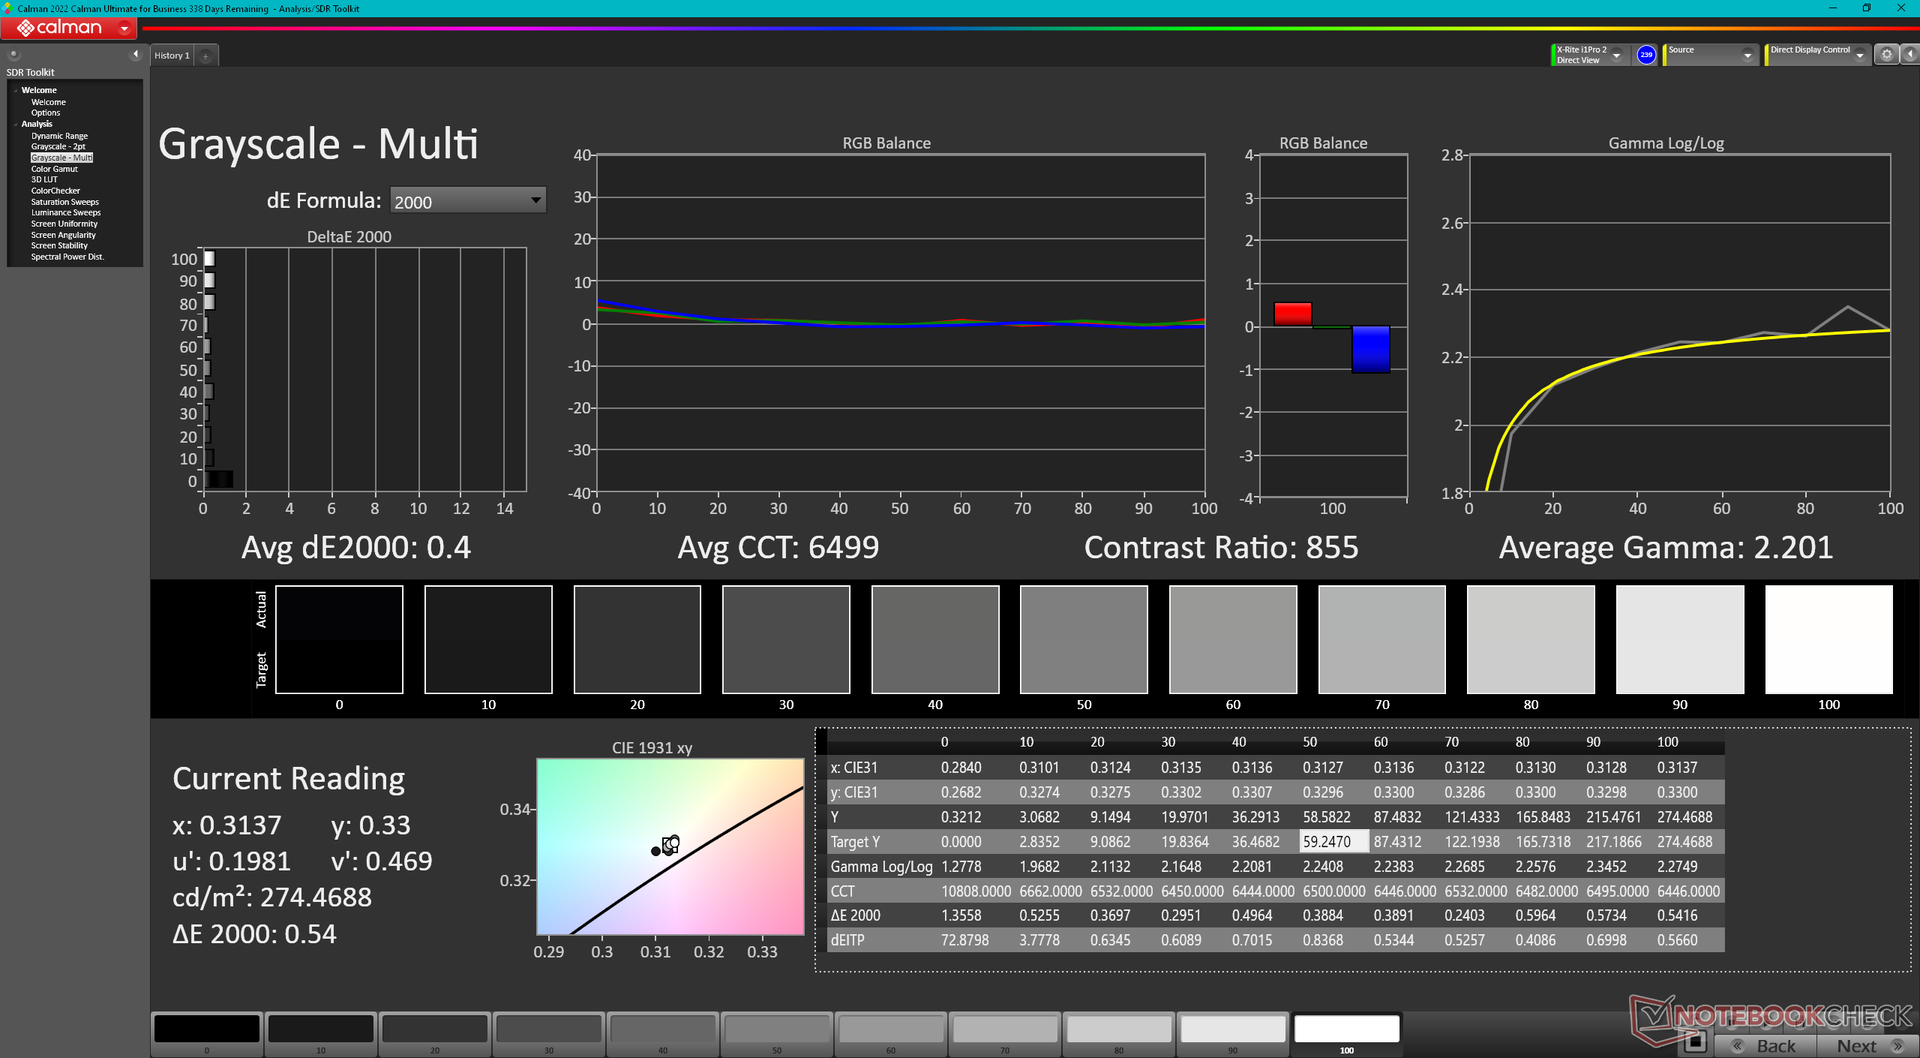
ΔE Greyscale Calman: 3.9 | ∀{0.09-98 Ø4.97}
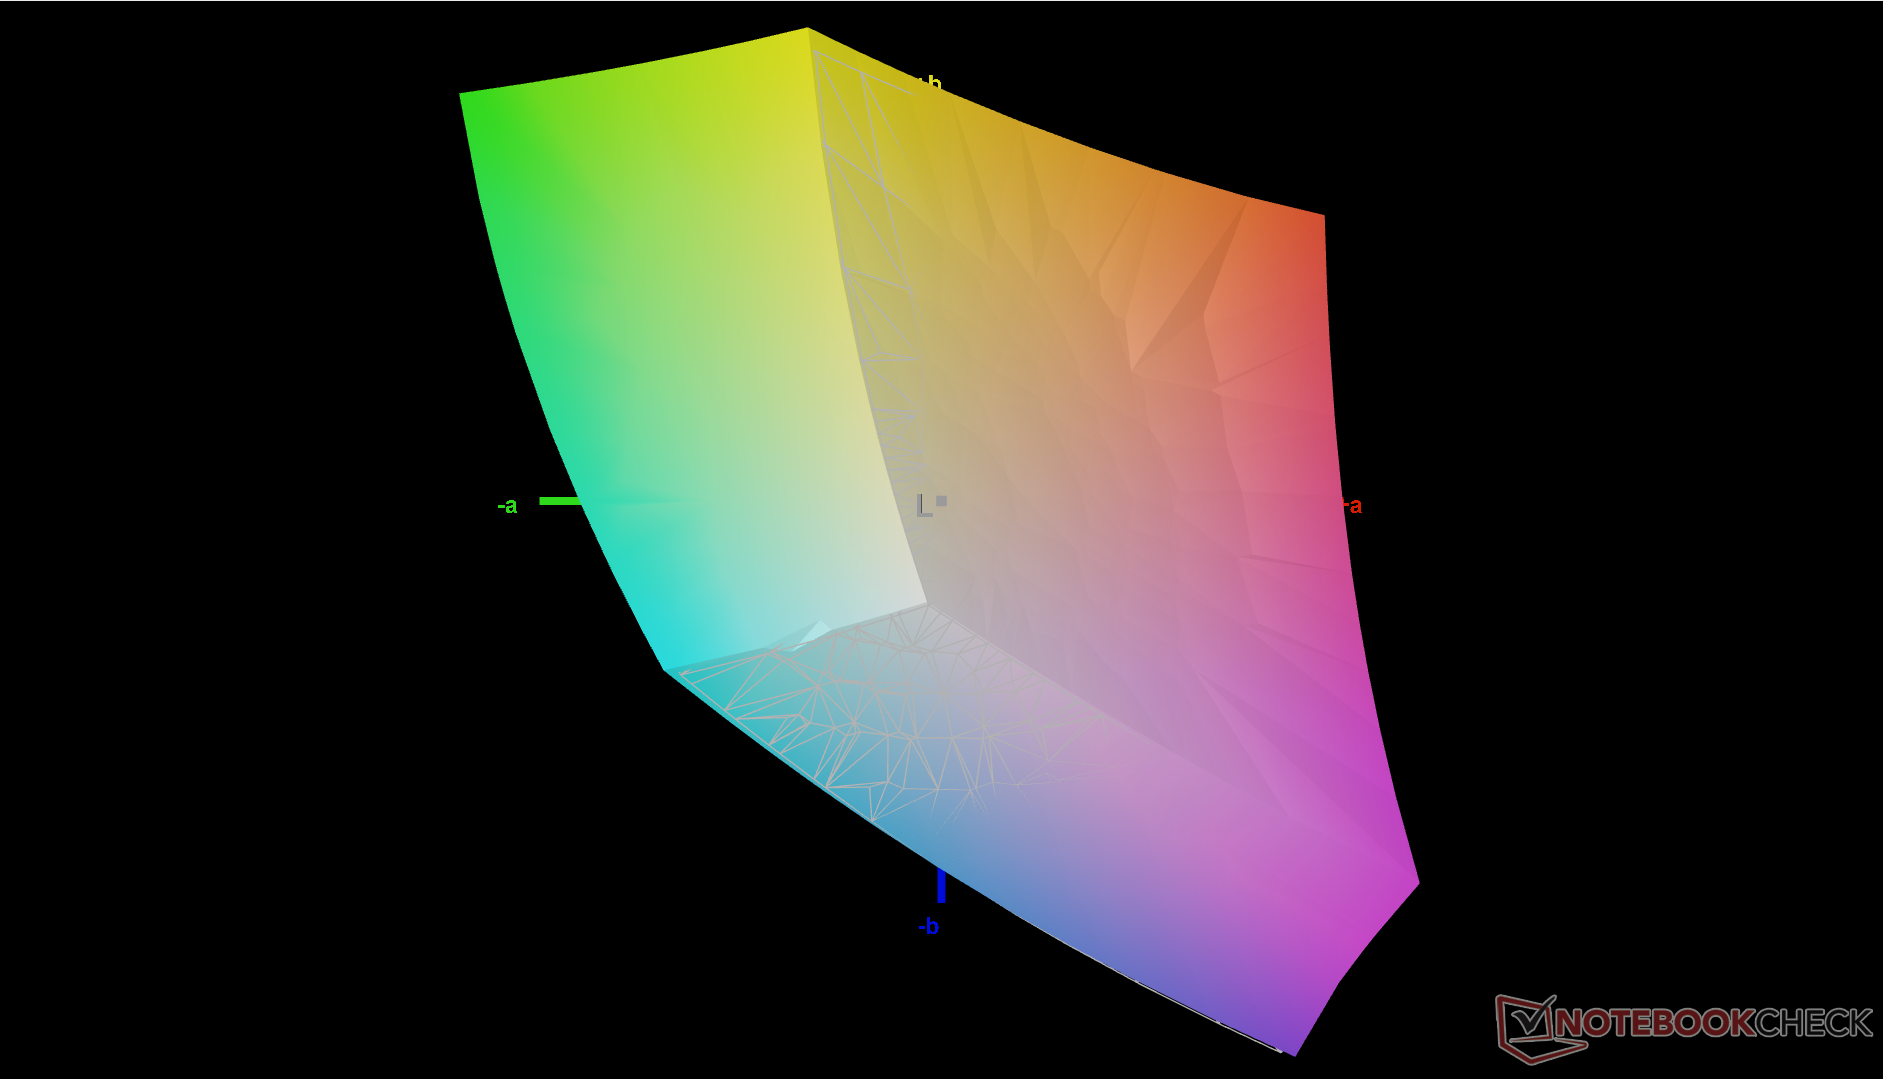
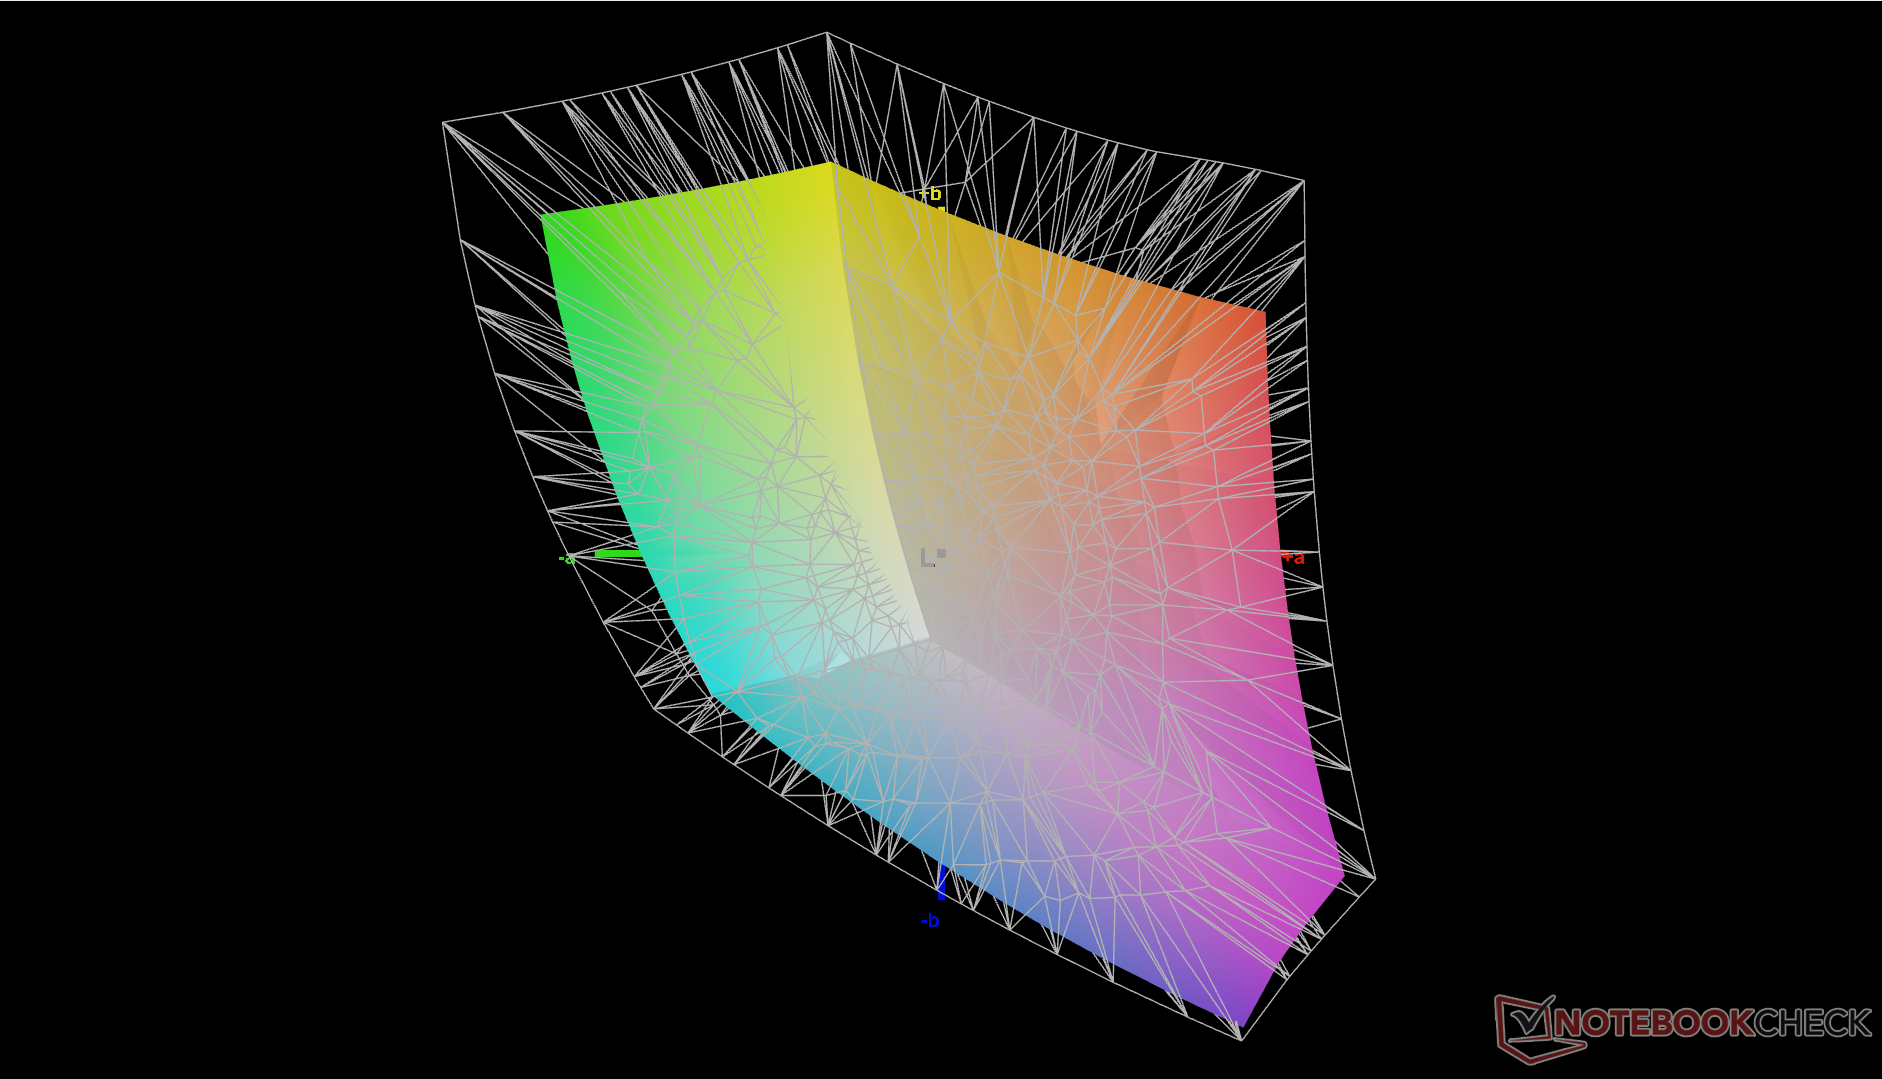
71.9% AdobeRGB 1998 (Argyll 3D)
99.8% sRGB (Argyll 3D)
71.6% Display P3 (Argyll 3D)
Gamma: 2.29
CCT: 5877 K
| Lenovo ThinkPad L13 Yoga G4 i7-1355U NV133WUM-N61, IPS, 1920x1200, 13.3" | Lenovo ThinkPad L13 Yoga G4 21FSS00100 B133UAN01.2 , IPS LED, 1920x1200, 13.3" | HP Elite Dragonfly Folio 13.5 G3 Chi Mei CMN13C0, IPS, 1920x1280, 13.5" | Dell Latitude 9330 AU Optronics B133QAA, IPS, 2560x1600, 13.3" | MSI Summit E13 Flip Evo A11MT Sharp LQ134N1JW53, IPS, 1920x1200, 13.4" | Framework Laptop 13.5 Ryzen 7 7840U BOE CQ NE135FBM-N41, IPS, 2256x1504, 13.5" | |
|---|---|---|---|---|---|---|
| Display | 2% | -3% | 6% | -2% | -2% | |
| Display P3 Coverage (%) | 71.6 | 74.1 3% | 68.3 -5% | 77.8 9% | 69.8 -3% | 69 -4% |
| sRGB Coverage (%) | 99.8 | 99.3 -1% | 98.6 -1% | 99.9 0% | 98.8 -1% | 99.1 -1% |
| AdobeRGB 1998 Coverage (%) | 71.9 | 74.5 4% | 70.2 -2% | 77.5 8% | 70.6 -2% | 71.1 -1% |
| Response Times | -58% | -147% | -165% | -140% | -81% | |
| Response Time Grey 50% / Grey 80% * (ms) | 27.3 ? | 43.3 ? -59% | 66.8 ? -145% | 67.6 ? -148% | 64 ? -134% | 50.4 ? -85% |
| Response Time Black / White * (ms) | 17.9 ? | 28 ? -56% | 44.4 ? -148% | 50.4 ? -182% | 44 ? -146% | 31.5 ? -76% |
| PWM Frequency (Hz) | ||||||
| Screen | -8% | 22% | 19% | 19% | 24% | |
| Brightness middle (cd/m²) | 278.1 | 336 21% | 369.5 33% | 542.3 95% | 551.3 98% | 436 57% |
| Brightness (cd/m²) | 280 | 321 15% | 350 25% | 516 84% | 517 85% | 416 49% |
| Brightness Distribution (%) | 92 | 88 -4% | 87 -5% | 85 -8% | 91 -1% | 89 -3% |
| Black Level * (cd/m²) | 0.34 | 0.22 35% | 0.24 29% | 0.38 -12% | 0.37 -9% | 0.36 -6% |
| Contrast (:1) | 818 | 1527 87% | 1540 88% | 1427 74% | 1490 82% | 1211 48% |
| Colorchecker dE 2000 * | 2.6 | 2.8 -8% | 2.3 12% | 3.18 -22% | 1.45 44% | 1.81 30% |
| Colorchecker dE 2000 max. * | 4.81 | 6.9 -43% | 4.34 10% | 6.05 -26% | 2.86 41% | 4.73 2% |
| Colorchecker dE 2000 calibrated * | 0.51 | 1.4 -175% | 0.6 -18% | 0.67 -31% | 1.7 -233% | 0.45 12% |
| Greyscale dE 2000 * | 3.9 | 3.8 3% | 3.1 21% | 3.1 21% | 1.3 67% | 2.9 26% |
| Gamma | 2.29 96% | 2.15 102% | 2.1 105% | 2.08 106% | 2.14 103% | 2.27 97% |
| CCT | 5877 111% | 6664 98% | 6248 104% | 6140 106% | 6580 99% | 6784 96% |
| Color Space (Percent of AdobeRGB 1998) (%) | 65 | |||||
| Color Space (Percent of sRGB) (%) | 99 | |||||
| Média Total (Programa/Configurações) | -21% /
-13% | -43% /
-8% | -47% /
-10% | -41% /
-8% | -20% /
3% |
* ... menor é melhor
A calibração do painel por nós mesmos com um colorímetro X-Rite melhoraria os valores DeltaE médios de escala de cinza e cor de 3,9 e 2,6 para apenas 0,4 e 0,51, respectivamente. Nosso perfil ICM calibrado está disponível acima para download gratuito.
Exibir tempos de resposta
| ↔ Tempo de resposta preto para branco | ||
|---|---|---|
| 17.9 ms ... ascensão ↗ e queda ↘ combinadas | ↗ 9 ms ascensão | 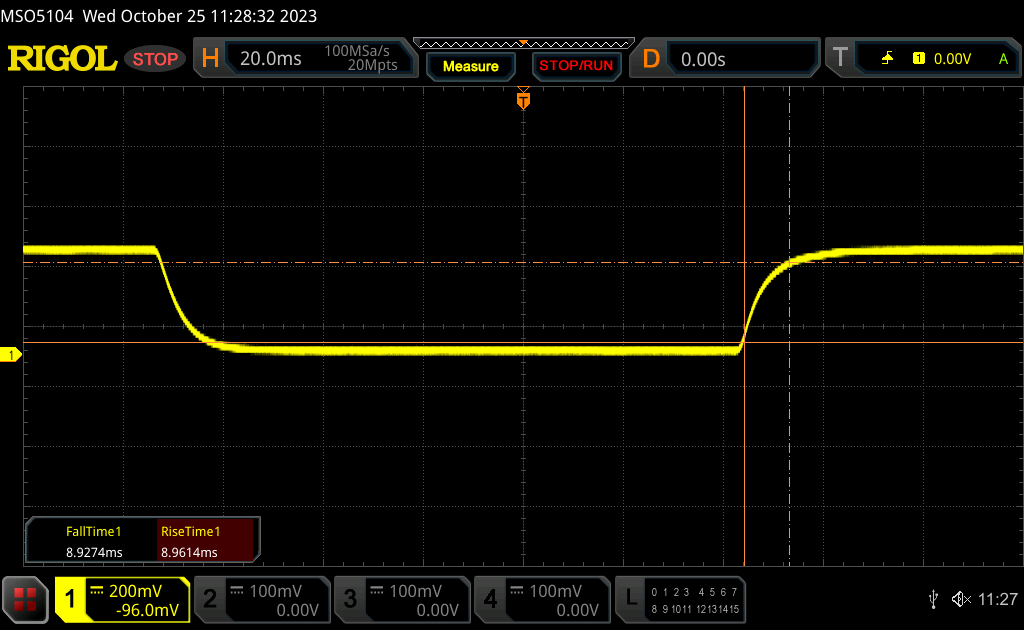 |
| ↘ 8.9 ms queda | ||
| A tela mostra boas taxas de resposta em nossos testes, mas pode ser muito lenta para jogadores competitivos. Em comparação, todos os dispositivos testados variam de 0.1 (mínimo) a 240 (máximo) ms. » 40 % de todos os dispositivos são melhores. Isso significa que o tempo de resposta medido é semelhante à média de todos os dispositivos testados (19.8 ms). | ||
| ↔ Tempo de resposta 50% cinza a 80% cinza | ||
| 27.3 ms ... ascensão ↗ e queda ↘ combinadas | ↗ 12.7 ms ascensão | 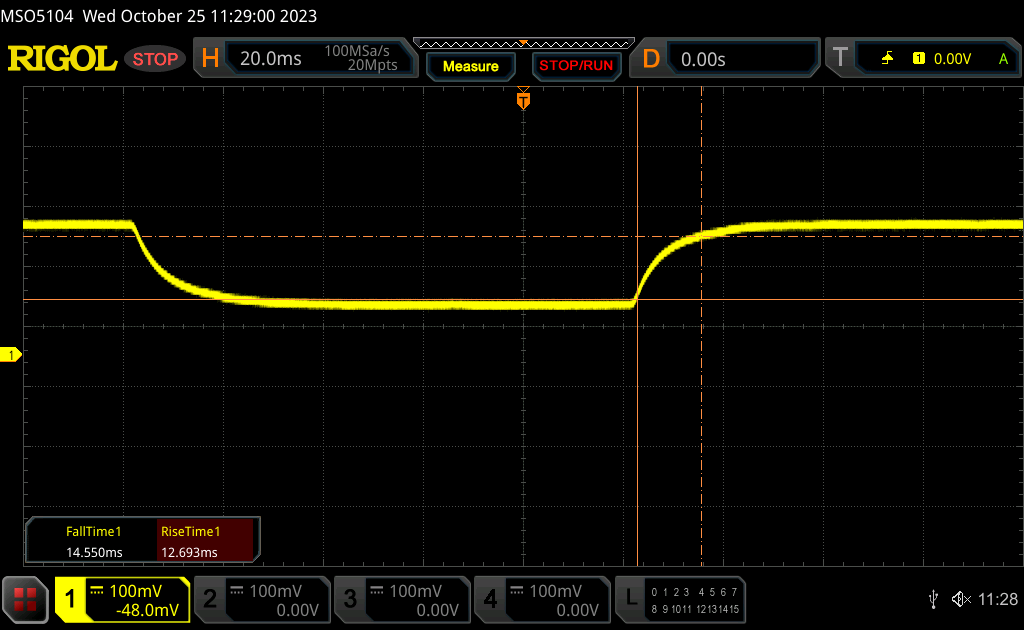 |
| ↘ 14.6 ms queda | ||
| A tela mostra taxas de resposta relativamente lentas em nossos testes e pode ser muito lenta para os jogadores. Em comparação, todos os dispositivos testados variam de 0.165 (mínimo) a 636 (máximo) ms. » 37 % de todos os dispositivos são melhores. Isso significa que o tempo de resposta medido é melhor que a média de todos os dispositivos testados (31 ms). | ||
Cintilação da tela / PWM (modulação por largura de pulso)
| Tela tremeluzindo / PWM não detectado | 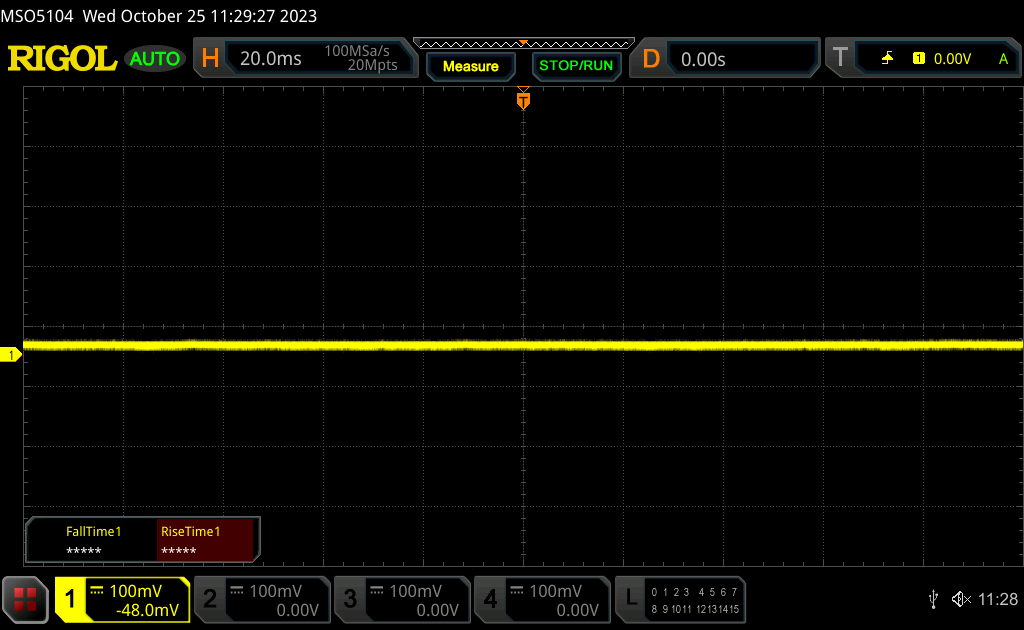 | ||
[pwm_comparison] Em comparação: 52 % de todos os dispositivos testados não usam PWM para escurecer a tela. Se PWM foi detectado, uma média de 7747 (mínimo: 5 - máximo: 343500) Hz foi medida. | |||
Desempenho
Condições de teste
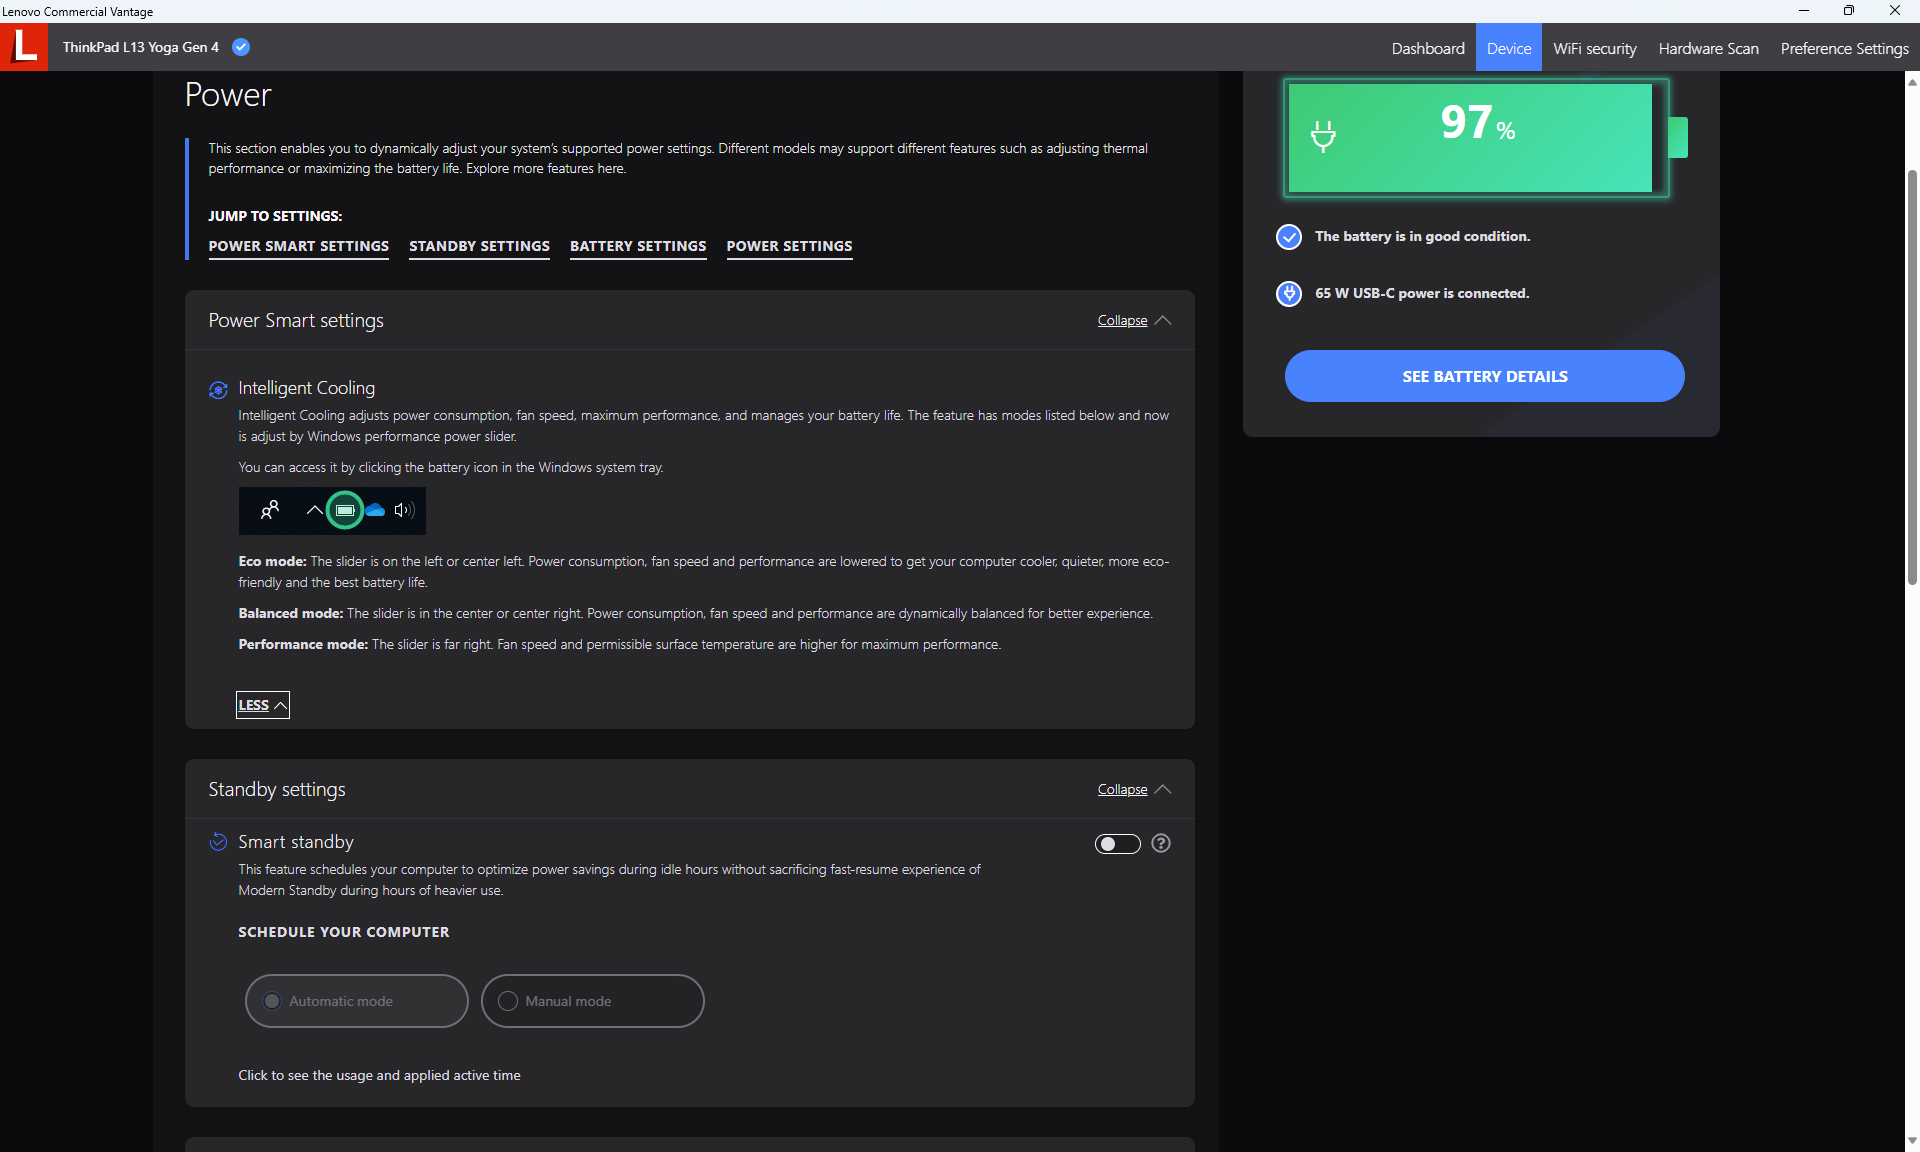
Definimos o Windows para o modo Desempenho antes de executar os benchmarks abaixo. Não há perfis de energia adicionais além dos perfis padrão do Windows (Power Saver, Balanced e Performance).
Processador
O desempenho da CPU é ligeiramente mais lento do que a maioria dos outros laptops com o mesmo Core i7-1355U devido ao estrangulamento. Ao executar o CineBench R15 xT em um loop, por exemplo, a pontuação inicial de 1274 pontos cairia em até 35% ao longo do tempo, como mostra o gráfico abaixo. Portanto, o desempenho multithread é apenas um pouco melhor do que o do concorrente Ryzen 5 7530U depois de levar em conta o maior estrangulamento da versão Intel.
A principal vantagem da Intel continua sendo o desempenho single-thread, em que nosso Core i7 tem uma vantagem de 20 a 25 por cento sobre o Ryzen 5 7530U.
Cinebench R15 Multi Loop
Cinebench R23: Multi Core | Single Core
Cinebench R20: CPU (Multi Core) | CPU (Single Core)
Cinebench R15: CPU Multi 64Bit | CPU Single 64Bit
Blender: v2.79 BMW27 CPU
7-Zip 18.03: 7z b 4 | 7z b 4 -mmt1
Geekbench 5.5: Multi-Core | Single-Core
HWBOT x265 Benchmark v2.2: 4k Preset
LibreOffice : 20 Documents To PDF
R Benchmark 2.5: Overall mean
| CPU Performance rating | |
| Framework Laptop 13.5 Ryzen 7 7840U | |
| Dell XPS 13 Plus 9320 Core i7-1360P | |
| Média Intel Core i7-1355U | |
| Lenovo ThinkPad L13 Yoga G4 i7-1355U | |
| HP Elite Dragonfly Folio 13.5 G3 | |
| Lenovo ThinkBook 13s G3 20YA0005GE | |
| Lenovo Yoga 6 13 83B2001SGE | |
| Dell Latitude 9330 | |
| Lenovo ThinkPad L13 Yoga G4 21FSS00100 | |
| Lenovo Yoga 6 13ALC6 -2! | |
| MSI Summit E13 Flip Evo A11MT | |
| Cinebench R23 / Multi Core | |
| Framework Laptop 13.5 Ryzen 7 7840U | |
| Dell XPS 13 Plus 9320 Core i7-1360P | |
| Média Intel Core i7-1355U (6936 - 10252, n=18) | |
| Lenovo ThinkPad L13 Yoga G4 i7-1355U | |
| Lenovo ThinkBook 13s G3 20YA0005GE | |
| HP Elite Dragonfly Folio 13.5 G3 | |
| Lenovo Yoga 6 13ALC6 | |
| Dell Latitude 9330 | |
| Lenovo Yoga 6 13 83B2001SGE | |
| Lenovo ThinkPad L13 Yoga G4 21FSS00100 | |
| MSI Summit E13 Flip Evo A11MT | |
| Cinebench R23 / Single Core | |
| Dell XPS 13 Plus 9320 Core i7-1360P | |
| Média Intel Core i7-1355U (1687 - 1889, n=18) | |
| Lenovo ThinkPad L13 Yoga G4 i7-1355U | |
| HP Elite Dragonfly Folio 13.5 G3 | |
| Framework Laptop 13.5 Ryzen 7 7840U | |
| Dell Latitude 9330 | |
| MSI Summit E13 Flip Evo A11MT | |
| Lenovo ThinkBook 13s G3 20YA0005GE | |
| Lenovo ThinkPad L13 Yoga G4 21FSS00100 | |
| Lenovo Yoga 6 13 83B2001SGE | |
| Lenovo Yoga 6 13ALC6 | |
| Cinebench R20 / CPU (Multi Core) | |
| Framework Laptop 13.5 Ryzen 7 7840U | |
| Dell XPS 13 Plus 9320 Core i7-1360P | |
| Média Intel Core i7-1355U (2849 - 3907, n=18) | |
| Lenovo ThinkPad L13 Yoga G4 i7-1355U | |
| Lenovo ThinkBook 13s G3 20YA0005GE | |
| HP Elite Dragonfly Folio 13.5 G3 | |
| Lenovo Yoga 6 13ALC6 | |
| Lenovo Yoga 6 13 83B2001SGE | |
| Dell Latitude 9330 | |
| Lenovo ThinkPad L13 Yoga G4 21FSS00100 | |
| MSI Summit E13 Flip Evo A11MT | |
| Cinebench R20 / CPU (Single Core) | |
| Dell XPS 13 Plus 9320 Core i7-1360P | |
| Média Intel Core i7-1355U (654 - 725, n=18) | |
| Lenovo ThinkPad L13 Yoga G4 i7-1355U | |
| HP Elite Dragonfly Folio 13.5 G3 | |
| Framework Laptop 13.5 Ryzen 7 7840U | |
| Dell Latitude 9330 | |
| Lenovo ThinkBook 13s G3 20YA0005GE | |
| MSI Summit E13 Flip Evo A11MT | |
| Lenovo Yoga 6 13 83B2001SGE | |
| Lenovo ThinkPad L13 Yoga G4 21FSS00100 | |
| Lenovo Yoga 6 13ALC6 | |
| Cinebench R15 / CPU Multi 64Bit | |
| Framework Laptop 13.5 Ryzen 7 7840U | |
| Dell XPS 13 Plus 9320 Core i7-1360P | |
| Lenovo ThinkBook 13s G3 20YA0005GE | |
| Lenovo ThinkBook 13s G3 20YA0005GE | |
| Lenovo Yoga 6 13 83B2001SGE | |
| Média Intel Core i7-1355U (1206 - 1735, n=18) | |
| HP Elite Dragonfly Folio 13.5 G3 | |
| Lenovo ThinkPad L13 Yoga G4 21FSS00100 | |
| Lenovo ThinkPad L13 Yoga G4 i7-1355U | |
| Lenovo Yoga 6 13ALC6 | |
| Dell Latitude 9330 | |
| MSI Summit E13 Flip Evo A11MT | |
| Cinebench R15 / CPU Single 64Bit | |
| Dell XPS 13 Plus 9320 Core i7-1360P | |
| Média Intel Core i7-1355U (237 - 267, n=18) | |
| Framework Laptop 13.5 Ryzen 7 7840U | |
| HP Elite Dragonfly Folio 13.5 G3 | |
| Lenovo ThinkPad L13 Yoga G4 i7-1355U | |
| Lenovo ThinkBook 13s G3 20YA0005GE | |
| Dell Latitude 9330 | |
| Lenovo Yoga 6 13 83B2001SGE | |
| MSI Summit E13 Flip Evo A11MT | |
| Lenovo ThinkPad L13 Yoga G4 21FSS00100 | |
| Lenovo Yoga 6 13ALC6 | |
| Blender / v2.79 BMW27 CPU | |
| MSI Summit E13 Flip Evo A11MT | |
| Lenovo ThinkPad L13 Yoga G4 i7-1355U | |
| Lenovo ThinkPad L13 Yoga G4 21FSS00100 | |
| Dell Latitude 9330 | |
| HP Elite Dragonfly Folio 13.5 G3 | |
| Média Intel Core i7-1355U (328 - 503, n=18) | |
| Lenovo ThinkBook 13s G3 20YA0005GE | |
| Lenovo Yoga 6 13ALC6 | |
| Lenovo Yoga 6 13 83B2001SGE | |
| Dell XPS 13 Plus 9320 Core i7-1360P | |
| Framework Laptop 13.5 Ryzen 7 7840U | |
| 7-Zip 18.03 / 7z b 4 | |
| Framework Laptop 13.5 Ryzen 7 7840U | |
| Dell XPS 13 Plus 9320 Core i7-1360P | |
| Lenovo Yoga 6 13 83B2001SGE | |
| Lenovo ThinkBook 13s G3 20YA0005GE | |
| Lenovo Yoga 6 13ALC6 | |
| Média Intel Core i7-1355U (30255 - 42092, n=18) | |
| HP Elite Dragonfly Folio 13.5 G3 | |
| Lenovo ThinkPad L13 Yoga G4 i7-1355U | |
| Lenovo ThinkPad L13 Yoga G4 21FSS00100 | |
| Dell Latitude 9330 | |
| MSI Summit E13 Flip Evo A11MT | |
| 7-Zip 18.03 / 7z b 4 -mmt1 | |
| Framework Laptop 13.5 Ryzen 7 7840U | |
| Média Intel Core i7-1355U (5301 - 5911, n=18) | |
| Dell XPS 13 Plus 9320 Core i7-1360P | |
| Lenovo ThinkPad L13 Yoga G4 i7-1355U | |
| Lenovo ThinkBook 13s G3 20YA0005GE | |
| Lenovo Yoga 6 13 83B2001SGE | |
| HP Elite Dragonfly Folio 13.5 G3 | |
| MSI Summit E13 Flip Evo A11MT | |
| Lenovo ThinkPad L13 Yoga G4 21FSS00100 | |
| Dell Latitude 9330 | |
| Lenovo Yoga 6 13ALC6 | |
| Geekbench 5.5 / Multi-Core | |
| Dell XPS 13 Plus 9320 Core i7-1360P | |
| Framework Laptop 13.5 Ryzen 7 7840U | |
| HP Elite Dragonfly Folio 13.5 G3 | |
| Média Intel Core i7-1355U (7507 - 9328, n=18) | |
| Lenovo ThinkPad L13 Yoga G4 i7-1355U | |
| Lenovo Yoga 6 13 83B2001SGE | |
| Dell Latitude 9330 | |
| Lenovo ThinkBook 13s G3 20YA0005GE | |
| Lenovo ThinkPad L13 Yoga G4 21FSS00100 | |
| MSI Summit E13 Flip Evo A11MT | |
| Geekbench 5.5 / Single-Core | |
| Framework Laptop 13.5 Ryzen 7 7840U | |
| Lenovo ThinkPad L13 Yoga G4 i7-1355U | |
| Dell XPS 13 Plus 9320 Core i7-1360P | |
| Média Intel Core i7-1355U (1678 - 1872, n=18) | |
| HP Elite Dragonfly Folio 13.5 G3 | |
| Dell Latitude 9330 | |
| MSI Summit E13 Flip Evo A11MT | |
| Lenovo Yoga 6 13 83B2001SGE | |
| Lenovo ThinkBook 13s G3 20YA0005GE | |
| Lenovo ThinkPad L13 Yoga G4 21FSS00100 | |
| HWBOT x265 Benchmark v2.2 / 4k Preset | |
| Framework Laptop 13.5 Ryzen 7 7840U | |
| Dell XPS 13 Plus 9320 Core i7-1360P | |
| Lenovo Yoga 6 13 83B2001SGE | |
| Lenovo ThinkBook 13s G3 20YA0005GE | |
| Média Intel Core i7-1355U (7.83 - 11.4, n=18) | |
| Lenovo ThinkPad L13 Yoga G4 i7-1355U | |
| Lenovo Yoga 6 13ALC6 | |
| HP Elite Dragonfly Folio 13.5 G3 | |
| Dell Latitude 9330 | |
| Lenovo ThinkPad L13 Yoga G4 21FSS00100 | |
| MSI Summit E13 Flip Evo A11MT | |
| LibreOffice / 20 Documents To PDF | |
| Lenovo Yoga 6 13ALC6 | |
| Lenovo ThinkPad L13 Yoga G4 21FSS00100 | |
| Média Intel Core i7-1355U (41.1 - 108.6, n=18) | |
| Dell Latitude 9330 | |
| Lenovo ThinkBook 13s G3 20YA0005GE | |
| HP Elite Dragonfly Folio 13.5 G3 | |
| Lenovo Yoga 6 13 83B2001SGE | |
| Lenovo ThinkPad L13 Yoga G4 i7-1355U | |
| MSI Summit E13 Flip Evo A11MT | |
| Dell XPS 13 Plus 9320 Core i7-1360P | |
| Framework Laptop 13.5 Ryzen 7 7840U | |
| R Benchmark 2.5 / Overall mean | |
| MSI Summit E13 Flip Evo A11MT | |
| Lenovo Yoga 6 13ALC6 | |
| Lenovo ThinkPad L13 Yoga G4 21FSS00100 | |
| Lenovo ThinkBook 13s G3 20YA0005GE | |
| Lenovo Yoga 6 13 83B2001SGE | |
| Dell Latitude 9330 | |
| Média Intel Core i7-1355U (0.4481 - 0.832, n=18) | |
| HP Elite Dragonfly Folio 13.5 G3 | |
| Lenovo ThinkPad L13 Yoga G4 i7-1355U | |
| Dell XPS 13 Plus 9320 Core i7-1360P | |
| Framework Laptop 13.5 Ryzen 7 7840U | |
* ... menor é melhor
AIDA64: FP32 Ray-Trace | FPU Julia | CPU SHA3 | CPU Queen | FPU SinJulia | FPU Mandel | CPU AES | CPU ZLib | FP64 Ray-Trace | CPU PhotoWorxx
| AIDA64 / FP32 Ray-Trace | |
| Framework Laptop 13.5 Ryzen 7 7840U | |
| Lenovo ThinkPad L13 Yoga G4 21FSS00100 | |
| Média Intel Core i7-1355U (5673 - 8424, n=18) | |
| MSI Summit E13 Flip Evo A11MT | |
| Dell Latitude 9330 | |
| HP Elite Dragonfly Folio 13.5 G3 | |
| Lenovo ThinkPad L13 Yoga G4 i7-1355U | |
| AIDA64 / FP64 Ray-Trace | |
| Framework Laptop 13.5 Ryzen 7 7840U | |
| Lenovo ThinkPad L13 Yoga G4 21FSS00100 | |
| MSI Summit E13 Flip Evo A11MT | |
| Média Intel Core i7-1355U (2991 - 4453, n=18) | |
| Dell Latitude 9330 | |
| HP Elite Dragonfly Folio 13.5 G3 | |
| Lenovo ThinkPad L13 Yoga G4 i7-1355U | |
| AIDA64 / CPU PhotoWorxx | |
| HP Elite Dragonfly Folio 13.5 G3 | |
| MSI Summit E13 Flip Evo A11MT | |
| Dell Latitude 9330 | |
| Lenovo ThinkPad L13 Yoga G4 i7-1355U | |
| Média Intel Core i7-1355U (21800 - 46154, n=18) | |
| Framework Laptop 13.5 Ryzen 7 7840U | |
| Lenovo ThinkPad L13 Yoga G4 21FSS00100 | |
Desempenho do sistema
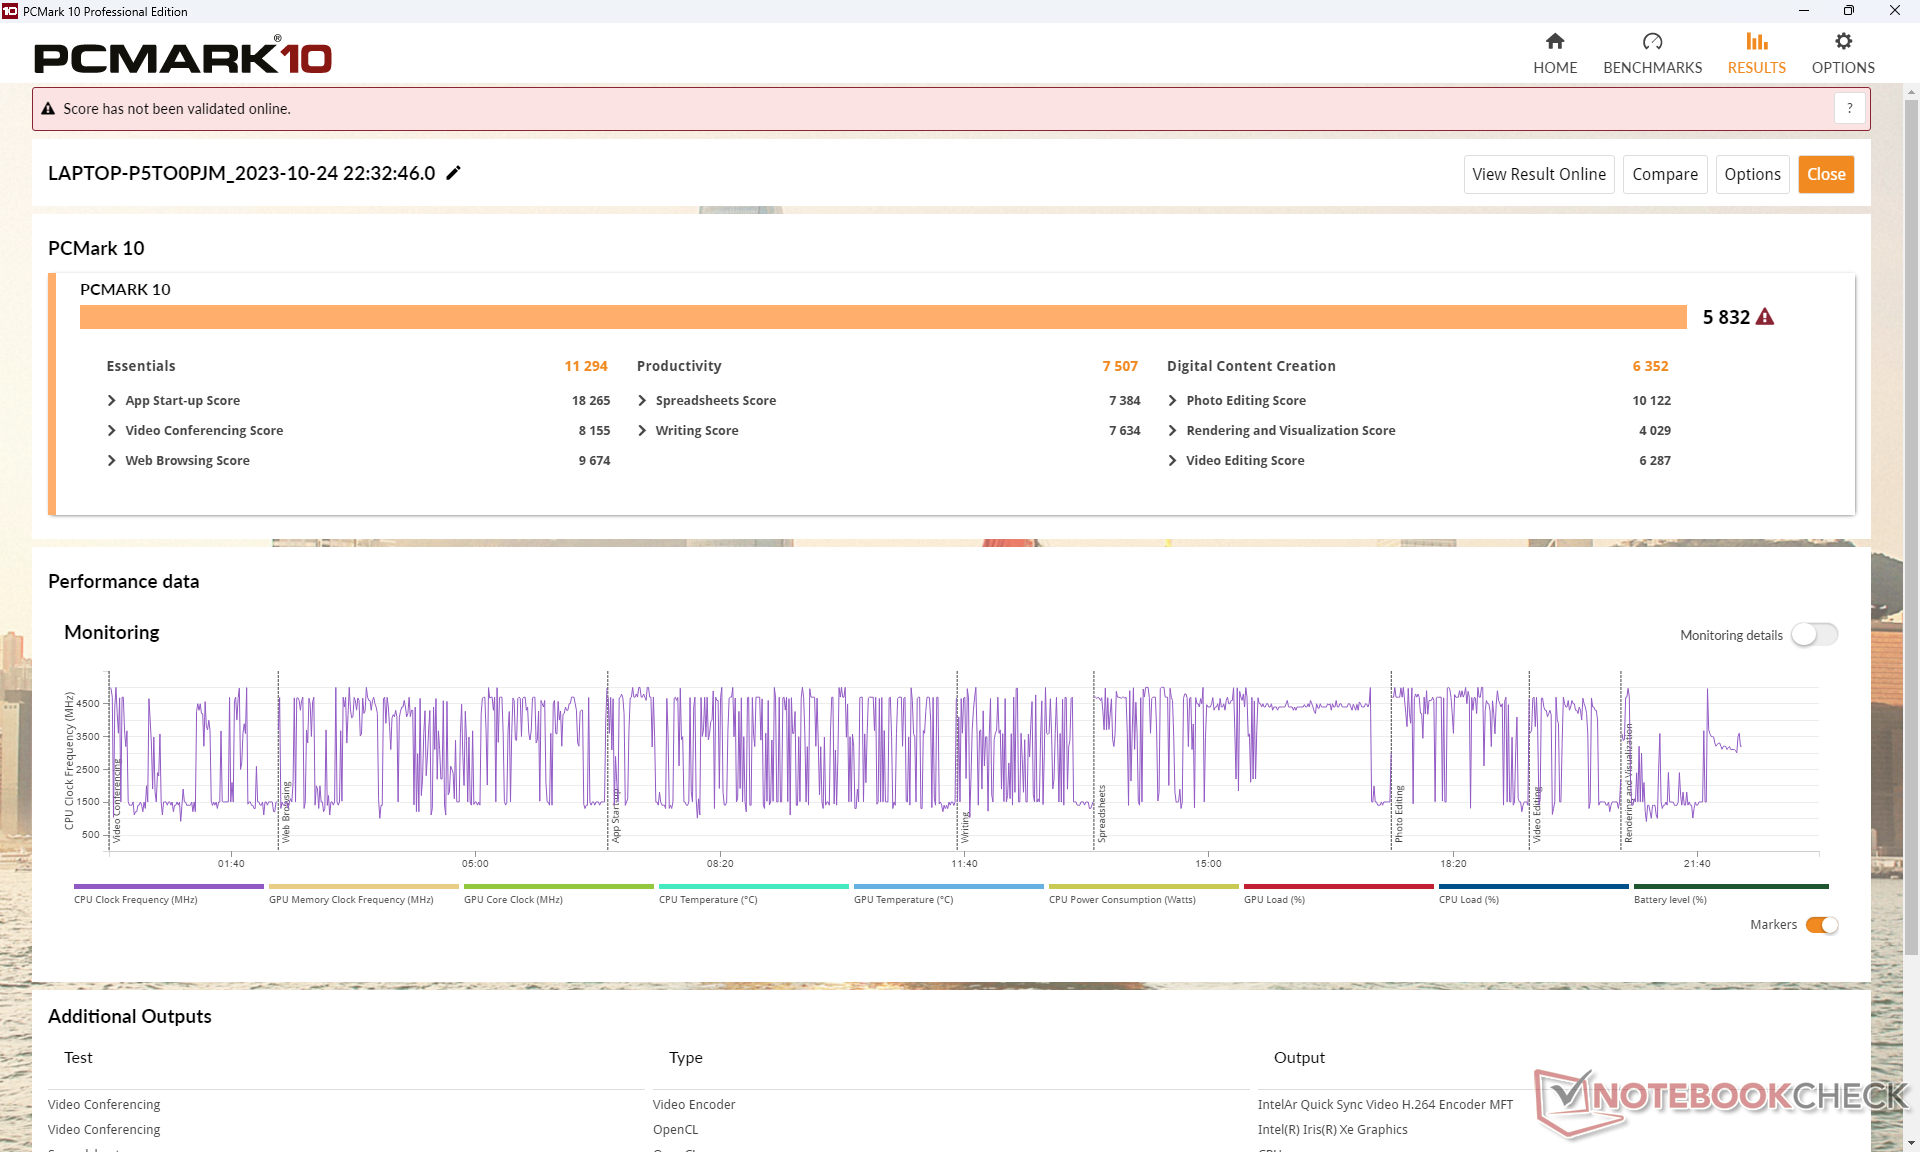
As pontuações do PCMark são mais altas no subteste de criação de conteúdo digital com uso intenso de GPU, enquanto o teste de produtividade com uso intenso de CPU favorece a versão da AMD. Isso sugere que nossa versão Intel oferece melhor desempenho gráfico integrado, mas um desempenho multi-thread mais lento da CPU do que a versão AMD.
CrossMark: Overall | Productivity | Creativity | Responsiveness
| PCMark 10 / Score | |
| Framework Laptop 13.5 Ryzen 7 7840U | |
| Lenovo ThinkPad L13 Yoga G4 i7-1355U | |
| HP Elite Dragonfly Folio 13.5 G3 | |
| Média Intel Core i7-1355U, Intel Iris Xe Graphics G7 96EUs (5455 - 5933, n=15) | |
| Lenovo ThinkPad L13 Yoga G4 21FSS00100 | |
| Dell Latitude 9330 | |
| MSI Summit E13 Flip Evo A11MT | |
| PCMark 10 / Essentials | |
| HP Elite Dragonfly Folio 13.5 G3 | |
| Lenovo ThinkPad L13 Yoga G4 i7-1355U | |
| Lenovo ThinkPad L13 Yoga G4 21FSS00100 | |
| Framework Laptop 13.5 Ryzen 7 7840U | |
| Média Intel Core i7-1355U, Intel Iris Xe Graphics G7 96EUs (10203 - 11822, n=15) | |
| Dell Latitude 9330 | |
| MSI Summit E13 Flip Evo A11MT | |
| PCMark 10 / Productivity | |
| Framework Laptop 13.5 Ryzen 7 7840U | |
| Lenovo ThinkPad L13 Yoga G4 21FSS00100 | |
| Lenovo ThinkPad L13 Yoga G4 i7-1355U | |
| HP Elite Dragonfly Folio 13.5 G3 | |
| Média Intel Core i7-1355U, Intel Iris Xe Graphics G7 96EUs (6763 - 7536, n=15) | |
| Dell Latitude 9330 | |
| MSI Summit E13 Flip Evo A11MT | |
| PCMark 10 / Digital Content Creation | |
| Framework Laptop 13.5 Ryzen 7 7840U | |
| Lenovo ThinkPad L13 Yoga G4 i7-1355U | |
| Média Intel Core i7-1355U, Intel Iris Xe Graphics G7 96EUs (5723 - 6712, n=15) | |
| HP Elite Dragonfly Folio 13.5 G3 | |
| Dell Latitude 9330 | |
| MSI Summit E13 Flip Evo A11MT | |
| Lenovo ThinkPad L13 Yoga G4 21FSS00100 | |
| CrossMark / Overall | |
| Framework Laptop 13.5 Ryzen 7 7840U | |
| HP Elite Dragonfly Folio 13.5 G3 | |
| Média Intel Core i7-1355U, Intel Iris Xe Graphics G7 96EUs (1478 - 1643, n=15) | |
| Lenovo ThinkPad L13 Yoga G4 i7-1355U | |
| Lenovo ThinkPad L13 Yoga G4 21FSS00100 | |
| CrossMark / Productivity | |
| Framework Laptop 13.5 Ryzen 7 7840U | |
| HP Elite Dragonfly Folio 13.5 G3 | |
| Média Intel Core i7-1355U, Intel Iris Xe Graphics G7 96EUs (1444 - 1665, n=15) | |
| Lenovo ThinkPad L13 Yoga G4 i7-1355U | |
| Lenovo ThinkPad L13 Yoga G4 21FSS00100 | |
| CrossMark / Creativity | |
| Framework Laptop 13.5 Ryzen 7 7840U | |
| HP Elite Dragonfly Folio 13.5 G3 | |
| Lenovo ThinkPad L13 Yoga G4 i7-1355U | |
| Média Intel Core i7-1355U, Intel Iris Xe Graphics G7 96EUs (1563 - 1732, n=15) | |
| Lenovo ThinkPad L13 Yoga G4 21FSS00100 | |
| CrossMark / Responsiveness | |
| HP Elite Dragonfly Folio 13.5 G3 | |
| Framework Laptop 13.5 Ryzen 7 7840U | |
| Média Intel Core i7-1355U, Intel Iris Xe Graphics G7 96EUs (1217 - 1681, n=15) | |
| Lenovo ThinkPad L13 Yoga G4 i7-1355U | |
| Lenovo ThinkPad L13 Yoga G4 21FSS00100 | |
| PCMark 10 Score | 5823 pontos | |
Ajuda | ||
| AIDA64 / Memory Latency | |
| HP Elite Dragonfly Folio 13.5 G3 | |
| Lenovo ThinkPad L13 Yoga G4 21FSS00100 | |
| Média Intel Core i7-1355U (72.2 - 346, n=18) | |
| Dell Latitude 9330 | |
| Lenovo ThinkPad L13 Yoga G4 i7-1355U | |
| MSI Summit E13 Flip Evo A11MT | |
| Framework Laptop 13.5 Ryzen 7 7840U | |
* ... menor é melhor
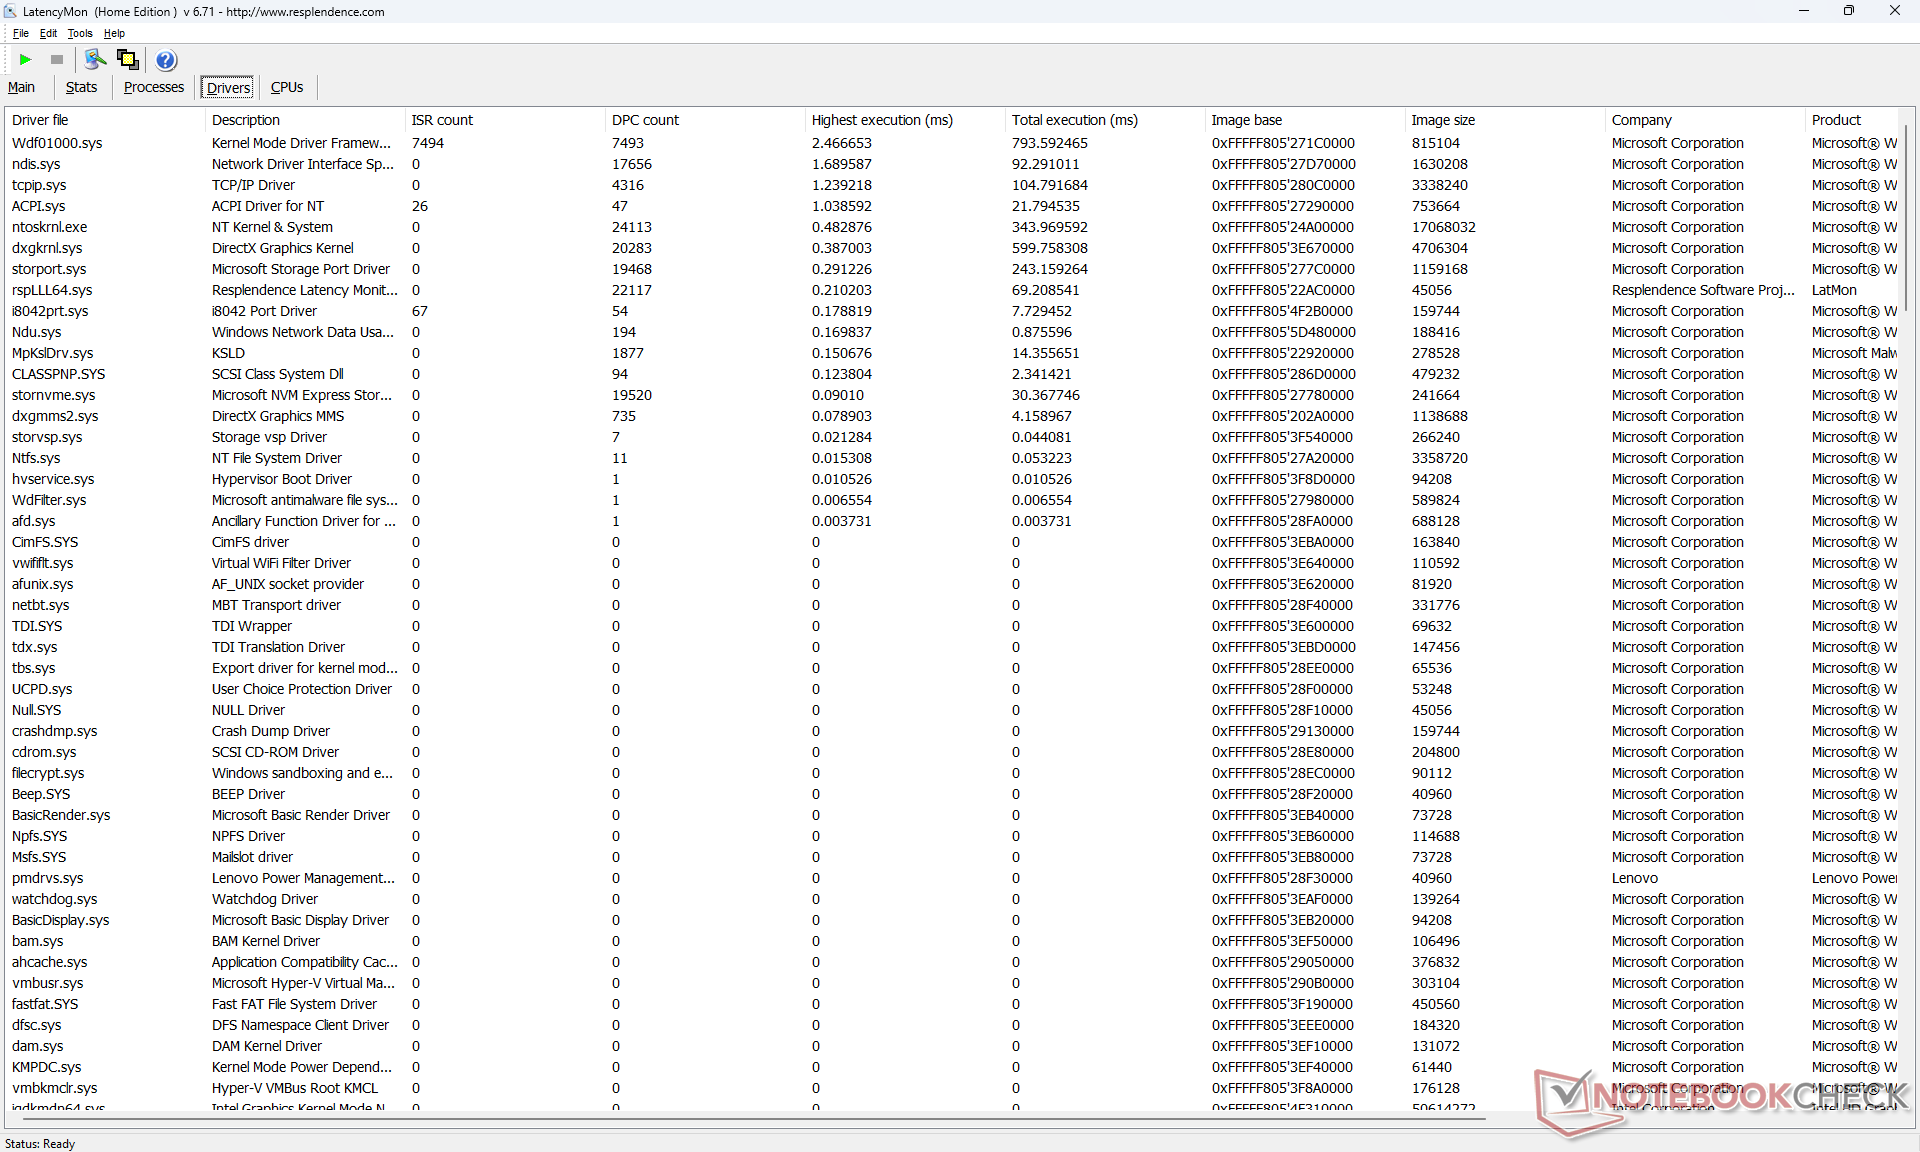
Latência DPC
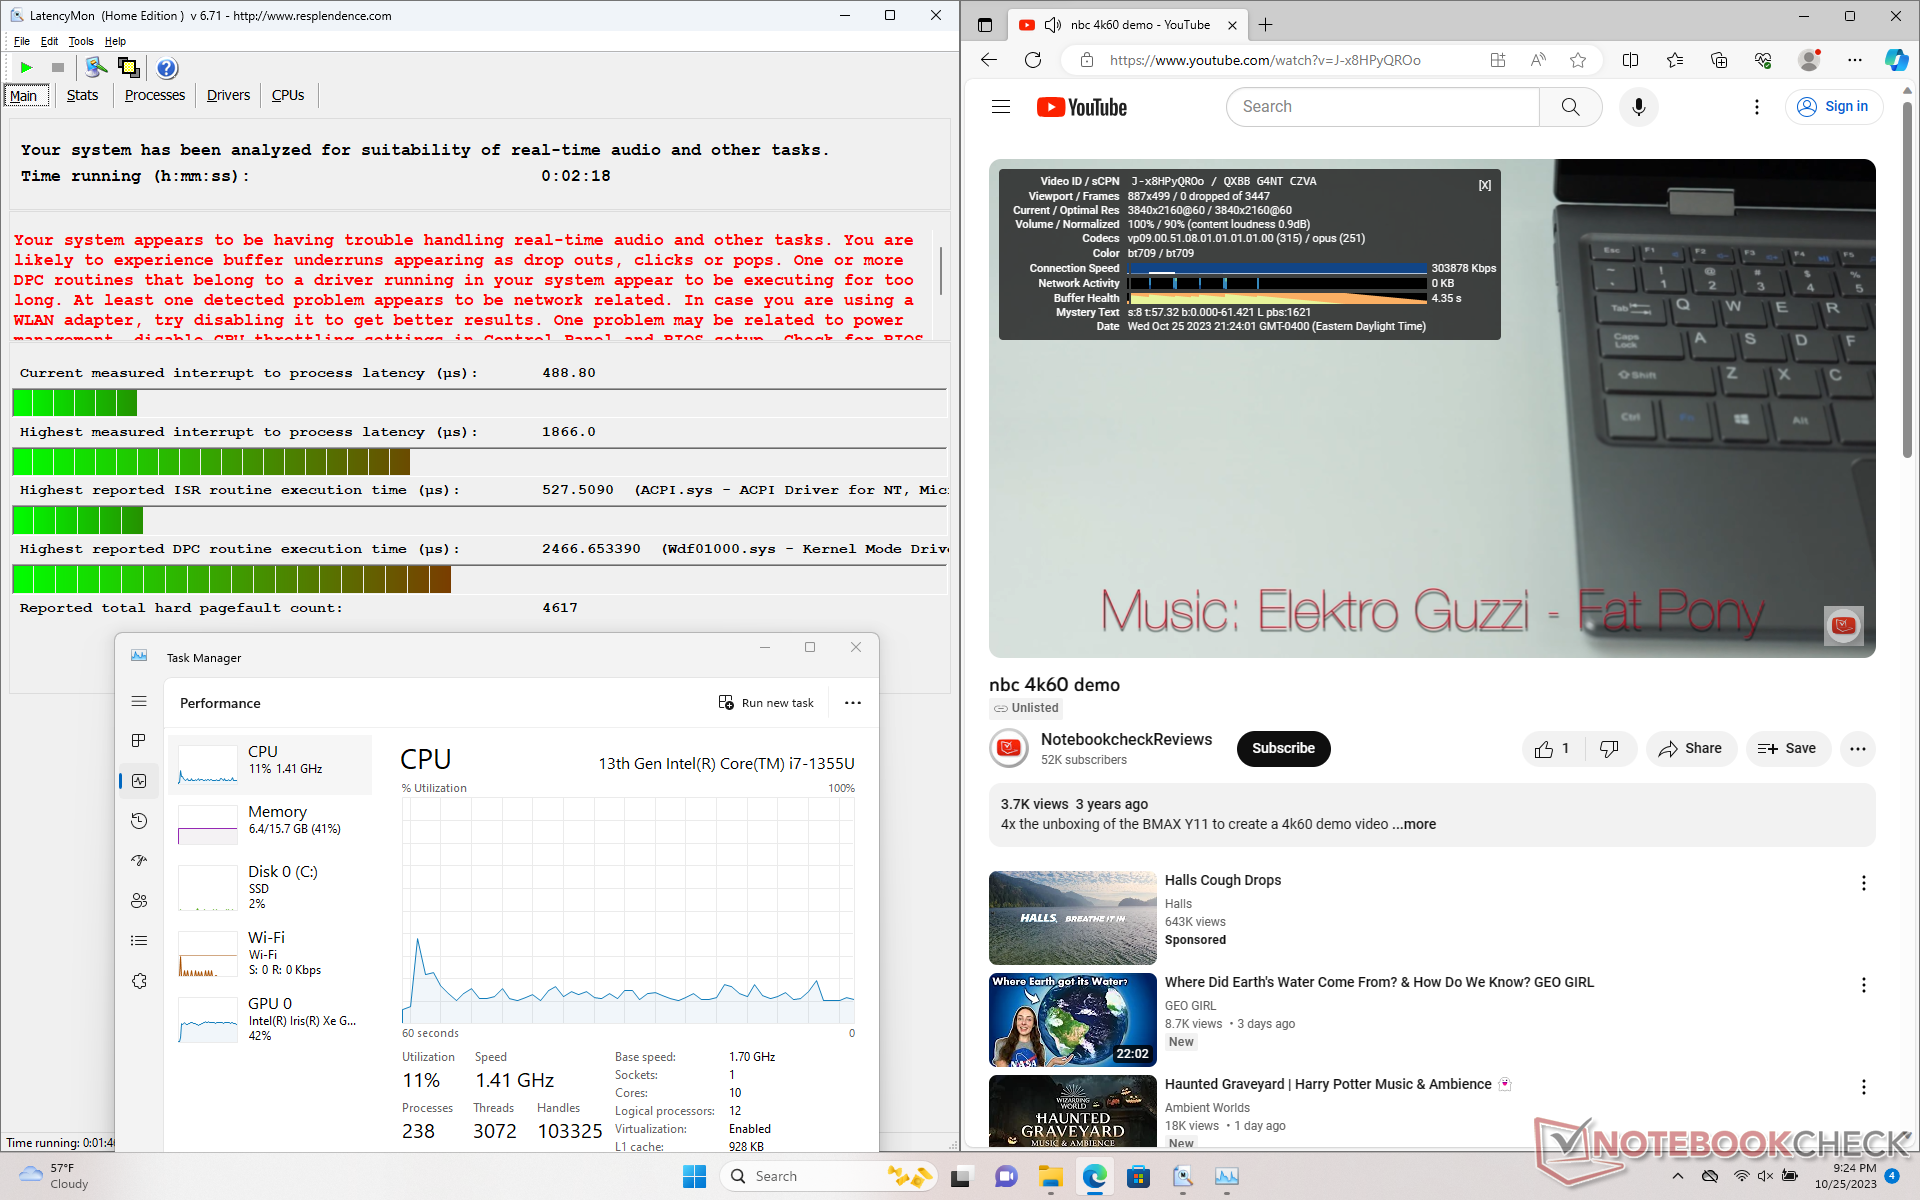
O LatencyMon revela pequenos problemas de DPC ao abrir várias guias do navegador em nossa página inicial. a reprodução de vídeo 4K a 60 FPS é suave e não há registro de queda de quadros.
| DPC Latencies / LatencyMon - interrupt to process latency (max), Web, Youtube, Prime95 | |
| Dell Latitude 9330 | |
| HP Elite Dragonfly Folio 13.5 G3 | |
| MSI Summit E13 Flip Evo A11MT | |
| Lenovo ThinkPad L13 Yoga G4 i7-1355U | |
| Framework Laptop 13.5 Ryzen 7 7840U | |
| Lenovo ThinkPad L13 Yoga G4 21FSS00100 | |
* ... menor é melhor
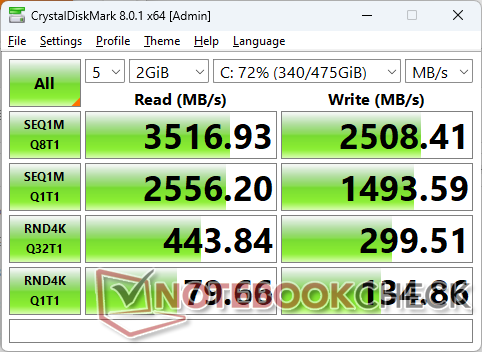
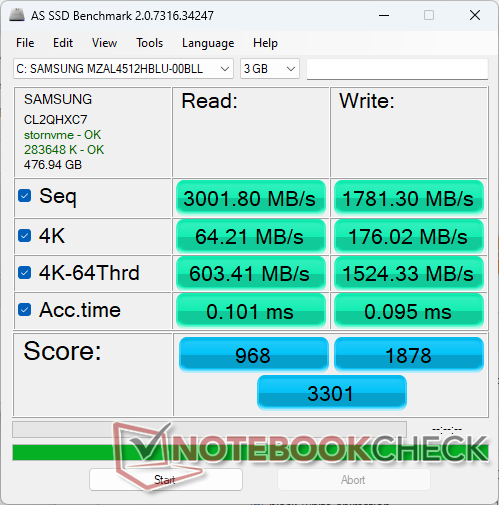
Dispositivos de armazenamento
Nossa unidade é fornecida com um modelo intermediário de 512 GBSamsung PM9B1 em vez do Kioxia BG5 encontrado em nossa versão AMD. As taxas de transferência atingem o máximo em torno de 3.600 MB/s antes que o estrangulamento entre em ação após alguns minutos de estresse, caso em que as taxas de transferência podem ser tão baixas quanto 2.200 MB/s.

| Drive Performance rating - Percent | |
| HP Elite Dragonfly Folio 13.5 G3 -11! | |
| MSI Summit E13 Flip Evo A11MT | |
| Framework Laptop 13.5 Ryzen 7 7840U -11! | |
| Dell Latitude 9330 | |
| Lenovo ThinkPad L13 Yoga G4 21FSS00100 | |
| Lenovo ThinkPad L13 Yoga G4 i7-1355U | |
* ... menor é melhor
Disk Throttling: DiskSpd Read Loop, Queue Depth 8
Desempenho da GPU
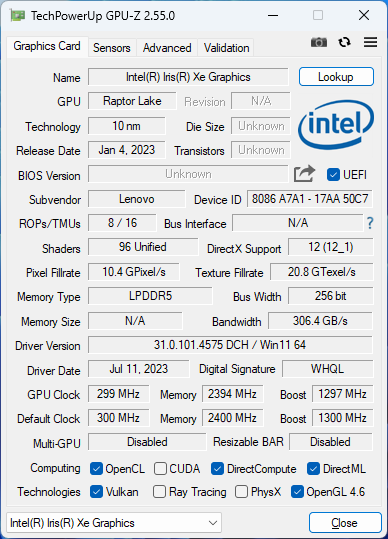
Nosso Iris Xe 96 EUs tem uma clara vantagem sobre aRadeon RX Vega 7 no Ryzen 5 7530U em aplicativos DX11 e DX12. os resultados do 3DMark Fire Strike e Time Spy, por exemplo, são 50 a 60% mais rápidos com nossa configuração Intel.
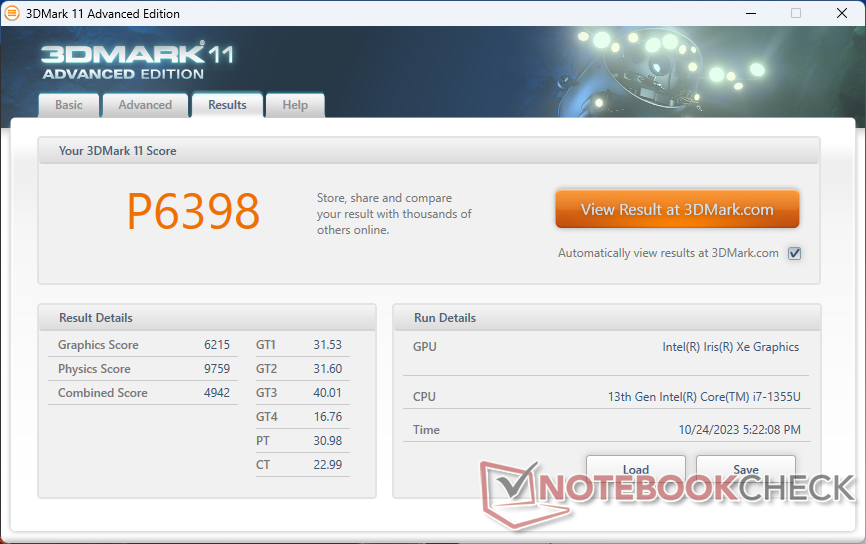
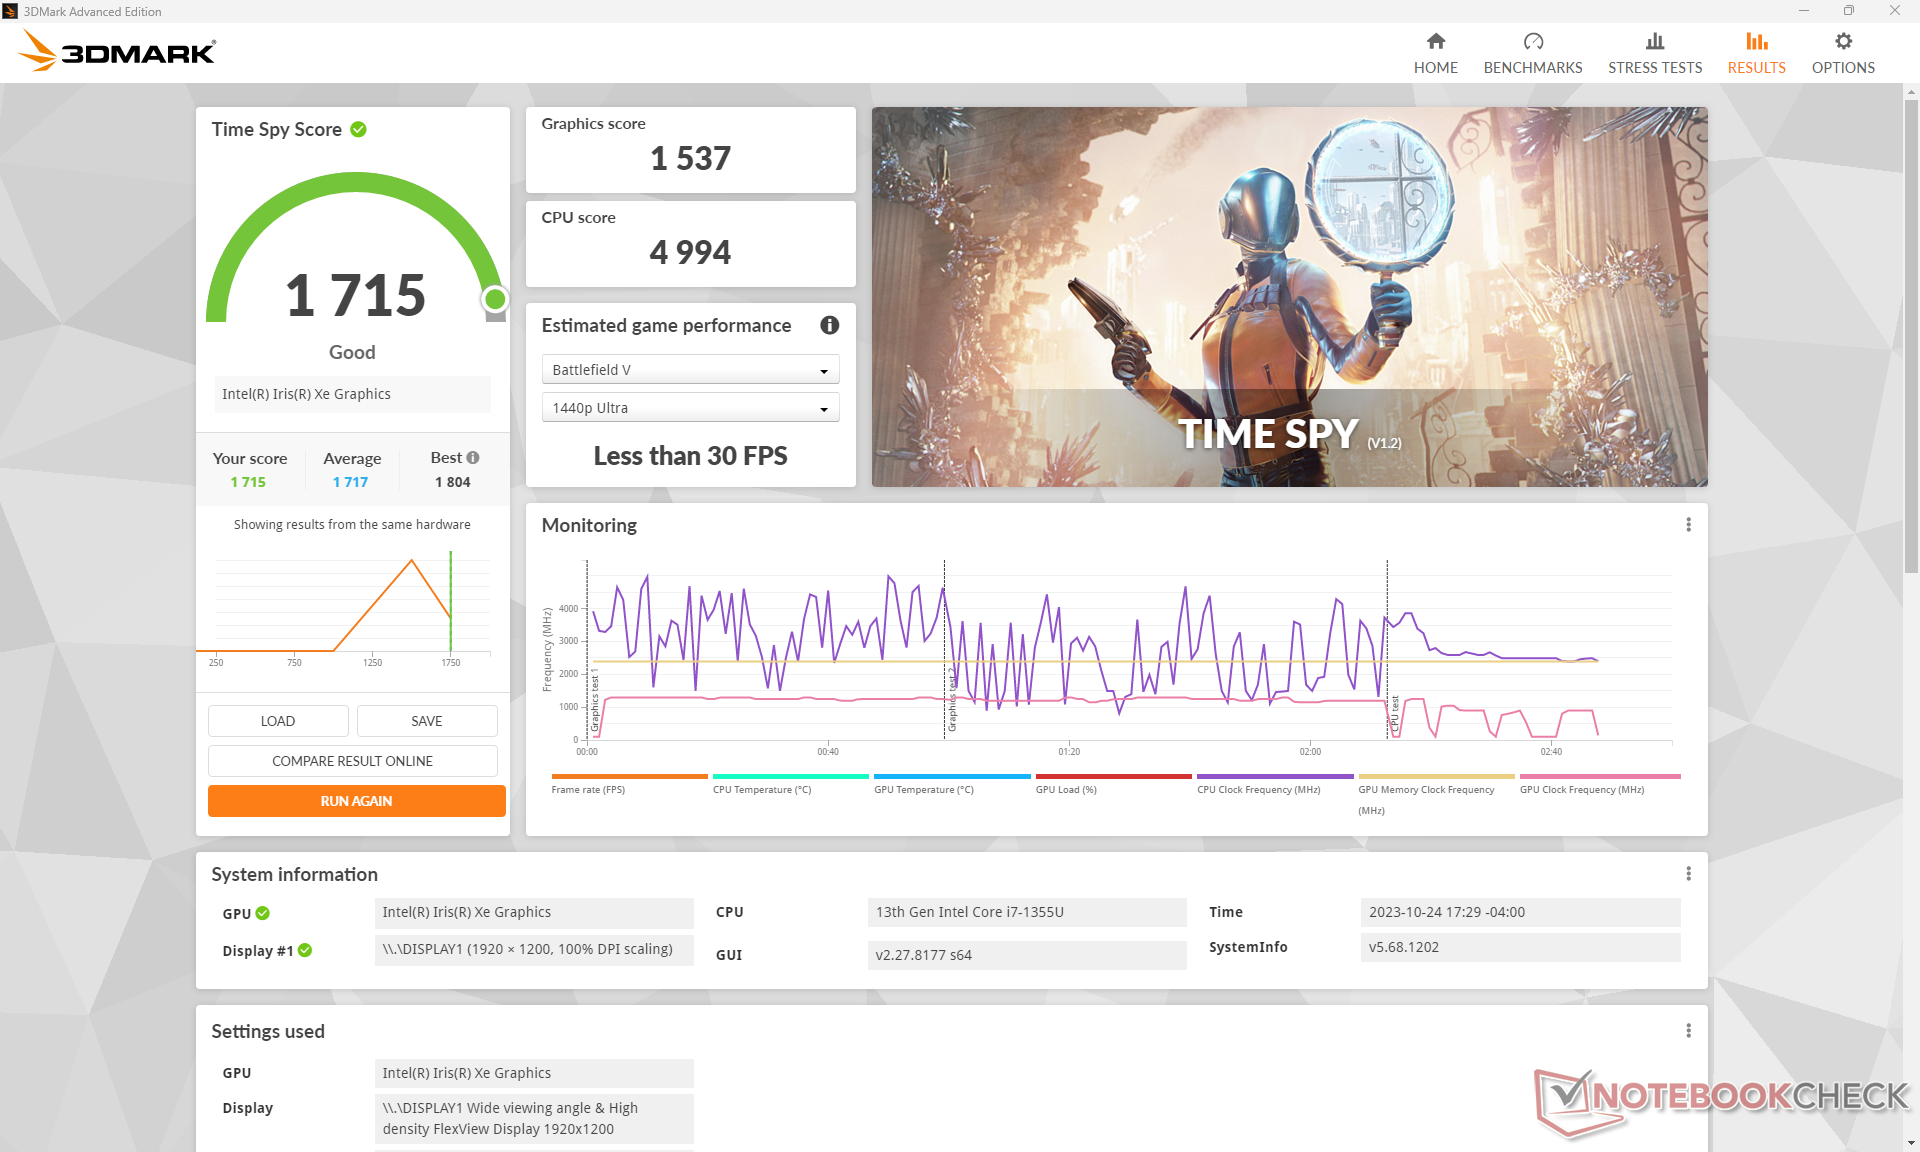
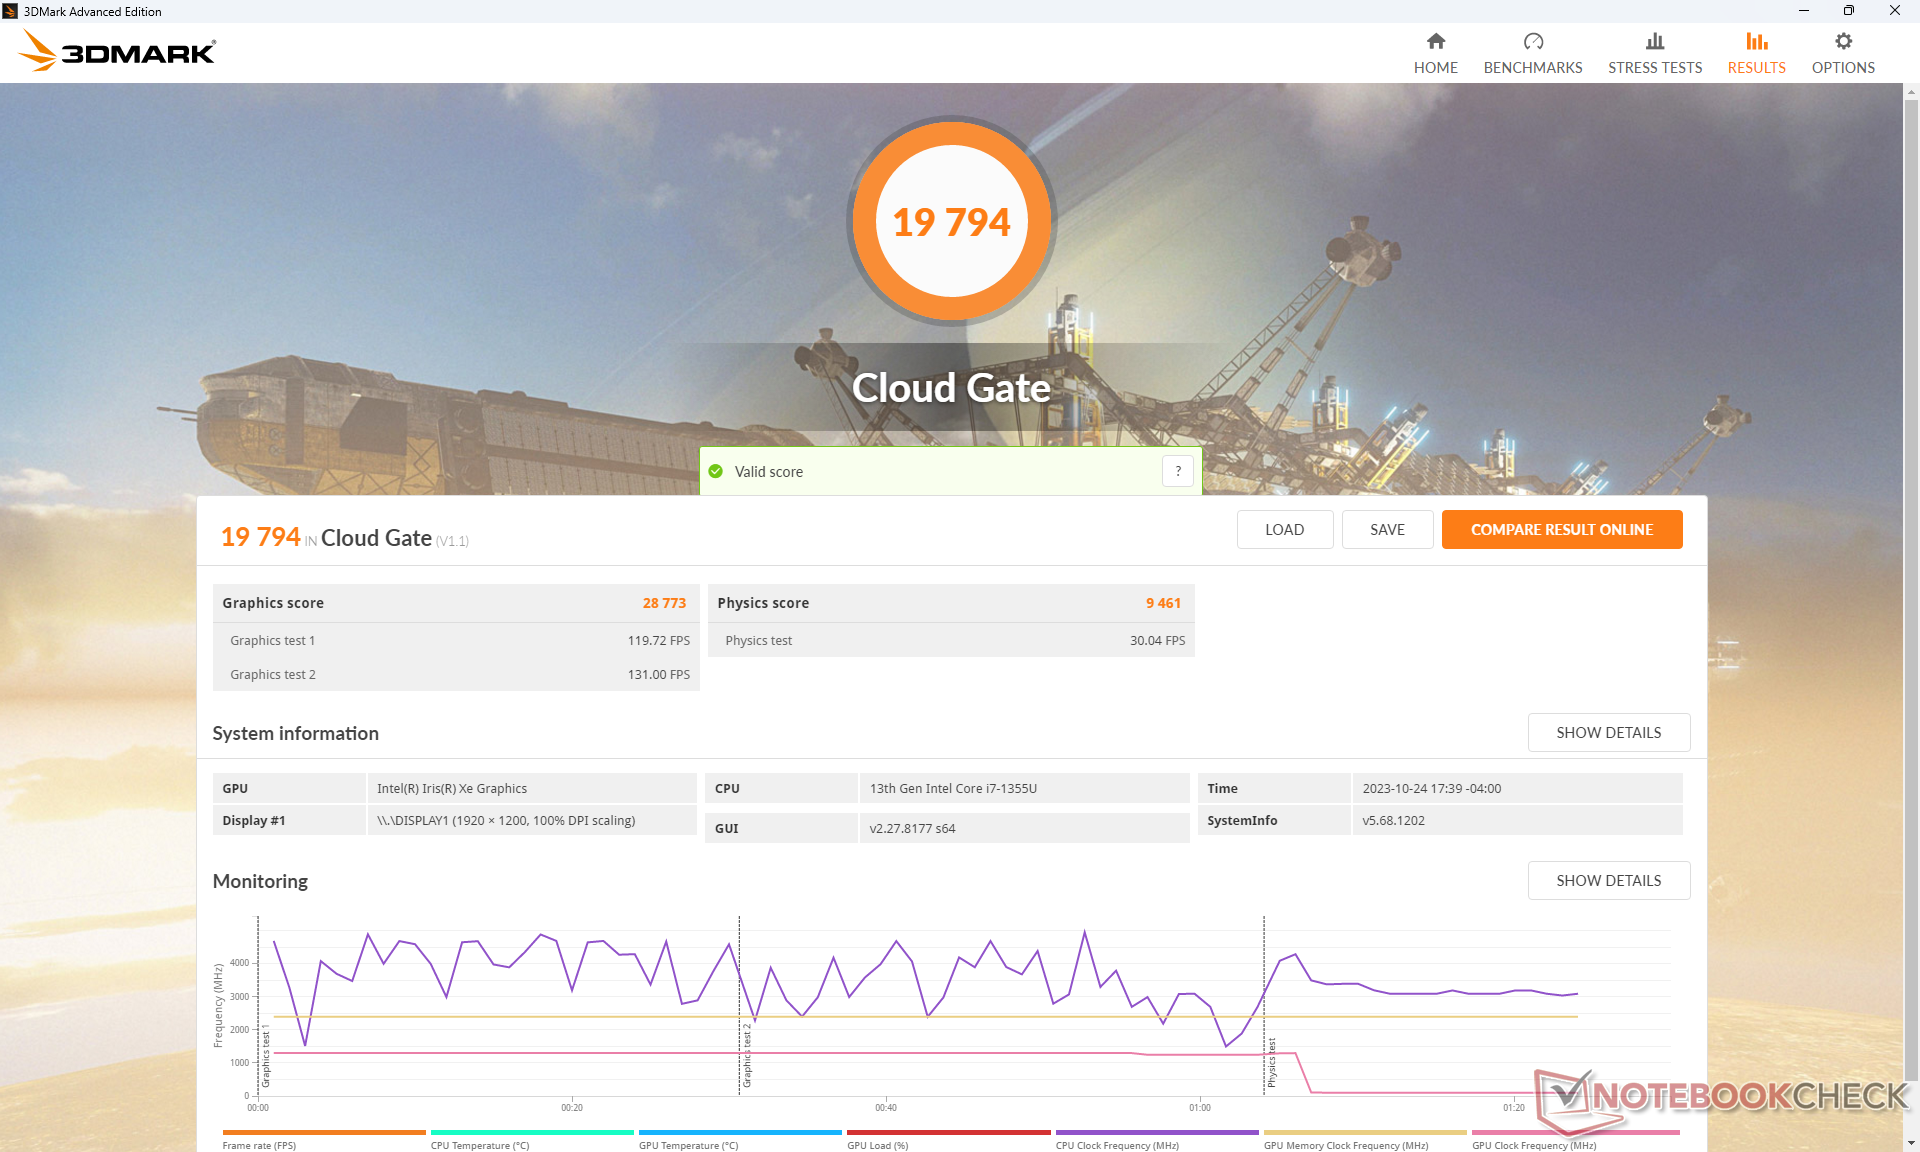
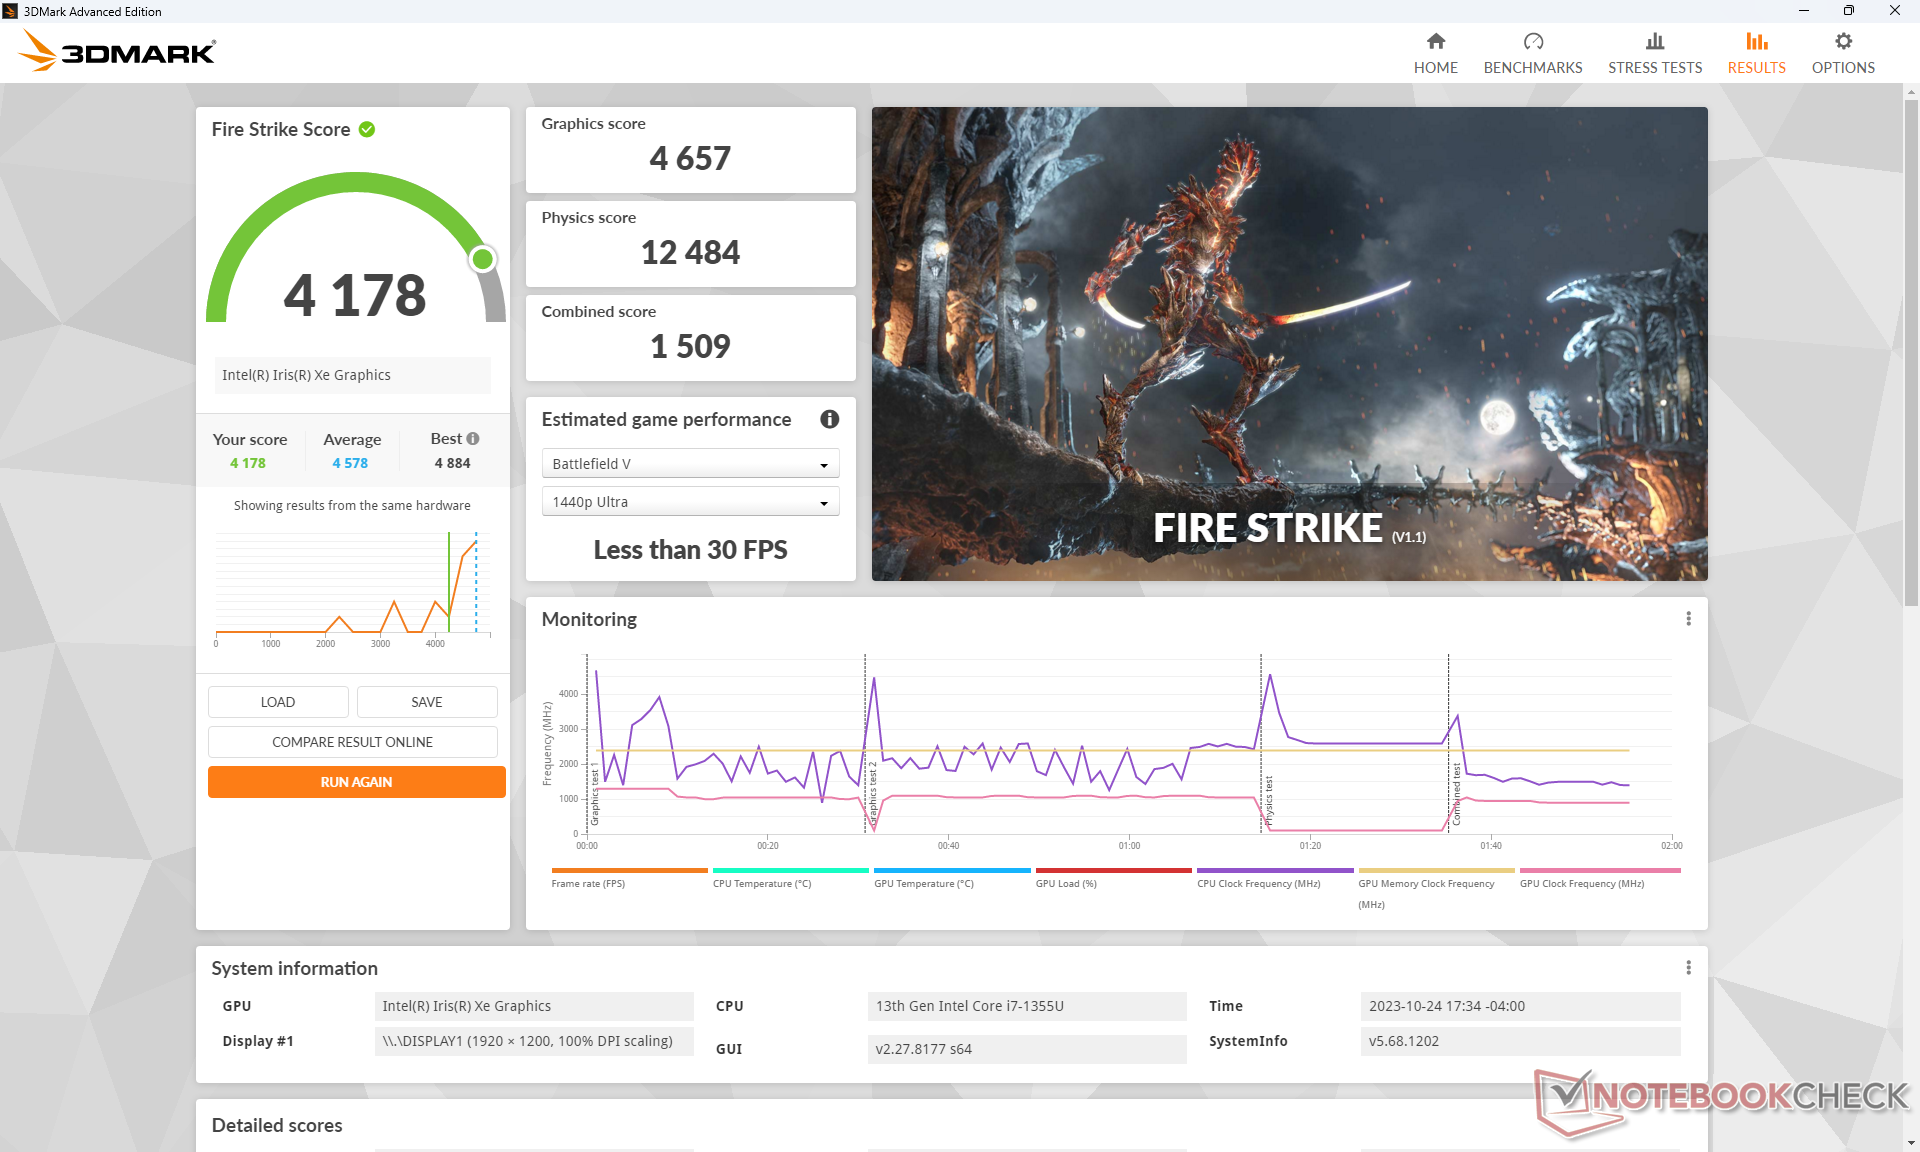
| 3DMark 11 Performance | 6398 pontos | |
| 3DMark Cloud Gate Standard Score | 19794 pontos | |
| 3DMark Fire Strike Score | 4178 pontos | |
| 3DMark Time Spy Score | 1715 pontos | |
Ajuda | ||
* ... menor é melhor
Infelizmente, a estabilidade da taxa de quadros em jogos é instável. Quando em marcha lenta em Witcher 3 em configurações baixas, por exemplo, as taxas de quadros flutuam entre 70 e 85 FPS, como mostra o gráfico abaixo, sugerindo taxas de clock flutuantes ao longo do tempo. Felizmente, o ThinkPad L13 não é um notebook para jogos e, portanto, essa desvantagem específica não deve ser um obstáculo para o público-alvo. Os aplicativos de streaming ainda funcionam sem problemas na máquina.
Witcher 3 FPS Chart
| baixo | média | alto | ultra | |
|---|---|---|---|---|
| GTA V (2015) | 106.7 | 84.1 | 9.99 | |
| The Witcher 3 (2015) | 92.8 | 56.7 | 31 | 13.8 |
| Dota 2 Reborn (2015) | 94.3 | 65.3 | 52.4 | 46.2 |
| Final Fantasy XV Benchmark (2018) | 36.6 | 20.1 | 15 | |
| X-Plane 11.11 (2018) | 39.8 | 27.3 | 25.1 | |
| Far Cry 5 (2018) | 45 | 24 | 22 | 21 |
| Strange Brigade (2018) | 87.2 | 38.1 | 30.5 | 23 |
| Cyberpunk 2077 1.6 (2022) | 17.8 | |||
| Tiny Tina's Wonderlands (2022) | 23.3 | 17.7 | 10.9 | 8.6 |
| F1 22 (2022) | 45 | 41.1 | 29.8 | 22.6 |
Emissões
Ruído do sistema
O ruído da ventoinha pode ser mais alto na versão Intel do que na versão AMD ao executar cargas exigentes como o 3DMark, o que pode ser atribuído ao desempenho gráfico mais rápido e ao consumo geral de energia da versão Intel. Por outro lado, o ruído da ventoinha normalmente fica na faixa de 30 dB(A) quando o usuário navega na Web ou faz streaming, sendo facilmente ignorável na maioria dos ambientes de escritório ou de conferência.
Barulho
| Ocioso |
| 23.4 / 23.4 / 23.4 dB |
| Carga |
| 33.9 / 36.9 dB |
 | ||
30 dB silencioso 40 dB(A) audível 50 dB(A) ruidosamente alto |
||
min: | ||
| Lenovo ThinkPad L13 Yoga G4 i7-1355U Iris Xe G7 96EUs, i7-1355U, Samsung PM9B1 512GB MZAL4512HBLU | Lenovo ThinkPad L13 Yoga G4 21FSS00100 Vega 7, R5 7530U, Kioxia BG5 KBG5AZNT512G | HP Elite Dragonfly Folio 13.5 G3 Iris Xe G7 96EUs, i7-1265U, Samsung PM9A1 MZVL2512HCJQ | Dell Latitude 9330 Iris Xe G7 96EUs, i7-1260U | MSI Summit E13 Flip Evo A11MT Iris Xe G7 96EUs, i7-1185G7, Phison 1TB SM2801T24GKBB4S-E162 | Framework Laptop 13.5 Ryzen 7 7840U Radeon 780M, R7 7840U, WD PC SN740 512GB SDDPNQD-512G | |
|---|---|---|---|---|---|---|
| Noise | 9% | 2% | -4% | -12% | -9% | |
| desligado / ambiente * (dB) | 23.1 | 23.4 -1% | 24.6 -6% | 23 -0% | 24.5 -6% | 22.6 2% |
| Idle Minimum * (dB) | 23.4 | 23.4 -0% | 24.6 -5% | 23 2% | 24.7 -6% | 22.6 3% |
| Idle Average * (dB) | 23.4 | 23.4 -0% | 24.6 -5% | 23.1 1% | 24.7 -6% | 22.6 3% |
| Idle Maximum * (dB) | 23.4 | 23.4 -0% | 24.6 -5% | 23.1 1% | 26.4 -13% | 24.2 -3% |
| Load Average * (dB) | 33.9 | 24 29% | 27.8 18% | 37.1 -9% | 37.8 -12% | 35.8 -6% |
| Witcher 3 ultra * (dB) | 36.9 | 30.8 17% | 33.4 9% | 40.6 -10% | 41.4 -12% | 46.5 -26% |
| Load Maximum * (dB) | 36.9 | 30.1 18% | 33.4 9% | 40.5 -10% | 48.8 -32% | 48.9 -33% |
* ... menor é melhor
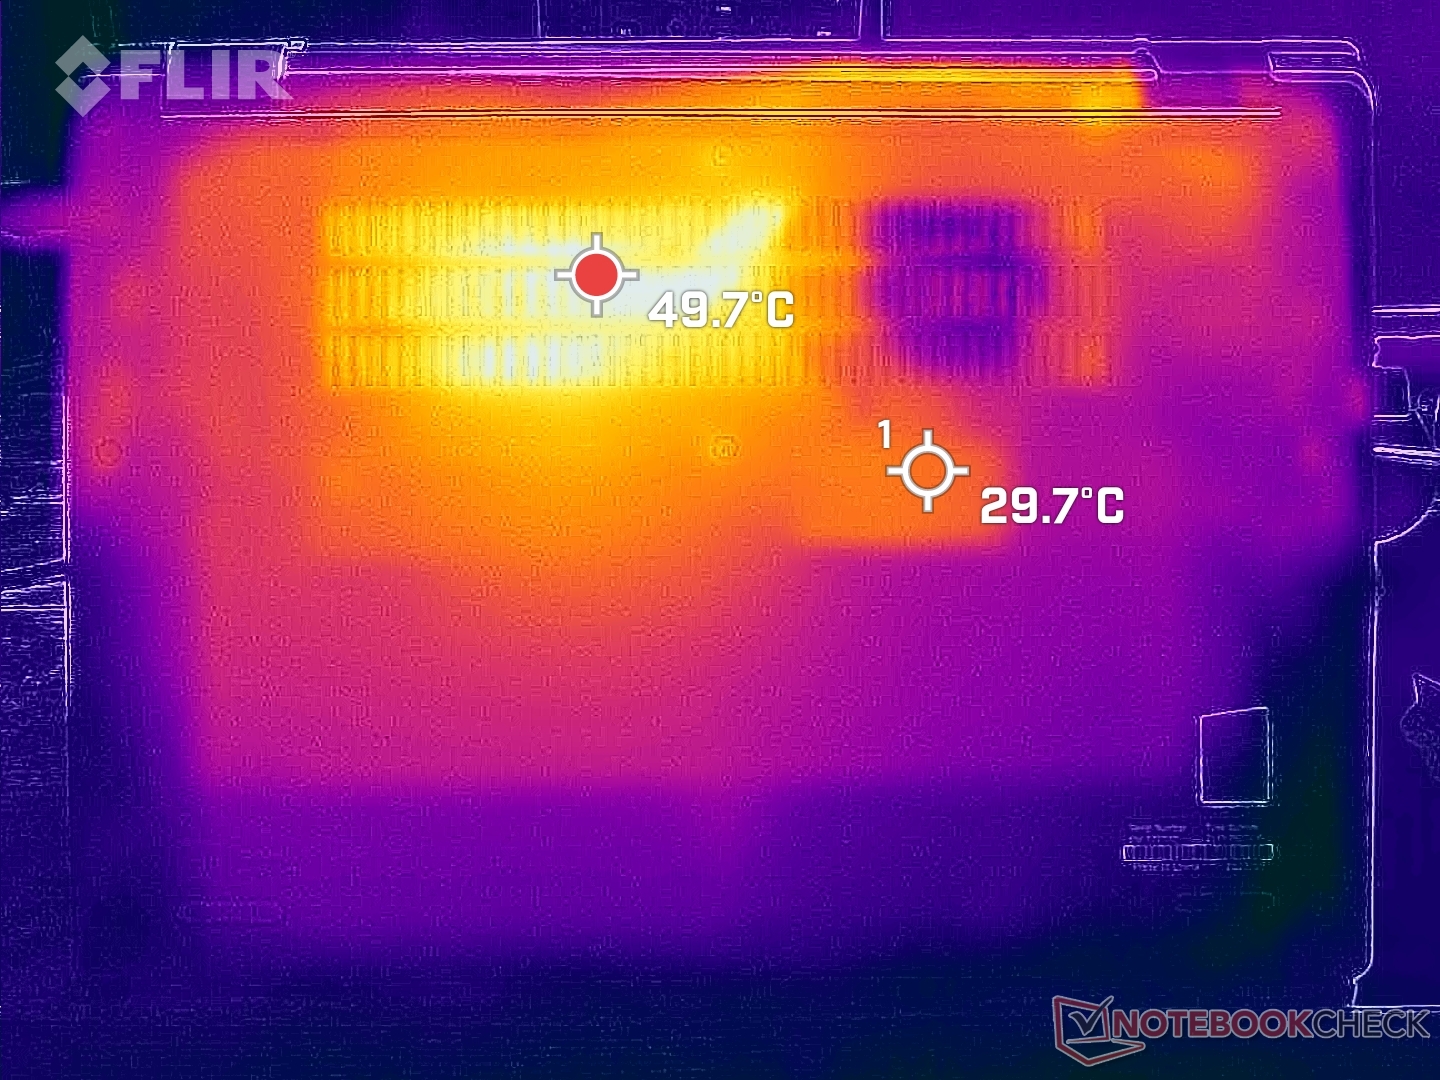
Temperatura
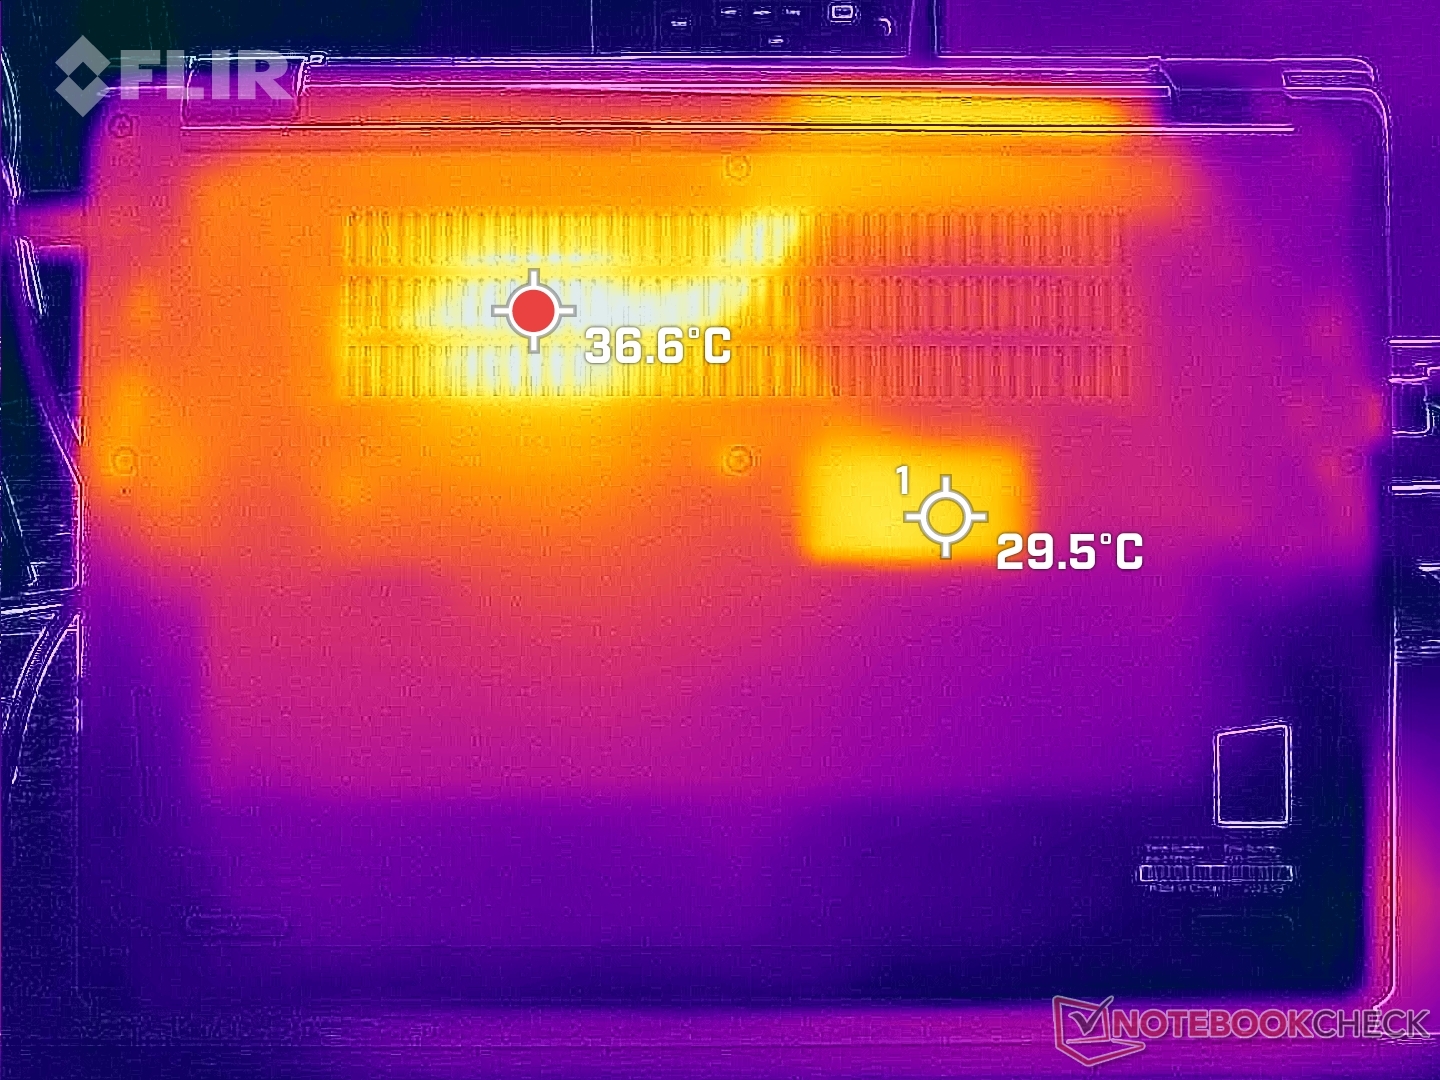
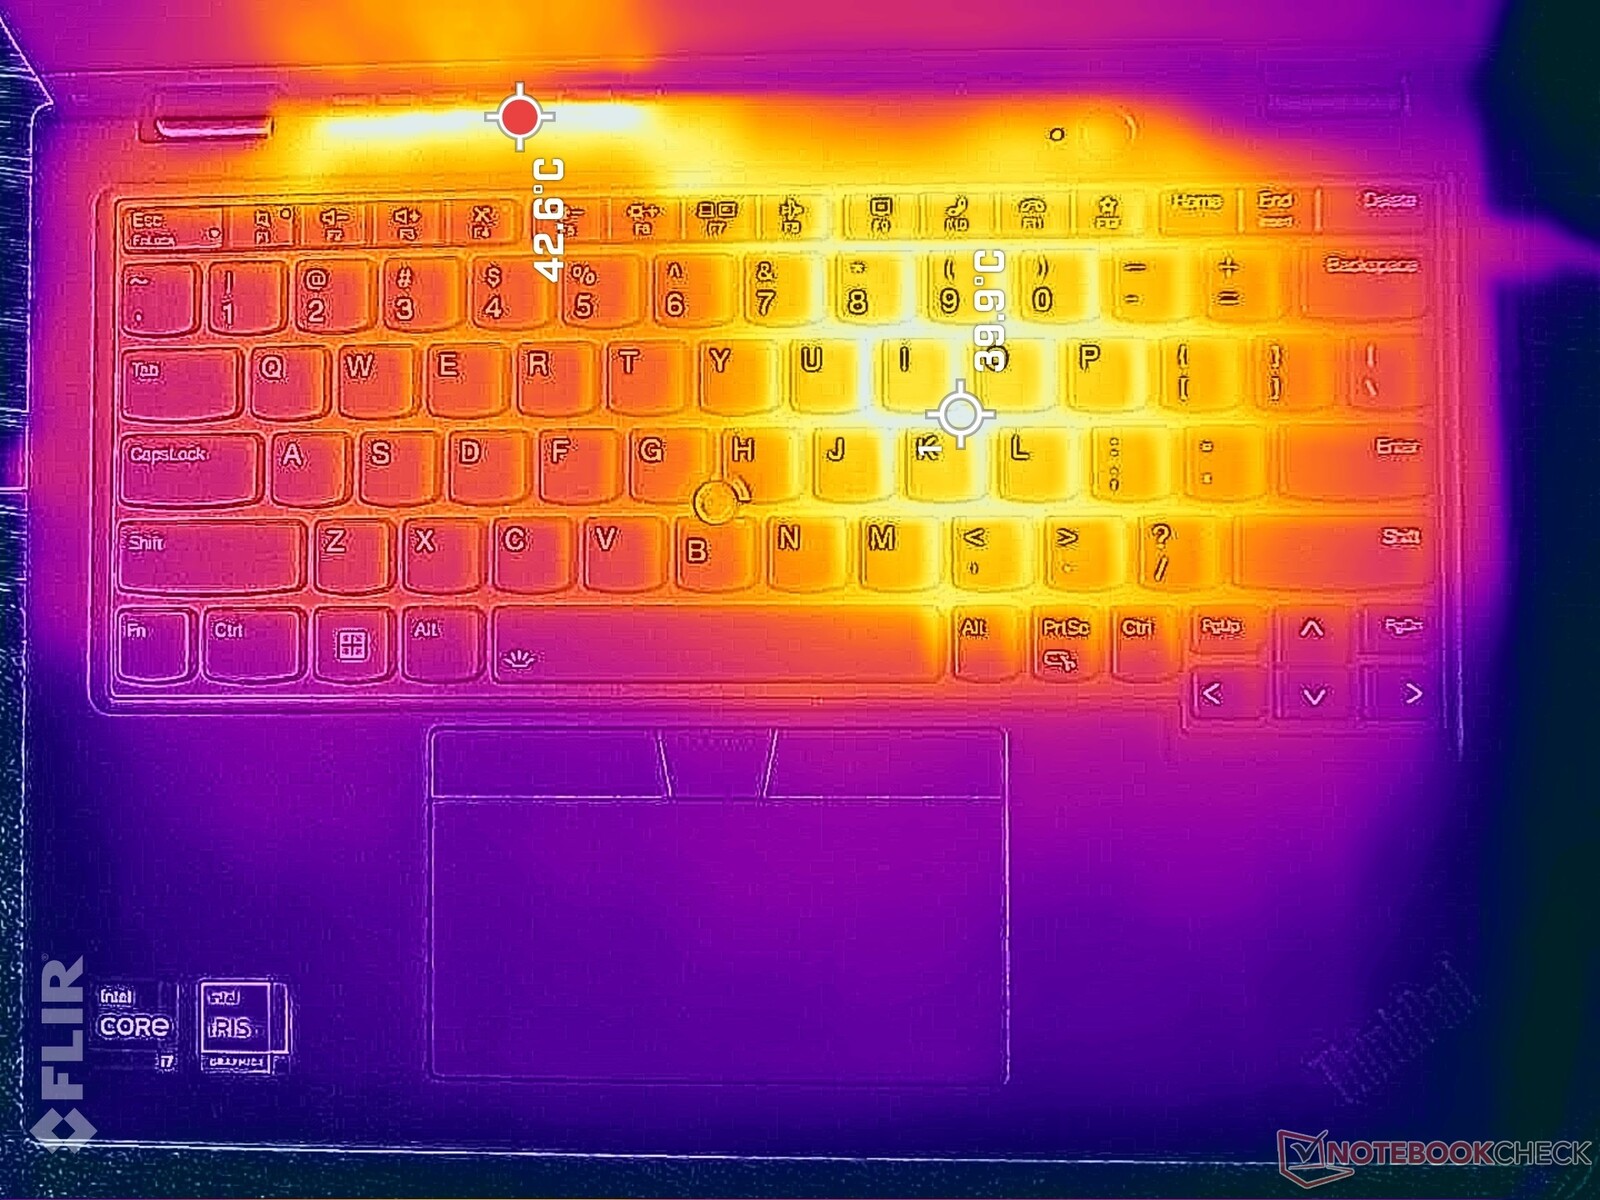
Os pontos quentes podem chegar a 40 °C no lado direito do teclado, semelhante ao que registramos na configuração da AMD. Portanto, a unidade Intel não funciona significativamente mais fria ou mais quente, apesar das diferenças de desempenho.
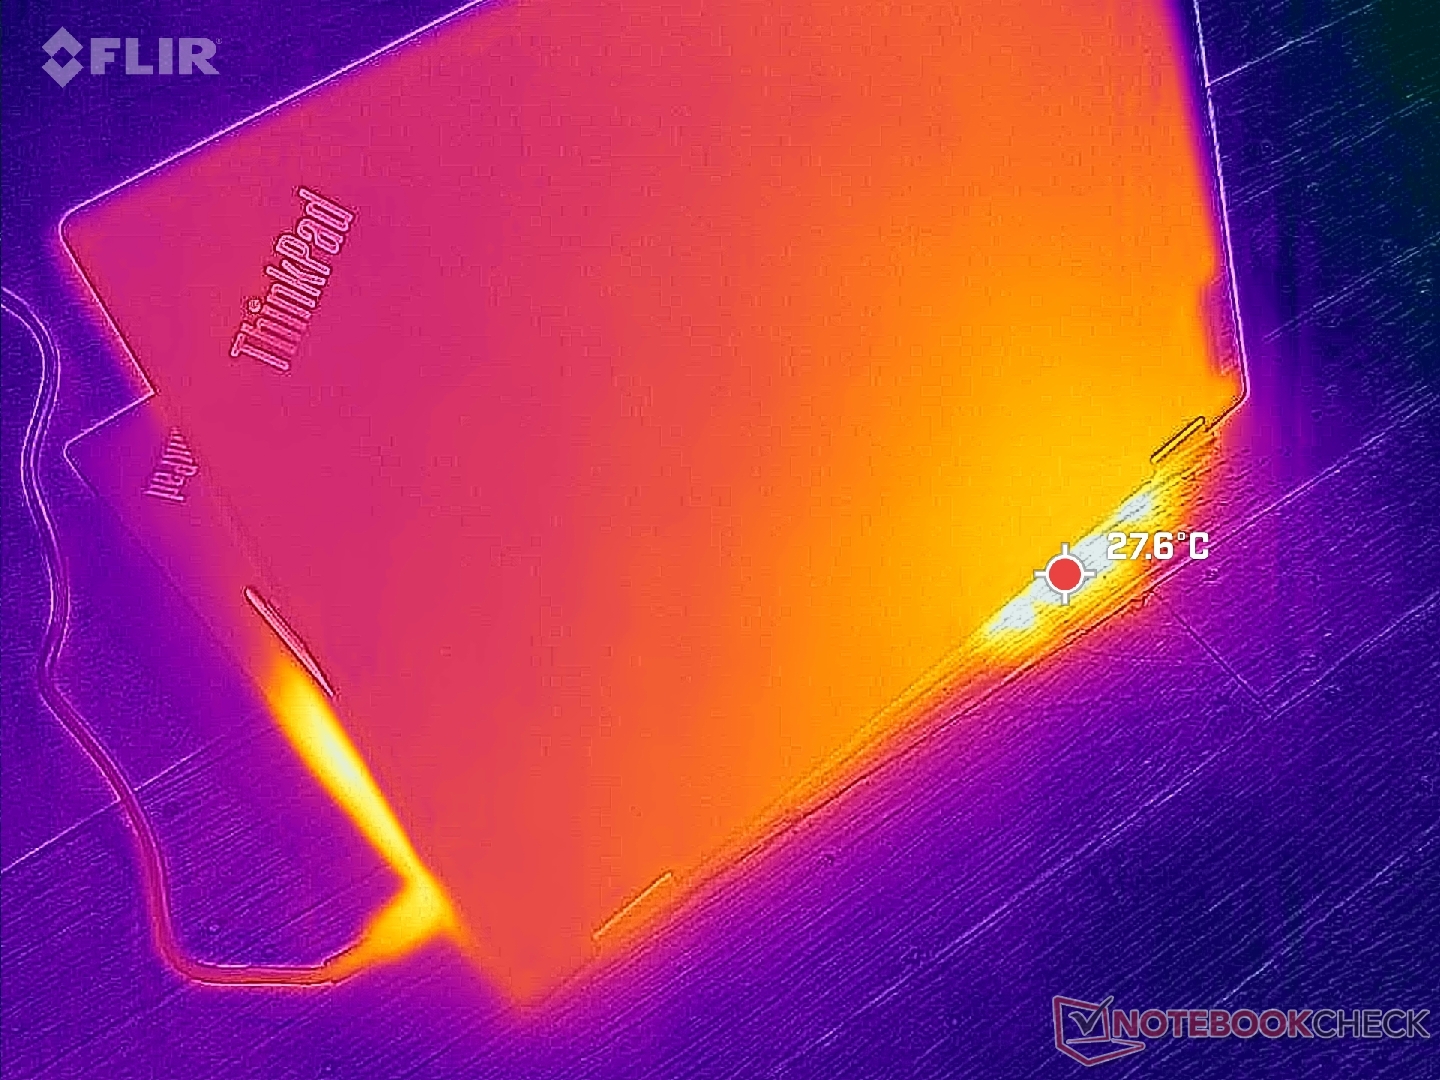
(+) A temperatura máxima no lado superior é 38.4 °C / 101 F, em comparação com a média de 35.4 °C / 96 F , variando de 19.6 a 60 °C para a classe Convertible.
(-) A parte inferior aquece até um máximo de 46 °C / 115 F, em comparação com a média de 36.9 °C / 98 F
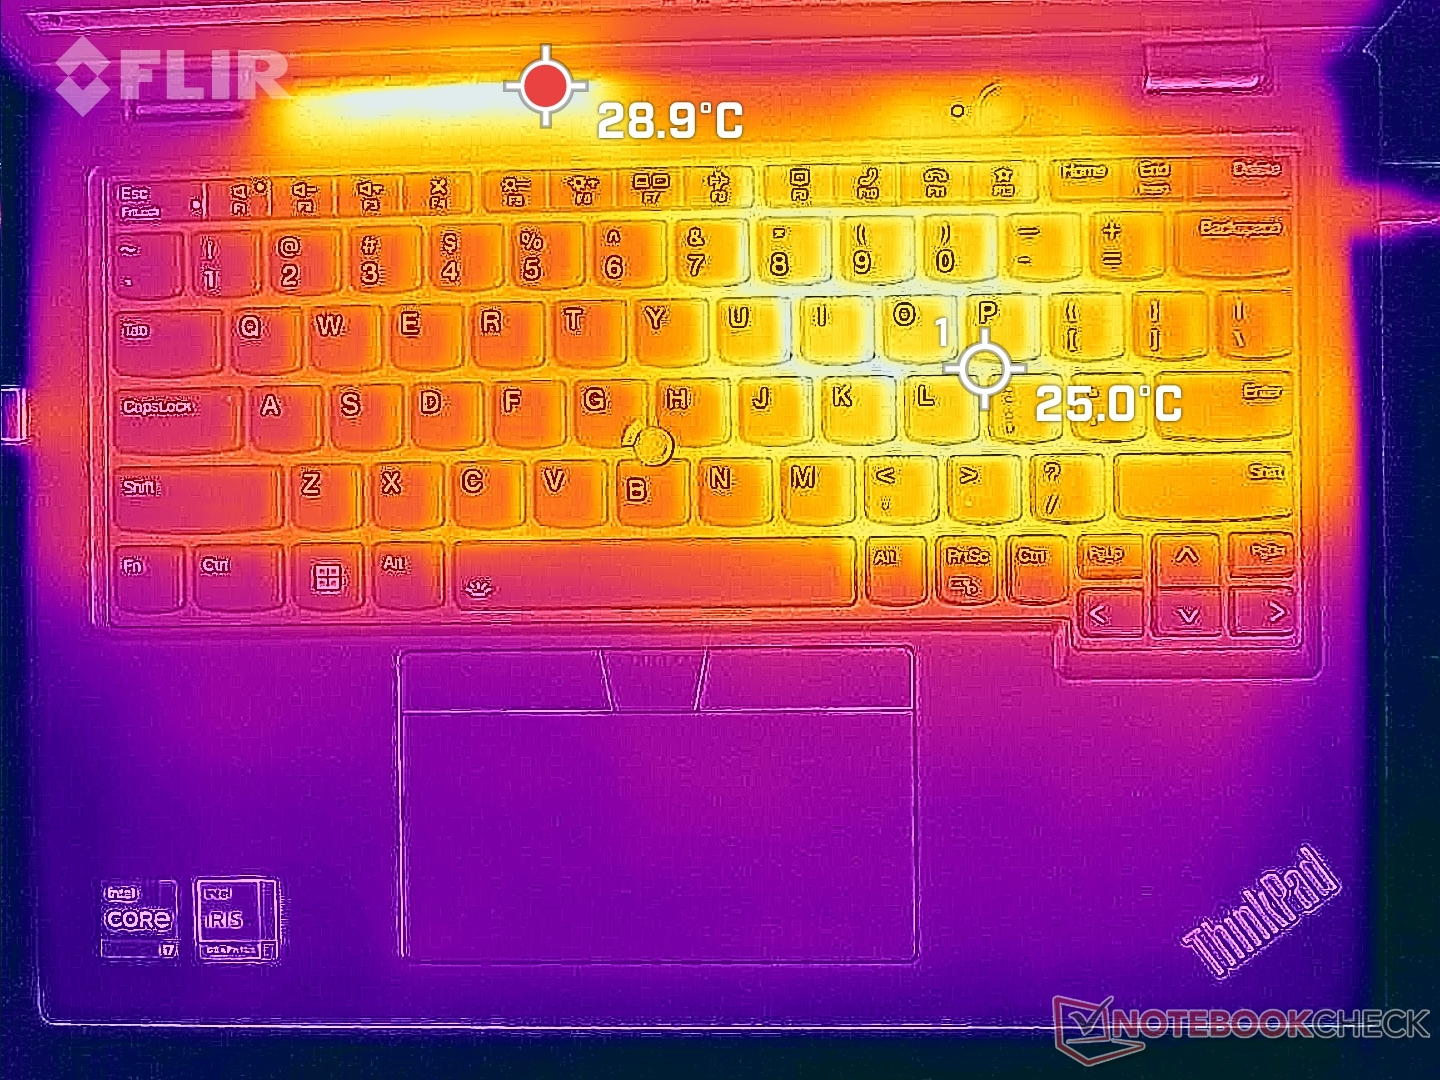
(+) Em uso inativo, a temperatura média para o lado superior é 27.2 °C / 81 F, em comparação com a média do dispositivo de 30.3 °C / ### class_avg_f### F.
(+) Os apoios para as mãos e o touchpad são mais frios que a temperatura da pele, com um máximo de 23.6 °C / 74.5 F e, portanto, são frios ao toque.
(+) A temperatura média da área do apoio para as mãos de dispositivos semelhantes foi 28 °C / 82.4 F (+4.4 °C / 7.9 F).
| Lenovo ThinkPad L13 Yoga G4 i7-1355U Intel Core i7-1355U, Intel Iris Xe Graphics G7 96EUs | Lenovo ThinkPad L13 Yoga G4 21FSS00100 AMD Ryzen 5 7530U, AMD Radeon RX Vega 7 | HP Elite Dragonfly Folio 13.5 G3 Intel Core i7-1265U, Intel Iris Xe Graphics G7 96EUs | Dell Latitude 9330 Intel Core i7-1260U, Intel Iris Xe Graphics G7 96EUs | MSI Summit E13 Flip Evo A11MT Intel Core i7-1185G7, Intel Iris Xe Graphics G7 96EUs | Framework Laptop 13.5 Ryzen 7 7840U AMD Ryzen 7 7840U, AMD Radeon 780M | |
|---|---|---|---|---|---|---|
| Heat | -3% | 23% | 7% | -14% | 3% | |
| Maximum Upper Side * (°C) | 38.4 | 43.3 -13% | 32.8 15% | 40.6 -6% | 52 -35% | 42 -9% |
| Maximum Bottom * (°C) | 46 | 46.5 -1% | 33.4 27% | 50.2 -9% | 57.4 -25% | 47.4 -3% |
| Idle Upper Side * (°C) | 31.2 | 31.9 -2% | 24.6 21% | 25 20% | 30.4 3% | 28.8 8% |
| Idle Bottom * (°C) | 34.8 | 33.1 5% | 24.6 29% | 27.6 21% | 34.2 2% | 29.6 15% |
* ... menor é melhor
Teste de estresse
Ao iniciar o estresse do Prime95, a CPU aumentava para 3 GHz, 89 C e 35 W apenas nos primeiros segundos, antes de cair continuamente e se estabilizar em 2,2 GHz, 75 C e 19 W. Esse comportamento se alinha com nossas observações do CineBench R15 xT acima, em que o desempenho era mais alto durante o início do teste antes de cair.
As taxas de clock da GPU durante a execução Witcher 3 oscilam entre 950 e 1150 MHz, o que contribui para as taxas de quadros cíclicas mencionadas acima.
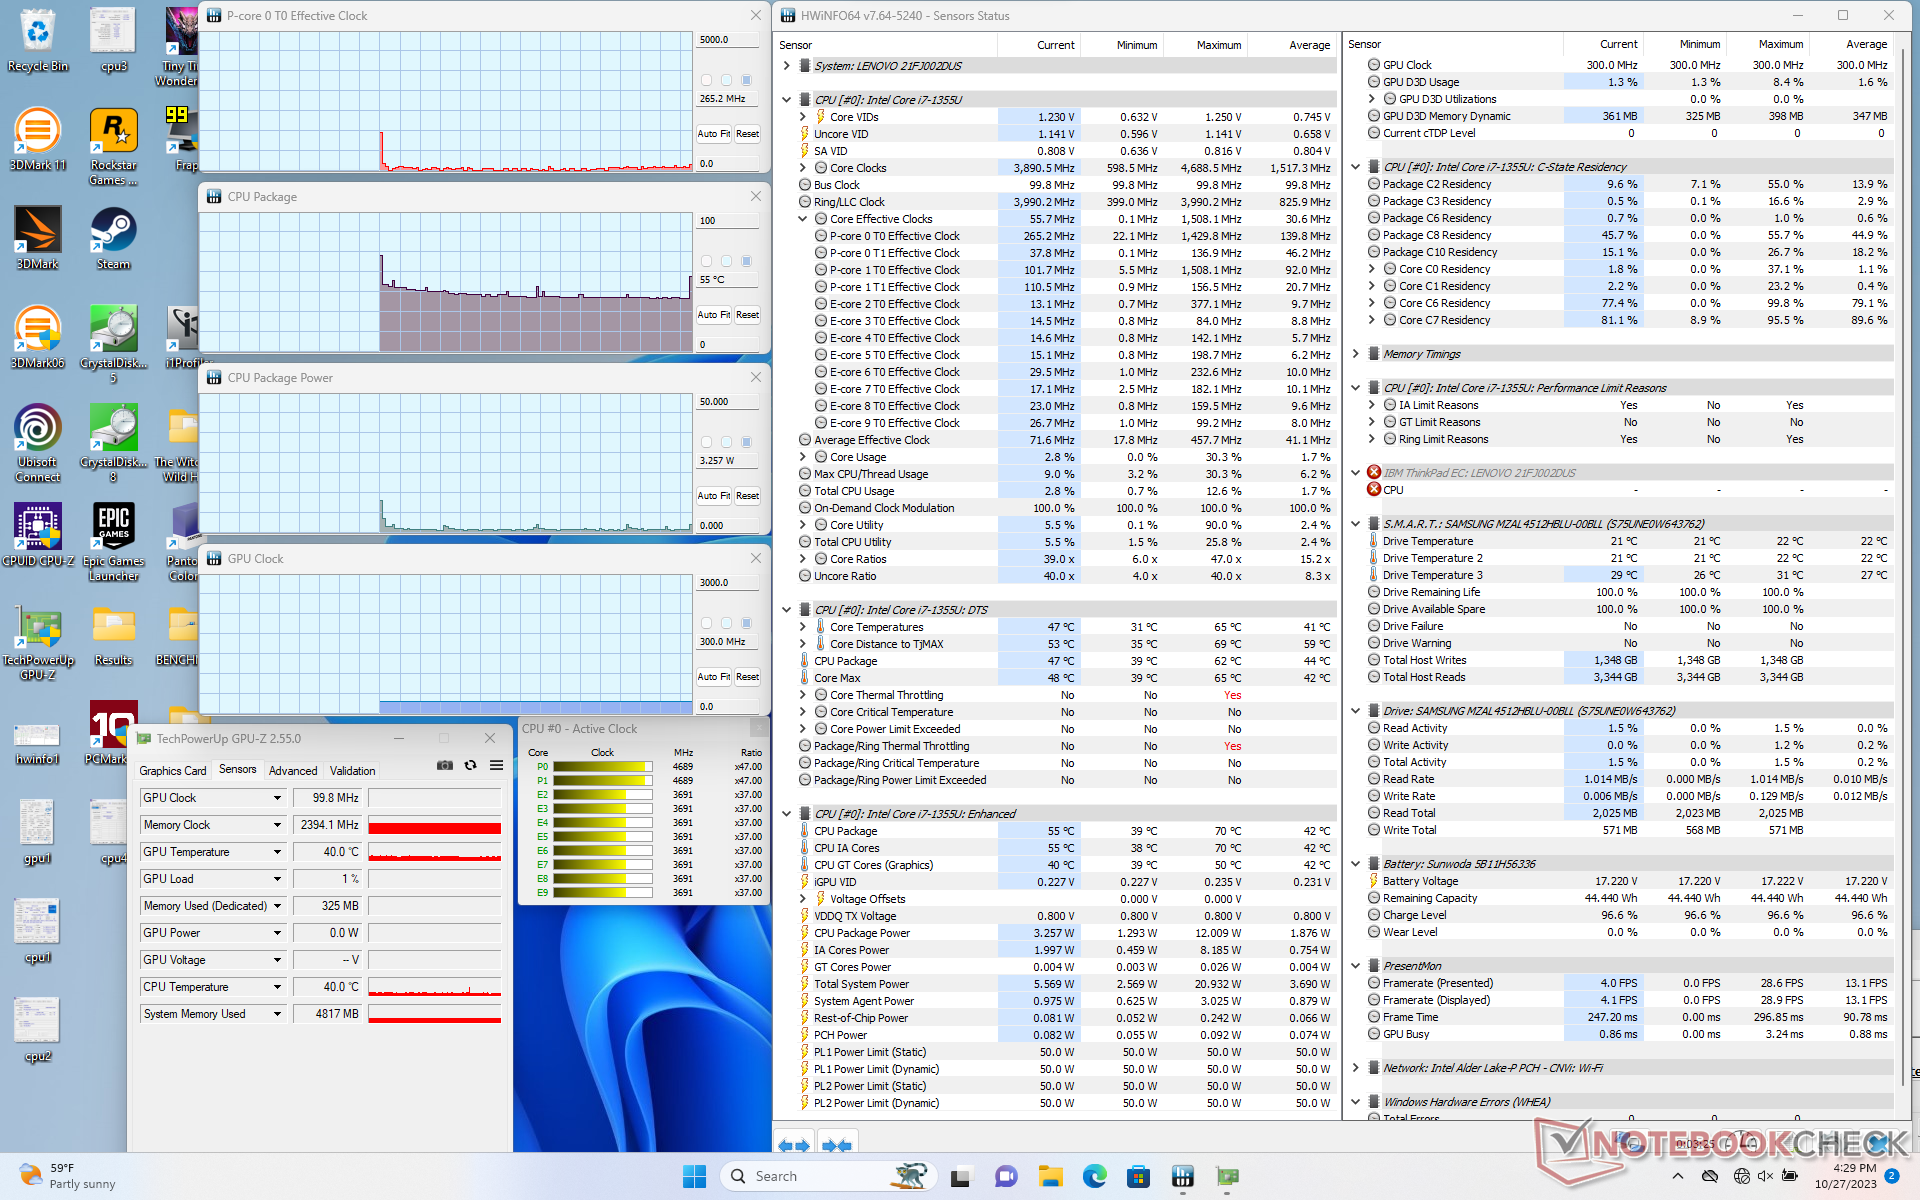
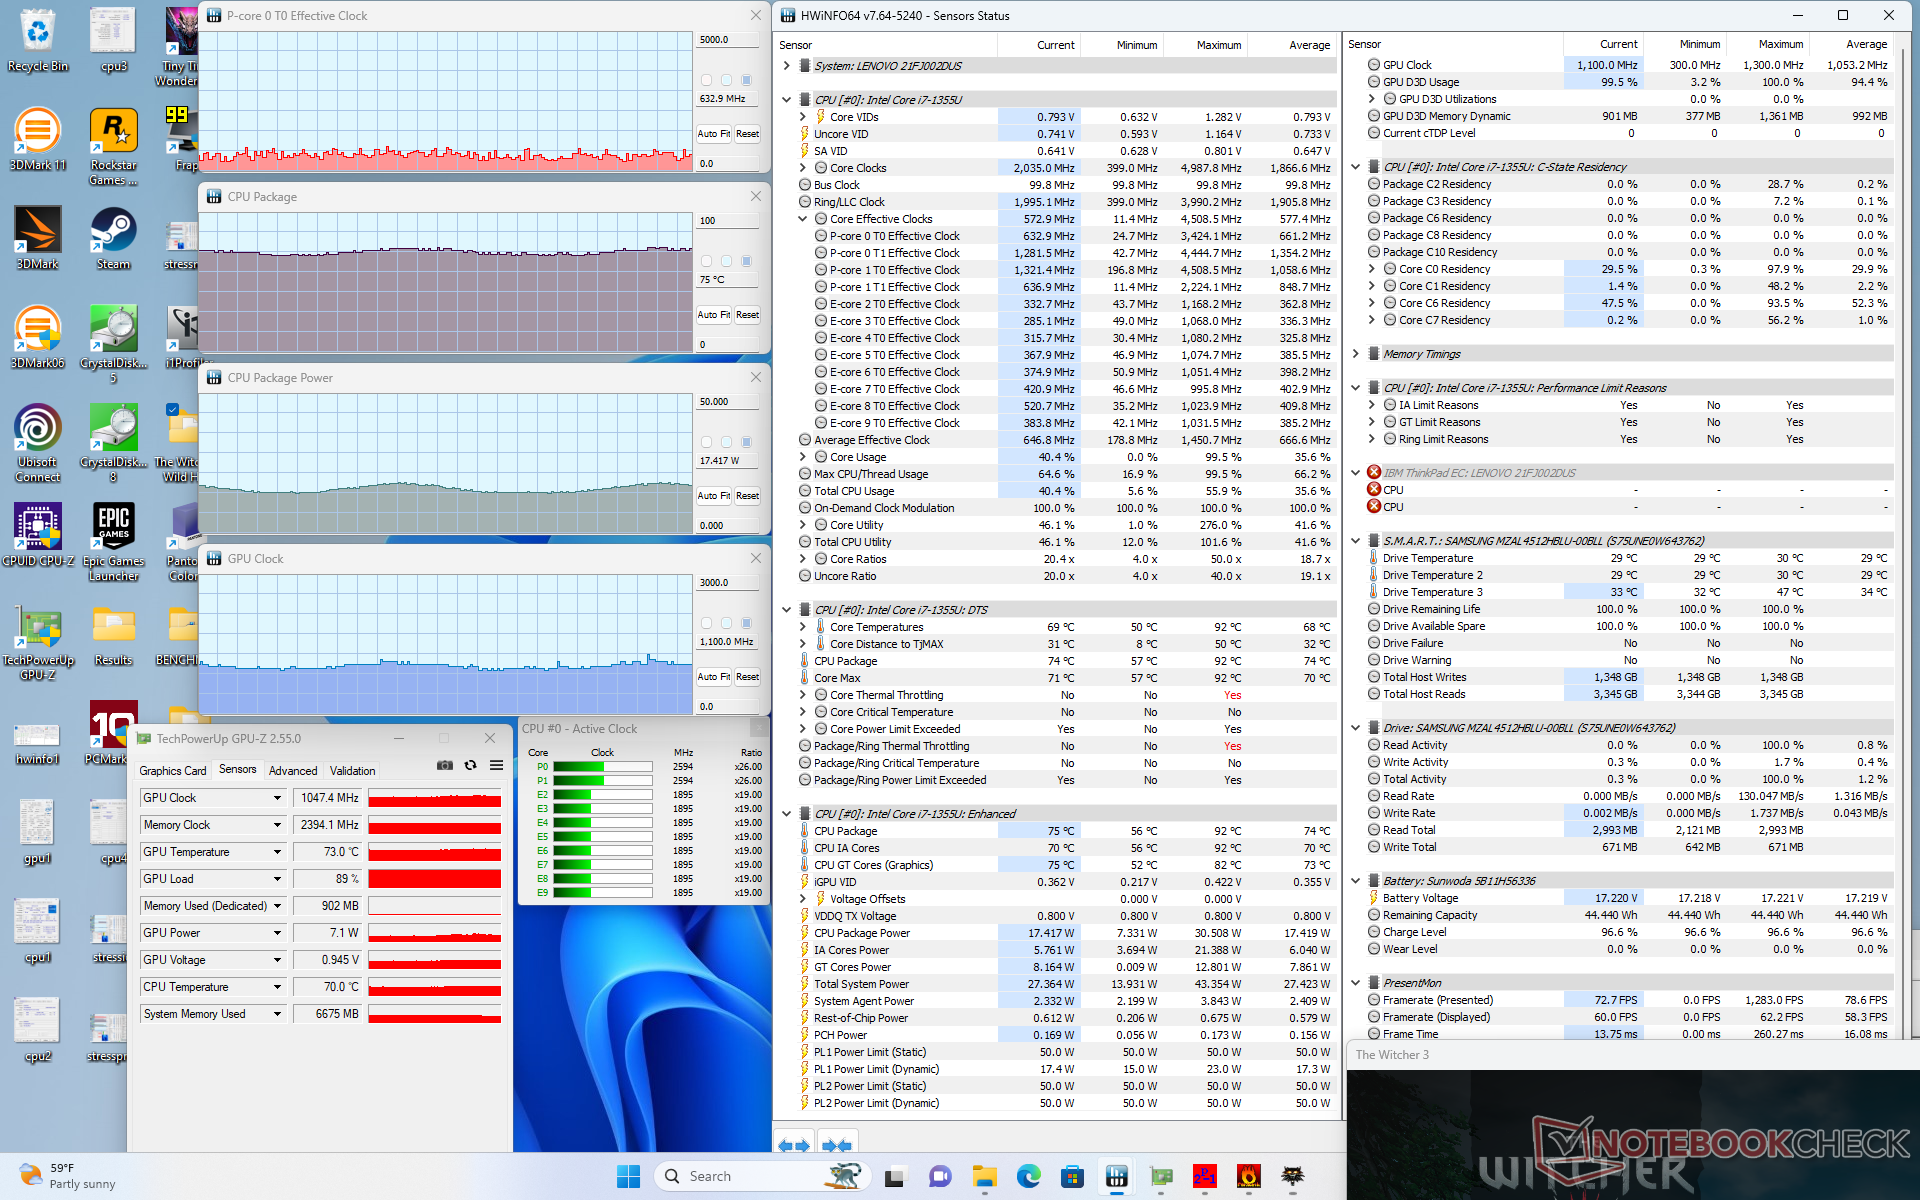
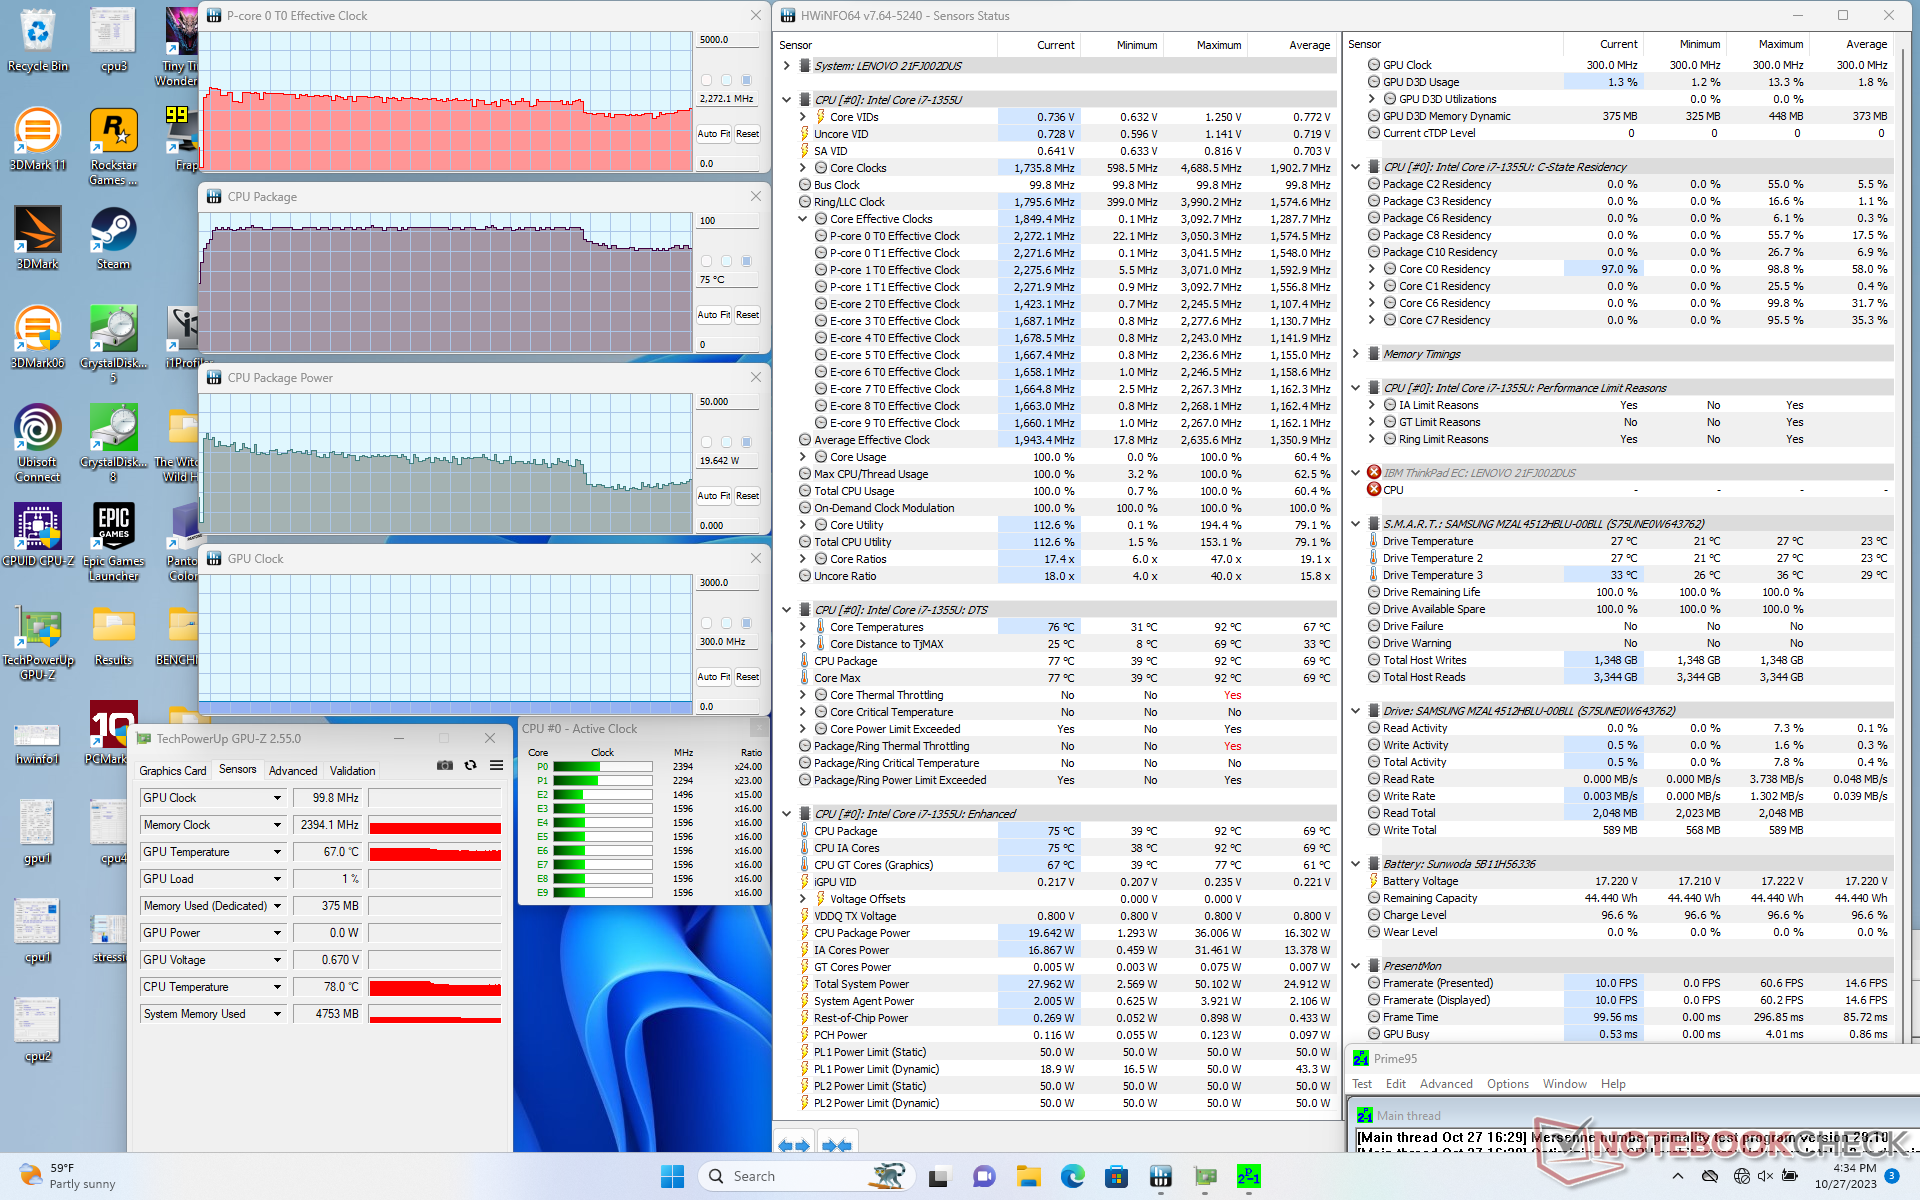

| Clock da CPU (GHz) | Clock da GPU (MHz) | Temperatura média da CPU (°C) | |
| Sistema ocioso | -- | -- | 36 |
| Estresse doPrime95 | 2.2 | -- | 75 |
| Prime95 + FurMark Stress | 1.0 - 1.5 | 550 - 850 | 68 - 79 |
| Witcher 3 Estresse | ~0,6 | 950 - 1150 | 75 |
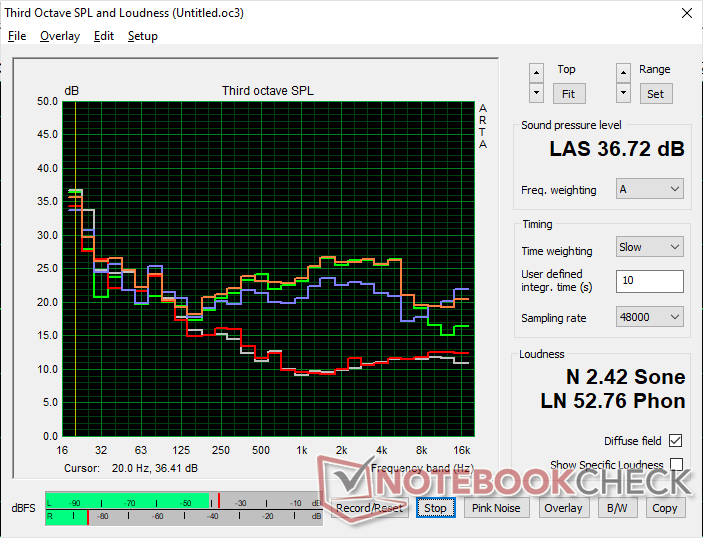
Alto-falantes
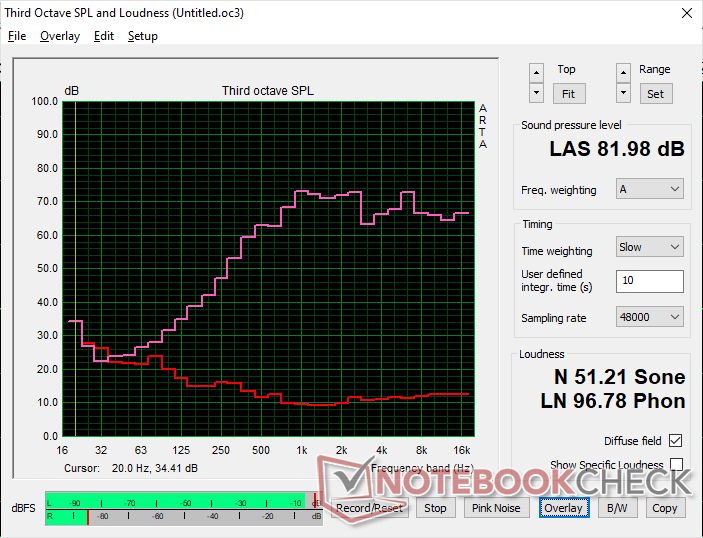
Lenovo ThinkPad L13 Yoga G4 i7-1355U análise de áudio
(+) | os alto-falantes podem tocar relativamente alto (###valor### dB)
Graves 100 - 315Hz
(-) | quase nenhum baixo - em média 24.7% menor que a mediana
(±) | a linearidade dos graves é média (7.7% delta para a frequência anterior)
Médios 400 - 2.000 Hz
(+) | médios equilibrados - apenas 4.9% longe da mediana
(+) | médios são lineares (5.4% delta para frequência anterior)
Altos 2 - 16 kHz
(+) | agudos equilibrados - apenas 2.7% longe da mediana
(±) | a linearidade dos máximos é média (7% delta para frequência anterior)
Geral 100 - 16.000 Hz
(±) | a linearidade do som geral é média (17.7% diferença em relação à mediana)
Comparado com a mesma classe
» 35% de todos os dispositivos testados nesta classe foram melhores, 9% semelhantes, 55% piores
» O melhor teve um delta de 6%, a média foi 20%, o pior foi 57%
Comparado com todos os dispositivos testados
» 35% de todos os dispositivos testados foram melhores, 8% semelhantes, 57% piores
» O melhor teve um delta de 4%, a média foi 23%, o pior foi 134%
Apple MacBook Pro 16 2021 M1 Pro análise de áudio
(+) | os alto-falantes podem tocar relativamente alto (###valor### dB)
Graves 100 - 315Hz
(+) | bons graves - apenas 3.8% longe da mediana
(+) | o baixo é linear (5.2% delta para a frequência anterior)
Médios 400 - 2.000 Hz
(+) | médios equilibrados - apenas 1.3% longe da mediana
(+) | médios são lineares (2.1% delta para frequência anterior)
Altos 2 - 16 kHz
(+) | agudos equilibrados - apenas 1.9% longe da mediana
(+) | os máximos são lineares (2.7% delta da frequência anterior)
Geral 100 - 16.000 Hz
(+) | o som geral é linear (4.6% diferença em relação à mediana)
Comparado com a mesma classe
» 0% de todos os dispositivos testados nesta classe foram melhores, 0% semelhantes, 100% piores
» O melhor teve um delta de 5%, a média foi 17%, o pior foi 45%
Comparado com todos os dispositivos testados
» 0% de todos os dispositivos testados foram melhores, 0% semelhantes, 100% piores
» O melhor teve um delta de 4%, a média foi 23%, o pior foi 134%
Gerenciamento de energia
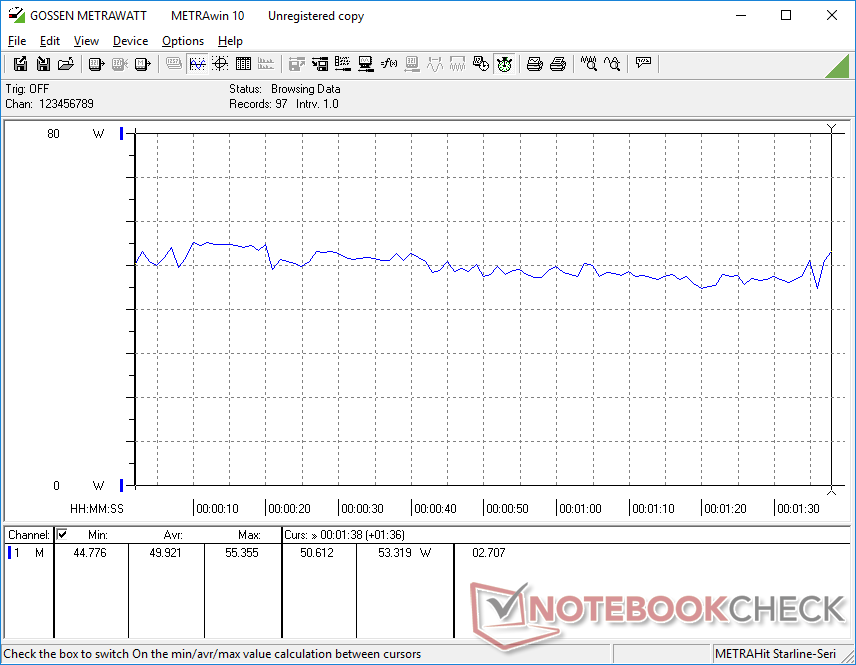
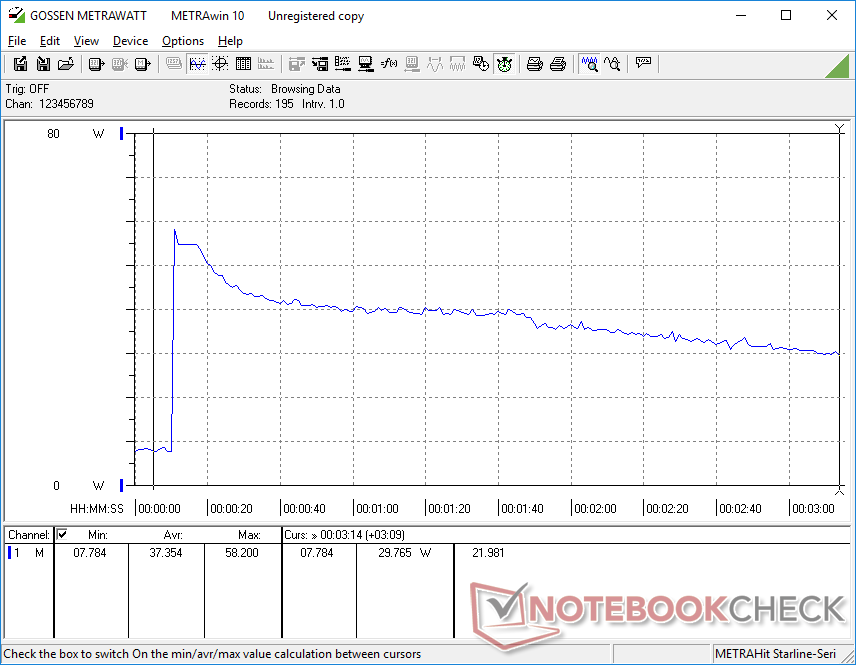
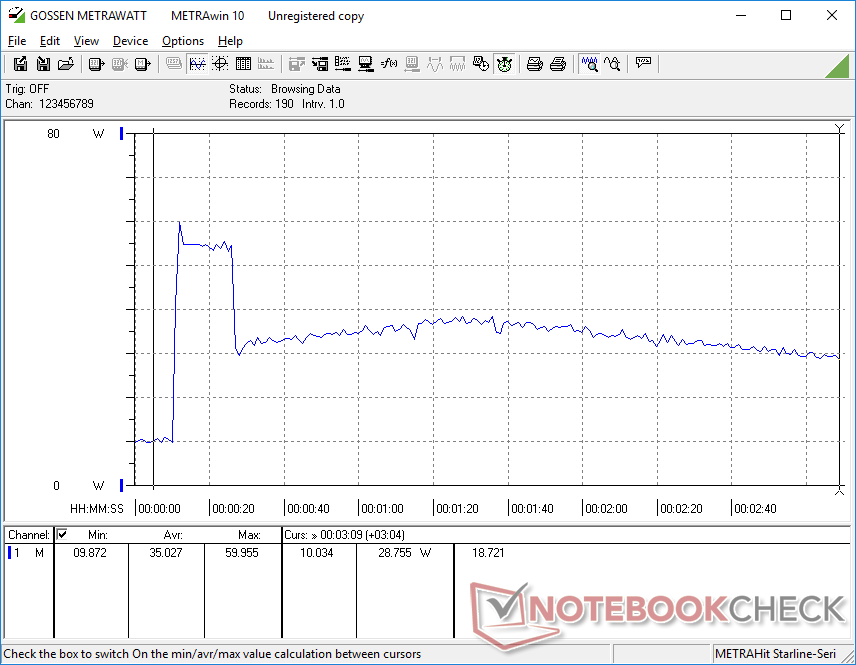
Consumo de energia
O consumo de energia é maior em toda a configuração da Intel em comparação com a AMD, especialmente ao executar cargas mais altas. Essas diferenças podem ser devidas ao maior potencial de Turbo Boost inicial da CPU Core i7 em comparação com o Ryzen 5 e ao desempenho gráfico integrado mais rápido em comparação com a Radeon RX Vega 7 Witcher 3por exemplo, consumiria cerca de 30% mais energia em nossa unidade Intel.
| desligado | |
| Ocioso | |
| Carga |
|
Key:
min: | |
| Lenovo ThinkPad L13 Yoga G4 i7-1355U i7-1355U, Iris Xe G7 96EUs, Samsung PM9B1 512GB MZAL4512HBLU, IPS, 1920x1200, 13.3" | Lenovo ThinkPad L13 Yoga G4 21FSS00100 R5 7530U, Vega 7, Kioxia BG5 KBG5AZNT512G, IPS LED, 1920x1200, 13.3" | HP Elite Dragonfly Folio 13.5 G3 i7-1265U, Iris Xe G7 96EUs, Samsung PM9A1 MZVL2512HCJQ, IPS, 1920x1280, 13.5" | Dell Latitude 9330 i7-1260U, Iris Xe G7 96EUs, , IPS, 2560x1600, 13.3" | MSI Summit E13 Flip Evo A11MT i7-1185G7, Iris Xe G7 96EUs, Phison 1TB SM2801T24GKBB4S-E162, IPS, 1920x1200, 13.4" | Framework Laptop 13.5 Ryzen 7 7840U R7 7840U, Radeon 780M, WD PC SN740 512GB SDDPNQD-512G, IPS, 2256x1504, 13.5" | |
|---|---|---|---|---|---|---|
| Power Consumption | 24% | 16% | 16% | -2% | 11% | |
| Idle Minimum * (Watt) | 5.5 | 4.4 20% | 3.4 38% | 4.7 15% | 4.8 13% | 4 27% |
| Idle Average * (Watt) | 8.3 | 7.2 13% | 4.9 41% | 8.2 1% | 8.4 -1% | 6.5 22% |
| Idle Maximum * (Watt) | 9.1 | 8.3 9% | 9.3 -2% | 8.4 8% | 8.6 5% | 6.8 25% |
| Load Average * (Watt) | 49.9 | 21.6 57% | 41.9 16% | 36.8 26% | 47.1 6% | 48 4% |
| Witcher 3 ultra * (Watt) | 42.4 | 32.1 24% | 36.4 14% | 30.4 28% | 51.6 -22% | 52.3 -23% |
| Load Maximum * (Watt) | 60 | 49.3 18% | 67.5 -13% | 49.9 17% | 65.9 -10% | 55.2 8% |
* ... menor é melhor
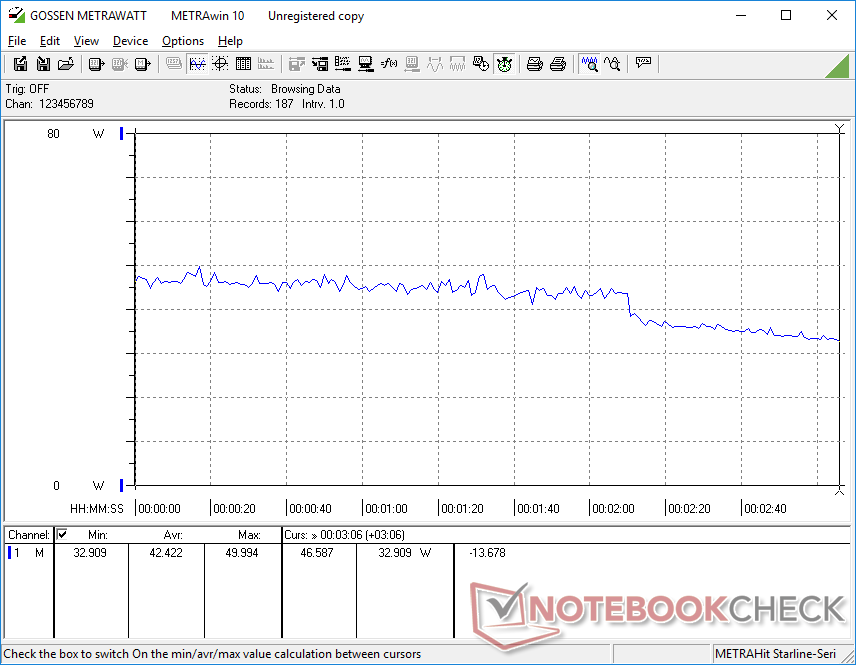
Power Consumption Witcher 3 / Stresstest
Power Consumption external Monitor
Duração da bateria
O consumo de energia geralmente mais alto mencionado acima afeta a vida útil da bateria. A navegação na Web em nossa unidade Intel duraria pouco mais de 6 horas, em comparação com 7,5 horas na unidade AMD, quando ambas estão com o mesmo perfil de energia balanceado. O carregamento também é mais lento do que o esperado, em torno de 2 horas, mesmo quando o Lenovo Rapid Charge está ativado.
| Lenovo ThinkPad L13 Yoga G4 i7-1355U i7-1355U, Iris Xe G7 96EUs, 46 Wh | Lenovo ThinkPad L13 Yoga G4 21FSS00100 R5 7530U, Vega 7, 46 Wh | HP Elite Dragonfly Folio 13.5 G3 i7-1265U, Iris Xe G7 96EUs, 53 Wh | Dell Latitude 9330 i7-1260U, Iris Xe G7 96EUs, 50 Wh | MSI Summit E13 Flip Evo A11MT i7-1185G7, Iris Xe G7 96EUs, 70 Wh | Framework Laptop 13.5 Ryzen 7 7840U R7 7840U, Radeon 780M, 61 Wh | |
|---|---|---|---|---|---|---|
| Duração da bateria | 24% | 52% | 52% | 81% | 95% | |
| WiFi v1.3 (h) | 6.2 | 7.7 24% | 9.4 52% | 9.4 52% | 11.2 81% | 12.1 95% |
| Load (h) | 1.5 | 2.6 | 2.3 | 1.8 | ||
| Reader / Idle (h) | 27.3 | 15.4 | 21.1 |
Pro
Contra
Veredicto - Trocando vida útil da bateria e ventiladores mais silenciosos por Thunderbolt e gráficos mais rápidos
Talvez a descoberta mais surpreendente sobre a versão Intel do ThinkPad L13 Yoga G4 seja a aceleração do desempenho da CPU mais acentuada do que o esperado. Embora nunca esperemos que qualquer processador Core U mantenha altas taxas de clock do Turbo Boost por períodos prolongados, o Core i7 nesse modelo específico da Lenovo seria mais lento do que na maioria dos outros notebooks com exatamente a mesma CPU. Esse déficit de desempenho reduz um ponto importante de vantagem da Intel em relação à AMD, especialmente porque o problema de estrangulamento não é tão grave na configuração da AMD.
Outro aspecto que vale a pena mencionar é o maior consumo de energia da versão Intel, que leva a tempos de execução mais curtos, de 1 a 2 horas. Os usuários que valorizam uma vida útil mais longa da bateria podem, portanto, preferir a versão AMD do ThinkPad L13 Yoga G4.
A menos que o senhor realmente precise do desempenho gráfico extra e do suporte Thunderbolt da Intel, a versão AMD do ThinkPad L13 Yoga G4 deve ser suficiente para a maioria dos usuários interessados.
Os principais motivos para escolher a versão Intel do modelo em vez da AMD são o vPro (em vez do AMD PRO), o suporte Thunderbolt, o desempenho gráfico mais rápido e o desempenho da CPU de thread único. Por outro lado, as SKUs da AMD têm vantagem quando se trata de desempenho de CPU multi-thread, duração da bateria e preço.
Preço e disponibilidade
A Lenovo ainda não está enviando o ThinkPad L13 Yoga Gen 4 no momento da publicação. No entanto, CDW está enviando atualmente nossa configuração Core i7 por $1419 USD.
Lenovo ThinkPad L13 Yoga G4 i7-1355U
- 10/30/2023 v7 (old)
Allen Ngo
Transparência
A seleção dos dispositivos a serem analisados é feita pela nossa equipe editorial. A amostra de teste foi fornecida ao autor como empréstimo pelo fabricante ou varejista para fins desta revisão. O credor não teve influência nesta revisão, nem o fabricante recebeu uma cópia desta revisão antes da publicação. Não houve obrigação de publicar esta revisão. Como empresa de mídia independente, a Notebookcheck não está sujeita à autoridade de fabricantes, varejistas ou editores.
É assim que o Notebookcheck está testando
Todos os anos, o Notebookcheck analisa de forma independente centenas de laptops e smartphones usando procedimentos padronizados para garantir que todos os resultados sejam comparáveis. Desenvolvemos continuamente nossos métodos de teste há cerca de 20 anos e definimos padrões da indústria no processo. Em nossos laboratórios de teste, equipamentos de medição de alta qualidade são utilizados por técnicos e editores experientes. Esses testes envolvem um processo de validação em vários estágios. Nosso complexo sistema de classificação é baseado em centenas de medições e benchmarks bem fundamentados, o que mantém a objetividade.Price comparison

