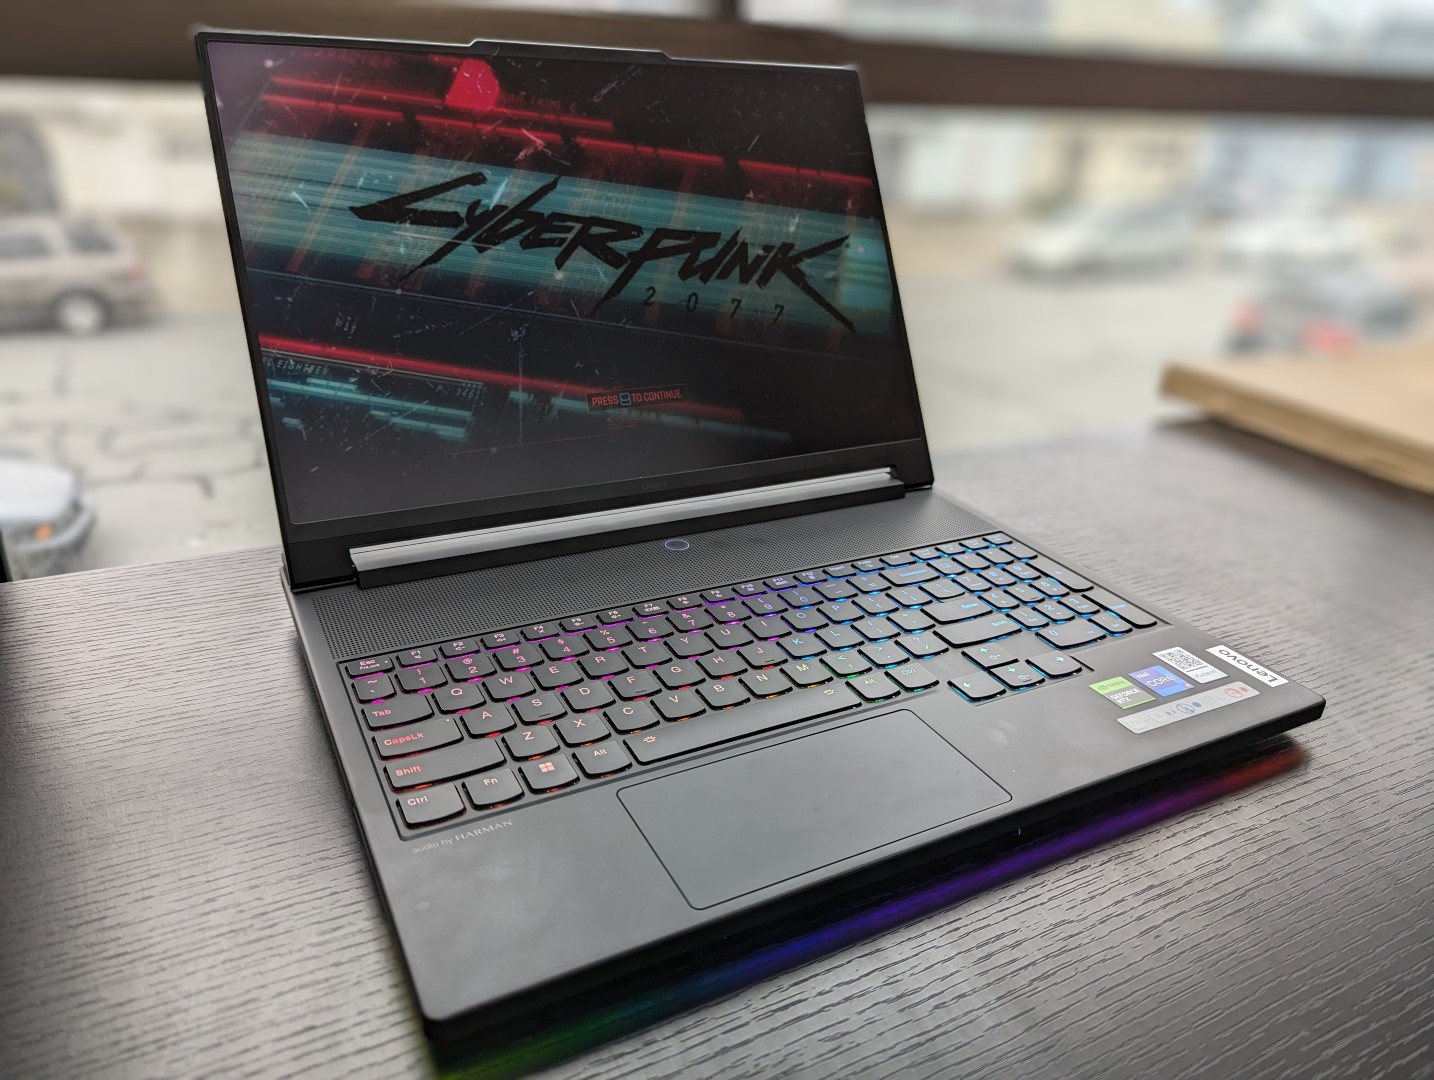
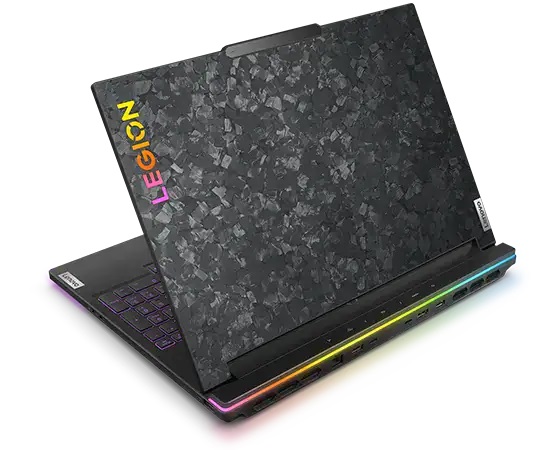
Legion análise do 9i Gen 8 16IRX8: O laptop para jogos mais ambicioso da Lenovo até hoje

Apresentado há apenas algumas semanas na IFA 2023o novo Legion 9i 16 é o modelo Legion mais sofisticado disponível, superando a série Legion 5 de médio porte e a série Legion 7 de médio porte superior. É o primeiro produto Legion 9 em vários anos após o medíocre Legion Y920 em 2017. O modelo mais recente é notável por sua tela mini-LED e pelos térmicos de resfriamento líquido integrados.
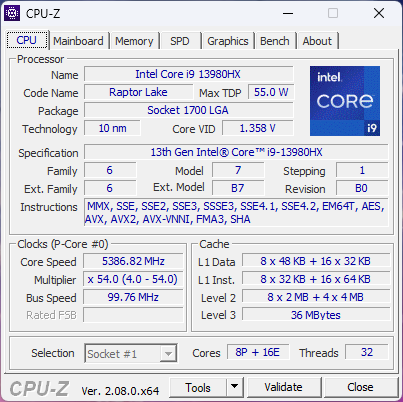
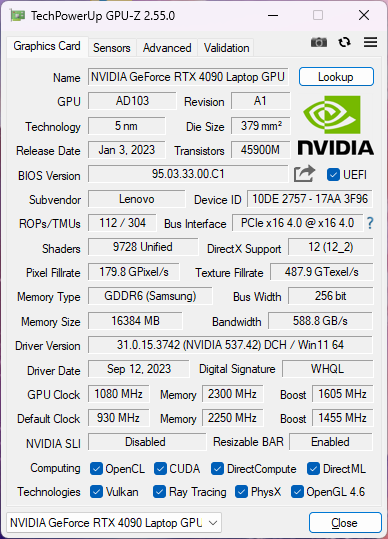
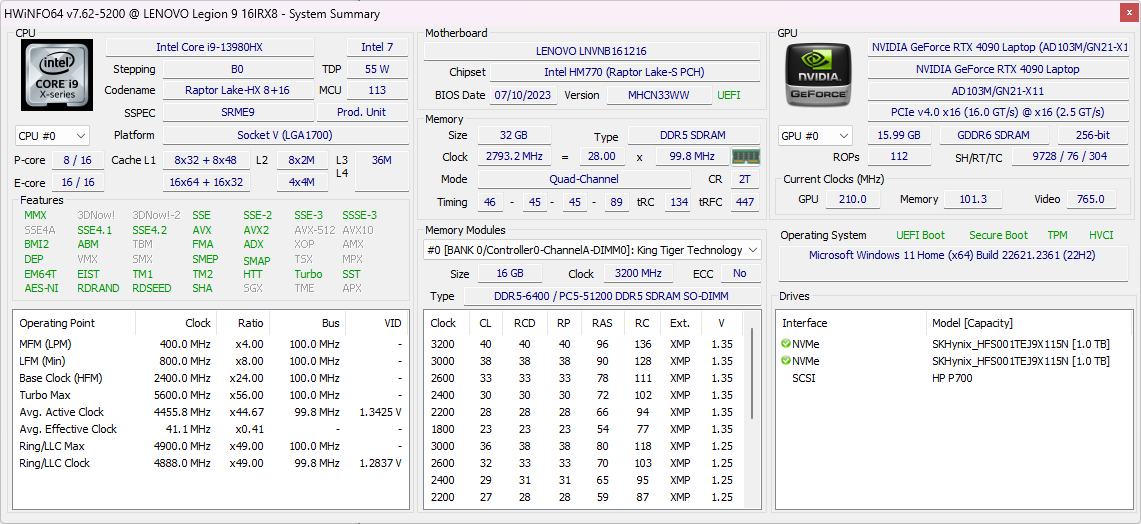
Nossa unidade em análise foi configurada com tudo e a pia da cozinha para incluir uma CPU Core i9-13980HX de 13ª geração, GPU GeForce RTX 4090 de 175 W, SSD PCIe4 x4 NVMe de 1 TB em RAID 0 e tela mini-LED de 3,2K (3200 x 2000) de 165 Hz com cores DCI-P3 por pouco menos de US$ 4.000 no varejo. No momento, todas as opções são fornecidas com a mesma CPU Core i9 e tela mini-LED, enquanto apenas a GPU pode ser configurada até a RTX 4080.
As alternativas ao Legion 9i 16 incluem outros laptops para jogos de 16 polegadas, como o Razer Blade 16, Asus ROG Strix G16, HP Omen Transcend 16e o Alienware x16 R1.
Mais análises da Lenovo:
Possíveis concorrentes em comparação
Avaliação | Data | Modelo | Peso | Altura | Size | Resolução | Preço |
|---|---|---|---|---|---|---|---|
| 90.2 % v7 (old) | 10/2023 | Lenovo Legion 9 16IRX8 i9-13980HX, GeForce RTX 4090 Laptop GPU | 2.6 kg | 22.7 mm | 16.00" | 3200x2000 | |
| 87.7 % v7 (old) | 08/2023 | Lenovo Legion Slim 5 16APH8 R7 7840HS, GeForce RTX 4060 Laptop GPU | 2.4 kg | 25.2 mm | 16.00" | 2560x1600 | |
| 89.8 % v7 (old) | 03/2023 | Razer Blade 16 Early 2023 RTX 4090 i9-13950HX, GeForce RTX 4090 Laptop GPU | 2.5 kg | 21.99 mm | 16.00" | 3840x2400 | |
| 88.4 % v7 (old) | 03/2023 | Asus ROG Strix G16 G614JZ i9-13980HX, GeForce RTX 4080 Laptop GPU | 2.4 kg | 30.4 mm | 16.00" | 2560x1600 | |
| 87.9 % v7 (old) | 08/2023 | HP Omen Transcend 16 i9-13900HX, GeForce RTX 4070 Laptop GPU | 2.3 kg | 19.8 mm | 16.00" | 2560x1600 | |
| 88.4 % v7 (old) | 06/2023 | Alienware x16 R1 i9-13900HK, GeForce RTX 4080 Laptop GPU | 2.6 kg | 18.57 mm | 16.00" | 2560x1600 |
Case - Um design evoluído Legion
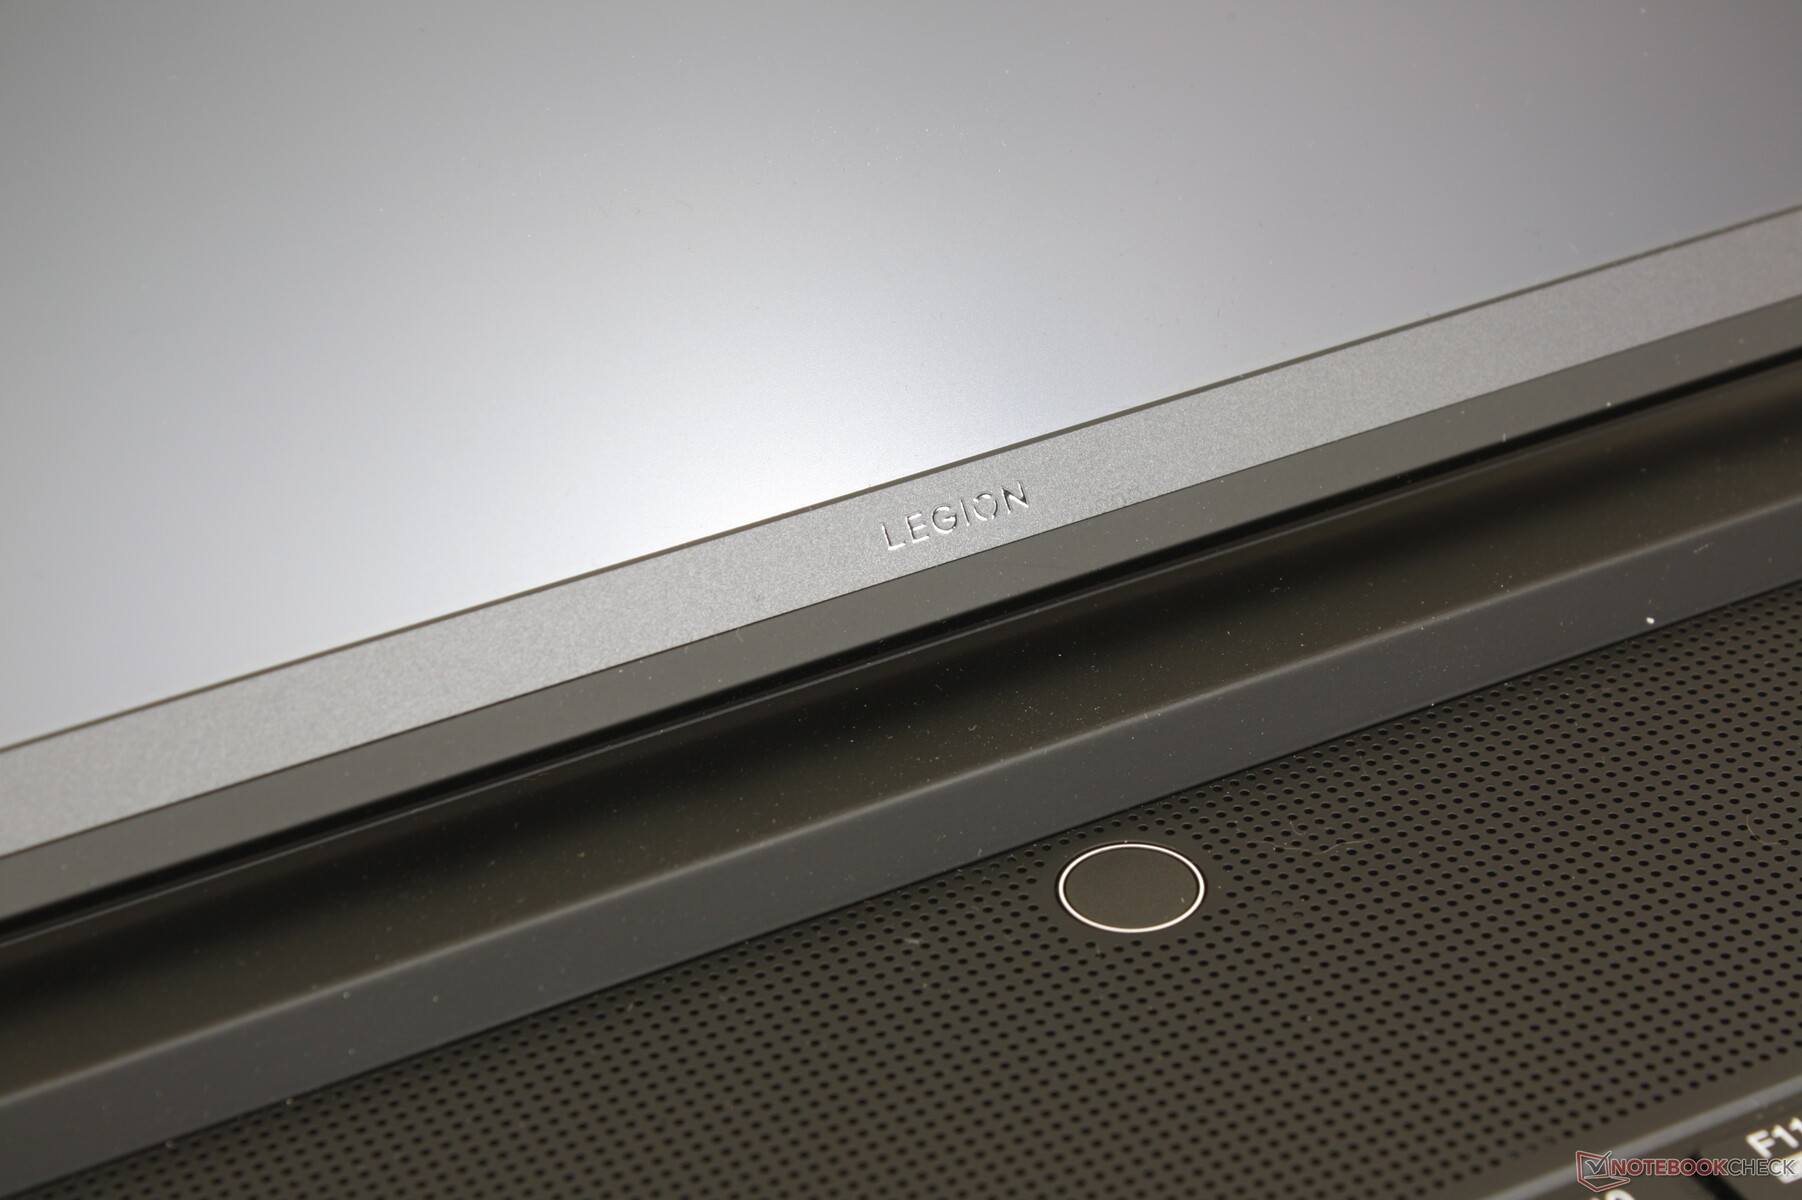
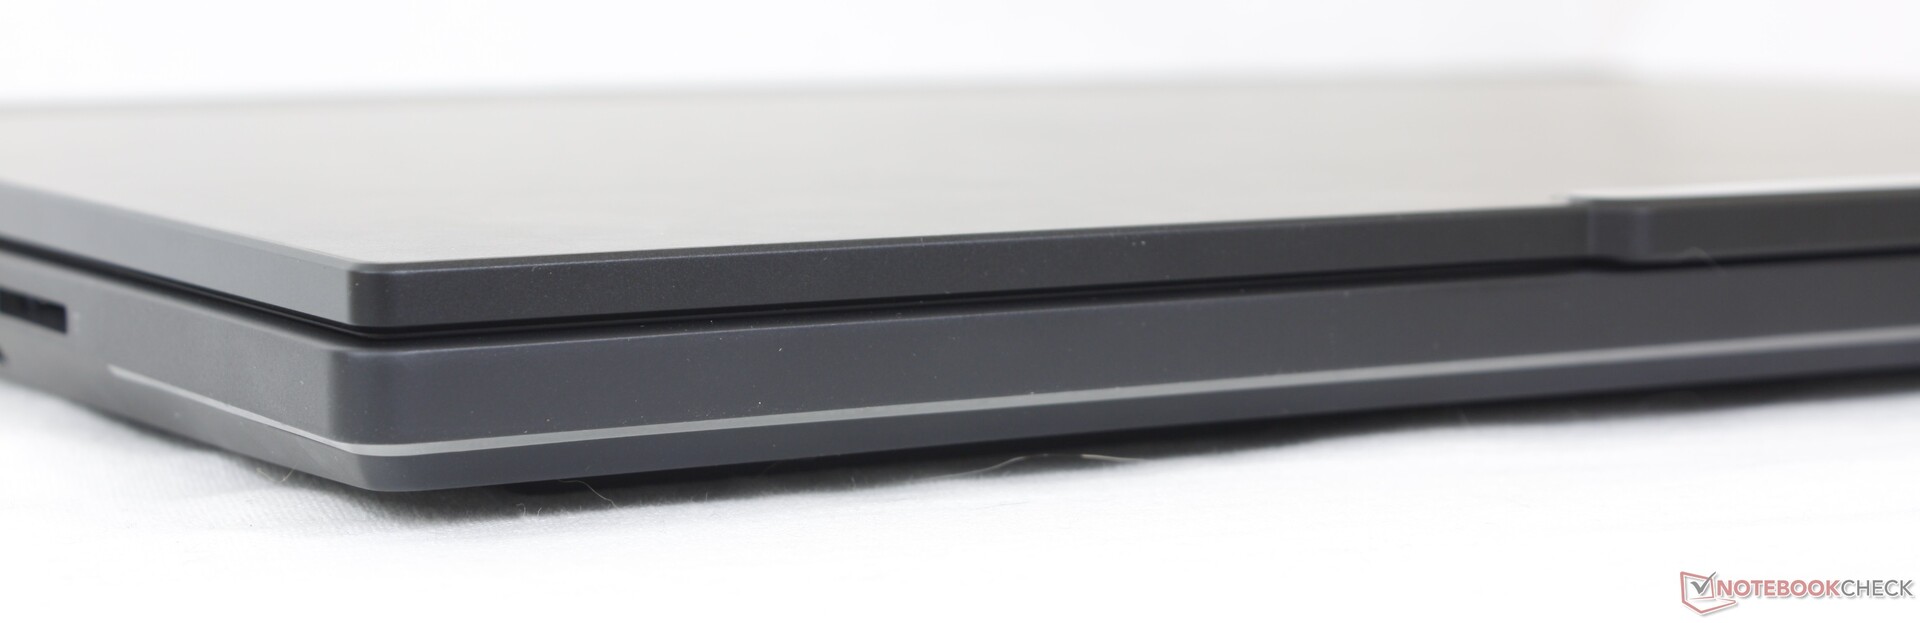
O Legion 9i 16 utiliza materiais de magnésio fosco semelhantes aos do Legion série 7, mas são visualmente muito diferentes. Em primeiro lugar, o teclado foi empurrado para a frente para ficar mais próximo do usuário, semelhante ao Asus Zephyrus S GX531, a fim de abrir espaço para mais grades de ventilação e uma solução de resfriamento maior. Em segundo lugar, um padrão exclusivo de revestimento de carbono ao redor da tampa externa ajuda a reduzir o acúmulo de impressões digitais e contribui para a estética gamer. E, por fim, a parte traseira saliente foi engrossada para acomodar melhor todas as mudanças internas e o hardware mais exigente.
A qualidade do chassi é excelente, com apenas um pouco de resistência ao tentar girar a tampa ou pressionar o centro do teclado ou os apoios para as mãos. Ele não parece melhor nem pior do que o
Legion 7 16 ou o Alienware x16 R1 em termos de rigidez, especialmente porque todos têm o mesmo peso. Entretanto, as dobradiças permanecem relativamente pequenas em comparação com as dobradiças muito maiores da Série Asus Strix ou o recenteMSI Raider GE68. Elas podem ser satisfatórias quando novas, mas somente o tempo dirá como elas se sairão a longo prazo.
A traseira estendida e os exigentes componentes internos Core i9/RTX 4090 resultaram em um chassi maior e mais espesso do que o Legion 7 16. As diferenças são perceptíveis, pois o Legion 9i 16 é maior do que muitos outros notebooks para jogos de 16 polegadas, como o ROG Strix G16, Blade 16ou Omen Transcend 16. Nesse aspecto, o alto desempenho e os recursos avançados têm o custo da portabilidade.
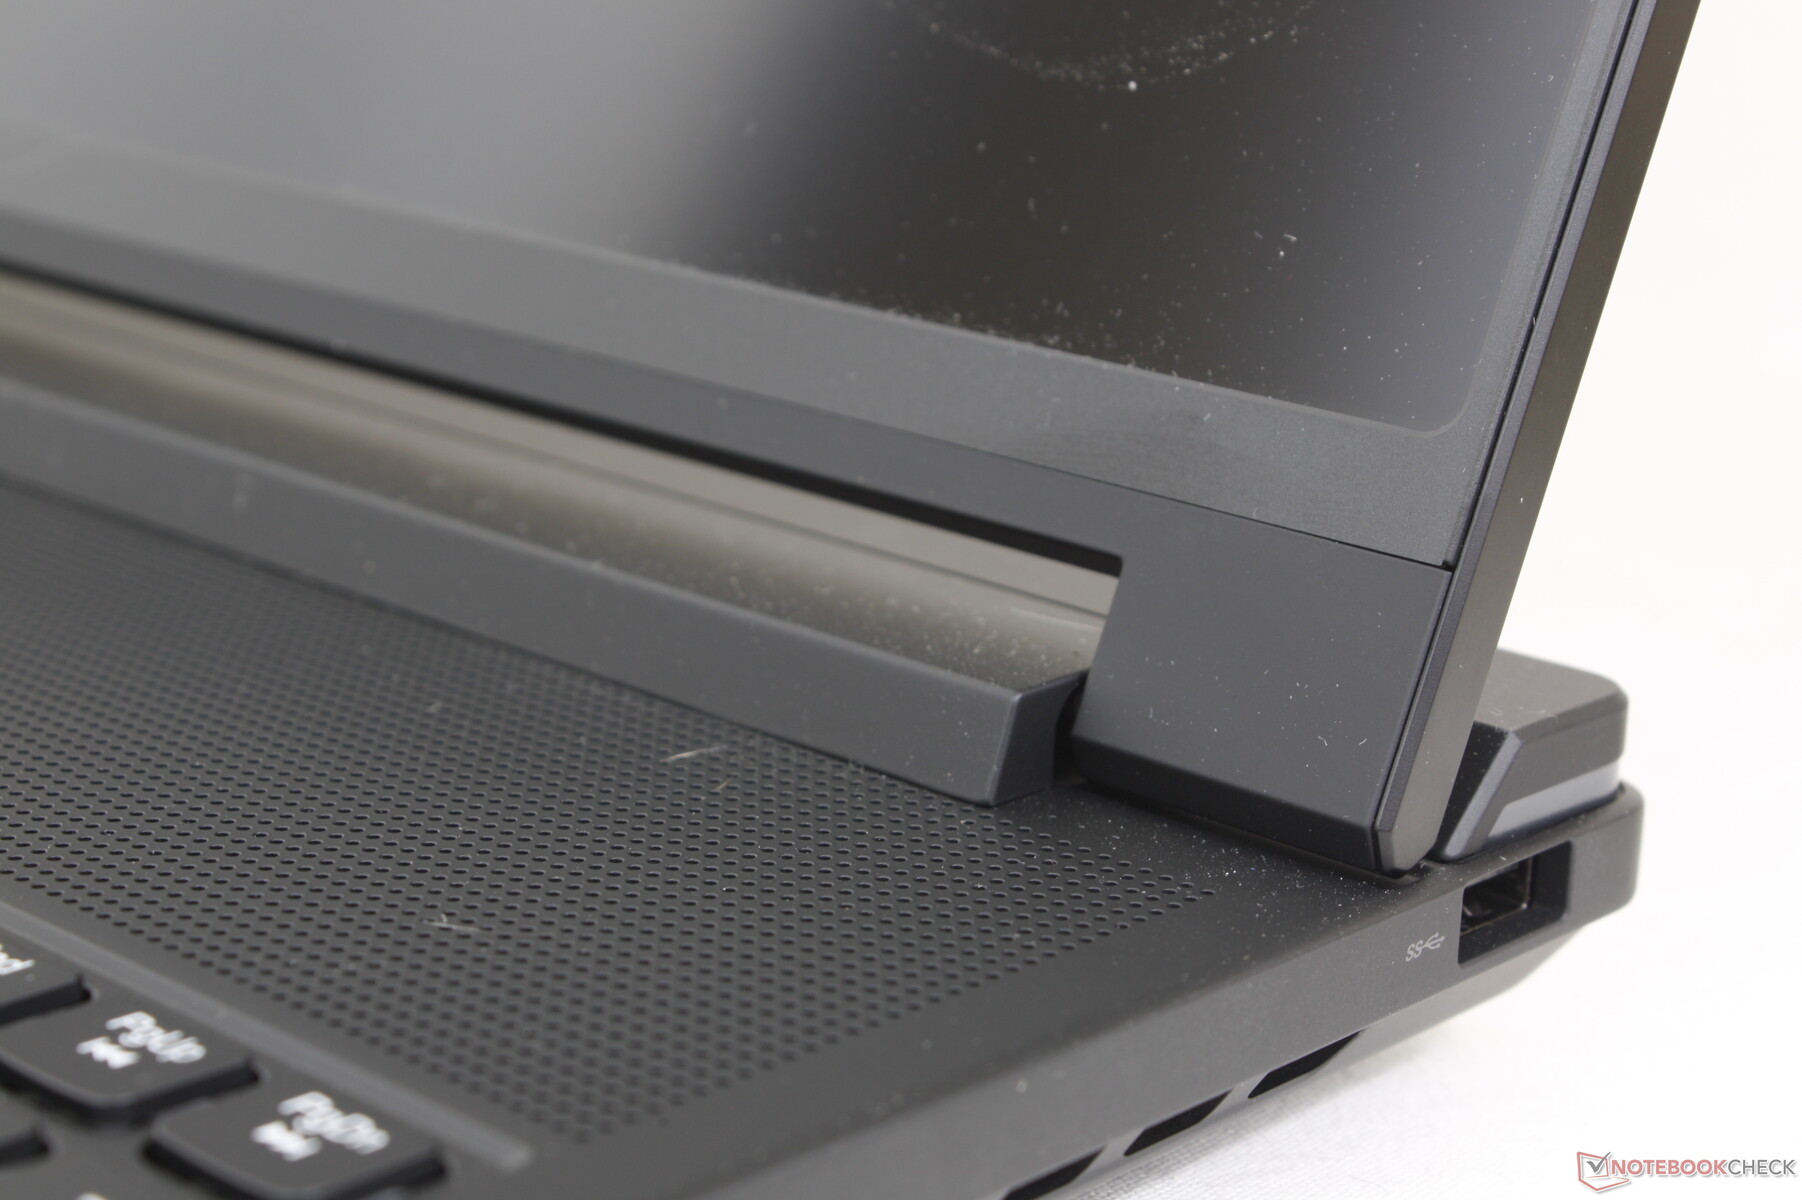
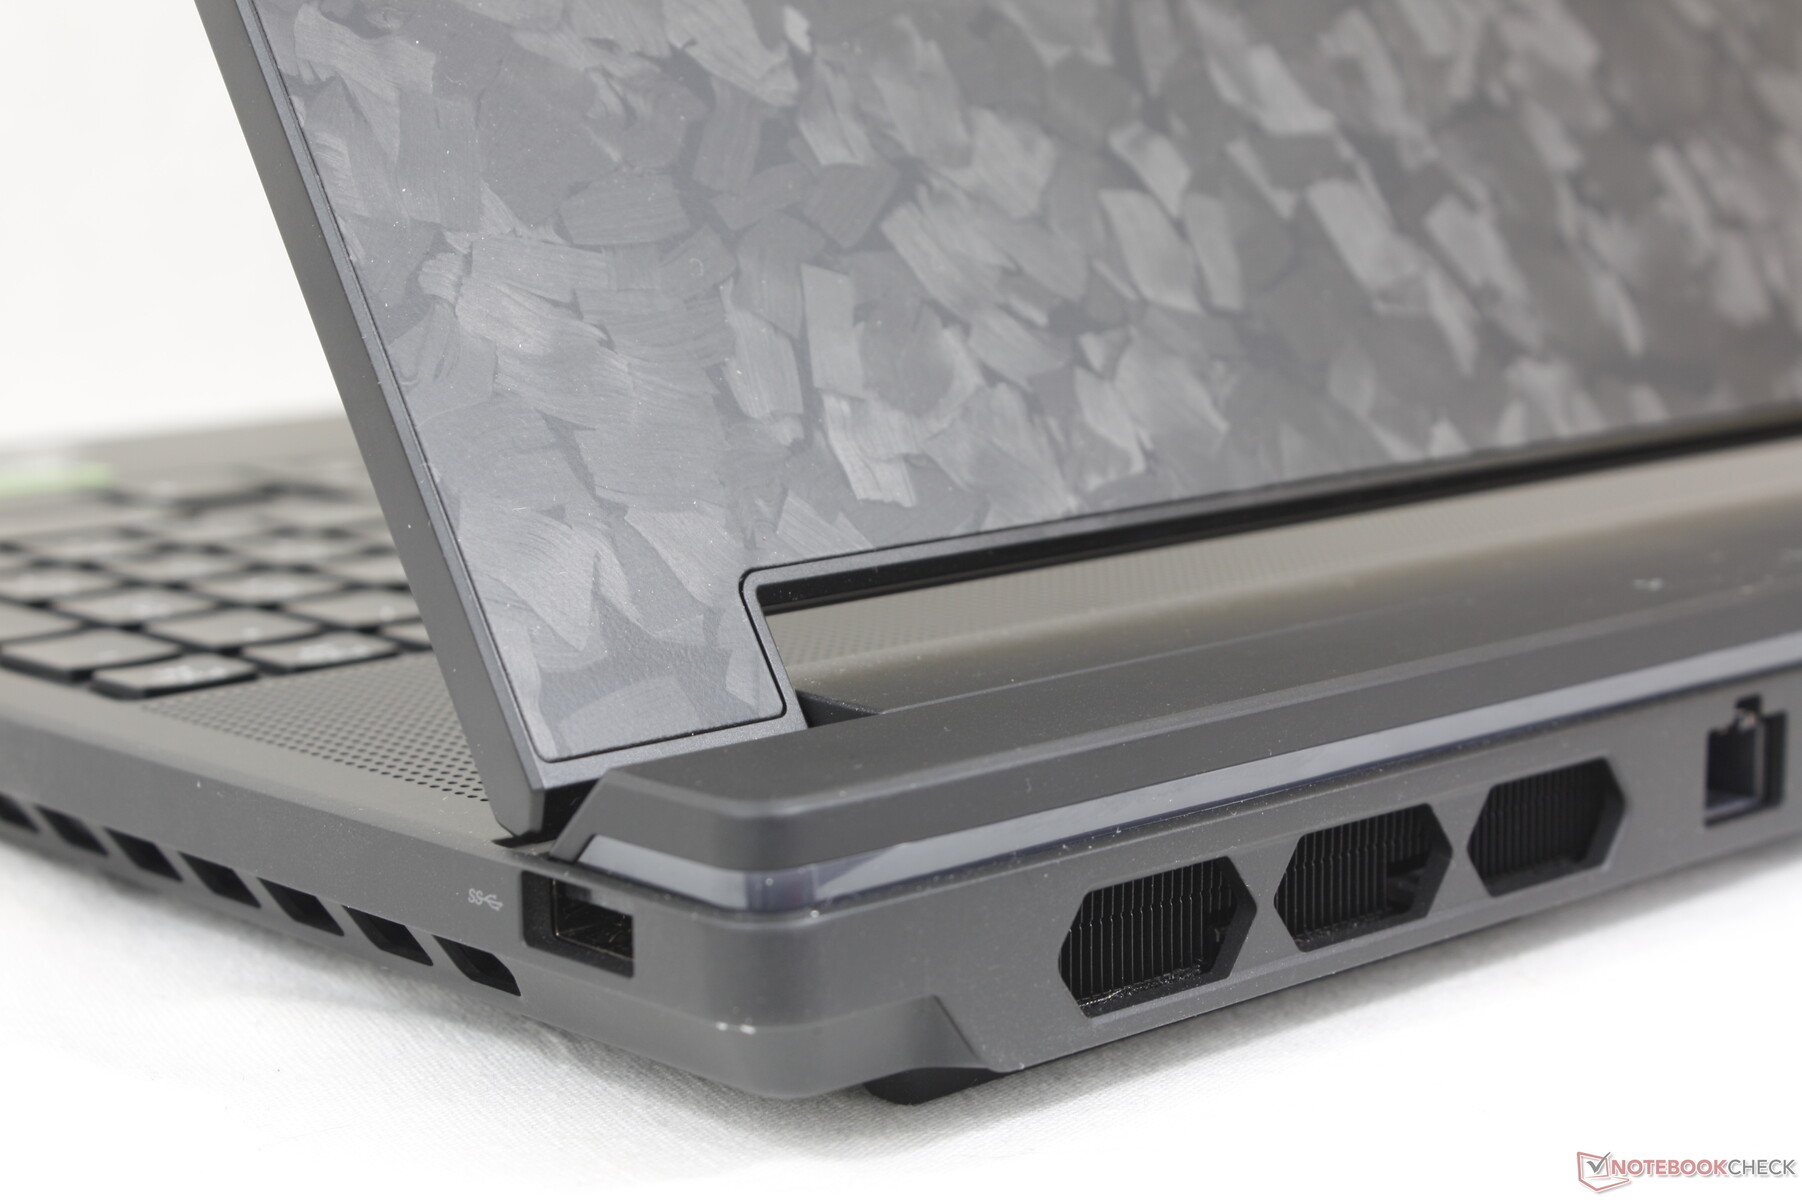
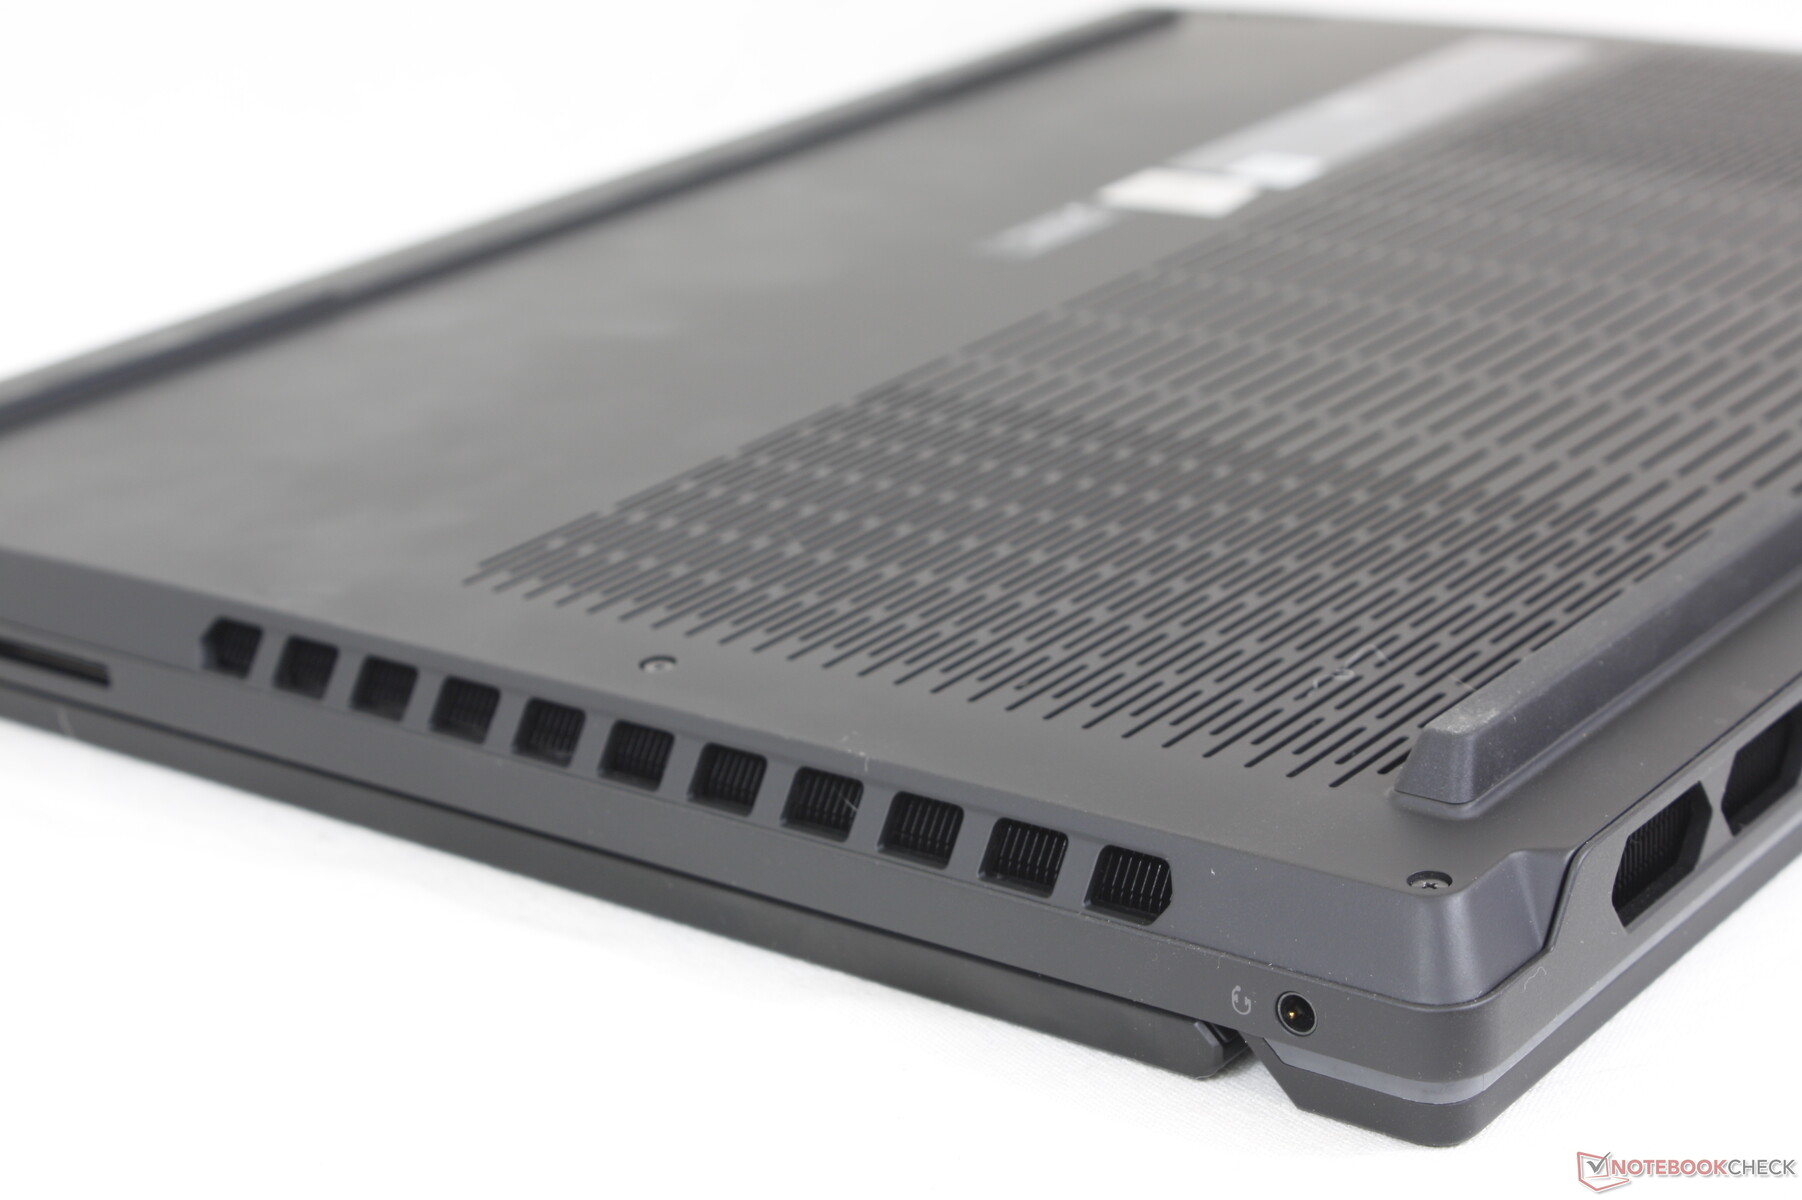
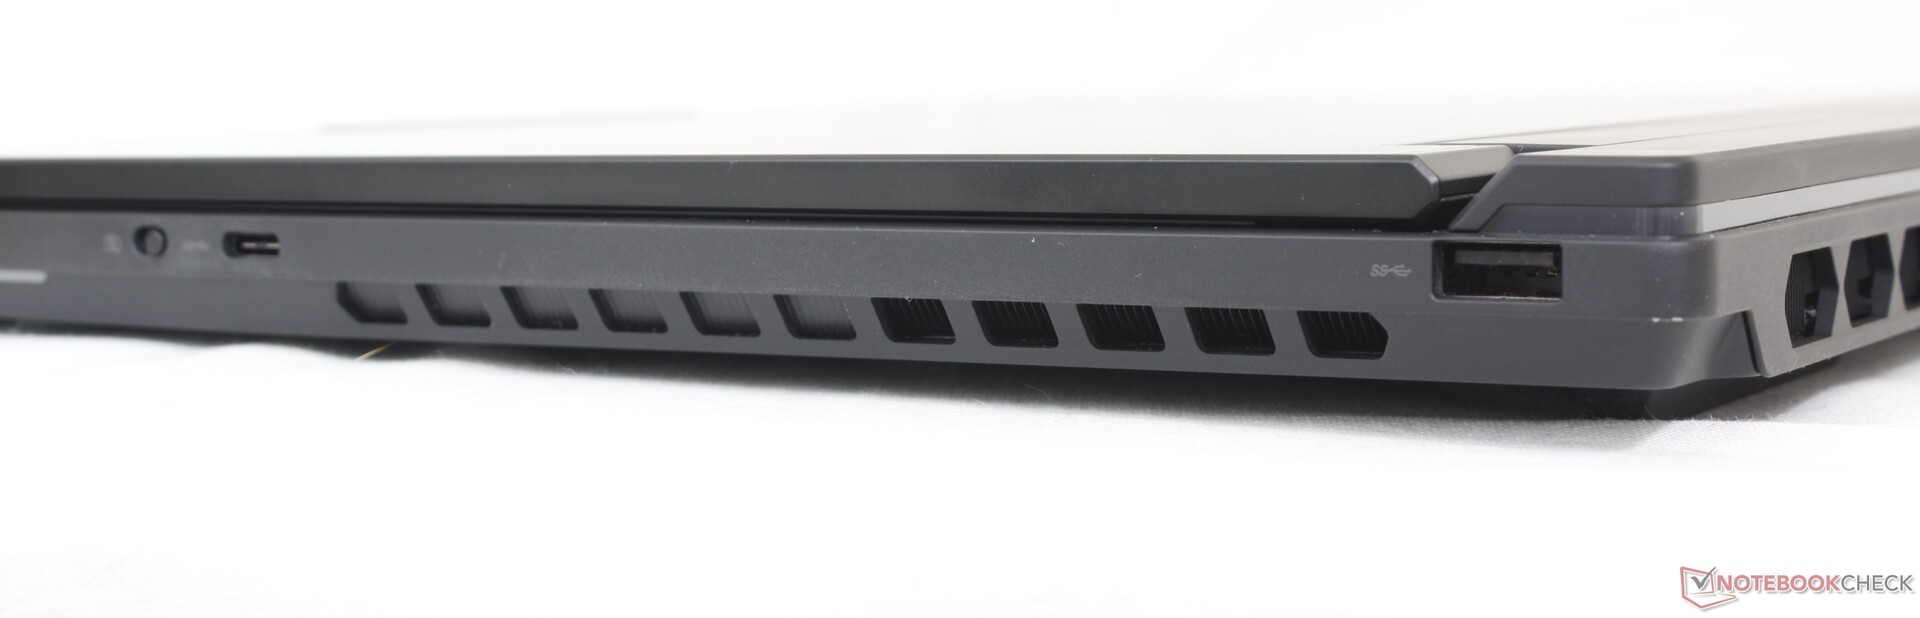
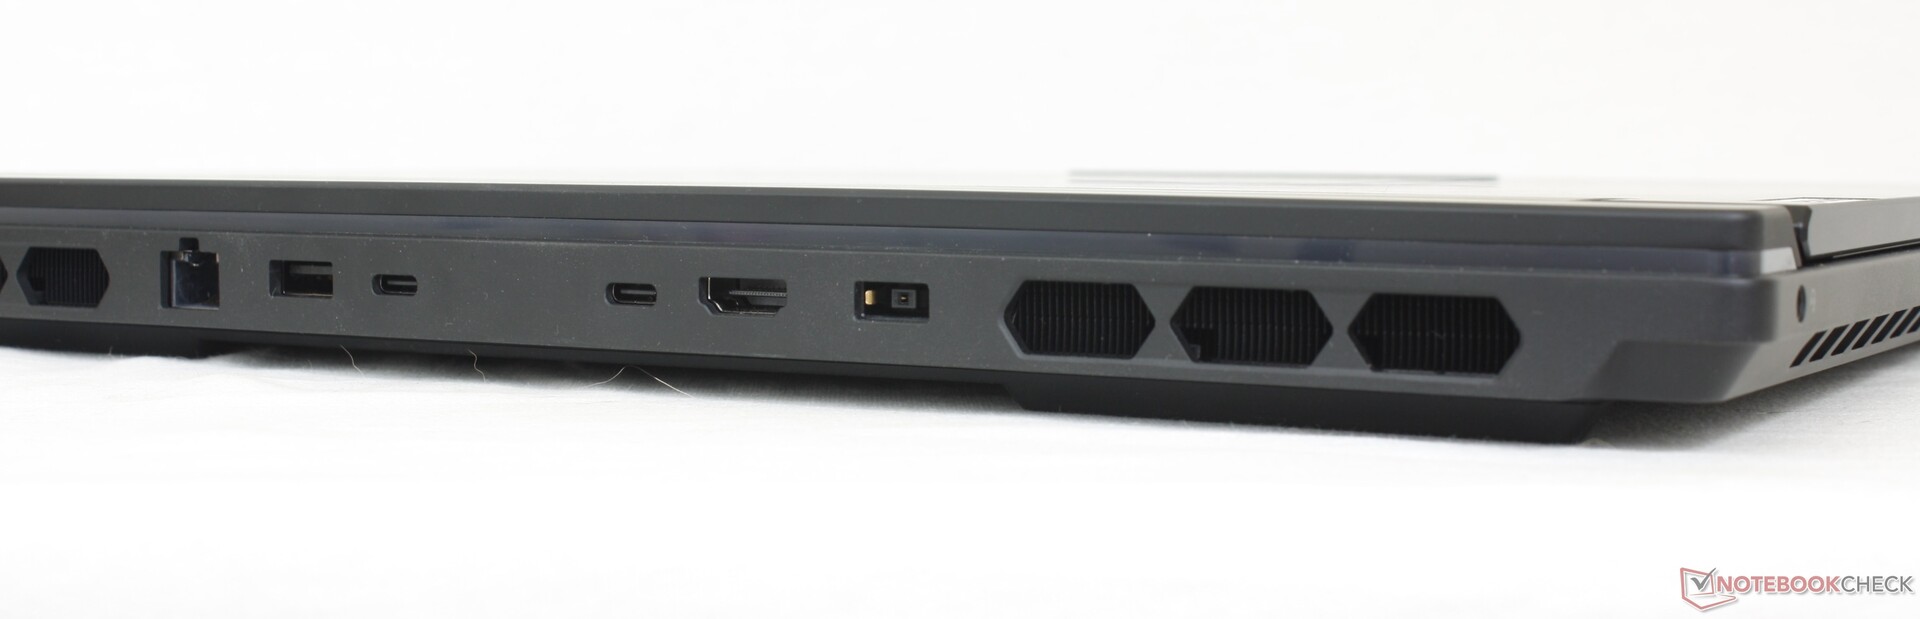
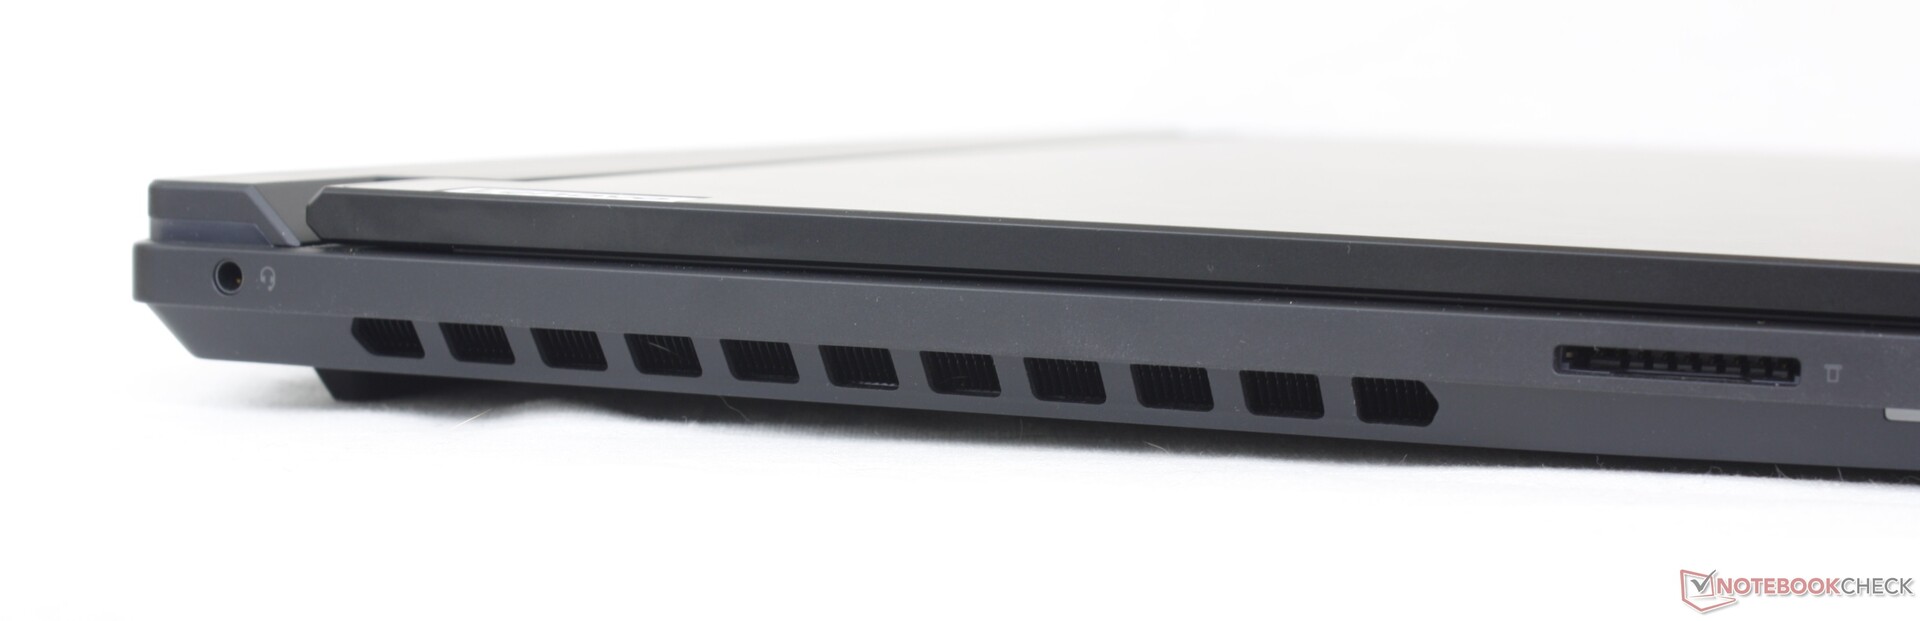
Conectividade - muitas opções de escolha
As opções de portas são abundantes, com a maioria delas localizadas na parte traseira em vez de nas laterais. No entanto, ao contrário das portas traseiras do Alienware X16 R1, as portas do Lenovo são rotuladas individualmente com indicadores LED para facilitar o acesso.
Apenas as duas portas USB-C traseiras podem ser usadas para monitores externos ou para recarregar o notebook via Power Delivery. A terceira porta USB-C ao longo da borda direita é apenas para dados e carregamento de dispositivos externos.
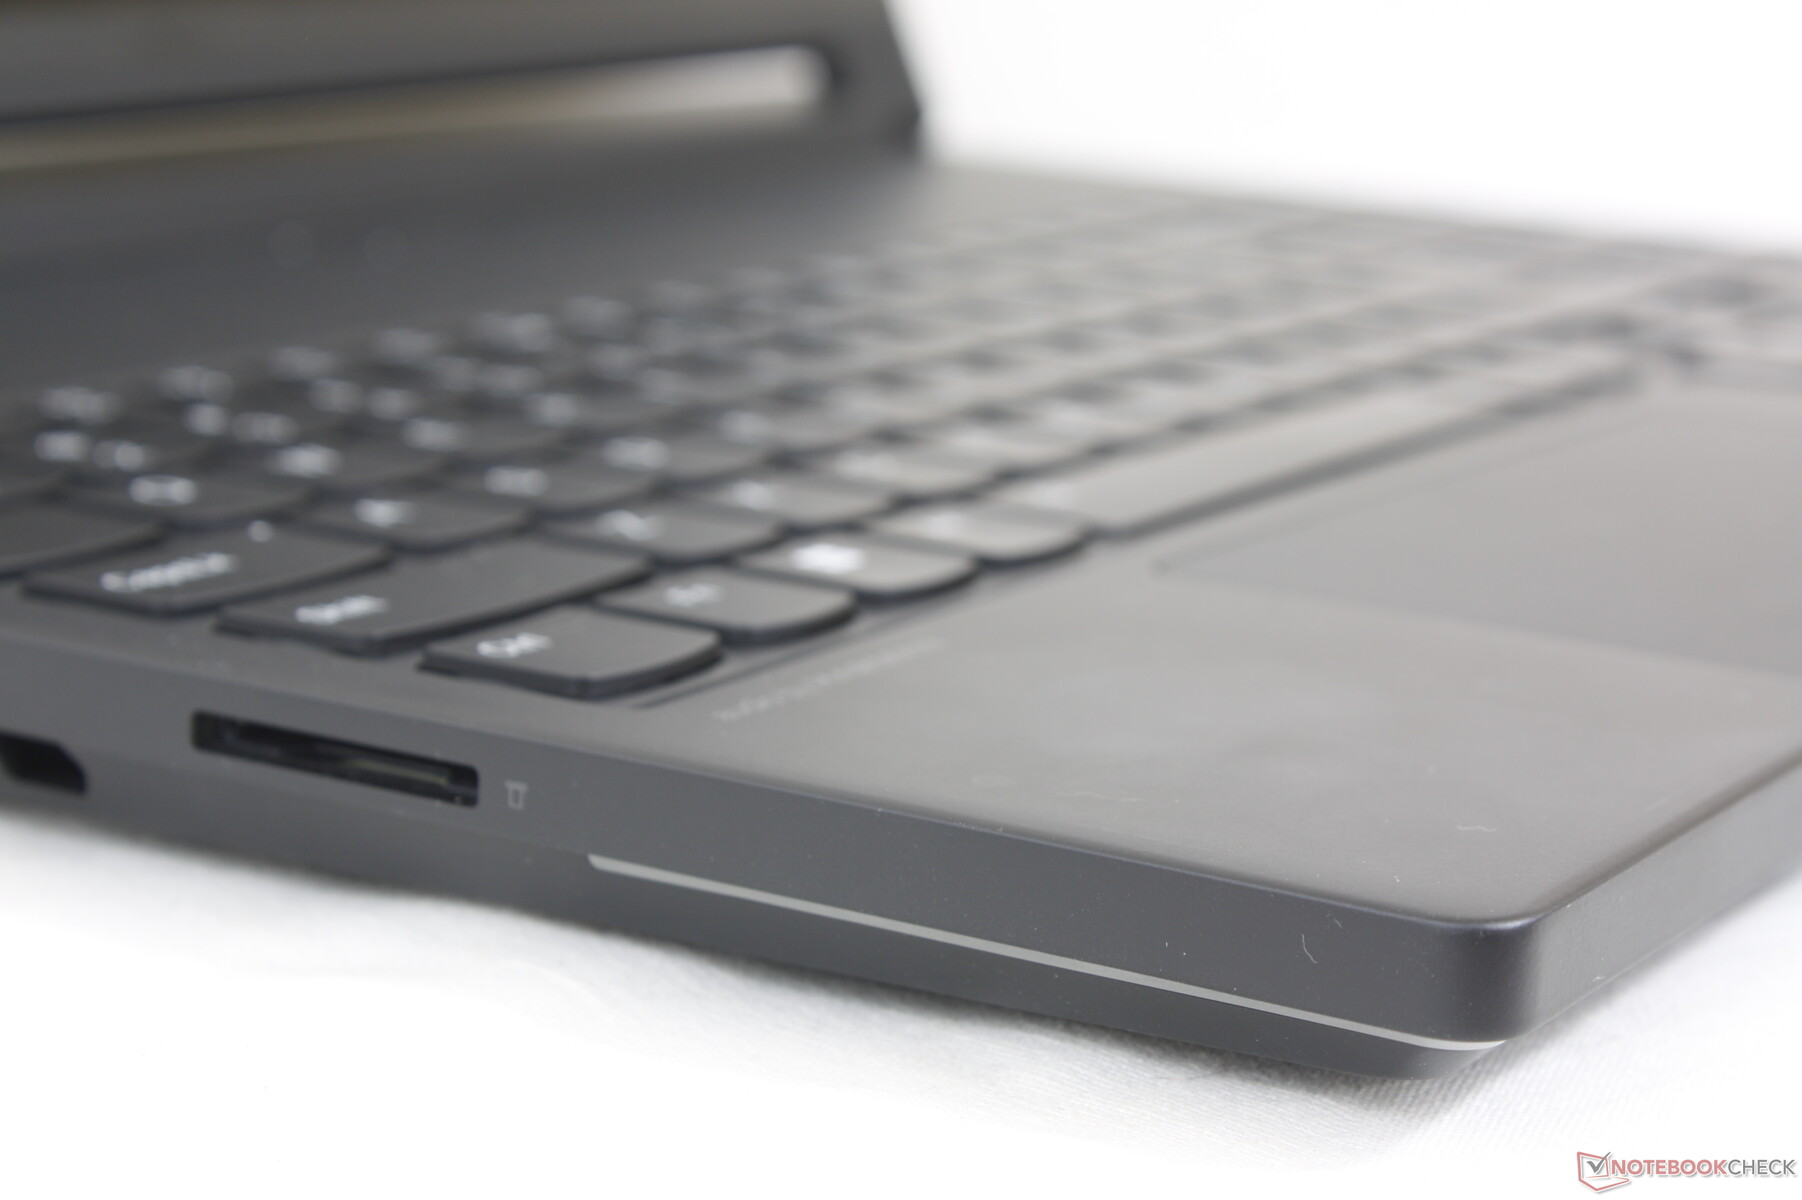
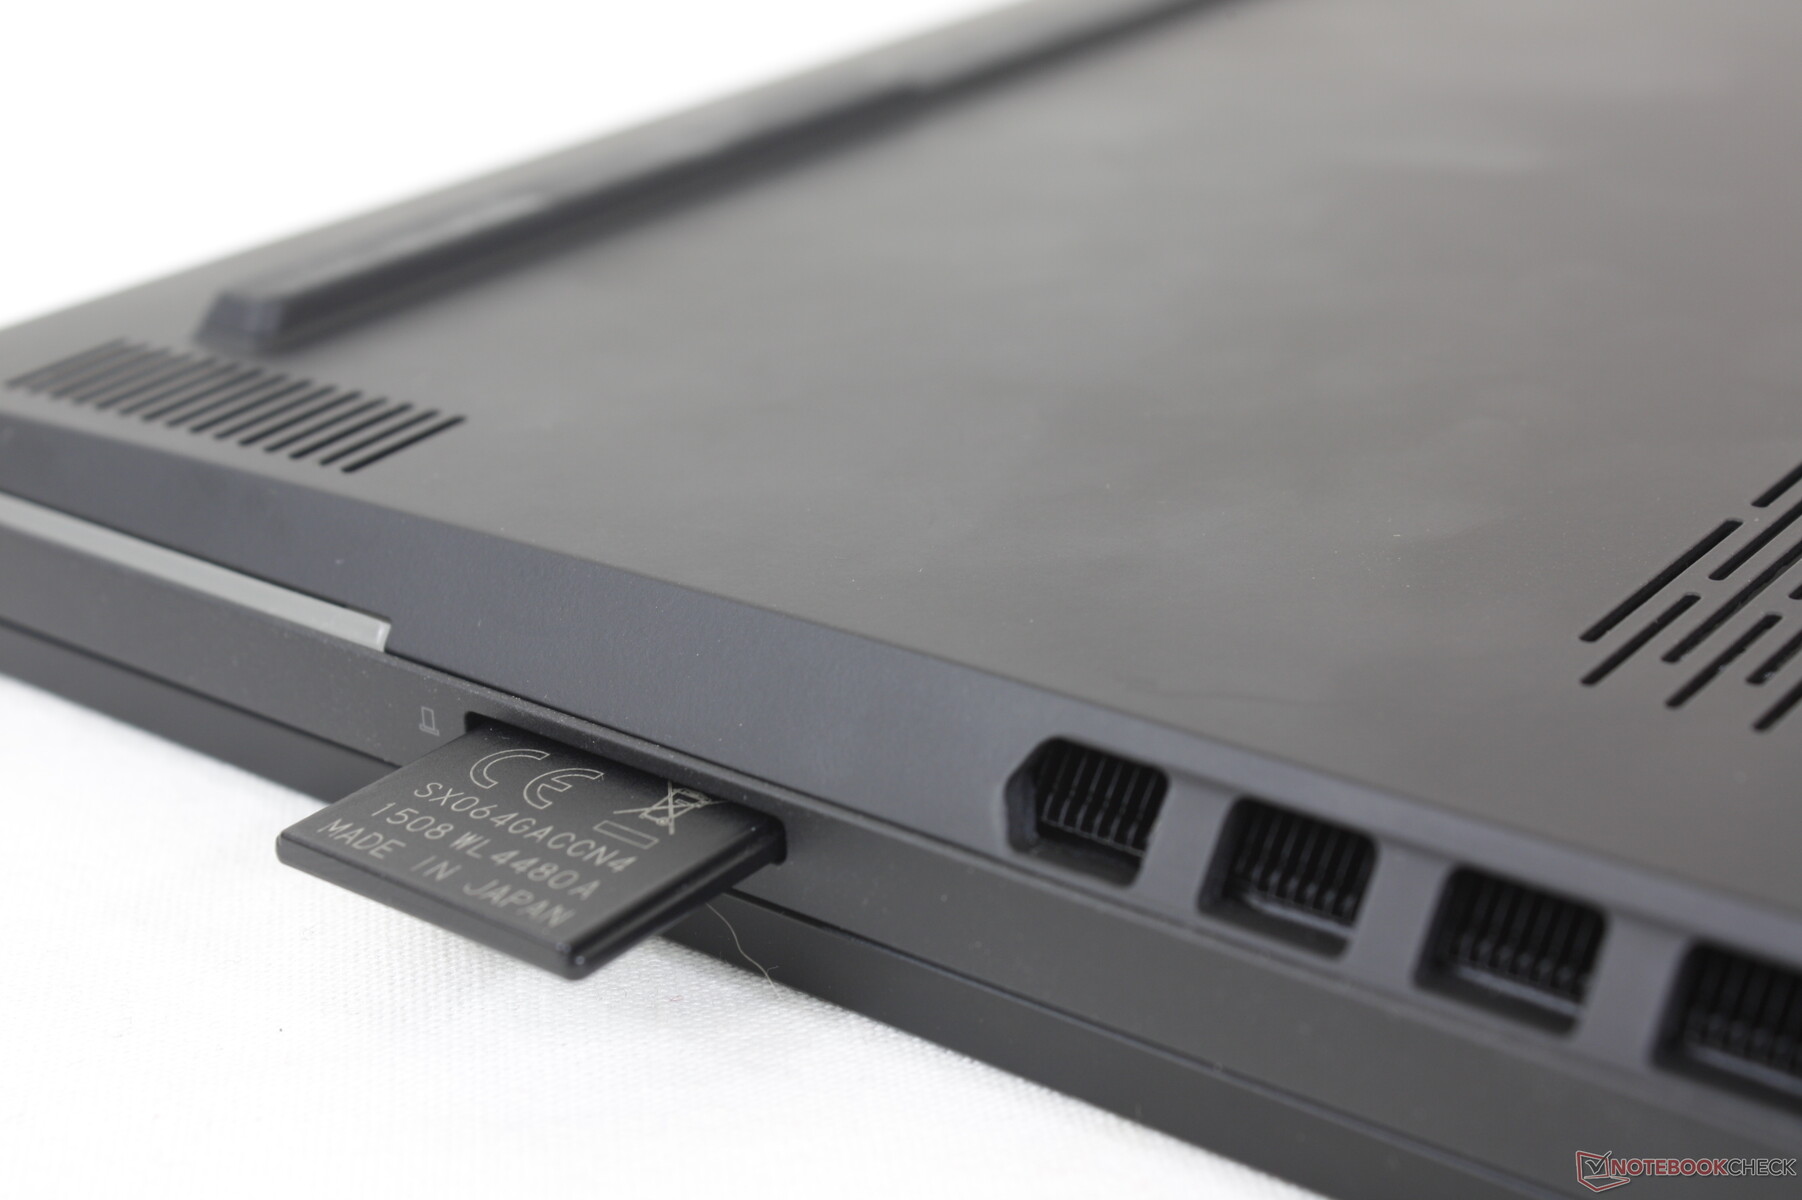
Leitor de cartão SD
O leitor de SD integrado é uma intenção de atrair os criadores de conteúdo tanto quanto os jogadores hardcore para o Legion 9i. No entanto, as taxas de transferência não são tão boas, com menos da metade da velocidade do leitor SD doRazer Blade 16.
| SD Card Reader | |
| average JPG Copy Test (av. of 3 runs) | |
| Razer Blade 16 Early 2023 RTX 4090 (Angelbird AV PRO 128 GB V60) | |
| Lenovo Legion 9 16IRX8 (Toshiba Exceria Pro SDXC 64 GB UHS-II) | |
| Alienware x16 R1 (AV PRO microSD 128 GB V60) | |
| Lenovo Legion Slim 5 16APH8 (PNY EliteX-Pro60 V60 256 GB) | |
| maximum AS SSD Seq Read Test (1GB) | |
| Alienware x16 R1 (AV PRO microSD 128 GB V60) | |
| Razer Blade 16 Early 2023 RTX 4090 (Angelbird AV PRO 128 GB V60) | |
| Lenovo Legion 9 16IRX8 (Toshiba Exceria Pro SDXC 64 GB UHS-II) | |
| Lenovo Legion Slim 5 16APH8 (PNY EliteX-Pro60 V60 256 GB) | |
Comunicação
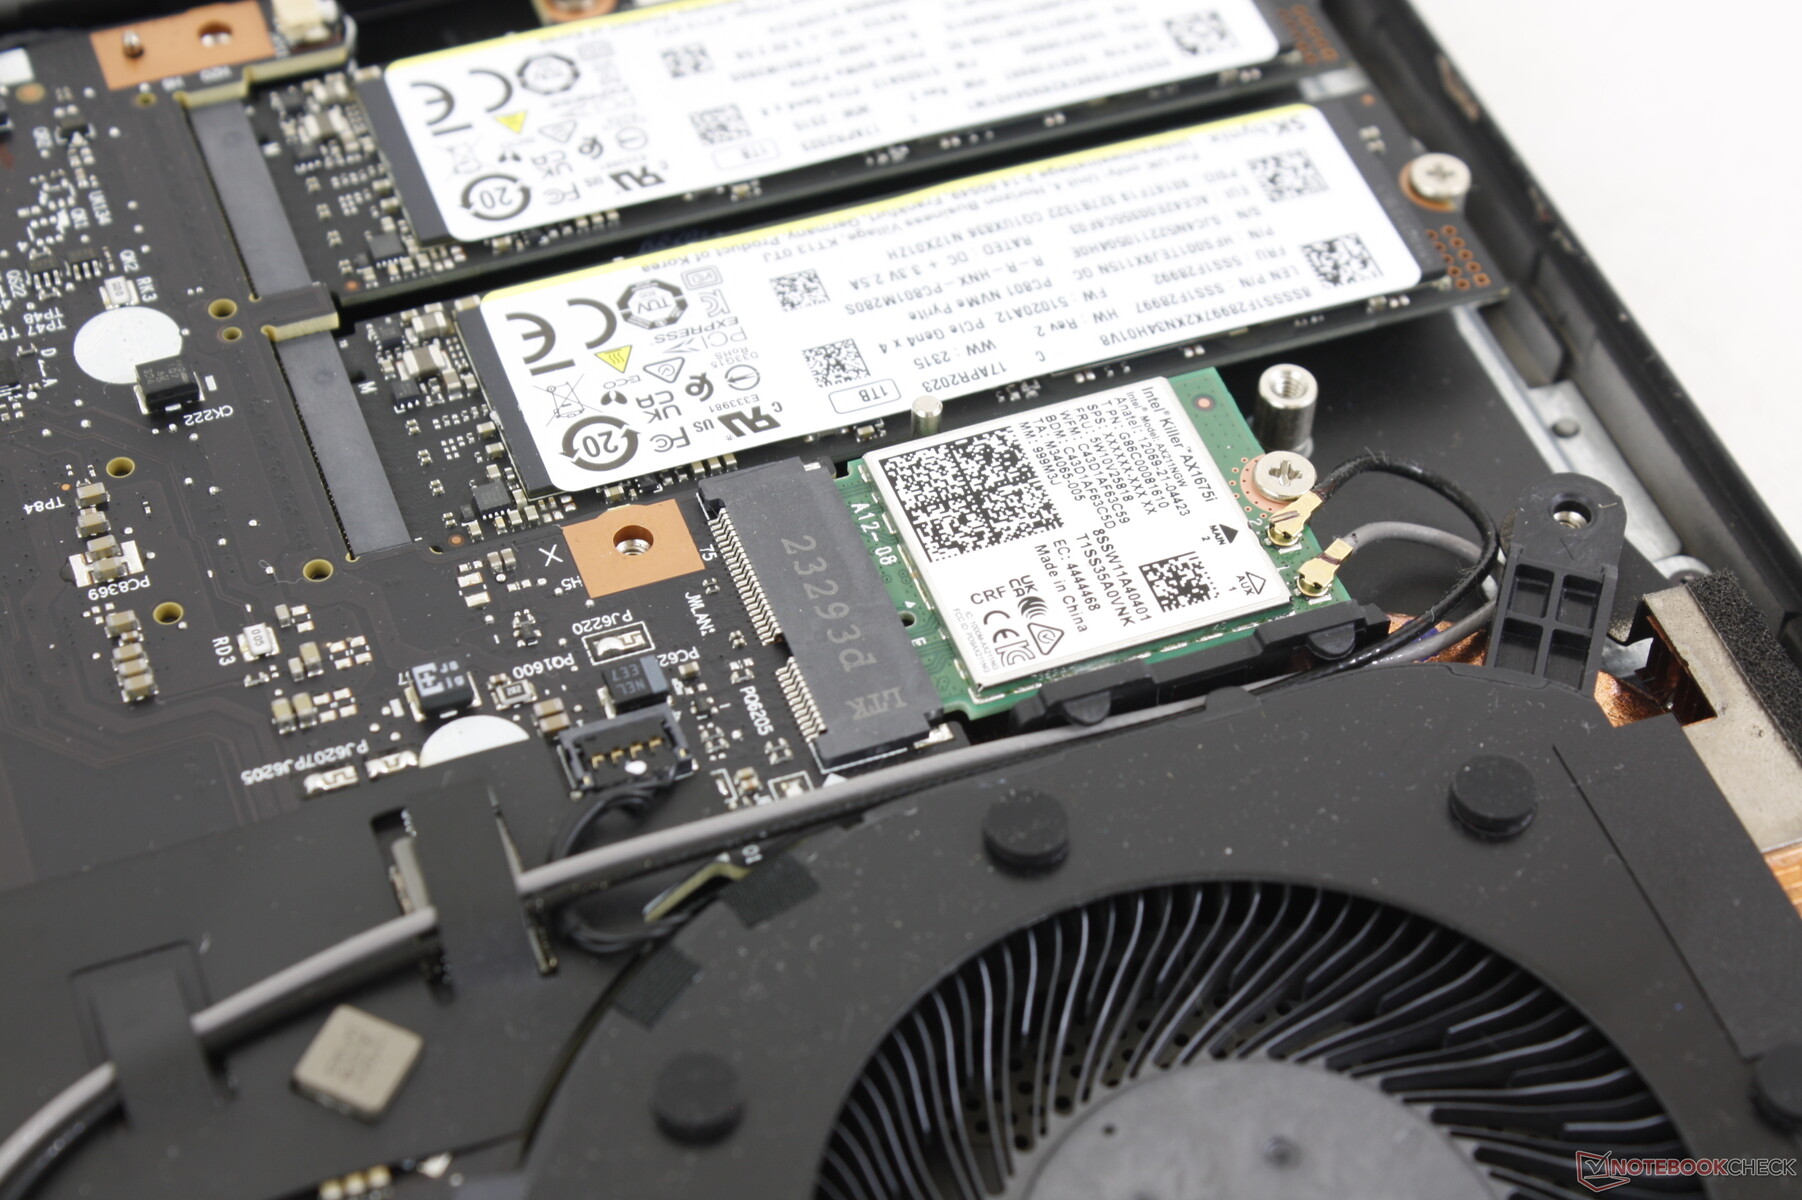
O Killer AX1675i vem como padrão, que é a marca de jogos do AX211 normal. O Wi-Fi 6E e o Bluetooth 5.3 são suportados e não tivemos problemas de conectividade quando emparelhados à nossa rede Asus AXE11000 de 6 GHz.
Webcam
A webcam de 2 MP é padrão para a categoria de laptops para jogos. Embora haja um interruptor de desativação da câmera integrado, não há sensor de infravermelho.

")
")
Manutenção
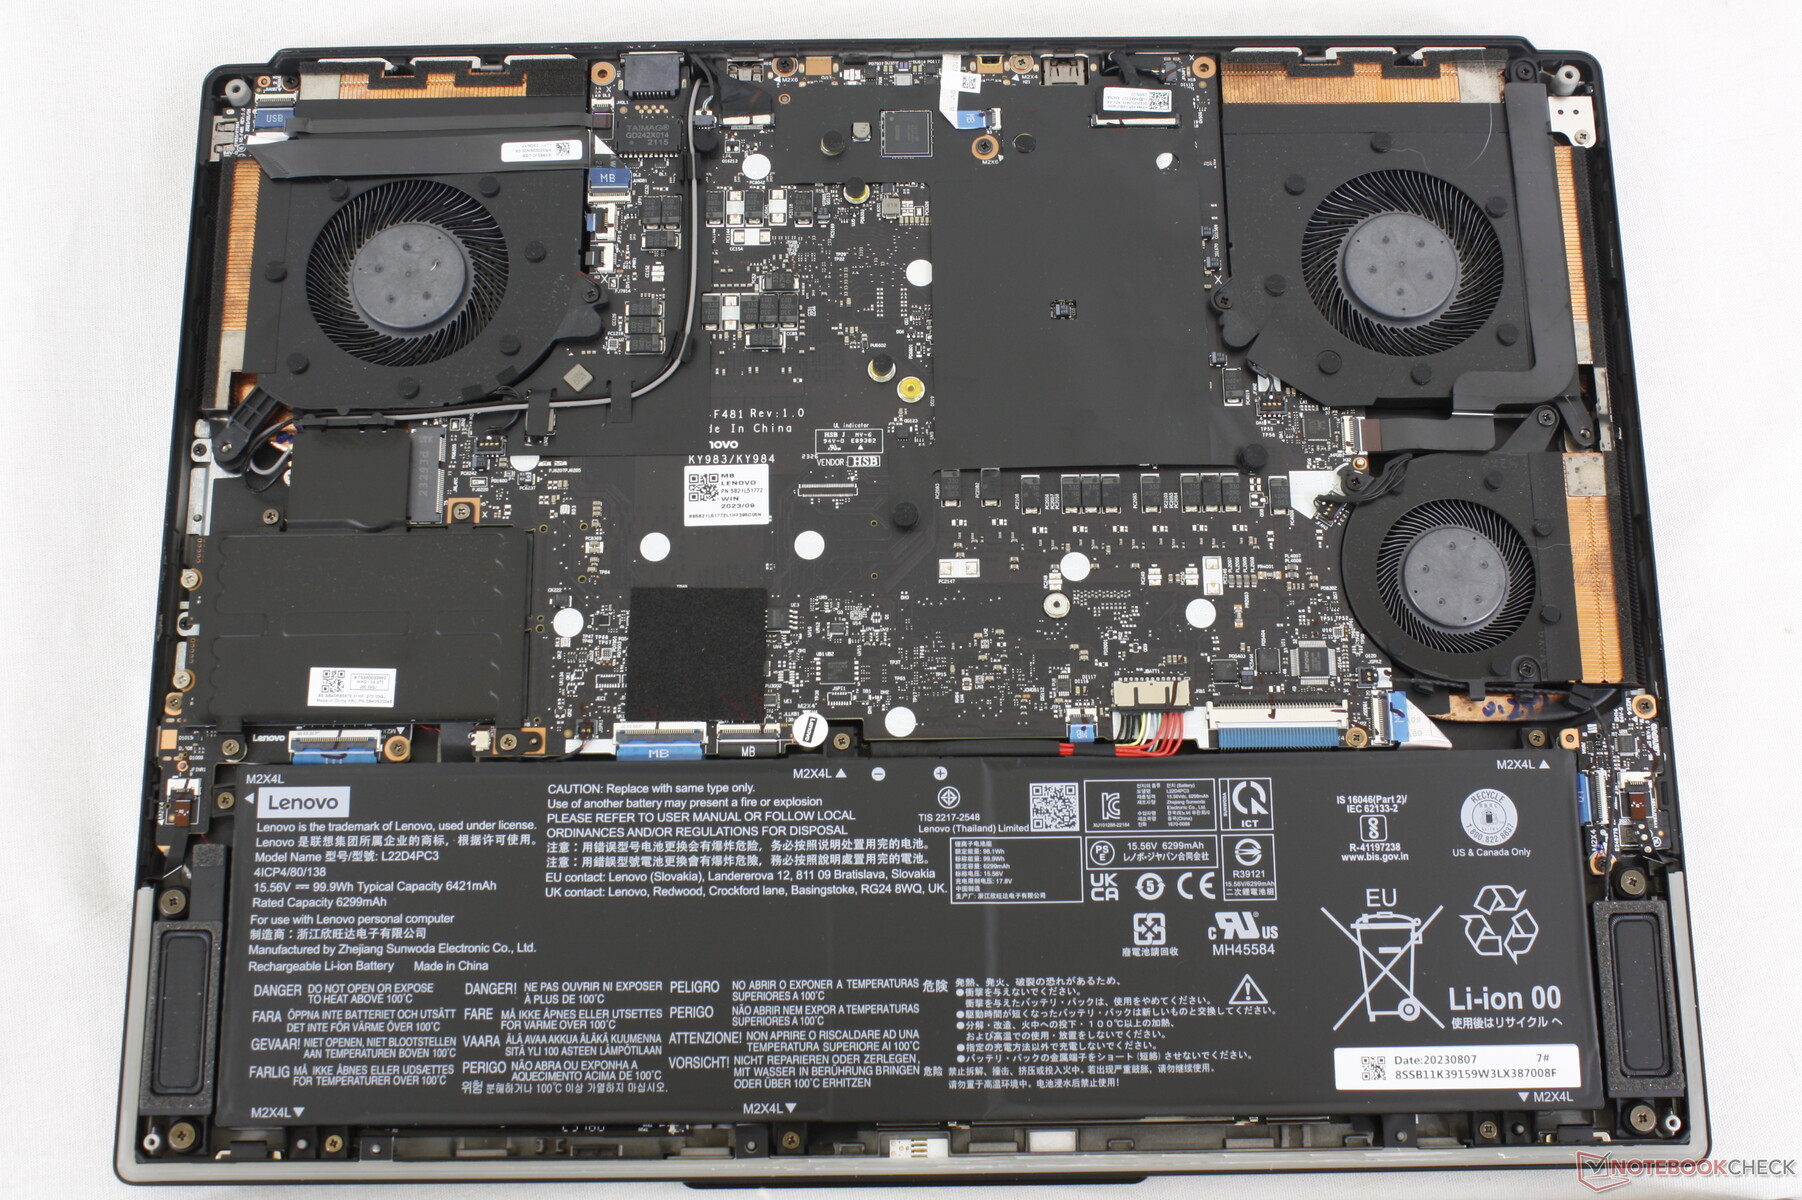
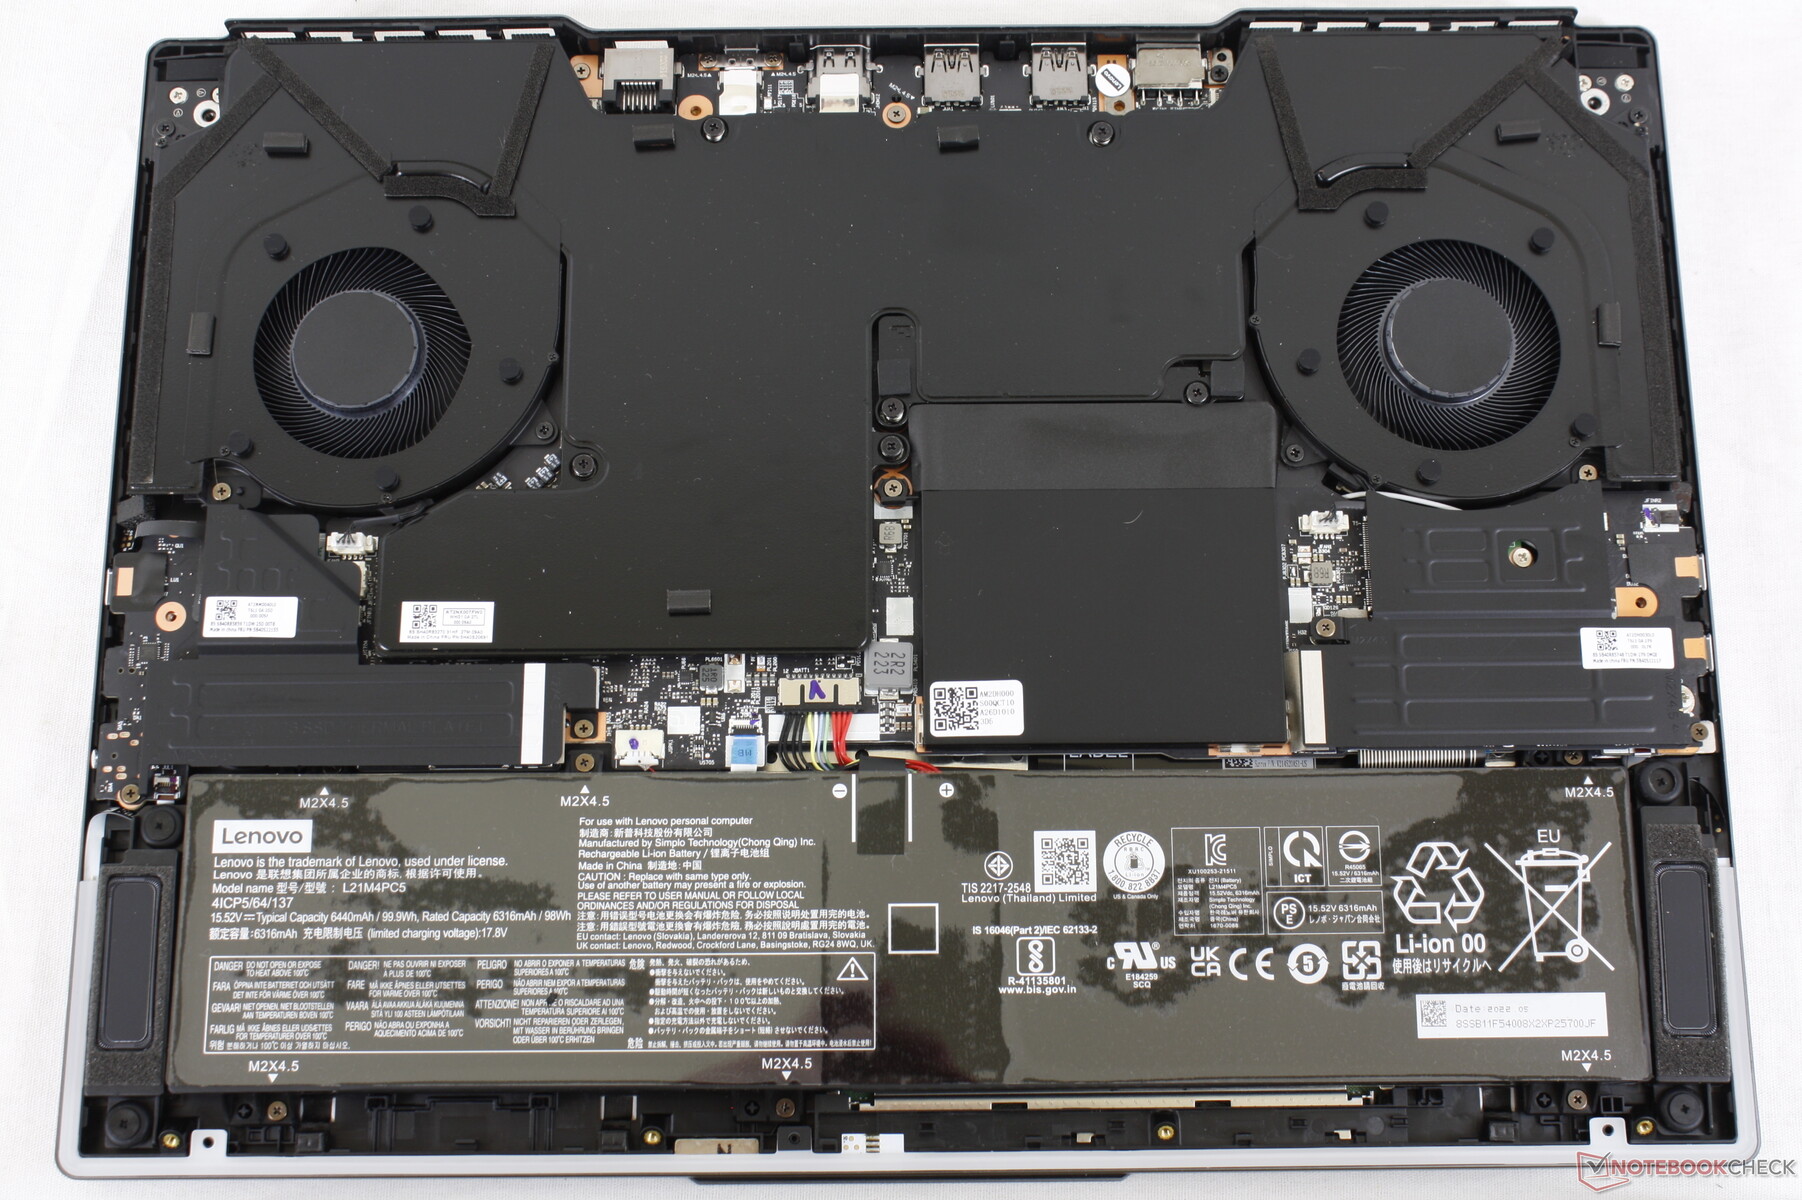
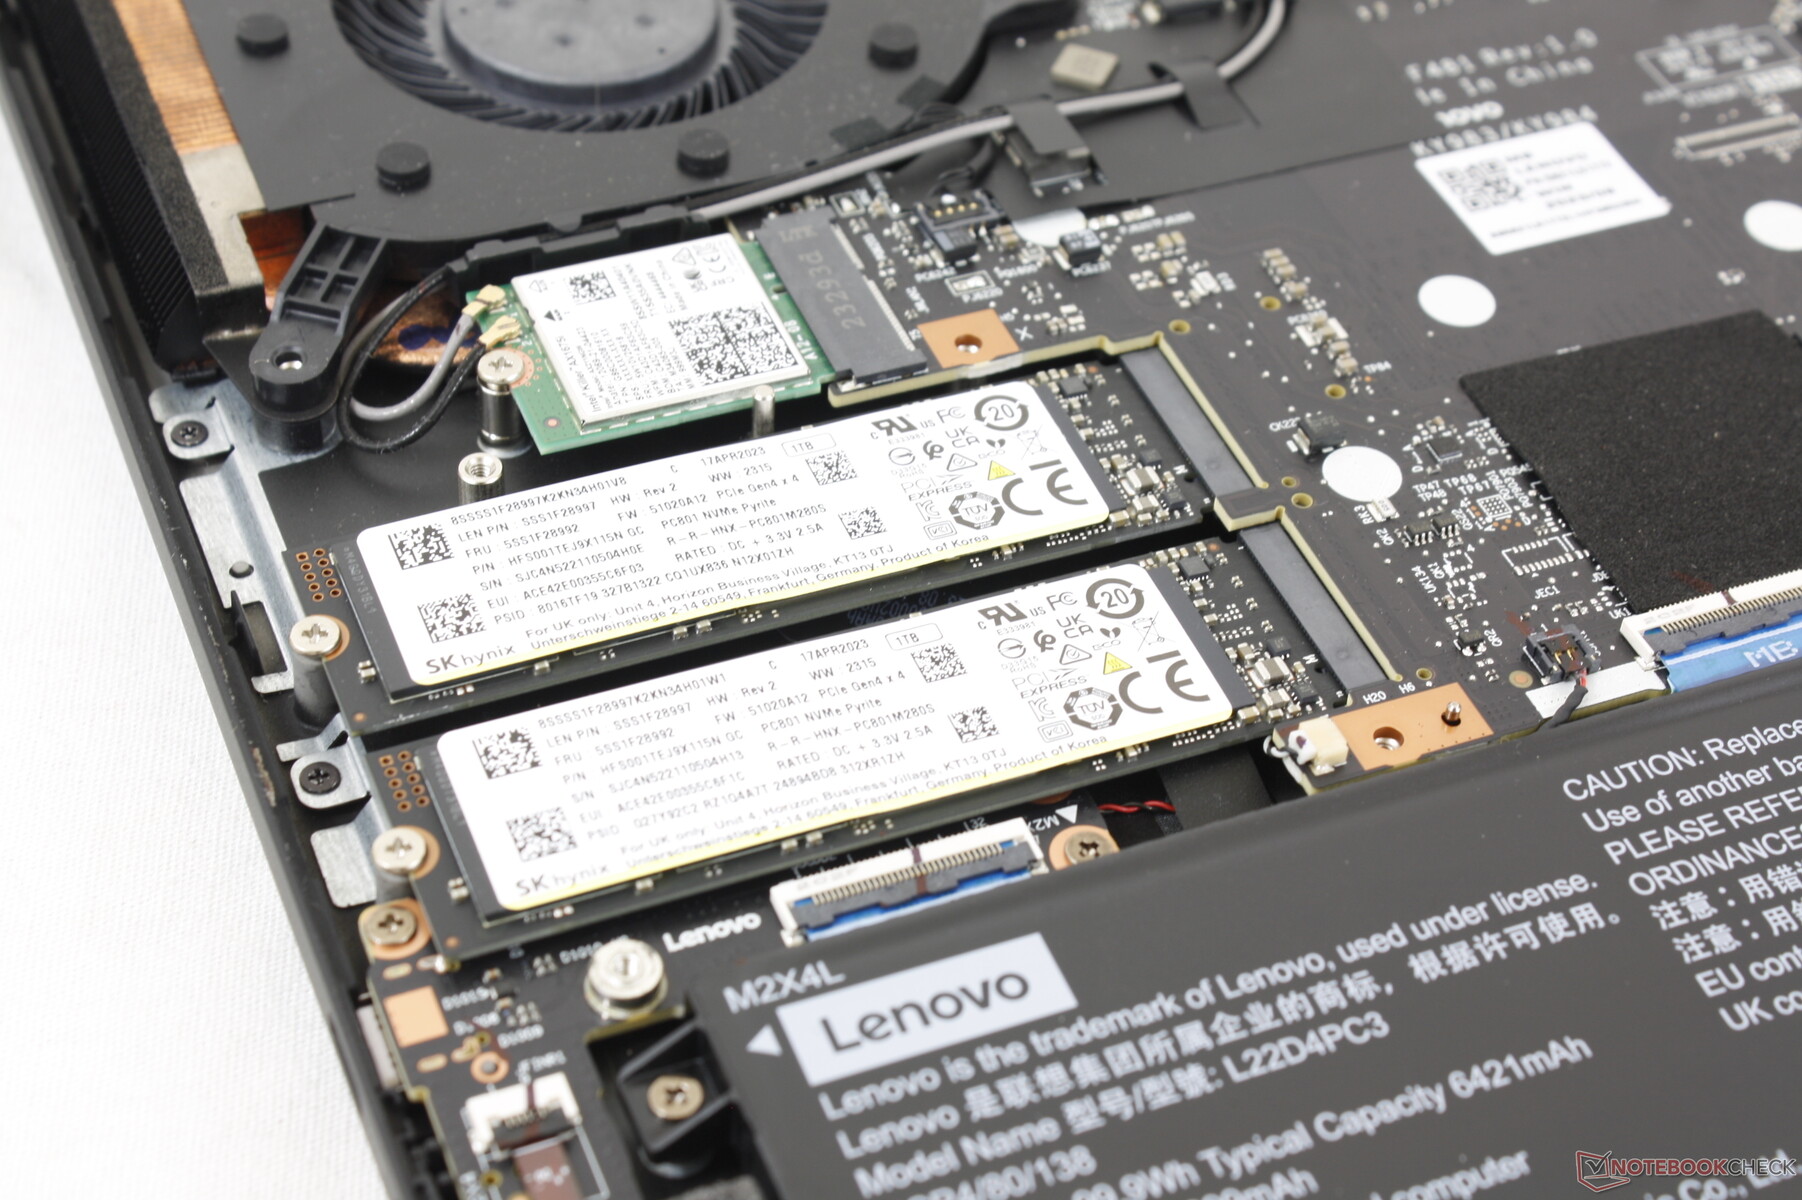
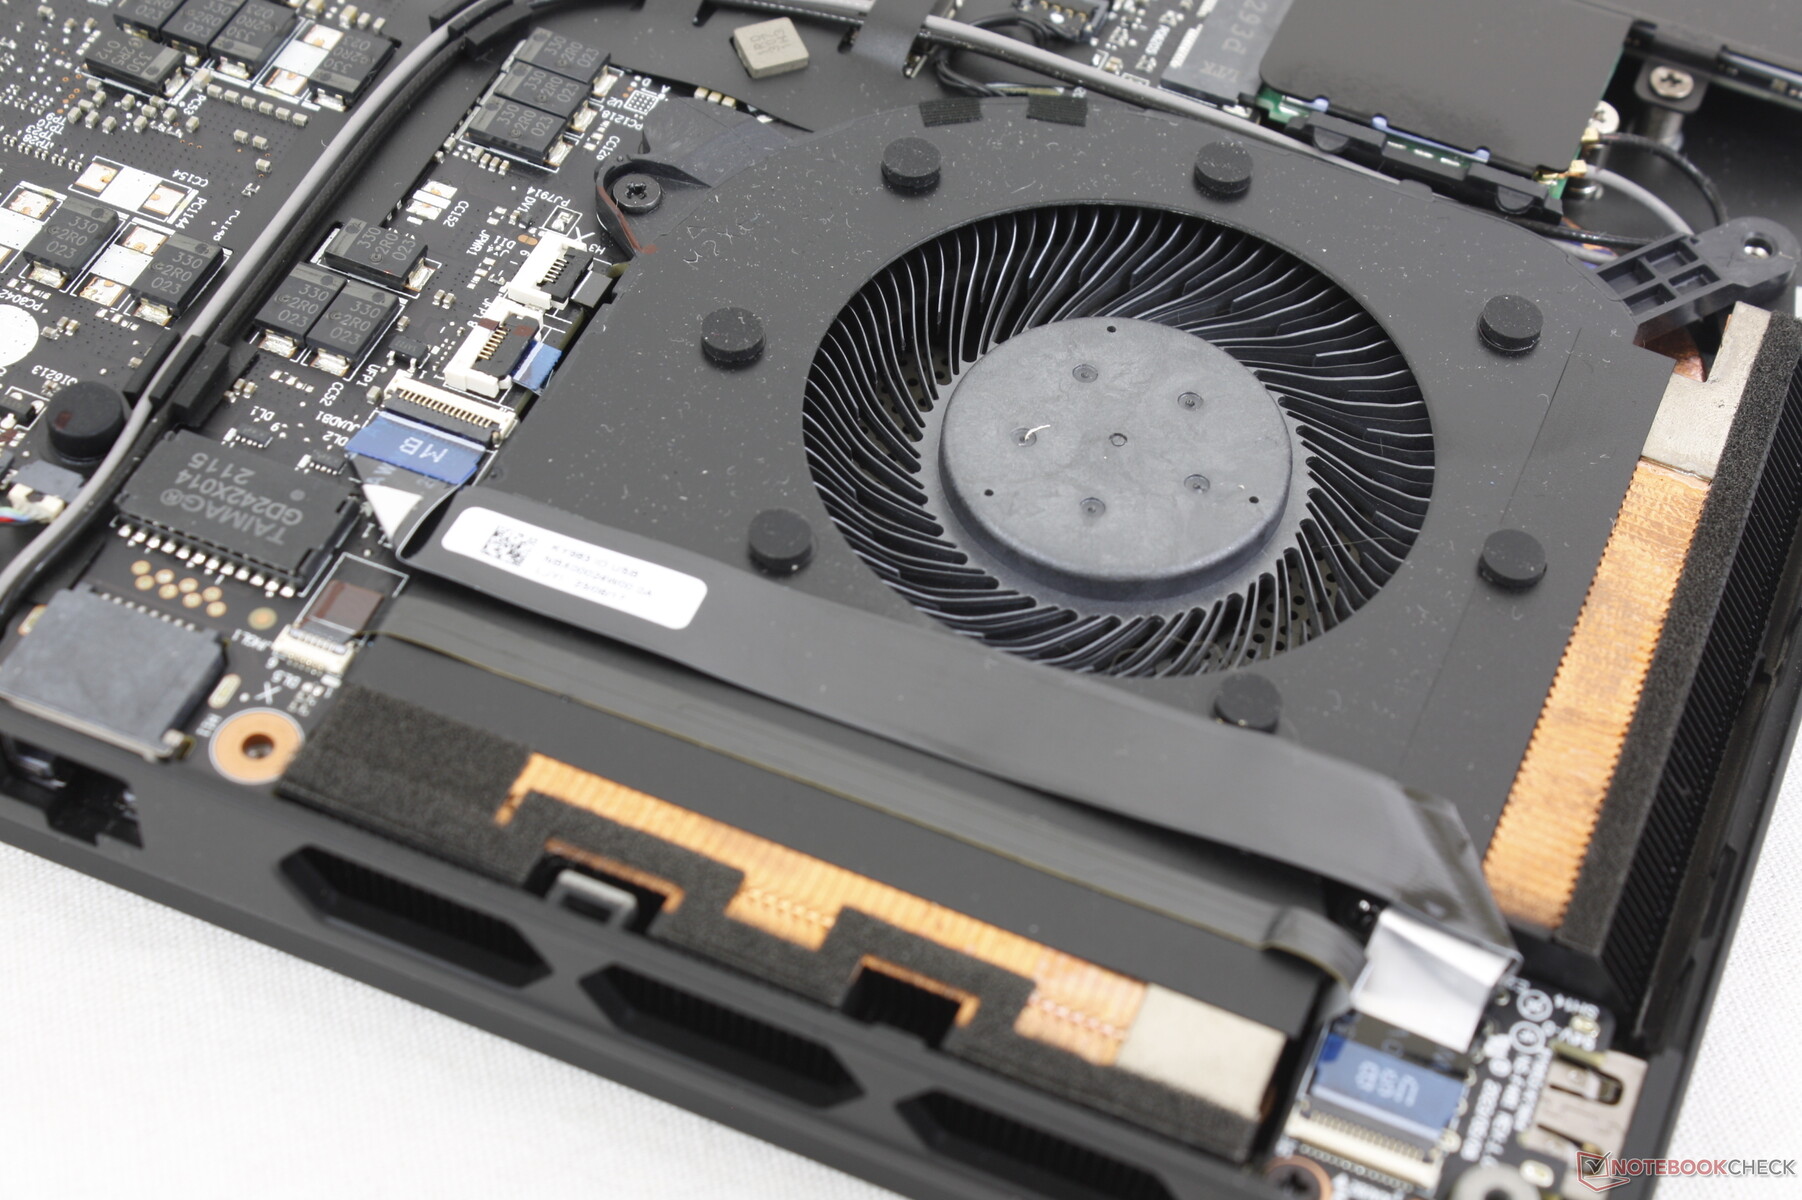
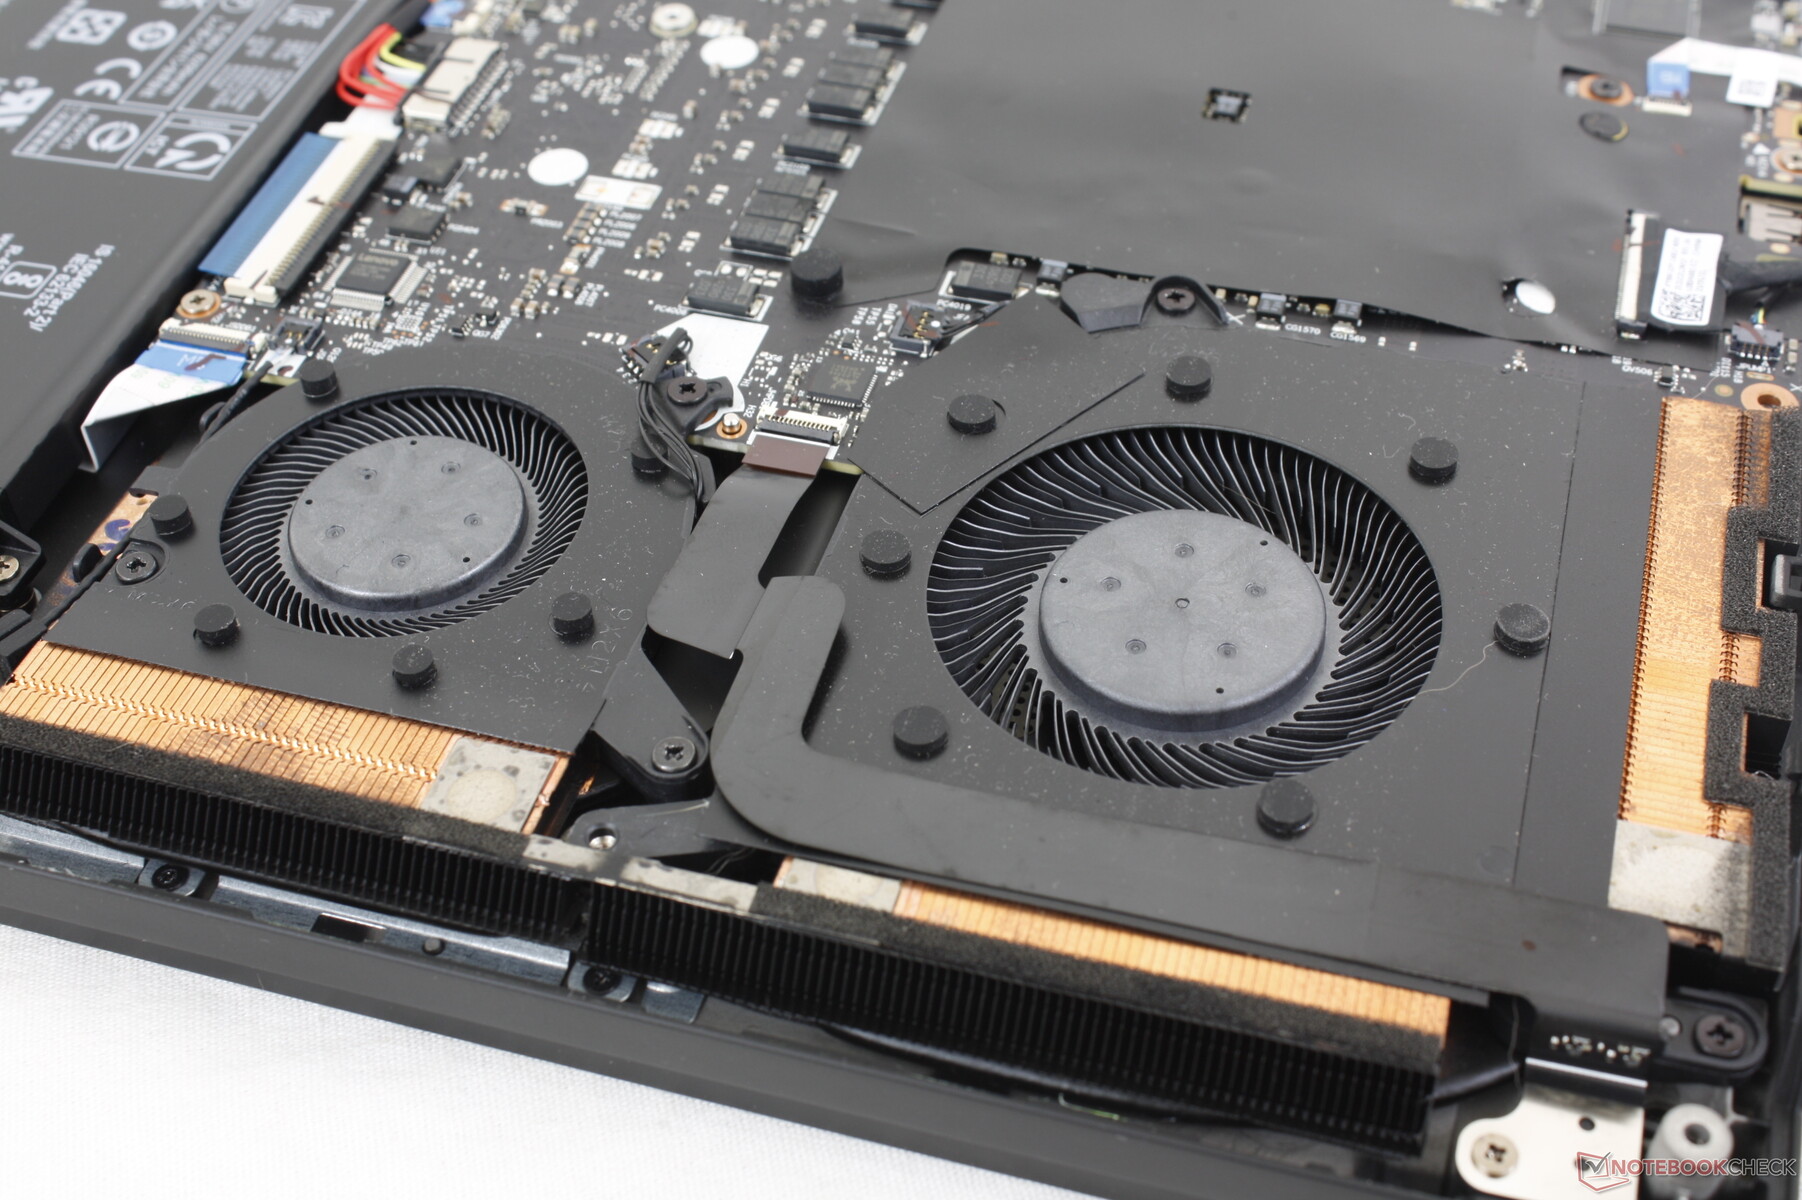
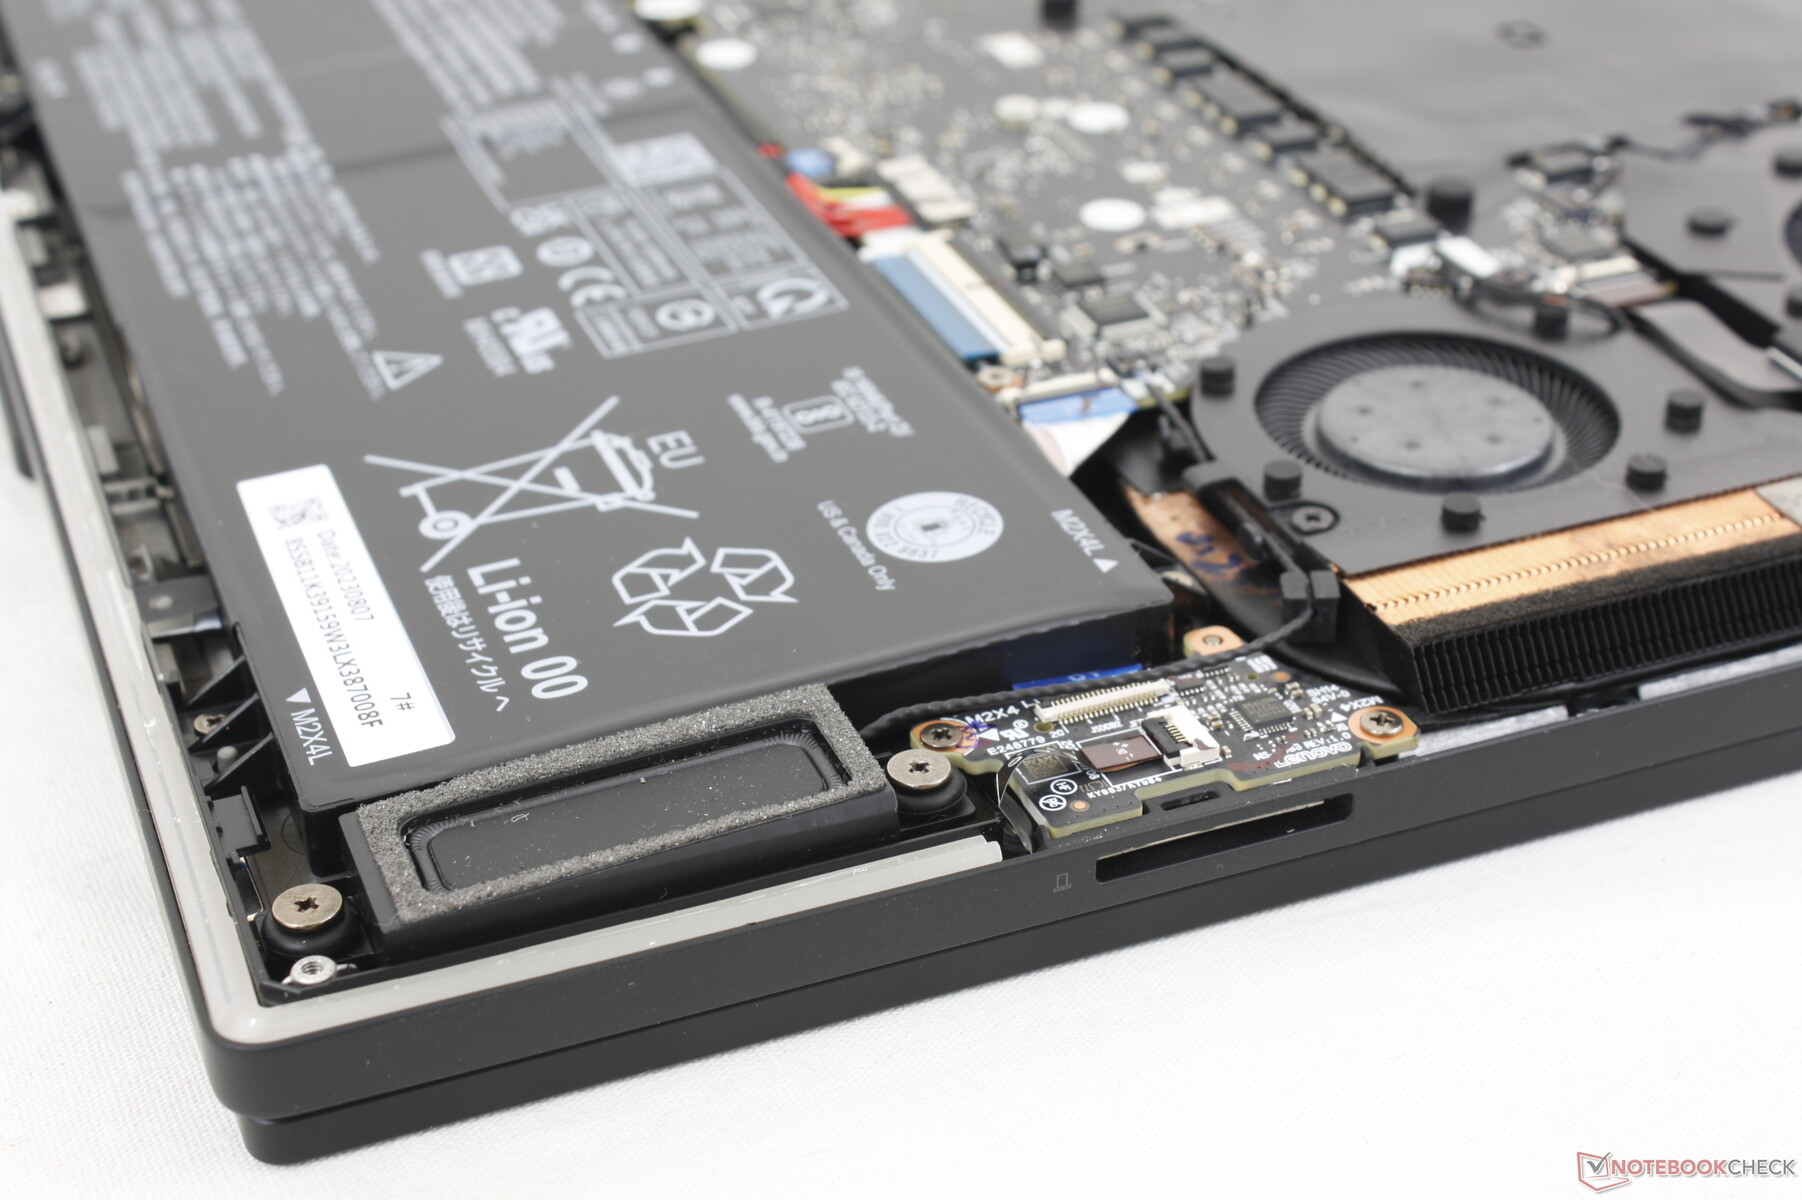
O painel inferior é fixado por 8 parafusos Phillips para uma remoção relativamente fácil. Ao contrário da maioria dos outros notebooks, a placa-mãe do Legion 9 16 está de cabeça para baixo e, portanto, é necessário desmontá-la para acessar os módulos de RAM da solução de resfriamento. Pelo menos os dois slots de SSD M.2 2280 são facilmente acessíveis.
Acessórios e garantia
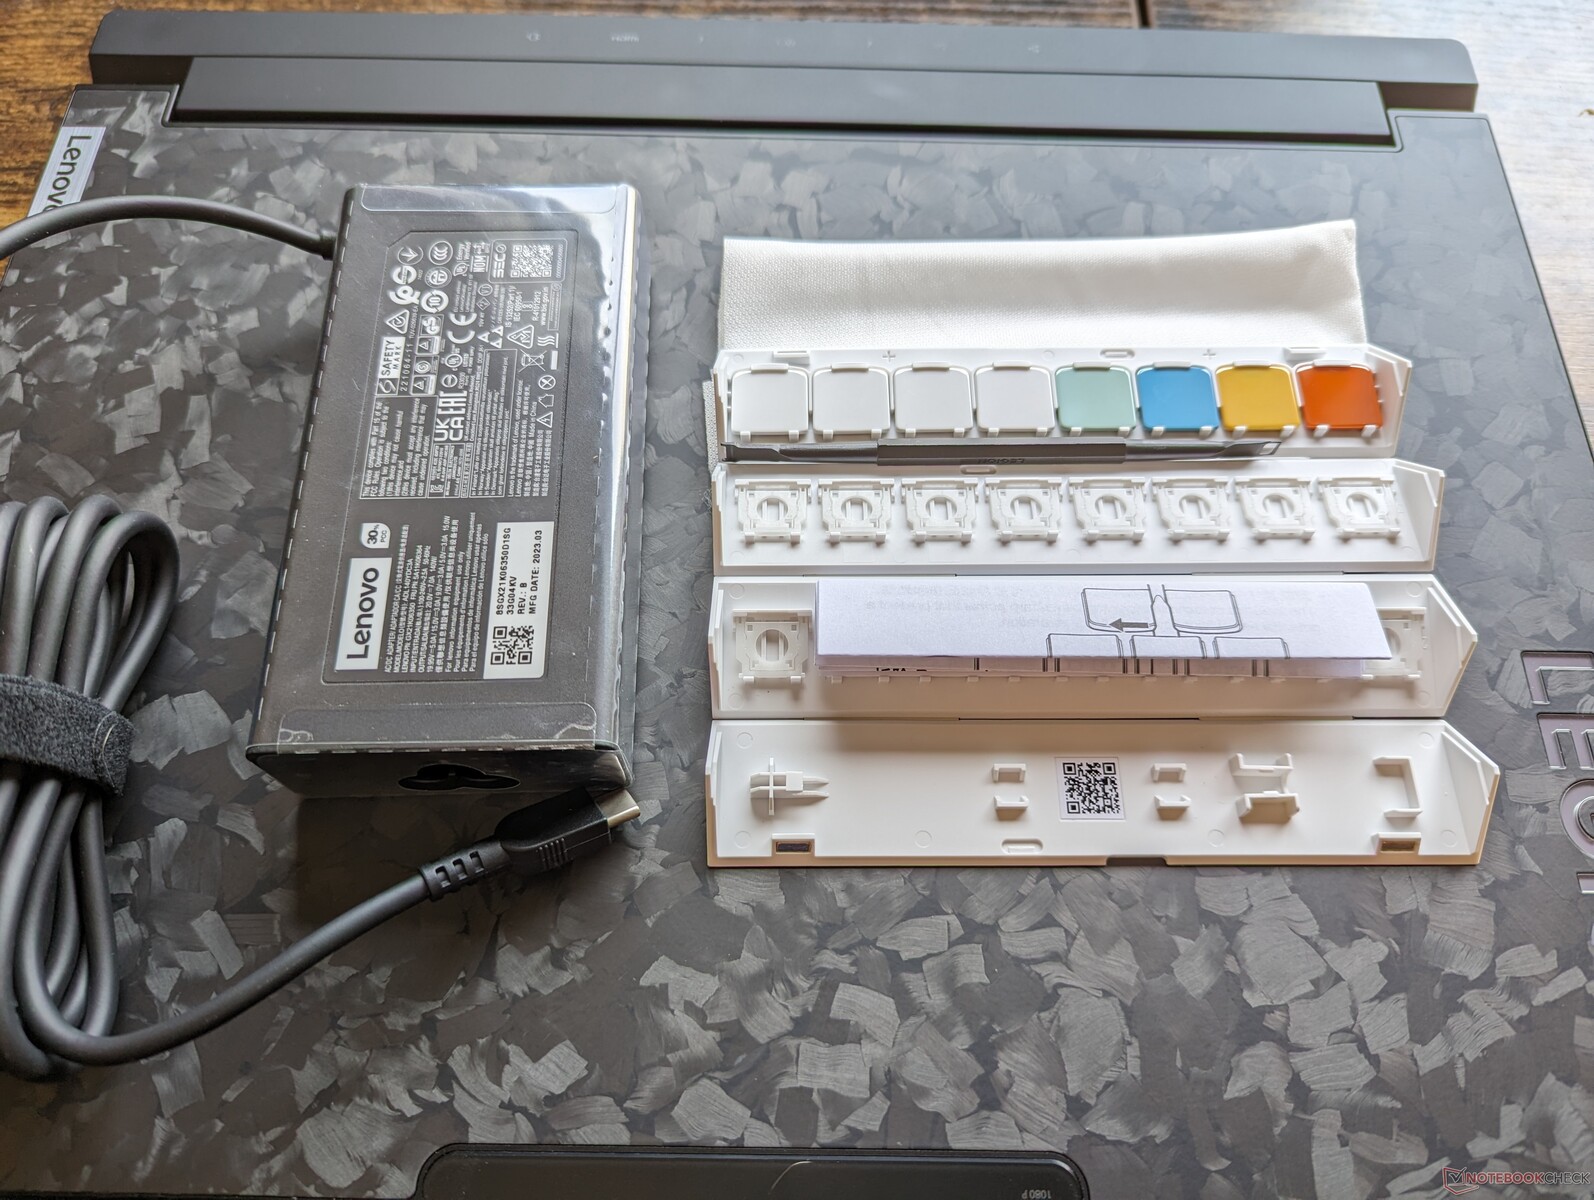
Além do adaptador CA proprietário e da documentação habituais, a caixa de varejo também inclui um adaptador USB-C universal de 140 W muito útil que pode ser usado para carregar esse laptop e a maioria dos outros dispositivos USB-C, além de 8 teclas.
A garantia padrão limitada de um ano do fabricante se aplica se o produto for comprado nos EUA.
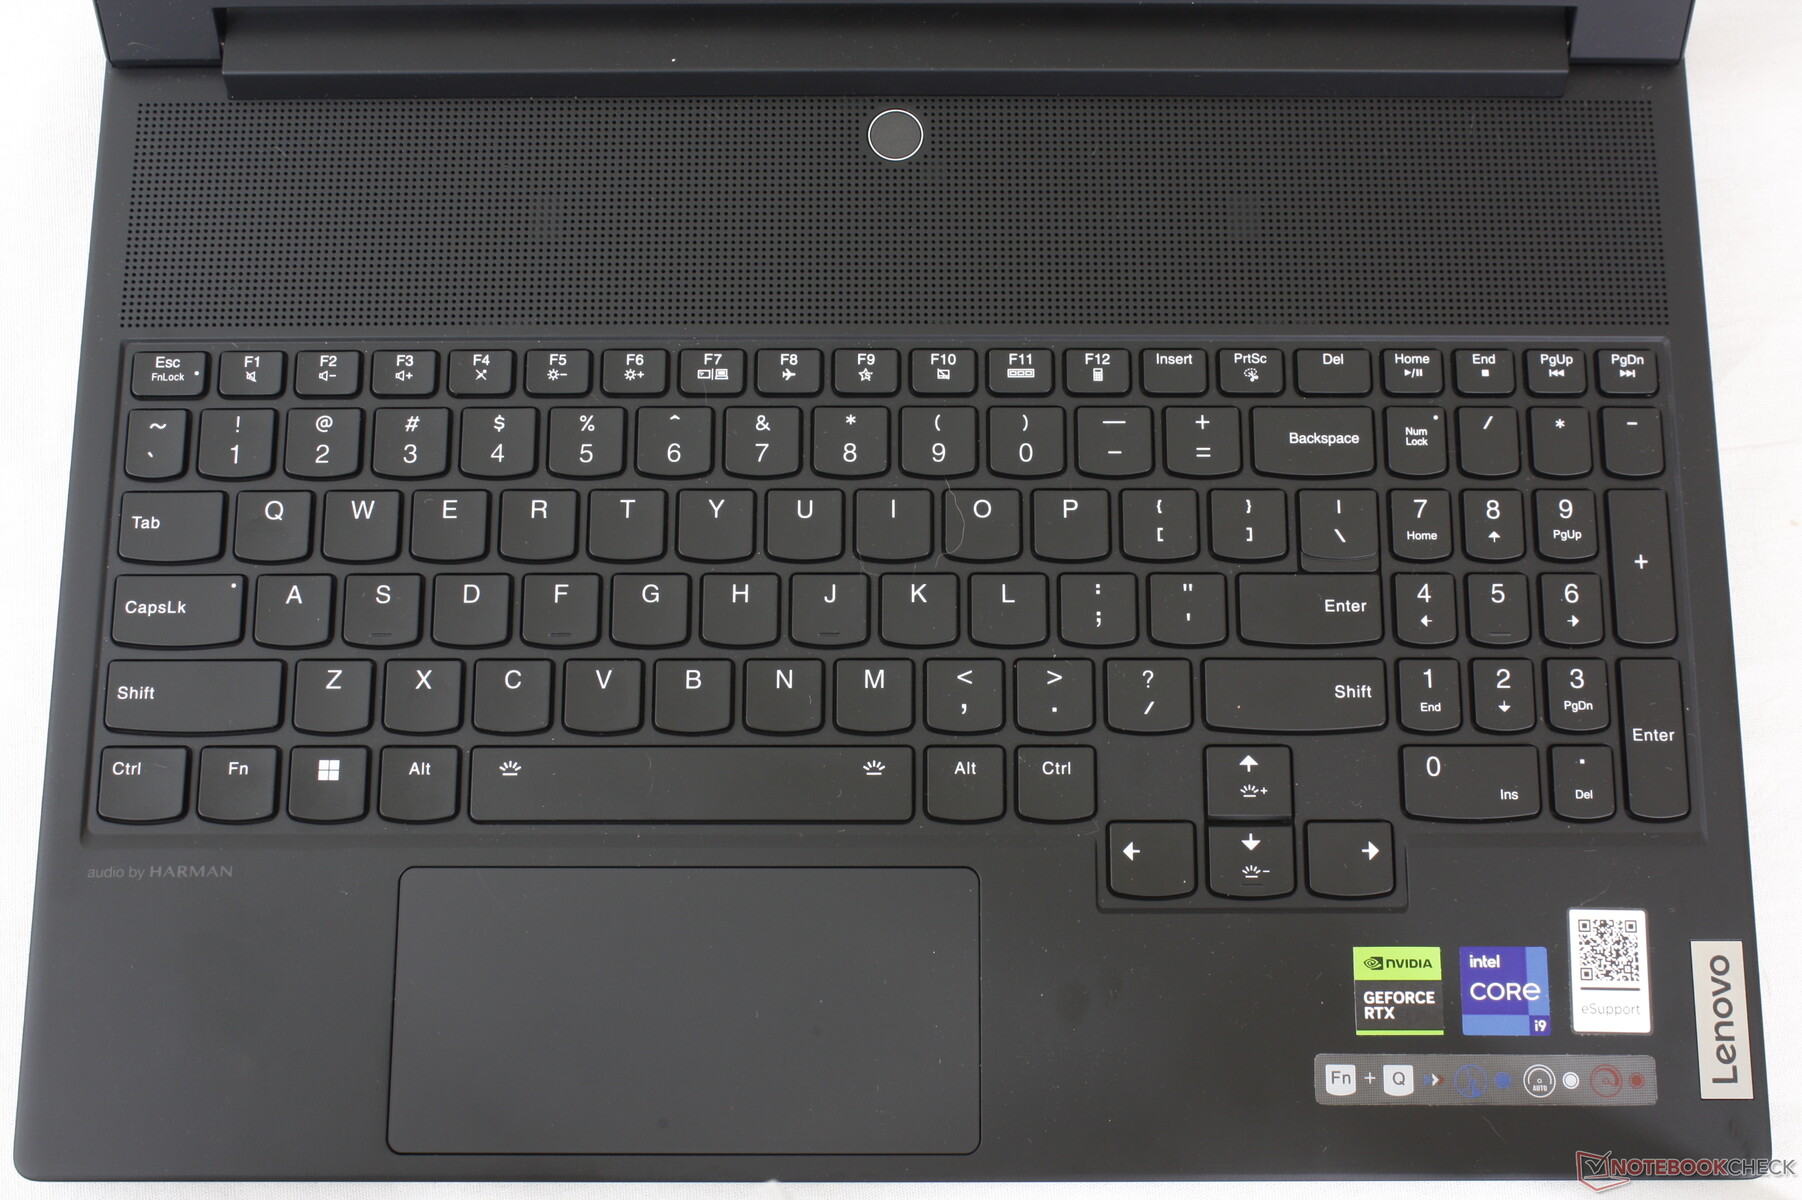
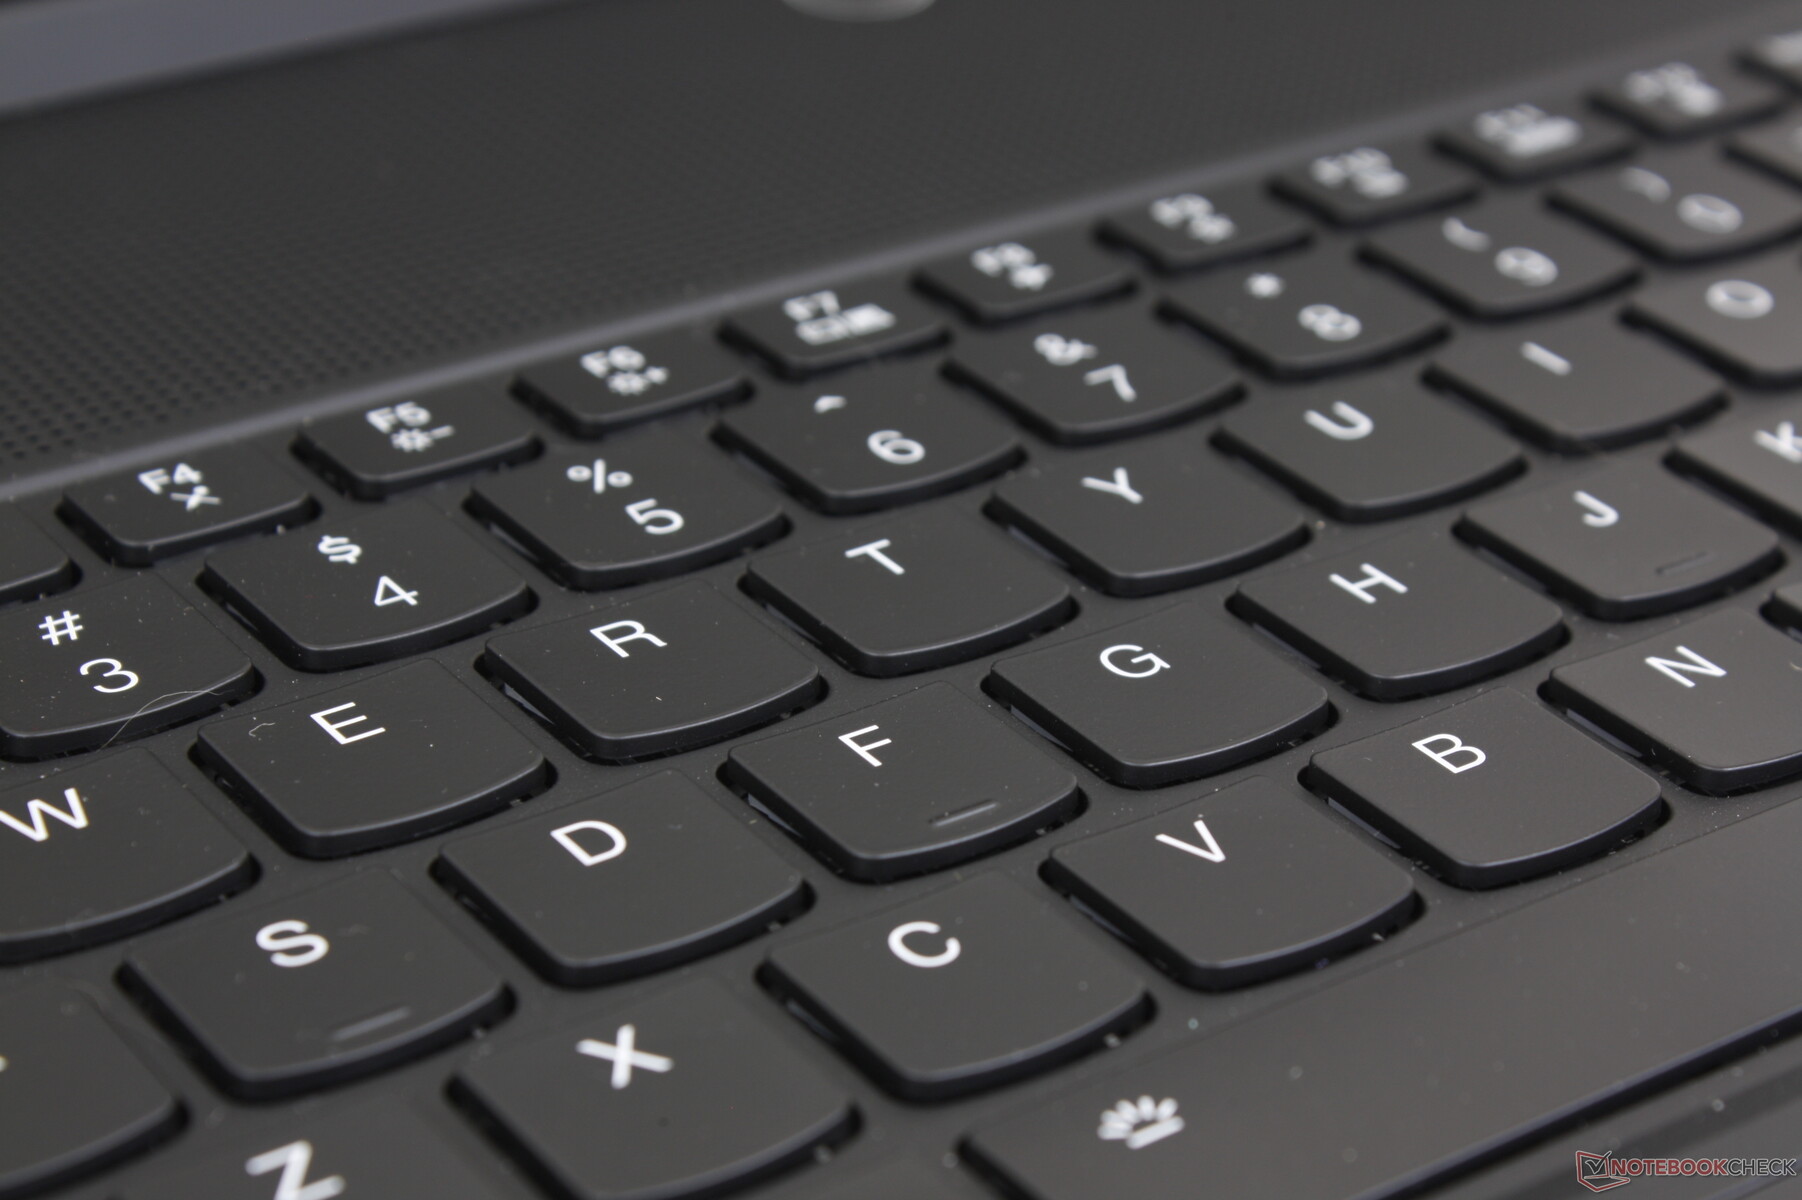
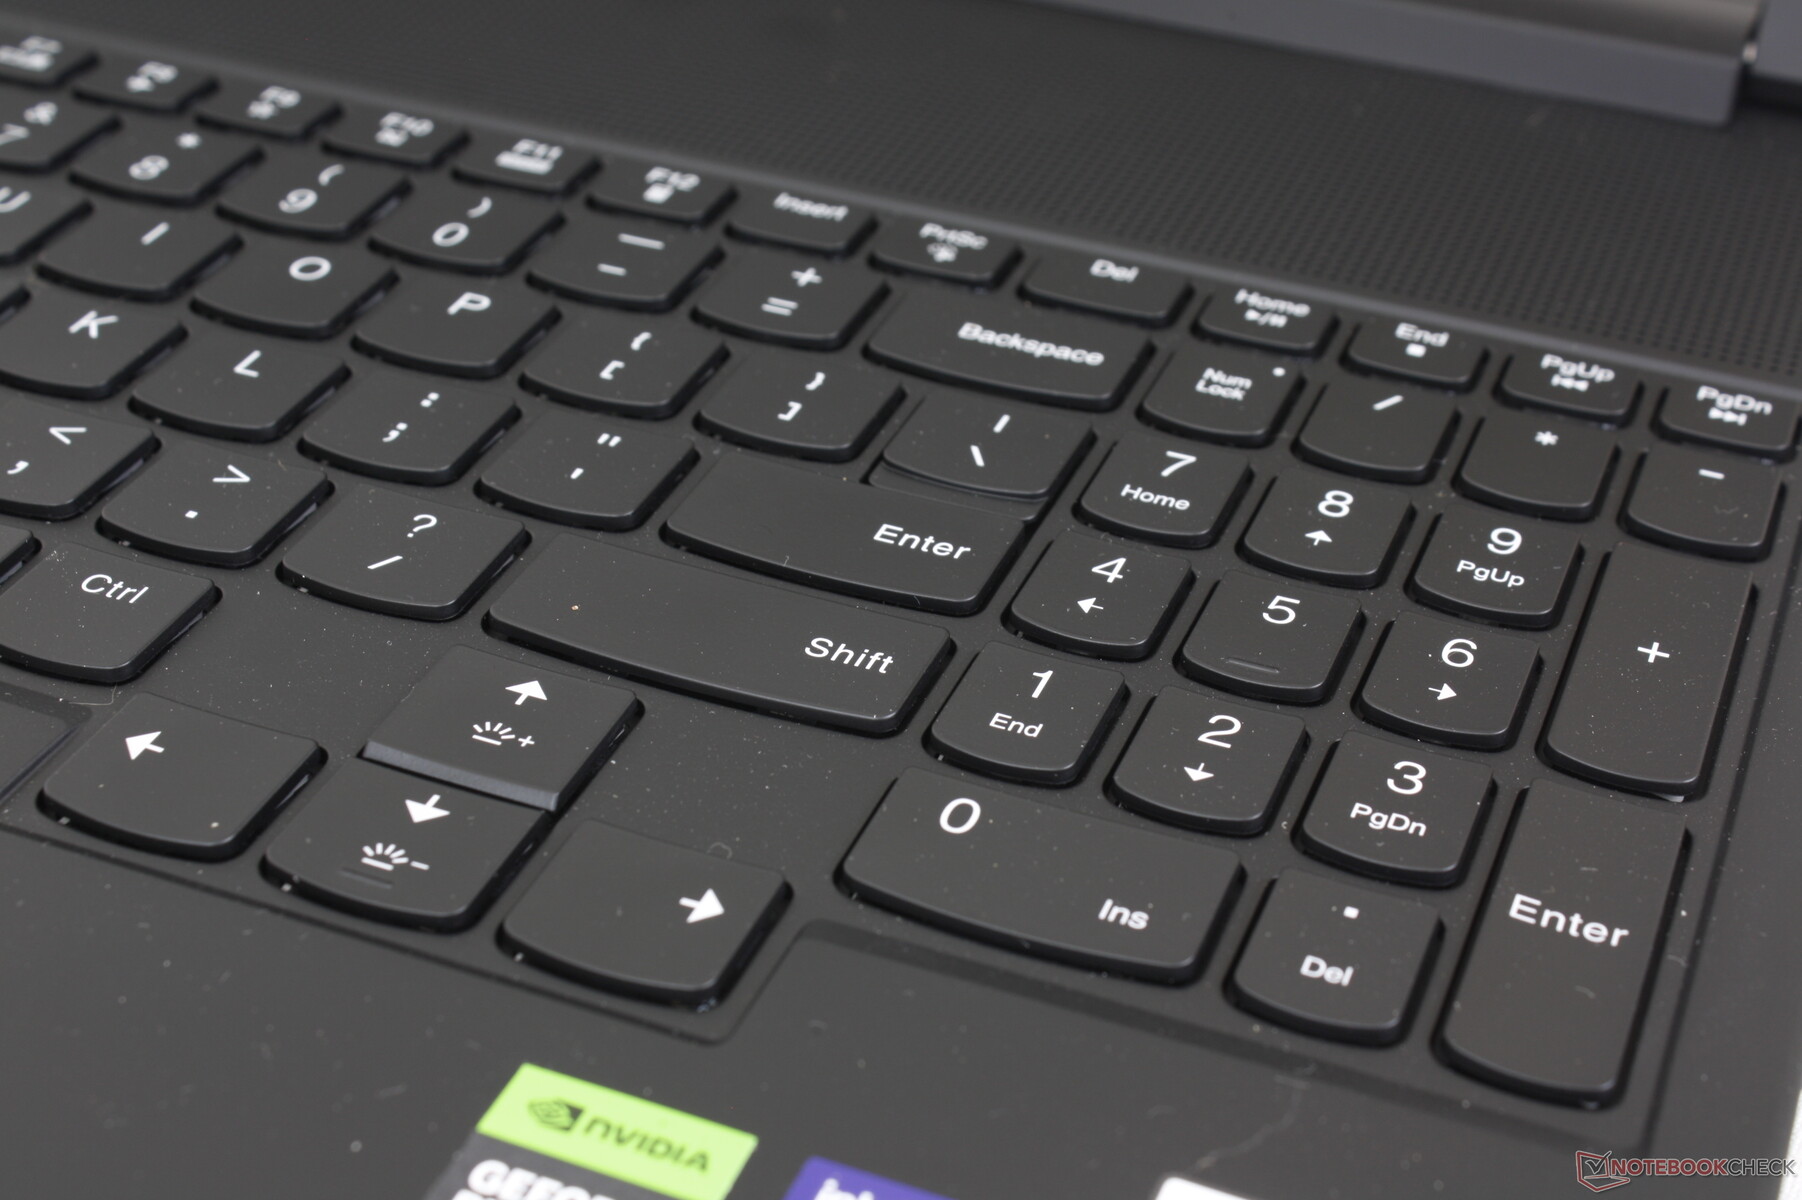
Dispositivos de entrada - Teclado confortável com clickpad apertado
Teclado
O teclado TrueStrike oferece um deslocamento das teclas de 1,5 mm para ser um pouco mais profundo do que as teclas da maioria dos Ultrabooks. O feedback é surpreendentemente nítido e confortável para teclas baseadas em membrana, mostrando que não são necessários interruptores mecânicos sofisticados para uma boa experiência de digitação. As teclas firmes são mais altas do que as teclas do Blade 16 ou do Asus Zephyrus M16 mas, definitivamente, ainda não são tão sensíveis quanto as teclas mecânicas de modelos como o Schenker XMG Neo 15 ou o Alienware m18.
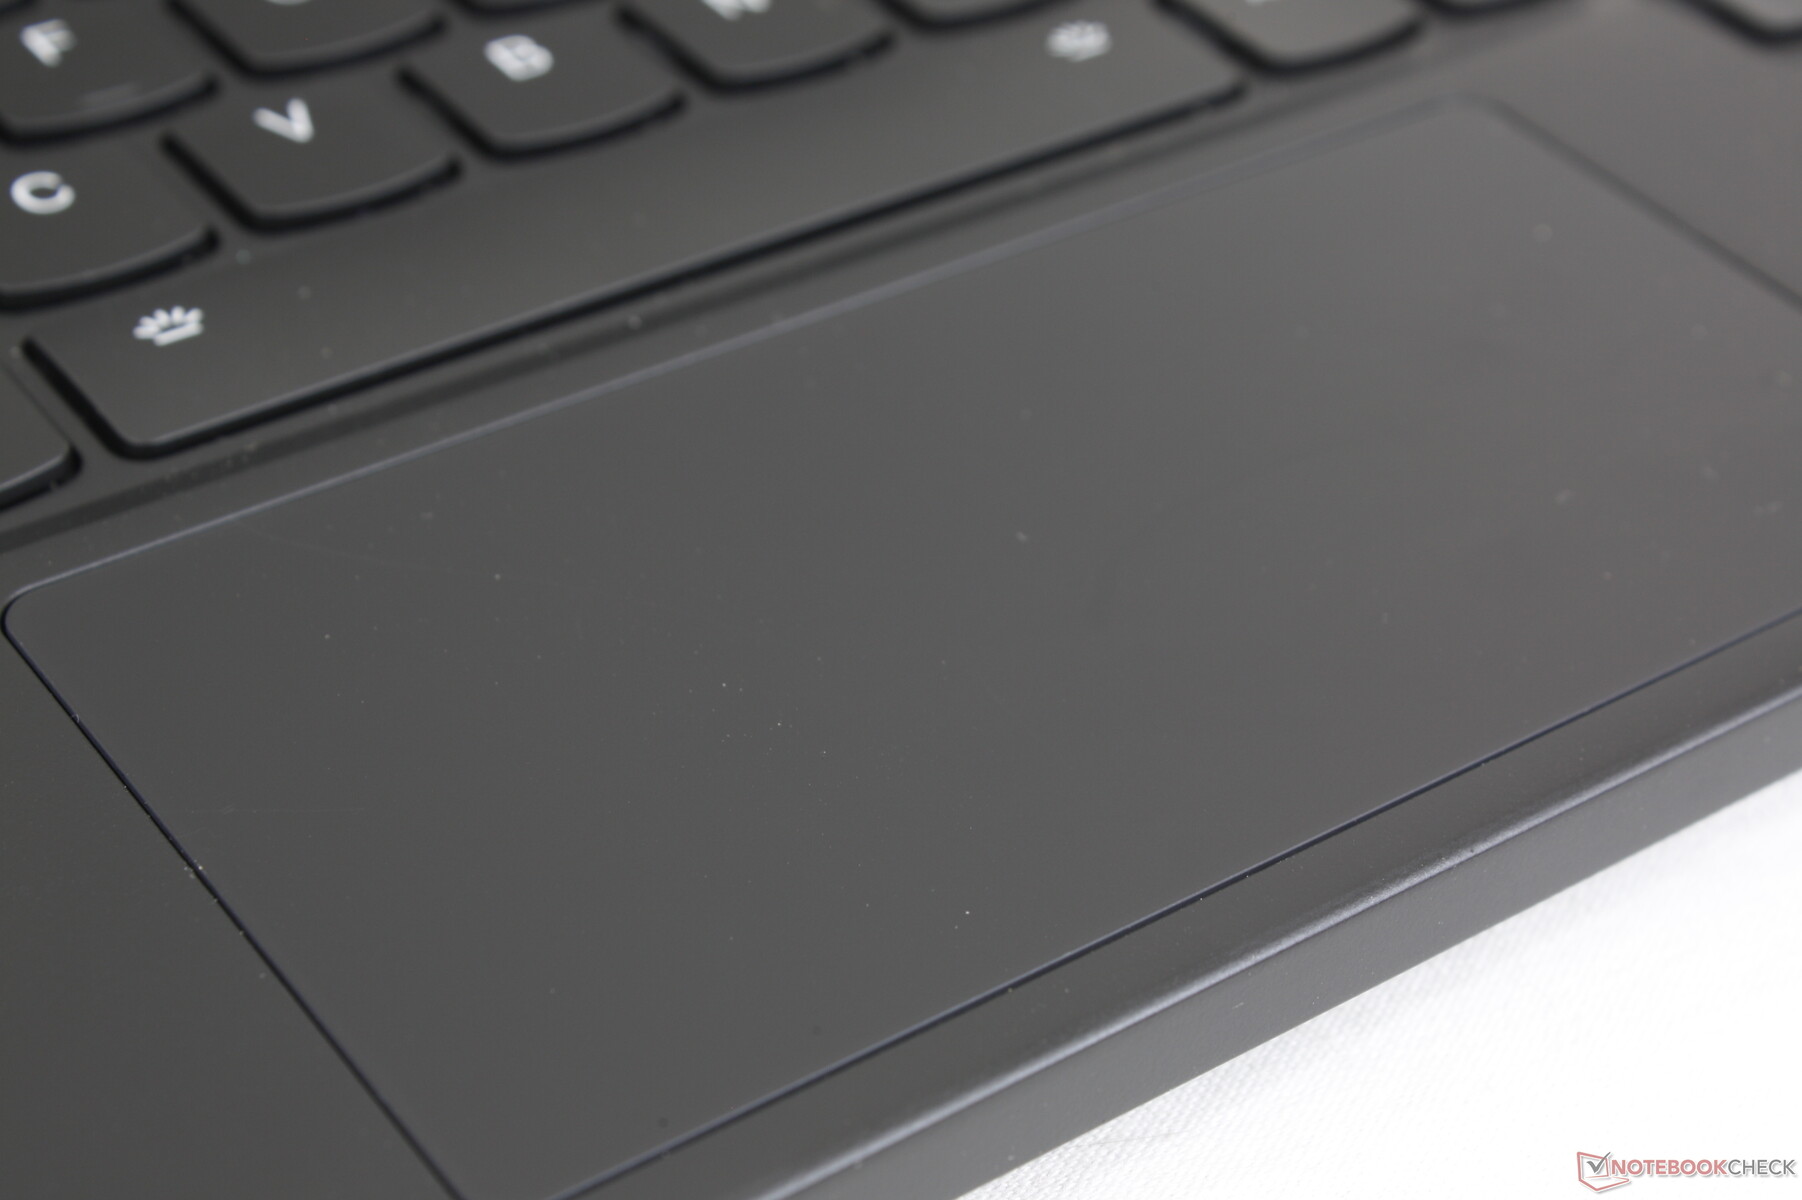
Touchpad
O tamanho do clickpad foi reduzido para apenas (12 x 5,9 cm) devido ao posicionamento do teclado. Como resultado, os movimentos verticais do cursor na tela alta de 16:10 parecem apertados, especialmente quando comparados aos notebooks para jogos com clickpads muito maiores, como o Razer Blade 16a Lenovo está apostando que os gamers usarão seus próprios mouses USB ou Bluetooth para a grande maioria dos cenários.
O deslizamento e o clique são suaves e com um clique satisfatório, apesar da pequena área de superfície. No entanto, os movimentos do cursor ocasionalmente congelavam em nossa unidade ao usar o clickpad, enquanto o mesmo problema não ocorria ao usar um mouse externo. Recomendamos que o senhor verifique novamente o clickpad no momento da compra para ter certeza de que ele não apresenta defeitos.
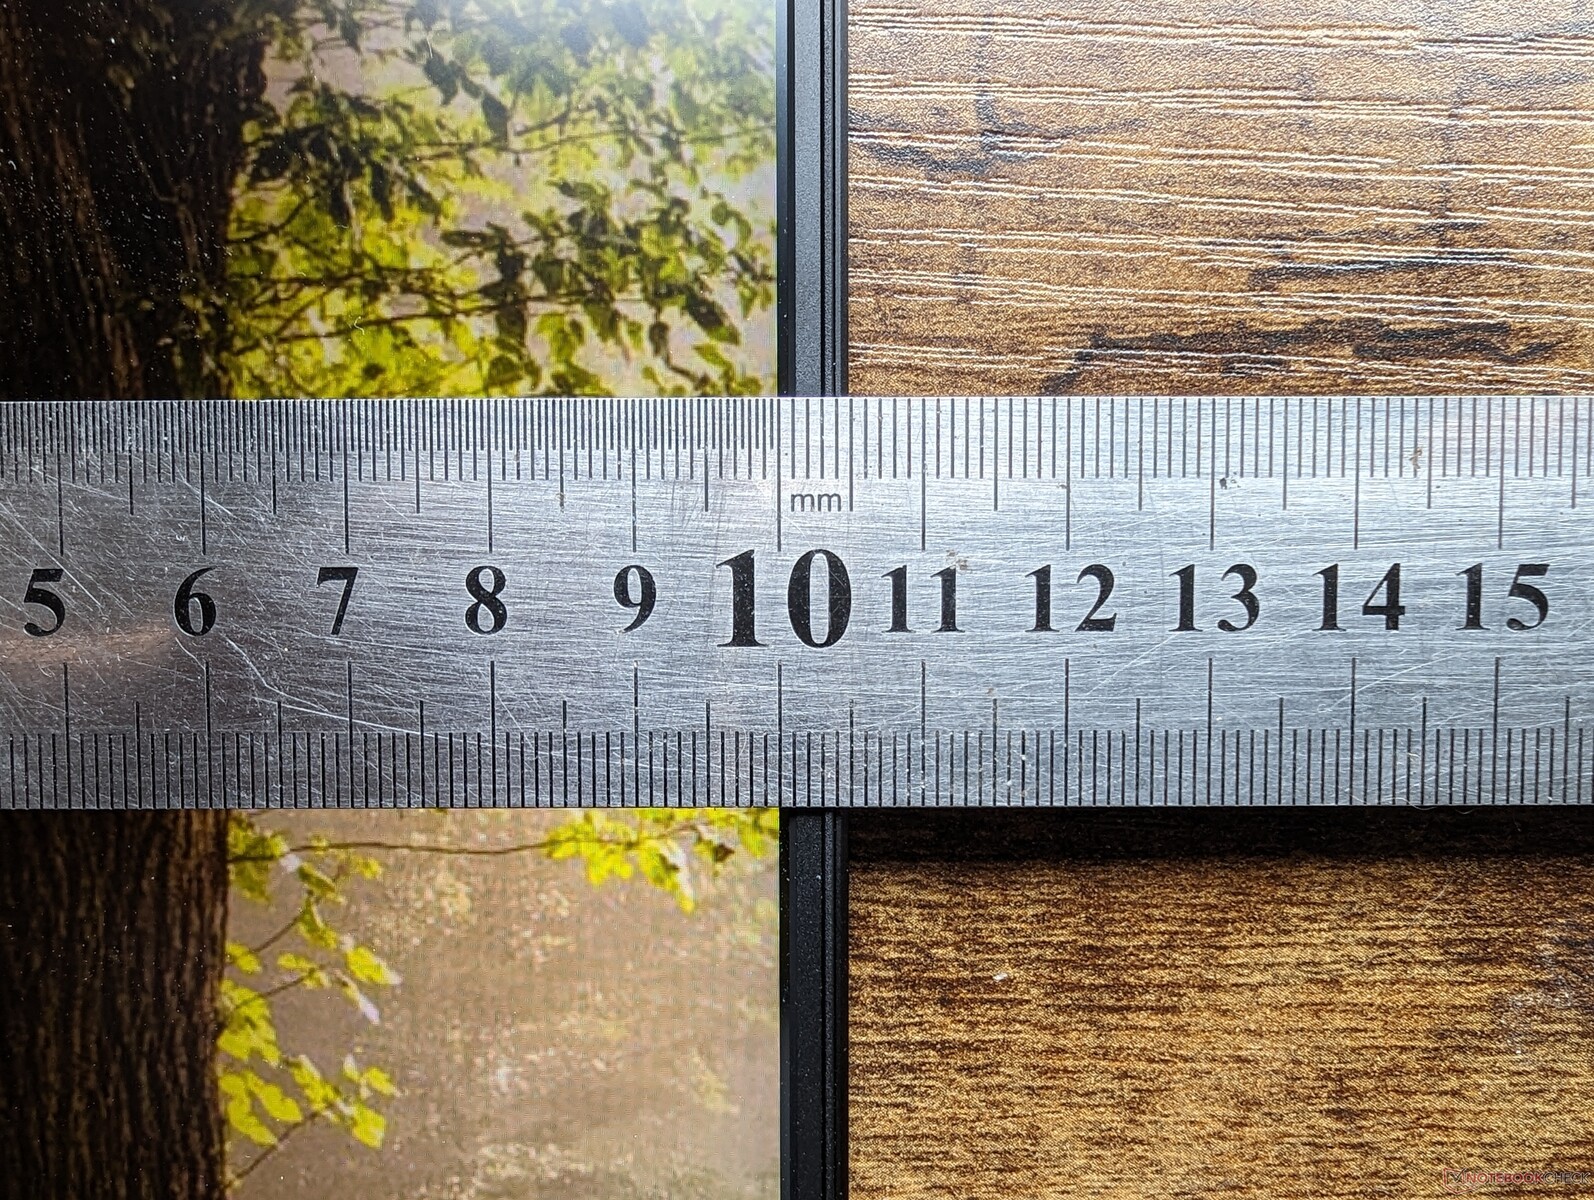
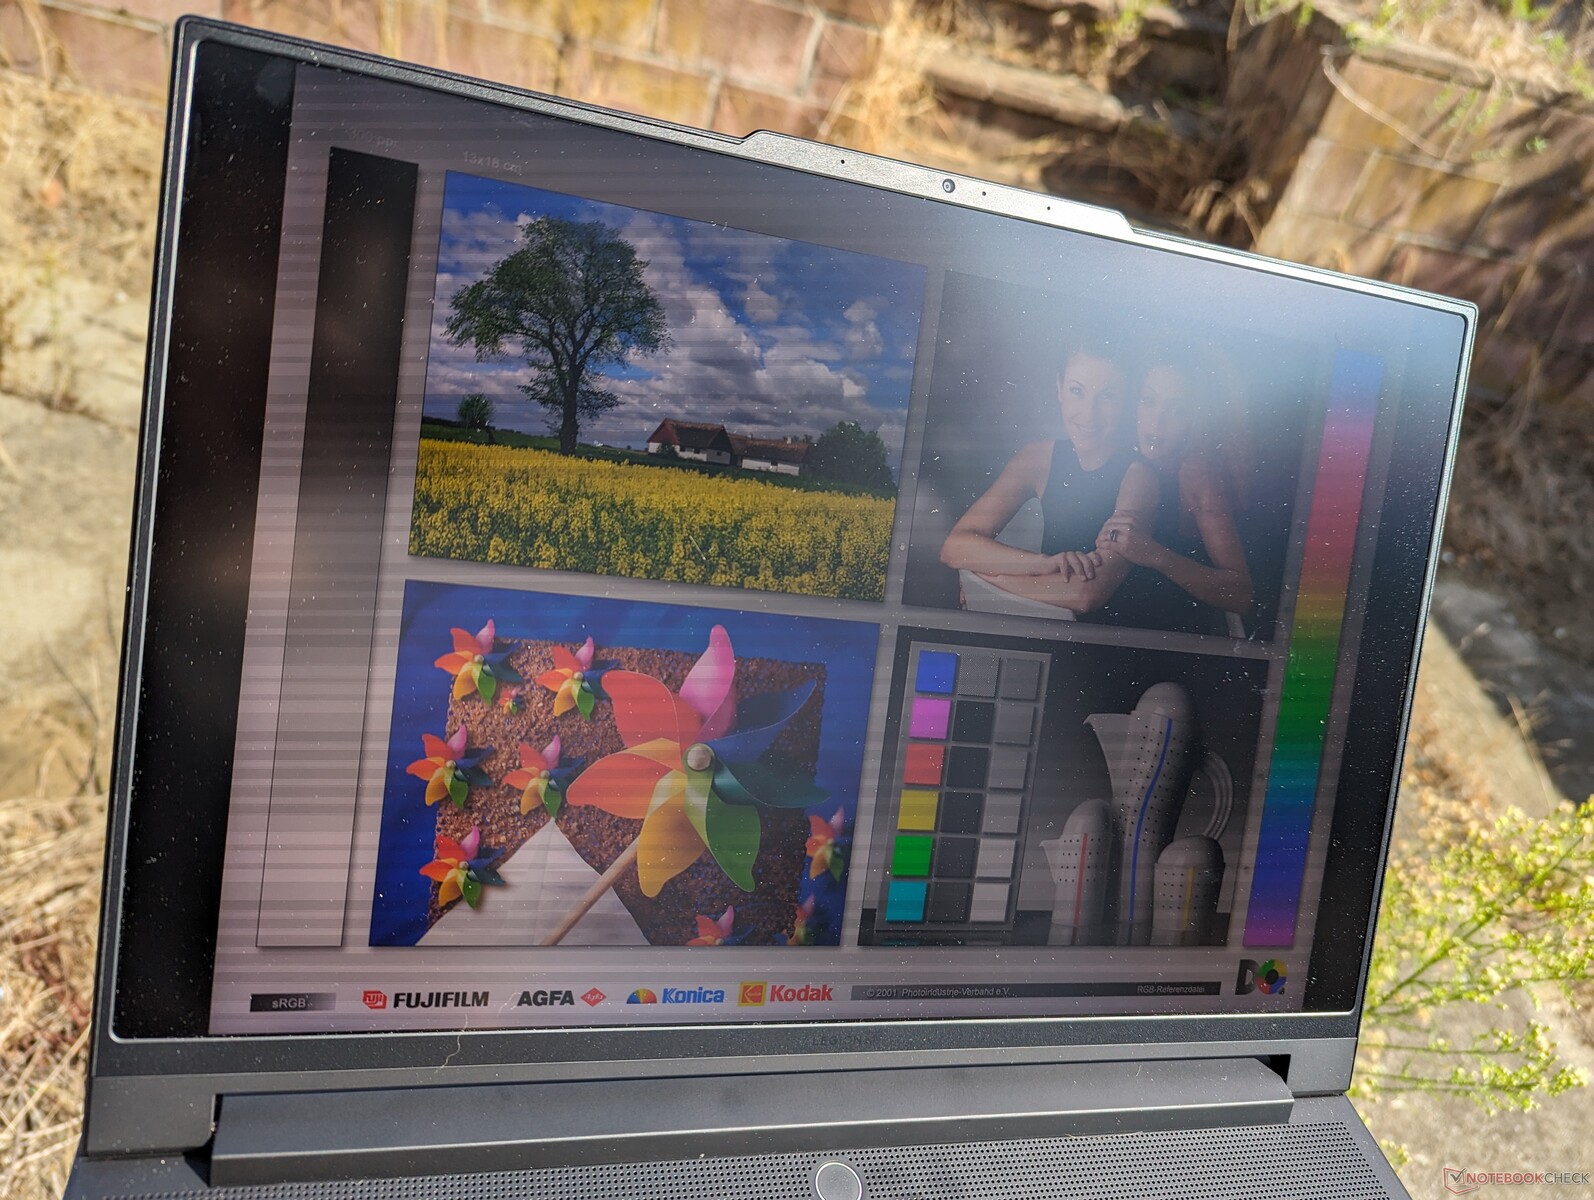
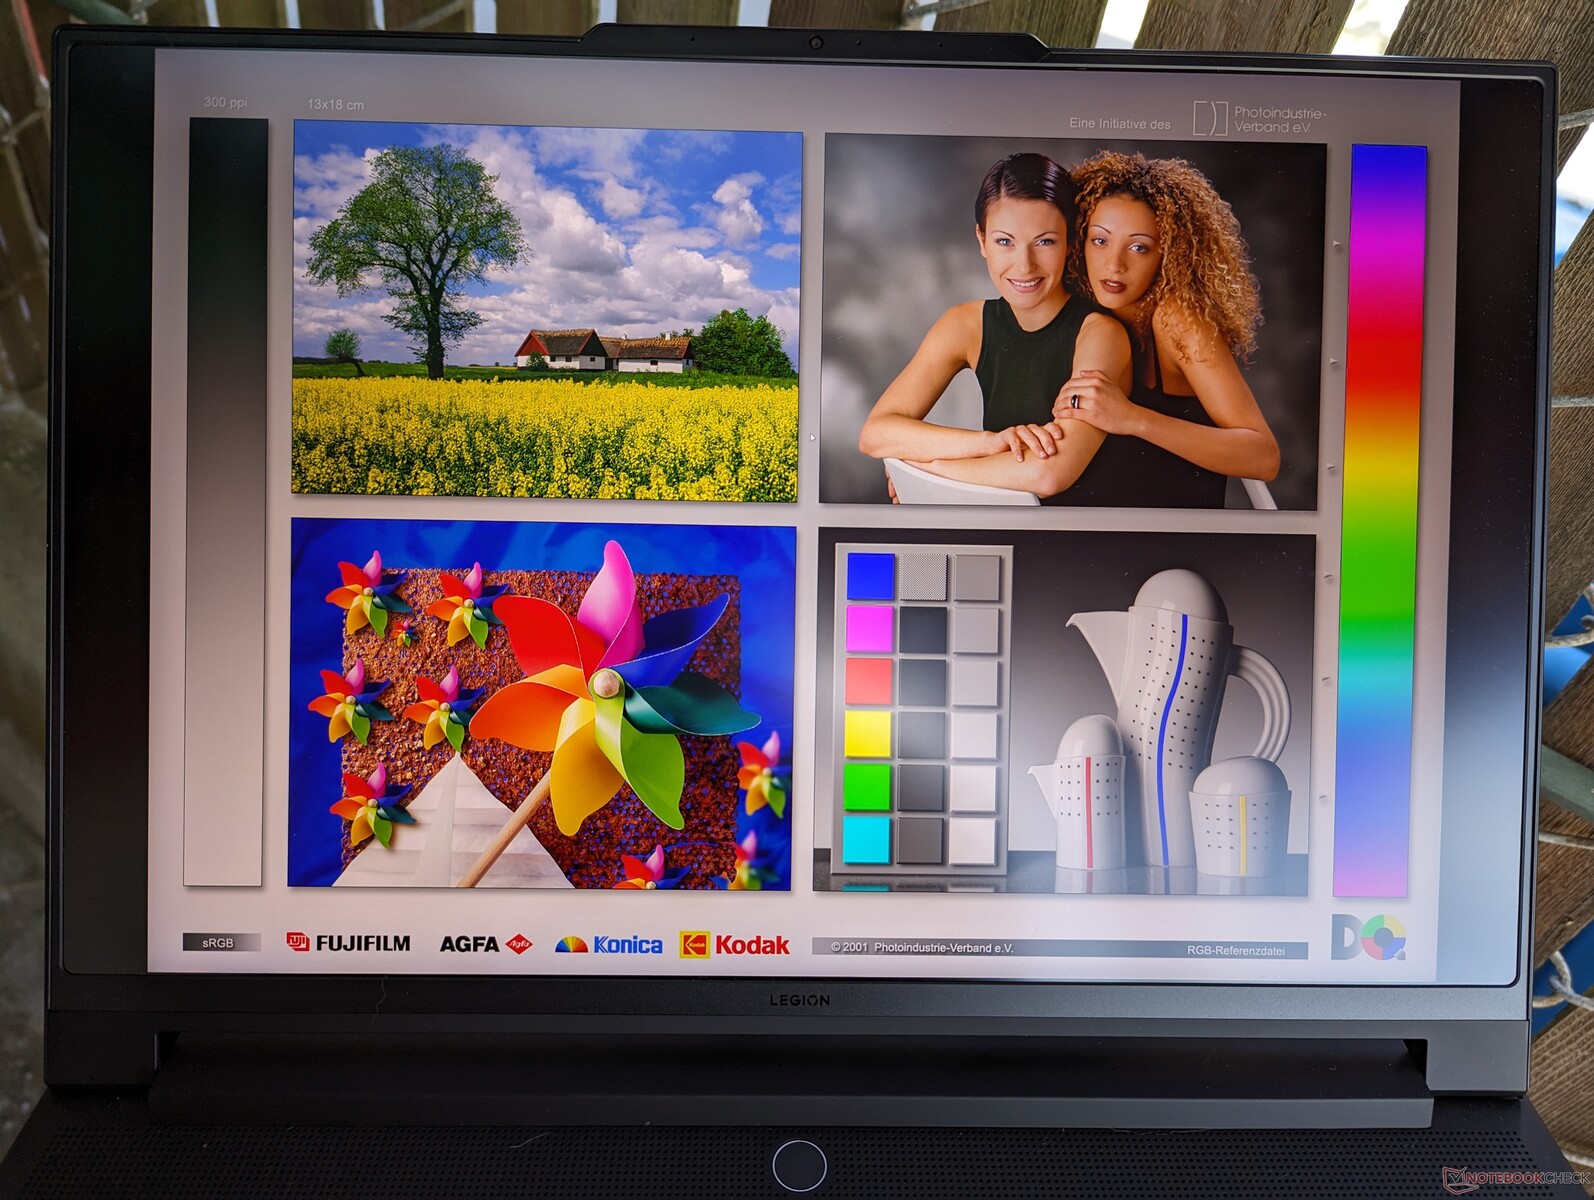
Display - A principal atração
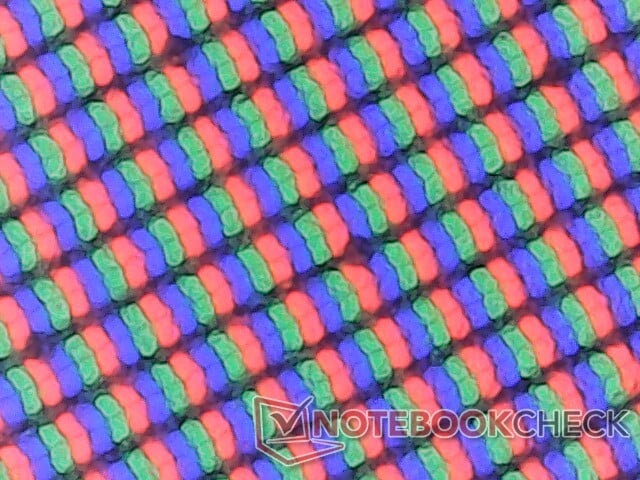
Em comparação com as telas IPS e OLED tradicionais, a mini-LED oferece níveis de preto superiores aos da primeira e níveis de brilho máximo ainda mais altos do que os da segunda para um suporte HDR melhor em geral. Nesse caso, a Lenovo anuncia um brilho máximo de 1200 nits para suporte a HDR1000, o que é raro de se ver em telas de laptop. Conseguimos confirmar um brilho máximo no mundo real de 1.025 nits quando o modo HDR está ativado ou 675 nits ao exibir conteúdo SDR. Em comparação, a maioria dos painéis IPS e OLED em laptops para jogos geralmente varia entre 300 e 500 nits. Portanto, o senhor vai querer reproduzir o conteúdo no modo HDR sempre que possível para explorar melhor os benefícios do mini-LED.
Além dos altíssimos níveis de brilho, o painel também apresenta G-Sync, cores DCI-P3 completas, taxa de atualização rápida de 165 Hz e tempos de resposta rápidos para ser adequado tanto para a criação de conteúdo quanto para jogos.
| |||||||||||||||||||||||||
iluminação: 96 %
iluminação com acumulador: 674.9 cd/m²
Contraste: 16873:1 (Preto: 0.04 cd/m²)
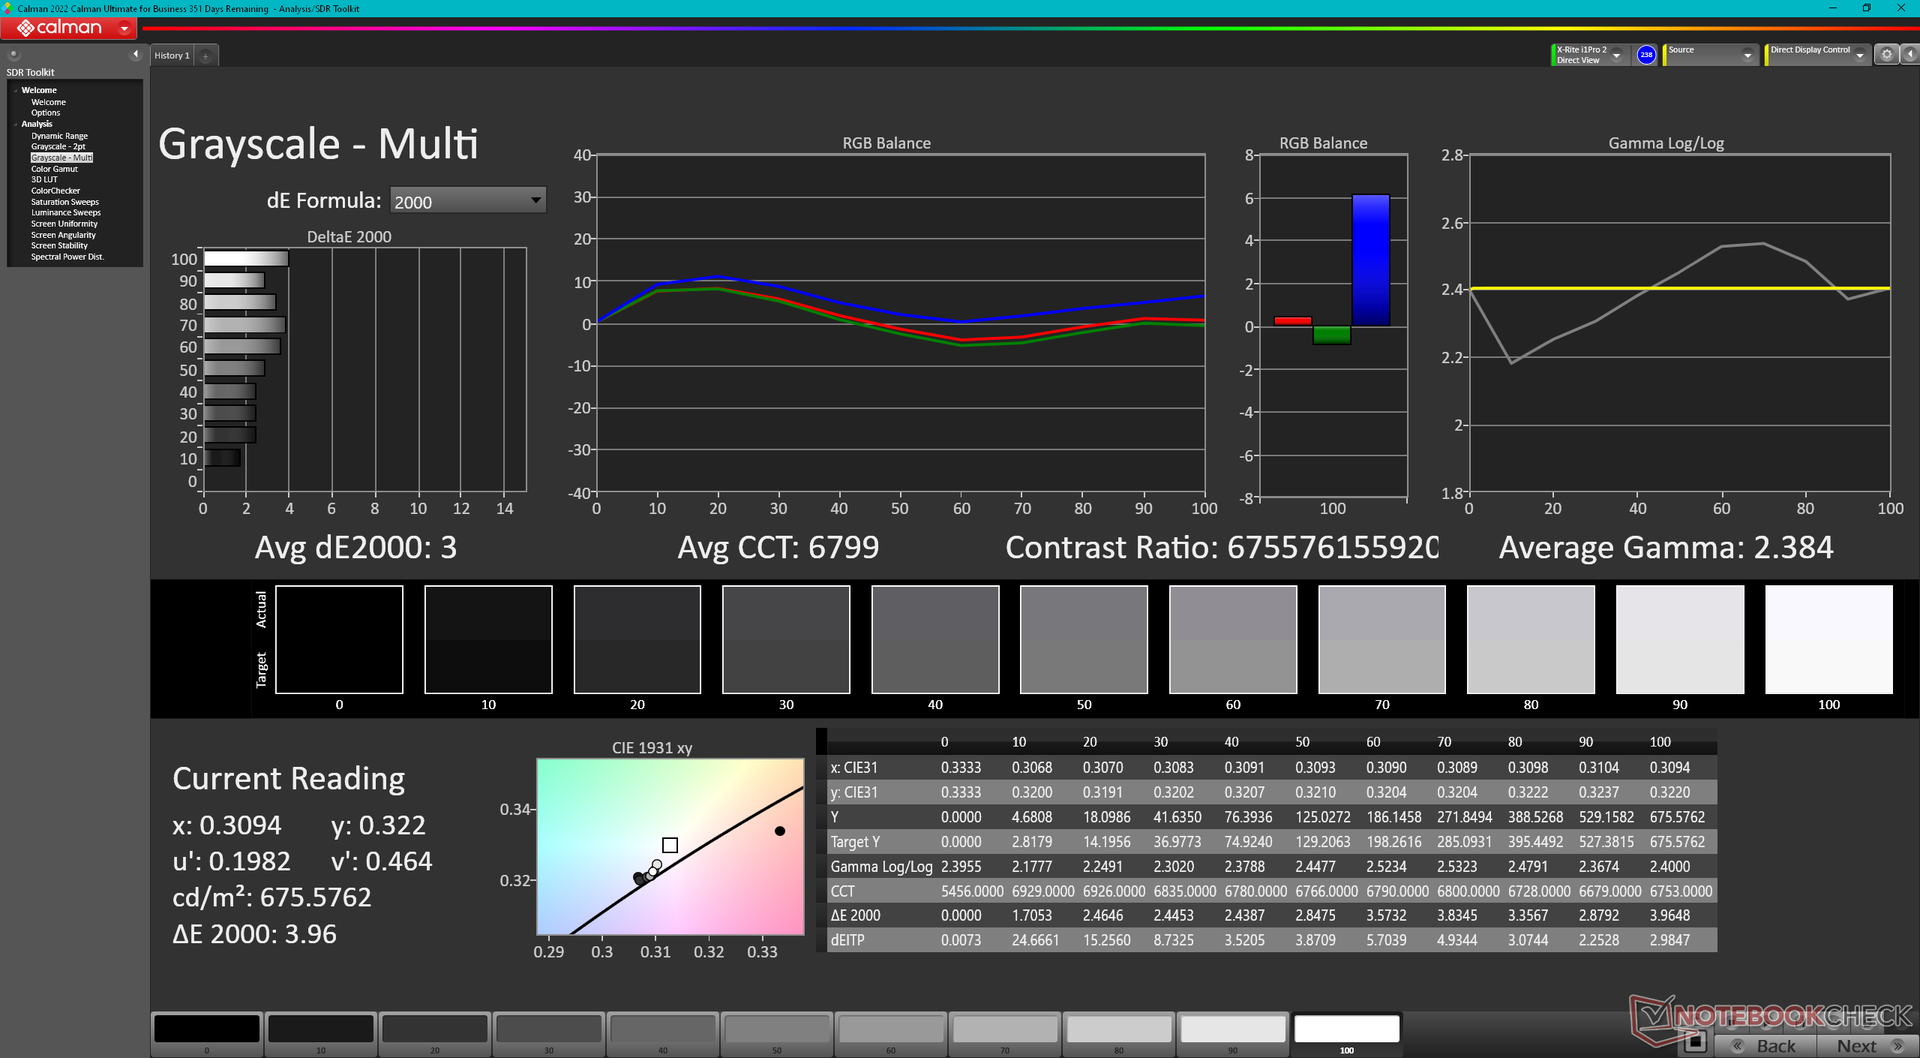
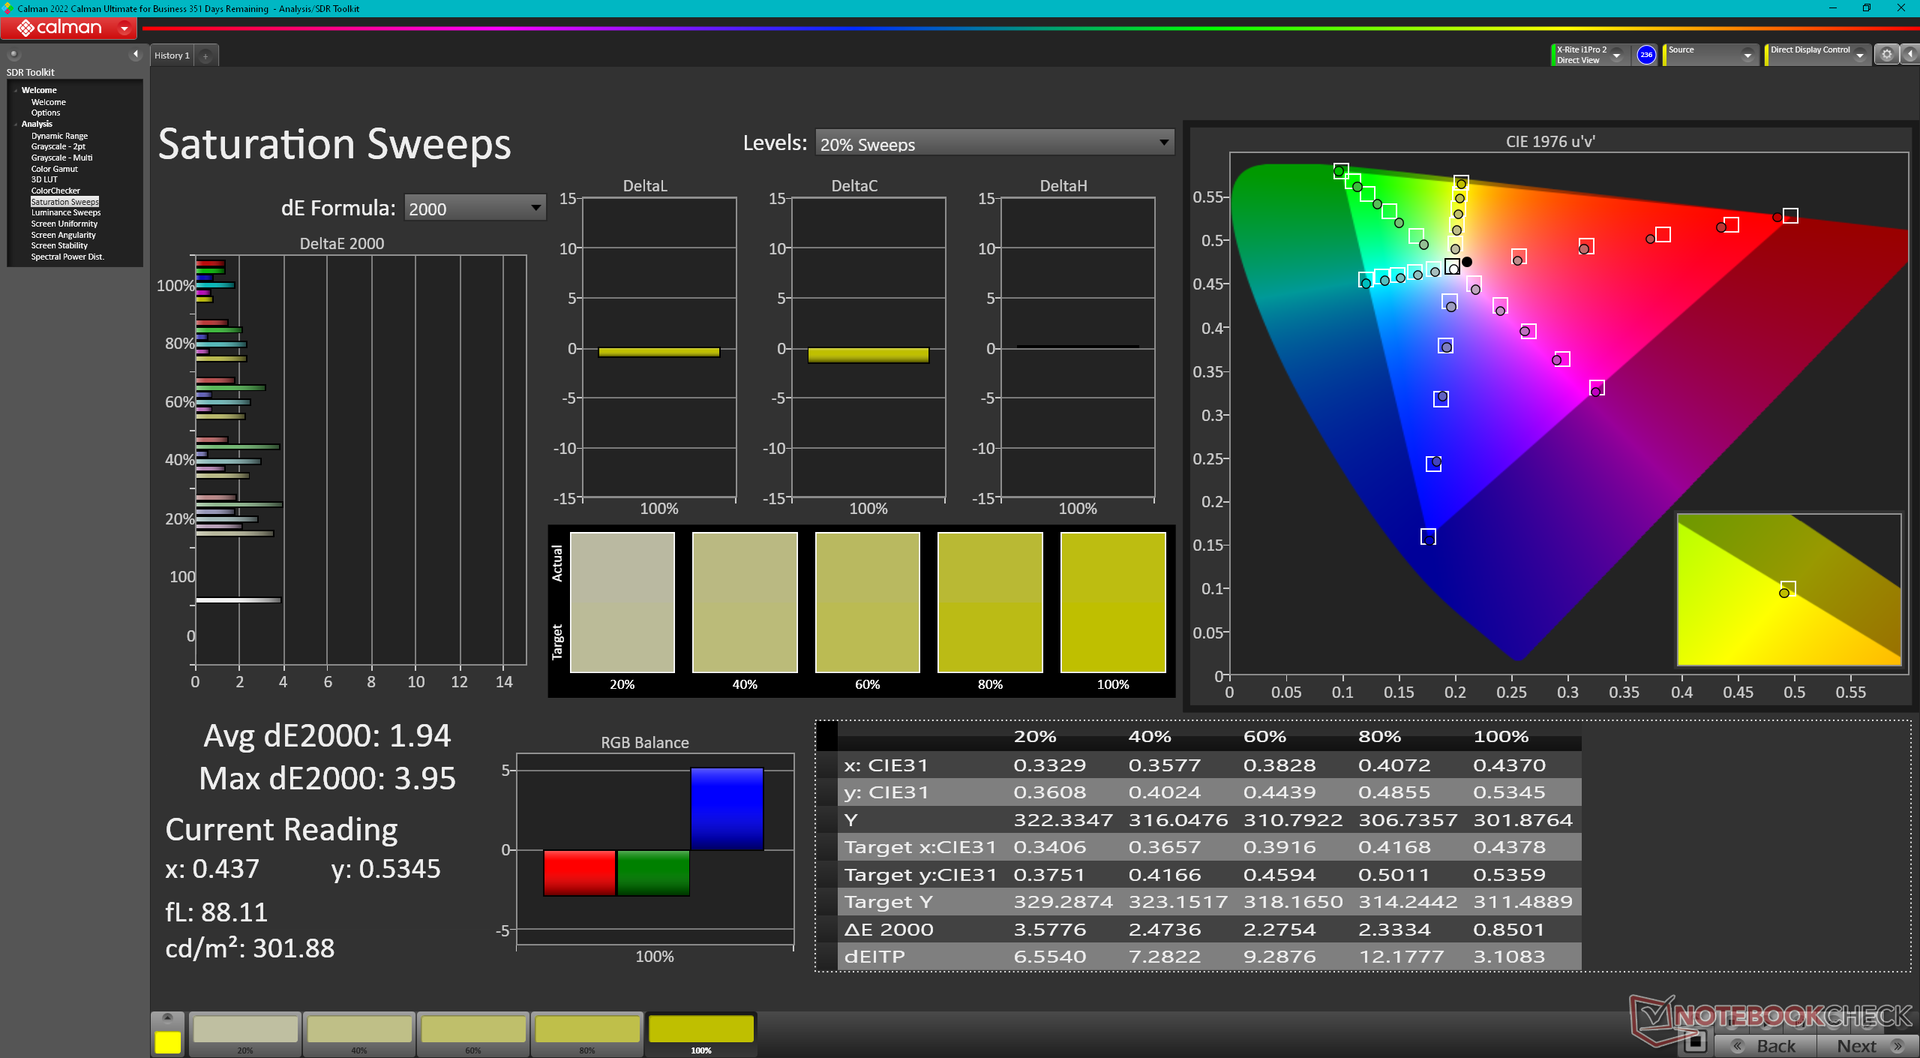
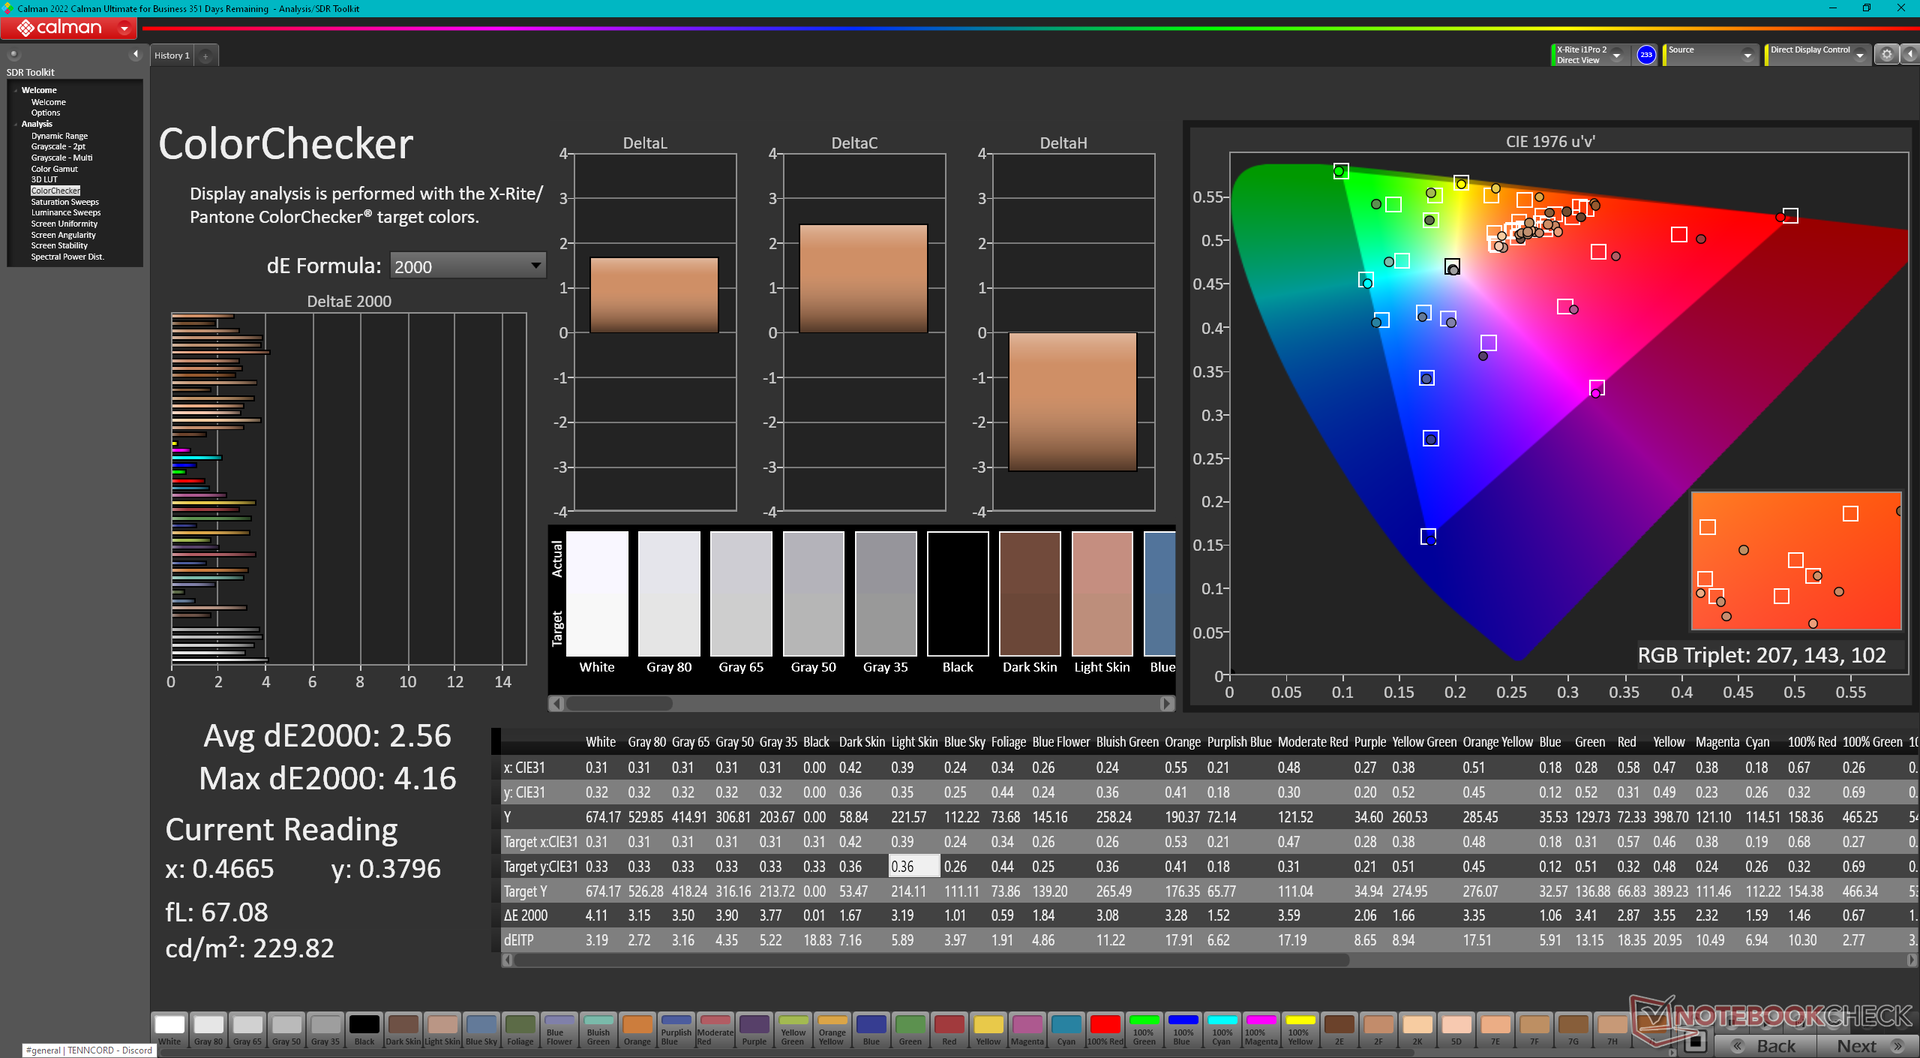
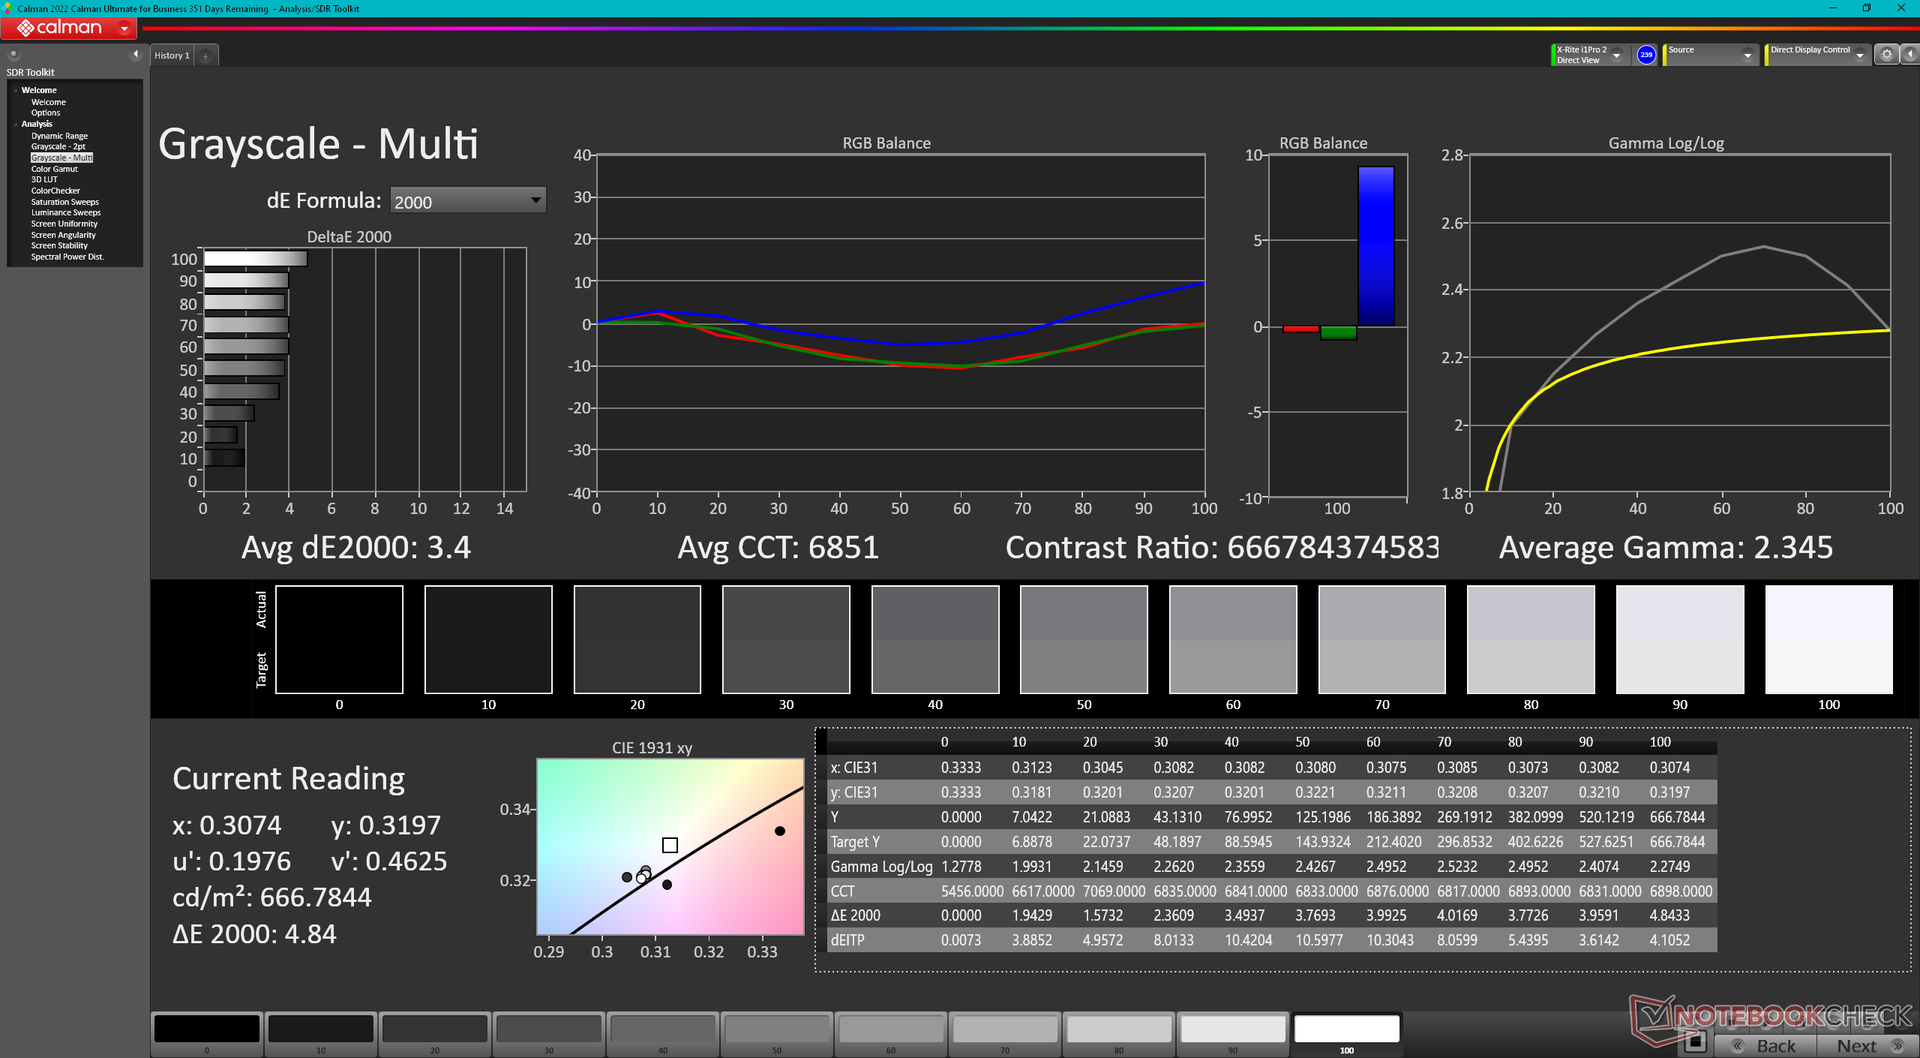
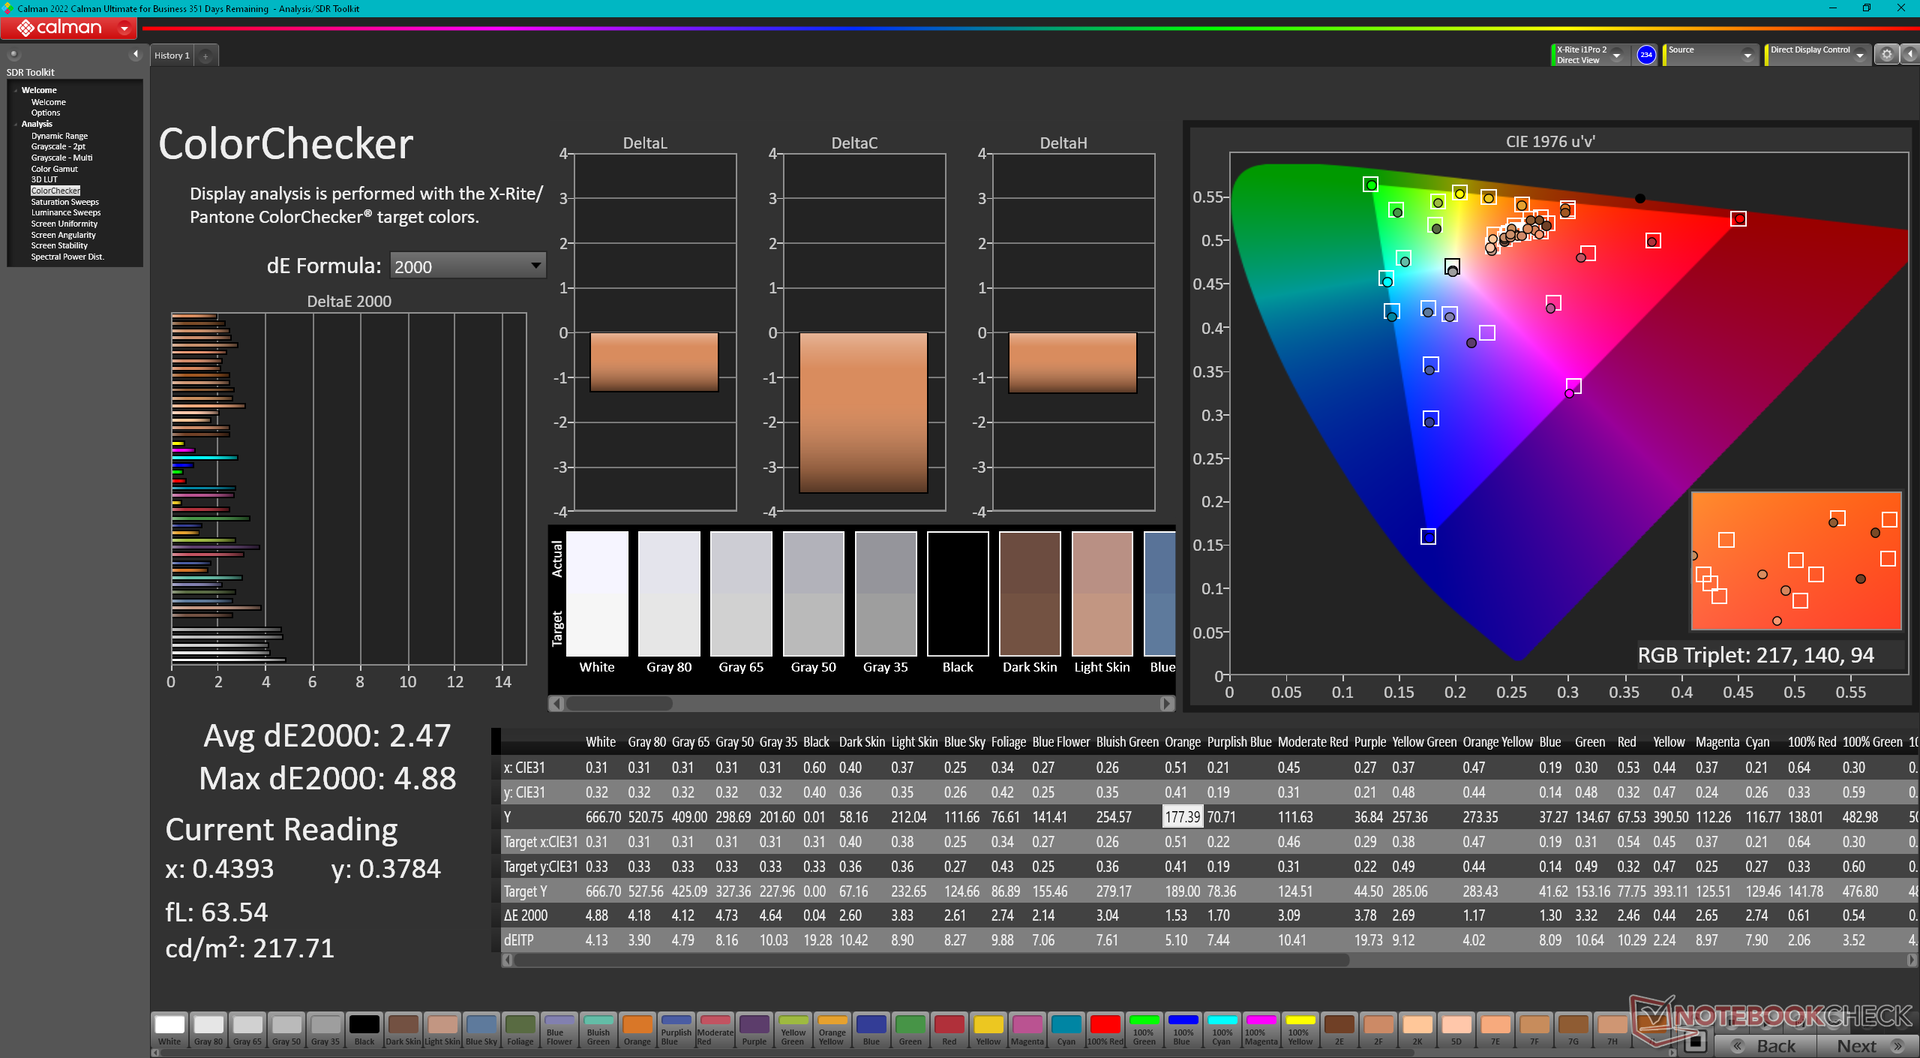
ΔE ColorChecker Calman: 2.56 | ∀{0.5-29.43 Ø4.71}
calibrated: 2.47
ΔE Greyscale Calman: 3 | ∀{0.09-98 Ø4.96}
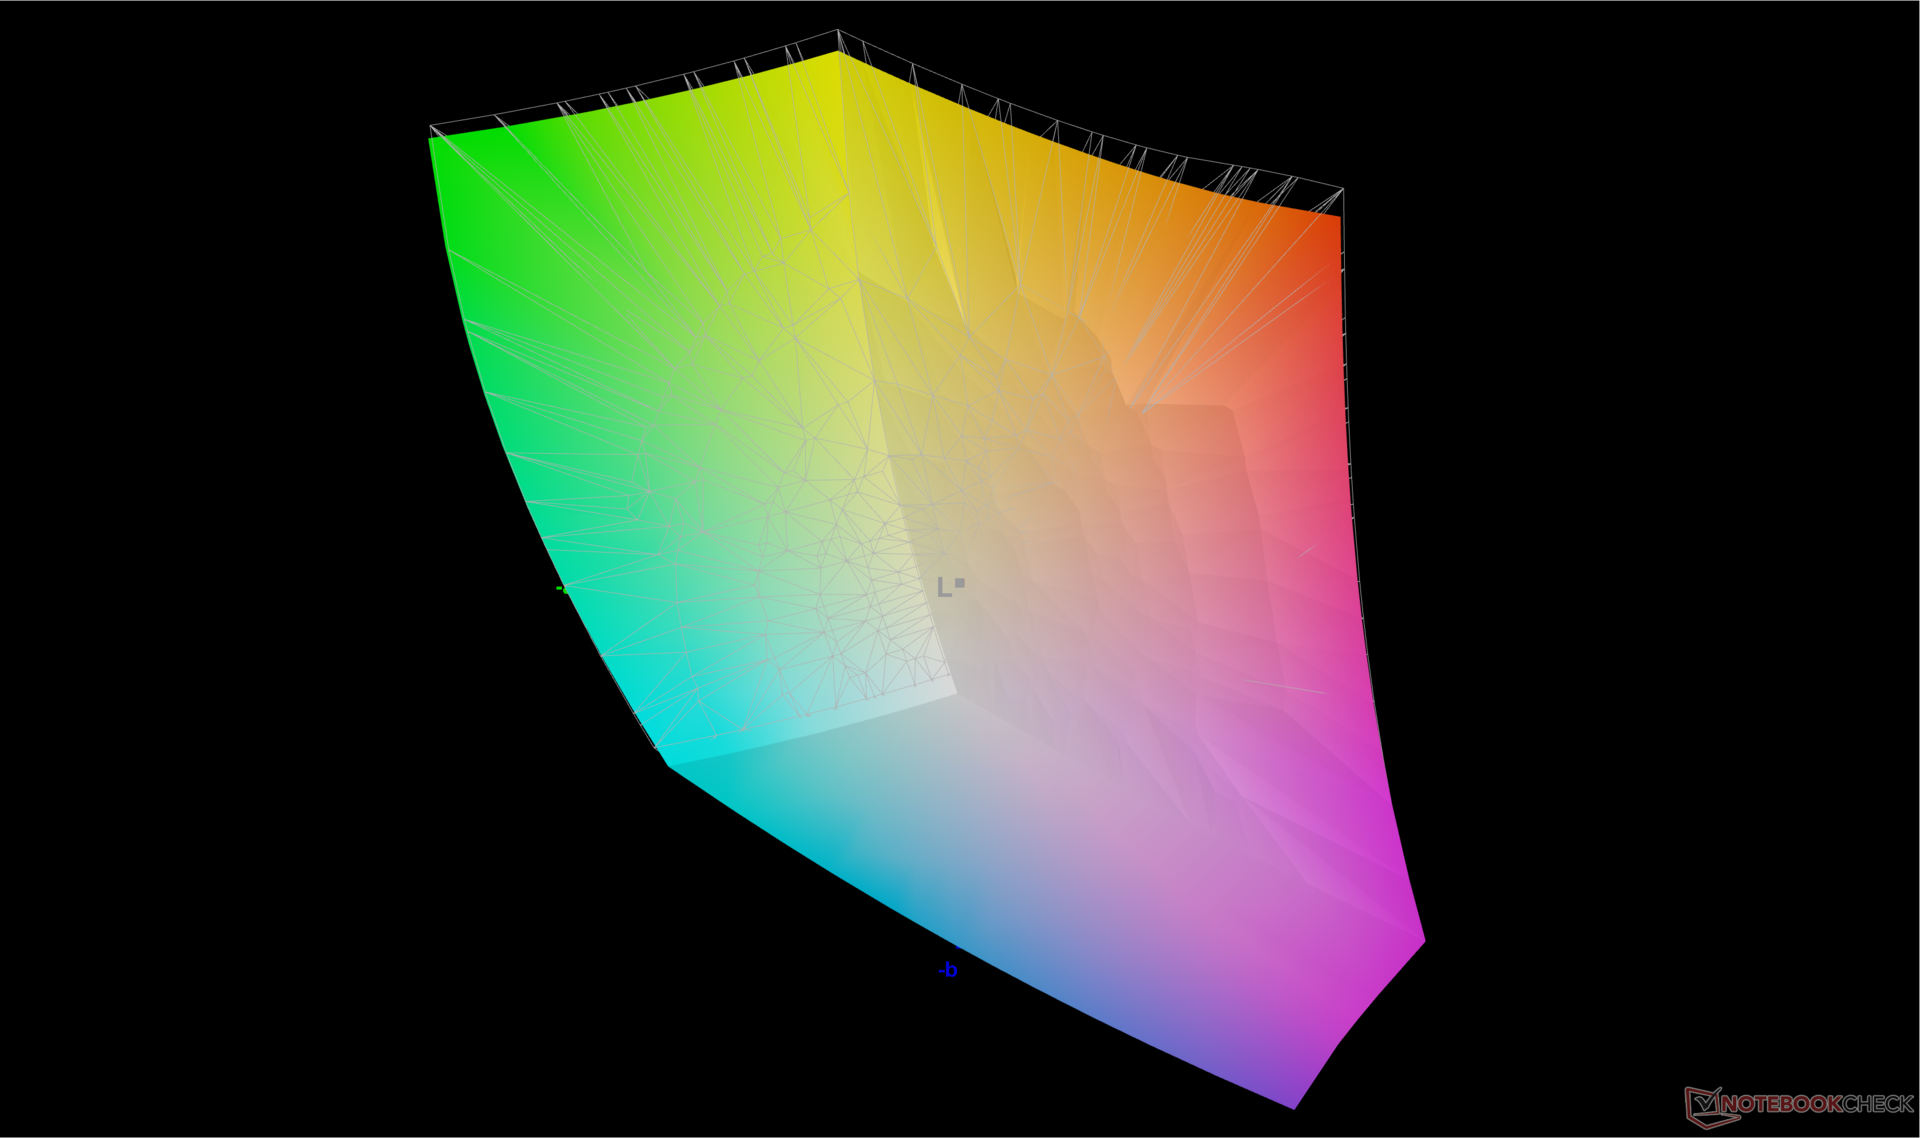
87% AdobeRGB 1998 (Argyll 3D)
99.9% sRGB (Argyll 3D)
97.2% Display P3 (Argyll 3D)
Gamma: 2.38
CCT: 6799 K
| Lenovo Legion 9 16IRX8 CSOT T3 MNG007ZA2-2, Mini-LED, 3200x2000, 16" | Lenovo Legion Slim 5 16APH8 BOE NJ NE160QDM-NYC, IPS, 2560x1600, 16" | Razer Blade 16 Early 2023 RTX 4090 AUO B160ZAN01.U, mini-LED, 3840x2400, 16" | Asus ROG Strix G16 G614JZ TL160ADMP03-0, IPS, 2560x1600, 16" | HP Omen Transcend 16 AUOA3A6, Mini-LED, 2560x1600, 16" | Alienware x16 R1 BOE NE16NZ4, IPS, 2560x1600, 16" | |
|---|---|---|---|---|---|---|
| Display | -16% | 2% | -1% | 1% | 1% | |
| Display P3 Coverage (%) | 97.2 | 69.3 -29% | 99.9 3% | 97 0% | 99.2 2% | 99.2 2% |
| sRGB Coverage (%) | 99.9 | 100 0% | 100 0% | 99.9 0% | 100 0% | 100 0% |
| AdobeRGB 1998 Coverage (%) | 87 | 70 -20% | 90.9 4% | 84.9 -2% | 87.6 1% | 88.6 2% |
| Response Times | 27% | -206% | 53% | -121% | 37% | |
| Response Time Grey 50% / Grey 80% * (ms) | 13.3 ? | 10.7 ? 20% | 10.2 ? 23% | 5.1 ? 62% | 26.4 ? -98% | 5.1 ? 62% |
| Response Time Black / White * (ms) | 11.6 ? | 7.8 ? 33% | 62.04 ? -435% | 6.6 ? 43% | 28.2 ? -143% | 10.3 ? 11% |
| PWM Frequency (Hz) | 4742 | 2420 ? | 3506 ? | |||
| Screen | -109% | 62% | -111% | -26% | -73% | |
| Brightness middle (cd/m²) | 674.9 | 371.6 -45% | 730 8% | 470 -30% | 791.1 17% | 302.2 -55% |
| Brightness (cd/m²) | 682 | 343 -50% | 729 7% | 459 -33% | 800 17% | 285 -58% |
| Brightness Distribution (%) | 96 | 84 -12% | 94 -2% | 93 -3% | 95 -1% | 89 -7% |
| Black Level * (cd/m²) | 0.04 | 0.44 -1000% | 0.0045 89% | 0.42 -950% | 0.04 -0% | 0.26 -550% |
| Contrast (:1) | 16873 | 845 -95% | 162222 861% | 1119 -93% | 19778 17% | 1162 -93% |
| Colorchecker dE 2000 * | 2.56 | 1.52 41% | 5.65 -121% | 1.86 27% | 4.37 -71% | 1.63 36% |
| Colorchecker dE 2000 max. * | 4.16 | 2.68 36% | 10.11 -143% | 3.87 7% | 10.39 -150% | 4.13 1% |
| Colorchecker dE 2000 calibrated * | 2.47 | 0.33 87% | 1.85 25% | 0.93 62% | 1.04 58% | 1.17 53% |
| Greyscale dE 2000 * | 3 | 1.2 60% | 8.1 -170% | 2.7 10% | 6.5 -117% | 2.5 17% |
| Gamma | 2.38 92% | 2.1 105% | 1.98 111% | 2.246 98% | 2.28 96% | 2.23 99% |
| CCT | 6799 96% | 6503 100% | 5874 111% | 6711 97% | 6000 108% | 6590 99% |
| Média Total (Programa/Configurações) | -33% /
-70% | -47% /
11% | -20% /
-64% | -49% /
-33% | -12% /
-41% |
* ... menor é melhor
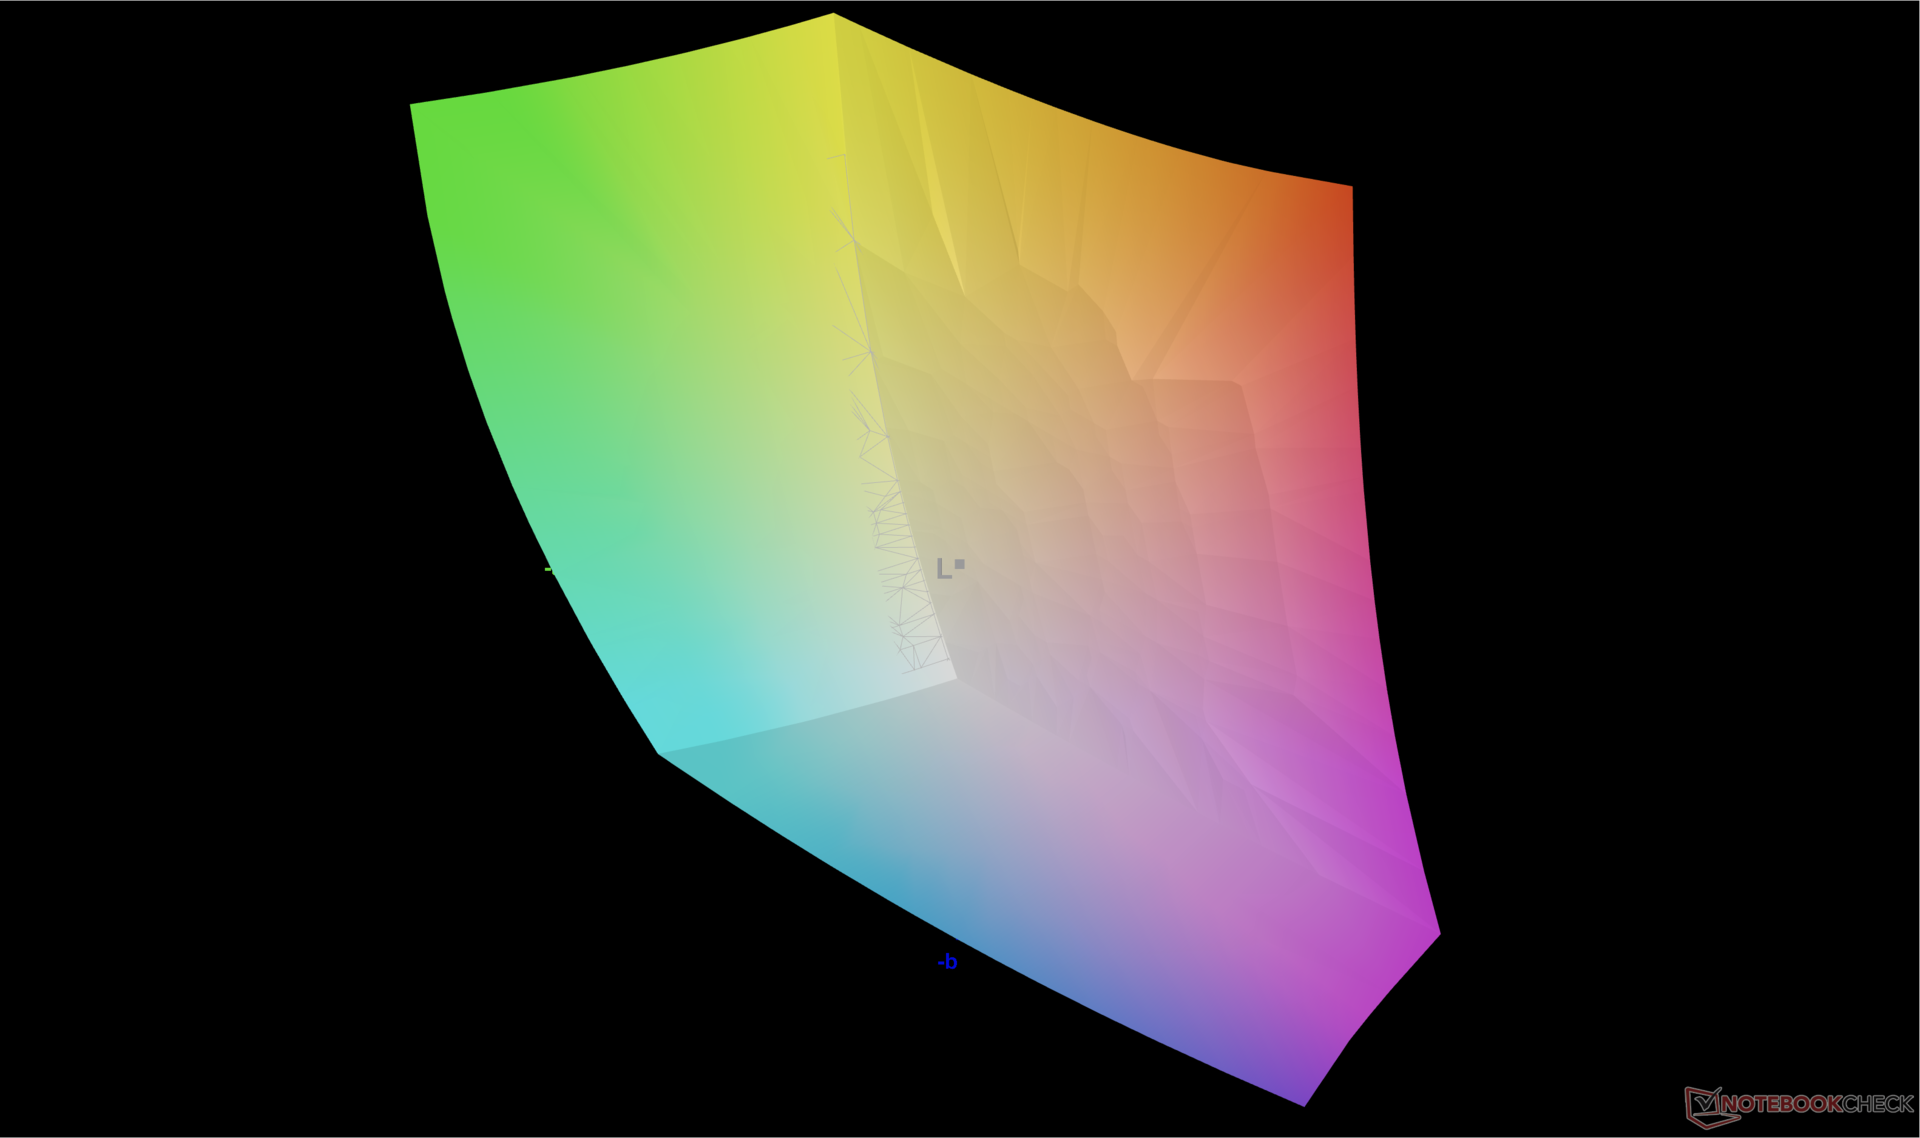
A tela vem bem calibrada de fábrica em relação ao padrão P3, com valores DeltaE médios de escala de cinza e cor de apenas 3 e 2,56, respectivamente.
Exibir tempos de resposta
| ↔ Tempo de resposta preto para branco | ||
|---|---|---|
| 11.6 ms ... ascensão ↗ e queda ↘ combinadas | ↗ 5.1 ms ascensão | 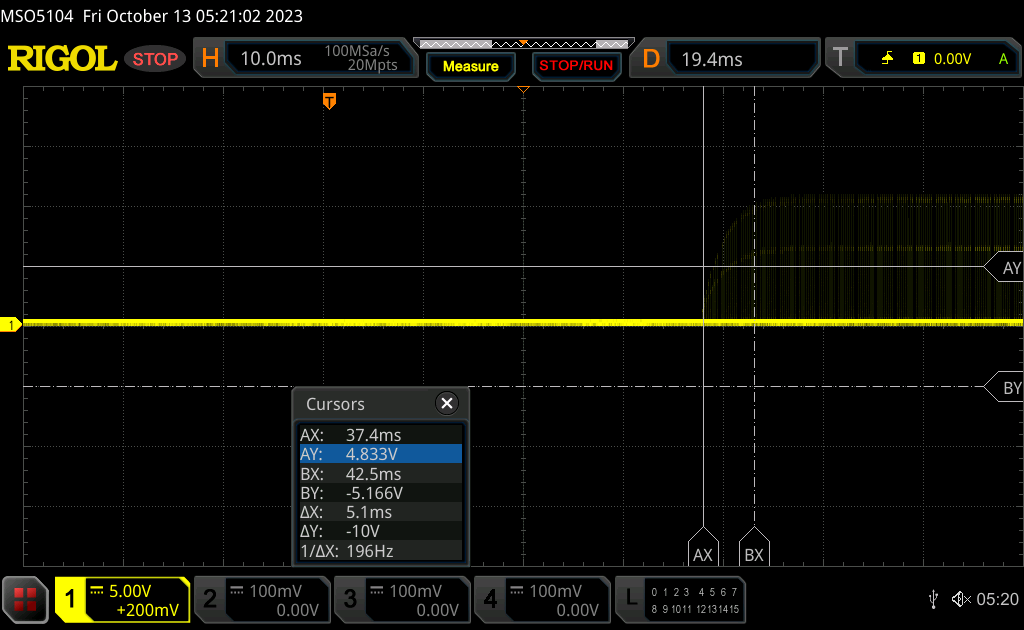 |
| ↘ 6.5 ms queda | ||
| A tela mostra boas taxas de resposta em nossos testes, mas pode ser muito lenta para jogadores competitivos. Em comparação, todos os dispositivos testados variam de 0.1 (mínimo) a 240 (máximo) ms. » 31 % de todos os dispositivos são melhores. Isso significa que o tempo de resposta medido é melhor que a média de todos os dispositivos testados (19.8 ms). | ||
| ↔ Tempo de resposta 50% cinza a 80% cinza | ||
| 13.3 ms ... ascensão ↗ e queda ↘ combinadas | ↗ 5.7 ms ascensão | 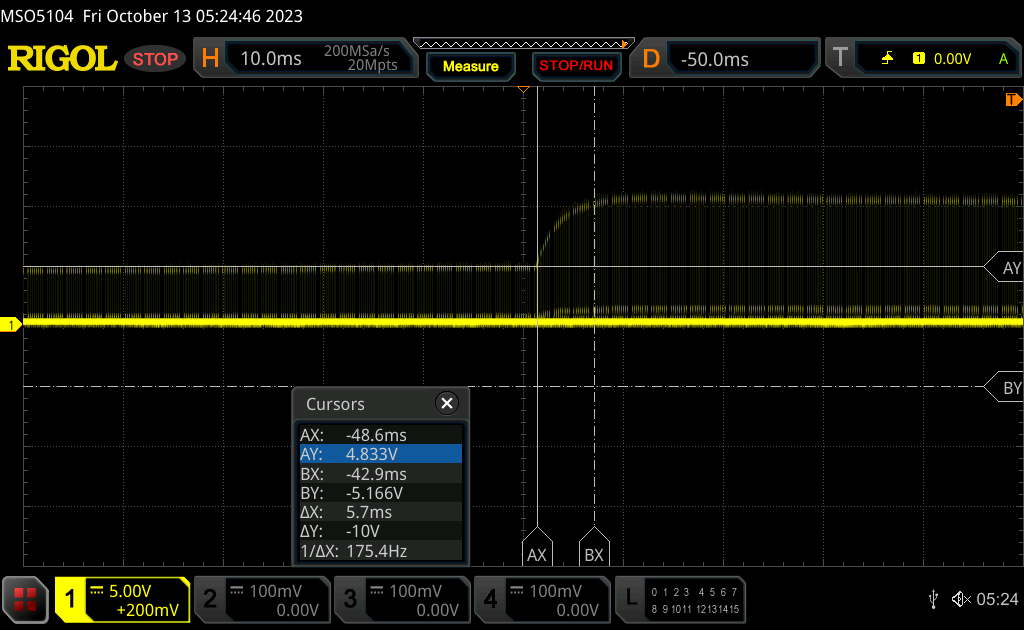 |
| ↘ 7.6 ms queda | ||
| A tela mostra boas taxas de resposta em nossos testes, mas pode ser muito lenta para jogadores competitivos. Em comparação, todos os dispositivos testados variam de 0.165 (mínimo) a 636 (máximo) ms. » 27 % de todos os dispositivos são melhores. Isso significa que o tempo de resposta medido é melhor que a média de todos os dispositivos testados (31 ms). | ||
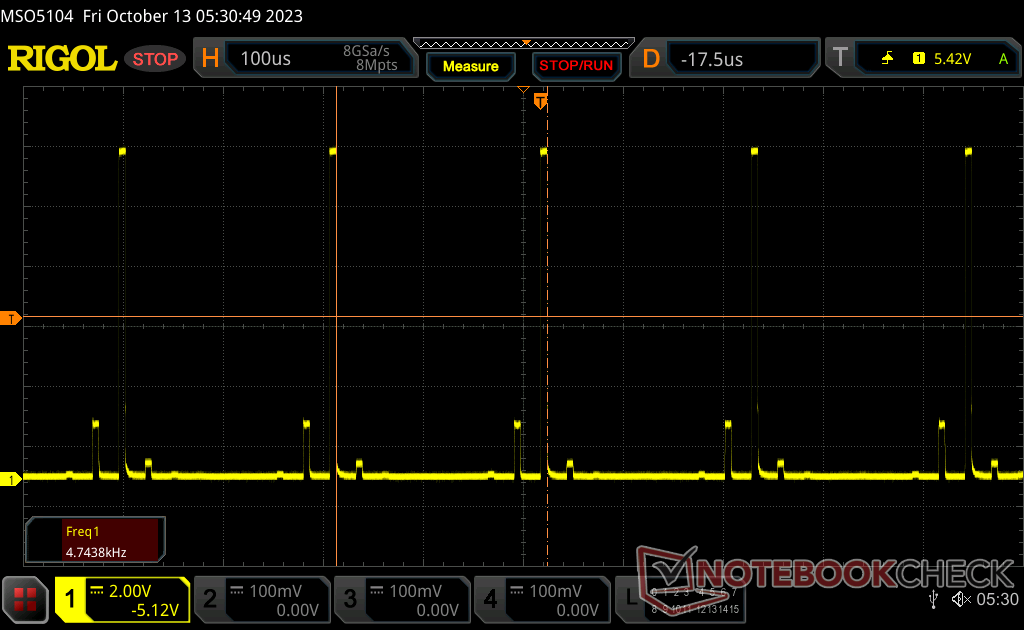
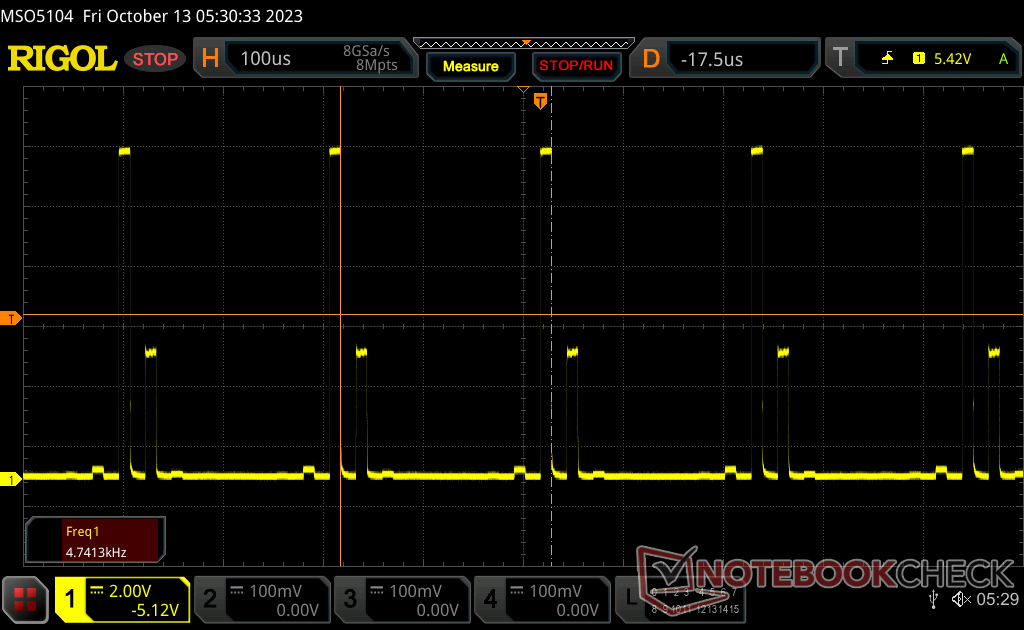
Cintilação da tela / PWM (modulação por largura de pulso)
| Tela tremeluzindo/PWM detectado | 4742 Hz | 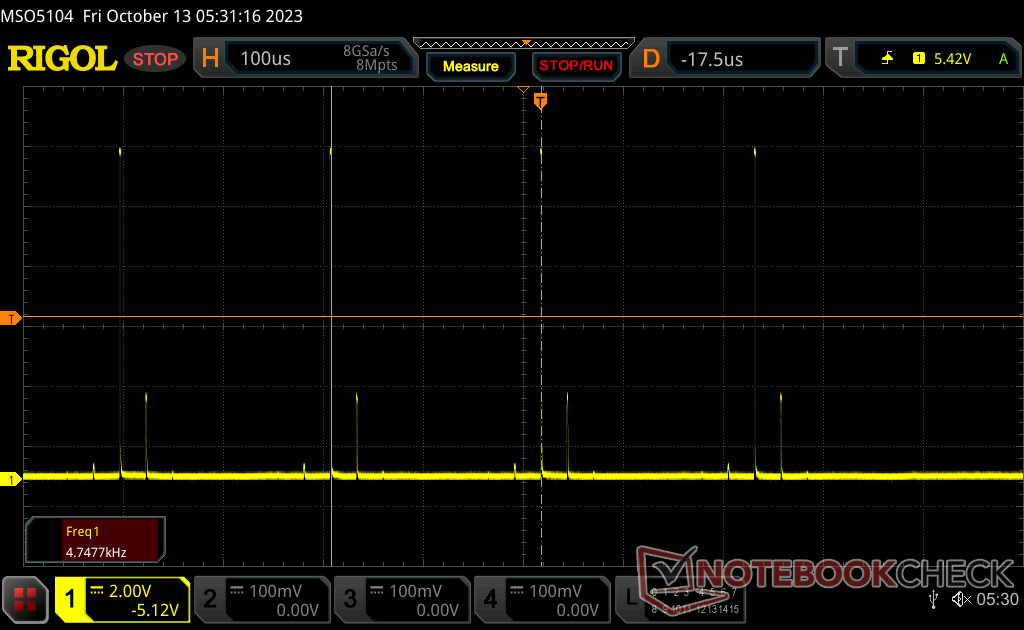 | |
A luz de fundo da tela pisca em 4742 Hz (pior caso, por exemplo, utilizando PWM) . A frequência de 4742 Hz é bastante alta, então a maioria dos usuários sensíveis ao PWM não deve notar nenhuma oscilação. [pwm_comparison] Em comparação: 52 % de todos os dispositivos testados não usam PWM para escurecer a tela. Se PWM foi detectado, uma média de 7754 (mínimo: 5 - máximo: 343500) Hz foi medida. | |||
A oscilação está presente em todos os níveis de brilho em uma frequência constante de 4752 Hz.


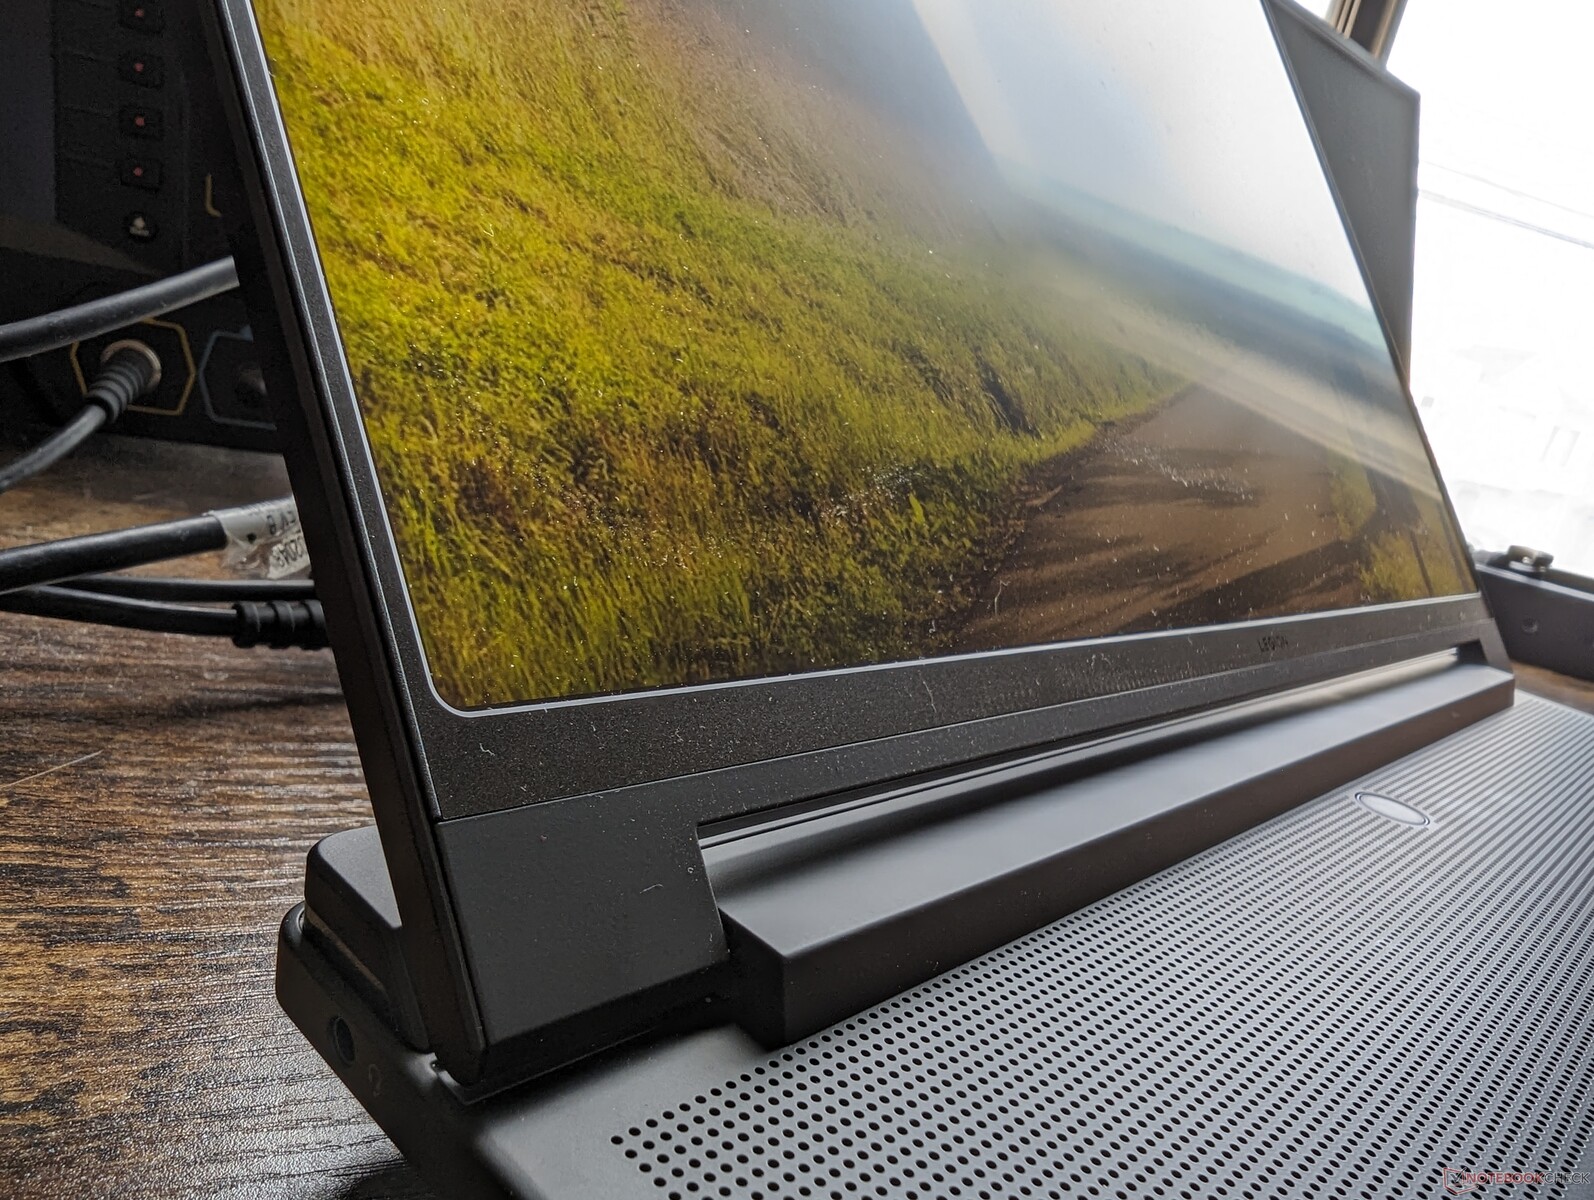
A visibilidade em ambientes externos é excelente para um laptop para jogos devido ao já mencionado alto brilho máximo do mini-LED. No entanto, o peso pesado e a curta duração da bateria do sistema ainda limitam o laptop a cenários predominantemente internos.
Desempenho - Não é permitido o uso de Core i7
Condições de teste
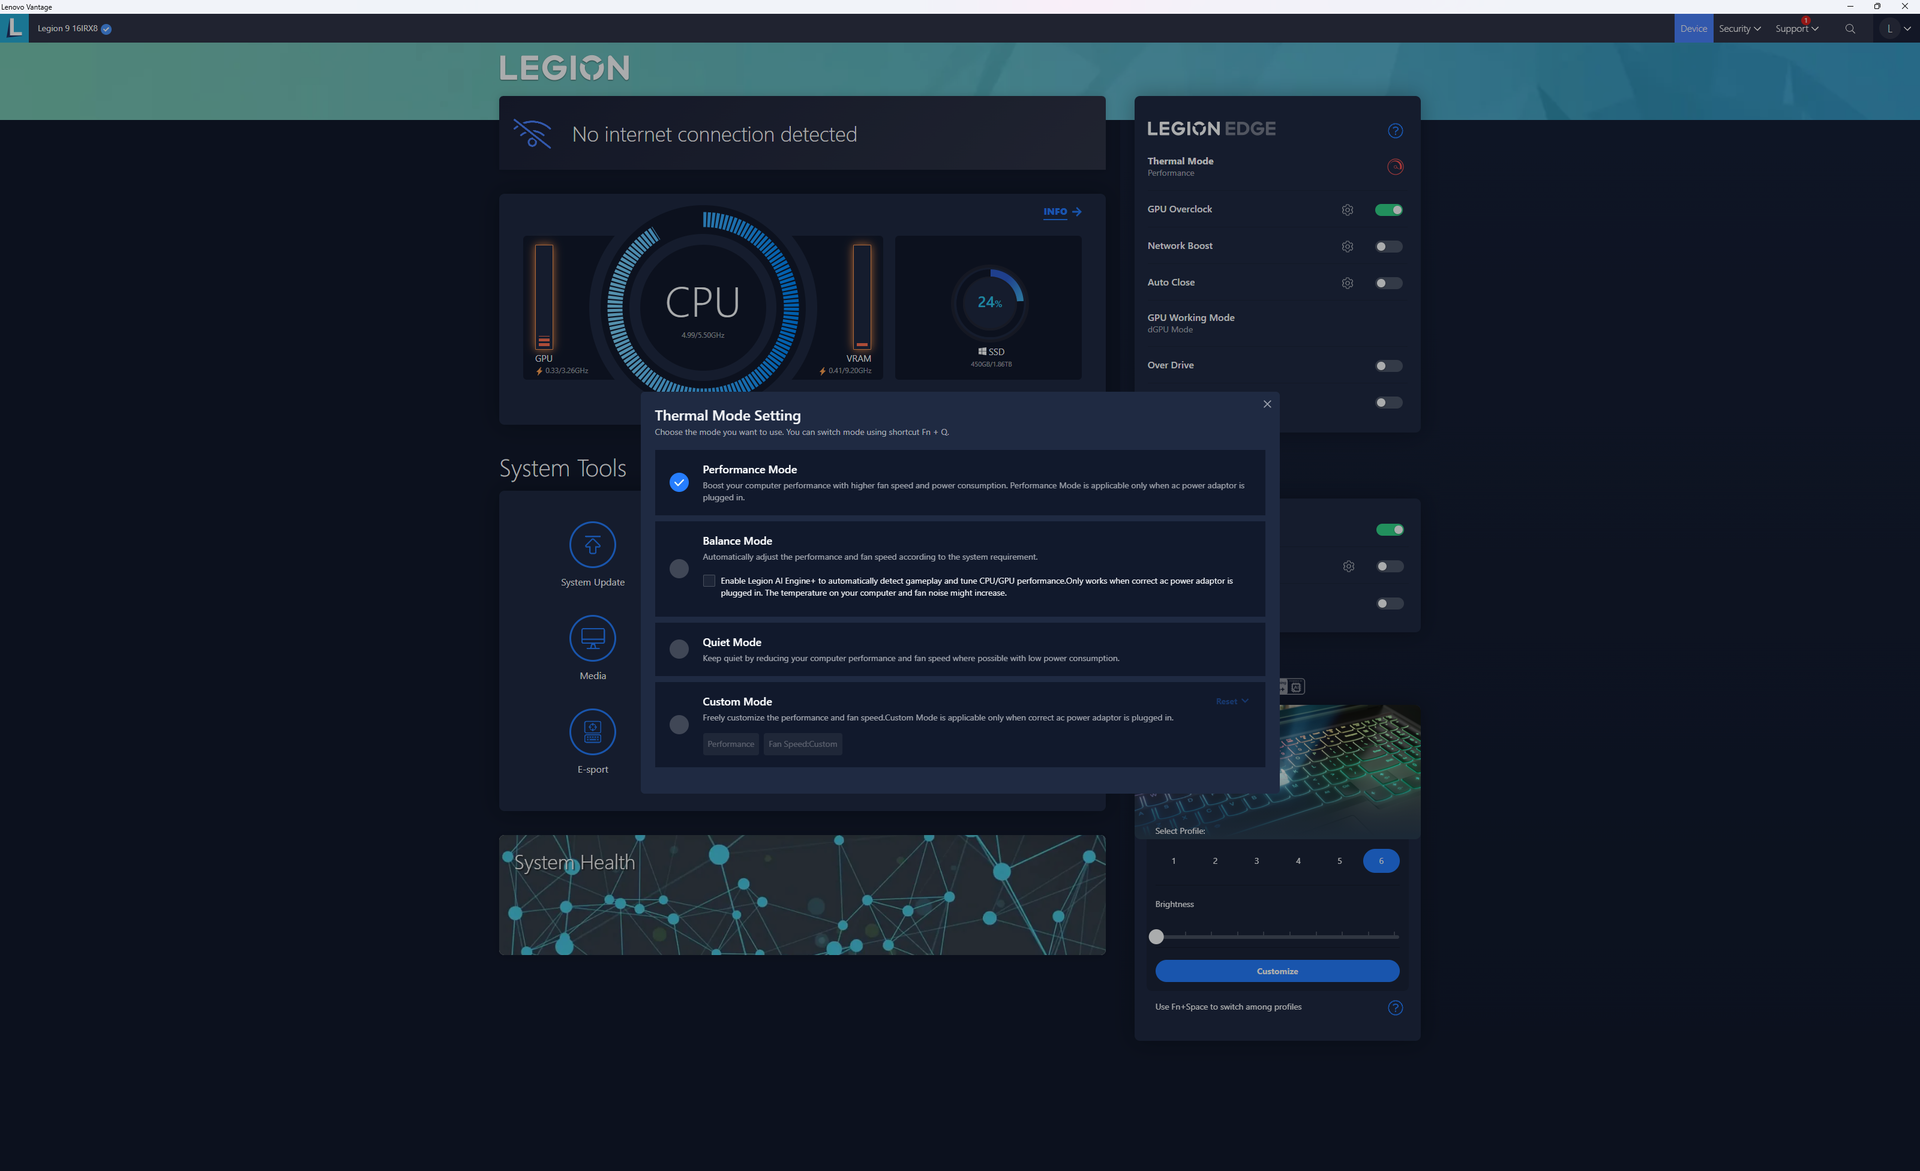
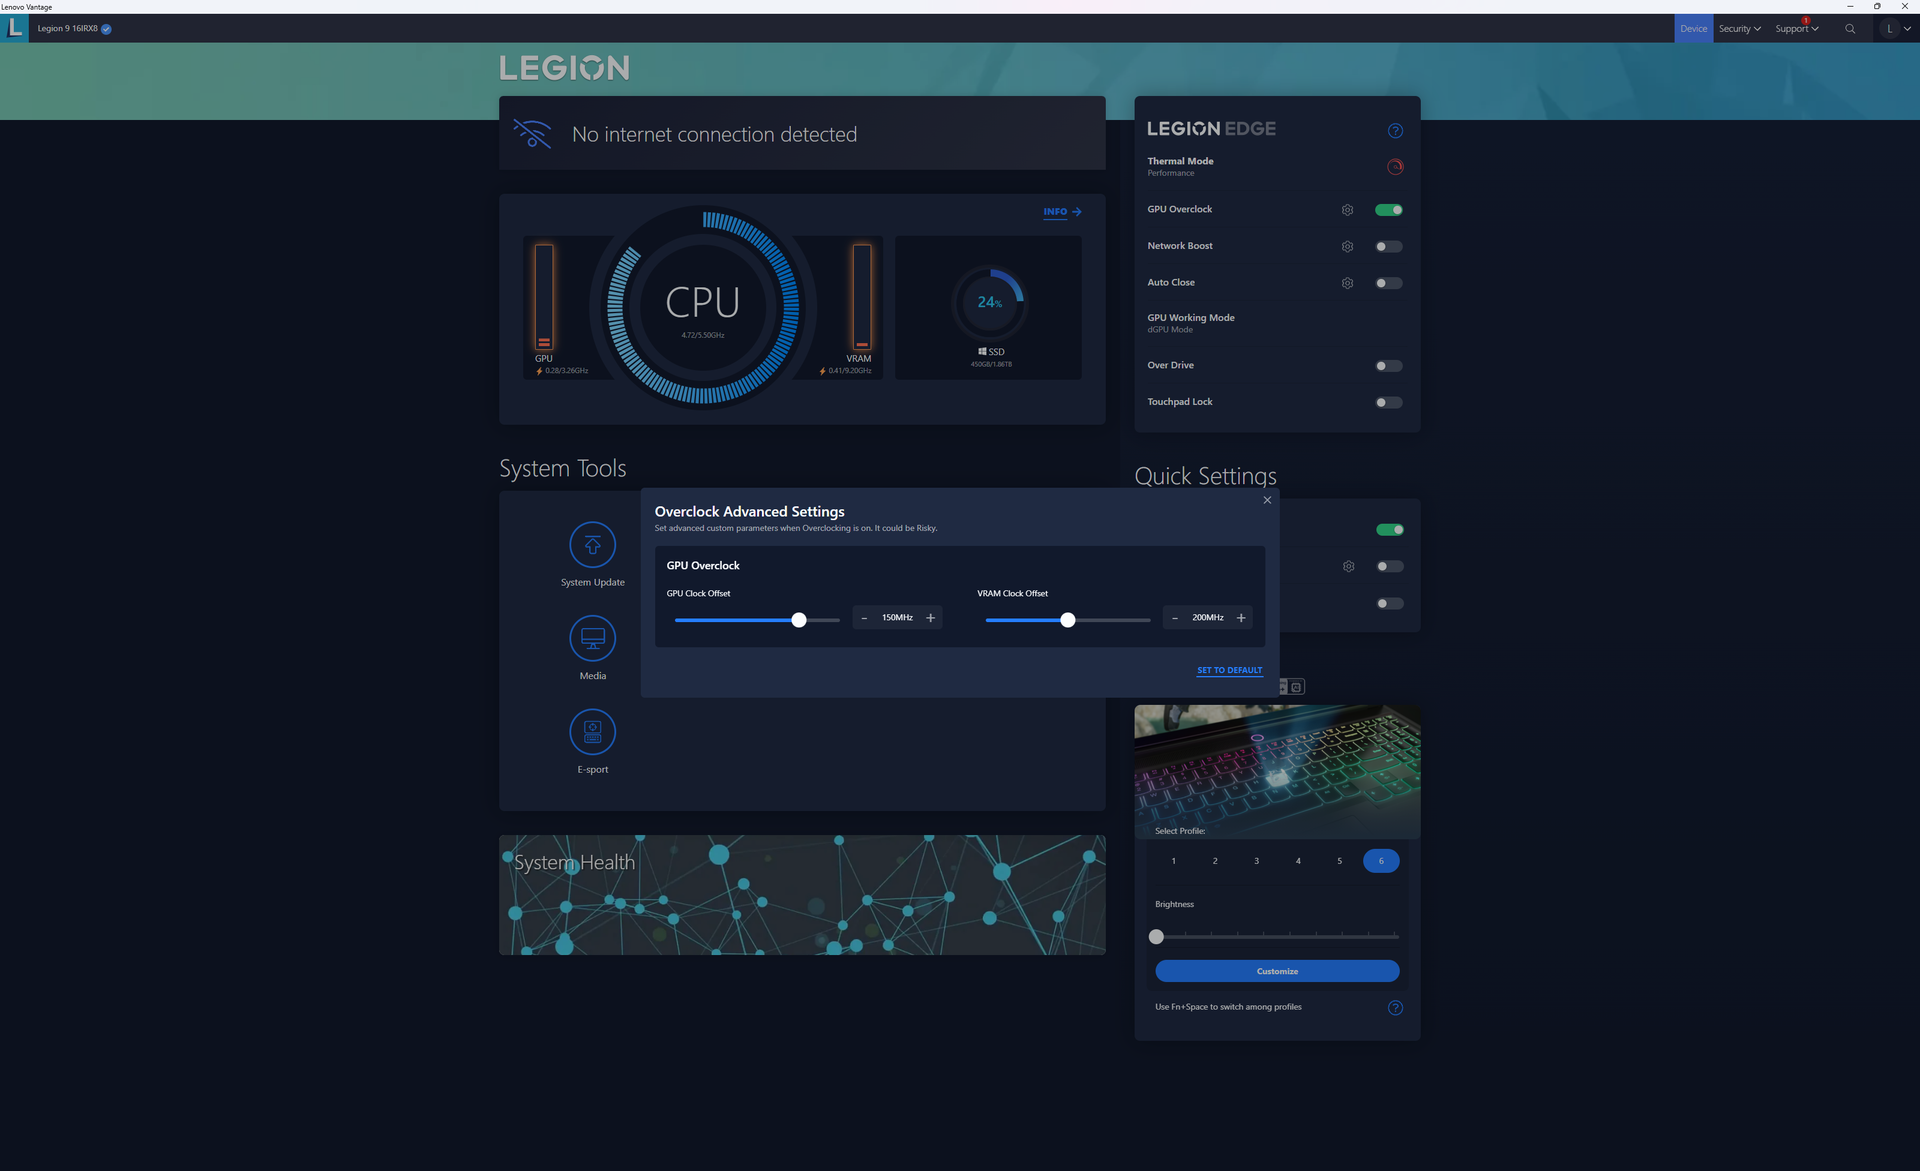
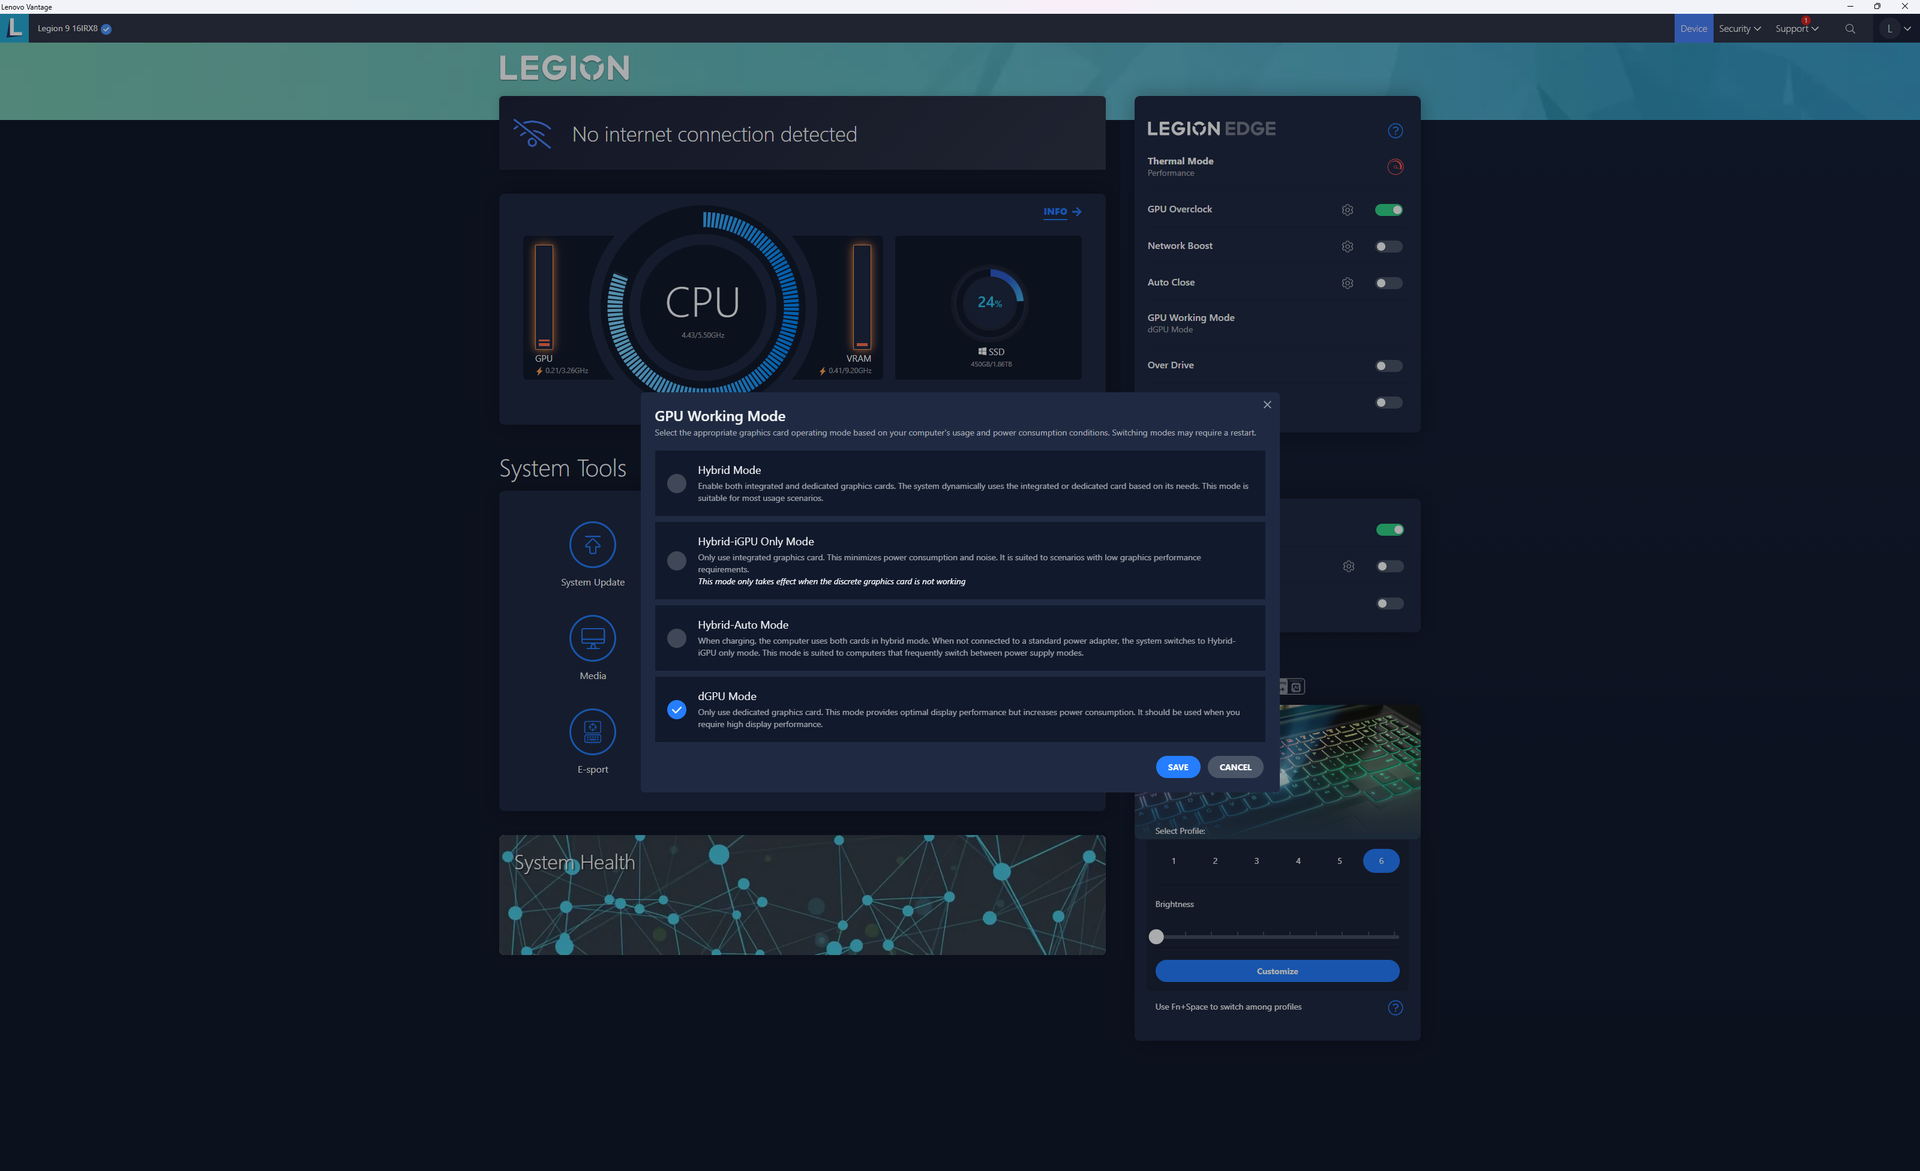
Definimos nossa unidade para o modo Performance e o modo dGPU por meio do Lenovo Vantage antes de executar os benchmarks abaixo. O Overclock da GPU também é ativado por padrão em +150 MHz de GPU e +200 MHz de VRAM, assim como em outros modelos de ponta do Legion. Recomenda-se que os proprietários se familiarizem com o Vantage para ajustar os perfis de energia e outras configurações auxiliares.
Advanced Optimus, MUX e G-Sync são suportados, ao contrário do recente Legion Slim 5 14.
Processador
O desempenho da CPU é excelente, com resultados que são cerca de 80 a 90% mais rápidos em cargas de trabalho multithread do que o comum Core i7-13700H. O Core i9-13980HX é uma das CPUs móveis mais rápidas da Intel no momento, mas ainda fica atrás do concorrenteRyzen 9 7945HX na maioria dos benchmarks multi-threaded em cerca de 10%.
O desempenho é apenas 5% mais rápido do que o Core i9-13950HX com base em nosso tempo com o Razer Blade 16 2023. Infelizmente, a Lenovo não oferece outras opções de CPUs além do Core i9-13980HX para aqueles que desejam economizar algumas centenas de dólares.
Cinebench R15 Multi Loop
Cinebench R23: Multi Core | Single Core
Cinebench R20: CPU (Multi Core) | CPU (Single Core)
Cinebench R15: CPU Multi 64Bit | CPU Single 64Bit
Blender: v2.79 BMW27 CPU
7-Zip 18.03: 7z b 4 | 7z b 4 -mmt1
Geekbench 5.5: Multi-Core | Single-Core
HWBOT x265 Benchmark v2.2: 4k Preset
LibreOffice : 20 Documents To PDF
R Benchmark 2.5: Overall mean
* ... menor é melhor
AIDA64: FP32 Ray-Trace | FPU Julia | CPU SHA3 | CPU Queen | FPU SinJulia | FPU Mandel | CPU AES | CPU ZLib | FP64 Ray-Trace | CPU PhotoWorxx
| Performance rating | |
| Lenovo Legion 9 16IRX8 | |
| Média Intel Core i9-13980HX | |
| Asus ROG Strix G16 G614JZ | |
| HP Omen Transcend 16 | |
| Razer Blade 16 Early 2023 RTX 4090 | |
| Lenovo Legion Slim 5 16APH8 | |
| Alienware x16 R1 | |
| AIDA64 / FP32 Ray-Trace | |
| Lenovo Legion Slim 5 16APH8 | |
| Asus ROG Strix G16 G614JZ | |
| Lenovo Legion 9 16IRX8 | |
| Média Intel Core i9-13980HX (21332 - 29553, n=9) | |
| HP Omen Transcend 16 | |
| Alienware x16 R1 | |
| Razer Blade 16 Early 2023 RTX 4090 | |
| AIDA64 / FPU Julia | |
| Lenovo Legion 9 16IRX8 | |
| Média Intel Core i9-13980HX (108001 - 148168, n=9) | |
| Asus ROG Strix G16 G614JZ | |
| Lenovo Legion Slim 5 16APH8 | |
| HP Omen Transcend 16 | |
| Razer Blade 16 Early 2023 RTX 4090 | |
| Alienware x16 R1 | |
| AIDA64 / CPU SHA3 | |
| Lenovo Legion 9 16IRX8 | |
| Asus ROG Strix G16 G614JZ | |
| Média Intel Core i9-13980HX (5264 - 7142, n=9) | |
| Razer Blade 16 Early 2023 RTX 4090 | |
| HP Omen Transcend 16 | |
| Lenovo Legion Slim 5 16APH8 | |
| Alienware x16 R1 | |
| AIDA64 / CPU Queen | |
| Asus ROG Strix G16 G614JZ | |
| Média Intel Core i9-13980HX (126758 - 143409, n=9) | |
| Razer Blade 16 Early 2023 RTX 4090 | |
| Lenovo Legion 9 16IRX8 | |
| HP Omen Transcend 16 | |
| Lenovo Legion Slim 5 16APH8 | |
| Alienware x16 R1 | |
| AIDA64 / FPU SinJulia | |
| Asus ROG Strix G16 G614JZ | |
| Média Intel Core i9-13980HX (13785 - 17117, n=9) | |
| Lenovo Legion 9 16IRX8 | |
| Lenovo Legion Slim 5 16APH8 | |
| HP Omen Transcend 16 | |
| Razer Blade 16 Early 2023 RTX 4090 | |
| Alienware x16 R1 | |
| AIDA64 / FPU Mandel | |
| Lenovo Legion 9 16IRX8 | |
| Média Intel Core i9-13980HX (53398 - 73758, n=9) | |
| Asus ROG Strix G16 G614JZ | |
| Lenovo Legion Slim 5 16APH8 | |
| HP Omen Transcend 16 | |
| Razer Blade 16 Early 2023 RTX 4090 | |
| Alienware x16 R1 | |
| AIDA64 / CPU AES | |
| Razer Blade 16 Early 2023 RTX 4090 | |
| Asus ROG Strix G16 G614JZ | |
| Lenovo Legion 9 16IRX8 | |
| Média Intel Core i9-13980HX (105169 - 136520, n=9) | |
| HP Omen Transcend 16 | |
| Alienware x16 R1 | |
| Lenovo Legion Slim 5 16APH8 | |
| AIDA64 / CPU ZLib | |
| Lenovo Legion 9 16IRX8 | |
| Asus ROG Strix G16 G614JZ | |
| Média Intel Core i9-13980HX (1513 - 2039, n=9) | |
| Razer Blade 16 Early 2023 RTX 4090 | |
| HP Omen Transcend 16 | |
| Alienware x16 R1 | |
| Lenovo Legion Slim 5 16APH8 | |
| AIDA64 / FP64 Ray-Trace | |
| Lenovo Legion Slim 5 16APH8 | |
| Lenovo Legion 9 16IRX8 | |
| Asus ROG Strix G16 G614JZ | |
| Média Intel Core i9-13980HX (11431 - 16325, n=9) | |
| HP Omen Transcend 16 | |
| Alienware x16 R1 | |
| Razer Blade 16 Early 2023 RTX 4090 | |
| AIDA64 / CPU PhotoWorxx | |
| Razer Blade 16 Early 2023 RTX 4090 | |
| Lenovo Legion 9 16IRX8 | |
| HP Omen Transcend 16 | |
| Alienware x16 R1 | |
| Média Intel Core i9-13980HX (37069 - 52949, n=9) | |
| Asus ROG Strix G16 G614JZ | |
| Lenovo Legion Slim 5 16APH8 | |
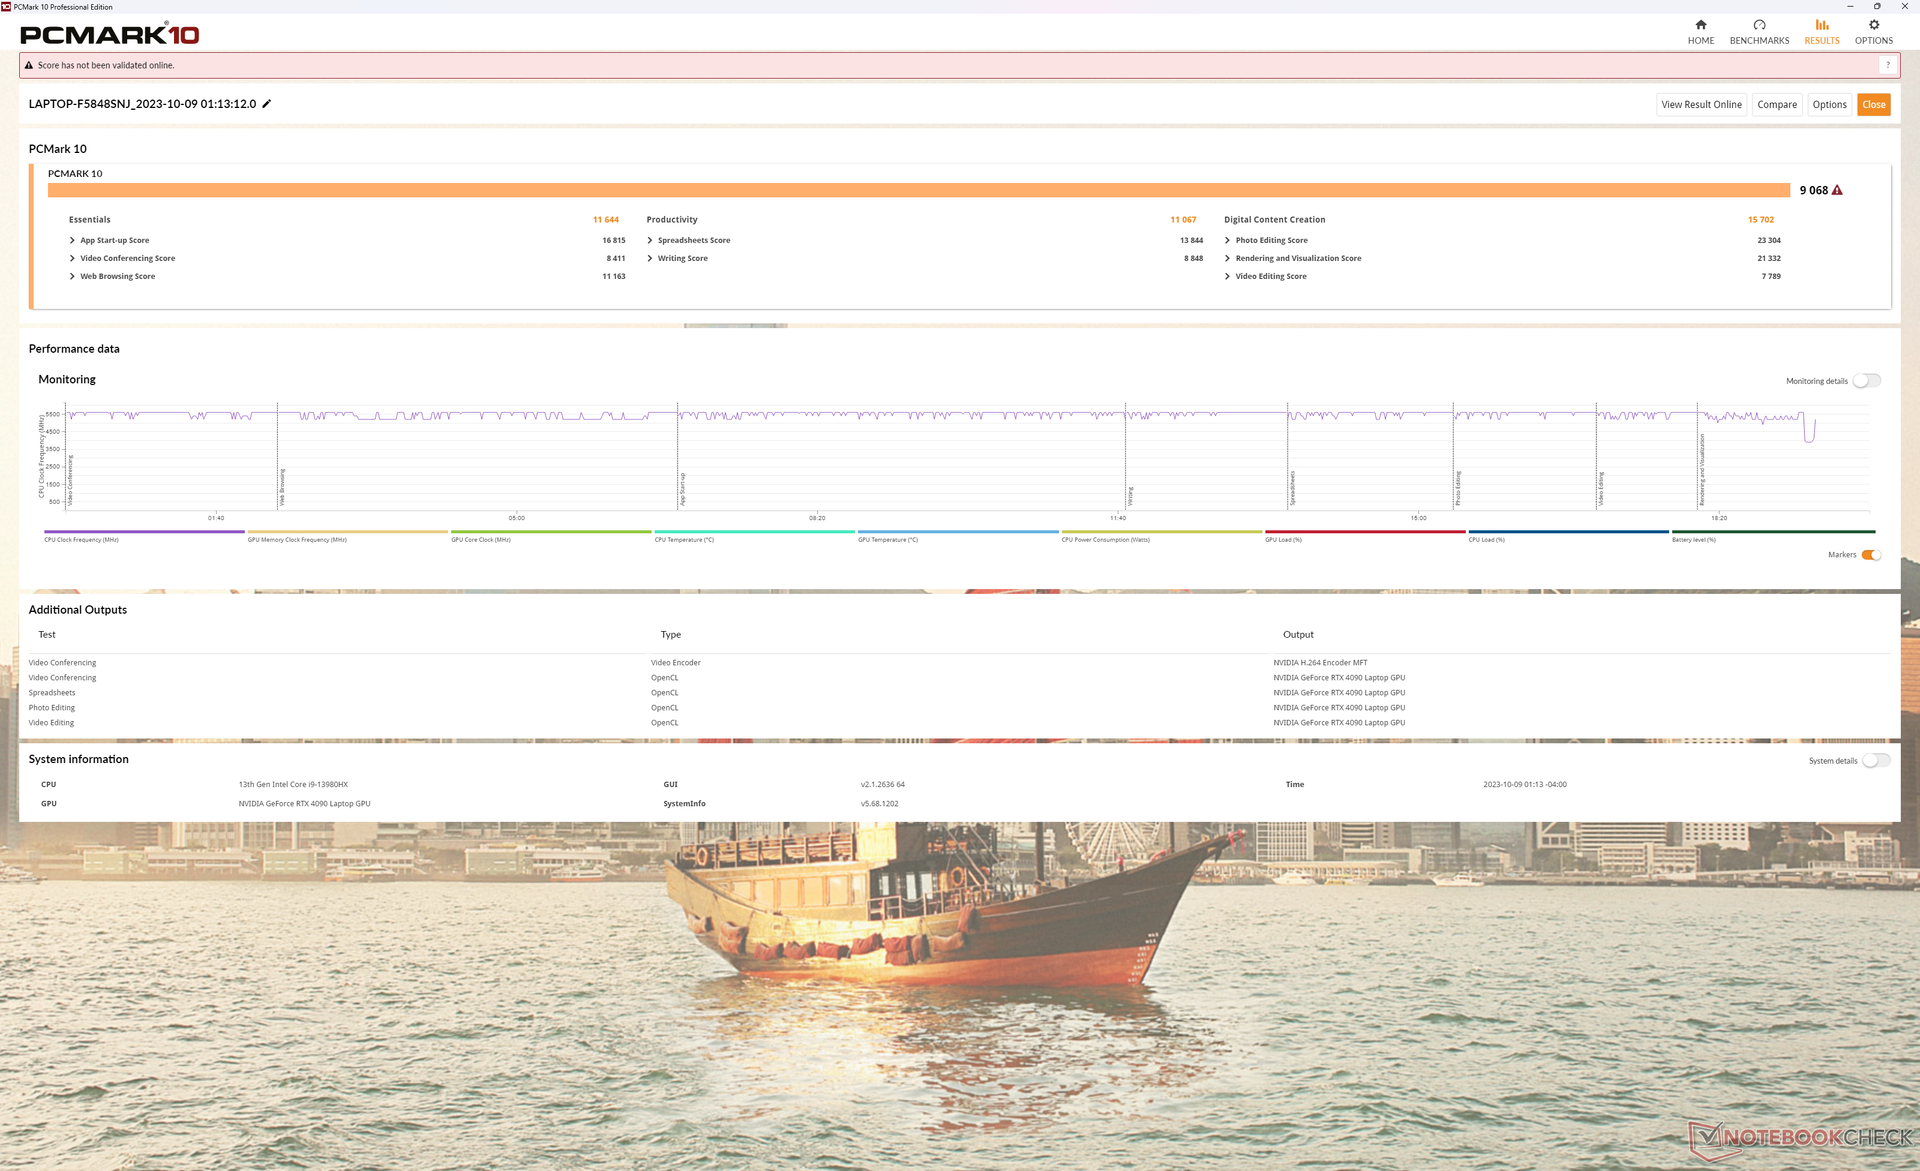
Desempenho do sistema
As pontuações do PCMark são algumas das mais altas de qualquer laptop para jogos, independentemente do tamanho, devido, em grande parte, à CPU Core HX de 13ª geração, à GPU RTX 4090 e, especialmente, à configuração RAID 0 PCIe4 x4. No entanto, ainda tivemos problemas ao acordar do modo de suspensão, em que a tela às vezes permanecia em branco e "congelada" por períodos de tempo incomumente longos. Suspeitamos que isso possa ser devido à forma como o modelo faz malabarismos entre os vários modos diferentes da GPU.
CrossMark: Overall | Productivity | Creativity | Responsiveness
| PCMark 10 / Score | |
| Lenovo Legion 9 16IRX8 | |
| Média Intel Core i9-13980HX, NVIDIA GeForce RTX 4090 Laptop GPU (8650 - 9068, n=4) | |
| Alienware x16 R1 | |
| HP Omen Transcend 16 | |
| Lenovo Legion Slim 5 16APH8 | |
| Razer Blade 16 Early 2023 RTX 4090 | |
| Asus ROG Strix G16 G614JZ | |
| PCMark 10 / Essentials | |
| Asus ROG Strix G16 G614JZ | |
| Lenovo Legion 9 16IRX8 | |
| Média Intel Core i9-13980HX, NVIDIA GeForce RTX 4090 Laptop GPU (11215 - 11644, n=3) | |
| HP Omen Transcend 16 | |
| Lenovo Legion Slim 5 16APH8 | |
| Alienware x16 R1 | |
| Razer Blade 16 Early 2023 RTX 4090 | |
| PCMark 10 / Productivity | |
| Lenovo Legion 9 16IRX8 | |
| Média Intel Core i9-13980HX, NVIDIA GeForce RTX 4090 Laptop GPU (10125 - 11067, n=3) | |
| Lenovo Legion Slim 5 16APH8 | |
| Alienware x16 R1 | |
| HP Omen Transcend 16 | |
| Razer Blade 16 Early 2023 RTX 4090 | |
| Asus ROG Strix G16 G614JZ | |
| PCMark 10 / Digital Content Creation | |
| Lenovo Legion 9 16IRX8 | |
| Média Intel Core i9-13980HX, NVIDIA GeForce RTX 4090 Laptop GPU (15052 - 16012, n=3) | |
| Alienware x16 R1 | |
| HP Omen Transcend 16 | |
| Razer Blade 16 Early 2023 RTX 4090 | |
| Lenovo Legion Slim 5 16APH8 | |
| Asus ROG Strix G16 G614JZ | |
| CrossMark / Overall | |
| Asus ROG Strix G16 G614JZ | |
| Média Intel Core i9-13980HX, NVIDIA GeForce RTX 4090 Laptop GPU (1935 - 2176, n=4) | |
| Razer Blade 16 Early 2023 RTX 4090 | |
| HP Omen Transcend 16 | |
| Alienware x16 R1 | |
| Lenovo Legion 9 16IRX8 | |
| Lenovo Legion Slim 5 16APH8 | |
| CrossMark / Productivity | |
| Asus ROG Strix G16 G614JZ | |
| Razer Blade 16 Early 2023 RTX 4090 | |
| Média Intel Core i9-13980HX, NVIDIA GeForce RTX 4090 Laptop GPU (1764 - 2005, n=4) | |
| Alienware x16 R1 | |
| HP Omen Transcend 16 | |
| Lenovo Legion 9 16IRX8 | |
| Lenovo Legion Slim 5 16APH8 | |
| CrossMark / Creativity | |
| Asus ROG Strix G16 G614JZ | |
| Média Intel Core i9-13980HX, NVIDIA GeForce RTX 4090 Laptop GPU (2267 - 2469, n=4) | |
| HP Omen Transcend 16 | |
| Lenovo Legion 9 16IRX8 | |
| Razer Blade 16 Early 2023 RTX 4090 | |
| Alienware x16 R1 | |
| Lenovo Legion Slim 5 16APH8 | |
| CrossMark / Responsiveness | |
| Asus ROG Strix G16 G614JZ | |
| Alienware x16 R1 | |
| Razer Blade 16 Early 2023 RTX 4090 | |
| Média Intel Core i9-13980HX, NVIDIA GeForce RTX 4090 Laptop GPU (1556 - 1904, n=4) | |
| Lenovo Legion 9 16IRX8 | |
| HP Omen Transcend 16 | |
| Lenovo Legion Slim 5 16APH8 | |
| PCMark 10 Score | 9068 pontos | |
Ajuda | ||
| AIDA64 / Memory Copy | |
| Razer Blade 16 Early 2023 RTX 4090 | |
| Lenovo Legion 9 16IRX8 | |
| HP Omen Transcend 16 | |
| Alienware x16 R1 | |
| Média Intel Core i9-13980HX (62189 - 80776, n=9) | |
| Lenovo Legion Slim 5 16APH8 | |
| Asus ROG Strix G16 G614JZ | |
| AIDA64 / Memory Read | |
| Lenovo Legion 9 16IRX8 | |
| Razer Blade 16 Early 2023 RTX 4090 | |
| HP Omen Transcend 16 | |
| Média Intel Core i9-13980HX (62624 - 89096, n=9) | |
| Asus ROG Strix G16 G614JZ | |
| Alienware x16 R1 | |
| Lenovo Legion Slim 5 16APH8 | |
| AIDA64 / Memory Write | |
| Alienware x16 R1 | |
| Lenovo Legion Slim 5 16APH8 | |
| Razer Blade 16 Early 2023 RTX 4090 | |
| Lenovo Legion 9 16IRX8 | |
| HP Omen Transcend 16 | |
| Média Intel Core i9-13980HX (59912 - 79917, n=9) | |
| Asus ROG Strix G16 G614JZ | |
| AIDA64 / Memory Latency | |
| Alienware x16 R1 | |
| Lenovo Legion Slim 5 16APH8 | |
| HP Omen Transcend 16 | |
| Asus ROG Strix G16 G614JZ | |
| Média Intel Core i9-13980HX (79.4 - 93.2, n=9) | |
| Razer Blade 16 Early 2023 RTX 4090 | |
| Lenovo Legion 9 16IRX8 | |
* ... menor é melhor
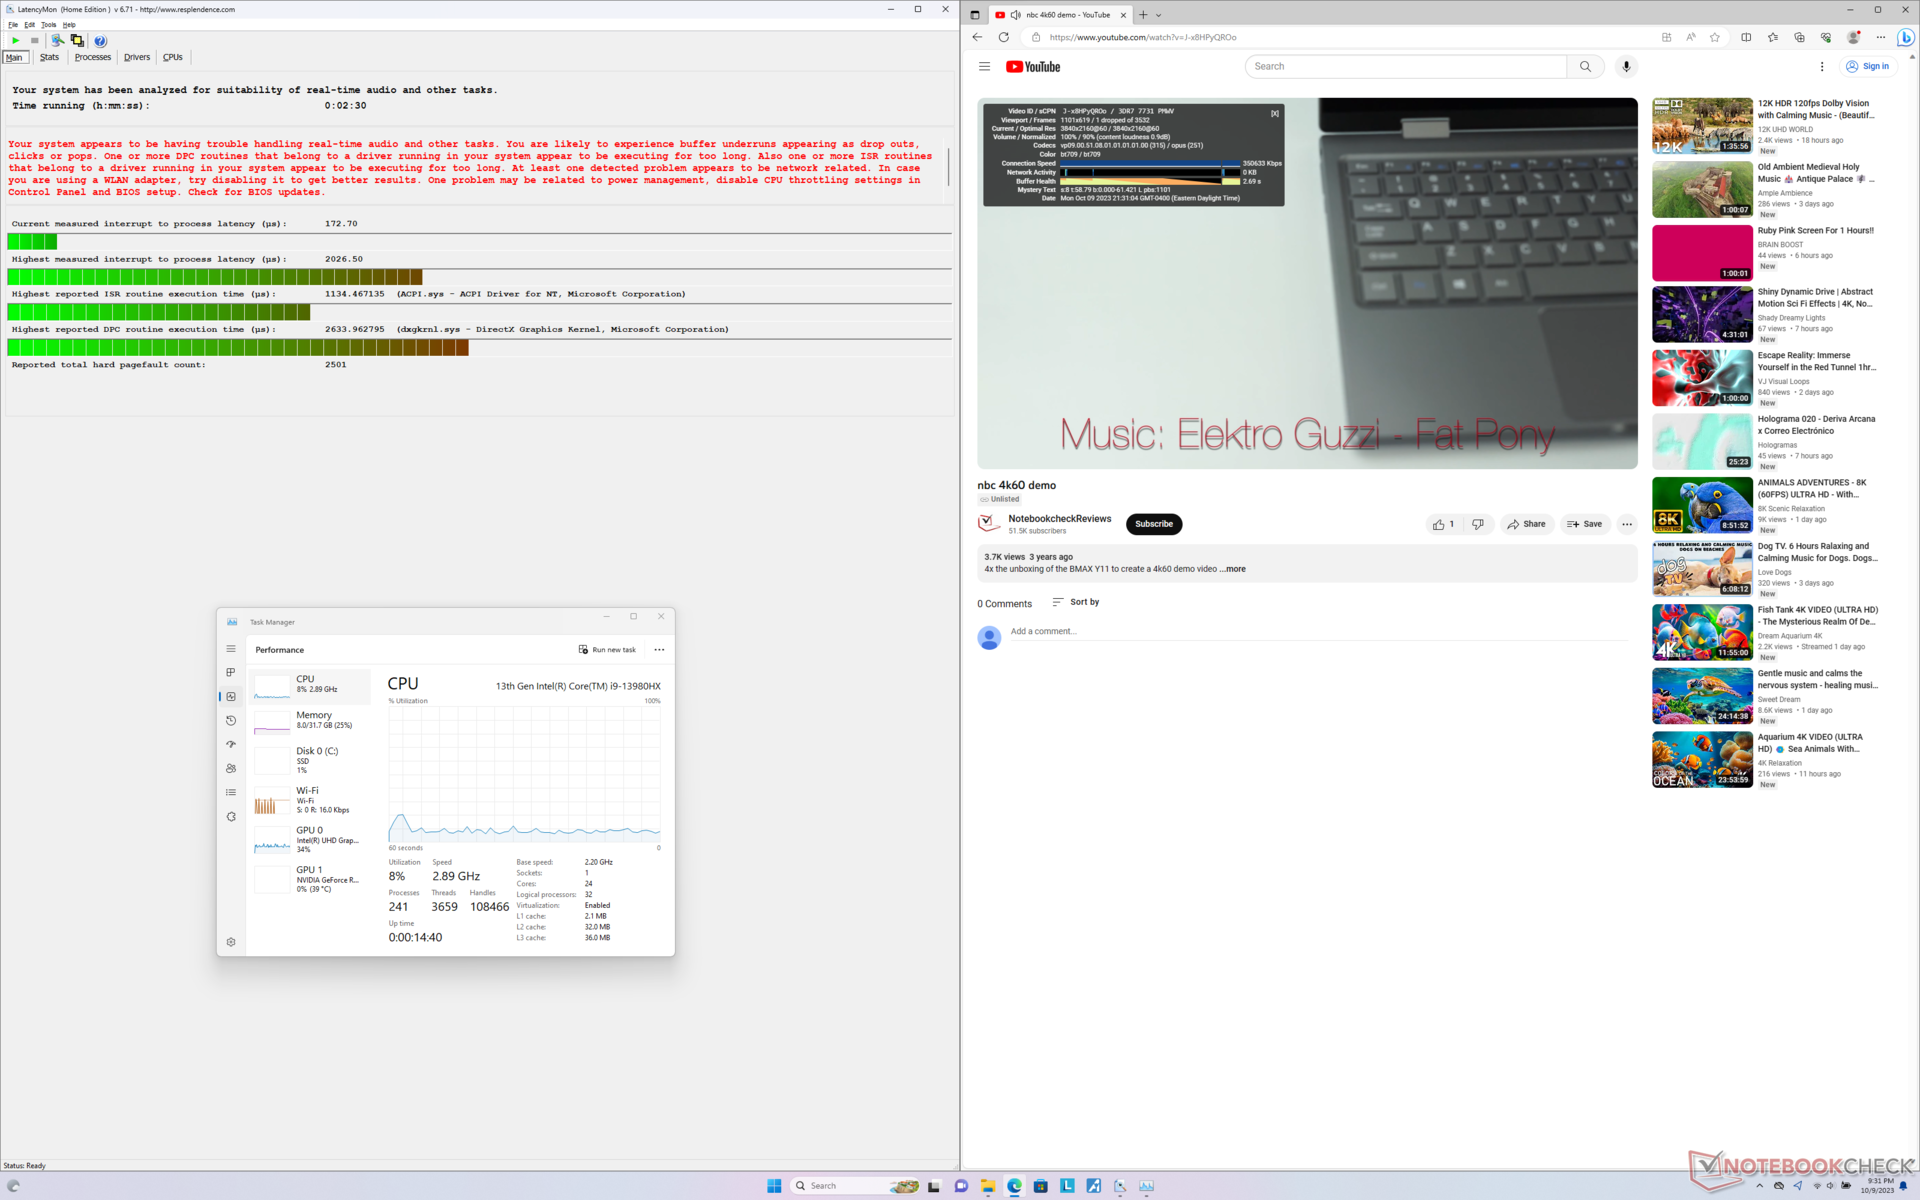
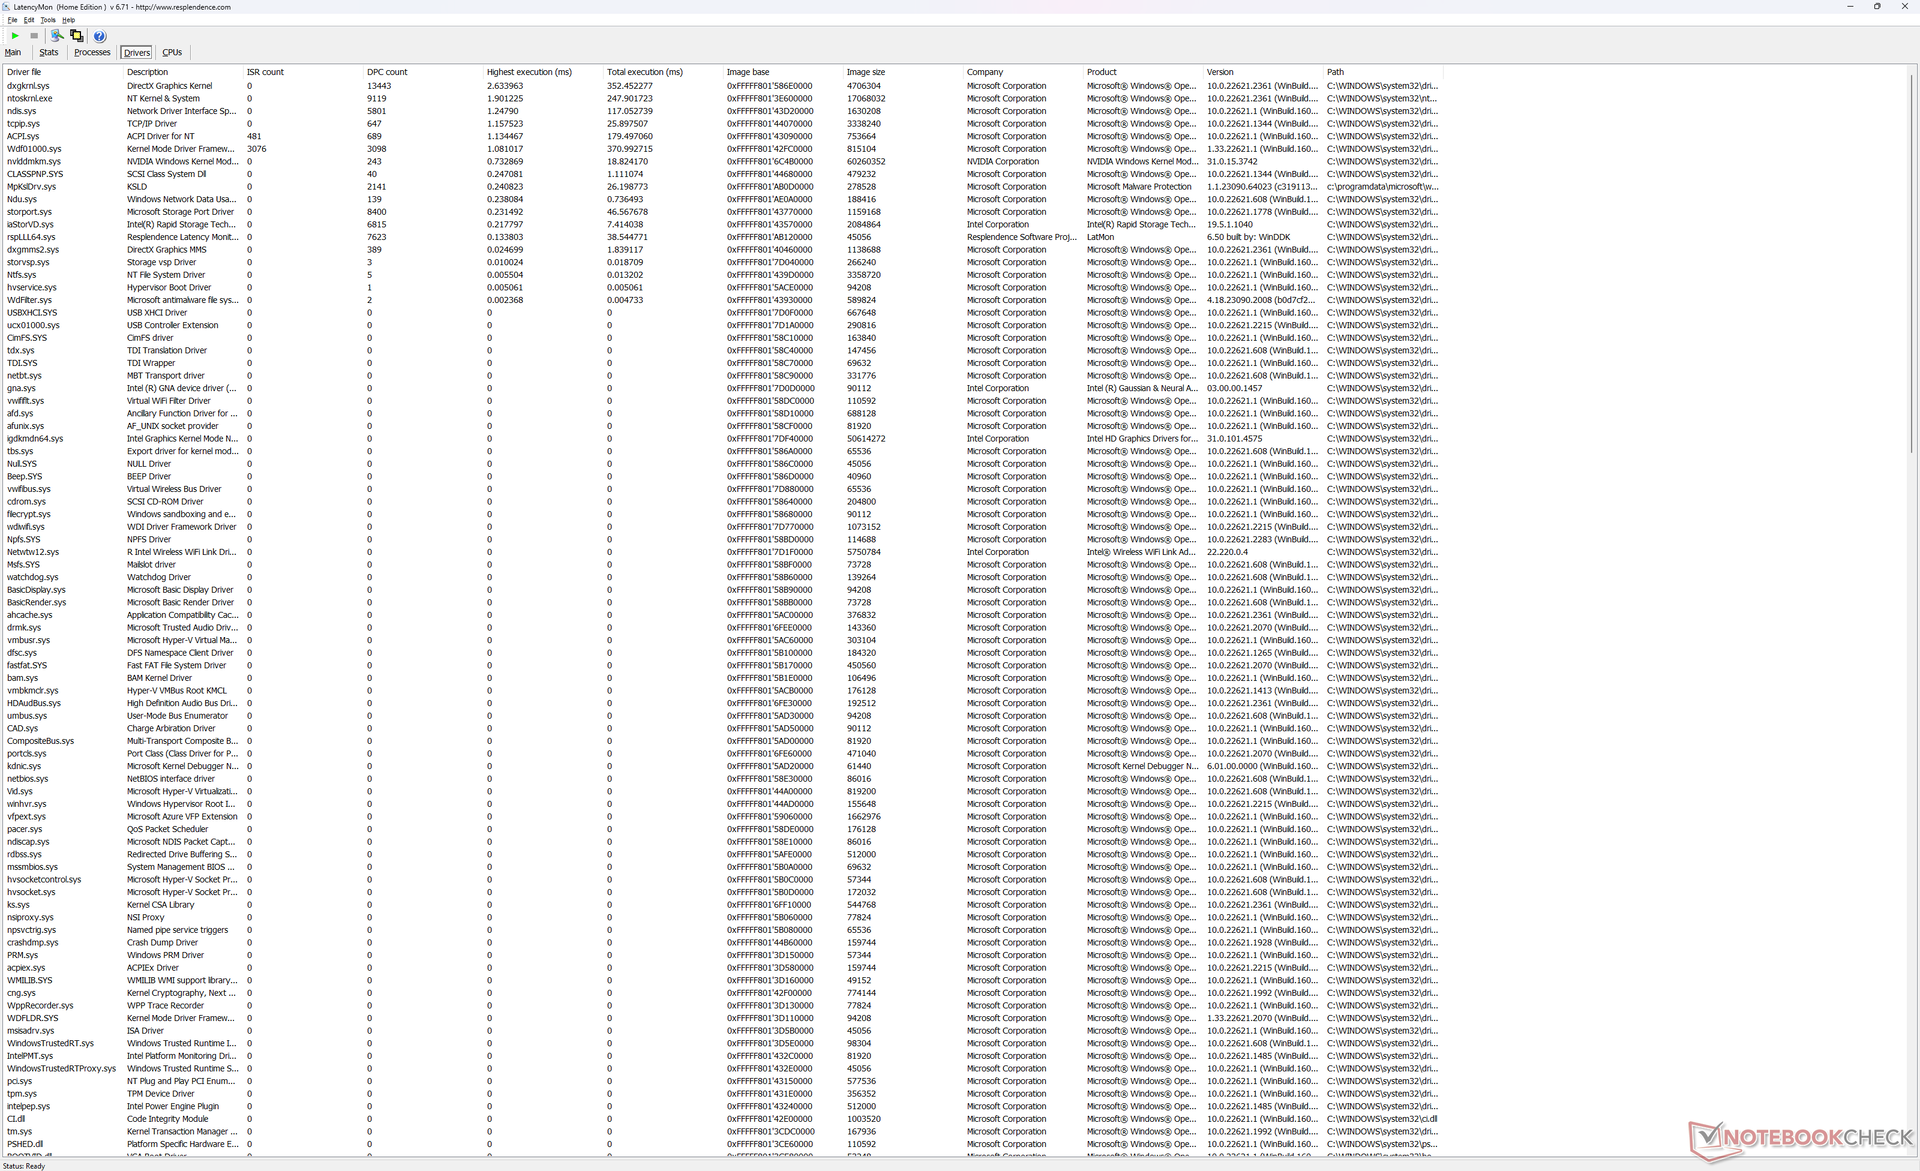
Latência DPC
O LatencyMon revela problemas de DPC ao abrir várias guias do navegador em nossa página inicial. a reprodução de vídeo 4K a 60 FPS é quase perfeita, com apenas um quadro perdido registrado durante um intervalo de um minuto.
| DPC Latencies / LatencyMon - interrupt to process latency (max), Web, Youtube, Prime95 | |
| Razer Blade 16 Early 2023 RTX 4090 | |
| Razer Blade 16 Early 2023 RTX 4090 | |
| Asus ROG Strix G16 G614JZ | |
| Lenovo Legion 9 16IRX8 | |
| HP Omen Transcend 16 | |
| Alienware x16 R1 | |
| Lenovo Legion Slim 5 16APH8 | |
* ... menor é melhor
Dispositivos de armazenamento
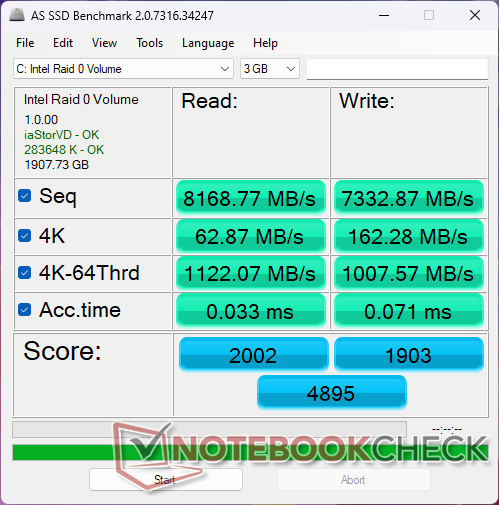
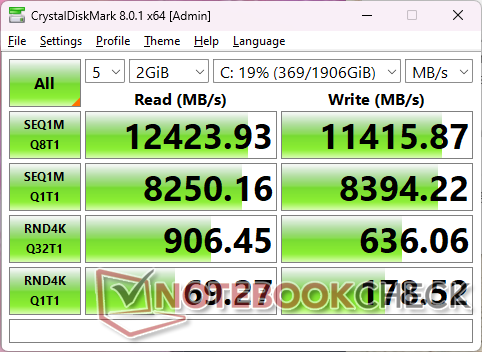
Nossa unidade vem configurada com dois SK hynix HFS001TEJ9X115N PCIe4 x4 NVMe na configuração RAID 0 para taxas de leitura e gravação sequenciais incrivelmente rápidas de até 12.000 MB/s e 11.000 MB/s, respectivamente. Infelizmente, as unidades são propensas a se estrangularem ao serem executadas em velocidades tão altas por períodos prolongados. Os resultados do teste de loop do DiskSpd abaixo mostram que as taxas de leitura de uma das unidades caem para cerca de 4600 MB/s após cerca de 4 minutos.

| Drive Performance rating - Percent | |
| Alienware x16 R1 | |
| Lenovo Legion 9 16IRX8 | |
| Razer Blade 16 Early 2023 RTX 4090 | |
| Asus ROG Strix G16 G614JZ | |
| HP Omen Transcend 16 | |
| Lenovo Legion Slim 5 16APH8 | |
* ... menor é melhor
Disk Throttling: DiskSpd Read Loop, Queue Depth 8
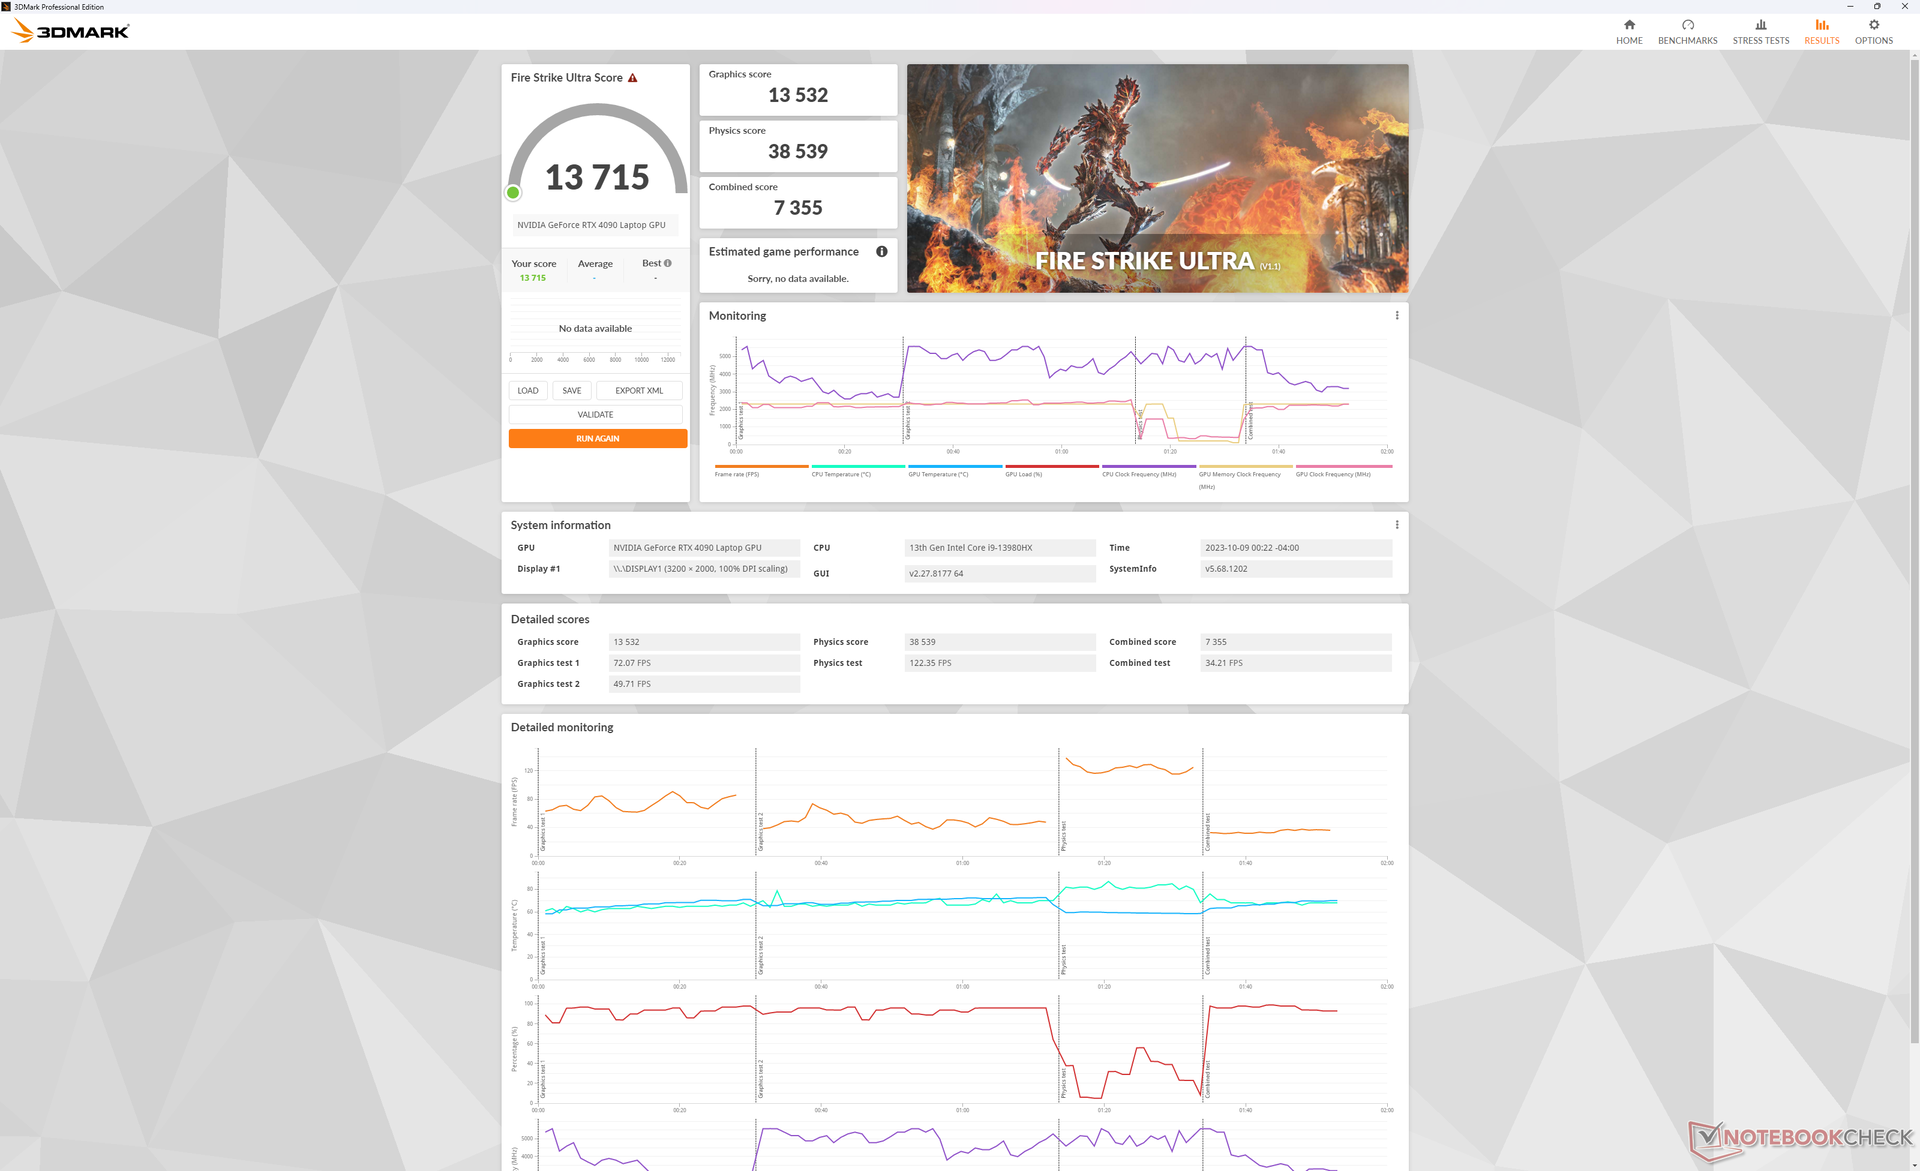
Desempenho da GPU - Gráficos TGP de 175 W
Nossos 175 W móvel GeForce RTX 4090 tem desempenho de apenas 1 a 2 pontos percentuais do laptop médio em nosso banco de dados com a mesma GPU. Os resultados são impressionantes, considerando o tamanho de alguns notebooks RTX 4090, como oMSI Raider GE78 HX 13VI.
Analisando o panorama geral, a RTX 4090 móvel é cerca de 40% mais lenta do que uma RTX 4090 "adequada" para desktop desktop RTX 4090. Na verdade, ele oferece apenas benefícios modestos, de apenas 5 a 10%, em relação ao rTX 4080 móvel configuração.
A execução no perfil de energia Balanced com overclocking desativado reduziria o desempenho gráfico em cerca de 17%, de acordo com nossa tabela de resultados do site Fire Strike abaixo.
| Perfil de energia | Pontuação de gráficos | Pontuação de física | Pontuação combinada |
| Modo de desempenho | 46386 | 38687 | 11456 |
| Modo balanceado (com overclock da GPU desativado) | 38285 (-17%) | 39020 (-0%) | 12715 (-0%) |
| Energia da bateria | 22176 (-52%) | 21072 (-46%) | 6306 (-45%) |
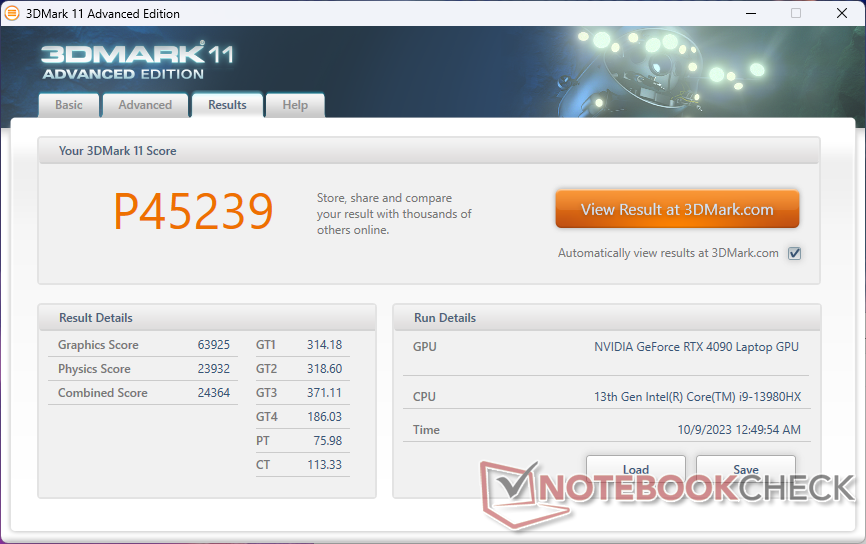
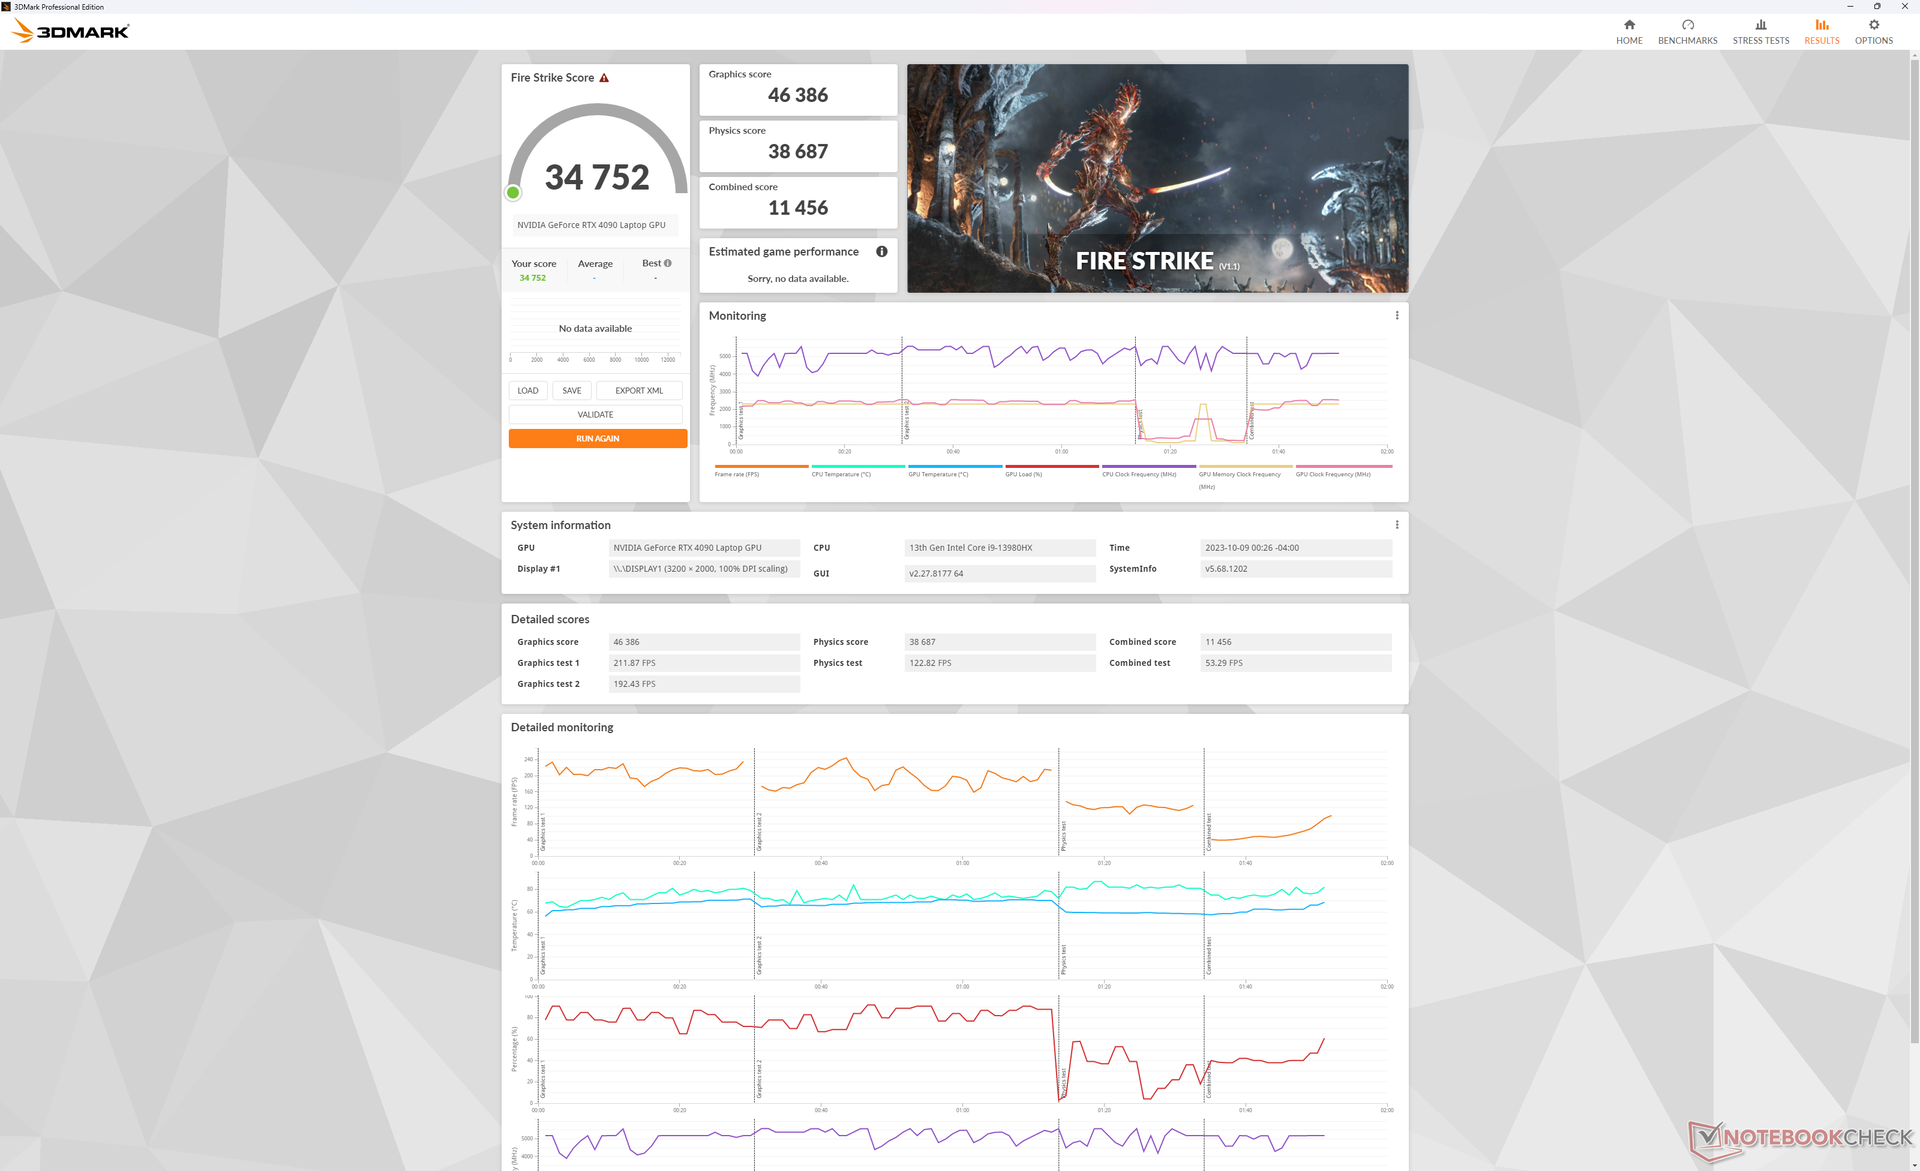
| 3DMark 11 Performance | 45239 pontos | |
| 3DMark Fire Strike Score | 34752 pontos | |
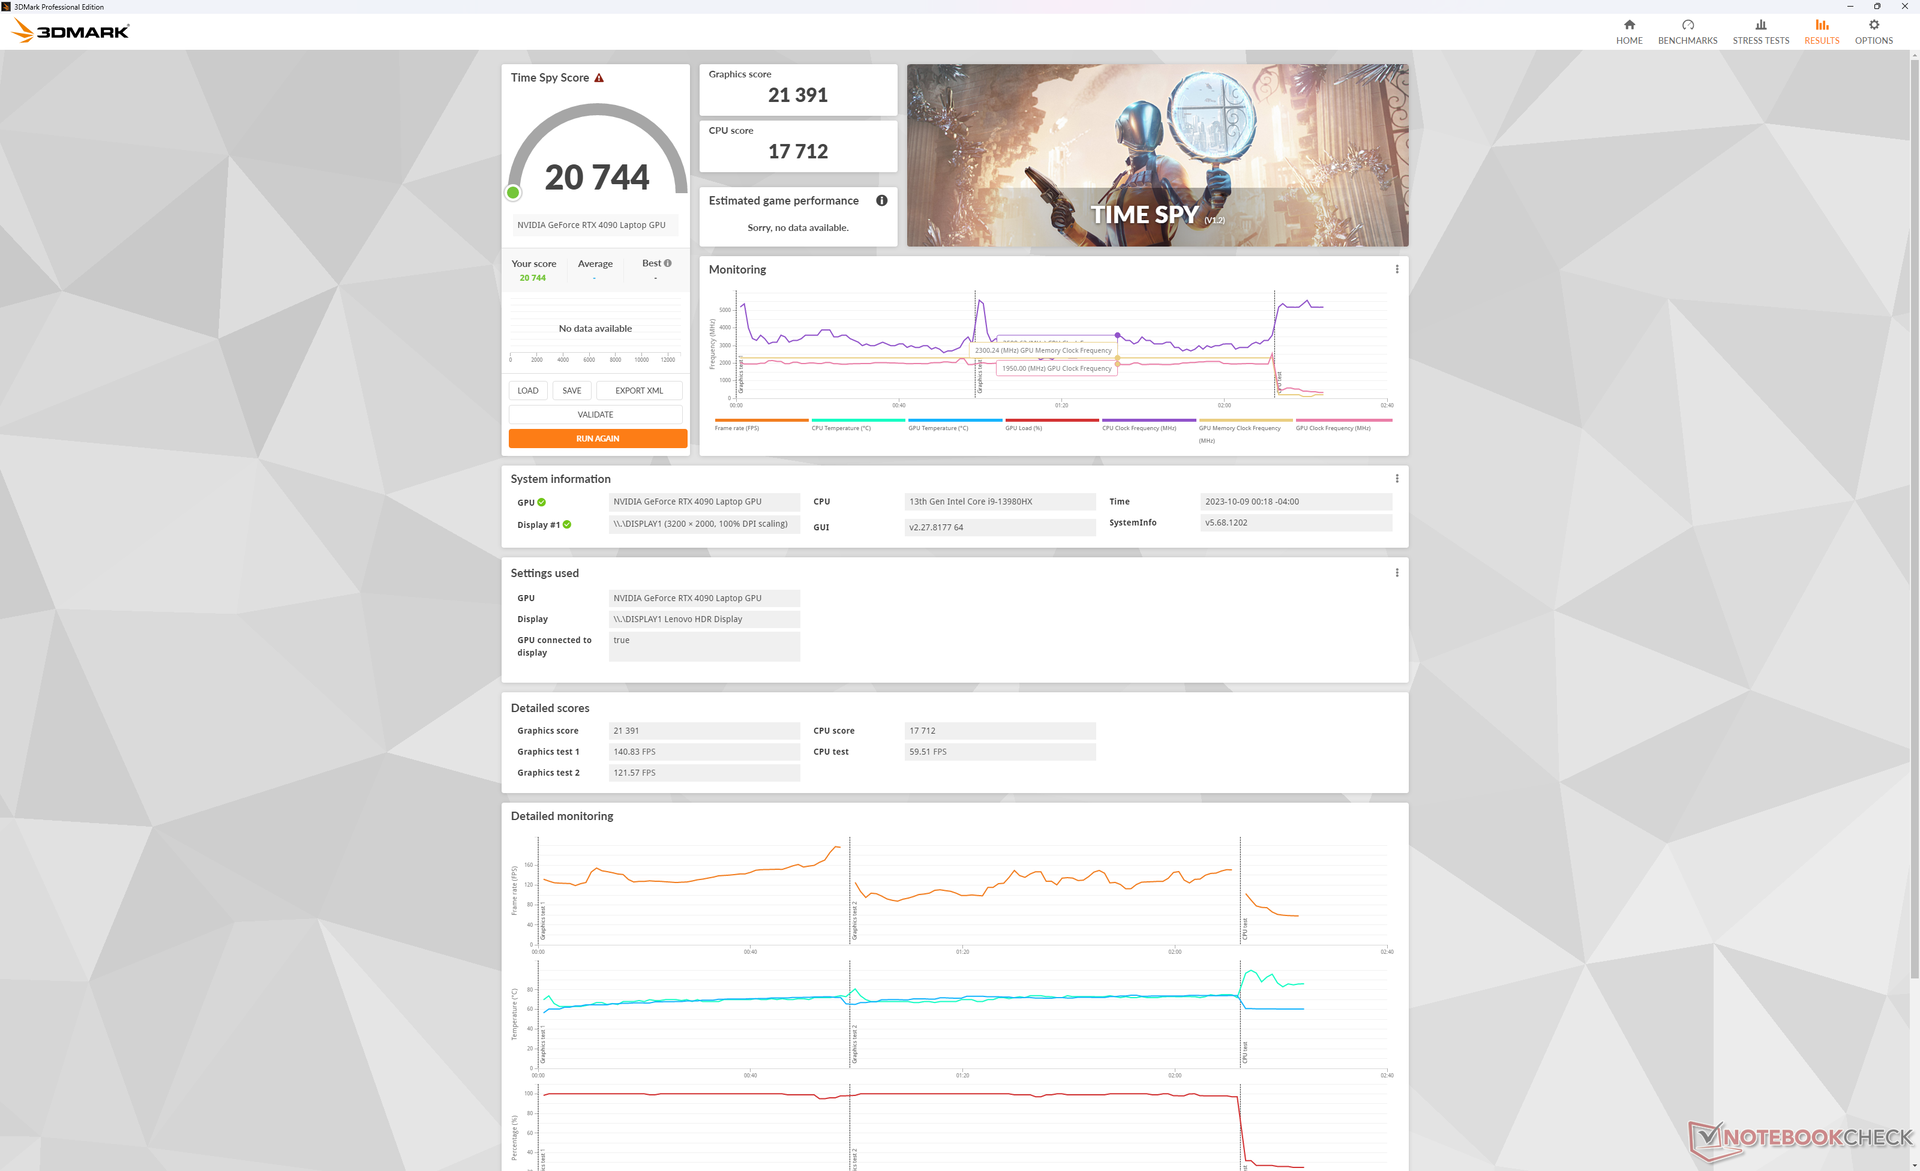
| 3DMark Time Spy Score | 20744 pontos | |
Ajuda | ||
* ... menor é melhor
Desempenho em jogos
Todos os jogos funcionam muito bem em QHD ou superior, incluindo títulos exigentes como Cyberpunk 2077 ou Ratchet and Clank. Observe que o G-Sync só pode ser ativado se for definido para o modo dGPU, caso contrário, ele será desativado se estiver nos modos de gráficos híbridos ou integrados.
| Ratchet & Clank Rift Apart | |
| 1920x1080 Low Preset | |
| Lenovo Legion 9 16IRX8 | |
| Média NVIDIA GeForce RTX 4090 Laptop GPU (n=1) | |
| MSI Raider GE68HX 13VF | |
| 1920x1080 Medium Preset AA:T | |
| Média NVIDIA GeForce RTX 4090 Laptop GPU (155.6 - 161.8, n=2) | |
| Lenovo Legion 9 16IRX8 | |
| MSI Raider GE68HX 13VF | |
| 1920x1080 High Preset AA:T | |
| Média NVIDIA GeForce RTX 4090 Laptop GPU (135.4 - 136.6, n=2) | |
| Lenovo Legion 9 16IRX8 | |
| MSI Raider GE68HX 13VF | |
| 1920x1080 Very High Preset AA:T | |
| Média NVIDIA GeForce RTX 4090 Laptop GPU (111.1 - 115.4, n=2) | |
| Lenovo Legion 9 16IRX8 | |
| MSI Raider GE68HX 13VF | |
| 2560x1440 Very High Preset AA:T | |
| Média NVIDIA GeForce RTX 4090 Laptop GPU (98.7 - 107.1, n=2) | |
| Lenovo Legion 9 16IRX8 | |
Witcher 3 FPS Chart
| baixo | média | alto | ultra | QHD | |
|---|---|---|---|---|---|
| GTA V (2015) | 187.1 | 186.3 | 184.8 | 150.7 | 145.3 |
| The Witcher 3 (2015) | 671.8 | 569 | 408.2 | 208.7 | 165 |
| Dota 2 Reborn (2015) | 244 | 217 | 208 | 193.1 | |
| Final Fantasy XV Benchmark (2018) | 231 | 207 | 181.3 | 158.4 | |
| X-Plane 11.11 (2018) | 214 | 185.9 | 140.1 | ||
| Far Cry 5 (2018) | 195 | 176 | 167 | 158 | 157 |
| Strange Brigade (2018) | 487 | 409 | 390 | 387 | 312 |
| Cyberpunk 2077 1.6 (2022) | 146.9 | 142.9 | 129.5 | 131.4 | 98.8 |
| Tiny Tina's Wonderlands (2022) | 377.6 | 290.4 | 226.2 | 186.4 | 137.8 |
| F1 22 (2022) | 336 | 333 | 286 | 130.8 | 90.9 |
| Ratchet & Clank Rift Apart (2023) | 163.4 | 155.6 | 135.4 | 111.1 | 98.7 |
| Cyberpunk 2077 (2023) | 131.22 | 89.55 | |||
| Alan Wake 2 (2023) | 121.1 | 83.7 | |||
| Avatar Frontiers of Pandora (2023) | 100 | 69 |
Emissões
Ruído do sistema
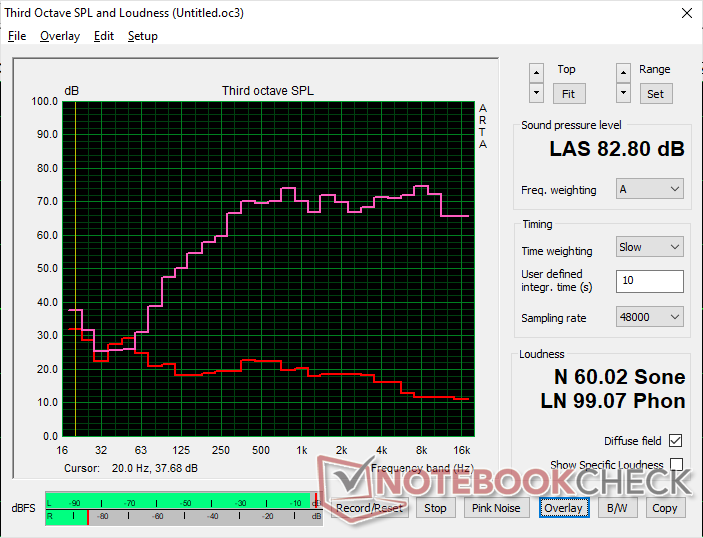
Os ventiladores quase nunca ficam ociosos e, portanto, é de se esperar algum ruído. Elas tendem a oscilar em torno de 30,4 dB(A) contra um fundo silencioso de 23,7 dB(A) quando submetidas às cargas mais comuns, como navegação na Web ou streaming de vídeo, mesmo quando configuradas no modo Silencioso. Essa faixa é típica da maioria dos outros notebooks para jogos em condições semelhantes, mas o Legion 9i 16 não pulsa com tanta frequência, desde que o senhor esteja executando no modo Balanced iGPU ou inferior.
O ruído do ventilador aumenta significativamente até 52,2 dB(A) ao jogar no modo Performance, que é a faixa esperada para laptops para jogos de ponta. O ruído cairia ligeiramente para 49,5 dB(A) se o jogo fosse jogado no modo Balanced, mas lembre-se do déficit gráfico de 17% em comparação com o modo Performance, conforme mencionado acima. Recomenda-se o uso de fones de ouvido para jogos em ambos os casos.
Barulho
| Ocioso |
| 24 / 24 / 30.4 dB |
| Carga |
| 30.4 / 54.9 dB |
 | ||
30 dB silencioso 40 dB(A) audível 50 dB(A) ruidosamente alto |
||
min: | ||
| Lenovo Legion 9 16IRX8 GeForce RTX 4090 Laptop GPU, i9-13980HX, 2x SK Hynix HFS001TEJ9X115N (RAID 0) | Lenovo Legion Slim 5 16APH8 GeForce RTX 4060 Laptop GPU, R7 7840HS, SK hynix PC801 HFS512GEJ9X115N | Razer Blade 16 Early 2023 RTX 4090 GeForce RTX 4090 Laptop GPU, i9-13950HX, SSSTC CA6-8D1024 | Asus ROG Strix G16 G614JZ GeForce RTX 4080 Laptop GPU, i9-13980HX, WD PC SN560 SDDPNQE-1T00 | HP Omen Transcend 16 GeForce RTX 4070 Laptop GPU, i9-13900HX, SK hynix PC801 HFS002TEJ9X101N | Alienware x16 R1 GeForce RTX 4080 Laptop GPU, i9-13900HK, SK hynix PC801 HFS001TEJ9X101N | |
|---|---|---|---|---|---|---|
| Noise | 1% | 3% | -11% | -13% | -1% | |
| desligado / ambiente * (dB) | 23.7 | 22.9 3% | 20.84 12% | 25 -5% | 22.9 3% | 22.7 4% |
| Idle Minimum * (dB) | 24 | 23.1 4% | 23.65 1% | 26 -8% | 29.1 -21% | 23.1 4% |
| Idle Average * (dB) | 24 | 23.1 4% | 23.65 1% | 28 -17% | 29.1 -21% | 25.8 -8% |
| Idle Maximum * (dB) | 30.4 | 27.7 9% | 23.65 22% | 30 1% | 29.1 4% | 25.8 15% |
| Load Average * (dB) | 30.4 | 33.3 -10% | 43.35 -43% | 48 -58% | 45.7 -50% | 39.3 -29% |
| Witcher 3 ultra * (dB) | 52.2 | 54 -3% | 46.7 11% | 49 6% | 54.3 -4% | 49.9 4% |
| Load Maximum * (dB) | 54.9 | 54 2% | 46.72 15% | 52 5% | 54.3 1% | 54.8 -0% |
* ... menor é melhor
Temperatura
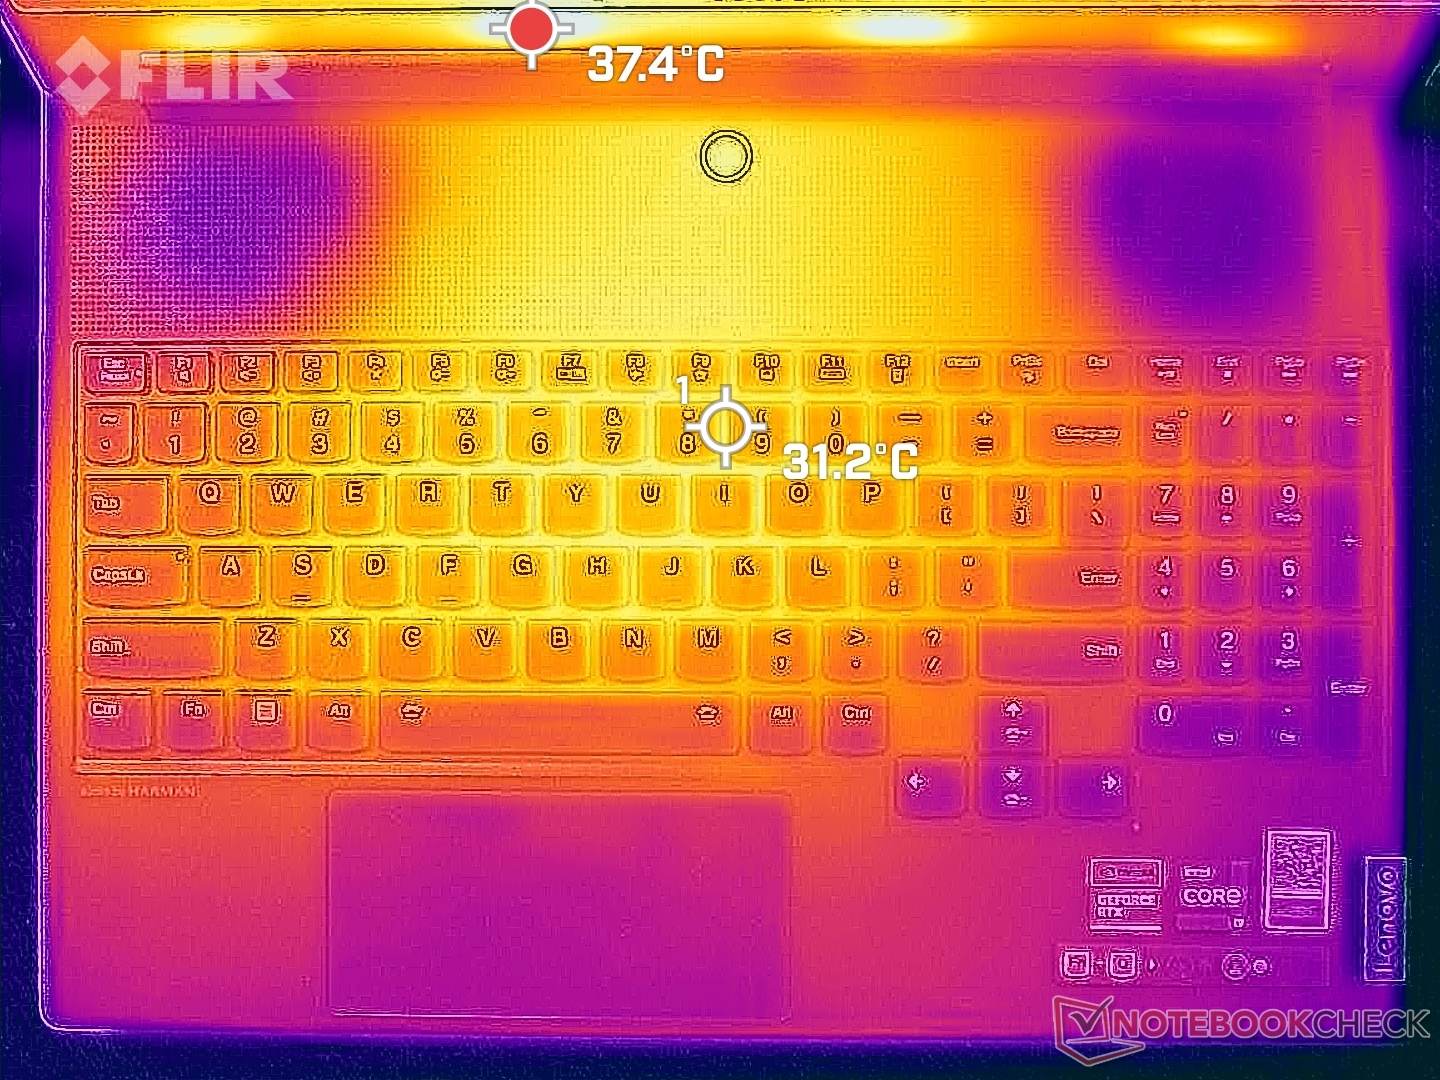
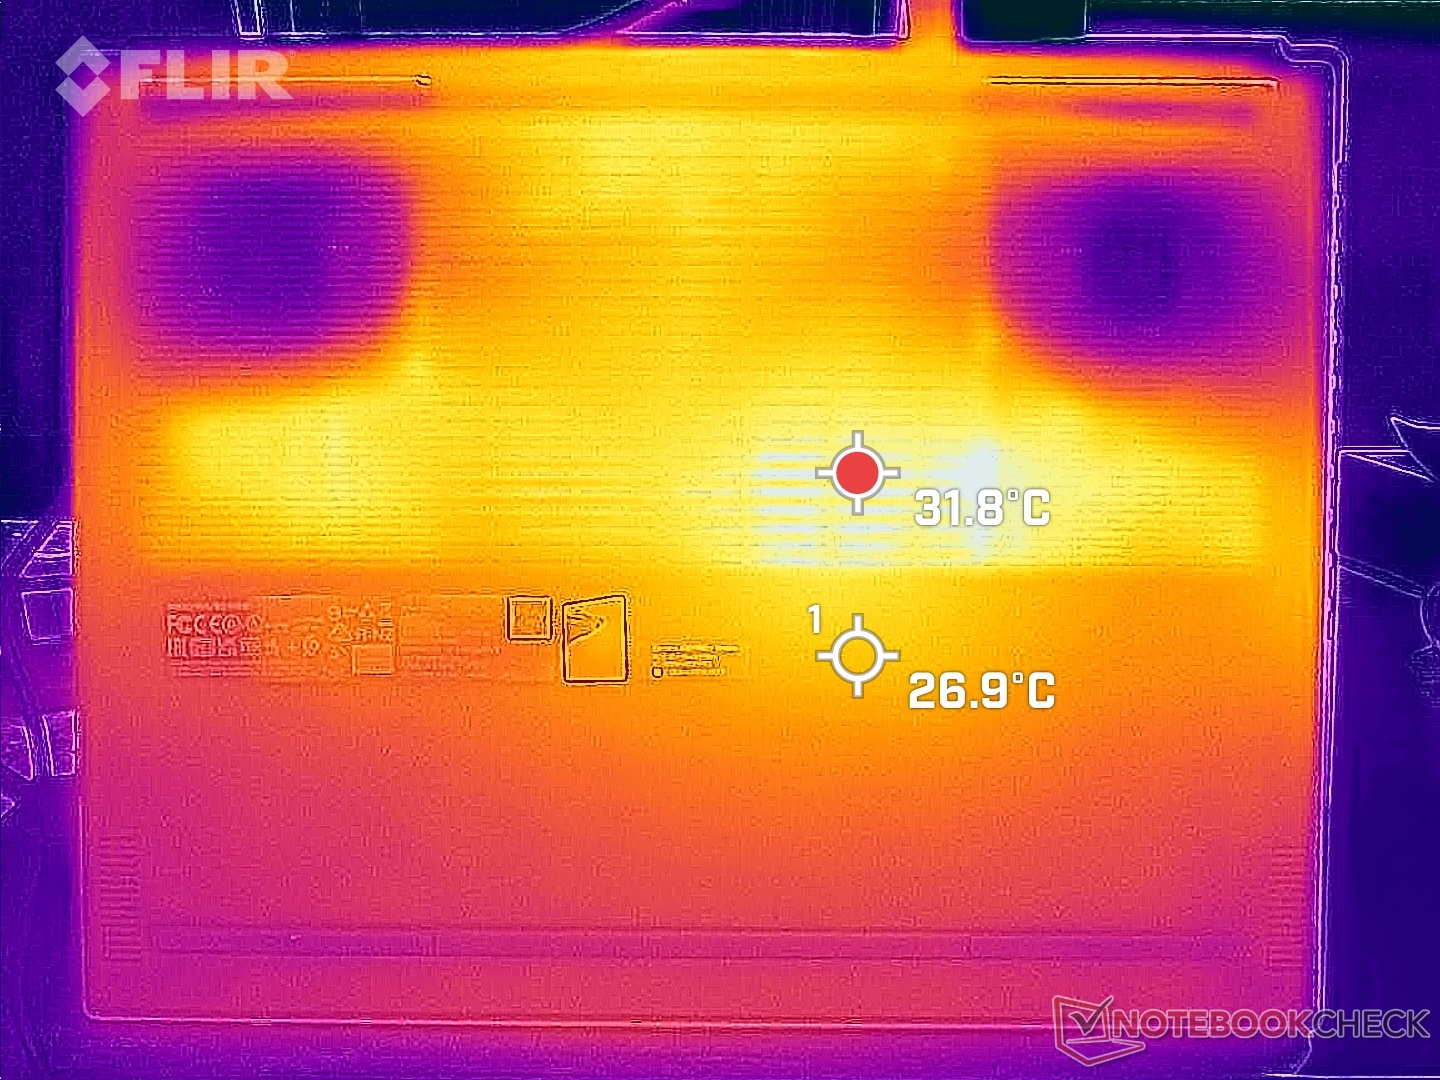
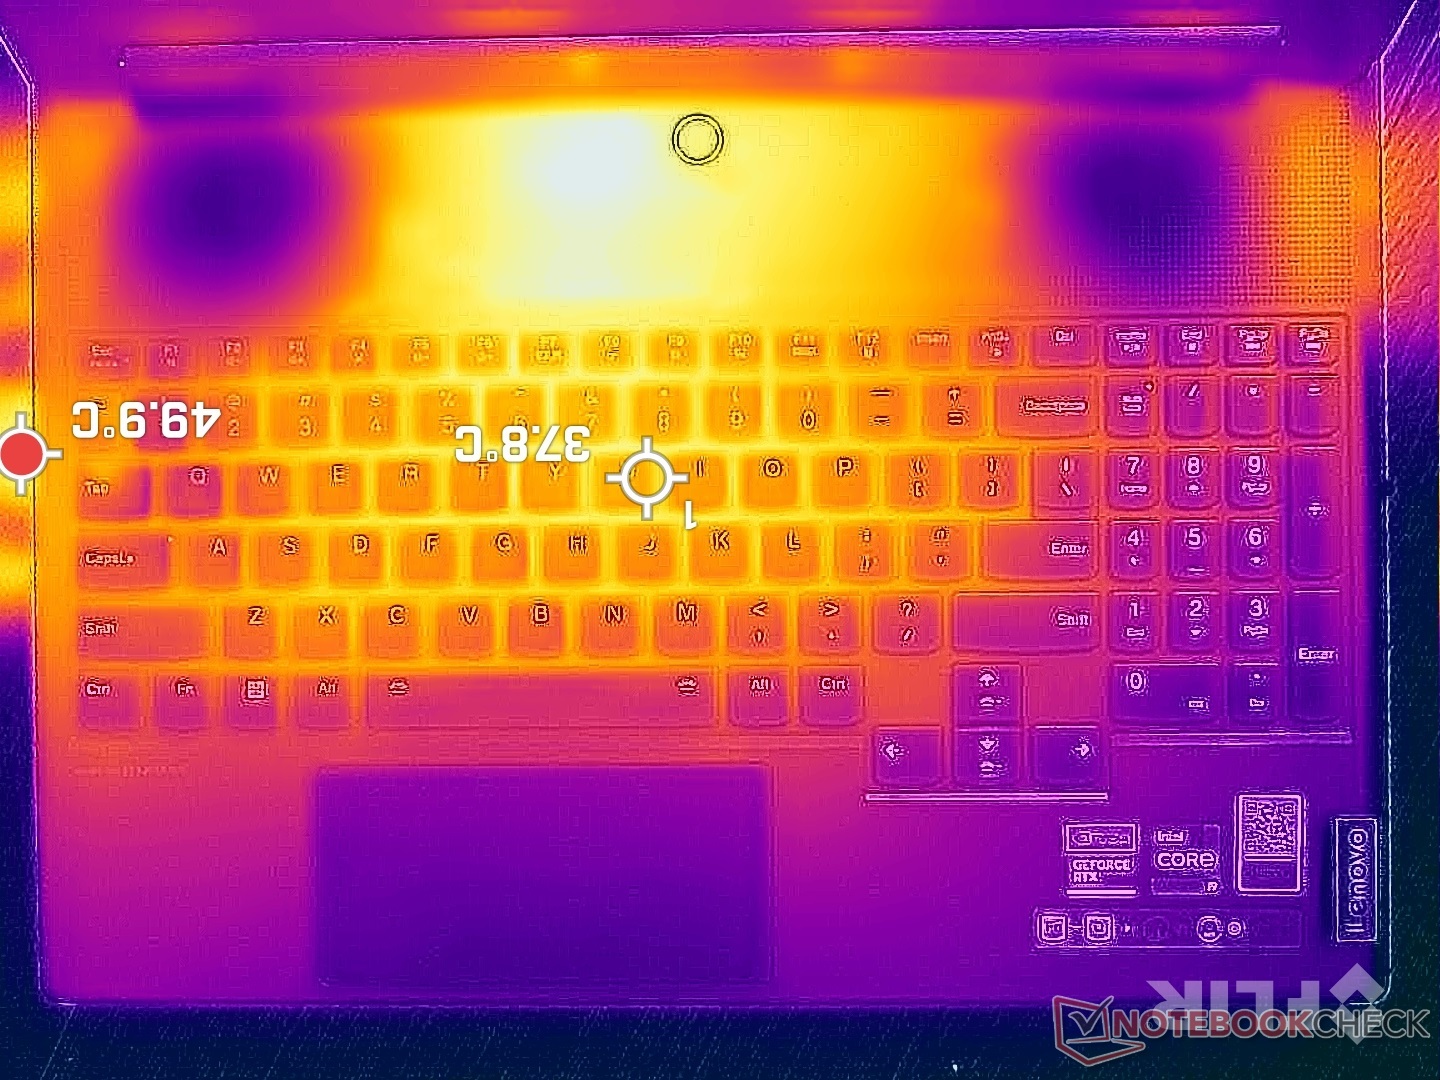
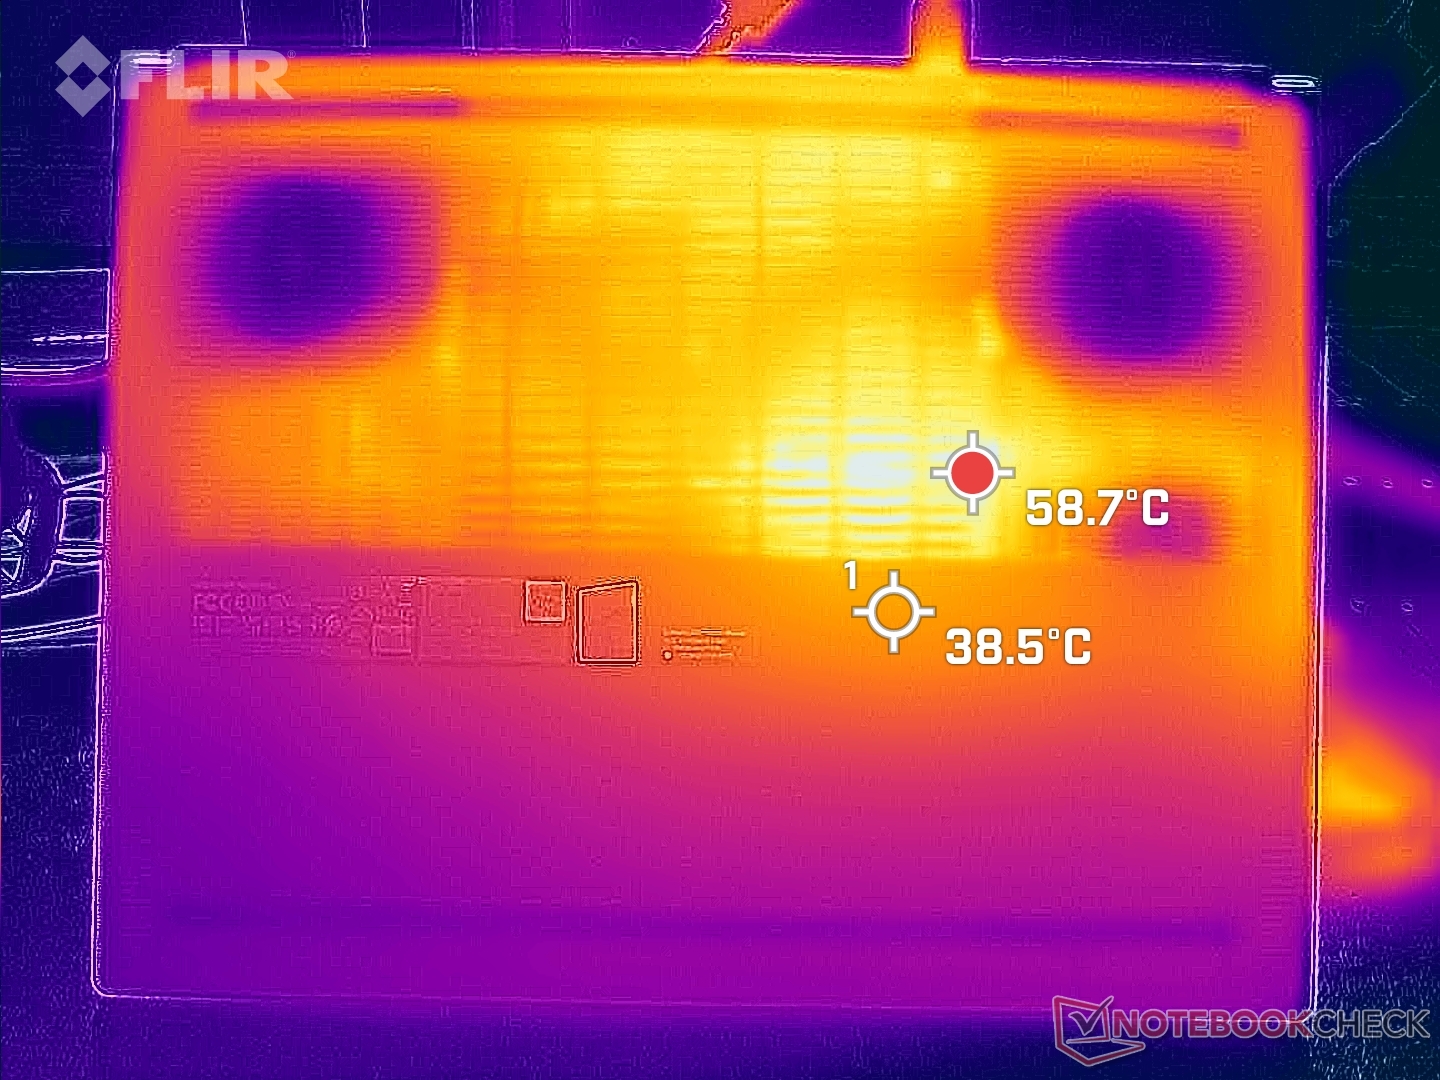
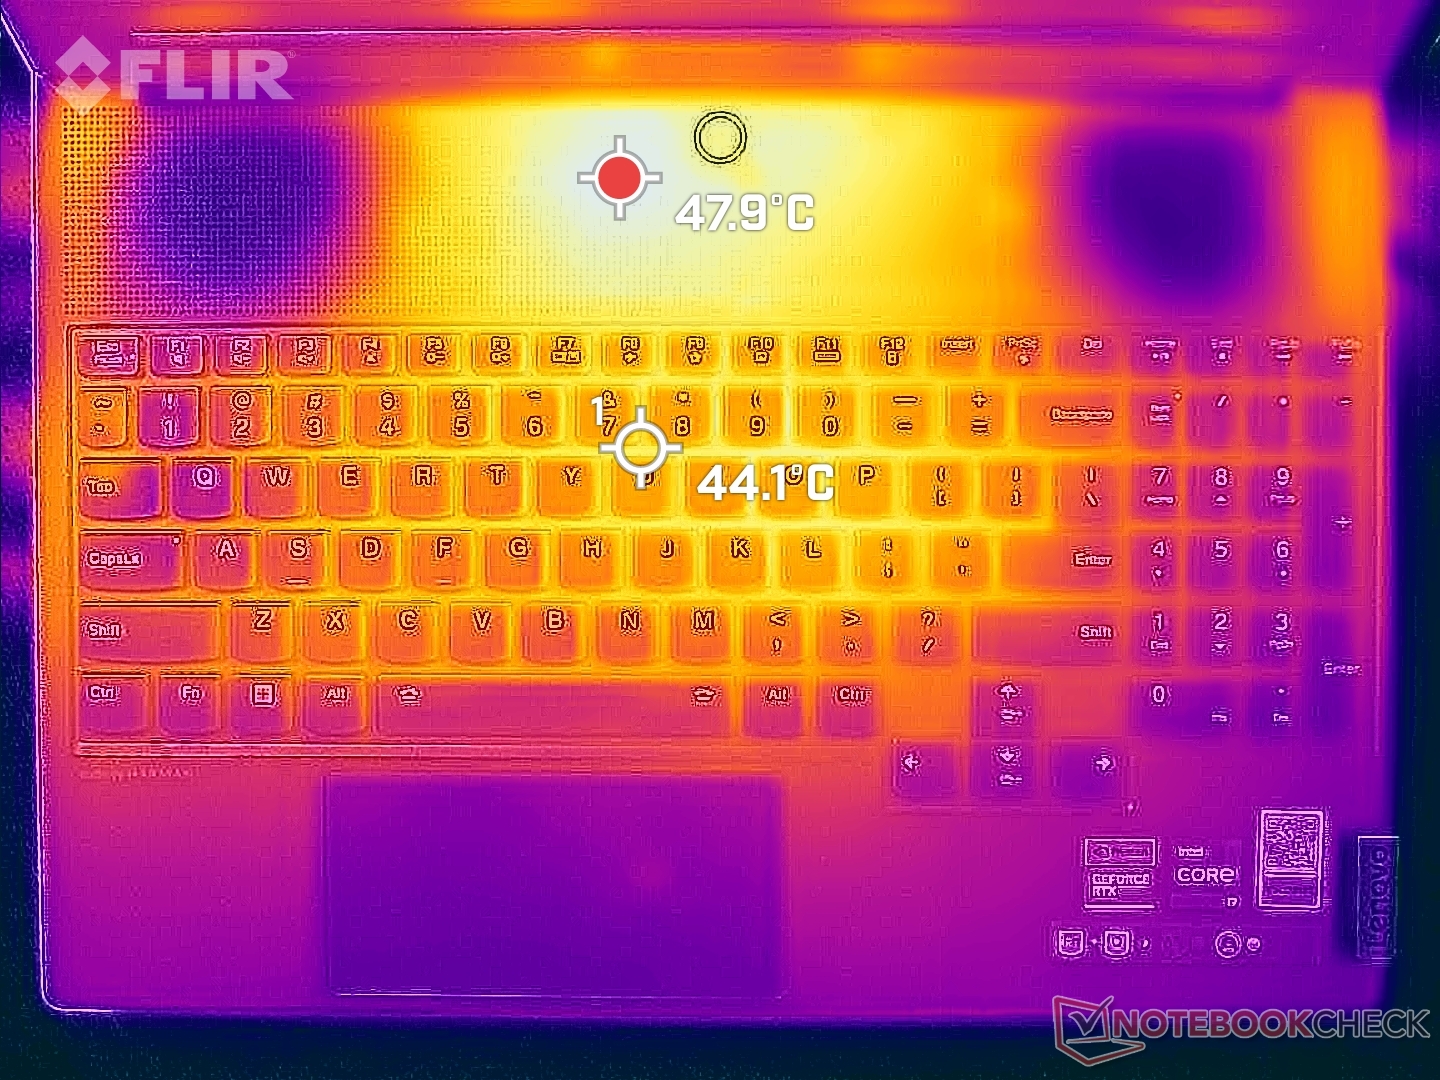
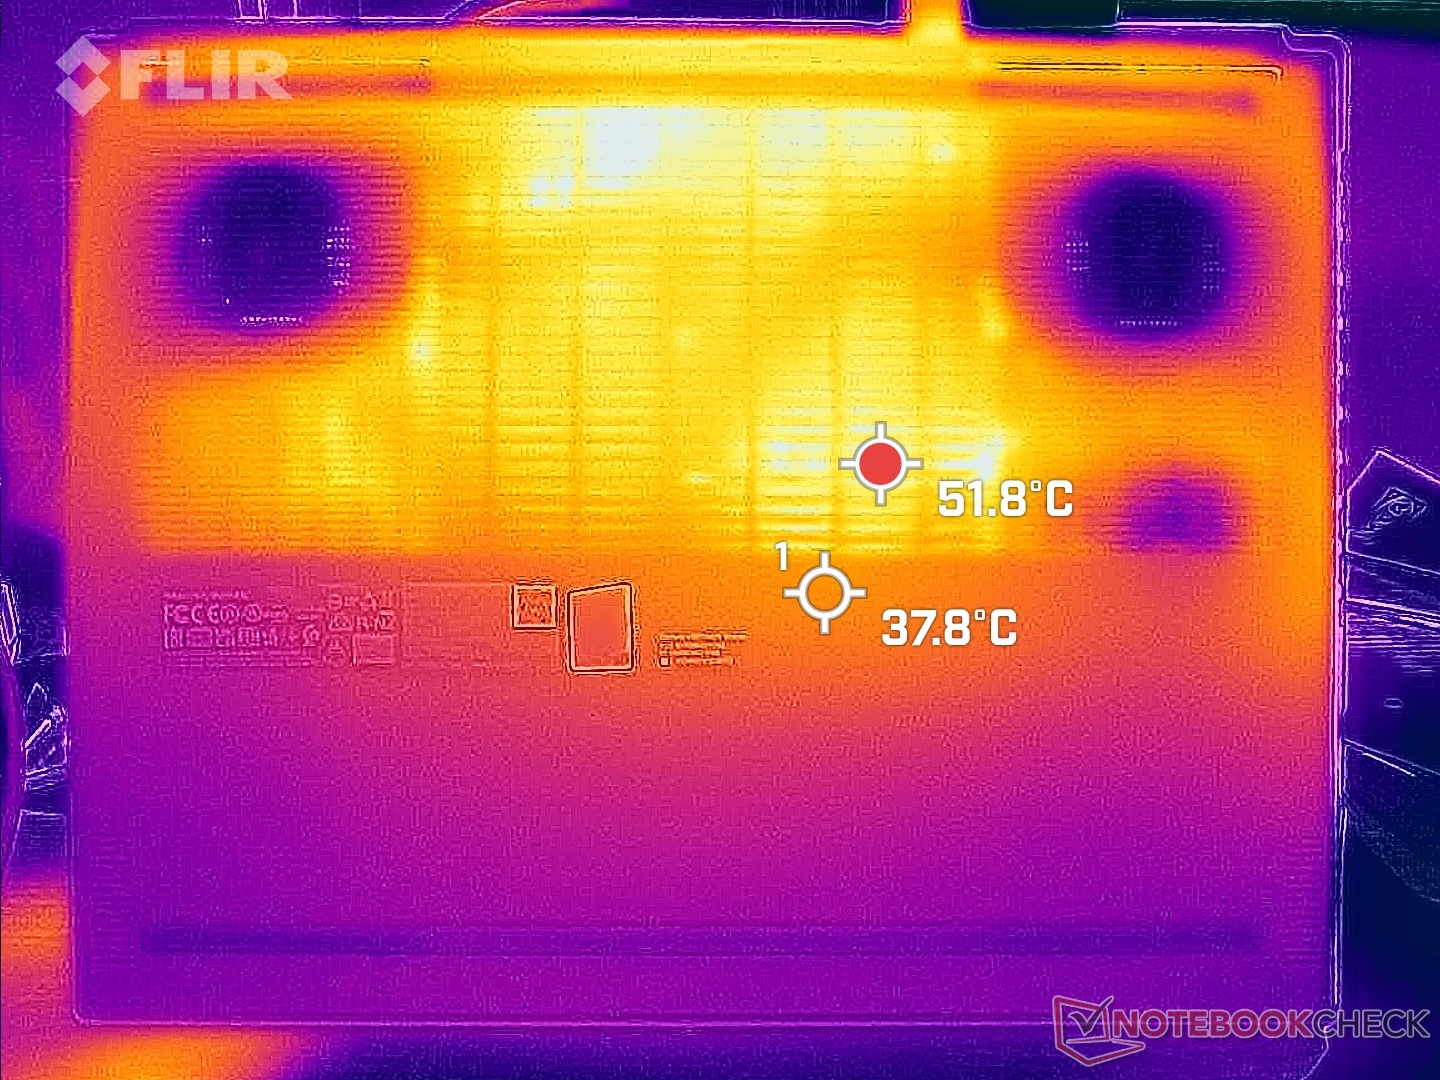
As temperaturas da superfície são bastante quentes, apesar das térmicas avançadas. Durante os jogos, as teclas WASD e o centro do teclado podem chegar a 42 °C e 46 °C, respectivamente, o que é um pouco mais quente do que o observado no Alienware x16 R1. Muitos outros notebooks para jogos, como o Razer Blade 16, puxam o ar fresco das teclas WASD para manter essa parte do teclado resfriada e proporcionar um jogo mais confortável, mas esse não é o caso do nosso design Legion 9 16, como mostram os mapas de temperatura abaixo.
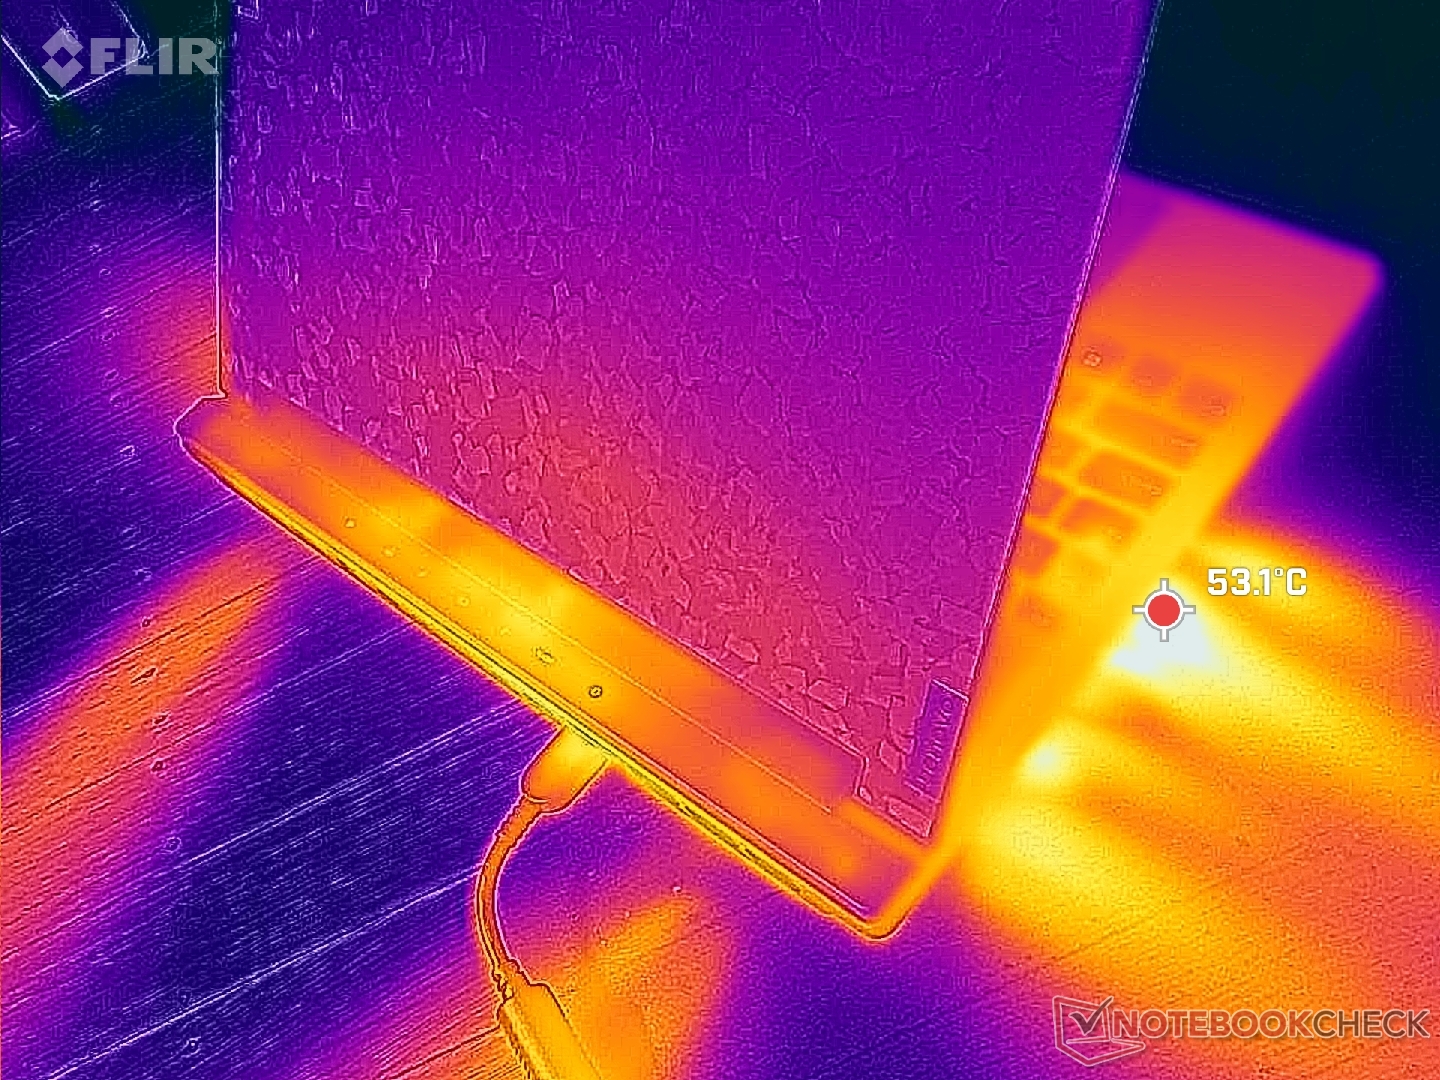
(-) A temperatura máxima no lado superior é 49.6 °C / 121 F, em comparação com a média de 40.4 °C / 105 F , variando de 21.2 a 68.8 °C para a classe Gaming.
(-) A parte inferior aquece até um máximo de 48.6 °C / 119 F, em comparação com a média de 43.2 °C / 110 F
(+) Em uso inativo, a temperatura média para o lado superior é 30 °C / 86 F, em comparação com a média do dispositivo de 33.9 °C / ### class_avg_f### F.
(-) Jogando The Witcher 3, a temperatura média para o lado superior é 38.1 °C / 101 F, em comparação com a média do dispositivo de 33.9 °C / ## #class_avg_f### F.
(+) Os apoios para as mãos e o touchpad estão atingindo a temperatura máxima da pele (33.6 °C / 92.5 F) e, portanto, não estão quentes.
(-) A temperatura média da área do apoio para as mãos de dispositivos semelhantes foi 28.8 °C / 83.8 F (-4.8 °C / -8.7 F).
| Lenovo Legion 9 16IRX8 Intel Core i9-13980HX, NVIDIA GeForce RTX 4090 Laptop GPU | Lenovo Legion Slim 5 16APH8 AMD Ryzen 7 7840HS, NVIDIA GeForce RTX 4060 Laptop GPU | Razer Blade 16 Early 2023 RTX 4090 Intel Core i9-13950HX, NVIDIA GeForce RTX 4090 Laptop GPU | Asus ROG Strix G16 G614JZ Intel Core i9-13980HX, NVIDIA GeForce RTX 4080 Laptop GPU | HP Omen Transcend 16 Intel Core i9-13900HX, NVIDIA GeForce RTX 4070 Laptop GPU | Alienware x16 R1 Intel Core i9-13900HK, NVIDIA GeForce RTX 4080 Laptop GPU | |
|---|---|---|---|---|---|---|
| Heat | 18% | 2% | -1% | 5% | -2% | |
| Maximum Upper Side * (°C) | 49.6 | 40.6 18% | 52 -5% | 54 -9% | 47.4 4% | 47.2 5% |
| Maximum Bottom * (°C) | 48.6 | 42 14% | 47.6 2% | 55 -13% | 54.4 -12% | 47.8 2% |
| Idle Upper Side * (°C) | 33.2 | 27.8 16% | 33 1% | 29 13% | 28.4 14% | 36.8 -11% |
| Idle Bottom * (°C) | 34.2 | 26.6 22% | 30.6 11% | 33 4% | 29.2 15% | 35.8 -5% |
* ... menor é melhor
Teste de estresse
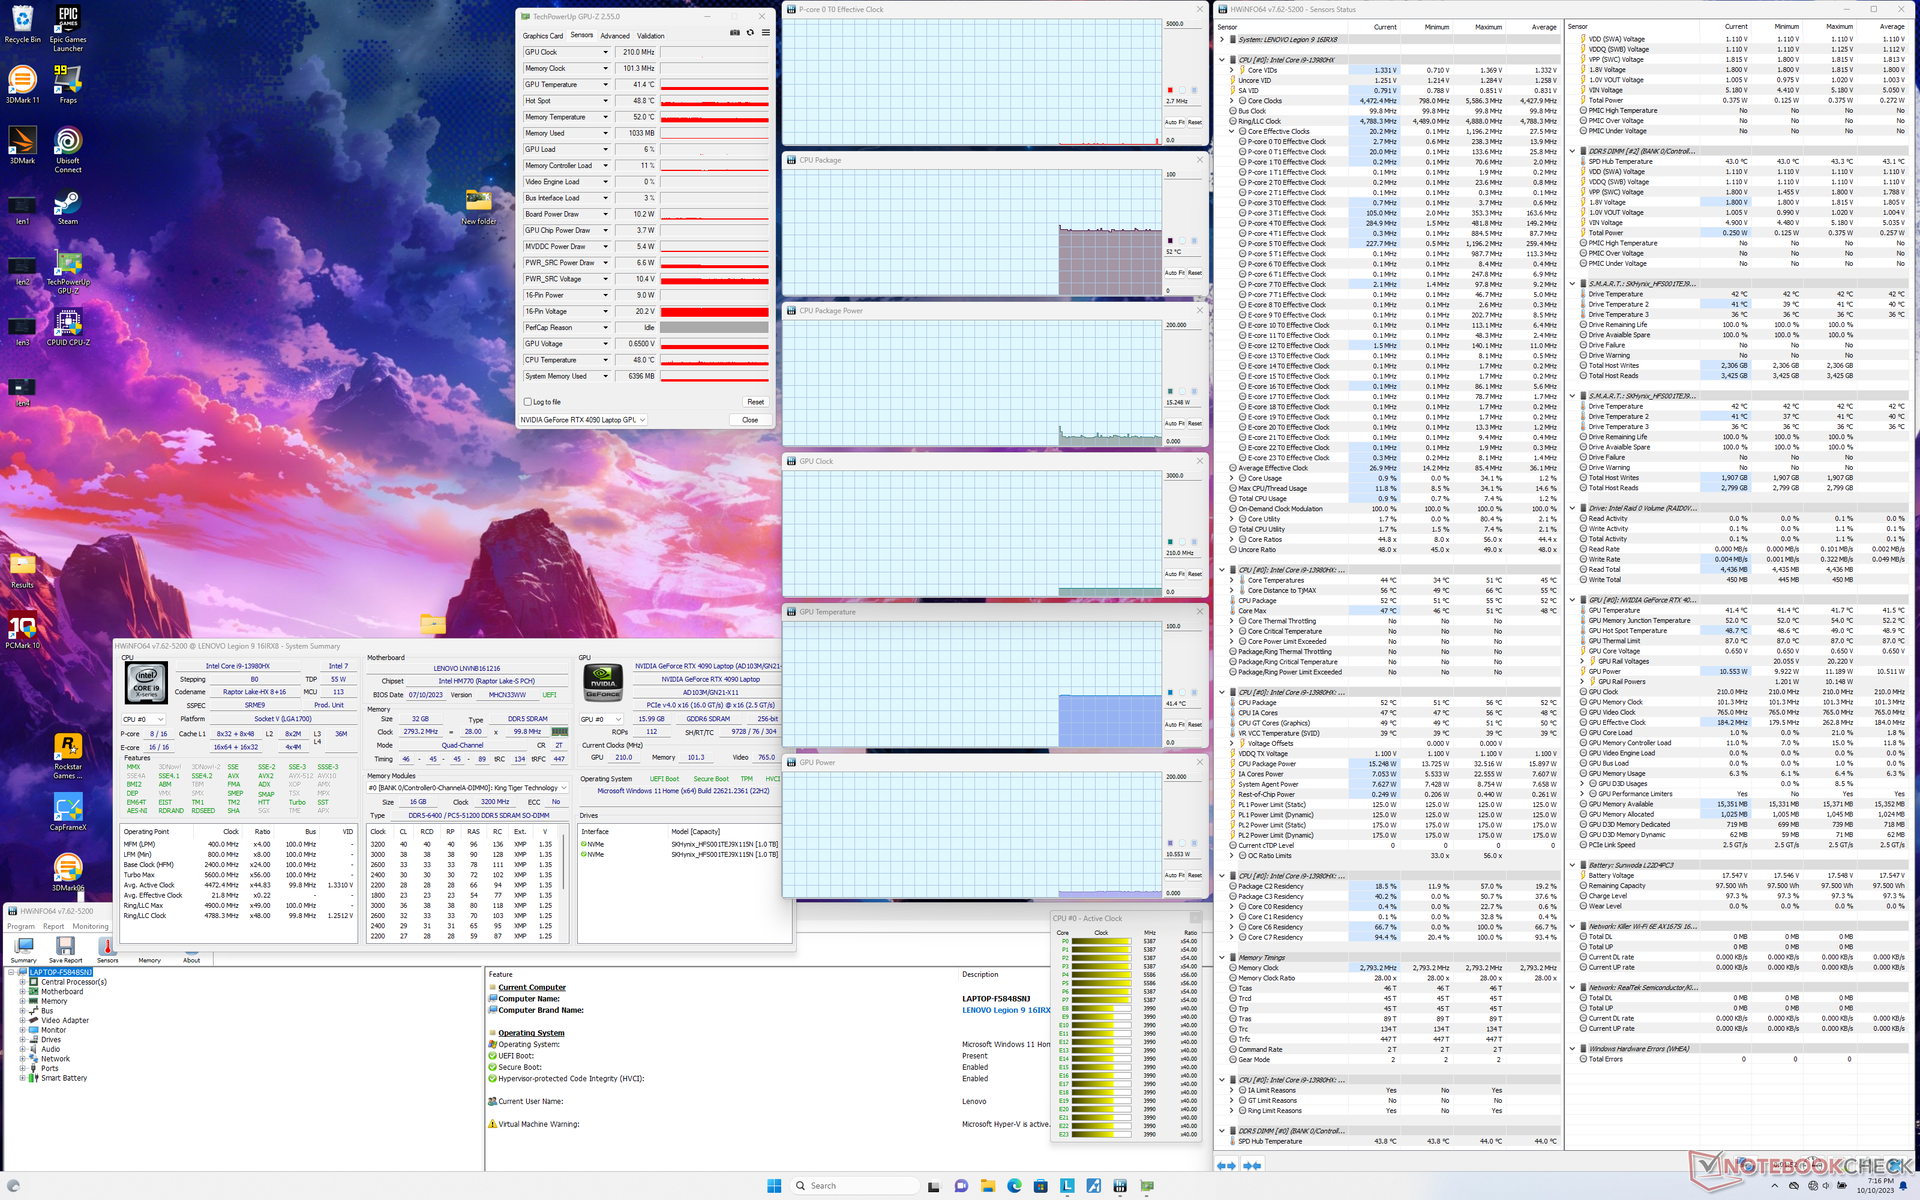
As taxas de clock da CPU e o consumo de energia da placa ao iniciar o estresse do Prime95 aumentavam para 3,6 GHz e 138 W, respectivamente, antes de cair e se estabilizar em 3,0 GHz e 125 W após cerca de um minuto de teste. A temperatura do núcleo se estabilizava em 83 C, em comparação com 100 C no maior Alienware m18 R1 equipado exatamente com o mesmo Core i9-13980HX.
O desempenho da GPU depende muito do perfil de energia selecionado, conforme mencionado acima na seção Desempenho da GPU. Ao executar Witcher 3 no modo Performance, por exemplo, a GPU da Nvidia se estabilizaria em 2265 MHz e 160 W, em comparação com apenas 1650 MHz e 104 W no modo Balanced com o Overclock da GPU desativado. A temperatura da GPU se estabilizaria em 78 °C, em comparação com 71 °C no Blade 16 com a mesma GPU RTX 4090.
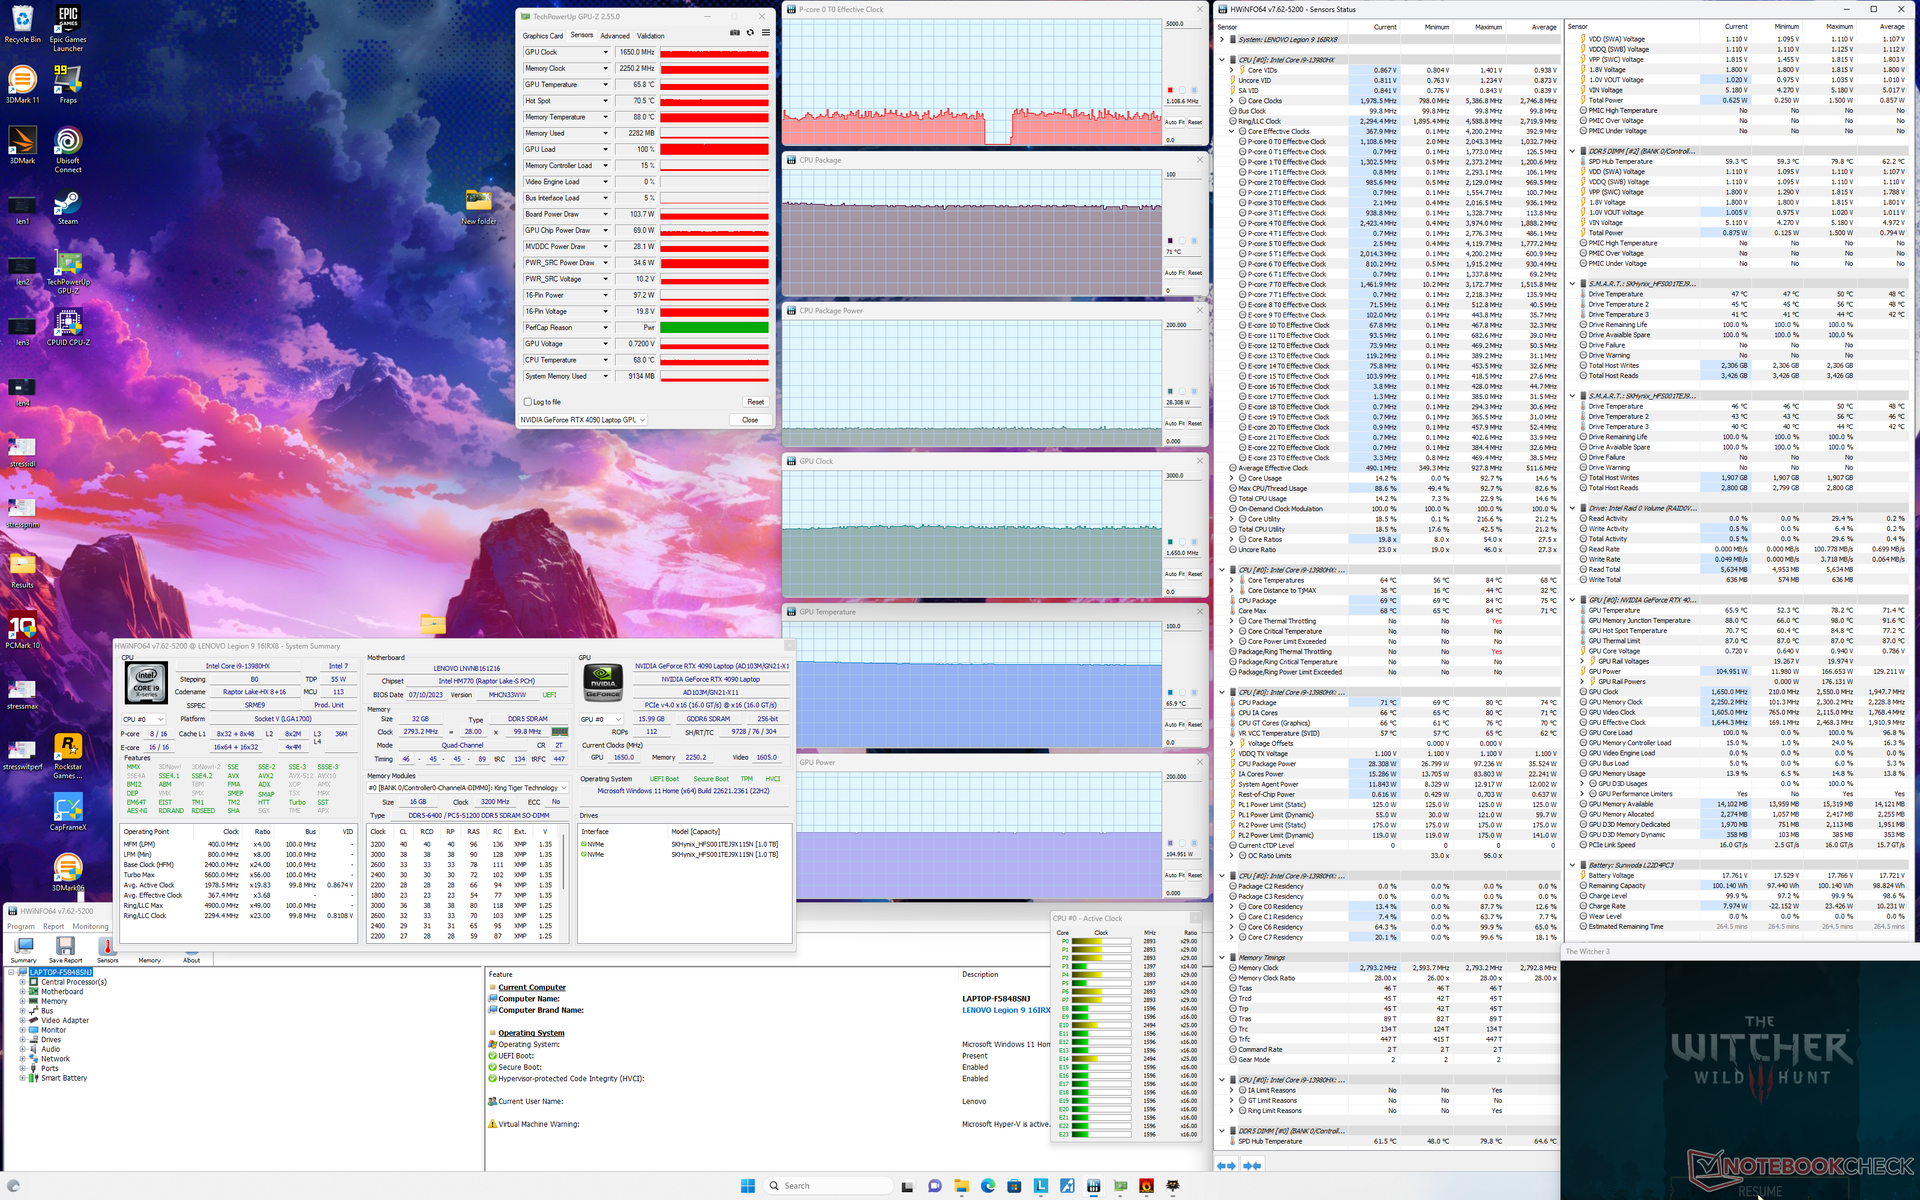
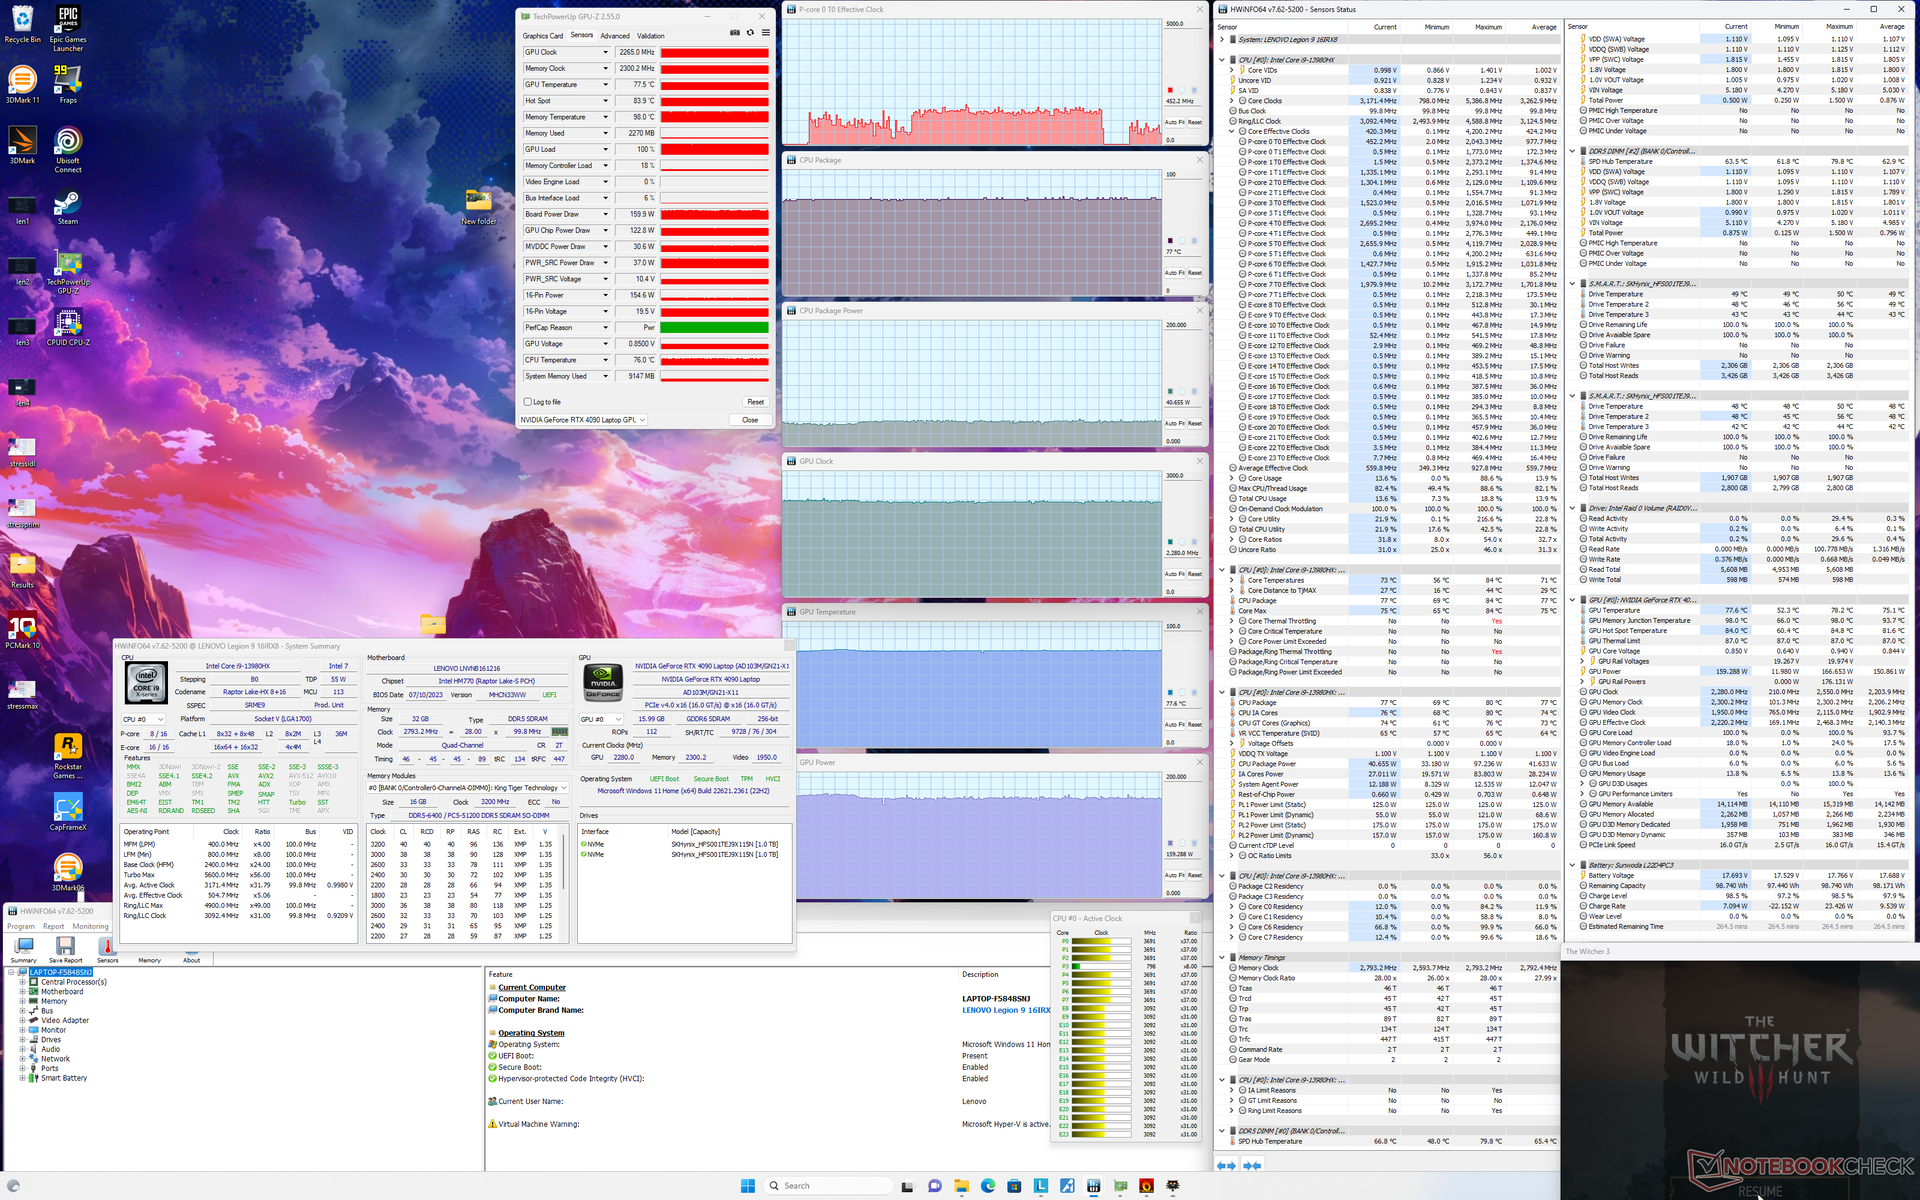
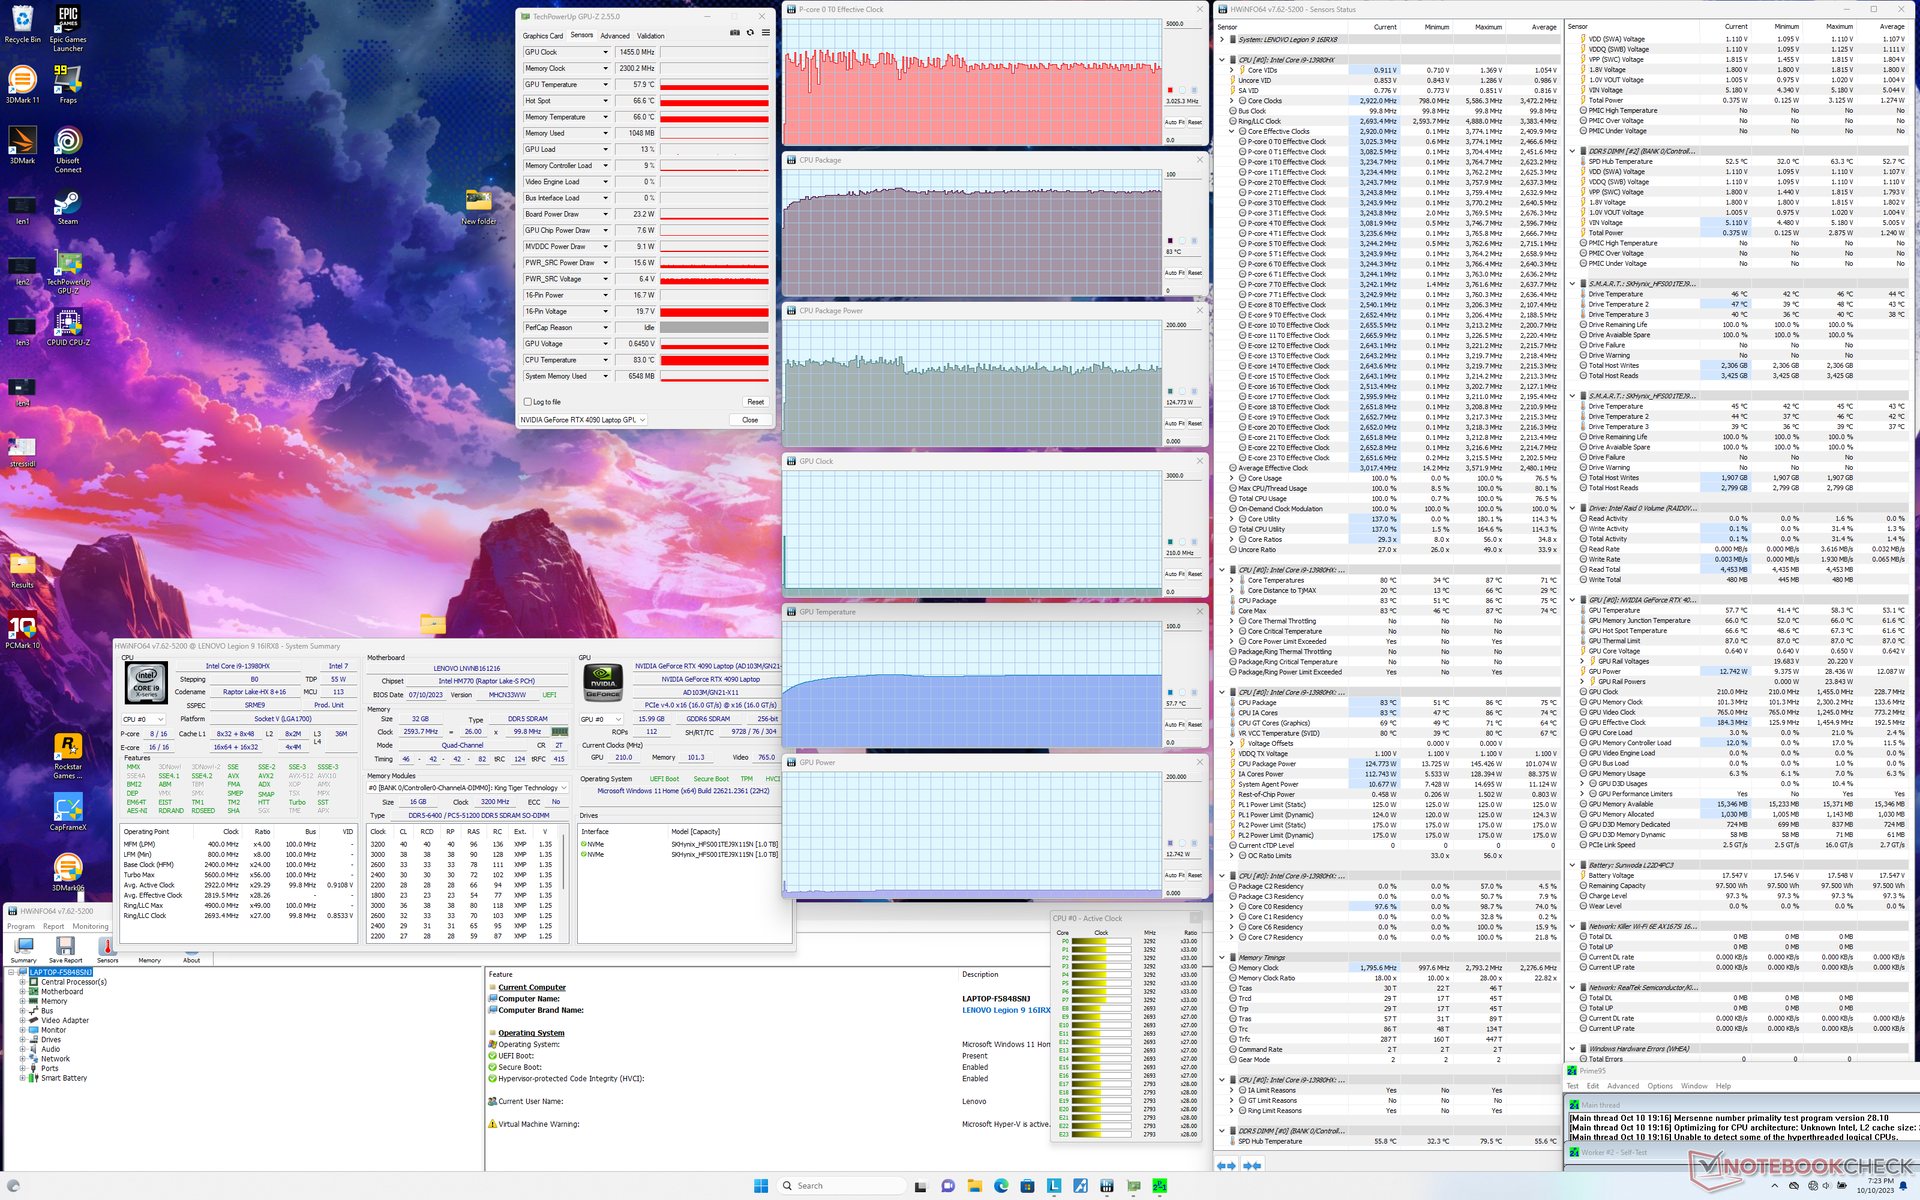
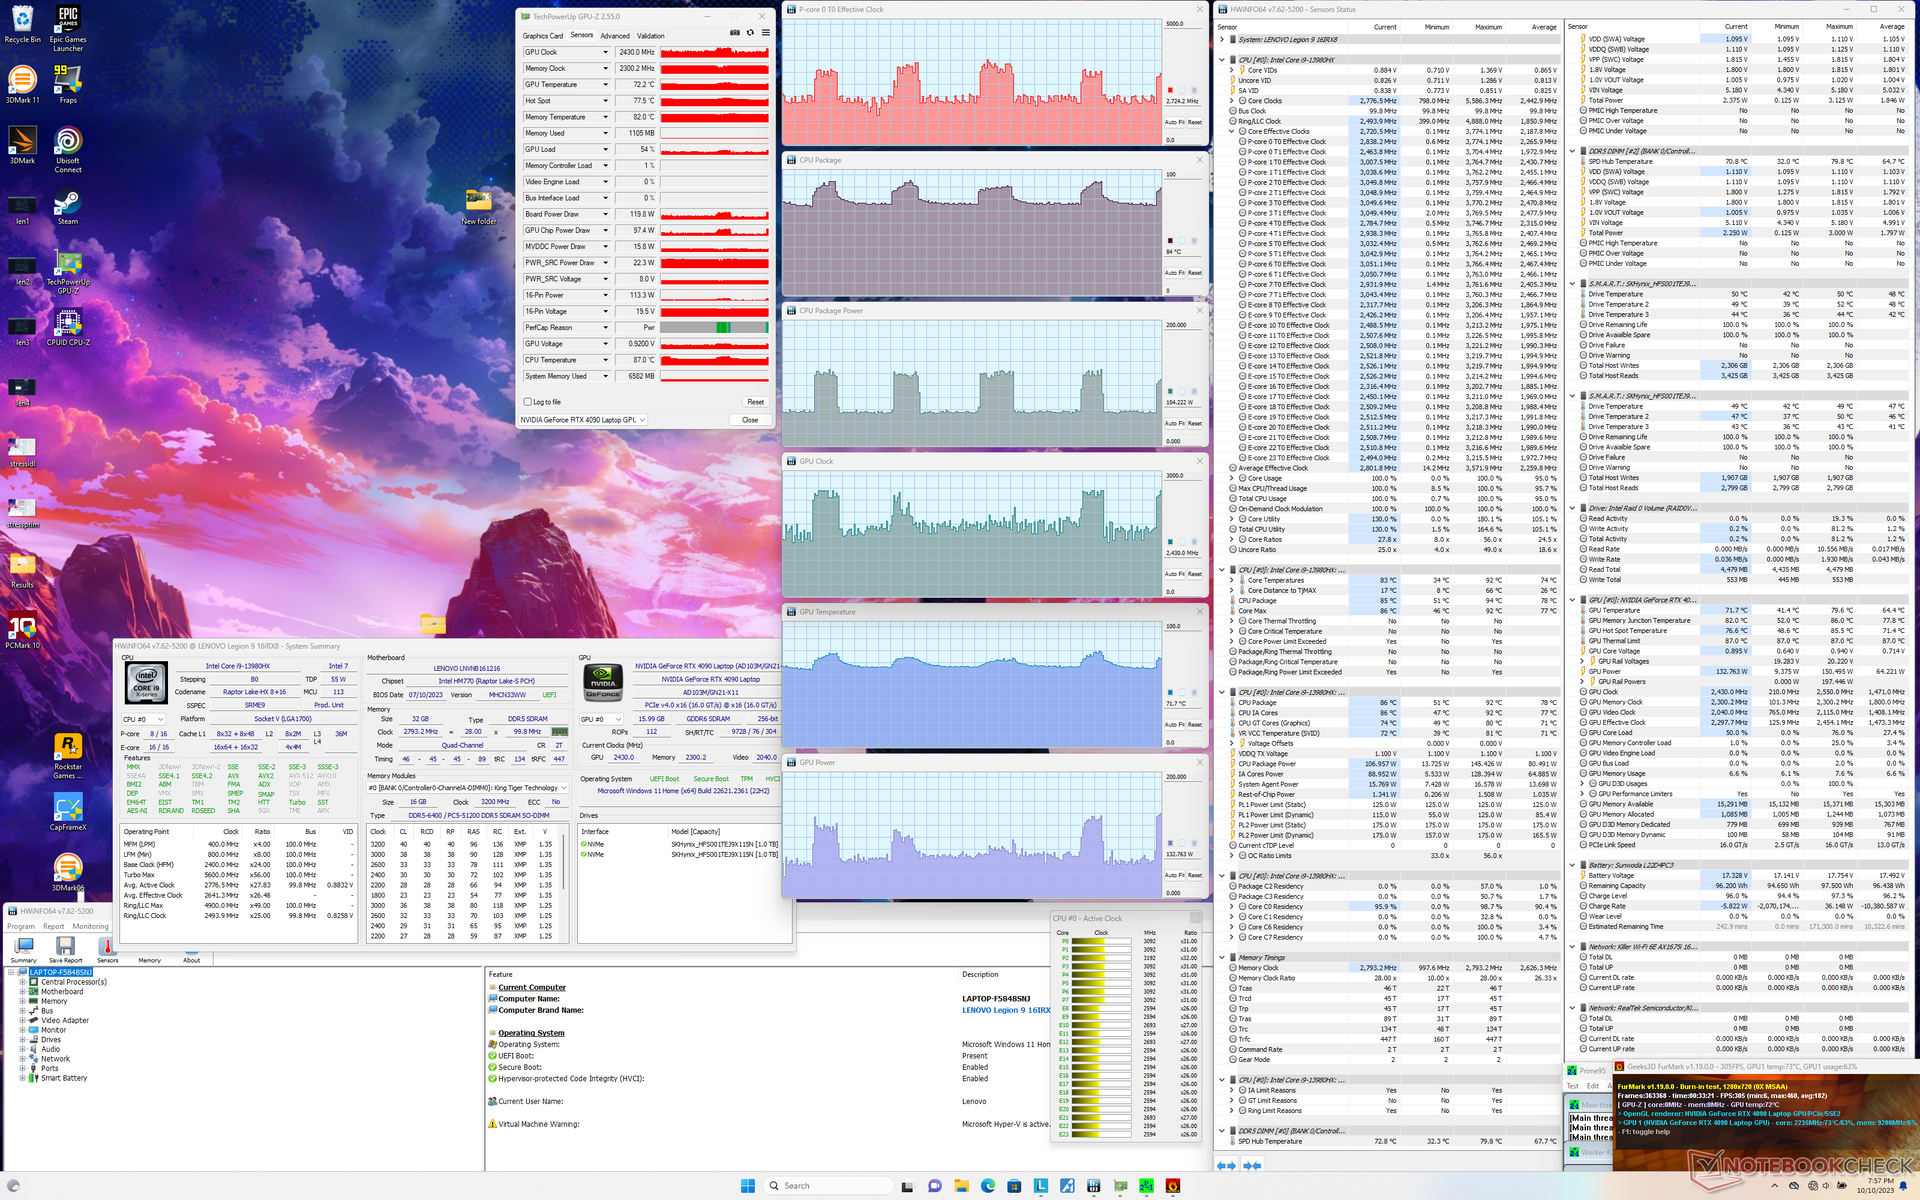
| CPU Clock (GHz) | GPU Clock (MHz) | Temperatura média da CPU (°C) | Temperatura média da GPU (°C) | |
| Sistema ocioso | -- | -- | 52 | 41 |
| Estresse doPrime95 | 3.0 | -- | 83 | 58 |
| Estresse doPrime95 + FurMark | 1.6 - 3.4 | 1365 - 2535 | 74 - 86 | 72 - 78 |
| Witcher 3 Estresse(modo balanceado com overclock da GPU desativado) | ~1.1 | 1650 | 71 | 66 |
| Witcher 3 Estresse(modo de desempenho) | ~1.1 | 2265 | 77 | 78 |
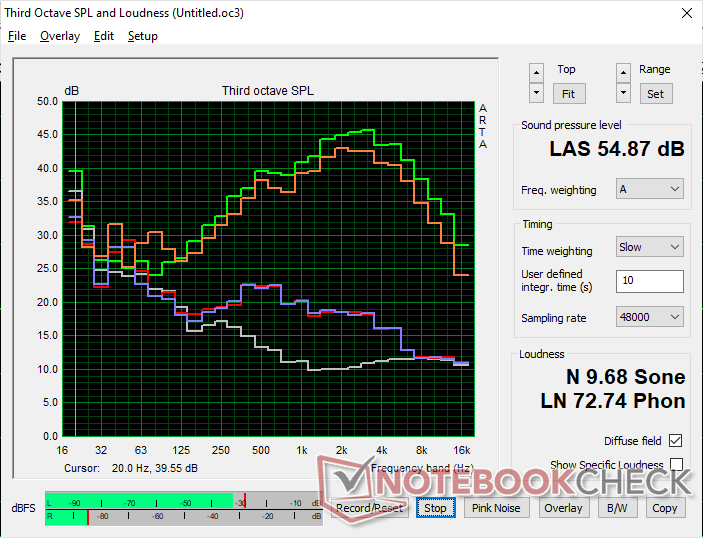
Alto-falantes
Lenovo Legion 9 16IRX8 análise de áudio
(+) | os alto-falantes podem tocar relativamente alto (###valor### dB)
Graves 100 - 315Hz
(±) | graves reduzidos - em média 13.5% menor que a mediana
(±) | a linearidade dos graves é média (9% delta para a frequência anterior)
Médios 400 - 2.000 Hz
(+) | médios equilibrados - apenas 1.5% longe da mediana
(+) | médios são lineares (5.7% delta para frequência anterior)
Altos 2 - 16 kHz
(+) | agudos equilibrados - apenas 2.4% longe da mediana
(+) | os máximos são lineares (3.7% delta da frequência anterior)
Geral 100 - 16.000 Hz
(+) | o som geral é linear (11% diferença em relação à mediana)
Comparado com a mesma classe
» 7% de todos os dispositivos testados nesta classe foram melhores, 3% semelhantes, 89% piores
» O melhor teve um delta de 6%, a média foi 18%, o pior foi 132%
Comparado com todos os dispositivos testados
» 6% de todos os dispositivos testados foram melhores, 2% semelhantes, 92% piores
» O melhor teve um delta de 4%, a média foi 23%, o pior foi 134%
Apple MacBook Pro 16 2021 M1 Pro análise de áudio
(+) | os alto-falantes podem tocar relativamente alto (###valor### dB)
Graves 100 - 315Hz
(+) | bons graves - apenas 3.8% longe da mediana
(+) | o baixo é linear (5.2% delta para a frequência anterior)
Médios 400 - 2.000 Hz
(+) | médios equilibrados - apenas 1.3% longe da mediana
(+) | médios são lineares (2.1% delta para frequência anterior)
Altos 2 - 16 kHz
(+) | agudos equilibrados - apenas 1.9% longe da mediana
(+) | os máximos são lineares (2.7% delta da frequência anterior)
Geral 100 - 16.000 Hz
(+) | o som geral é linear (4.6% diferença em relação à mediana)
Comparado com a mesma classe
» 0% de todos os dispositivos testados nesta classe foram melhores, 0% semelhantes, 100% piores
» O melhor teve um delta de 5%, a média foi 17%, o pior foi 45%
Comparado com todos os dispositivos testados
» 0% de todos os dispositivos testados foram melhores, 0% semelhantes, 100% piores
» O melhor teve um delta de 4%, a média foi 23%, o pior foi 134%
Gerenciamento de energia
Consumo de energia
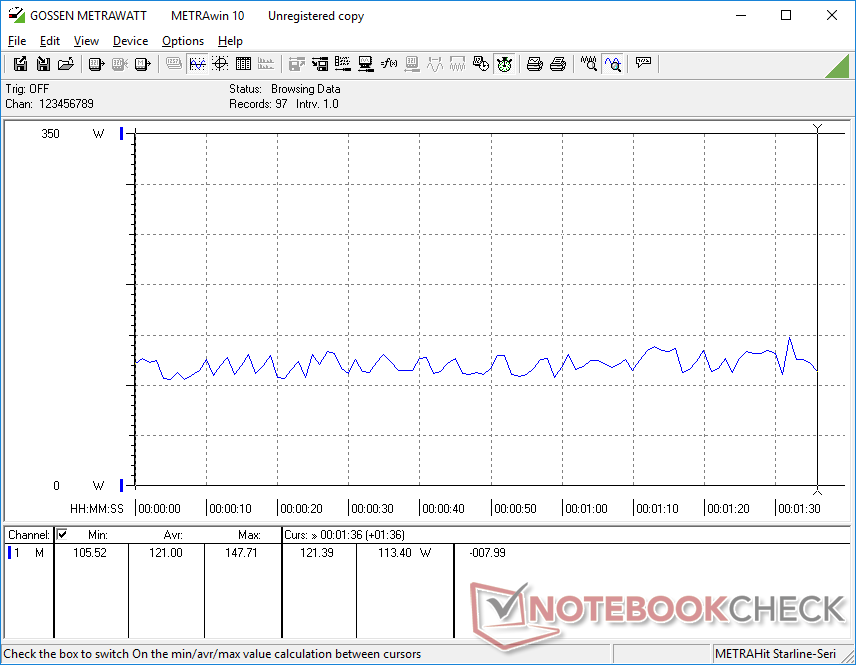
O consumo de energia é muito alto, independentemente da configuração de energia. Ocioso no desktop no modo Power Saver iGPU e na configuração de brilho mínimo ainda exigiria 32 W em comparação com apenas 9 W a 10 W no Legion Slim 5 16 ou Asus ROG Strix G16 cada um com painéis IPS. O consumo também depende não apenas do brilho, mas também da cor, como acontece com um painel OLED. Uma tela totalmente branca em nosso Legion 9i 16, por exemplo, exigiria cerca de 13 W a mais do que uma tela totalmente preta, mesmo com a configuração máxima de brilho para ambas as cores. Os painéis IPS exigiriam apenas alguns watts, no máximo, independentemente da cor em comparação.
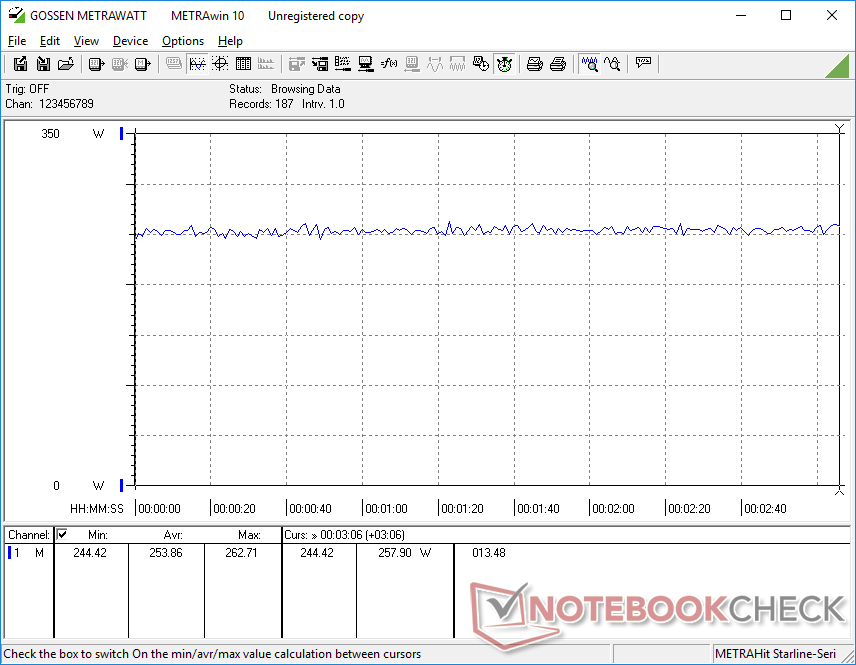
A execução do Prime95 em um monitor externo mostra níveis de consumo muito semelhantes entre a nossa unidade Lenovo e o Asus ROG Strix Scar 17 equipado com o Ryzen 9 7945HX da concorrência, conforme mostram os gráficos de comparação abaixo. No entanto, o desempenho por watt ainda está a favor da AMD, já que o Ryzen 9 7945HX supera nosso Core i9-13980HX em cargas de trabalho multithread, apesar de suas demandas de energia semelhantes.
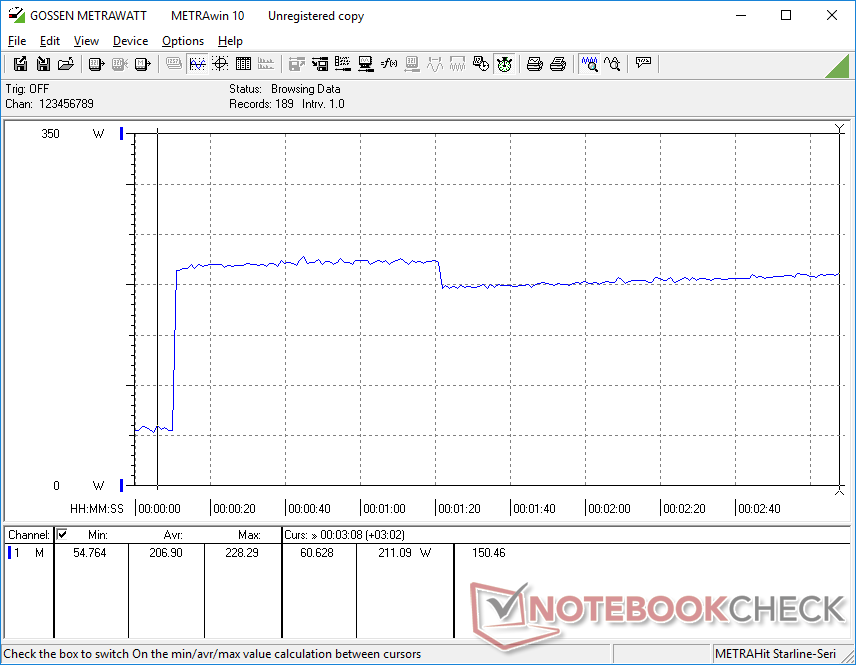
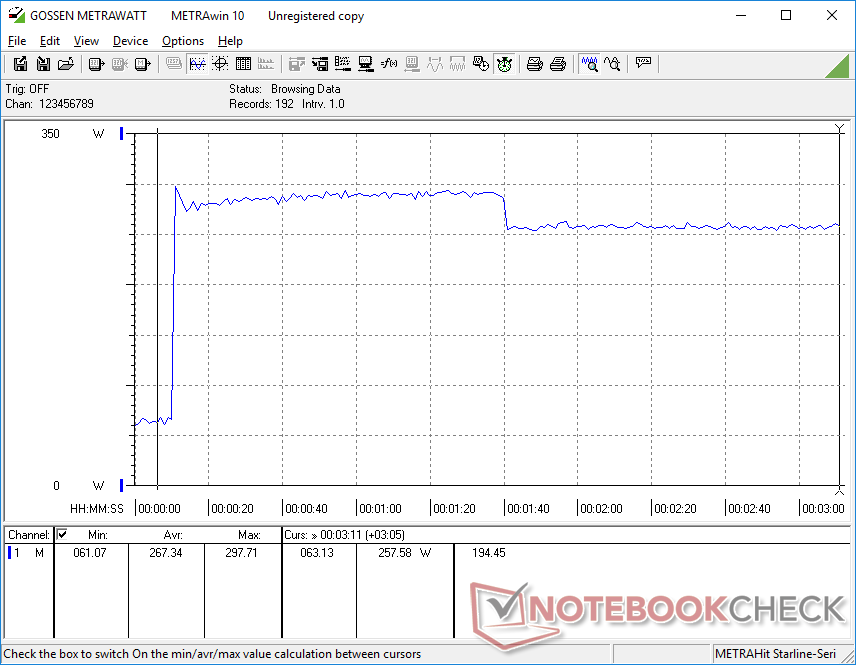
O consumo em jogos é ligeiramente maior, em cerca de 10%, em comparação com o Asus ROG Strix Scar 17 SE com a antiga RTX 3080 Ti. No entanto, o aumento de 40% a 75% no desempenho gráfico com nossa RTX 4090 mais do que compensa o menor aumento no consumo. O altíssimo desempenho por watt da série móvel Ada Lovelace é impressionante e inigualável no momento.
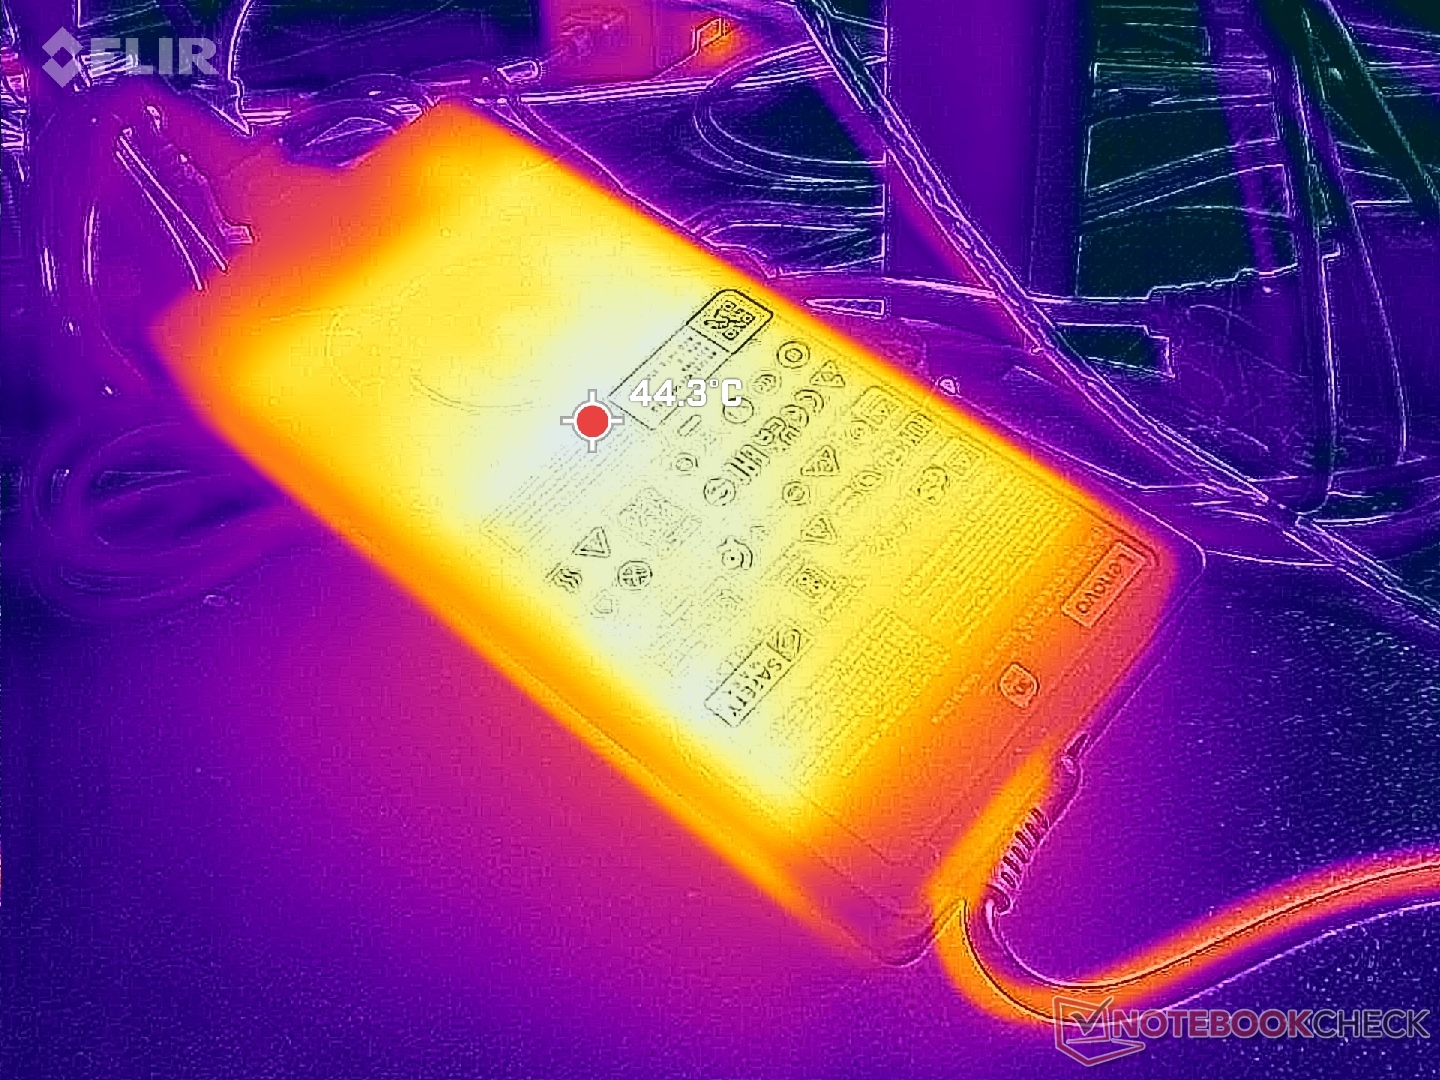
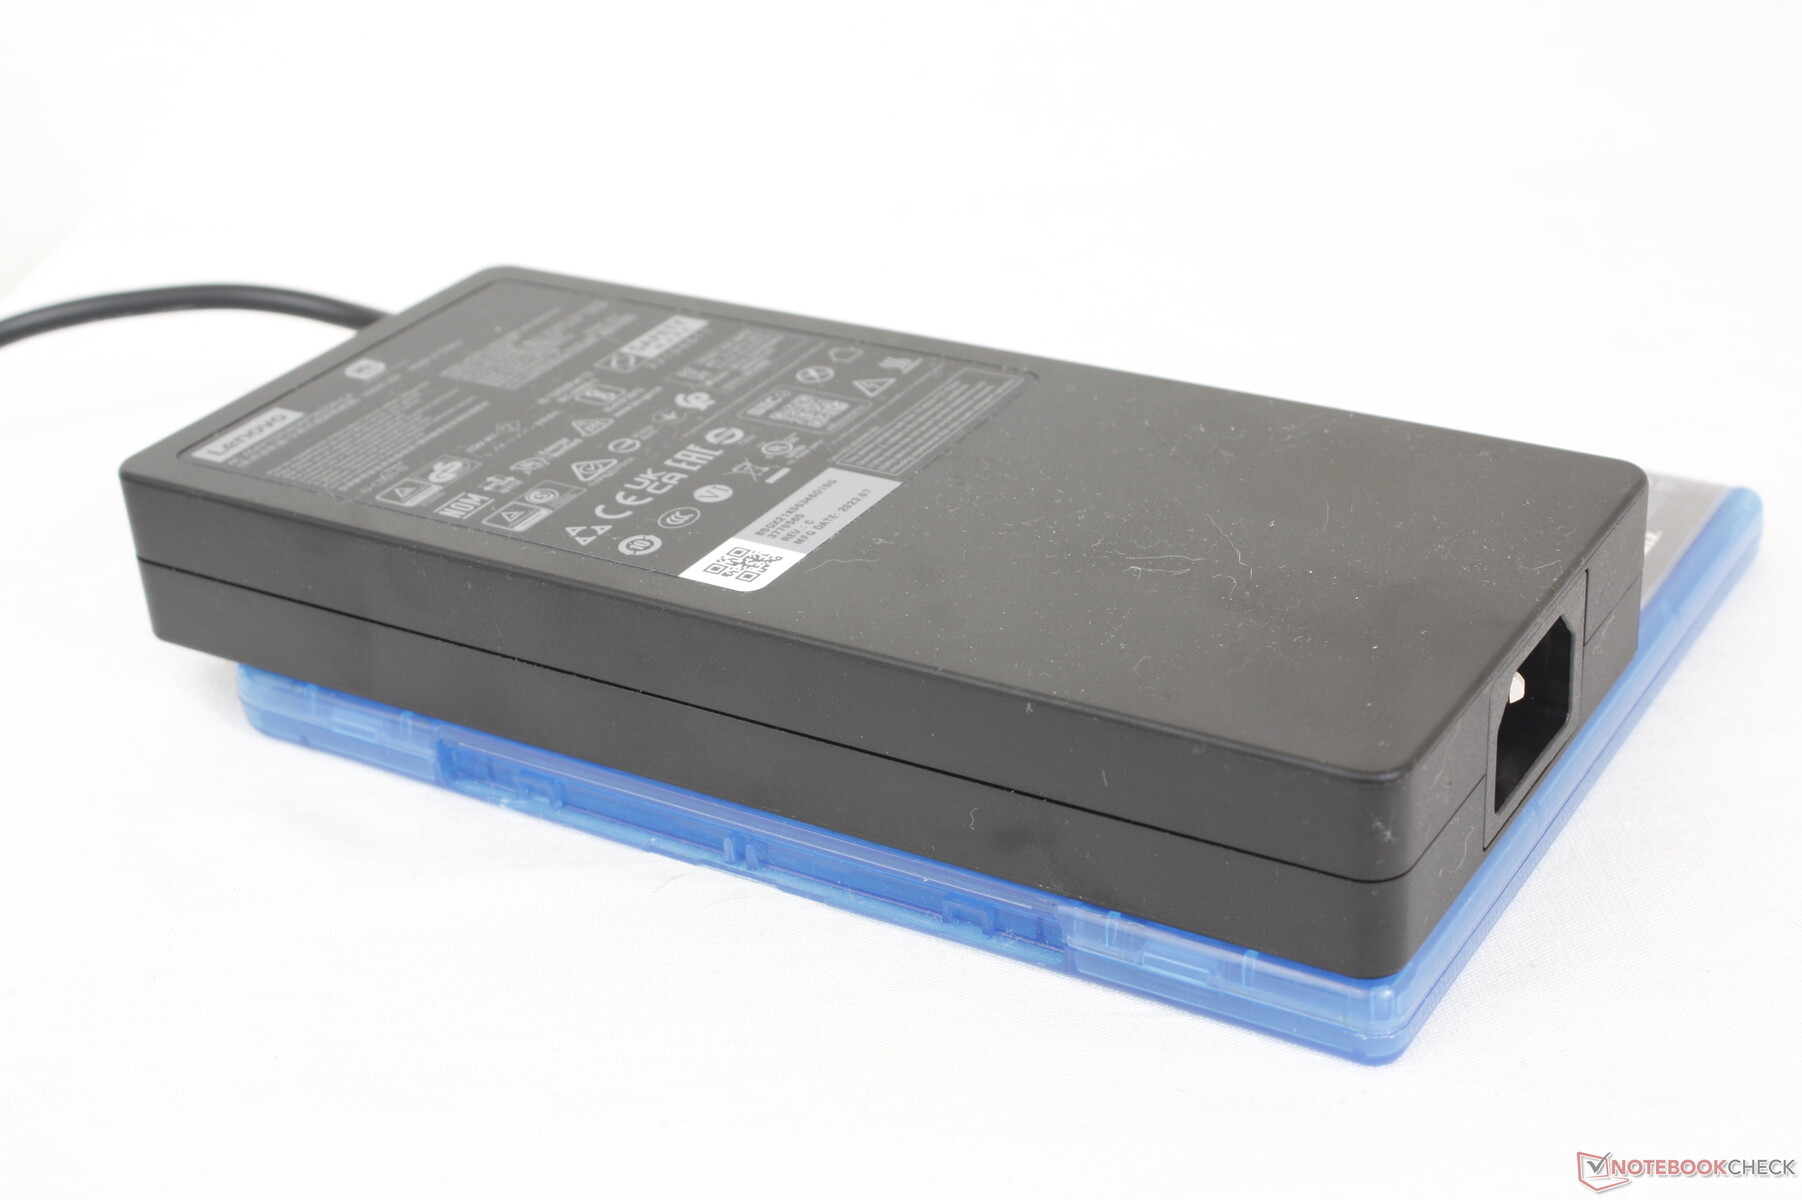
Conseguimos medir um consumo máximo de 298 W do adaptador CA de 330 W de tamanho médio (18,5 x 2,6 x 8,3 cm) quando a CPU e a GPU estão com 100% de utilização. Essa taxa é apenas temporária devido a limitações térmicas.
| desligado | |
| Ocioso | |
| Carga |
|
Key:
min: | |
| Lenovo Legion 9 16IRX8 i9-13980HX, GeForce RTX 4090 Laptop GPU, 2x SK Hynix HFS001TEJ9X115N (RAID 0), Mini-LED, 3200x2000, 16" | Lenovo Legion Slim 5 16APH8 R7 7840HS, GeForce RTX 4060 Laptop GPU, SK hynix PC801 HFS512GEJ9X115N, IPS, 2560x1600, 16" | Razer Blade 16 Early 2023 RTX 4090 i9-13950HX, GeForce RTX 4090 Laptop GPU, SSSTC CA6-8D1024, mini-LED, 3840x2400, 16" | Asus ROG Strix G16 G614JZ i9-13980HX, GeForce RTX 4080 Laptop GPU, WD PC SN560 SDDPNQE-1T00, IPS, 2560x1600, 16" | HP Omen Transcend 16 i9-13900HX, GeForce RTX 4070 Laptop GPU, SK hynix PC801 HFS002TEJ9X101N, Mini-LED, 2560x1600, 16" | Alienware x16 R1 i9-13900HK, GeForce RTX 4080 Laptop GPU, SK hynix PC801 HFS001TEJ9X101N, IPS, 2560x1600, 16" | |
|---|---|---|---|---|---|---|
| Power Consumption | 53% | 9% | 28% | 18% | 12% | |
| Idle Minimum * (Watt) | 32.3 | 9.4 71% | 27.5 15% | 10 69% | 19.2 41% | 25.2 22% |
| Idle Average * (Watt) | 42.6 | 15.5 64% | 34.4 19% | 16 62% | 22.7 47% | 29.9 30% |
| Idle Maximum * (Watt) | 57.9 | 24.4 58% | 35.4 39% | 27 53% | 55.4 4% | 49.8 14% |
| Load Average * (Watt) | 121 | 74.1 39% | 147.8 -22% | 129 -7% | 128.4 -6% | 105.4 13% |
| Witcher 3 ultra * (Watt) | 254 | 112.9 56% | 256 -1% | 247 3% | 206 19% | 263 -4% |
| Load Maximum * (Watt) | 297.7 | 206.5 31% | 286.7 4% | 342 -15% | 292 2% | 313.8 -5% |
* ... menor é melhor
Power Consumption Witcher 3 / Stresstest
Power Consumption external Monitor
Duração da bateria
Os tempos de execução são ruins, o que se correlaciona com nossos números de alto consumo de energia acima. Só conseguimos navegar na Web por apenas 160 minutos, mesmo quando configurado no modo Balanced iGPU. Outros notebooks com mini-LED, como o HP Omen Transcend 16também apresentam tempos de execução muito curtos, apesar de suas grandes baterias de mais de 90 Wh.
O carregamento é, pelo menos, muito rápido, cerca de uma hora quando o Lenovo Rapid Charge está ativado, em comparação com 90 minutos ou mais na maioria dos outros notebooks para jogos. Adaptadores USB-C de terceiros também podem carregar o sistema, embora em um ritmo mais lento e com compatibilidade não garantida.
| Lenovo Legion 9 16IRX8 i9-13980HX, GeForce RTX 4090 Laptop GPU, 99.9 Wh | Lenovo Legion Slim 5 16APH8 R7 7840HS, GeForce RTX 4060 Laptop GPU, 80 Wh | Razer Blade 16 Early 2023 RTX 4090 i9-13950HX, GeForce RTX 4090 Laptop GPU, 95.2 Wh | Asus ROG Strix G16 G614JZ i9-13980HX, GeForce RTX 4080 Laptop GPU, 90 Wh | HP Omen Transcend 16 i9-13900HX, GeForce RTX 4070 Laptop GPU, 97 Wh | Alienware x16 R1 i9-13900HK, GeForce RTX 4080 Laptop GPU, 90 Wh | |
|---|---|---|---|---|---|---|
| Duração da bateria | 86% | 78% | 135% | 23% | -9% | |
| Reader / Idle (h) | 6.7 | 11.7 75% | 6.3 -6% | 7.3 9% | ||
| WiFi v1.3 (h) | 2.7 | 7.1 163% | 5.8 115% | 9.7 259% | 4.2 56% | 2.5 -7% |
| Load (h) | 1 | 1.2 20% | 1.4 40% | 1.1 10% | 1.2 20% | 0.7 -30% |
| H.264 (h) | 8.4 | |||||
| Witcher 3 ultra (h) | 1.6 |
Pro
Contra
Veredicto - O melhor Legion que o dinheiro pode comprar
Se o senhor estiver procurando uma CPU Core i9, uma GPU RTX 4090 e uma tela mini-LED, vale a pena considerar o Legion 9i 16. Quando comparado a outros notebooks para jogos com mini-LED, como o HP Omen Transcend 16, Razer Blade 16ou o Asus Zephyrus M16se o senhor tiver alguma dúvida de que o Lenovo é o melhor, o Lenovo oferece gráficos mais rápidos do que o HP, preços mais baixos do que o Razer e uma resolução nativa mais alta do que o Asus. Ele acerta em cheio tanto nas especificações quanto no design físico para ser um avanço saudável em relação à já excelente Legion Série Pro 7.
Todas as atualizações levaram naturalmente a um chassi maior e mais pesado. Se o senhor quiser os recursos de CPU e tela do Lenovo, mas em um formato mais portátil, o Blade 16, mais caro, pode valer a pena. O resfriamento líquido integrado parece interessante no papel, mas não parece ter contribuído para um design mais leve, mais silencioso ou até mesmo mais frio. O Lenovo deve funcionar tão ruidosamente quanto a maioria dos outros notebooks para jogos na mesma categoria de tamanho.
O Legion 9i 16 tem todas as especificações sofisticadas e um novo visual que os entusiastas podem apreciar, desde que o senhor possa ignorar a curta duração da bateria e o chassi relativamente grande.
O senhor terá que realmente desejar o mini-LED se quiser o Legion 9 16, pois ele não oferece outras opções de tela, para melhor ou pior. O Mini-LED tem seu melhor desempenho quando o HDR está ativado para explorar seu brilho máximo de 1000 nits. Caso contrário, o painel exige muito da bateria, sem outras vantagens importantes em relação a painéis mais baratos, como IPS ou OLED.
Preço e disponibilidade
A Lenovo agora está enviando seu modelo Legion 9i Gen 8 a partir de US$ 3420, se configurado com o GeForce RTX 4080, até US$ 4000, se totalmente configurado com o RTX 4090 e armazenamento adicional.
Lenovo Legion 9 16IRX8
- 10/15/2023 v7 (old)
Allen Ngo
Transparência
A seleção dos dispositivos a serem analisados é feita pela nossa equipe editorial. A amostra de teste foi fornecida ao autor como empréstimo pelo fabricante ou varejista para fins desta revisão. O credor não teve influência nesta revisão, nem o fabricante recebeu uma cópia desta revisão antes da publicação. Não houve obrigação de publicar esta revisão. Como empresa de mídia independente, a Notebookcheck não está sujeita à autoridade de fabricantes, varejistas ou editores.
É assim que o Notebookcheck está testando
Todos os anos, o Notebookcheck analisa de forma independente centenas de laptops e smartphones usando procedimentos padronizados para garantir que todos os resultados sejam comparáveis. Desenvolvemos continuamente nossos métodos de teste há cerca de 20 anos e definimos padrões da indústria no processo. Em nossos laboratórios de teste, equipamentos de medição de alta qualidade são utilizados por técnicos e editores experientes. Esses testes envolvem um processo de validação em vários estágios. Nosso complexo sistema de classificação é baseado em centenas de medições e benchmarks bem fundamentados, o que mantém a objetividade.Price comparison

