Análise do laptop Acer Predator Helios 18 2024: Novo hardware para o jogador de 18 polegadas

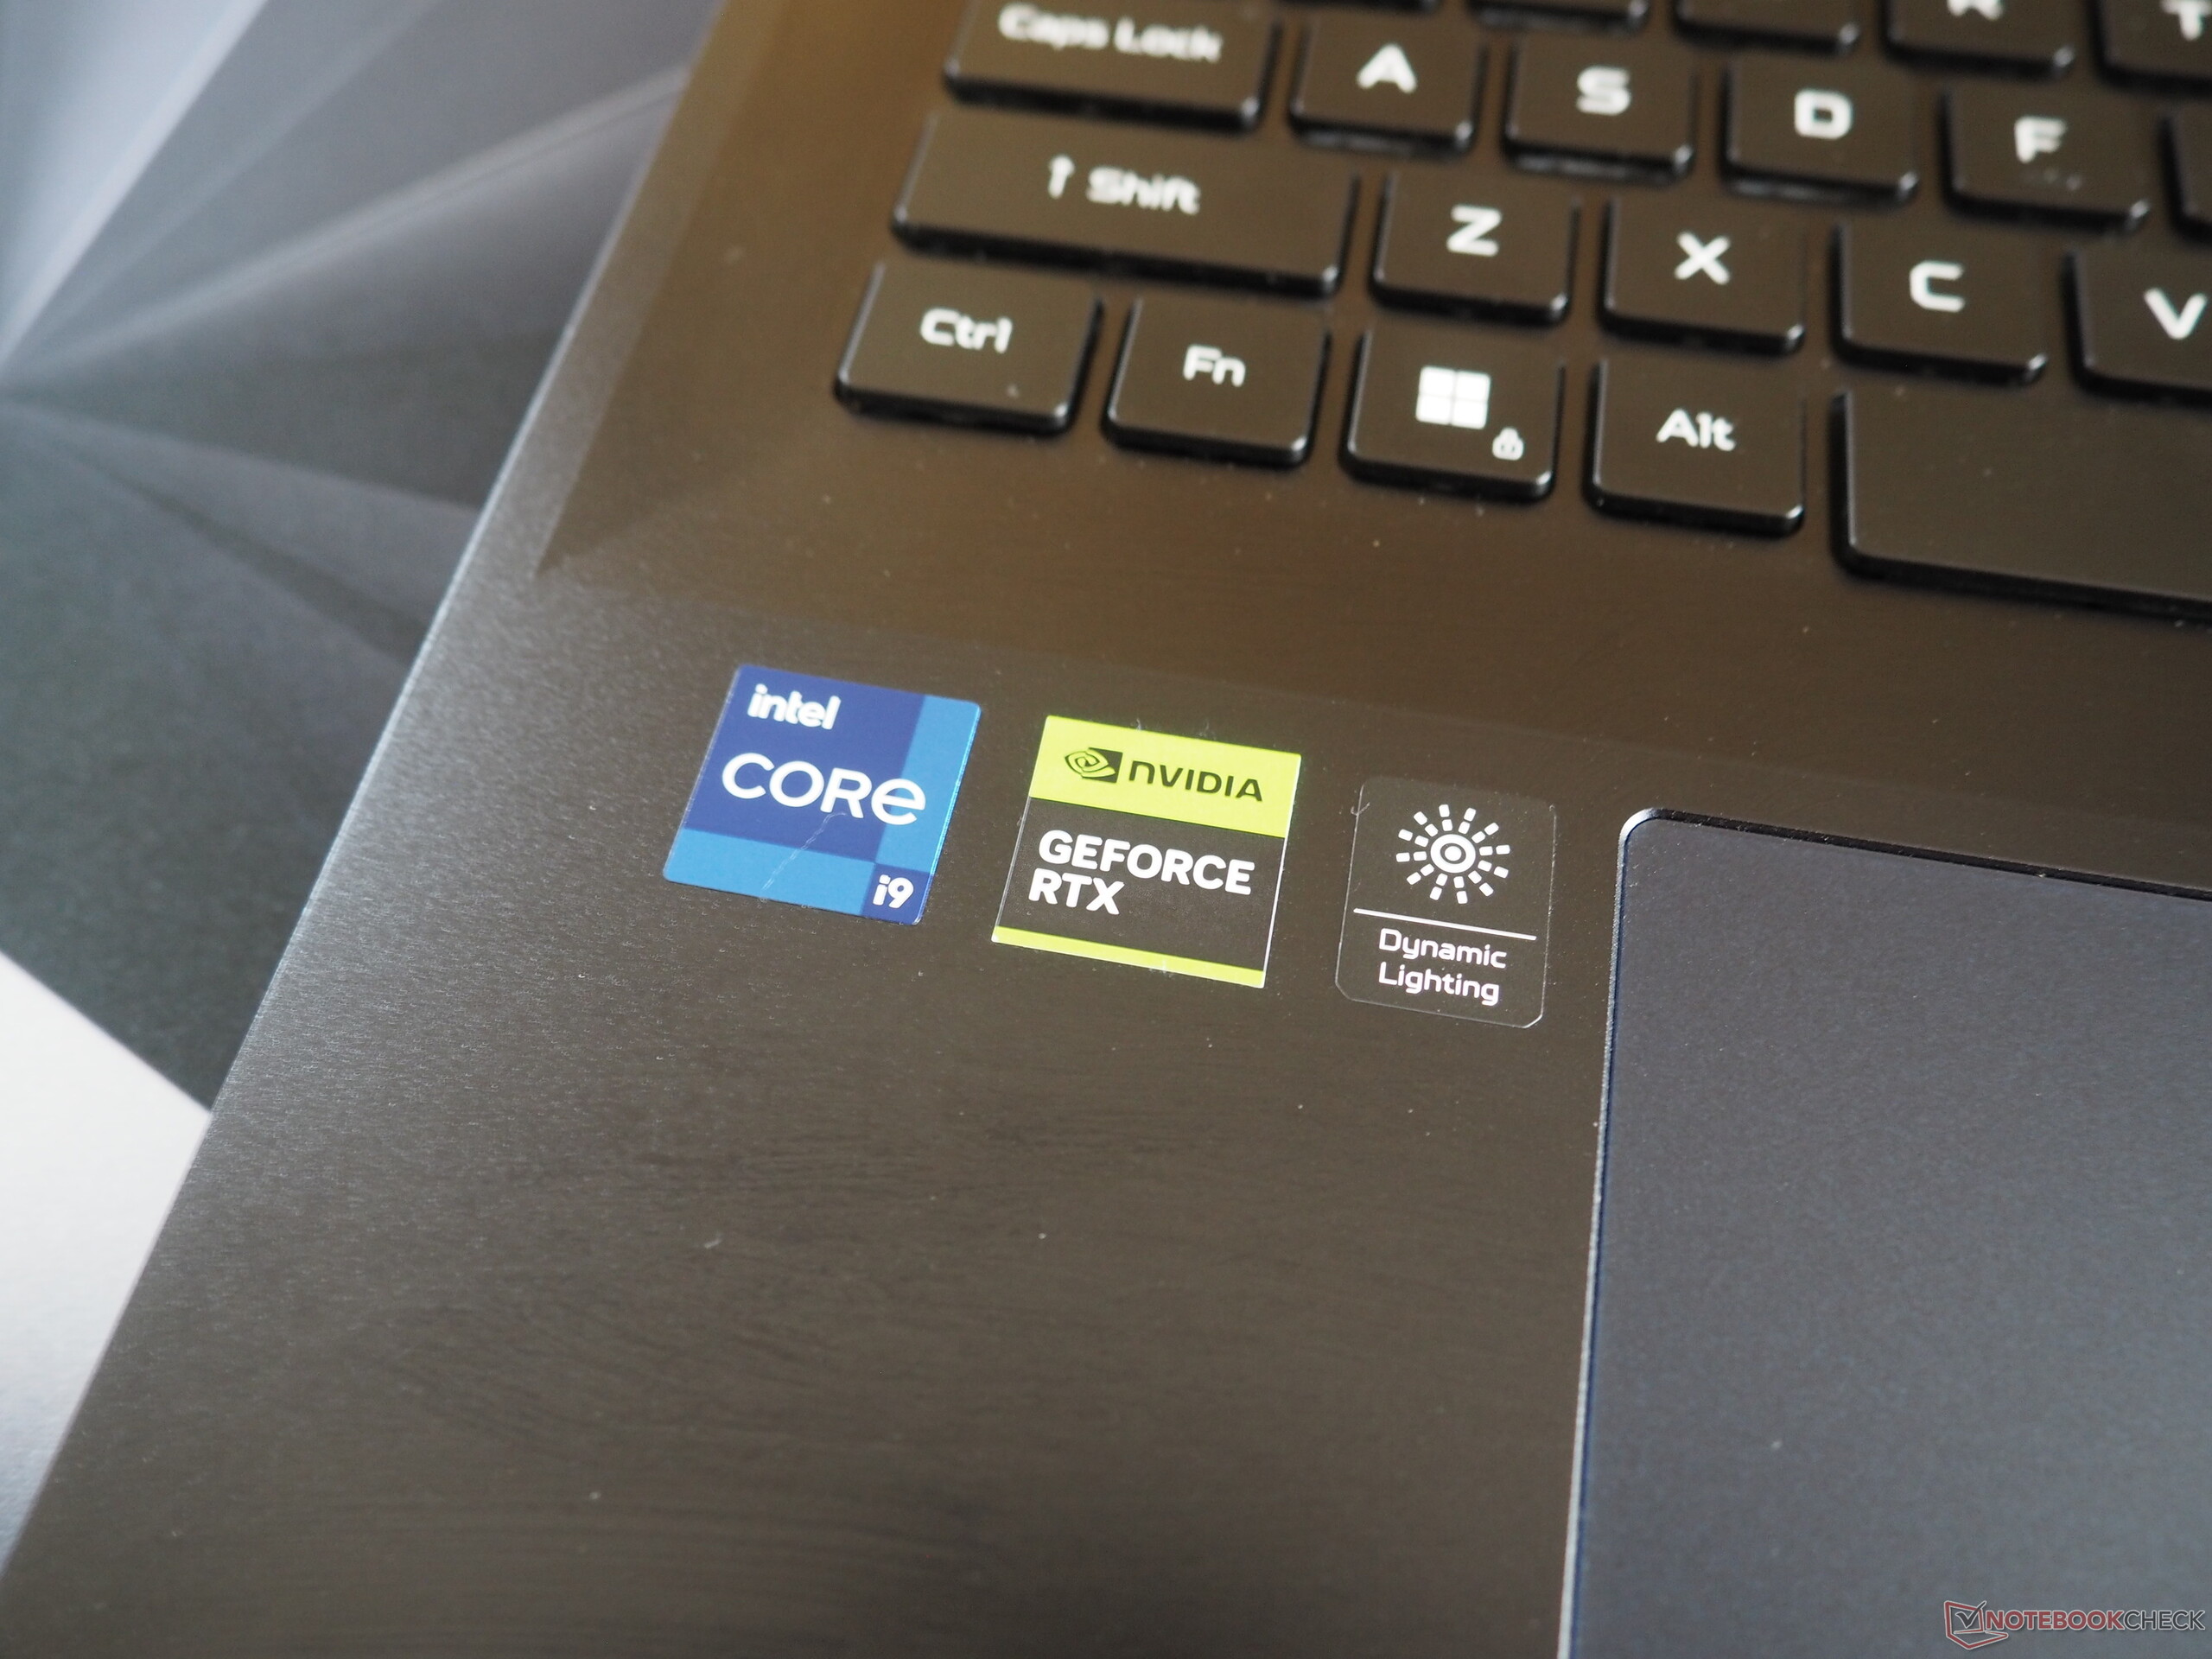
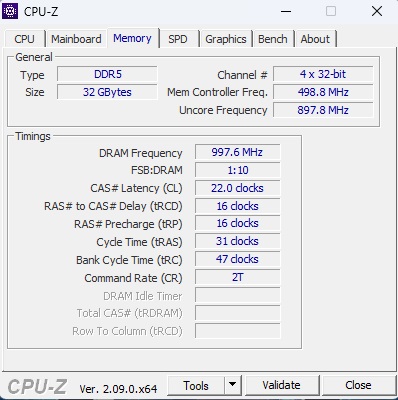
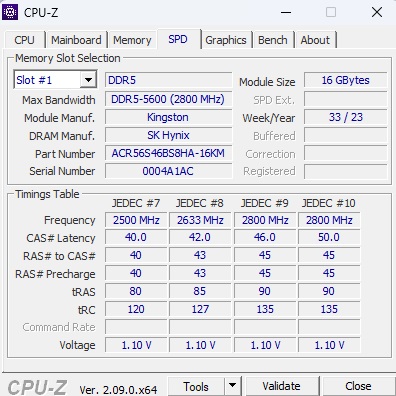
Em 2023, a Acer começou a vender laptops de 18 polegadas. Embora nosso primeiro dispositivo de teste foi equipado com um Core i9-13900HX e uma GeForce RTX 4080a configuração de teste do modelo sucessor conta com um Core i9-14900HX e um GeForce RTX 4090. Uma coisa que permaneceu a mesma é o poderoso painel Mini-LED do laptop que impressiona quase inteiramente sem compromisso (mais sobre isso em breve). A Acer instalou 2x 16 GB de RAM DDR5-5600 e dois NVMe-SSDs no formato RAID-0 (M.2 2280) com 1 TB de armazenamento cada. No momento do teste, o laptop ainda não estava disponível nos Estados Unidos, portanto, ainda não podemos dar nenhuma informação sobre seu preço de venda.
Entre os concorrentes do Predator Helios 18 estão os gamers de 18 polegadas, como o MSI Titan 18 HX A14e o Asus ROG Strix Scar 18 G834 e o Alienware m18 R1-todos listados nas tabelas como dispositivos de comparação.
Possíveis concorrentes em comparação
Avaliação | Data | Modelo | Peso | Altura | Size | Resolução | Preço |
|---|---|---|---|---|---|---|---|
| 87.1 % v7 (old) | 03/2024 | Acer Predator Helios 18 PH18-72-98MW i9-14900HX, GeForce RTX 4090 Laptop GPU | 3.3 kg | 29.5 mm | 18.00" | 2560x1600 | |
| 88.8 % v7 (old) | 01/2024 | MSI Titan 18 HX A14VIG i9-14900HX, GeForce RTX 4090 Laptop GPU | 3.6 kg | 32.1 mm | 18.00" | 3840x2400 | |
| 88.3 % v7 (old) | 02/2024 | Asus ROG Strix Scar 18 G834JYR (2024) i9-14900HX, GeForce RTX 4090 Laptop GPU | 3.1 kg | 30.8 mm | 18.00" | 2560x1600 | |
| 88.3 % v7 (old) | 10/2023 | Acer Predator Helios 18 N23Q2 i9-13900HX, GeForce RTX 4080 Laptop GPU | 3.2 kg | 29.15 mm | 18.00" | 2560x1600 | |
| 89.2 % v7 (old) | 11/2023 | Alienware m18 R1 AMD R9 7945HX, Radeon RX 7900M | 3.9 kg | 26.7 mm | 18.00" | 1920x1200 |
Caso
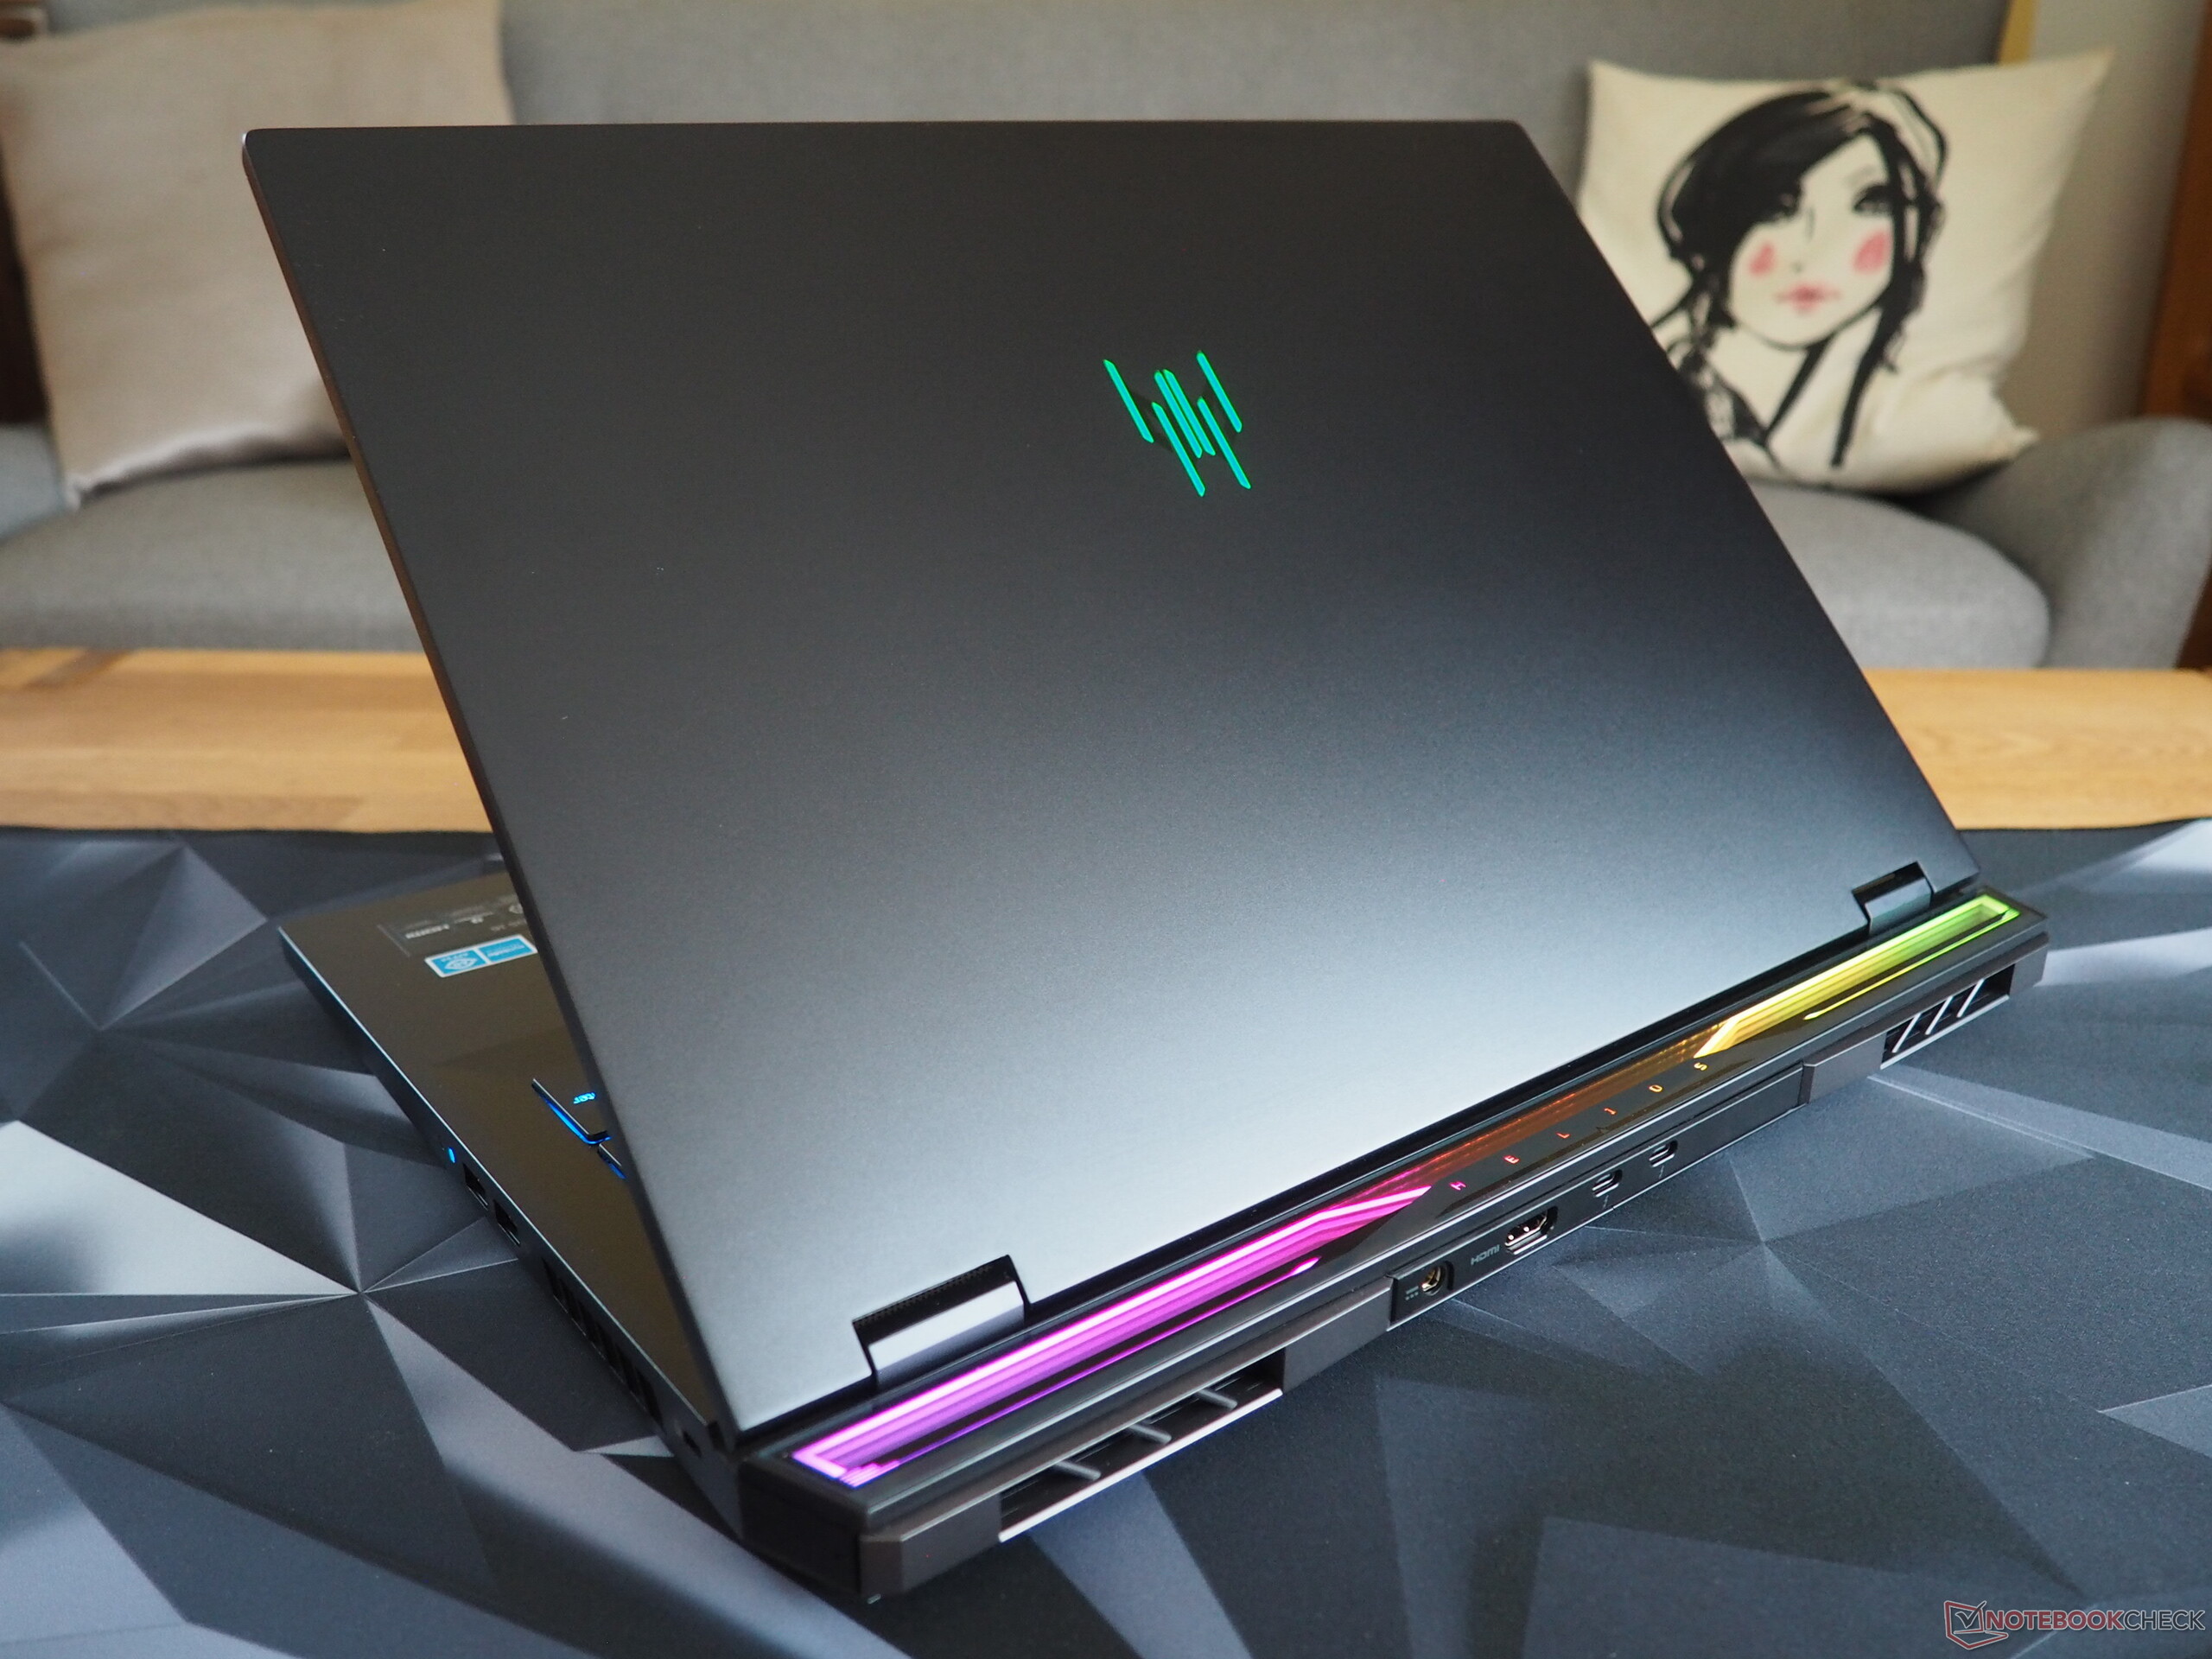
No que diz respeito à caixa do dispositivo, a Acer manteve-se fiel ao seu antecessor - embora, ao olhar mais de perto, o senhor comece a notar algumas mudanças. O fabricante trocou o modelo do teclado e redesenhou a elegante faixa de luz na parte traseira. O laptop continua sendo de alta qualidade, pois a tampa e a parte superior da unidade básica são feitas de metal. Também não temos nada negativo a relatar sobre a construção do dispositivo. No entanto, a Acer poderia melhorar as dobradiças do laptop, pois elas podem ser um pouco instáveis às vezes. Embora a tampa possa ser mais estável e certas partes do teclado possam ser empurradas para dentro quando o senhor pressiona com força suficiente, ainda assim classificaríamos o gabinete como estável. Seu design não é monótono nem excessivamente divertido.

Com relação ao peso, o Predator Helios 18 está na média. Seus 3,3 kg são mais do que o Asus ROG Strix Scar 18, mas menos do que o MSI Titan 18 e o Alienware m18.
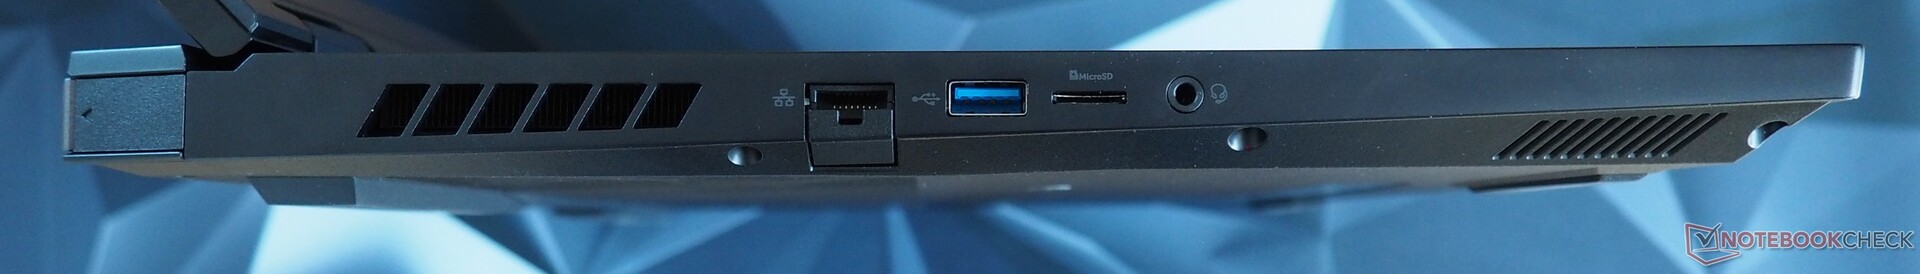
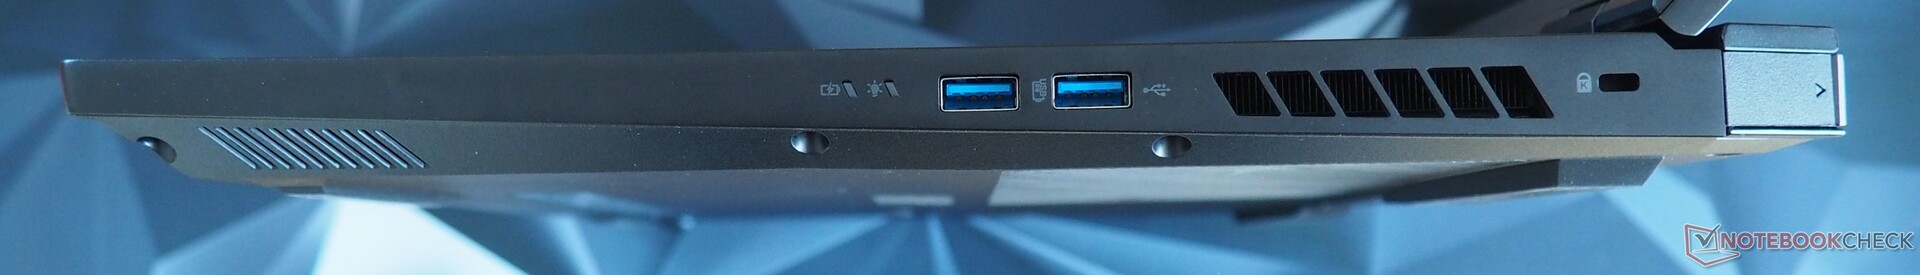
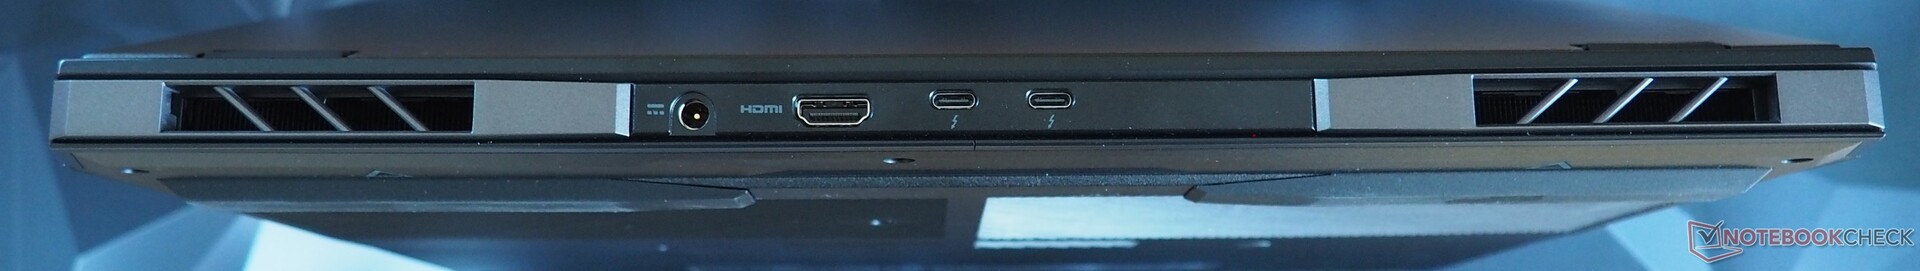
Conectividade
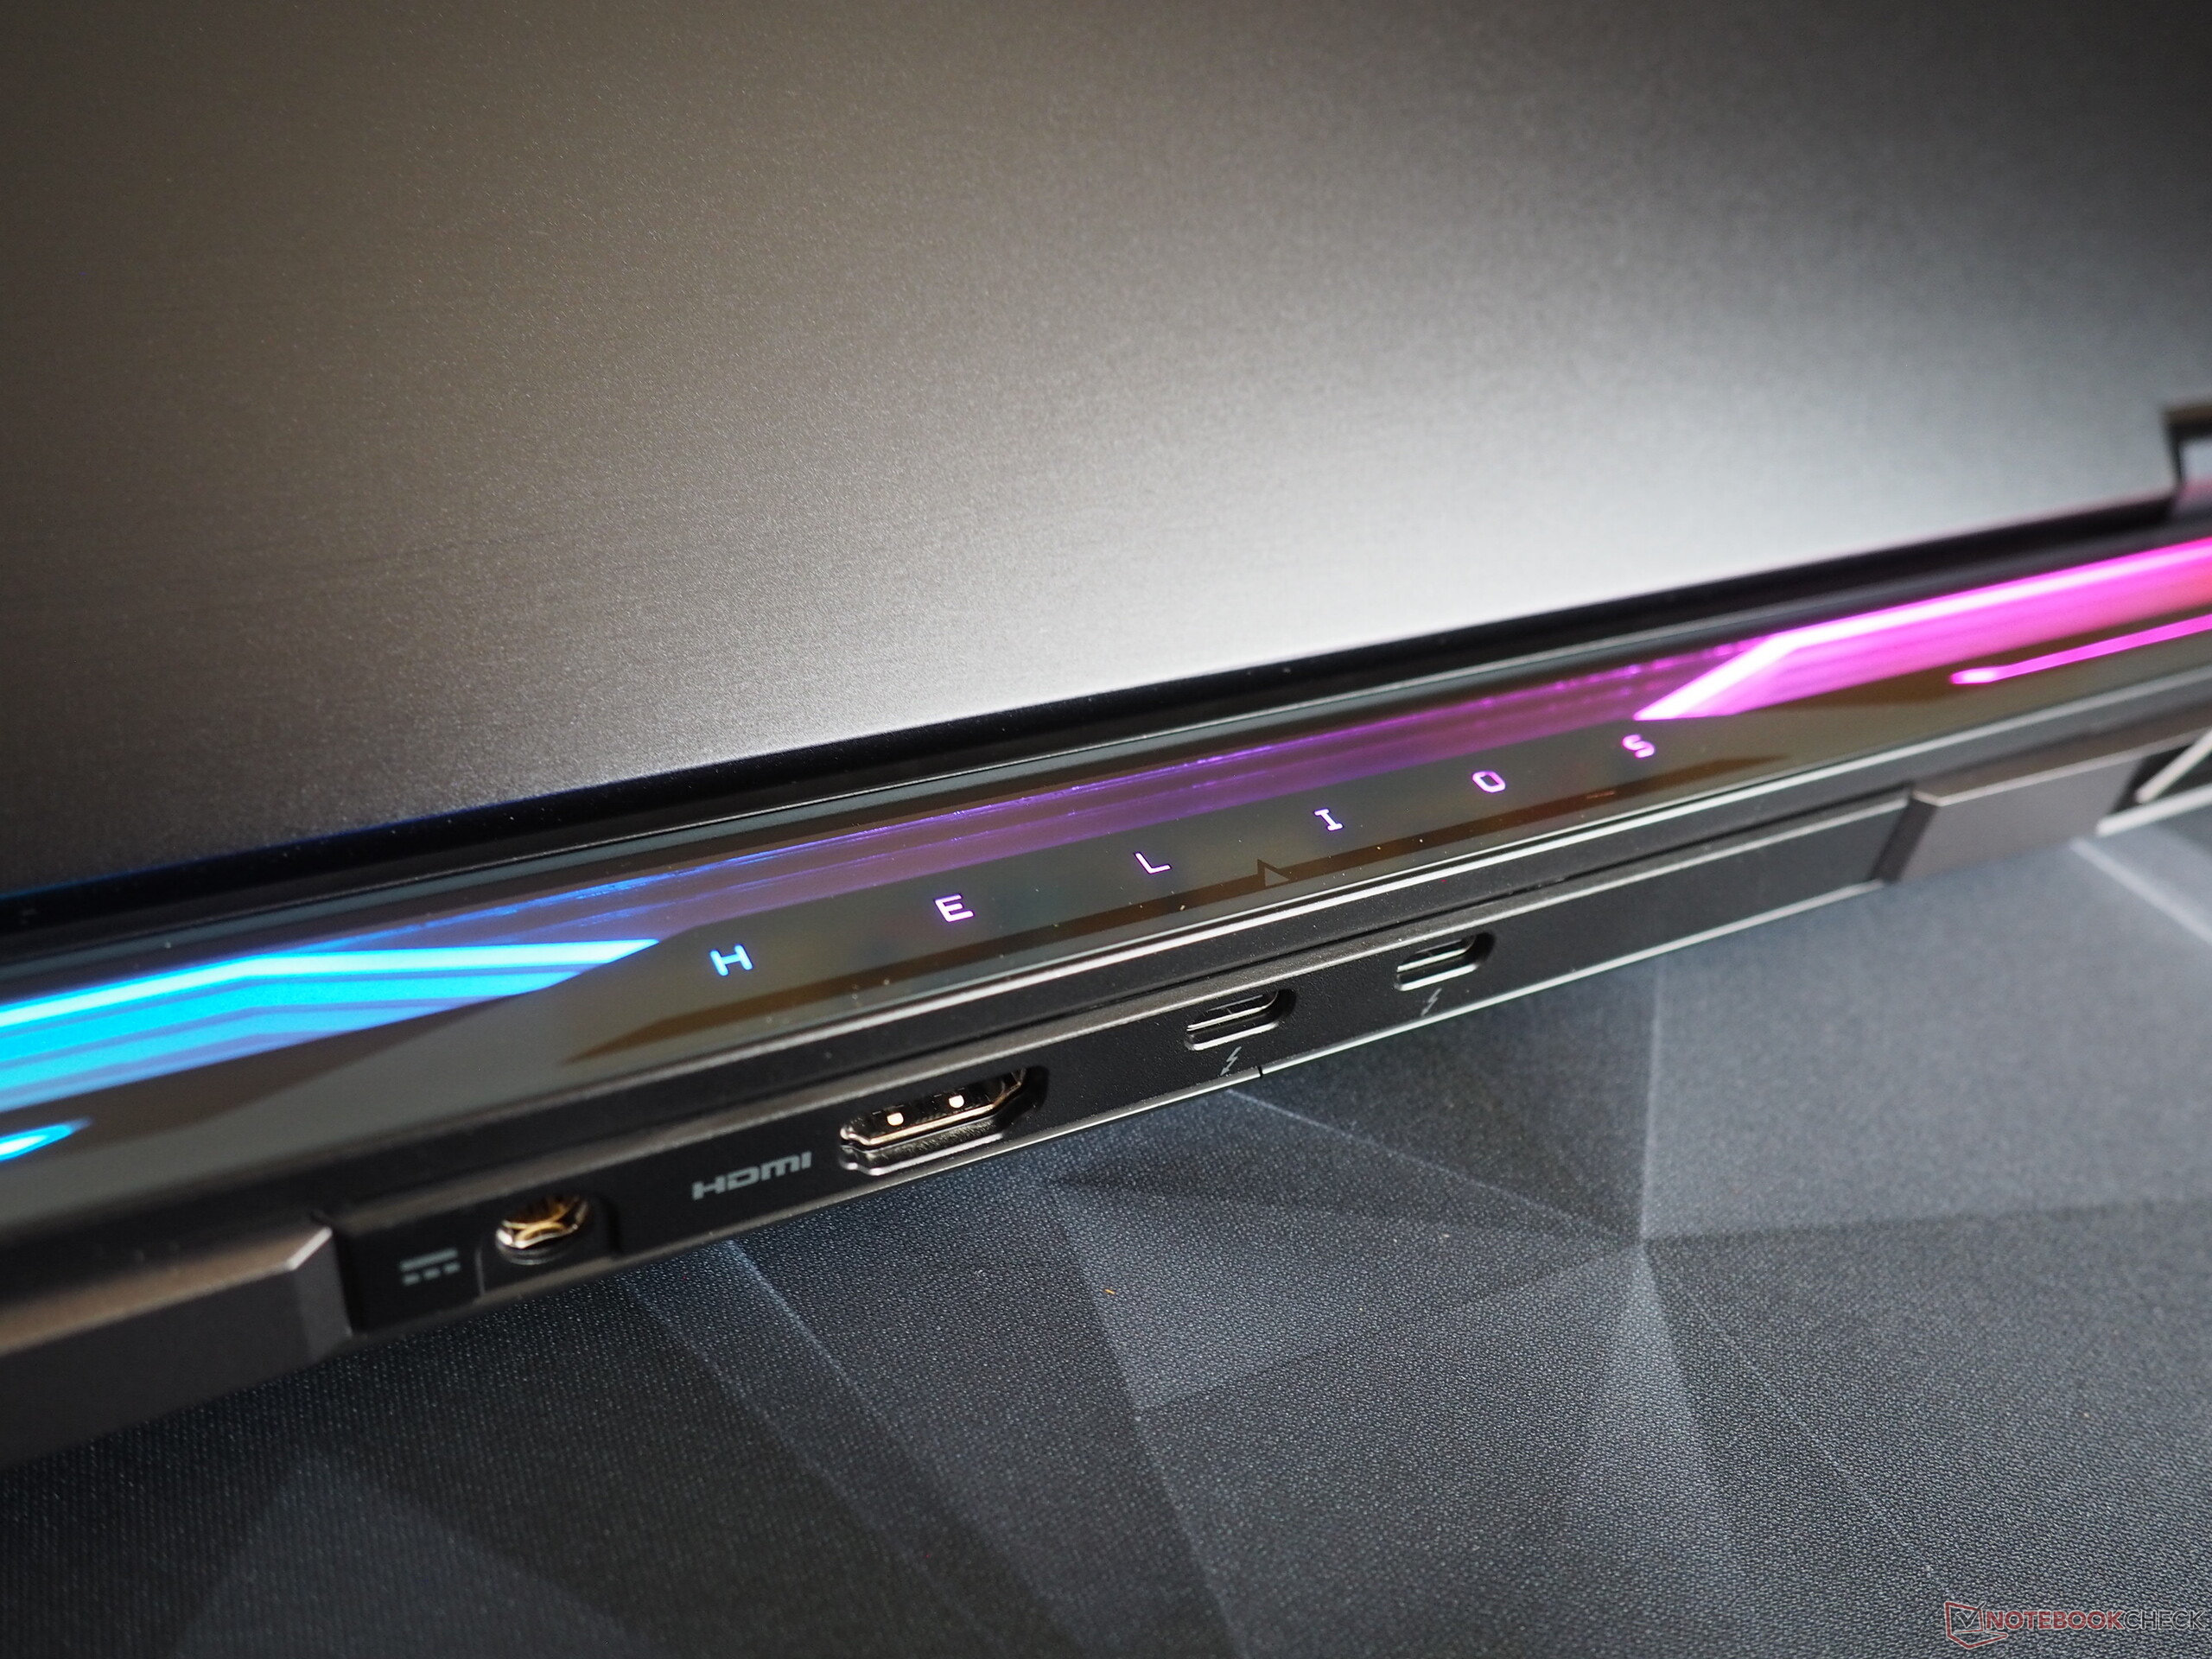
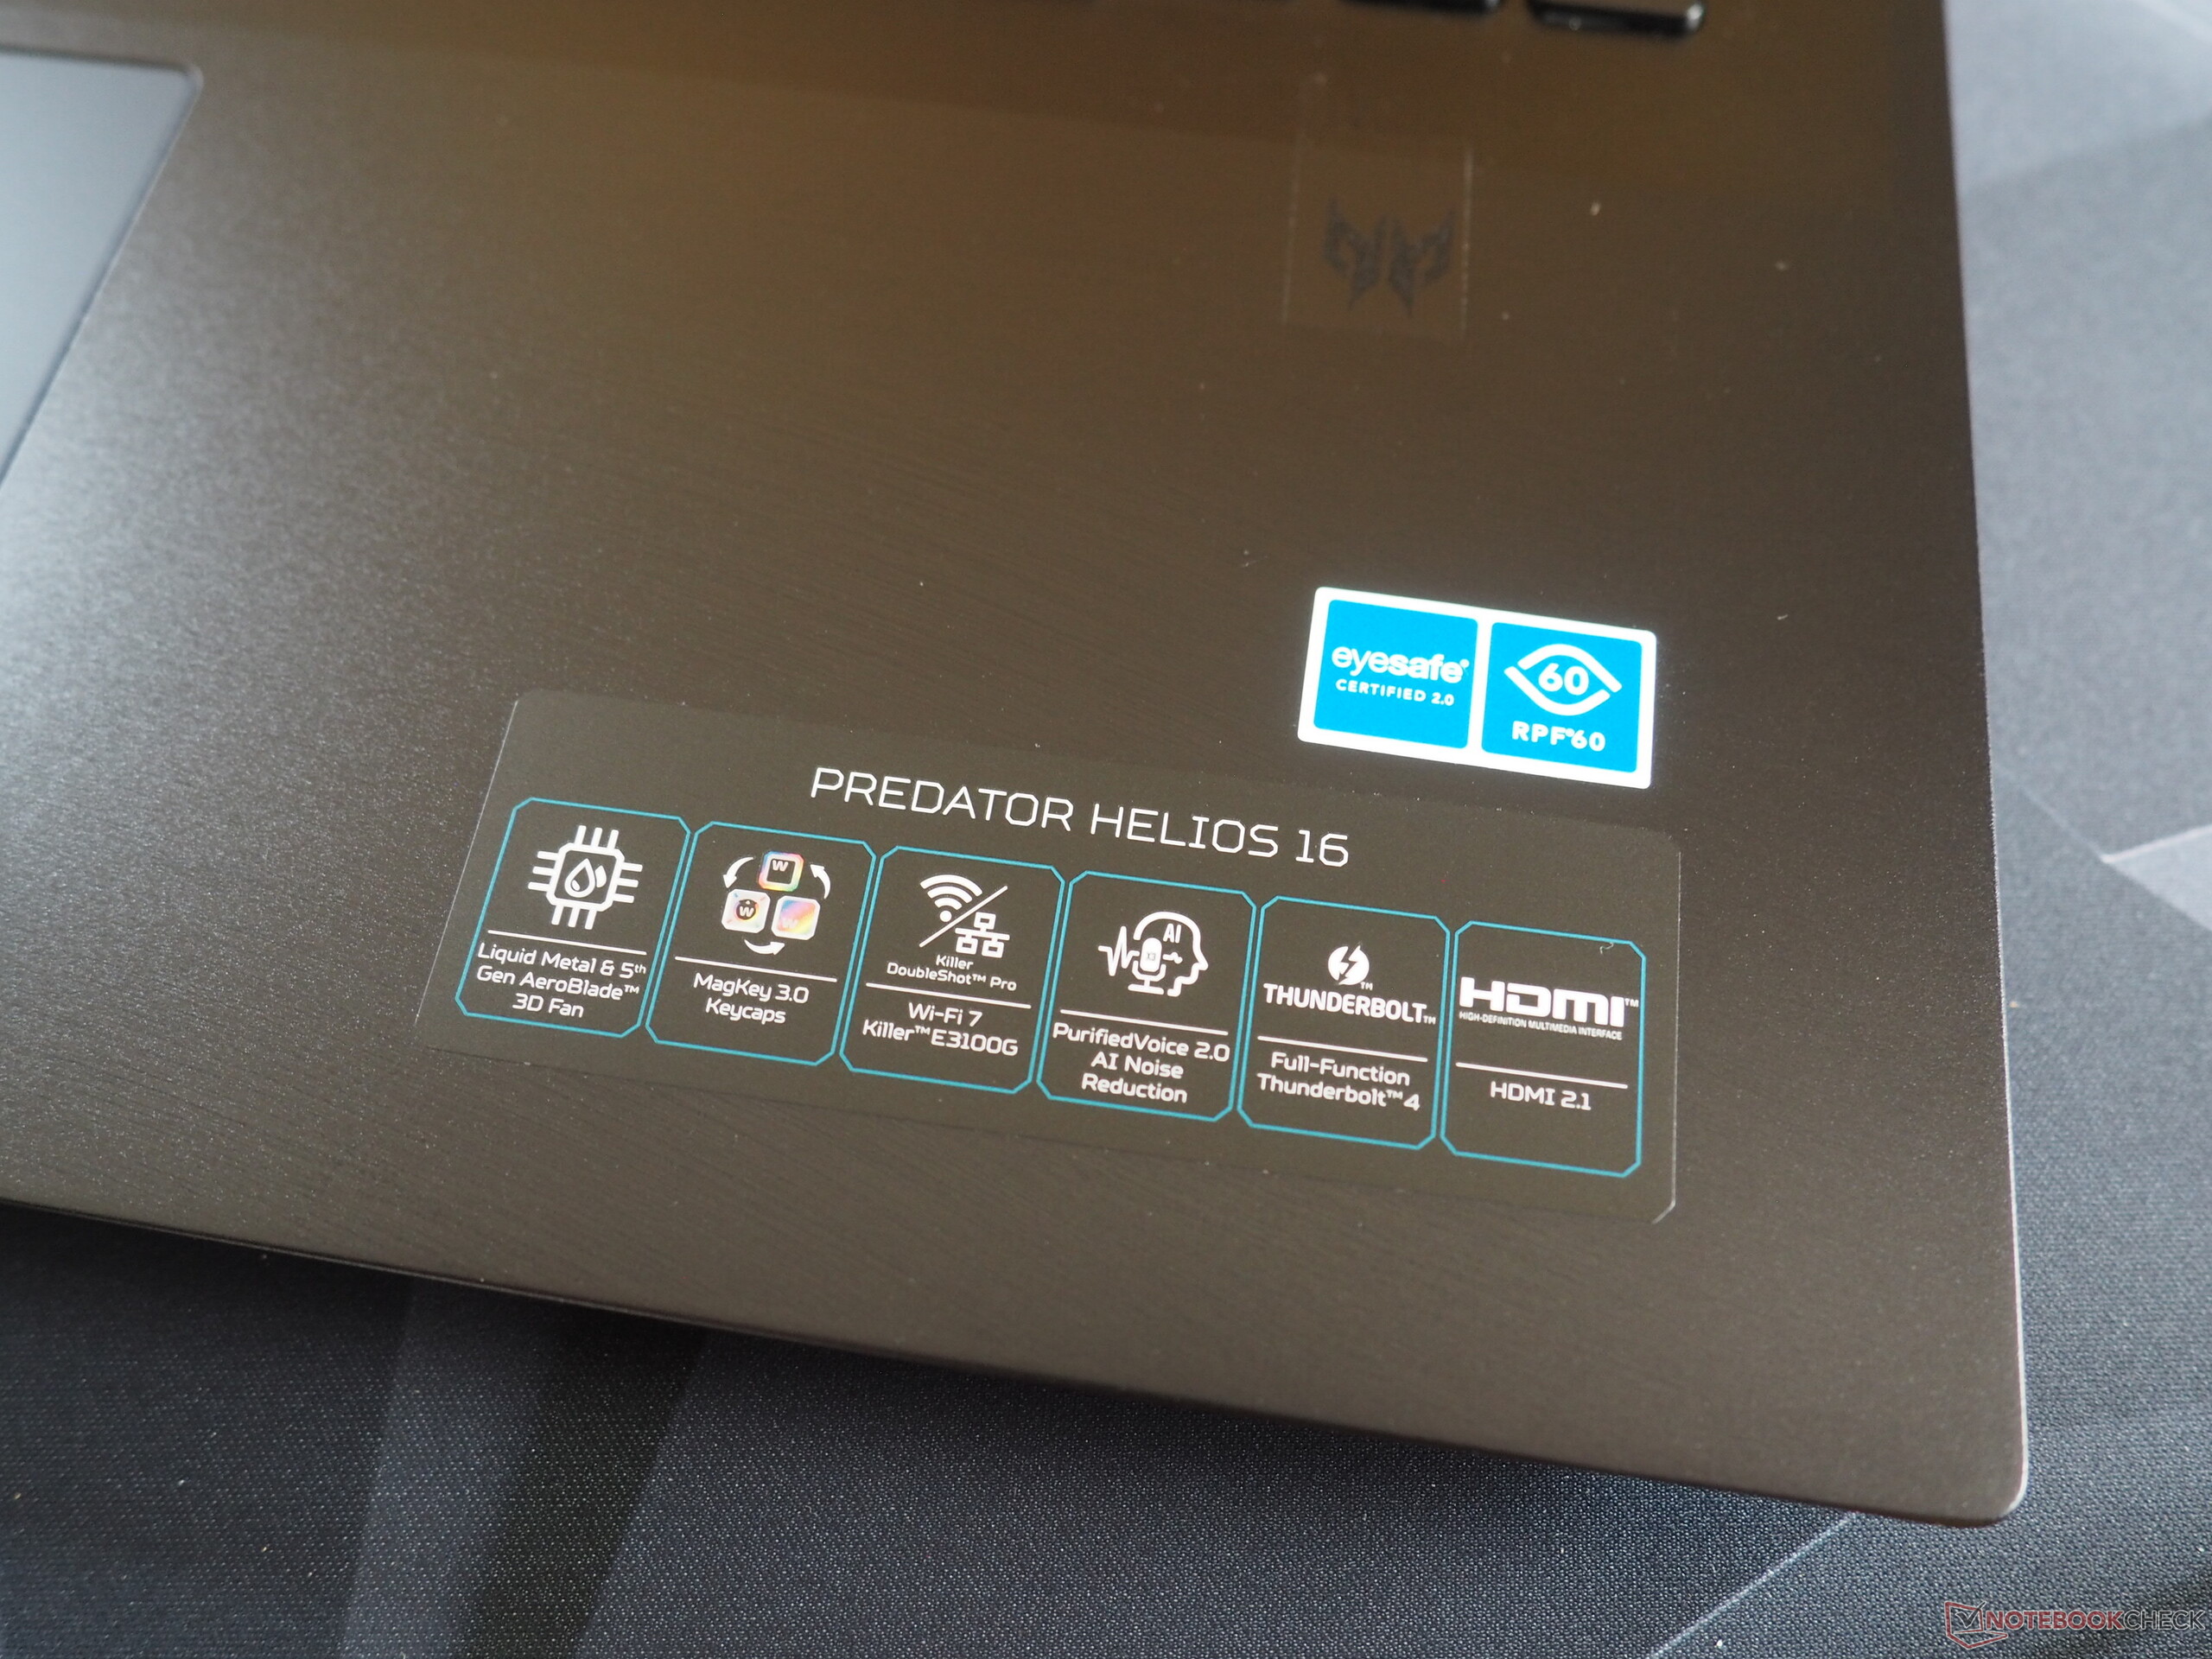
As opções de conectividade do dispositivo são modernas. Enquanto a parte traseira abriga uma saída HDMI 2.1 e duas portas Thunderbolt 4 (incluindo DisplayPort e Power Delivery), o lado direito apresenta duas portas USB 3.2 Gen-2 (Tipo A) e um slot para uma trava Kensington. Esse pacote é complementado por uma porta RJ45, uma porta USB 3.0 (Tipo A), um leitor de cartão microSD e um conector de áudio no lado esquerdo.
Leitor de cartão SD
O leitor de cartão instalado atinge velocidades medíocres. Somente o Alienware m18, que foi capaz de usar nossa placa de referência até certo ponto, nos impressionou nesse aspecto.
| SD Card Reader | |
| average JPG Copy Test (av. of 3 runs) | |
| Alienware m18 R1 AMD (Toshiba Exceria Pro SDXC 64 GB UHS-II) | |
| Média da turma Gaming (20.9 - 210, n=54, últimos 2 anos) | |
| Acer Predator Helios 18 PH18-72-98MW (AV PRO microSD 128 GB V60) | |
| MSI Titan 18 HX A14VIG (Toshiba Exceria Pro SDXC 64 GB UHS-II) | |
| Acer Predator Helios 18 N23Q2 | |
| maximum AS SSD Seq Read Test (1GB) | |
| Alienware m18 R1 AMD (Toshiba Exceria Pro SDXC 64 GB UHS-II) | |
| Média da turma Gaming (25.5 - 261, n=51, últimos 2 anos) | |
| MSI Titan 18 HX A14VIG (Toshiba Exceria Pro SDXC 64 GB UHS-II) | |
| Acer Predator Helios 18 PH18-72-98MW (AV PRO microSD 128 GB V60) | |
| Acer Predator Helios 18 N23Q2 | |
Comunicação
O novo Helios 18 tem um chip Wi-Fi 7 de última geração, que só podemos testar de forma limitada devido à falta de hardware adequado. Em nossos testes padrão, seu módulo Wi-Fi apresentou um desempenho sólido (envio) até um desempenho muito bom (recebimento).
Webcam
Graças à sua resolução Full HD, a webcam instalada é um pouco mais nítida do que a maioria dos laptops, mas, como geralmente acontece, ainda há espaço para melhorias no que se refere à precisão das cores.

")
")
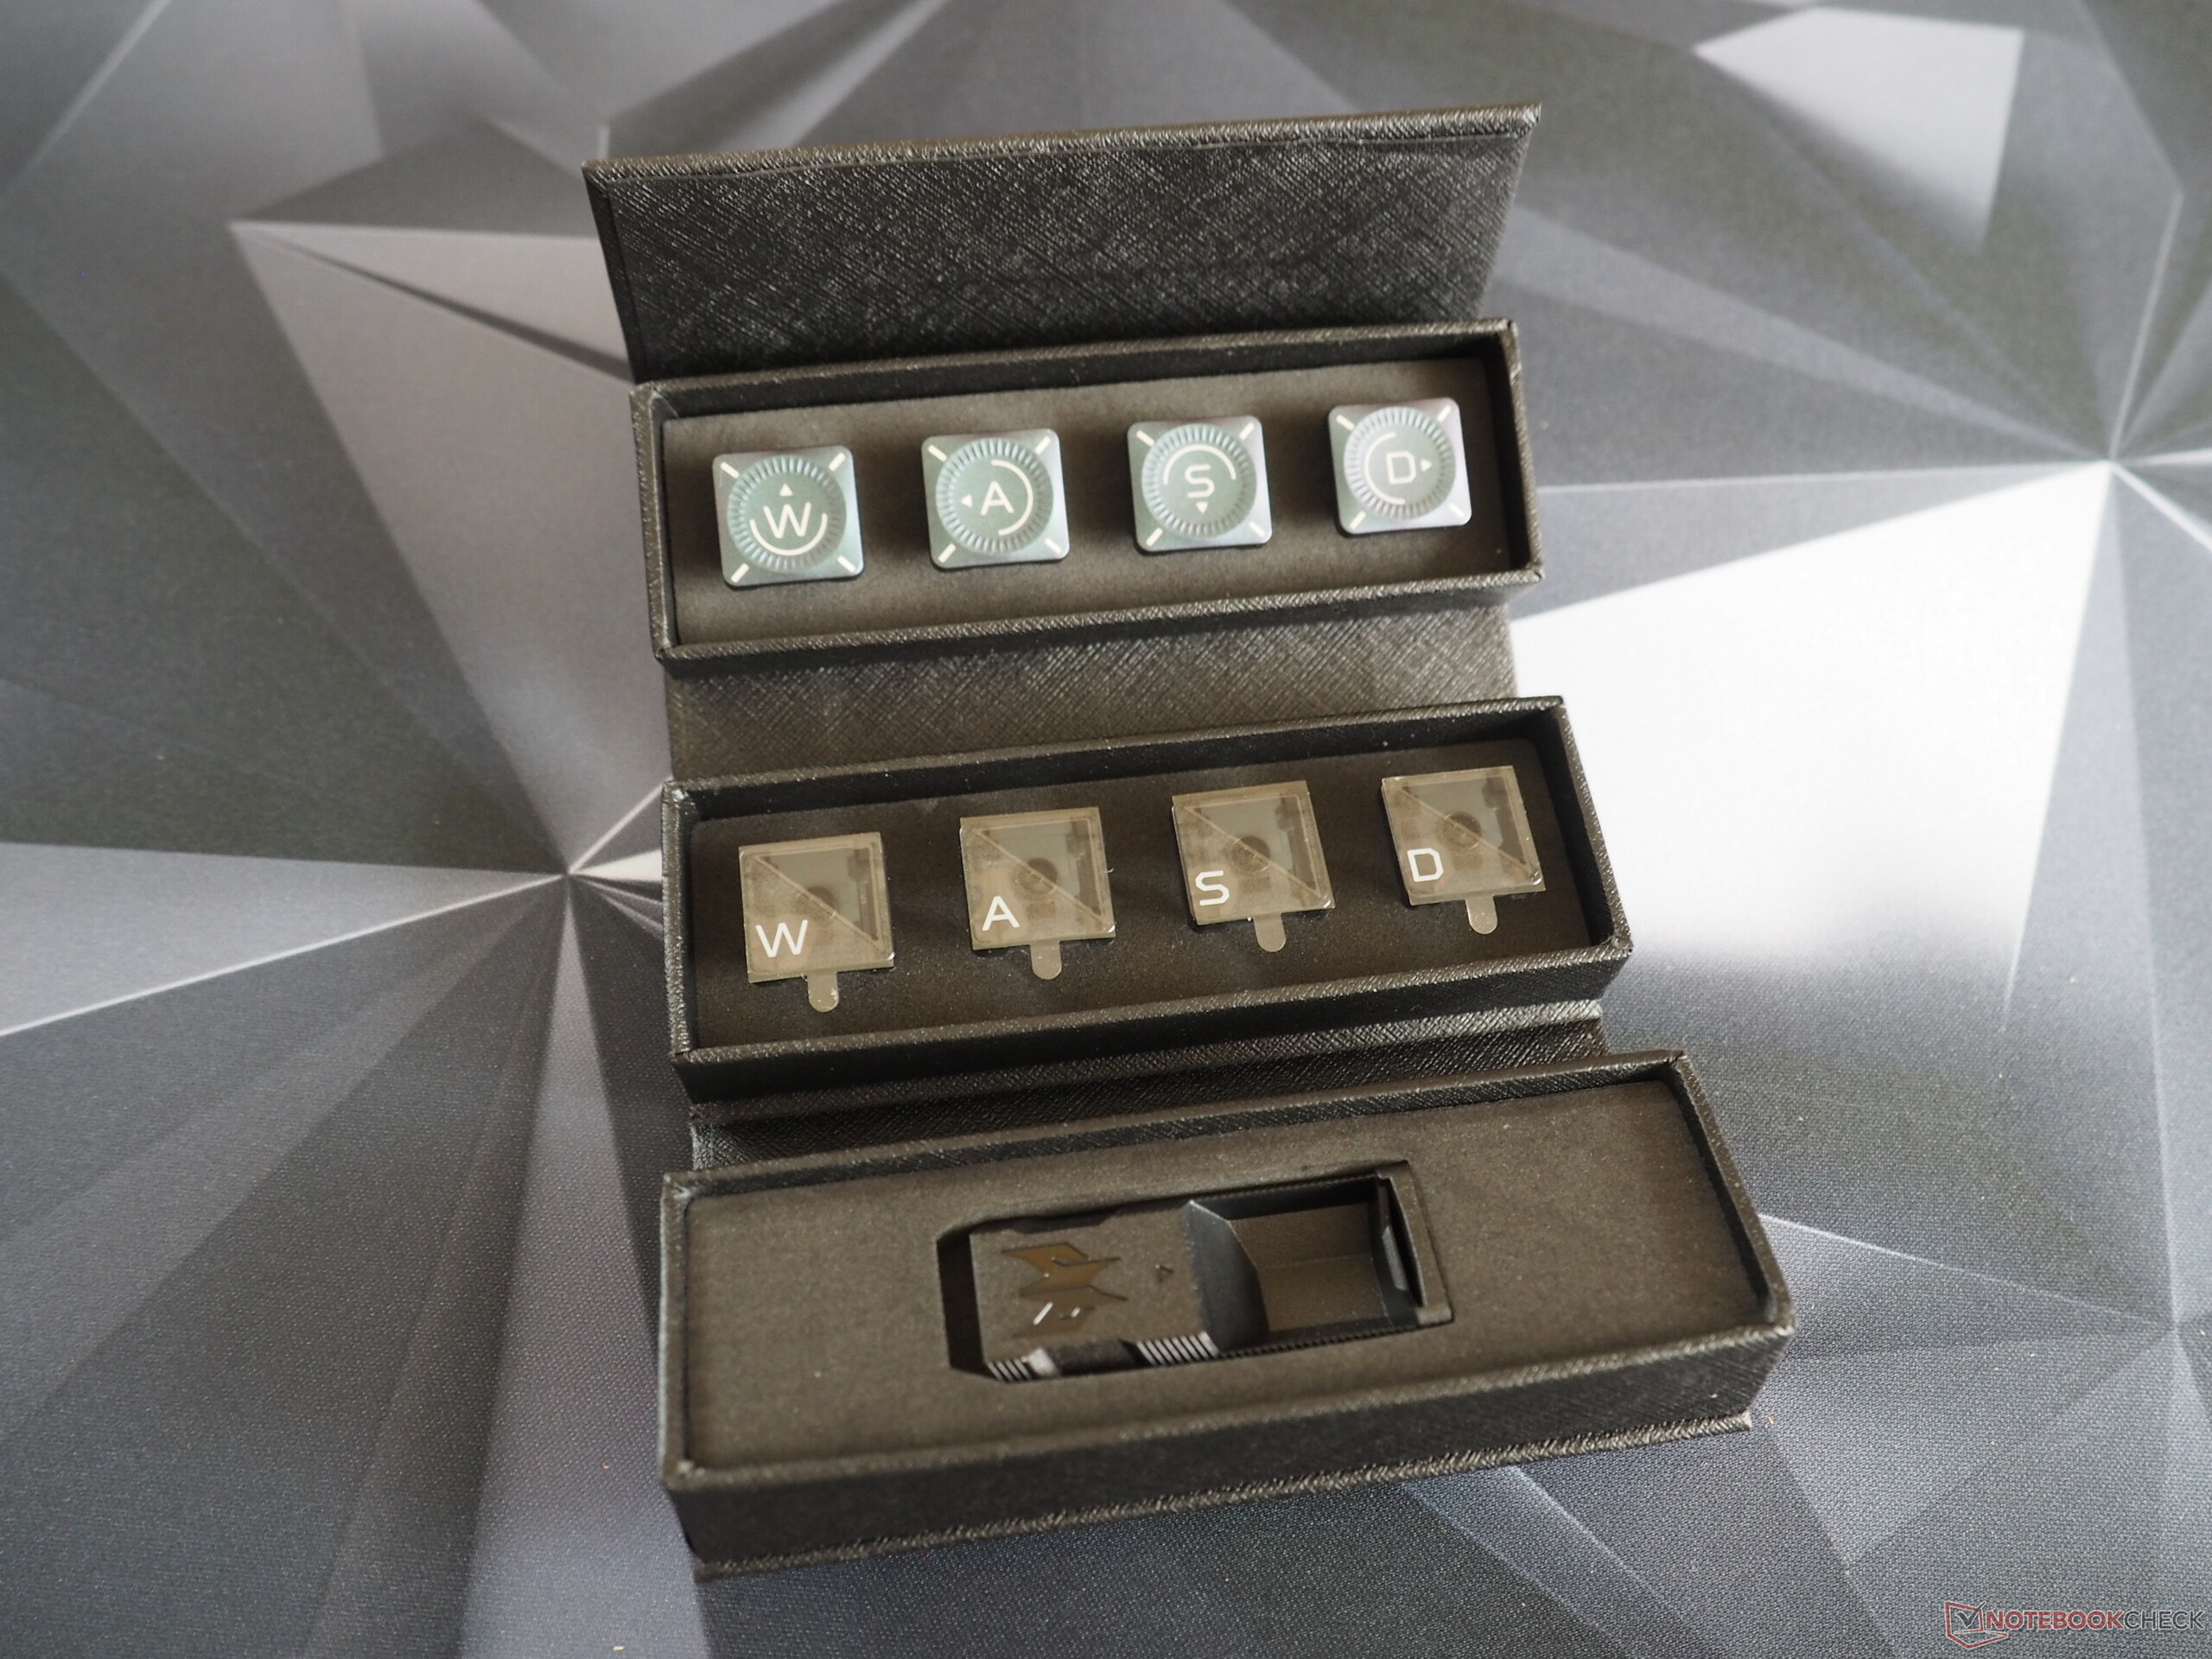
Acessórios
O Predator Helios 18 tem um recurso especial interessante: Sua caixa não só contém grades de ventilador substituíveis para a parte traseira do dispositivo, mas também recebe dois conjuntos de teclas WASD diferentes e algumas alavancas de teclas. Como esperado, a fonte de alimentação de 330 watts fornecida é bastante volumosa.
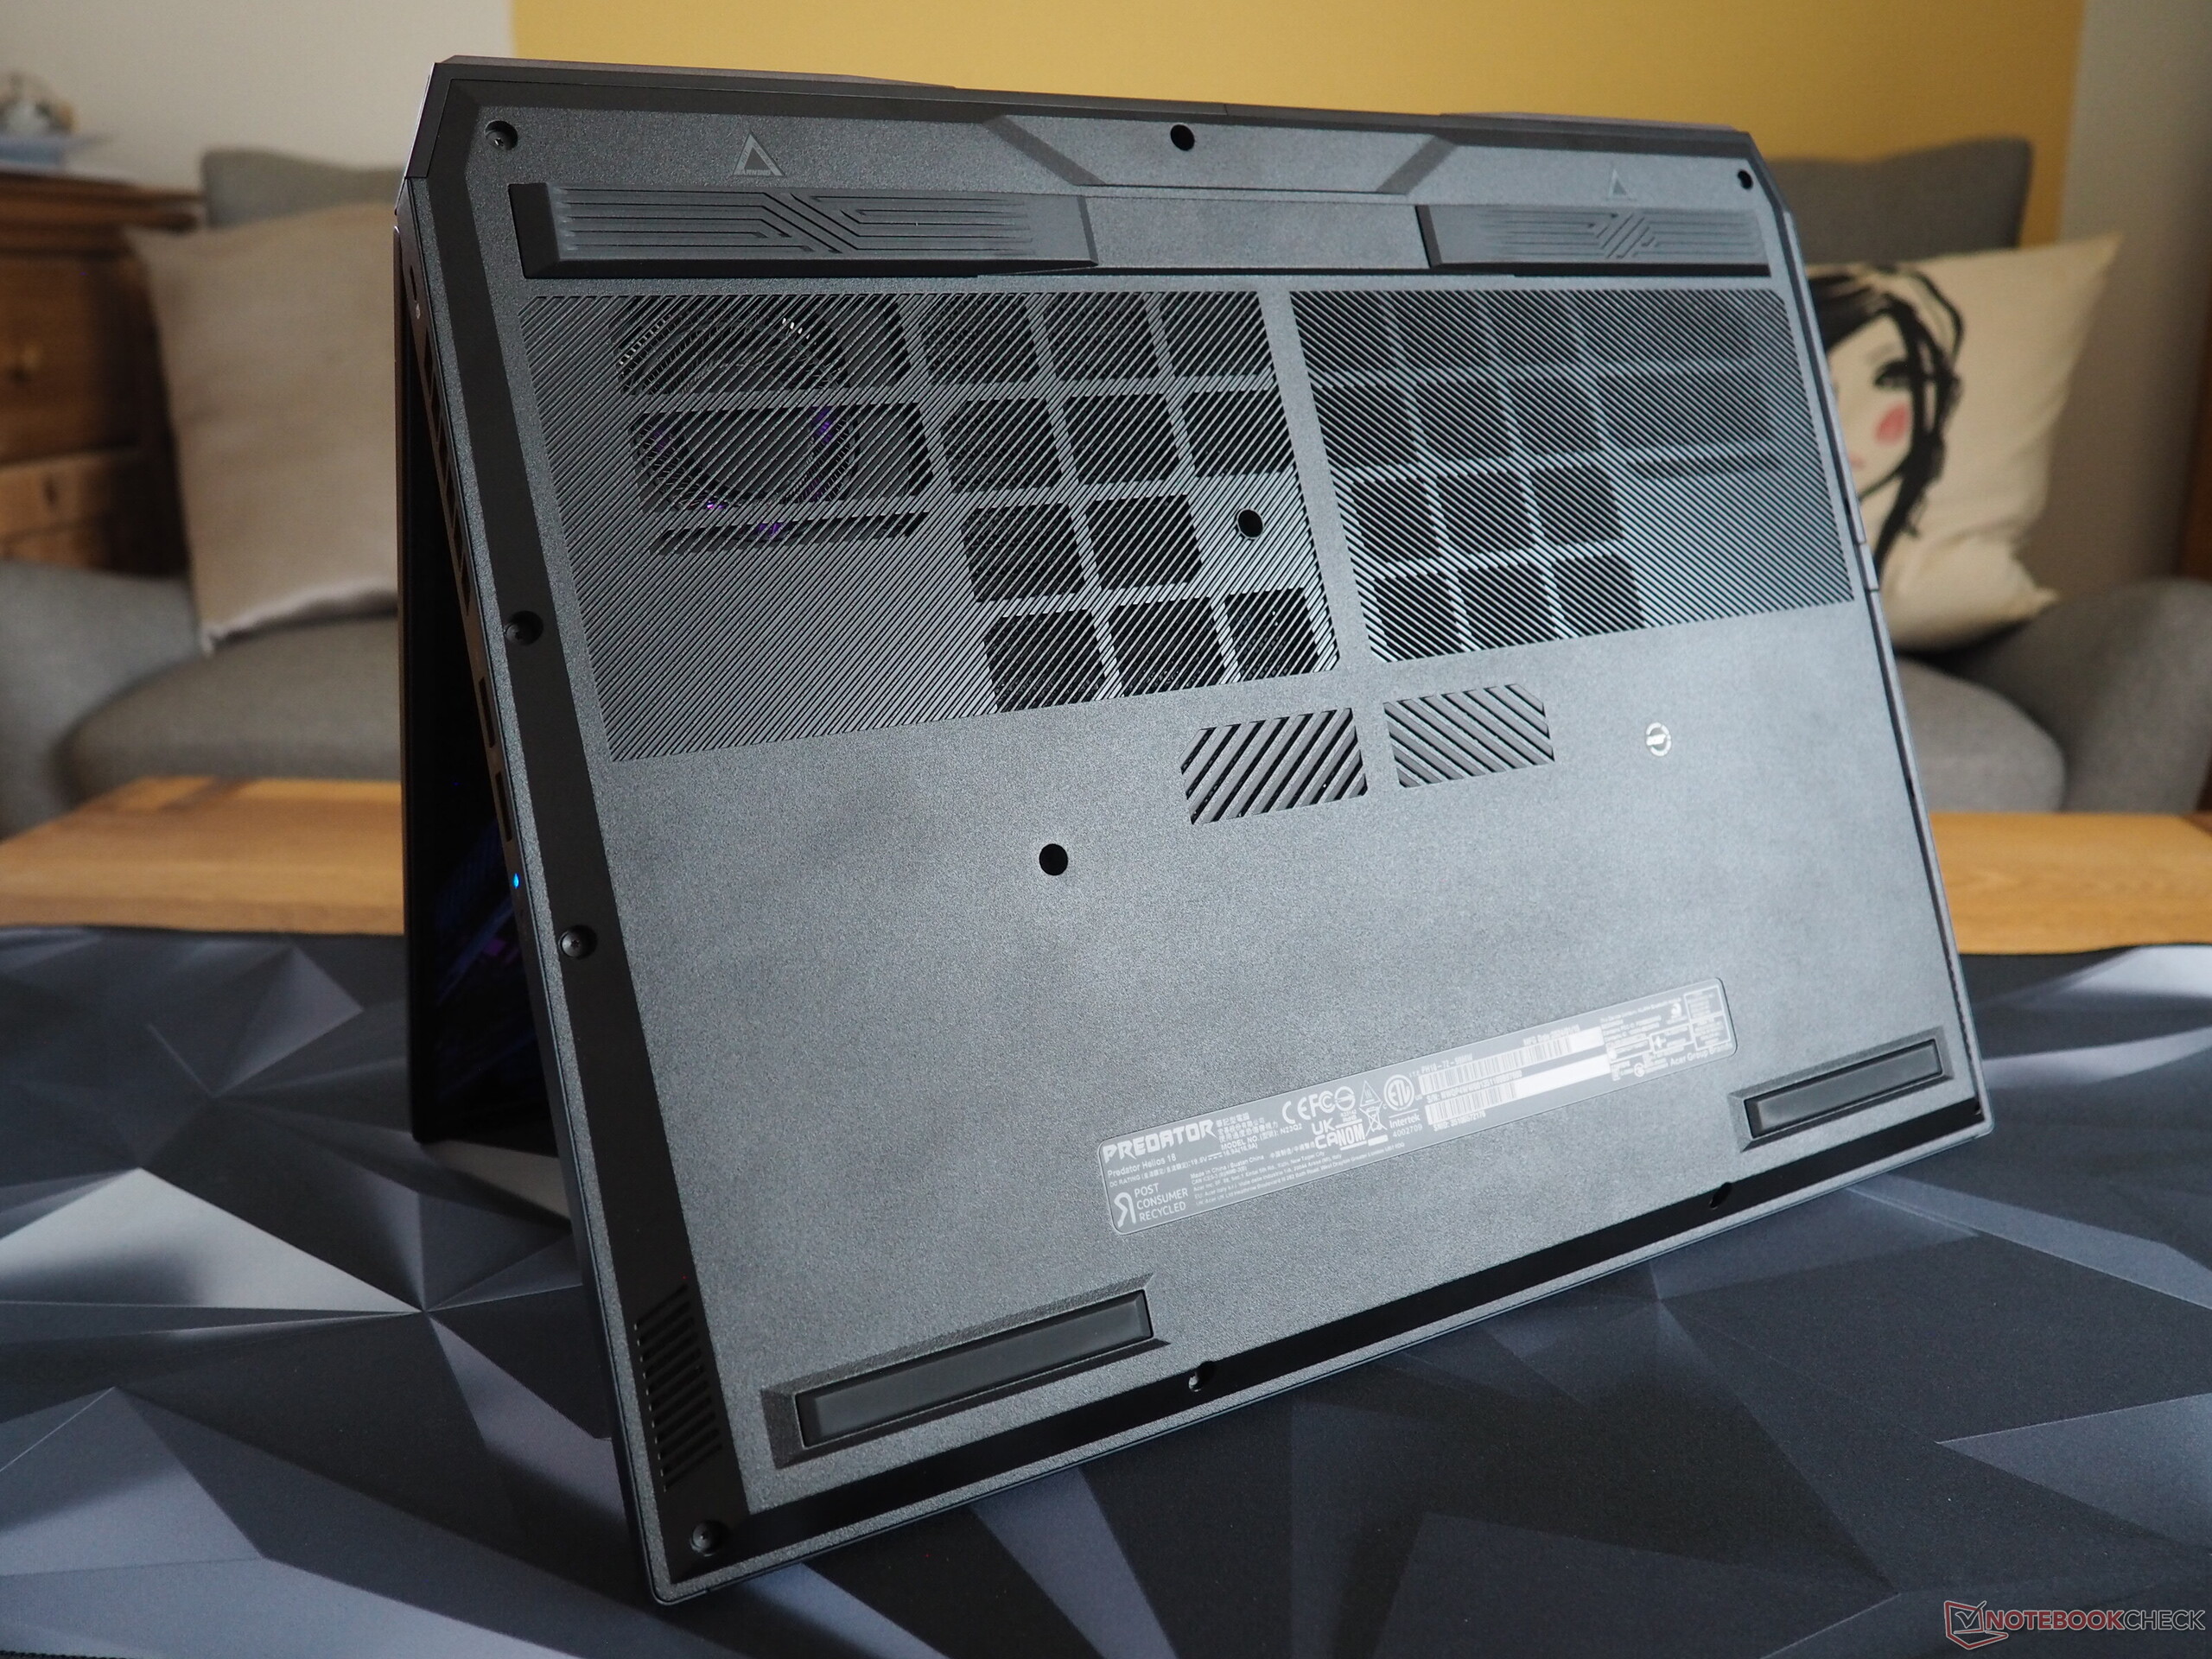
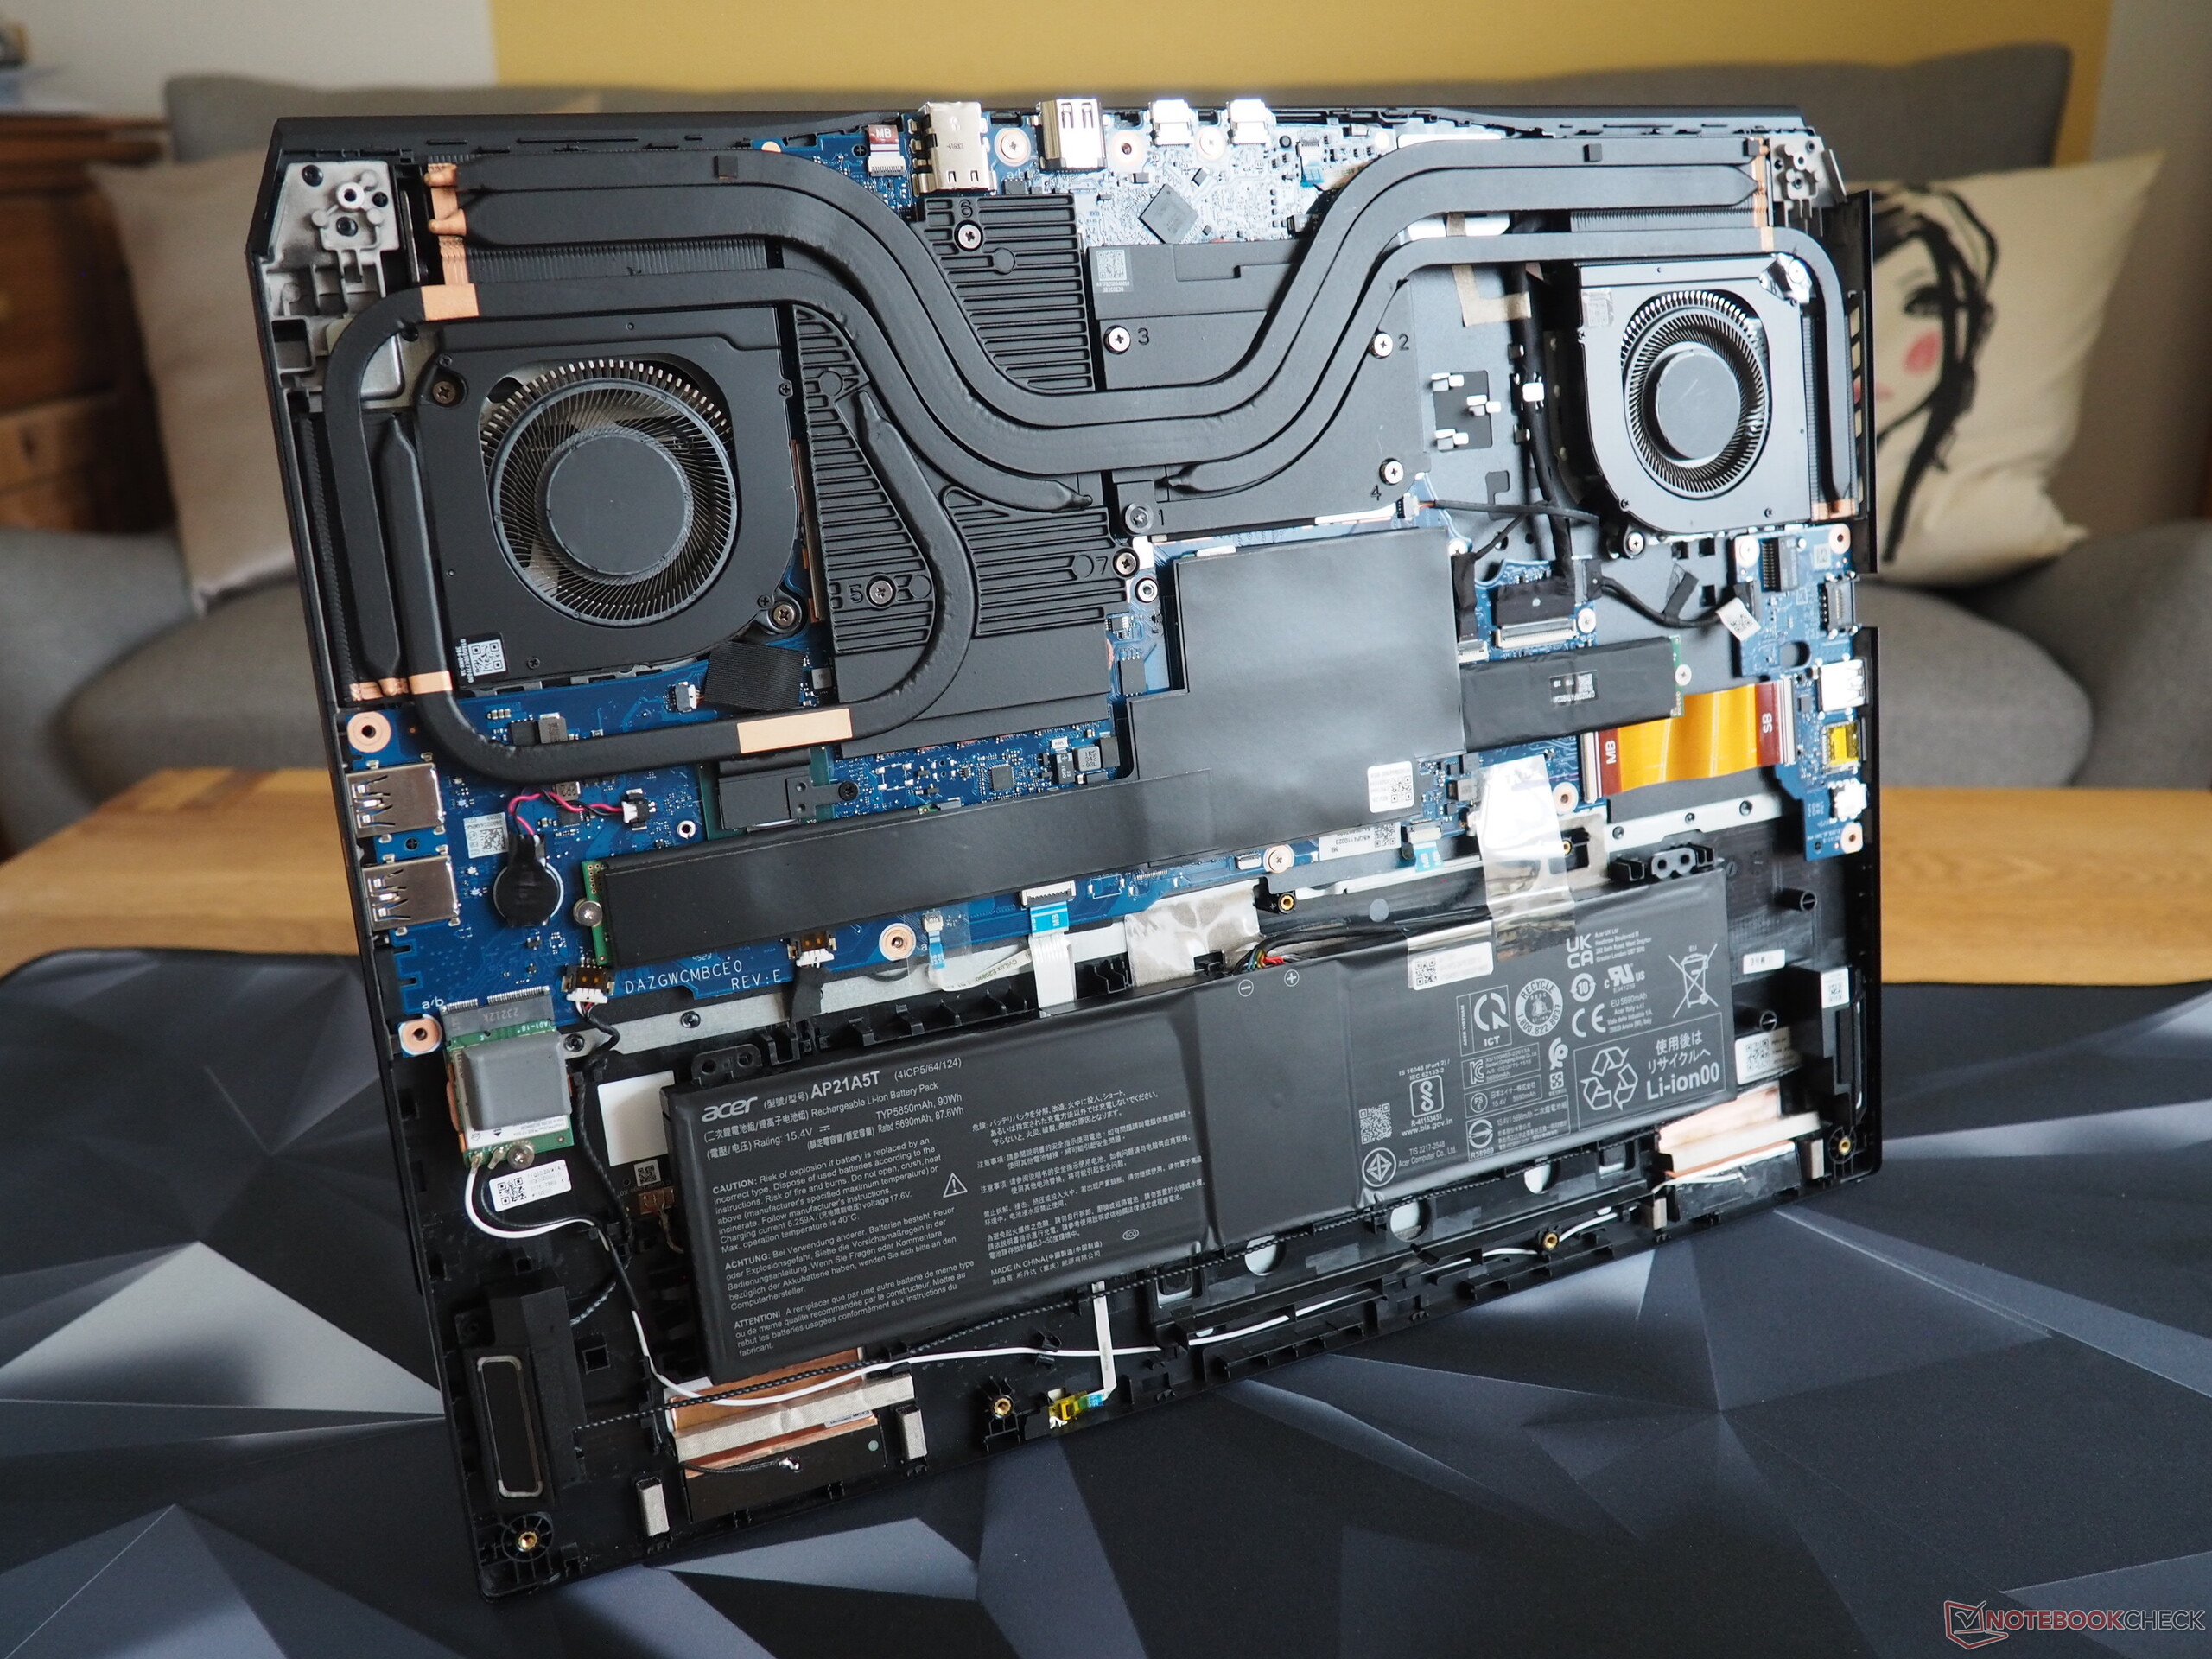
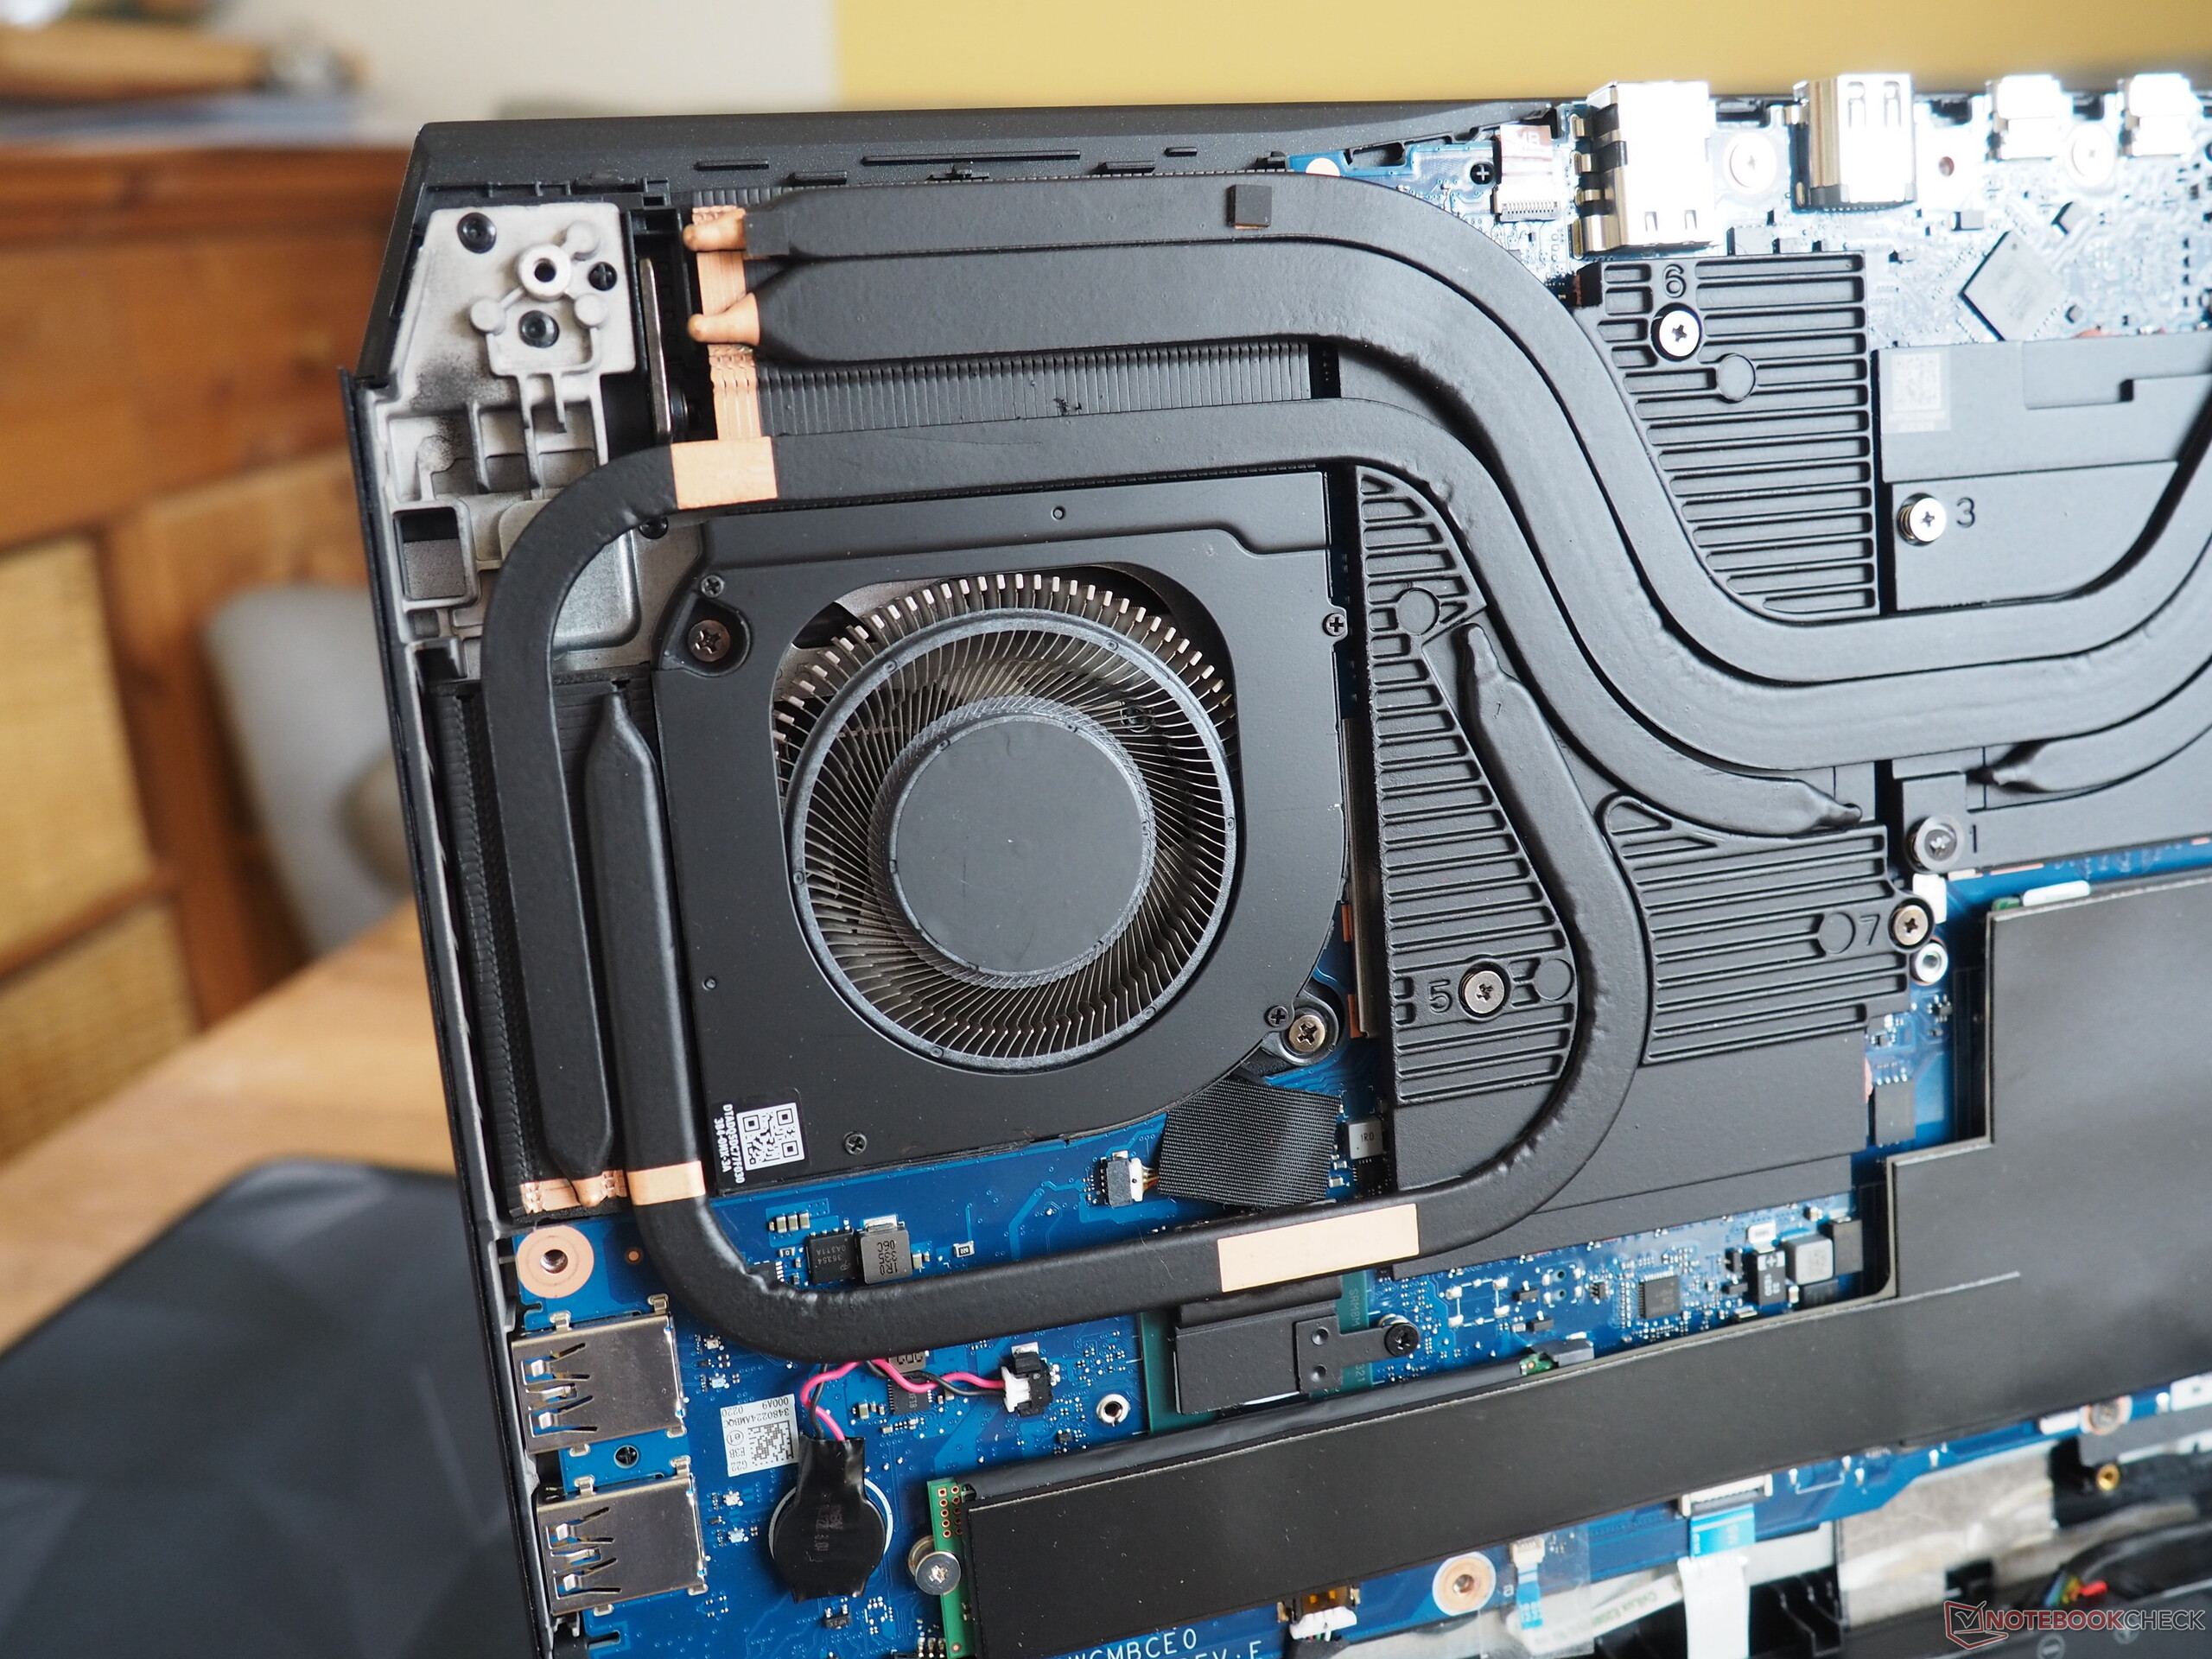
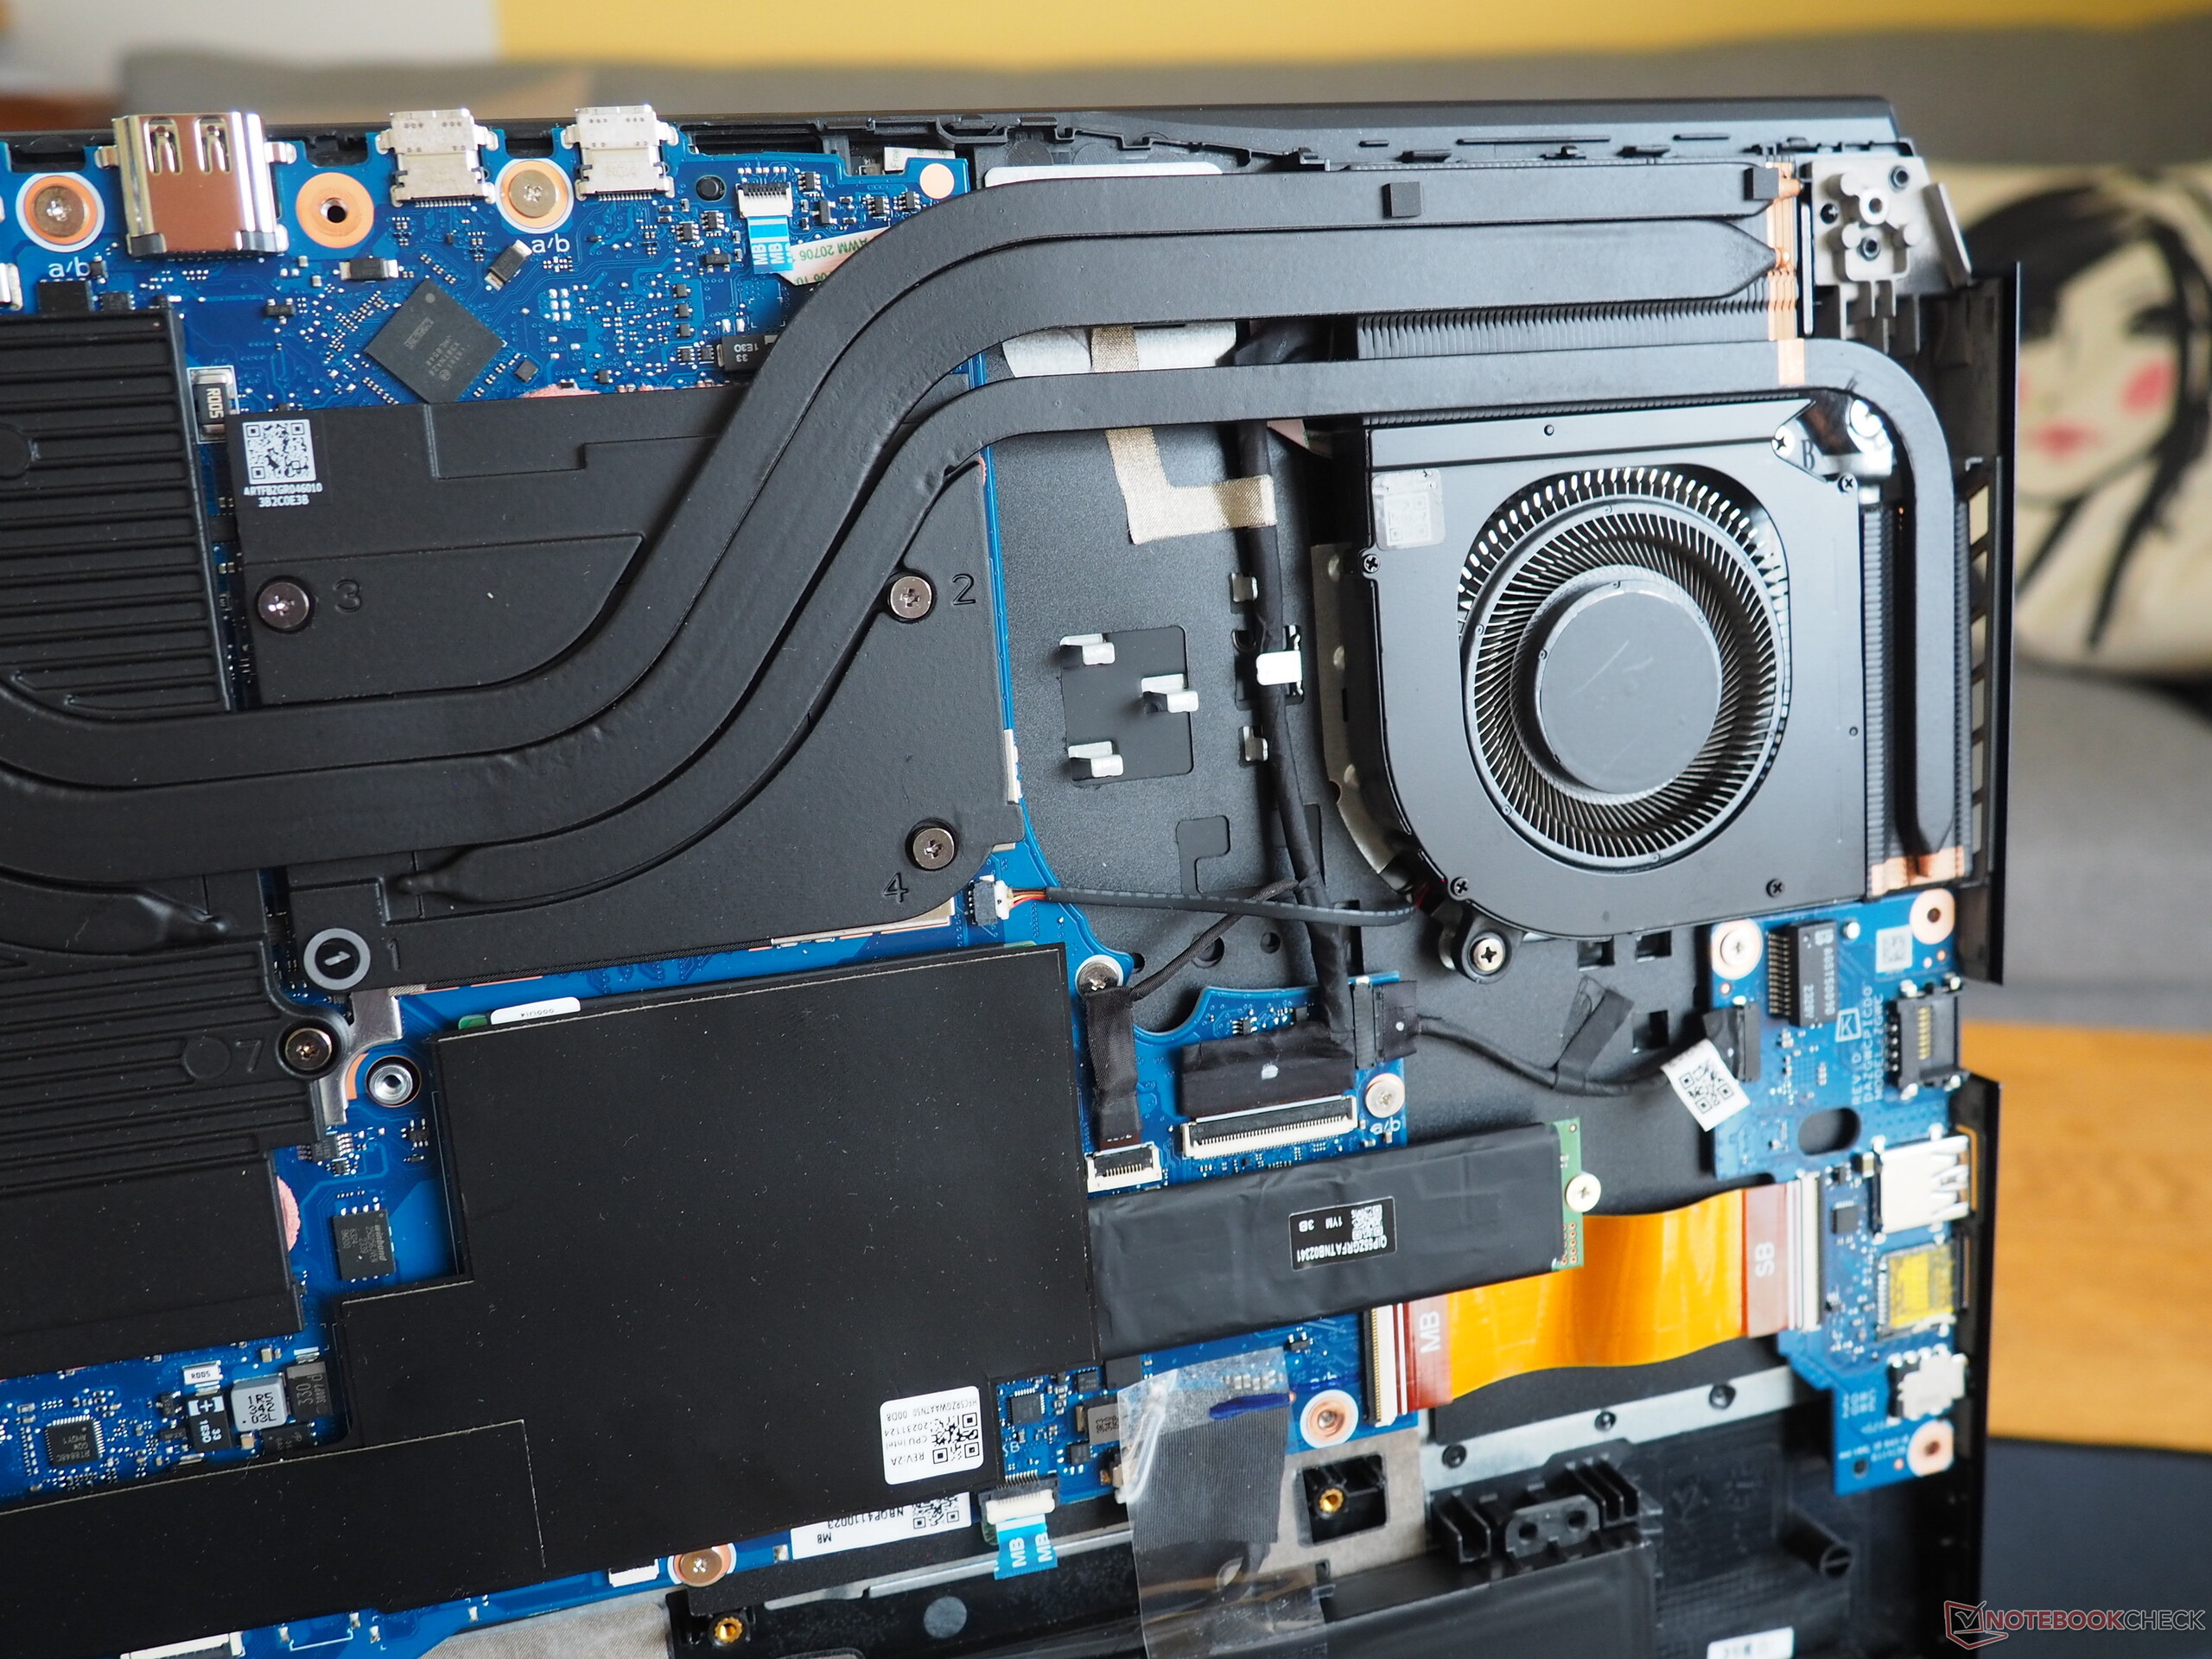
Manutenção
Suas opções de manutenção nos deixaram com sentimentos contraditórios. Leva um bom tempo para desparafusar os 14 parafusos Torx e abrir a placa inferior - além disso, a Acer pode até mesmo assustar muitos usuários com o uso de um selo de garantia (cobrindo um parafuso). Na parte interna, o senhor pelo menos tem acesso ao sistema de resfriamento, à bateria, ao módulo WLAN, à RAM e ao SSD. Entretanto, os dois últimos estão cobertos por películas e almofadas, o que não facilita a troca.
Garantia
O laptop é coberto por uma garantia de 24 meses.
Dispositivos de entrada
Teclado
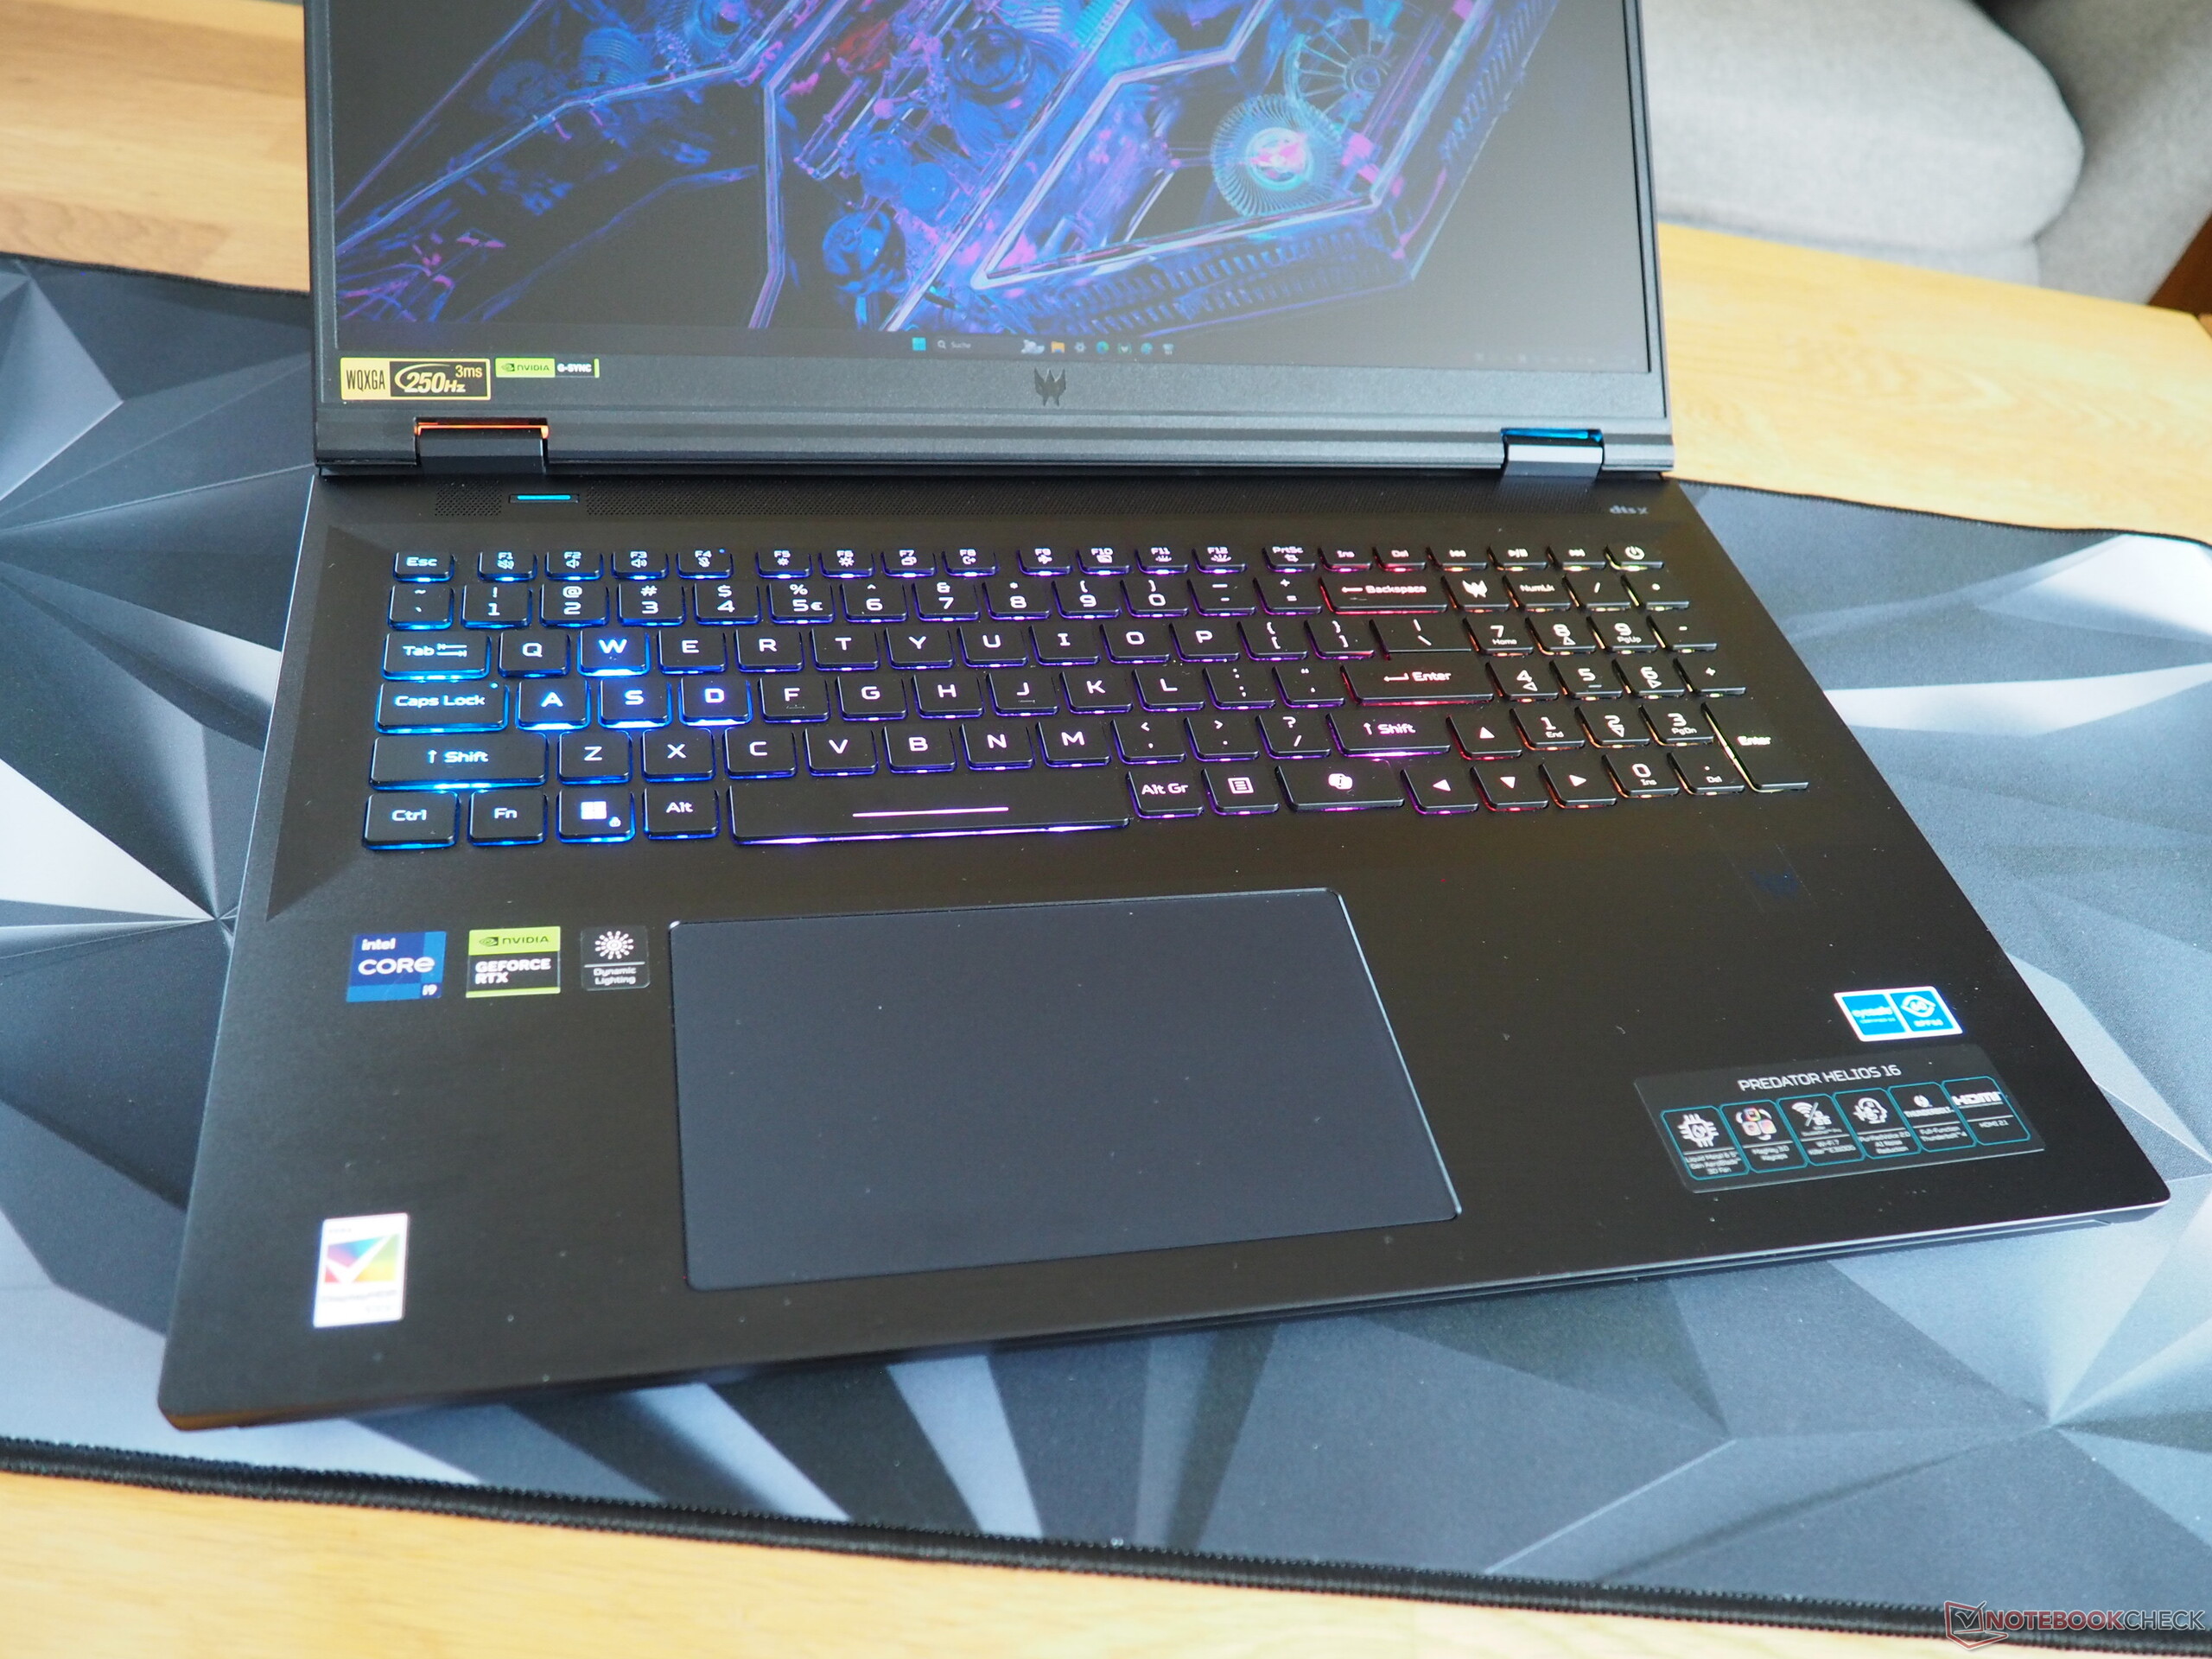
Os gamers ficarão entusiasmados ao ver a ampla iluminação do laptop em particular (RGB de tecla única) que, a nosso ver, poderia ser um pouco mais uniforme. Para um teclado clássico com cúpula de borracha, ele é surpreendentemente bom para digitar - é apenas um pouco barulhento. Com exceção de alguns detalhes (teclado numérico modificado), seu layout é bom. Ao contrário de outros fabricantes, a Acer não fez muitas experiências e a maioria das funções é útil. O fabricante também merece elogios pelo tamanho generoso das teclas do laptop (por exemplo, suas teclas de seta bem dimensionadas).
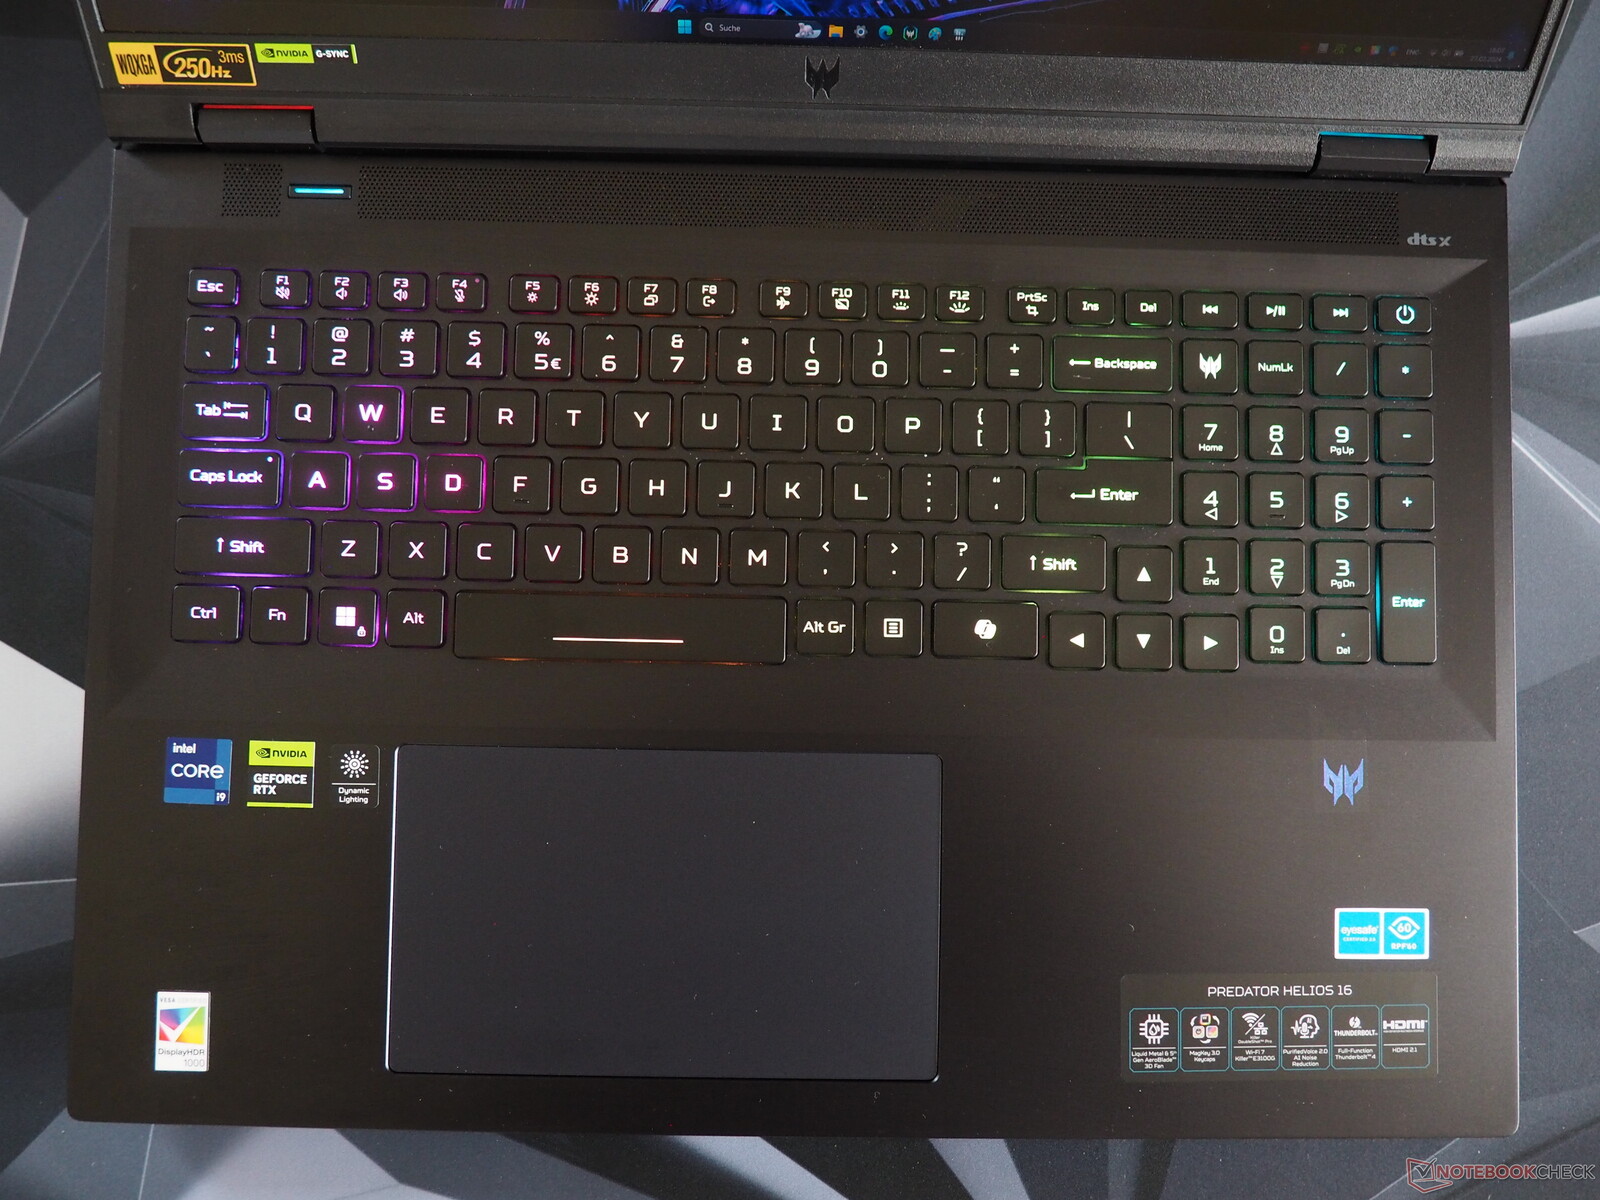
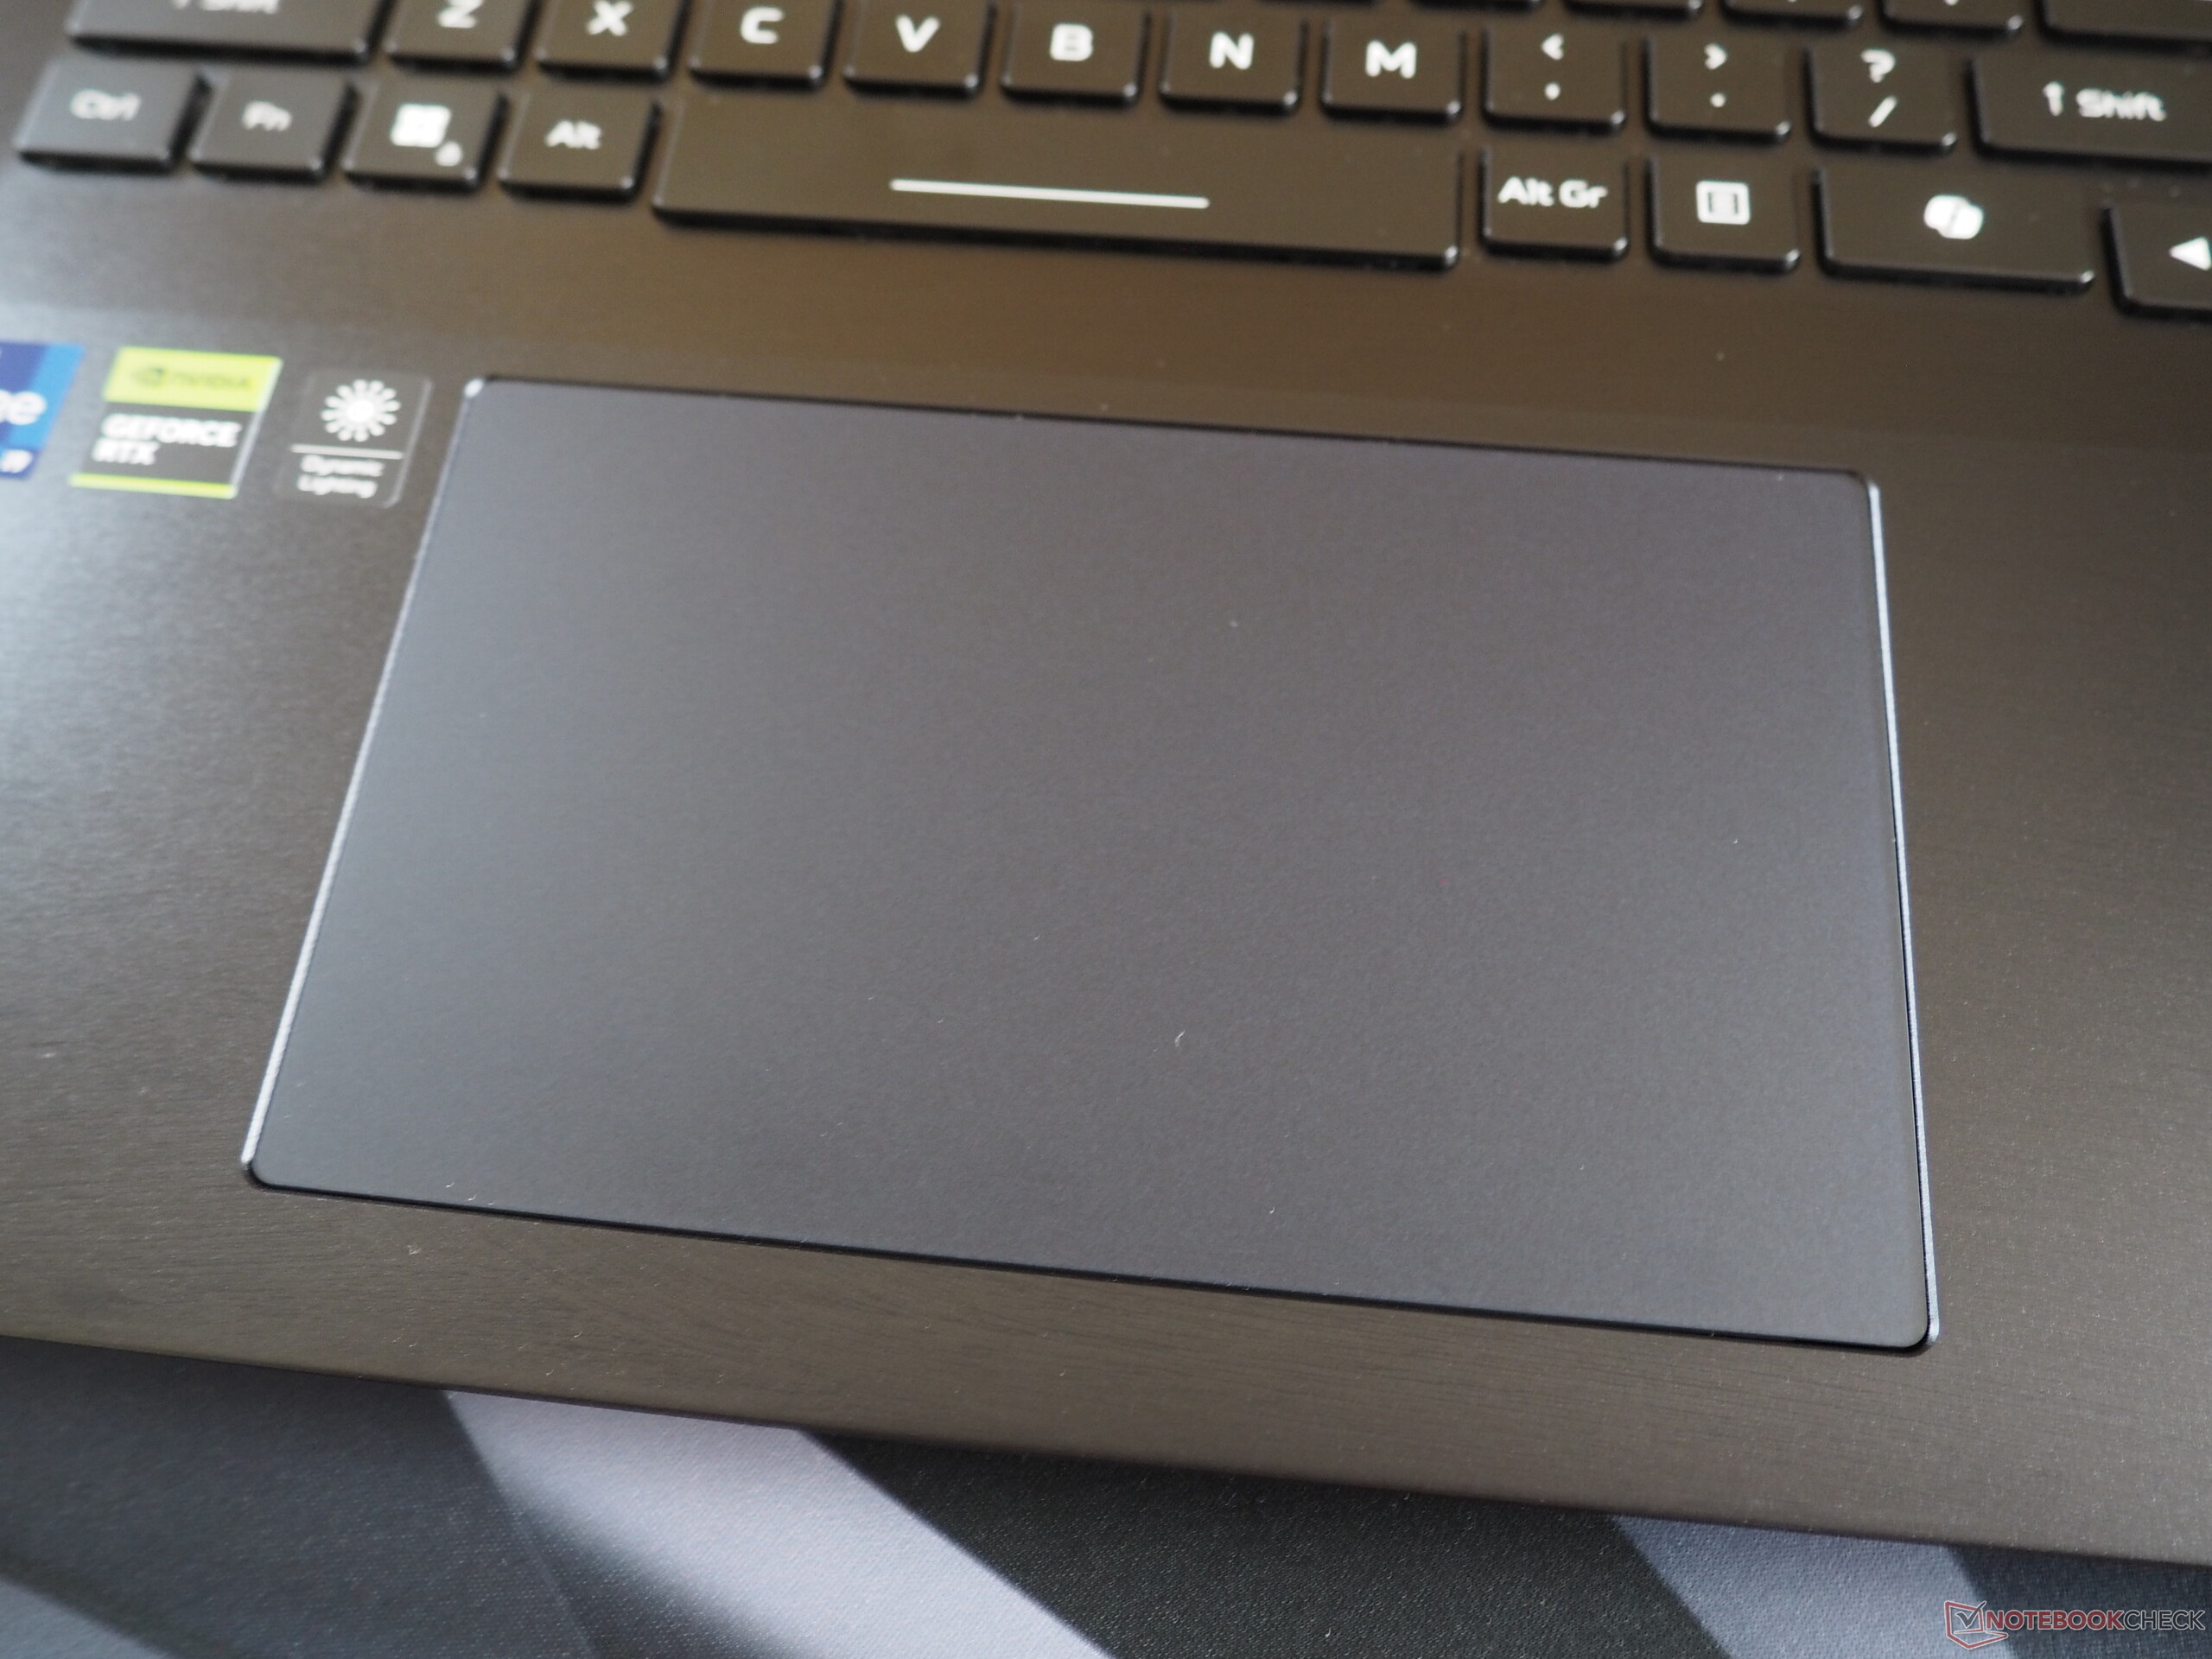
Touchpad
O touchpad também é quase perfeito. Seu tamanho de 15 x 9 cm é generoso e permite movimentos longos sem a necessidade de levantar o dedo. Além disso, sua superfície lisa garante que seus dedos deslizem bem sobre o touchpad. Não notamos nada imperceptível no que diz respeito ao suporte a gestos e à precisão.
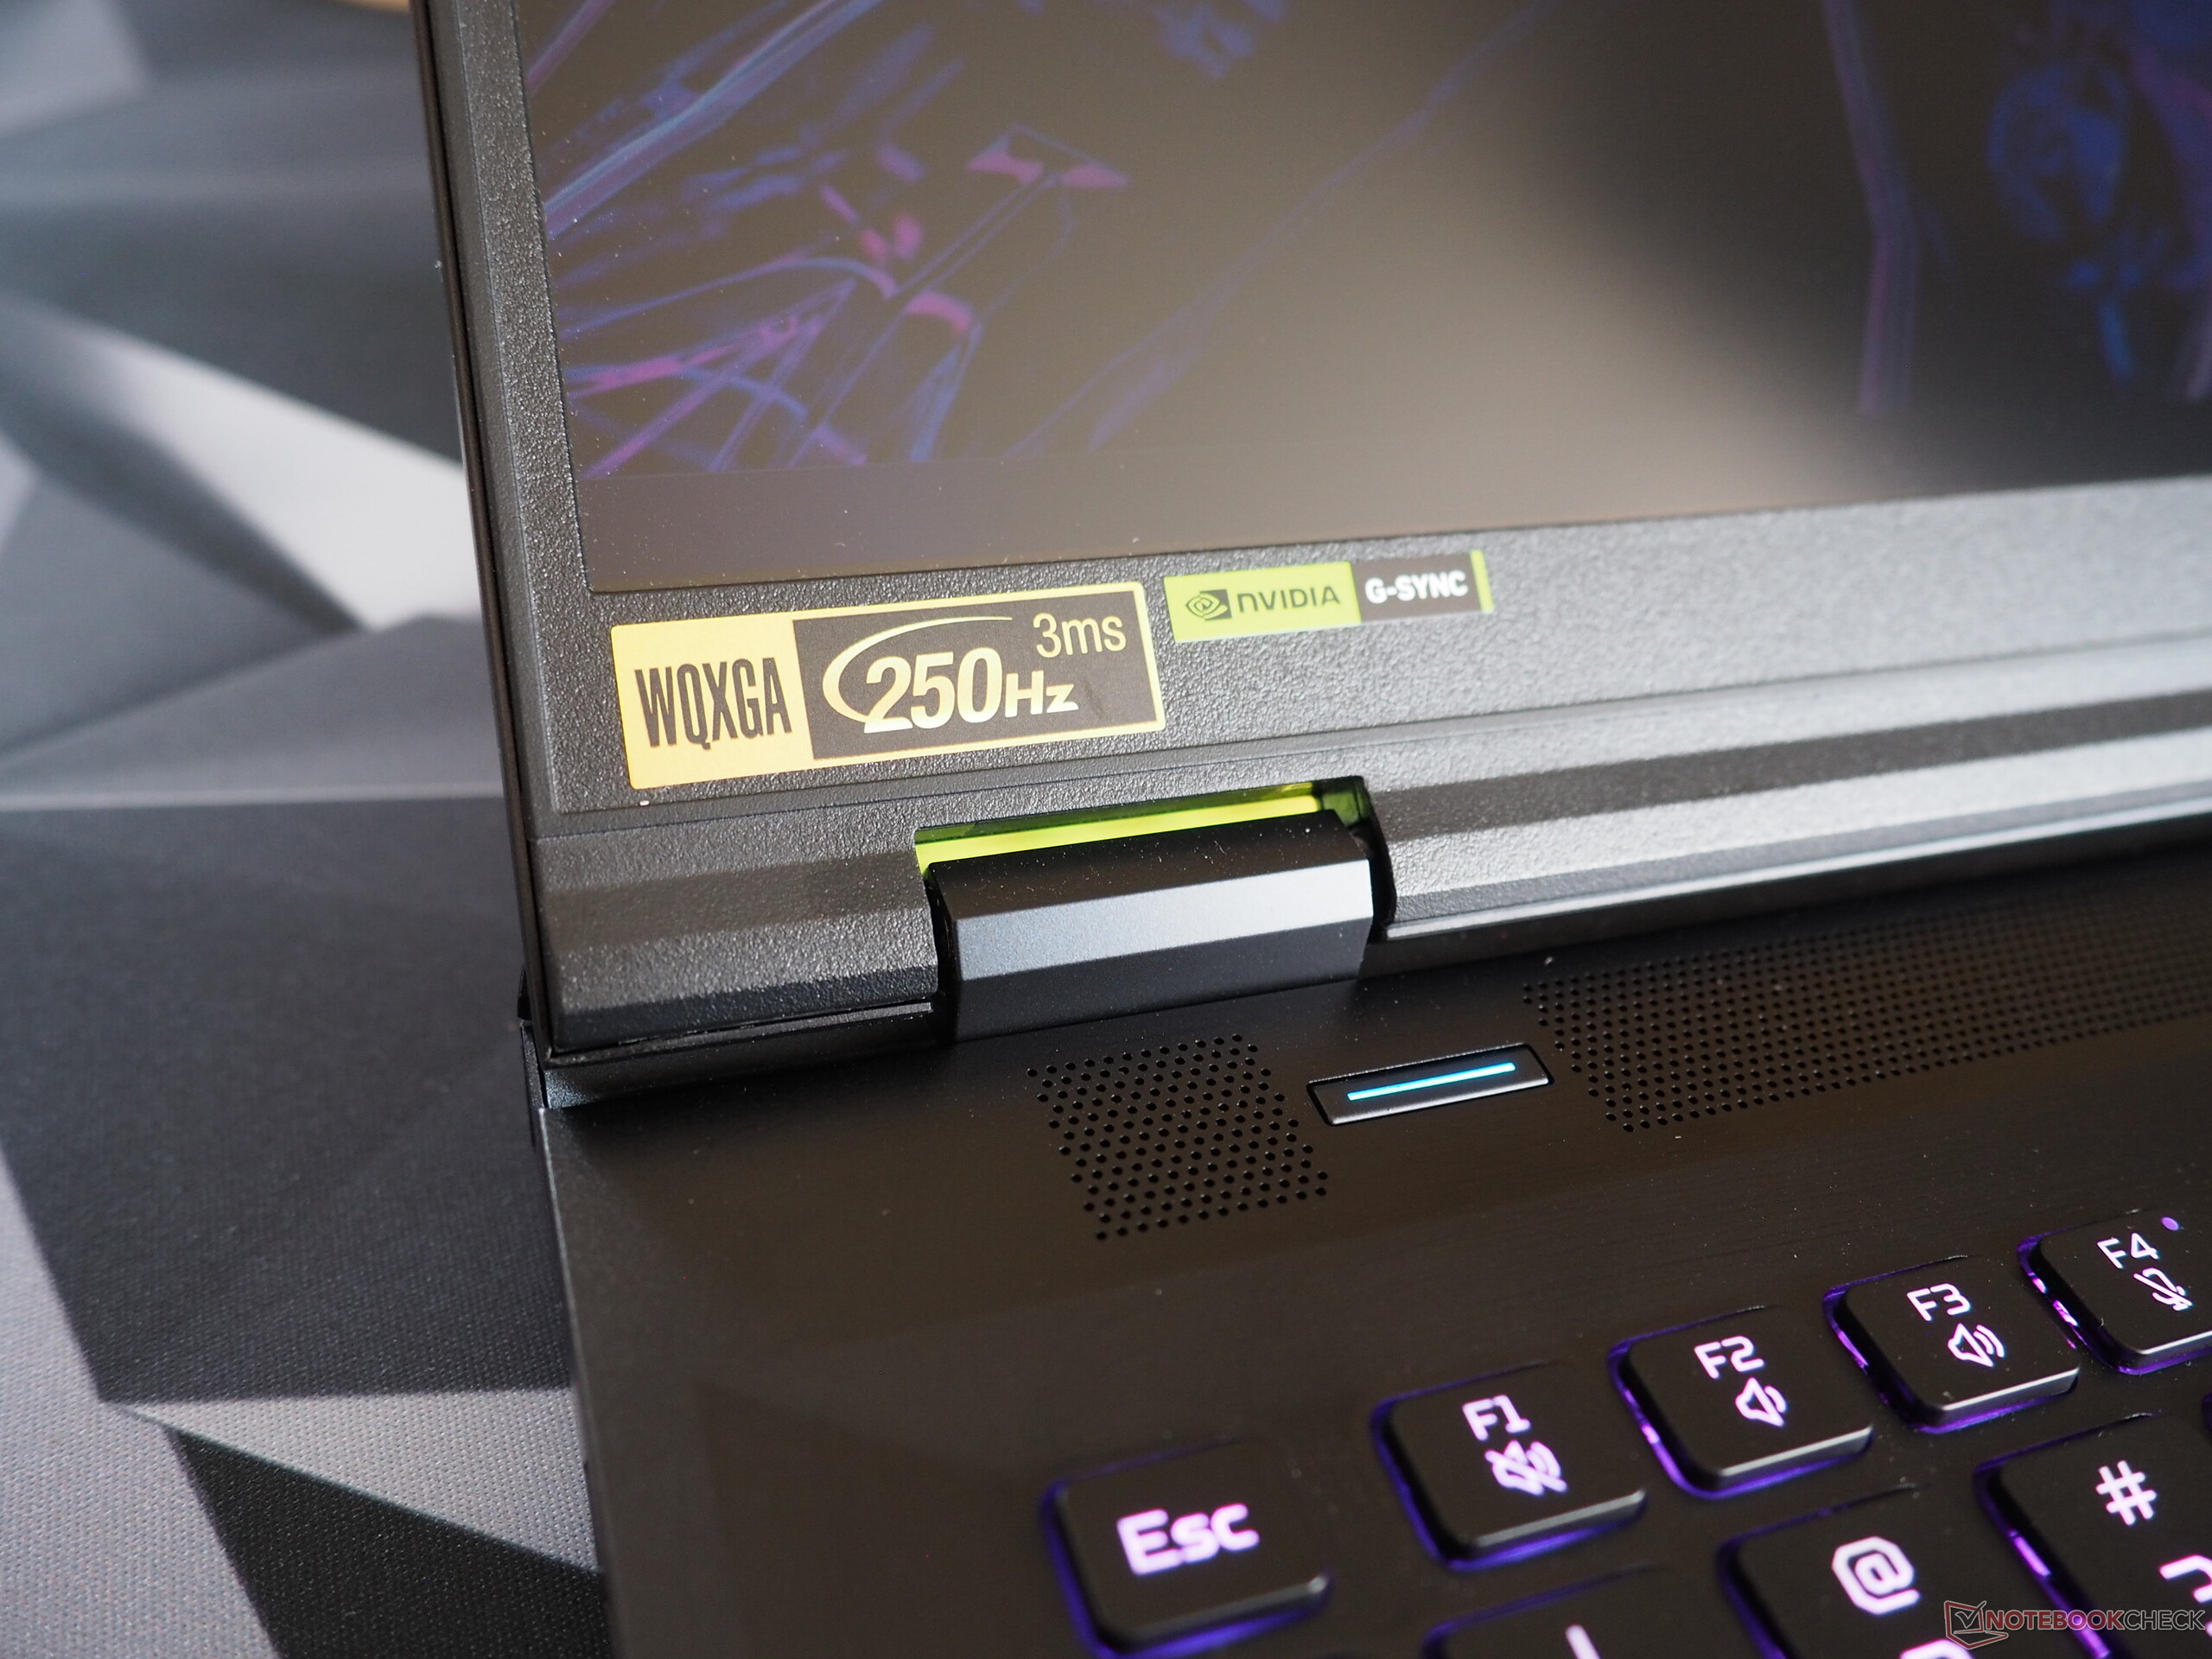
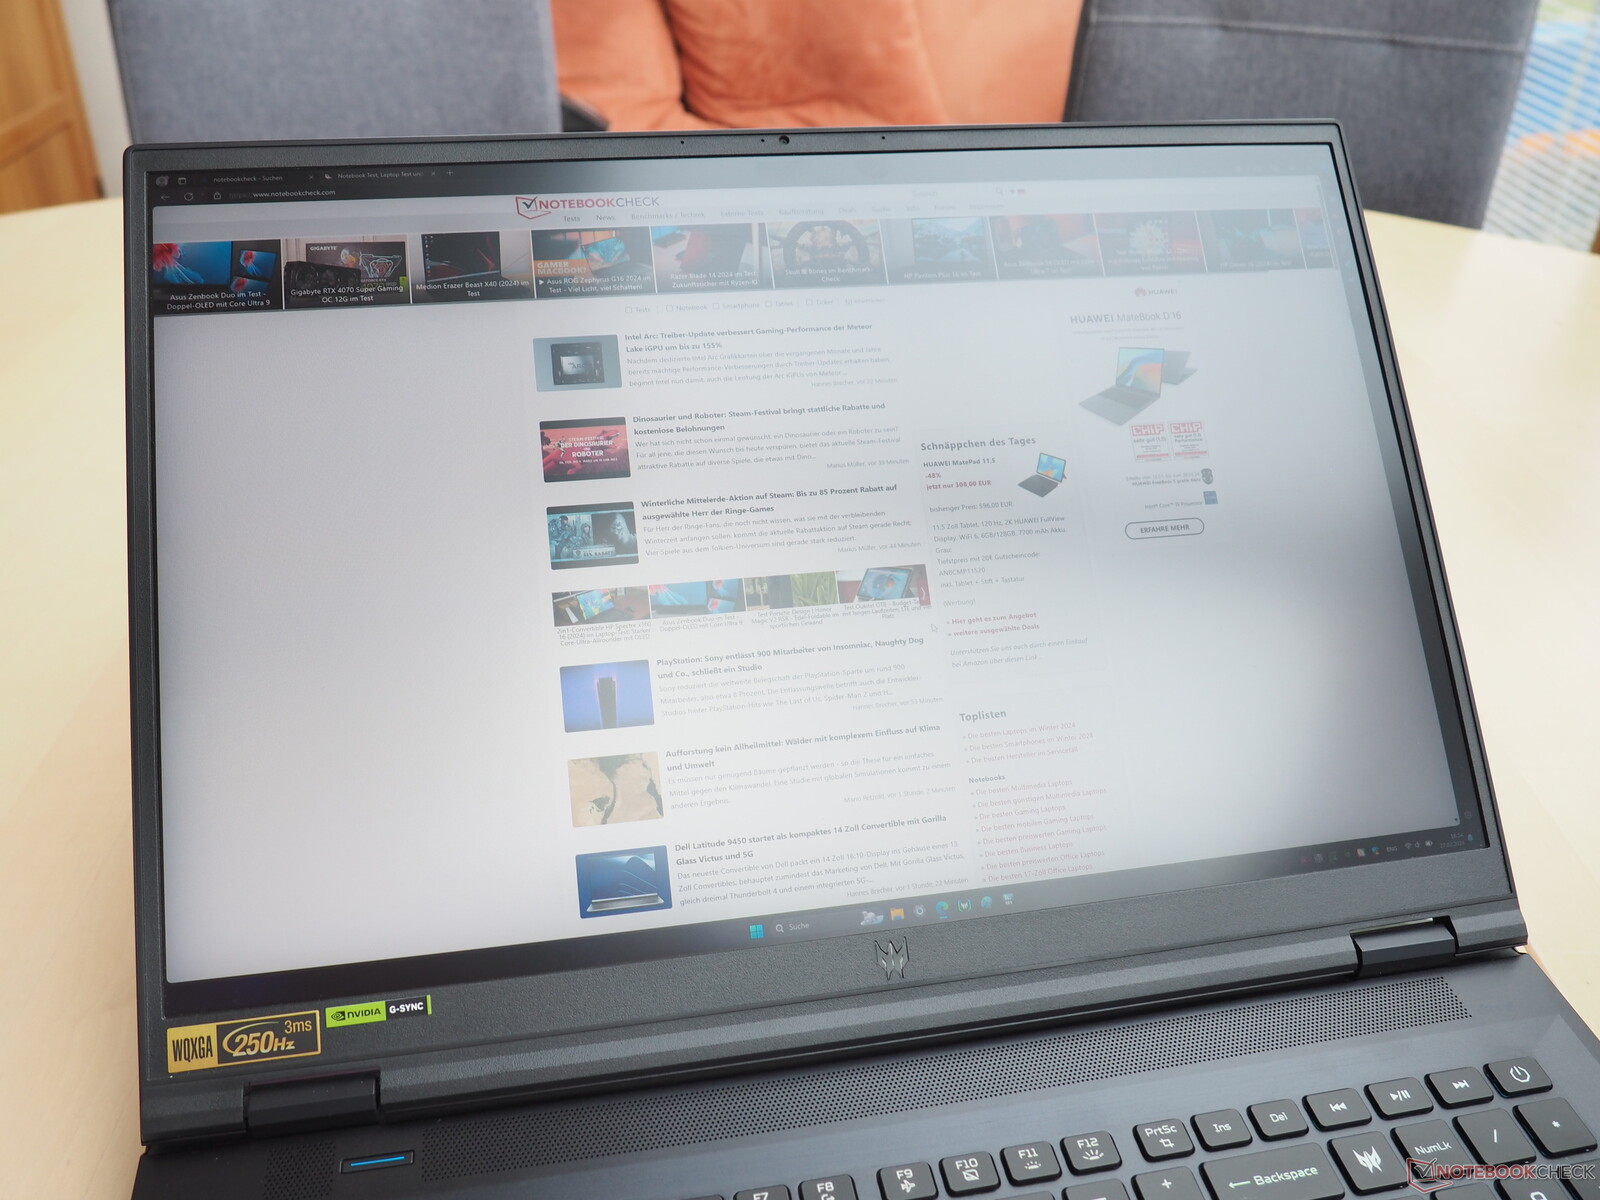
Tela
A versão 2024 herdou a tela Mini-LED de seu antecessor (WQXGA, 16:10, 250 Hz, HDR1000). Se desconsiderarmos a oscilação em todos os níveis de brilho (que, felizmente, só deve ser um problema para usuários sensíveis), essa tecnologia tem vantagens claras sobre um painel IPS padrão.
| |||||||||||||||||||||||||
iluminação: 93 %
iluminação com acumulador: 722 cd/m²
Contraste: 18050:1 (Preto: 0.04 cd/m²)
ΔE ColorChecker Calman: 3.4 | ∀{0.5-29.43 Ø4.71}
calibrated: 1.6
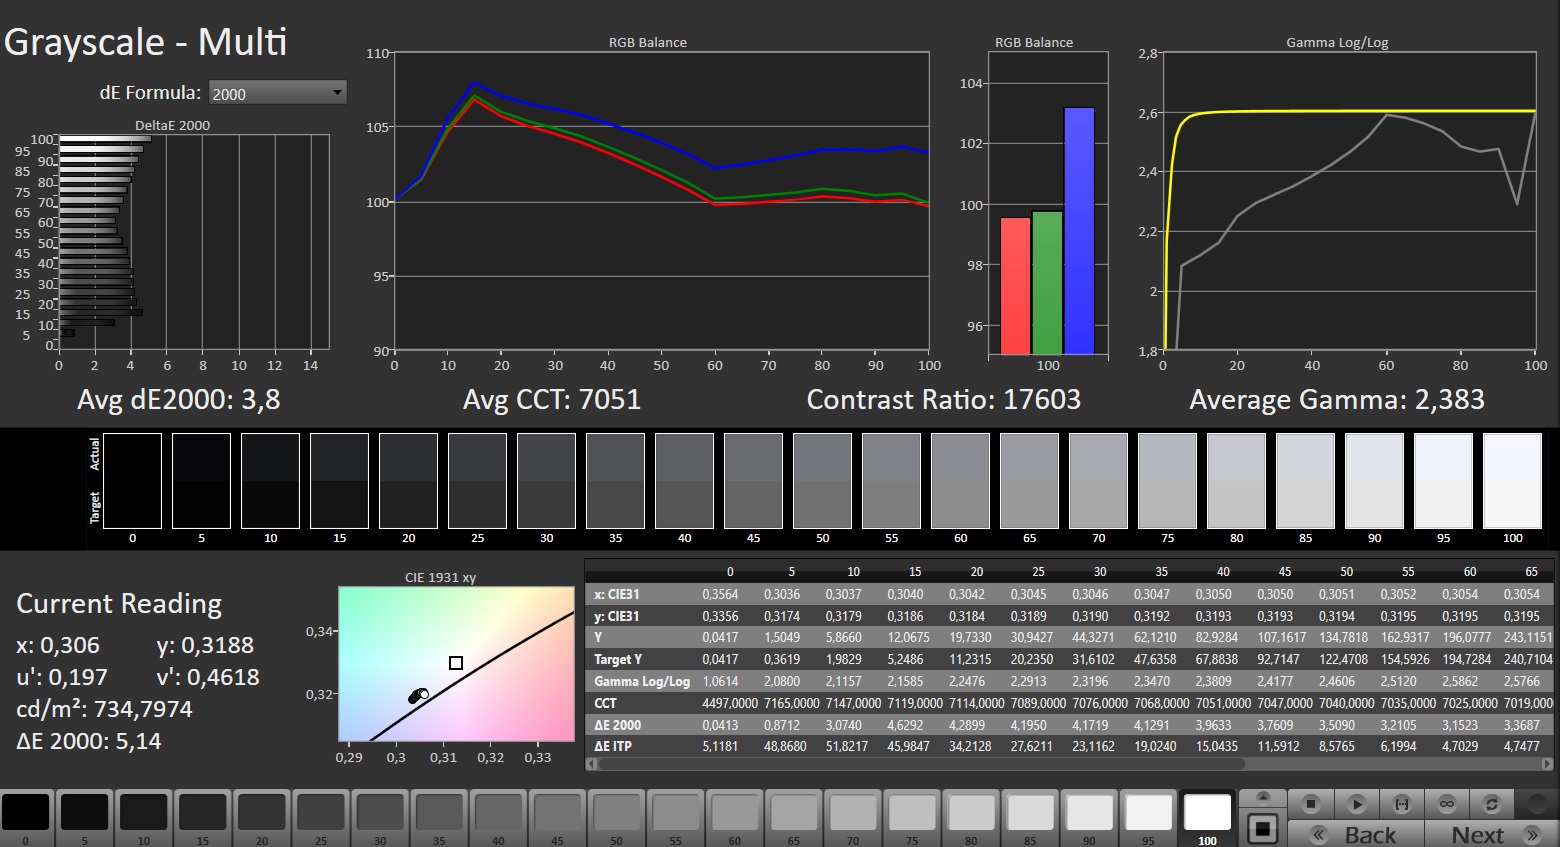
ΔE Greyscale Calman: 3.8 | ∀{0.09-98 Ø4.96}
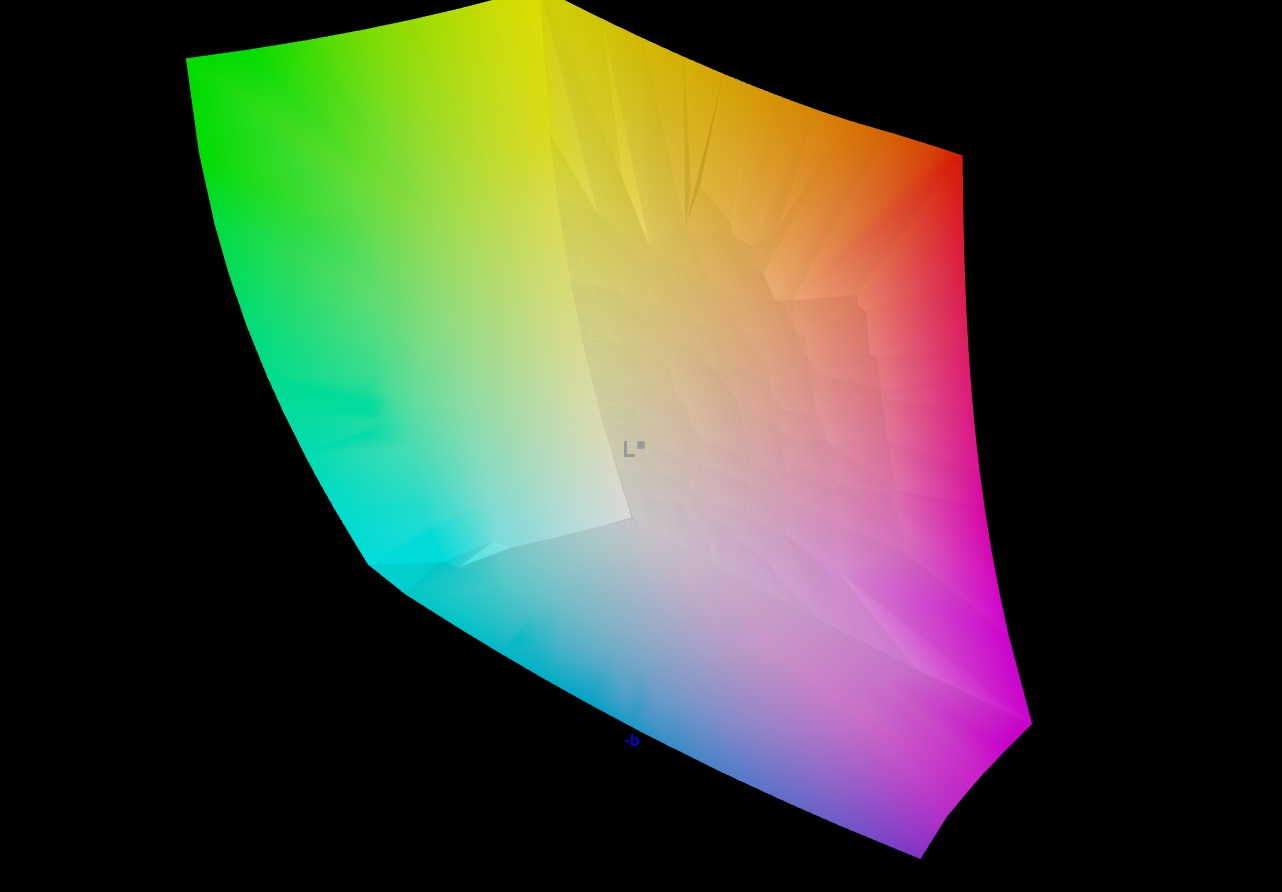
91.6% AdobeRGB 1998 (Argyll 3D)
100% sRGB (Argyll 3D)
99.7% Display P3 (Argyll 3D)
Gamma: 2.383
CCT: 7051 K
| Acer Predator Helios 18 PH18-72-98MW B180QAN01.2 (AUO45A8), Mini-LED, 2560x1600, 18" | MSI Titan 18 HX A14VIG AU Optronics B180ZAN01.0, Mini-LED, 3840x2400, 18" | Asus ROG Strix Scar 18 G834JYR (2024) BOE NE180QDM-NM1, Mini LED, 2560x1600, 18" | Acer Predator Helios 18 N23Q2 AUO45A8 (B180QAN01.2), IPS, 2560x1600, 18" | Alienware m18 R1 AMD BOE NE18NZ1, IPS, 1920x1200, 18" | |
|---|---|---|---|---|---|
| Display | -3% | -1% | 0% | -1% | |
| Display P3 Coverage (%) | 99.7 | 98.1 -2% | 99.9 0% | 99.8 0% | 98.5 -1% |
| sRGB Coverage (%) | 100 | 99.8 0% | 100 0% | 100 0% | 99.7 0% |
| AdobeRGB 1998 Coverage (%) | 91.6 | 86.2 -6% | 90 -2% | 91.8 0% | 88.7 -3% |
| Response Times | -187% | -6% | 2% | 55% | |
| Response Time Grey 50% / Grey 80% * (ms) | 8 ? | 8.6 ? -8% | 12 ? -50% | 7.6 ? 5% | 2.8 ? 65% |
| Response Time Black / White * (ms) | 17.6 ? | 81.8 ? -365% | 10.7 ? 39% | 17.8 ? -1% | 9.6 ? 45% |
| PWM Frequency (Hz) | 4832 ? | 2592 ? | 5733 ? | 2509 | |
| Screen | -24% | 17% | -82% | -54% | |
| Brightness middle (cd/m²) | 722 | 467.5 -35% | 937 30% | 360 -50% | 319.6 -56% |
| Brightness (cd/m²) | 724 | 459 -37% | 934 29% | 355 -51% | 304 -58% |
| Brightness Distribution (%) | 93 | 90 -3% | 89 -4% | 92 -1% | 87 -6% |
| Black Level * (cd/m²) | 0.04 | 0.066 -65% | 0.21 -425% | 0.25 -525% | |
| Contrast (:1) | 18050 | 14197 -21% | 1714 -91% | 1278 -93% | |
| Colorchecker dE 2000 * | 3.4 | 3.77 -11% | 1.52 55% | 3.82 -12% | 1.22 64% |
| Colorchecker dE 2000 max. * | 5.32 | 6.12 -15% | 2.82 47% | 7.38 -39% | 3.1 42% |
| Colorchecker dE 2000 calibrated * | 1.6 | 2.94 -84% | 1.21 24% | 2.24 -40% | 0.47 71% |
| Greyscale dE 2000 * | 3.8 | 3.2 16% | 1.7 55% | 5.06 -33% | 0.8 79% |
| Gamma | 2.383 92% | 2.43 91% | 2.042 108% | 2.52 87% | 2.23 99% |
| CCT | 7051 92% | 6478 100% | 6578 99% | 5657 115% | 6471 100% |
| Média Total (Programa/Configurações) | -71% /
-46% | 3% /
10% | -27% /
-53% | 0% /
-27% |
* ... menor é melhor
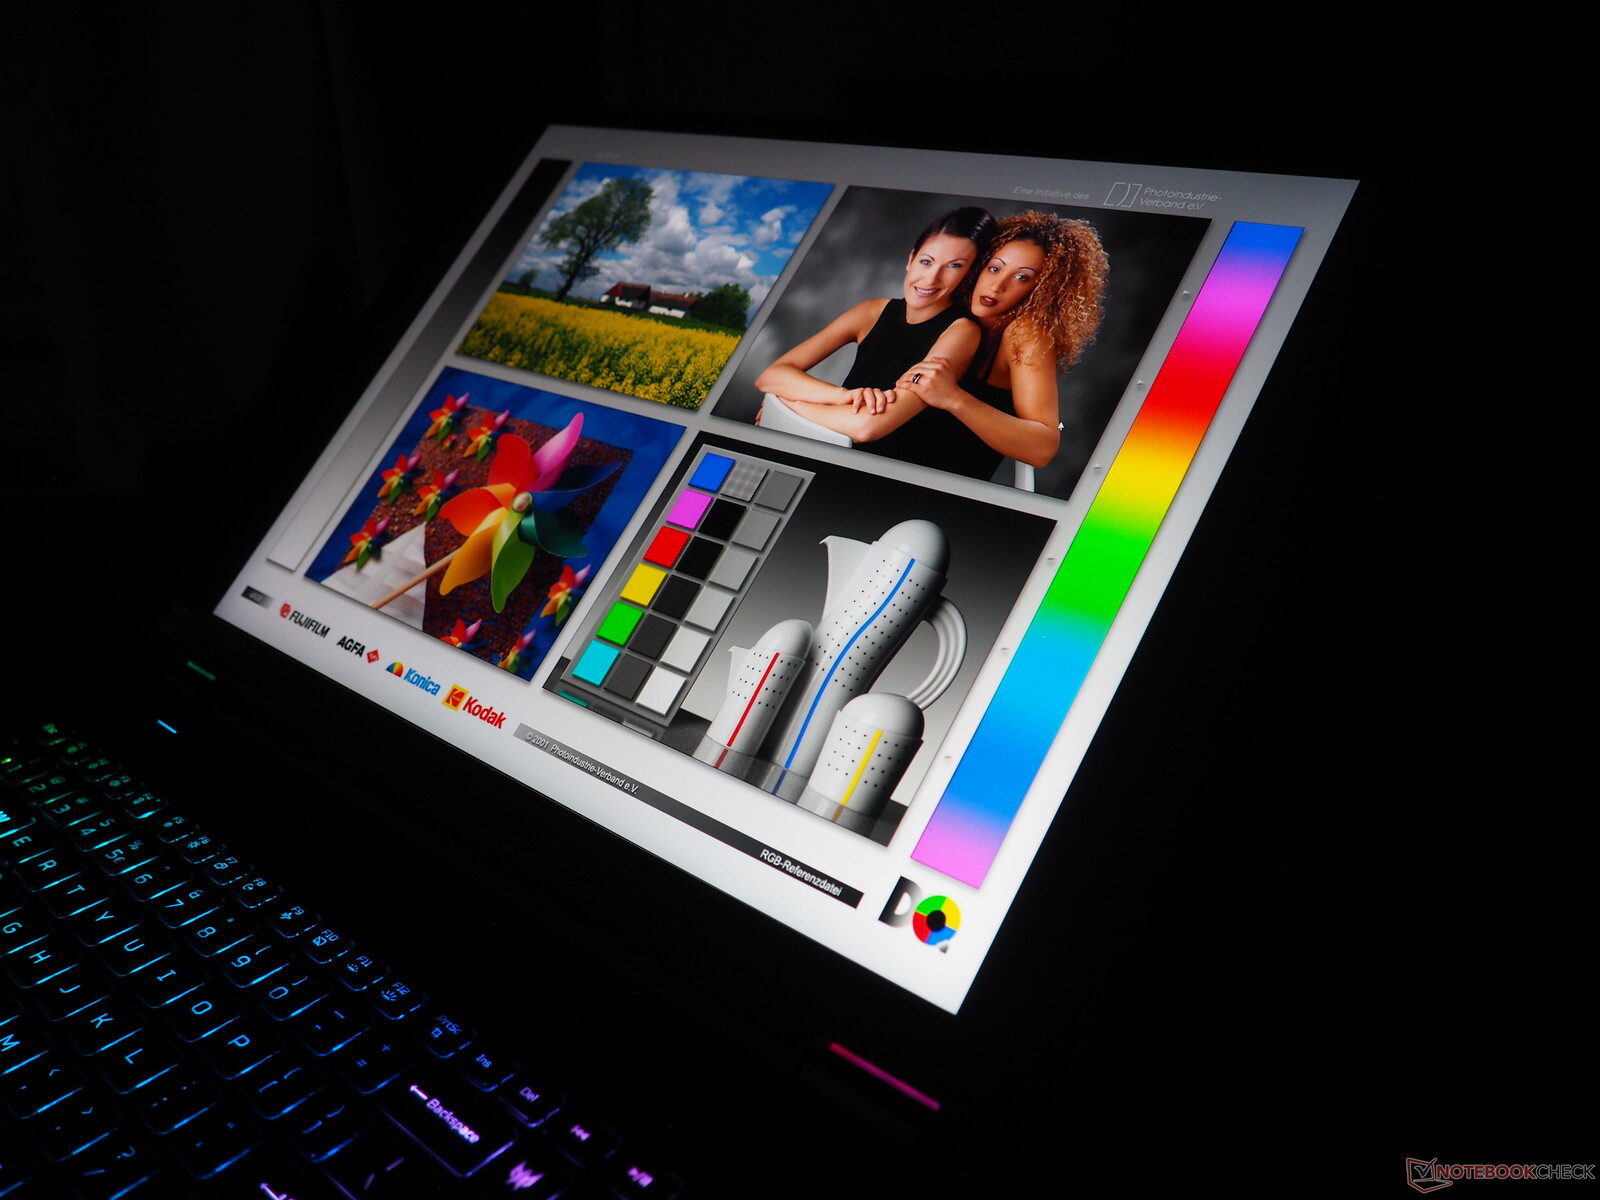
A começar por seu brilho impressionante: Uma média de 724 cd/m² significa que o senhor pode usar o dispositivo mesmo em ambientes muito claros (ou seja, ao ar livre). Em combinação com seu valor de preto extremamente baixo de aproximadamente 0,04 cd/m², a tela oferece um excelente contraste de cerca de 18.000:1. Além disso, a ampla cobertura do espaço de cores - embora não consiga cobrir o AdobeRGB em sua totalidade, ela consegue cobrir 100% do sRGB e do DCI-P3, o que é impressionante.
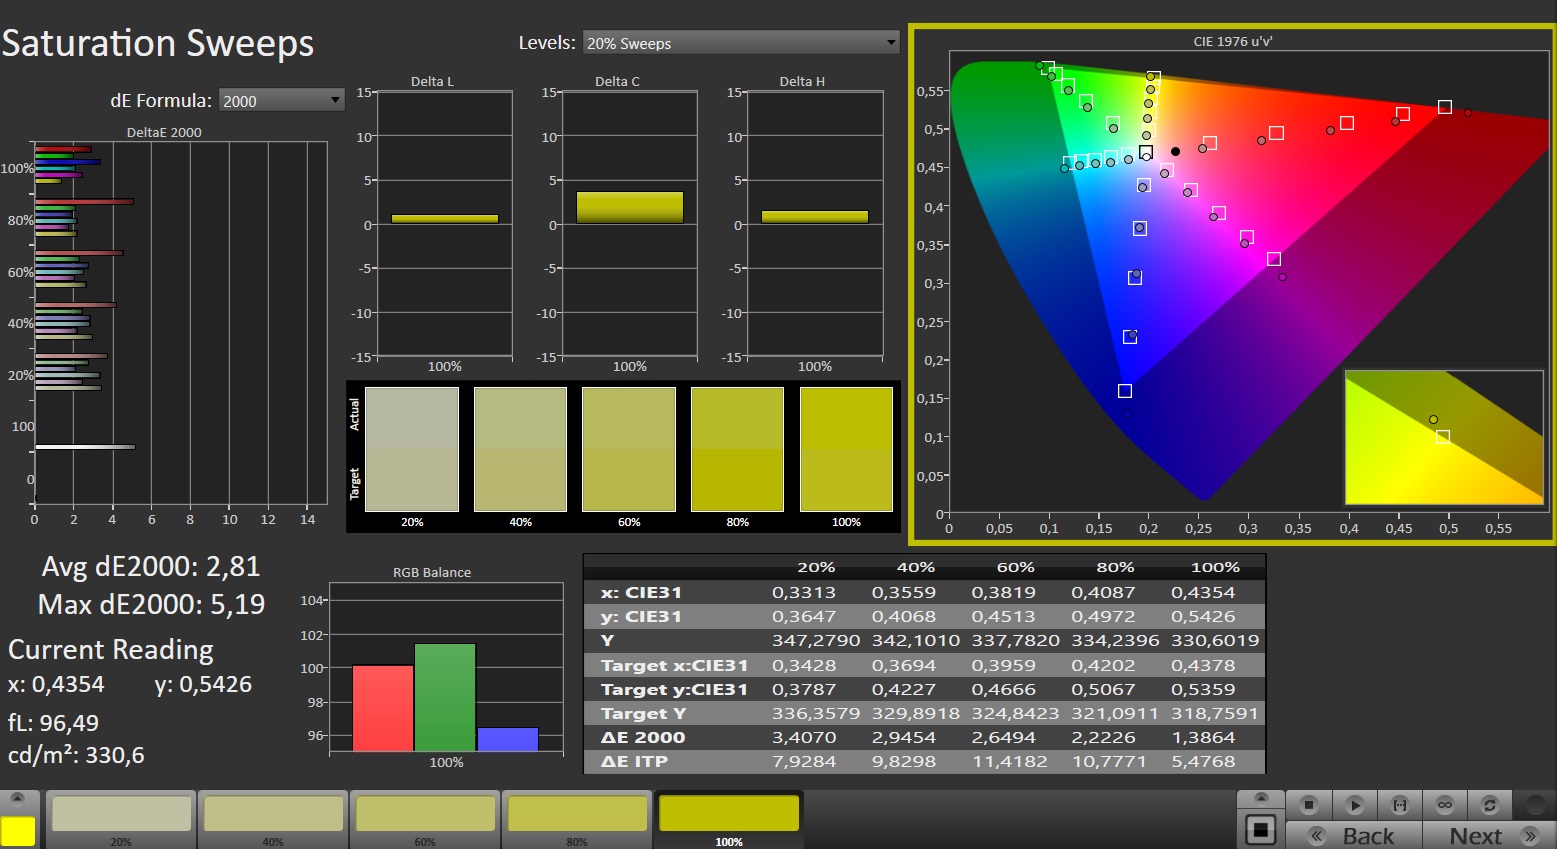
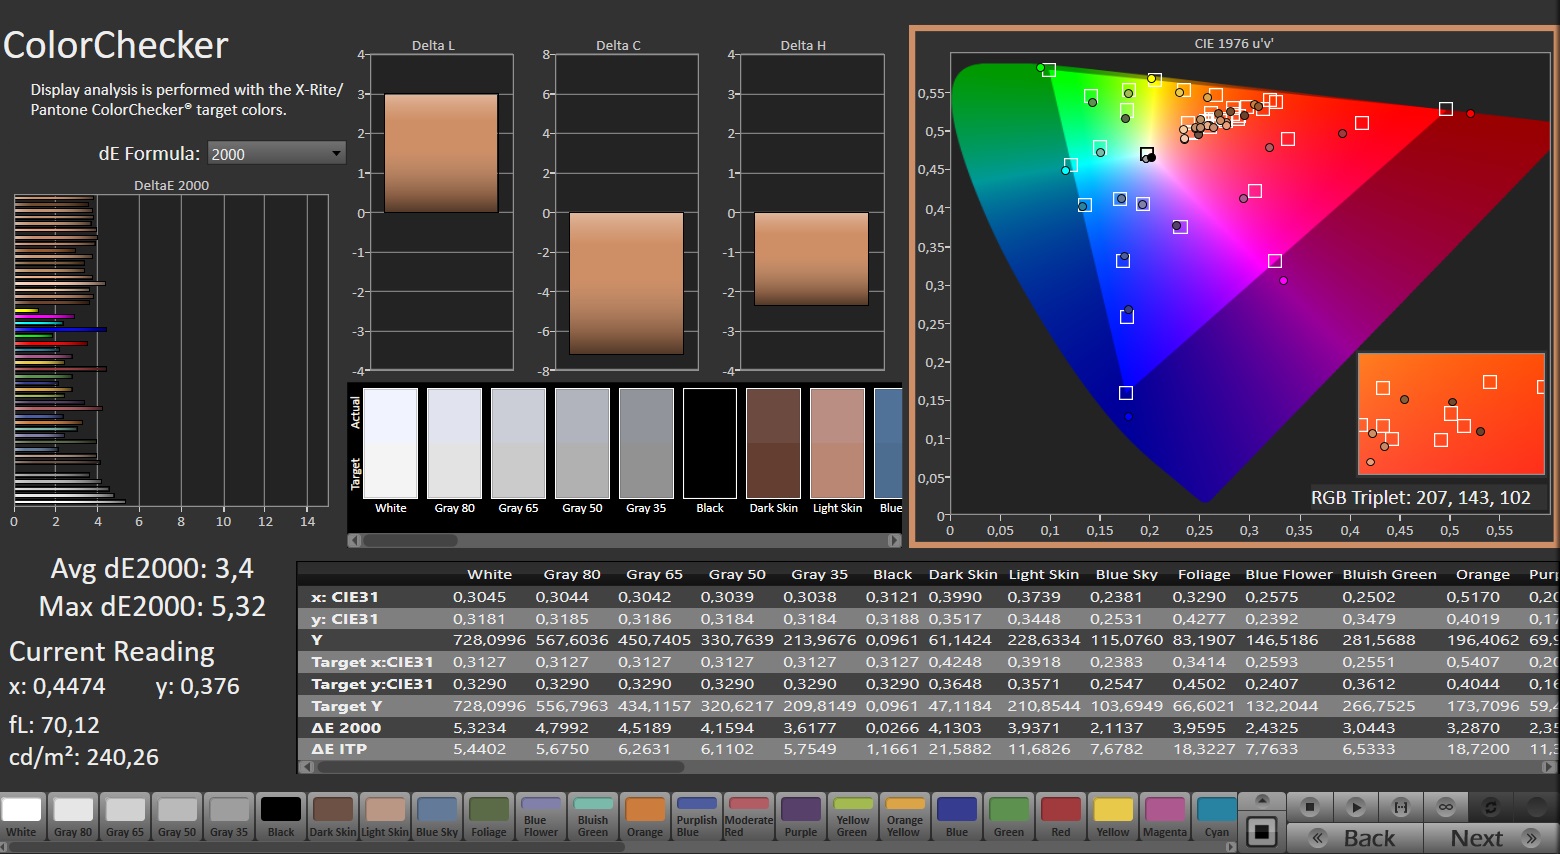
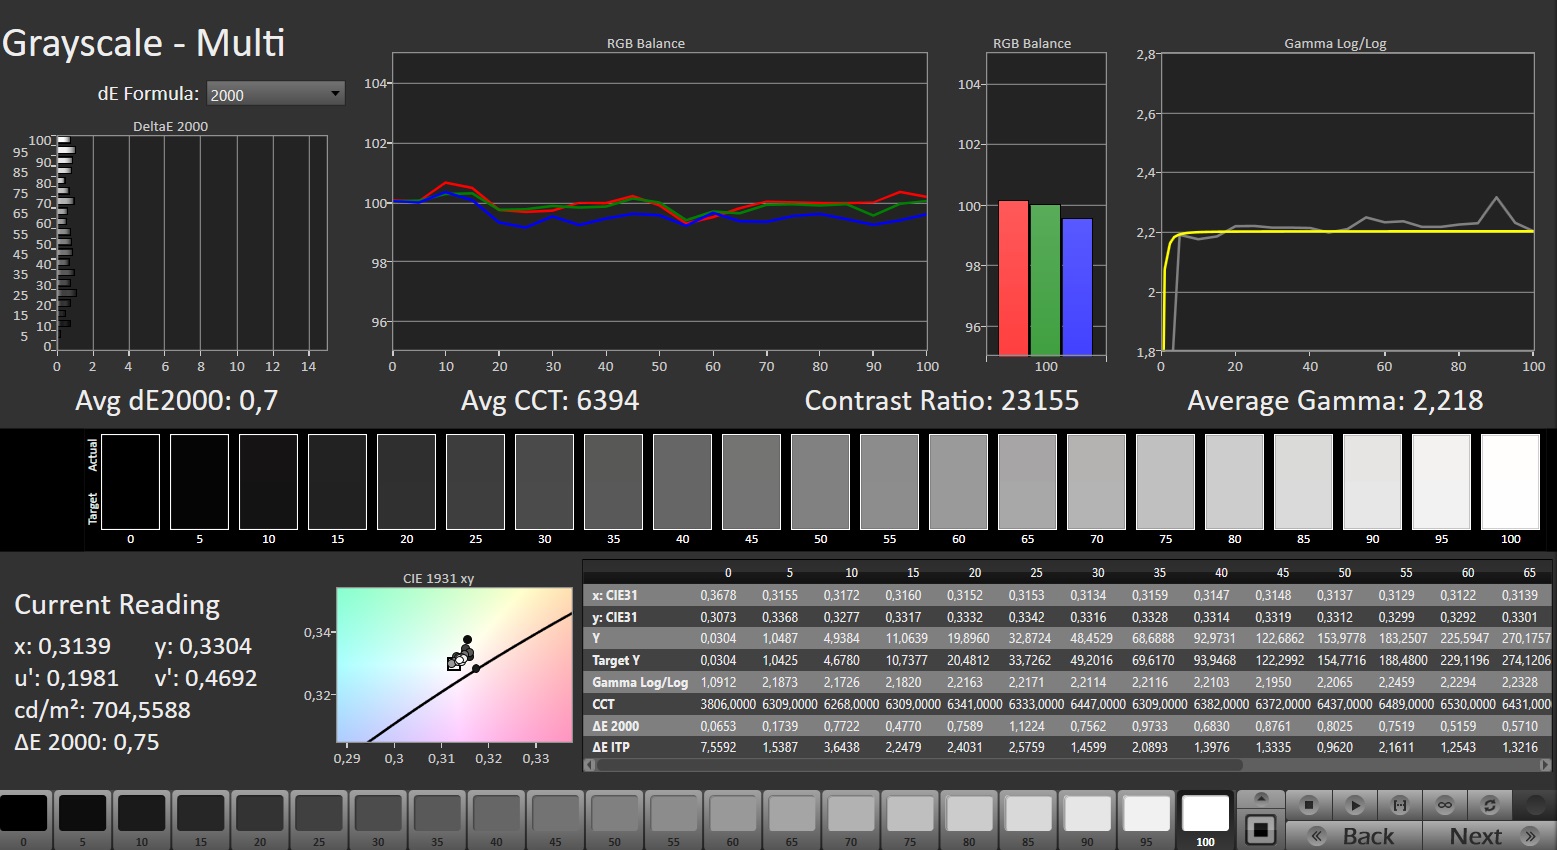
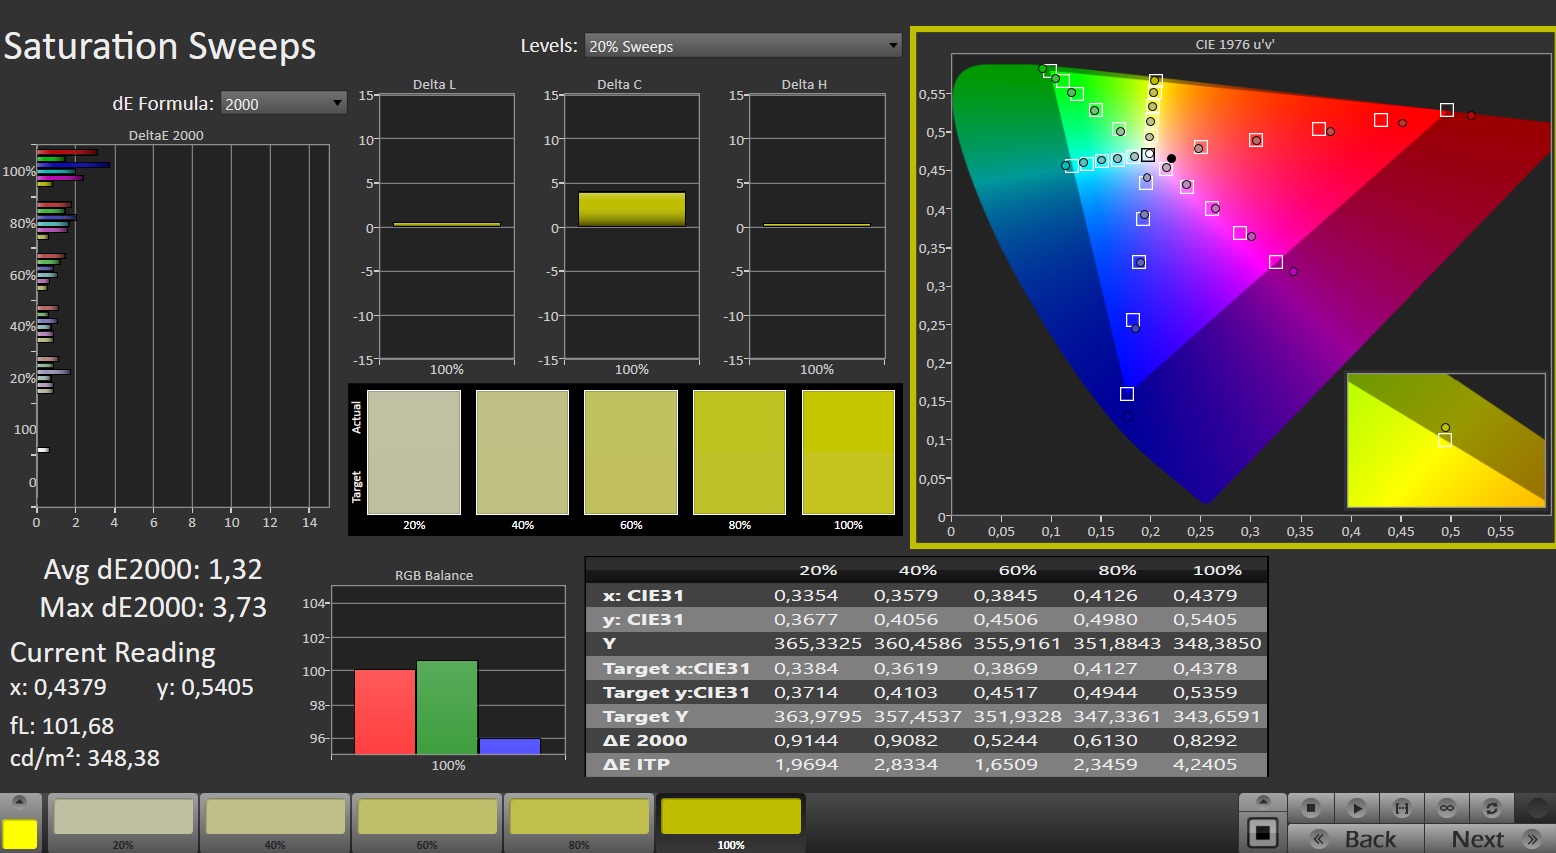
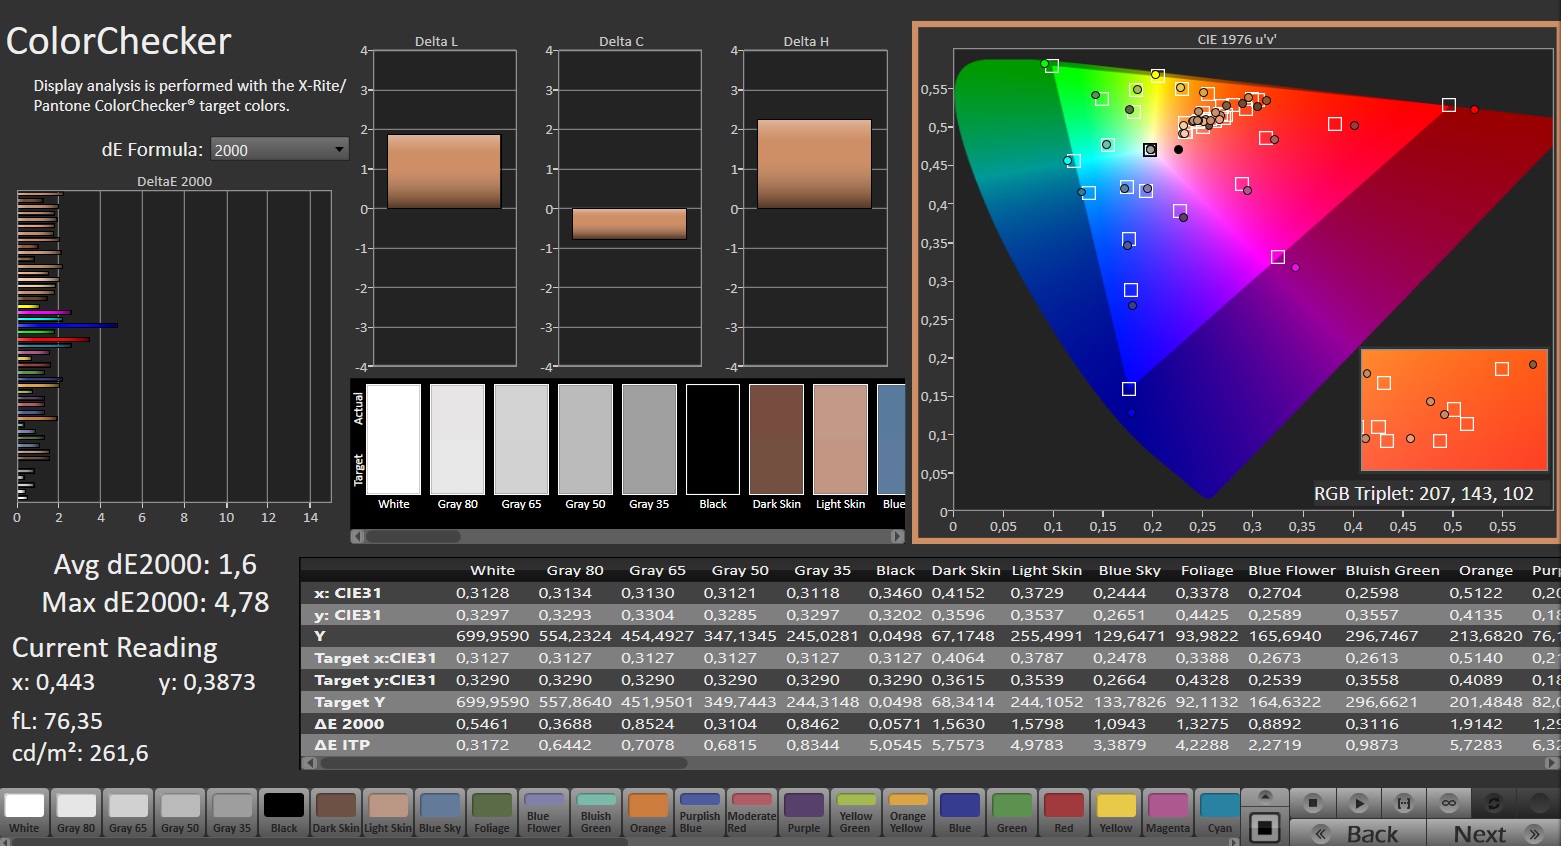
Infelizmente, sua precisão de cores não é das melhores logo que sai da caixa, portanto, os usuários profissionais devem realizar uma calibração após a compra (nosso arquivo ICC está no link acima).


Seus tempos de resposta são de decentes a bons, mas não conseguem se equiparar aos dos painéis OLED que, além disso, oferecem contrastes e valores de preto ainda melhores. Por outro lado, eles também têm seus próprios pontos fracos (por exemplo, geralmente uma superfície reflexiva).
Exibir tempos de resposta
| ↔ Tempo de resposta preto para branco | ||
|---|---|---|
| 17.6 ms ... ascensão ↗ e queda ↘ combinadas | ↗ 15.2 ms ascensão | 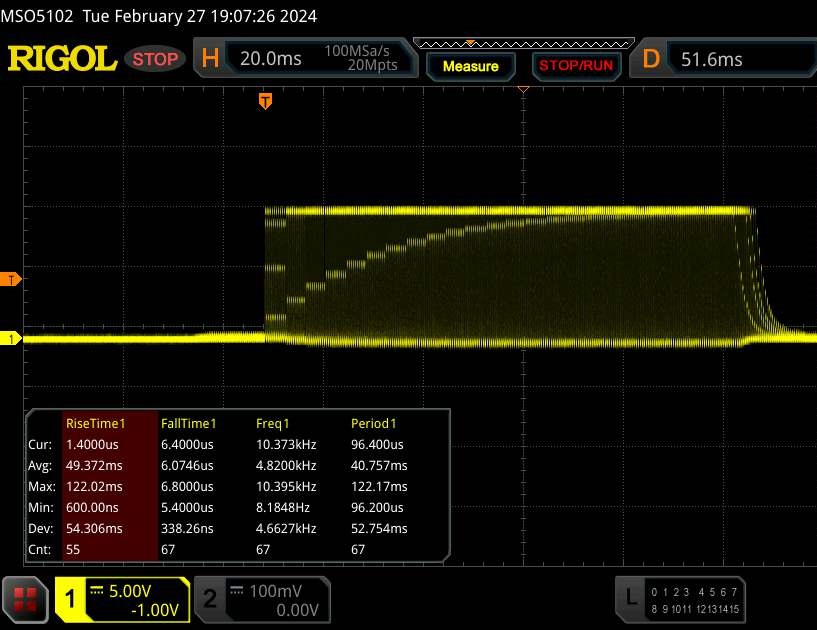 |
| ↘ 2.4 ms queda | ||
| A tela mostra boas taxas de resposta em nossos testes, mas pode ser muito lenta para jogadores competitivos. Em comparação, todos os dispositivos testados variam de 0.1 (mínimo) a 240 (máximo) ms. » 40 % de todos os dispositivos são melhores. Isso significa que o tempo de resposta medido é melhor que a média de todos os dispositivos testados (19.8 ms). | ||
| ↔ Tempo de resposta 50% cinza a 80% cinza | ||
| 8 ms ... ascensão ↗ e queda ↘ combinadas | ↗ 4.9 ms ascensão | 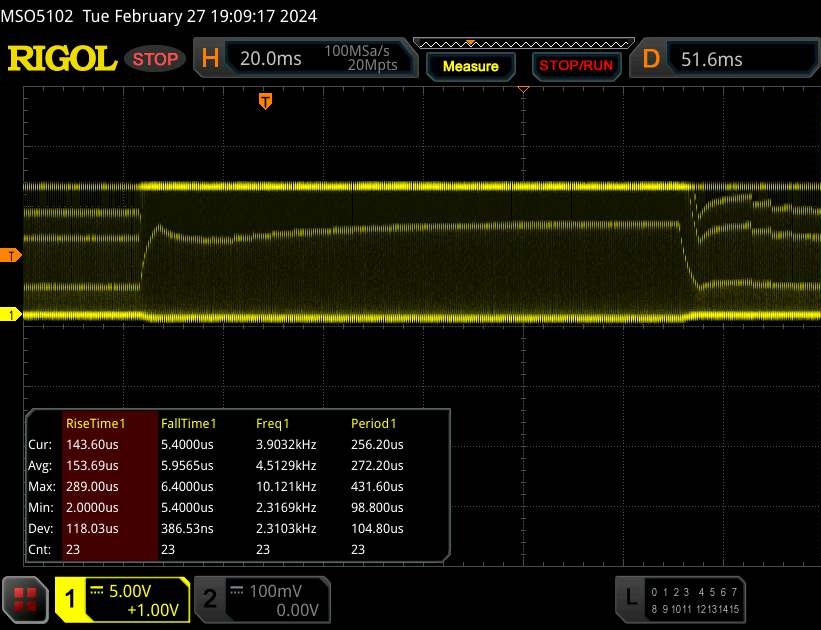 |
| ↘ 3.1 ms queda | ||
| A tela mostra taxas de resposta rápidas em nossos testes e deve ser adequada para jogos. Em comparação, todos os dispositivos testados variam de 0.165 (mínimo) a 636 (máximo) ms. » 21 % de todos os dispositivos são melhores. Isso significa que o tempo de resposta medido é melhor que a média de todos os dispositivos testados (31 ms). | ||
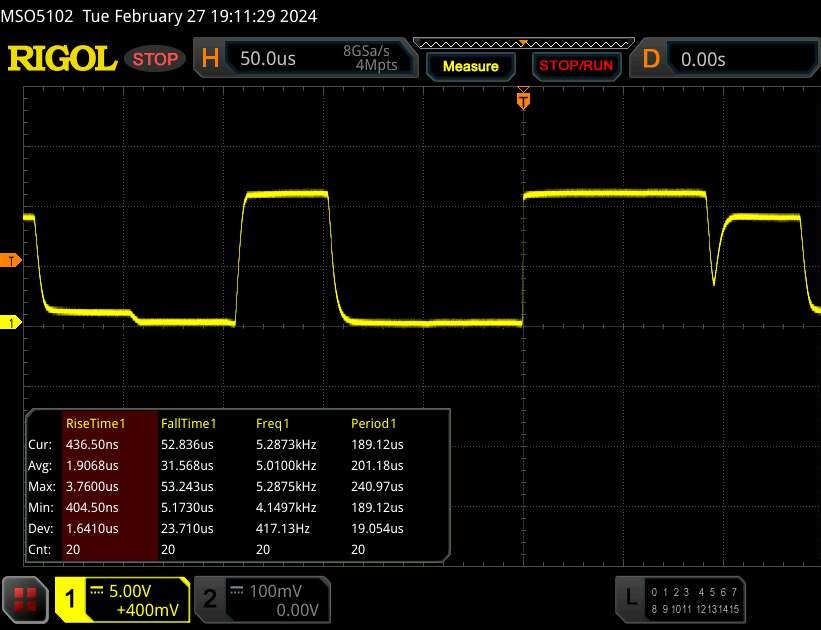
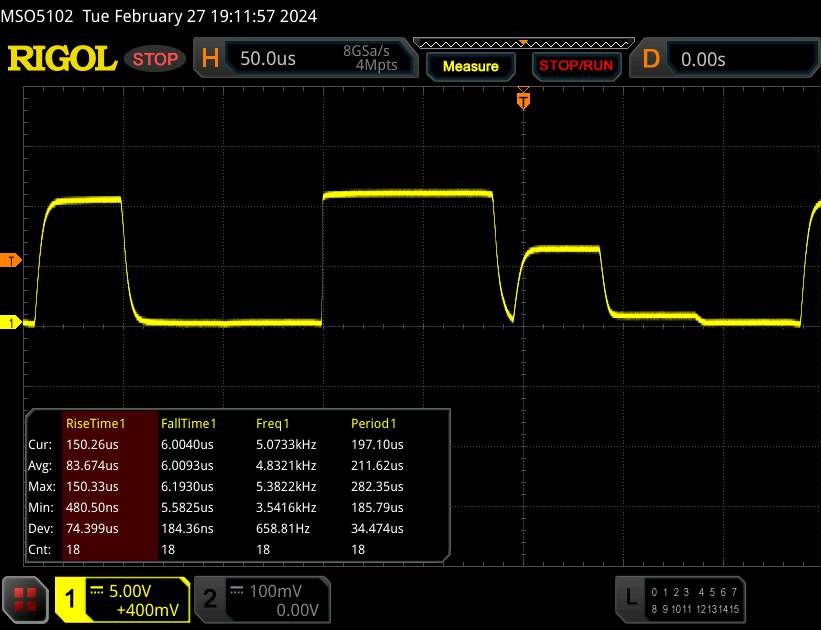
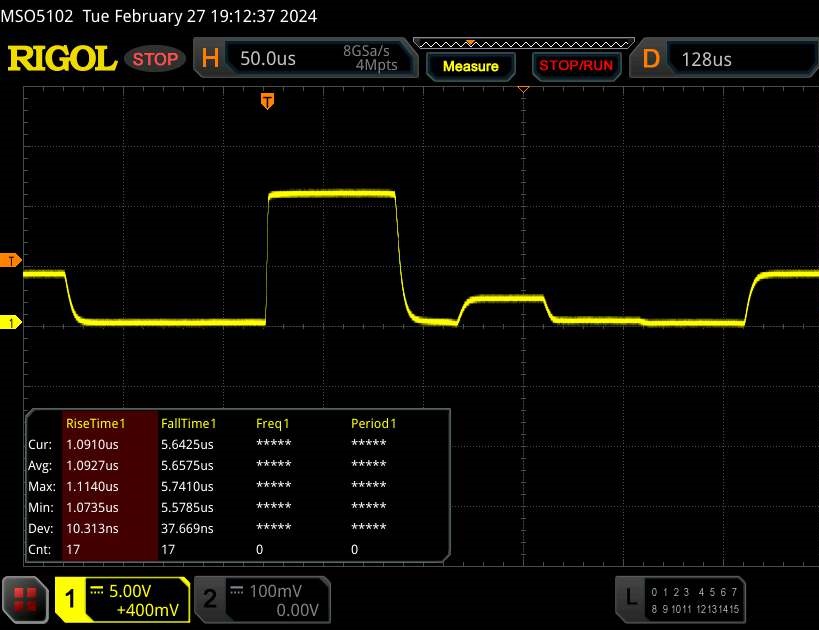
Cintilação da tela / PWM (modulação por largura de pulso)
| Tela tremeluzindo/PWM detectado | 4832 Hz | ≤ 100 % configuração de brilho | 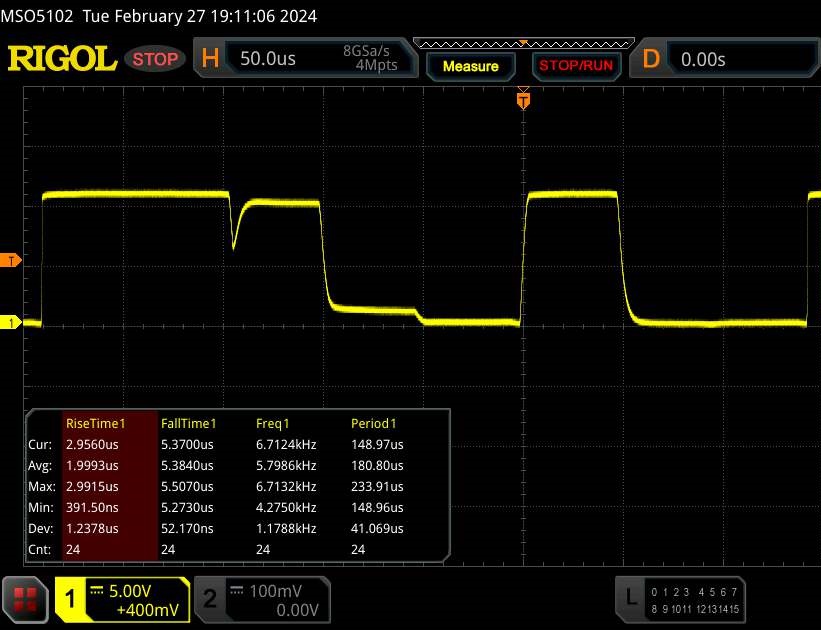 |
A luz de fundo da tela pisca em 4832 Hz (pior caso, por exemplo, utilizando PWM) Cintilação detectada em uma configuração de brilho de 100 % e abaixo. Não deve haver cintilação ou PWM acima desta configuração de brilho. A frequência de 4832 Hz é bastante alta, então a maioria dos usuários sensíveis ao PWM não deve notar nenhuma oscilação. [pwm_comparison] Em comparação: 52 % de todos os dispositivos testados não usam PWM para escurecer a tela. Se PWM foi detectado, uma média de 7757 (mínimo: 5 - máximo: 343500) Hz foi medida. | |||

Desempenho
Os componentes do Predator Helios 18 são modelos topo de linha quando se trata de laptops para jogos. 32 GB de RAM e 2 TB de armazenamento devem ser suficientes para a maioria dos usuários nos próximos anos. O mesmo pode ser dito sobre a potência da CPU e da GPU, que ainda não atingiram seus limites devido à resolução moderada da tela do laptop de 2.560 x 1.600 pixels.
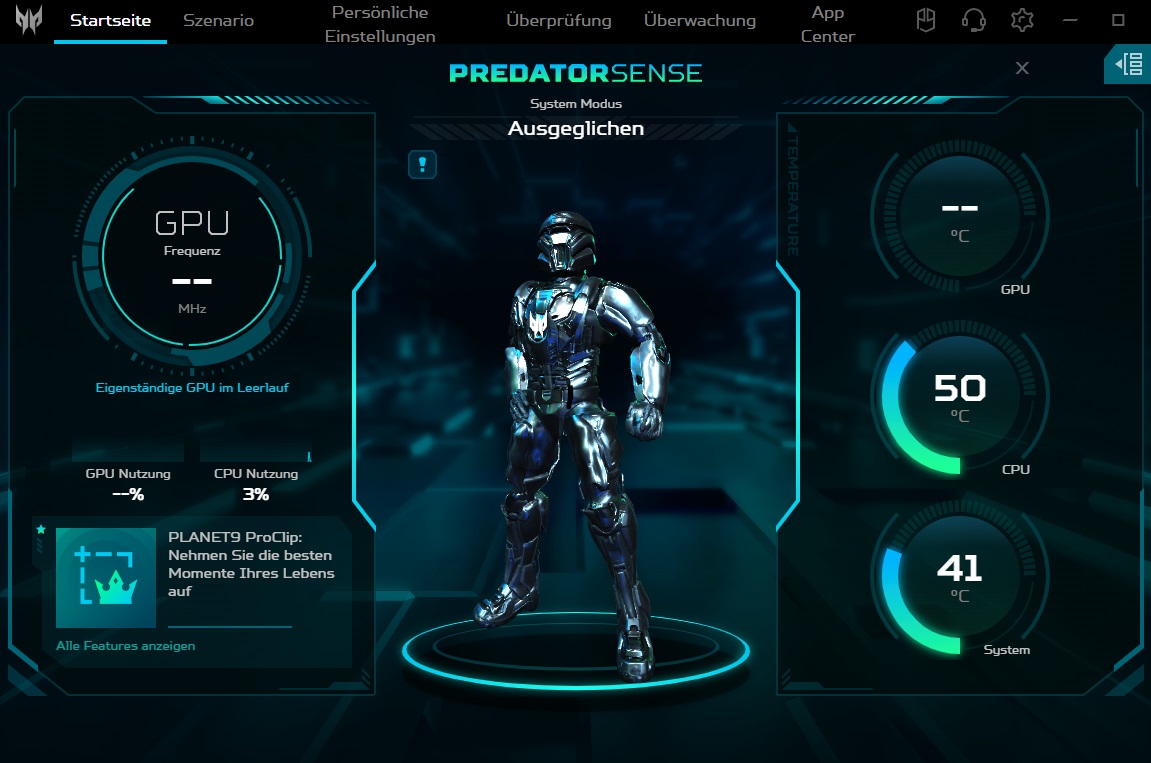
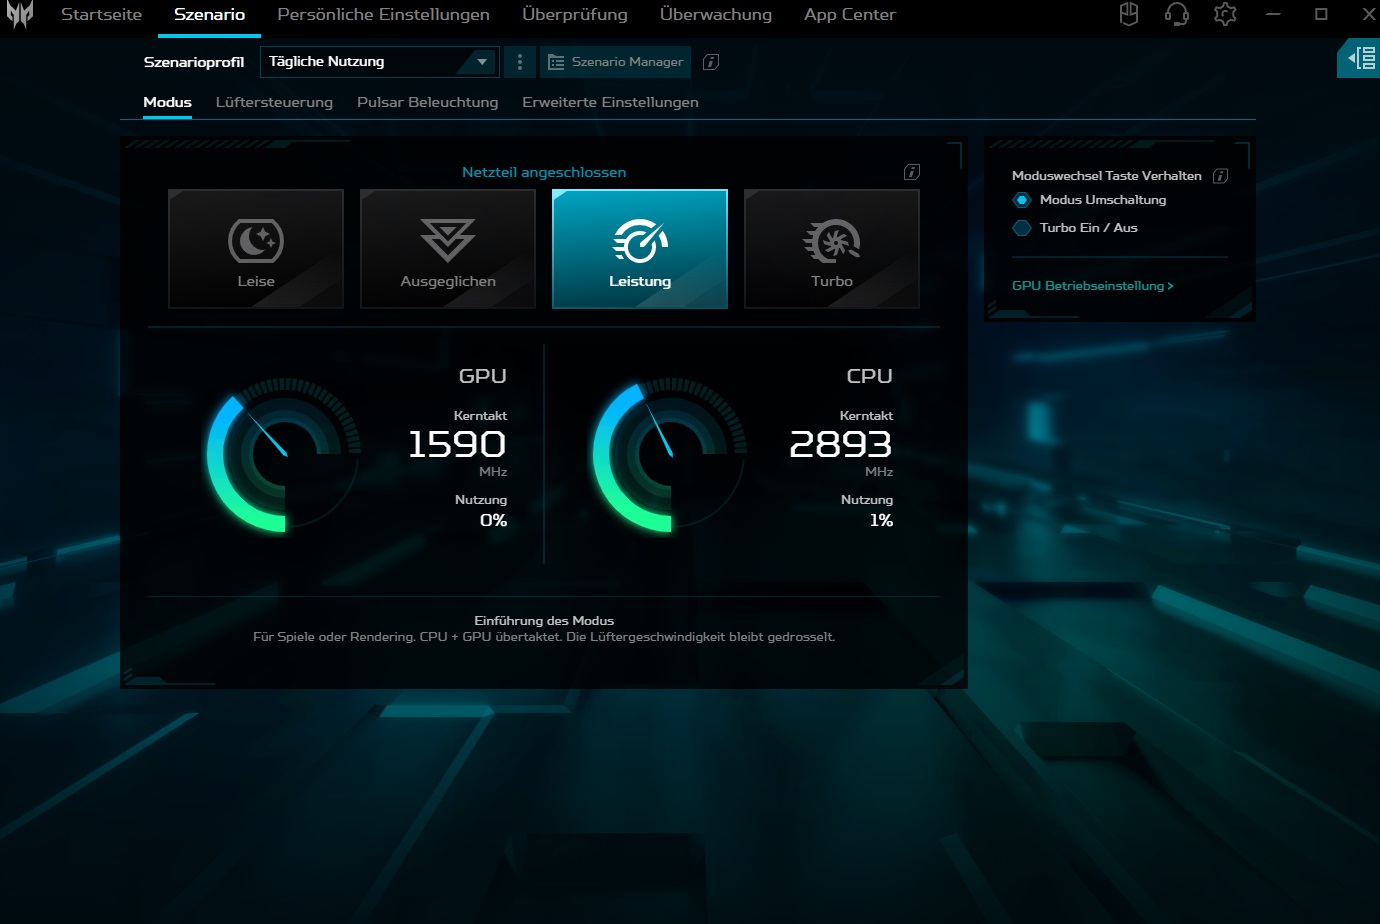
Condições de teste
No software pré-instalado do fabricante (Predator Sense), há vários modos de operação listados em Scenario, que têm grande influência no desempenho e nas emissões de ruído. Como o laptop de 18 polegadas é extremamente barulhento no modo turbo (>60 dB em jogos), todas as medições foram realizadas no modo de desempenho. Portanto, os valores determinados de velocidade e emissão só são comparáveis aos do seu antecessor até certo ponto.
| Witcher 3 (FHD/Ultra) | Silencioso | Balanceado | Desempenho | Turbo |
| Ruído | 38 dB(A) | 43 dB(A) | 49 dB(A) | 61 dB(A) |
| Desempenho | 130 fps | 160 fps | 180 fps | 200 fps |
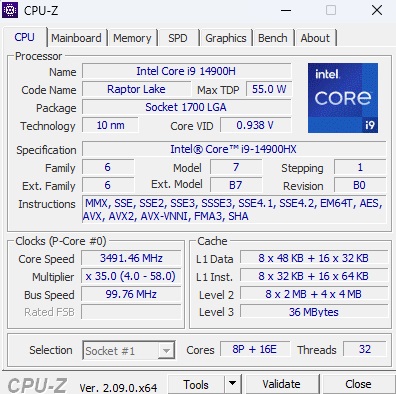
Processador
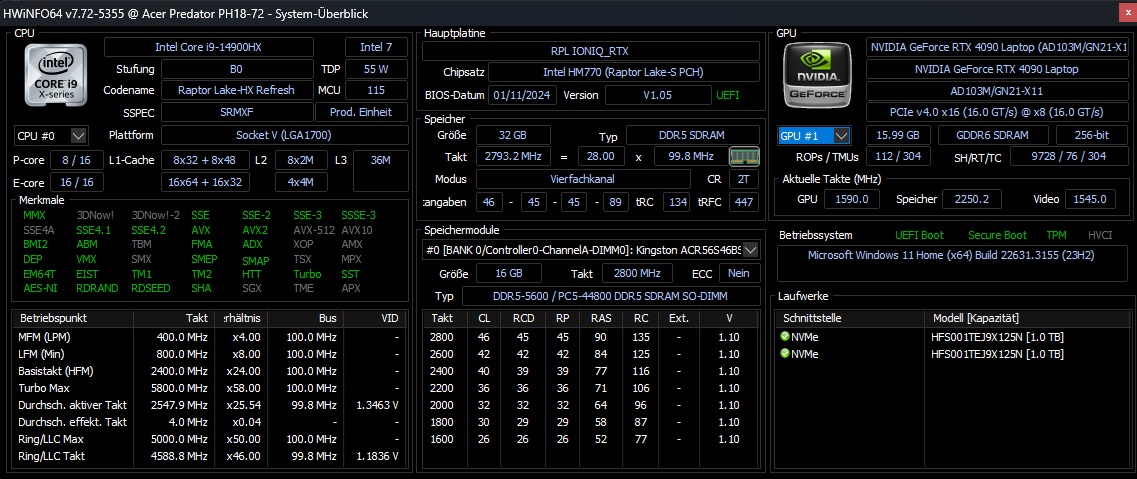
O Core i9-14900HX é um modelo topo de linha da série Raptor Lake da Intel e, embora tenha um alto consumo, oferece excelente desempenho. A Intel faz uso de 8 núcleos de desempenho com hyper threading e 16 núcleos de eficiência sem HT, resultando em 32 threads paralelos. No modo de desempenho, a CPU obteve resultados ligeiramente abaixo da média (-6% em comparação com a média anterior). Além disso, seu desempenho cai durante períodos mais longos de carga, como revelou nosso loop Cinebench (veja o gráfico). Esse não foi o caso de nenhum dos dispositivos da concorrência.
Cinebench R15 Multi continuous test
* ... menor é melhor
AIDA64: FP32 Ray-Trace | FPU Julia | CPU SHA3 | CPU Queen | FPU SinJulia | FPU Mandel | CPU AES | CPU ZLib | FP64 Ray-Trace | CPU PhotoWorxx
| Performance rating | |
| Alienware m18 R1 AMD | |
| Acer Predator Helios 18 N23Q2 | |
| MSI Titan 18 HX A14VIG | |
| Asus ROG Strix Scar 18 G834JYR (2024) | |
| Média da turma Gaming | |
| Média Intel Core i9-14900HX | |
| Acer Predator Helios 18 PH18-72-98MW | |
| AIDA64 / FP32 Ray-Trace | |
| Alienware m18 R1 AMD | |
| Média da turma Gaming (10227 - 85542, n=105, últimos 2 anos) | |
| MSI Titan 18 HX A14VIG | |
| Acer Predator Helios 18 N23Q2 | |
| Asus ROG Strix Scar 18 G834JYR (2024) | |
| Média Intel Core i9-14900HX (13098 - 33474, n=36) | |
| Acer Predator Helios 18 PH18-72-98MW | |
| AIDA64 / FPU Julia | |
| Alienware m18 R1 AMD | |
| MSI Titan 18 HX A14VIG | |
| Média da turma Gaming (51376 - 238426, n=105, últimos 2 anos) | |
| Acer Predator Helios 18 N23Q2 | |
| Asus ROG Strix Scar 18 G834JYR (2024) | |
| Média Intel Core i9-14900HX (67573 - 166040, n=36) | |
| Acer Predator Helios 18 PH18-72-98MW | |
| AIDA64 / CPU SHA3 | |
| Alienware m18 R1 AMD | |
| MSI Titan 18 HX A14VIG | |
| Acer Predator Helios 18 N23Q2 | |
| Média da turma Gaming (2180 - 10115, n=105, últimos 2 anos) | |
| Asus ROG Strix Scar 18 G834JYR (2024) | |
| Média Intel Core i9-14900HX (3589 - 7979, n=36) | |
| Acer Predator Helios 18 PH18-72-98MW | |
| AIDA64 / CPU Queen | |
| Alienware m18 R1 AMD | |
| MSI Titan 18 HX A14VIG | |
| Asus ROG Strix Scar 18 G834JYR (2024) | |
| Acer Predator Helios 18 PH18-72-98MW | |
| Média Intel Core i9-14900HX (118405 - 148966, n=36) | |
| Acer Predator Helios 18 N23Q2 | |
| Média da turma Gaming (49785 - 173351, n=90, últimos 2 anos) | |
| AIDA64 / FPU SinJulia | |
| Alienware m18 R1 AMD | |
| MSI Titan 18 HX A14VIG | |
| Asus ROG Strix Scar 18 G834JYR (2024) | |
| Acer Predator Helios 18 N23Q2 | |
| Média Intel Core i9-14900HX (10475 - 18517, n=36) | |
| Acer Predator Helios 18 PH18-72-98MW | |
| Média da turma Gaming (4424 - 33636, n=105, últimos 2 anos) | |
| AIDA64 / FPU Mandel | |
| Alienware m18 R1 AMD | |
| Média da turma Gaming (25115 - 128721, n=105, últimos 2 anos) | |
| MSI Titan 18 HX A14VIG | |
| Acer Predator Helios 18 N23Q2 | |
| Asus ROG Strix Scar 18 G834JYR (2024) | |
| Média Intel Core i9-14900HX (32543 - 83662, n=36) | |
| Acer Predator Helios 18 PH18-72-98MW | |
| AIDA64 / CPU AES | |
| Acer Predator Helios 18 N23Q2 | |
| Alienware m18 R1 AMD | |
| Média Intel Core i9-14900HX (86964 - 241777, n=36) | |
| MSI Titan 18 HX A14VIG | |
| Asus ROG Strix Scar 18 G834JYR (2024) | |
| Acer Predator Helios 18 PH18-72-98MW | |
| Média da turma Gaming (39258 - 247074, n=105, últimos 2 anos) | |
| AIDA64 / CPU ZLib | |
| Alienware m18 R1 AMD | |
| MSI Titan 18 HX A14VIG | |
| Acer Predator Helios 18 N23Q2 | |
| Média Intel Core i9-14900HX (1054 - 2292, n=36) | |
| Asus ROG Strix Scar 18 G834JYR (2024) | |
| Acer Predator Helios 18 PH18-72-98MW | |
| Média da turma Gaming (574 - 2531, n=105, últimos 2 anos) | |
| AIDA64 / FP64 Ray-Trace | |
| Alienware m18 R1 AMD | |
| Média da turma Gaming (5509 - 45446, n=105, últimos 2 anos) | |
| MSI Titan 18 HX A14VIG | |
| Acer Predator Helios 18 N23Q2 | |
| Asus ROG Strix Scar 18 G834JYR (2024) | |
| Média Intel Core i9-14900HX (6809 - 18349, n=36) | |
| Acer Predator Helios 18 PH18-72-98MW | |
| AIDA64 / CPU PhotoWorxx | |
| Acer Predator Helios 18 N23Q2 | |
| Asus ROG Strix Scar 18 G834JYR (2024) | |
| Acer Predator Helios 18 PH18-72-98MW | |
| Média Intel Core i9-14900HX (23903 - 54702, n=36) | |
| Média da turma Gaming (12271 - 89891, n=105, últimos 2 anos) | |
| Alienware m18 R1 AMD | |
| MSI Titan 18 HX A14VIG | |
Desempenho do sistema
O desempenho do sistema também não foi suficiente para o primeiro lugar. Sua pontuação total no PCMark 10 é comparável à de seu antecessor. A RAM do dispositivo oferece níveis de desempenho típicos da RAM DDR5-5600.
CrossMark: Overall | Productivity | Creativity | Responsiveness
WebXPRT 3: Overall
WebXPRT 4: Overall
Mozilla Kraken 1.1: Total
| PCMark 10 / Score | |
| Alienware m18 R1 AMD | |
| MSI Titan 18 HX A14VIG | |
| Asus ROG Strix Scar 18 G834JYR (2024) | |
| Média Intel Core i9-14900HX, NVIDIA GeForce RTX 4090 Laptop GPU (8230 - 9234, n=13) | |
| Acer Predator Helios 18 N23Q2 | |
| Média da turma Gaming (5828 - 12414, n=93, últimos 2 anos) | |
| Acer Predator Helios 18 PH18-72-98MW | |
| PCMark 10 / Essentials | |
| Alienware m18 R1 AMD | |
| MSI Titan 18 HX A14VIG | |
| Asus ROG Strix Scar 18 G834JYR (2024) | |
| Média Intel Core i9-14900HX, NVIDIA GeForce RTX 4090 Laptop GPU (10778 - 11628, n=13) | |
| Acer Predator Helios 18 PH18-72-98MW | |
| Acer Predator Helios 18 N23Q2 | |
| Média da turma Gaming (8810 - 11935, n=97, últimos 2 anos) | |
| PCMark 10 / Productivity | |
| Alienware m18 R1 AMD | |
| Média da turma Gaming (6845 - 25323, n=95, últimos 2 anos) | |
| Média Intel Core i9-14900HX, NVIDIA GeForce RTX 4090 Laptop GPU (9458 - 11759, n=13) | |
| Asus ROG Strix Scar 18 G834JYR (2024) | |
| Acer Predator Helios 18 N23Q2 | |
| MSI Titan 18 HX A14VIG | |
| Acer Predator Helios 18 PH18-72-98MW | |
| PCMark 10 / Digital Content Creation | |
| Alienware m18 R1 AMD | |
| MSI Titan 18 HX A14VIG | |
| Asus ROG Strix Scar 18 G834JYR (2024) | |
| Média Intel Core i9-14900HX, NVIDIA GeForce RTX 4090 Laptop GPU (13219 - 16462, n=13) | |
| Acer Predator Helios 18 N23Q2 | |
| Média da turma Gaming (7602 - 19954, n=95, últimos 2 anos) | |
| Acer Predator Helios 18 PH18-72-98MW | |
| CrossMark / Overall | |
| Asus ROG Strix Scar 18 G834JYR (2024) | |
| Acer Predator Helios 18 N23Q2 | |
| Média Intel Core i9-14900HX, NVIDIA GeForce RTX 4090 Laptop GPU (1877 - 2344, n=10) | |
| Média da turma Gaming (1366 - 2409, n=94, últimos 2 anos) | |
| Alienware m18 R1 AMD | |
| MSI Titan 18 HX A14VIG | |
| CrossMark / Productivity | |
| Acer Predator Helios 18 N23Q2 | |
| Asus ROG Strix Scar 18 G834JYR (2024) | |
| Média Intel Core i9-14900HX, NVIDIA GeForce RTX 4090 Laptop GPU (1738 - 2162, n=10) | |
| Média da turma Gaming (1386 - 2254, n=94, últimos 2 anos) | |
| Alienware m18 R1 AMD | |
| MSI Titan 18 HX A14VIG | |
| CrossMark / Creativity | |
| Asus ROG Strix Scar 18 G834JYR (2024) | |
| Acer Predator Helios 18 N23Q2 | |
| Média Intel Core i9-14900HX, NVIDIA GeForce RTX 4090 Laptop GPU (2195 - 2660, n=10) | |
| Média da turma Gaming (1343 - 2786, n=94, últimos 2 anos) | |
| Alienware m18 R1 AMD | |
| MSI Titan 18 HX A14VIG | |
| CrossMark / Responsiveness | |
| Acer Predator Helios 18 N23Q2 | |
| Asus ROG Strix Scar 18 G834JYR (2024) | |
| Média Intel Core i9-14900HX, NVIDIA GeForce RTX 4090 Laptop GPU (1478 - 2327, n=10) | |
| Média da turma Gaming (1226 - 2334, n=94, últimos 2 anos) | |
| Alienware m18 R1 AMD | |
| MSI Titan 18 HX A14VIG | |
| WebXPRT 3 / Overall | |
| Alienware m18 R1 AMD | |
| MSI Titan 18 HX A14VIG | |
| Média Intel Core i9-14900HX, NVIDIA GeForce RTX 4090 Laptop GPU (279 - 339, n=10) | |
| Asus ROG Strix Scar 18 G834JYR (2024) | |
| Acer Predator Helios 18 N23Q2 | |
| Média da turma Gaming (220 - 532, n=98, últimos 2 anos) | |
| WebXPRT 4 / Overall | |
| Asus ROG Strix Scar 18 G834JYR (2024) | |
| Alienware m18 R1 AMD | |
| Média Intel Core i9-14900HX, NVIDIA GeForce RTX 4090 Laptop GPU (246 - 309, n=8) | |
| MSI Titan 18 HX A14VIG | |
| Média da turma Gaming (165 - 354, n=98, últimos 2 anos) | |
| Mozilla Kraken 1.1 / Total | |
| Alienware m18 R1 AMD | |
| Média da turma Gaming (391 - 590, n=100, últimos 2 anos) | |
| Acer Predator Helios 18 N23Q2 | |
| Média Intel Core i9-14900HX, NVIDIA GeForce RTX 4090 Laptop GPU (428 - 535, n=11) | |
| MSI Titan 18 HX A14VIG | |
| Asus ROG Strix Scar 18 G834JYR (2024) | |
| Acer Predator Helios 18 PH18-72-98MW | |
* ... menor é melhor
| PCMark 10 Score | 8230 pontos | |
Ajuda | ||
| AIDA64 / Memory Copy | |
| Asus ROG Strix Scar 18 G834JYR (2024) | |
| Acer Predator Helios 18 N23Q2 | |
| Acer Predator Helios 18 PH18-72-98MW | |
| Média Intel Core i9-14900HX (38028 - 83392, n=36) | |
| Média da turma Gaming (21750 - 129946, n=105, últimos 2 anos) | |
| MSI Titan 18 HX A14VIG | |
| Alienware m18 R1 AMD | |
| AIDA64 / Memory Read | |
| Asus ROG Strix Scar 18 G834JYR (2024) | |
| Acer Predator Helios 18 N23Q2 | |
| Acer Predator Helios 18 PH18-72-98MW | |
| Média Intel Core i9-14900HX (43306 - 87568, n=36) | |
| Média da turma Gaming (22956 - 118858, n=105, últimos 2 anos) | |
| Alienware m18 R1 AMD | |
| MSI Titan 18 HX A14VIG | |
| AIDA64 / Memory Write | |
| Asus ROG Strix Scar 18 G834JYR (2024) | |
| Média da turma Gaming (22297 - 135096, n=105, últimos 2 anos) | |
| Acer Predator Helios 18 N23Q2 | |
| Média Intel Core i9-14900HX (37146 - 80589, n=36) | |
| Acer Predator Helios 18 PH18-72-98MW | |
| Alienware m18 R1 AMD | |
| MSI Titan 18 HX A14VIG | |
| AIDA64 / Memory Latency | |
| Média da turma Gaming (75.3 - 259, n=105, últimos 2 anos) | |
| MSI Titan 18 HX A14VIG | |
| Alienware m18 R1 AMD | |
| Média Intel Core i9-14900HX (76.1 - 105, n=36) | |
| Acer Predator Helios 18 N23Q2 | |
| Acer Predator Helios 18 PH18-72-98MW | |
| Asus ROG Strix Scar 18 G834JYR (2024) | |
* ... menor é melhor
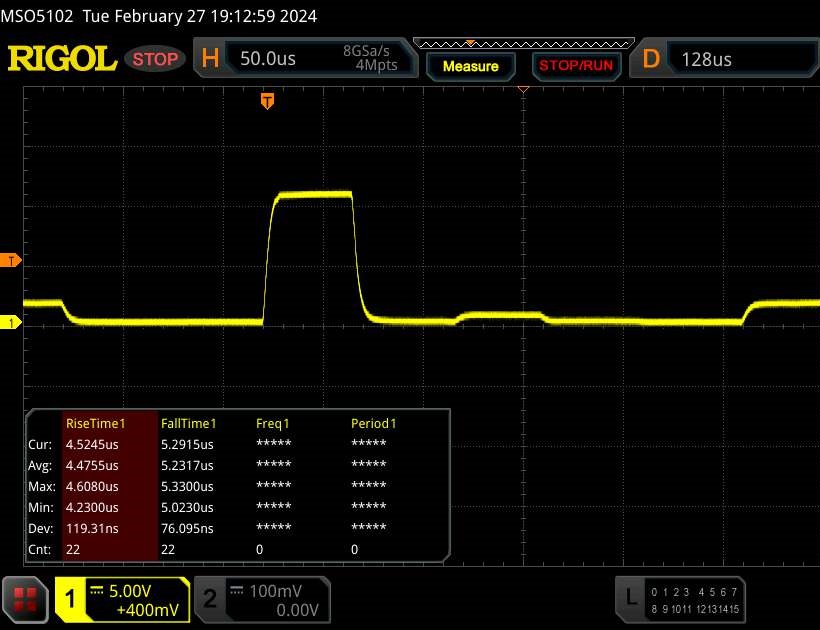
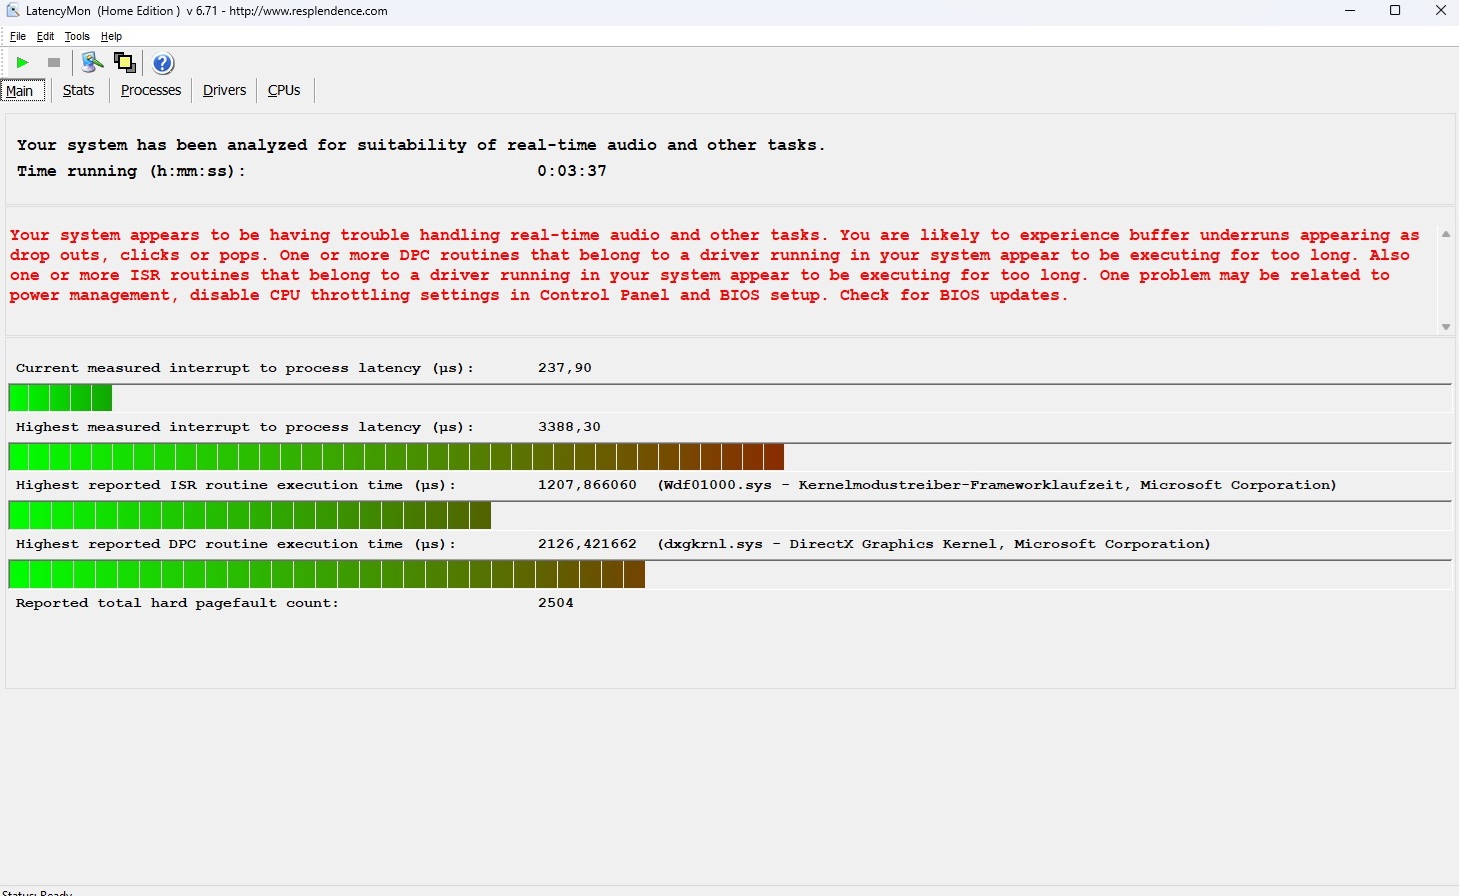
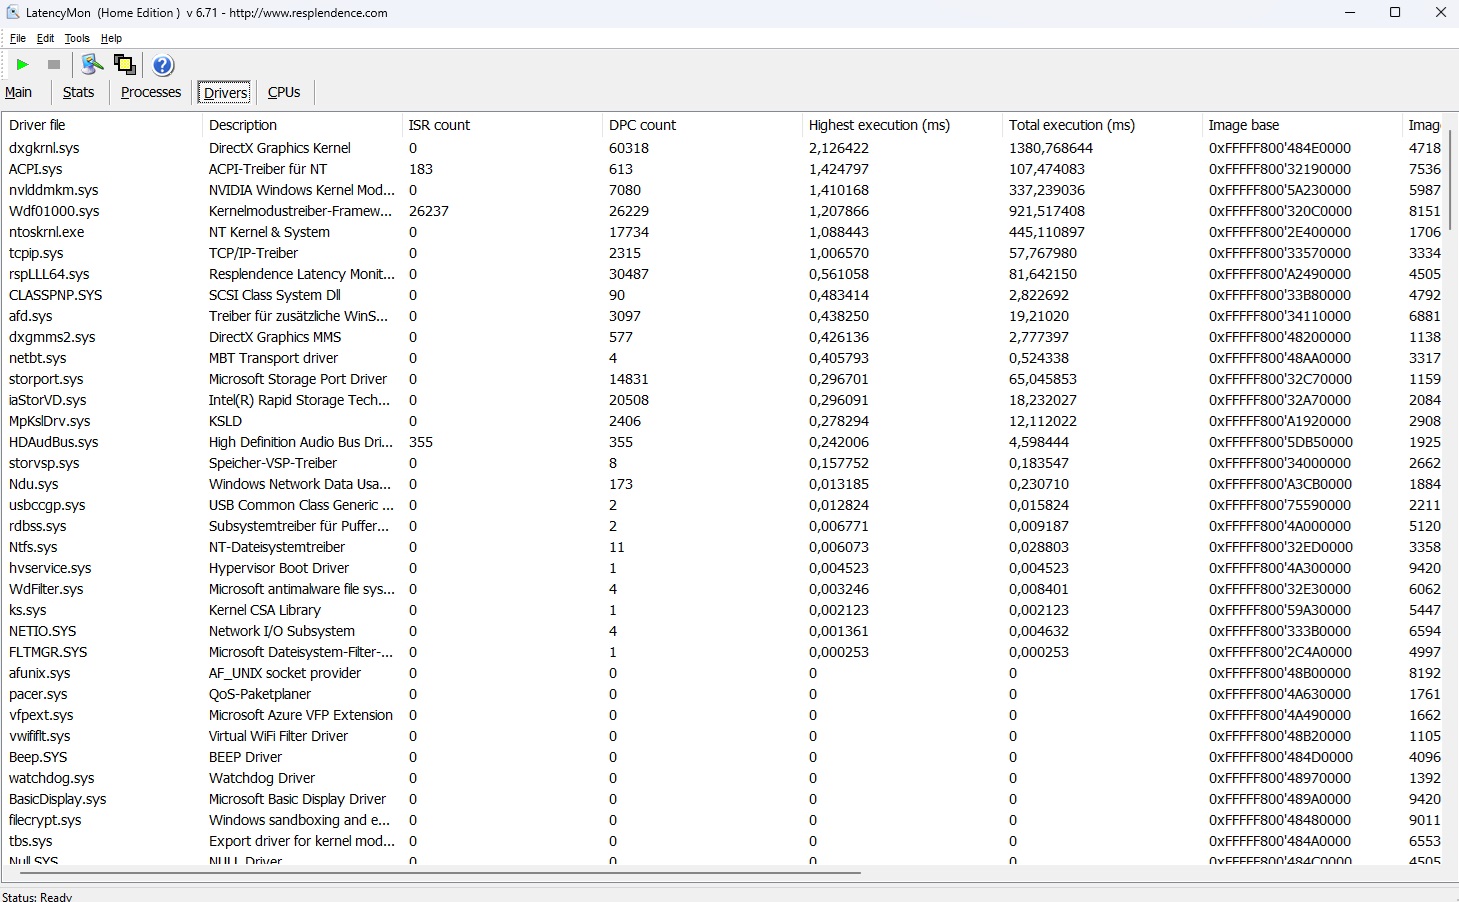
Latência DPC
As latências do laptop podem ser consideravelmente mais baixas do que no antigo Helios 18, mas, de acordo com a ferramenta LatencyMon, elas ainda são muito altas para determinados campos de uso (edição de áudio e vídeo em tempo real).
| DPC Latencies / LatencyMon - interrupt to process latency (max), Web, Youtube, Prime95 | |
| Acer Predator Helios 18 N23Q2 | |
| Acer Predator Helios 18 PH18-72-98MW | |
| MSI Titan 18 HX A14VIG | |
| Alienware m18 R1 AMD | |
| Asus ROG Strix Scar 18 G834JYR (2024) | |
* ... menor é melhor
Dispositivos de armazenamento
Conforme mencionado em nossa introdução, a Acer combinou dois SSDs NVMe em uma matriz Raid 0. À primeira vista, isso oferece resultados de primeira classe quando se trata de suas taxas de leitura e gravação sequenciais. No entanto, o resfriamento do laptop parece não ser o ideal, pois notamos algumas flutuações ocasionais de desempenho após algum tempo durante nosso teste de loop.

* ... menor é melhor
Reading continuous performance: DiskSpd Read Loop, Queue Depth 8
Placa de vídeo
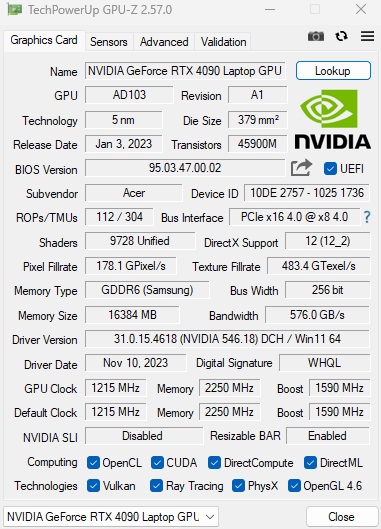
A GeForce RTX 4090 - baseada na arquitetura Ada Lovelace - é atualmente a placa de vídeo para laptop mais potente da Nvidia. Suas 9.728 unidades de shader são tão generosas quanto sua VRAM GDDR6 de 16 GB, especialmente porque a Acer selecionou o máximo de 175 watts como TGP. Mesmo assim, o desempenho da GPU no modo de desempenho fica aquém do que poderia ser possível. De forma análoga aos testes de CPU, ele atingiu 6% a menos em comparação com a média anterior do RTX 4090.
| 3DMark 11 Performance | 44065 pontos | |
| 3DMark Cloud Gate Standard Score | 59876 pontos | |
| 3DMark Fire Strike Score | 33907 pontos | |
| 3DMark Time Spy Score | 18542 pontos | |
Ajuda | ||
* ... menor é melhor
Desempenho em jogos
Os benchmarks de jogos mostram um quadro semelhante. Aqui, também, a RTX 4090 não foi capaz de usar todo o seu potencial. No entanto, isso foi suficiente para executar todos os jogos modernos com todos os detalhes em sua resolução nativa de 2.560 x 1.600 pixels. As coisas só ficam difíceis quando se joga jogos extremamente exigentes ou mal otimizados, como Lords of the Fallen. O DLSS pode ajudar nesse caso, com esse último jogo sendo executado a 72 fps em vez de 43 fps (configuração de qualidade) em QHD/Ultra, por exemplo. Muitas vezes, a RTX 4090 também teria reservas suficientes para uma tela 4K (consulte a Página da GPU).
| The Witcher 3 - 1920x1080 Ultra Graphics & Postprocessing (HBAO+) | |
| MSI Titan 18 HX A14VIG | |
| Média NVIDIA GeForce RTX 4090 Laptop GPU (139.2 - 216, n=35) | |
| Média da turma Gaming (104.7 - 240, n=7, últimos 2 anos) | |
| Asus ROG Strix Scar 18 G834JYR (2024) | |
| Acer Predator Helios 18 PH18-72-98MW | |
| Acer Predator Helios 18 N23Q2 | |
| Alienware m18 R1 AMD | |
| Skull & Bones - 2560x1440 Ultra High Preset AA:T | |
| Média NVIDIA GeForce RTX 4090 Laptop GPU (85 - 98, n=3) | |
| Asus ROG Zephyrus M16 | |
| Acer Predator Helios 18 PH18-72-98MW | |
| Prince of Persia The Lost Crown - 2560x1440 Ultra Preset AA:SM | |
| Asus ROG Zephyrus M16 | |
| Média NVIDIA GeForce RTX 4090 Laptop GPU (355 - 356, n=2) | |
| Acer Predator Helios 18 PH18-72-98MW | |
| Média da turma Gaming (352 - 357, n=4, últimos 2 anos) | |
| Lords of the Fallen - 2560x1440 Ultra Preset | |
| XMG Neo 17 E23 | |
| Média NVIDIA GeForce RTX 4090 Laptop GPU (43 - 51.9, n=2) | |
| Acer Predator Helios 18 PH18-72-98MW | |
| Counter-Strike 2 - 2560x1440 Very High Preset | |
| XMG Neo 17 E23 | |
| Média NVIDIA GeForce RTX 4090 Laptop GPU (156.6 - 188.7, n=2) | |
| Acer Predator Helios 18 PH18-72-98MW | |
| Média da turma Gaming (15.7 - 224, n=5, últimos 2 anos) | |
| Lies of P - 2560x1440 Best Preset | |
| XMG Neo 17 E23 | |
| Média NVIDIA GeForce RTX 4090 Laptop GPU (136.4 - 173.1, n=2) | |
| Acer Predator Helios 18 PH18-72-98MW | |
| EA Sports WRC - 2560x1440 Ultra Preset AA:Epic AF:16x | |
| XMG Neo 17 E23 | |
| Média NVIDIA GeForce RTX 4090 Laptop GPU (97.9 - 103, n=2) | |
| Acer Predator Helios 18 PH18-72-98MW | |
| Armored Core 6 - 2560x1440 Maximum Preset | |
| XMG Neo 17 E23 | |
| Média NVIDIA GeForce RTX 4090 Laptop GPU (92 - 114.7, n=2) | |
| Acer Predator Helios 18 PH18-72-98MW | |
| Média da turma Gaming (n=1últimos 2 anos) | |
| Atlas Fallen - 2560x1440 Very High Preset | |
| XMG Neo 17 E23 | |
| Média NVIDIA GeForce RTX 4090 Laptop GPU (128.3 - 171.1, n=2) | |
| Acer Predator Helios 18 PH18-72-98MW | |
Para testar como o desempenho da GPU se comporta em um período de tempo mais longo, colocamos o Helios 18 contra o jogo de RPG The Witcher 3 por cerca de 60 minutos. O resultado: Não notamos absolutamente nenhuma queda na taxa de quadros.
Witcher 3 FPS diagram
| baixo | média | alto | ultra | QHD | |
|---|---|---|---|---|---|
| GTA V (2015) | 180.4 | 134 | 126.4 | ||
| The Witcher 3 (2015) | 180 | ||||
| Dota 2 Reborn (2015) | 226 | 205 | 192.8 | 178.3 | |
| Final Fantasy XV Benchmark (2018) | 157.1 | 131.9 | |||
| X-Plane 11.11 (2018) | 183.7 | 148.3 | 114.5 | ||
| Far Cry 5 (2018) | 146 | 123 | 115 | ||
| Strange Brigade (2018) | 329 | 305 | 243 | ||
| Atlas Fallen (2023) | 182 | 161 | 128.3 | ||
| Armored Core 6 (2023) | 109.3 | 103.5 | 92 | ||
| The Crew Motorfest (2023) | 60 | 60 | 60 | ||
| Lies of P (2023) | 208 | 187 | 136.4 | ||
| Counter-Strike 2 (2023) | 234 | 189.7 | 156.6 | ||
| Lords of the Fallen (2023) | 87.3 | 64.2 | 43 | ||
| EA Sports WRC (2023) | 135.2 | 115.1 | 97.9 | ||
| Prince of Persia The Lost Crown (2024) | 357 | 356 | 355 | ||
| Skull & Bones (2024) | 133 | 106 | 85 | ||
| Last Epoch (2024) | 203 | 190 | 145.5 |
Emissões
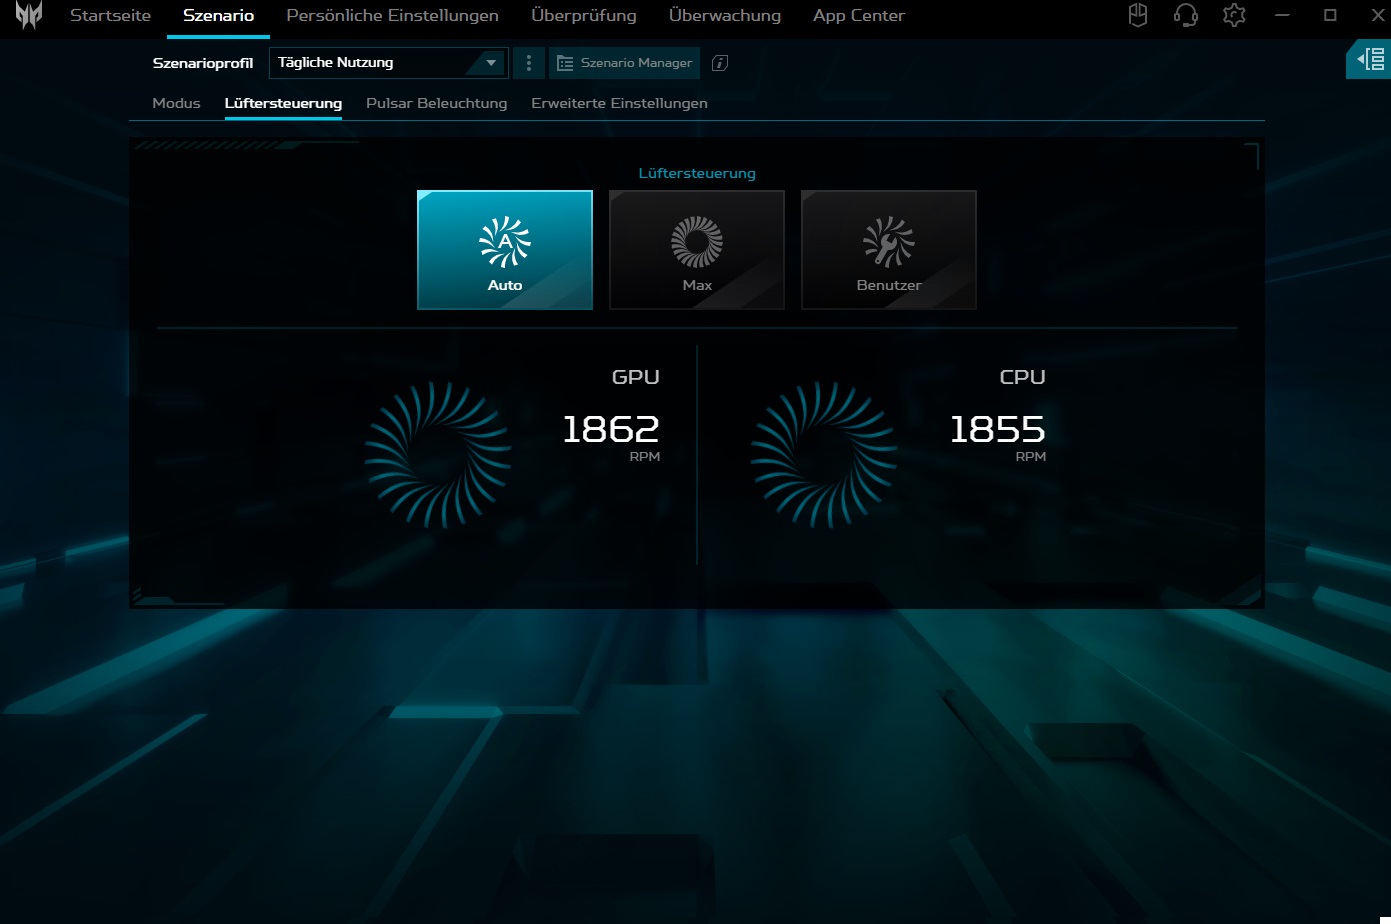
Emissões de ruído
Um dos maiores pontos fracos do Predator Helios 18 é o controle insuficiente da ventoinha. No modo balanceado, as ventoinhas às vezes começam a girar desnecessariamente quando o laptop está em marcha lenta. No modo de desempenho e turbo, esse comportamento ocorre com ainda mais frequência e intensidade. Sob carga, o dispositivo de 18 polegadas não apresenta um comportamento fora do comum. Em uso 3D, o modo de desempenho resulta em valores audíveis, mas não exagerados, de 48 a 51 dB(A).
Barulho
| Ocioso |
| 30 / 36 / 44 dB |
| Carga |
| 48 / 51 dB |
 | ||
30 dB silencioso 40 dB(A) audível 50 dB(A) ruidosamente alto |
||
min: | ||
| Acer Predator Helios 18 PH18-72-98MW i9-14900HX, GeForce RTX 4090 Laptop GPU | MSI Titan 18 HX A14VIG i9-14900HX, GeForce RTX 4090 Laptop GPU | Asus ROG Strix Scar 18 G834JYR (2024) i9-14900HX, GeForce RTX 4090 Laptop GPU | Acer Predator Helios 18 N23Q2 i9-13900HX, GeForce RTX 4080 Laptop GPU | Alienware m18 R1 AMD R9 7945HX, Radeon RX 7900M | |
|---|---|---|---|---|---|
| Noise | 12% | 8% | 12% | 15% | |
| desligado / ambiente * (dB) | 25 | 22.8 9% | 24 4% | 23 8% | 22.4 10% |
| Idle Minimum * (dB) | 30 | 23.8 21% | 27 10% | 23 23% | 23 23% |
| Idle Average * (dB) | 36 | 23.8 34% | 28 22% | 23 36% | 23.4 35% |
| Idle Maximum * (dB) | 44 | 28 36% | 32 27% | 23 48% | 33.5 24% |
| Load Average * (dB) | 48 | 38 21% | 50 -4% | 45.26 6% | 33.5 30% |
| Witcher 3 ultra * (dB) | 49 | 57.3 -17% | 50 -2% | 59.82 -22% | 53.6 -9% |
| Load Maximum * (dB) | 51 | 62.8 -23% | 52 -2% | 59.94 -18% | 53.6 -5% |
* ... menor é melhor
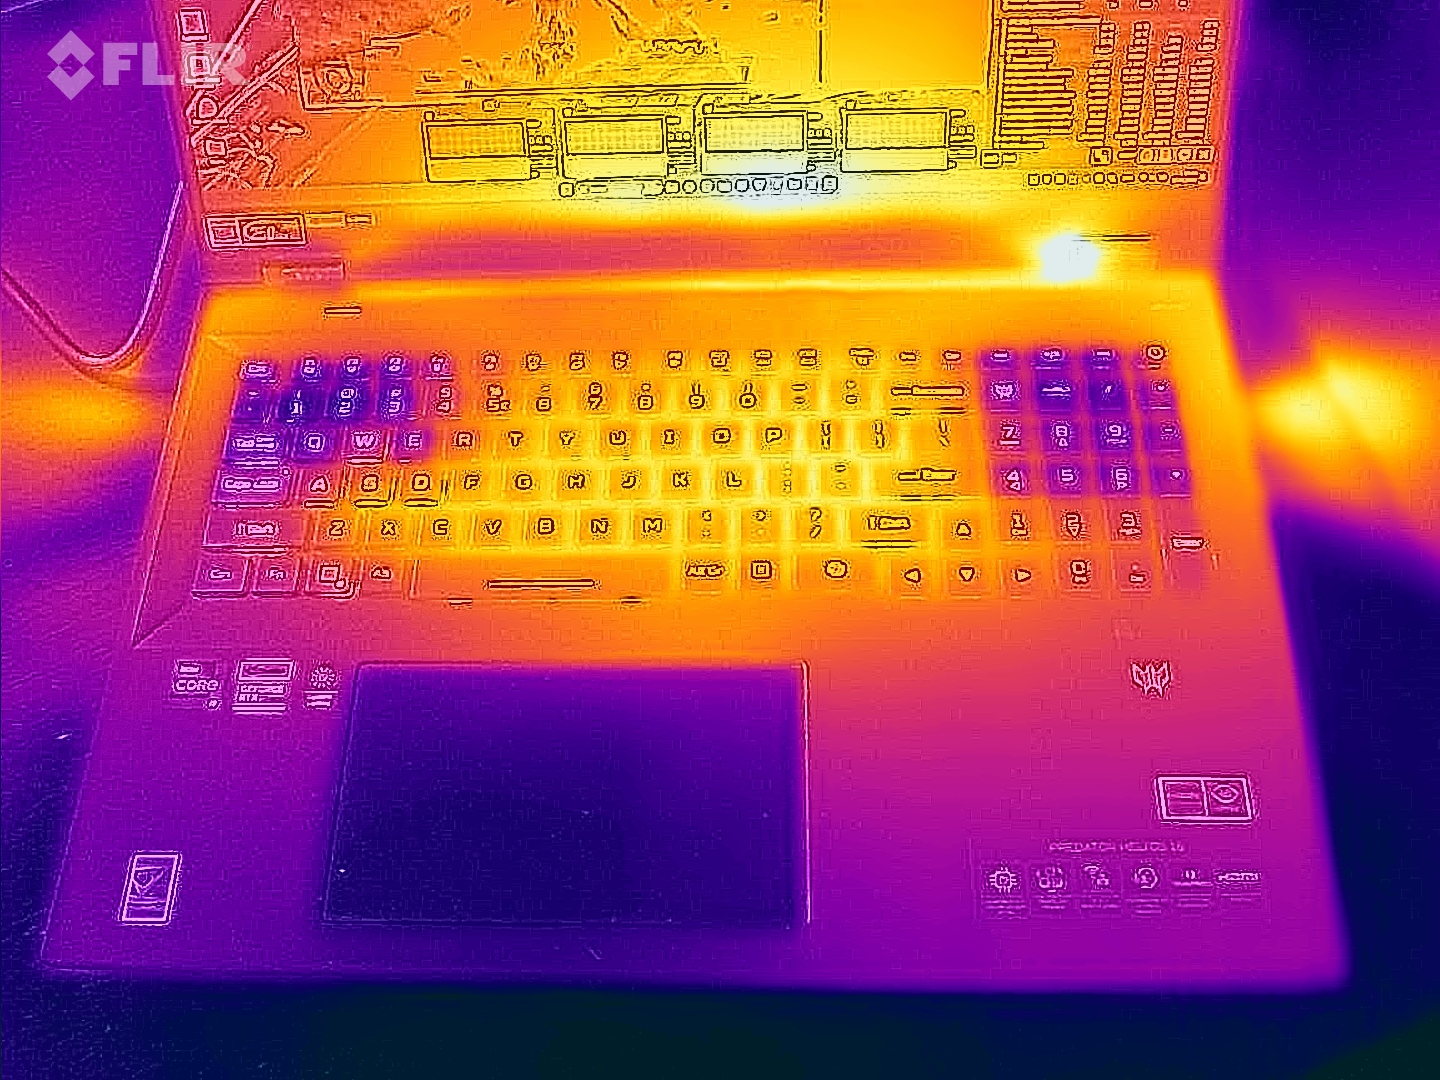
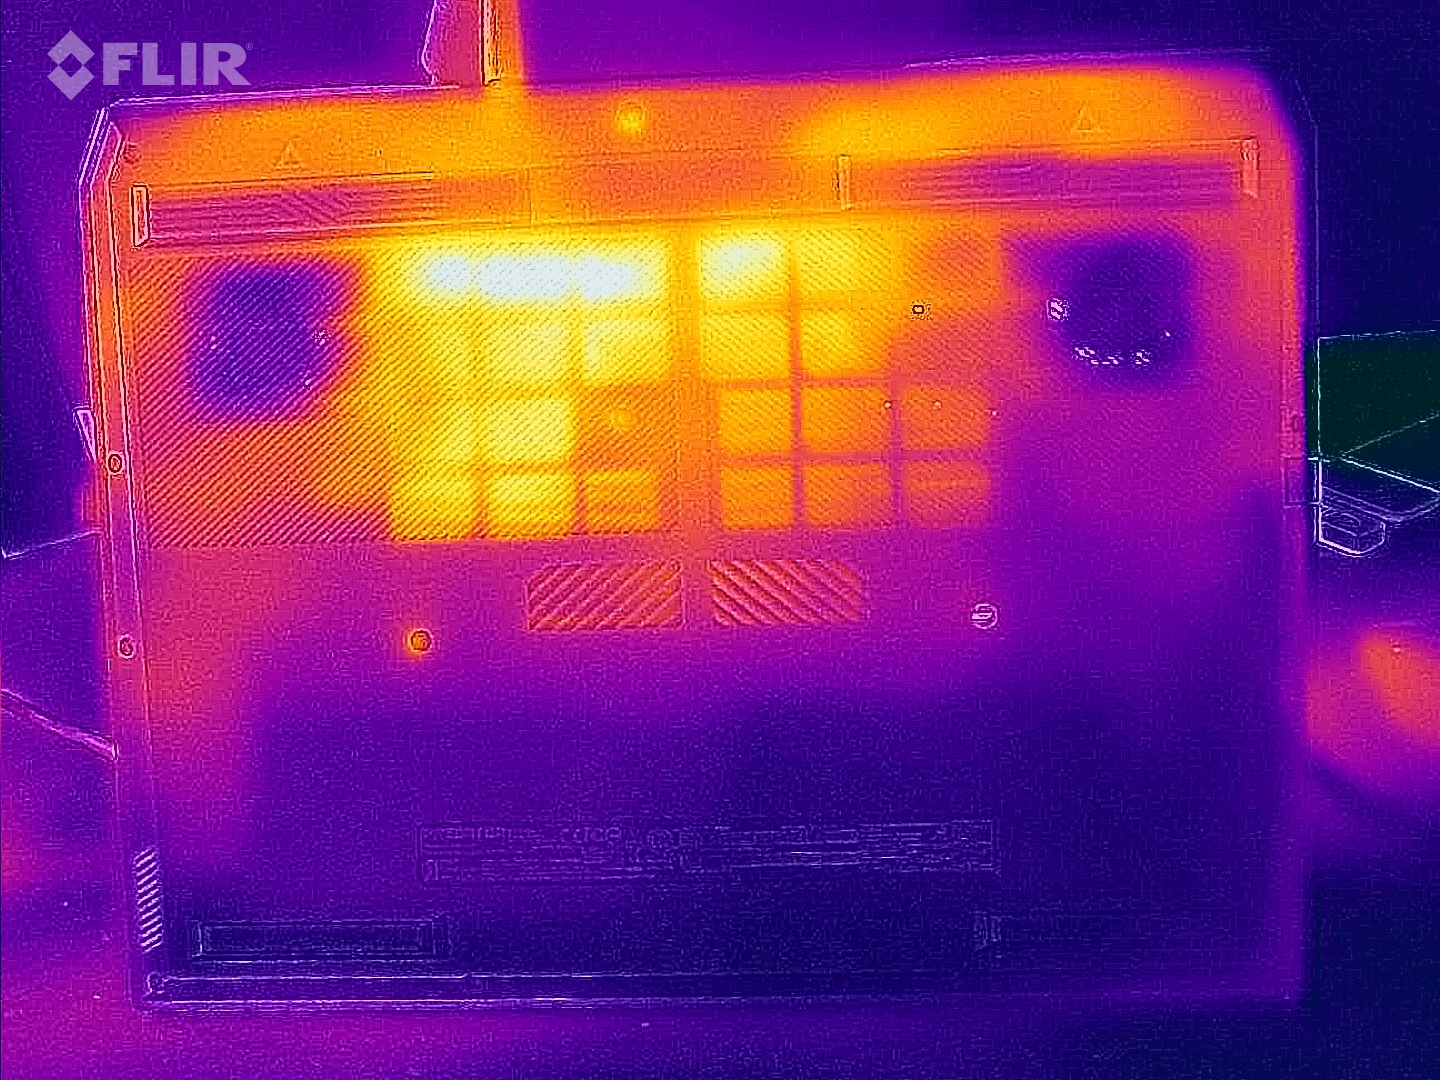
Temperatura
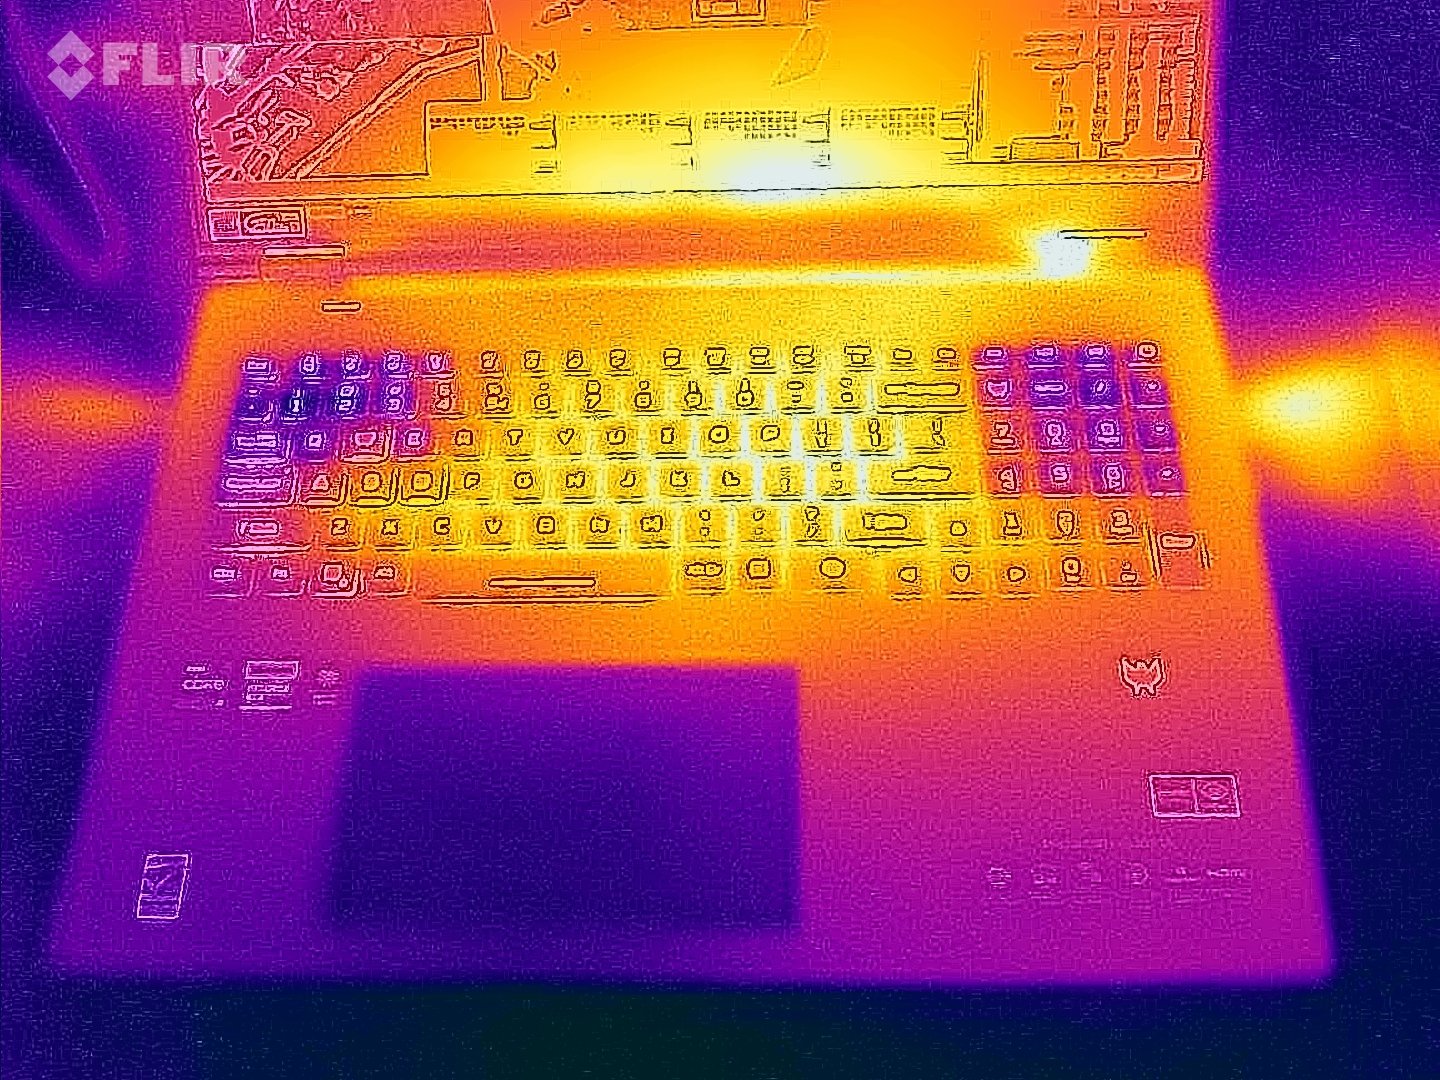
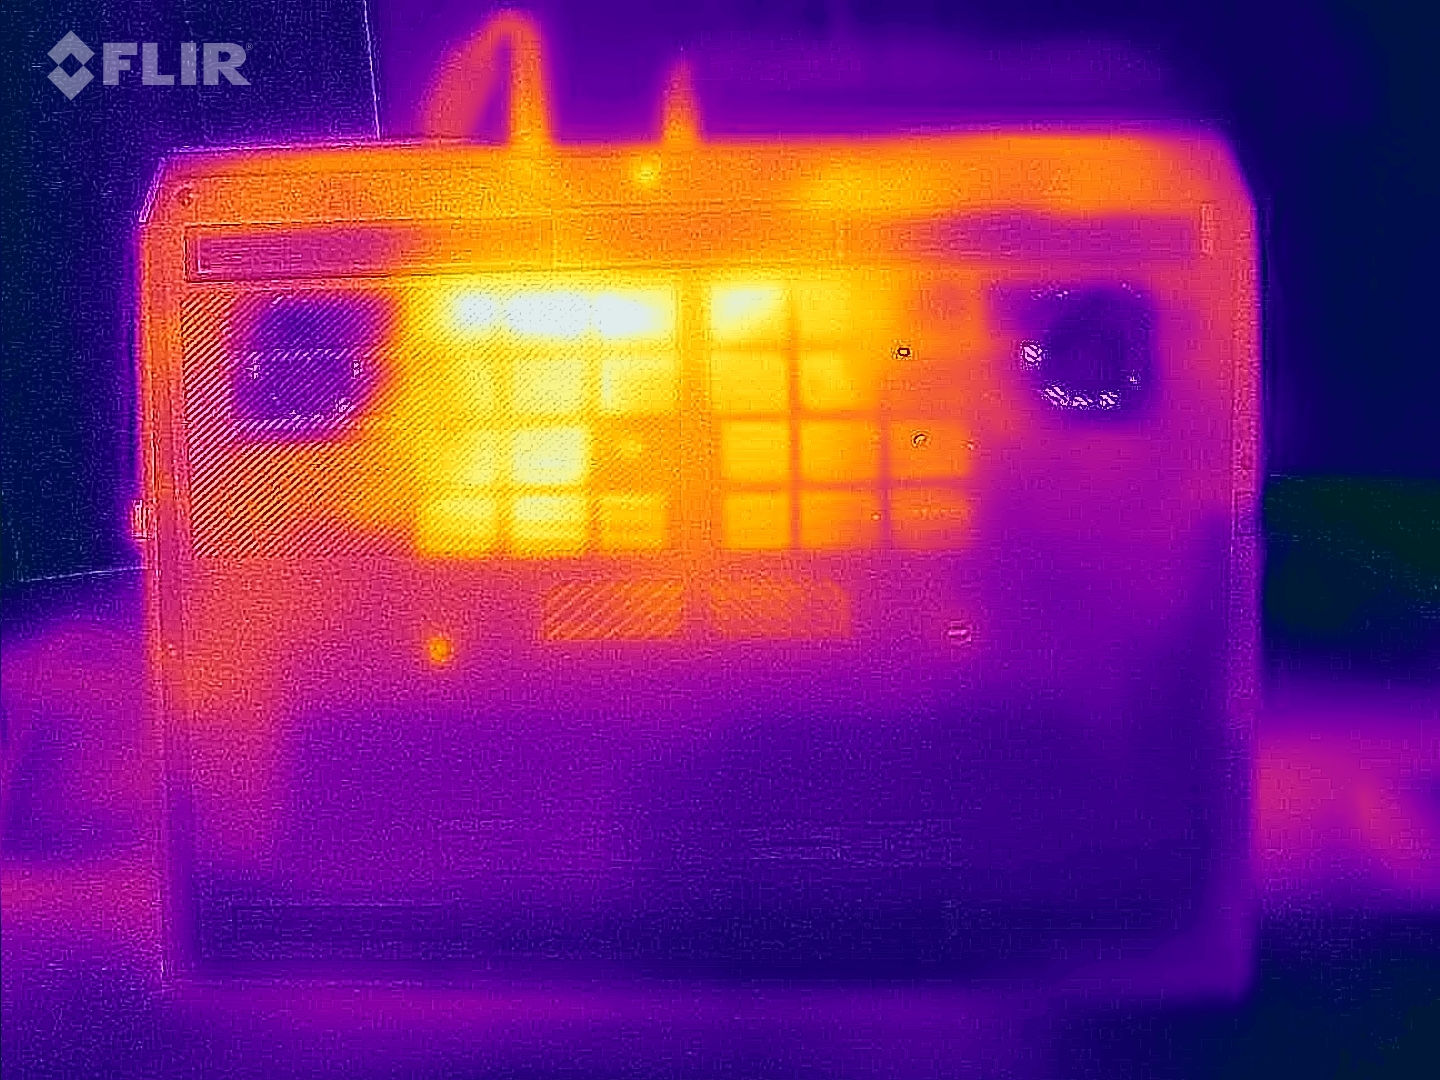
A parte inferior da superfície do gabinete do notebook é a que mais aquece. Após 60 minutos de nosso teste de estresse, medimos mais de 50 °C em determinadas partes, o que significa que o senhor não poderá jogar com o dispositivo sentado no colo. A parte superior permanece muito mais fria, com valores que chegam a 43 °C. Quando ocioso, os valores são bastante moderados - observamos uma média de 29 °C (parte superior) e 30 °C (parte inferior), o que é absolutamente bom.
(±) A temperatura máxima no lado superior é 43 °C / 109 F, em comparação com a média de 40.4 °C / 105 F , variando de 21.2 a 68.8 °C para a classe Gaming.
(-) A parte inferior aquece até um máximo de 59 °C / 138 F, em comparação com a média de 43.2 °C / 110 F
(+) Em uso inativo, a temperatura média para o lado superior é 29.2 °C / 85 F, em comparação com a média do dispositivo de 33.9 °C / ### class_avg_f### F.
(-) Jogando The Witcher 3, a temperatura média para o lado superior é 38.9 °C / 102 F, em comparação com a média do dispositivo de 33.9 °C / ## #class_avg_f### F.
(+) Os apoios para as mãos e o touchpad estão atingindo a temperatura máxima da pele (33 °C / 91.4 F) e, portanto, não estão quentes.
(-) A temperatura média da área do apoio para as mãos de dispositivos semelhantes foi 28.8 °C / 83.8 F (-4.2 °C / -7.6 F).
| Acer Predator Helios 18 PH18-72-98MW i9-14900HX, GeForce RTX 4090 Laptop GPU | MSI Titan 18 HX A14VIG i9-14900HX, GeForce RTX 4090 Laptop GPU | Asus ROG Strix Scar 18 G834JYR (2024) i9-14900HX, GeForce RTX 4090 Laptop GPU | Acer Predator Helios 18 N23Q2 i9-13900HX, GeForce RTX 4080 Laptop GPU | Alienware m18 R1 AMD R9 7945HX, Radeon RX 7900M | |
|---|---|---|---|---|---|
| Heat | 8% | 6% | 1% | 14% | |
| Maximum Upper Side * (°C) | 43 | 37.8 12% | 49 -14% | 35 19% | 40.2 7% |
| Maximum Bottom * (°C) | 59 | 37.6 36% | 47 20% | 56 5% | 37.4 37% |
| Idle Upper Side * (°C) | 32 | 34.8 -9% | 29 9% | 34 -6% | 31.6 1% |
| Idle Bottom * (°C) | 34 | 36 -6% | 31 9% | 39 -15% | 30.6 10% |
* ... menor é melhor
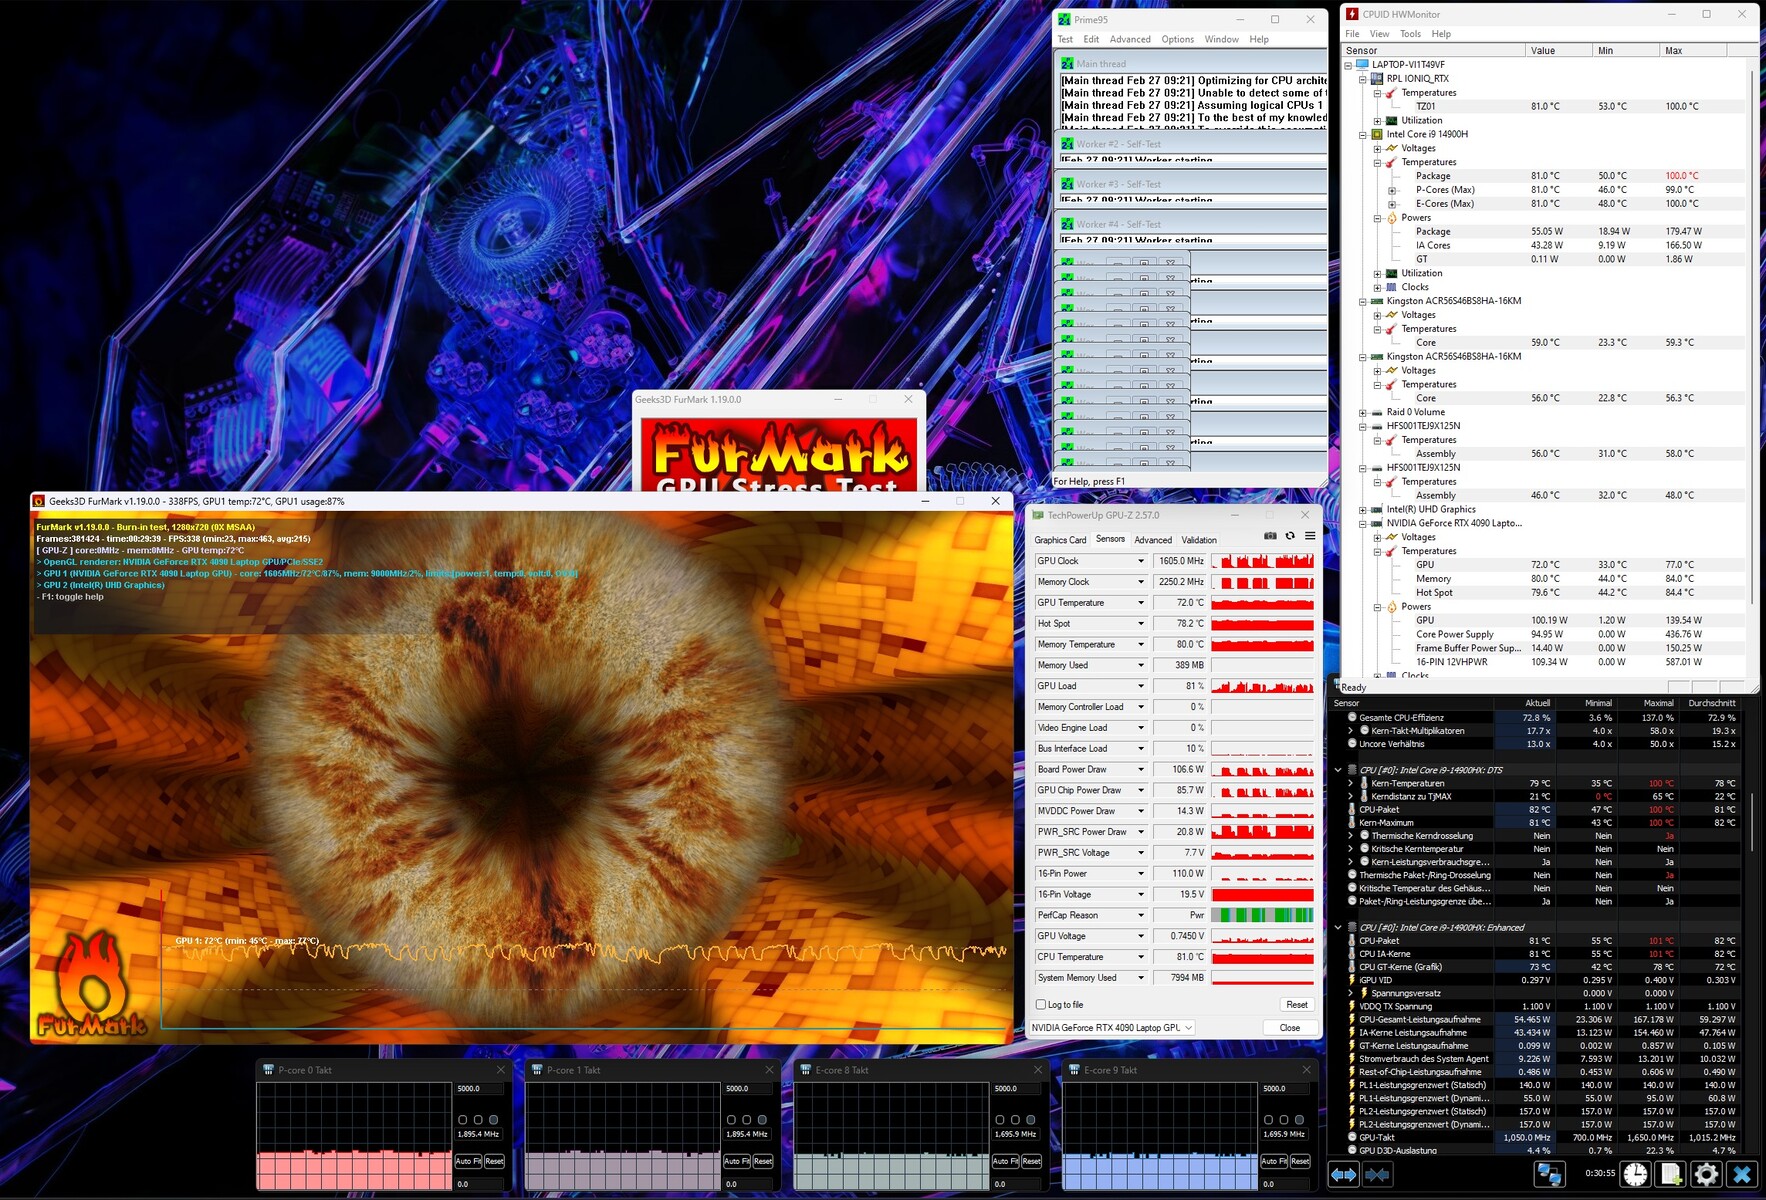
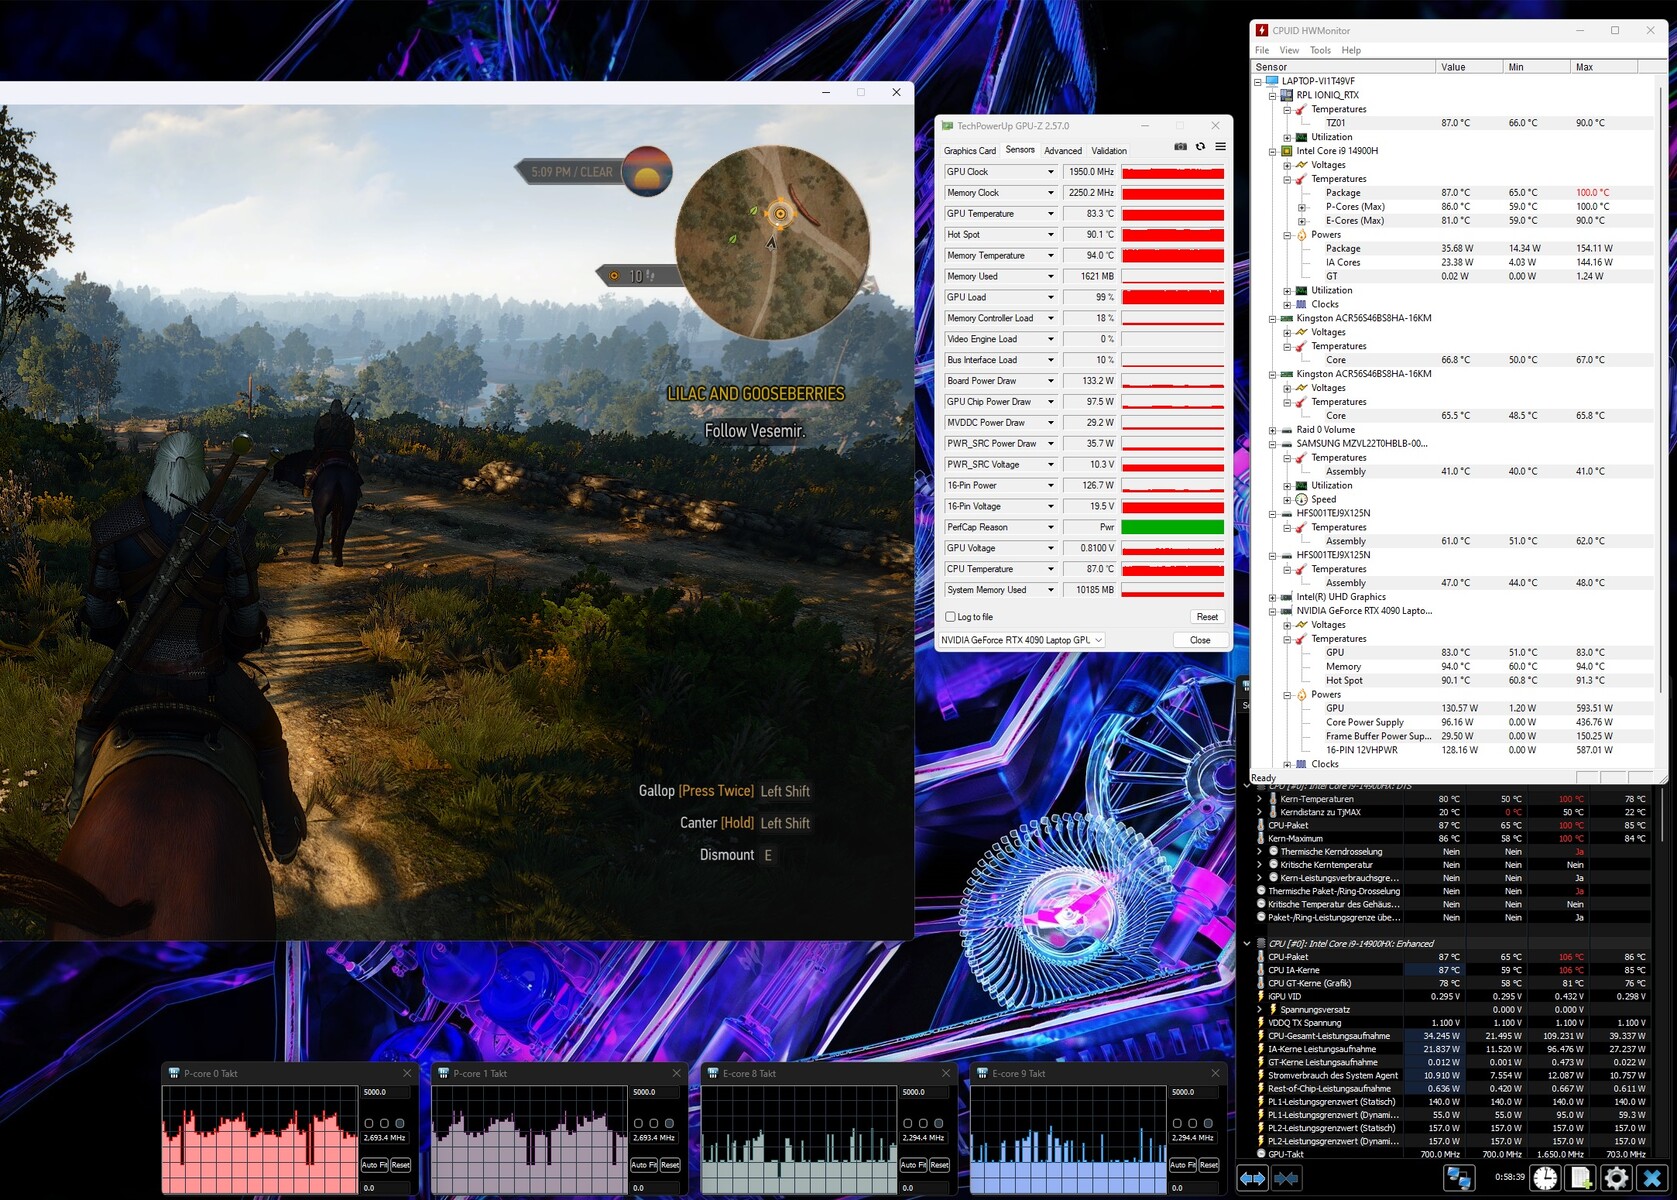
Teste de estresse
Nosso teste de estresse usando as ferramentas Furmark e Prime95 não levou os componentes aos seus limites. Enquanto o Core i9-14900HX se estabilizou em cerca de 81 °C, o GeForce RTX 4090 atingiu cerca de 72 °C (hotspot de 78 °C). No entanto, o hardware pode ficar mais quente no modo de jogo devido às taxas de clock mais altas. No Witcher 3, nossas ferramentas mediram cerca de 87 °C (CPU) e 83 °C (GPU).
Alto-falantes
Nossa análise de áudio confirmou que o novo Predator Helios 18 soa melhor do que seu antecessor. Embora os graves ainda possam ser mais potentes, os médios e agudos agora são mais pronunciados. O volume máximo de 85 dB(A) também deve ser suficiente para a maioria dos usuários.
Acer Predator Helios 18 PH18-72-98MW análise de áudio
(+) | os alto-falantes podem tocar relativamente alto (###valor### dB)
Graves 100 - 315Hz
(-) | quase nenhum baixo - em média 21.1% menor que a mediana
(±) | a linearidade dos graves é média (10.7% delta para a frequência anterior)
Médios 400 - 2.000 Hz
(+) | médios equilibrados - apenas 2.9% longe da mediana
(+) | médios são lineares (5.6% delta para frequência anterior)
Altos 2 - 16 kHz
(+) | agudos equilibrados - apenas 2.7% longe da mediana
(+) | os máximos são lineares (3.6% delta da frequência anterior)
Geral 100 - 16.000 Hz
(+) | o som geral é linear (13.6% diferença em relação à mediana)
Comparado com a mesma classe
» 20% de todos os dispositivos testados nesta classe foram melhores, 7% semelhantes, 73% piores
» O melhor teve um delta de 6%, a média foi 18%, o pior foi 132%
Comparado com todos os dispositivos testados
» 15% de todos os dispositivos testados foram melhores, 4% semelhantes, 82% piores
» O melhor teve um delta de 4%, a média foi 23%, o pior foi 134%
MSI Titan 18 HX A14VIG análise de áudio
(+) | os alto-falantes podem tocar relativamente alto (###valor### dB)
Graves 100 - 315Hz
(-) | quase nenhum baixo - em média 17.6% menor que a mediana
(±) | a linearidade dos graves é média (8% delta para a frequência anterior)
Médios 400 - 2.000 Hz
(+) | médios equilibrados - apenas 1.8% longe da mediana
(+) | médios são lineares (3.7% delta para frequência anterior)
Altos 2 - 16 kHz
(+) | agudos equilibrados - apenas 1.2% longe da mediana
(+) | os máximos são lineares (2% delta da frequência anterior)
Geral 100 - 16.000 Hz
(+) | o som geral é linear (9.9% diferença em relação à mediana)
Comparado com a mesma classe
» 5% de todos os dispositivos testados nesta classe foram melhores, 2% semelhantes, 94% piores
» O melhor teve um delta de 6%, a média foi 18%, o pior foi 132%
Comparado com todos os dispositivos testados
» 4% de todos os dispositivos testados foram melhores, 1% semelhantes, 95% piores
» O melhor teve um delta de 4%, a média foi 23%, o pior foi 134%
Asus ROG Strix Scar 18 G834JYR (2024) análise de áudio
(+) | os alto-falantes podem tocar relativamente alto (###valor### dB)
Graves 100 - 315Hz
(±) | graves reduzidos - em média 5.6% menor que a mediana
(+) | o baixo é linear (6.8% delta para a frequência anterior)
Médios 400 - 2.000 Hz
(±) | médios mais altos - em média 5.7% maior que a mediana
(+) | médios são lineares (2.8% delta para frequência anterior)
Altos 2 - 16 kHz
(±) | máximos reduzidos - em média 7.2% menor que a mediana
(±) | a linearidade dos máximos é média (7.2% delta para frequência anterior)
Geral 100 - 16.000 Hz
(+) | o som geral é linear (13% diferença em relação à mediana)
Comparado com a mesma classe
» 18% de todos os dispositivos testados nesta classe foram melhores, 3% semelhantes, 79% piores
» O melhor teve um delta de 6%, a média foi 18%, o pior foi 132%
Comparado com todos os dispositivos testados
» 13% de todos os dispositivos testados foram melhores, 3% semelhantes, 85% piores
» O melhor teve um delta de 4%, a média foi 23%, o pior foi 134%
Acer Predator Helios 18 N23Q2 análise de áudio
(+) | os alto-falantes podem tocar relativamente alto (###valor### dB)
Graves 100 - 315Hz
(-) | quase nenhum baixo - em média 17.6% menor que a mediana
(±) | a linearidade dos graves é média (9.8% delta para a frequência anterior)
Médios 400 - 2.000 Hz
(±) | médios mais altos - em média 9.1% maior que a mediana
(±) | a linearidade dos médios é média (8.8% delta para frequência anterior)
Altos 2 - 16 kHz
(±) | máximos mais altos - em média 5.3% maior que a mediana
(+) | os máximos são lineares (6.4% delta da frequência anterior)
Geral 100 - 16.000 Hz
(±) | a linearidade do som geral é média (20.3% diferença em relação à mediana)
Comparado com a mesma classe
» 72% de todos os dispositivos testados nesta classe foram melhores, 6% semelhantes, 23% piores
» O melhor teve um delta de 6%, a média foi 18%, o pior foi 132%
Comparado com todos os dispositivos testados
» 53% de todos os dispositivos testados foram melhores, 8% semelhantes, 39% piores
» O melhor teve um delta de 4%, a média foi 23%, o pior foi 134%
Alienware m18 R1 AMD análise de áudio
(+) | os alto-falantes podem tocar relativamente alto (###valor### dB)
Graves 100 - 315Hz
(-) | quase nenhum baixo - em média 22.7% menor que a mediana
(-) | graves não são lineares (15.8% delta para frequência anterior)
Médios 400 - 2.000 Hz
(+) | médios equilibrados - apenas 1.5% longe da mediana
(+) | médios são lineares (3.8% delta para frequência anterior)
Altos 2 - 16 kHz
(+) | agudos equilibrados - apenas 3.6% longe da mediana
(+) | os máximos são lineares (5.5% delta da frequência anterior)
Geral 100 - 16.000 Hz
(±) | a linearidade do som geral é média (16.5% diferença em relação à mediana)
Comparado com a mesma classe
» 42% de todos os dispositivos testados nesta classe foram melhores, 7% semelhantes, 51% piores
» O melhor teve um delta de 6%, a média foi 18%, o pior foi 132%
Comparado com todos os dispositivos testados
» 28% de todos os dispositivos testados foram melhores, 6% semelhantes, 66% piores
» O melhor teve um delta de 4%, a média foi 23%, o pior foi 134%
Gerenciamento de energia
Consumo de energia
A Acer poderia ajustar um pouco o consumo de energia do dispositivo. Apesar de sua comutação gráfica ativa, o laptop de 18 polegadas requer bastante energia no modo inativo, ou seja, de 31 a 43 watts. A maioria dos concorrentes, bem como o antigo Helios, se saem muito melhor nesse aspecto. Também pode ter havido um bug em nosso dispositivo de teste.
| desligado | |
| Ocioso | |
| Carga |
|
Key:
min: | |
| Acer Predator Helios 18 PH18-72-98MW i9-14900HX, GeForce RTX 4090 Laptop GPU | MSI Titan 18 HX A14VIG i9-14900HX, GeForce RTX 4090 Laptop GPU | Asus ROG Strix Scar 18 G834JYR (2024) i9-14900HX, GeForce RTX 4090 Laptop GPU | Acer Predator Helios 18 N23Q2 i9-13900HX, GeForce RTX 4080 Laptop GPU | Alienware m18 R1 AMD R9 7945HX, Radeon RX 7900M | Média da turma Gaming | |
|---|---|---|---|---|---|---|
| Power Consumption | -3% | 24% | 22% | -34% | 38% | |
| Idle Minimum * (Watt) | 31 | 13.2 57% | 14 55% | 16 48% | 30.3 2% | 13 ? 58% |
| Idle Average * (Watt) | 35 | 25.4 27% | 17 51% | 19 46% | 55.6 -59% | 19 ? 46% |
| Idle Maximum * (Watt) | 43 | 53.5 -24% | 24 44% | 21.3 50% | 101.1 -135% | 24.6 ? 43% |
| Load Average * (Watt) | 144 | 151.4 -5% | 143 1% | 124 14% | 160.3 -11% | 110.7 ? 23% |
| Witcher 3 ultra * (Watt) | 228 | 336 -47% | 251 -10% | 289 -27% | 216 5% | |
| Load Maximum * (Watt) | 318 | 395.2 -24% | 302 5% | 319 -0% | 332.1 -4% | 259 ? 19% |
* ... menor é melhor
Power consumption Witcher 3 / stress test
Power consumption with external monitor
Tempos de execução
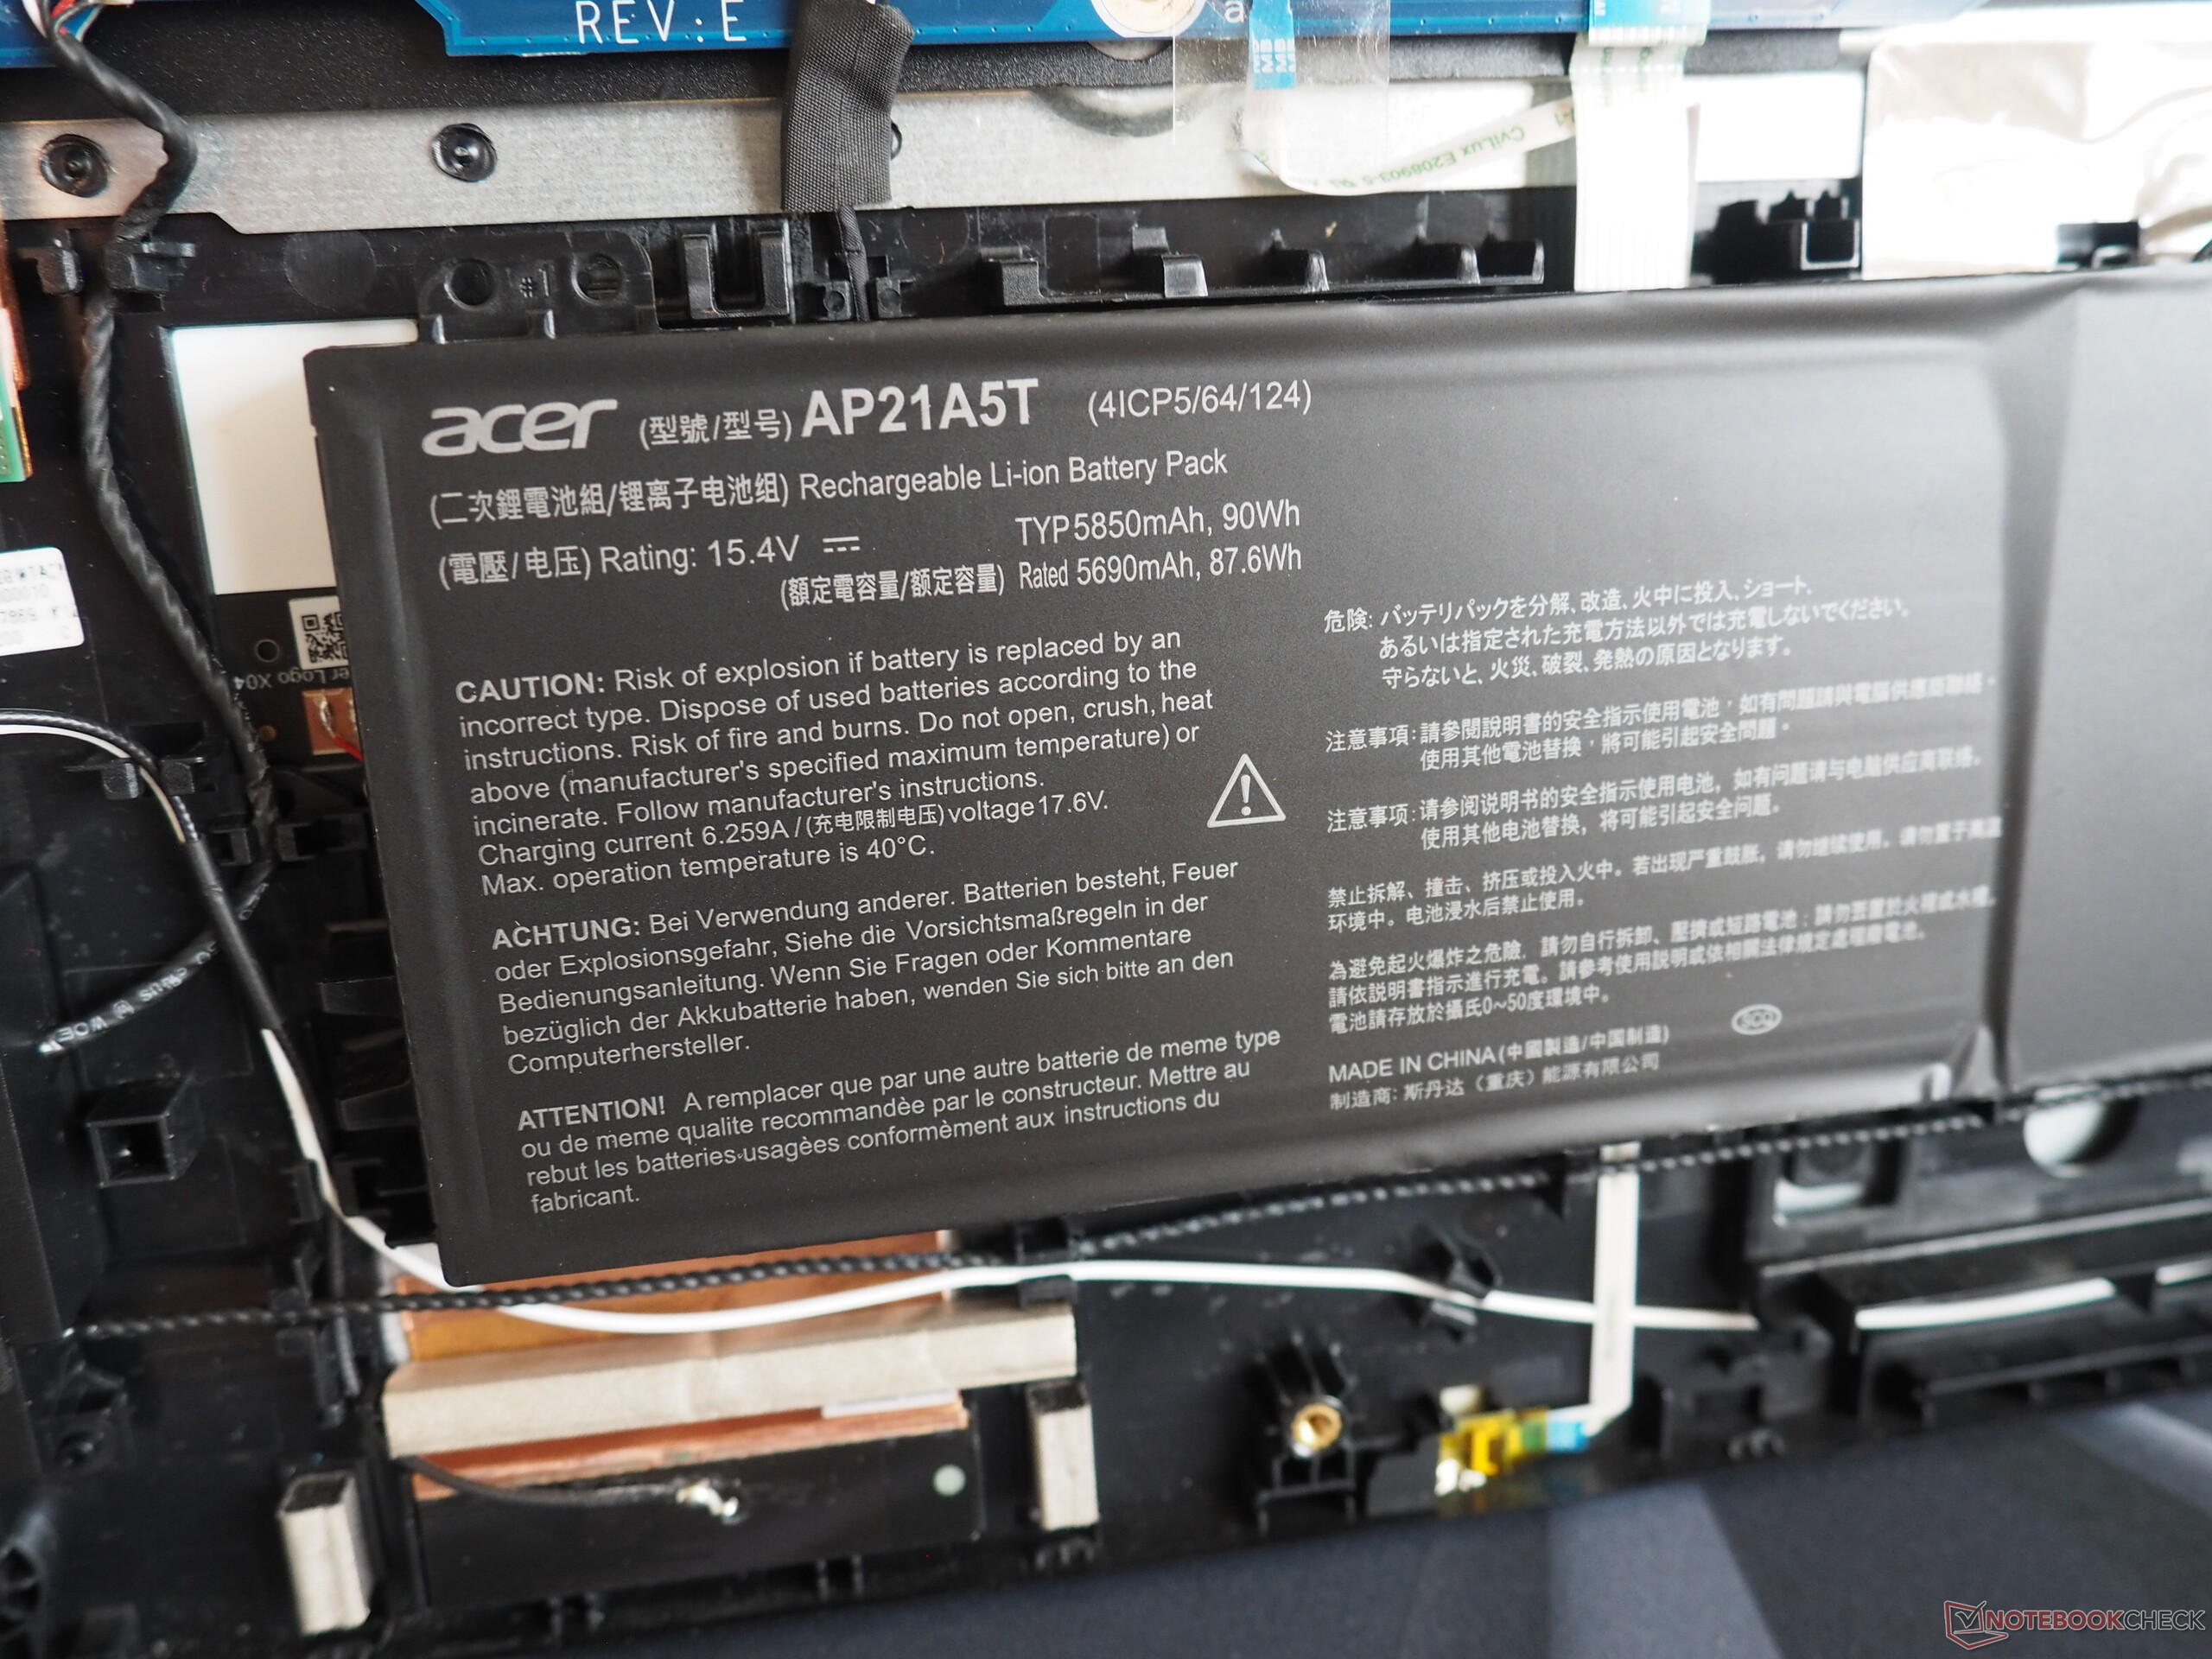
Sua alta exigência de energia leva a uma duração de bateria muito modesta. Em nosso teste WLAN com o brilho reduzido para 150 cd/m², o Predator Helios 18 durou pouco mais de 3 horas. Em comparação, o ROG Strix Scar 18 conseguiu mais de 7 horas. Em geral, sua bateria de 90 Wh não é nada pequena.
| Acer Predator Helios 18 PH18-72-98MW i9-14900HX, GeForce RTX 4090 Laptop GPU, 90 Wh | MSI Titan 18 HX A14VIG i9-14900HX, GeForce RTX 4090 Laptop GPU, 99.9 Wh | Asus ROG Strix Scar 18 G834JYR (2024) i9-14900HX, GeForce RTX 4090 Laptop GPU, 90 Wh | Acer Predator Helios 18 N23Q2 i9-13900HX, GeForce RTX 4080 Laptop GPU, 90 Wh | Alienware m18 R1 AMD R9 7945HX, Radeon RX 7900M, 97 Wh | Média da turma Gaming | |
|---|---|---|---|---|---|---|
| Duração da bateria | 20% | 80% | 47% | -46% | 80% | |
| WiFi v1.3 (h) | 3.2 | 4.2 31% | 7.7 141% | 4.4 38% | 1.4 -56% | 7.11 ? 122% |
| Load (h) | 1.1 | 1.2 9% | 1.3 18% | 1.7 55% | 0.7 -36% | 1.502 ? 37% |
| Reader / Idle (h) | 5.9 | 10.2 | 4.5 | 8.27 ? | ||
| H.264 (h) | 7.5 | 4.8 | 8.32 ? |
Pro
Contra
Veredicto
A versão 2024 é mais uma atualização sutil do Predator Helios 18.
Em termos de desempenho, seu Core i9-14900HX e GeForce RTX 4090 praticamente não diferem do antigo Core i9-13900HX e GeForce RTX 4080. Por outro lado, sua tela WQXGA-MiniLED com uma proporção de 16:10 continua a oferecer uma qualidade de imagem impressionante (brilho, contraste, espaço de cores etc.). Além disso, há ótimos dispositivos de entrada e opções de conectividade modernas (2x Thunderbolt 4).
Os gamers exigentes com o orçamento certo terão a certeza de receber um pacote completo e despreocupado.
No entanto, em seu estado atual, o Predator Helios 18 não recebeu a classificação de "muito bom" por pouco. Além do controle da ventoinha (que, às vezes, causa irritantes vibrações), a Acer também poderia revisar o consumo de energia do laptop em modo inativo, o que atualmente ainda leva a tempos de execução escassos.
Muitos concorrentes podem não estar atualmente no mercado, mas estão pelo menos no mesmo nível do dispositivo - seja o MSI Titan 18 ou o Asus ROG Strix Scar 18.
Preço e disponibilidade
No momento em que este artigo foi escrito, o Predator Helios 18 com um Core i9-14900HX e um GeForce RTX 4090 ainda não estava disponível para compra nos Estados Unidos.
Acer Predator Helios 18 PH18-72-98MW
- 02/27/2024 v7 (old)
Florian Glaser
Transparência
A seleção dos dispositivos a serem analisados é feita pela nossa equipe editorial. A amostra de teste foi fornecida ao autor como empréstimo pelo fabricante ou varejista para fins desta revisão. O credor não teve influência nesta revisão, nem o fabricante recebeu uma cópia desta revisão antes da publicação. Não houve obrigação de publicar esta revisão. Como empresa de mídia independente, a Notebookcheck não está sujeita à autoridade de fabricantes, varejistas ou editores.
É assim que o Notebookcheck está testando
Todos os anos, o Notebookcheck analisa de forma independente centenas de laptops e smartphones usando procedimentos padronizados para garantir que todos os resultados sejam comparáveis. Desenvolvemos continuamente nossos métodos de teste há cerca de 20 anos e definimos padrões da indústria no processo. Em nossos laboratórios de teste, equipamentos de medição de alta qualidade são utilizados por técnicos e editores experientes. Esses testes envolvem um processo de validação em vários estágios. Nosso complexo sistema de classificação é baseado em centenas de medições e benchmarks bem fundamentados, o que mantém a objetividade.Price comparison

