Asus ROG Strix Scar 17 G733PY revisão laptop: Intel não é mais rei

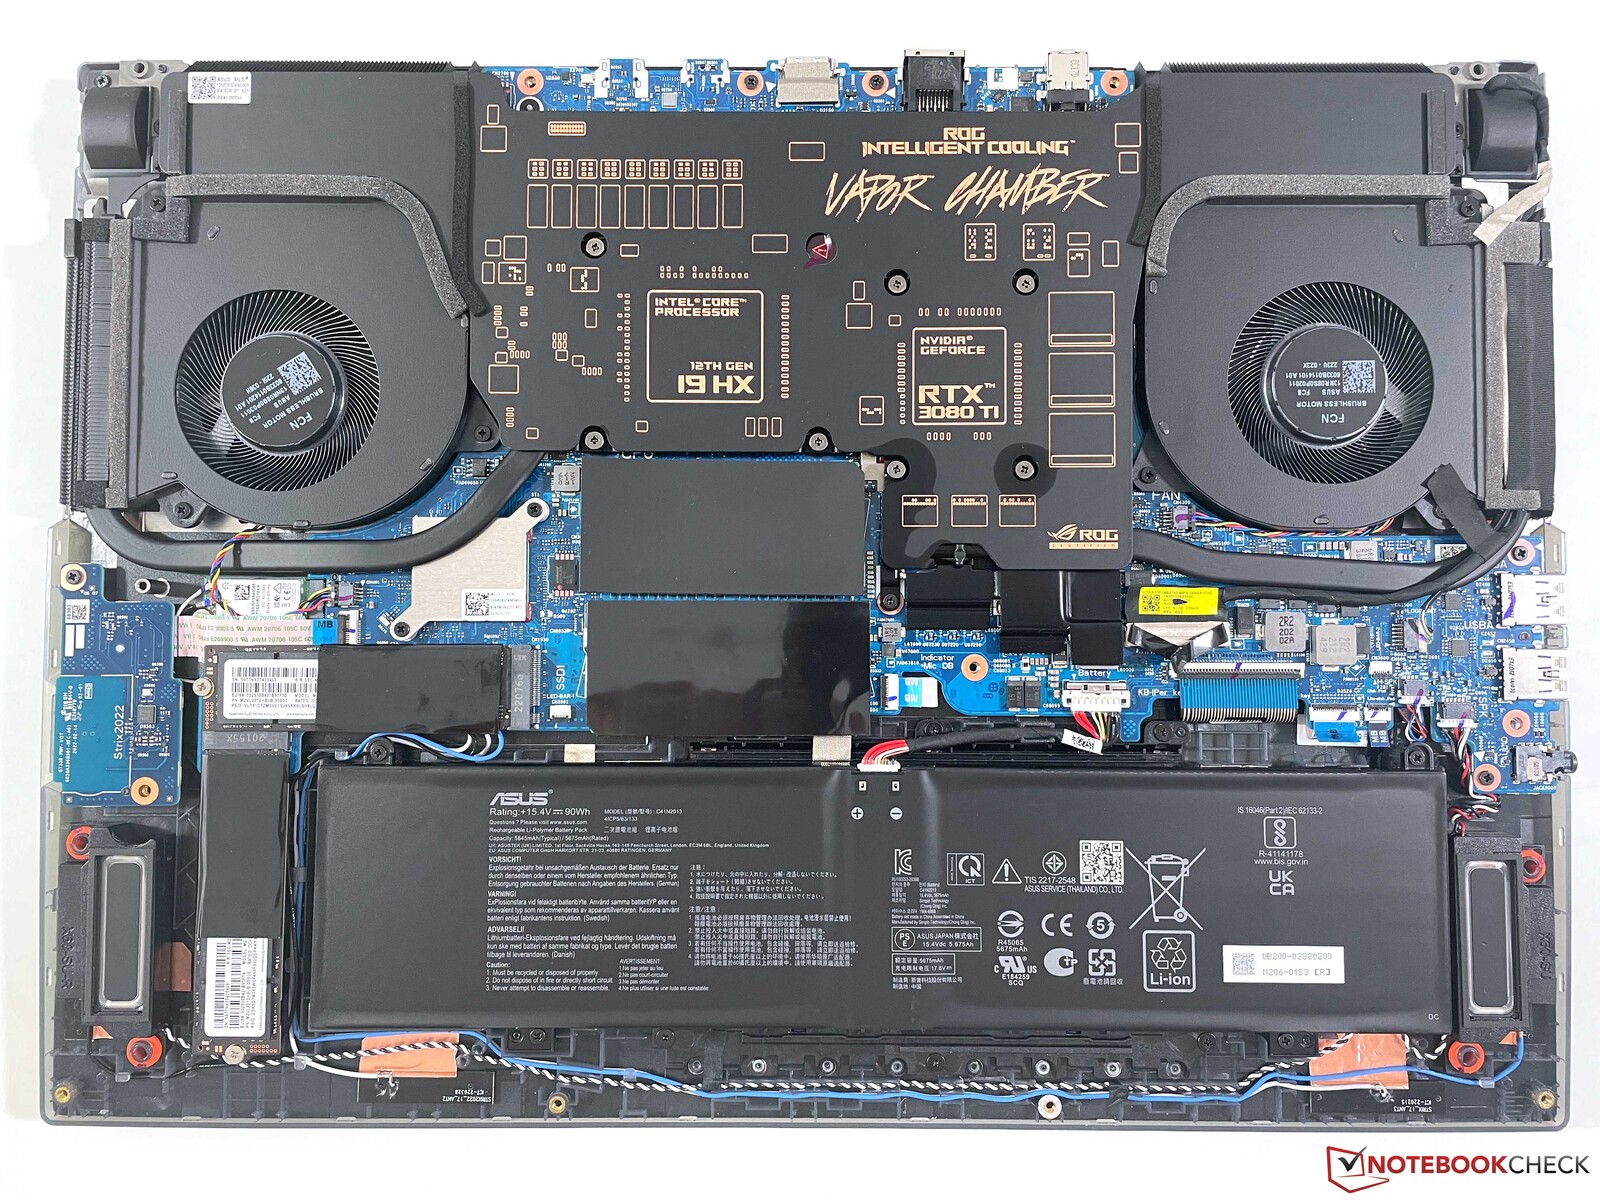
Apresentada no CES 2023, a Asus atualizou sua série ROG Strix Scar 17 de 17,3 polegadas com as últimas CPUs Intel do 13º gênero, CPUs Zen 4 AMD, e GPUs Nvidia Ada Lovelace para substituir a linha do ano passado. Além destas atualizações internas, entretanto, o design do chassi externo permanece quase idêntico ano após ano. Recomendamos verificar nossas revisões existentes sobre o modelo 2022 ROG Strix Scar 17 para saber mais sobre as características físicas do modelo 2023. Quaisquer diferenças entre elas serão observadas abaixo.
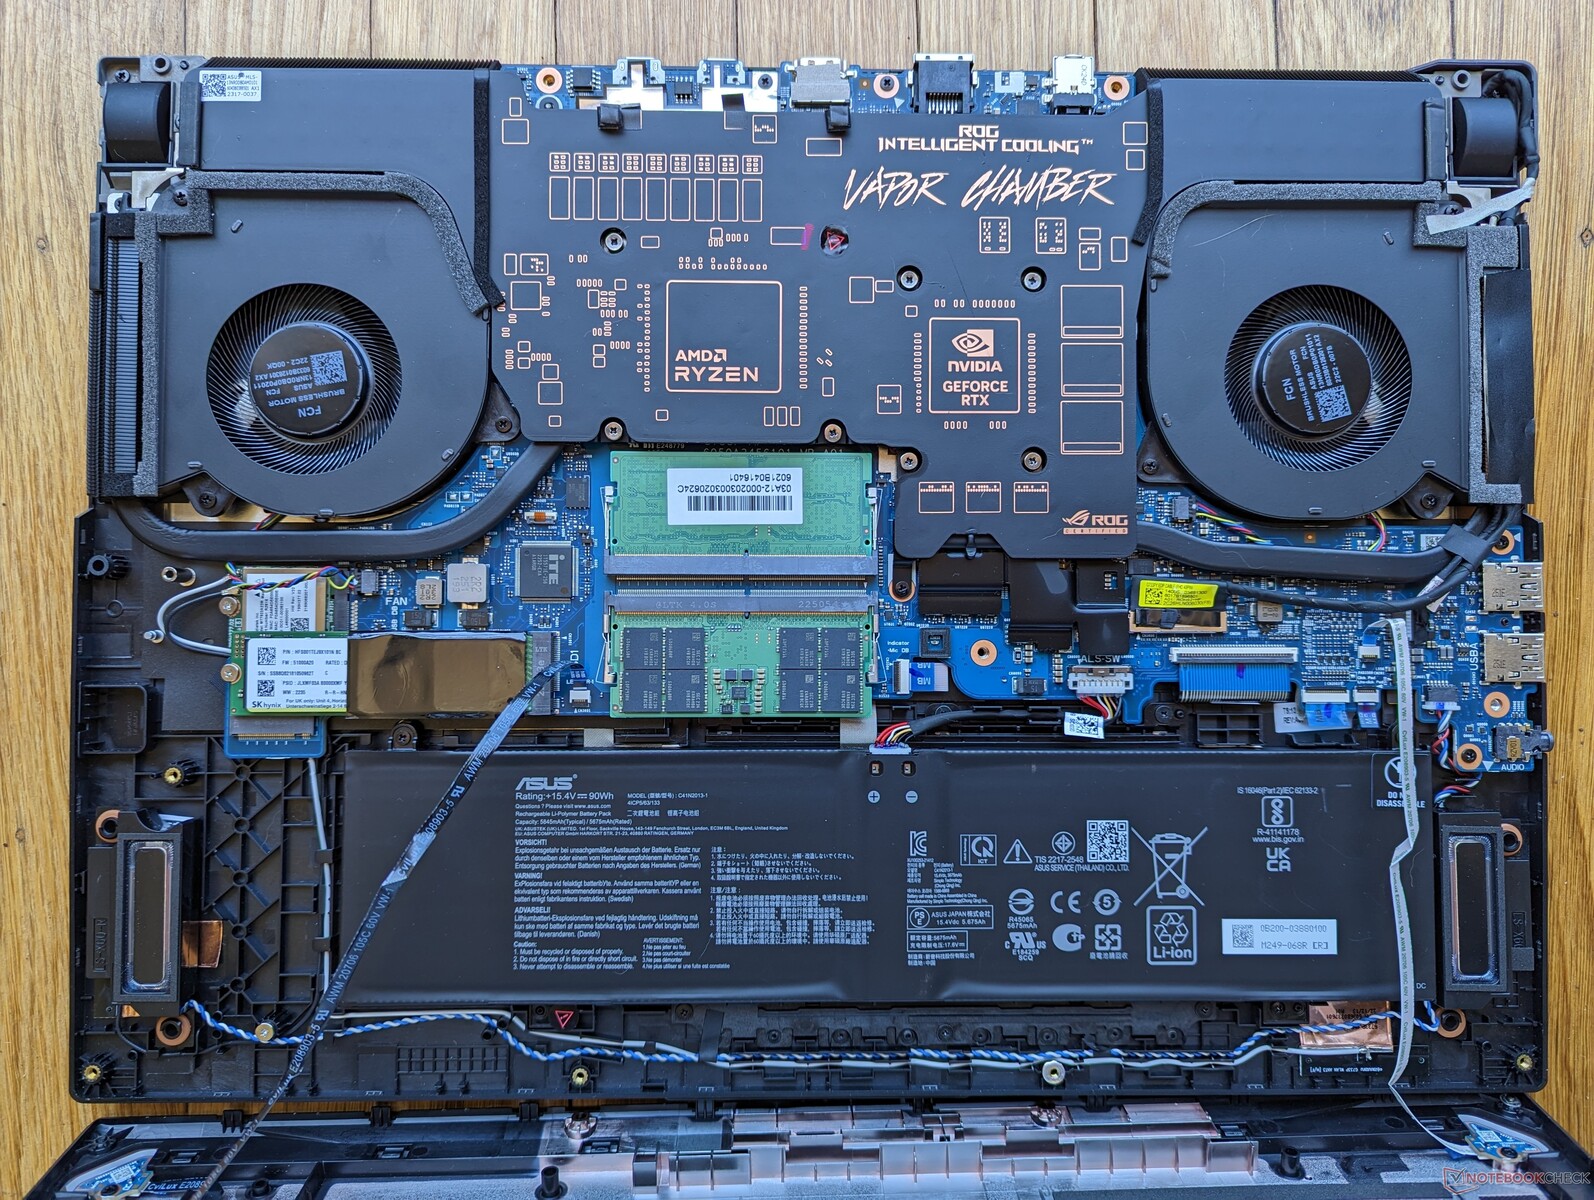
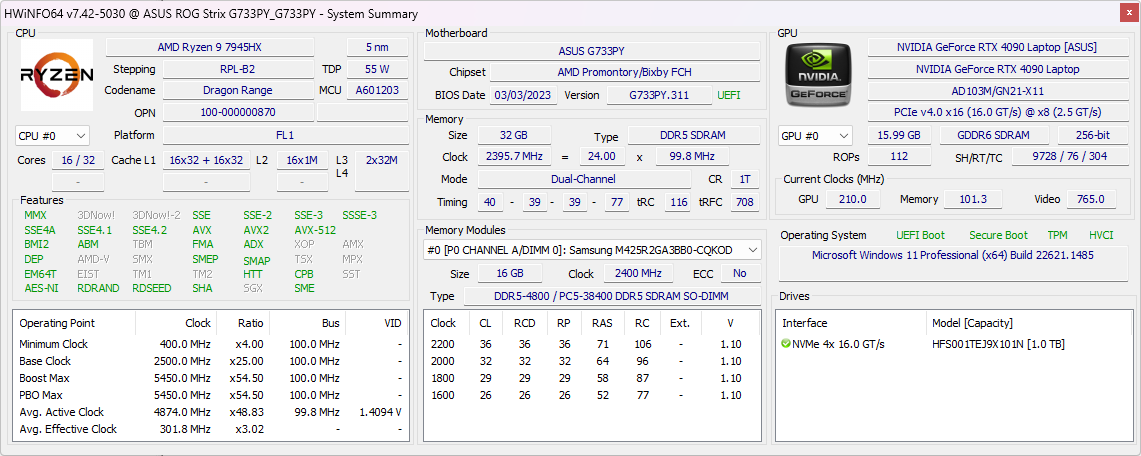
Nossa configuração em revisão é a mais alta SKU equipada com a CPU Ryzen 9 7945HX e 175 W GeForce RTX 4090 GPU. Outros SKUs estão disponíveis até o RTX 4060, mas todos eles carregam o mesmo painel IPS 240 Hz 1440p que este escrito.
Os concorrentes ao Strix Scar 17 incluem outros laptops de alta qualidade de 17 polegadas, como o Lâmina Razer 17, Alienware m17, MSI GE77ou Aorus 17.
Mais revisões do Asus:
Possíveis concorrentes em comparação
Avaliação | Data | Modelo | Peso | Altura | Size | Resolução | Preço |
|---|---|---|---|---|---|---|---|
| 88.3 % v7 (old) | 04/2023 | Asus ROG Strix Scar 17 G733PY-XS96 R9 7945HX, GeForce RTX 4090 Laptop GPU | 2.9 kg | 28.3 mm | 17.30" | 2560x1440 | |
| 88.3 % v7 (old) | 03/2023 | MSI GE78HX 13VH-070US i9-13950HX, GeForce RTX 4080 Laptop GPU | 3 kg | 23 mm | 17.00" | 2560x1600 | |
| 89.9 % v7 (old) | 03/2023 | Eluktronics Mech-17 GP2 i9-13900HX, GeForce RTX 4090 Laptop GPU | 2.9 kg | 27 mm | 17.00" | 2560x1600 | |
| 88.4 % v7 (old) | 04/2023 | Asus ROG Strix G17 G713PI R9 7945HX, GeForce RTX 4070 Laptop GPU | 2.8 kg | 30.7 mm | 17.30" | 2560x1440 | |
| 83.7 % v7 (old) | 08/2022 | Aorus 17X XES i9-12900HX, GeForce RTX 3070 Ti Laptop GPU | 2.7 kg | 30 mm | 17.30" | 1920x1080 | |
| 86.1 % v7 (old) | 01/2023 | Alienware m17 R5 (R9 6900HX, RX 6850M XT) R9 6900HX, Radeon RX 6850M XT | 3.4 kg | 26.7 mm | 17.00" | 3840x2160 |
Caso - Sem mudanças... Quase
Há três diferenças importantes entre os modelos 2023 e 2022, como segue:
- O Asus Keystone não é mais suportado. O fabricante provavelmente reconheceu que muito poucos proprietários estavam usando o recurso em primeiro lugar.
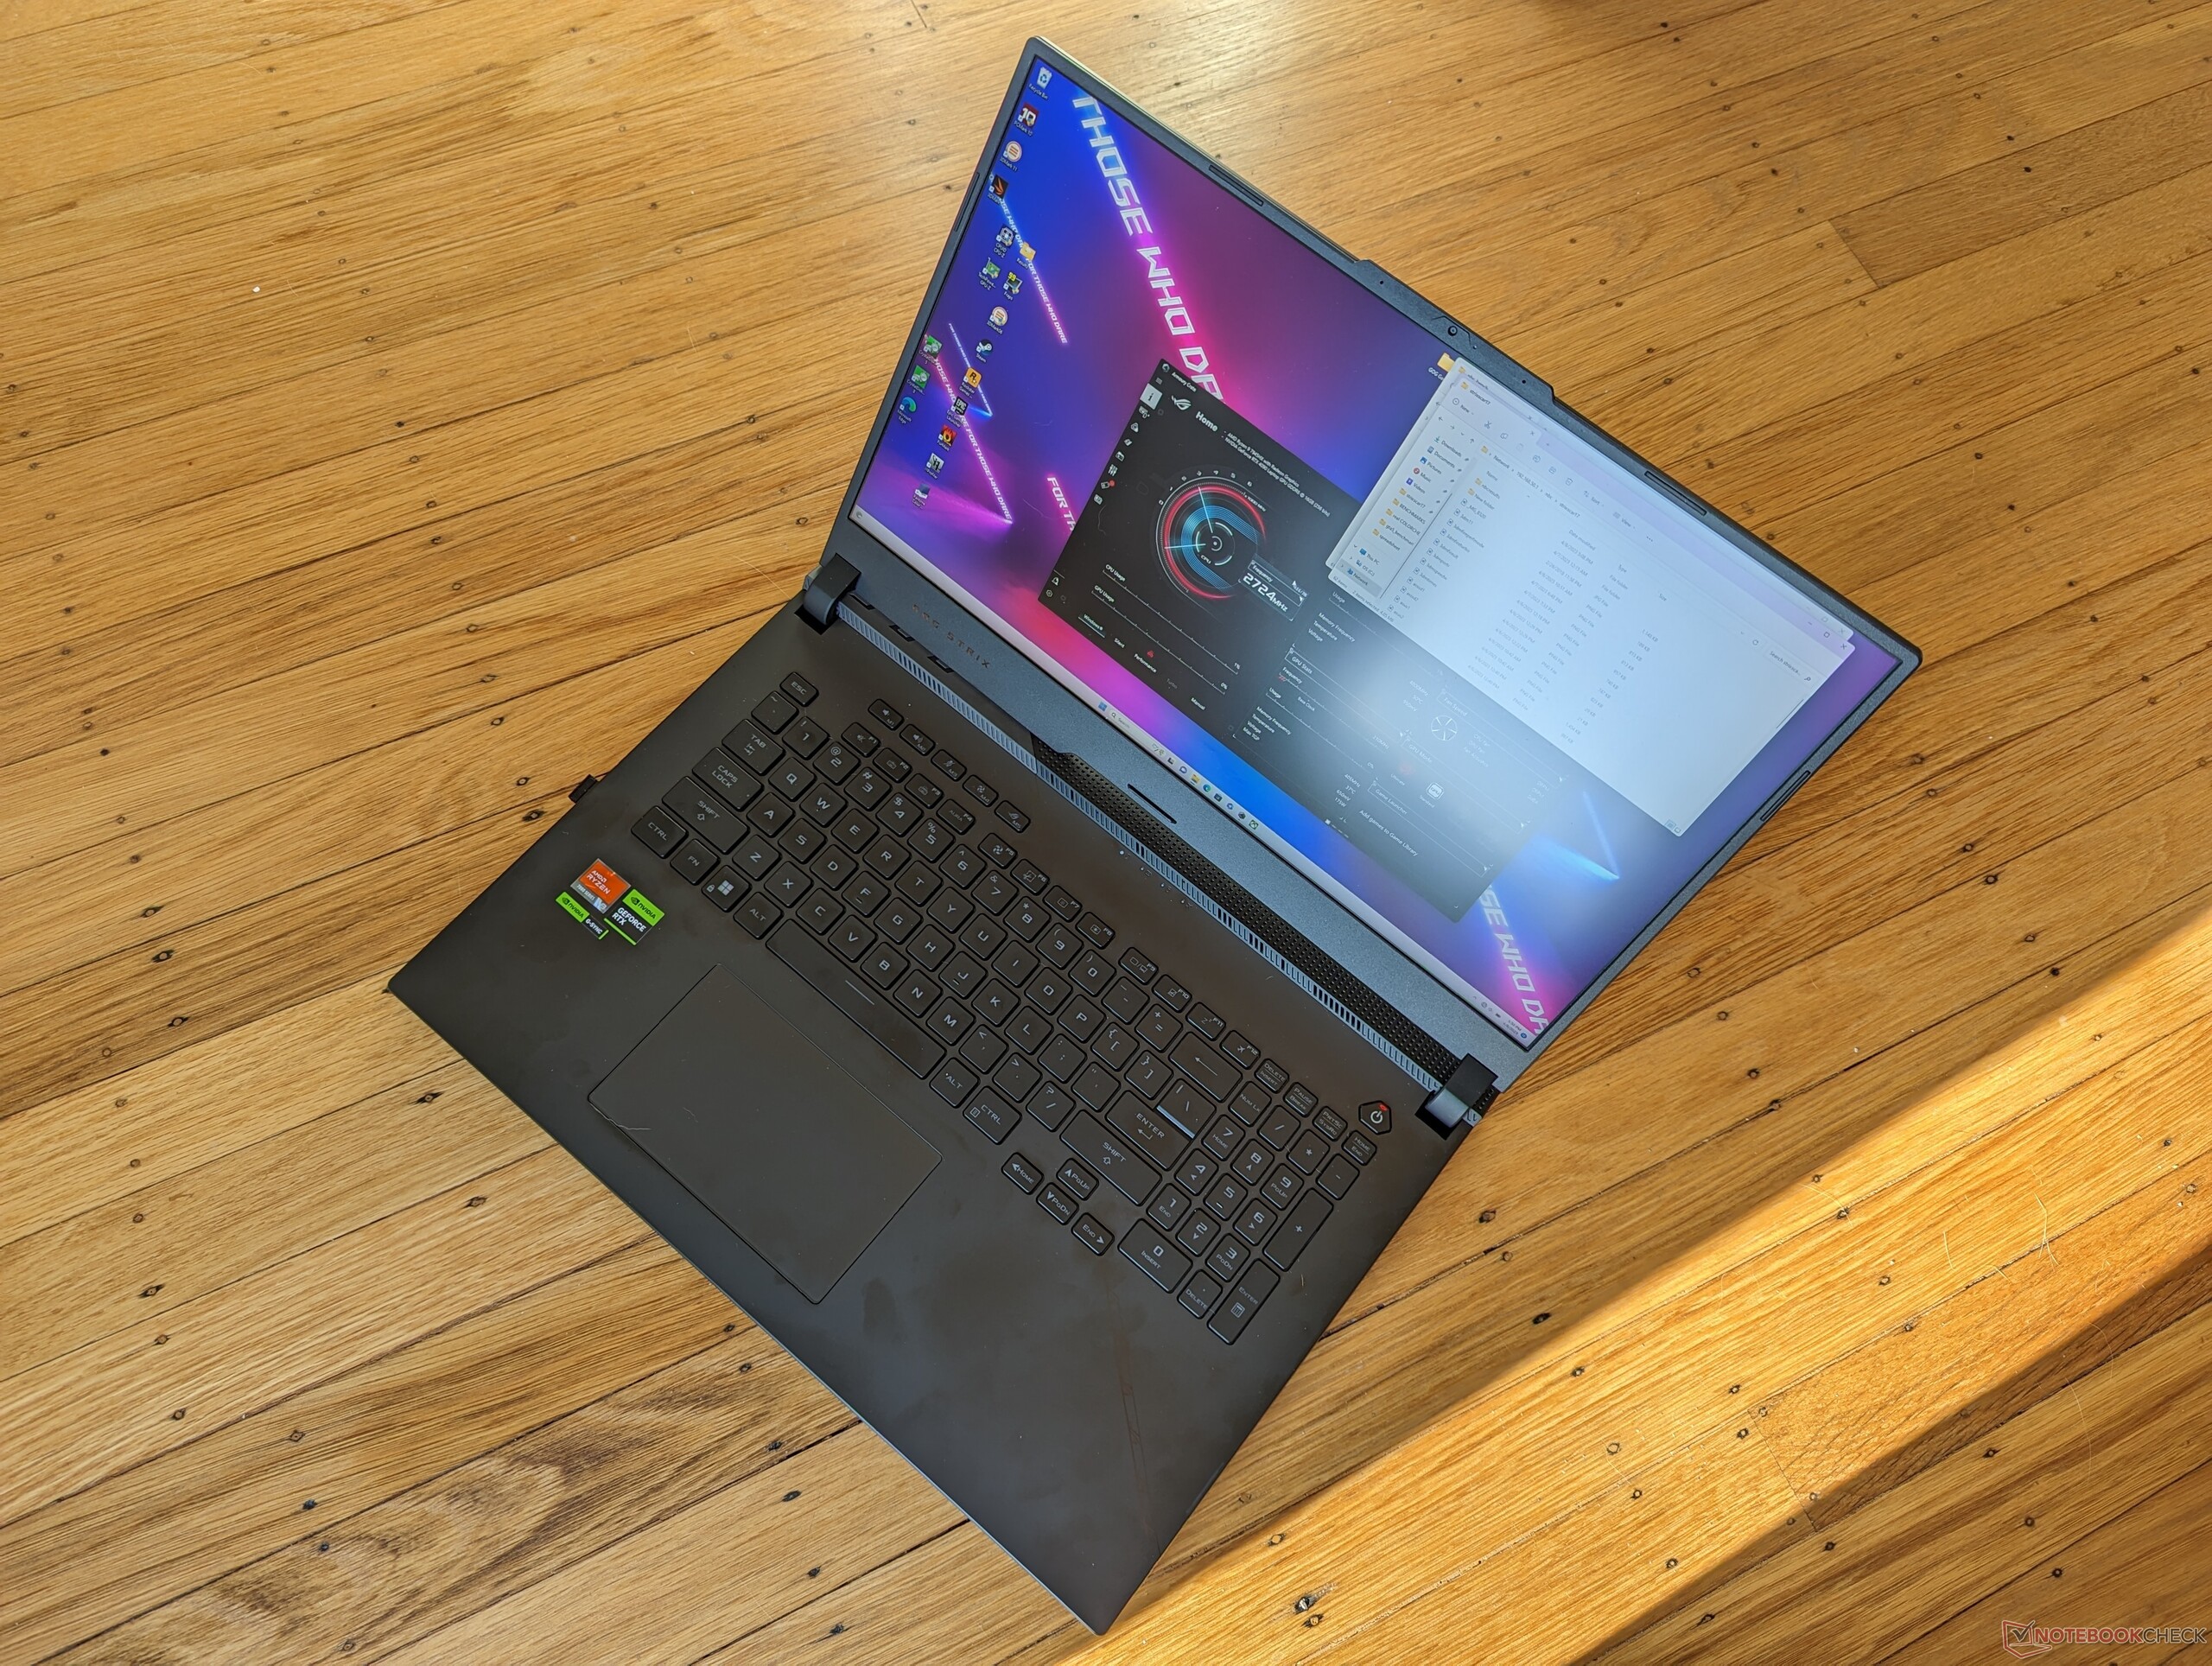
- Nova webcam. Agora existe uma webcam integrada, enquanto que o modelo do ano passado careceria de uma completamente.
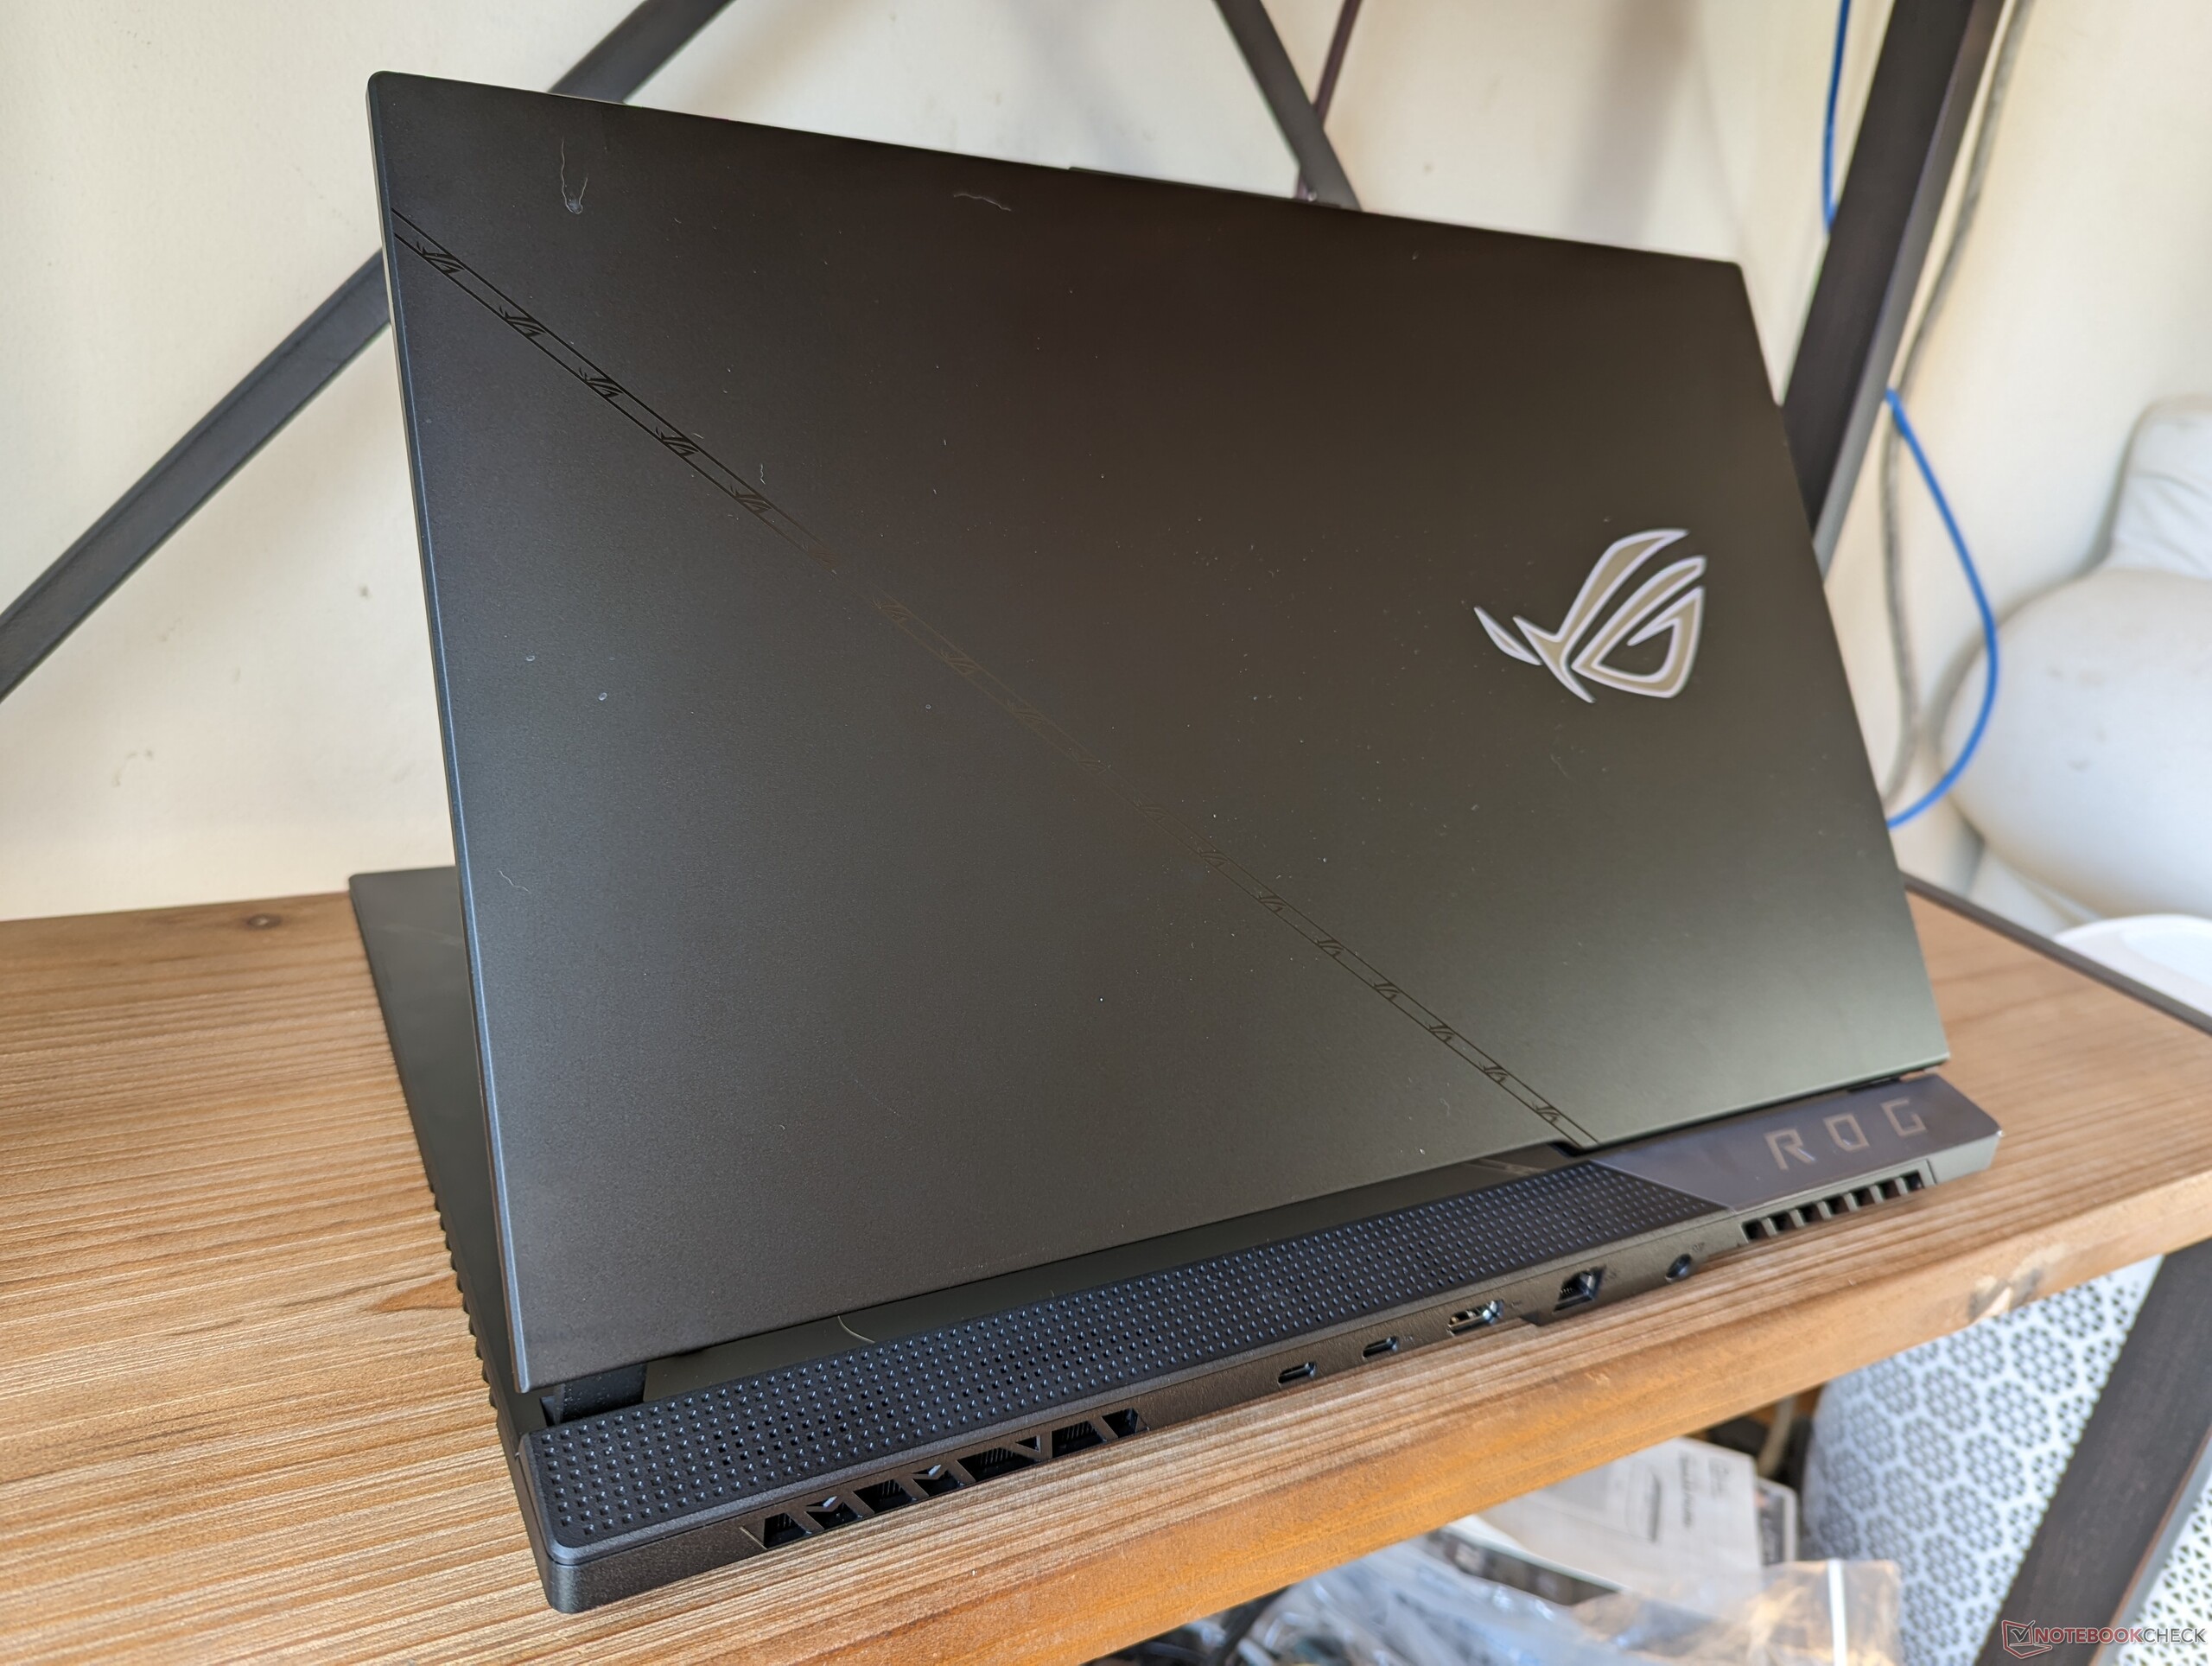
- Novas marcas superficiais nos apoios das palmas e na tampa externa.
Caso contrário, o chassi geral é idêntico ao do ano anterior.
Comunicação
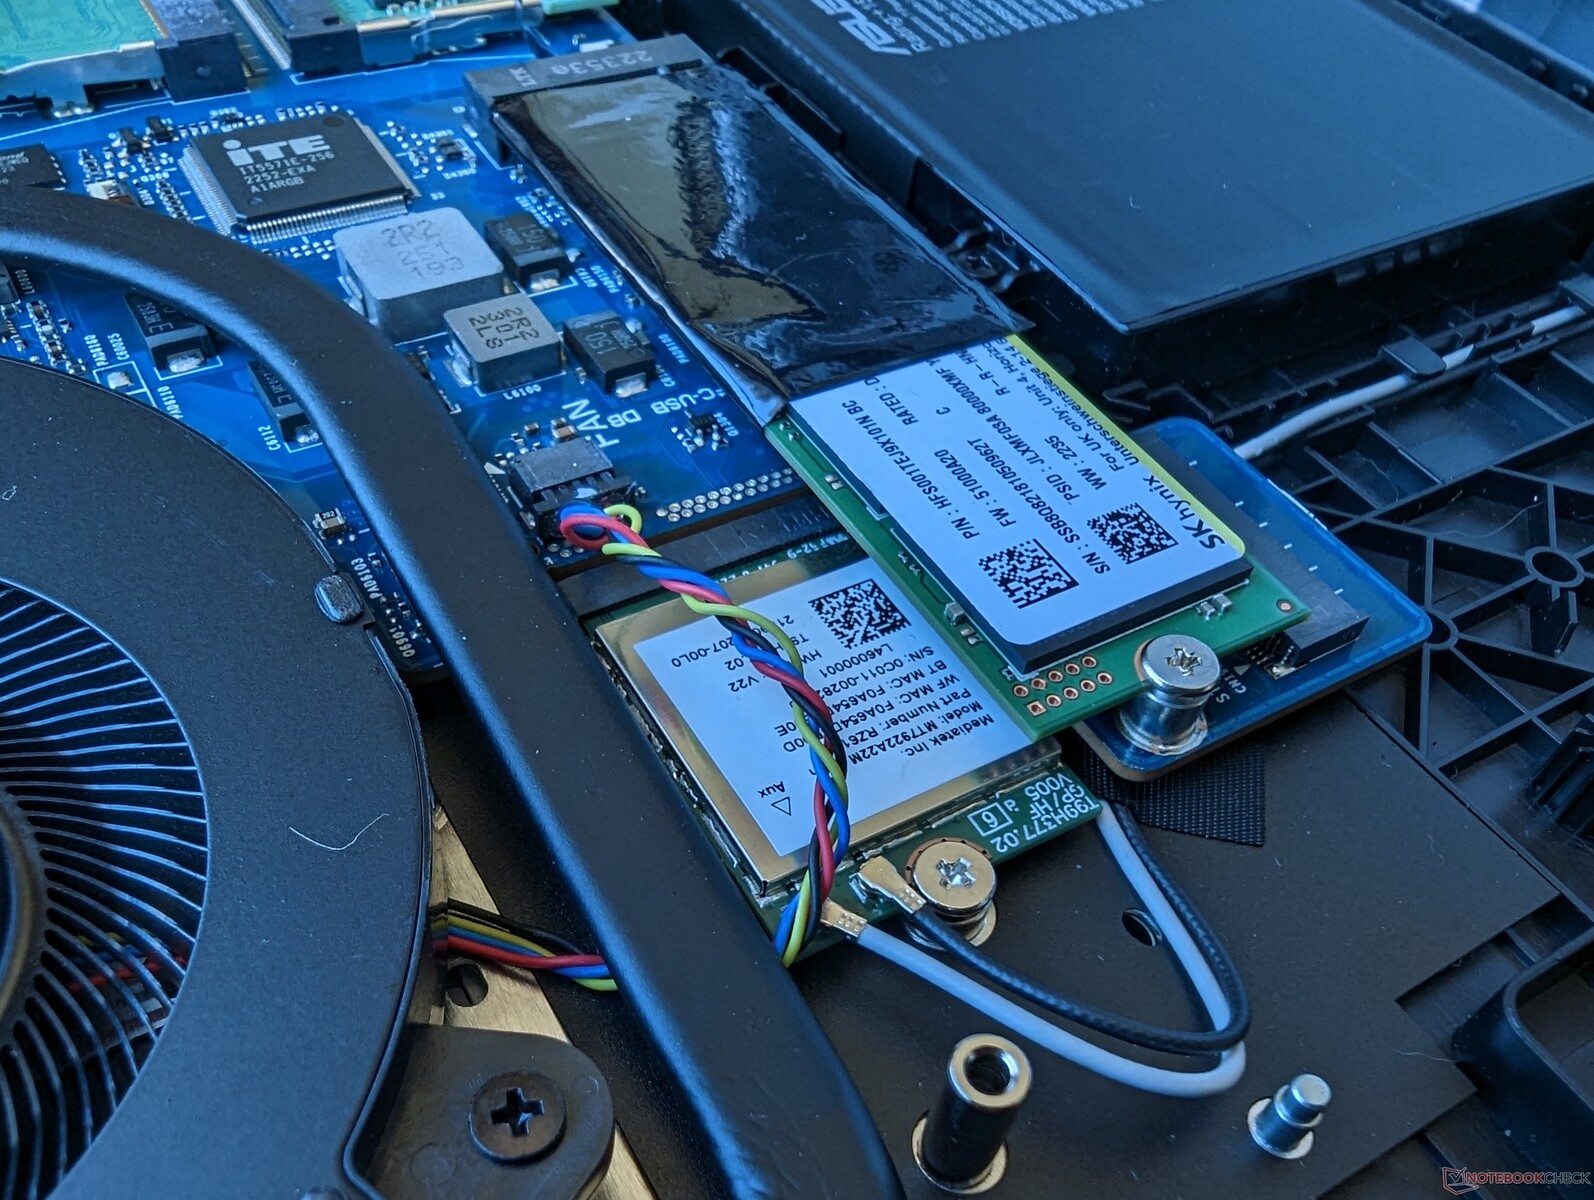
O Wi-Fi 6E é fornecido por um MediaTek MT7922 em vez do mais comum Intel AX211, provavelmente porque este é um projeto focado na AMD-Nvidia. No entanto, as taxas de transferência e o desempenho são estáveis e confiáveis quando emparelhados com nosso roteador de teste Asus AXE11000.
| Networking | |
| iperf3 transmit AXE11000 | |
| Asus ROG Strix G17 G713PI | |
| Eluktronics Mech-17 GP2 | |
| MSI GE78HX 13VH-070US | |
| Alienware m17 R5 (R9 6900HX, RX 6850M XT) | |
| Asus ROG Strix Scar 17 G733PY-XS96 | |
| iperf3 receive AXE11000 | |
| Asus ROG Strix G17 G713PI | |
| Eluktronics Mech-17 GP2 | |
| Asus ROG Strix Scar 17 G733PY-XS96 | |
| MSI GE78HX 13VH-070US | |
| Alienware m17 R5 (R9 6900HX, RX 6850M XT) | |
| iperf3 transmit AXE11000 6GHz | |
| Aorus 17X XES | |
| Asus ROG Strix Scar 17 G733PY-XS96 | |
| MSI GE78HX 13VH-070US | |
| iperf3 receive AXE11000 6GHz | |
| Aorus 17X XES | |
| MSI GE78HX 13VH-070US | |
| Asus ROG Strix Scar 17 G733PY-XS96 | |
Webcam
Embora uma webcam seja melhor do que nenhuma webcam, o Asus foi com o menor denominador comum ao instalar um sensor de 1 MP em vez de um sensor de 2 MP ou 5 MP. Outros laptops para jogos, como o Alienware m17 R1 ou Lâmina Razer têm webcams de resolução mais alta em comparação. O IR não é suportado no Asus.


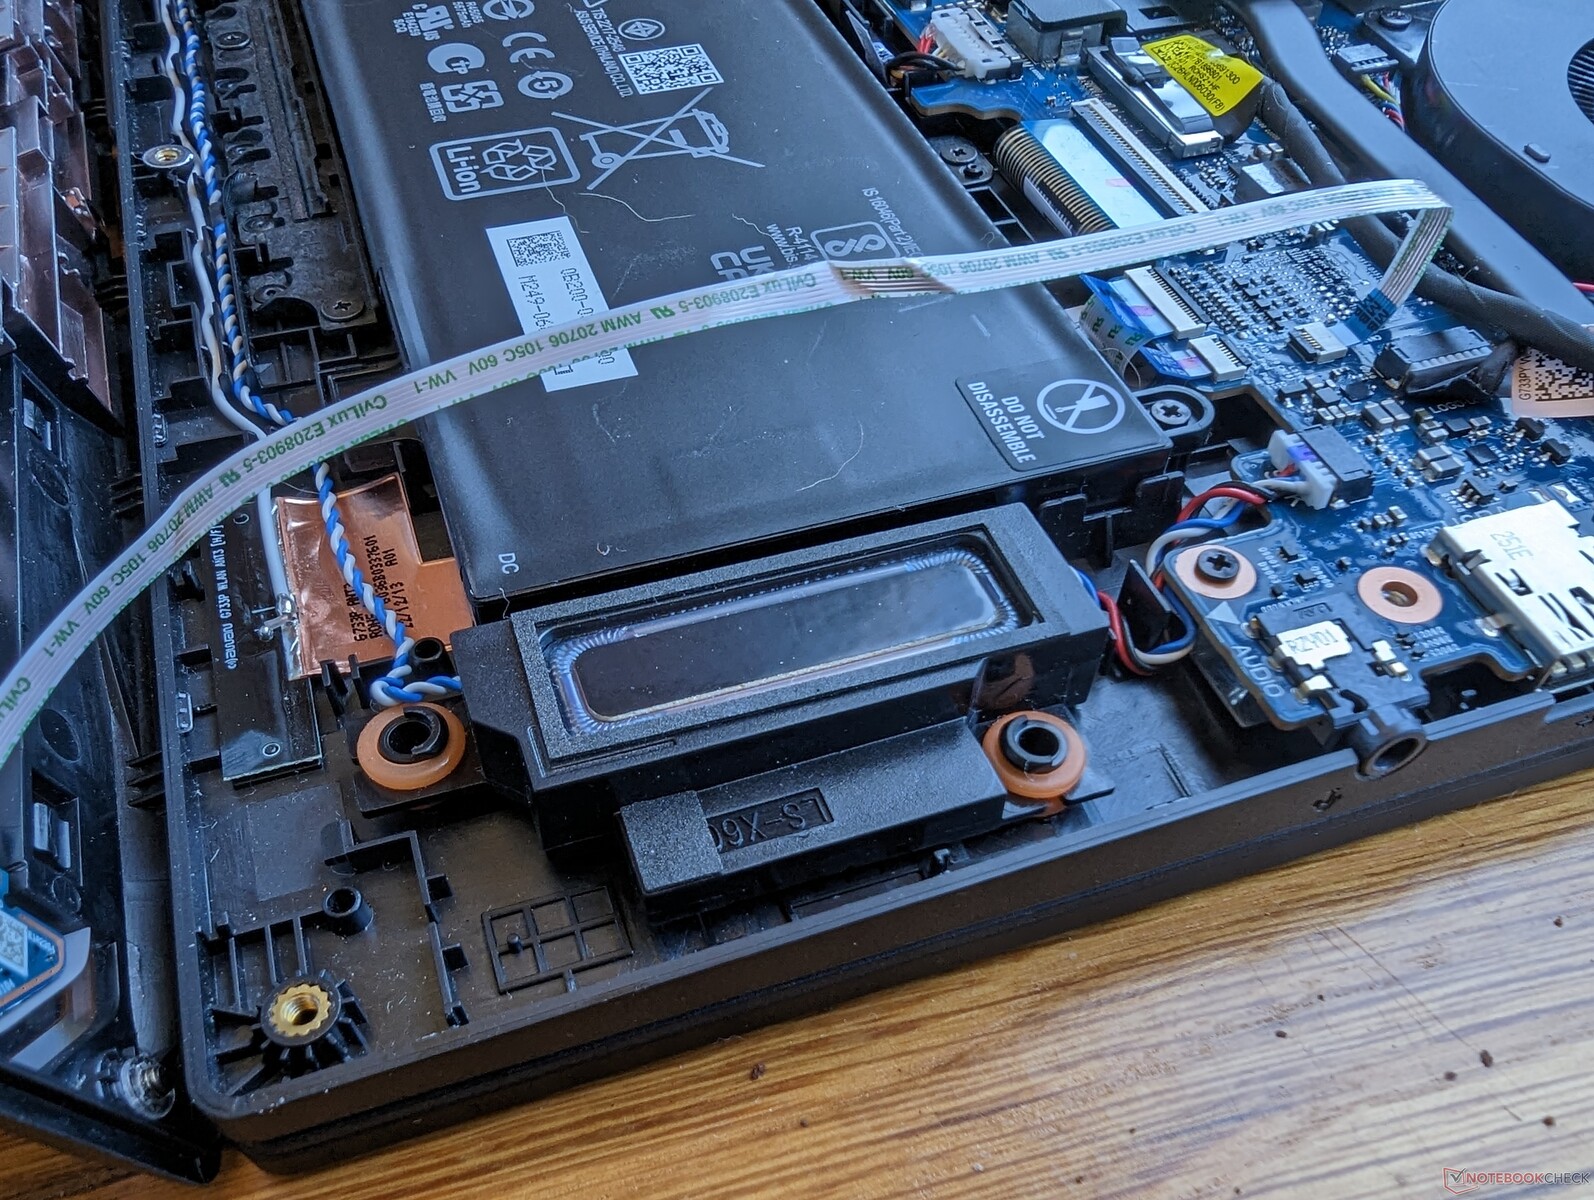
Manutenção
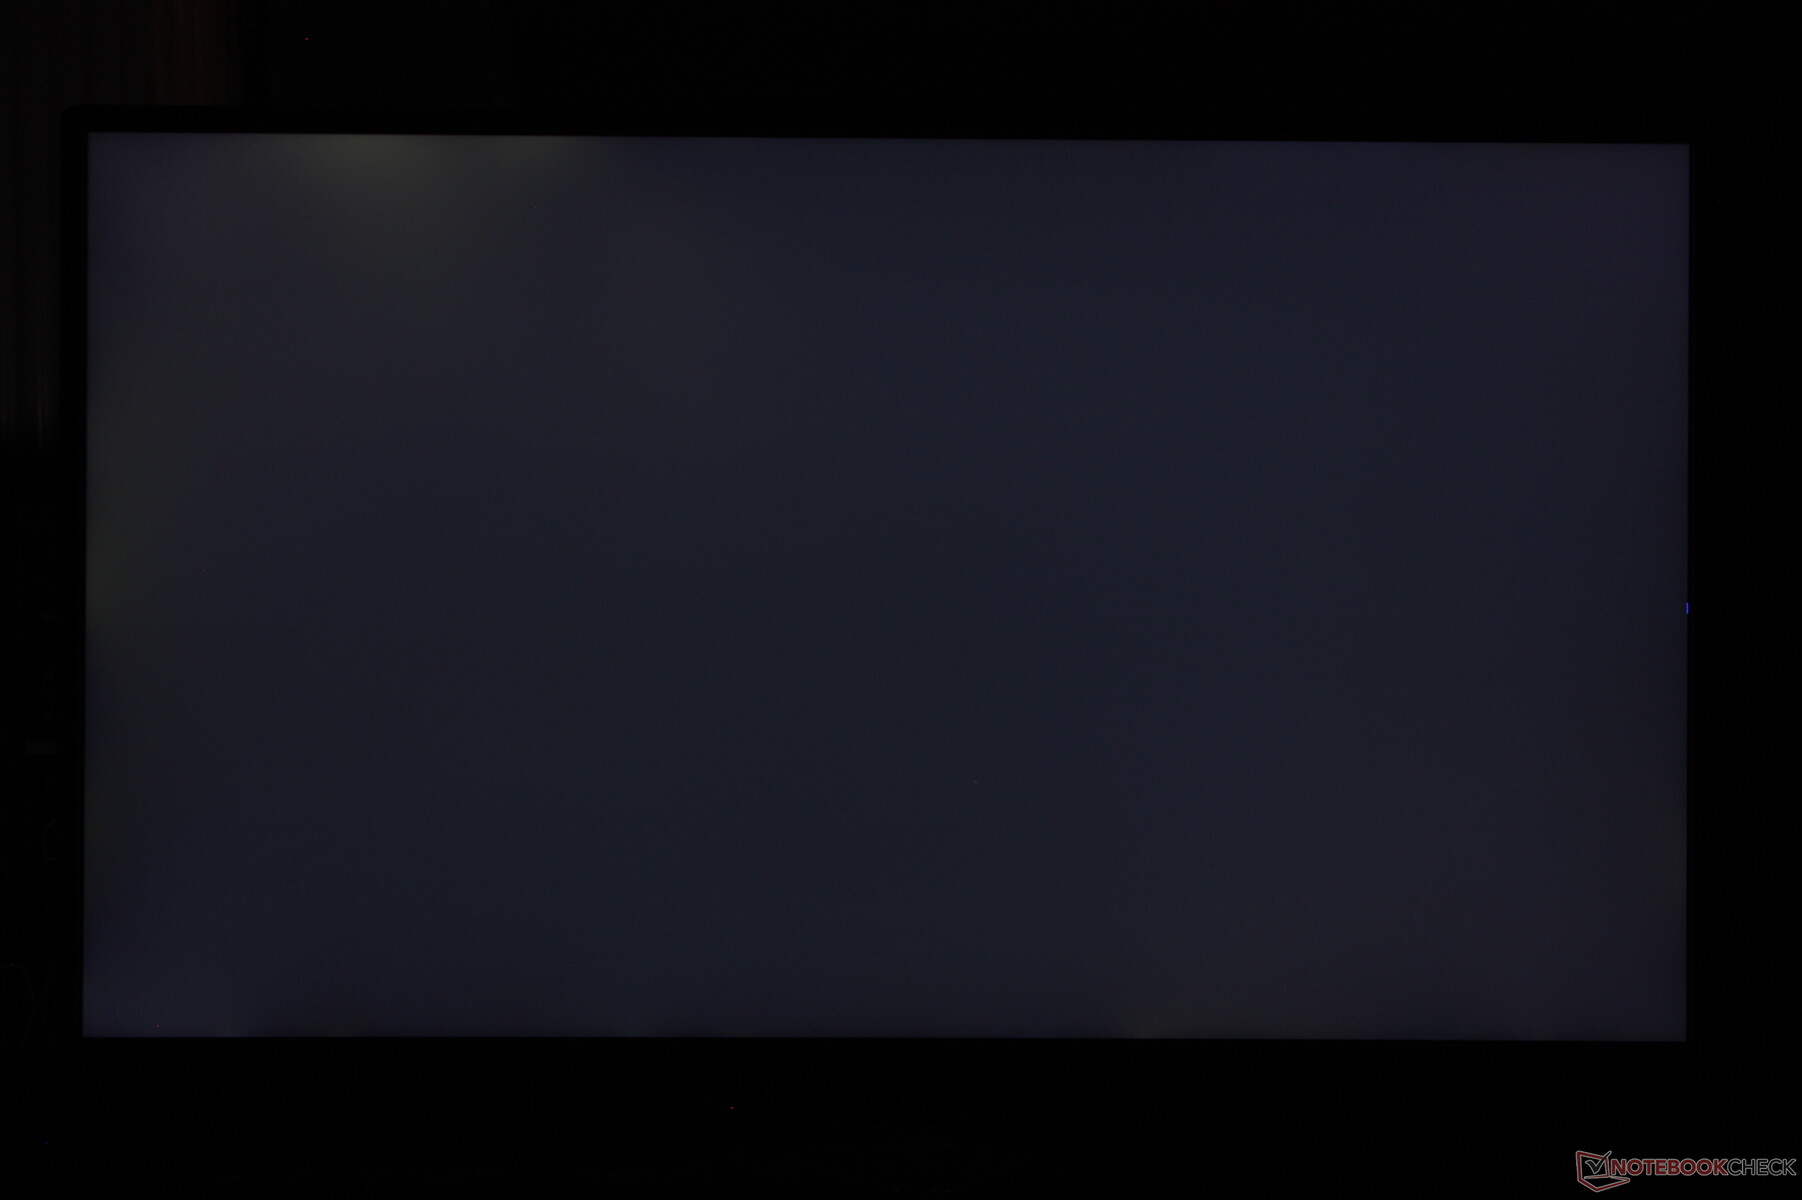
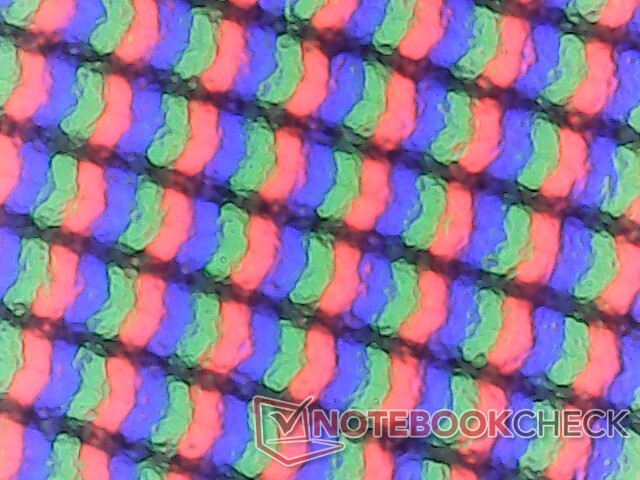
Mostrador - 1440p Sweet Spot
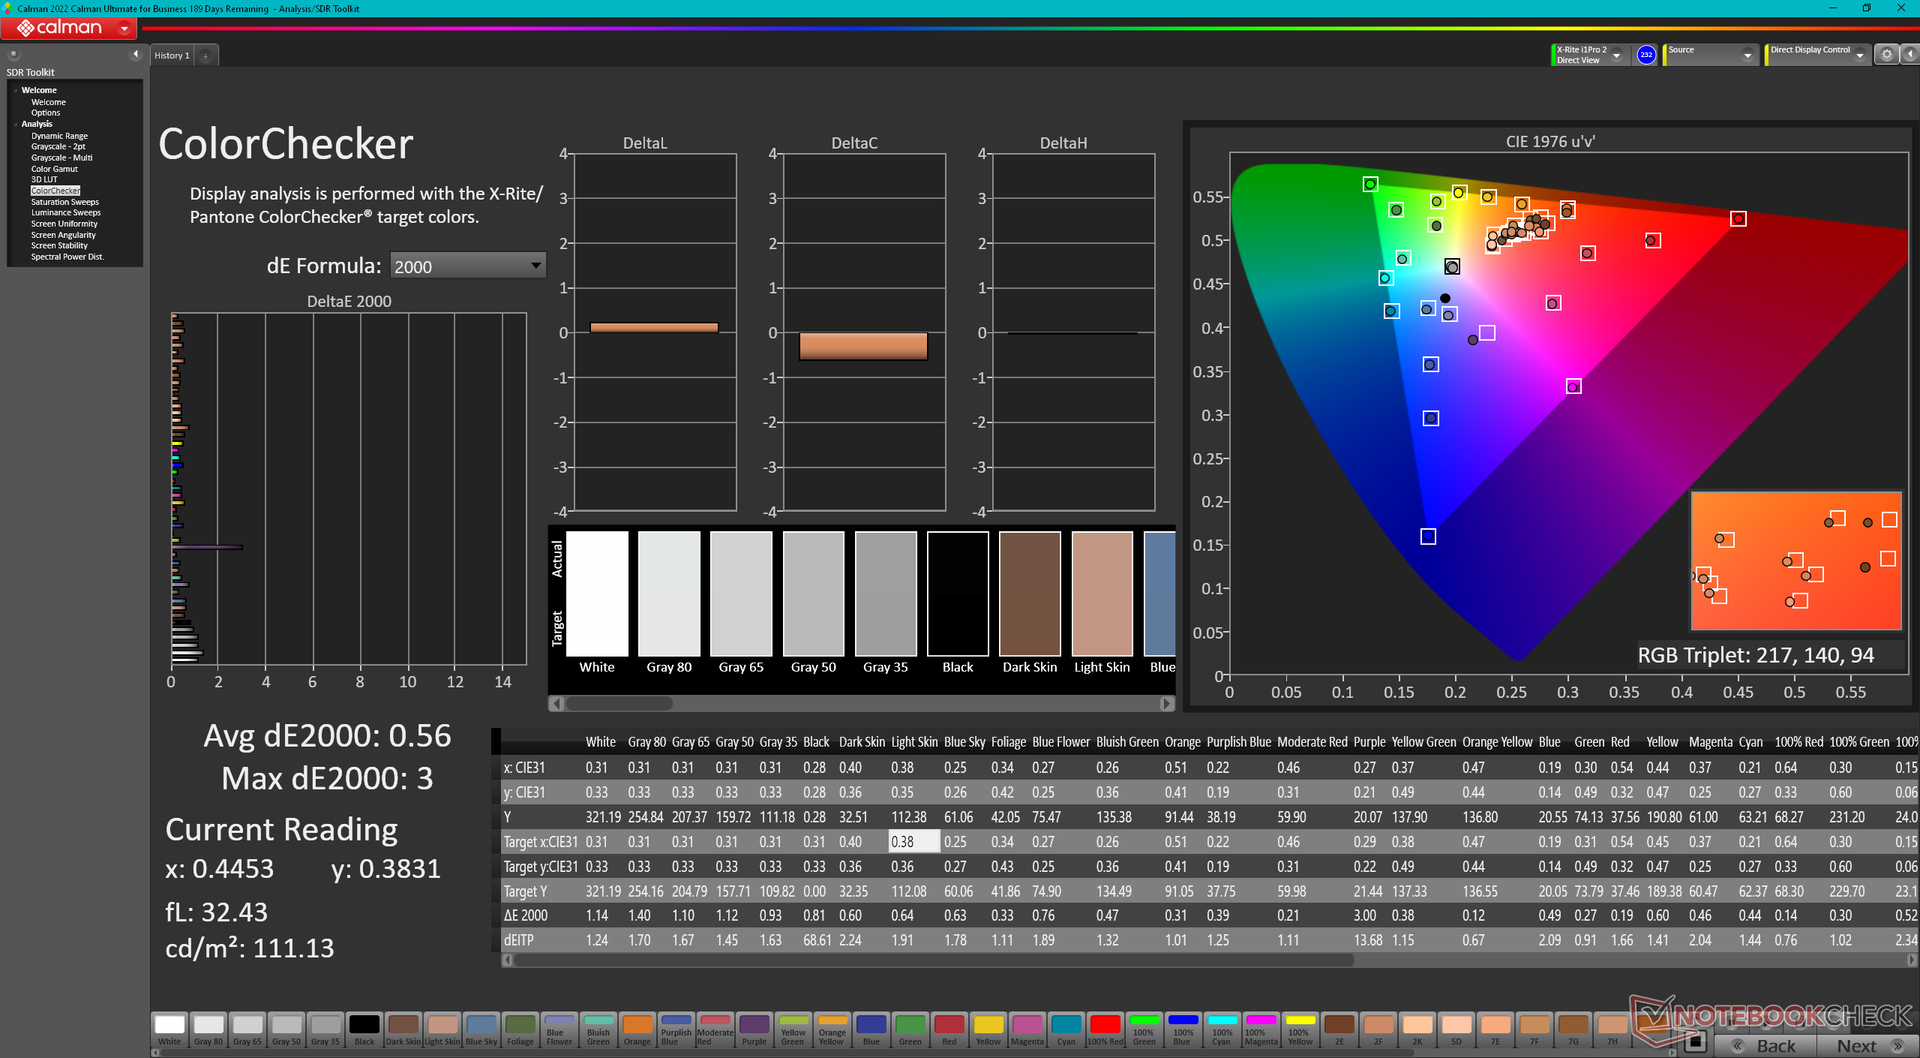
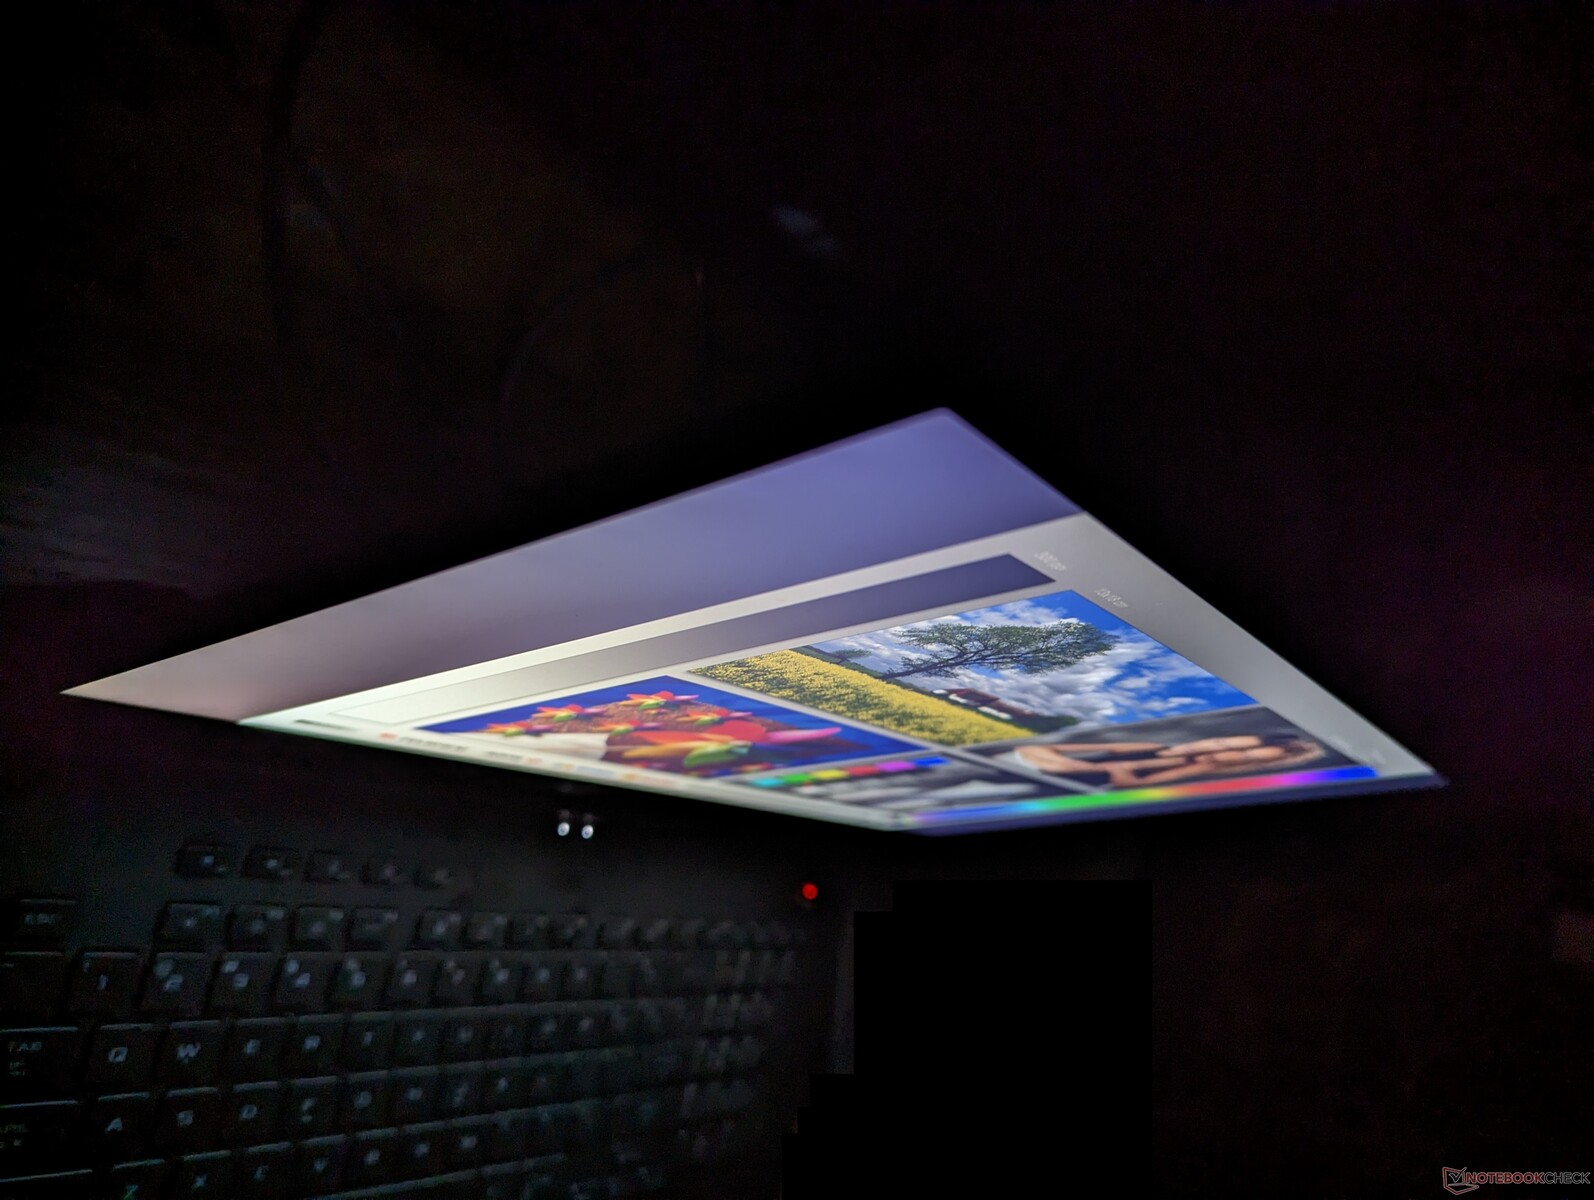
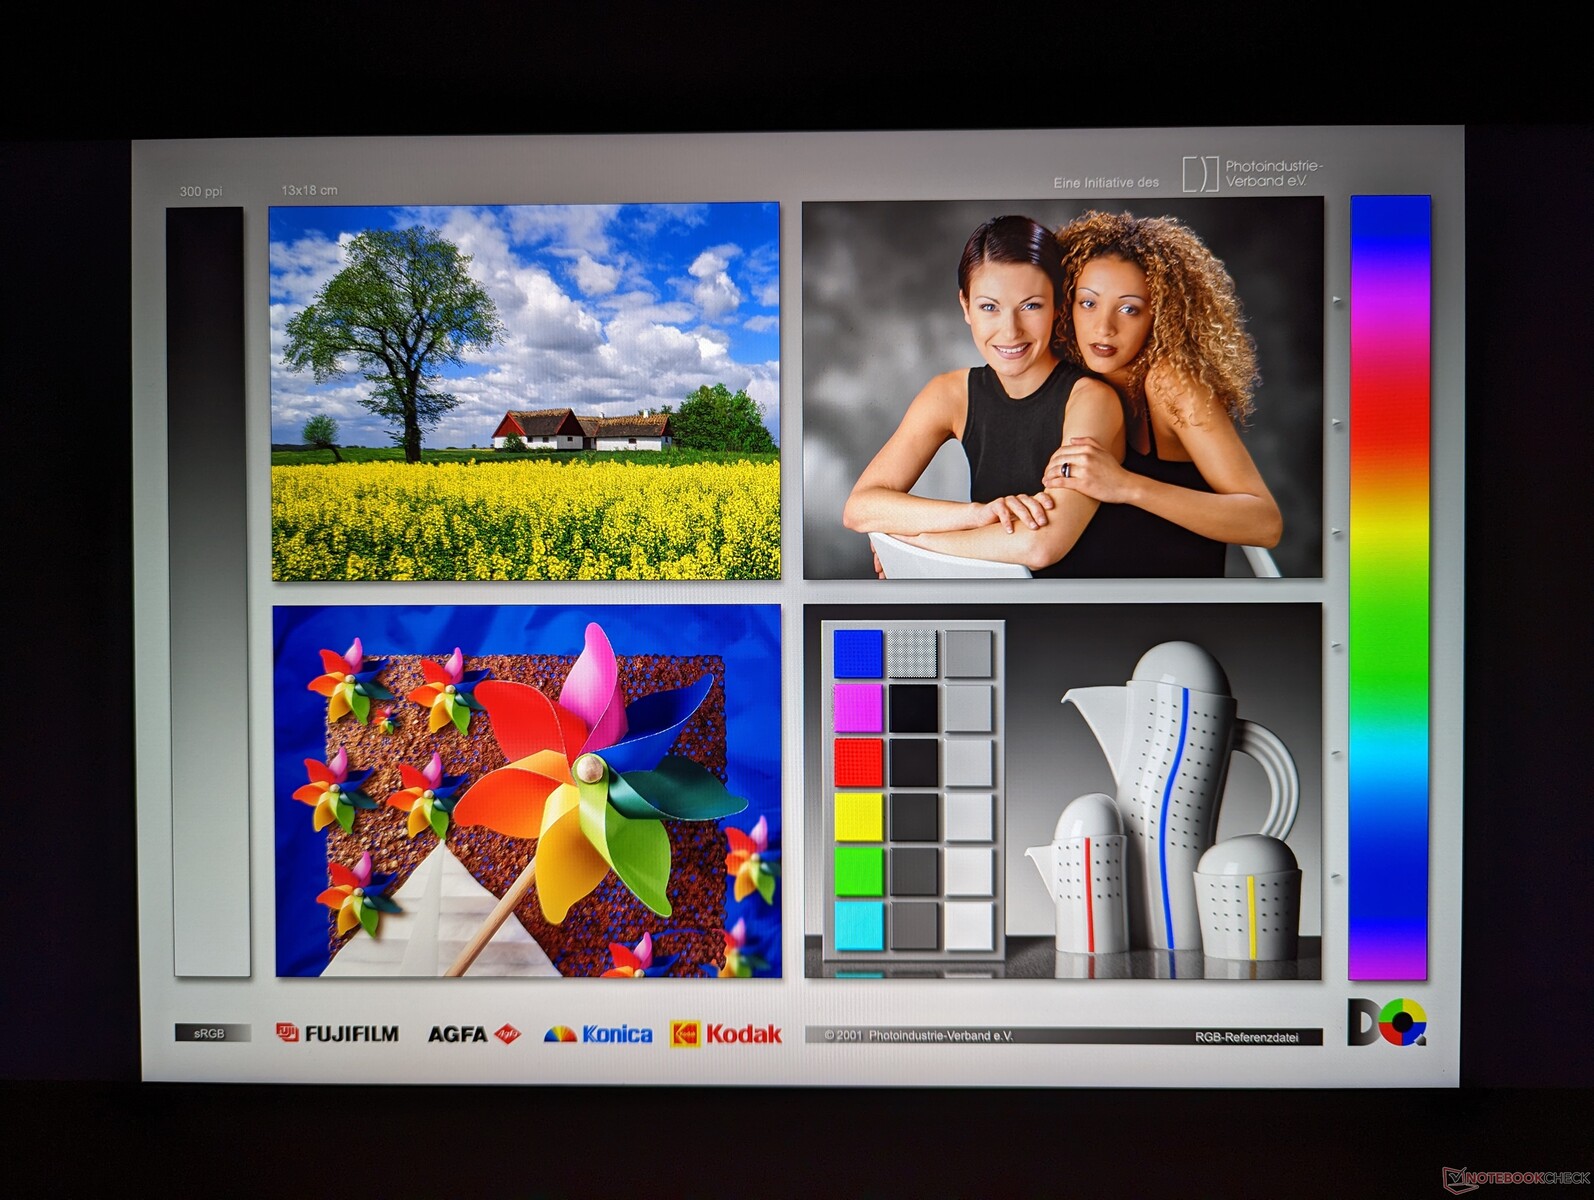
O modelo 2023 utiliza o mesmo painel IPS BOE NE173QHM-NZ2 de 240 Hz que o modelo 2022. Nossas medidas abaixo são, portanto, quase idênticas de ano para ano. Isto não é necessariamente uma coisa ruim, pois o painel oferece tempos de resposta muito rápidos, cores DCI-P3 completas e uma relação de contraste decente para ser adequado tanto para edição gráfica quanto para jogos. Os usuários que procuram opções 4K ou OLED, no entanto, estão sem sorte no momento.
| |||||||||||||||||||||||||
iluminação: 86 %
iluminação com acumulador: 322.5 cd/m²
Contraste: 1112:1 (Preto: 0.29 cd/m²)
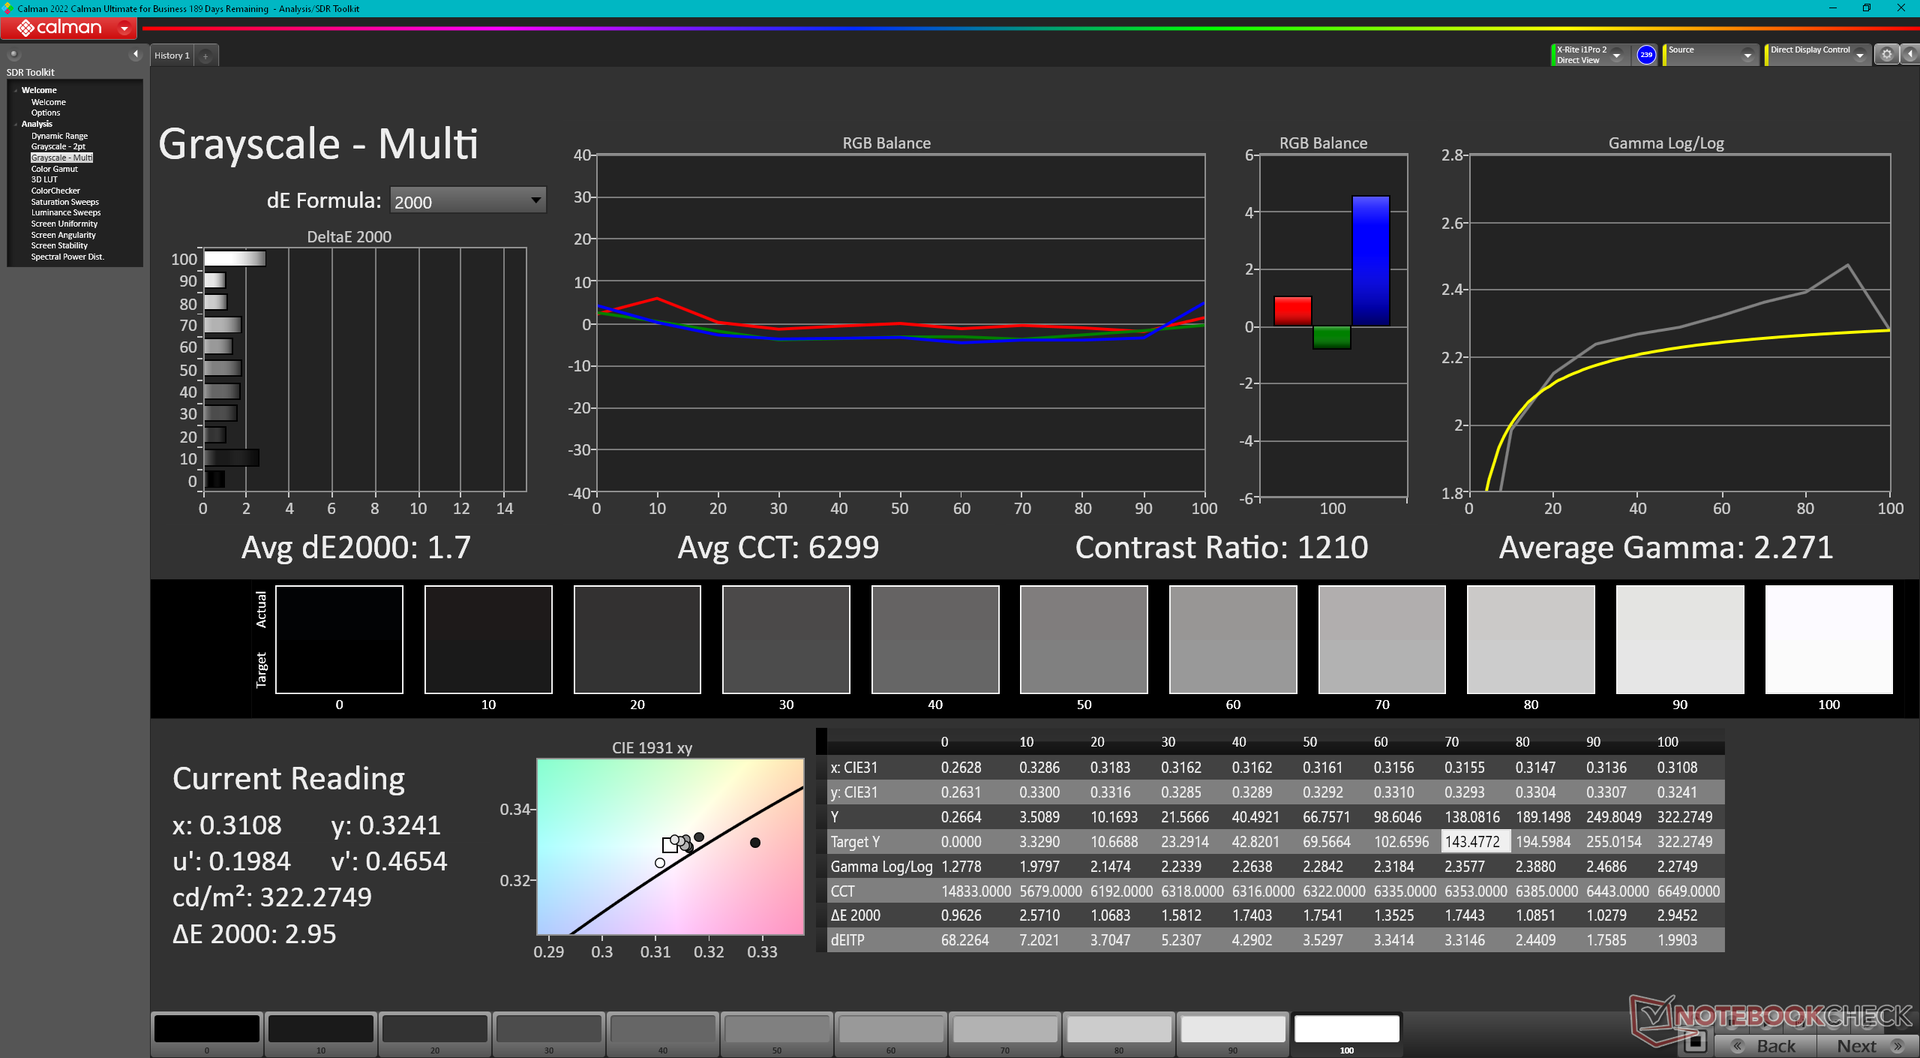
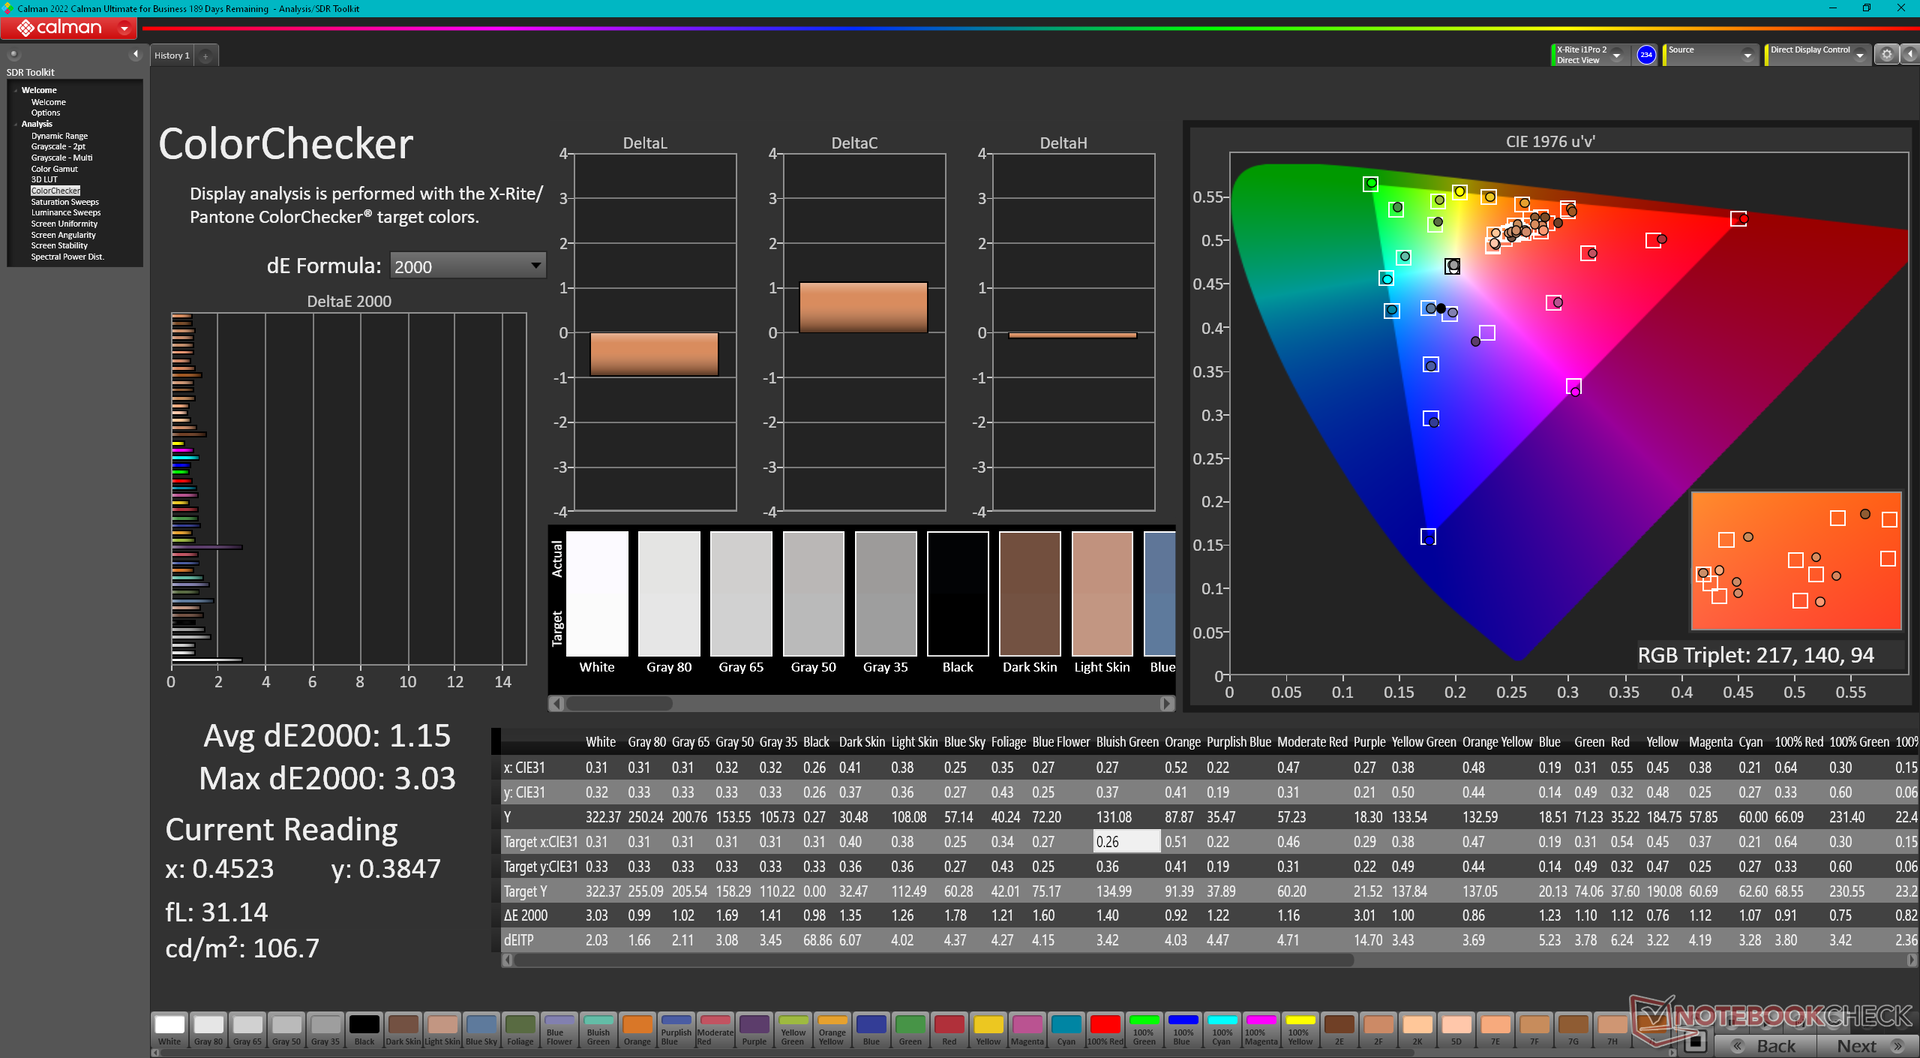
ΔE ColorChecker Calman: 1.15 | ∀{0.5-29.43 Ø4.71}
calibrated: 0.56
ΔE Greyscale Calman: 1.7 | ∀{0.09-98 Ø4.96}
85.6% AdobeRGB 1998 (Argyll 3D)
100% sRGB (Argyll 3D)
98% Display P3 (Argyll 3D)
Gamma: 2.27
CCT: 6299 K
| Asus ROG Strix Scar 17 G733PY-XS96 NE173QHM-NZ2, IPS, 2560x1440, 17.3" | Asus ROG Strix Scar 17 SE G733CX-LL014W NE173QHM-NZ2, IPS, 2560x1440, 17.3" | MSI GE78HX 13VH-070US AU Optronics B170QAN01.2, IPS, 2560x1600, 17" | Eluktronics Mech-17 GP2 BOE NE170QDM-NZ1, IPS, 2560x1600, 17" | Aorus 17X XES Sharp SHP1563, IPS, 1920x1080, 17.3" | Alienware m17 R5 (R9 6900HX, RX 6850M XT) AU Optronics AUODBA3, IPS, 3840x2160, 17" | |
|---|---|---|---|---|---|---|
| Display | -1% | 0% | -16% | -15% | 1% | |
| Display P3 Coverage (%) | 98 | 97.1 -1% | 97.6 0% | 69.1 -29% | 70.1 -28% | 97.2 -1% |
| sRGB Coverage (%) | 100 | 99.9 0% | 99.9 0% | 99.7 0% | 99.9 0% | 99.6 0% |
| AdobeRGB 1998 Coverage (%) | 85.6 | 84.8 -1% | 86.5 1% | 69.8 -18% | 71.9 -16% | 88.4 3% |
| Response Times | 10% | 38% | -38% | 47% | -84% | |
| Response Time Grey 50% / Grey 80% * (ms) | 6.2 ? | 5.7 ? 8% | 4.2 ? 32% | 12 ? -94% | 3.4 ? 45% | 16.4 ? -165% |
| Response Time Black / White * (ms) | 11.4 ? | 10.1 ? 11% | 6.4 ? 44% | 9.4 ? 18% | 5.8 ? 49% | 11.6 ? -2% |
| PWM Frequency (Hz) | ||||||
| Screen | 5% | -93% | -20% | -102% | -161% | |
| Brightness middle (cd/m²) | 322.5 | 320 -1% | 398.6 24% | 417.3 29% | 278 -14% | 484 50% |
| Brightness (cd/m²) | 317 | 303 -4% | 384 21% | 387 22% | 273 -14% | 449 42% |
| Brightness Distribution (%) | 86 | 87 1% | 89 3% | 87 1% | 79 -8% | 87 1% |
| Black Level * (cd/m²) | 0.29 | 0.3 -3% | 0.46 -59% | 0.42 -45% | 0.26 10% | 0.55 -90% |
| Contrast (:1) | 1112 | 1067 -4% | 867 -22% | 994 -11% | 1069 -4% | 880 -21% |
| Colorchecker dE 2000 * | 1.15 | 1.1 4% | 4.05 -252% | 2.14 -86% | 3.96 -244% | 4.8 -317% |
| Colorchecker dE 2000 max. * | 3.03 | 2.7 11% | 8.68 -186% | 4.09 -35% | 10.78 -256% | 7.48 -147% |
| Colorchecker dE 2000 calibrated * | 0.56 | 1.02 -82% | 0.42 25% | 1.07 -91% | 4.74 -746% | |
| Greyscale dE 2000 * | 1.7 | 1.1 35% | 6.5 -282% | 3.1 -82% | 6.8 -300% | 5.5 -224% |
| Gamma | 2.27 97% | 2.13 103% | 2.11 104% | 2.19 100% | 2.224 99% | 2.42 91% |
| CCT | 6299 103% | 6599 98% | 7518 86% | 6040 108% | 7651 85% | 6148 106% |
| Média Total (Programa/Configurações) | 5% /
4% | -18% /
-54% | -25% /
-22% | -23% /
-62% | -81% /
-116% |
* ... menor é melhor
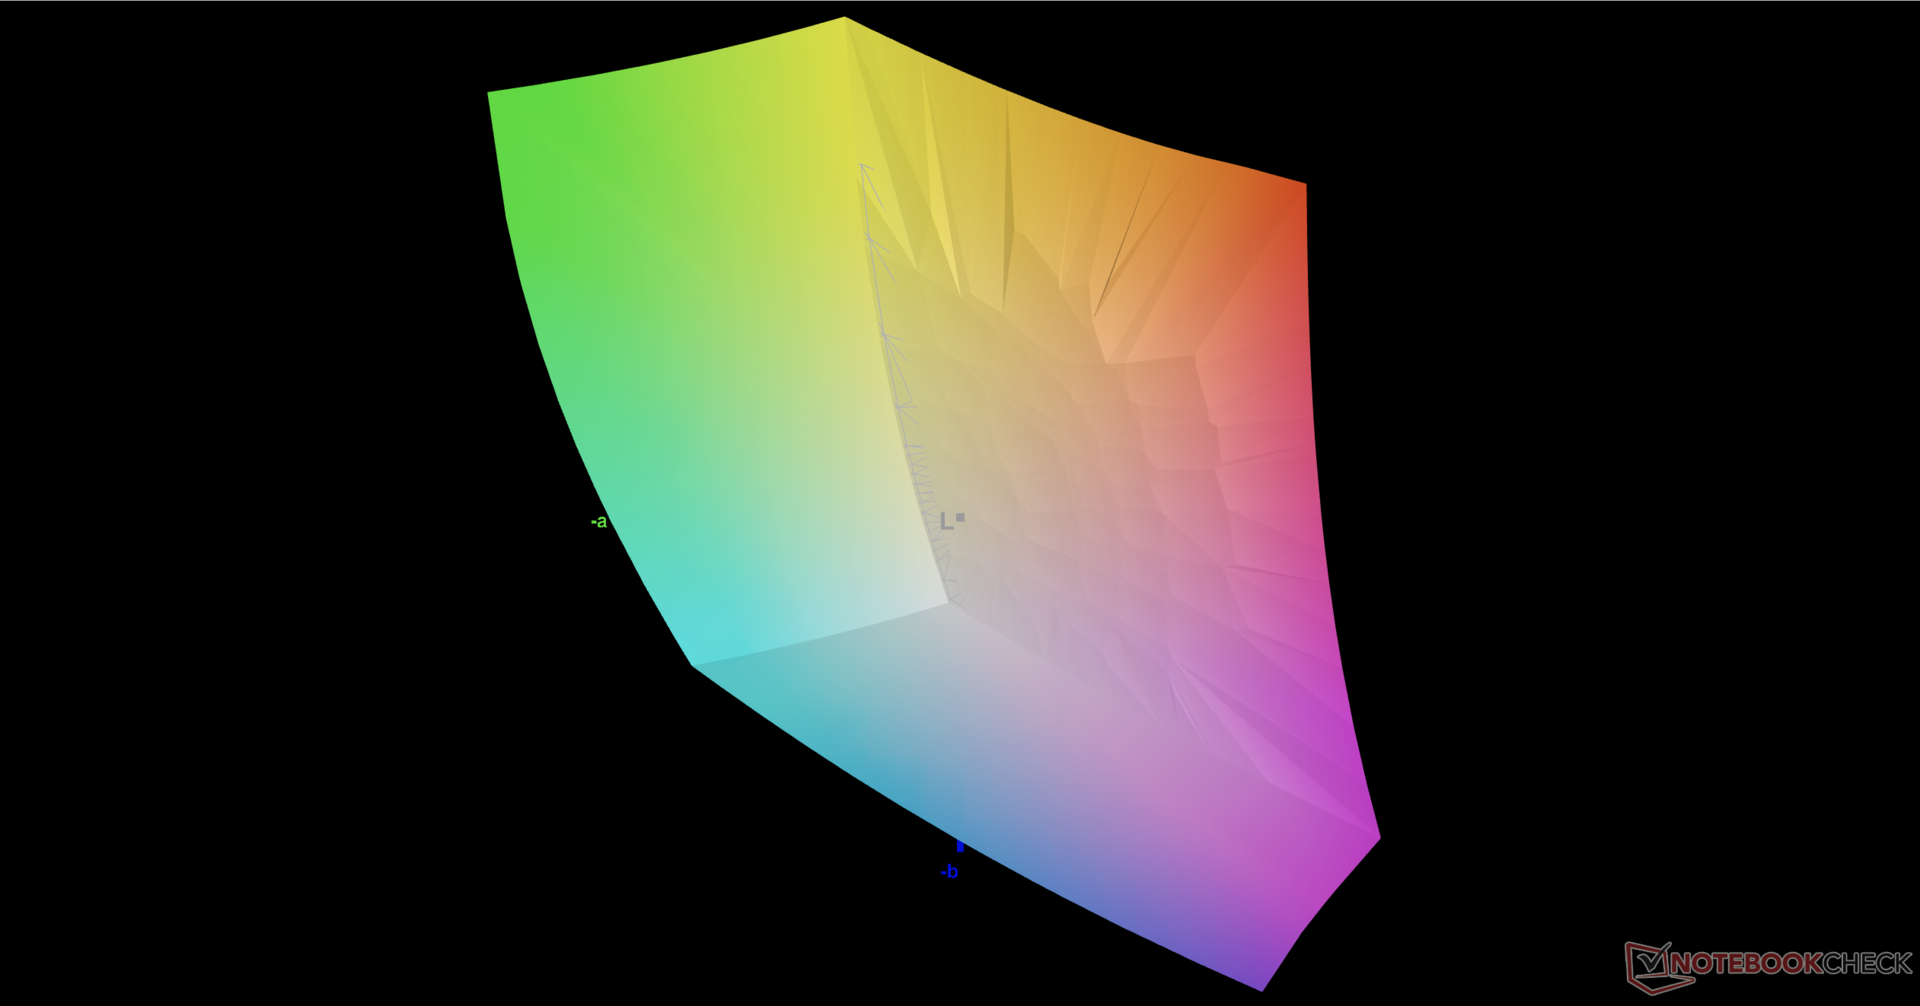
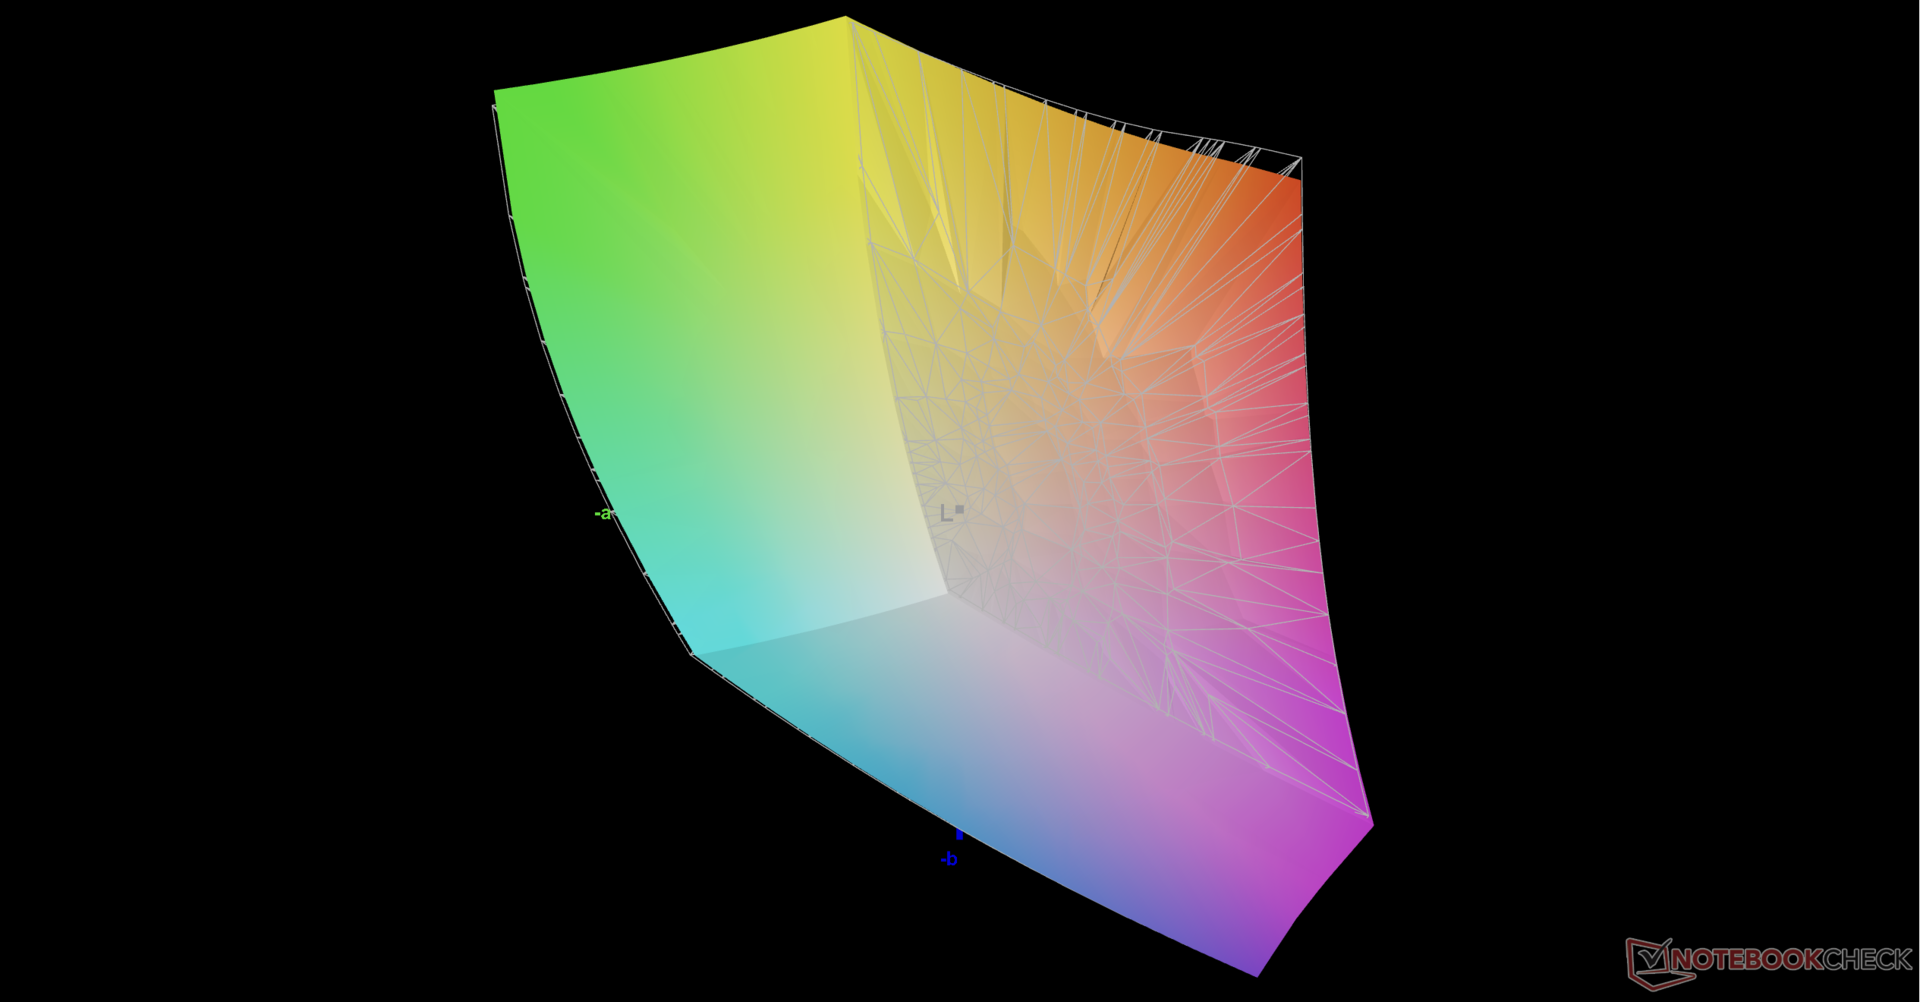
O display vem pré-calibrado fora da caixa com valores médios muito baixos de escala de cinza e deltaE de cor de apenas 1,7 e 1,15, respectivamente. Portanto, não é necessária uma calibração do usuário final.

Exibir tempos de resposta
| ↔ Tempo de resposta preto para branco | ||
|---|---|---|
| 11.4 ms ... ascensão ↗ e queda ↘ combinadas | ↗ 5.9 ms ascensão | 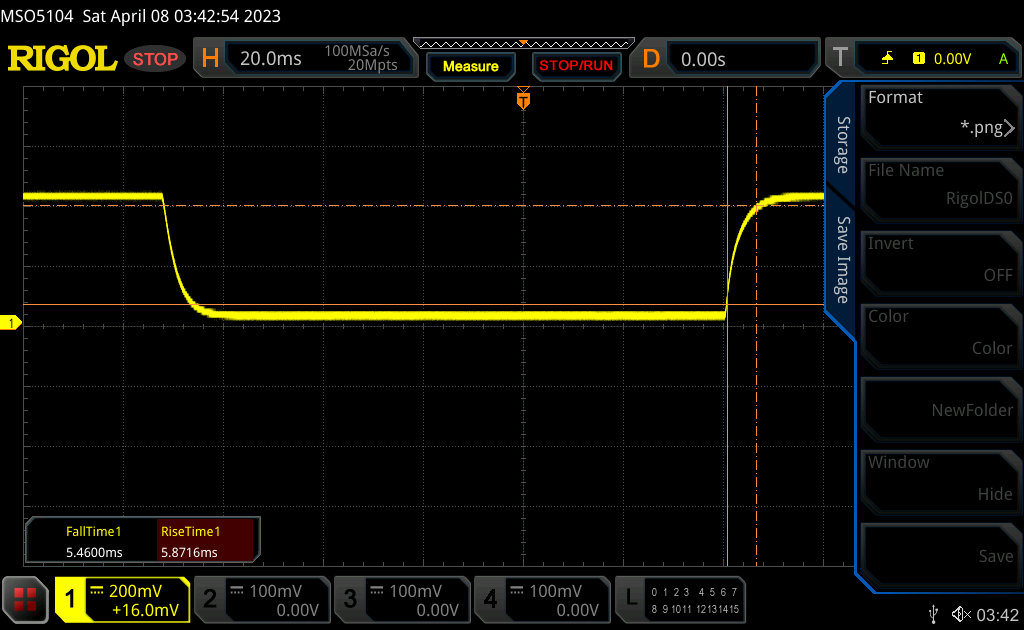 |
| ↘ 5.5 ms queda | ||
| A tela mostra boas taxas de resposta em nossos testes, mas pode ser muito lenta para jogadores competitivos. Em comparação, todos os dispositivos testados variam de 0.1 (mínimo) a 240 (máximo) ms. » 31 % de todos os dispositivos são melhores. Isso significa que o tempo de resposta medido é melhor que a média de todos os dispositivos testados (19.8 ms). | ||
| ↔ Tempo de resposta 50% cinza a 80% cinza | ||
| 6.2 ms ... ascensão ↗ e queda ↘ combinadas | ↗ 2.8 ms ascensão | 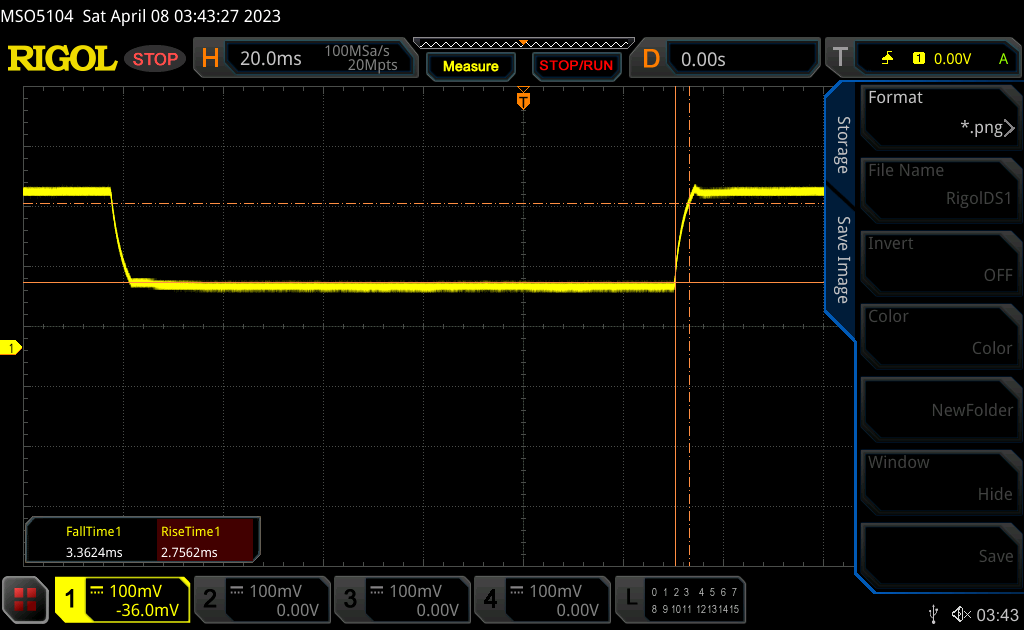 |
| ↘ 3.4 ms queda | ||
| A tela mostra taxas de resposta muito rápidas em nossos testes e deve ser muito adequada para jogos em ritmo acelerado. Em comparação, todos os dispositivos testados variam de 0.165 (mínimo) a 636 (máximo) ms. » 19 % de todos os dispositivos são melhores. Isso significa que o tempo de resposta medido é melhor que a média de todos os dispositivos testados (30.9 ms). | ||
Cintilação da tela / PWM (modulação por largura de pulso)
| Tela tremeluzindo / PWM não detectado | 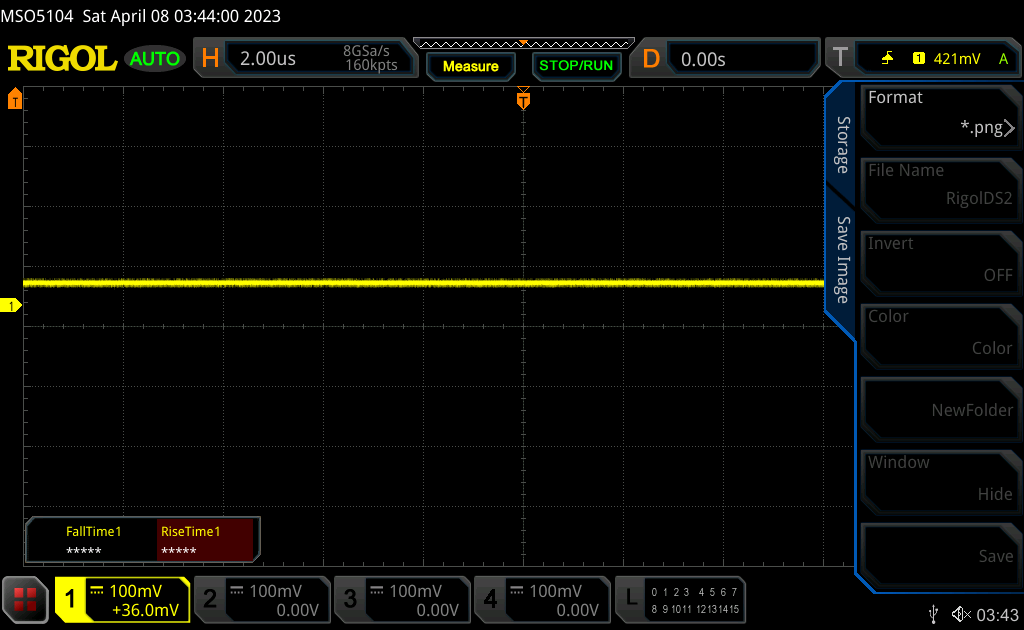 | ||
[pwm_comparison] Em comparação: 52 % de todos os dispositivos testados não usam PWM para escurecer a tela. Se PWM foi detectado, uma média de 7744 (mínimo: 5 - máximo: 343500) Hz foi medida. | |||
Desempenho - Rising Ryzen
Condições de teste
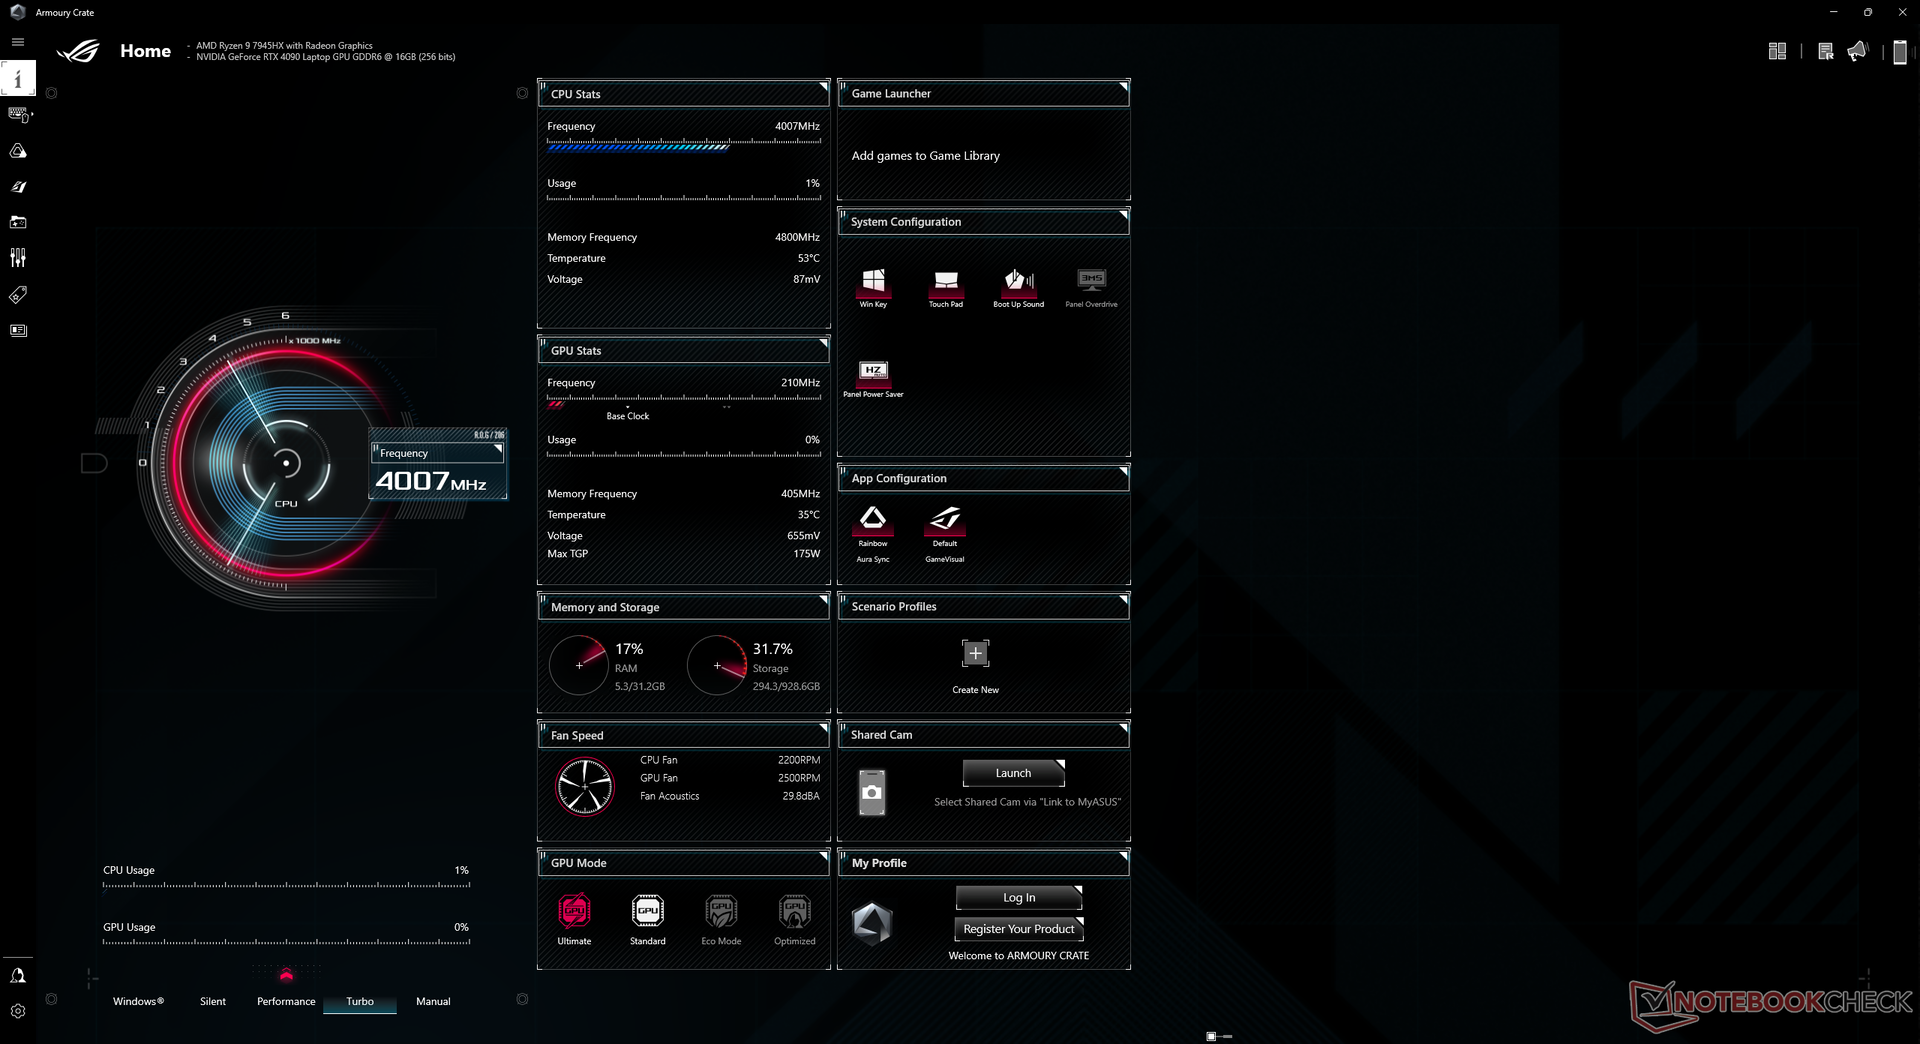
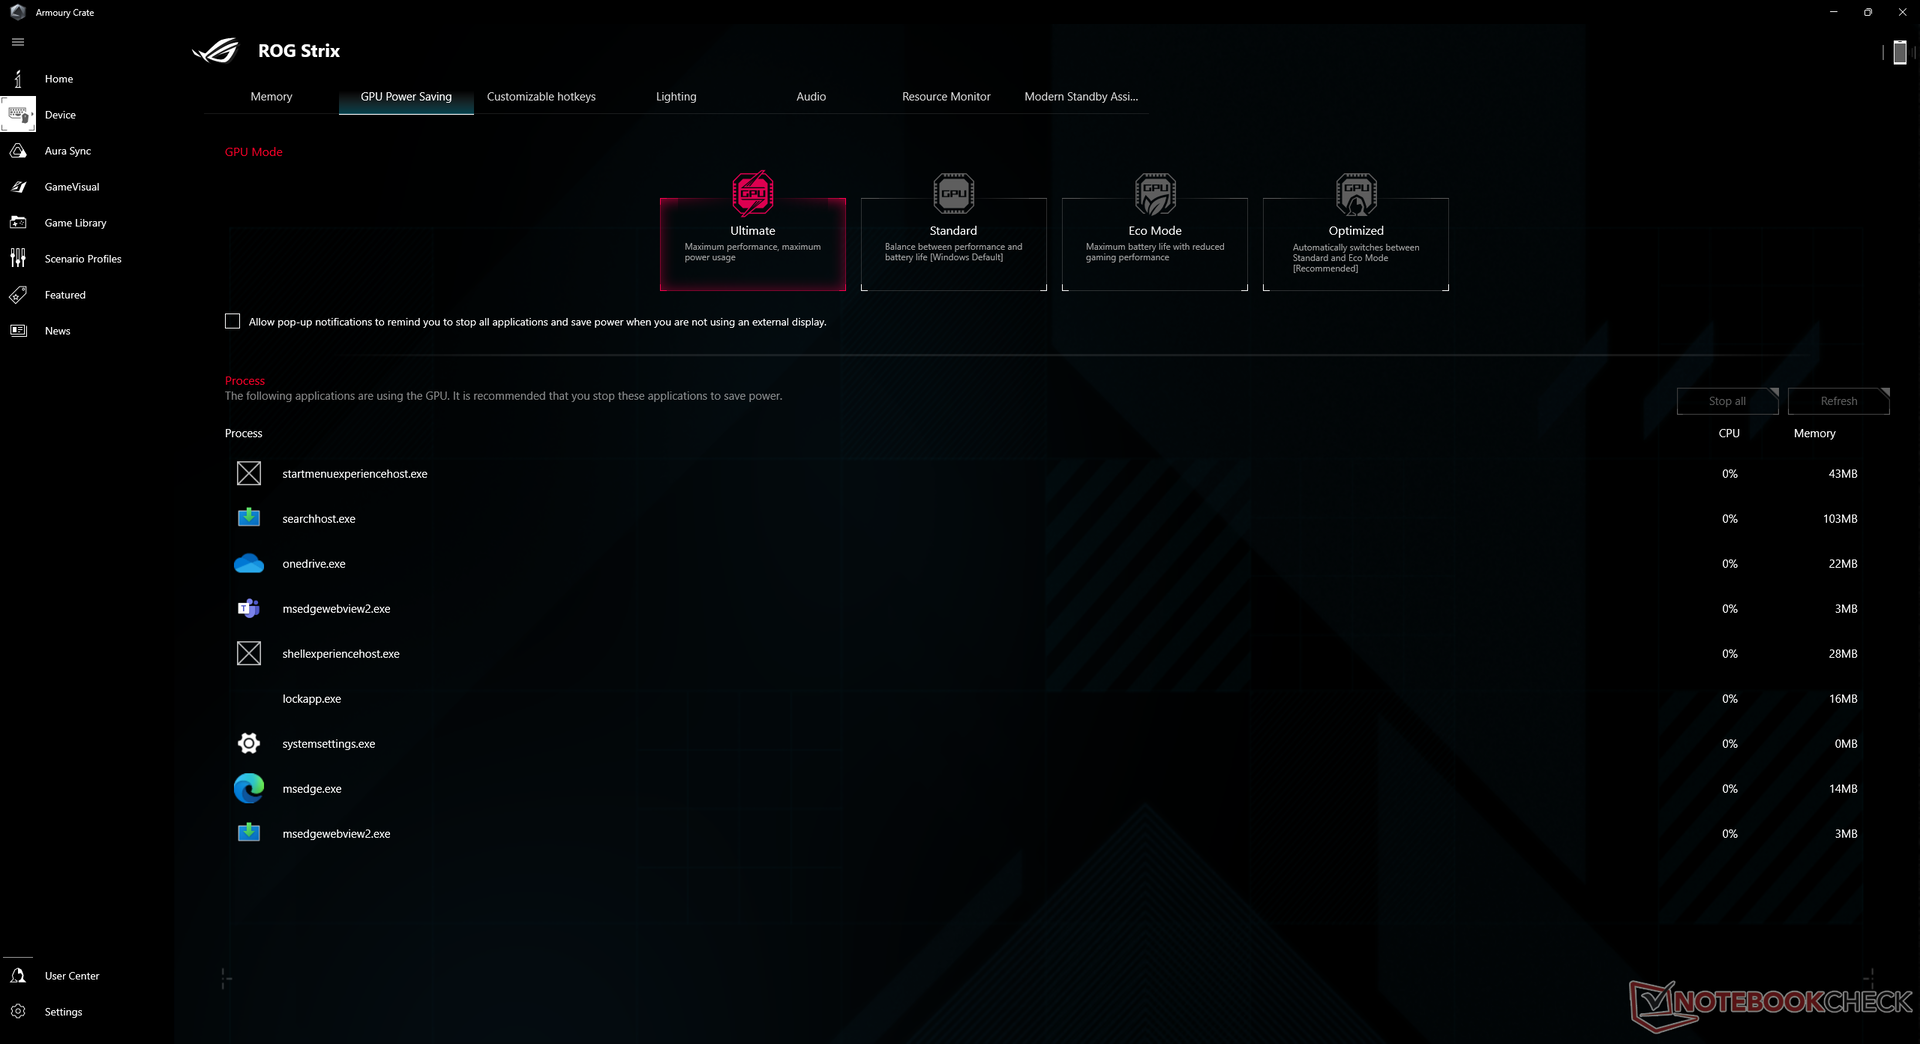
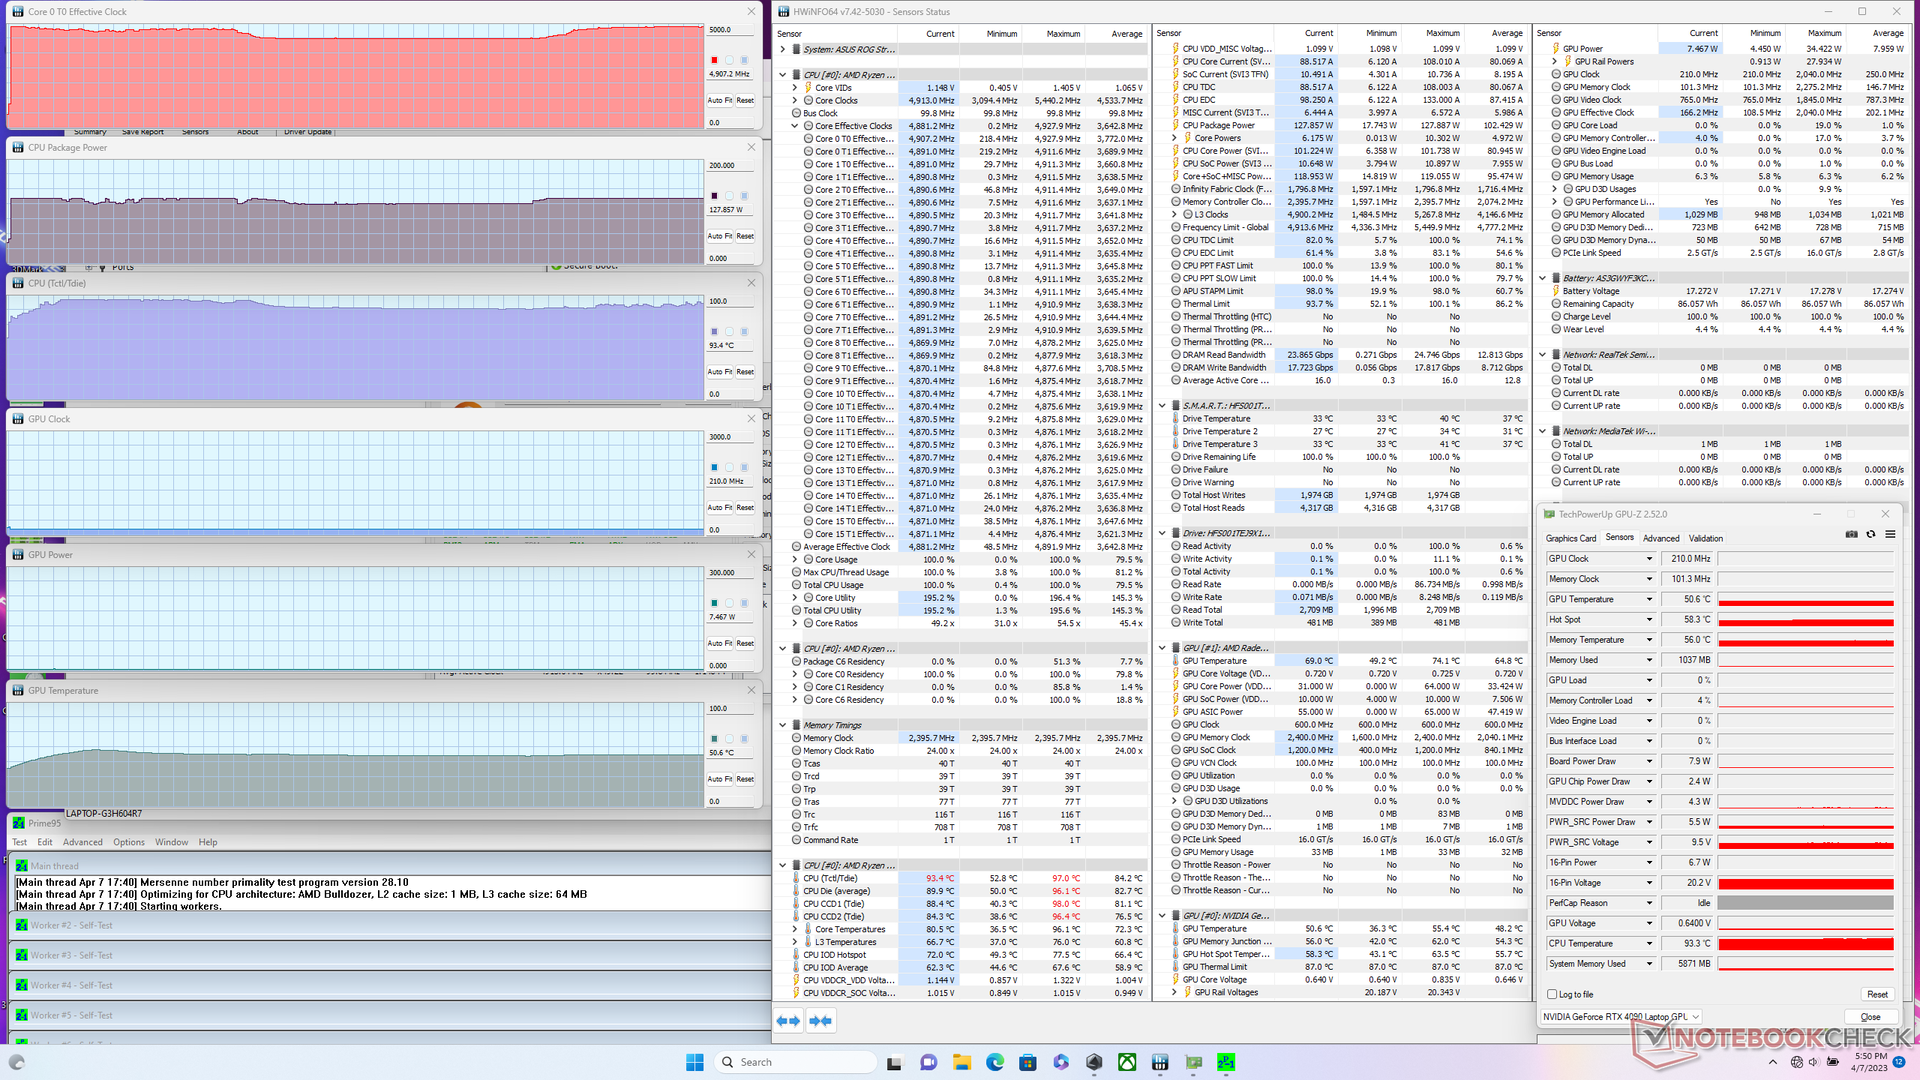
Configuramos nossa unidade para modo Turbo e modo GPU discreto via Asus Armoury Crate antes de executar quaisquer benchmarks abaixo. Os proprietários são encorajados a se familiarizar com o Armoury Crate, pois ele é o centro de controle dos modos de potência, MUX, Asus Aura, e outras características e atualizações específicas do modelo.
Vale a pena notar que tivemos alguns problemas em nossa unidade de teste. Ao alternar entre os modos Optimus e dGPU, o sistema às vezes não conseguia carregar ao reiniciar. Uma reinicialização difícil seria então necessária.
Processador
O desempenho dos processadores é um dos mais rápidos disponíveis em qualquer laptop, conforme detalhado em nossa revisão do Ryzen 9 7945HX. No entanto, ele ainda fica atrás dos concorrentes.Núcleo i9-13950HX ou i9-13900HX apenas ligeiramente quando se trata de operações com uma única rosca.
Cinebench R15 Multi Loop
Cinebench R23: Multi Core | Single Core
Cinebench R20: CPU (Multi Core) | CPU (Single Core)
Cinebench R15: CPU Multi 64Bit | CPU Single 64Bit
Blender: v2.79 BMW27 CPU
7-Zip 18.03: 7z b 4 | 7z b 4 -mmt1
Geekbench 5.5: Multi-Core | Single-Core
HWBOT x265 Benchmark v2.2: 4k Preset
LibreOffice : 20 Documents To PDF
R Benchmark 2.5: Overall mean
* ... menor é melhor
AIDA64: FP32 Ray-Trace | FPU Julia | CPU SHA3 | CPU Queen | FPU SinJulia | FPU Mandel | CPU AES | CPU ZLib | FP64 Ray-Trace | CPU PhotoWorxx
| Performance rating | |
| Asus ROG Strix Scar 17 G733PY-XS96 | |
| Média AMD Ryzen 9 7945HX | |
| Asus ROG Strix G17 G713PI | |
| Eluktronics Mech-17 GP2 | |
| MSI GE78HX 13VH-070US | |
| Aorus 17X XES | |
| Alienware m17 R5 (R9 6900HX, RX 6850M XT) | |
| AIDA64 / FP32 Ray-Trace | |
| Asus ROG Strix Scar 17 G733PY-XS96 | |
| Média AMD Ryzen 9 7945HX (50388 - 60169, n=7) | |
| Asus ROG Strix G17 G713PI | |
| MSI GE78HX 13VH-070US | |
| Eluktronics Mech-17 GP2 | |
| Alienware m17 R5 (R9 6900HX, RX 6850M XT) | |
| Aorus 17X XES | |
| AIDA64 / FPU Julia | |
| Asus ROG Strix Scar 17 G733PY-XS96 | |
| Asus ROG Strix G17 G713PI | |
| Média AMD Ryzen 9 7945HX (201874 - 252486, n=7) | |
| MSI GE78HX 13VH-070US | |
| Eluktronics Mech-17 GP2 | |
| Alienware m17 R5 (R9 6900HX, RX 6850M XT) | |
| Aorus 17X XES | |
| AIDA64 / CPU SHA3 | |
| Asus ROG Strix Scar 17 G733PY-XS96 | |
| Média AMD Ryzen 9 7945HX (8525 - 10389, n=7) | |
| Asus ROG Strix G17 G713PI | |
| Eluktronics Mech-17 GP2 | |
| MSI GE78HX 13VH-070US | |
| Aorus 17X XES | |
| Alienware m17 R5 (R9 6900HX, RX 6850M XT) | |
| AIDA64 / CPU Queen | |
| Asus ROG Strix Scar 17 G733PY-XS96 | |
| Média AMD Ryzen 9 7945HX (175041 - 200651, n=7) | |
| Asus ROG Strix G17 G713PI | |
| Eluktronics Mech-17 GP2 | |
| MSI GE78HX 13VH-070US | |
| Alienware m17 R5 (R9 6900HX, RX 6850M XT) | |
| Aorus 17X XES | |
| AIDA64 / FPU SinJulia | |
| Asus ROG Strix Scar 17 G733PY-XS96 | |
| Média AMD Ryzen 9 7945HX (28794 - 32988, n=7) | |
| Asus ROG Strix G17 G713PI | |
| Eluktronics Mech-17 GP2 | |
| MSI GE78HX 13VH-070US | |
| Alienware m17 R5 (R9 6900HX, RX 6850M XT) | |
| Aorus 17X XES | |
| AIDA64 / FPU Mandel | |
| Asus ROG Strix Scar 17 G733PY-XS96 | |
| Média AMD Ryzen 9 7945HX (105740 - 134044, n=7) | |
| Asus ROG Strix G17 G713PI | |
| MSI GE78HX 13VH-070US | |
| Eluktronics Mech-17 GP2 | |
| Alienware m17 R5 (R9 6900HX, RX 6850M XT) | |
| Aorus 17X XES | |
| AIDA64 / CPU ZLib | |
| Asus ROG Strix Scar 17 G733PY-XS96 | |
| Média AMD Ryzen 9 7945HX (2022 - 2409, n=7) | |
| Asus ROG Strix G17 G713PI | |
| MSI GE78HX 13VH-070US | |
| Eluktronics Mech-17 GP2 | |
| Aorus 17X XES | |
| Alienware m17 R5 (R9 6900HX, RX 6850M XT) | |
| AIDA64 / FP64 Ray-Trace | |
| Asus ROG Strix Scar 17 G733PY-XS96 | |
| Média AMD Ryzen 9 7945HX (26875 - 31796, n=7) | |
| Asus ROG Strix G17 G713PI | |
| MSI GE78HX 13VH-070US | |
| Eluktronics Mech-17 GP2 | |
| Alienware m17 R5 (R9 6900HX, RX 6850M XT) | |
| Aorus 17X XES | |
| AIDA64 / CPU PhotoWorxx | |
| MSI GE78HX 13VH-070US | |
| Eluktronics Mech-17 GP2 | |
| Aorus 17X XES | |
| Média AMD Ryzen 9 7945HX (31421 - 40095, n=7) | |
| Asus ROG Strix Scar 17 G733PY-XS96 | |
| Asus ROG Strix G17 G713PI | |
| Alienware m17 R5 (R9 6900HX, RX 6850M XT) | |
Desempenho do sistema
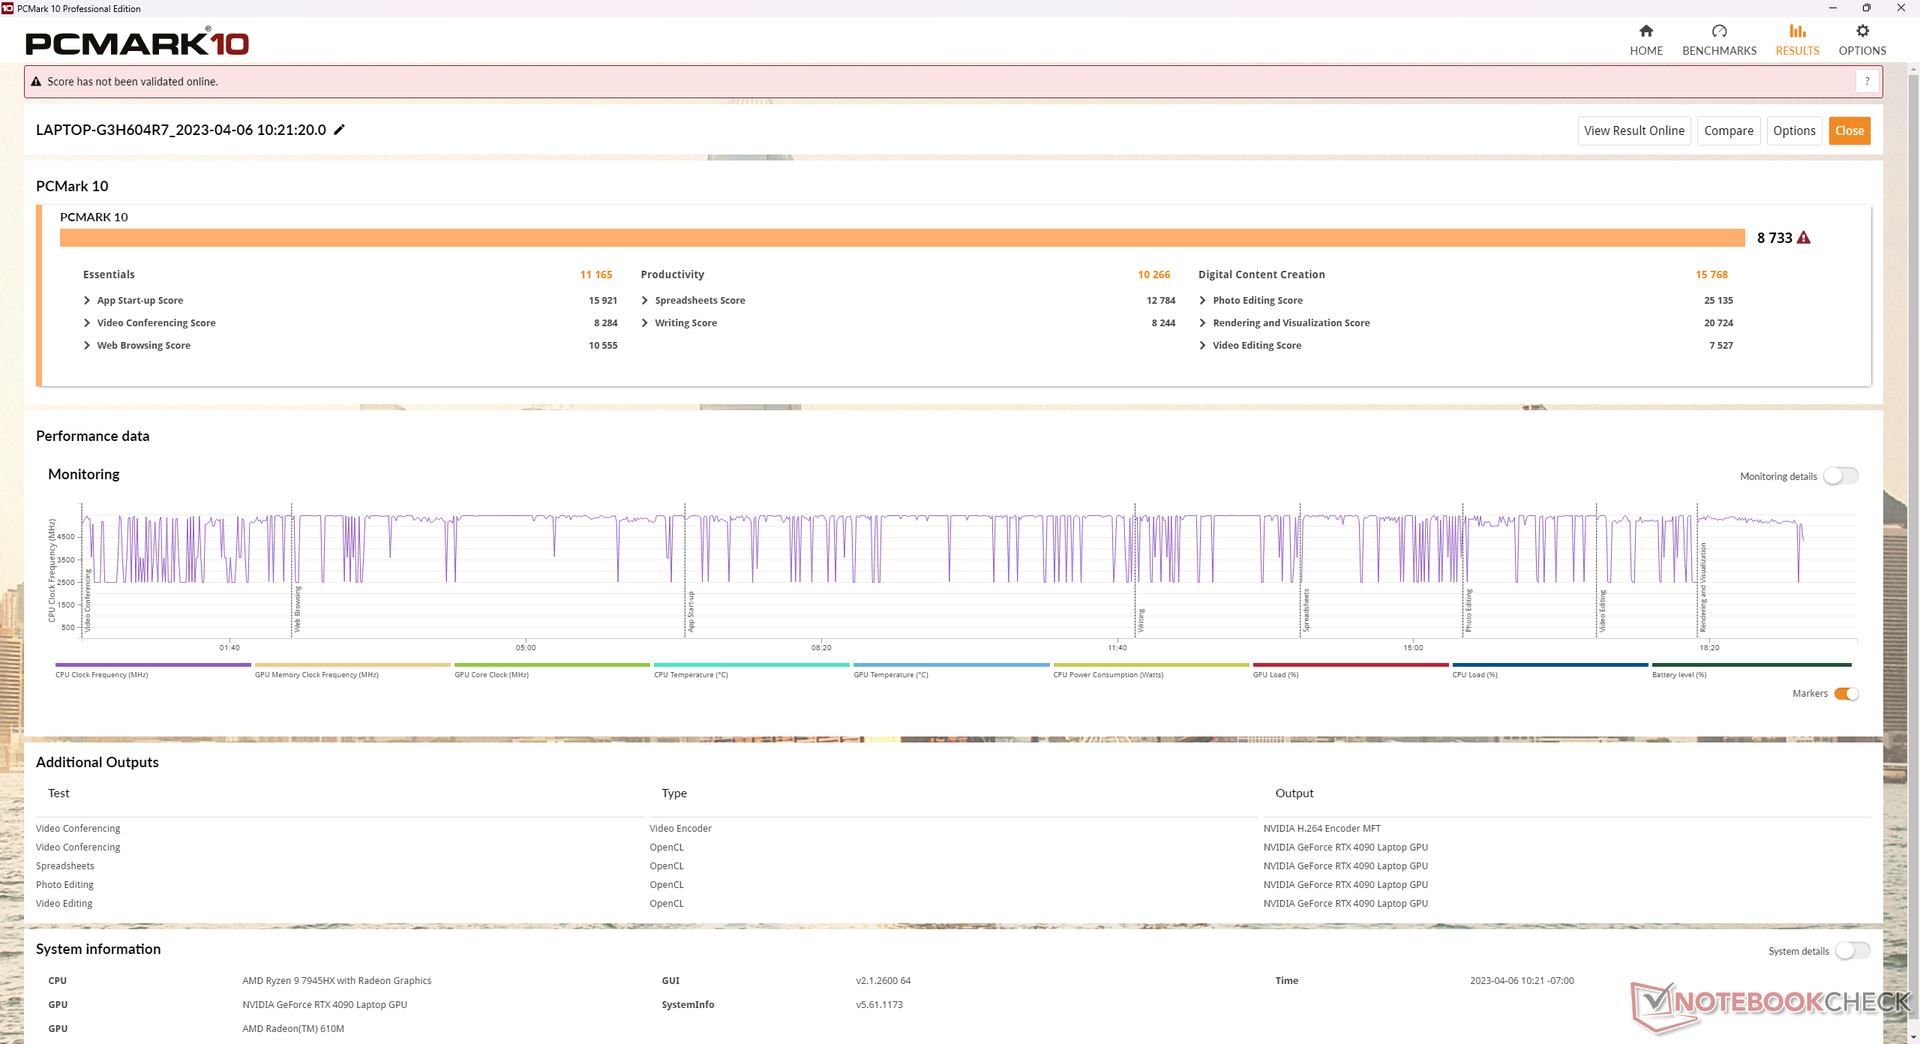
CrossMark: Overall | Productivity | Creativity | Responsiveness
| PCMark 10 / Score | |
| Eluktronics Mech-17 GP2 | |
| Média AMD Ryzen 9 7945HX, NVIDIA GeForce RTX 4090 Laptop GPU (8733 - 9151, n=2) | |
| MSI GE78HX 13VH-070US | |
| Asus ROG Strix Scar 17 G733PY-XS96 | |
| Aorus 17X XES | |
| Asus ROG Strix G17 G713PI | |
| Alienware m17 R5 (R9 6900HX, RX 6850M XT) | |
| Asus ROG Strix Scar 17 SE G733CX-LL014W | |
| PCMark 10 / Essentials | |
| Eluktronics Mech-17 GP2 | |
| Média AMD Ryzen 9 7945HX, NVIDIA GeForce RTX 4090 Laptop GPU (11165 - 12176, n=2) | |
| MSI GE78HX 13VH-070US | |
| Asus ROG Strix G17 G713PI | |
| Asus ROG Strix Scar 17 G733PY-XS96 | |
| Aorus 17X XES | |
| Asus ROG Strix Scar 17 SE G733CX-LL014W | |
| Alienware m17 R5 (R9 6900HX, RX 6850M XT) | |
| PCMark 10 / Productivity | |
| Asus ROG Strix G17 G713PI | |
| Média AMD Ryzen 9 7945HX, NVIDIA GeForce RTX 4090 Laptop GPU (10266 - 11833, n=2) | |
| Eluktronics Mech-17 GP2 | |
| MSI GE78HX 13VH-070US | |
| Asus ROG Strix Scar 17 G733PY-XS96 | |
| Aorus 17X XES | |
| Asus ROG Strix Scar 17 SE G733CX-LL014W | |
| Alienware m17 R5 (R9 6900HX, RX 6850M XT) | |
| PCMark 10 / Digital Content Creation | |
| Asus ROG Strix Scar 17 G733PY-XS96 | |
| Eluktronics Mech-17 GP2 | |
| MSI GE78HX 13VH-070US | |
| Média AMD Ryzen 9 7945HX, NVIDIA GeForce RTX 4090 Laptop GPU (14432 - 15768, n=2) | |
| Aorus 17X XES | |
| Alienware m17 R5 (R9 6900HX, RX 6850M XT) | |
| Asus ROG Strix Scar 17 SE G733CX-LL014W | |
| Asus ROG Strix G17 G713PI | |
| CrossMark / Overall | |
| Eluktronics Mech-17 GP2 | |
| Aorus 17X XES | |
| Asus ROG Strix Scar 17 SE G733CX-LL014W | |
| Asus ROG Strix G17 G713PI | |
| Média AMD Ryzen 9 7945HX, NVIDIA GeForce RTX 4090 Laptop GPU (1993 - 2078, n=2) | |
| Asus ROG Strix Scar 17 G733PY-XS96 | |
| MSI GE78HX 13VH-070US | |
| Alienware m17 R5 (R9 6900HX, RX 6850M XT) | |
| CrossMark / Productivity | |
| Eluktronics Mech-17 GP2 | |
| Aorus 17X XES | |
| Asus ROG Strix Scar 17 SE G733CX-LL014W | |
| Asus ROG Strix G17 G713PI | |
| Média AMD Ryzen 9 7945HX, NVIDIA GeForce RTX 4090 Laptop GPU (1838 - 1946, n=2) | |
| MSI GE78HX 13VH-070US | |
| Asus ROG Strix Scar 17 G733PY-XS96 | |
| Alienware m17 R5 (R9 6900HX, RX 6850M XT) | |
| CrossMark / Creativity | |
| Eluktronics Mech-17 GP2 | |
| Média AMD Ryzen 9 7945HX, NVIDIA GeForce RTX 4090 Laptop GPU (2334 - 2377, n=2) | |
| Asus ROG Strix Scar 17 SE G733CX-LL014W | |
| Asus ROG Strix Scar 17 G733PY-XS96 | |
| Asus ROG Strix G17 G713PI | |
| Aorus 17X XES | |
| MSI GE78HX 13VH-070US | |
| Alienware m17 R5 (R9 6900HX, RX 6850M XT) | |
| CrossMark / Responsiveness | |
| Aorus 17X XES | |
| Asus ROG Strix Scar 17 SE G733CX-LL014W | |
| Eluktronics Mech-17 GP2 | |
| MSI GE78HX 13VH-070US | |
| Asus ROG Strix G17 G713PI | |
| Média AMD Ryzen 9 7945HX, NVIDIA GeForce RTX 4090 Laptop GPU (1584 - 1689, n=2) | |
| Asus ROG Strix Scar 17 G733PY-XS96 | |
| Alienware m17 R5 (R9 6900HX, RX 6850M XT) | |
| PCMark 10 Score | 8733 pontos | |
Ajuda | ||
| AIDA64 / Memory Copy | |
| MSI GE78HX 13VH-070US | |
| Eluktronics Mech-17 GP2 | |
| Aorus 17X XES | |
| Média AMD Ryzen 9 7945HX (48948 - 57953, n=7) | |
| Alienware m17 R5 (R9 6900HX, RX 6850M XT) | |
| Asus ROG Strix Scar 17 G733PY-XS96 | |
| Asus ROG Strix G17 G713PI | |
| AIDA64 / Memory Read | |
| MSI GE78HX 13VH-070US | |
| Eluktronics Mech-17 GP2 | |
| Aorus 17X XES | |
| Média AMD Ryzen 9 7945HX (56910 - 67753, n=7) | |
| Asus ROG Strix G17 G713PI | |
| Asus ROG Strix Scar 17 G733PY-XS96 | |
| Alienware m17 R5 (R9 6900HX, RX 6850M XT) | |
| AIDA64 / Memory Write | |
| MSI GE78HX 13VH-070US | |
| Eluktronics Mech-17 GP2 | |
| Média AMD Ryzen 9 7945HX (58602 - 70063, n=7) | |
| Aorus 17X XES | |
| Asus ROG Strix Scar 17 G733PY-XS96 | |
| Asus ROG Strix G17 G713PI | |
| Alienware m17 R5 (R9 6900HX, RX 6850M XT) | |
| AIDA64 / Memory Latency | |
| Alienware m17 R5 (R9 6900HX, RX 6850M XT) | |
| Eluktronics Mech-17 GP2 | |
| Aorus 17X XES | |
| Asus ROG Strix G17 G713PI | |
| MSI GE78HX 13VH-070US | |
| Média AMD Ryzen 9 7945HX (77.1 - 91.3, n=7) | |
| Asus ROG Strix Scar 17 G733PY-XS96 | |
* ... menor é melhor
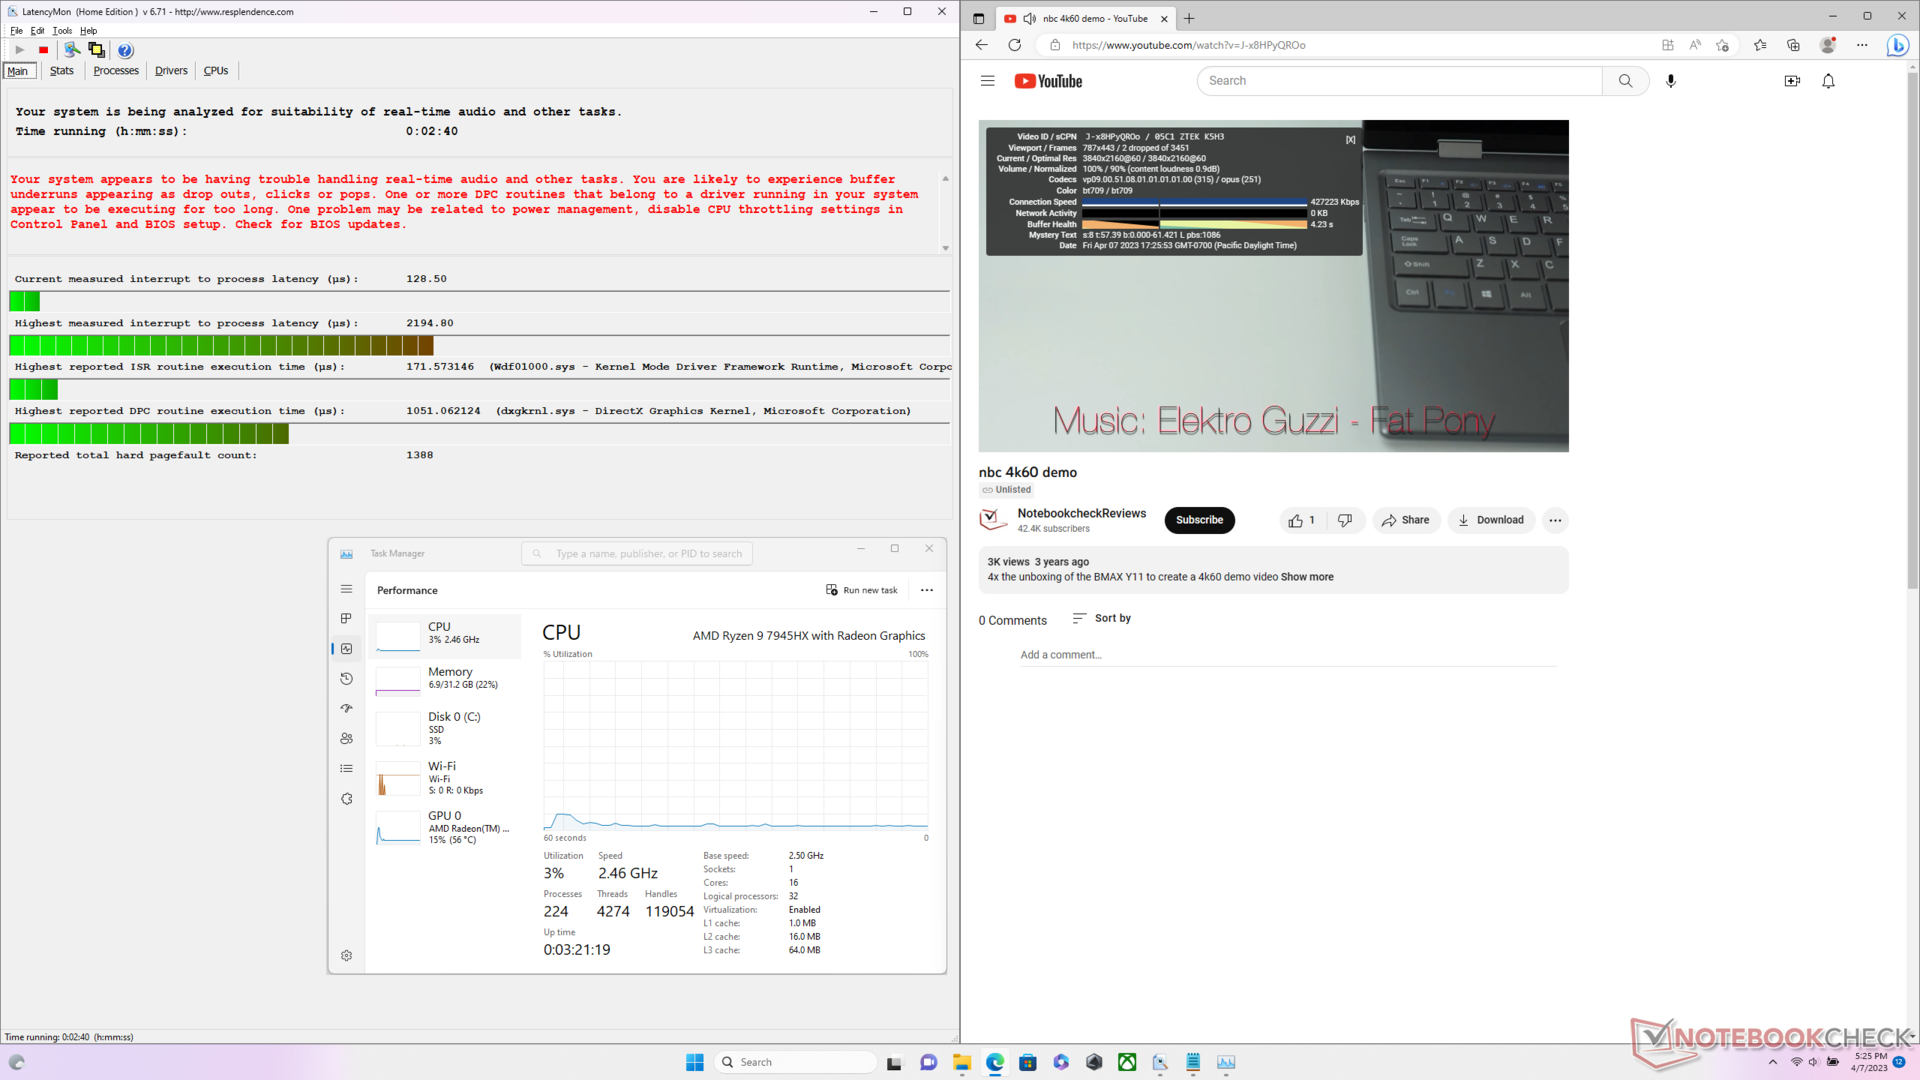
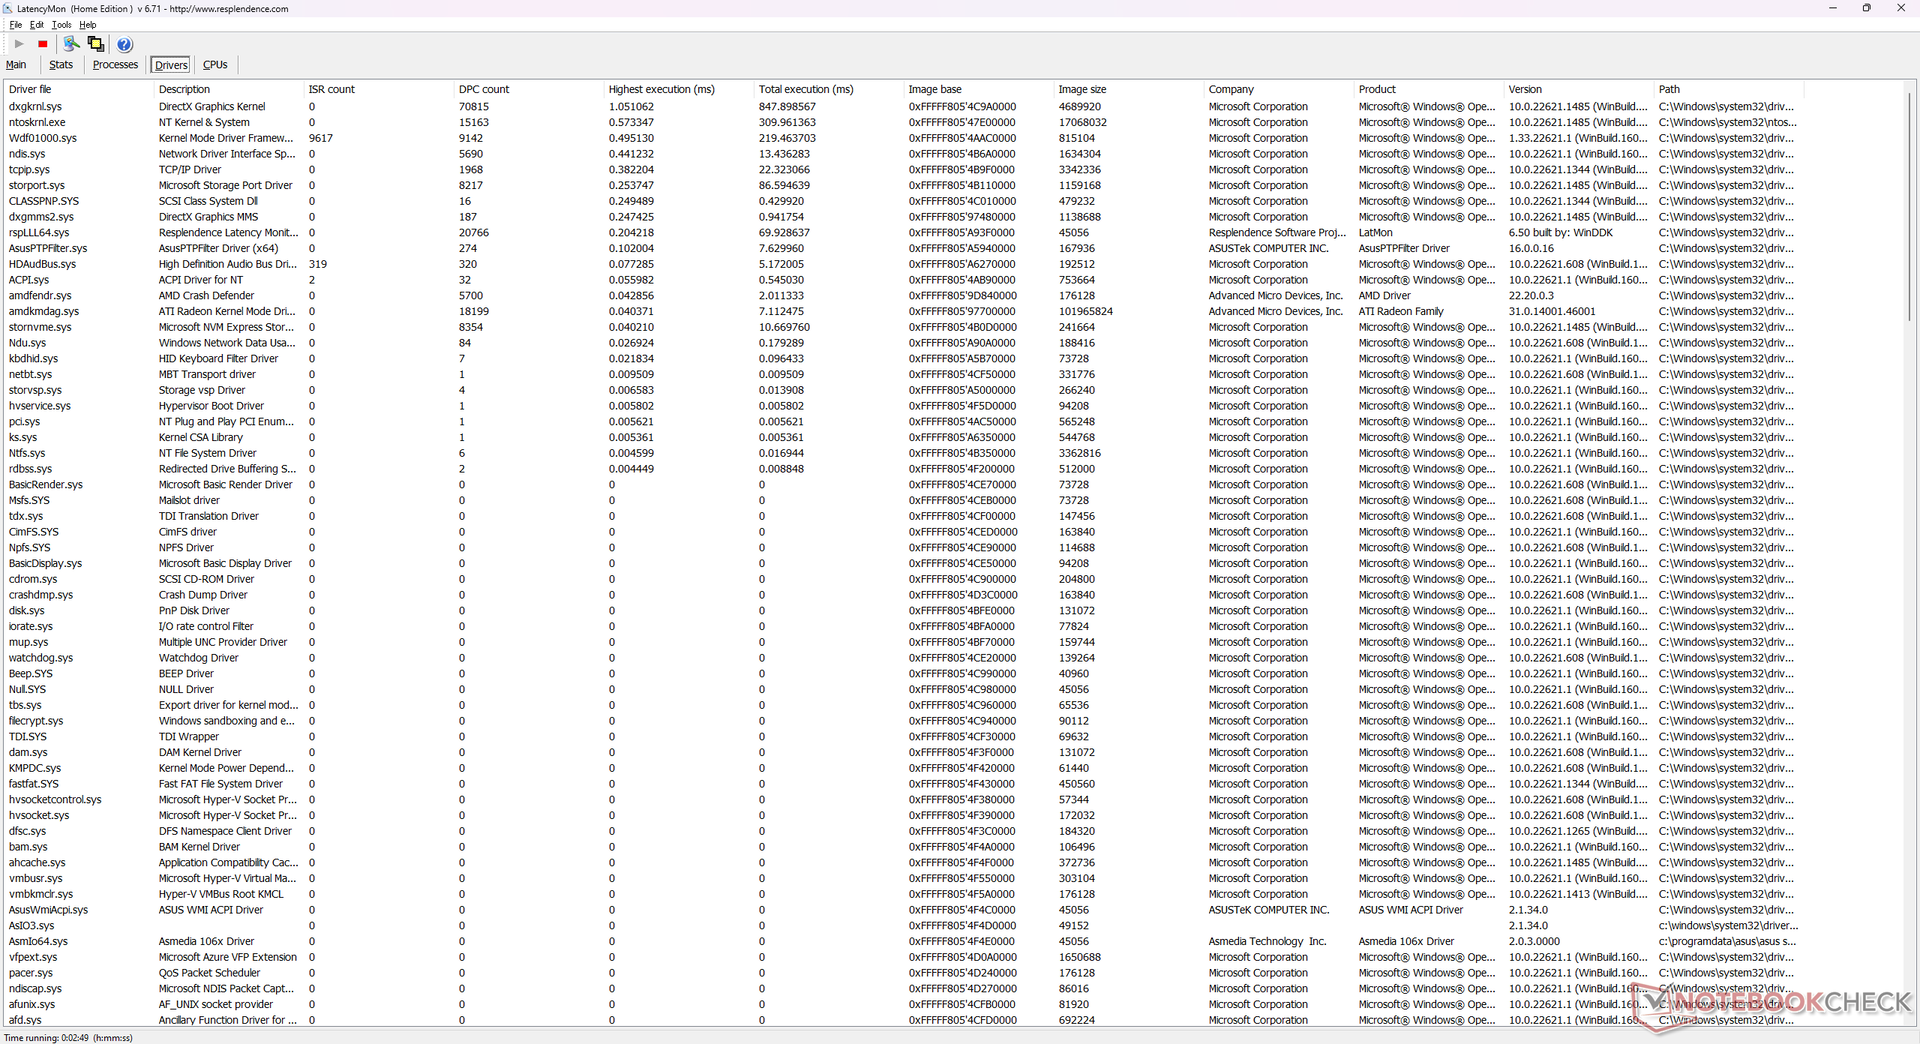
Latência do DPC
A LatencyMon não revelaria nenhum problema de DPC ao abrir várias abas do navegador de nossa página inicial. A execução do Prime95, entretanto, induziria a uma alta latência de interrupção. Somos capazes de gravar 2 quadros soltos ao reproduzir nosso vídeo de teste 4K60 de um minuto.
| DPC Latencies / LatencyMon - interrupt to process latency (max), Web, Youtube, Prime95 | |
| MSI GE78HX 13VH-070US | |
| Asus ROG Strix Scar 17 SE G733CX-LL014W | |
| Asus ROG Strix Scar 17 G733PY-XS96 | |
| Asus ROG Strix G17 G713PI | |
| Alienware m17 R5 (R9 6900HX, RX 6850M XT) | |
| Eluktronics Mech-17 GP2 | |
* ... menor é melhor
Dispositivos de Armazenamento - Detecção de estrangulamento de desempenho
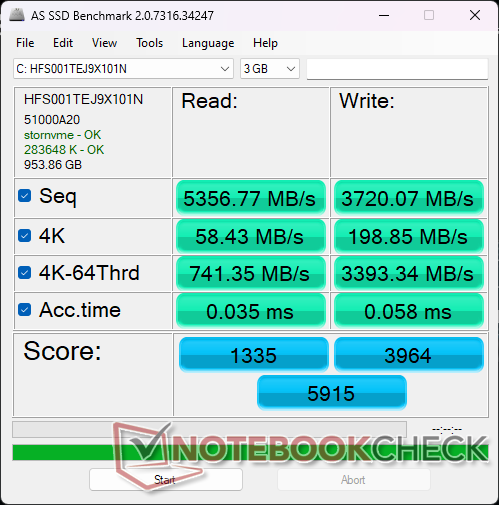
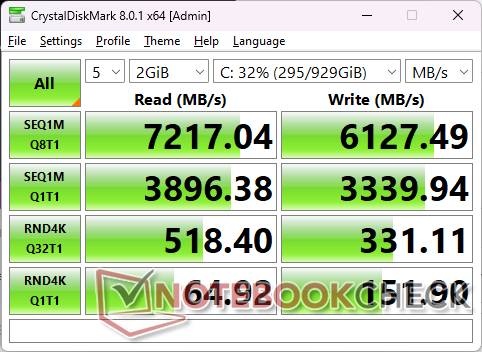
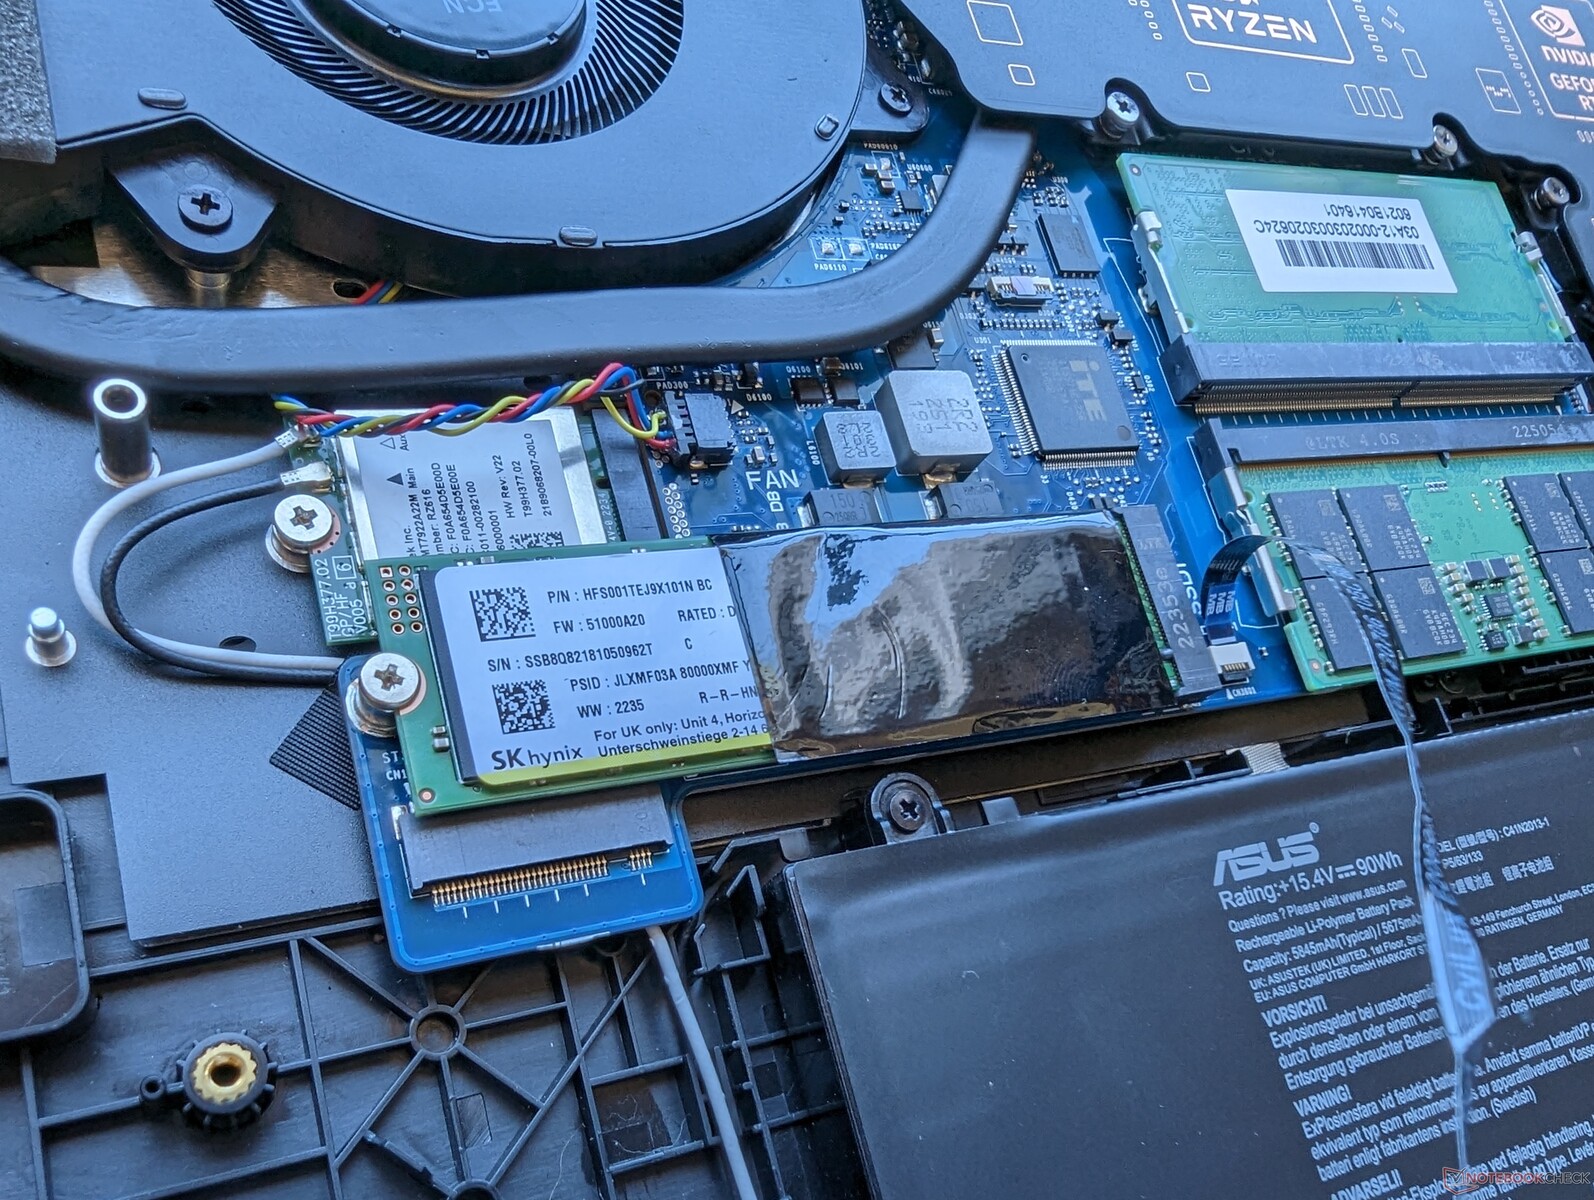
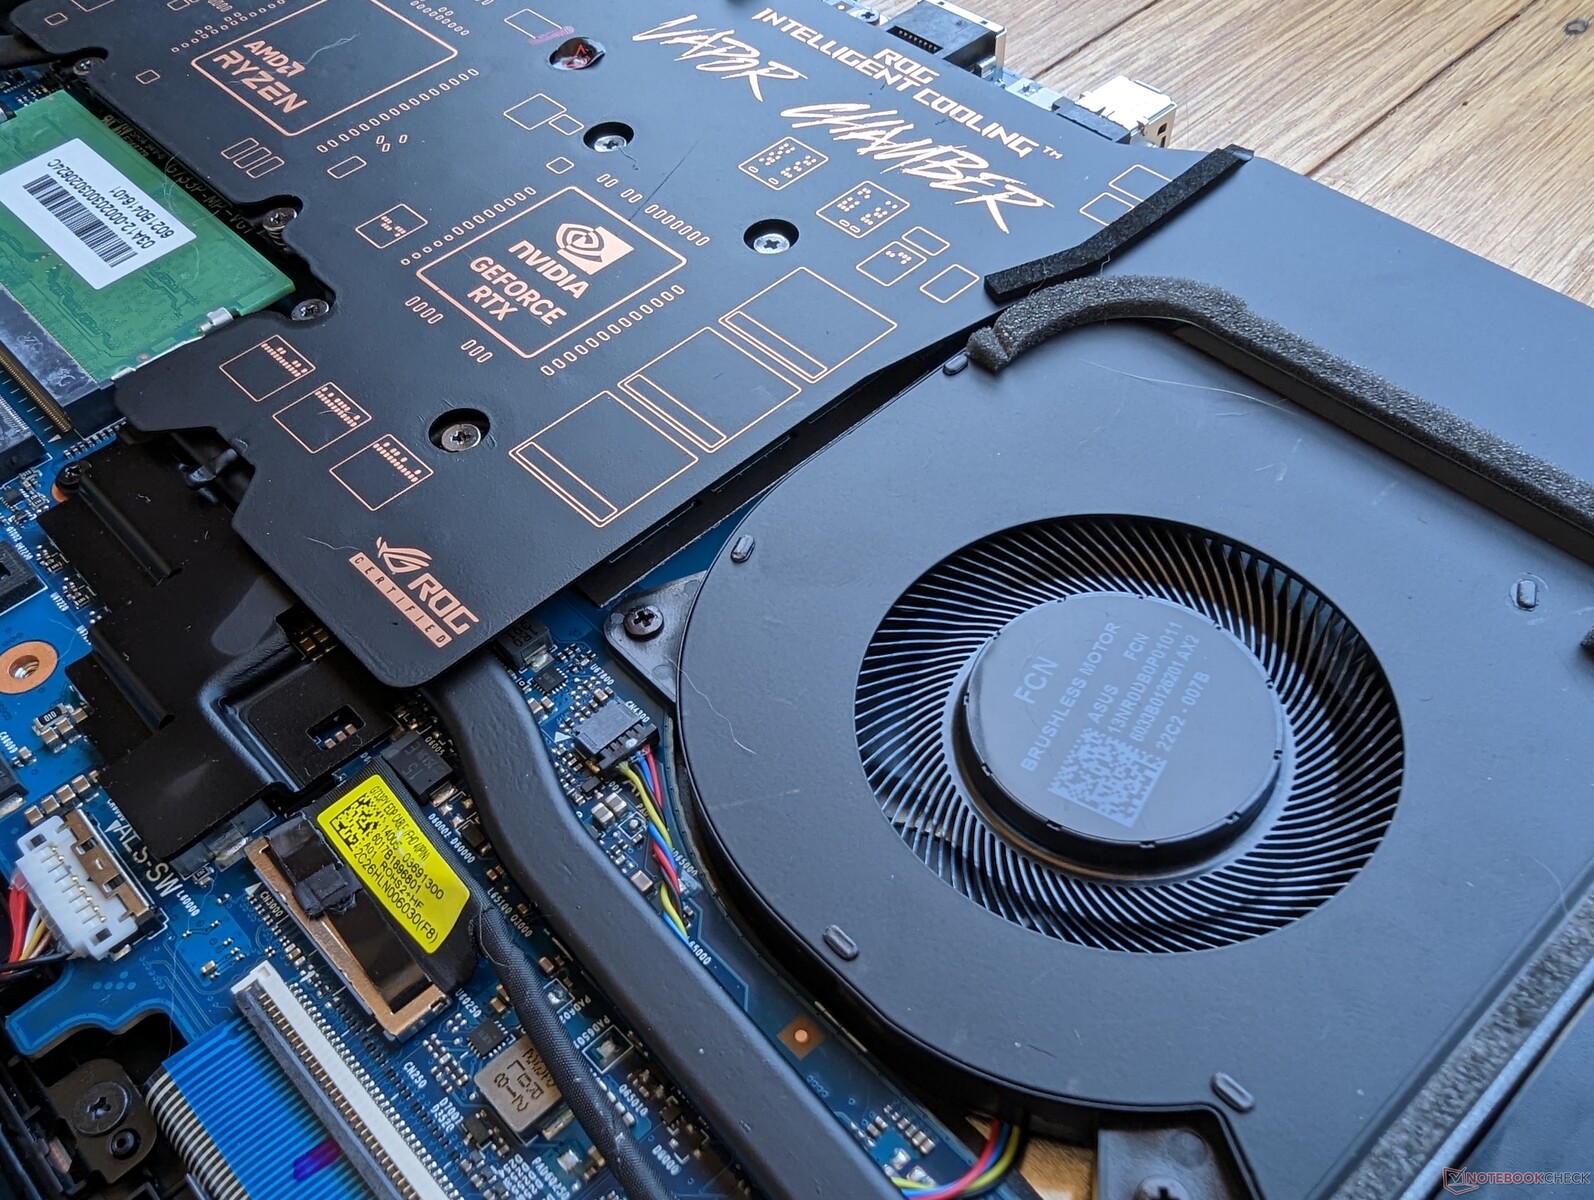
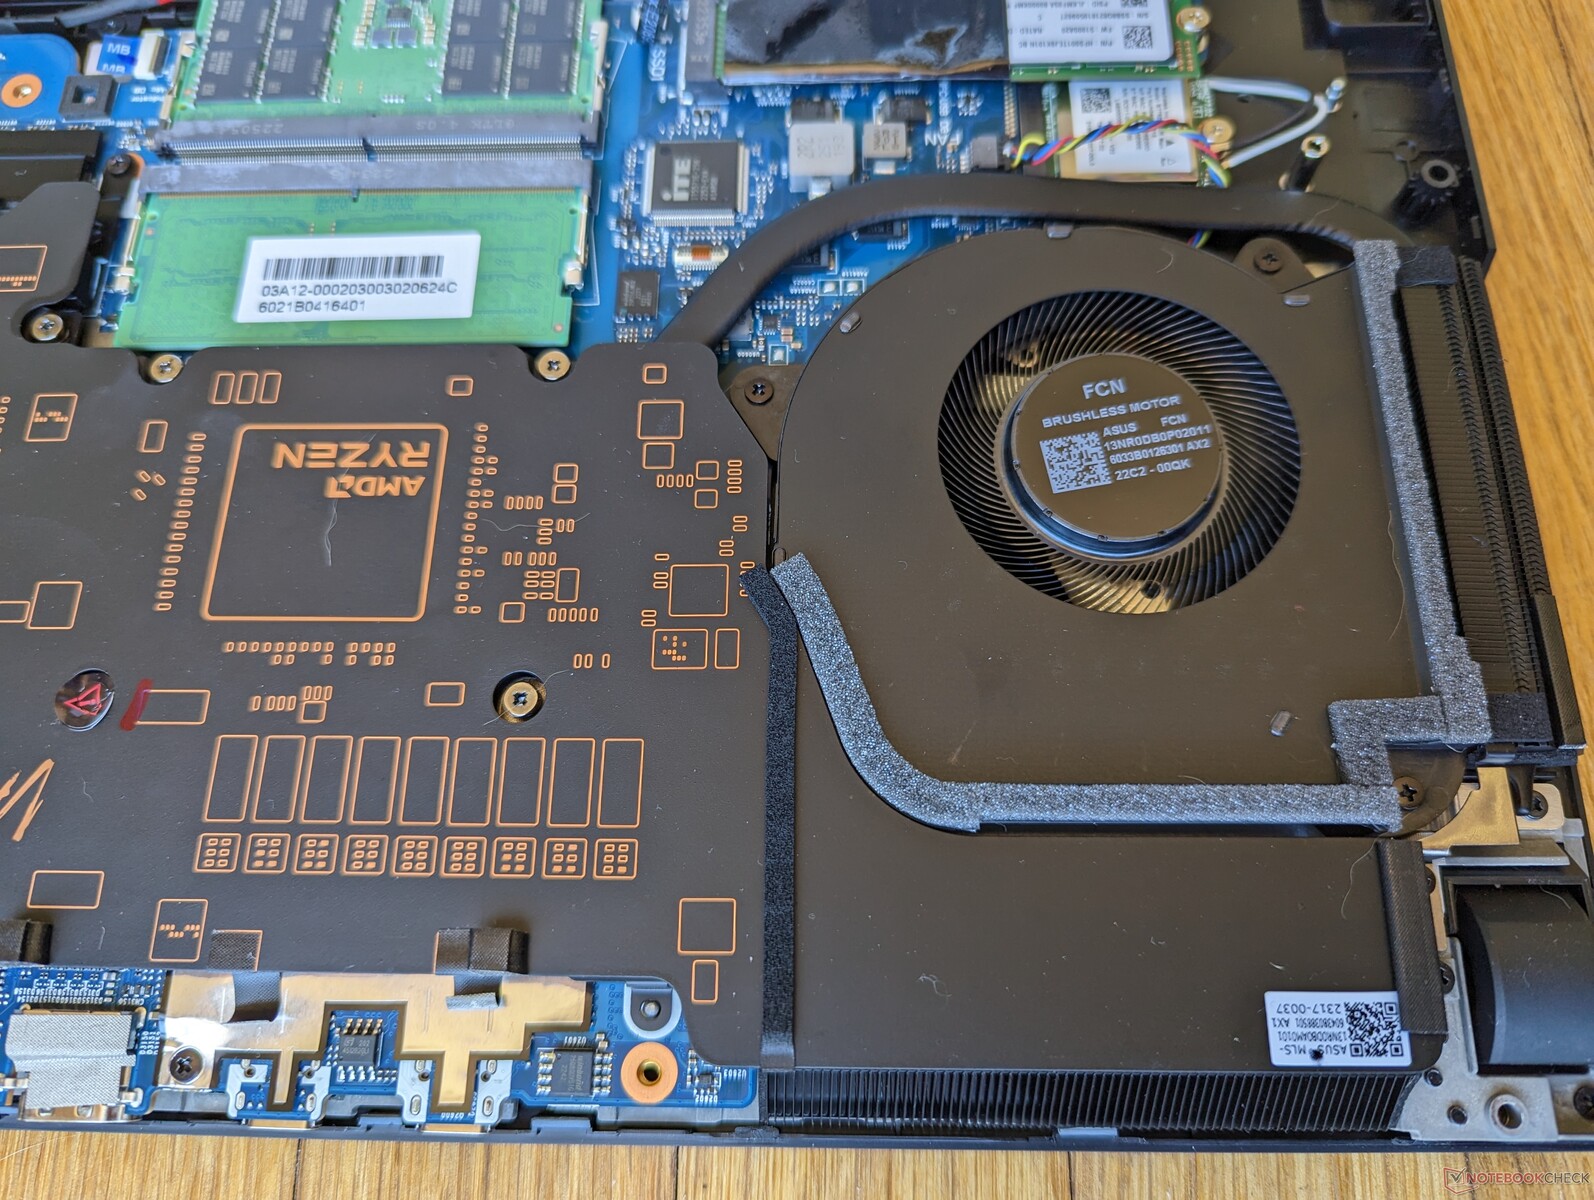
Nossa unidade é enviada com um 1 TB SK hynix PC801 para taxas seqüenciais de leitura e escrita de cerca de 7200 MB/s e 6200 MB/s, respectivamente. Entretanto, a unidade exibiria problemas de estrangulamento de desempenho após cerca de 4 minutos de estresse, como mostra nosso gráfico abaixo. Não há espalhador de calor ou almofada térmica nos SSDs para auxiliar na dissipação de calor.

| Drive Performance rating - Percent | |
| Aorus 17X XES | |
| MSI GE78HX 13VH-070US | |
| Asus ROG Strix Scar 17 G733PY-XS96 | |
| Eluktronics Mech-17 GP2 | |
| Alienware m17 R5 (R9 6900HX, RX 6850M XT) | |
| Asus ROG Strix G17 G713PI | |
* ... menor é melhor
Disk Throttling: DiskSpd Read Loop, Queue Depth 8
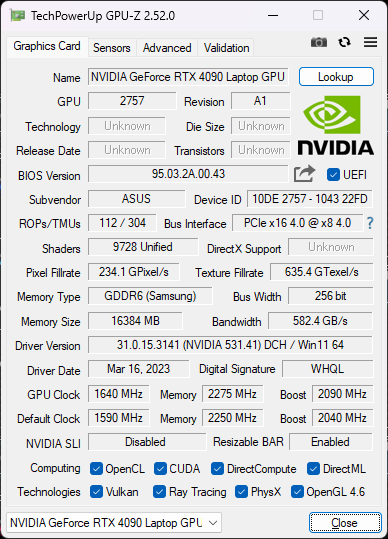
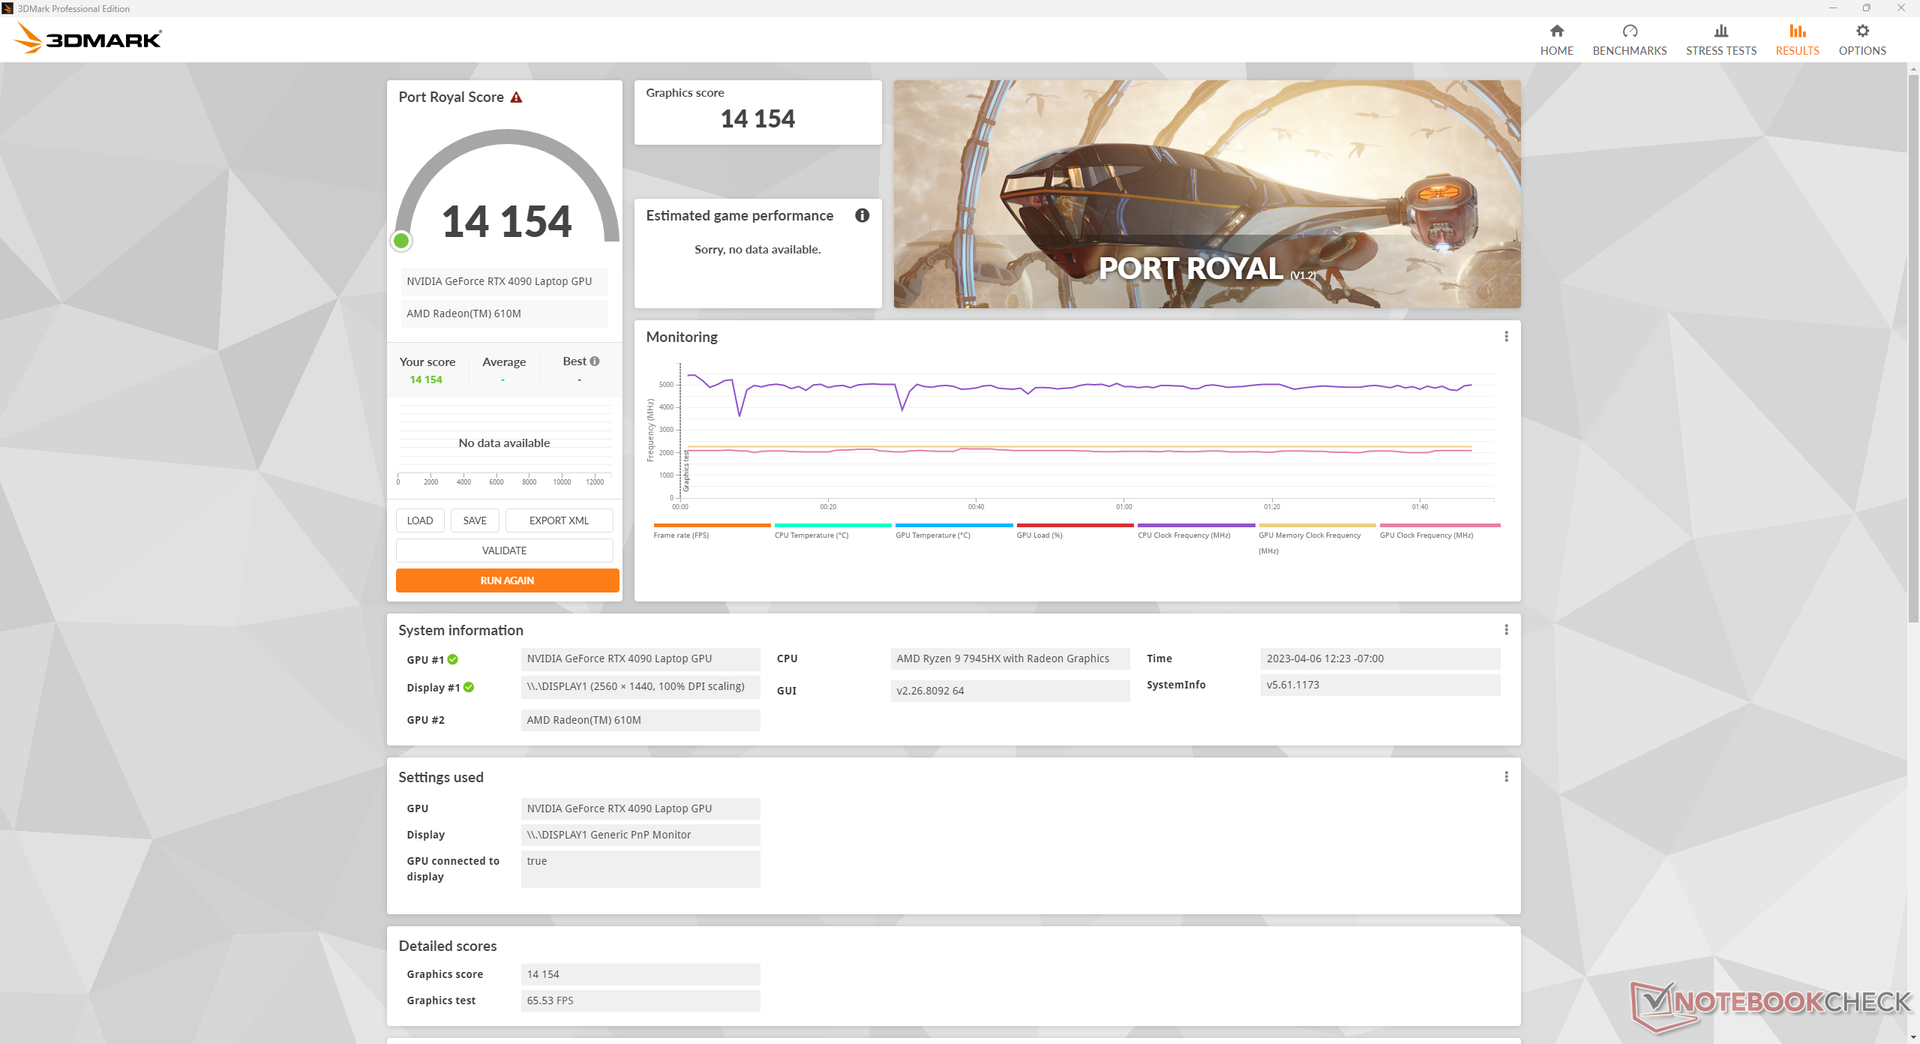
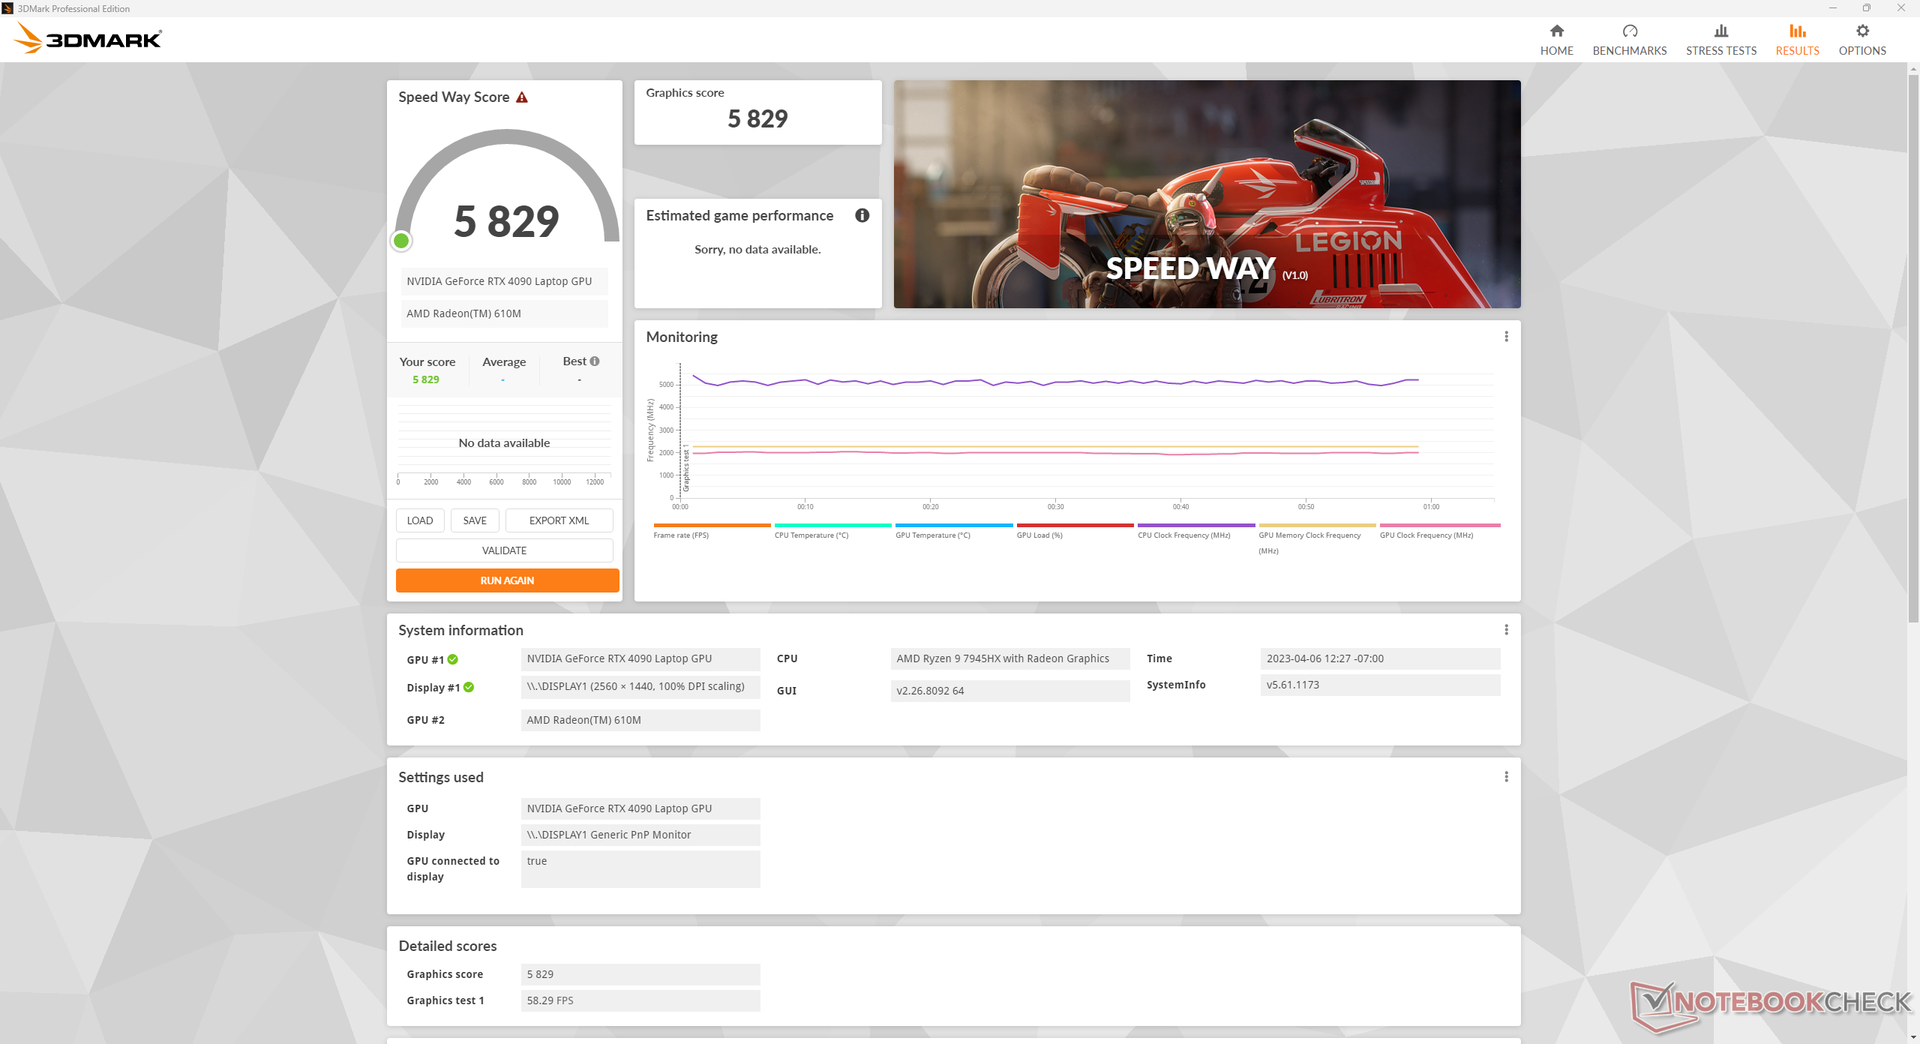
GPU Performance - 175 W GeForce RTX 4090
O móvel GeForce RTX 4090 oferece um desempenho 60 a 80% mais rápido do que o RTX 3080 Ti móvel no ano passado ROG Strix Scar 17 G733. Assim, o diferencial de desempenho ano após ano é bastante significativo. A redução para a RTX 4080 ou 4070 Espera-se que as SKUs tenham um impacto no desempenho da GPU de 15% a 20% e 40% a 50%, respectivamente. Portanto, os entusiastas podem querer evitar a RTX 4070 móvel, uma vez que a queda de desempenho da RTX 4080 móvel para a RTX 4070 móvel é muito maior do que a queda da RTX 4090 móvel para a RTX 4080 móvel.
A execução no modo Performance ao invés do modo Turbo afeta ligeiramente o desempenho. Um teste em Fire Strike no modo Performance resultaria em uma queda de 4 a 5% na pontuação gráfica. Nossa seção de Teste de Estresse abaixo explora estes dois modos mais detalhadamente.

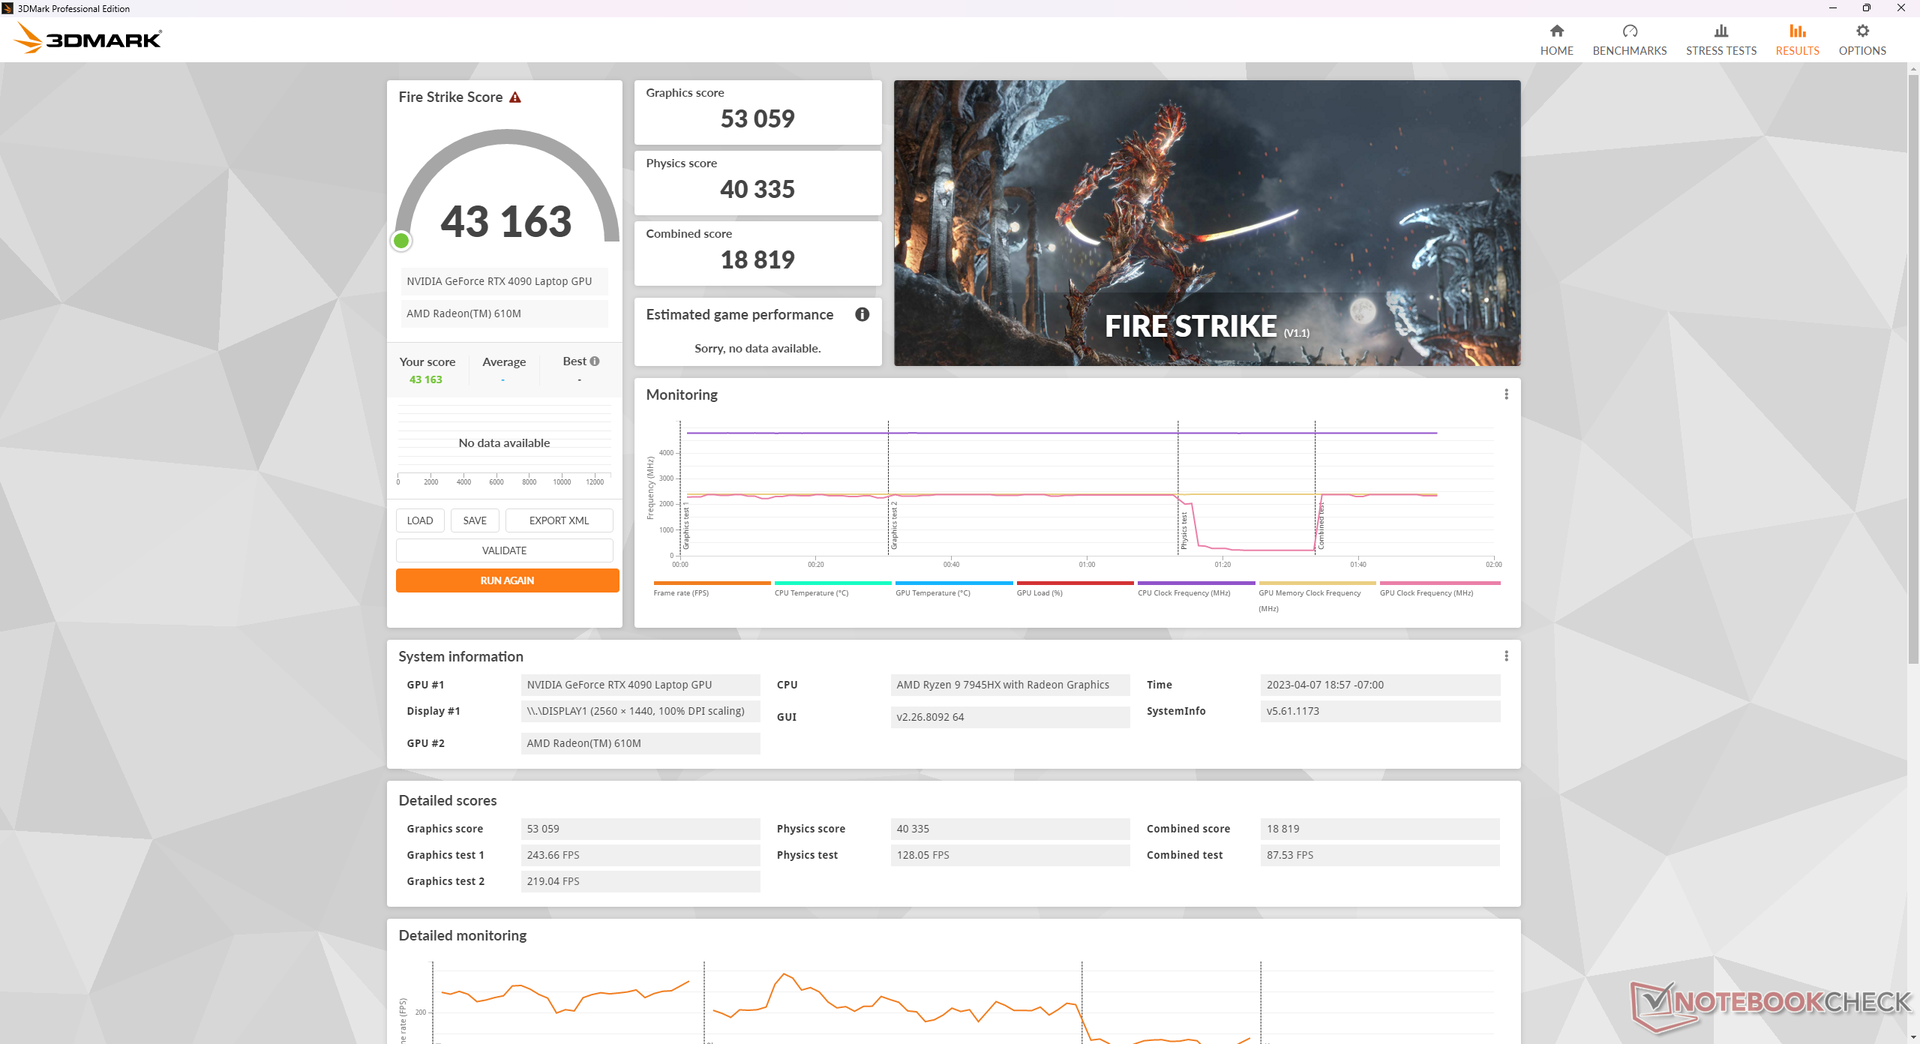
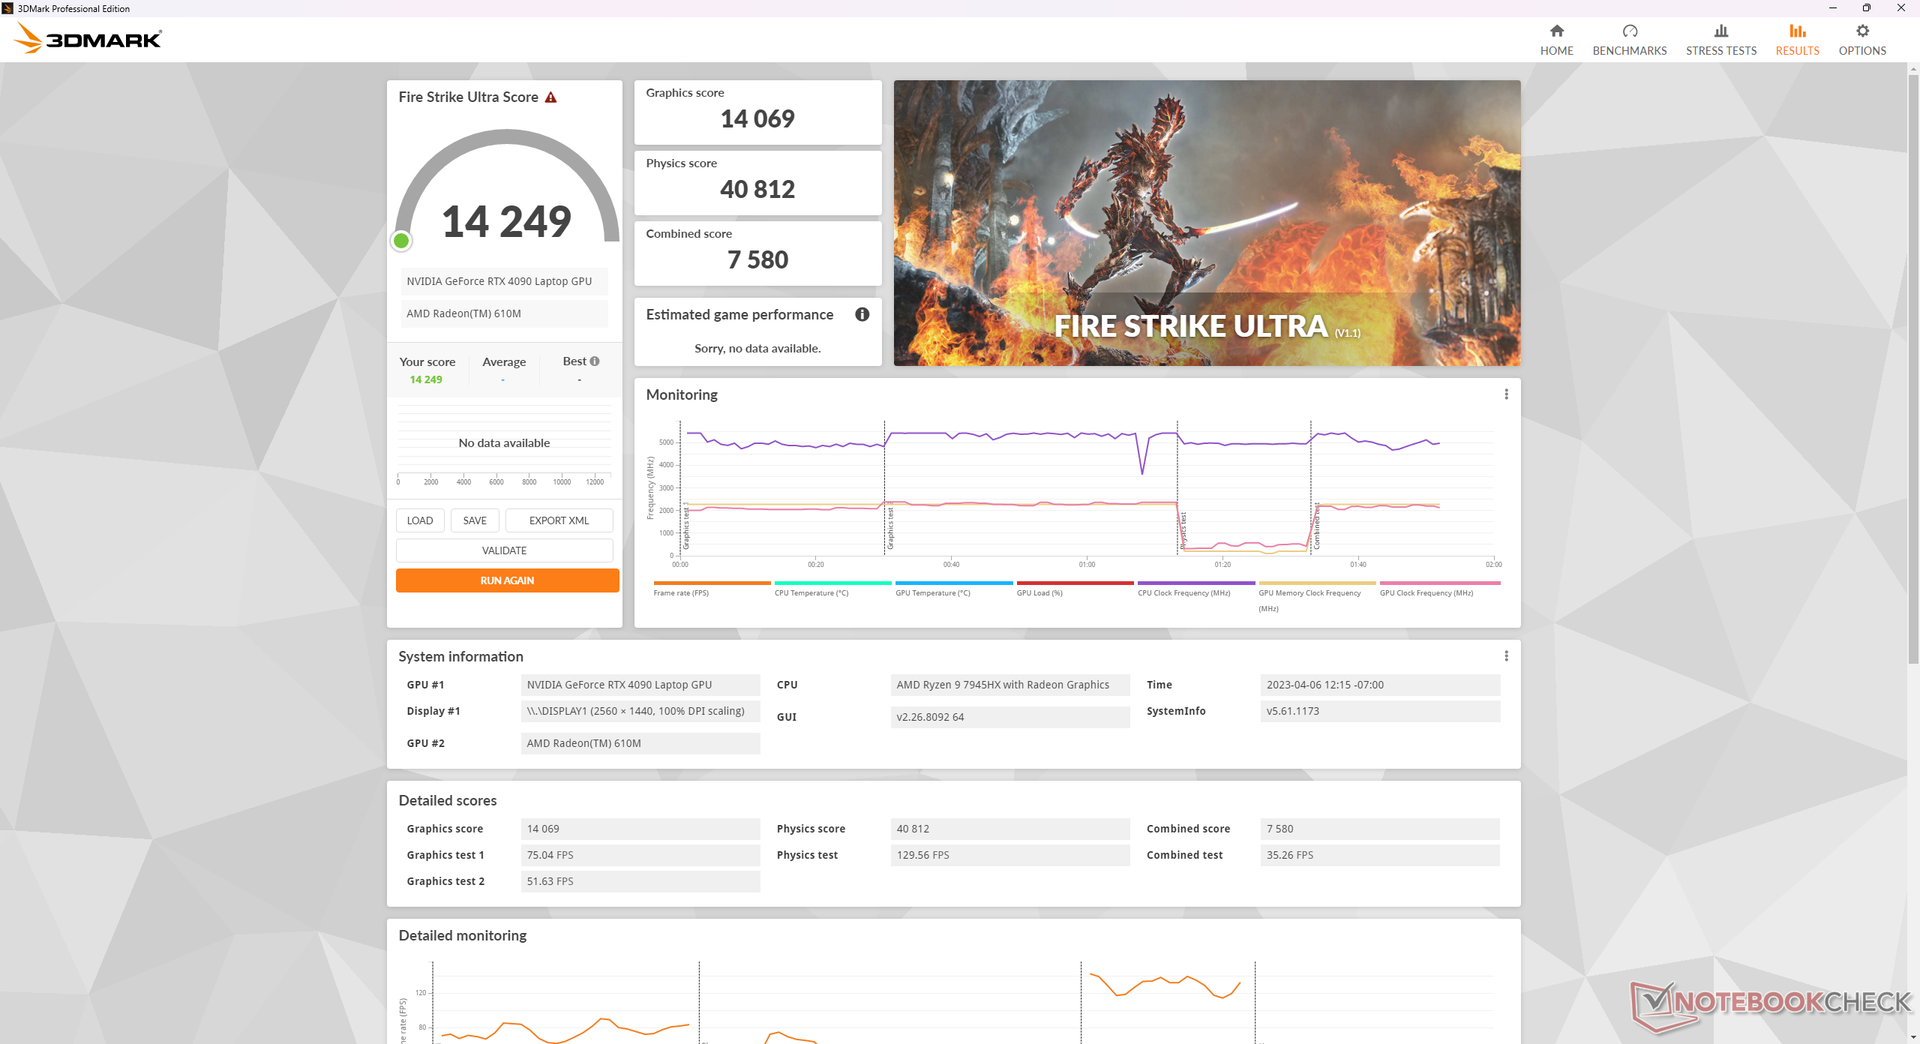
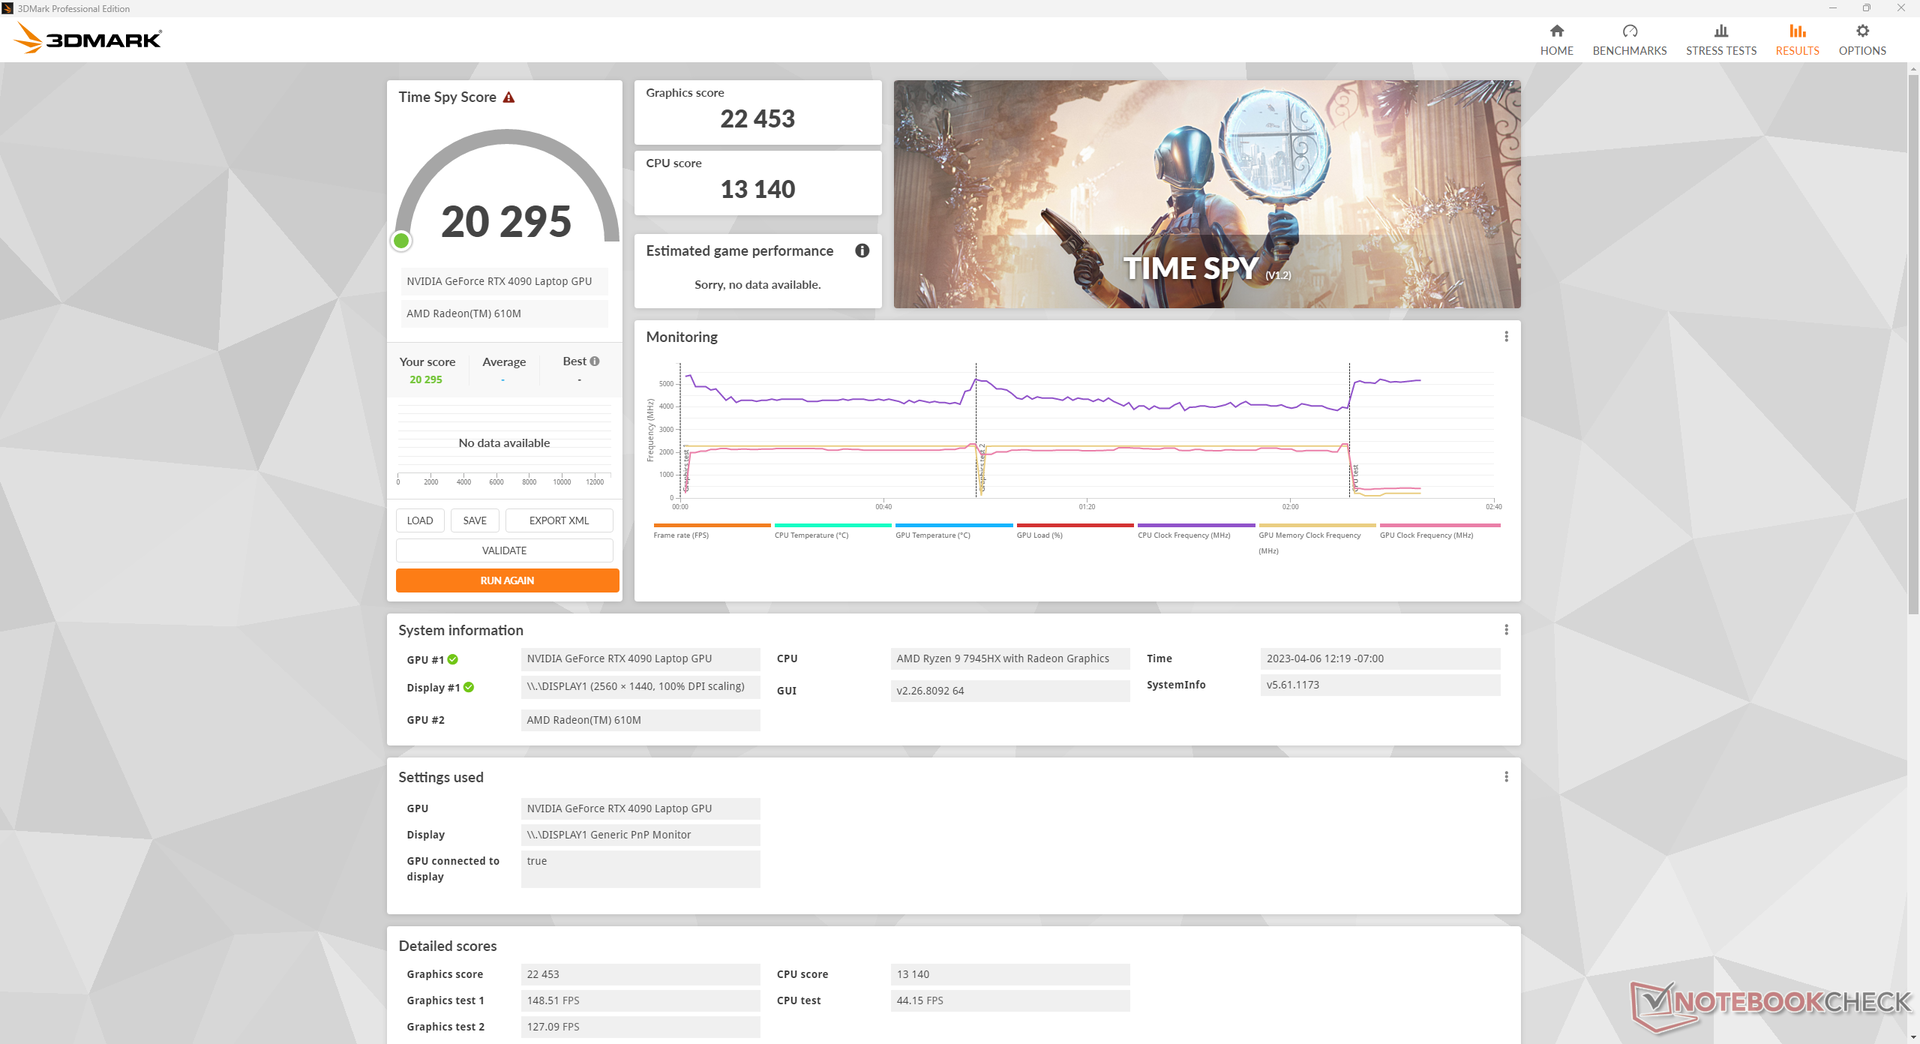
| 3DMark 11 Performance | 46484 pontos | |
| 3DMark Fire Strike Score | 43163 pontos | |
| 3DMark Time Spy Score | 20295 pontos | |
Ajuda | ||
* ... menor é melhor
| Tiny Tina's Wonderlands | |
| 1920x1080 Low Preset (DX12) | |
| KFA2 GeForce RTX 4090 SG | |
| Média NVIDIA GeForce RTX 4090 Laptop GPU (268 - 378, n=8) | |
| Asus ROG Strix Scar 17 G733PY-XS96 | |
| 1920x1080 Medium Preset (DX12) | |
| KFA2 GeForce RTX 4090 SG | |
| Média NVIDIA GeForce RTX 4090 Laptop GPU (230 - 302, n=8) | |
| Asus ROG Strix Scar 17 G733PY-XS96 | |
| 1920x1080 High Preset (DX12) | |
| KFA2 GeForce RTX 4090 SG | |
| Média NVIDIA GeForce RTX 4090 Laptop GPU (168 - 233, n=9) | |
| Asus ROG Strix Scar 17 G733PY-XS96 | |
| 1920x1080 Badass Preset (DX12) | |
| KFA2 GeForce RTX 4090 SG | |
| Asus ROG Strix Scar 17 G733PY-XS96 | |
| Média NVIDIA GeForce RTX 4090 Laptop GPU (141.1 - 189.4, n=14) | |
| 2560x1440 Badass Preset (DX12) | |
| KFA2 GeForce RTX 4090 SG | |
| Asus ROG Strix Scar 17 G733PY-XS96 | |
| Média NVIDIA GeForce RTX 4090 Laptop GPU (103.4 - 137.8, n=14) | |
| 3840x2160 Badass Preset (DX12) | |
| KFA2 GeForce RTX 4090 SG | |
| Asus ROG Strix Scar 17 G733PY-XS96 | |
| Média NVIDIA GeForce RTX 4090 Laptop GPU (53.3 - 73.7, n=12) | |
Witcher 3 FPS Chart
| baixo | média | alto | ultra | QHD DLSS | QHD FSR | QHD | 4K DLSS | 4K FSR | 4K | |
|---|---|---|---|---|---|---|---|---|---|---|
| GTA V (2015) | 185 | 180.4 | 175.2 | 112.6 | 114.8 | 170.5 | ||||
| The Witcher 3 (2015) | 490.1 | 405.6 | 370.3 | 203.8 | 154.8 | |||||
| Dota 2 Reborn (2015) | 165.6 | 150.5 | 154.2 | 139 | 135.4 | |||||
| Final Fantasy XV Benchmark (2018) | 214 | 205 | 163.9 | 151 | 93.3 | |||||
| X-Plane 11.11 (2018) | 132.2 | 118 | 94.3 | 78.5 | ||||||
| Far Cry 5 (2018) | 157 | 145 | 142 | 108 | ||||||
| Shadow of the Tomb Raider (2018) | 238 | 228 | 190 | 104 | ||||||
| Borderlands 3 (2019) | 121.4 | |||||||||
| Doom Eternal (2020) | 441 | 362 | 200 | |||||||
| Valorant (2020) | 485 | |||||||||
| Assassin´s Creed Valhalla (2020) | 187 | 169 | 135 | 79 | ||||||
| Far Cry 6 (2021) | 117 | 112 | 109 | 82 | ||||||
| Cyberpunk 2077 1.6 (2022) | 146.4 | 140.5 | 132.6 | 133.8 | 104.3 | 48.6 | ||||
| Tiny Tina's Wonderlands (2022) | 267.7 | 230 | 194.6 | 176.2 | 134.2 | 71.9 | ||||
| F1 22 (2022) | 266 | 243 | 221 | 116.3 | 92.1 | 45.8 | ||||
| Call of Duty Modern Warfare 2 2022 (2022) | 188 | 180 | 135 | 82 | ||||||
| Star Wars Jedi Survivor (2023) | 105.6 | 103.1 | 88.4 | 43 | ||||||
| Black Myth: Wukong (2024) | 153 | 117 | 93 | 41 | 43 | 24 | ||||
| Final Fantasy XVI (2024) | 91.6 | 71.2 | 77.5 | |||||||
| God of War Ragnarök (2024) | 138 | 127.1 | 113.9 | 82.8 | ||||||
| Call of Duty Black Ops 6 (2024) | 130 | 126 | 92 | 76 | 72 | 76 | ||||
| Stalker 2 (2024) | 64.2 | 113.2 | 58.6 | 78.2 | 38.9 | |||||
| Marvel Rivals (2024) | 146 | 122 | 101 | 90 | 71 | |||||
| Kingdom Come Deliverance 2 (2025) | 112.5 | 110.4 | 86.7 | 70.8 | 48.4 | |||||
| Monster Hunter Wilds (2025) | 89.2 | 84.7 | 78.1 | 74.7 | 66.6 | 58 | 42.8 | |||
| Civilization 7 (2025) | 161.3 | 155.4 | 154.9 | |||||||
| The Elder Scrolls IV Oblivion Remastered (2025) | 56.8 | 53.7 | 43.1 | 26.4 | ||||||
| Doom: The Dark Ages (2025) | 123.4 | 115 | 105.5 | 95.2 | 95.3 | 73.1 | 57.1 | 39.7 | ||
| F1 25 (2025) | 227 | 216 | 203 | 53.8 | 57.8 | 32.4 | 28.8 | 15 | ||
| Borderlands 4 (2025) | 83.2 | 70 | 54.8 | 37.9 | ||||||
| Battlefield 6 (2025) | 126.8 | 113.7 | 89.9 | 50.9 | ||||||
| The Outer Worlds 2 (2025) | 77.2 | 41.8 | 51.5 | 27.2 | ||||||
| ARC Raiders (2025) | 226 | 205 | 196.7 | 116.5 | 87.7 | 50 | ||||
| Anno 117: Pax Romana (2025) | 96.4 | 59.9 | 59 | 44.4 | 25.9 | |||||
| Call of Duty Black Ops 7 (2025) | 76 | 52 | 27 | |||||||
| Resident Evil Requiem (2026) | 72.4 | 55.6 | 28.3 | |||||||
| Death Stranding 2 (2026) | 88.5 | 82.6 | 68.1 | 63.4 | 42.4 | |||||
| Crimson Desert (2026) | 73.3 | 68.1 | 57.3 | 51.1 | 43.1 | |||||
| Pragmata (2026) | 110.7 | 104.6 | 85.5 | 82.6 | 58.6 | |||||
| War Thunder (2026) | 123 | 85 | 50 | |||||||
| Forza Horizon 6 (2026) | 94 | 61 | 50 | 31 | ||||||
| 007 First Light (2026) | 75.8 | 79.4 | 67.3 | 63.4 | 35.7 |
Emissões - Desempenho mais silencioso do que o do Turbo
Ruído do sistema
O ruído do ventilador está sempre presente em 23 a 27 dB(A) contra um fundo silencioso de 22,7 dB(A), não importando o ajuste de desempenho. Felizmente, esta faixa é silenciosa o suficiente para ser imperceptível e os ventiladores fazem um bom trabalho ao permanecerem abaixo de 30 dB(A) quando rodam cargas ligeiramente mais altas como navegação na web ou streaming.
Os jogos no modo Performance são mais silenciosos do que no modo Turbo. Ruído dos ventiladores quando em funcionamento Witcher 3 no modo Performance seria cerca de 46,4 dB(A) vs. 51,4 a 54 dB(A) se no modo Turbo. Assim, os usuários podem querer comer os 5% de déficit de desempenho gráfico para os níveis de ruído mais silenciosos do modo Performance.
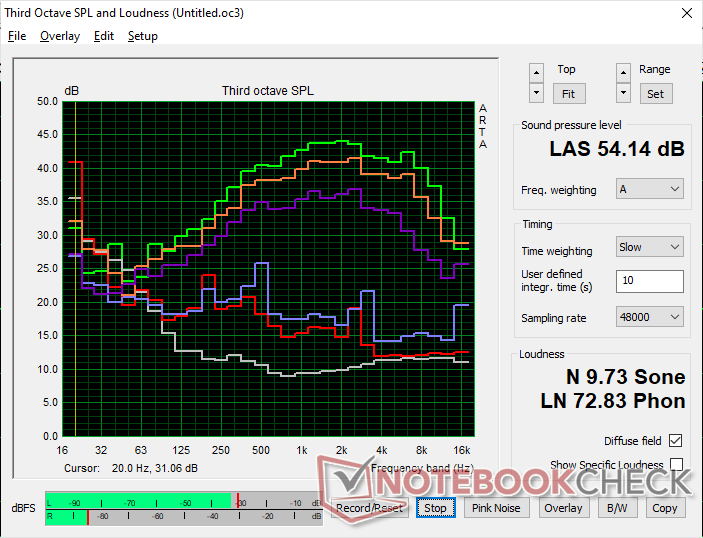
Barulho
| Ocioso |
| 23.5 / 27.7 / 27.7 dB |
| Carga |
| 30.5 / 54.1 dB |
 | ||
30 dB silencioso 40 dB(A) audível 50 dB(A) ruidosamente alto |
||
min: | ||
| Asus ROG Strix Scar 17 G733PY-XS96 GeForce RTX 4090 Laptop GPU, R9 7945HX, SK hynix PC801 HFS001TEJ9X101N | MSI GE78HX 13VH-070US GeForce RTX 4080 Laptop GPU, i9-13950HX, Samsung PM9A1 MZVL22T0HBLB | Eluktronics Mech-17 GP2 GeForce RTX 4090 Laptop GPU, i9-13900HX, Samsung PM9A1 MZVL21T0HCLR | Asus ROG Strix G17 G713PI GeForce RTX 4070 Laptop GPU, R9 7945HX, WD PC SN560 SDDPNQE-1T00 | Aorus 17X XES GeForce RTX 3070 Ti Laptop GPU, i9-12900HX, Gigabyte AG470S1TB-SI B10 | Alienware m17 R5 (R9 6900HX, RX 6850M XT) Radeon RX 6850M XT, R9 6900HX, SSSTC CA6-8D1024 | |
|---|---|---|---|---|---|---|
| Noise | -10% | -10% | -9% | -24% | 1% | |
| desligado / ambiente * (dB) | 22.7 | 23.4 -3% | 25.2 -11% | 25 -10% | 26 -15% | 23 -1% |
| Idle Minimum * (dB) | 23.5 | 24.2 -3% | 28 -19% | 26 -11% | 28 -19% | 23 2% |
| Idle Average * (dB) | 27.7 | 25.6 8% | 28 -1% | 29 -5% | 32 -16% | 28.11 -1% |
| Idle Maximum * (dB) | 27.7 | 31 -12% | 30.4 -10% | 30 -8% | 38 -37% | 28.11 -1% |
| Load Average * (dB) | 30.5 | 43.3 -42% | 41 -34% | 46 -51% | 53 -74% | 30.62 -0% |
| Witcher 3 ultra * (dB) | 51.4 | 56.3 -10% | 50.7 1% | 46 11% | 54 -5% | 49.75 3% |
| Load Maximum * (dB) | 54.1 | 59.1 -9% | 52.6 3% | 47 13% | 55 -2% | 50.17 7% |
* ... menor é melhor
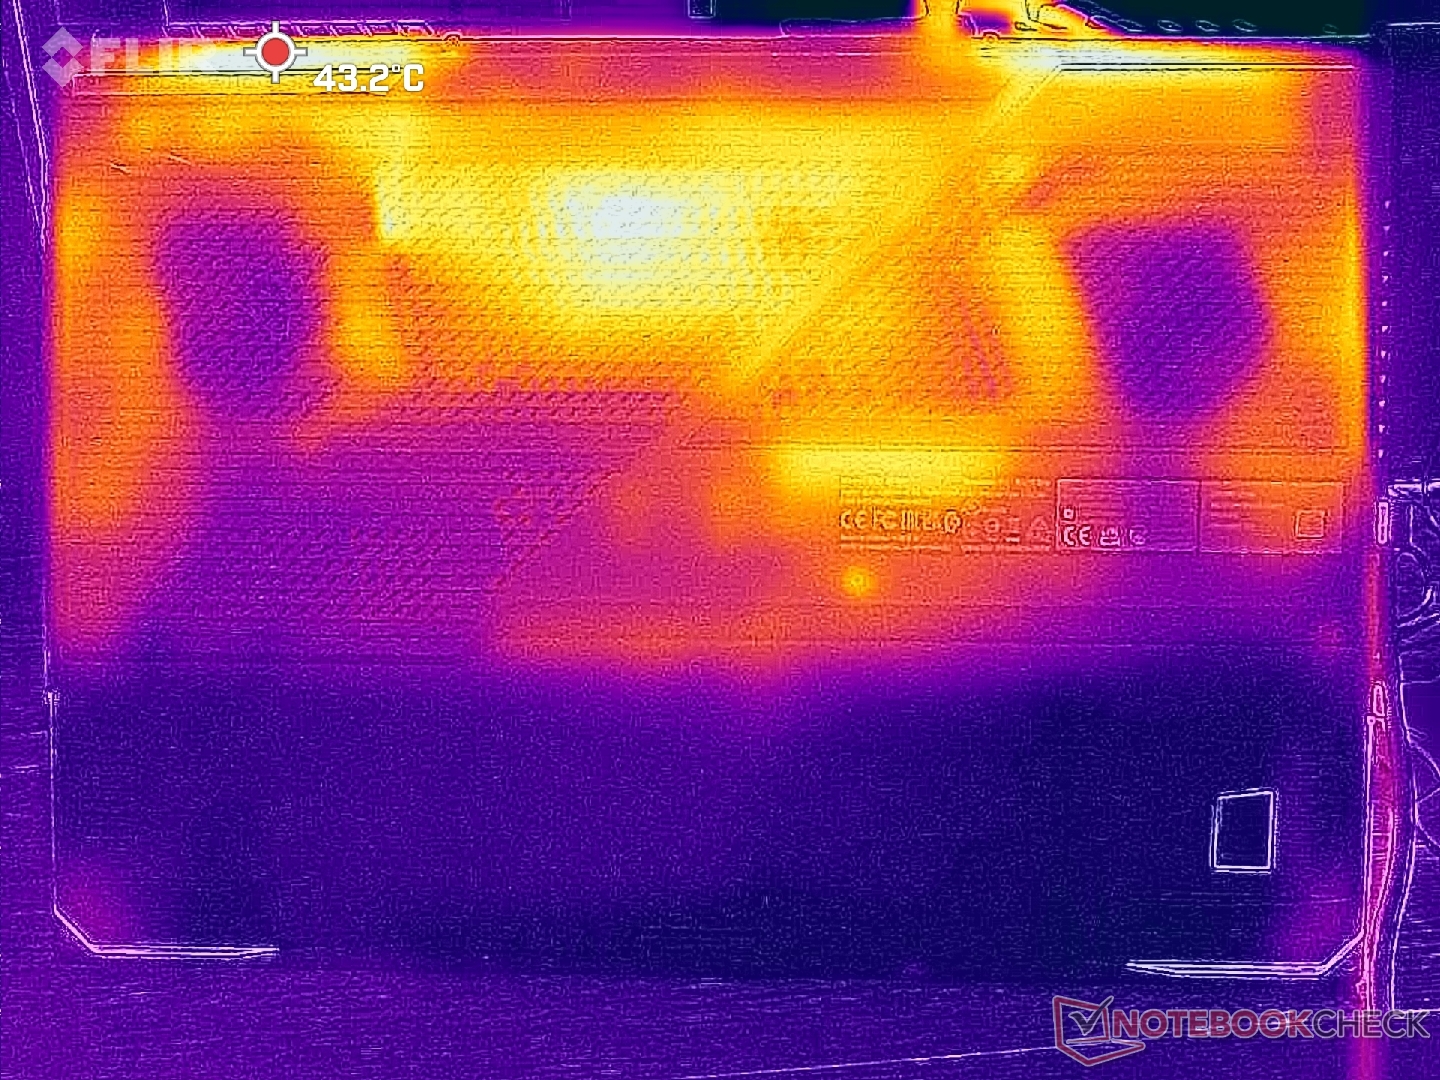
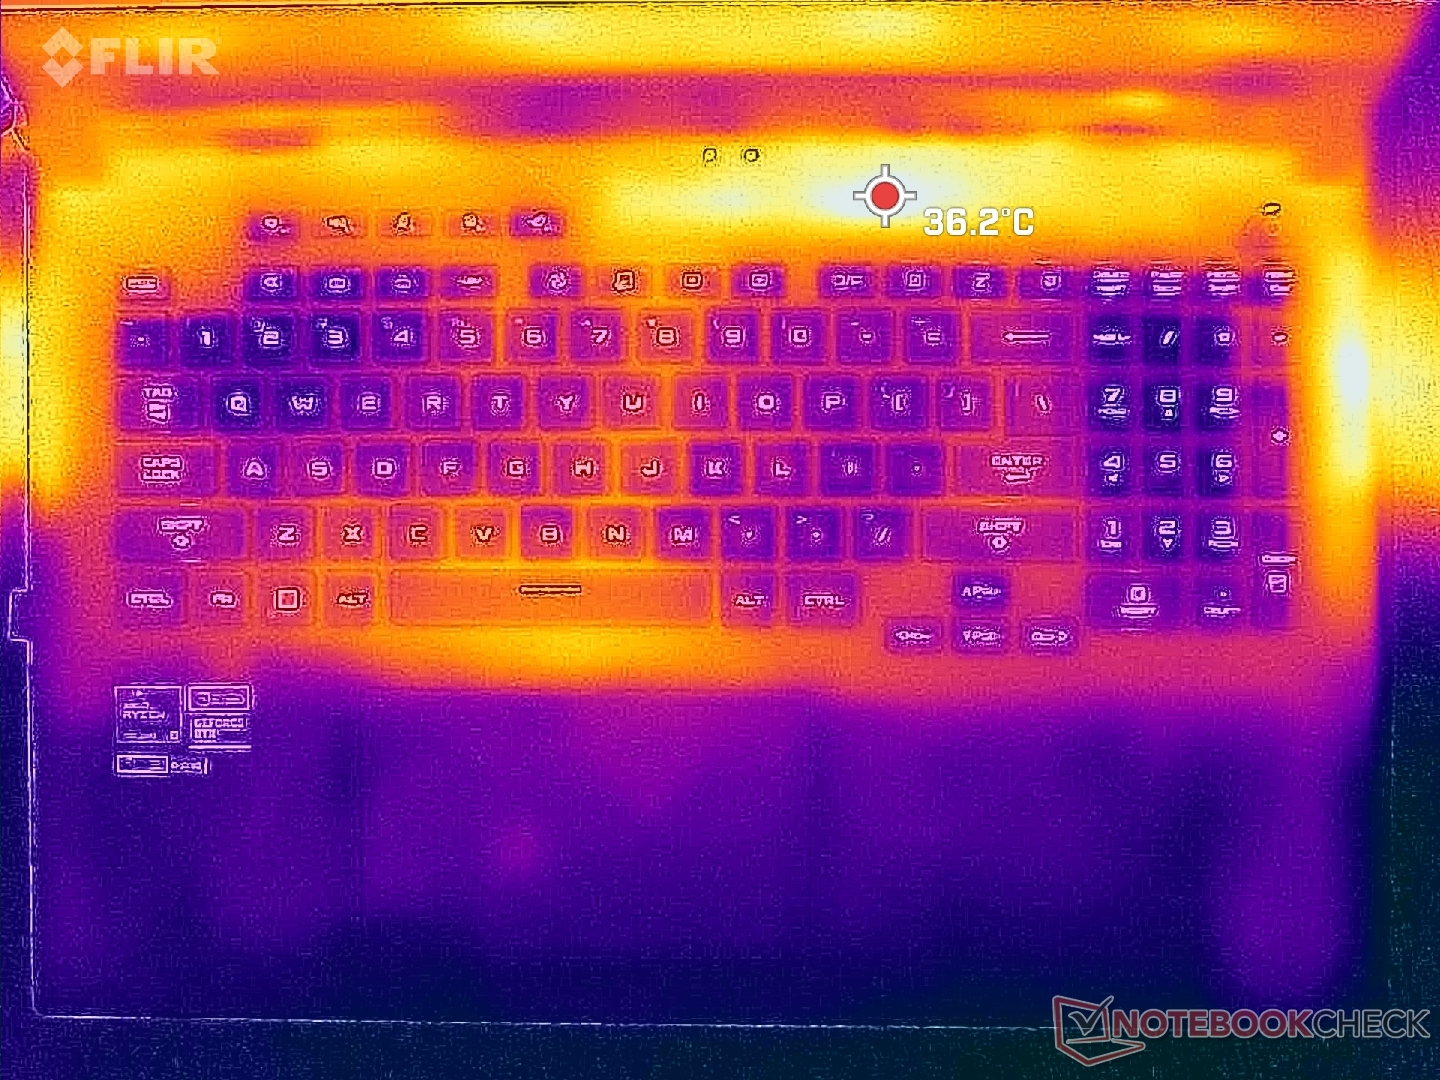
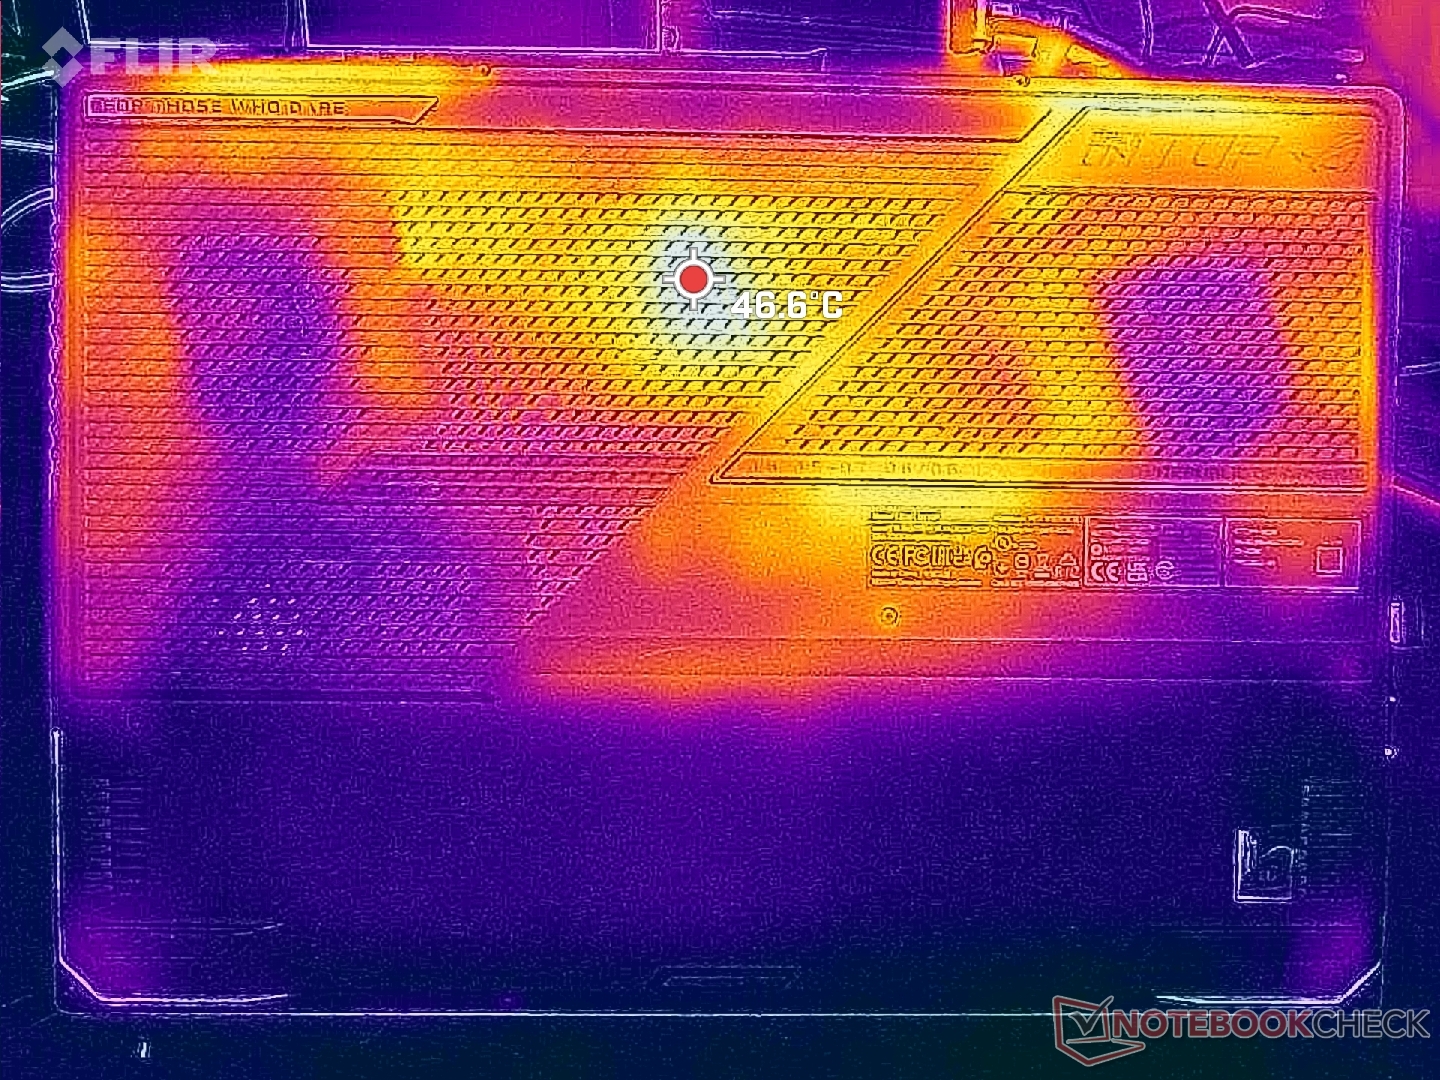
Temperatura
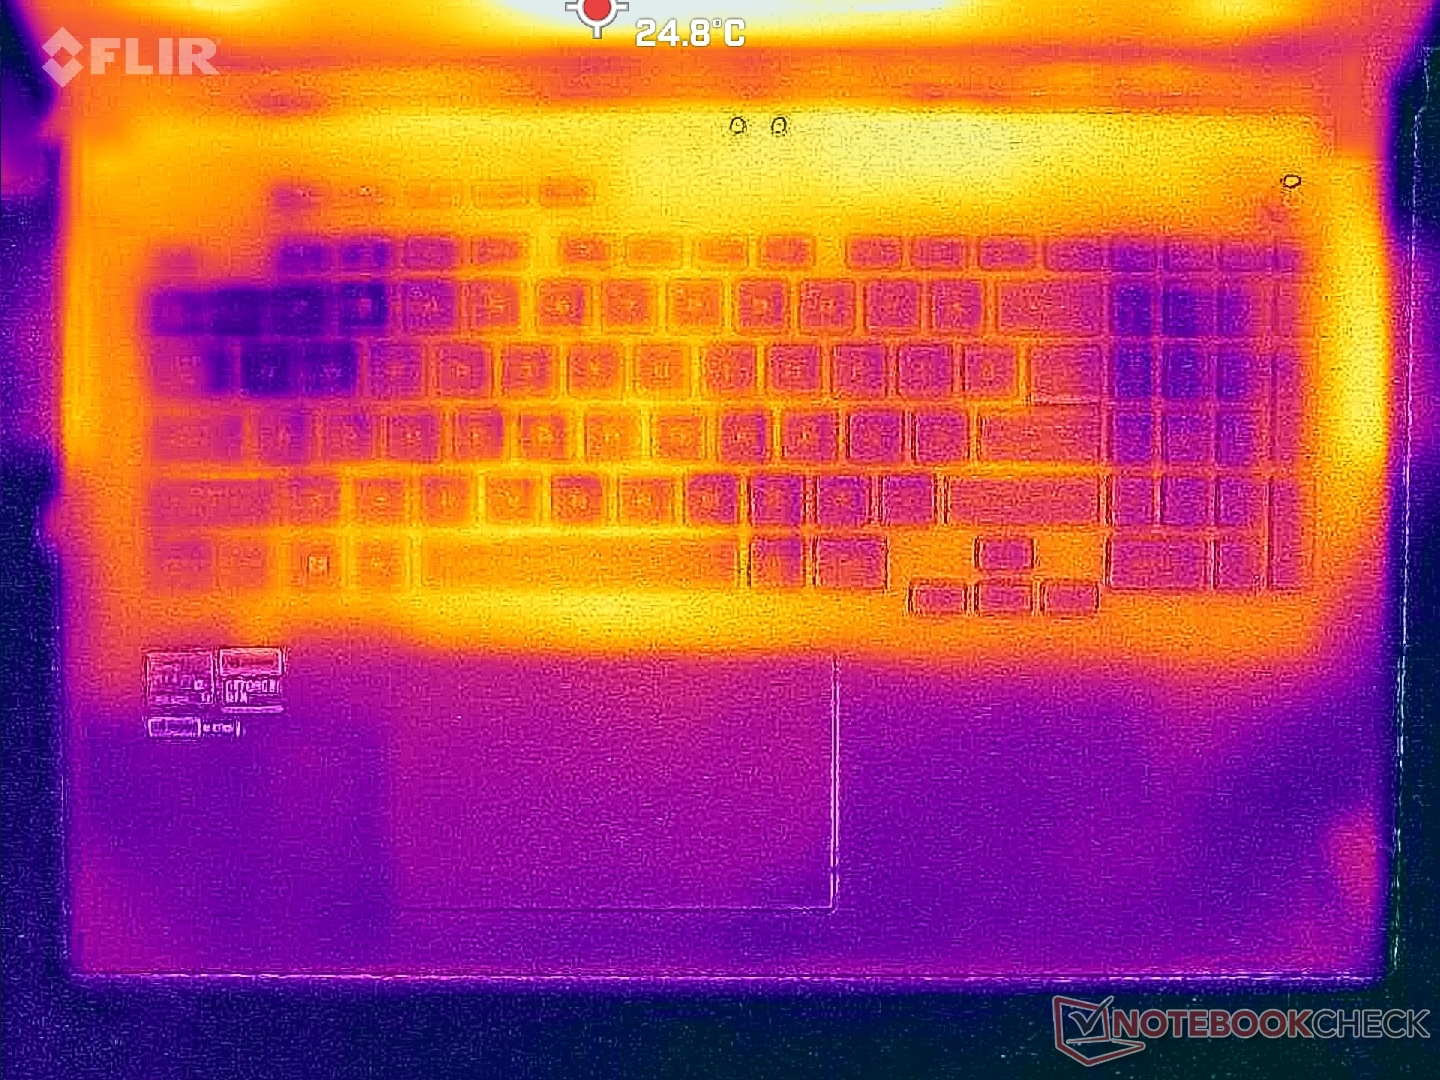
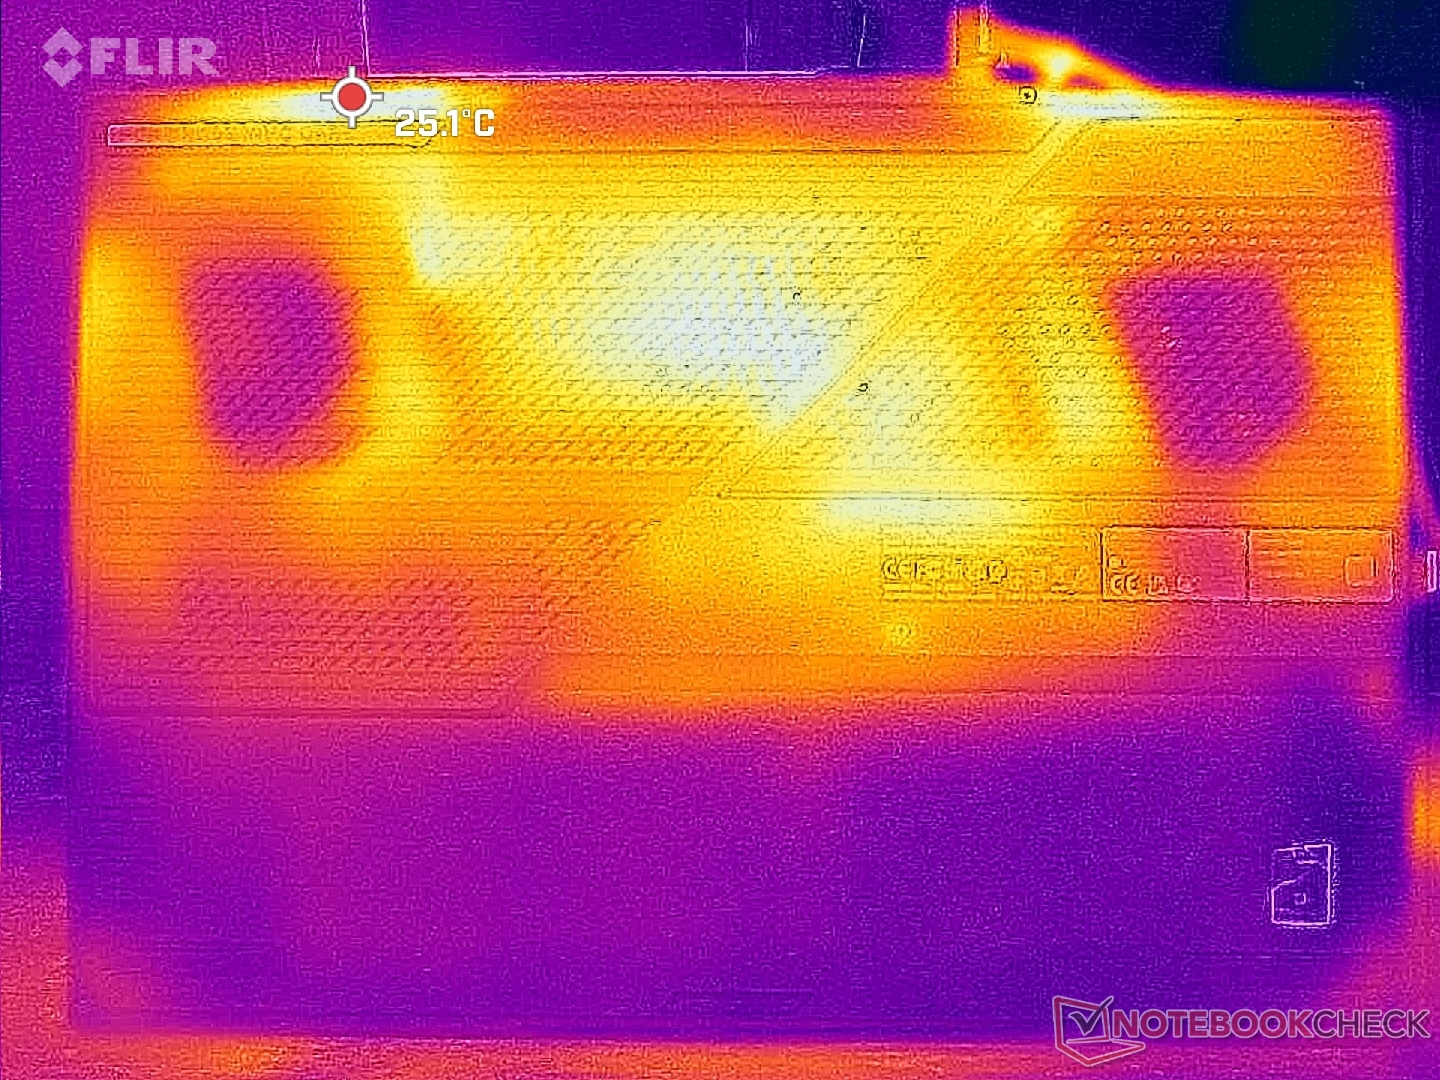
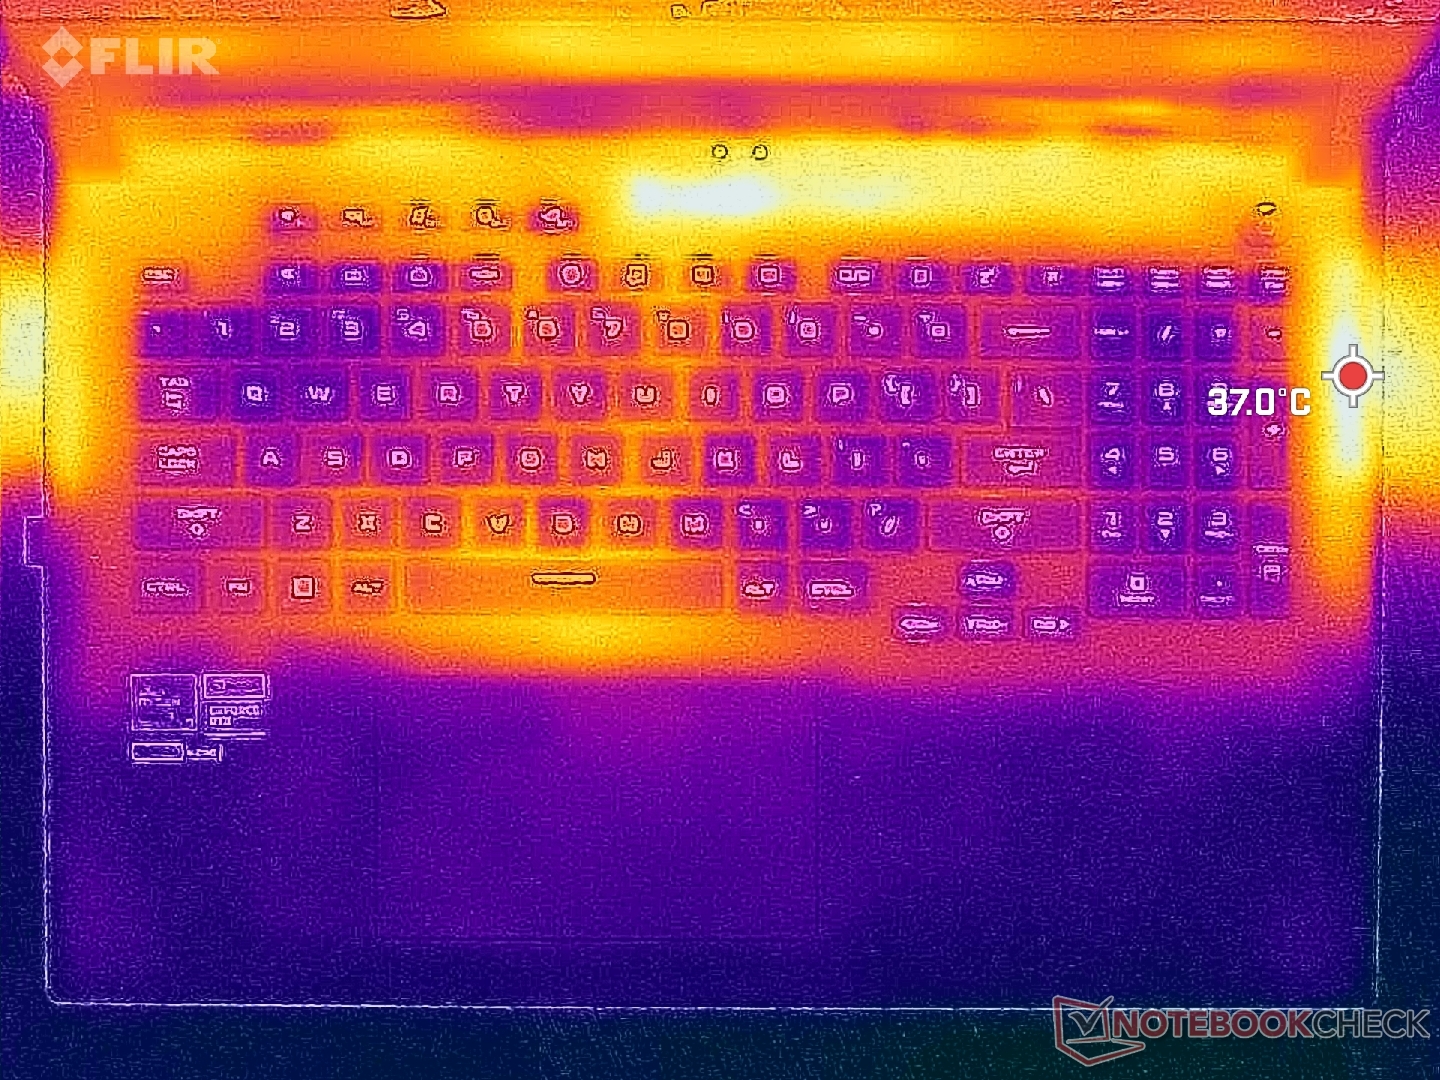
Grande parte do teclado e dos descansos para as mãos permanecem frios quando se joga. Em vez disso, há pontos quentes ao longo das bordas do baralho onde os dedos têm menos probabilidade de se tocar.
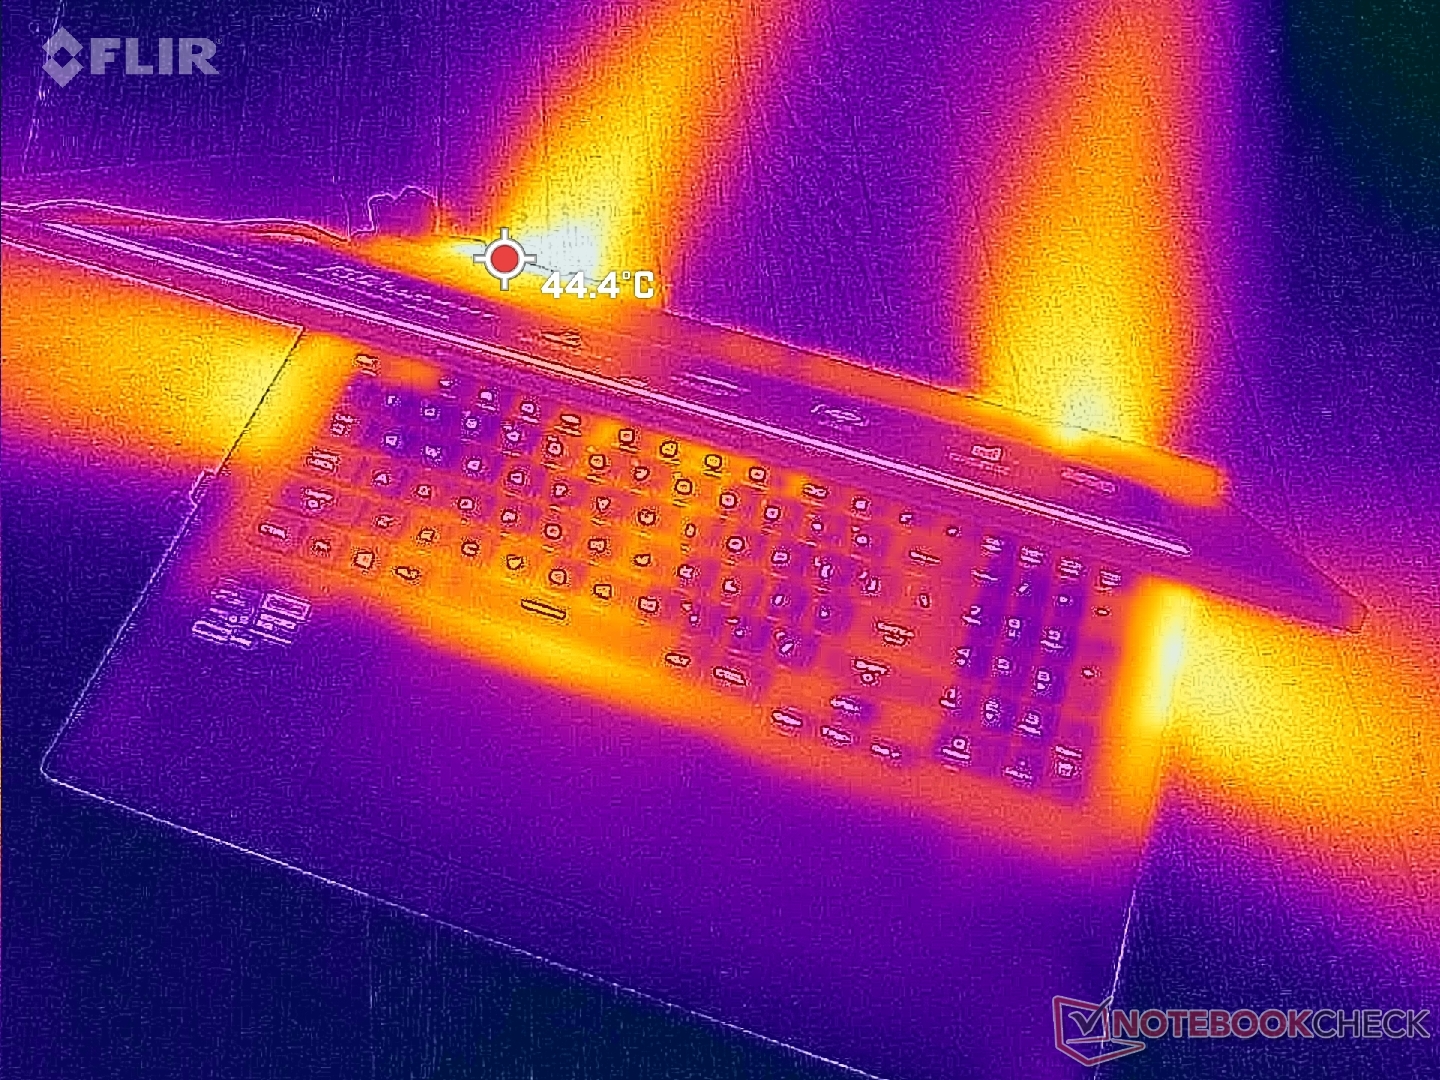
(+) A temperatura máxima no lado superior é 34.6 °C / 94 F, em comparação com a média de 40.4 °C / 105 F , variando de 21.2 a 68.8 °C para a classe Gaming.
(+) A parte inferior aquece até um máximo de 35.6 °C / 96 F, em comparação com a média de 43.2 °C / 110 F
(+) Em uso inativo, a temperatura média para o lado superior é 23.2 °C / 74 F, em comparação com a média do dispositivo de 33.9 °C / ### class_avg_f### F.
(+) Jogando The Witcher 3, a temperatura média para o lado superior é 27.3 °C / 81 F, em comparação com a média do dispositivo de 33.9 °C / ## #class_avg_f### F.
(+) Os apoios para as mãos e o touchpad são mais frios que a temperatura da pele, com um máximo de 20.8 °C / 69.4 F e, portanto, são frios ao toque.
(+) A temperatura média da área do apoio para as mãos de dispositivos semelhantes foi 28.8 °C / 83.8 F (+8 °C / 14.4 F).
| Asus ROG Strix Scar 17 G733PY-XS96 AMD Ryzen 9 7945HX, NVIDIA GeForce RTX 4090 Laptop GPU | MSI GE78HX 13VH-070US Intel Core i9-13950HX, NVIDIA GeForce RTX 4080 Laptop GPU | Eluktronics Mech-17 GP2 Intel Core i9-13900HX, NVIDIA GeForce RTX 4090 Laptop GPU | Asus ROG Strix G17 G713PI AMD Ryzen 9 7945HX, NVIDIA GeForce RTX 4070 Laptop GPU | Aorus 17X XES Intel Core i9-12900HX, NVIDIA GeForce RTX 3070 Ti Laptop GPU | Alienware m17 R5 (R9 6900HX, RX 6850M XT) AMD Ryzen 9 6900HX, AMD Radeon RX 6850M XT | |
|---|---|---|---|---|---|---|
| Heat | -13% | -13% | -18% | -46% | -29% | |
| Maximum Upper Side * (°C) | 34.6 | 37.4 -8% | 39 -13% | 42 -21% | 54 -56% | 53 -53% |
| Maximum Bottom * (°C) | 35.6 | 45 -26% | 44 -24% | 41 -15% | 58 -63% | 56 -57% |
| Idle Upper Side * (°C) | 27.2 | 29.8 -10% | 31 -14% | 33 -21% | 37 -36% | 30 -10% |
| Idle Bottom * (°C) | 30 | 32.4 -8% | 29.8 1% | 34 -13% | 39 -30% | 29 3% |
* ... menor é melhor
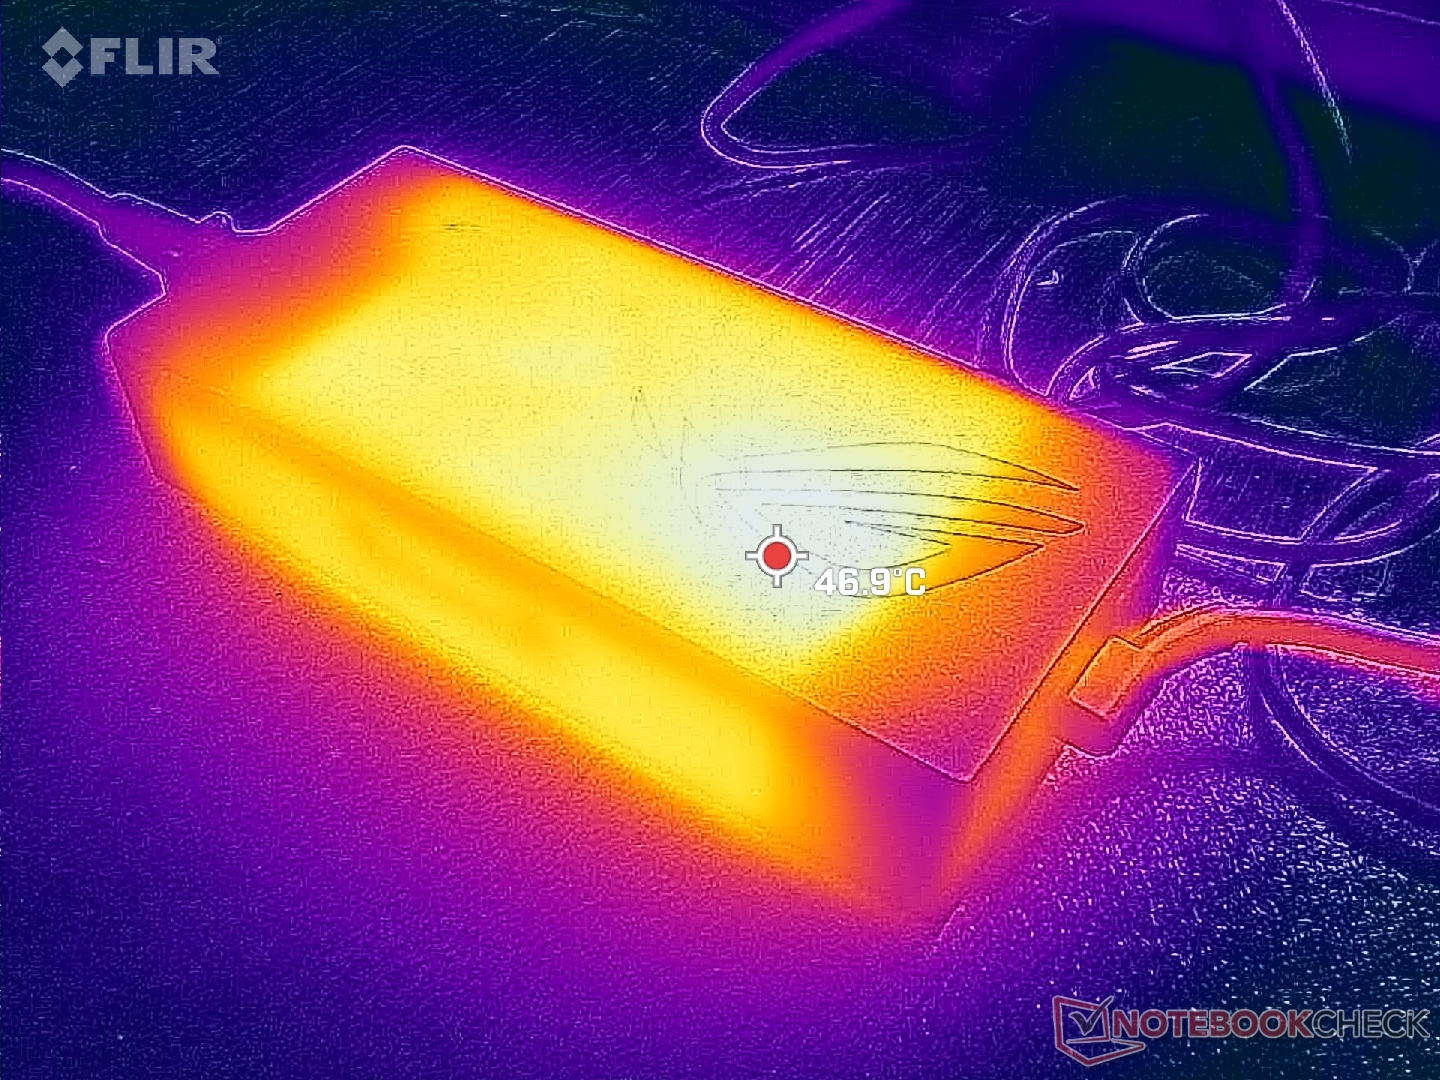
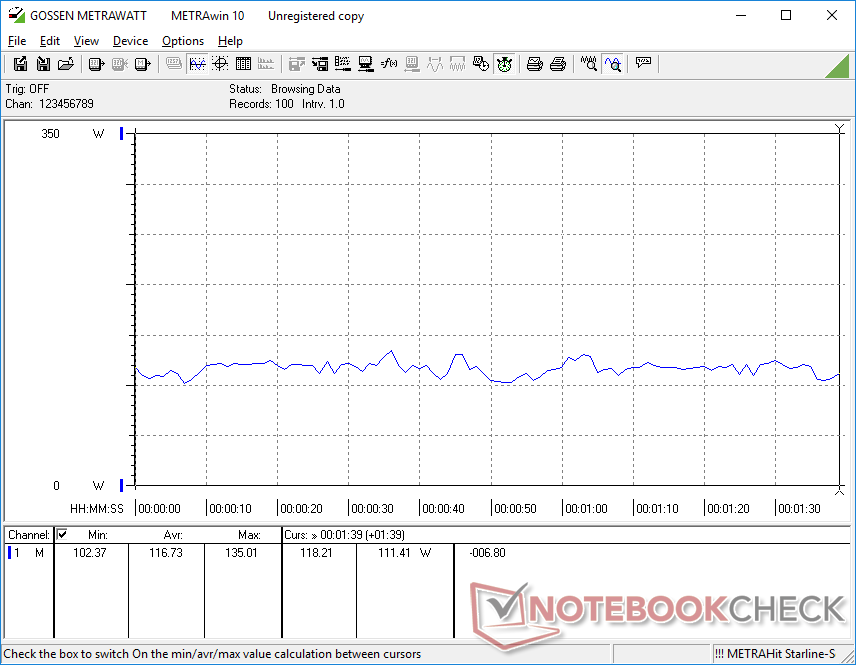
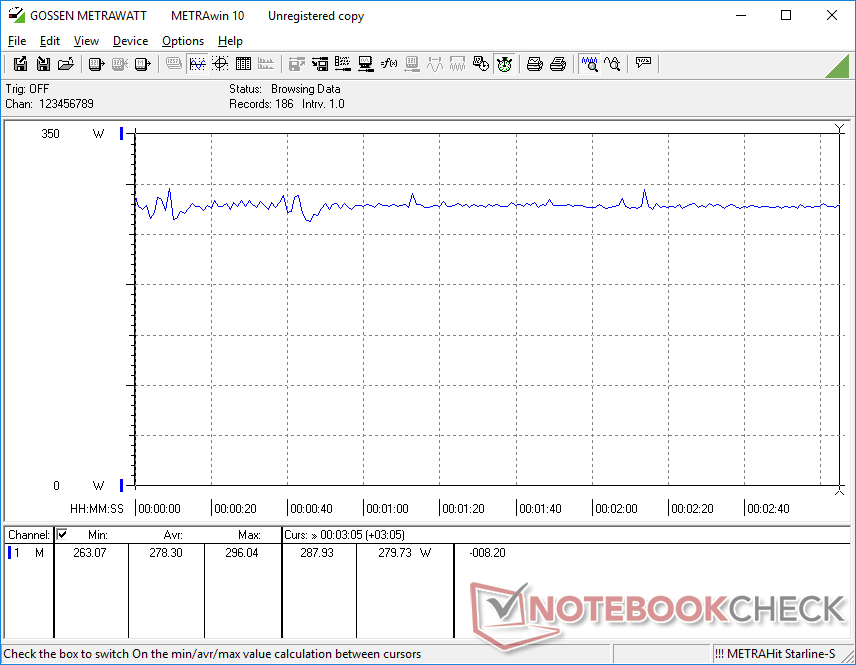
Teste de estresse - Temperatura do núcleo quente
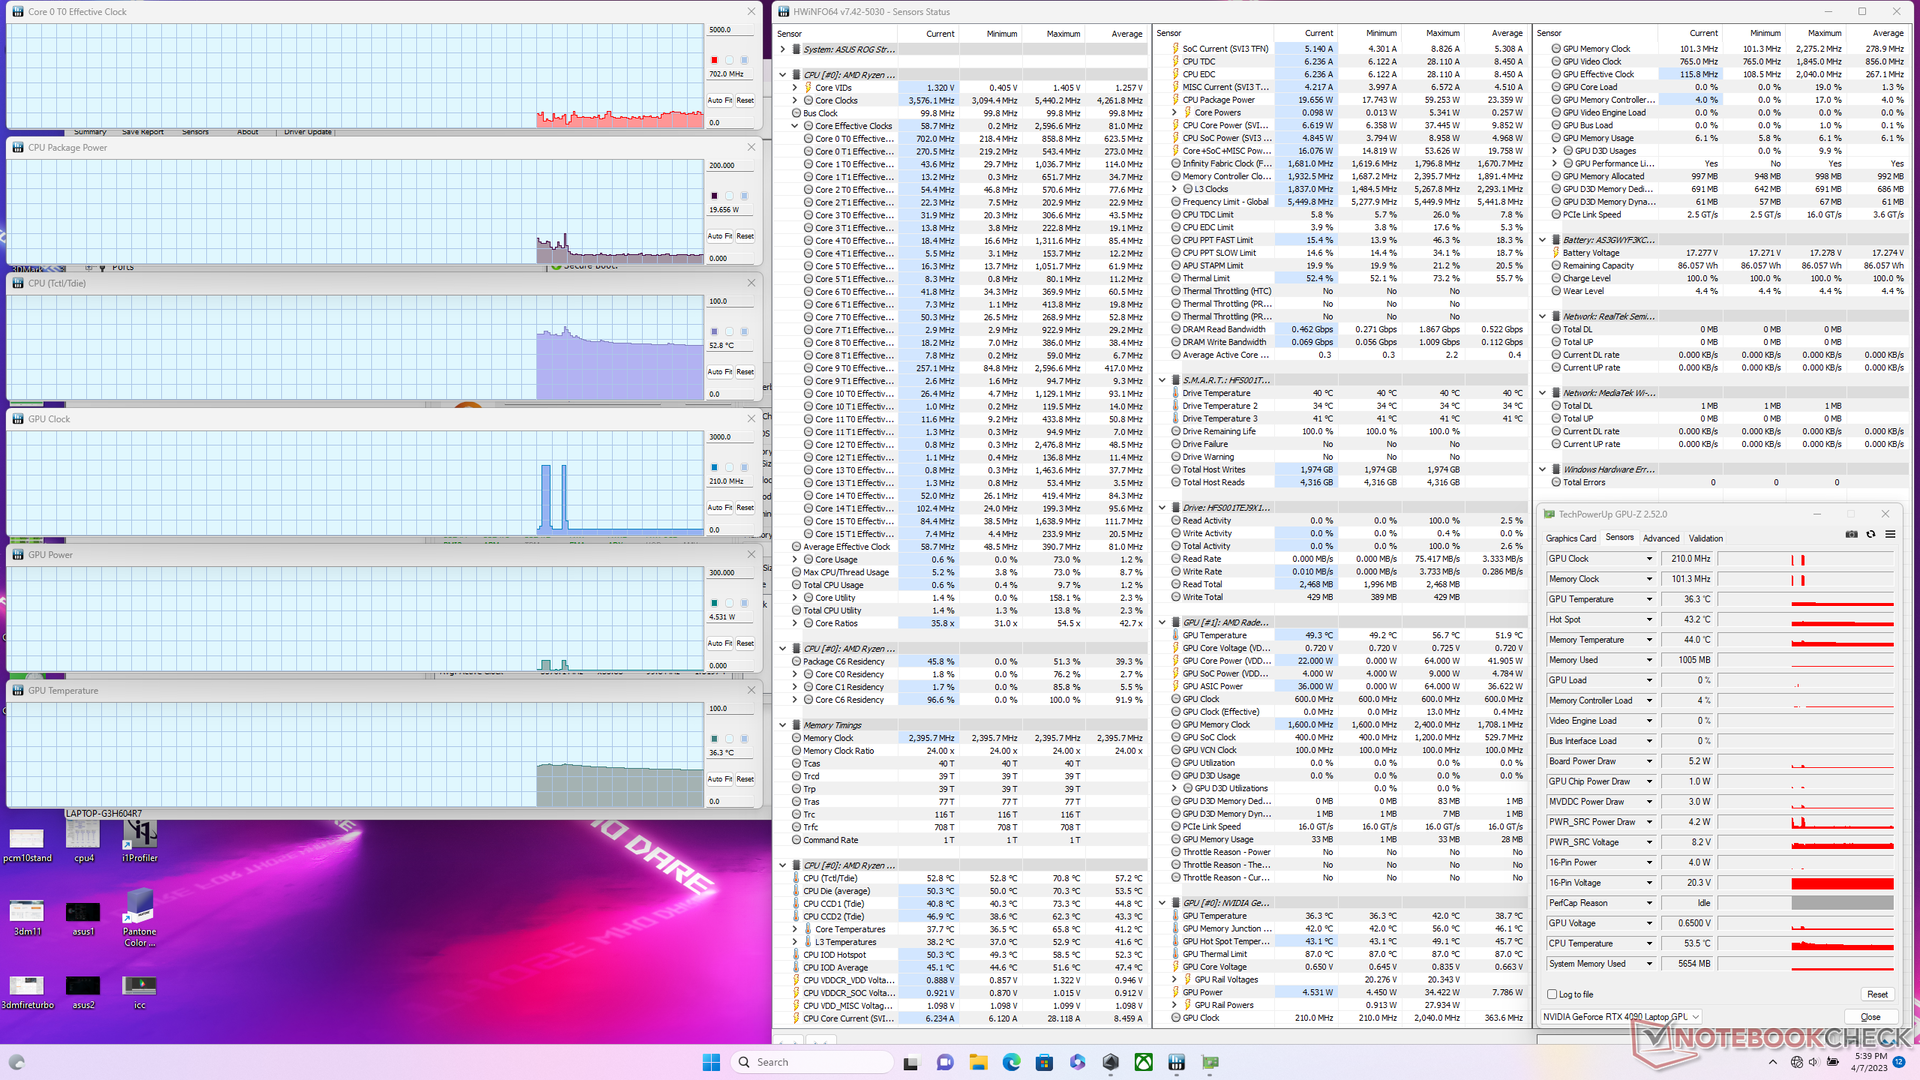
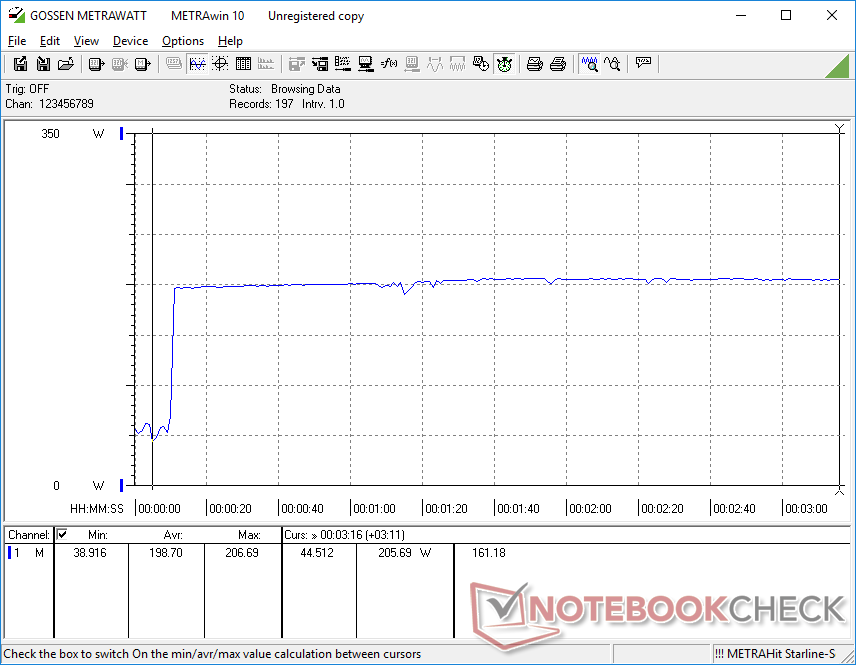
Quando estressada sob Prime95, a CPU ciclaria entre 4,2 e 4,9 GHz, mantendo a potência de um pacote de CPU entre 114 W e 128 W. A temperatura central seria muito alta a mais de 90 C, no entanto.
A taxa de clock GPU, relógio de memória, temperatura e consumo de energia da placa se estabilizariam em 2055 MHz, 2250 MHz, 79 C e 149 W, respectivamente, quando em funcionamento Witcher 3 no modo Performance. Estes valores mudariam para 2280 MHz, 2275 MHz, 74 C, e 170 W quando ajustados para o modo Turbo. Assim, o modo Turbo é necessário para se aproximar do TGP de 175 W anunciado do RTX 4090 móvel.
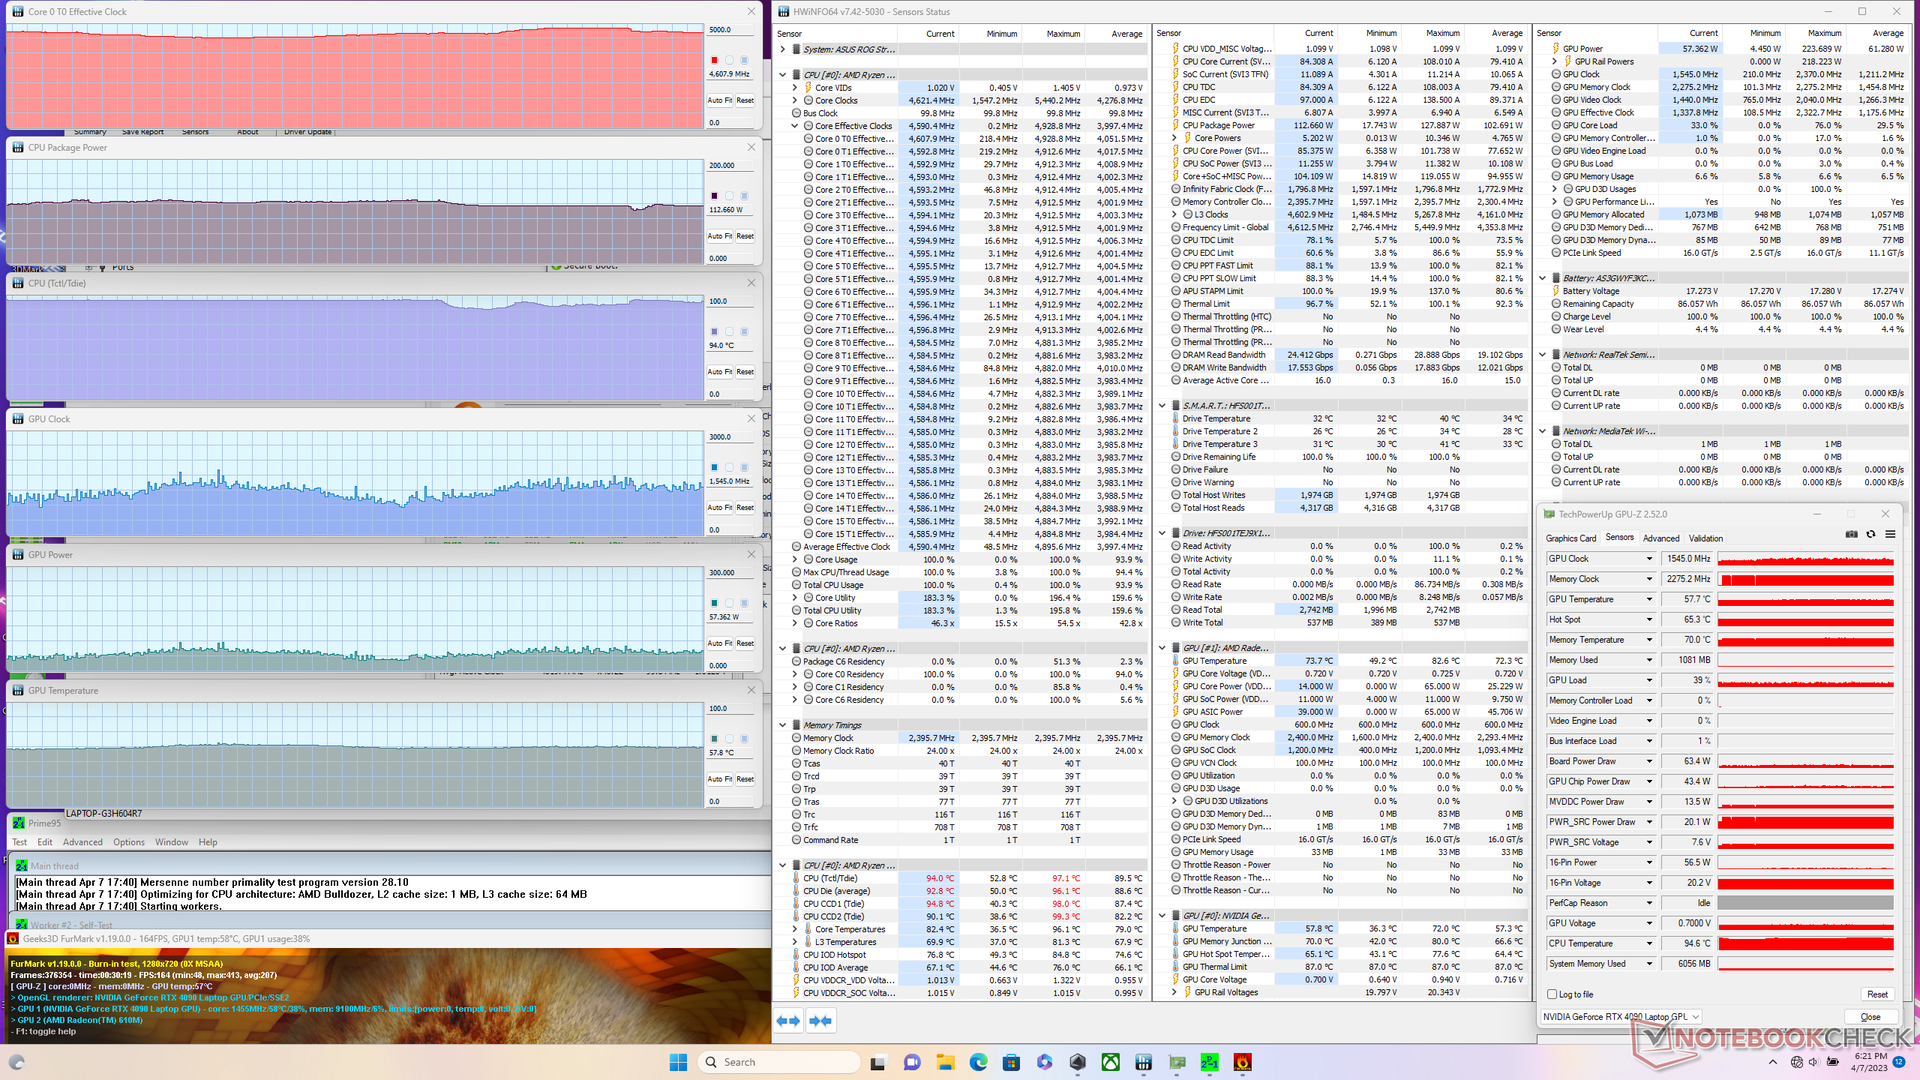
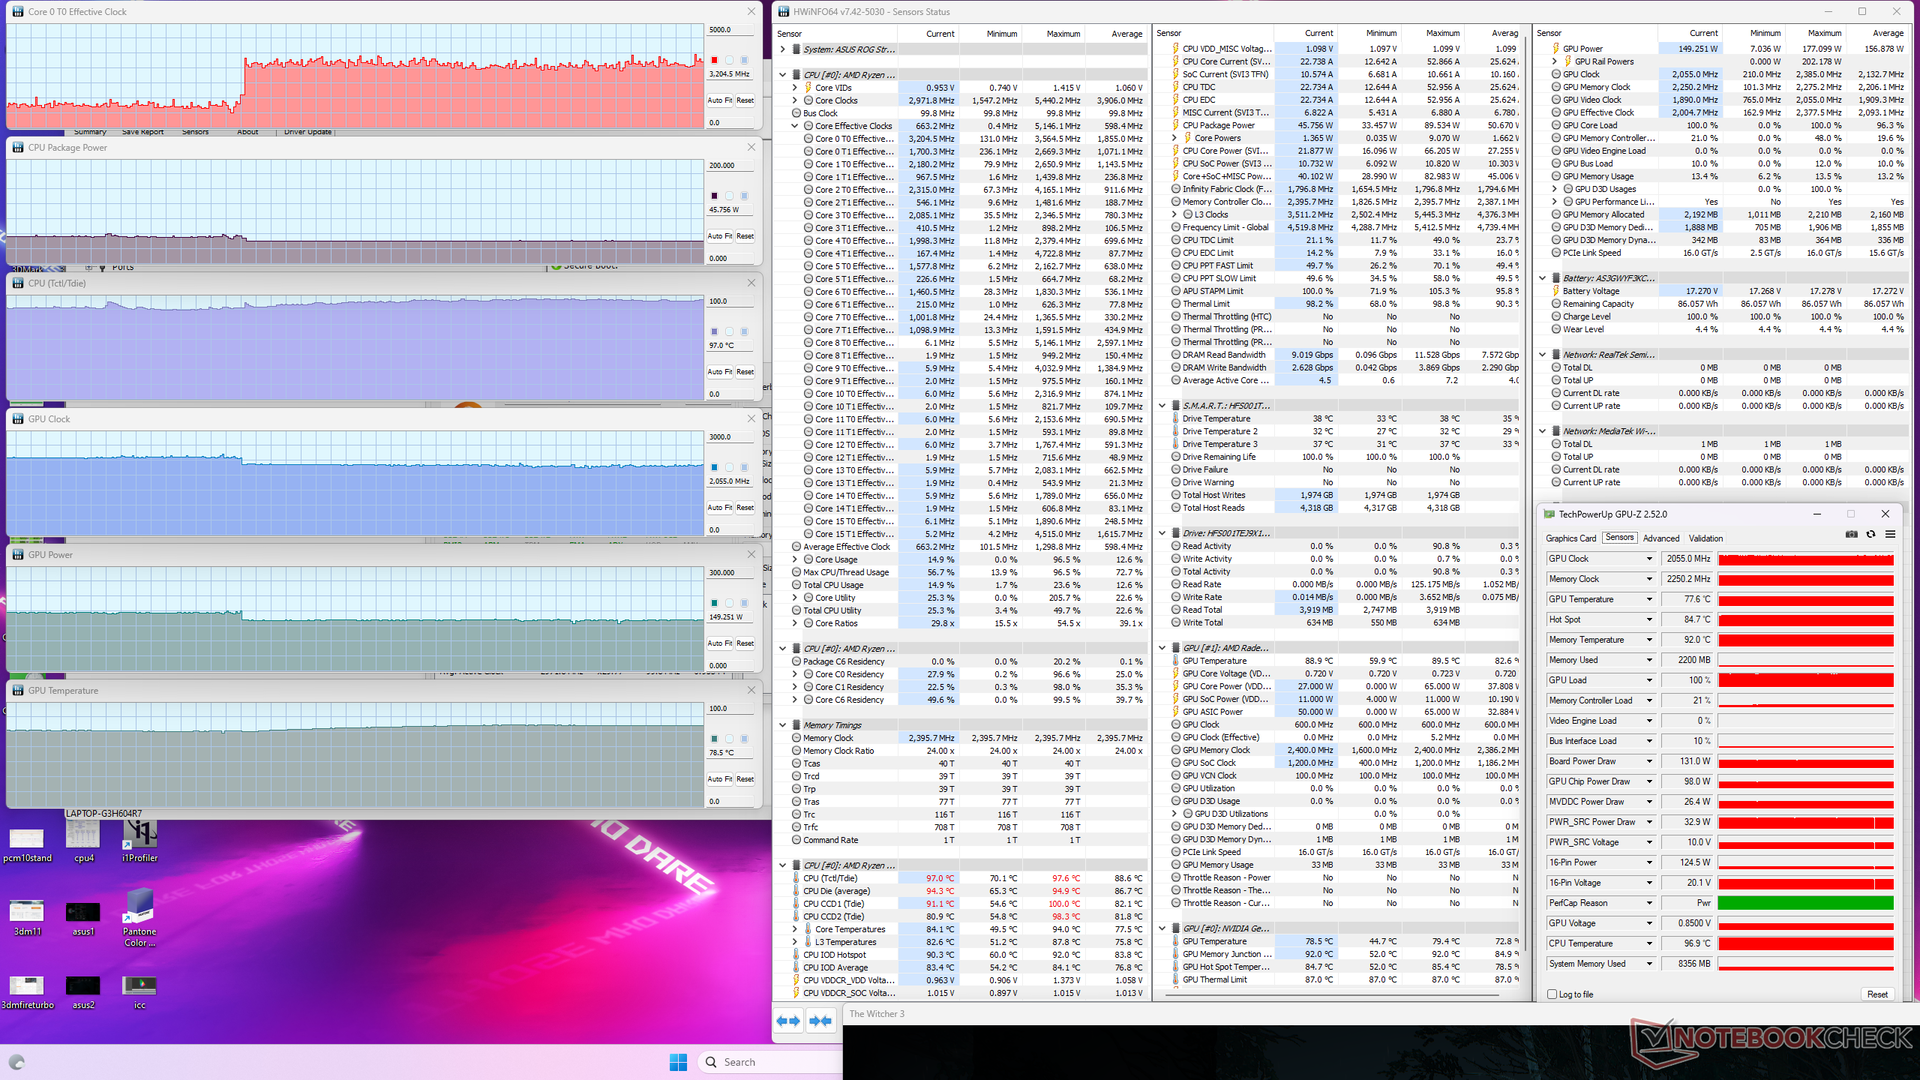
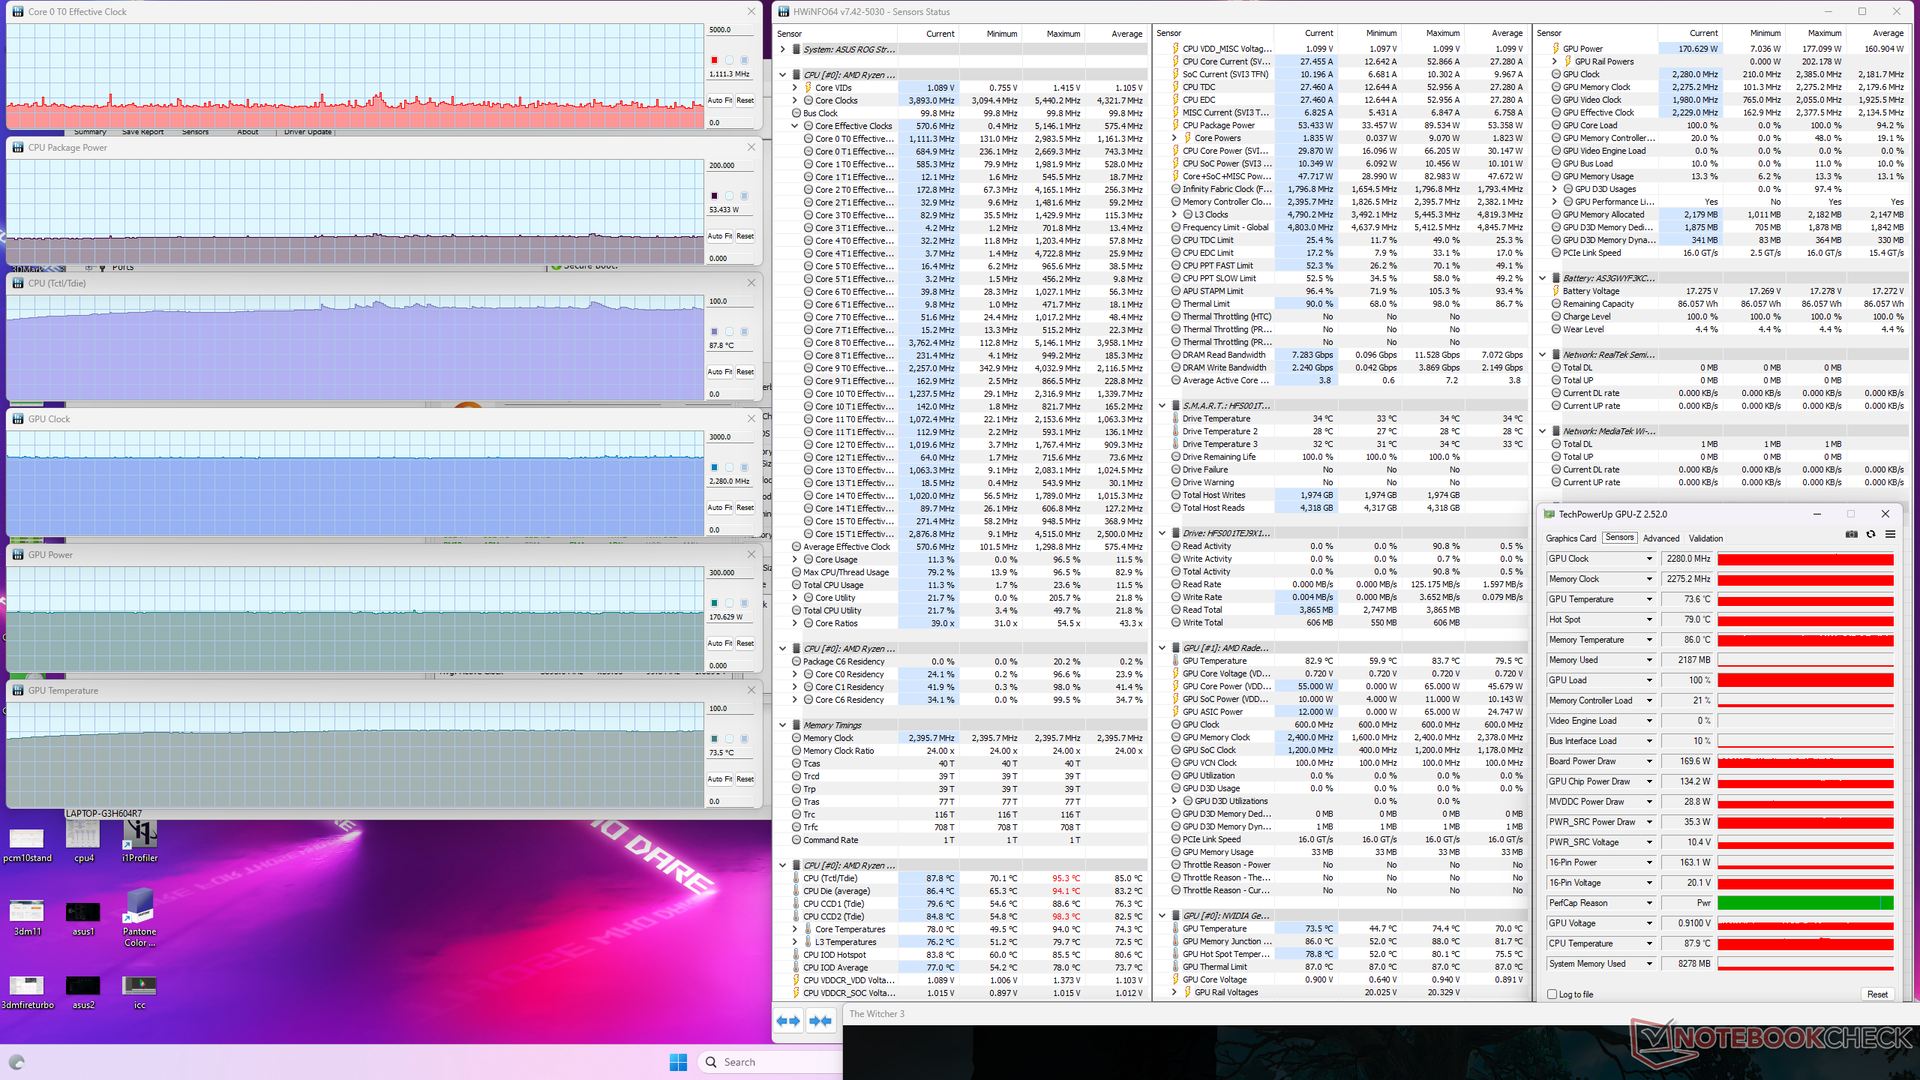
| Relógio CPU (GHz) | Relógio GPU (MHz) | Temperatura média da CPU (°C) | Temperatura média da GPU (°C) | |
| System Idle | -- | -- | 53 | 36 |
| Prime95 Stress | 4.2 - 4.9 | -- | 90 - 94 | 51 |
| Prime95 + FurMark Stress | 4.2 - 4.8 | ~850 - 1545 | 94 | 58 |
| Witcher 3 Estresse (modo de desempenho) | ~3.2 | 2055 | 97 | 79 |
| Witcher 3 Stress (modo Turbo) | ~1.1 | 2280 | 88 | 74 |
Oradores
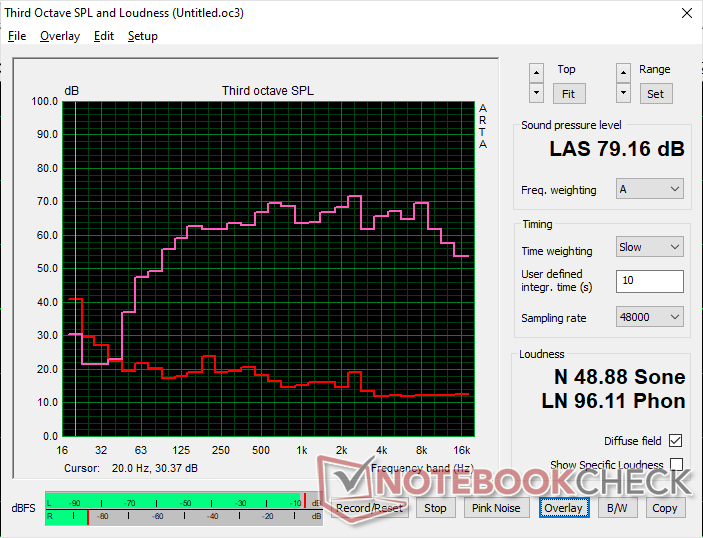
Asus ROG Strix Scar 17 G733PY-XS96 análise de áudio
(±) | o volume do alto-falante é médio, mas bom (###valor### dB)
Graves 100 - 315Hz
(+) | bons graves - apenas 2.8% longe da mediana
(+) | o baixo é linear (5.6% delta para a frequência anterior)
Médios 400 - 2.000 Hz
(+) | médios equilibrados - apenas 2.9% longe da mediana
(+) | médios são lineares (4.7% delta para frequência anterior)
Altos 2 - 16 kHz
(+) | agudos equilibrados - apenas 3.5% longe da mediana
(±) | a linearidade dos máximos é média (10% delta para frequência anterior)
Geral 100 - 16.000 Hz
(+) | o som geral é linear (9.3% diferença em relação à mediana)
Comparado com a mesma classe
» 3% de todos os dispositivos testados nesta classe foram melhores, 2% semelhantes, 95% piores
» O melhor teve um delta de 6%, a média foi 18%, o pior foi 132%
Comparado com todos os dispositivos testados
» 3% de todos os dispositivos testados foram melhores, 1% semelhantes, 96% piores
» O melhor teve um delta de 4%, a média foi 23%, o pior foi 134%
Apple MacBook Pro 16 2021 M1 Pro análise de áudio
(+) | os alto-falantes podem tocar relativamente alto (###valor### dB)
Graves 100 - 315Hz
(+) | bons graves - apenas 3.8% longe da mediana
(+) | o baixo é linear (5.2% delta para a frequência anterior)
Médios 400 - 2.000 Hz
(+) | médios equilibrados - apenas 1.3% longe da mediana
(+) | médios são lineares (2.1% delta para frequência anterior)
Altos 2 - 16 kHz
(+) | agudos equilibrados - apenas 1.9% longe da mediana
(+) | os máximos são lineares (2.7% delta da frequência anterior)
Geral 100 - 16.000 Hz
(+) | o som geral é linear (4.6% diferença em relação à mediana)
Comparado com a mesma classe
» 0% de todos os dispositivos testados nesta classe foram melhores, 0% semelhantes, 100% piores
» O melhor teve um delta de 5%, a média foi 17%, o pior foi 45%
Comparado com todos os dispositivos testados
» 0% de todos os dispositivos testados foram melhores, 0% semelhantes, 100% piores
» O melhor teve um delta de 4%, a média foi 23%, o pior foi 134%
Gestão de Energia - Máquina Exigente
Consumo de energia
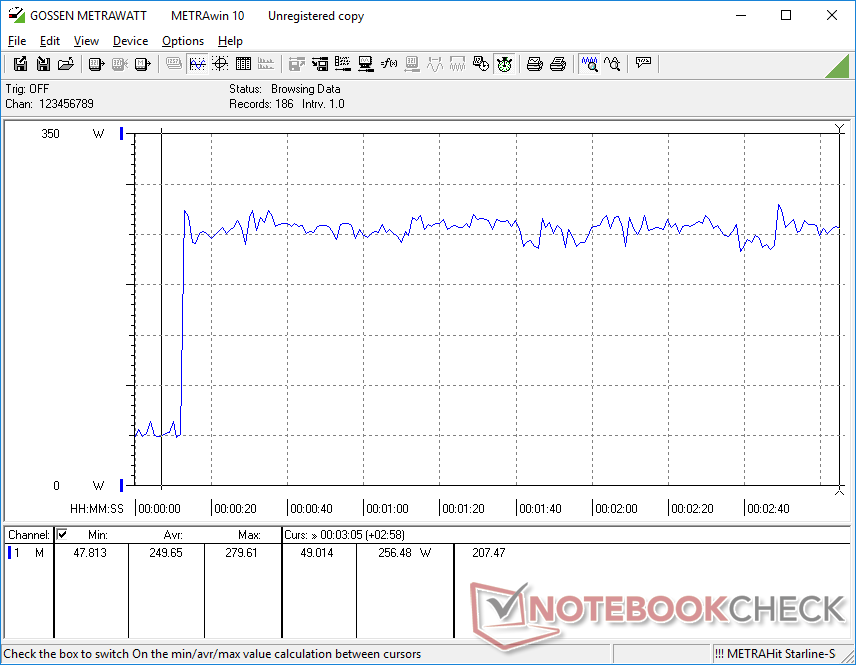
Nosso modelo 2023 é geralmente mais sedento de energia do que o modelo 2022 da Intel. Ao rodar Prime95, por exemplo, o consumo de energia se estabilizaria em 205 W contra apenas 117 W na configuração i9-12950HX do ano passado. Da mesma forma, rodando Witcher 3 consumiria cerca de 24% mais energia sobre a configuração RTX 3080 Ti mais antiga. O desempenho pode ser mais rápido de geração para geração, mas o consumo também aumentou.
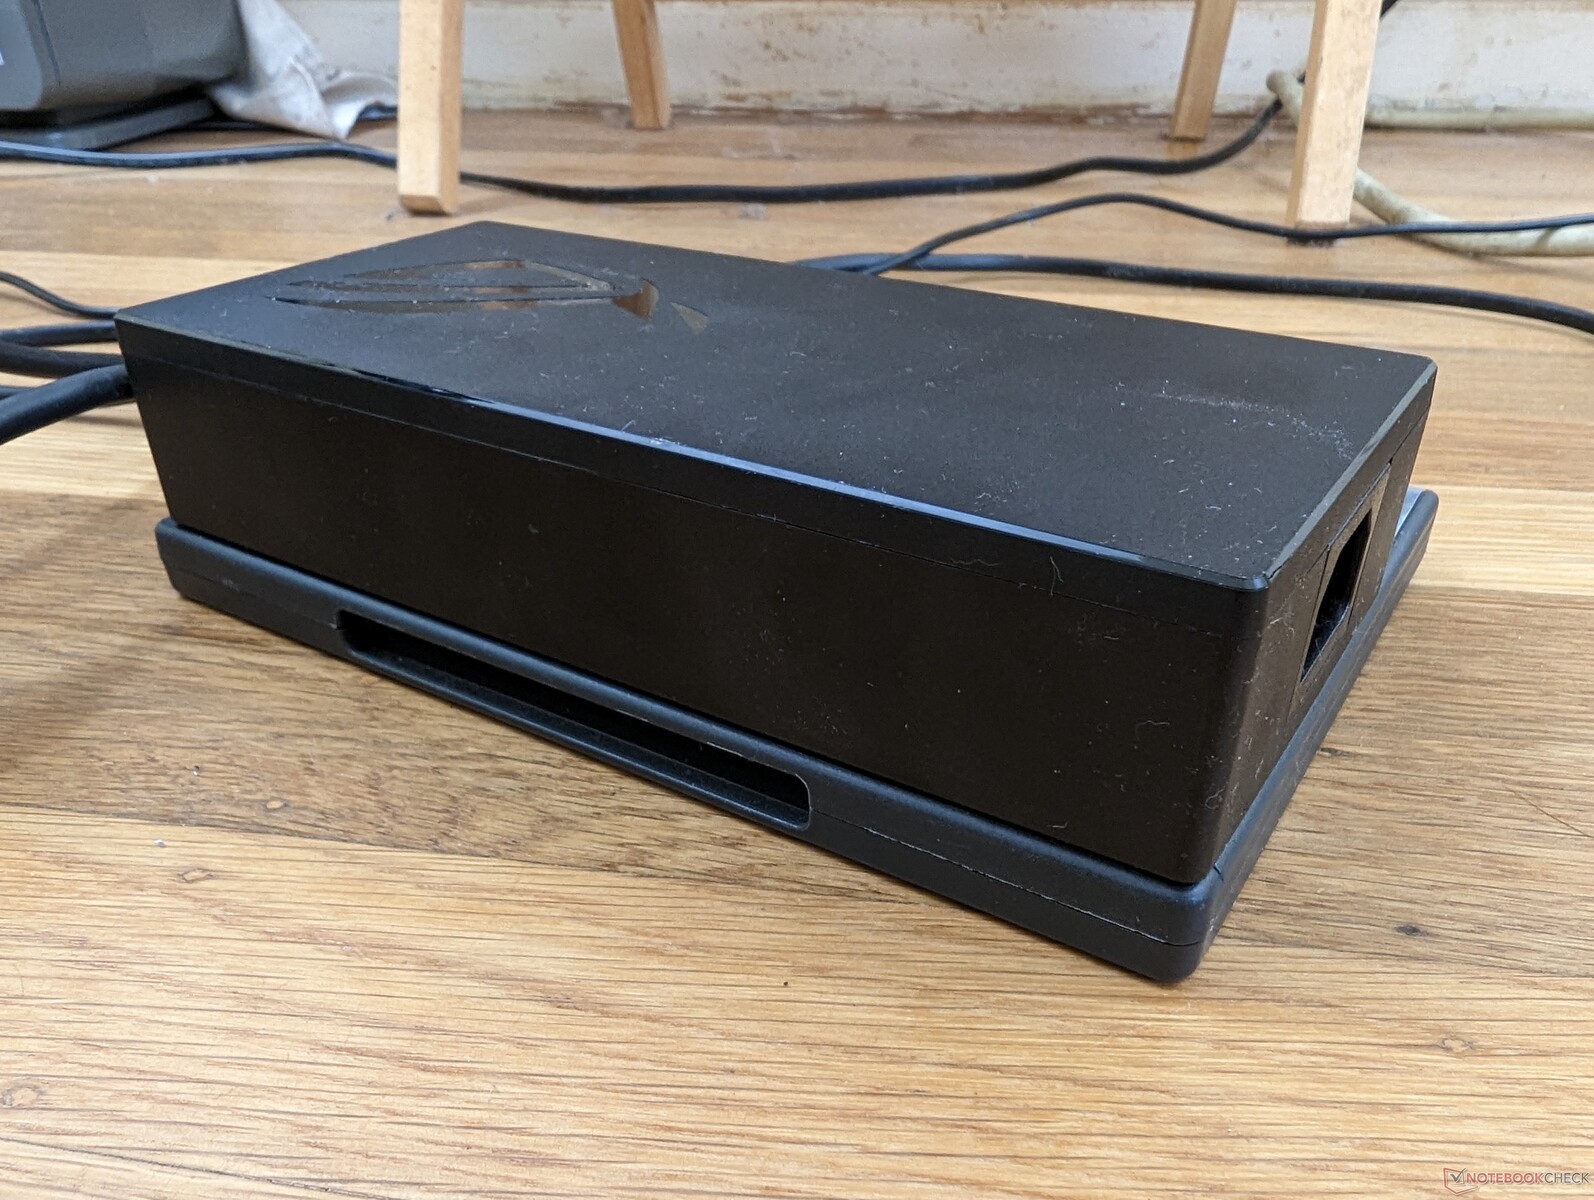
Somos capazes de registrar um consumo máximo de 280 W do adaptador AC grande (~18,4 x 8,4 x 3,6 cm) de 330 W.
| desligado | |
| Ocioso | |
| Carga |
|
Key:
min: | |
| Asus ROG Strix Scar 17 G733PY-XS96 R9 7945HX, GeForce RTX 4090 Laptop GPU, SK hynix PC801 HFS001TEJ9X101N, IPS, 2560x1440, 17.3" | MSI GE78HX 13VH-070US i9-13950HX, GeForce RTX 4080 Laptop GPU, Samsung PM9A1 MZVL22T0HBLB, IPS, 2560x1600, 17" | Eluktronics Mech-17 GP2 i9-13900HX, GeForce RTX 4090 Laptop GPU, Samsung PM9A1 MZVL21T0HCLR, IPS, 2560x1600, 17" | Asus ROG Strix G17 G713PI R9 7945HX, GeForce RTX 4070 Laptop GPU, WD PC SN560 SDDPNQE-1T00, IPS, 2560x1440, 17.3" | Aorus 17X XES i9-12900HX, GeForce RTX 3070 Ti Laptop GPU, Gigabyte AG470S1TB-SI B10, IPS, 1920x1080, 17.3" | Alienware m17 R5 (R9 6900HX, RX 6850M XT) R9 6900HX, Radeon RX 6850M XT, SSSTC CA6-8D1024, IPS, 3840x2160, 17" | |
|---|---|---|---|---|---|---|
| Power Consumption | -3% | -1% | 13% | -9% | 23% | |
| Idle Minimum * (Watt) | 14.5 | 16.1 -11% | 14 3% | 15 -3% | 18 -24% | 13 10% |
| Idle Average * (Watt) | 21.1 | 24 -14% | 19.3 9% | 20 5% | 28 -33% | 16.5 22% |
| Idle Maximum * (Watt) | 42.8 | 34 21% | 36.8 14% | 29 32% | 36 16% | 17 60% |
| Load Average * (Watt) | 116.7 | 123.6 -6% | 117.2 -0% | 121 -4% | 153 -31% | 93 20% |
| Witcher 3 ultra * (Watt) | 278 | 286 -3% | 304 -9% | 179.8 35% | 221 21% | 239 14% |
| Load Maximum * (Watt) | 279.6 | 285.7 -2% | 342.5 -22% | 246 12% | 290 -4% | 251 10% |
* ... menor é melhor
Power Consumption Witcher 3 / Stresstest
Power Consumption external Monitor
Vida útil da bateria
O tempo de execução da WLAN é de aproximadamente 4 horas em média quando no perfil Balanceado com Optimus e iGPU ativo. Outros laptops de 17 polegadas para jogos como o ROG Strix G17 G713PI ouAorus 17X XES retornariam resultados semelhantes.
O sistema pode ser recarregado através de adaptadores USB-C de terceiros. Alguns adaptadores podem não funcionar; nosso carregador USB-C Lenovo 135 W funcionaria sem problemas enquanto nosso carregador USB-C Dell XPS de 130 W não recarregaria em absoluto.
| Asus ROG Strix Scar 17 G733PY-XS96 R9 7945HX, GeForce RTX 4090 Laptop GPU, 90 Wh | MSI GE78HX 13VH-070US i9-13950HX, GeForce RTX 4080 Laptop GPU, 99 Wh | Eluktronics Mech-17 GP2 i9-13900HX, GeForce RTX 4090 Laptop GPU, 99 Wh | Asus ROG Strix G17 G713PI R9 7945HX, GeForce RTX 4070 Laptop GPU, 90 Wh | Aorus 17X XES i9-12900HX, GeForce RTX 3070 Ti Laptop GPU, 99 Wh | Alienware m17 R5 (R9 6900HX, RX 6850M XT) R9 6900HX, Radeon RX 6850M XT, 97 Wh | |
|---|---|---|---|---|---|---|
| Duração da bateria | 49% | 24% | 5% | 7% | 17% | |
| WiFi v1.3 (h) | 4.1 | 6.1 49% | 5.1 24% | 4.3 5% | 4.4 7% | 4.8 17% |
| Reader / Idle (h) | 7.3 | |||||
| Load (h) | 1.5 | 1 | 1.4 | 1.8 | ||
| H.264 (h) | 2.8 | 3.8 | 4.9 | |||
| Witcher 3 ultra (h) | 1.1 |
Pro
Contra
Veredicto - Excelente desempenho com um olhar envelhecido
Para 2022, AMD e Nvidia introduziram as séries Zen 3+ e móvel GeForce 30 Ti para substituir as opções Zen 3 e não Ti de 2021, respectivamente. As atualizações provaram ser relativamente menores, porém, pois as opções mais recentes não trouxeram nada de novo no nível arquitetônico. Para 2023, as séries Zen 4 e móvel GeForce RTX 40 finalmente trouxeram as atualizações significativas de desempenho que os jogadores de laptop estavam esperando. O consumo de energia pode ser maior, mas o aumento de potência compensa especialmente porque o Ryzen 9 7945HX é um pouco mais rápido e mais eficiente em termos de potência do que o Core i9-13950HX do 13º gênero concorrente.
O 2023 ROG Strix Scar 17 mostra o Ryzen 9 7945HX e GeForce RTX 4090 no seu melhor. Algumas características externas do projeto, no entanto, poderiam ser atualizadas.
Embora os processadores sejam impressionantes este ano, o design externo geral do ROG Strix Scar 17 poderia usar uma atualização maior. A temperatura da CPU quando os jogos são mais altos do que o esperado, por exemplo, enquanto o PCIe4 x4 SSD aciona o acelerador após alguns minutos de uso pesado. As pequenas teclas numpad e setas ainda estão apertadas e algumas etiquetas secundárias nas teclas do teclado ainda não se acendem quando a luz de fundo está ativa. Alguns modelos concorrentes como o mais fino MSI GE78 também passaram para 16:10, enquanto a série Strix Scar 17 continua a ser 16:9. O modelo arrisca-se a parecer e a se sentir velho mais cedo, mesmo que seu desempenho seja tudo menos lento.
Preço e Disponibilidade
Nome preço e disponibilidade do modelo testado, se necessário desviando as variantes relevantes do equipamento. Afilie o link a uma loja da lista na janela de link.
Asus ROG Strix Scar 17 G733PY-XS96
- 04/10/2023 v7 (old)
Allen Ngo
Transparência
A seleção dos dispositivos a serem analisados é feita pela nossa equipe editorial. A amostra de teste foi fornecida ao autor como empréstimo pelo fabricante ou varejista para fins desta revisão. O credor não teve influência nesta revisão, nem o fabricante recebeu uma cópia desta revisão antes da publicação. Não houve obrigação de publicar esta revisão. Como empresa de mídia independente, a Notebookcheck não está sujeita à autoridade de fabricantes, varejistas ou editores.
É assim que o Notebookcheck está testando
Todos os anos, o Notebookcheck analisa de forma independente centenas de laptops e smartphones usando procedimentos padronizados para garantir que todos os resultados sejam comparáveis. Desenvolvemos continuamente nossos métodos de teste há cerca de 20 anos e definimos padrões da indústria no processo. Em nossos laboratórios de teste, equipamentos de medição de alta qualidade são utilizados por técnicos e editores experientes. Esses testes envolvem um processo de validação em vários estágios. Nosso complexo sistema de classificação é baseado em centenas de medições e benchmarks bem fundamentados, o que mantém a objetividade.Price comparison

