Revisão Razer Blade 16 Early 2023 RTX 4090: Núcleo da besta i9-13950HX com o primeiro visor de modo dual mini-LED UHD+ do mundo
O novo Lâmina Razer 16junta-se à crescente lista de computadores portáteis para jogos da série Raptor Lake-HX e RTX 40 que se enfiam em tudo menos na pia da cozinha e custam tanto quanto um carro usado.
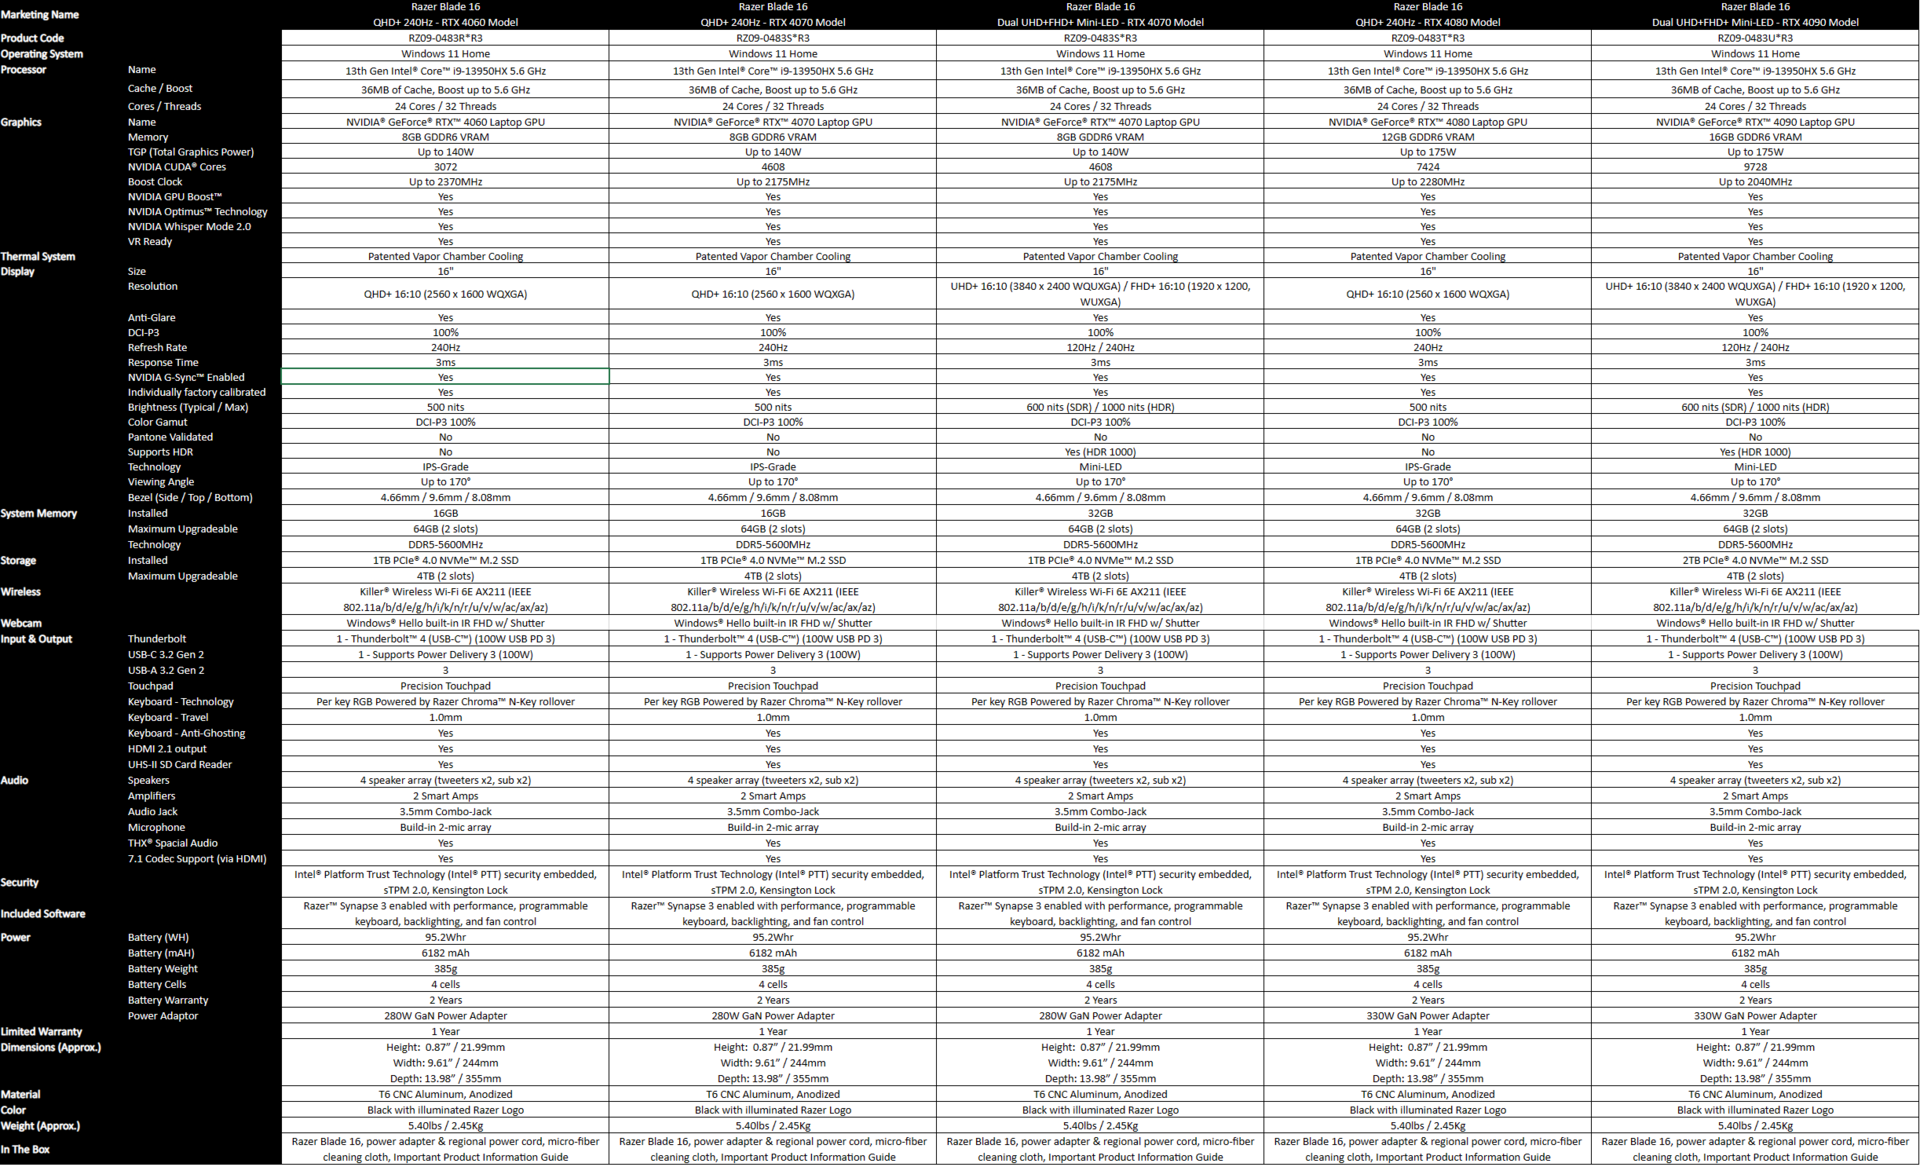
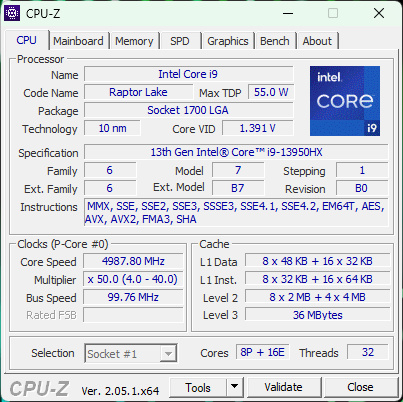
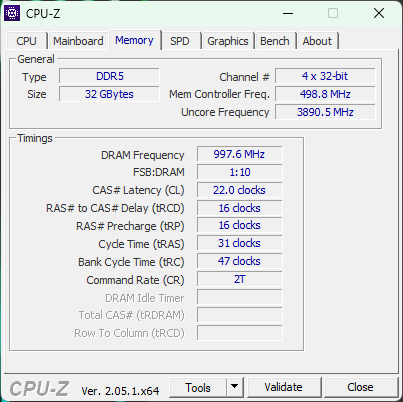
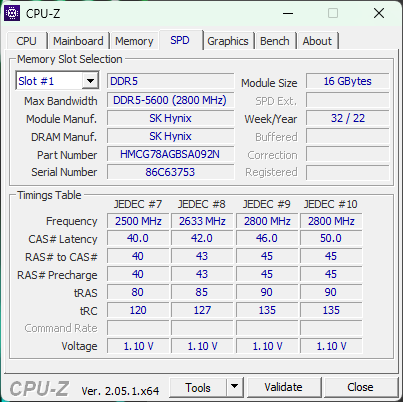
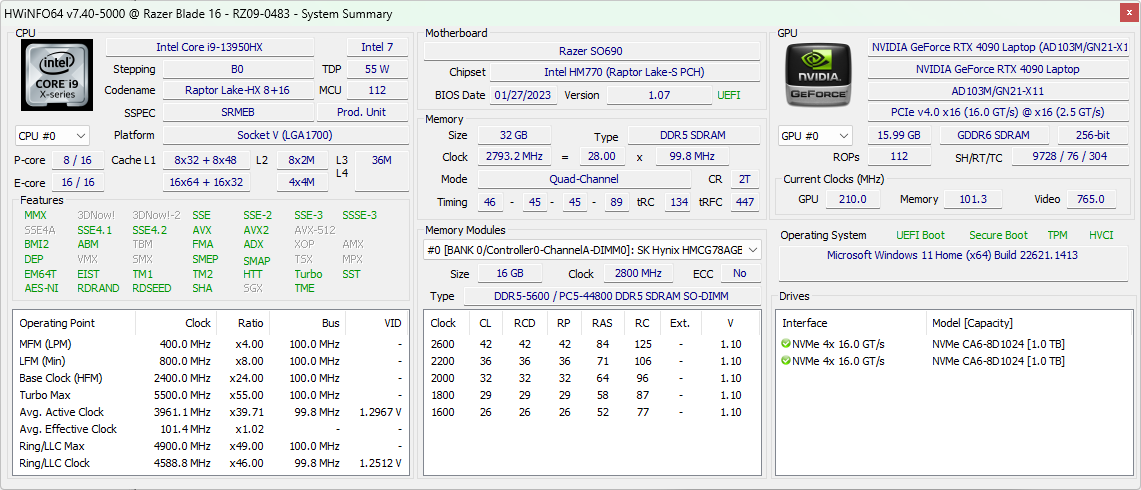
Nossa amostra de teste fornecida pela Nvidia Índia é alimentada pelo Núcleo i9-13950HX, GPU para notebook RTX 4090um display UHD de modo duplo de 16 polegadas, 32 GB DDR5-5600 RAM, 2x 1 TB NVMe SSDs, e uma bateria de 95,2 WHr. A Razer não vende seus produtos na Índia, mas esta configuração lhe atrasará em US$ 4.300 ou 5.000.
Revisamos anteriormente oLâmina Razer 16 Início de 2023alimentado pelo Intel Core i9-13950HX eNvidia GeForce RTX 4080 GPU para notebooke também o Lâmina 18 com a mesma CPU e oGPU para notebook RTX 4070.
Nesta revisão, testamos a variante RTX 4090 da GPU para laptops do Blade 16 Early 2023, comparamo-la com os dispositivos mais recentes este ano, e vemos se há algum benefício real em esbanjar mais US$700 no que já é uma configuração bastante grande.
O chassi, os dispositivos de entrada e outros componentes internos são idênticos à versão RTX 4080 da Lâmina 16, por isso, abordaremos apenas brevemente os mesmos aqui.
Possíveis concorrentes em comparação
Avaliação | Data | Modelo | Peso | Altura | Size | Resolução | Preço |
|---|---|---|---|---|---|---|---|
| 89.8 % v7 (old) | 03/2023 | Razer Blade 16 Early 2023 RTX 4090 i9-13950HX, GeForce RTX 4090 Laptop GPU | 2.5 kg | 21.99 mm | 16.00" | 3840x2400 | |
| 89.9 % v7 (old) | 03/2023 | Eluktronics Mech-17 GP2 i9-13900HX, GeForce RTX 4090 Laptop GPU | 2.9 kg | 27 mm | 17.00" | 2560x1600 | |
| 88 % v7 (old) | 04/2023 | Asus Zephyrus Duo 16 GX650PY-NM006W R9 7945HX, GeForce RTX 4090 Laptop GPU | 2.7 kg | 29.7 mm | 16.00" | 2560x1600 | |
| 89 % v7 (old) | 02/2023 | MSI Titan GT77 HX 13VI i9-13950HX, GeForce RTX 4090 Laptop GPU | 3.5 kg | 23 mm | 17.30" | 3840x2160 | |
| 86.6 % v7 (old) | 02/2023 | Asus ROG Strix Scar 18 2023 G834JY-N6005W i9-13980HX, GeForce RTX 4090 Laptop GPU | 3.1 kg | 30.8 mm | 18.00" | 2560x1600 | |
| 89.4 % v7 (old) | 03/2023 | Asus ROG Zephyrus M16 GU604VY-NM042X i9-13900H, GeForce RTX 4090 Laptop GPU | 2.3 kg | 22.9 mm | 16.00" | 2560x1600 | |
| 88.4 % v7 (old) | 03/2023 | Asus ROG Strix G16 G614JZ i9-13980HX, GeForce RTX 4080 Laptop GPU | 2.4 kg | 30.4 mm | 16.00" | 2560x1600 | |
| 91.2 % v7 (old) | 02/2023 | Razer Blade 16 Early 2023 i9-13950HX, GeForce RTX 4080 Laptop GPU | 2.4 kg | 21.99 mm | 16.00" | 2560x1600 | |
| 89.4 % v7 (old) | 02/2023 | Lenovo Legion Pro 7 16IRX8H i9-13900HX, GeForce RTX 4080 Laptop GPU | 2.7 kg | 26 mm | 16.00" | 2560x1600 | |
| 91.4 % v7 (old) | 02/2023 | Razer Blade 18 RTX 4070 i9-13950HX, GeForce RTX 4070 Laptop GPU | 3 kg | 21.9 mm | 18.00" | 2560x1600 |
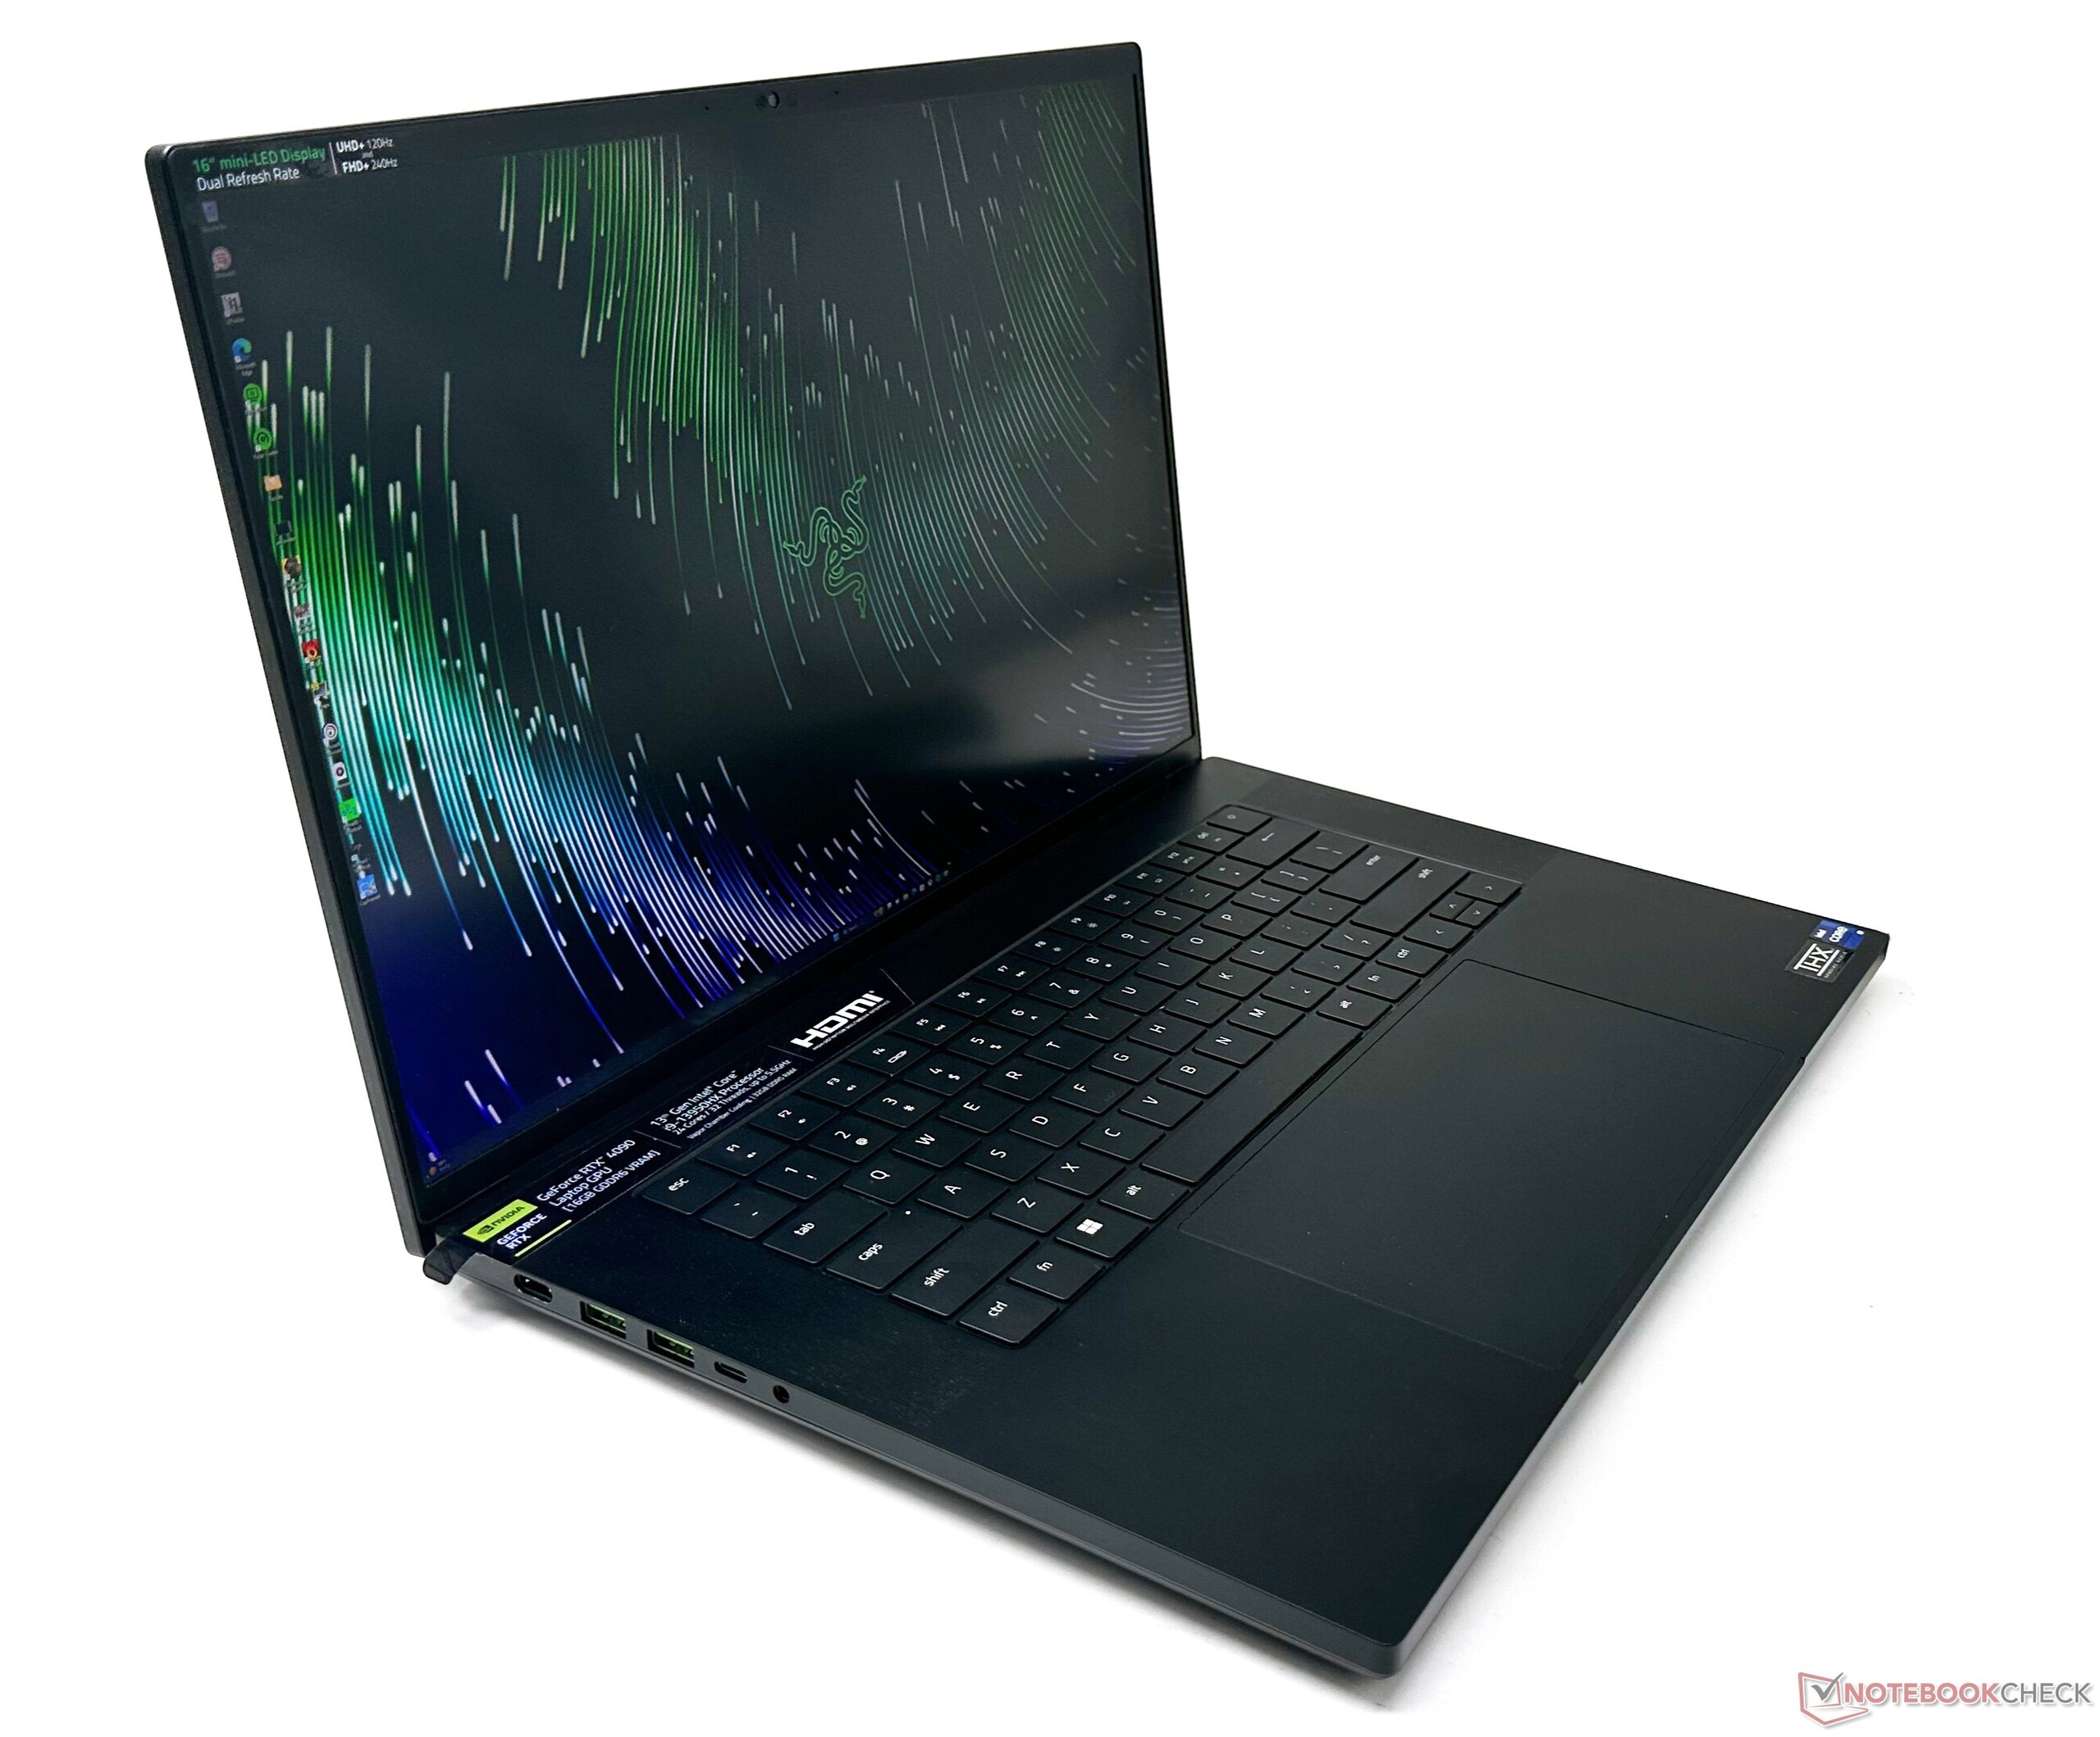
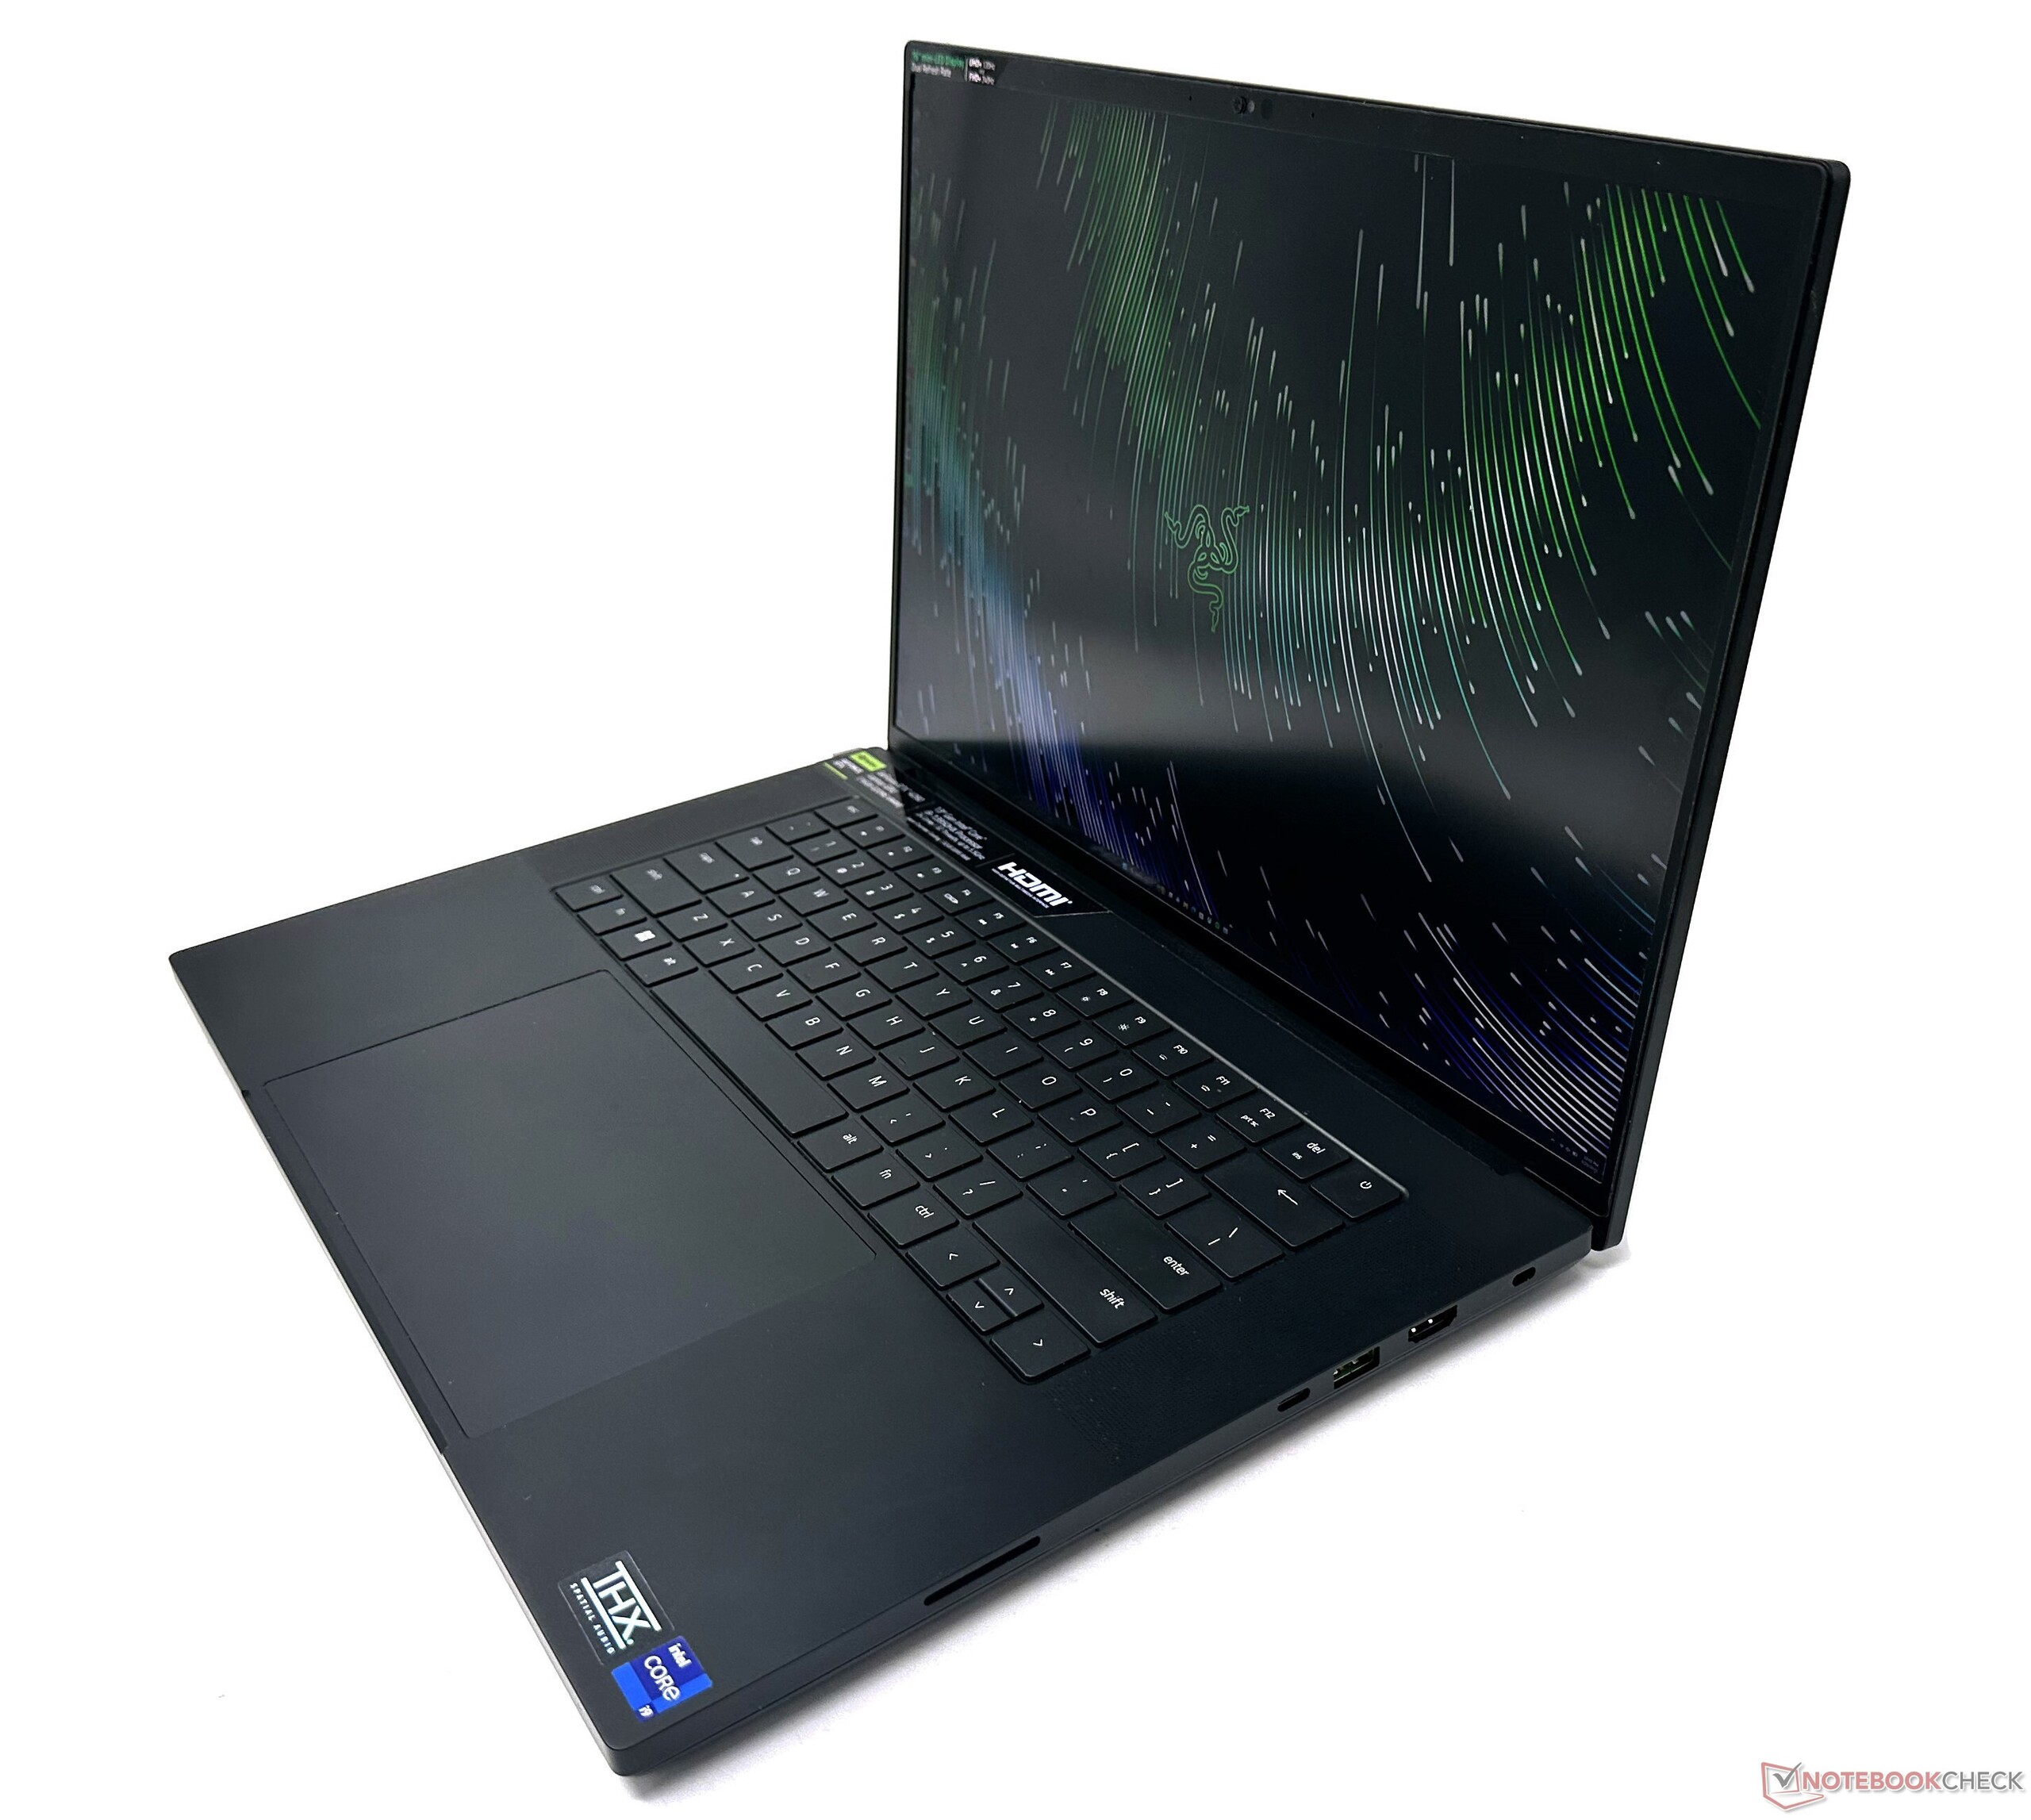
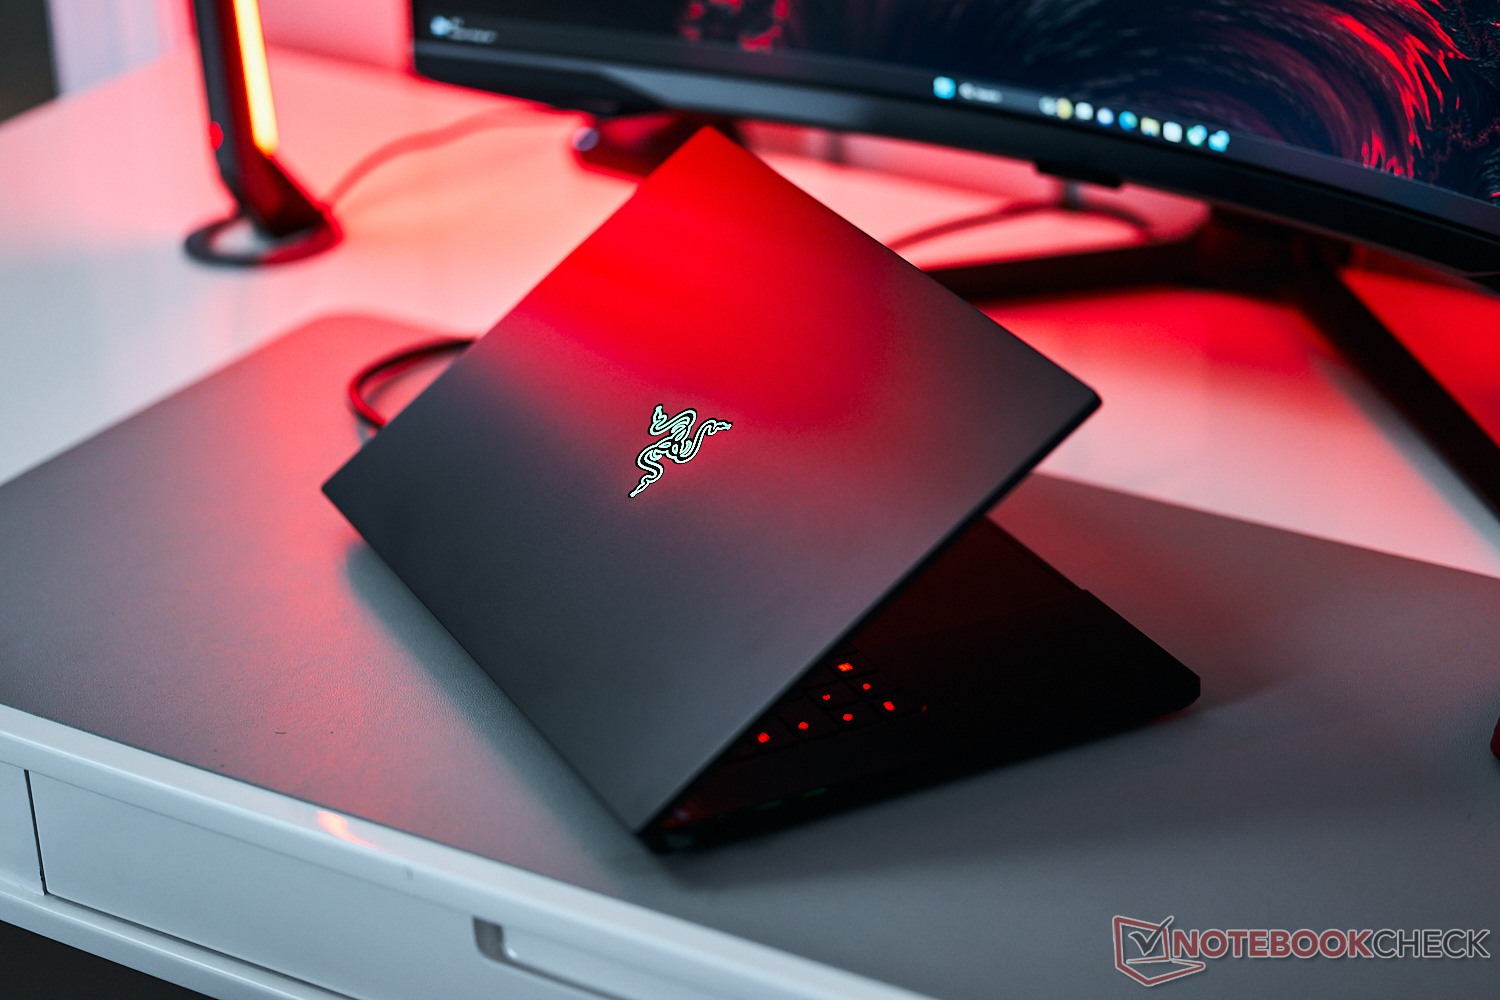
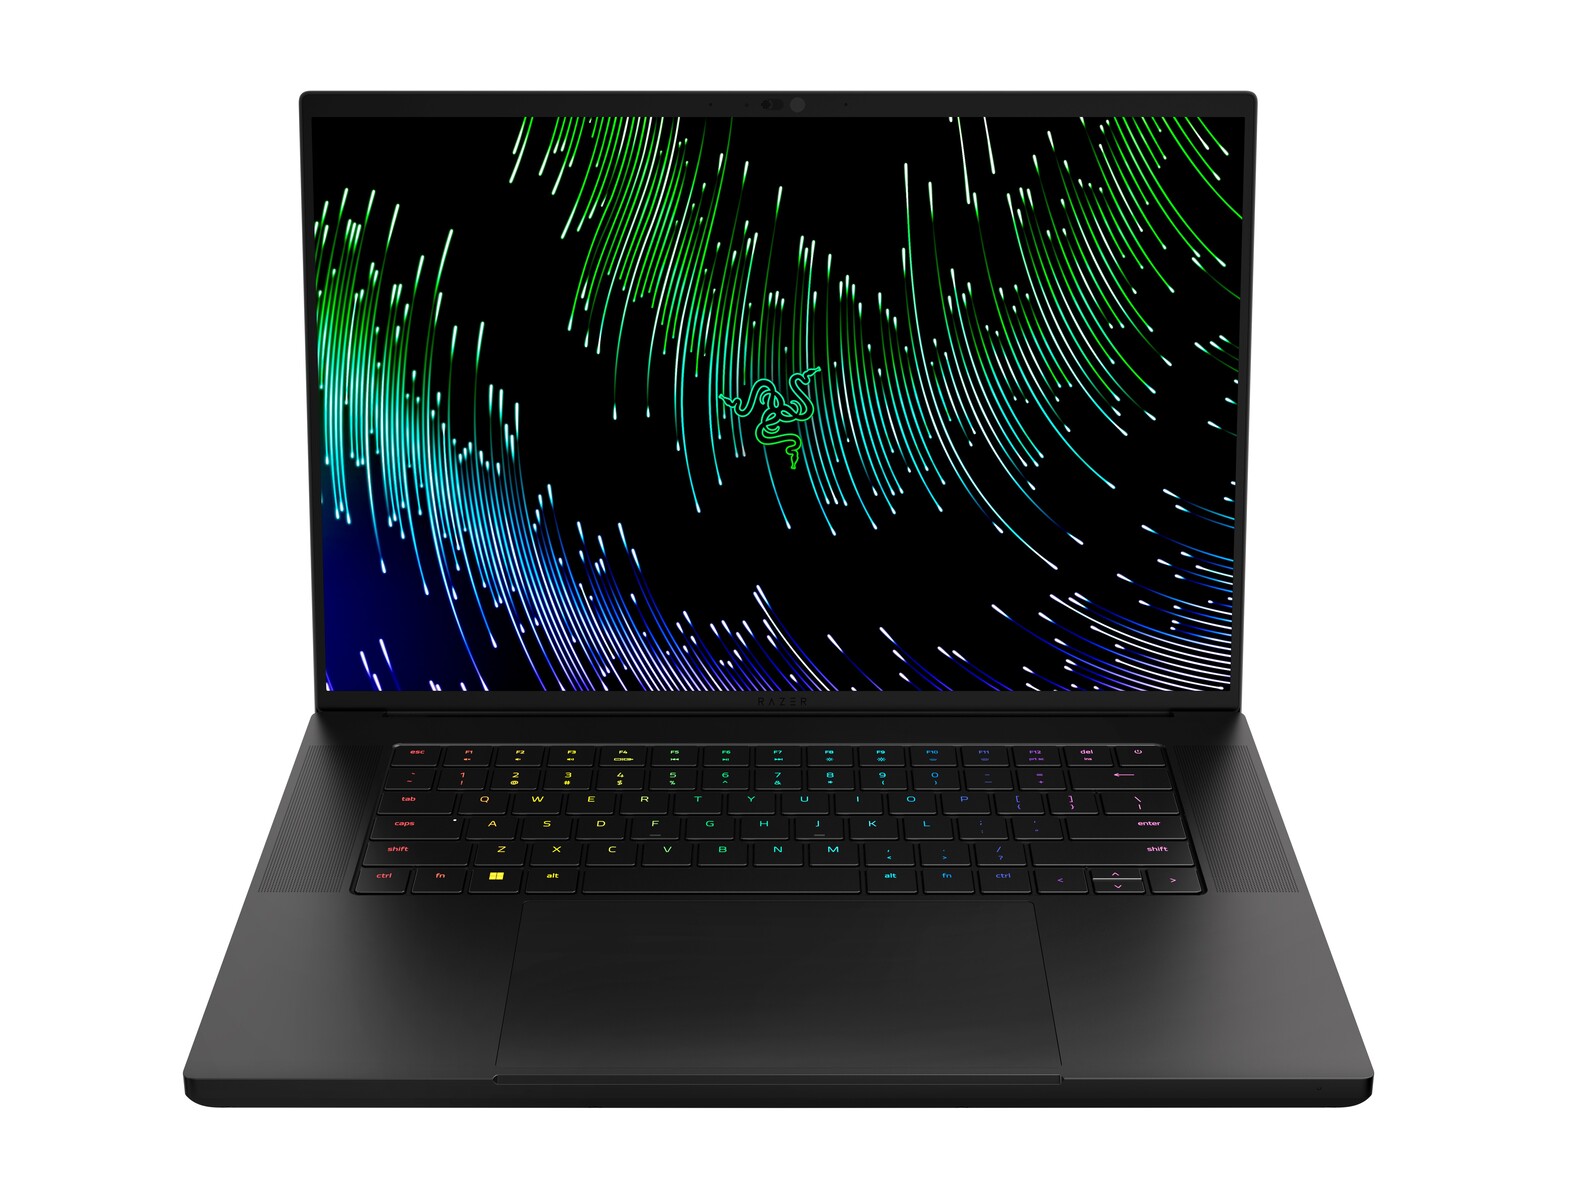
Estojo: Premium e robusto na verdadeira moda Razer
A Lâmina 16 é um acabamento esportivo de alumínio anodizado que lembra um MacBook Pro, semelhante a um bom número de Razers anteriores que testamos. O chassi premium parece extremamente robusto com um mínimo de flexão, que também só se aplica deliberadamente uma boa quantidade de pressão.
A lâmina Razer Blade 16 é mais fina do que a Asus ROG Zephyrus Duo 16 e definitivamente muito mais elegante do que o Lenovo Legion Pro 7 e o MSI Titan GT77 HX 13VI. O Asus ROG Zephyrus M16 é quase idêntico ao Blade 16 Early 2023 em termos de dimensões gerais.
O chassi tem um design minimalista, e o único efeito de iluminação é o logotipo característico da cobra Razer na parte de trás da tampa. A tampa, entretanto, é um ímã de grime e impressões digitais e é incômodo para mantê-la limpa. É fácil abrir a tampa com um único dedo sem problemas de estabilidade.
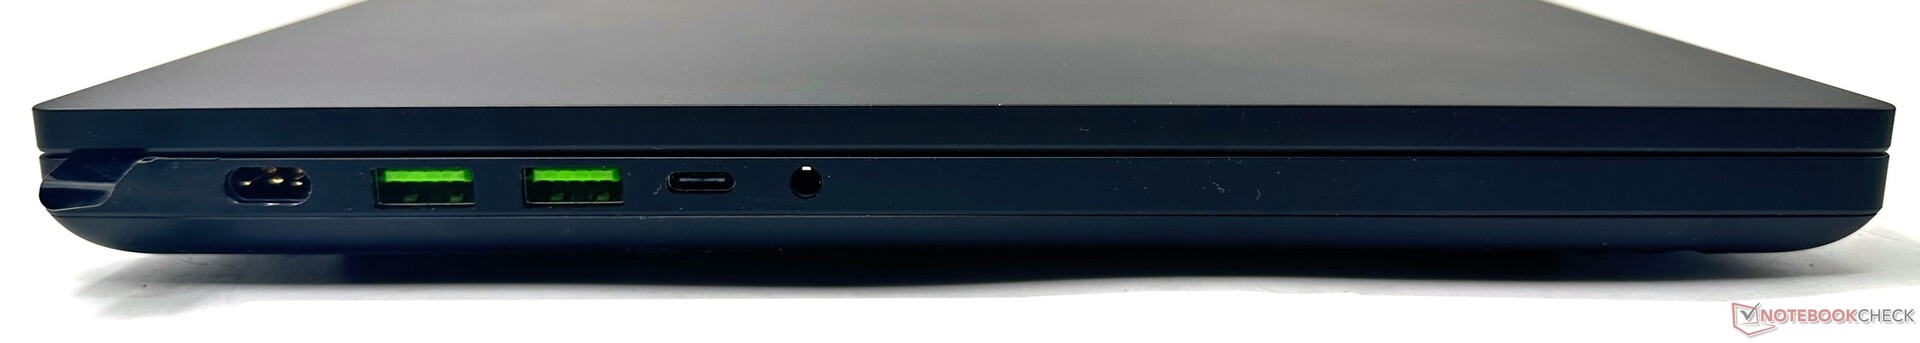
Conectividade: Cartão SD de alto rendimento e Wi-Fi
A Lâmina 16 oferece uma seleção adequada de portos. A Razer utiliza uma porta de carregamento própria compatível com a do ano passado Lâmina 15 e Lâmina 17. O conector não se senta nivelado com o chassi, o que pode ser um incômodo para alguns.
É possível uma alimentação de até 100 W em ambas as portas USB Tipo C. Falando em Tipo-C, a lâmina 16 oferece apenas um Thunderbolt 4 enquanto o outro é um USB 3.2 Gen2 Tipo-C.
A Razer poderia ter equipado a lâmina 16 com duas portas Thunderbolt 4 em seu lugar. Além disso, as portas Type-C não são etiquetadas, então você terá que observar que o Thunderbolt 4 é na verdade o da direita e não o da esquerda.
Um slot de trava Kensington está presente. Entretanto, a ausência de uma porta Ethernet Gigabit RJ-45 vem como uma chatice, dado que o laptop não está exatamente aspirando a ser esquelético.
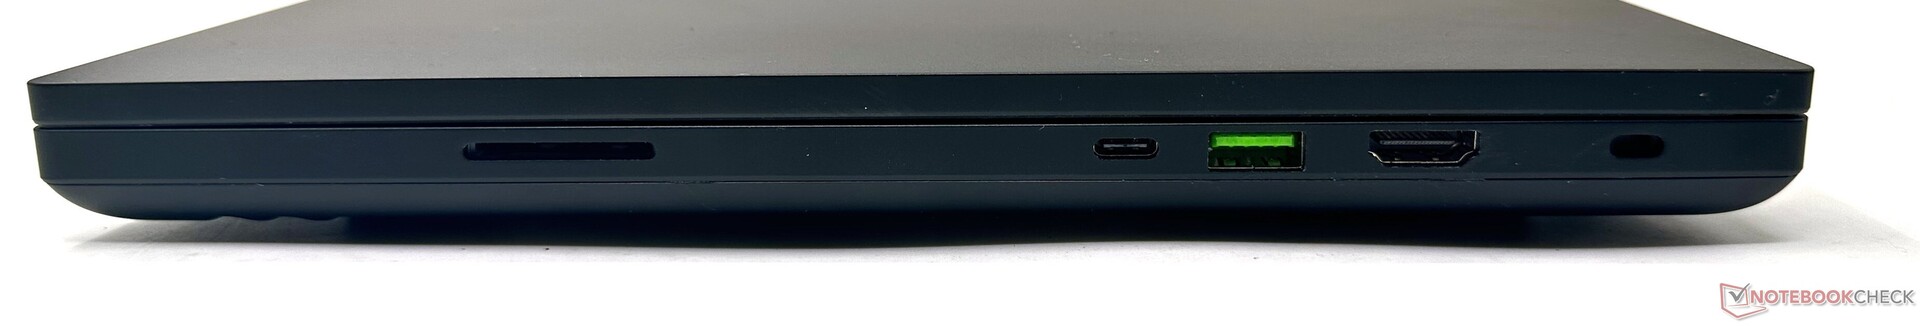
Leitor de cartões SD
A Razer continua usando alguns dos leitores de cartões SD mais rápidos em laptops de jogos, e a lâmina 16 não é diferente. Embora o leitor de cartões Blade 16 Early 2023 fique atrás do Asus ROG Zephyrus Duo 16 em testes seqüenciais, ele é capaz de ultrapassar este último em testes de cópia de arquivo JPG.
| SD Card Reader | |
| average JPG Copy Test (av. of 3 runs) | |
| Razer Blade 18 RTX 4070 (Angelibird AV Pro V60) | |
| Razer Blade 16 Early 2023 RTX 4090 (Angelbird AV PRO 128 GB V60) | |
| Asus ROG Zephyrus M16 GU604VY-NM042X | |
| Asus Zephyrus Duo 16 GX650PY-NM006W (Angelbird AV Pro V60) | |
| Média da turma Gaming (20.9 - 210, n=54, últimos 2 anos) | |
| Razer Blade 16 Early 2023 (AV PRO microSD 128 GB V60) | |
| MSI Titan GT77 HX 13VI (Angelibird AV Pro V60) | |
| Eluktronics Mech-17 GP2 (Angelibird AV Pro V60) | |
| maximum AS SSD Seq Read Test (1GB) | |
| Asus Zephyrus Duo 16 GX650PY-NM006W (Angelbird AV Pro V60) | |
| Razer Blade 18 RTX 4070 (Angelibird AV Pro V60) | |
| Razer Blade 16 Early 2023 (AV PRO microSD 128 GB V60) | |
| Razer Blade 16 Early 2023 RTX 4090 (Angelbird AV PRO 128 GB V60) | |
| Asus ROG Zephyrus M16 GU604VY-NM042X | |
| Média da turma Gaming (25.5 - 261, n=51, últimos 2 anos) | |
| Eluktronics Mech-17 GP2 (Angelibird AV Pro V60) | |
| MSI Titan GT77 HX 13VI (Angelibird AV Pro V60) | |
Comunicação
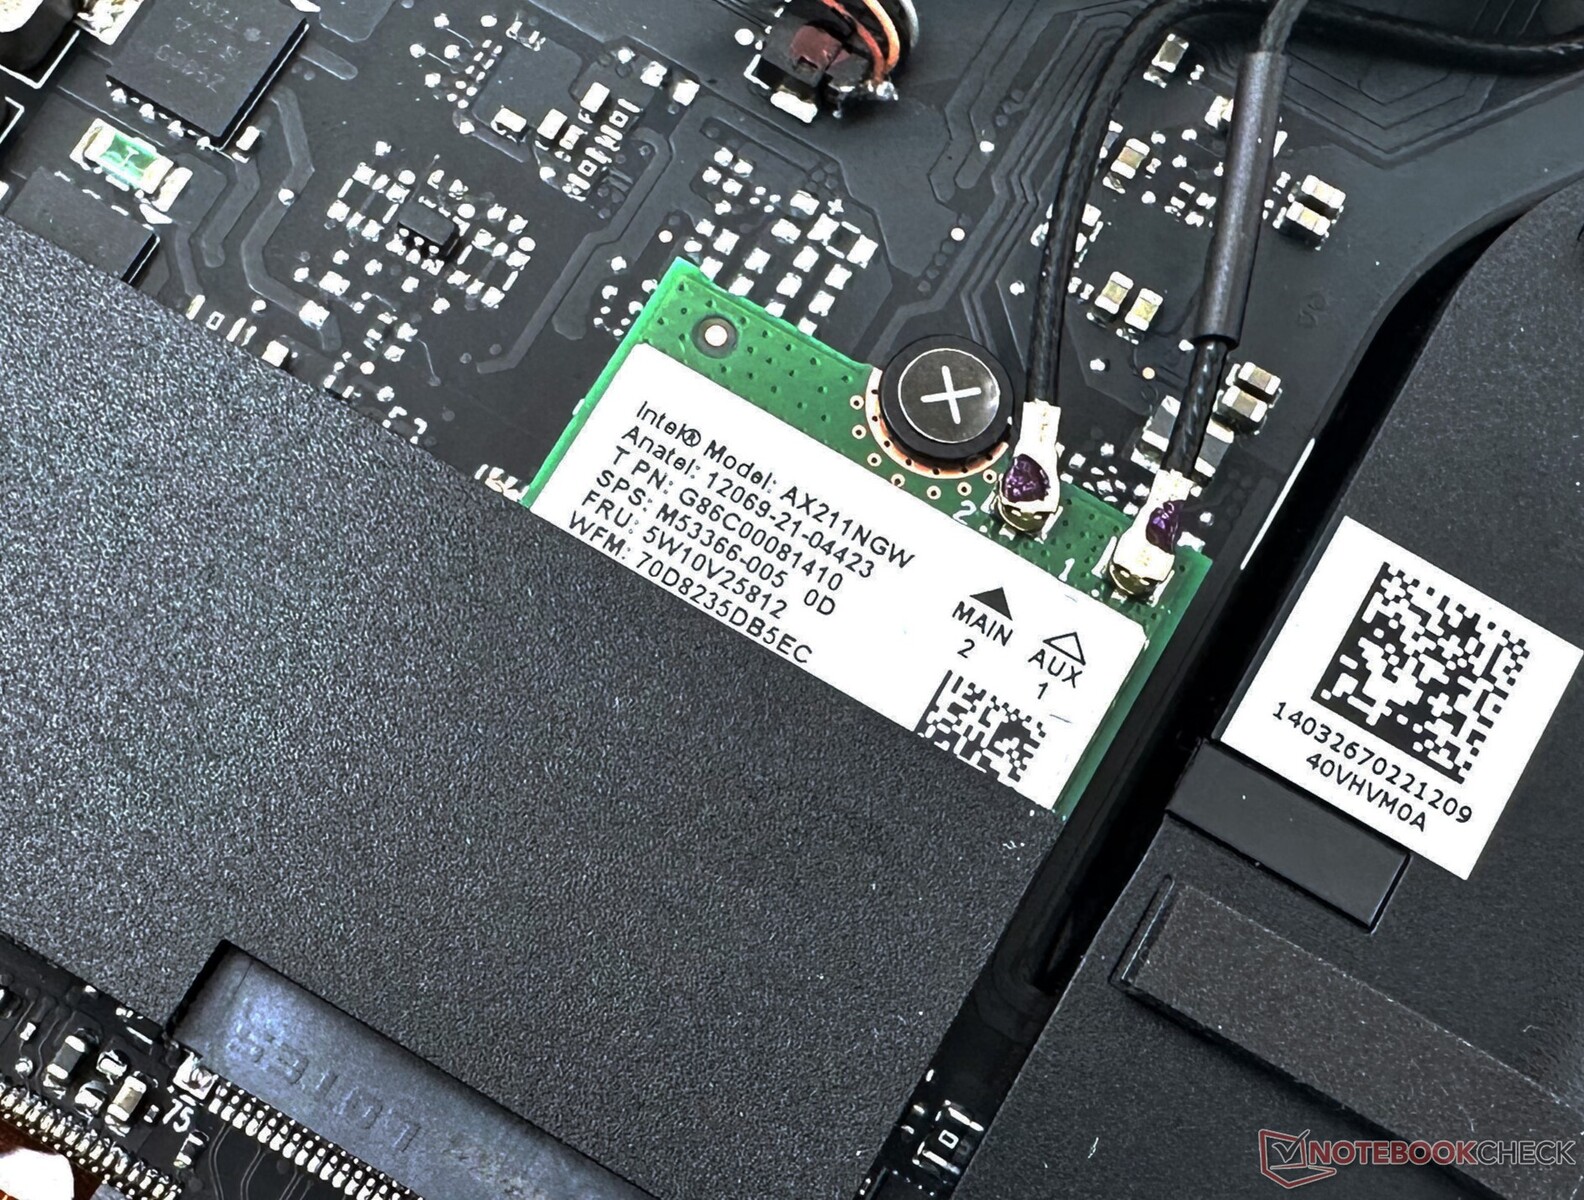
O Blade 16 vem equipado com um módulo Intel Wi-Fi 6E AX211 WLAN. O desempenho Wi-Fi foi testado usando nosso roteador de referência Asus ROG Rapture GT-AXE11000 a uma distância de 1 m do laptop em linha clara de visão, sem nenhum outro dispositivo conectado ou interferência externa.
O desempenho da rede é bastante estável tanto nas bandas de 5 GHz como de 6 GHz. Não há benefício real de rendimento no uso da banda de 6 GHz acima de 5 GHz, pois as taxas de transferência são largamente idênticas em ambas.
Dito isto, a opção de 6 GHz ainda é uma boa opção se você tiver um roteador compatível e gostaria de reduzir a interferência da pletora de outros clientes de 5 GHz.
Webcam
A webcam 1080p mostra desvios de cor um pouco maiores, particularmente com tonalidades azuis. A nitidez é útil, mas com quantidades perceptíveis de ruído. Em geral, a saída é decrescente - o suficiente para as chamadas de vídeo e as obras.


Segurança
O Blade 16 suporta logins baseados no Windows Hello através do sensor IR. O reconhecimento facial é rápido e funciona sem muitos problemas. Ao contrário da Lâmina 18, um obturador físico é fornecido para a webcam. Um módulo TPM 2.0 está presente.
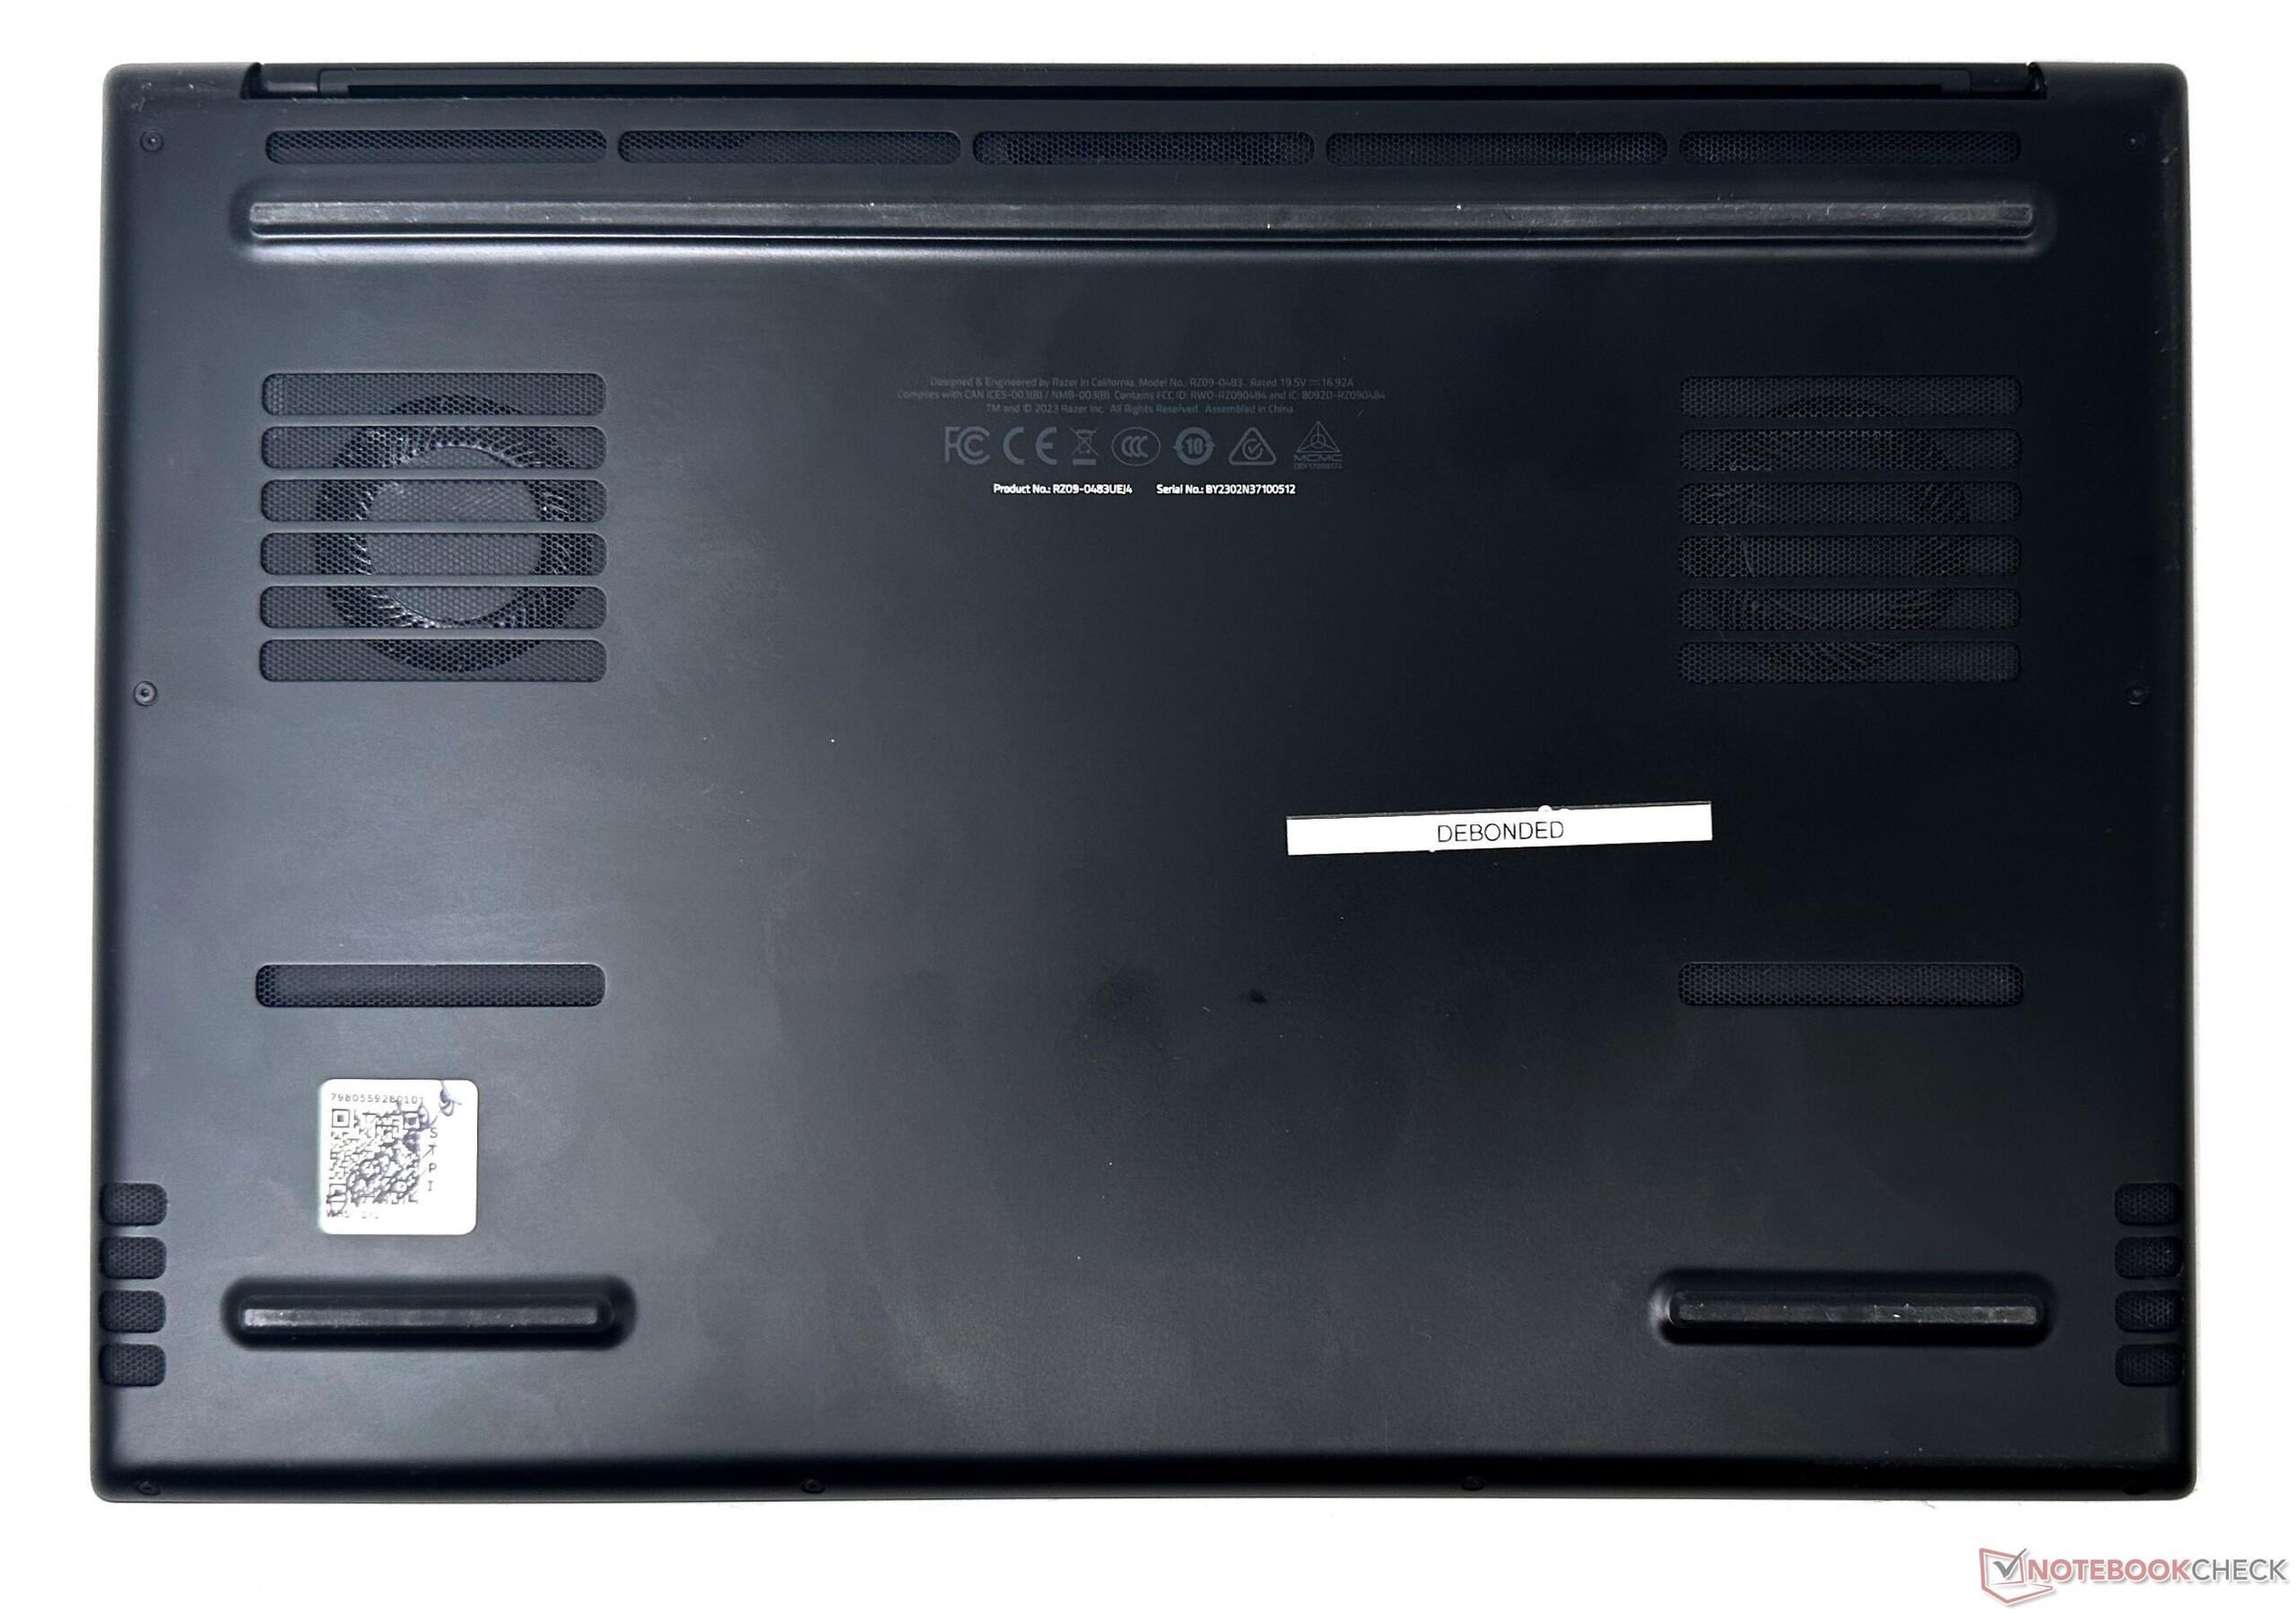
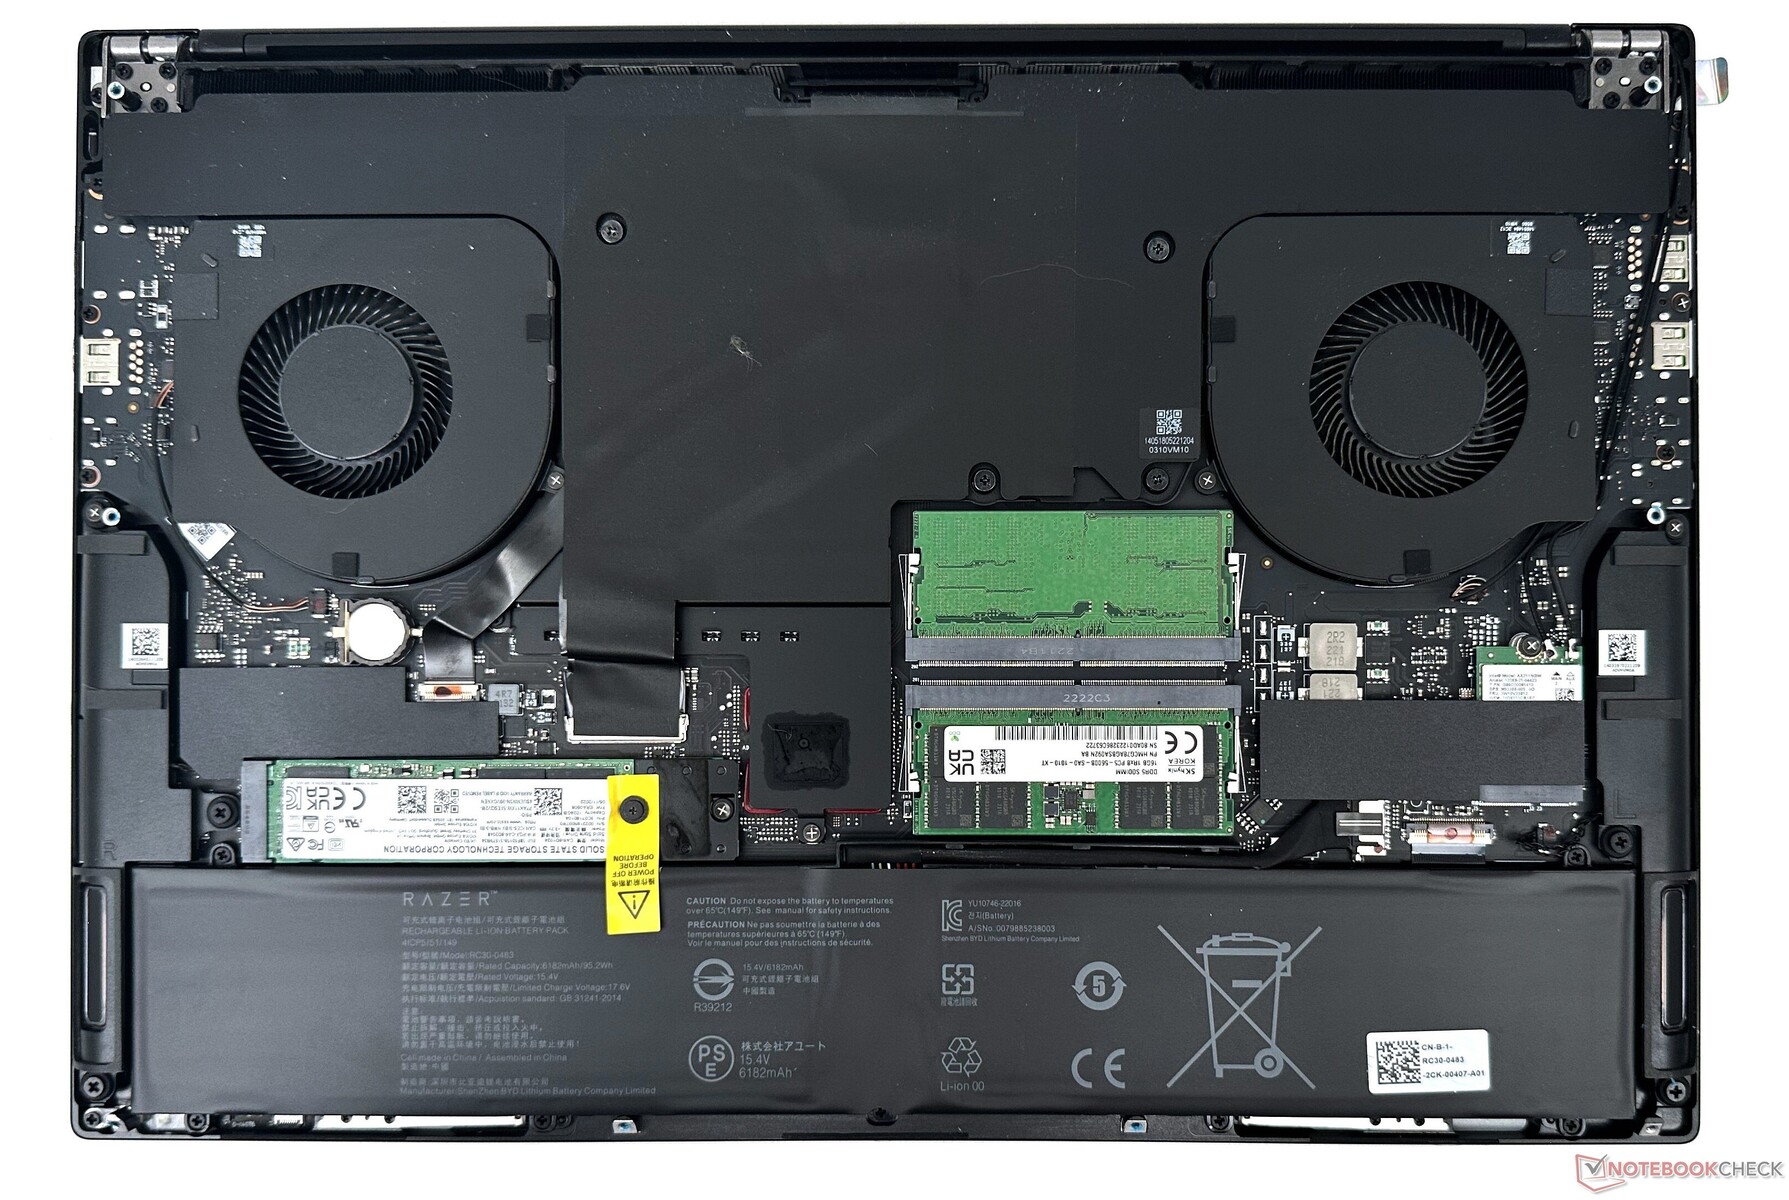
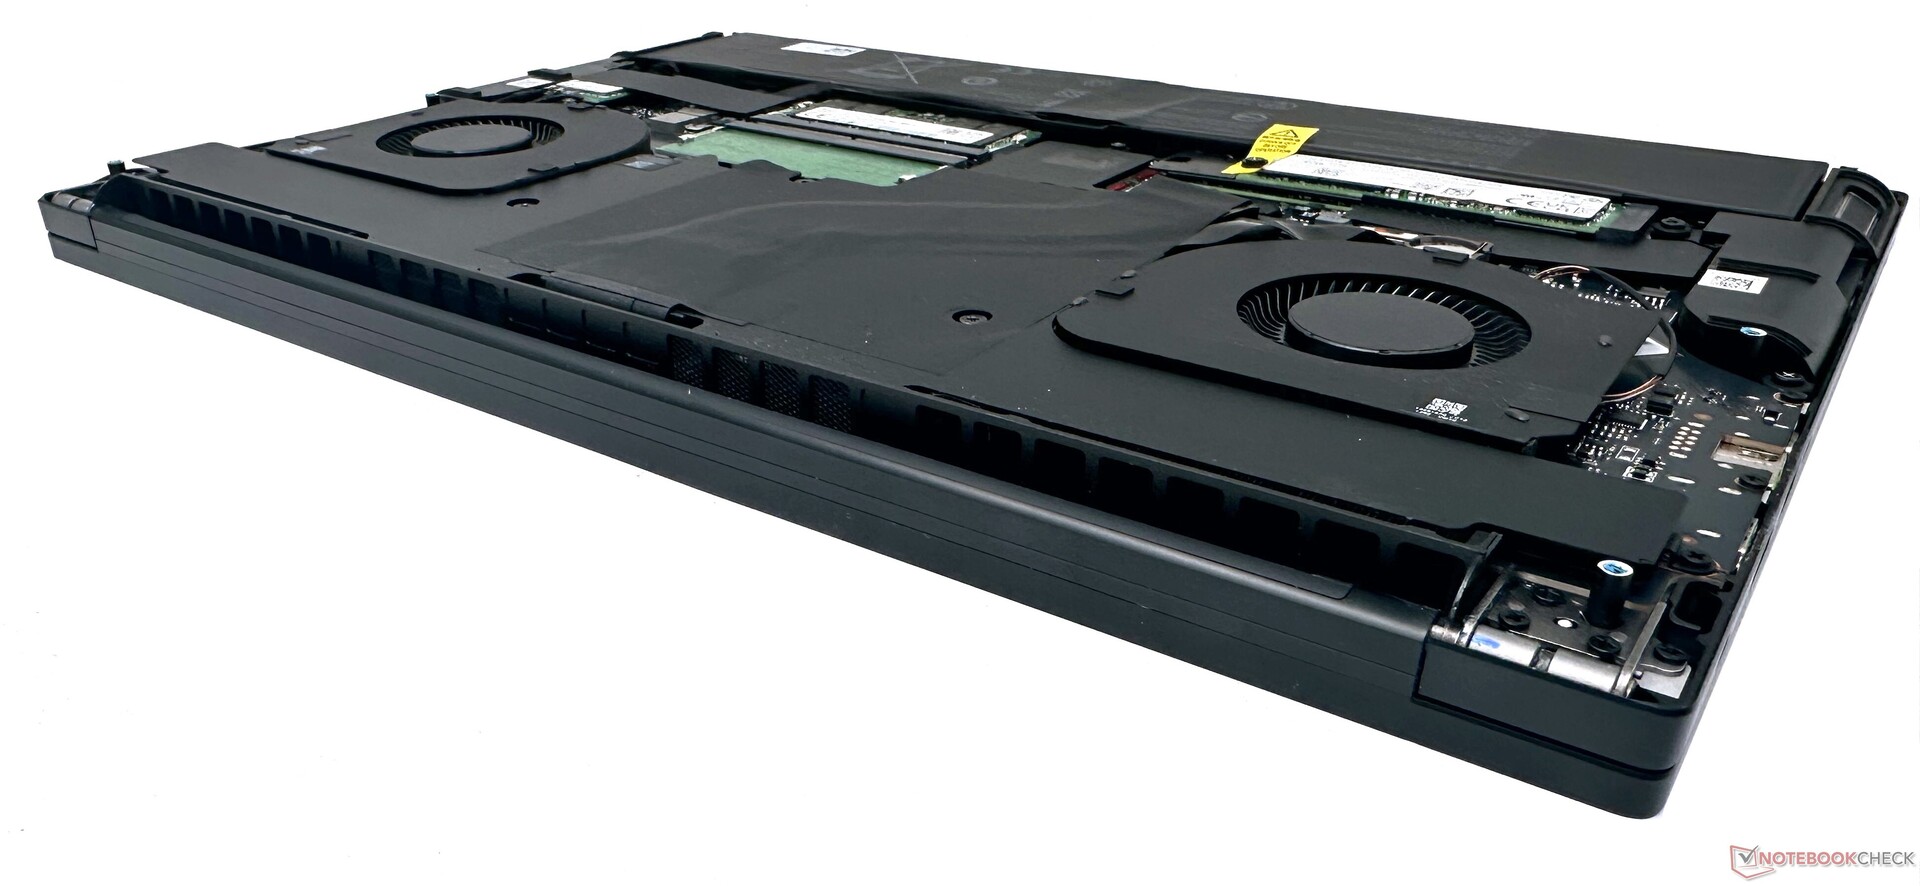
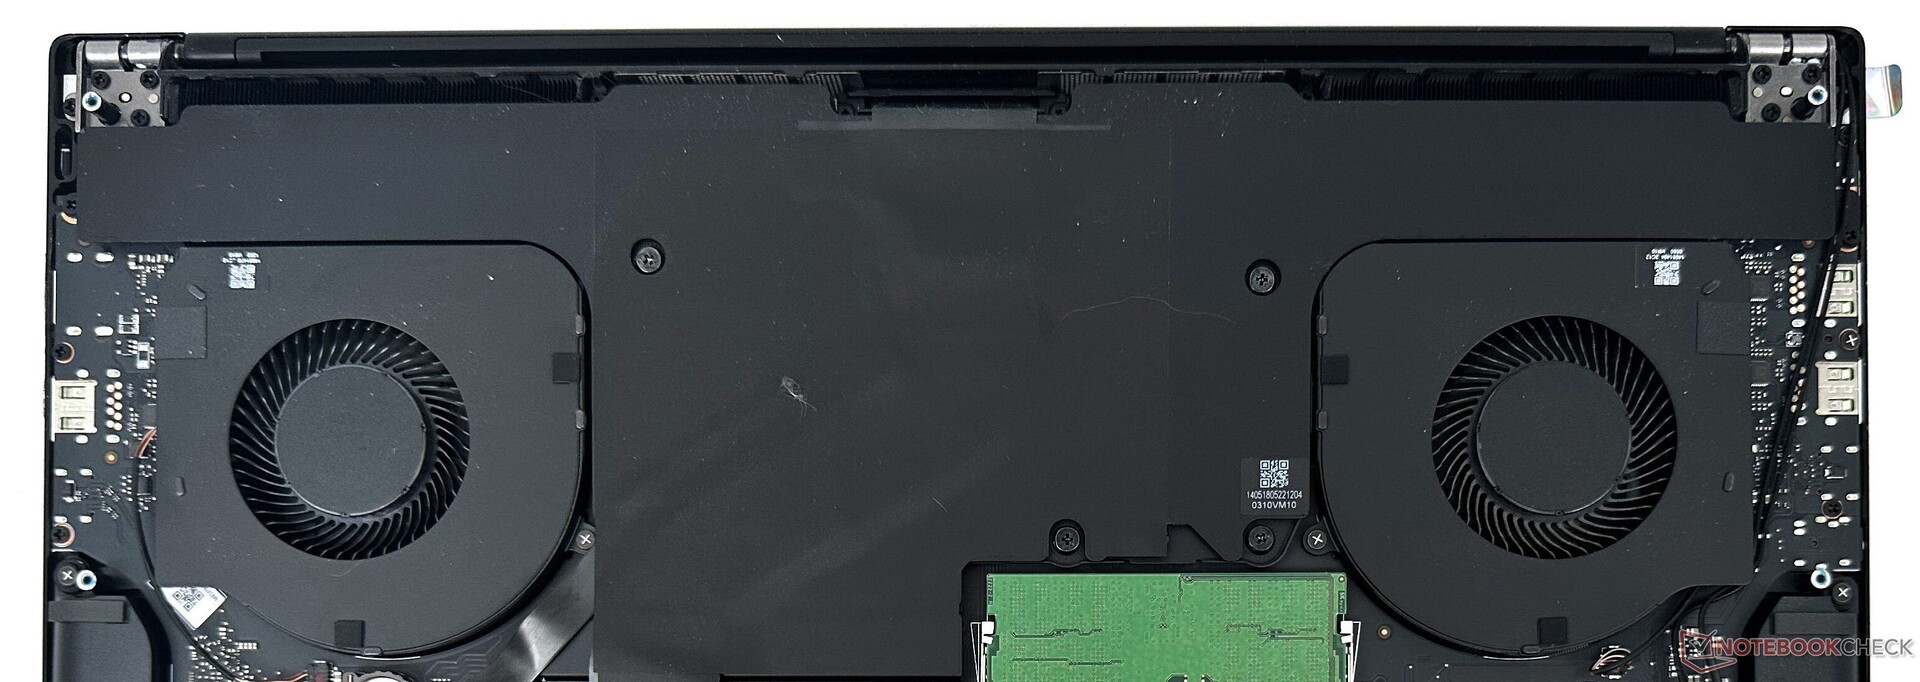
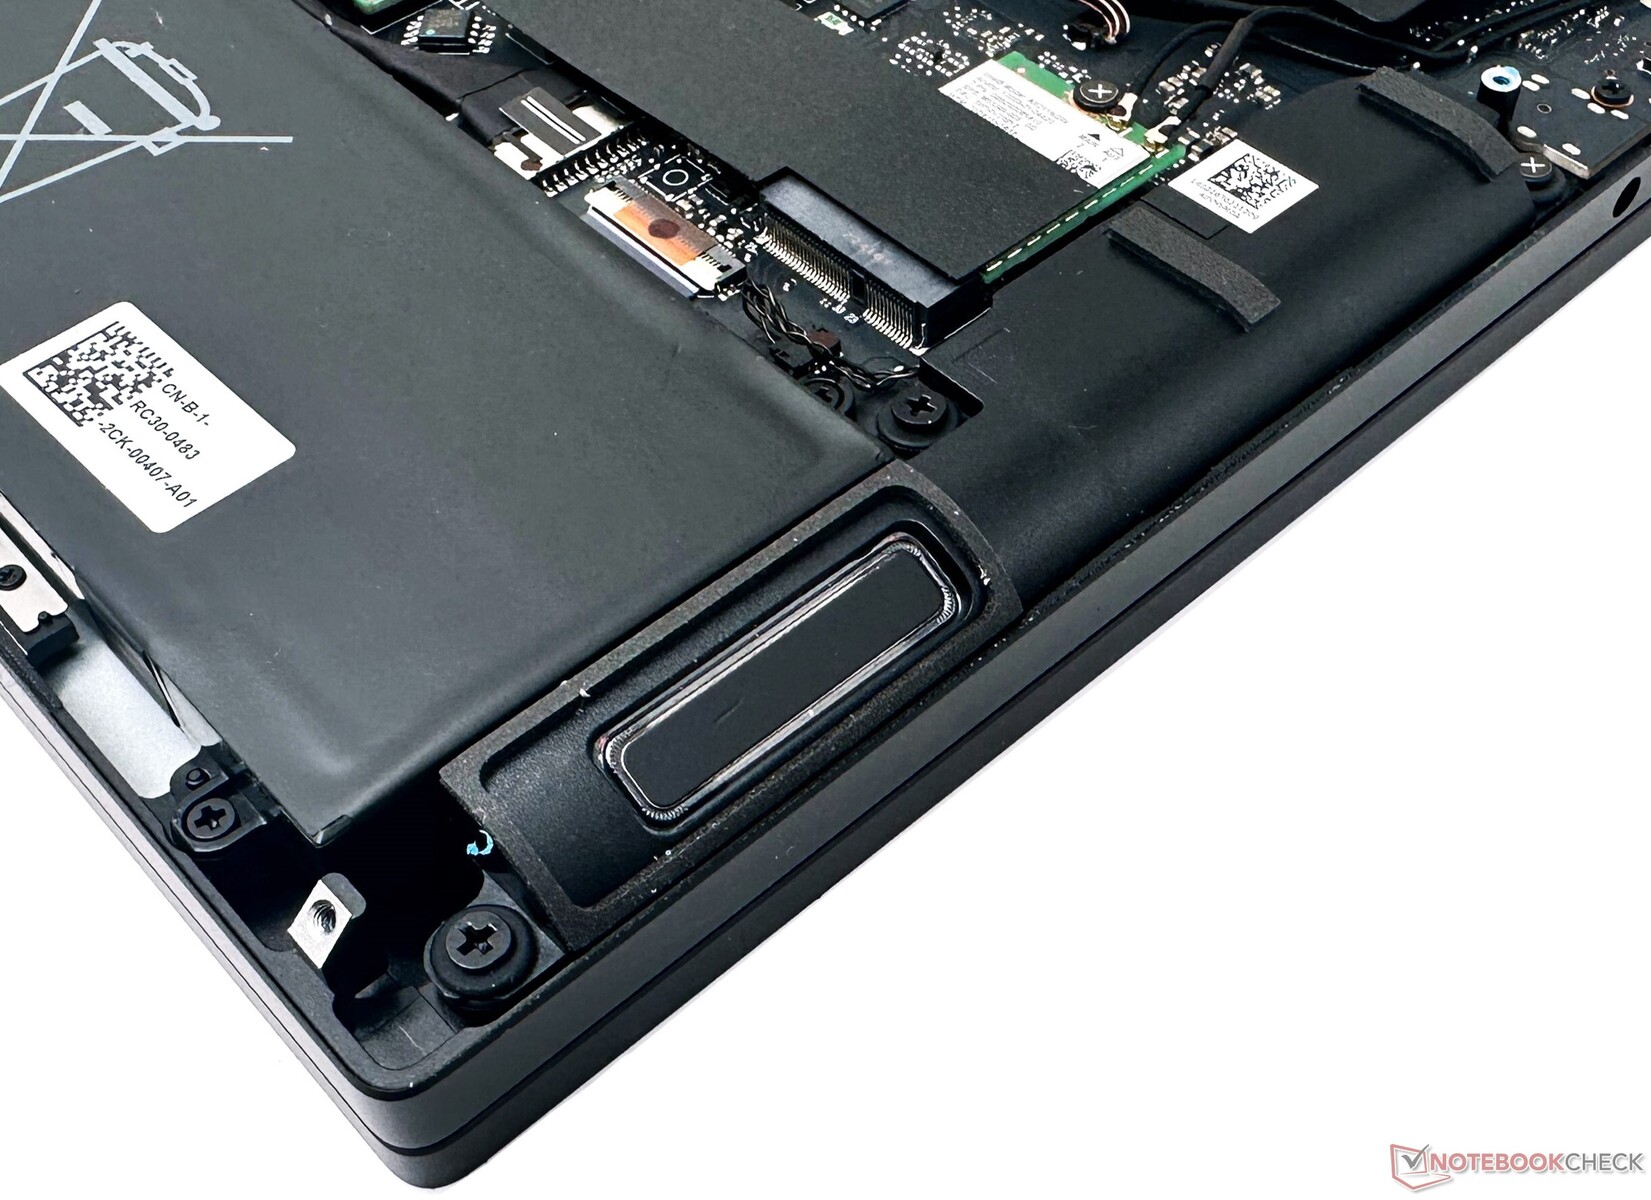
Manutenção
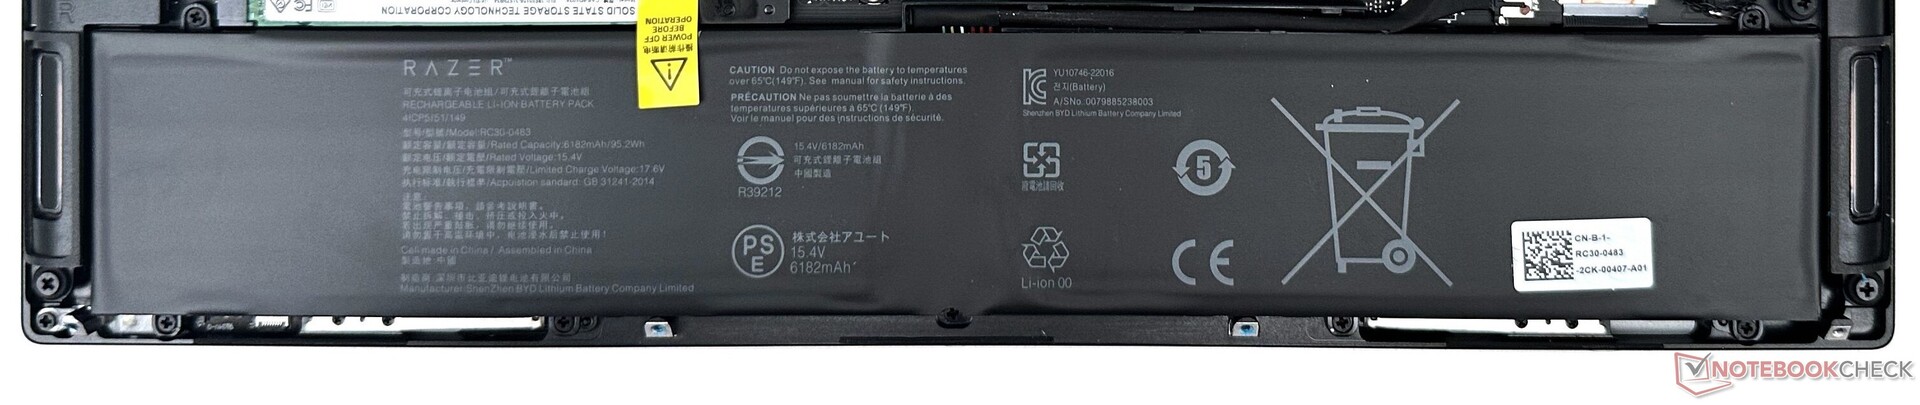
A remoção dos oito parafusos T5 abre o painel inferior revelando o enorme sistema de resfriamento da câmara de vapor. Os cartões DDR5-5600 RAM, NVMe SSDs e Wi-Fi podem ser trocados, se necessário. O pacote de bateria dupla também pode ser desatarraxado e substituído.
Um ponto a ser observado aqui é que a Razer só oferece atualizações de BIOS e firmware em seu site de suporte https://mysupport.razer.com/app/answers/detail/a_id/9668. Na sua maioria, os drivers genéricos oficiais da Intel e Nvidia para WLAN e gráficos trabalham sem problemas.
Mas se você tiver que apagar ou substituir o disco inteiro por algum motivo, certifique-se de ter uma cópia da imagem de recuperação da fábrica https://mysupport.razer.com/app/answers/detail/a_id/6300 de antemão. Para fazer o download da imagem de recuperação é necessário entrar com uma conta Razer e digitar o número de série do dispositivo.
Acessórios e Garantia
Nossa unidade Blade 16 veio com um adaptador de energia 330 W GaN e a papelada usual como padrão.
A Razer oferece uma garantia padrão de um ano para a Blade 16 e dois anos para a bateria. Uma garantia estendida por mais um ano pode ser adquirida separadamente, mas isto não é aplicável para a bateria.
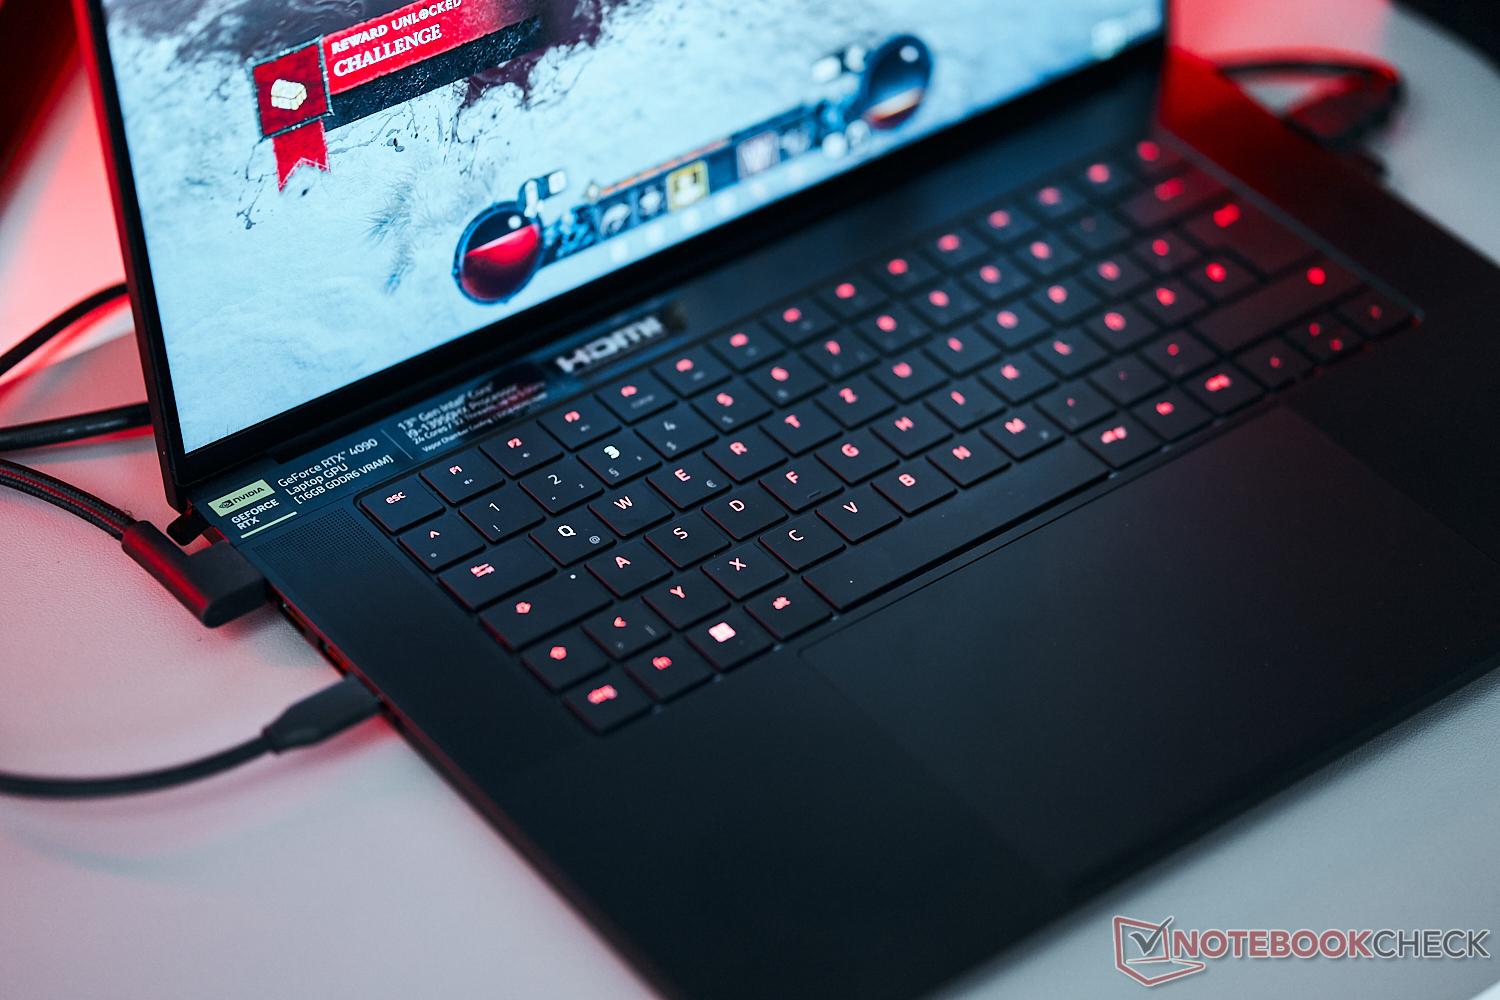
Dispositivos de entrada: Não muito diferente das anteriores Lâminas
Teclado
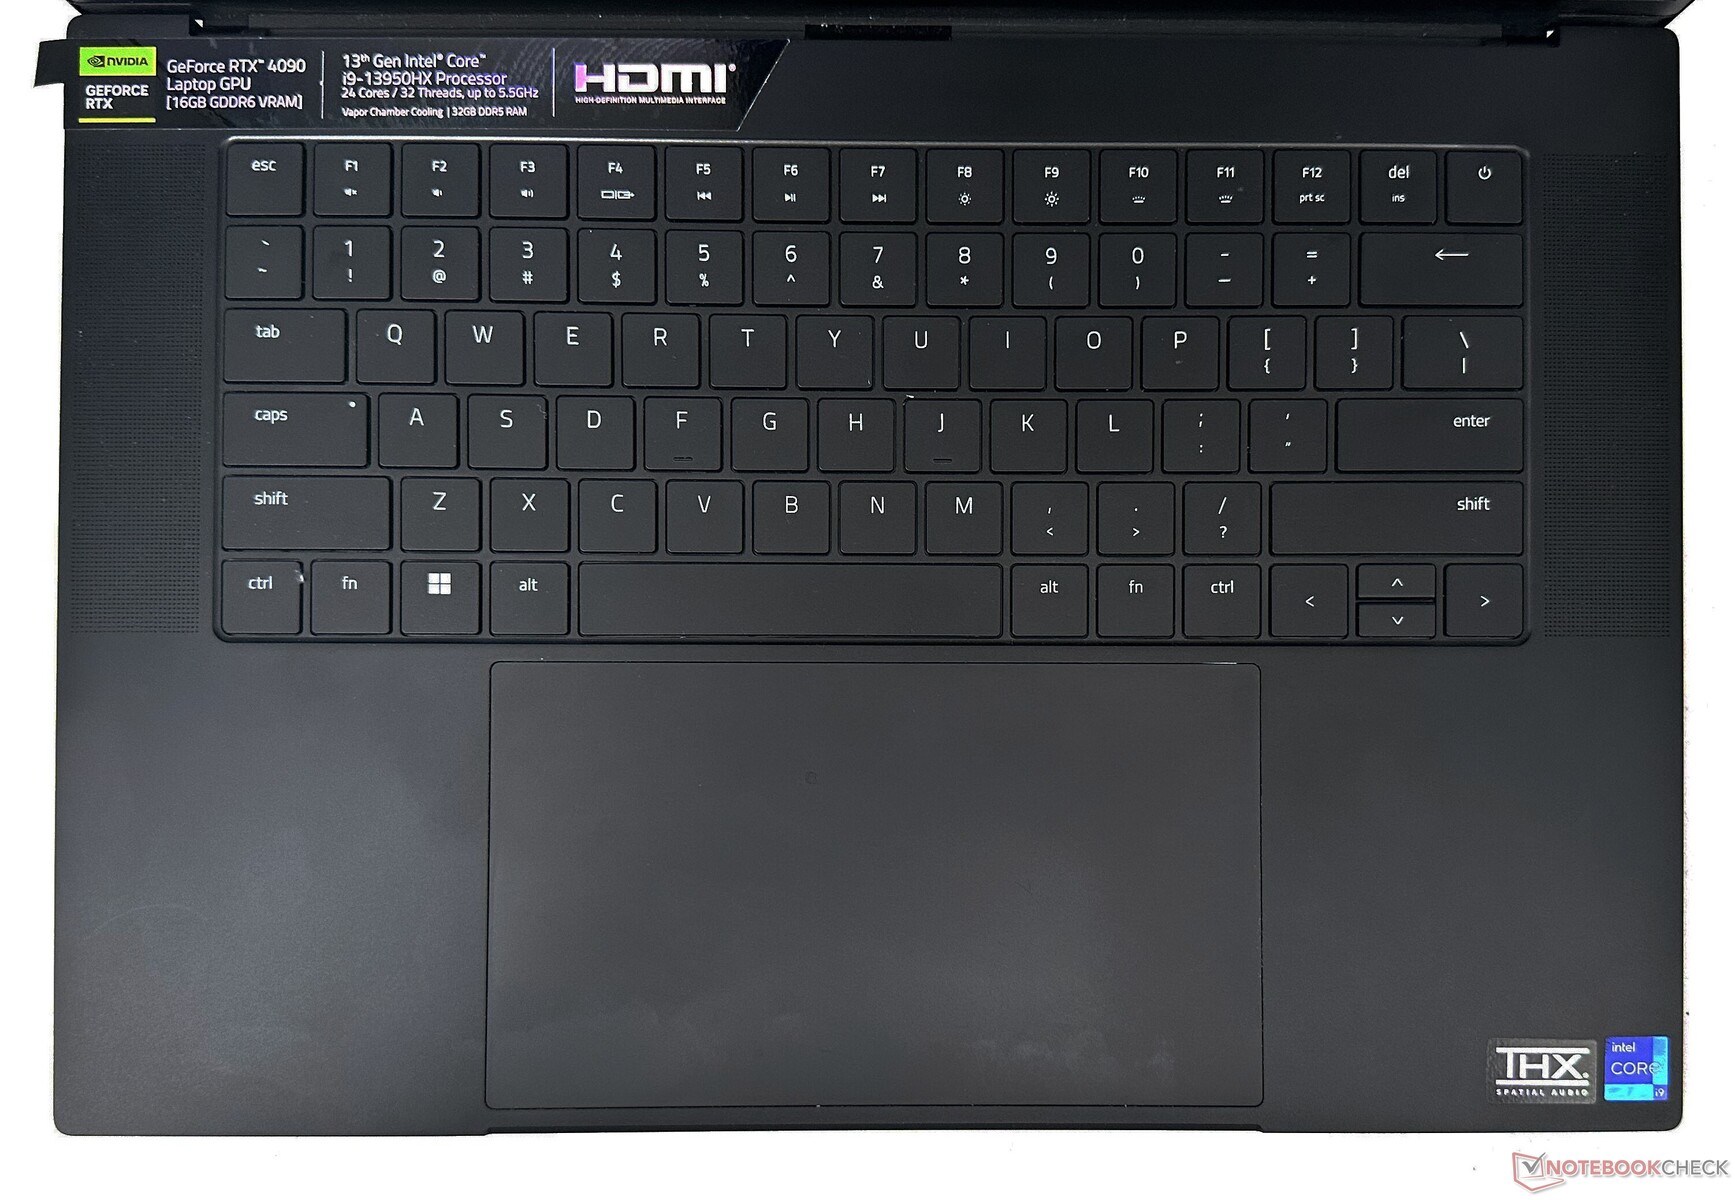
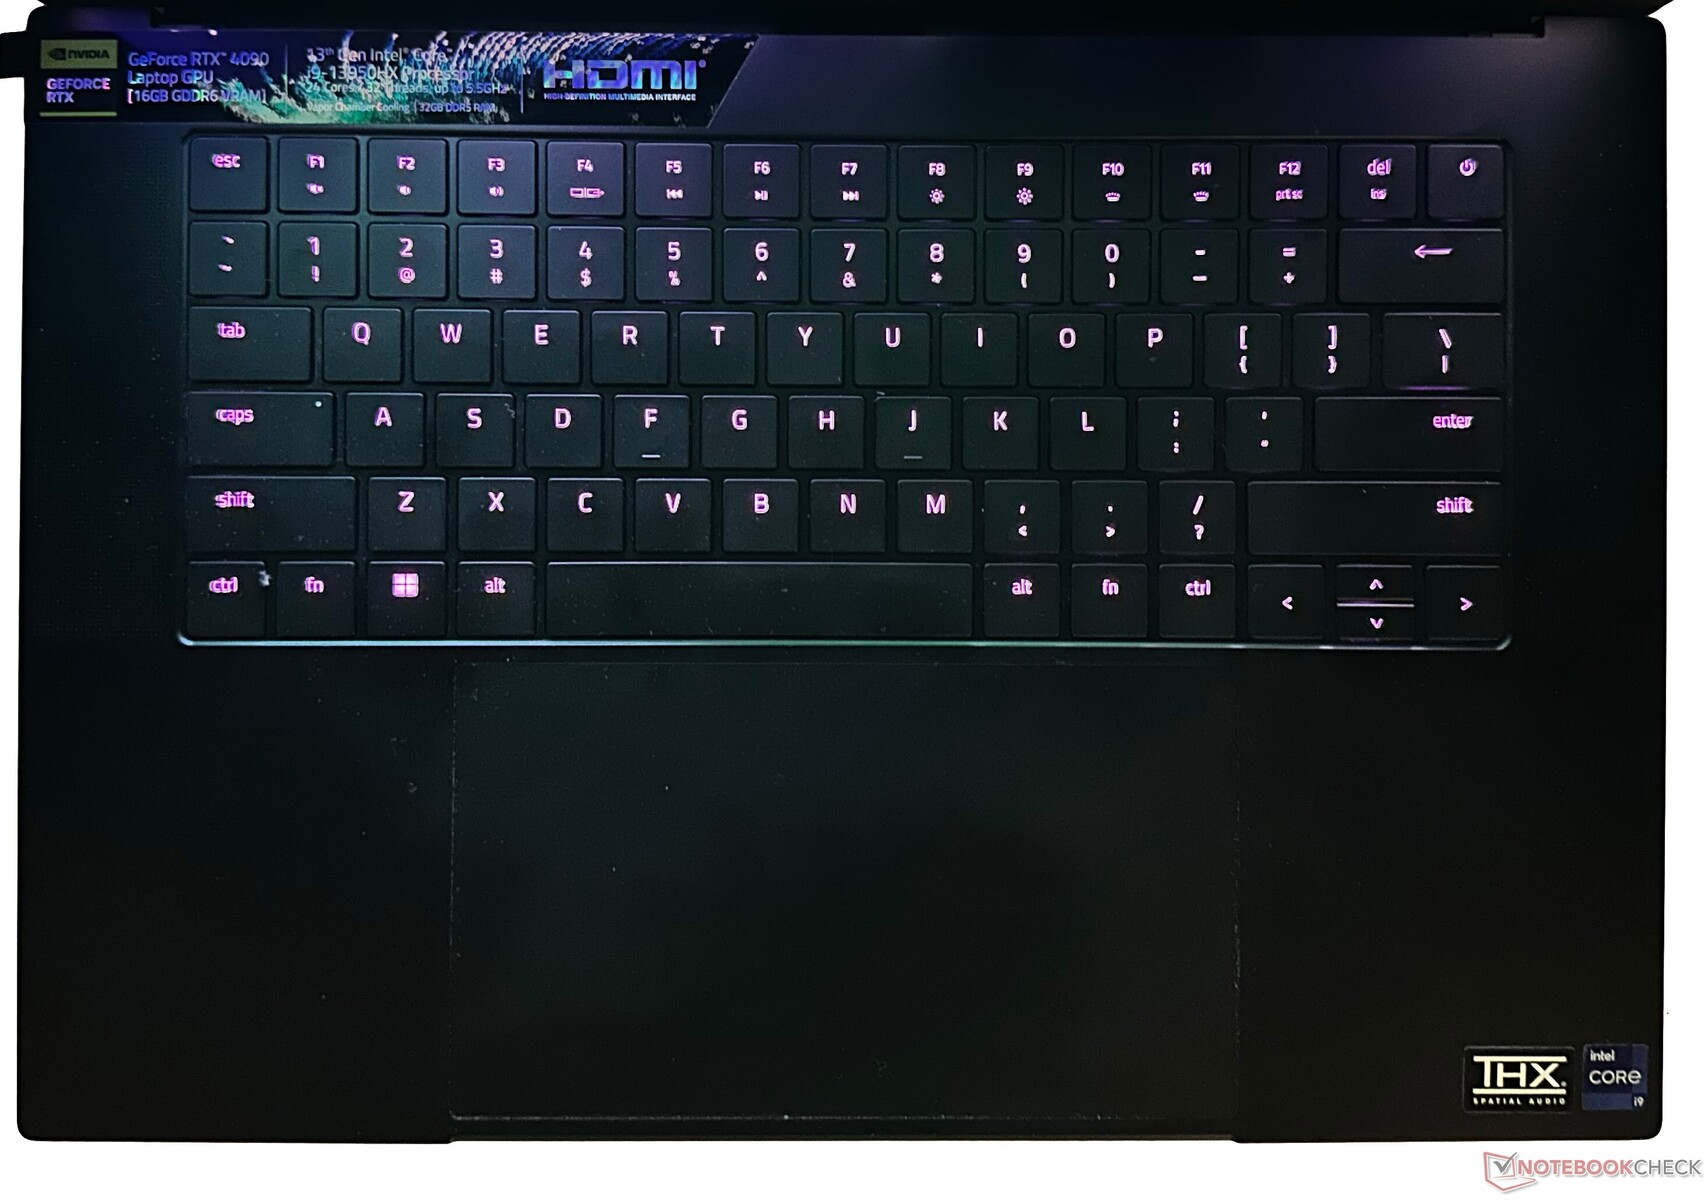
A Razer conta com os tradicionais interruptores de teclas de membrana para o teclado. As teclas são planas com acionamento e tato decentes, mas oferecem uma distância curta de 1 mm de deslocamento. O teclado suporta os efeitos Razer Chroma RGB e o capotamento das teclas N-key. A intensidade da luz de fundo é ajustável em 15 passos.
O posicionamento centralizado apelará para aqueles que não se importam com a ausência de um teclado numérico. Entretanto, acostumar-se com a tecla Shift mais longa para a direita e teclas de seta curta para cima e para baixo pode parecer incômodo.
O teclado do Blade 16 não pode combinar com o MSI Titan GT77 ou com o Schenker XMG Neo 17 M22que oferecem interruptores mecânicos. Embora a implementação da Razer sirva na maior parte das vezes bem, digitar documentos extensos parece um pouco cansativo neste teclado.
Touchpad
O espaçoso touchpad de vidro de 9,5 cm x 17 cm é uma nova oferta para as Lâminas 2023 com uma grande área de deslizamento e suporte para os gestos do Windows Precision. Toda a superfície é clicável e altamente responsiva, mas a háptica parece um pouco pastosa.
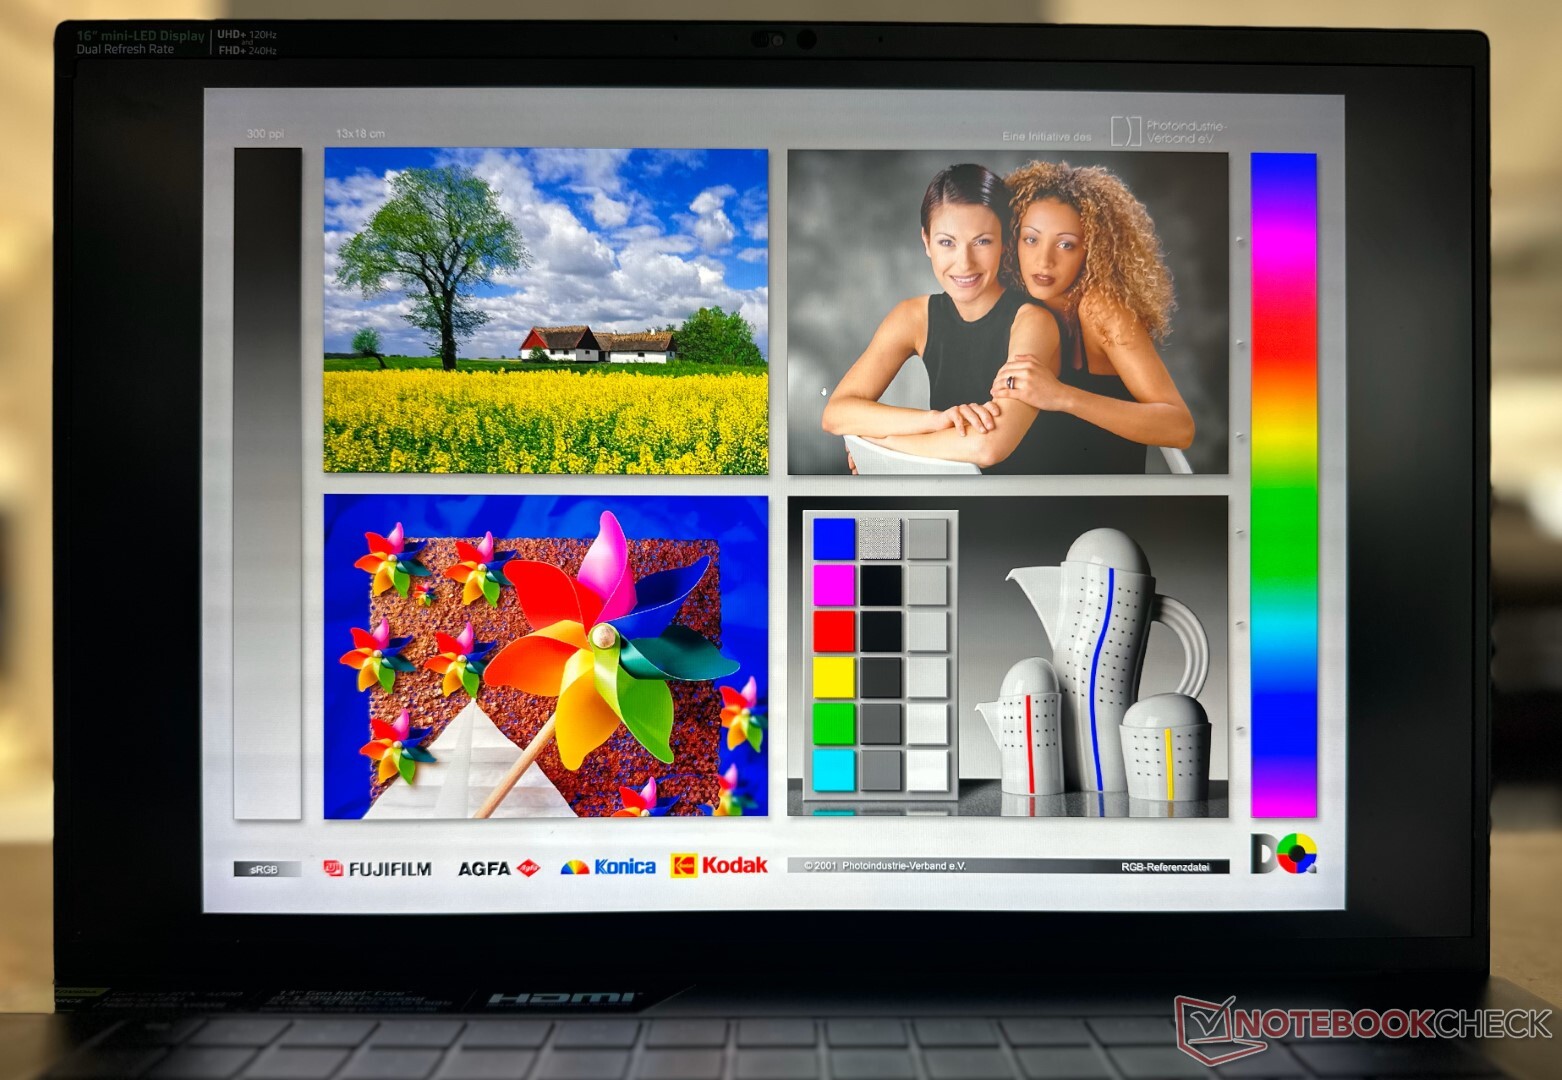
Mostrar: Mini-LED bimodal de qualidade brilhante, quase FERRADA, com alto PWM
O Blade 16 Early 2023 oferece um primeiro display de modo dual do tipo mini-LED. Nossa unidade de teste apresentou vários insights intrigantes durante o curso de nossos testes.
O painel AUO de nossa unidade sofreu inicialmente de um bug de retenção de imagem que gravou partes do papel de parede permanentemente no display (exceto quando desligado), o que foi uma experiência irritante. Entretanto, a Razer emitiu agora um patch de firmware que corrige completamente este problema
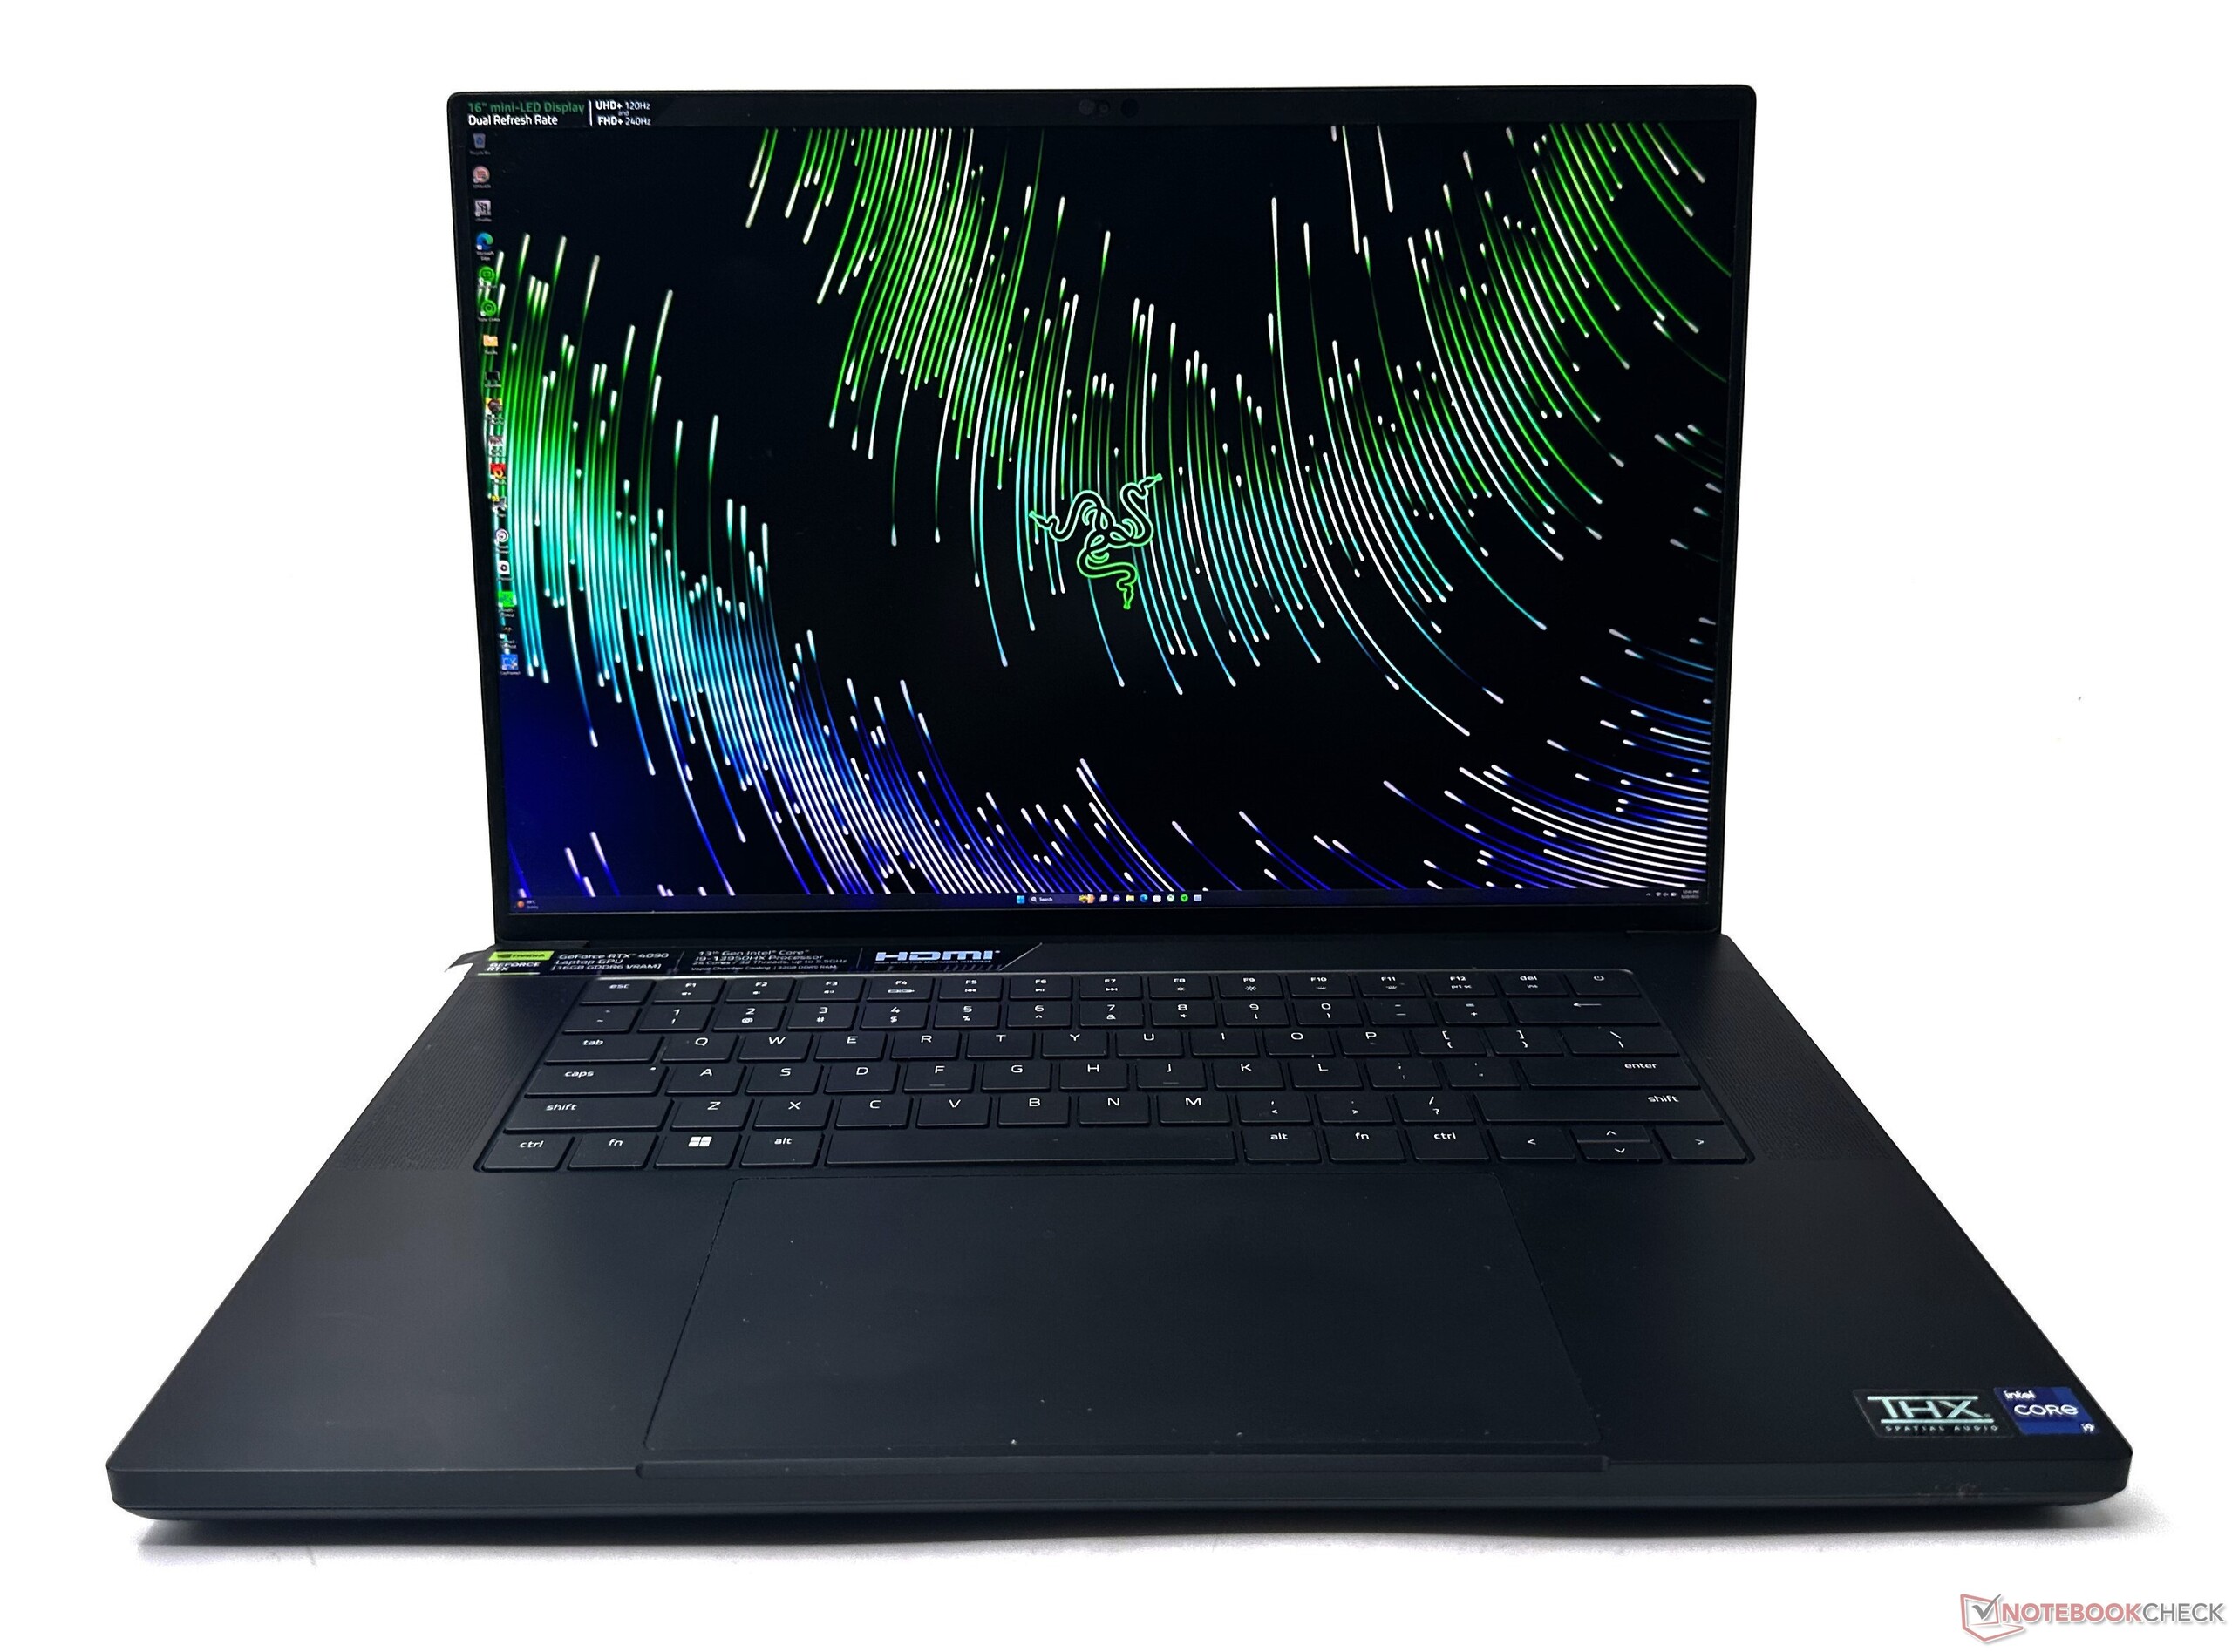
.O Blade 16 Early 2023 é o primeiro laptop a oferecer uma opção de exibição de modo duplo 16:10. Os usuários podem mudar entre os modos UHD+ (3840 x 2400) 120 Hz e FHD+ (1920 x 1200) 240 Hz de painel nativo, o que é um escalonamento inteiro perfeito. A maior resolução pode ajudar com fluxos de trabalho criativos, enquanto o FHD+ a 240 Hz vem a calhar durante jogos competitivos.
A Razer não especifica o número exato de zonas de escurecimento, mas esperamos que sejam mais de 1.000 semelhantes ao MSI Titan GT77 HX 13VI. A Nvidia G-Sync é suportada, mas somente no modo dGPU.
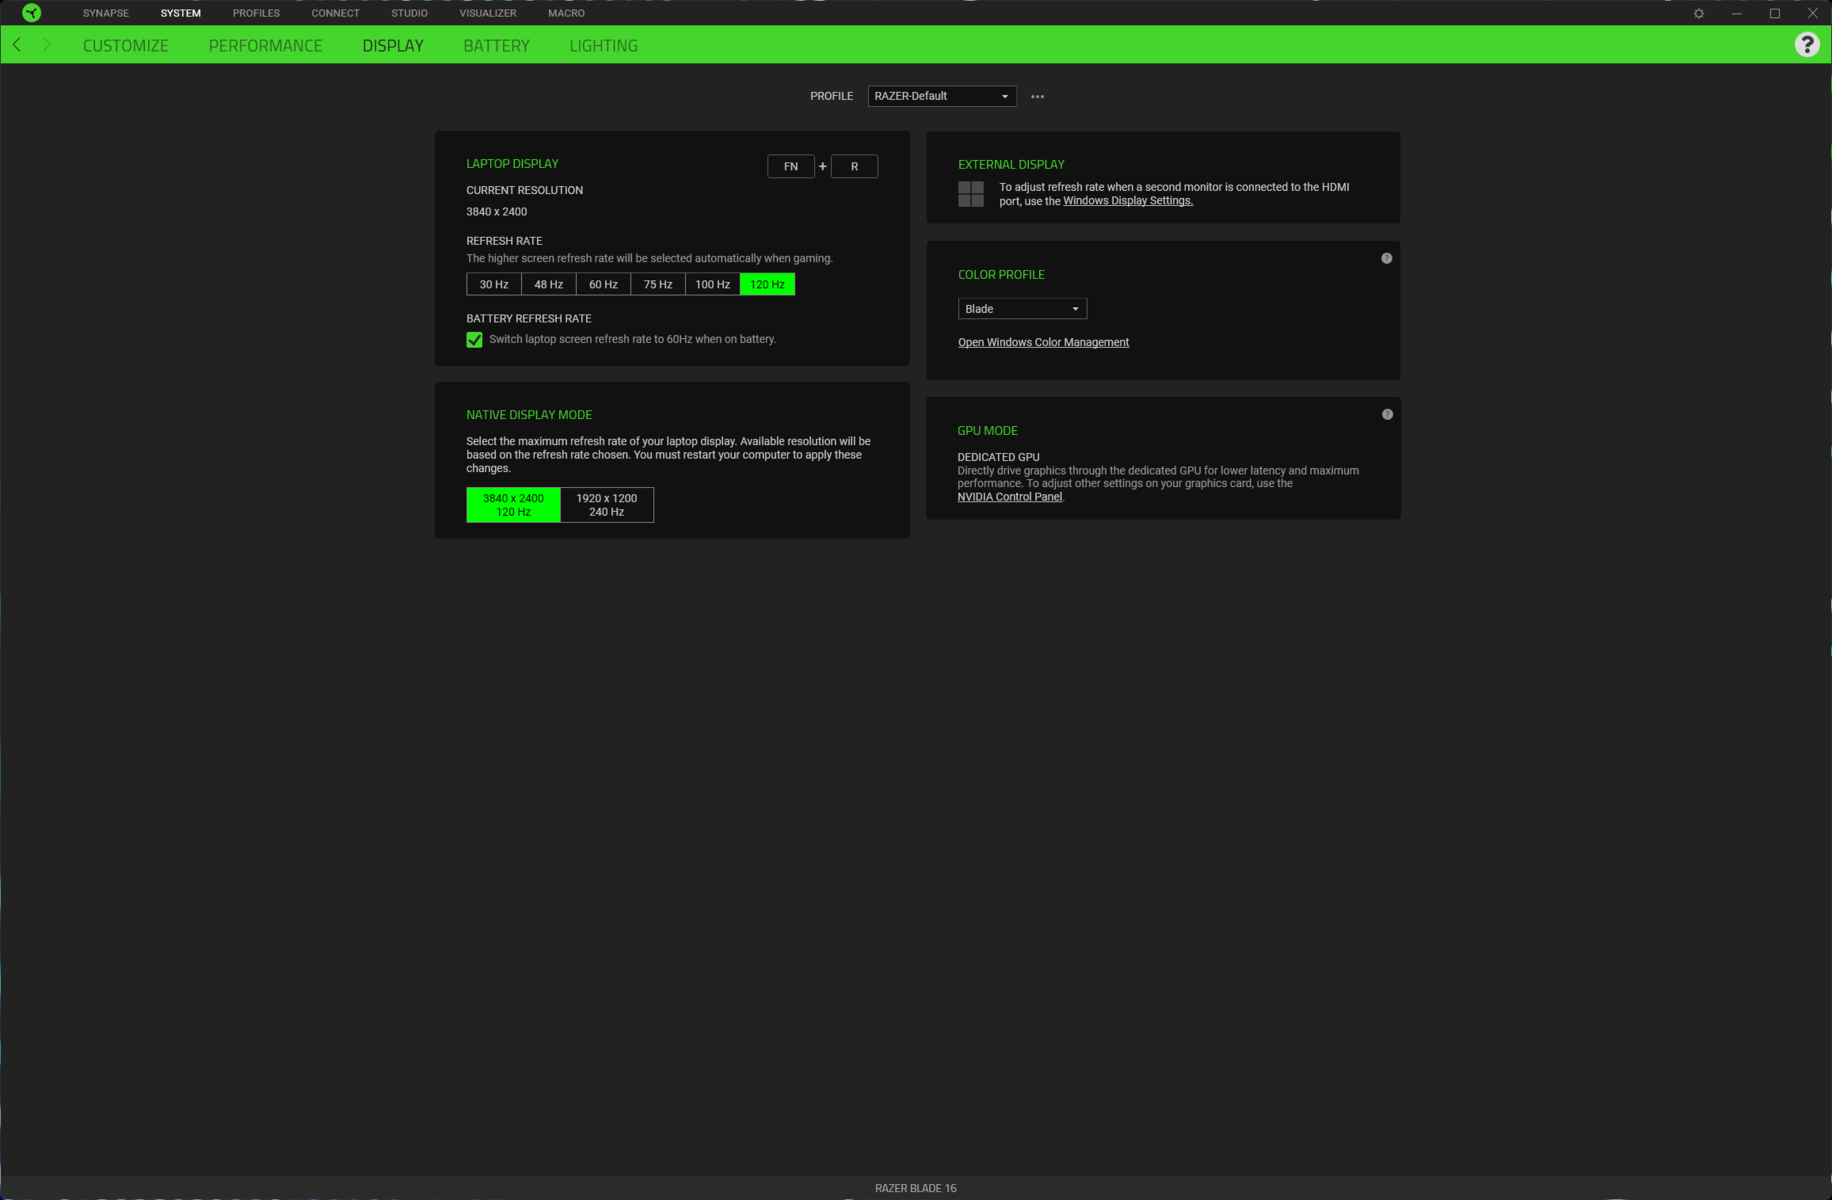
O modo de exibição pode ser alterado através da Razer Synapse (requer reinício) ou a partir da BIOS. Aqui, encontramos a primeira de várias peculiaridades. Se você mudar a resolução para FHD+ na BIOS, não poderá voltar para UHD+ a partir da interface UEFI. Ao contrário, você terá que confiar no Synapse para mudar para UHD+. Isto não é detalhado claramente e pode confundir os primeiros usuários.
Realizamos todos os testes no modo UHD+ 120 Hz, pois é a escolha lógica para qualquer pessoa que gaste mais de quatro mil dólares em um laptop.
A matriz sub-pixel parece um pouco granulosa quando vista de perto. Curiosamente, vemos que a matriz no modo UHD+ parece bastante afiada e bem definida. Seria de se esperar um tamanho de pixel maior ao mudar para o modo FHD+, mas vemos aqui pixels de tamanho idêntico.
Também podemos ver artefatos de confusão e aliasing na matriz sub-pixel - não é tão nítida quanto o modo UHD+ e definitivamente não é tão nítida em comparação com um painel FHD nativo. Parece que o Razer está simplesmente diminuindo a resolução de 4K e usando a dízima temporal.
Isto pode não ser um grande problema enquanto se joga com um atirador de ritmo rápido, mas recomendamos que se mantenha a resolução nativa UHD+ na maior parte do tempo. Não há sangramento de luz de fundo observado sob alta exposição.


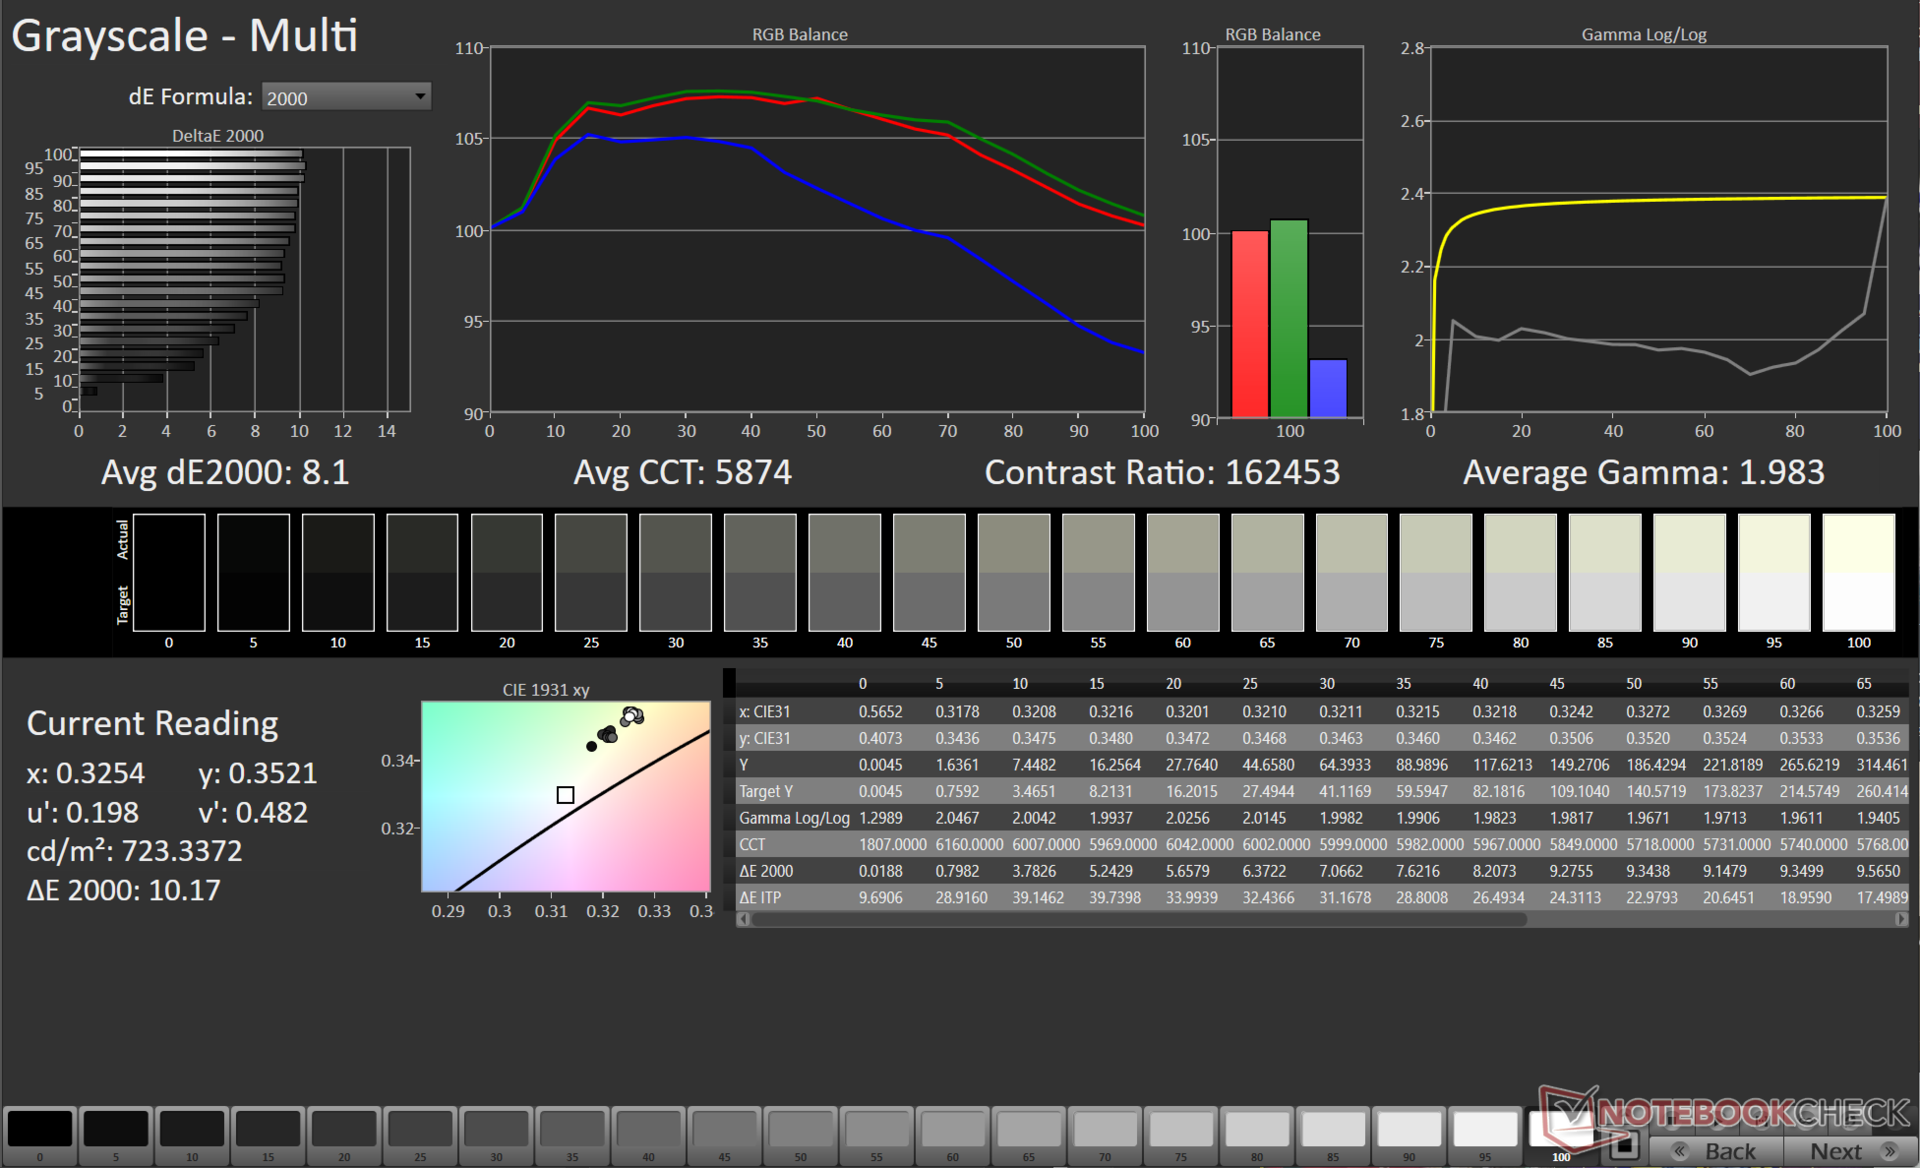
O painel 2023 Razer Blade 16 é oficialmente classificado para oferecer um pico de luminosidade de 1.000 lêndeas. Observamos uma excelente distribuição de brilho de 94% com um valor de pico de 752 lêndeas no modo SDR.
Por alguma razão, estes valores são obtidos somente quando se utiliza o perfil de cor padrão do Windows, que é a base para nossas medidas abaixo. A Lâmina 16 vem calibrada de fábrica, mas usando este perfil ICC reduz os níveis de brilho em boas 100 lêndeas.
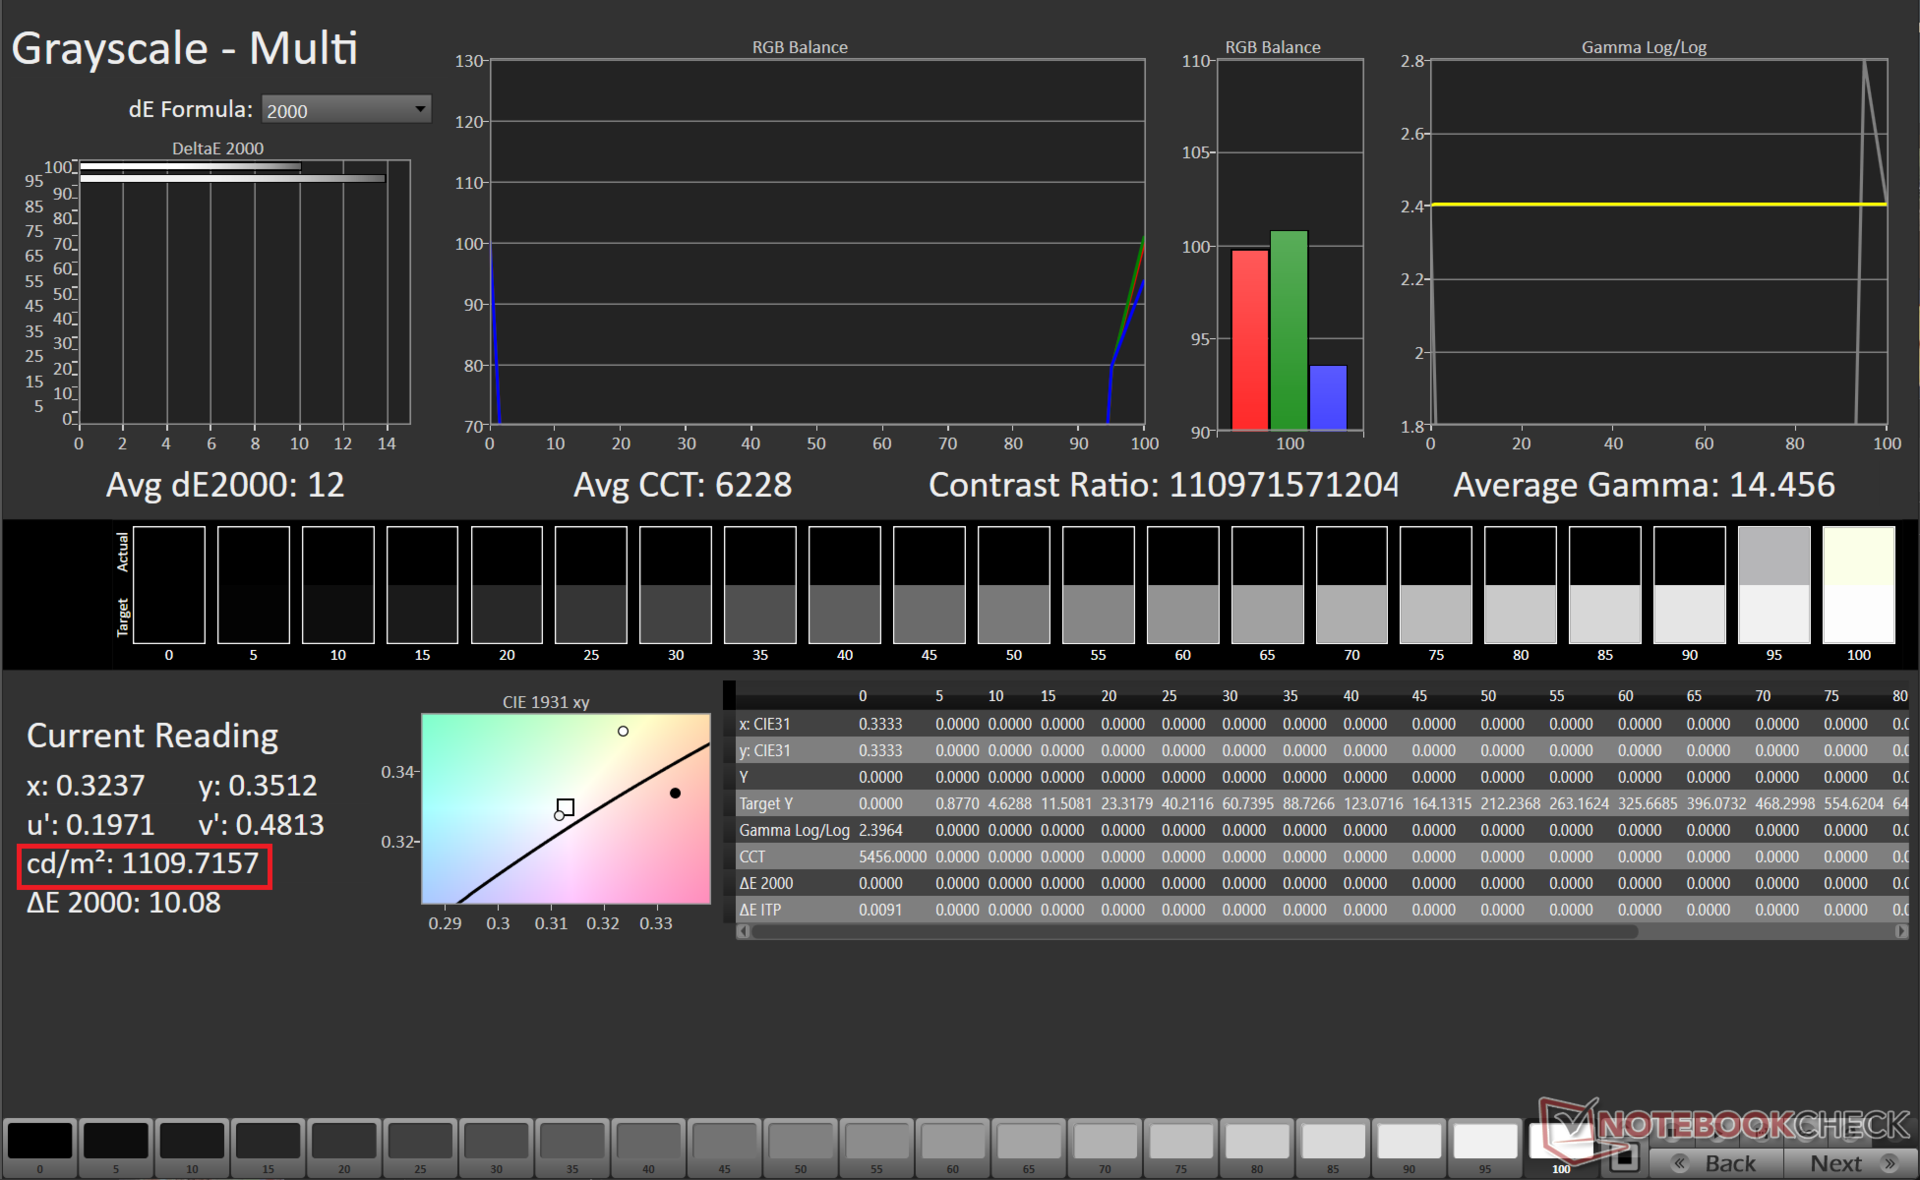
Medimos cerca de 1.110 lêndeas no modo HDR com uma imagem 100% branca. Não é exatamente Apple MacBook Pro 16 mas ainda é uma excelente luminância, no entanto.
Não há perfis de cor pré-definidos, exceto o único arquivo ICC calibrado de fábrica. No modo UHD+, os usuários podem selecionar o perfil desejado diretamente das configurações de exibição do Windows ou do Razer Synapse. Estas opções não estão disponíveis no modo FHD+, no entanto.
| |||||||||||||||||||||||||
iluminação: 94 %
iluminação com acumulador: 723 cd/m²
Contraste: 162222:1 (Preto: 0.0045 cd/m²)
ΔE ColorChecker Calman: 5.65 | ∀{0.5-29.43 Ø4.71}
calibrated: 1.85
ΔE Greyscale Calman: 8.1 | ∀{0.09-98 Ø4.96}
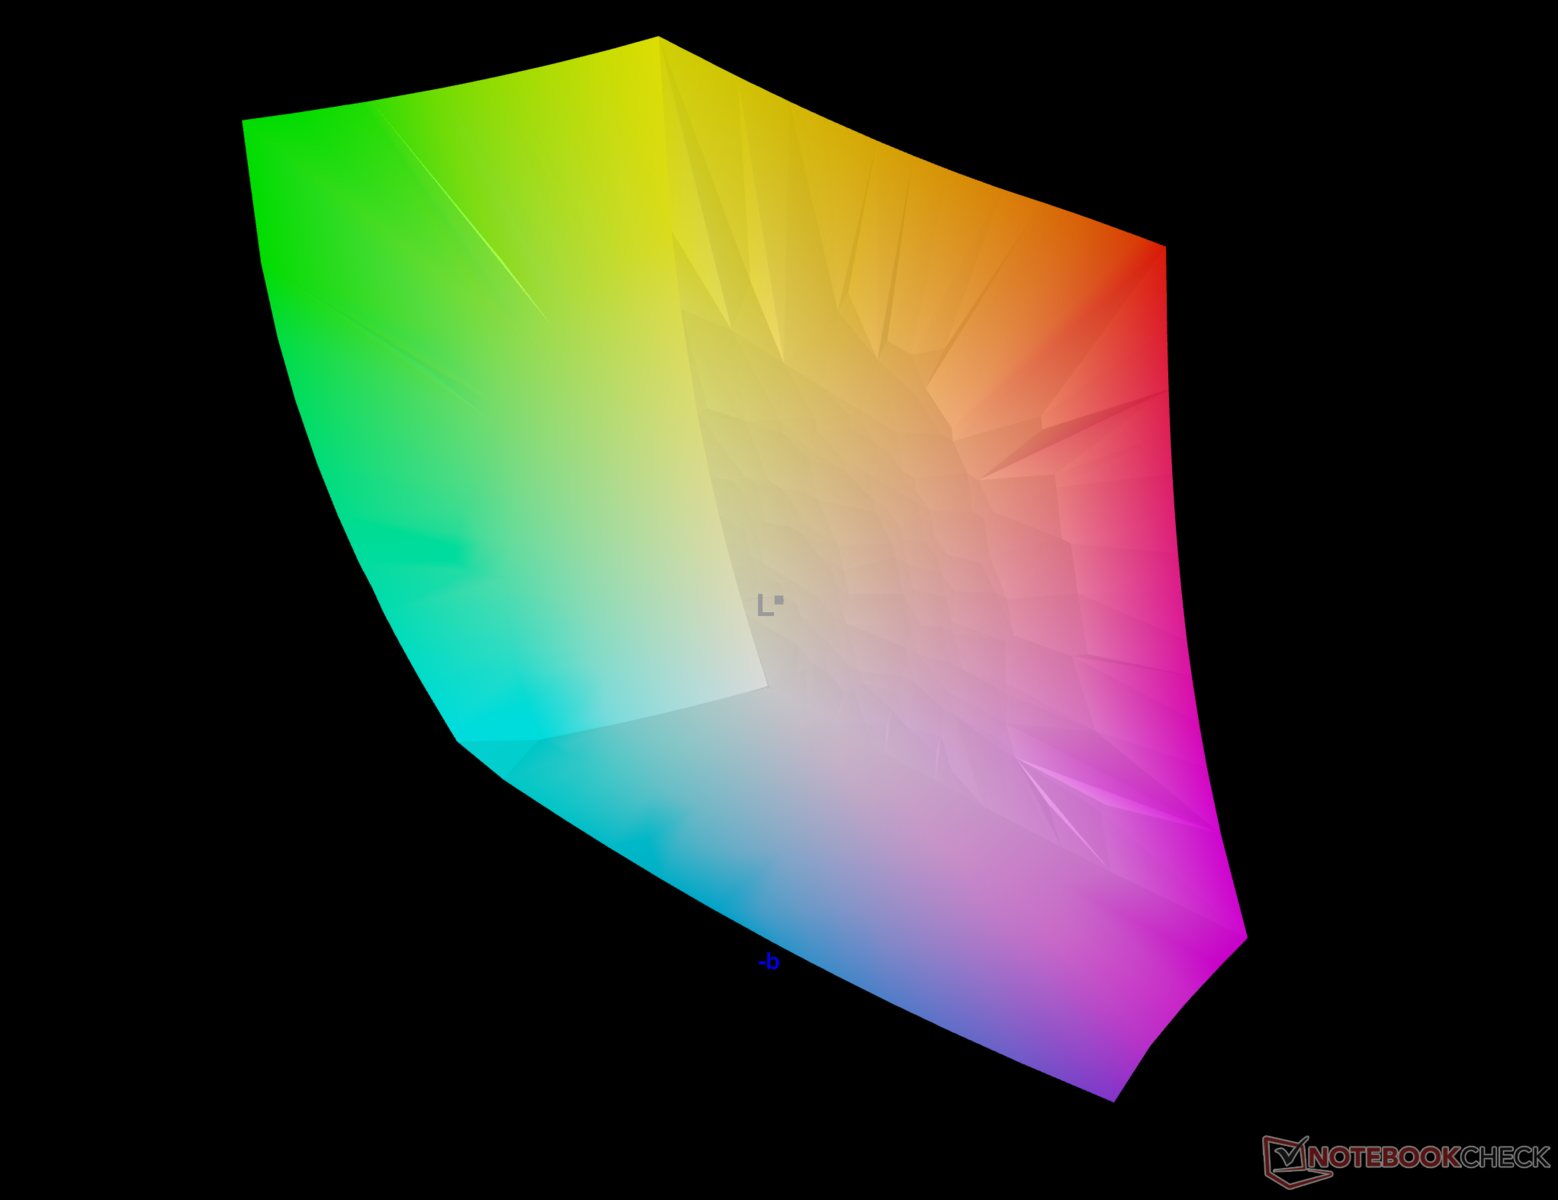
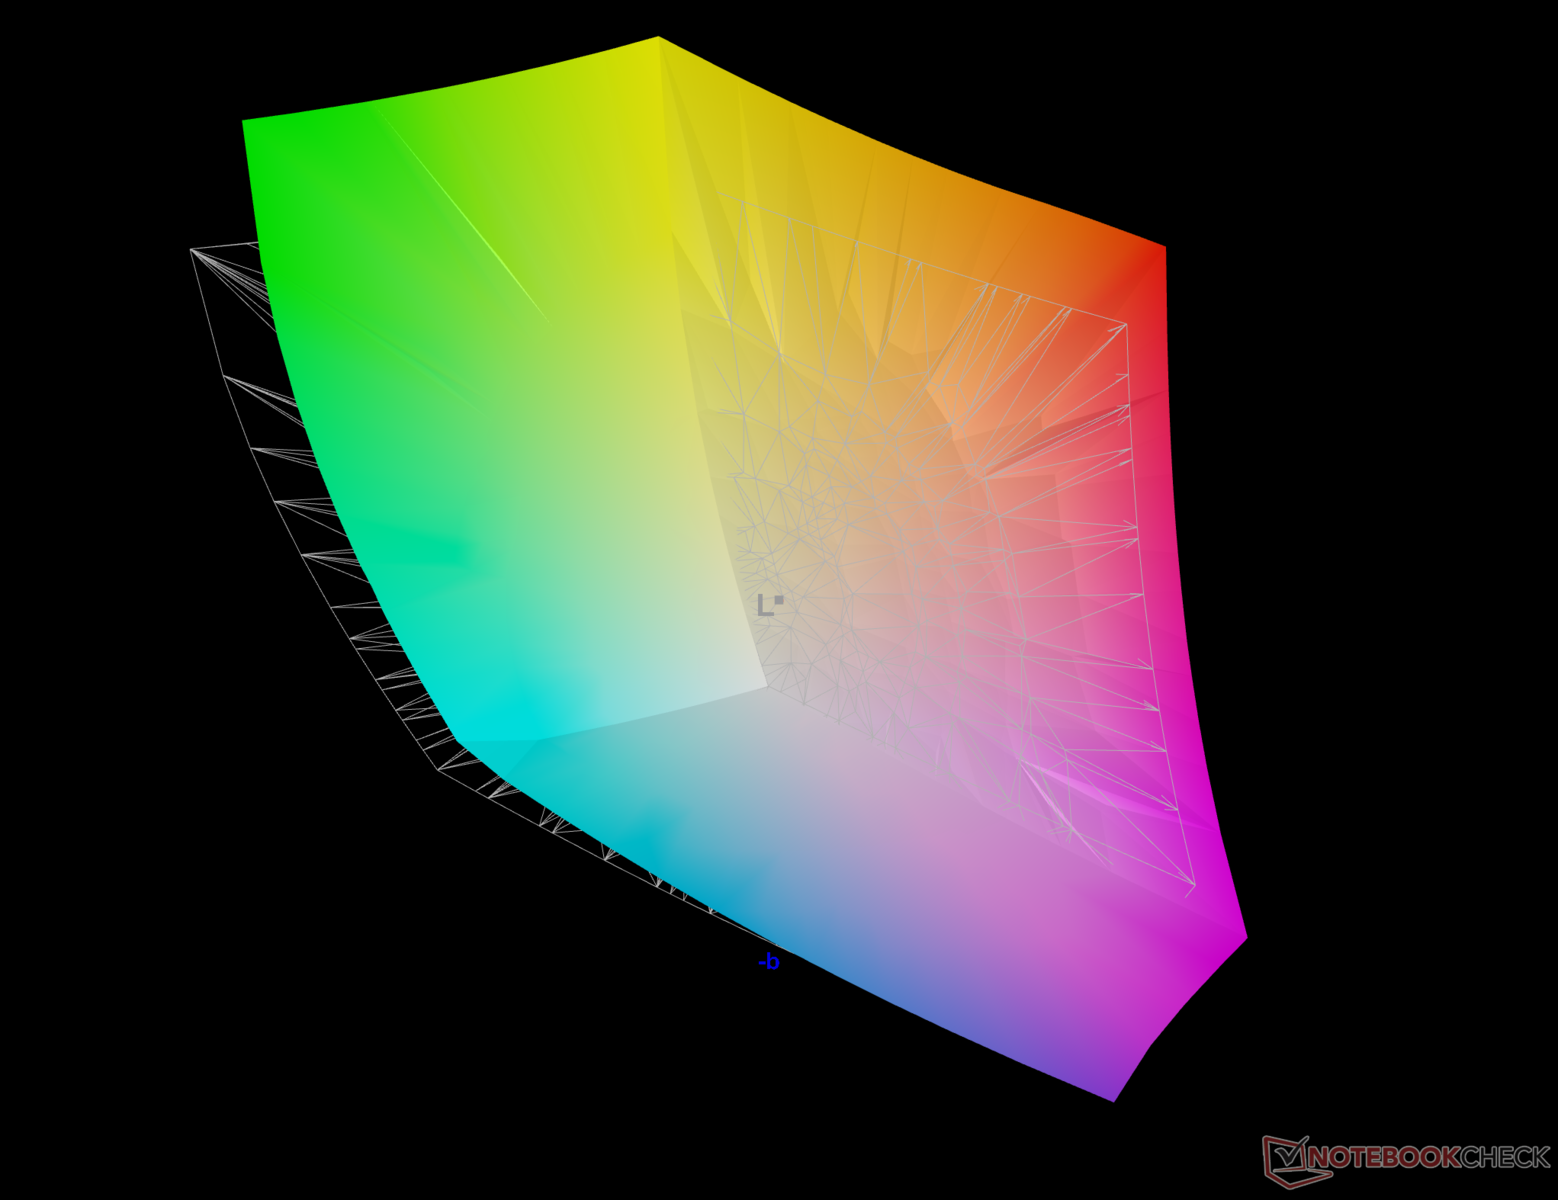
90.9% AdobeRGB 1998 (Argyll 3D)
100% sRGB (Argyll 3D)
99.9% Display P3 (Argyll 3D)
Gamma: 1.98
CCT: 5874 K
| Razer Blade 16 Early 2023 RTX 4090 AUO B160ZAN01.U, mini-LED, 3840x2400, 16" | Asus Zephyrus Duo 16 GX650PY-NM006W NE160QDM-NM4, MiniLED, 2560x1600, 16" | MSI Titan GT77 HX 13VI B173ZAN06.C, Mini-LED, 3840x2160, 17.3" | Asus ROG Strix G16 G614JZ TL160ADMP03-0, IPS, 2560x1600, 16" | Lenovo Legion Pro 7 16IRX8H MNG007DA2-3 (CSO1628), IPS, 2560x1600, 16" | Razer Blade 18 RTX 4070 AU Optronics B180QAN01.0, IPS, 2560x1600, 18" | |
|---|---|---|---|---|---|---|
| Display | -0% | -1% | -3% | -18% | -3% | |
| Display P3 Coverage (%) | 99.9 | 99.4 -1% | 94.9 -5% | 97 -3% | 69.1 -31% | 96.9 -3% |
| sRGB Coverage (%) | 100 | 100 0% | 99.9 0% | 99.9 0% | 99.7 0% | 99.8 0% |
| AdobeRGB 1998 Coverage (%) | 90.9 | 90.8 0% | 92.4 2% | 84.9 -7% | 71.2 -22% | 85.3 -6% |
| Response Times | 10% | -110% | 70% | 35% | 73% | |
| Response Time Grey 50% / Grey 80% * (ms) | 10.2 ? | 15.2 ? -49% | 38.4 ? -276% | 5.1 ? 50% | 12.3 ? -21% | 4.2 ? 59% |
| Response Time Black / White * (ms) | 62.04 ? | 19 ? 69% | 26.6 ? 57% | 6.6 ? 89% | 5.9 ? 90% | 8 ? 87% |
| PWM Frequency (Hz) | 2420 ? | 12000 ? | 2380 ? | |||
| Screen | -147% | 417% | -1018% | -962% | -1303% | |
| Brightness middle (cd/m²) | 730 | 712 -2% | 606 -17% | 470 -36% | 511 -30% | 549.6 -25% |
| Brightness (cd/m²) | 729 | 703 -4% | 602 -17% | 459 -37% | 469 -36% | 524 -28% |
| Brightness Distribution (%) | 94 | 95 1% | 93 -1% | 93 -1% | 86 -9% | 89 -5% |
| Black Level * (cd/m²) | 0.0045 | 0.07 -1456% | 0.0001 98% | 0.42 -9233% | 0.4 -8789% | 0.53 -11678% |
| Contrast (:1) | 162222 | 10171 -94% | 6060000 3636% | 1119 -99% | 1278 -99% | 1037 -99% |
| Colorchecker dE 2000 * | 5.65 | 1.7 70% | 4.8 15% | 1.86 67% | 0.95 83% | 3.32 41% |
| Colorchecker dE 2000 max. * | 10.11 | 4 60% | 8.2 19% | 3.87 62% | 2.07 80% | 6.63 34% |
| Colorchecker dE 2000 calibrated * | 1.85 | 1.2 35% | 1.8 3% | 0.93 50% | 0.91 51% | 2.7 -46% |
| Greyscale dE 2000 * | 8.1 | 2.8 65% | 6.5 20% | 2.7 67% | 0.6 93% | 2 75% |
| Gamma | 1.98 111% | 2.21 100% | 2.63 84% | 2.246 98% | 2.176 101% | 2.29 96% |
| CCT | 5874 111% | 6978 93% | 6596 99% | 6711 97% | 6545 99% | 6319 103% |
| Média Total (Programa/Configurações) | -46% /
-93% | 102% /
252% | -317% /
-645% | -315% /
-617% | -411% /
-828% |
* ... menor é melhor
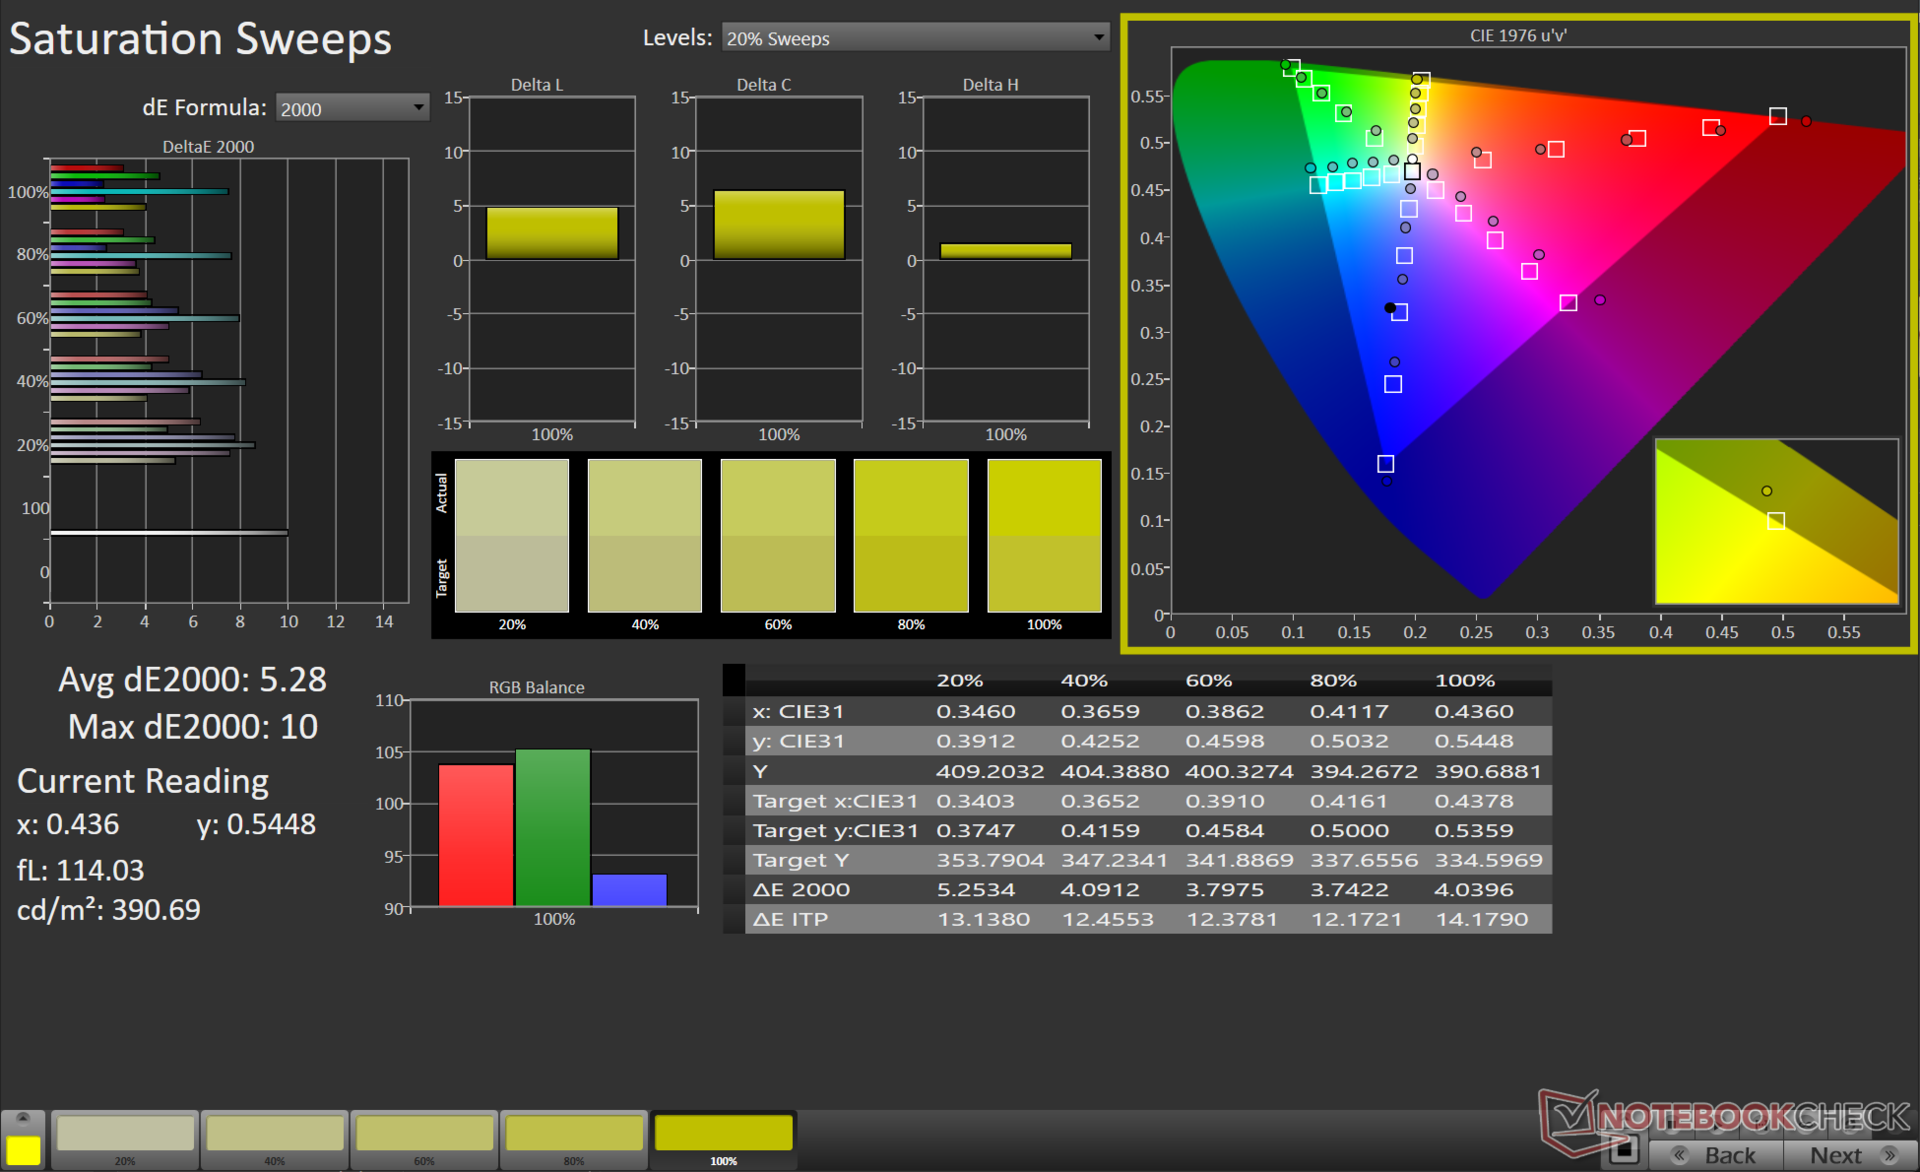
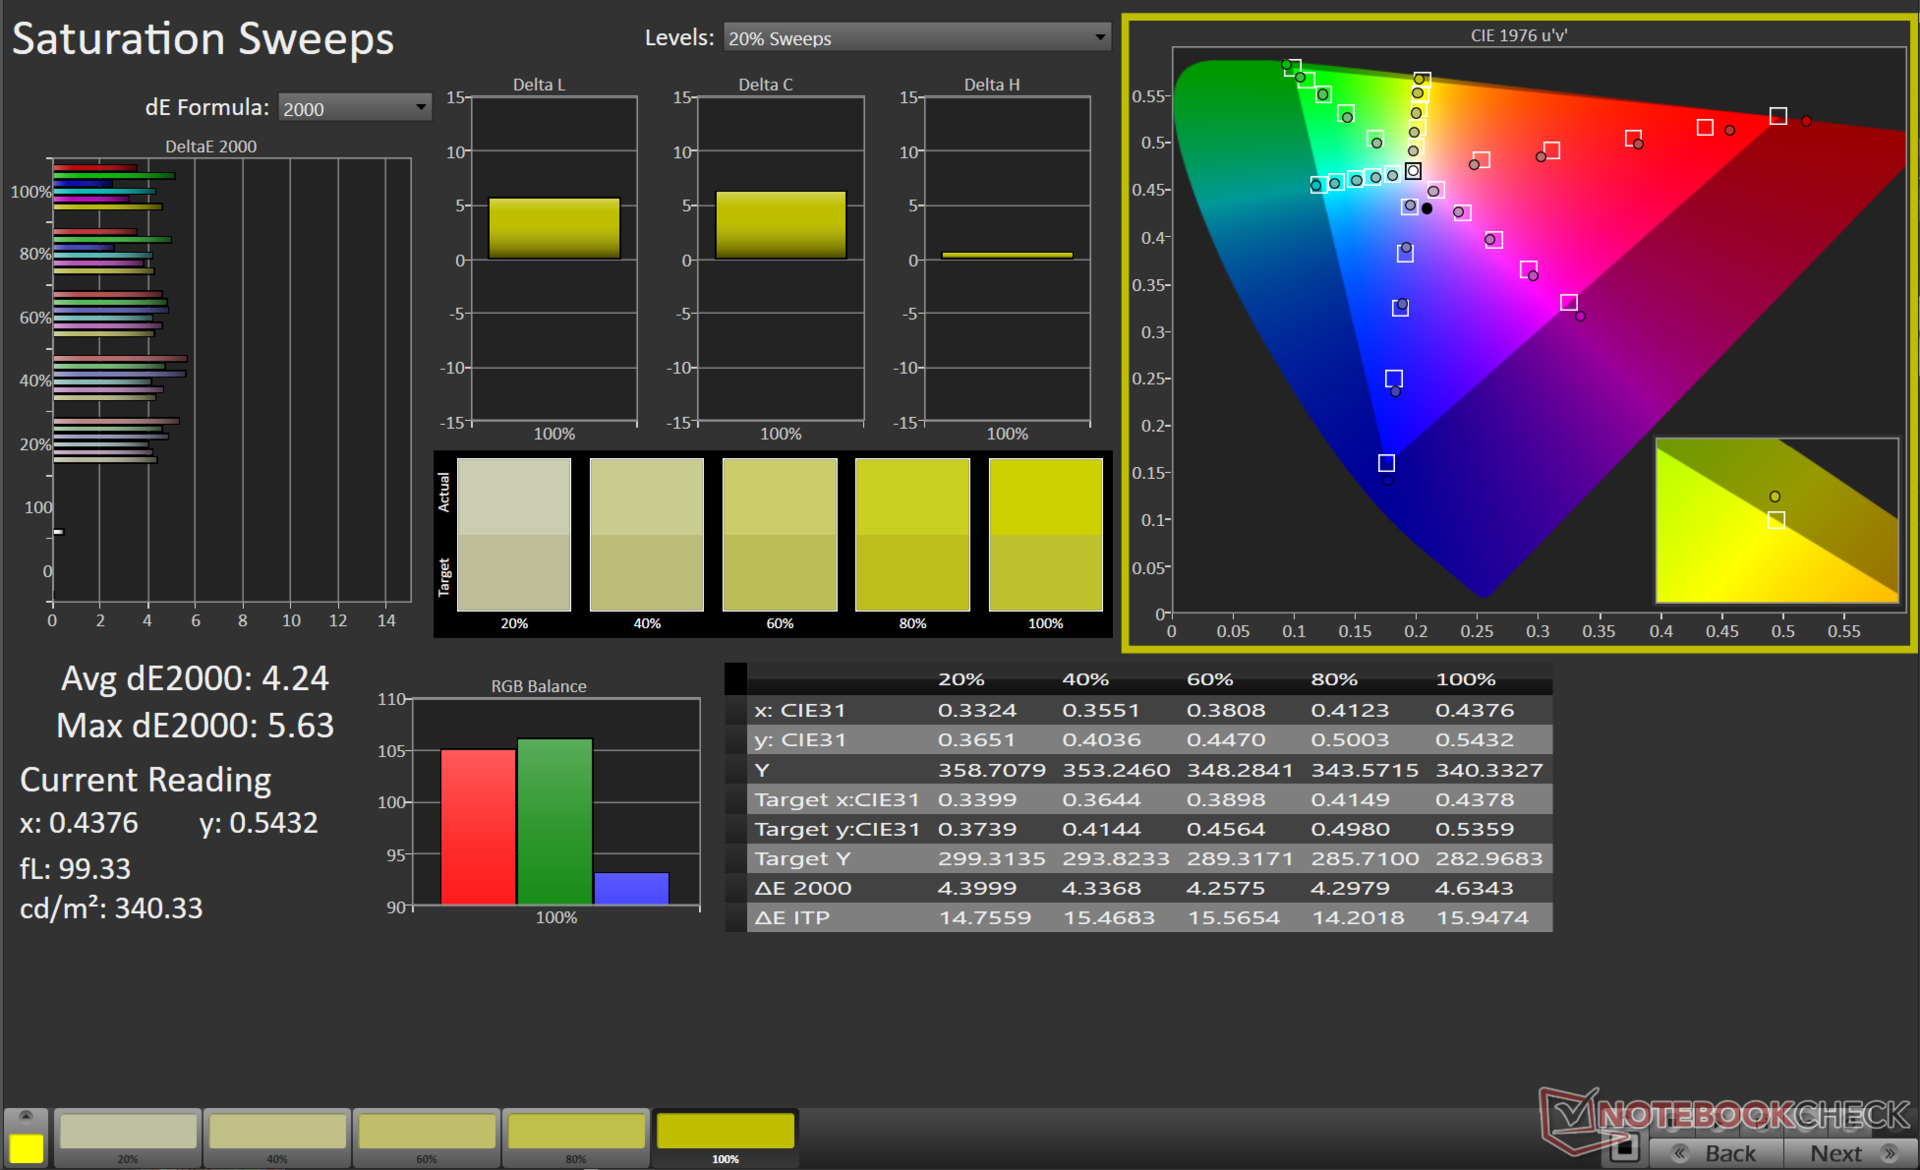
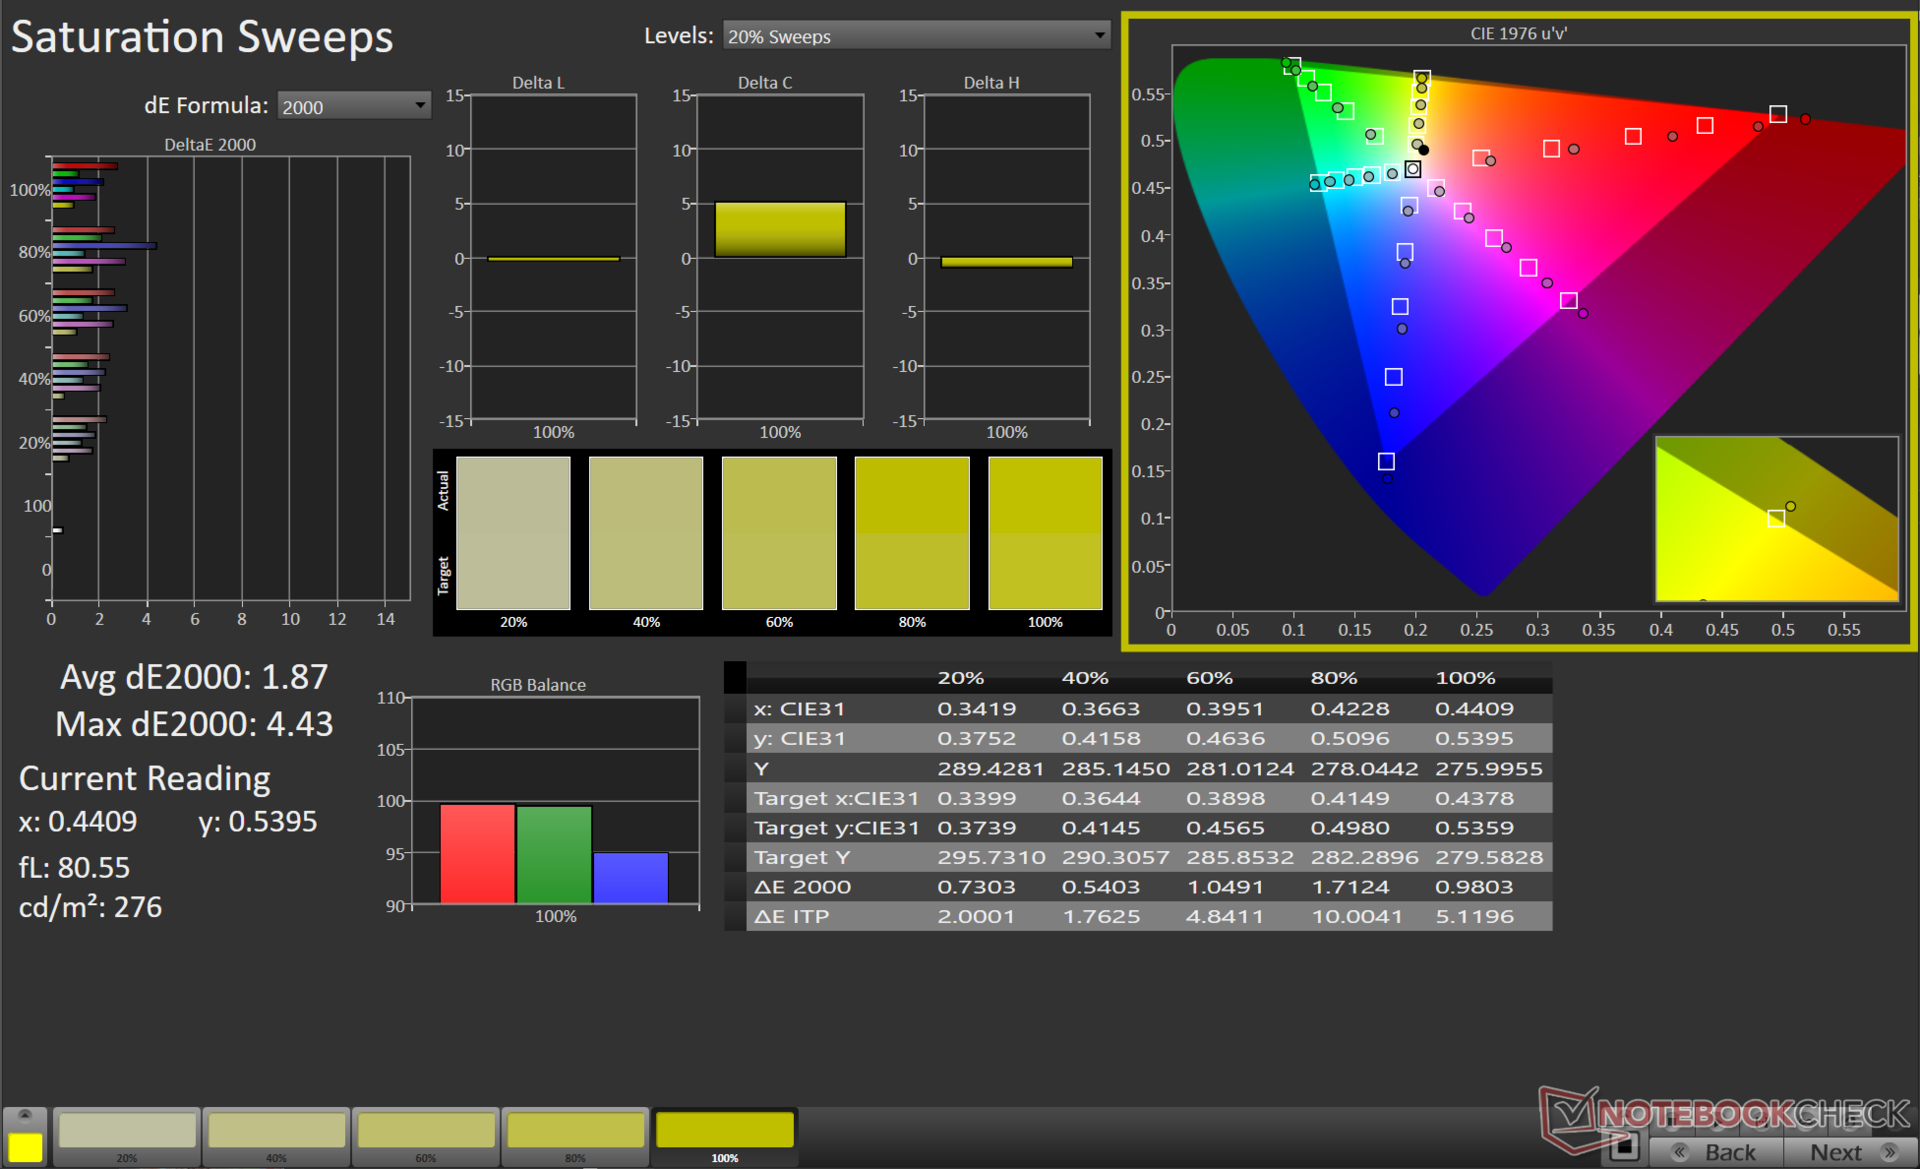
A Razer anuncia uma cobertura 100% DCI-P3 para este painel, e nossas medidas confirmam o mesmo também. Também observamos uma cobertura completa da gama de cores sRGB e uma excelente cobertura de 91% do Adobe RGB, o que significa que a tela do Blade 16 é acessível tanto para os jogadores quanto para os criadores de conteúdo.
Subjetivamente, o visor de mini LED é um tratamento visual com pretos quase infinitos e cores perfuradas. Há alguma floração observada em inspeção próxima, mas não distrai e não atrapalha a experiência visual.
Este é o mais próximo que se pode chegar da qualidade OLED e ao mesmo tempo colher os benefícios de altos níveis de luminância.

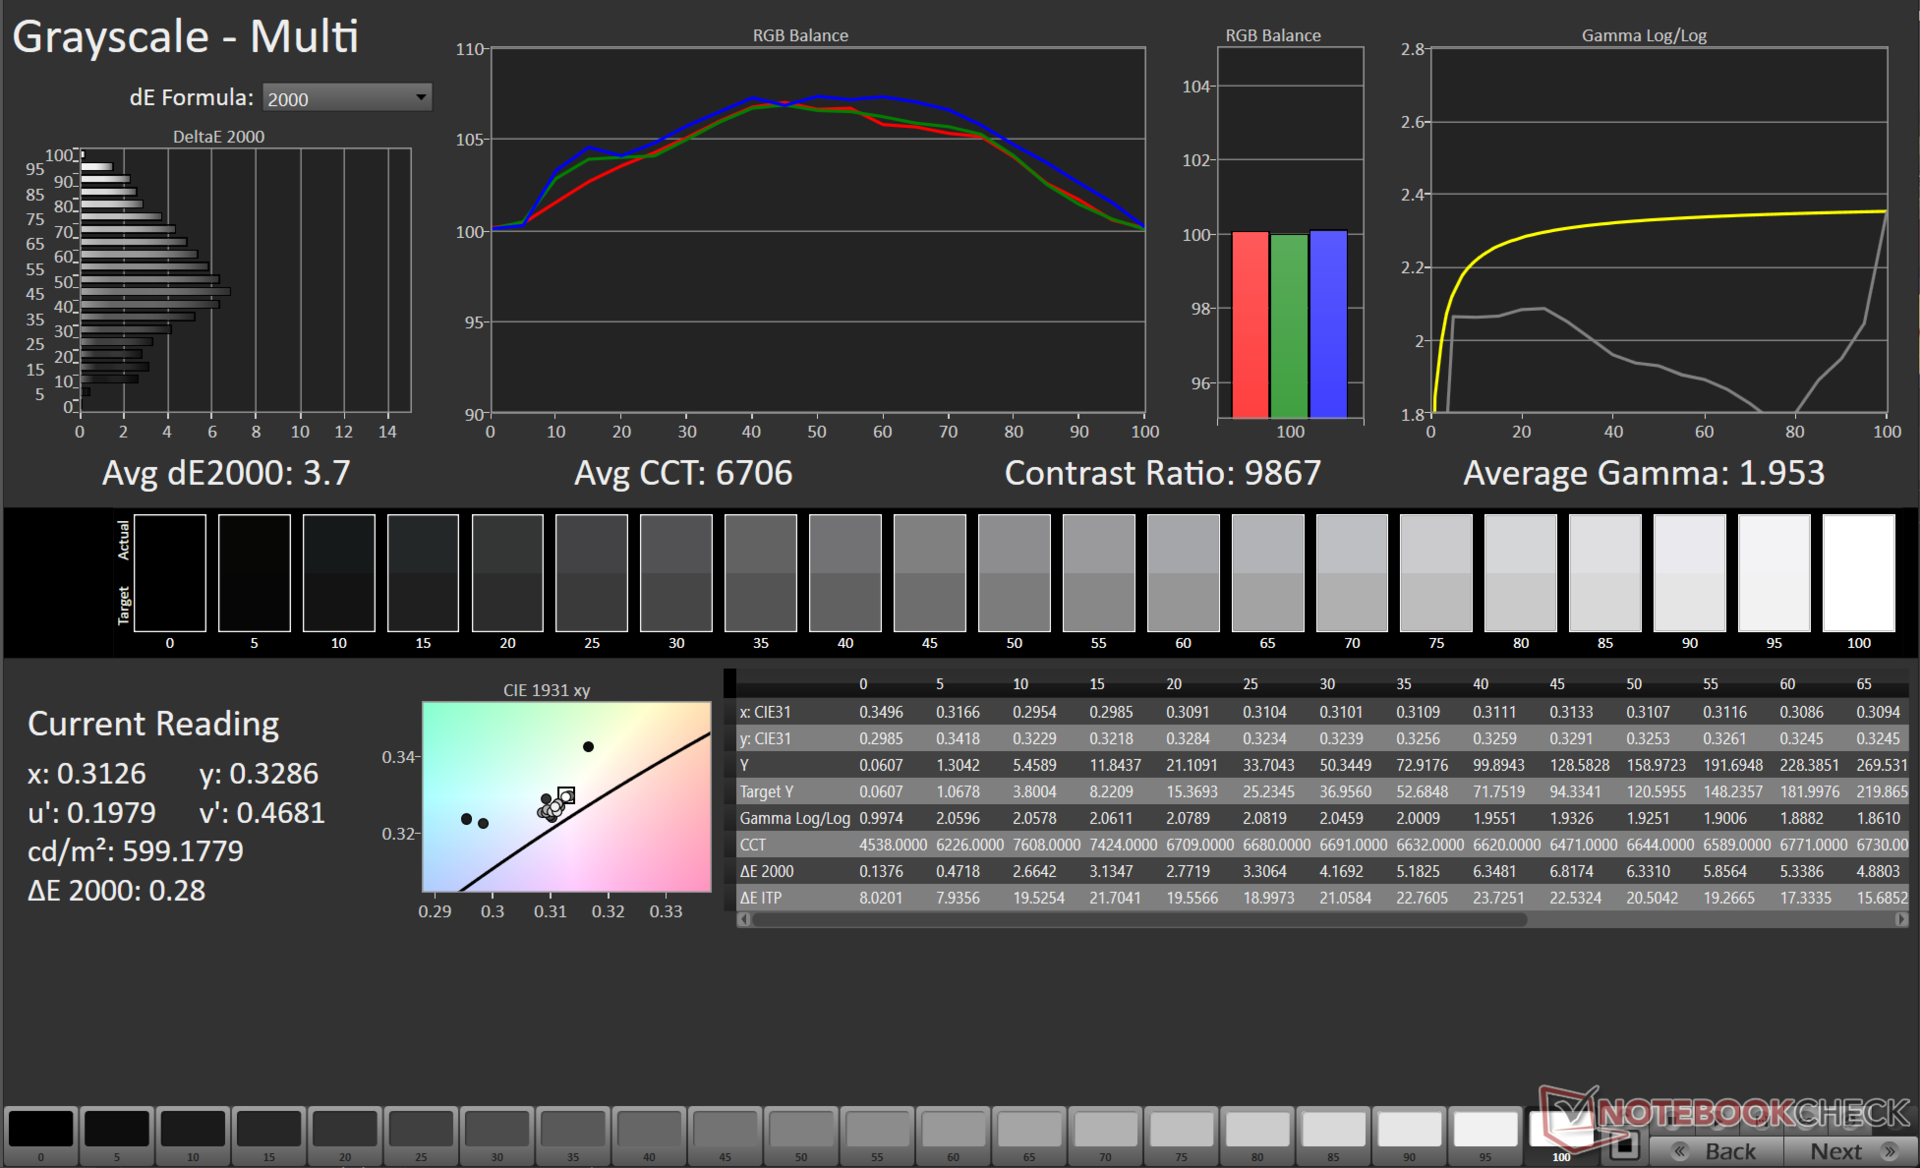
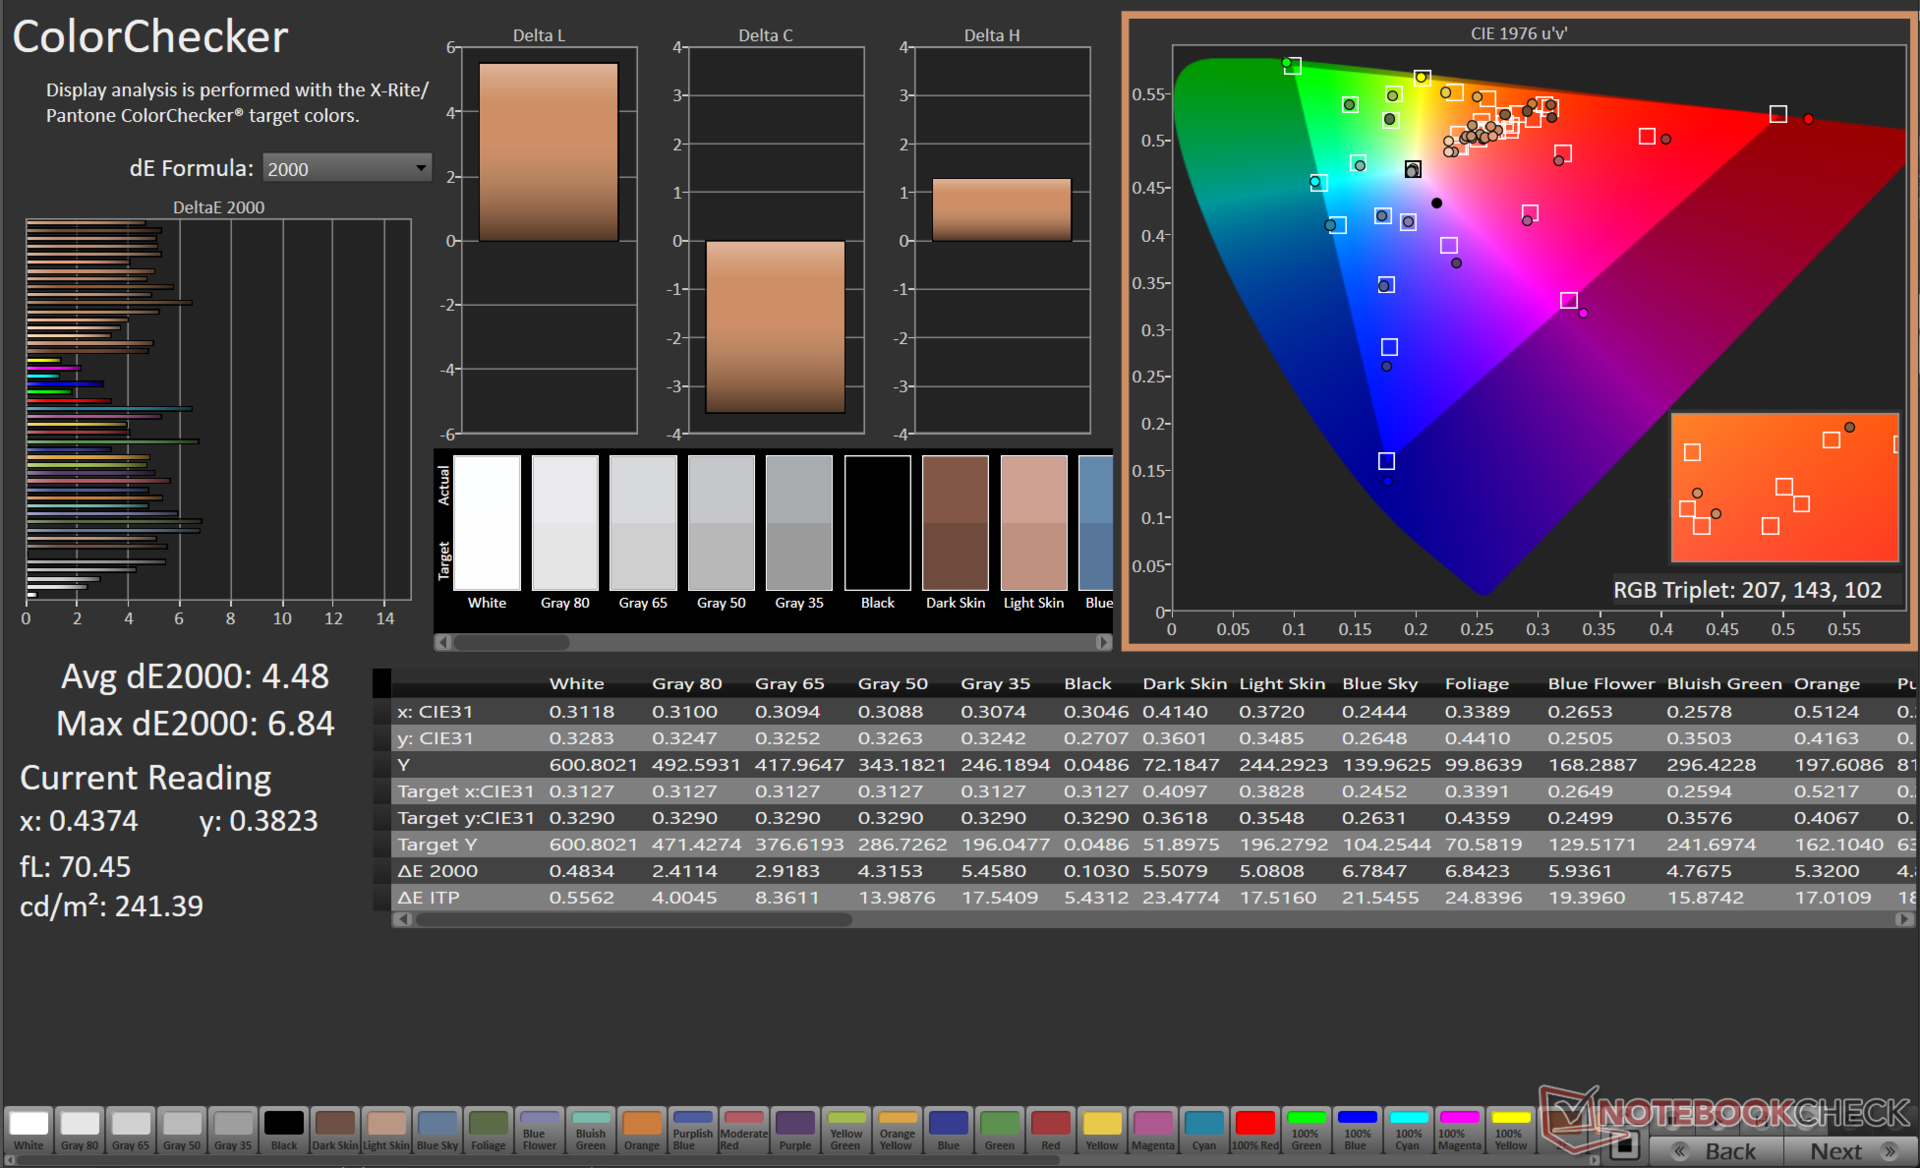
Embora a calibração de fábrica pareça reduzir o brilho geral do SDR, os valores do Delta E são muito melhores comparados com os do perfil ICC padrão do Windows. Dito isto, a calibração de cor de fábrica não é perfeita e tem muito espaço para melhorias.
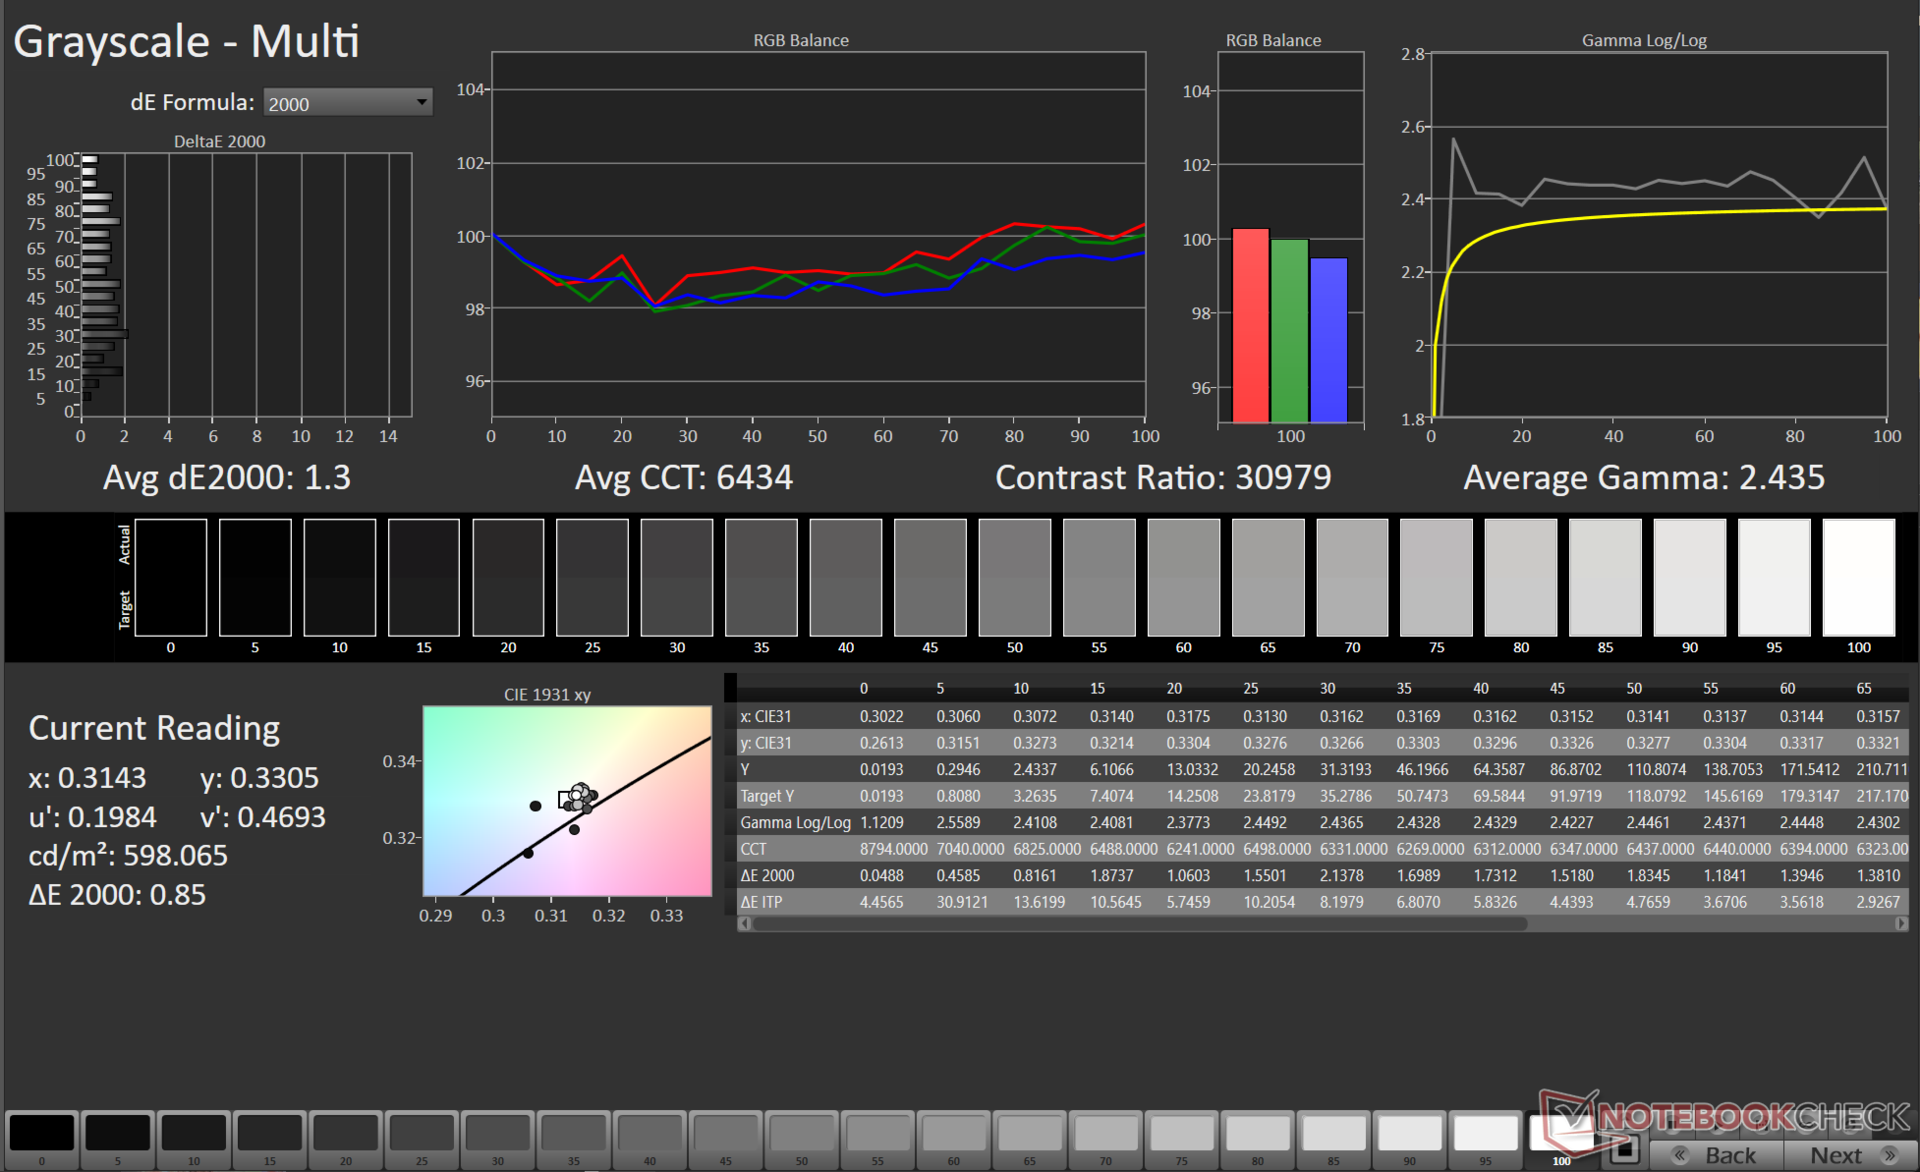
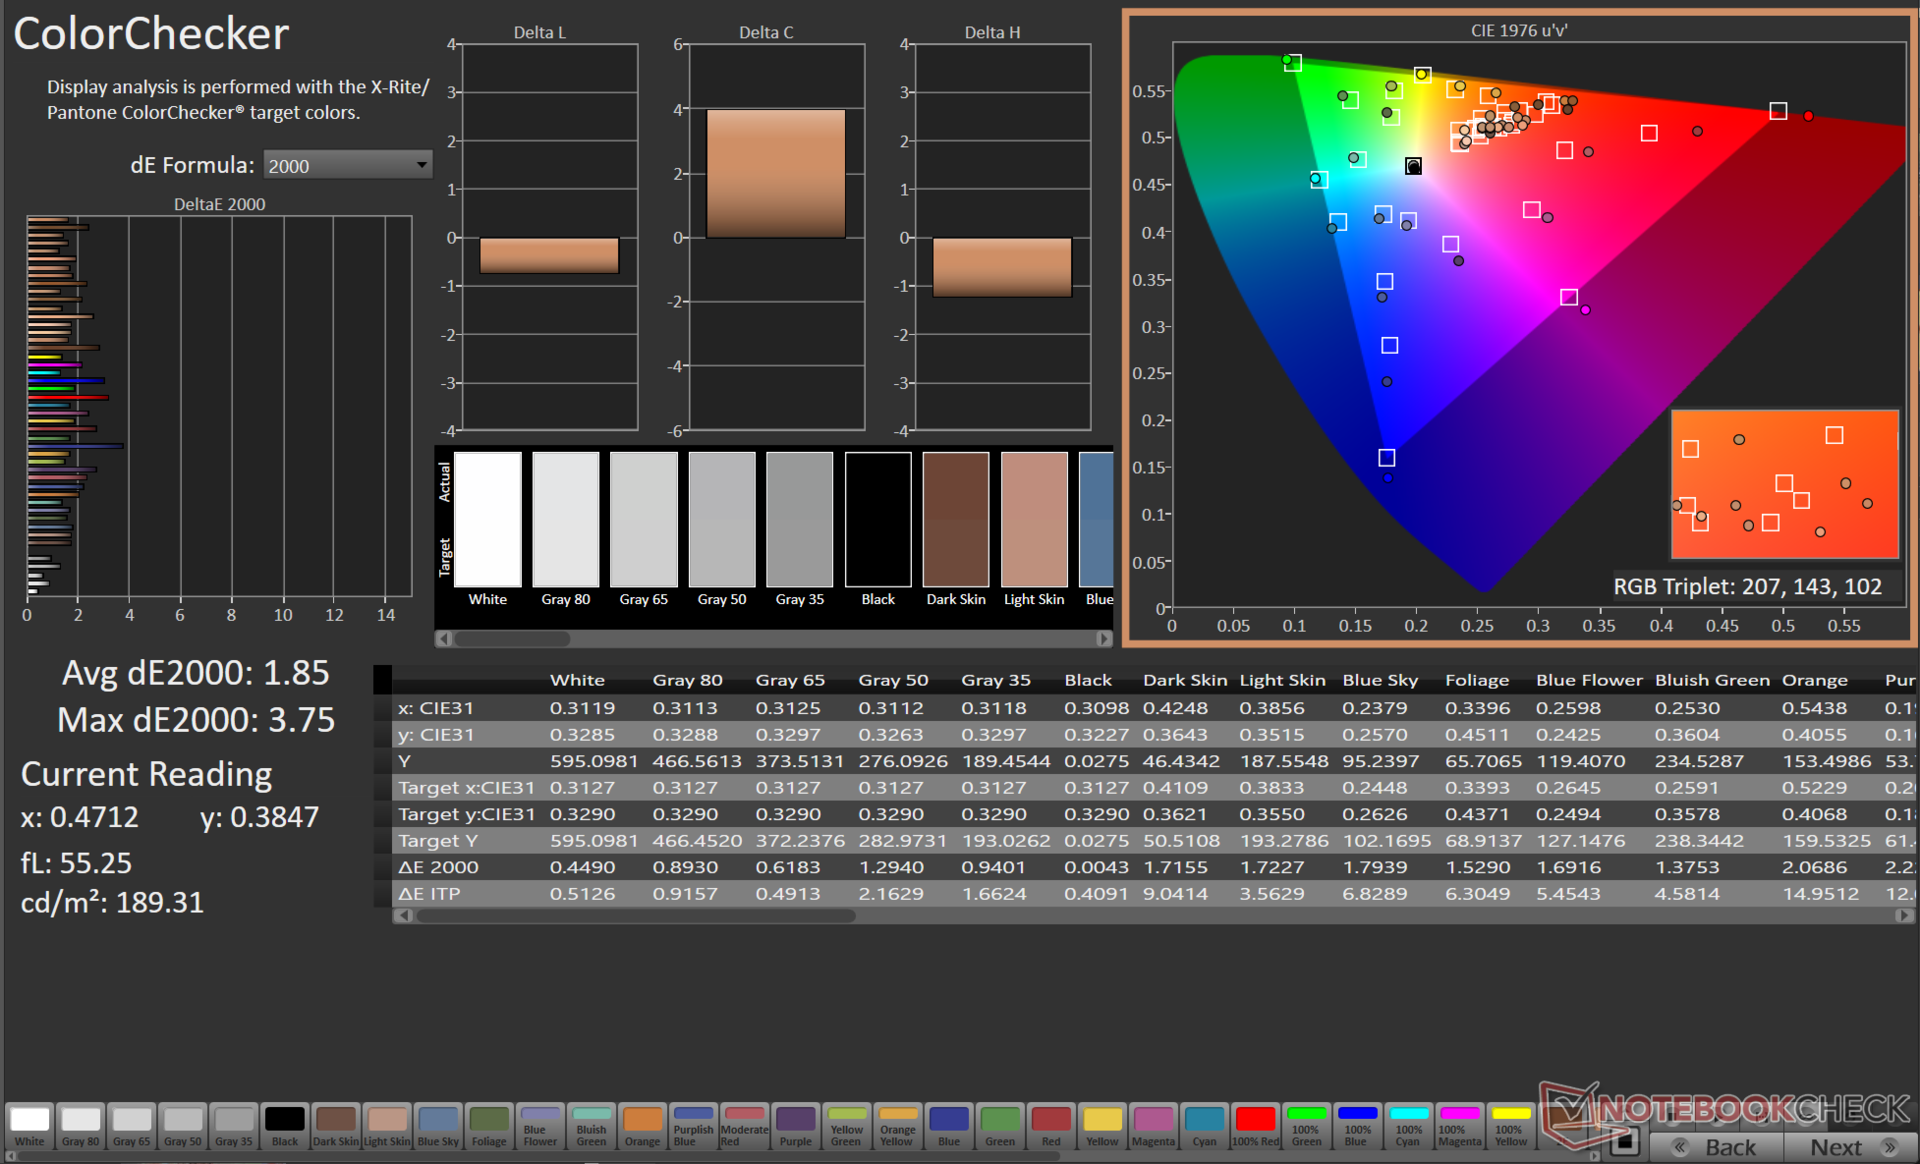
Nós calibramos a tela da Blade 16 usando o espectrofotômetro X-Rite i1Basic Pro 3 e o software de calibração de cores Calman Ultimate da Portrait Displays no espaço de cores DCI-P3.
Nossa rotina de calibração resulta em valores médios Delta E significativamente melhorados de 1,3 e 1,85 nas medidas de Grayscale e ColorChecker, respectivamente. O vermelho e 100% azul apresentam os maiores desvios, mas o Delta E máximo de 3,75 ainda é bastante útil para a maioria dos fluxos de trabalho criativos. Observe que os níveis de brilho caem mais uma vez aqui após a calibração.
O arquivo ICC calibrado pode ser baixado a partir do link acima.

Exibir tempos de resposta
| ↔ Tempo de resposta preto para branco | ||
|---|---|---|
| 62.04 ms ... ascensão ↗ e queda ↘ combinadas | ↗ 58.04 ms ascensão |  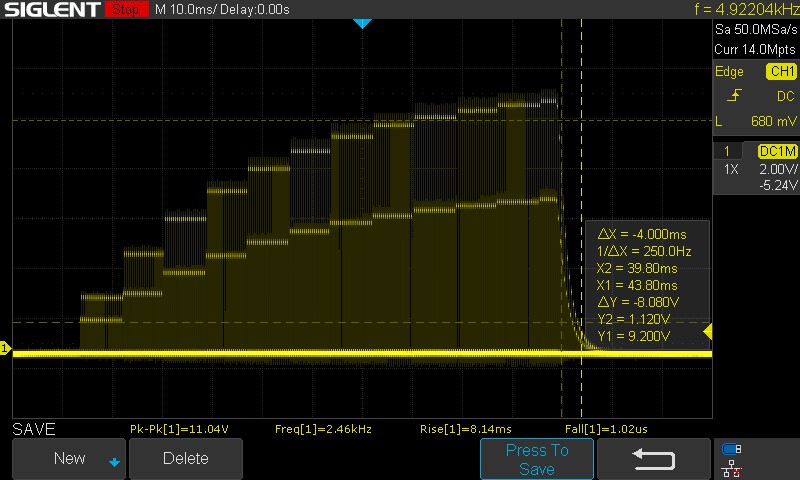 |
| ↘ 4 ms queda | ||
| A tela mostra taxas de resposta lentas em nossos testes e será insatisfatória para os jogadores. Em comparação, todos os dispositivos testados variam de 0.1 (mínimo) a 240 (máximo) ms. » 100 % de todos os dispositivos são melhores. Isso significa que o tempo de resposta medido é pior que a média de todos os dispositivos testados (19.8 ms). | ||
| ↔ Tempo de resposta 50% cinza a 80% cinza | ||
| 10.2 ms ... ascensão ↗ e queda ↘ combinadas | ↗ 5.8 ms ascensão |  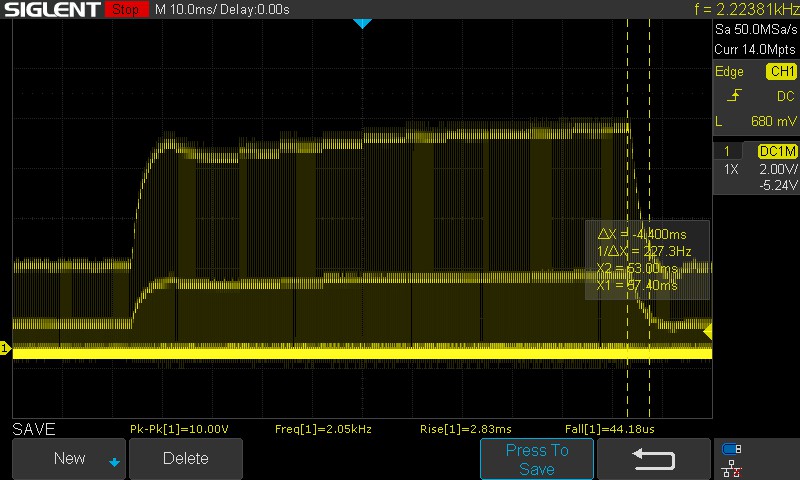 |
| ↘ 4.4 ms queda | ||
| A tela mostra boas taxas de resposta em nossos testes, mas pode ser muito lenta para jogadores competitivos. Em comparação, todos os dispositivos testados variam de 0.165 (mínimo) a 636 (máximo) ms. » 24 % de todos os dispositivos são melhores. Isso significa que o tempo de resposta medido é melhor que a média de todos os dispositivos testados (31 ms). | ||
A matriz mini-LED torna a medição precisa dos tempos de resposta um pouco complicada. A alta cintilação significou que tivemos que amostrar os dados em toda a faixa de pulsação e determinar manualmente os tempos de subida e descida. Os valores observados acima, portanto, parecerão mais altos do que o normal para um laptop para jogos, particularmente com a transição de 100% de preto para 100%.
A Razer anuncia um tempo de resposta de 3 ms, mas não está claro sob quais condições este valor é obtido. Usamos uma configuração de brilho 100% SDR, mas é possível que a Razer tenha escolhido um brilho muito menor. Dito isto, a taxa de atualização de 120 Hz não parece resultar em nenhum problema de fantasma perceptível.
Cintilação da tela / PWM (modulação por largura de pulso)
| Tela tremeluzindo/PWM detectado | 2420 Hz | ≤ 100 % configuração de brilho | 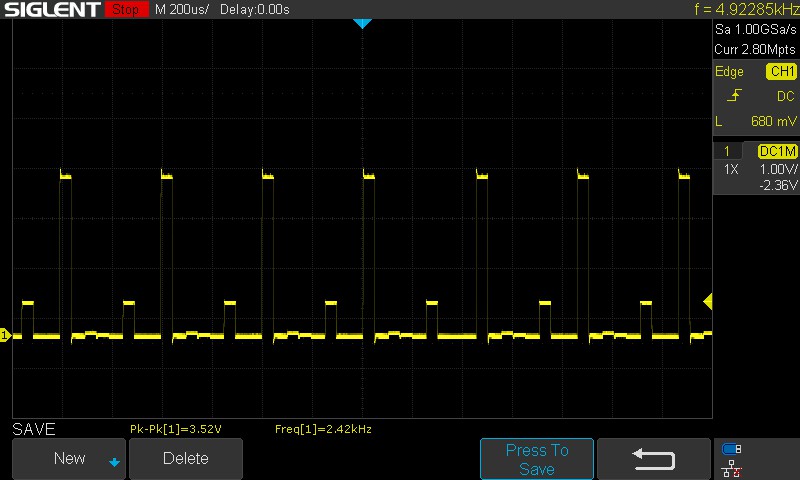 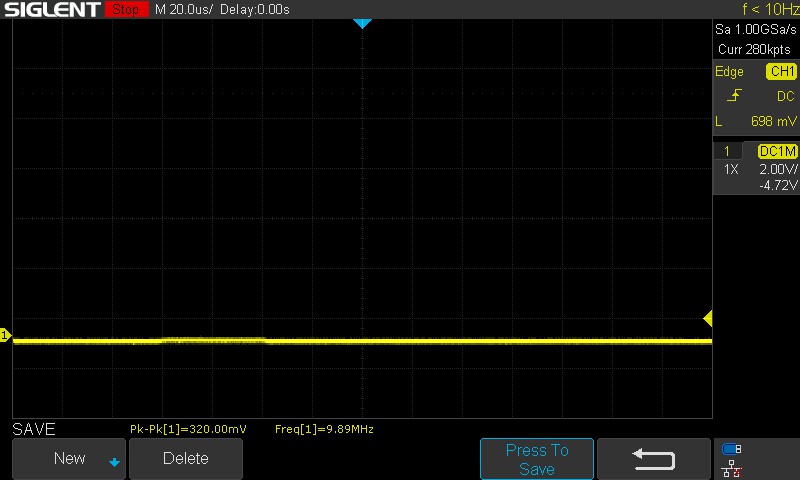 |
A luz de fundo da tela pisca em 2420 Hz (pior caso, por exemplo, utilizando PWM) Cintilação detectada em uma configuração de brilho de 100 % e abaixo. Não deve haver cintilação ou PWM acima desta configuração de brilho. A frequência de 2420 Hz é bastante alta, então a maioria dos usuários sensíveis ao PWM não deve notar nenhuma oscilação. [pwm_comparison] Em comparação: 52 % de todos os dispositivos testados não usam PWM para escurecer a tela. Se PWM foi detectado, uma média de 7757 (mínimo: 5 - máximo: 343500) Hz foi medida. | |||
Observamos um PWM de 2.420 Hz em todos os níveis de brilho testados, que é suficientemente alto. O PWM aumenta para 9,89 MHz a 0% de brilho, o que é tão bom quanto não ter cintilação.
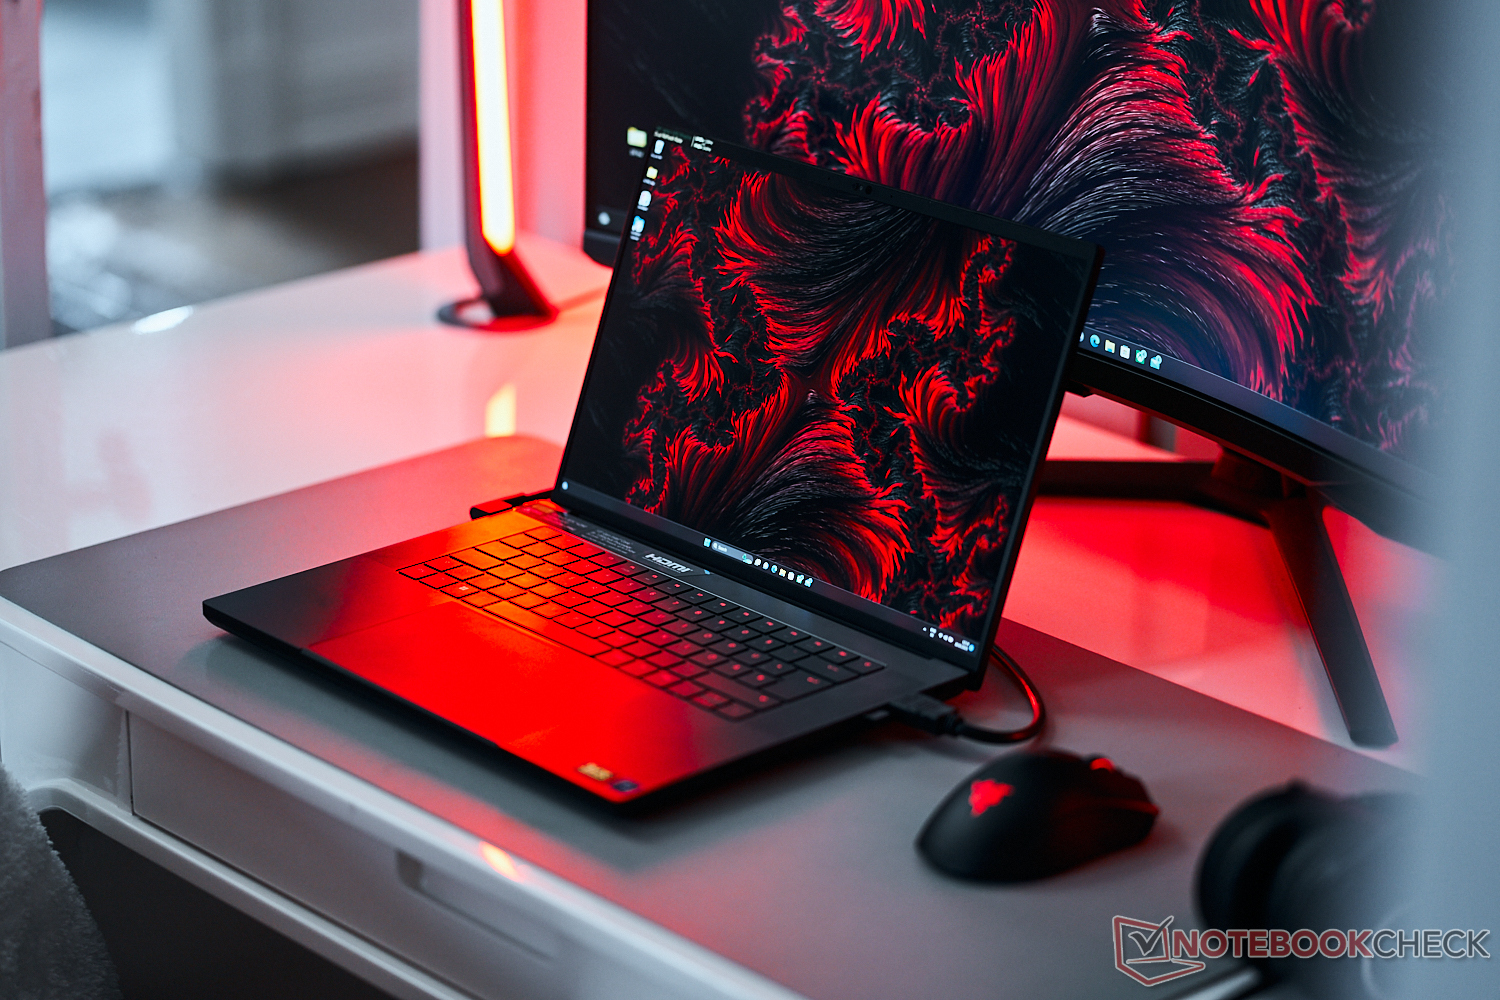
Os altos níveis de brilho emprestam uma boa experiência visual ao ar livre, mesmo sob a luz direta do sol. Os ângulos de visão são muito estáveis com apenas uma mínima perda de brilho nos extremos.


Desempenho: Pistas combinadas i9-13950HX e RTX 4090 por trás da concorrência
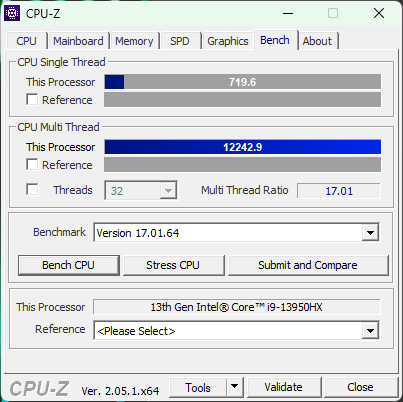
Nossa unidade Razer Blade 16 Early 2023 é alimentada pela Intel Core i9-13950HX e o Nvidia GeForce RTX 4090 GPU para notebook. Os compradores também têm a opção de escolher entre várias outras configurações da Lâmina 16, conforme indicado na introdução.
Observe que os displays de modo dual mini-LED só estão disponíveis em configurações com a GPU para laptop RTX 4070 e a GPU para laptop RTX 4090.
Condições de teste
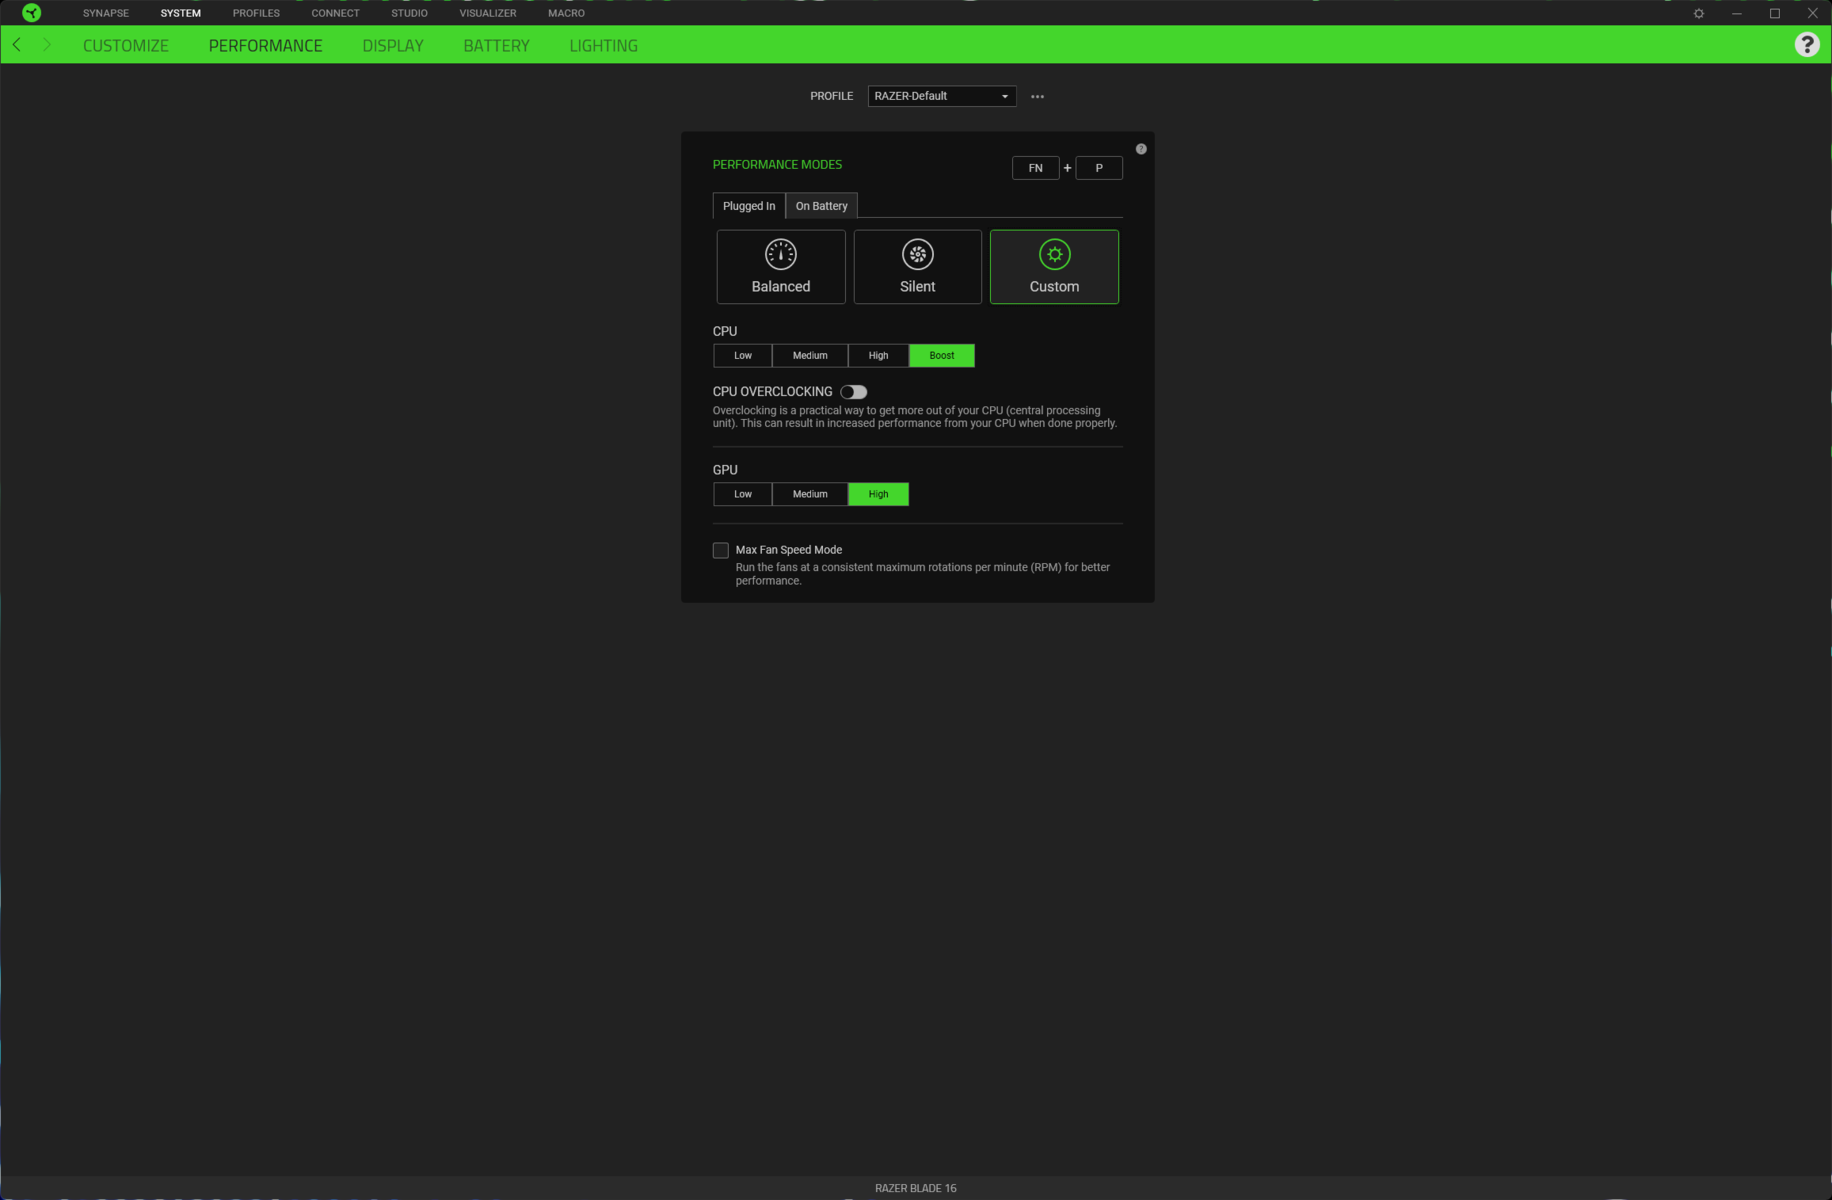
A Razer Synapse permite mudar vários modos de desempenho, dependendo da necessidade. Para permitir que o Core i9-13950HX e o RTX 4090 flexibilizem totalmente seus músculos, usamos o modo Personalizado com CPU Boost e GPU High opções. Isto resulta em um PL1 sustentado de 110 W e um pequeno impulso de ruptura de 130 W.
Usamos o modo dGPU para a execução de testes gráficos. O laptop suporta Advanced Optimus, para que você possa facilmente alternar entre MSHybrid e dGPU diretamente do Painel de Controle Nvidia sem ter que reiniciar. O G-Sync foi desativado durante os testes.
A escolha dos modos de desempenho pode ter um impacto sobre as emissões térmicas e de ruído. A tabela abaixo ilustra como PL1 e PL2 variam com cada configuração de desempenho.
Somente o perfil Balanceado é oferecido com a energia da bateria. Usamos este modo para nossos testes de bateria e ativamos a opção de mudar automaticamente para uma taxa de atualização de 60 Hz.
| Performance Mode | PL1 (PBP) / Tau | PL2 (MTP) / Tau |
|---|---|---|
| Silencioso | 32,5 W / 56 s | 37 W / 2,44 ms |
| Equilibrado | 54 W / 56 s | 55 W / 2,44 ms |
| Personalizado (Aumento da CPU / GPU Alta) | 110 W / 56 s | 130 W / 2,44 ms |
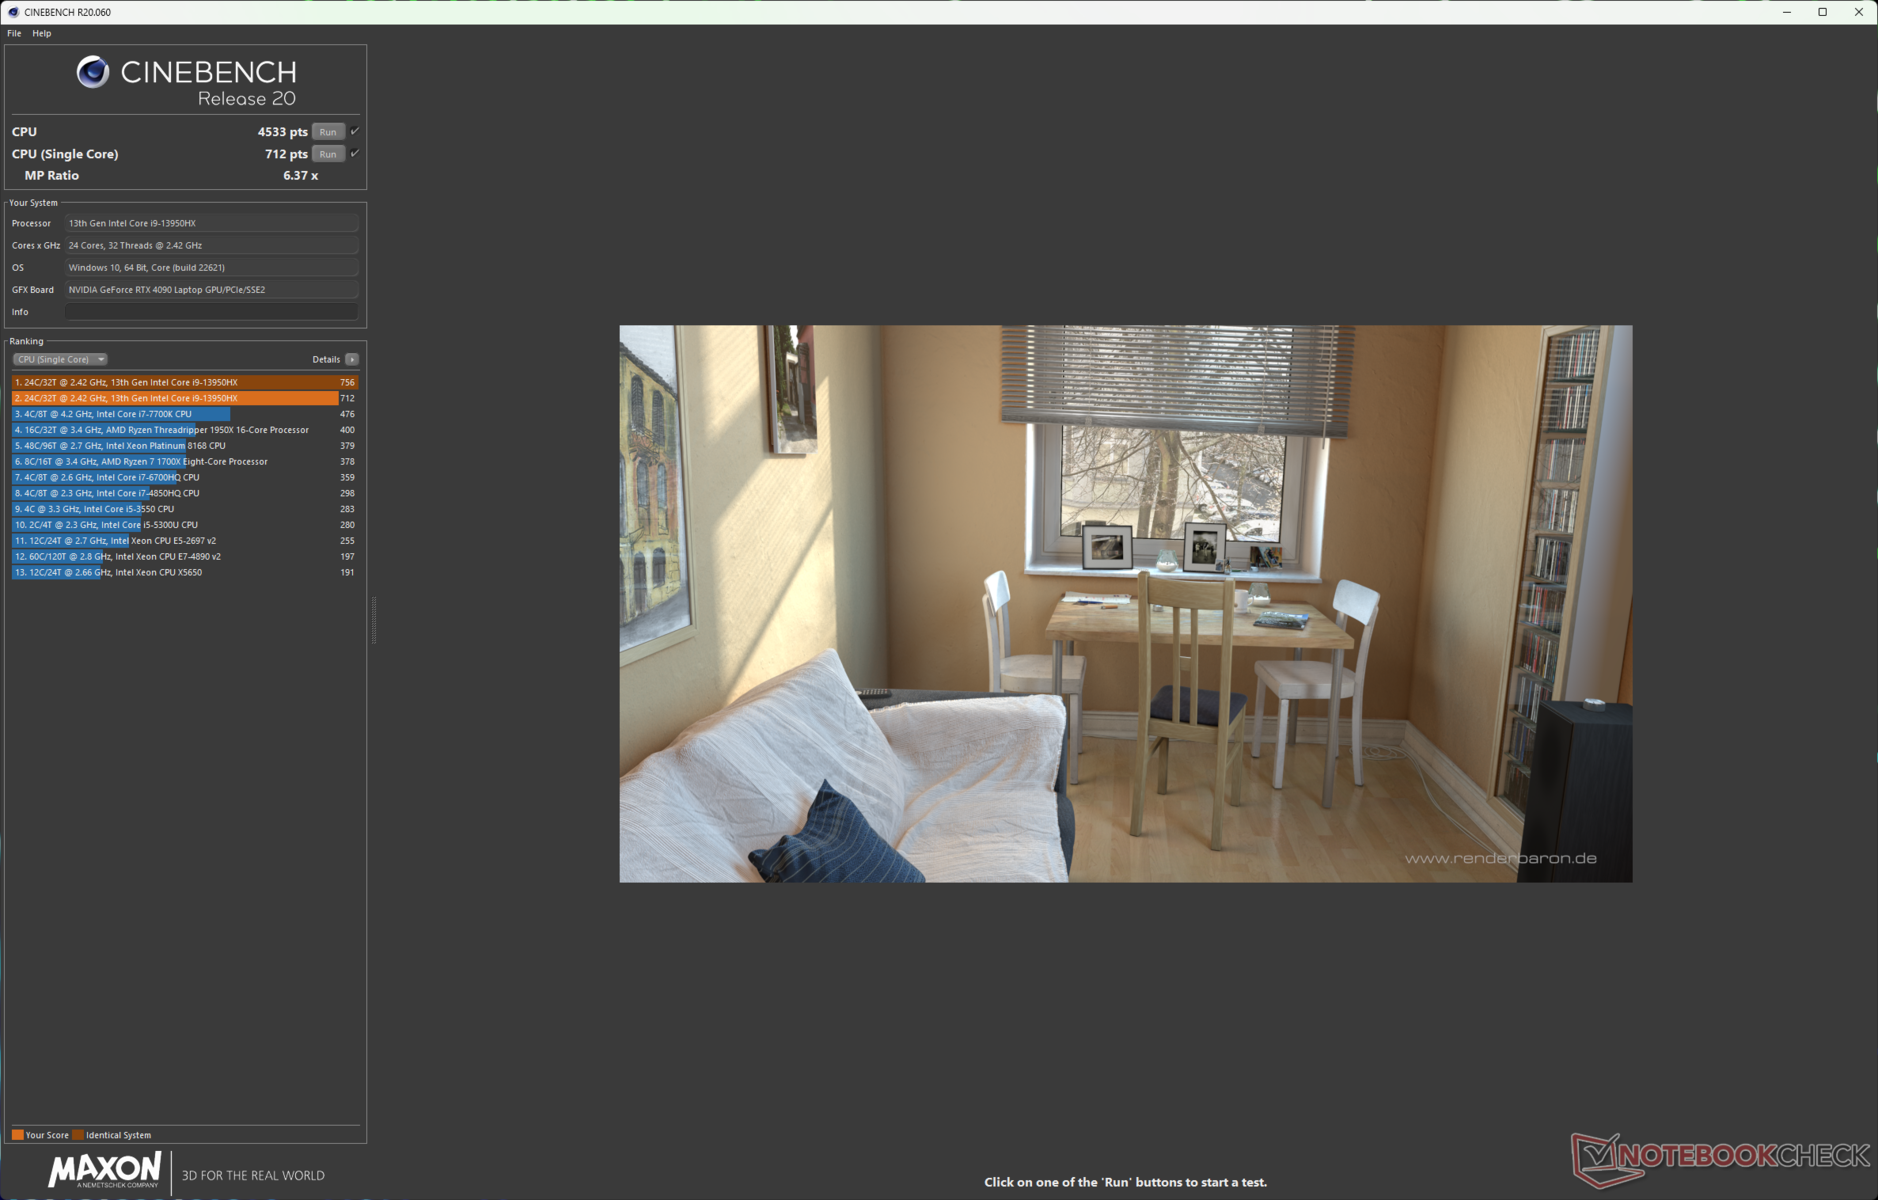
Processador
O Intel Core i9-13950HX é uma peça Raptor Lake-HX com 24 núcleos e 32 roscas que pode alcançar um impulso de 5,5 GHz com um só núcleo.
Quando revisamos o Razer Blade 16 com o RTX 4080, a concorrência consistia principalmente de dispositivos alimentados por chips Intel Alder Lake e AMD Ryzen série 6000.
No último mês, mais ou menos, houve um fluxo constante de notebooks do 13º gênero Intel e da série AMD Ryzen 7000. Isto nos permite fazer uma comparação mais contemporânea, e infelizmente ambos os Blade 16s 2023 lutam contra a mais recente competição.
Apesar de ostentar um resfriador de câmara de vapor capaz, a Lâmina 16 com o RTX 4090 não se sustenta bem no teste de loop multi-core Cinebench R15. Vemos uma queda de até 29% em direção à 19ª corrida antes de subir na velocidade do 21º loop. Isto é diferente do RTX 4080-powered Blade 16, que mostra um desempenho bem sustentado.
Cinebench R15 Multi Loop
O desempenho acumulado é um aumento decente de 17% sobre uma média Núcleo i9-12950HX. O Núcleo i9-13900HXna Lenovo Legion Pro 7 supera facilmente o Core i9-13950HX da Blade 16 devido a seus altos valores de 130 W/185 W PL1/PL2.
Da mesma forma, o MSI Titan GT77 HX 13VI com a mesma CPU que a da Lâmina 16 é capaz de pontuar mais alto cumulativamente nos benchmarks de CPU graças a seus 150 W PL1 e 220 W PL2.
O AMD Ryzen 9 7945HX no Asus ROG Zephyrus Duo 16 é colocado a um confortável 12% de chumbo geral do que o Core i9-13950HX no Blade 16.
Cinebench R23: Multi Core | Single Core
Cinebench R20: CPU (Multi Core) | CPU (Single Core)
Cinebench R15: CPU Multi 64Bit | CPU Single 64Bit
Blender: v2.79 BMW27 CPU
7-Zip 18.03: 7z b 4 | 7z b 4 -mmt1
Geekbench 5.5: Multi-Core | Single-Core
HWBOT x265 Benchmark v2.2: 4k Preset
LibreOffice : 20 Documents To PDF
R Benchmark 2.5: Overall mean
| CPU Performance rating | |
| Média Intel Core i9-13900K | |
| Eluktronics Mech-17 GP2 | |
| Asus ROG Strix Scar 18 2023 G834JY-N6005W | |
| Asus Zephyrus Duo 16 GX650PY-NM006W | |
| MSI Titan GT77 HX 13VI | |
| Lenovo Legion Pro 7 16IRX8H | |
| Asus ROG Strix G16 G614JZ | |
| Razer Blade 18 RTX 4070 | |
| Razer Blade 16 Early 2023 RTX 4090 | |
| Razer Blade 16 Early 2023 | |
| Média da turma Gaming | |
| Asus ROG Zephyrus M16 GU604VY-NM042X | |
| Média Intel Core i9-12950HX | |
| Cinebench R23 / Multi Core | |
| Média Intel Core i9-13900K (32592 - 40103, n=4) | |
| Asus Zephyrus Duo 16 GX650PY-NM006W | |
| MSI Titan GT77 HX 13VI | |
| Eluktronics Mech-17 GP2 | |
| Asus ROG Strix Scar 18 2023 G834JY-N6005W | |
| Lenovo Legion Pro 7 16IRX8H | |
| Asus ROG Strix G16 G614JZ | |
| Razer Blade 18 RTX 4070 | |
| Razer Blade 16 Early 2023 RTX 4090 | |
| Razer Blade 16 Early 2023 | |
| Média da turma Gaming (10488 - 42661, n=107, últimos 2 anos) | |
| Média Intel Core i9-12950HX (16277 - 23113, n=7) | |
| Asus ROG Zephyrus M16 GU604VY-NM042X | |
| Cinebench R23 / Single Core | |
| Média Intel Core i9-13900K (2203 - 2272, n=4) | |
| Asus ROG Strix Scar 18 2023 G834JY-N6005W | |
| Asus ROG Strix G16 G614JZ | |
| MSI Titan GT77 HX 13VI | |
| Eluktronics Mech-17 GP2 | |
| Razer Blade 18 RTX 4070 | |
| Lenovo Legion Pro 7 16IRX8H | |
| Razer Blade 16 Early 2023 | |
| Média da turma Gaming (1166 - 2415, n=107, últimos 2 anos) | |
| Asus ROG Zephyrus M16 GU604VY-NM042X | |
| Razer Blade 16 Early 2023 RTX 4090 | |
| Asus Zephyrus Duo 16 GX650PY-NM006W | |
| Média Intel Core i9-12950HX (1465 - 1922, n=7) | |
| Cinebench R20 / CPU (Multi Core) | |
| Média Intel Core i9-13900K (13415 - 15181, n=4) | |
| Asus Zephyrus Duo 16 GX650PY-NM006W | |
| MSI Titan GT77 HX 13VI | |
| Eluktronics Mech-17 GP2 | |
| Asus ROG Strix Scar 18 2023 G834JY-N6005W | |
| Asus ROG Strix G16 G614JZ | |
| Lenovo Legion Pro 7 16IRX8H | |
| Razer Blade 18 RTX 4070 | |
| Razer Blade 16 Early 2023 RTX 4090 | |
| Média da turma Gaming (4029 - 16433, n=106, últimos 2 anos) | |
| Razer Blade 16 Early 2023 | |
| Média Intel Core i9-12950HX (6625 - 8777, n=7) | |
| Asus ROG Zephyrus M16 GU604VY-NM042X | |
| Cinebench R20 / CPU (Single Core) | |
| Média Intel Core i9-13900K (828 - 870, n=4) | |
| Asus ROG Strix Scar 18 2023 G834JY-N6005W | |
| Asus ROG Strix G16 G614JZ | |
| MSI Titan GT77 HX 13VI | |
| Eluktronics Mech-17 GP2 | |
| Razer Blade 18 RTX 4070 | |
| Lenovo Legion Pro 7 16IRX8H | |
| Média da turma Gaming (442 - 913, n=106, últimos 2 anos) | |
| Asus Zephyrus Duo 16 GX650PY-NM006W | |
| Razer Blade 16 Early 2023 RTX 4090 | |
| Asus ROG Zephyrus M16 GU604VY-NM042X | |
| Razer Blade 16 Early 2023 | |
| Média Intel Core i9-12950HX (703 - 741, n=7) | |
| Cinebench R15 / CPU Multi 64Bit | |
| Média Intel Core i9-13900K (5321 - 6191, n=8) | |
| Asus Zephyrus Duo 16 GX650PY-NM006W | |
| MSI Titan GT77 HX 13VI | |
| Eluktronics Mech-17 GP2 | |
| Lenovo Legion Pro 7 16IRX8H | |
| Asus ROG Strix Scar 18 2023 G834JY-N6005W | |
| Asus ROG Strix G16 G614JZ | |
| Asus ROG Strix G16 G614JZ | |
| Razer Blade 16 Early 2023 | |
| Razer Blade 18 RTX 4070 | |
| Razer Blade 16 Early 2023 RTX 4090 | |
| Média da turma Gaming (1578 - 6330, n=105, últimos 2 anos) | |
| Média Intel Core i9-12950HX (2464 - 3530, n=7) | |
| Asus ROG Zephyrus M16 GU604VY-NM042X | |
| Cinebench R15 / CPU Single 64Bit | |
| Média Intel Core i9-13900K (299 - 328, n=8) | |
| Asus ROG Strix Scar 18 2023 G834JY-N6005W | |
| Asus Zephyrus Duo 16 GX650PY-NM006W | |
| Asus ROG Strix G16 G614JZ | |
| Asus ROG Strix G16 G614JZ | |
| Lenovo Legion Pro 7 16IRX8H | |
| MSI Titan GT77 HX 13VI | |
| Eluktronics Mech-17 GP2 | |
| Razer Blade 18 RTX 4070 | |
| Média da turma Gaming (188.8 - 350, n=106, últimos 2 anos) | |
| Asus ROG Zephyrus M16 GU604VY-NM042X | |
| Razer Blade 16 Early 2023 RTX 4090 | |
| Razer Blade 16 Early 2023 | |
| Média Intel Core i9-12950HX (167 - 276, n=7) | |
| Blender / v2.79 BMW27 CPU | |
| Média Intel Core i9-12950HX (138 - 193, n=7) | |
| Asus ROG Zephyrus M16 GU604VY-NM042X | |
| Média da turma Gaming (79 - 330, n=104, últimos 2 anos) | |
| Razer Blade 16 Early 2023 RTX 4090 | |
| Razer Blade 16 Early 2023 | |
| Razer Blade 18 RTX 4070 | |
| Asus ROG Strix G16 G614JZ | |
| Lenovo Legion Pro 7 16IRX8H | |
| Asus ROG Strix Scar 18 2023 G834JY-N6005W | |
| Eluktronics Mech-17 GP2 | |
| MSI Titan GT77 HX 13VI | |
| Asus Zephyrus Duo 16 GX650PY-NM006W | |
| Média Intel Core i9-13900K (80 - 101, n=7) | |
| 7-Zip 18.03 / 7z b 4 | |
| Média Intel Core i9-13900K (127201 - 148053, n=5) | |
| Asus Zephyrus Duo 16 GX650PY-NM006W | |
| MSI Titan GT77 HX 13VI | |
| Eluktronics Mech-17 GP2 | |
| Asus ROG Strix Scar 18 2023 G834JY-N6005W | |
| Lenovo Legion Pro 7 16IRX8H | |
| Razer Blade 18 RTX 4070 | |
| Asus ROG Strix G16 G614JZ | |
| Razer Blade 16 Early 2023 | |
| Razer Blade 16 Early 2023 RTX 4090 | |
| Média da turma Gaming (33491 - 148086, n=105, últimos 2 anos) | |
| Asus ROG Zephyrus M16 GU604VY-NM042X | |
| Média Intel Core i9-12950HX (65637 - 85019, n=7) | |
| 7-Zip 18.03 / 7z b 4 -mmt1 | |
| Média Intel Core i9-13900K (7176 - 7539, n=5) | |
| Asus Zephyrus Duo 16 GX650PY-NM006W | |
| Asus ROG Strix Scar 18 2023 G834JY-N6005W | |
| Lenovo Legion Pro 7 16IRX8H | |
| Eluktronics Mech-17 GP2 | |
| Asus ROG Strix G16 G614JZ | |
| MSI Titan GT77 HX 13VI | |
| Razer Blade 18 RTX 4070 | |
| Razer Blade 16 Early 2023 RTX 4090 | |
| Razer Blade 16 Early 2023 | |
| Média da turma Gaming (4199 - 7436, n=105, últimos 2 anos) | |
| Asus ROG Zephyrus M16 GU604VY-NM042X | |
| Média Intel Core i9-12950HX (6022 - 6318, n=7) | |
| Geekbench 5.5 / Multi-Core | |
| Média Intel Core i9-13900K (22448 - 24157, n=5) | |
| Lenovo Legion Pro 7 16IRX8H | |
| Asus ROG Strix Scar 18 2023 G834JY-N6005W | |
| Eluktronics Mech-17 GP2 | |
| MSI Titan GT77 HX 13VI | |
| Razer Blade 18 RTX 4070 | |
| Asus Zephyrus Duo 16 GX650PY-NM006W | |
| Asus ROG Strix G16 G614JZ | |
| Razer Blade 16 Early 2023 | |
| Média da turma Gaming (6460 - 28263, n=105, últimos 2 anos) | |
| Razer Blade 16 Early 2023 RTX 4090 | |
| Asus ROG Zephyrus M16 GU604VY-NM042X | |
| Média Intel Core i9-12950HX (14028 - 16009, n=7) | |
| Geekbench 5.5 / Single-Core | |
| Média Intel Core i9-13900K (2106 - 2290, n=5) | |
| Asus Zephyrus Duo 16 GX650PY-NM006W | |
| Asus ROG Strix Scar 18 2023 G834JY-N6005W | |
| Eluktronics Mech-17 GP2 | |
| Média da turma Gaming (986 - 2474, n=105, últimos 2 anos) | |
| Asus ROG Strix G16 G614JZ | |
| MSI Titan GT77 HX 13VI | |
| Razer Blade 18 RTX 4070 | |
| Lenovo Legion Pro 7 16IRX8H | |
| Asus ROG Zephyrus M16 GU604VY-NM042X | |
| Razer Blade 16 Early 2023 RTX 4090 | |
| Média Intel Core i9-12950HX (1847 - 1945, n=7) | |
| Razer Blade 16 Early 2023 | |
| HWBOT x265 Benchmark v2.2 / 4k Preset | |
| Média Intel Core i9-13900K (34.5 - 42.6, n=5) | |
| Asus Zephyrus Duo 16 GX650PY-NM006W | |
| Eluktronics Mech-17 GP2 | |
| Asus ROG Strix Scar 18 2023 G834JY-N6005W | |
| MSI Titan GT77 HX 13VI | |
| Lenovo Legion Pro 7 16IRX8H | |
| Razer Blade 18 RTX 4070 | |
| Razer Blade 16 Early 2023 RTX 4090 | |
| Asus ROG Strix G16 G614JZ | |
| Média da turma Gaming (11.5 - 44.4, n=105, últimos 2 anos) | |
| Razer Blade 16 Early 2023 | |
| Média Intel Core i9-12950HX (18.6 - 26.5, n=7) | |
| Asus ROG Zephyrus M16 GU604VY-NM042X | |
| LibreOffice / 20 Documents To PDF | |
| Asus Zephyrus Duo 16 GX650PY-NM006W | |
| Razer Blade 16 Early 2023 RTX 4090 | |
| Asus ROG Zephyrus M16 GU604VY-NM042X | |
| Média da turma Gaming (33.2 - 88.8, n=105, últimos 2 anos) | |
| Asus ROG Strix G16 G614JZ | |
| Razer Blade 16 Early 2023 | |
| MSI Titan GT77 HX 13VI | |
| Lenovo Legion Pro 7 16IRX8H | |
| Razer Blade 18 RTX 4070 | |
| Média Intel Core i9-12950HX (34.7 - 45.4, n=7) | |
| Asus ROG Strix Scar 18 2023 G834JY-N6005W | |
| Média Intel Core i9-13900K (30.3 - 41.6, n=5) | |
| Eluktronics Mech-17 GP2 | |
| R Benchmark 2.5 / Overall mean | |
| Média Intel Core i9-12950HX (0.4251 - 0.4515, n=7) | |
| Média da turma Gaming (0.3439 - 0.759, n=106, últimos 2 anos) | |
| Razer Blade 16 Early 2023 | |
| Asus ROG Zephyrus M16 GU604VY-NM042X | |
| MSI Titan GT77 HX 13VI | |
| Asus Zephyrus Duo 16 GX650PY-NM006W | |
| Lenovo Legion Pro 7 16IRX8H | |
| Razer Blade 16 Early 2023 RTX 4090 | |
| Razer Blade 18 RTX 4070 | |
| Asus ROG Strix G16 G614JZ | |
| Eluktronics Mech-17 GP2 | |
| Asus ROG Strix Scar 18 2023 G834JY-N6005W | |
| Média Intel Core i9-13900K (0.3468 - 0.3911, n=5) | |
* ... menor é melhor
O gráfico incomum visto acima no loop Cinebench R15 também é refletido enquanto se avalia vários parâmetros de CPU nos modos de desempenho disponíveis. Tal padrão não é visto ao executar o teste do loop em perfis Balanceado e Silencioso.
Na configuração personalizada, vemos a potência do pacote atingir um máximo de 137,6 W, resultando em um impulso máximo de 4,4 GHz e temperatura central de até 90 °C. É possível que a Razer tenha implementado uma tolerância dura à temperatura tão logo a temperatura central atinja a marca de 90 °C. Isto resulta em uma queda de potência da embalagem de até 74 W antes de se recuperar novamente para 130 W e o ciclo se repetir.
O modo balanceado parece ser um pouco perdoador neste caso. Vemos os relógios atingirem perto de 4,4 GHz a uma potência máxima de 59 W e uma temperatura máxima do núcleo de 79 °C. Este modo deve ser suficiente para a maioria dos casos de uso.
O modo silencioso é bastante impactante em termos de relógios, mas o pico da temperatura central é de 69 °C, enquanto consome um máximo de 39,7 W.
Em bateria, a lâmina 16 funciona no perfil Balanceado. Enquanto o desempenho de um núcleo leva apenas 5% de acerto, as pontuações de vários núcleos caem 57% no Cinebench R20. Dito isto, o desempenho reduzido ainda deve ser suficiente para se conseguir algum trabalho em movimento.
O Razer Blade 16 Early 2023 oferece um bom desempenho geral da CPU, mas os limites de potência relativamente mais baixos a colocam em desvantagem em relação à concorrência.
AIDA64: FP32 Ray-Trace | FPU Julia | CPU SHA3 | CPU Queen | FPU SinJulia | FPU Mandel | CPU AES | CPU ZLib | FP64 Ray-Trace | CPU PhotoWorxx
| Performance rating | |
| Eluktronics Mech-17 GP2 | |
| MSI Titan GT77 HX 13VI | |
| Asus ROG Strix Scar 18 2023 G834JY-N6005W | |
| Lenovo Legion Pro 7 16IRX8H | |
| Média da turma Gaming | |
| Asus ROG Strix G16 G614JZ | |
| Razer Blade 18 RTX 4070 | |
| Média Intel Core i9-13950HX | |
| Razer Blade 16 Early 2023 RTX 4090 | |
| Razer Blade 16 Early 2023 | |
| Asus ROG Zephyrus M16 GU604VY-NM042X | |
Confira nossos dedicados Intel Core i9-13950HX para mais informações e comparações de desempenho.
Desempenho do sistema
As pontuações totais do PCMark 10 vêem o Razer Blade 16 ficar atrás do Ryzen 9 7945HX, com o Zephyrus Duo 16 por 17%, mas estes dispositivos mostram desempenho mais ou menos idêntico nas pontuações totais do CrossMark.
Não encontramos nenhum problema com o desempenho e a capacidade de resposta do sistema no uso diário.
CrossMark: Overall | Productivity | Creativity | Responsiveness
| PCMark 10 / Score | |
| Asus Zephyrus Duo 16 GX650PY-NM006W | |
| Eluktronics Mech-17 GP2 | |
| MSI Titan GT77 HX 13VI | |
| Asus ROG Strix Scar 18 2023 G834JY-N6005W | |
| Média da turma Gaming (5828 - 12414, n=93, últimos 2 anos) | |
| Asus ROG Zephyrus M16 GU604VY-NM042X | |
| Média Intel Core i9-13950HX, NVIDIA GeForce RTX 4090 Laptop GPU (7597 - 8884, n=2) | |
| Razer Blade 16 Early 2023 | |
| Lenovo Legion Pro 7 16IRX8H | |
| Razer Blade 18 RTX 4070 | |
| Razer Blade 16 Early 2023 RTX 4090 | |
| Asus ROG Strix G16 G614JZ | |
| PCMark 10 / Essentials | |
| Asus Zephyrus Duo 16 GX650PY-NM006W | |
| Asus ROG Strix G16 G614JZ | |
| Eluktronics Mech-17 GP2 | |
| MSI Titan GT77 HX 13VI | |
| Lenovo Legion Pro 7 16IRX8H | |
| Razer Blade 18 RTX 4070 | |
| Asus ROG Zephyrus M16 GU604VY-NM042X | |
| Média Intel Core i9-13950HX, NVIDIA GeForce RTX 4090 Laptop GPU (10903 - 11761, n=2) | |
| Razer Blade 16 Early 2023 | |
| Razer Blade 16 Early 2023 RTX 4090 | |
| Média da turma Gaming (8810 - 11935, n=97, últimos 2 anos) | |
| PCMark 10 / Productivity | |
| Asus Zephyrus Duo 16 GX650PY-NM006W | |
| Média da turma Gaming (6845 - 25323, n=95, últimos 2 anos) | |
| Asus ROG Zephyrus M16 GU604VY-NM042X | |
| Lenovo Legion Pro 7 16IRX8H | |
| Eluktronics Mech-17 GP2 | |
| MSI Titan GT77 HX 13VI | |
| Razer Blade 18 RTX 4070 | |
| Média Intel Core i9-13950HX, NVIDIA GeForce RTX 4090 Laptop GPU (8330 - 9851, n=2) | |
| Razer Blade 16 Early 2023 RTX 4090 | |
| Razer Blade 16 Early 2023 | |
| Asus ROG Strix G16 G614JZ | |
| PCMark 10 / Digital Content Creation | |
| MSI Titan GT77 HX 13VI | |
| Eluktronics Mech-17 GP2 | |
| Média Intel Core i9-13950HX, NVIDIA GeForce RTX 4090 Laptop GPU (13099 - 16424, n=2) | |
| Razer Blade 16 Early 2023 | |
| Asus Zephyrus Duo 16 GX650PY-NM006W | |
| Média da turma Gaming (7602 - 19954, n=95, últimos 2 anos) | |
| Razer Blade 16 Early 2023 RTX 4090 | |
| Asus ROG Zephyrus M16 GU604VY-NM042X | |
| Asus ROG Strix G16 G614JZ | |
| Razer Blade 18 RTX 4070 | |
| Lenovo Legion Pro 7 16IRX8H | |
| CrossMark / Overall | |
| Eluktronics Mech-17 GP2 | |
| Asus ROG Strix G16 G614JZ | |
| MSI Titan GT77 HX 13VI | |
| Razer Blade 18 RTX 4070 | |
| Asus ROG Strix Scar 18 2023 G834JY-N6005W | |
| Média Intel Core i9-13950HX, NVIDIA GeForce RTX 4090 Laptop GPU (2019 - 2139, n=2) | |
| Asus Zephyrus Duo 16 GX650PY-NM006W | |
| Razer Blade 16 Early 2023 RTX 4090 | |
| Média da turma Gaming (1366 - 2409, n=94, últimos 2 anos) | |
| Asus ROG Zephyrus M16 GU604VY-NM042X | |
| Razer Blade 16 Early 2023 | |
| CrossMark / Productivity | |
| Asus ROG Strix G16 G614JZ | |
| Eluktronics Mech-17 GP2 | |
| MSI Titan GT77 HX 13VI | |
| Razer Blade 18 RTX 4070 | |
| Asus Zephyrus Duo 16 GX650PY-NM006W | |
| Média Intel Core i9-13950HX, NVIDIA GeForce RTX 4090 Laptop GPU (1909 - 1977, n=2) | |
| Asus ROG Strix Scar 18 2023 G834JY-N6005W | |
| Razer Blade 16 Early 2023 RTX 4090 | |
| Média da turma Gaming (1386 - 2254, n=94, últimos 2 anos) | |
| Asus ROG Zephyrus M16 GU604VY-NM042X | |
| Razer Blade 16 Early 2023 | |
| CrossMark / Creativity | |
| Eluktronics Mech-17 GP2 | |
| Asus ROG Strix Scar 18 2023 G834JY-N6005W | |
| MSI Titan GT77 HX 13VI | |
| Asus ROG Strix G16 G614JZ | |
| Razer Blade 18 RTX 4070 | |
| Asus Zephyrus Duo 16 GX650PY-NM006W | |
| Média Intel Core i9-13950HX, NVIDIA GeForce RTX 4090 Laptop GPU (2222 - 2423, n=2) | |
| Média da turma Gaming (1343 - 2786, n=94, últimos 2 anos) | |
| Asus ROG Zephyrus M16 GU604VY-NM042X | |
| Razer Blade 16 Early 2023 RTX 4090 | |
| Razer Blade 16 Early 2023 | |
| CrossMark / Responsiveness | |
| Asus ROG Strix G16 G614JZ | |
| Razer Blade 18 RTX 4070 | |
| MSI Titan GT77 HX 13VI | |
| Eluktronics Mech-17 GP2 | |
| Média Intel Core i9-13950HX, NVIDIA GeForce RTX 4090 Laptop GPU (1792 - 1861, n=2) | |
| Razer Blade 16 Early 2023 RTX 4090 | |
| Média da turma Gaming (1226 - 2334, n=94, últimos 2 anos) | |
| Asus Zephyrus Duo 16 GX650PY-NM006W | |
| Asus ROG Zephyrus M16 GU604VY-NM042X | |
| Asus ROG Strix Scar 18 2023 G834JY-N6005W | |
| Razer Blade 16 Early 2023 | |
| PCMark 8 Home Score Accelerated v2 | 4861 pontos | |
| PCMark 8 Creative Score Accelerated v2 | 5206 pontos | |
| PCMark 10 Score | 7597 pontos | |
Ajuda | ||
* ... menor é melhor
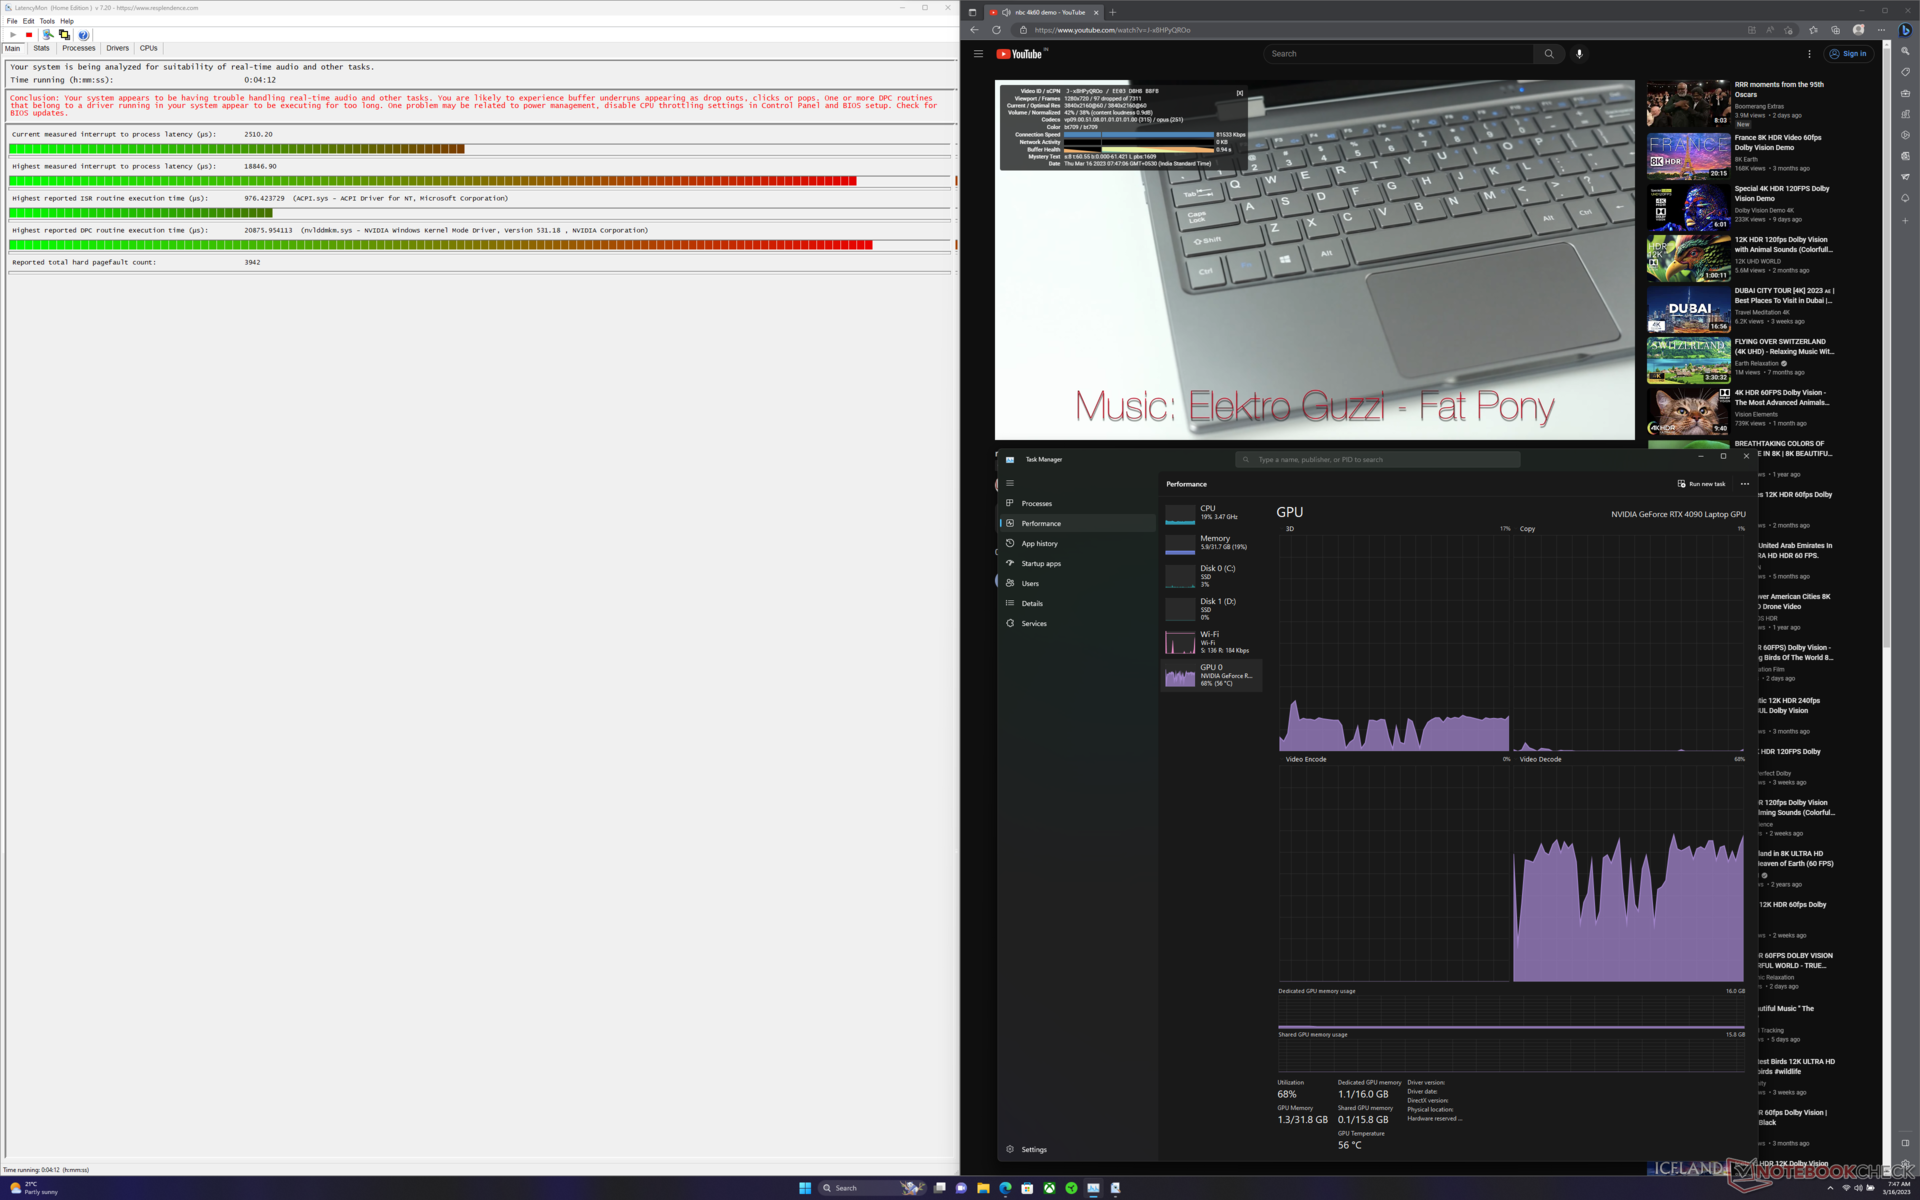
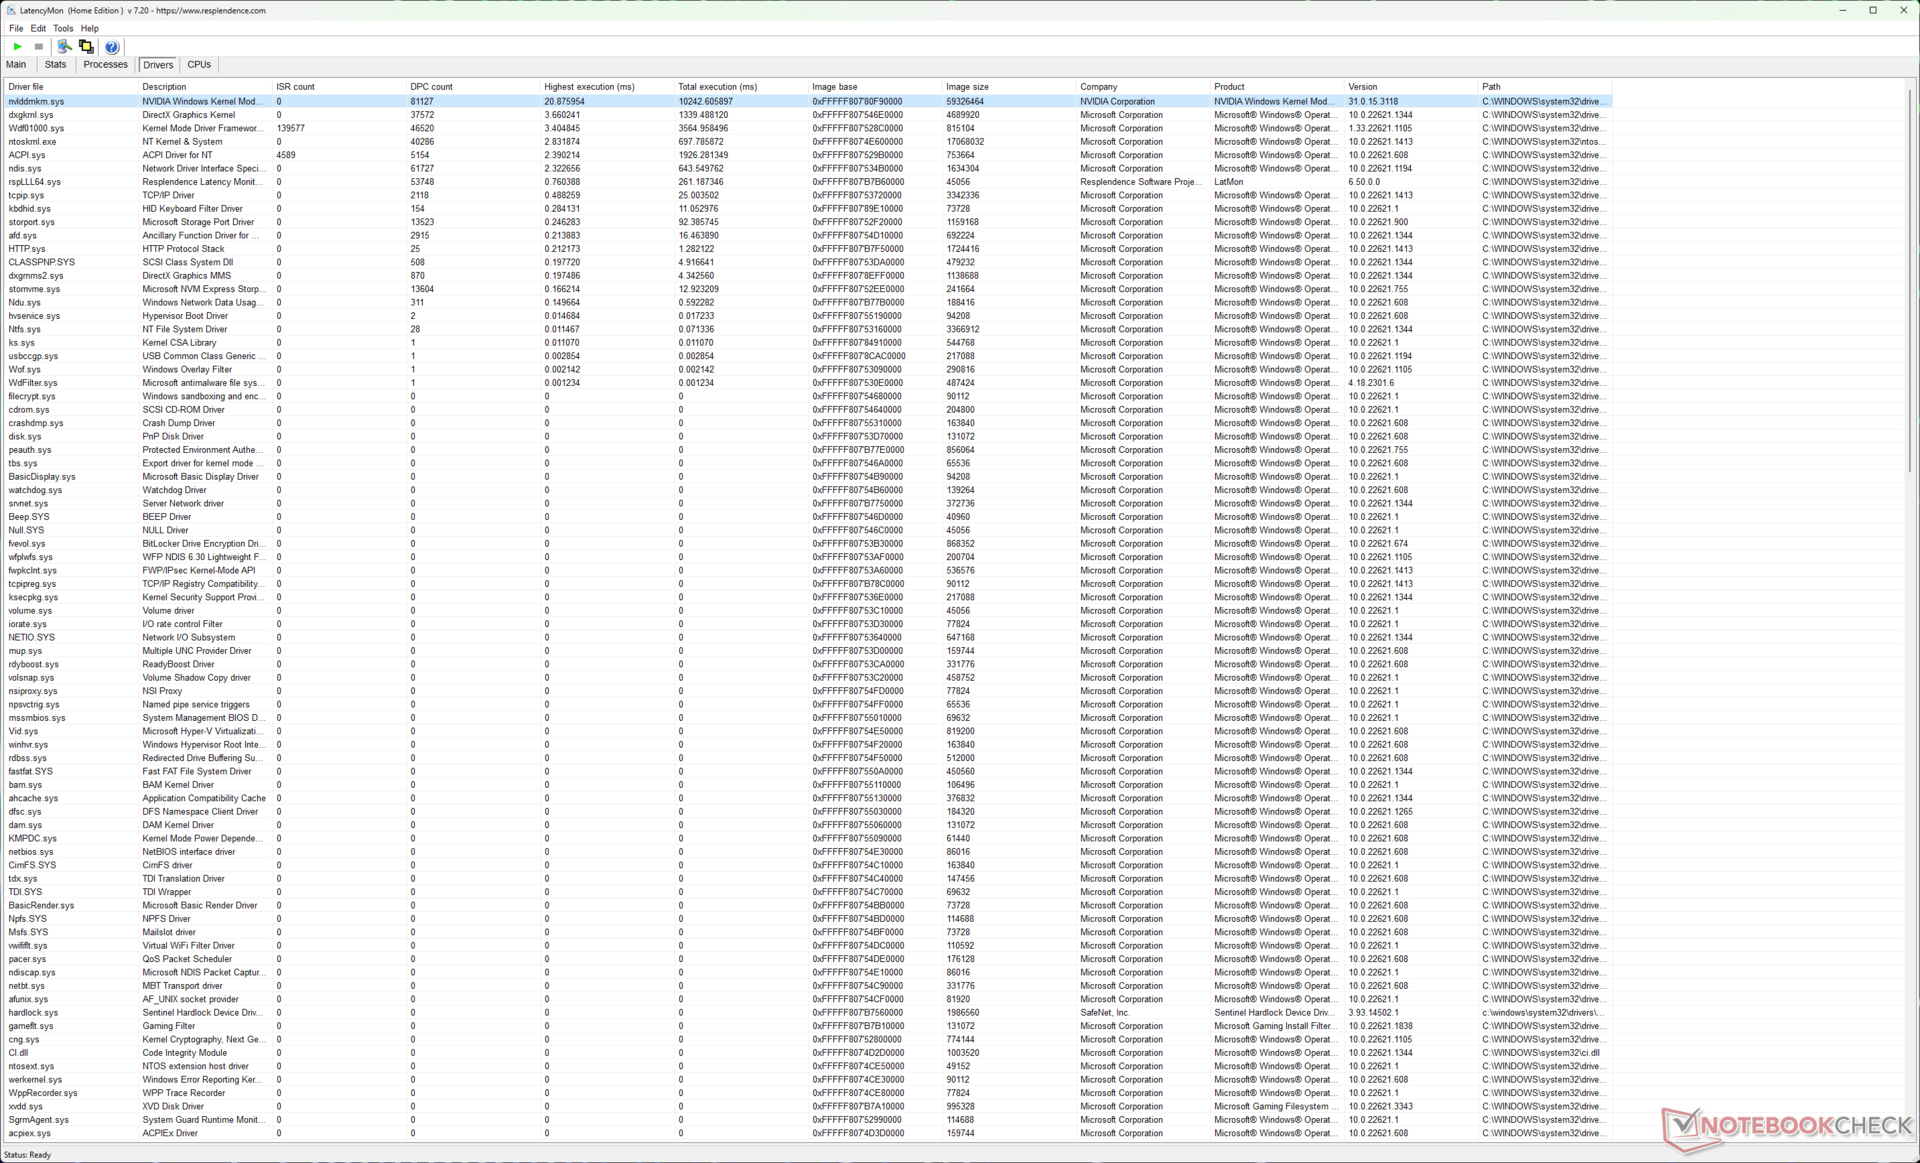
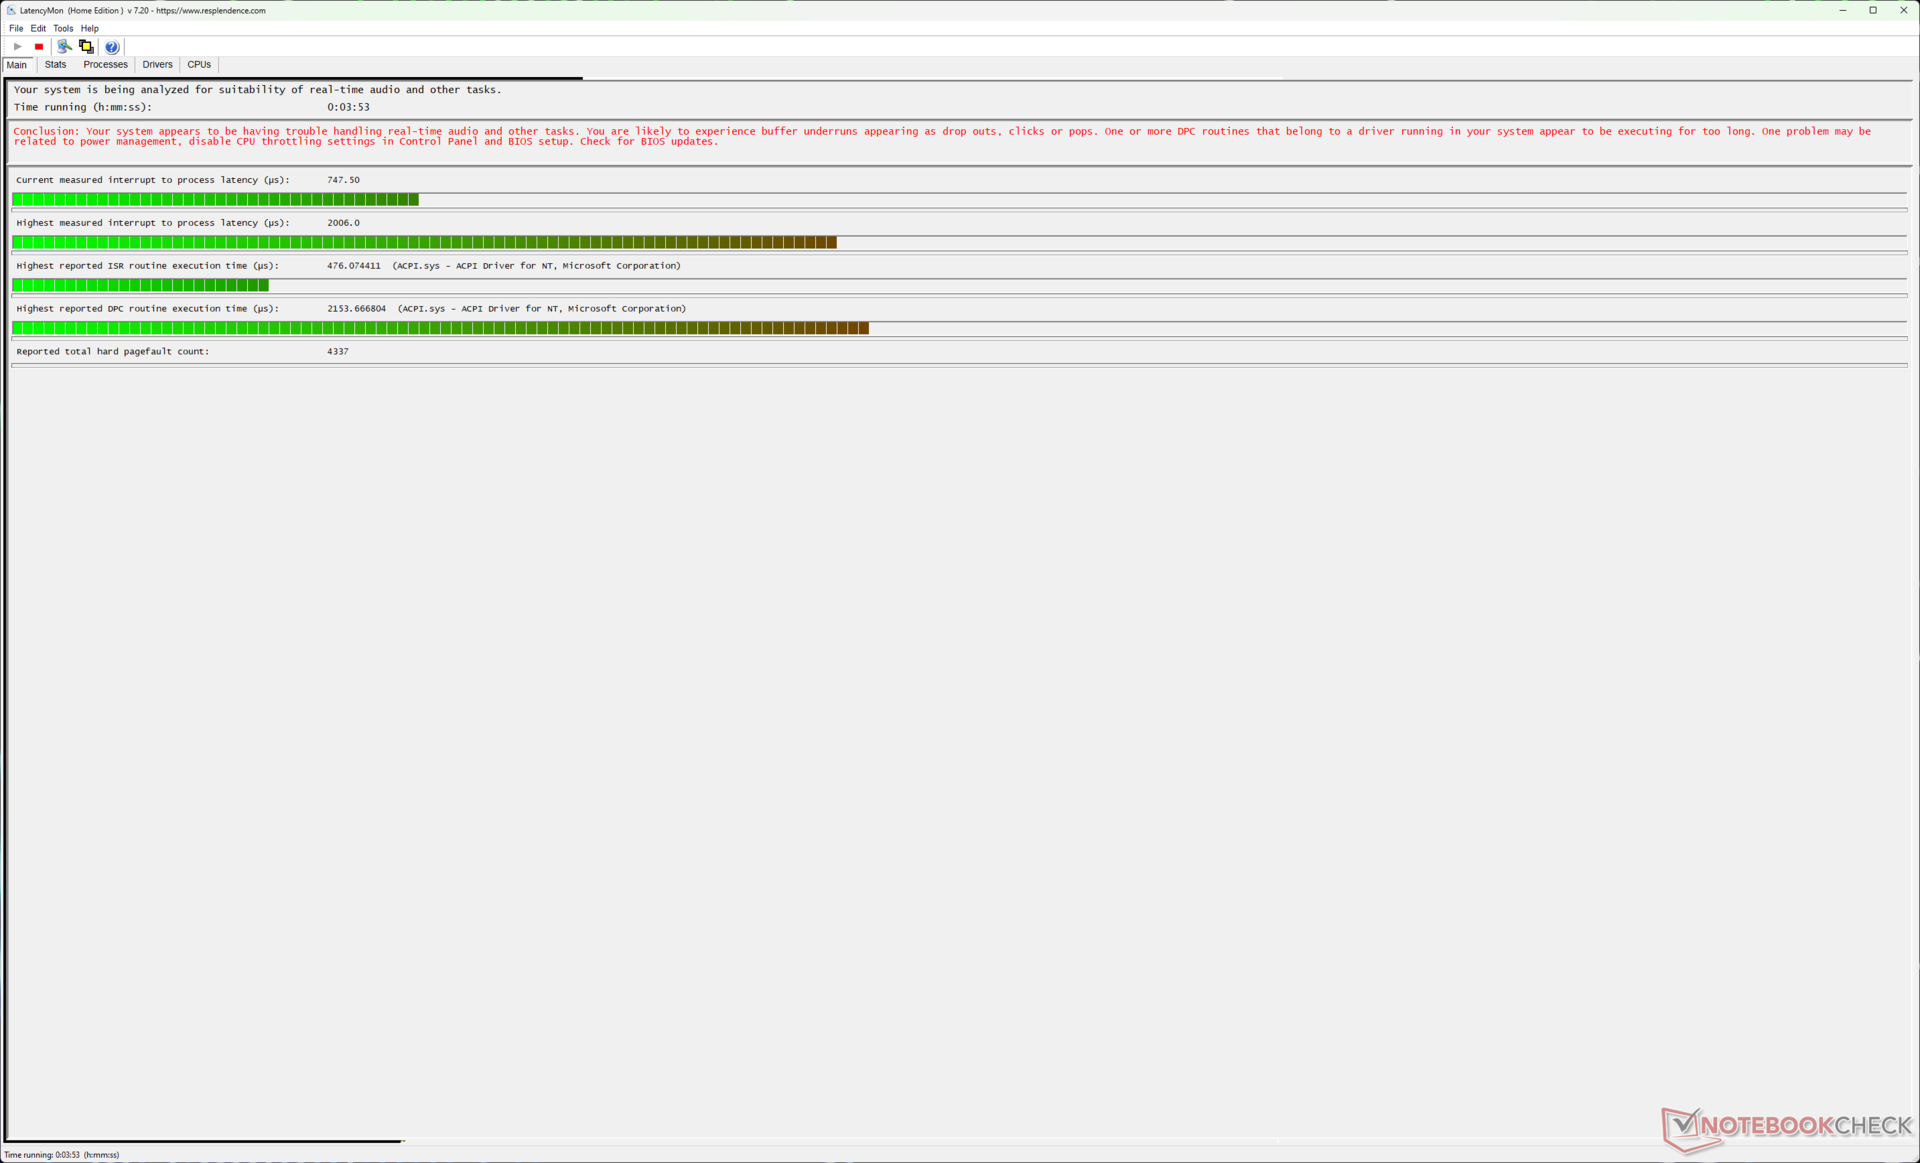
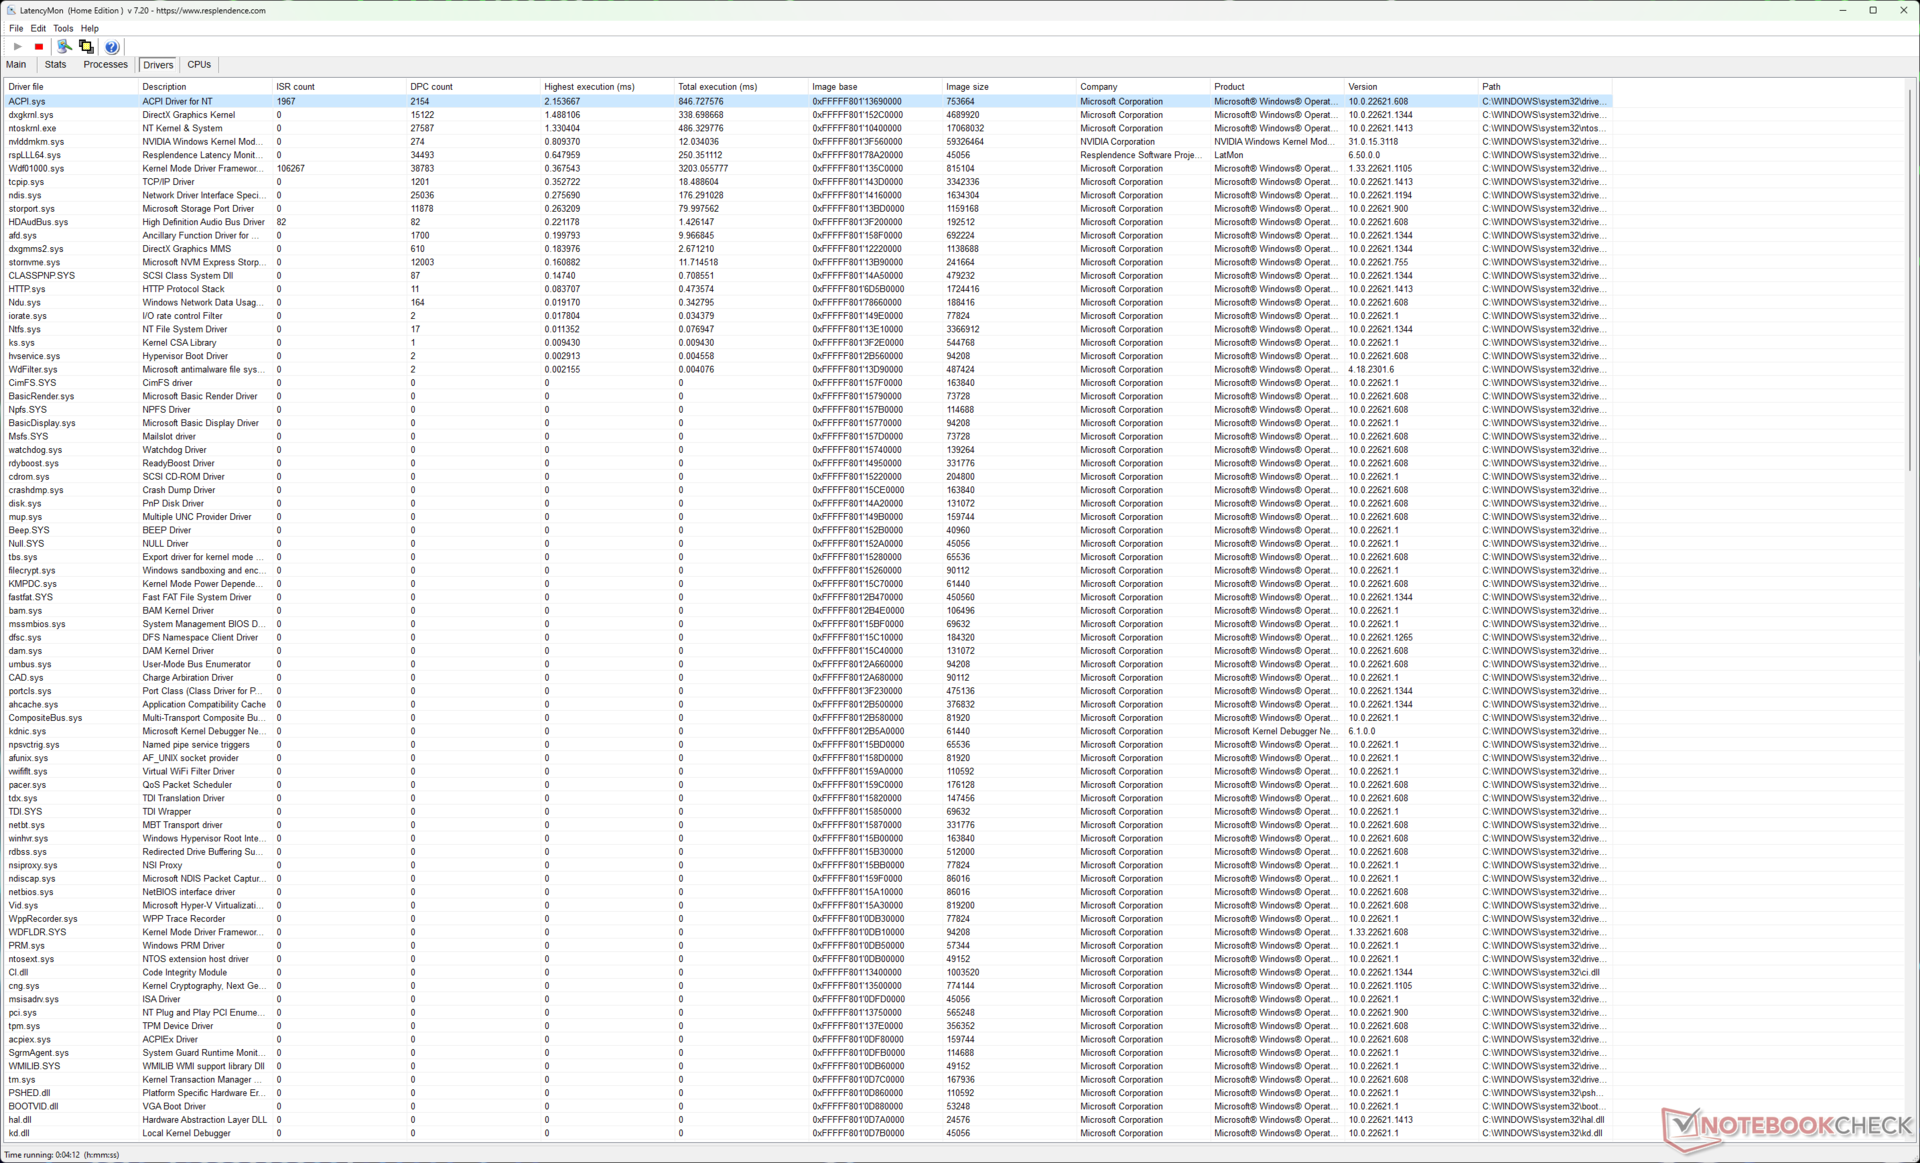
Latência do DPC
Há um bug conhecido em GeForce drivers que causa alta latência de DPC. Nvidia também reconheceu https://us.download.nvidia.com/Windows/531.29/531.29-win11-win10-release-notes.pdf que o Driver Release 530 para Windows resulta no aumento da latência do DPC quando medido com LatencyMon.
Assim, observamos uma interrupção muito alta para processar a latência de 18.846,9 µs no modo dGPU junto com o uso elevado de GPU. Isto pode ser atribuído ao alto tempo de execução de 20,87 ms para o driver em modo Nvidia Kernel Mode.
A maior interrupção para processar o valor de latência cai para um valor mais razoável, mas ainda alto 2.006 µs no modo MSHybrid.
Tal alta latência de DPC pode colocar problemas com fluxos de trabalho de edição de áudio e vídeo em tempo real, o que não é ideal para esta configuração e preço.
| DPC Latencies / LatencyMon - interrupt to process latency (max), Web, Youtube, Prime95 | |
| Razer Blade 16 Early 2023 RTX 4090 (dGPU) | |
| Razer Blade 16 Early 2023 RTX 4090 (MSHybrid) | |
| Asus Zephyrus Duo 16 GX650PY-NM006W | |
| MSI Titan GT77 HX 13VI | |
| Asus ROG Zephyrus M16 GU604VY-NM042X | |
| Asus ROG Strix G16 G614JZ | |
| Razer Blade 16 Early 2023 (Edge 109.0.1518.70) | |
| Razer Blade 18 RTX 4070 (Edge 110.0.1587.46) | |
| Asus ROG Strix Scar 18 2023 G834JY-N6005W | |
| Eluktronics Mech-17 GP2 (Edge 110.0.1587.57) | |
| Lenovo Legion Pro 7 16IRX8H | |
* ... menor é melhor
Mais comparações LatencyMon podem ser vistas em nosso Ranking de Latência DPC página.
Dispositivos de armazenamento
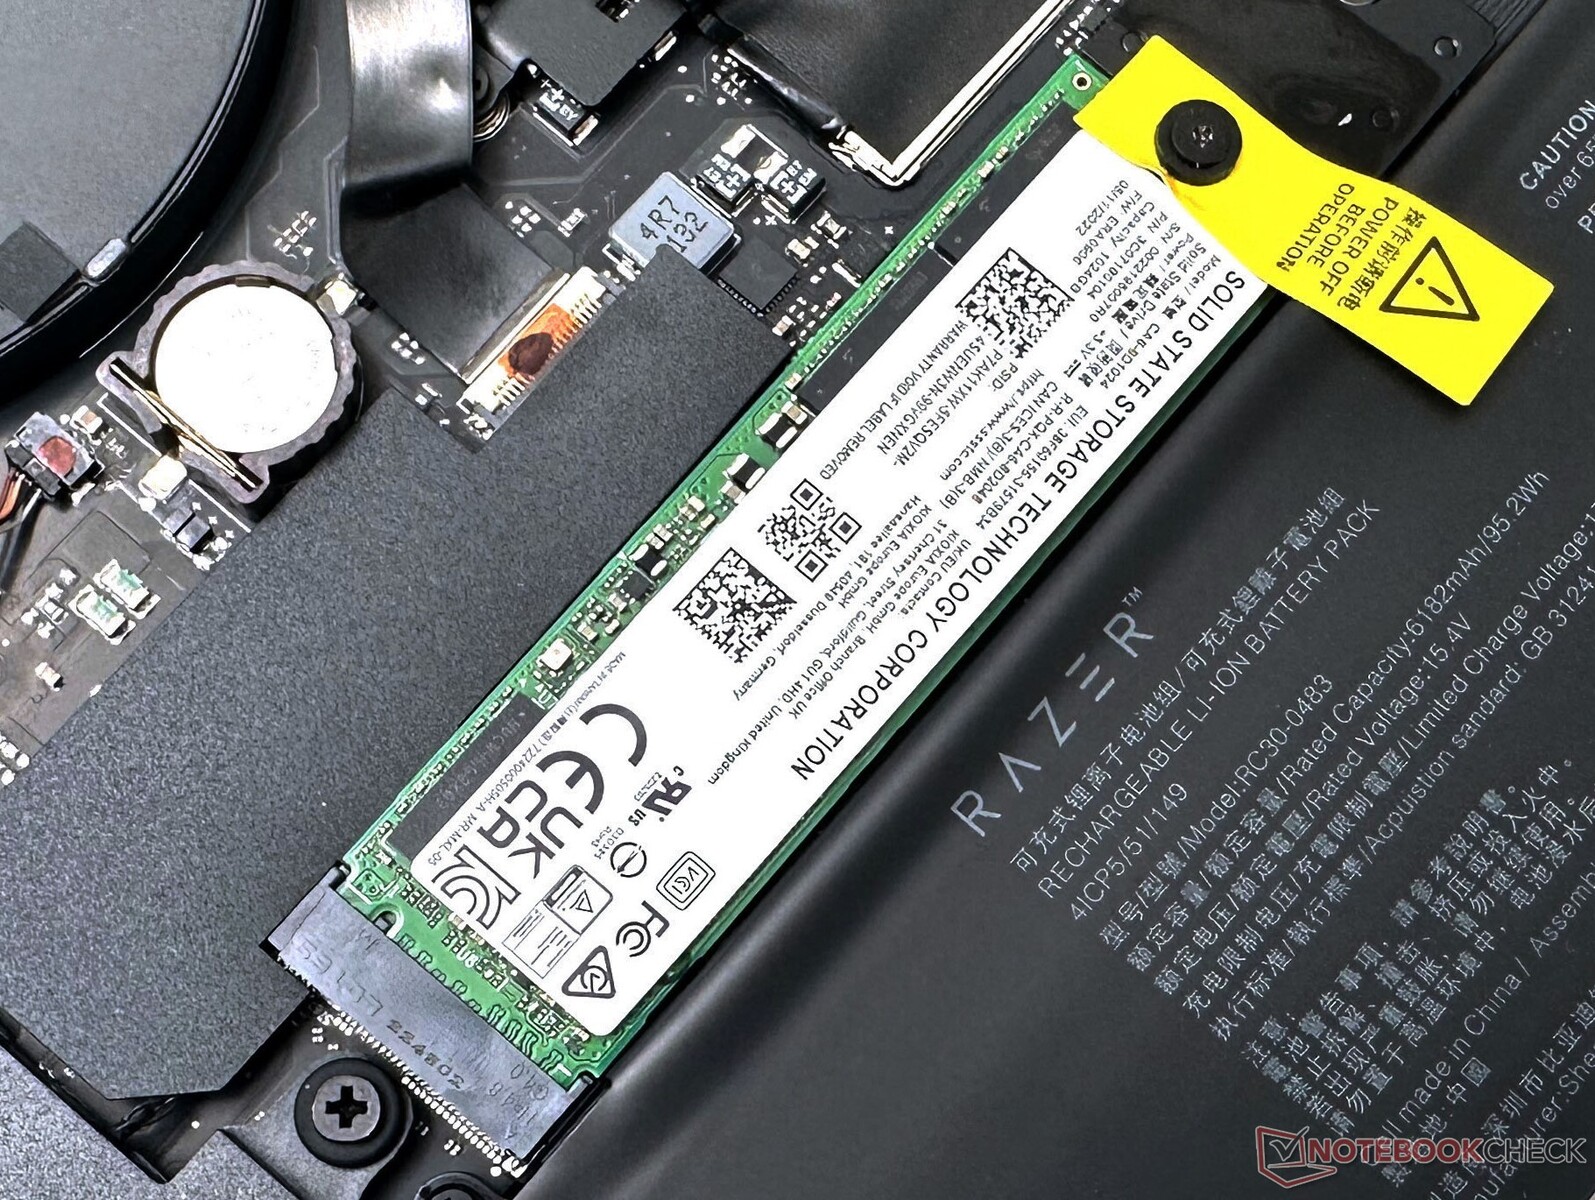
Nossa unidade Blade 16 Early 2023 veio equipada com duas SSDs NVMe de 1 TB da Solid State Storage Technology Corporation (SSSTC). As unidades NVMe são empilhadas umas sobre as outras, com o acionamento principal abaixo, para uma utilização eficaz do espaço da placa-mãe.
O desempenho geral do disco está nas linhas previstas, mas não pode corresponder às configurações baseadas no Samsung PM9A1. o desempenho de escrita 4K, no entanto, é melhor do que a maioria da concorrência.
O acionamento é capaz de se manter razoavelmente bem na parte inicial de nosso teste de loop de leitura DiskSpd a uma profundidade de 8 filas antes de começar a estrangular a partir do loop 31.
Não há espaço para adicionar um drive SATA de 2,5 polegadas.

* ... menor é melhor
Disk Throttling: DiskSpd Read Loop, Queue Depth 8
Consulte nosso SSD e HDD Benchmarks para mais comparações de dispositivos de armazenamento.
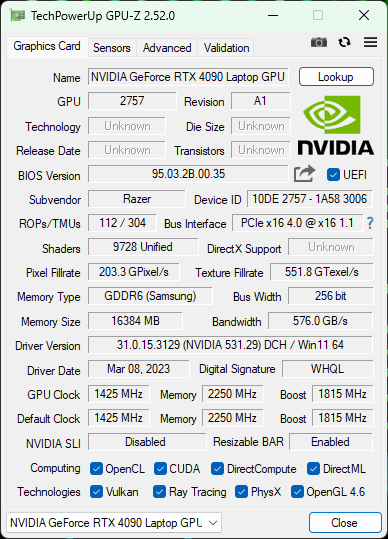
Desempenho da GPU
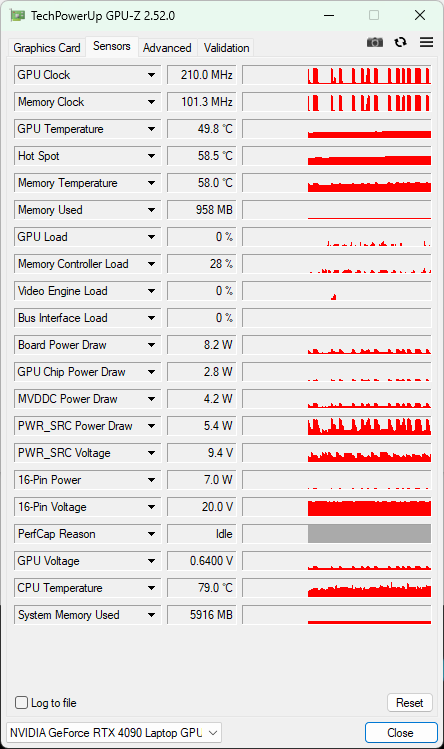
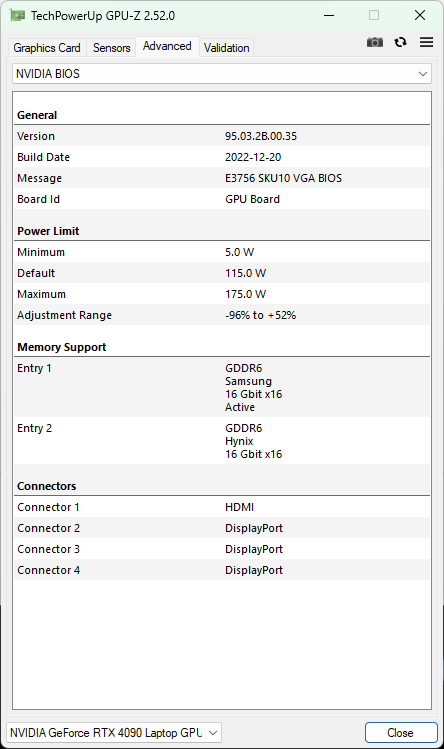
Nossa unidade Blade 16 veio equipada com um Nvidia GeForce RTX 4090 GPU para notebook que tem um TGP de 175 W. A Razer não especifica os valores do Dynamic Boost, mas assumimos que seja 25 W, dado que o GPU do laptop RTX 4090 na verdade não tem um TGP de 150 W.
O RTX 4090 na Lâmina 16 não está no topo dos gráficos no desempenho geral do 3DMark. O Blade 16 Early 2023 RTX 4090 lidera o RTX 4080 SKU em 8% em geral, mas segue atrás de outros pesos pesados RTX 4090 como o MSI Titan GT77 HX 13VI, Asus ROG Strix Scar 18, Eluktronics Mech-17 GP2e o Asus ROG Zephyrus Duo 16.
O Asus ROG Strix G16 com o RTX 4080 polegadas além da Lâmina 16 por um assobio.
| 3DMark 11 Performance | 41433 pontos | |
| 3DMark Ice Storm Standard Score | 244104 pontos | |
| 3DMark Cloud Gate Standard Score | 52227 pontos | |
| 3DMark Fire Strike Score | 31174 pontos | |
| 3DMark Fire Strike Extreme Score | 22713 pontos | |
| 3DMark Time Spy Score | 18599 pontos | |
Ajuda | ||
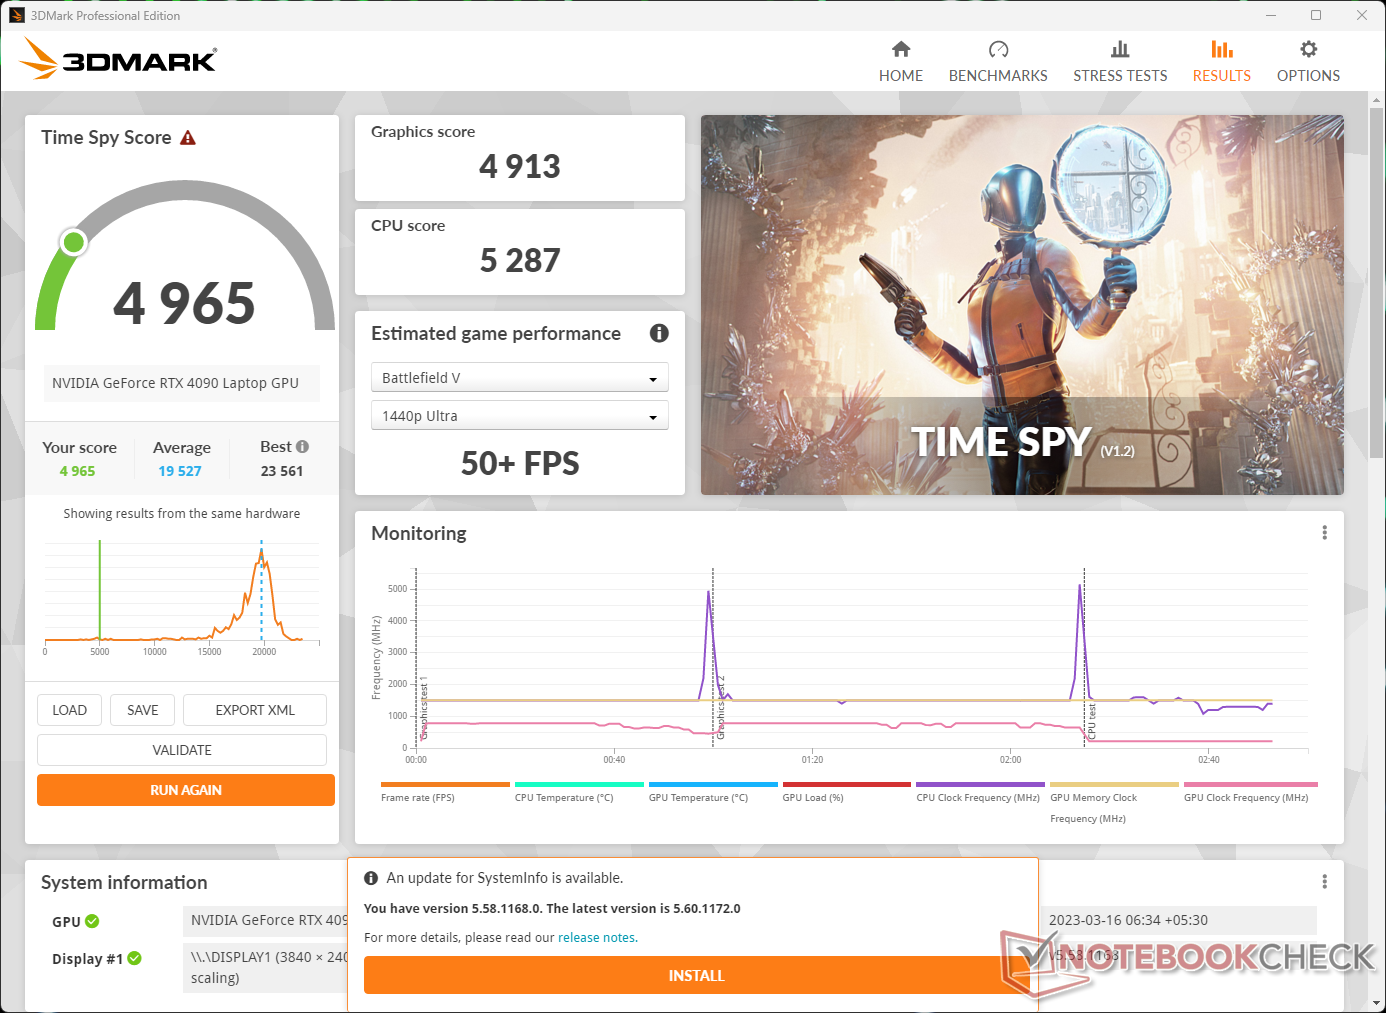
O desempenho da GPU em bateria pode levar uma batida e tanto. 3DMark Time Spy as pontuações gráficas caem massivamente 75% na energia da bateria. De acordo com o benchmark, isto ainda deve oferecer desempenho suficiente para jogar Battlefield V a 50 fps em 1440p Ultra.
O Blender 3.3 vê o RTX 4090 no Blade 16 ter o mesmo desempenho que outros laptops de configuração similar nos testes Optix e Classroom CUDA, mas o laptop é um bom 52% mais lento em comparação com o Zephyrus Duo 16 na CPU Classroom do Ryzen 9 7945HX.
| Blender / v3.3 Classroom OPTIX/RTX | |
| Razer Blade 18 RTX 4070 | |
| Média da turma Gaming (9 - 32, n=106, últimos 2 anos) | |
| Razer Blade 16 Early 2023 | |
| Asus ROG Zephyrus M16 GU604VY-NM042X | |
| Lenovo Legion Pro 7 16IRX8H | |
| Asus ROG Strix G16 G614JZ | |
| Asus Zephyrus Duo 16 GX650PY-NM006W | |
| Média NVIDIA GeForce RTX 4090 Laptop GPU (9 - 19, n=39) | |
| MSI Titan GT77 HX 13VI | |
| Razer Blade 16 Early 2023 RTX 4090 | |
| Asus ROG Strix Scar 18 2023 G834JY-N6005W | |
| Eluktronics Mech-17 GP2 | |
| Blender / v3.3 Classroom CUDA | |
| Razer Blade 18 RTX 4070 | |
| Média da turma Gaming (15 - 228, n=106, últimos 2 anos) | |
| Lenovo Legion Pro 7 16IRX8H | |
| Razer Blade 16 Early 2023 | |
| Asus ROG Strix G16 G614JZ | |
| Asus Zephyrus Duo 16 GX650PY-NM006W | |
| Média NVIDIA GeForce RTX 4090 Laptop GPU (16 - 24, n=39) | |
| Asus ROG Strix Scar 18 2023 G834JY-N6005W | |
| Asus ROG Strix Scar 18 2023 G834JY-N6005W | |
| Asus ROG Zephyrus M16 GU604VY-NM042X | |
| MSI Titan GT77 HX 13VI | |
| Razer Blade 16 Early 2023 RTX 4090 | |
| Eluktronics Mech-17 GP2 | |
| Blender / v3.3 Classroom CPU | |
| Asus ROG Zephyrus M16 GU604VY-NM042X | |
| Média da turma Gaming (122 - 565, n=102, últimos 2 anos) | |
| Razer Blade 16 Early 2023 RTX 4090 | |
| Razer Blade 16 Early 2023 | |
| Média NVIDIA GeForce RTX 4090 Laptop GPU (144 - 305, n=39) | |
| Razer Blade 18 RTX 4070 | |
| Lenovo Legion Pro 7 16IRX8H | |
| Asus ROG Strix G16 G614JZ | |
| Asus ROG Strix Scar 18 2023 G834JY-N6005W | |
| MSI Titan GT77 HX 13VI | |
| Eluktronics Mech-17 GP2 | |
| Asus Zephyrus Duo 16 GX650PY-NM006W | |
* ... menor é melhor
Desempenho nos jogos
O desempenho cumulativo do Blade 16 RTX 4090 a 1080p Ultra fica logo abaixo do do Zephyrus Duo 16, mas mostra um ganho decente de 15% sobre o Blade 18 com um GPU de laptop RTX 4070. Tanto o MSI Titan GT77 quanto o ROG Strix Scar 18 lideram nossa unidade de teste em 13% enquanto o Eluktronics Mech-17 GP2 lidera os gráficos.
Estes laptops têm um PL2 mais alto, que pode vir a ser útil em resoluções limitadas por CPU como 1080p.
Vemos uma tendência semelhante em resoluções mais altas também na maioria dos jogos. O rastreamento de raios a 4K Ultra nativo com taxas de quadros jogáveis não é uma experiência agradável. Entretanto, os jogadores podem fazer uso do DLSS 3 Frame Generation em títulos suportados para alcançar um impulso significativo de fps.
| F1 2021 | |
| 1920x1080 Ultra High Preset + Raytracing AA:T AF:16x | |
| MSI Titan GT77 HX 13VI | |
| Média NVIDIA GeForce RTX 4090 Laptop GPU (151.6 - 271, n=7) | |
| Asus Zephyrus Duo 16 GX650PY-NM006W | |
| Razer Blade 16 Early 2023 RTX 4090 | |
| 2560x1440 Ultra High Preset + Raytracing AA:T AF:16x | |
| MSI Titan GT77 HX 13VI | |
| Média NVIDIA GeForce RTX 4090 Laptop GPU (140 - 204, n=7) | |
| Asus Zephyrus Duo 16 GX650PY-NM006W | |
| Razer Blade 16 Early 2023 RTX 4090 | |
| 3840x2160 Ultra High Preset + Raytracing AA:T AF:16x | |
| MSI Titan GT77 HX 13VI | |
| Média NVIDIA GeForce RTX 4090 Laptop GPU (89.9 - 115.1, n=5) | |
| Razer Blade 16 Early 2023 RTX 4090 | |
A Carta de FPS Witcher 3
A Lâmina 16 permanece relativamente estável quando estressada com O Witcher 3 a 1080p Ultra, mas vemos ocasionais quedas de estrutura.
| baixo | média | alto | ultra | QHD | 4K DLSS | 4K | |
|---|---|---|---|---|---|---|---|
| GTA V (2015) | 186.6 | 187.3 | 181.6 | 128.7 | 120.5 | 153.5 | |
| The Witcher 3 (2015) | 452 | 408 | 322 | 174.8 | 130 | ||
| Dota 2 Reborn (2015) | 234.8 | 209.9 | 200.2 | 183.5 | 170.8 | ||
| Final Fantasy XV Benchmark (2018) | 194.5 | 155.9 | 122.2 | 115.7 | 83.9 | ||
| X-Plane 11.11 (2018) | 197.3 | 172.1 | 135.6 | 113.1 | |||
| Far Cry 5 (2018) | 162 | 167 | 144 | 146 | 100 | ||
| Strange Brigade (2018) | 432 | 380 | 350 | 328 | 256 | 129.5 | |
| F1 2021 (2021) | 433 | 341 | 299 | 151.6 | 151.5 | 103.6 | |
| Cyberpunk 2077 1.6 (2022) | 100.7 | 97.5 | 96.6 | 86.7 | 45.4 | ||
| F1 22 (2022) | 254 | 264 | 223 | 114.3 | 79.7 | 44 | |
| Call of Duty Modern Warfare 2 2022 (2022) | 177 | 169 | 160 | 154 | 122 | 112 | 75 |
| The Witcher 3 v4 (2023) | 220 | 154.1 | 137.5 | 120.4 | 83.3 | 41.6 |
Mais informações podem ser encontradas em nosso site dedicado Nvidia GeForce RTX 4090 GPU para notebook página. Além disso, não deixe de conferir nossa análise aprofundada da RTX 4080 e RTX 4090e o GPUs para notebooks RTX 4050, RTX 4060 e RTX 4070 para comparações detalhadas de desempenho.
Emissões: Alto nível de ruído e calor
Ruído do sistema
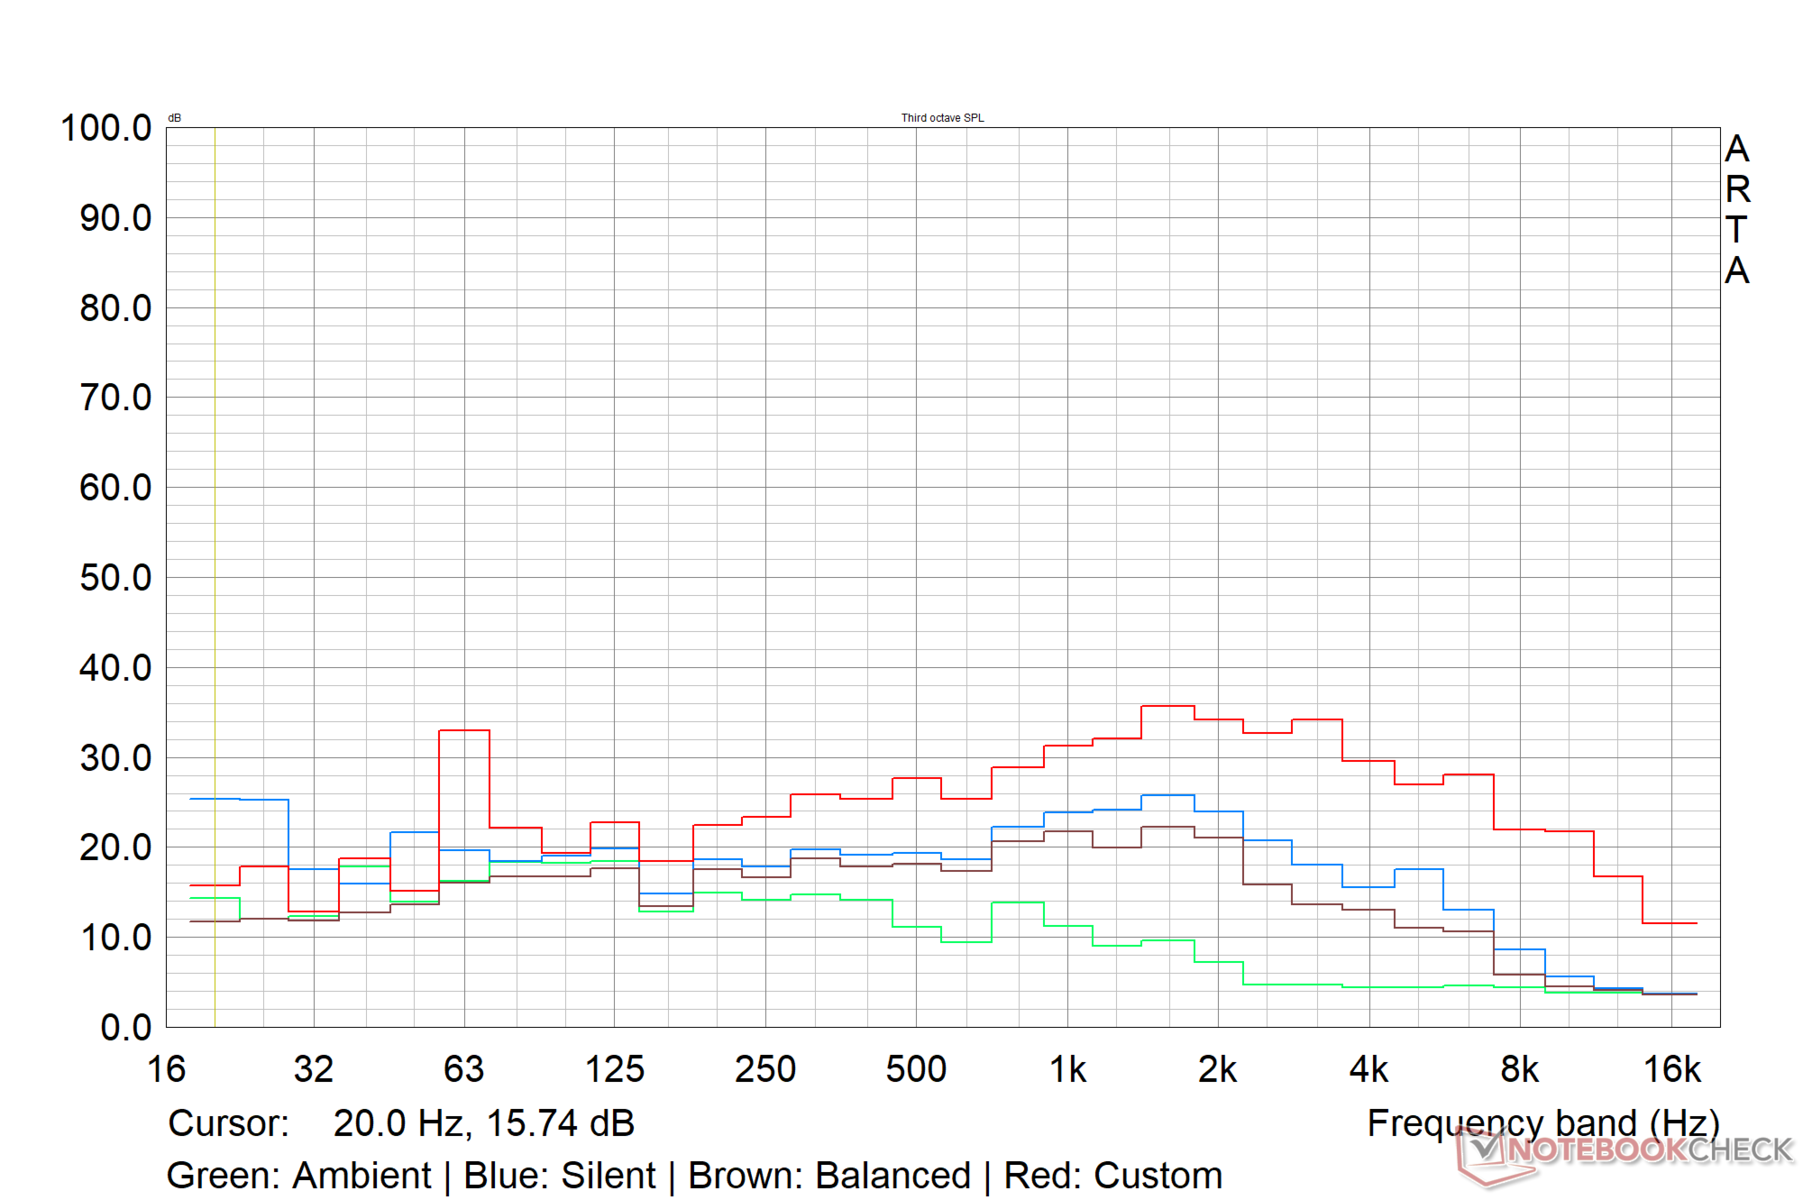
A Lâmina 16 pode fazer seus ventiladores vibrarem consideravelmente alto quando estressados. Gravamos um nível máximo de pressão sonora (SPL) de 46,7 db(A) sob uma carga combinada de Prime95 e FurMark e também no The Witcher 3 a 1080p Ultra no perfil personalizado testado.
O ruído do ventilador no perfil Equilibrado é muito mais tolerável com o máximo de emissões pairando apenas abaixo da marca de 41 dB(A). No modo silencioso, o ruído do ventilador permanece sempre abaixo de 35 db(A), não importando a carga.
| Ajuste de desempenho | dB(A) | Carga média dB(A) | Carga máxima dB(A) | A Witcher 3 dB(A) |
|---|---|---|---|---|
| Silencioso | 23,65 | 33,12 | 31,03 | 33,90 |
| Equilibrado | 23.65 | 30.03 | 38.20 | 40.69 |
| Personalizado (Aumento da CPU / GPU Alta) | 23.65 | 43.35 | 46.72 | 46.65 |
Barulho
| Ocioso |
| 23.65 / 23.65 / 23.65 dB |
| Carga |
| 43.35 / 46.72 dB |
 | ||
30 dB silencioso 40 dB(A) audível 50 dB(A) ruidosamente alto |
||
min: | ||
| Razer Blade 16 Early 2023 RTX 4090 i9-13950HX, GeForce RTX 4090 Laptop GPU | Eluktronics Mech-17 GP2 i9-13900HX, GeForce RTX 4090 Laptop GPU | Asus Zephyrus Duo 16 GX650PY-NM006W R9 7945HX, GeForce RTX 4090 Laptop GPU | MSI Titan GT77 HX 13VI i9-13950HX, GeForce RTX 4090 Laptop GPU | Razer Blade 16 Early 2023 i9-13950HX, GeForce RTX 4080 Laptop GPU | Lenovo Legion Pro 7 16IRX8H i9-13900HX, GeForce RTX 4080 Laptop GPU | Razer Blade 18 RTX 4070 i9-13950HX, GeForce RTX 4070 Laptop GPU | |
|---|---|---|---|---|---|---|---|
| Noise | -15% | -20% | -21% | -2% | -19% | -5% | |
| desligado / ambiente * (dB) | 20.84 | 25.2 -21% | 23.9 -15% | 24.6 -18% | 23 -10% | 24 -15% | 23.5 -13% |
| Idle Minimum * (dB) | 23.65 | 28 -18% | 23.9 -1% | 29.2 -23% | 23 3% | 26 -10% | 23.8 -1% |
| Idle Average * (dB) | 23.65 | 28 -18% | 32.9 -39% | 29.2 -23% | 23 3% | 28 -18% | 23.8 -1% |
| Idle Maximum * (dB) | 23.65 | 30.4 -29% | 36.5 -54% | 29.2 -23% | 23.6 -0% | 34 -44% | 26.8 -13% |
| Load Average * (dB) | 43.35 | 41 5% | 42.9 1% | 50.7 -17% | 39 10% | 47 -8% | 37.3 14% |
| Witcher 3 ultra * (dB) | 46.7 | 50.7 -9% | 51.2 -10% | 53.3 -14% | 51.6 -10% | 55 -18% | 48 -3% |
| Load Maximum * (dB) | 46.72 | 52.6 -13% | 56 -20% | 61 -31% | 51.3 -10% | 56 -20% | 53.5 -15% |
* ... menor é melhor
Temperatura
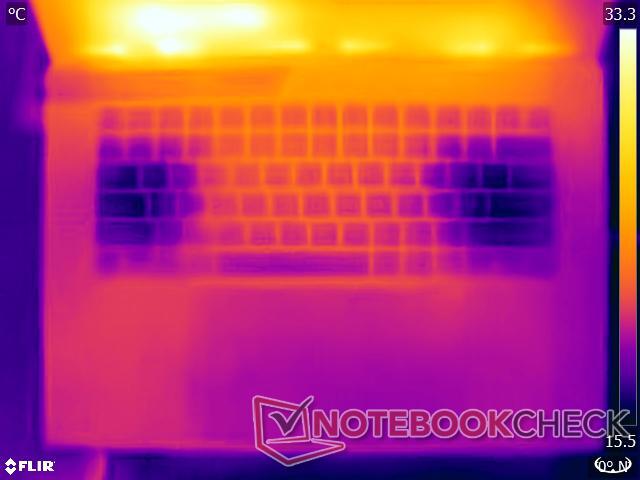
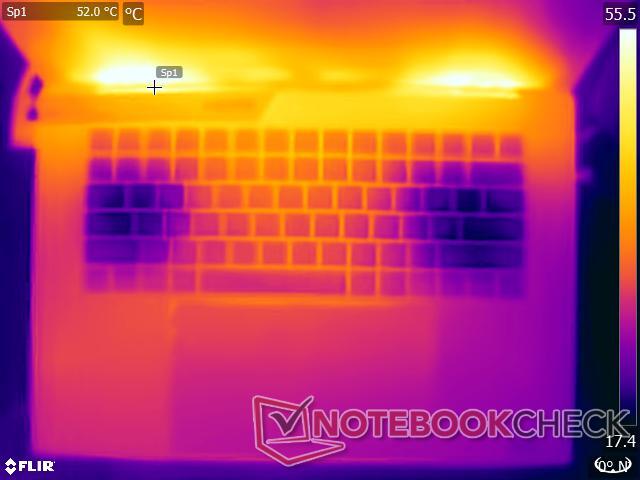
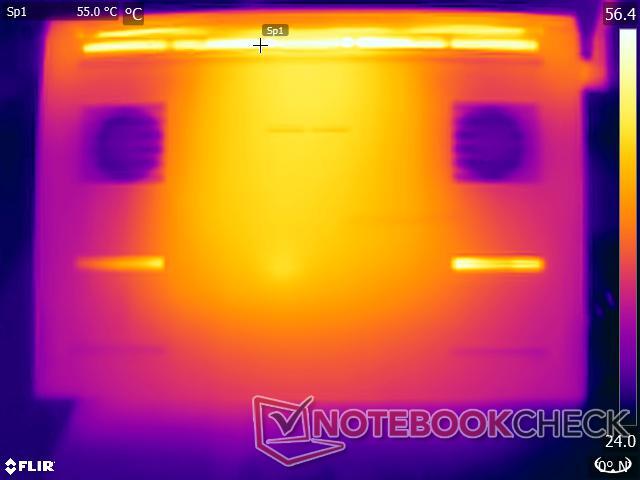
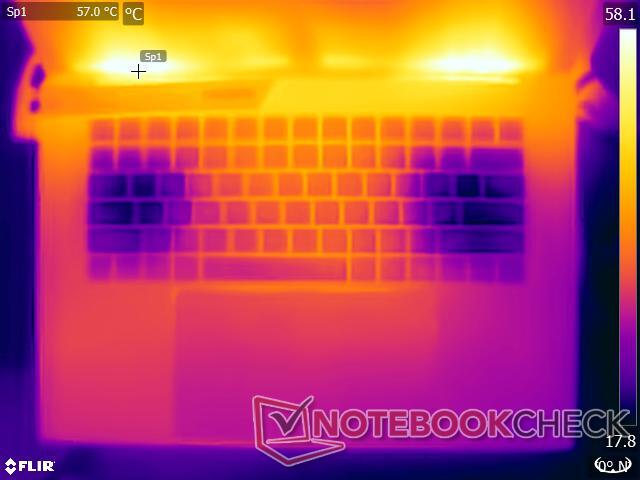
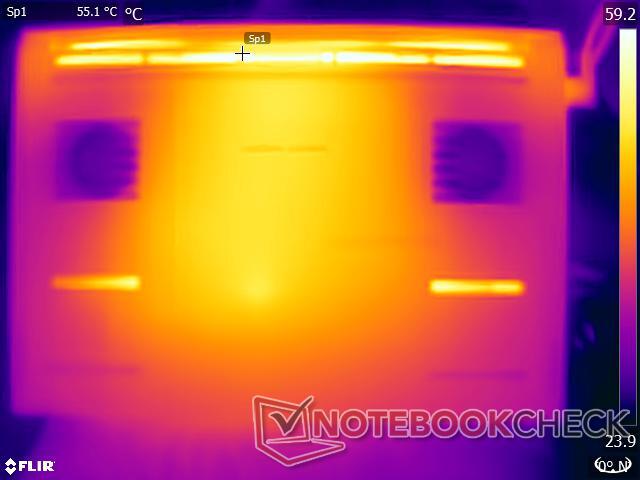
A Razer Blade 16 não é exatamente um cliente frio quando se trata de temperaturas de superfície sob carga. Registramos uma temperatura máxima de 54,2 °C enquanto estressamos com o The Witcher 3 a 1080p Ultra enquanto uma carga combinada Prime95 e FurMark resulta em um hotspot de 52 °C no centro superior do chassi.
A maior parte do calor é concentrada na fileira superior. A parte inferior do laptop pode ficar consideravelmente quente, por isso não recomendamos o uso do dispositivo na volta enquanto se trabalha com cargas pesadas. O perfil Balanceado ou Silencioso é mais adequado em tais casos.
As áreas de descanso da palma da mão não ficam anormalmente quentes, mas registramos pontos quentes em torno de 40 °C nos apoios esquerdo e direito da palma da mão e no touchpad.
(-) A temperatura máxima no lado superior é 52 °C / 126 F, em comparação com a média de 40.4 °C / 105 F , variando de 21.2 a 68.8 °C para a classe Gaming.
(-) A parte inferior aquece até um máximo de 47.6 °C / 118 F, em comparação com a média de 43.2 °C / 110 F
(+) Em uso inativo, a temperatura média para o lado superior é 30.6 °C / 87 F, em comparação com a média do dispositivo de 33.9 °C / ### class_avg_f### F.
(-) Jogando The Witcher 3, a temperatura média para o lado superior é 44.9 °C / 113 F, em comparação com a média do dispositivo de 33.9 °C / ## #class_avg_f### F.
(-) Os apoios para as mãos e o touchpad podem ficar muito quentes ao toque, com um máximo de 40.6 °C / 105.1 F.
(-) A temperatura média da área do apoio para as mãos de dispositivos semelhantes foi 28.8 °C / 83.8 F (-11.8 °C / -21.3 F).
O visor bloqueia parcialmente os exaustores de ar, levando a um acúmulo excessivo de calor naquela área. A base do mostrador também aquece consideravelmente como resultado.
Idealmente, a Razer deveria ter oferecido mais espaço entre a base de exibição e as aberturas de exaustão.

| Razer Blade 16 Early 2023 RTX 4090 i9-13950HX, GeForce RTX 4090 Laptop GPU | Eluktronics Mech-17 GP2 i9-13900HX, GeForce RTX 4090 Laptop GPU | Asus Zephyrus Duo 16 GX650PY-NM006W R9 7945HX, GeForce RTX 4090 Laptop GPU | MSI Titan GT77 HX 13VI i9-13950HX, GeForce RTX 4090 Laptop GPU | Razer Blade 16 Early 2023 i9-13950HX, GeForce RTX 4080 Laptop GPU | Lenovo Legion Pro 7 16IRX8H i9-13900HX, GeForce RTX 4080 Laptop GPU | Razer Blade 18 RTX 4070 i9-13950HX, GeForce RTX 4070 Laptop GPU | |
|---|---|---|---|---|---|---|---|
| Heat | 11% | 8% | 15% | 11% | -6% | 12% | |
| Maximum Upper Side * (°C) | 52 | 39 25% | 44.2 15% | 40.6 22% | 40 23% | 48 8% | 39.2 25% |
| Maximum Bottom * (°C) | 47.6 | 44 8% | 46.8 2% | 41.1 14% | 37.6 21% | 49 -3% | 35.6 25% |
| Idle Upper Side * (°C) | 33 | 31 6% | 29.2 12% | 26.2 21% | 32.4 2% | 40 -21% | 31.8 4% |
| Idle Bottom * (°C) | 30.6 | 29.8 3% | 30.2 1% | 30.3 1% | 31.4 -3% | 33 -8% | 33.2 -8% |
* ... menor é melhor
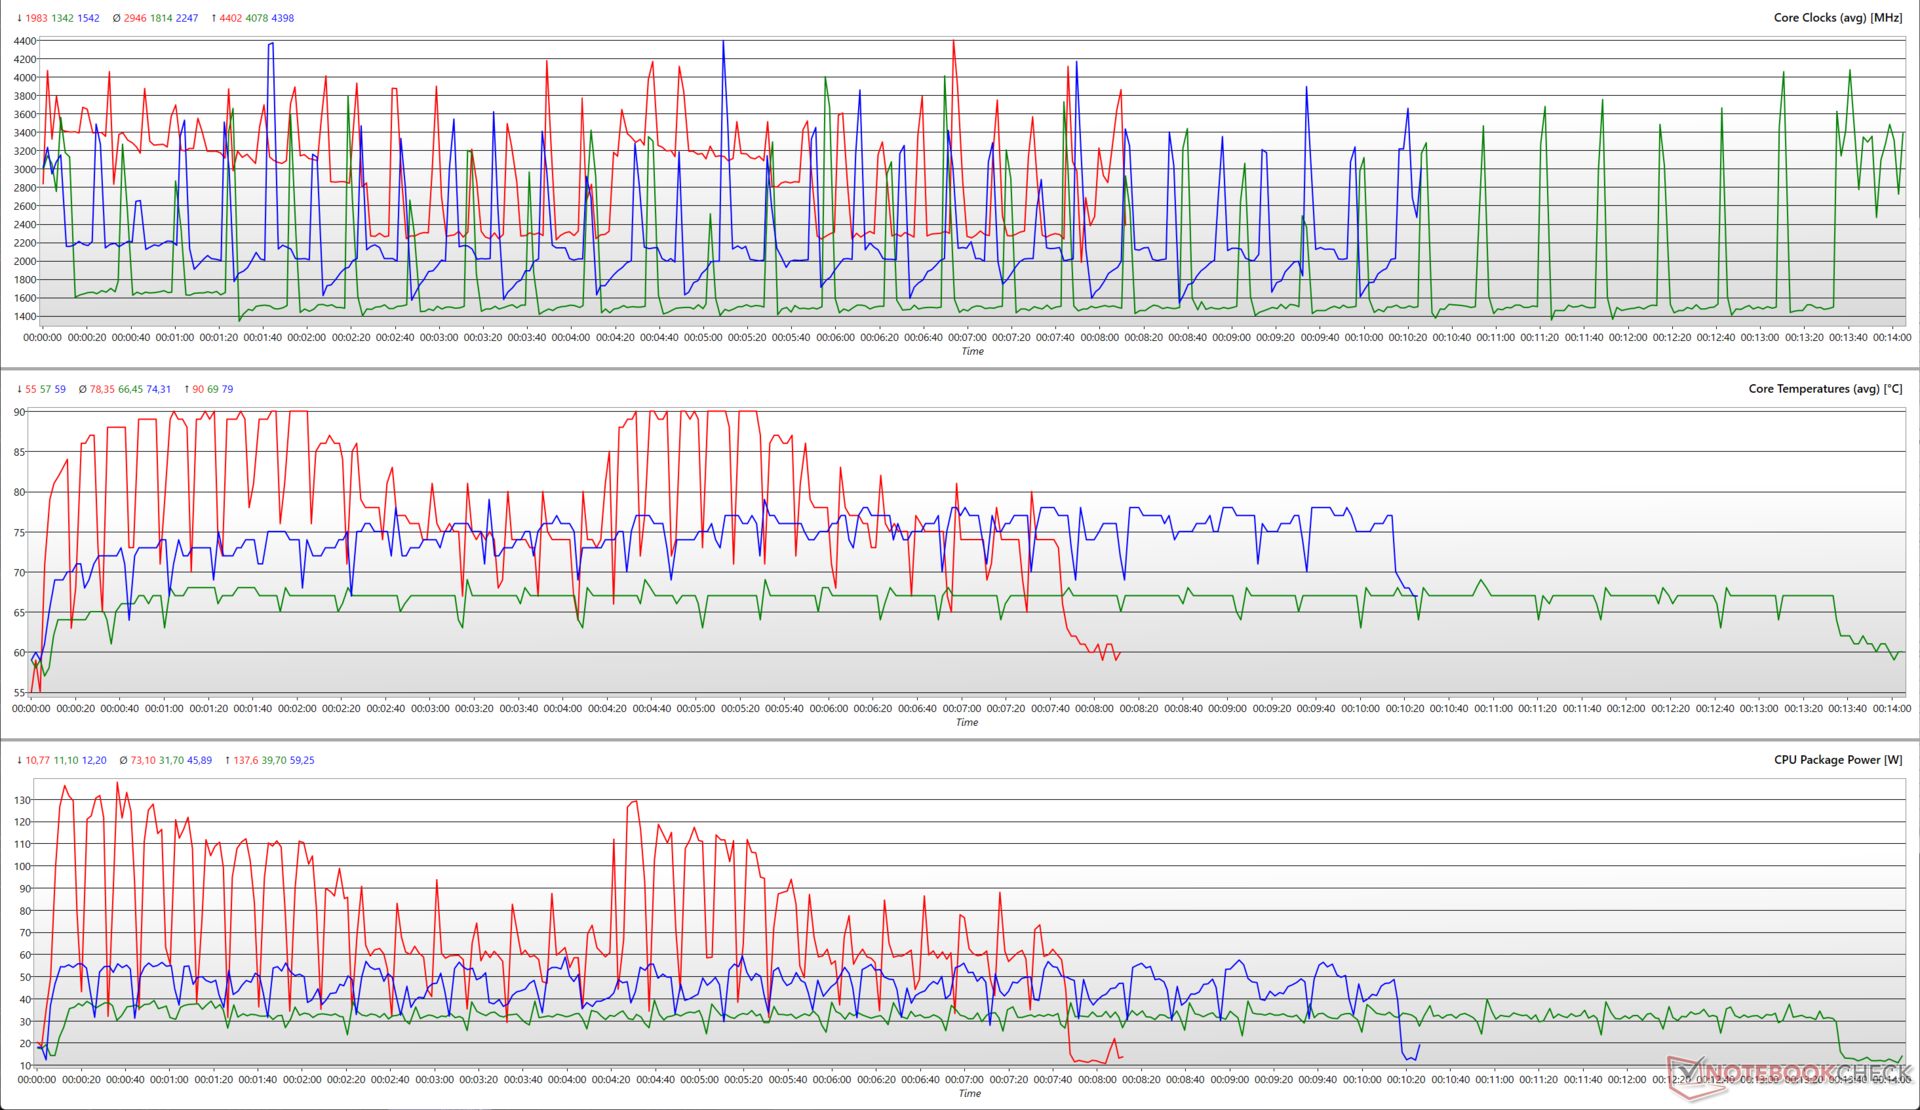
Teste de estresse
A lâmina 16 usa um sistema de resfriamento por câmara de vapor para manter seus poderosos componentes refrigerados. A câmara de vapor faz um trabalho decente para evitar o estrangulamento excessivo, como evidenciado por nossos testes de estresse.
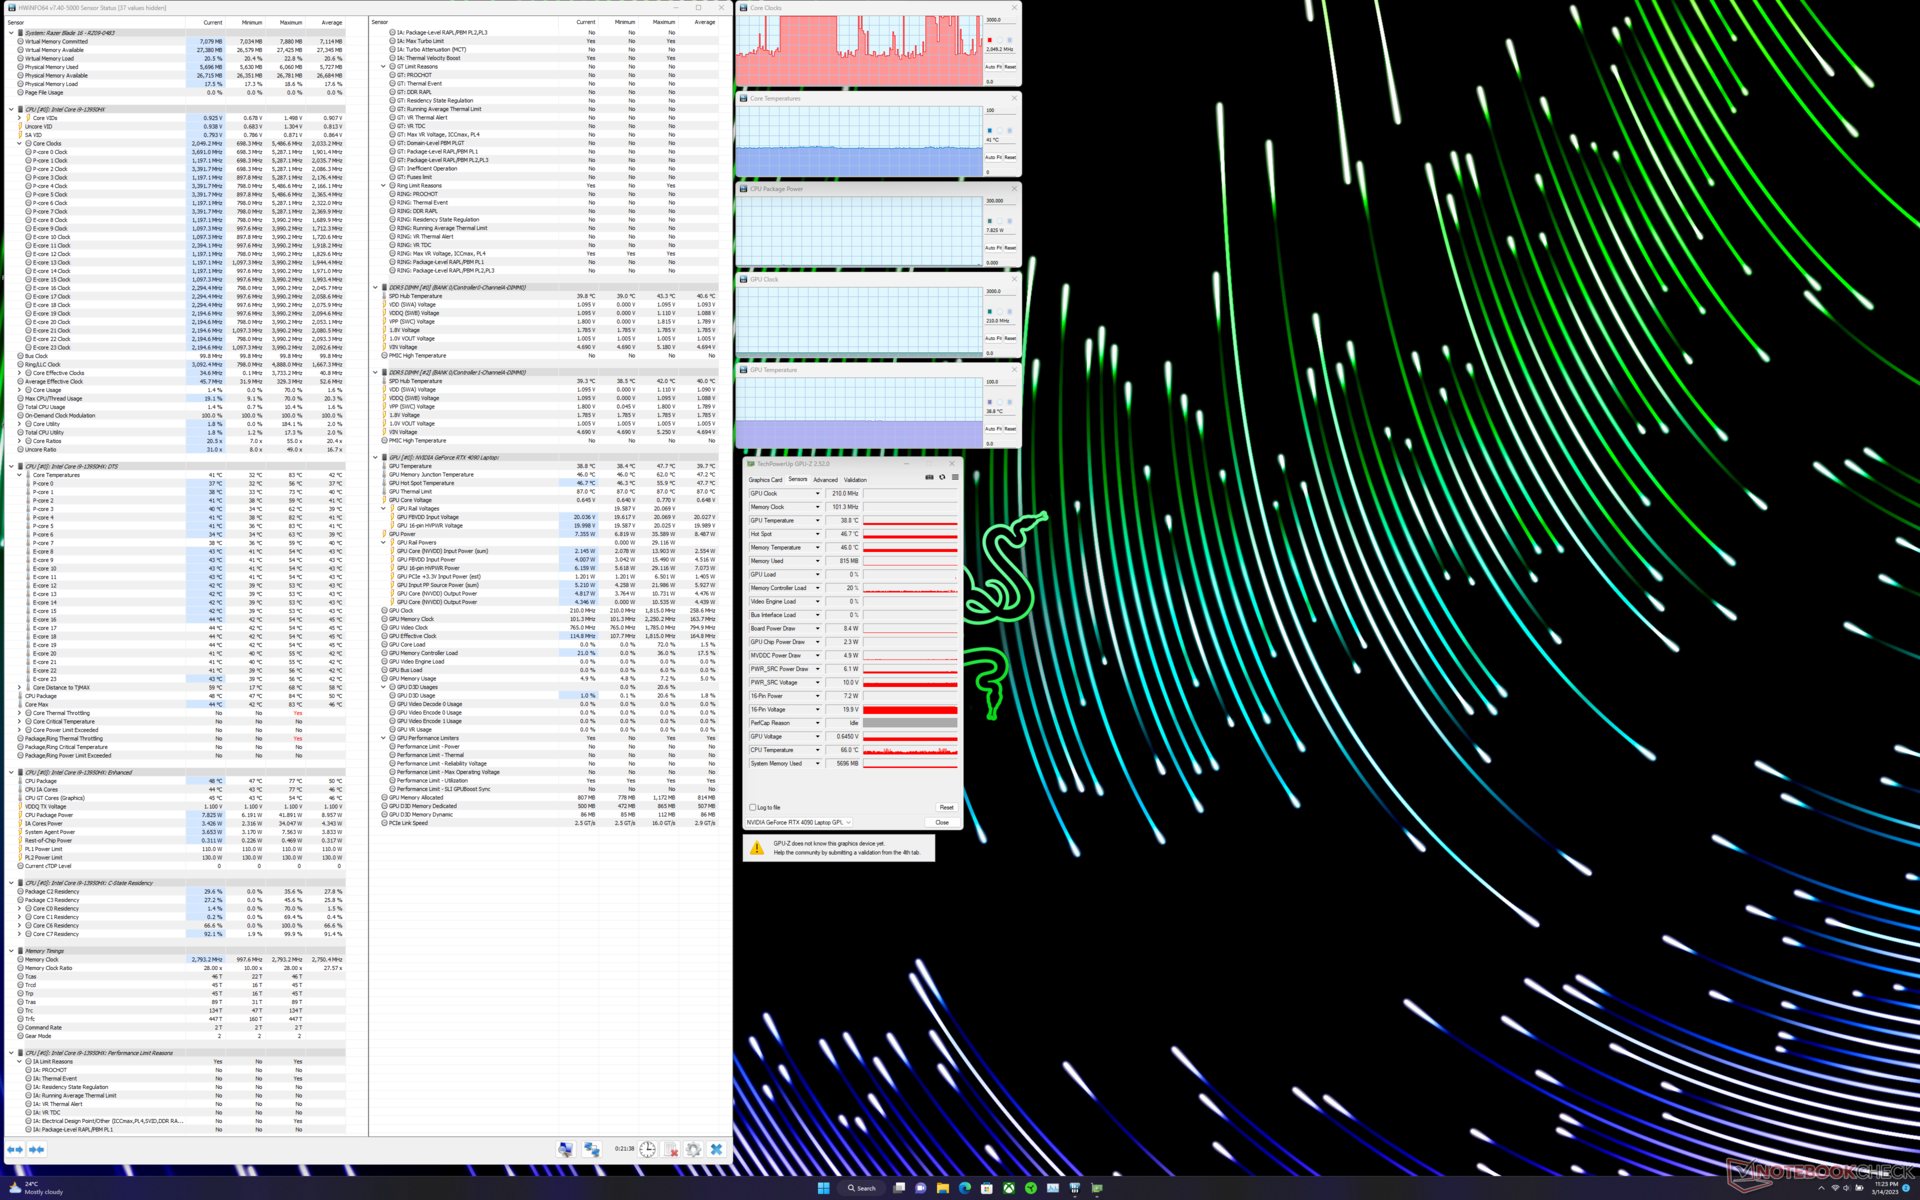
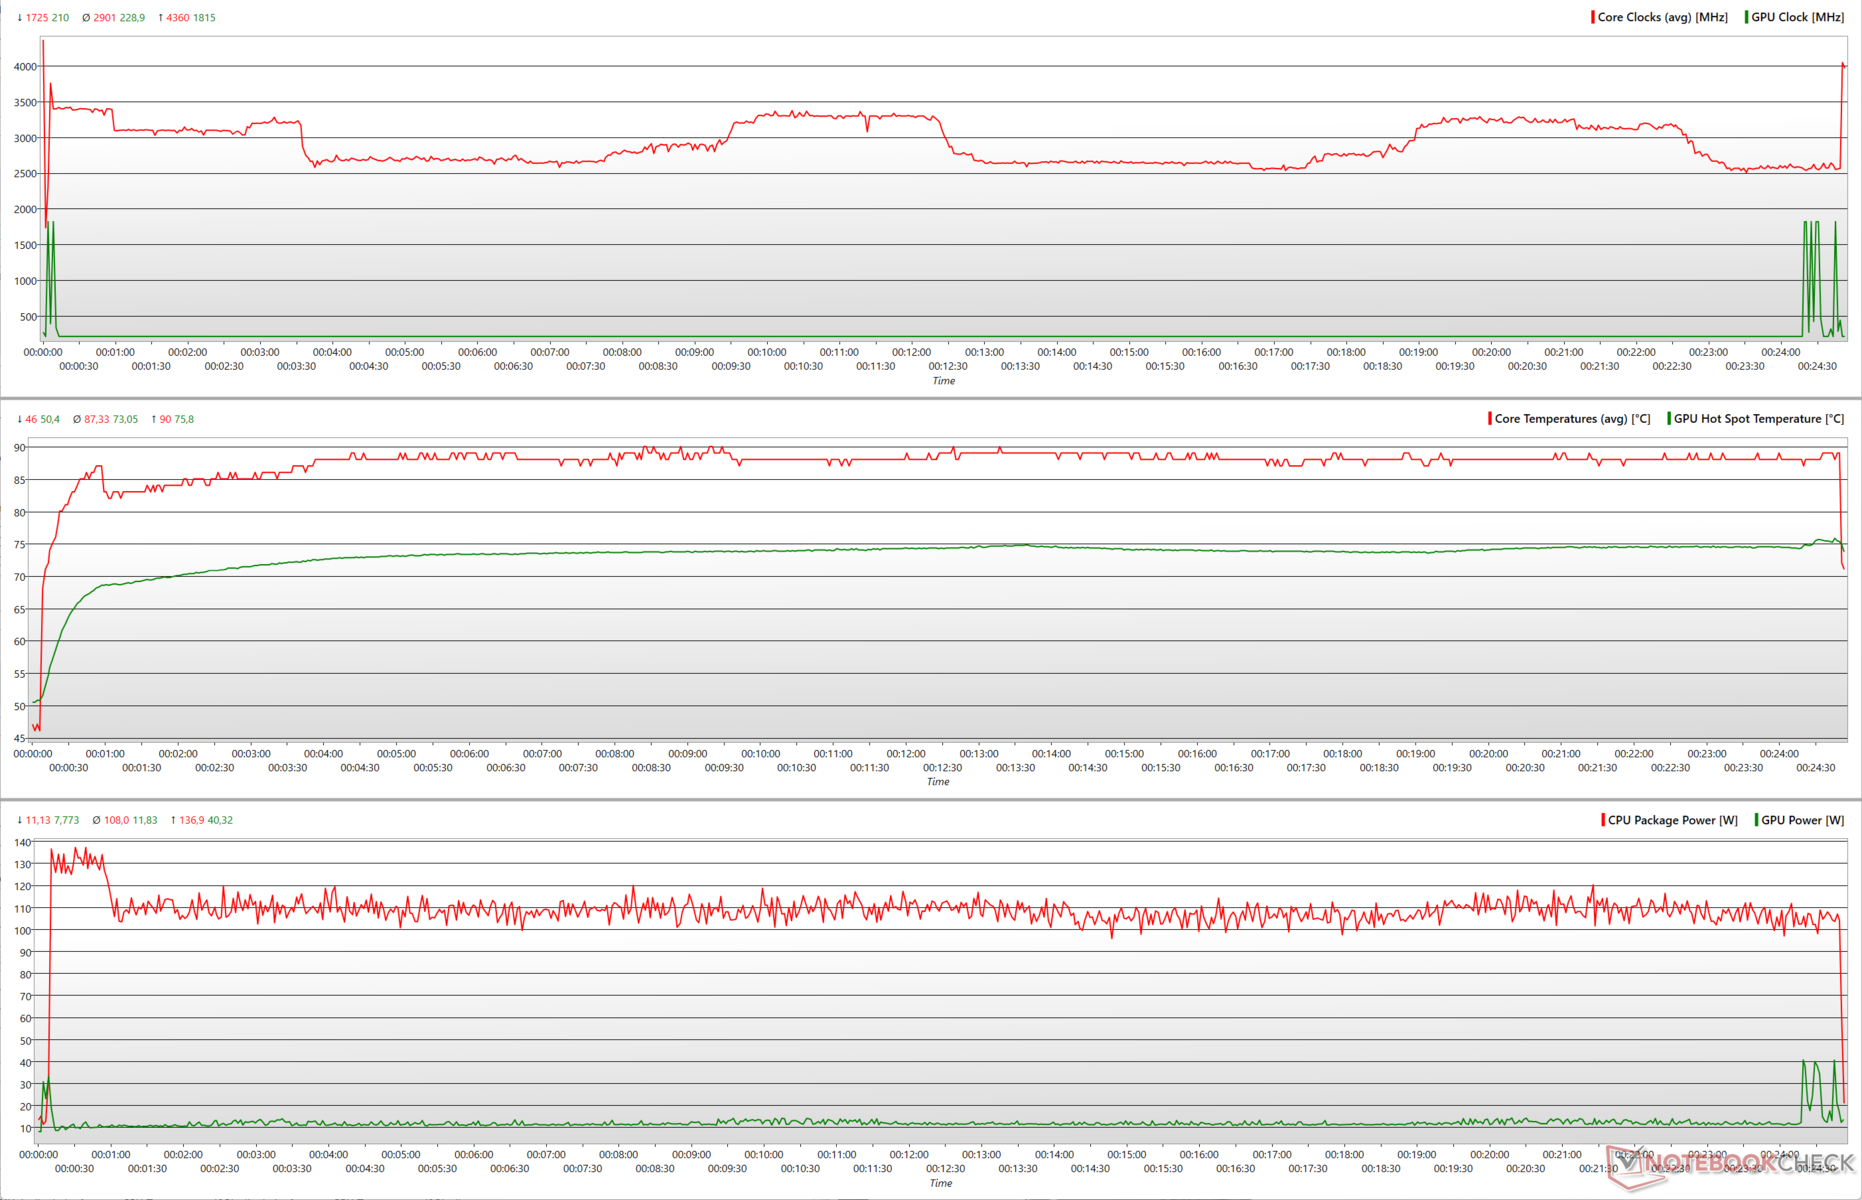
Enquanto o stress com Prime95 no local, grandes FFTs mostram o núcleo i9-13950HX aumentando até 4,36 GHz enquanto as temperaturas do núcleo atingem a marca de 90 °C. A CPU pode utilizar até 137 W momentaneamente antes de descer para cerca de 100 W durante o restante do teste.
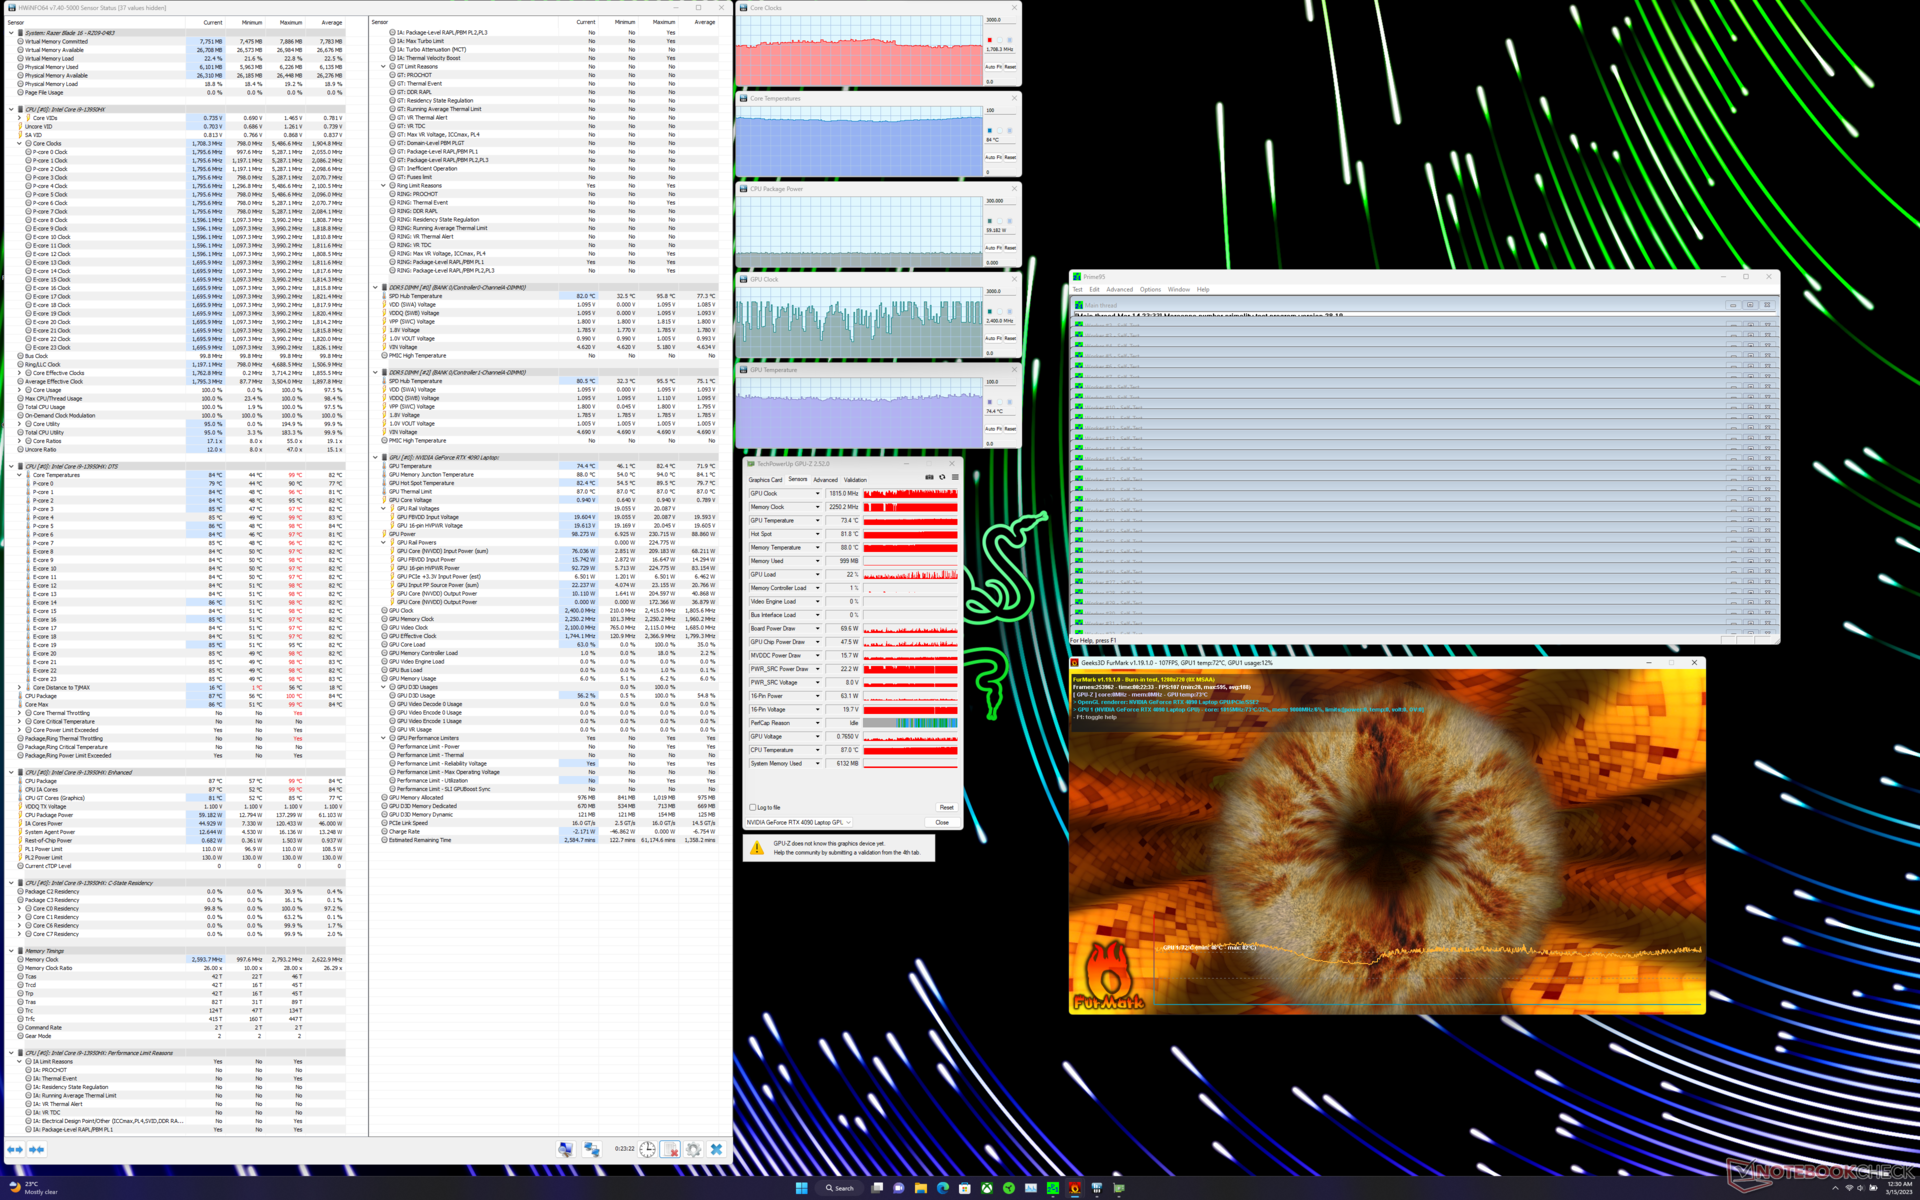
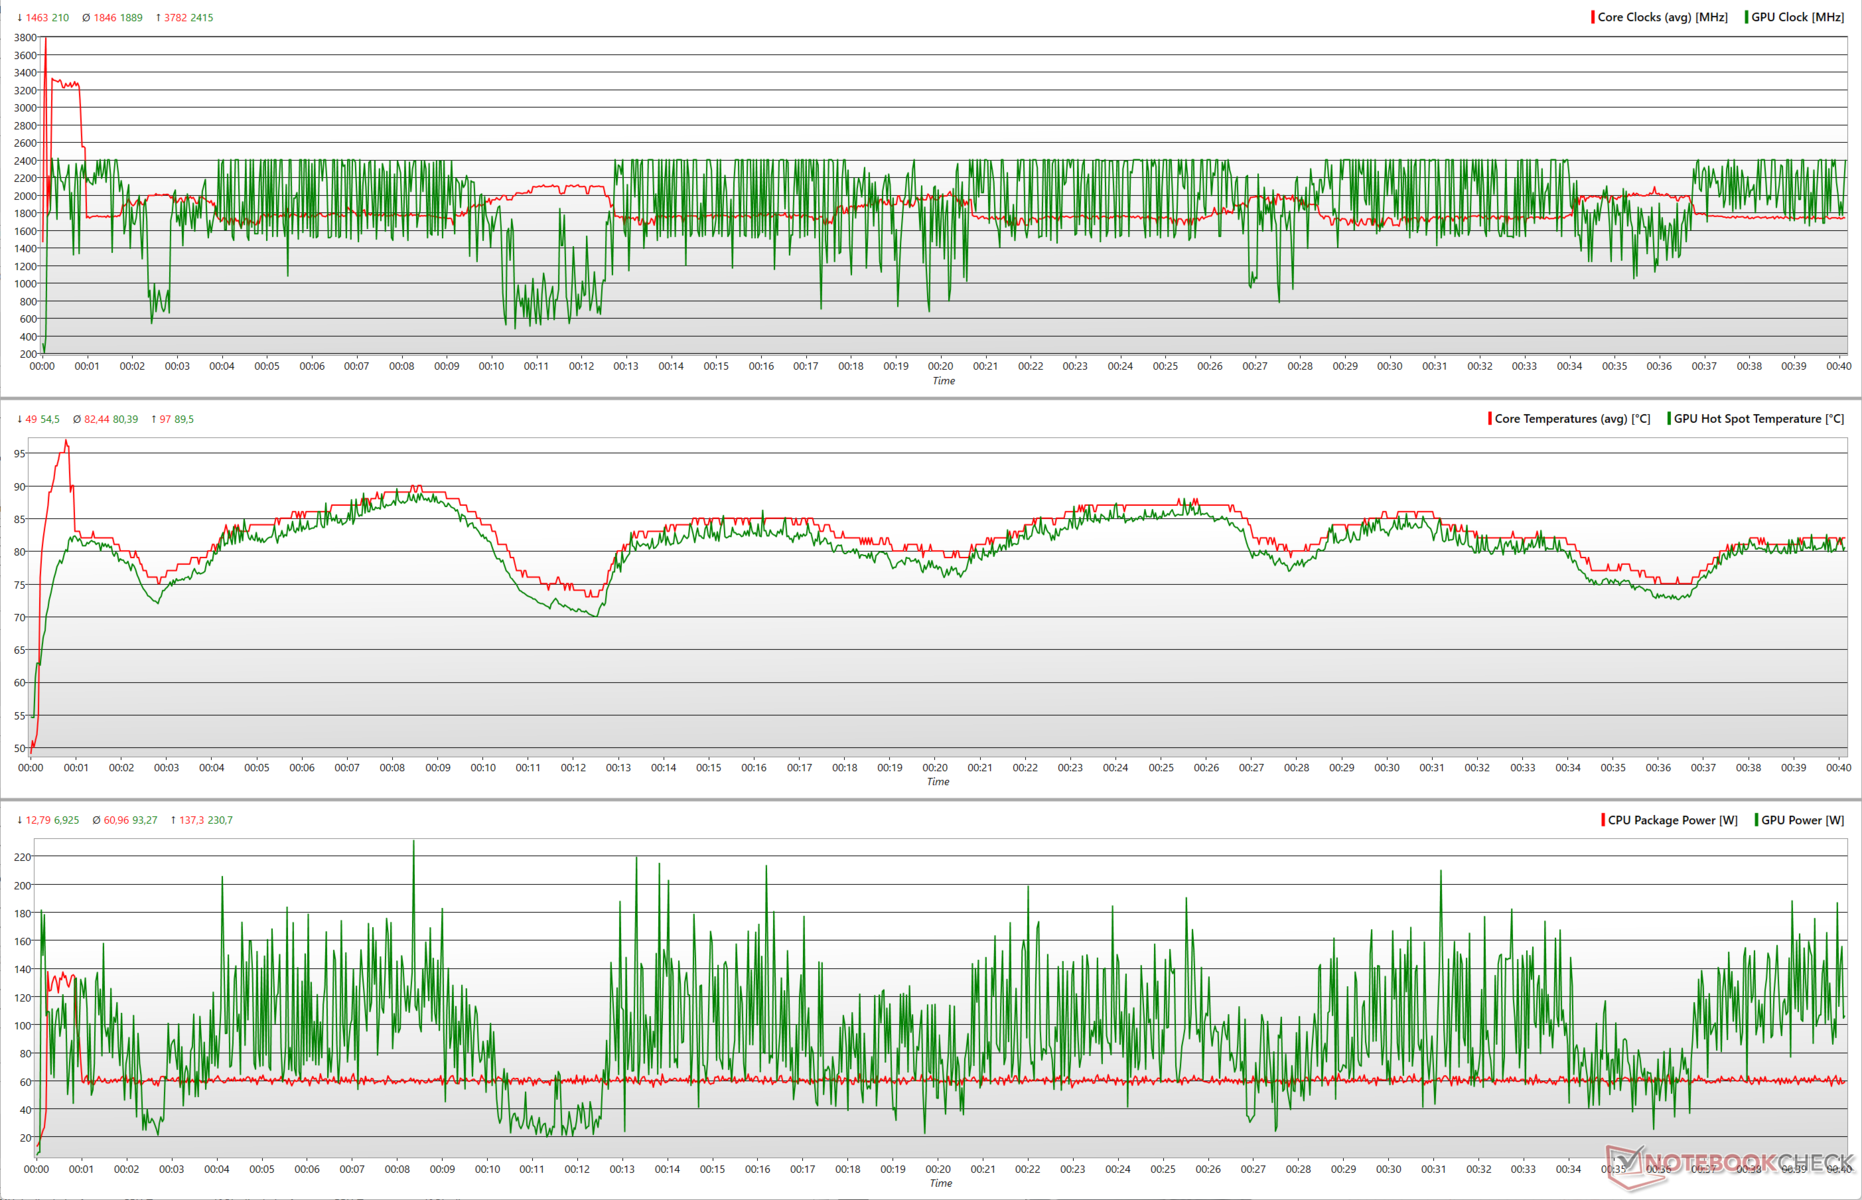
Ao adicionar o FurMark ao mix rodando a 1280 x 720 sem AA, a Blade 16 sacrifica parte de sua potência de CPU para permitir algum espaço para a GPU do laptop RTX 4090. Entretanto, os relógios da GPU caem significativamente sempre que a CPU tenta aumentar de 1,8 GHz para cerca de 2,2 GHz.
Em comparação com Prime95, a potência média do pacote da CPU na carga combinada cai de 108 W para 61 W. Isto permite que o RTX 4090 absorva aquela potência extra para picos momentâneos de até 231 W, resultando em relógios de pico de 2.415 MHz.
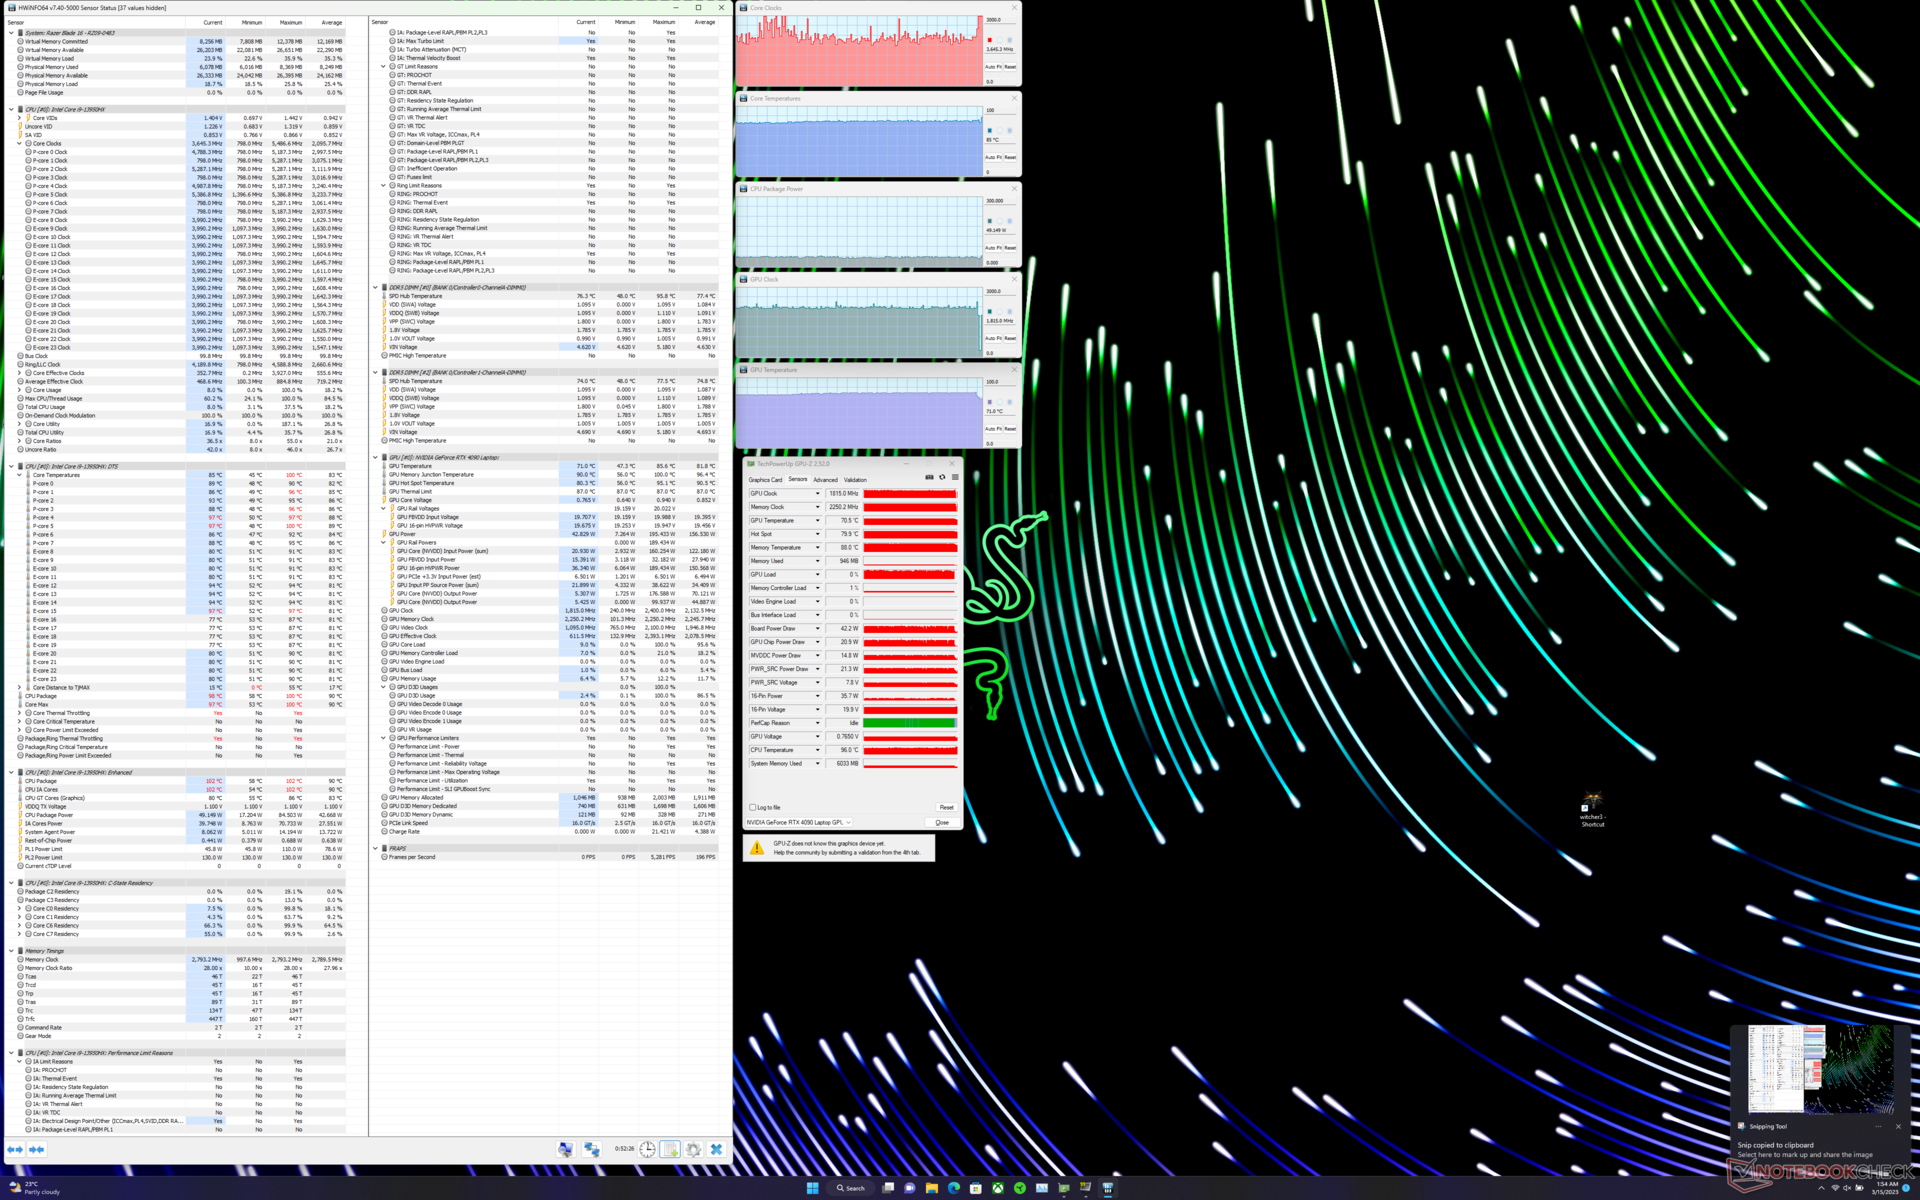
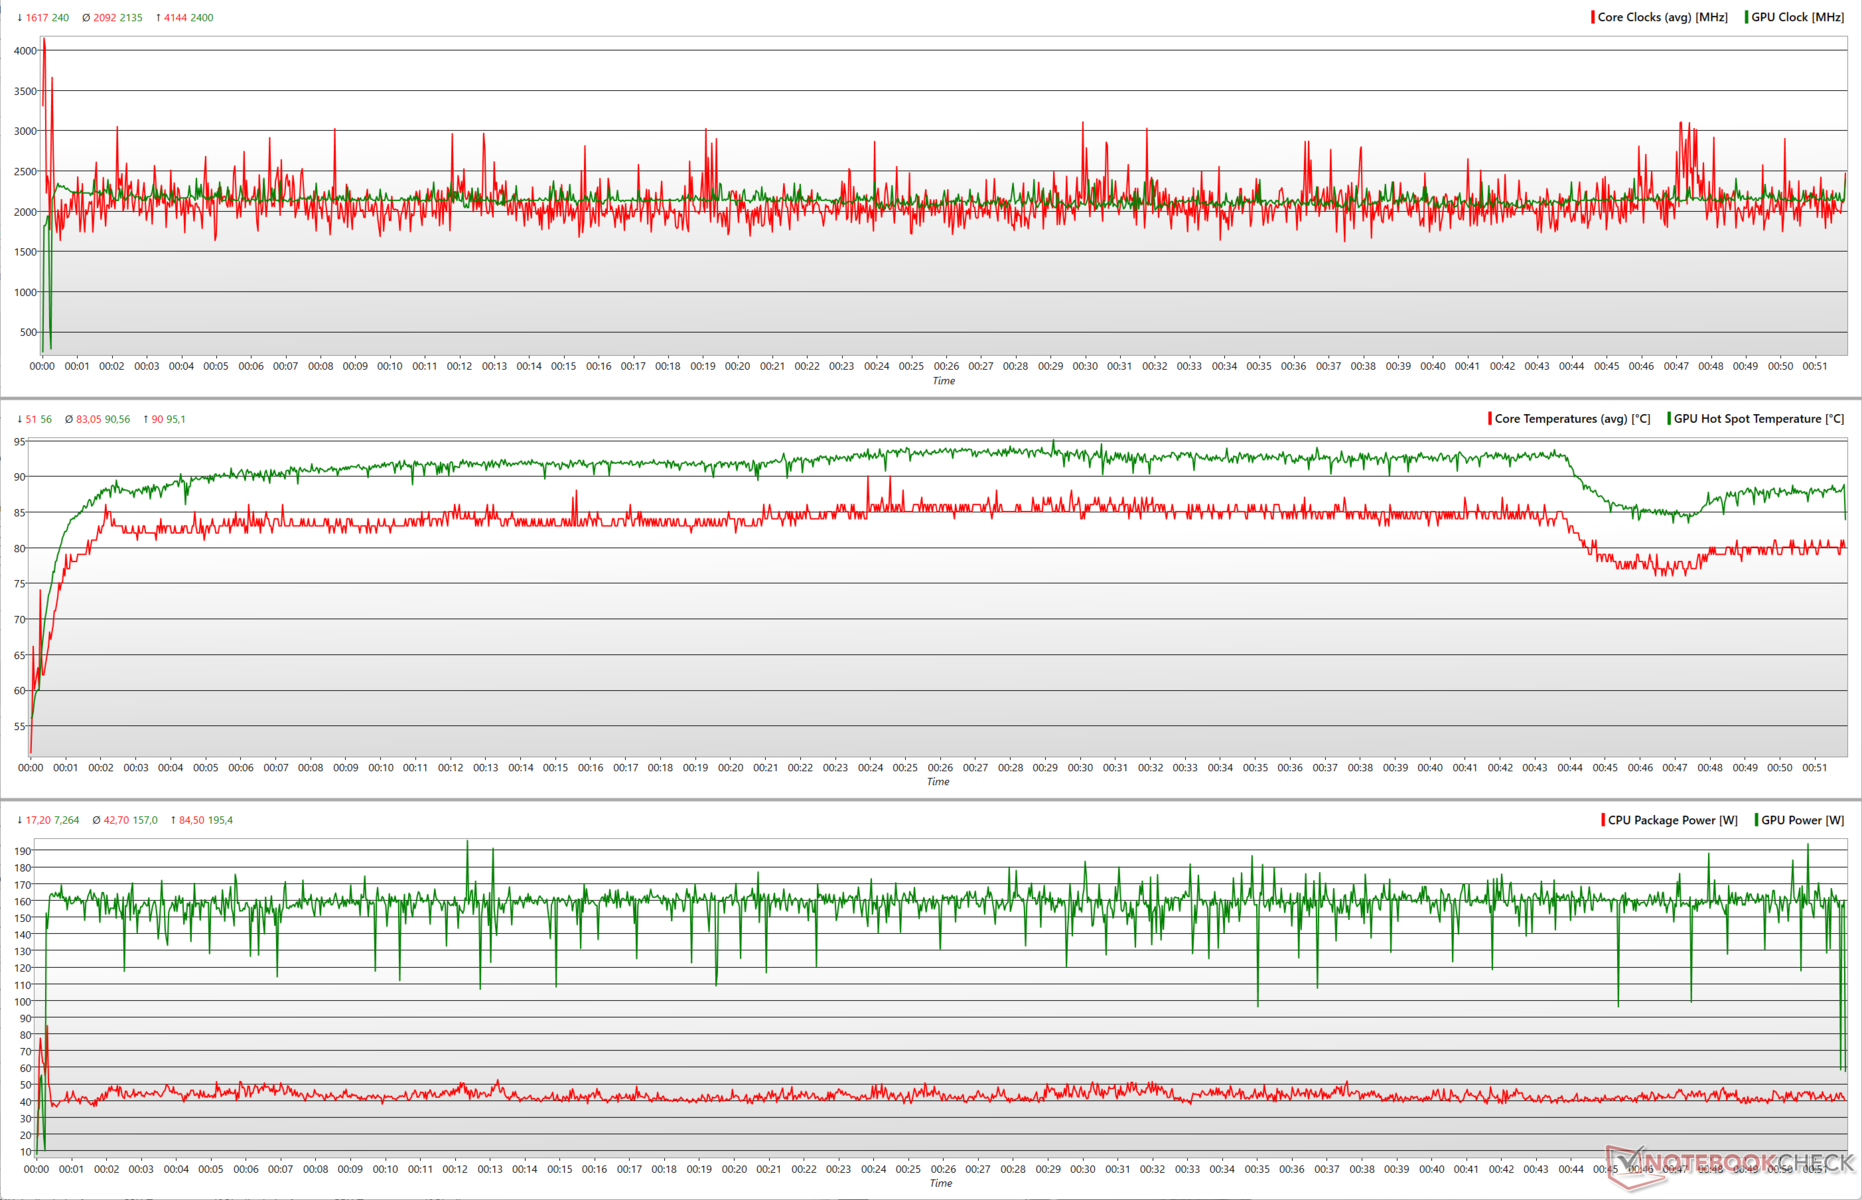
Os relógios GPU e a potência permanecem relativamente estáveis durante a tensão Witcher 3 a 1080p Ultra. A potência média do pacote da CPU é reduzida ainda mais para 42,7 W, permitindo que o RTX 4090 se adapte confortavelmente à marca de 157 W, em média. Tanto o relógio Core i9-13950HX quanto o RTX 4090 estão próximos a 2,1 GHz em média.
| Teste de estresse | Relógio da CPU (GHz) | Relógio da GPU (MHz) | Temperatura média da CPU (°C) | Temperatura média da GPU (°C) |
| Sistema ocioso | 2.05 | 210 | 42 | 39.7 |
| Prime95 | 2.56 | 210 | 87 | 63.1 |
| Prime95 + FurMark | 1.70 | 1.815 | 82 | 72 |
| O Witcher 3 | 3,64 | 1.815 | 83 | 81,8 |
Oradores
A Razer é conhecida por equipar suas Lâminas com alto-falantes decentes a bordo, e a Lâmina 16 não é diferente. A Lâmina 16 vem com dois alto-falantes e dois woofers alimentados por dois Smart Amps.
O pico de 75 dB(A) SPL parece ser um pouco mais baixo do que o que vimos antes com a Lâmina 16 RTX 4080 e a Lâmina 18, mas é suficientemente alto para encher uma sala de tamanho médio.
A resposta dos graves é decente, mas poderia ter sido definitivamente melhor considerando a presença de woofers dedicados. Os médios e altos são bem definidos, o que deve ser adequado para uma escuta casual. Outras opções de conectividade de áudio incluem uma tomada de áudio combinada de 3,5 mm e Bluetooth 5,3.
A Razer oferece a funcionalidade THX Spatial Audio, mas infelizmente, não conseguimos fazer com que o aplicativo funcionasse mesmo depois de atualizar os drivers de áudio.
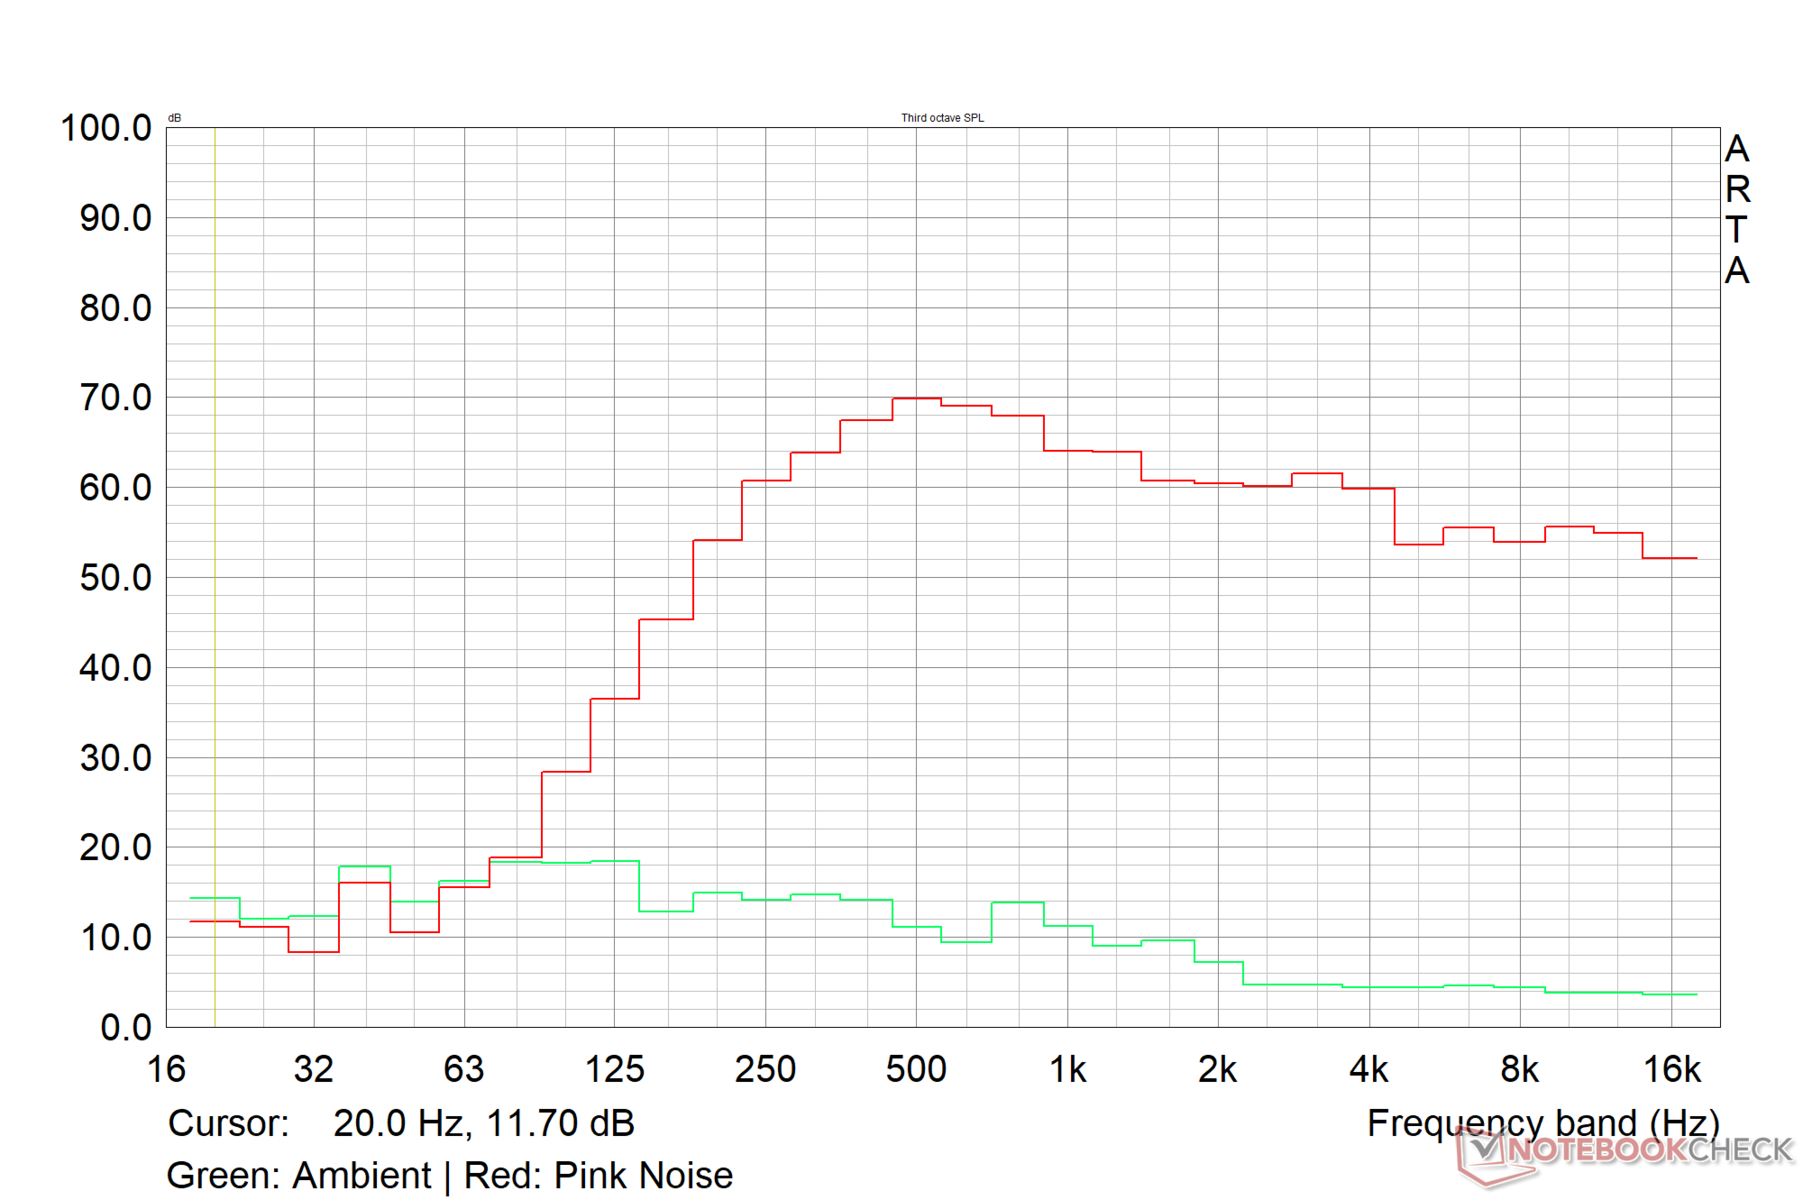
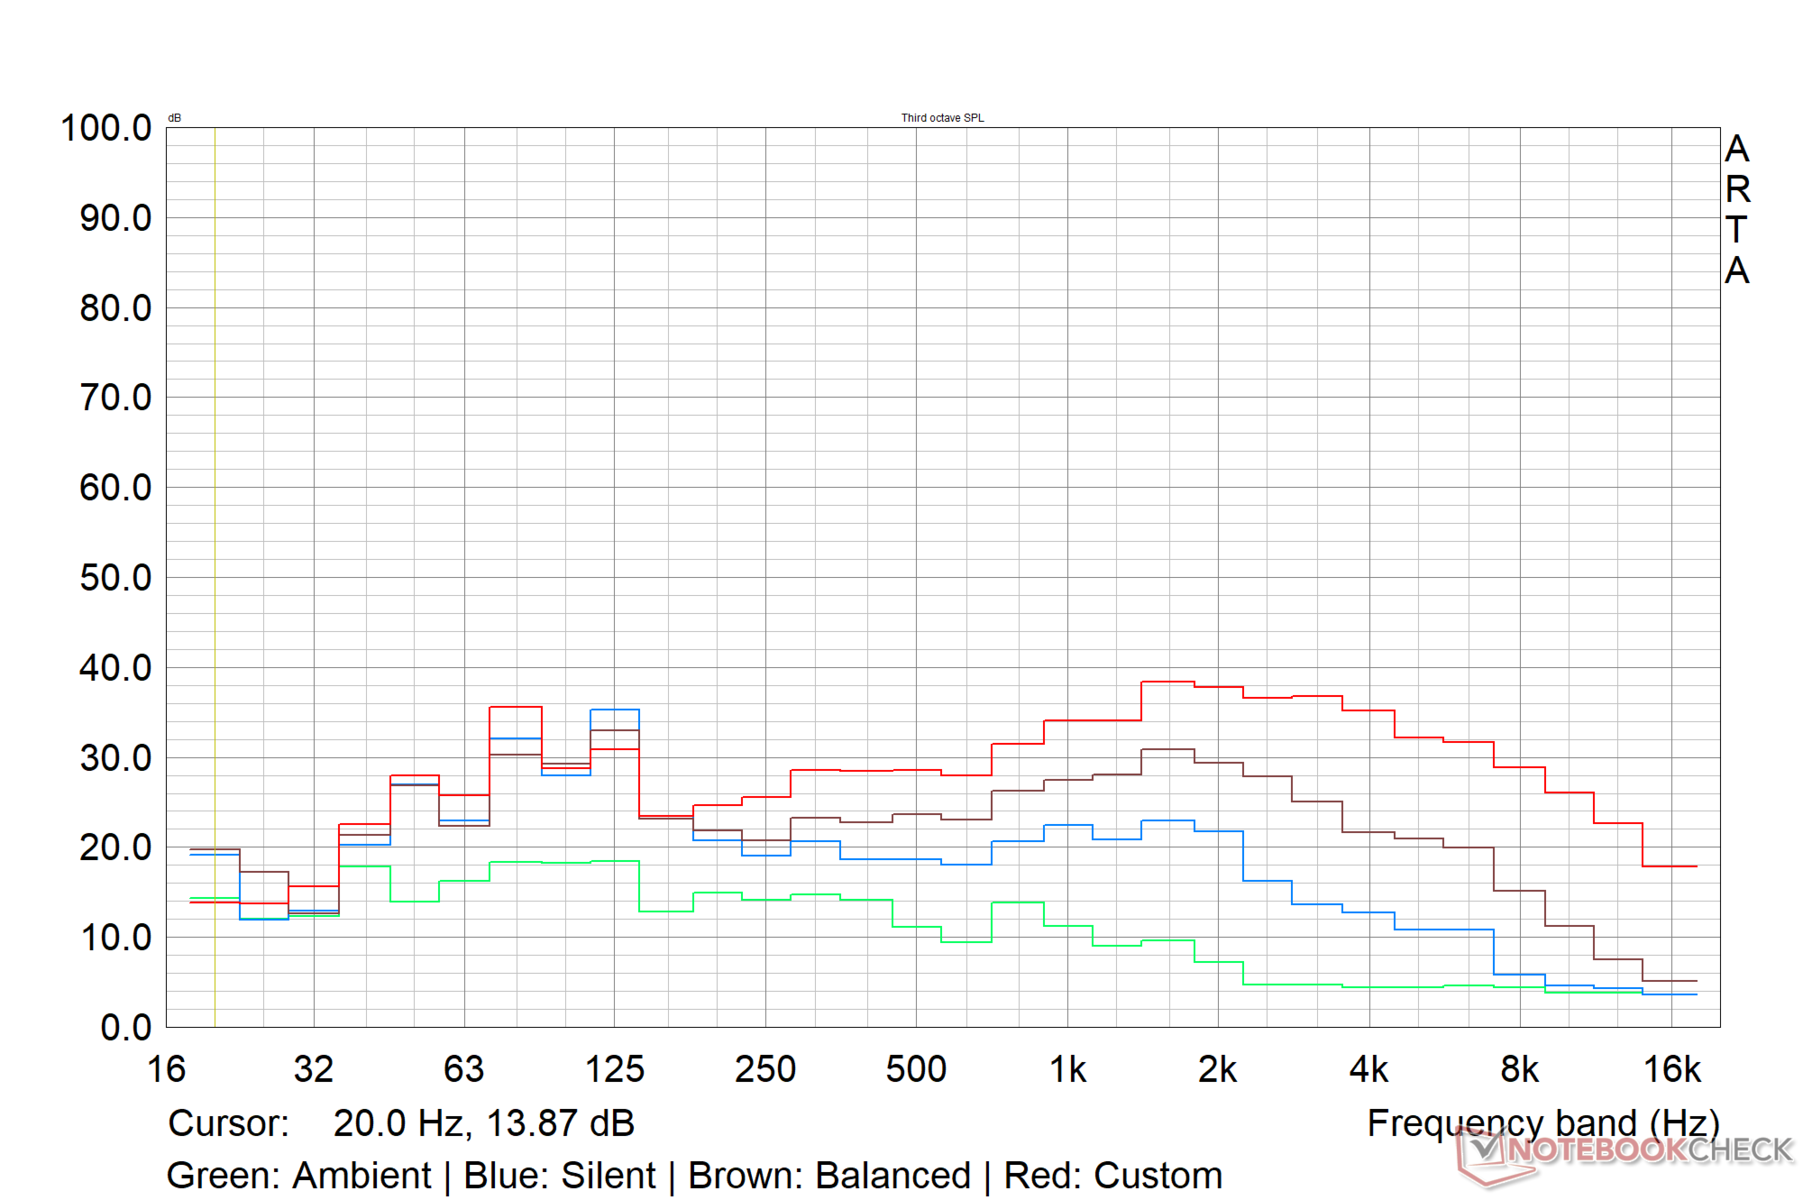
Razer Blade 16 Early 2023 RTX 4090 análise de áudio
(±) | o volume do alto-falante é médio, mas bom (###valor### dB)
Graves 100 - 315Hz
(±) | graves reduzidos - em média 13.4% menor que a mediana
(±) | a linearidade dos graves é média (14.8% delta para a frequência anterior)
Médios 400 - 2.000 Hz
(±) | médios mais altos - em média 5.3% maior que a mediana
(+) | médios são lineares (3.8% delta para frequência anterior)
Altos 2 - 16 kHz
(+) | agudos equilibrados - apenas 3.4% longe da mediana
(+) | os máximos são lineares (4.2% delta da frequência anterior)
Geral 100 - 16.000 Hz
(±) | a linearidade do som geral é média (15.6% diferença em relação à mediana)
Comparado com a mesma classe
» 36% de todos os dispositivos testados nesta classe foram melhores, 6% semelhantes, 58% piores
» O melhor teve um delta de 6%, a média foi 18%, o pior foi 132%
Comparado com todos os dispositivos testados
» 23% de todos os dispositivos testados foram melhores, 5% semelhantes, 72% piores
» O melhor teve um delta de 4%, a média foi 23%, o pior foi 134%
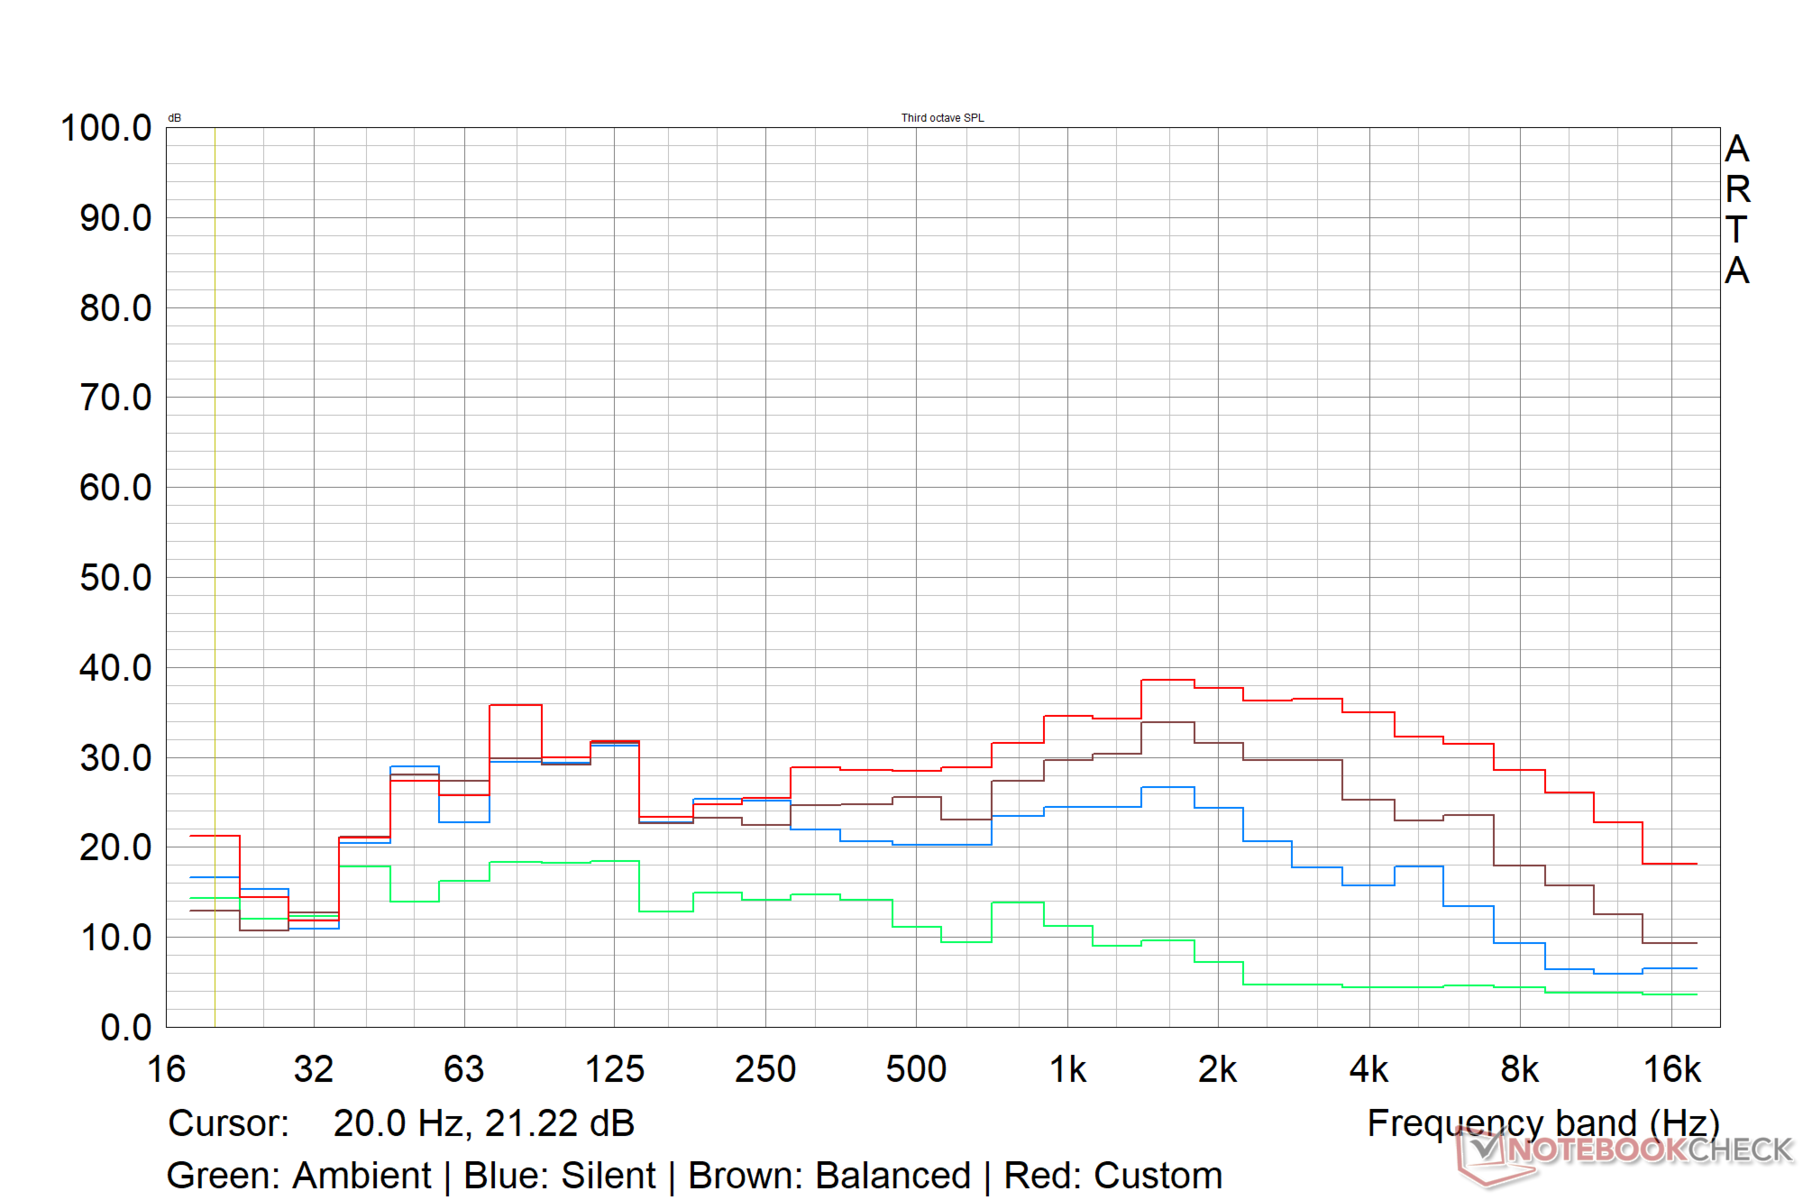
Apple MacBook Pro 16 2021 M1 Pro análise de áudio
(+) | os alto-falantes podem tocar relativamente alto (###valor### dB)
Graves 100 - 315Hz
(+) | bons graves - apenas 3.8% longe da mediana
(+) | o baixo é linear (5.2% delta para a frequência anterior)
Médios 400 - 2.000 Hz
(+) | médios equilibrados - apenas 1.3% longe da mediana
(+) | médios são lineares (2.1% delta para frequência anterior)
Altos 2 - 16 kHz
(+) | agudos equilibrados - apenas 1.9% longe da mediana
(+) | os máximos são lineares (2.7% delta da frequência anterior)
Geral 100 - 16.000 Hz
(+) | o som geral é linear (4.6% diferença em relação à mediana)
Comparado com a mesma classe
» 0% de todos os dispositivos testados nesta classe foram melhores, 0% semelhantes, 100% piores
» O melhor teve um delta de 5%, a média foi 17%, o pior foi 45%
Comparado com todos os dispositivos testados
» 0% de todos os dispositivos testados foram melhores, 0% semelhantes, 100% piores
» O melhor teve um delta de 4%, a média foi 23%, o pior foi 134%
Gestão de energia: Potência econômica para a configuração
Consumo de energia
O consumo de energia ociosa do Blade 16 RTX 4090 está no lado mais alto, mas o consumo de energia sob carga parece bastante econômico para a configuração dada. O padrão de consumo de energia coincide em grande parte com nossas observações durante o teste de estresse acima.
Registramos um pico de consumo de energia próximo a 287 W sob carga máxima no perfil personalizado, de modo que o adaptador de energia GaN de 330 W fornecido deve ser mais do que adequado para as necessidades de energia da lâmina 16. Comparado aos adaptadores com a concorrência, o tijolo de energia GaN da Razer é mais compacto e portátil.
| desligado | |
| Ocioso | |
| Carga |
|
Key:
min: | |
| Razer Blade 16 Early 2023 RTX 4090 i9-13950HX, GeForce RTX 4090 Laptop GPU, mini-LED, 3840x2400, 16" | Eluktronics Mech-17 GP2 i9-13900HX, GeForce RTX 4090 Laptop GPU, IPS, 2560x1600, 17" | Asus Zephyrus Duo 16 GX650PY-NM006W R9 7945HX, GeForce RTX 4090 Laptop GPU, MiniLED, 2560x1600, 16" | MSI Titan GT77 HX 13VI i9-13950HX, GeForce RTX 4090 Laptop GPU, Mini-LED, 3840x2160, 17.3" | Razer Blade 16 Early 2023 i9-13950HX, GeForce RTX 4080 Laptop GPU, IPS, 2560x1600, 16" | Lenovo Legion Pro 7 16IRX8H i9-13900HX, GeForce RTX 4080 Laptop GPU, IPS, 2560x1600, 16" | Razer Blade 18 RTX 4070 i9-13950HX, GeForce RTX 4070 Laptop GPU, IPS, 2560x1600, 18" | Média NVIDIA GeForce RTX 4090 Laptop GPU | Média da turma Gaming | |
|---|---|---|---|---|---|---|---|---|---|
| Power Consumption | 12% | 9% | 14% | 11% | 12% | 2% | 15% | 33% | |
| Idle Minimum * (Watt) | 27.5 | 14 49% | 19.2 30% | 14 49% | 15.2 45% | 18 35% | 24.5 11% | 16.2 ? 41% | 13 ? 53% |
| Idle Average * (Watt) | 34.4 | 19.3 44% | 29.7 14% | 21.6 37% | 22.8 34% | 24 30% | 34.1 1% | 23.1 ? 33% | 19 ? 45% |
| Idle Maximum * (Watt) | 35.4 | 36.8 -4% | 30.8 13% | 24.8 30% | 49.8 -41% | 32 10% | 47.7 -35% | 34.2 ? 3% | 24.6 ? 31% |
| Load Average * (Watt) | 147.8 | 117.2 21% | 126 15% | 122.5 17% | 121.2 18% | 130 12% | 140 5% | 130.5 ? 12% | 110.7 ? 25% |
| Witcher 3 ultra * (Watt) | 256 | 304 -19% | 258 -1% | 265 -4% | 242 5% | 260 -2% | 202 21% | ||
| Load Maximum * (Watt) | 286.7 | 342.5 -19% | 330 -15% | 418 -46% | 273.7 5% | 320 -12% | 261 9% | 324 ? -13% | 259 ? 10% |
* ... menor é melhor
Power Consumption: The Witcher 3 / Stress test
Power Consumption: External monitor
Vida útil da bateria
O pacote de 95,2 WHr de bateria dupla atinge 5,45 horas de duração em nosso teste de navegação Wi-Fi padronizado a 150 nits. Isto é apenas ligeiramente testado pela Razer Blade 16 RTX 4080.
O tempo de reprodução de vídeo a 150 lêndeas é muito melhor do que a concorrência a cerca de 8,5 horas.
Devido aos poderosos internos, a bateria dura apenas cerca de 1,5 horas sob carga. A Lenovo Legion Pro 7 com uma RTX 4080 e uma bateria de 99,9 WHr pode durar 53% mais.
| Razer Blade 16 Early 2023 RTX 4090 i9-13950HX, GeForce RTX 4090 Laptop GPU, 95.2 Wh | Eluktronics Mech-17 GP2 i9-13900HX, GeForce RTX 4090 Laptop GPU, 99 Wh | Asus Zephyrus Duo 16 GX650PY-NM006W R9 7945HX, GeForce RTX 4090 Laptop GPU, 90 Wh | MSI Titan GT77 HX 13VI i9-13950HX, GeForce RTX 4090 Laptop GPU, 99.9 Wh | Razer Blade 16 Early 2023 i9-13950HX, GeForce RTX 4080 Laptop GPU, 95.2 Wh | Lenovo Legion Pro 7 16IRX8H i9-13900HX, GeForce RTX 4080 Laptop GPU, 99.9 Wh | Razer Blade 18 RTX 4070 i9-13950HX, GeForce RTX 4070 Laptop GPU, 91.7 Wh | Média da turma Gaming | |
|---|---|---|---|---|---|---|---|---|
| Duração da bateria | -12% | -38% | -13% | 3% | 19% | -19% | 10% | |
| H.264 (h) | 8.4 | 3.8 -55% | 6 -29% | 8.32 ? -1% | ||||
| WiFi v1.3 (h) | 5.8 | 5.1 -12% | 4 -31% | 5.3 -9% | 6.1 5% | 5.1 -12% | 4 -31% | 7.11 ? 23% |
| Witcher 3 ultra (h) | 1.6 | |||||||
| Load (h) | 1.4 | 1 -29% | 1.4 0% | 1.4 0% | 2.1 50% | 1.3 -7% | 1.502 ? 7% | |
| Reader / Idle (h) | 8.9 | 6.4 | 7 | 8.27 ? |
Pro
Contra
Veredicto: Uma lâmina 16 para os entusiastas, não tanto para os conhecedores de desempenho
O Razer Blade 16 Early 2023 com o GPU RTX 4090 Laptop evoca excitação à primeira vista. O chassi elegante de 16 polegadas parece e sente-se premium, e a Razer deve ser elogiada por atingir o equilíbrio certo entre minimalismo e estética de jogo. Embora robusto, ele pode rapidamente se transformar em um visual desagradável, graças a toda a mancha.
A Razer acerta muitas coisas com a lâmina 16 de 2023. Um leitor de cartões SD de alto rendimento, Wi-Fi 6E estável, uma webcam decente de 1080p, I/O adequada e uma área de touchpad aumentada, tudo isso é um bom augúrio para a Blade 16. O teclado é bom com uma luz de fundo brilhante, mas a Razer poderia ter implementado viagens mais longas e/ou incorporado teclas ópticas.
O visor de modo duplo mini-LED é o principal USP do Blade 16 Early 2023, e este é o primeiro laptop do mundo a ter um. A capacidade de alternar entre os modos UHD+ 120 Hz e FHD+ 240 Hz pode ser útil para os criadores que também jogam.
Entretanto, além de todo o hype está o fato de que a implementação do modo dual não é perfeita. A comutação não é dinâmica, exigindo um reinício a cada vez. Além disso, o modo FHD+ mostra uma imagem visivelmente difusa, e perde-se a capacidade de mudar os perfis de cor. No modo UHD+, entretanto, a tela da Blade 16 se destaca com alta luminância e visuais SDR/HDR deslumbrantes que estão o mais próximo possível da qualidade OLED.
O Blade 16 Razer Blade 16 Early 2023 é uma perspectiva sedutora com um preço que dá água nos olhos. Apresentando um Core i9-13950HX, um GPU para laptop RTX 4090 de 175 W e uma vibrante tela UHD+ mini-LED dual-mode, o novo Razer Blade 16 verifica a maioria das caixas para um laptop de alta qualidade em 2023. No entanto, a US$ 4.300, seria de se esperar um laptop quase perfeito em todos os aspectos, o que não é o caso aqui"
O Blade 16 Early 2023 é um equipamento esportivo top de linha, incluindo o Intel Core i9-13950HX e o Nvidia GeForce RTX 4090 GPU para notebook. Embora esta combinação supere facilmente os principais laptops de ponta do ano passado sem quebrar um suor, as coisas começaram a se tornar extremamente competitivas em 2023.
A Lâmina 16 trilha atrás de outros laptops de alto nível para jogos, tais como o MSI Titan GT77 HX 13VI, Lenovo Legion Pro 7e o Asus ROG Zephyrus Duo 16 no desempenho da CPU. Os deltas de desempenho são um pouco estreitos quando se trata de cargas gráficas.
A GPU para laptop RTX 4090 é às vezes ofuscada pela GPU para notebook RTX 4080 a 1080p Ultra devido aos gargalos da CPU, mas a placa funciona bem em QHD e 4K, dependendo do título. Qualquer plano de jogo a 4K Ultra com traçado de raio exigirá a habilitação da geração de quadros DLSS 2 ou DLSS 3 para taxas de quadros jogáveis.
As térmicas da Blade 16 são bastante capazes, mas definitivamente há espaço para melhorias. A câmara de vapor faz um trabalho decente de manter os componentes frios, mas não é capaz de domar totalmente a CPU e GPU em carga máxima no perfil de potência personalizado.
As altas temperaturas de superfície podem ser um fator dissuasor. Os níveis de ruído dos ventiladores estão ao mesmo nível do curso de um laptop de jogo deste calibre. A qualidade sonora a bordo é, na maior parte das vezes, atendida.
O consumo de energia é alto em modo inativo, mas surpreendentemente econômico sob carga, dada a configuração. O novo adaptador de energia GaN tem uma pegada muito reduzida e é capaz de fornecer 330 W sem problemas. A vida útil da bateria é decente para uma simples navegação na web e reprodução de vídeo com baixos níveis de brilho. Qualquer quantidade de tensão verá a vida útil da bateria afundar.
No total, por um preço solicitado de US$ 4.300, o Razer Blade 16 Early 2023 é um saco misto. Se você já é um fã da Razer, a atualização para as últimas especificações deve oferecer benefícios de desempenho tangíveis junto com todos os laptops Razer famosos por suas manobras.
Ou você pode economizar US$700 optando pelo Lâmina 16 Início 2023 RTX 4080. A diferença de desempenho entre estes dois SKUs não vale o preço extra pedido neste momento.
A nova Lâmina 16 também apelará para aqueles que priorizam a qualidade de exibição em relação a outros aspectos. Entretanto, se você estiver perseguindo os números de desempenho sozinho, a Lâmina 16 tem sérios concorrentes este ano que dão uma surra.
E nós estamos apenas começando!
Preço e Disponibilidade
Razer Blade 16 Early 2023 RTX 4090
- 03/23/2023 v7 (old)
Vaidyanathan Subramaniam
Transparência
A seleção dos dispositivos a serem analisados é feita pela nossa equipe editorial. A amostra de teste foi fornecida ao autor como empréstimo pelo fabricante ou varejista para fins desta revisão. O credor não teve influência nesta revisão, nem o fabricante recebeu uma cópia desta revisão antes da publicação. Não houve obrigação de publicar esta revisão. Como empresa de mídia independente, a Notebookcheck não está sujeita à autoridade de fabricantes, varejistas ou editores.
É assim que o Notebookcheck está testando
Todos os anos, o Notebookcheck analisa de forma independente centenas de laptops e smartphones usando procedimentos padronizados para garantir que todos os resultados sejam comparáveis. Desenvolvemos continuamente nossos métodos de teste há cerca de 20 anos e definimos padrões da indústria no processo. Em nossos laboratórios de teste, equipamentos de medição de alta qualidade são utilizados por técnicos e editores experientes. Esses testes envolvem um processo de validação em vários estágios. Nosso complexo sistema de classificação é baseado em centenas de medições e benchmarks bem fundamentados, o que mantém a objetividade.Price comparison

