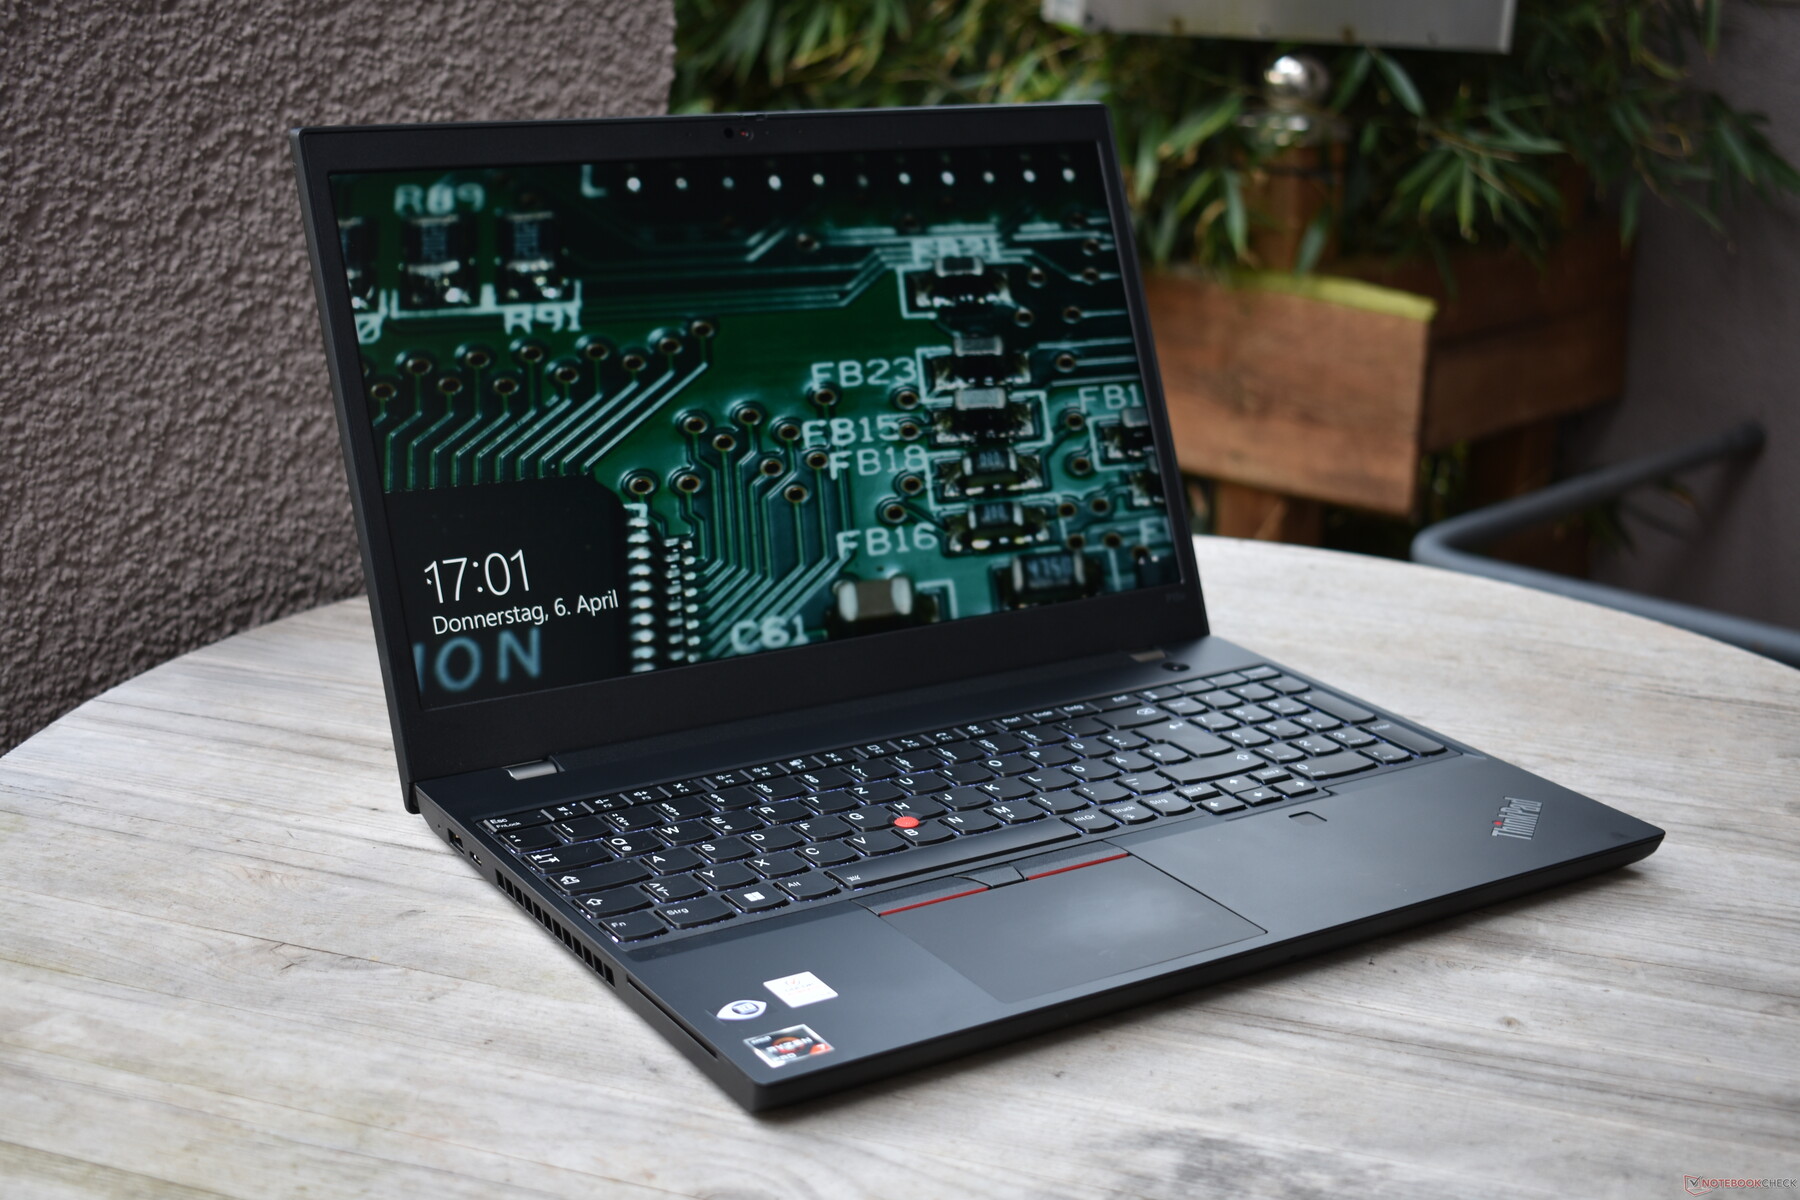
Análise do laptop Lenovo ThinkPad P15v G3 AMD: uma estação de trabalho ThinkPad agora com um Ryzen 6000H pela primeira vez
Se as estações de trabalho ThinkPad série P com GPUs RTX tinham algo em comum, eram os processadores Intel. Esses poderosos laptops corporativos nunca tinham sido fornecidos com CPUs AMD - até agora. O Lenovo ThinkPad P15v Gen 3 muda o status quo ao contar com os chips H45 da série Ryzen 6000. Ao mesmo tempo, não é um modelo top de linha, com o "v" no nome significando "valor". Assim, ele é mais uma variante econômica entre os laptops de estação de trabalho, com preço abaixo do Lenovo ThinkPad P16.
Possíveis concorrentes em comparação
Avaliação | Data | Modelo | Peso | Altura | Size | Resolução | Preço |
|---|---|---|---|---|---|---|---|
| 87.8 % v7 (old) | 04/2023 | Lenovo ThinkPad P15v G3 21EM001AGE R7 PRO 6850H, RTX A2000 Laptop GPU | 2.2 kg | 22.7 mm | 15.60" | 3840x2160 | |
| 88.2 % v7 (old) | 02/2023 | Lenovo ThinkPad P16 G1 21D6001DMB i7-12850HX, RTX A2000 Laptop GPU | 3 kg | 30.23 mm | 16.00" | 2560x1600 | |
| 86.2 % v7 (old) | 06/2022 | Lenovo ThinkPad P15v G2 21A9000XGE i7-11800H, T1200 Laptop GPU | 2.3 kg | 22.7 mm | 15.60" | 1920x1080 | |
| 87.4 % v7 (old) | 01/2023 | HP ZBook Power 15 G9 6B8C4EA i7-12700H, RTX A2000 Laptop GPU | 2 kg | 22.8 mm | 15.60" | 3840x2160 | |
| 88.4 % v7 (old) | 10/2022 | Dell Precision 7670 i7-12850HX, RTX A2000 Laptop GPU | 2.7 kg | 24.7 mm | 16.00" | 3840x2400 |
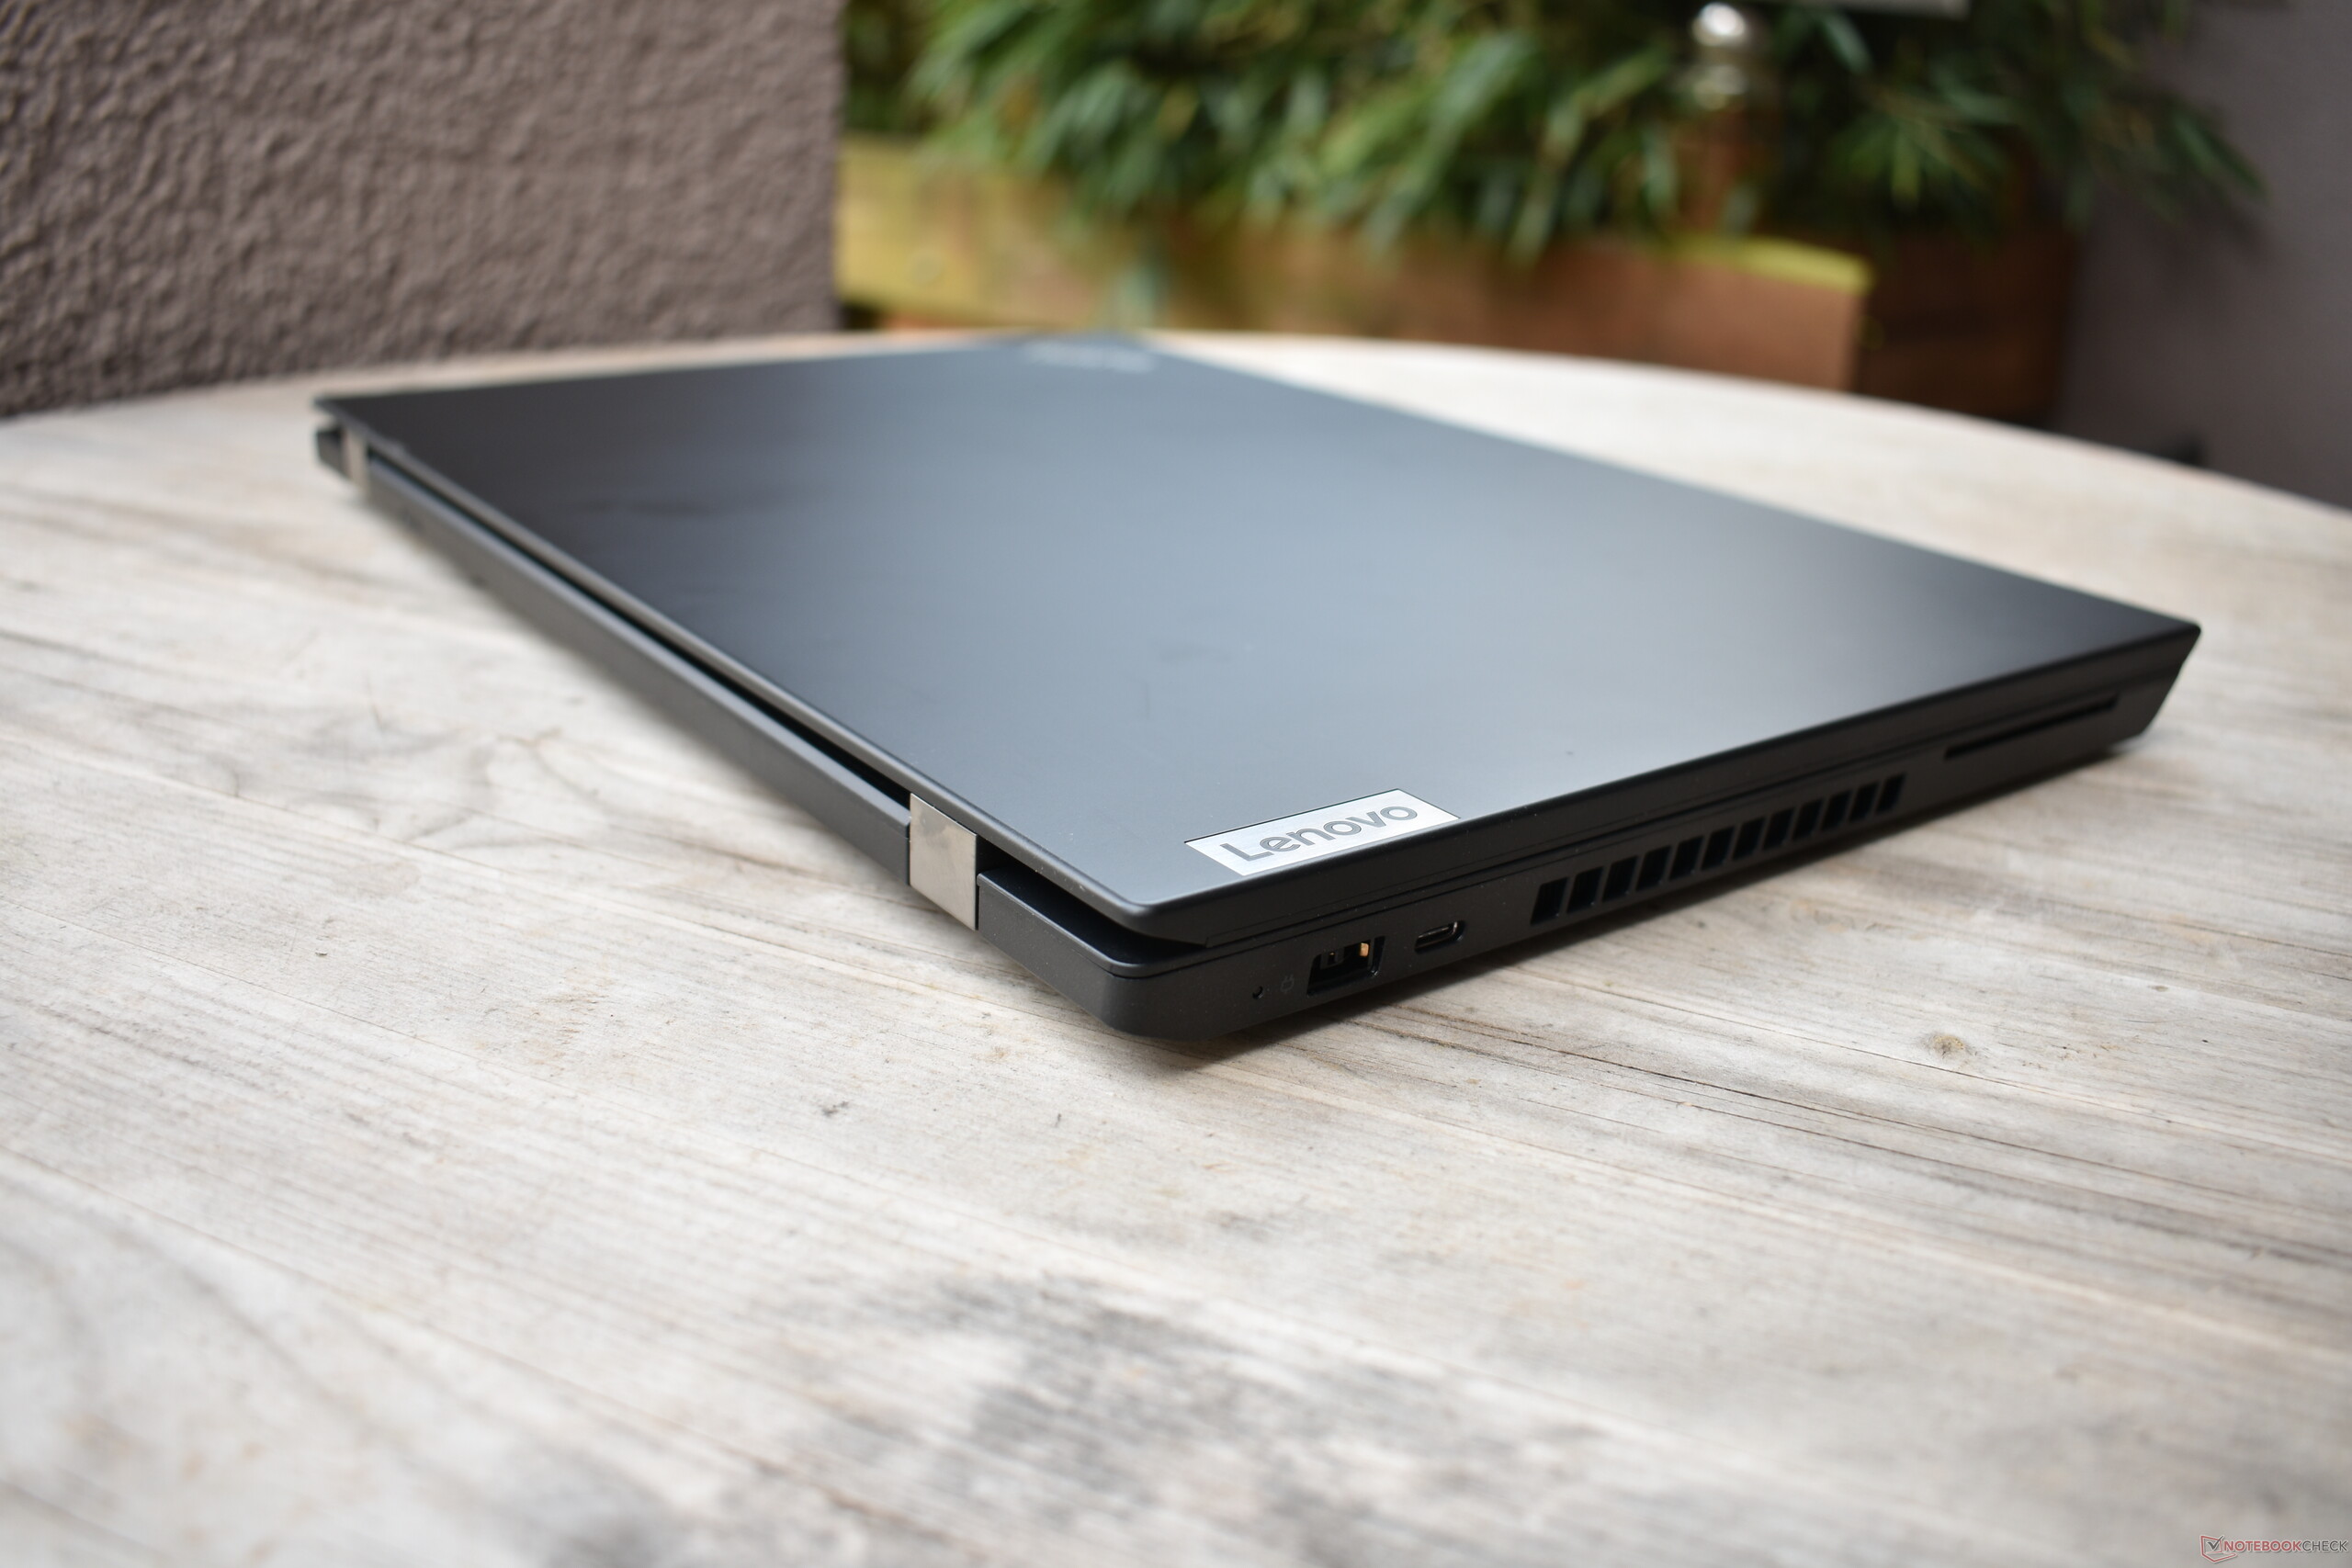
Estojo: Design rústico do ThinkPad em preto fosco
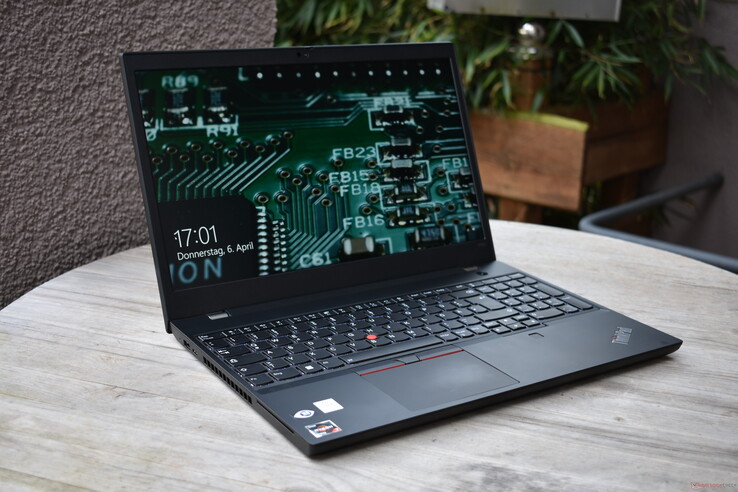
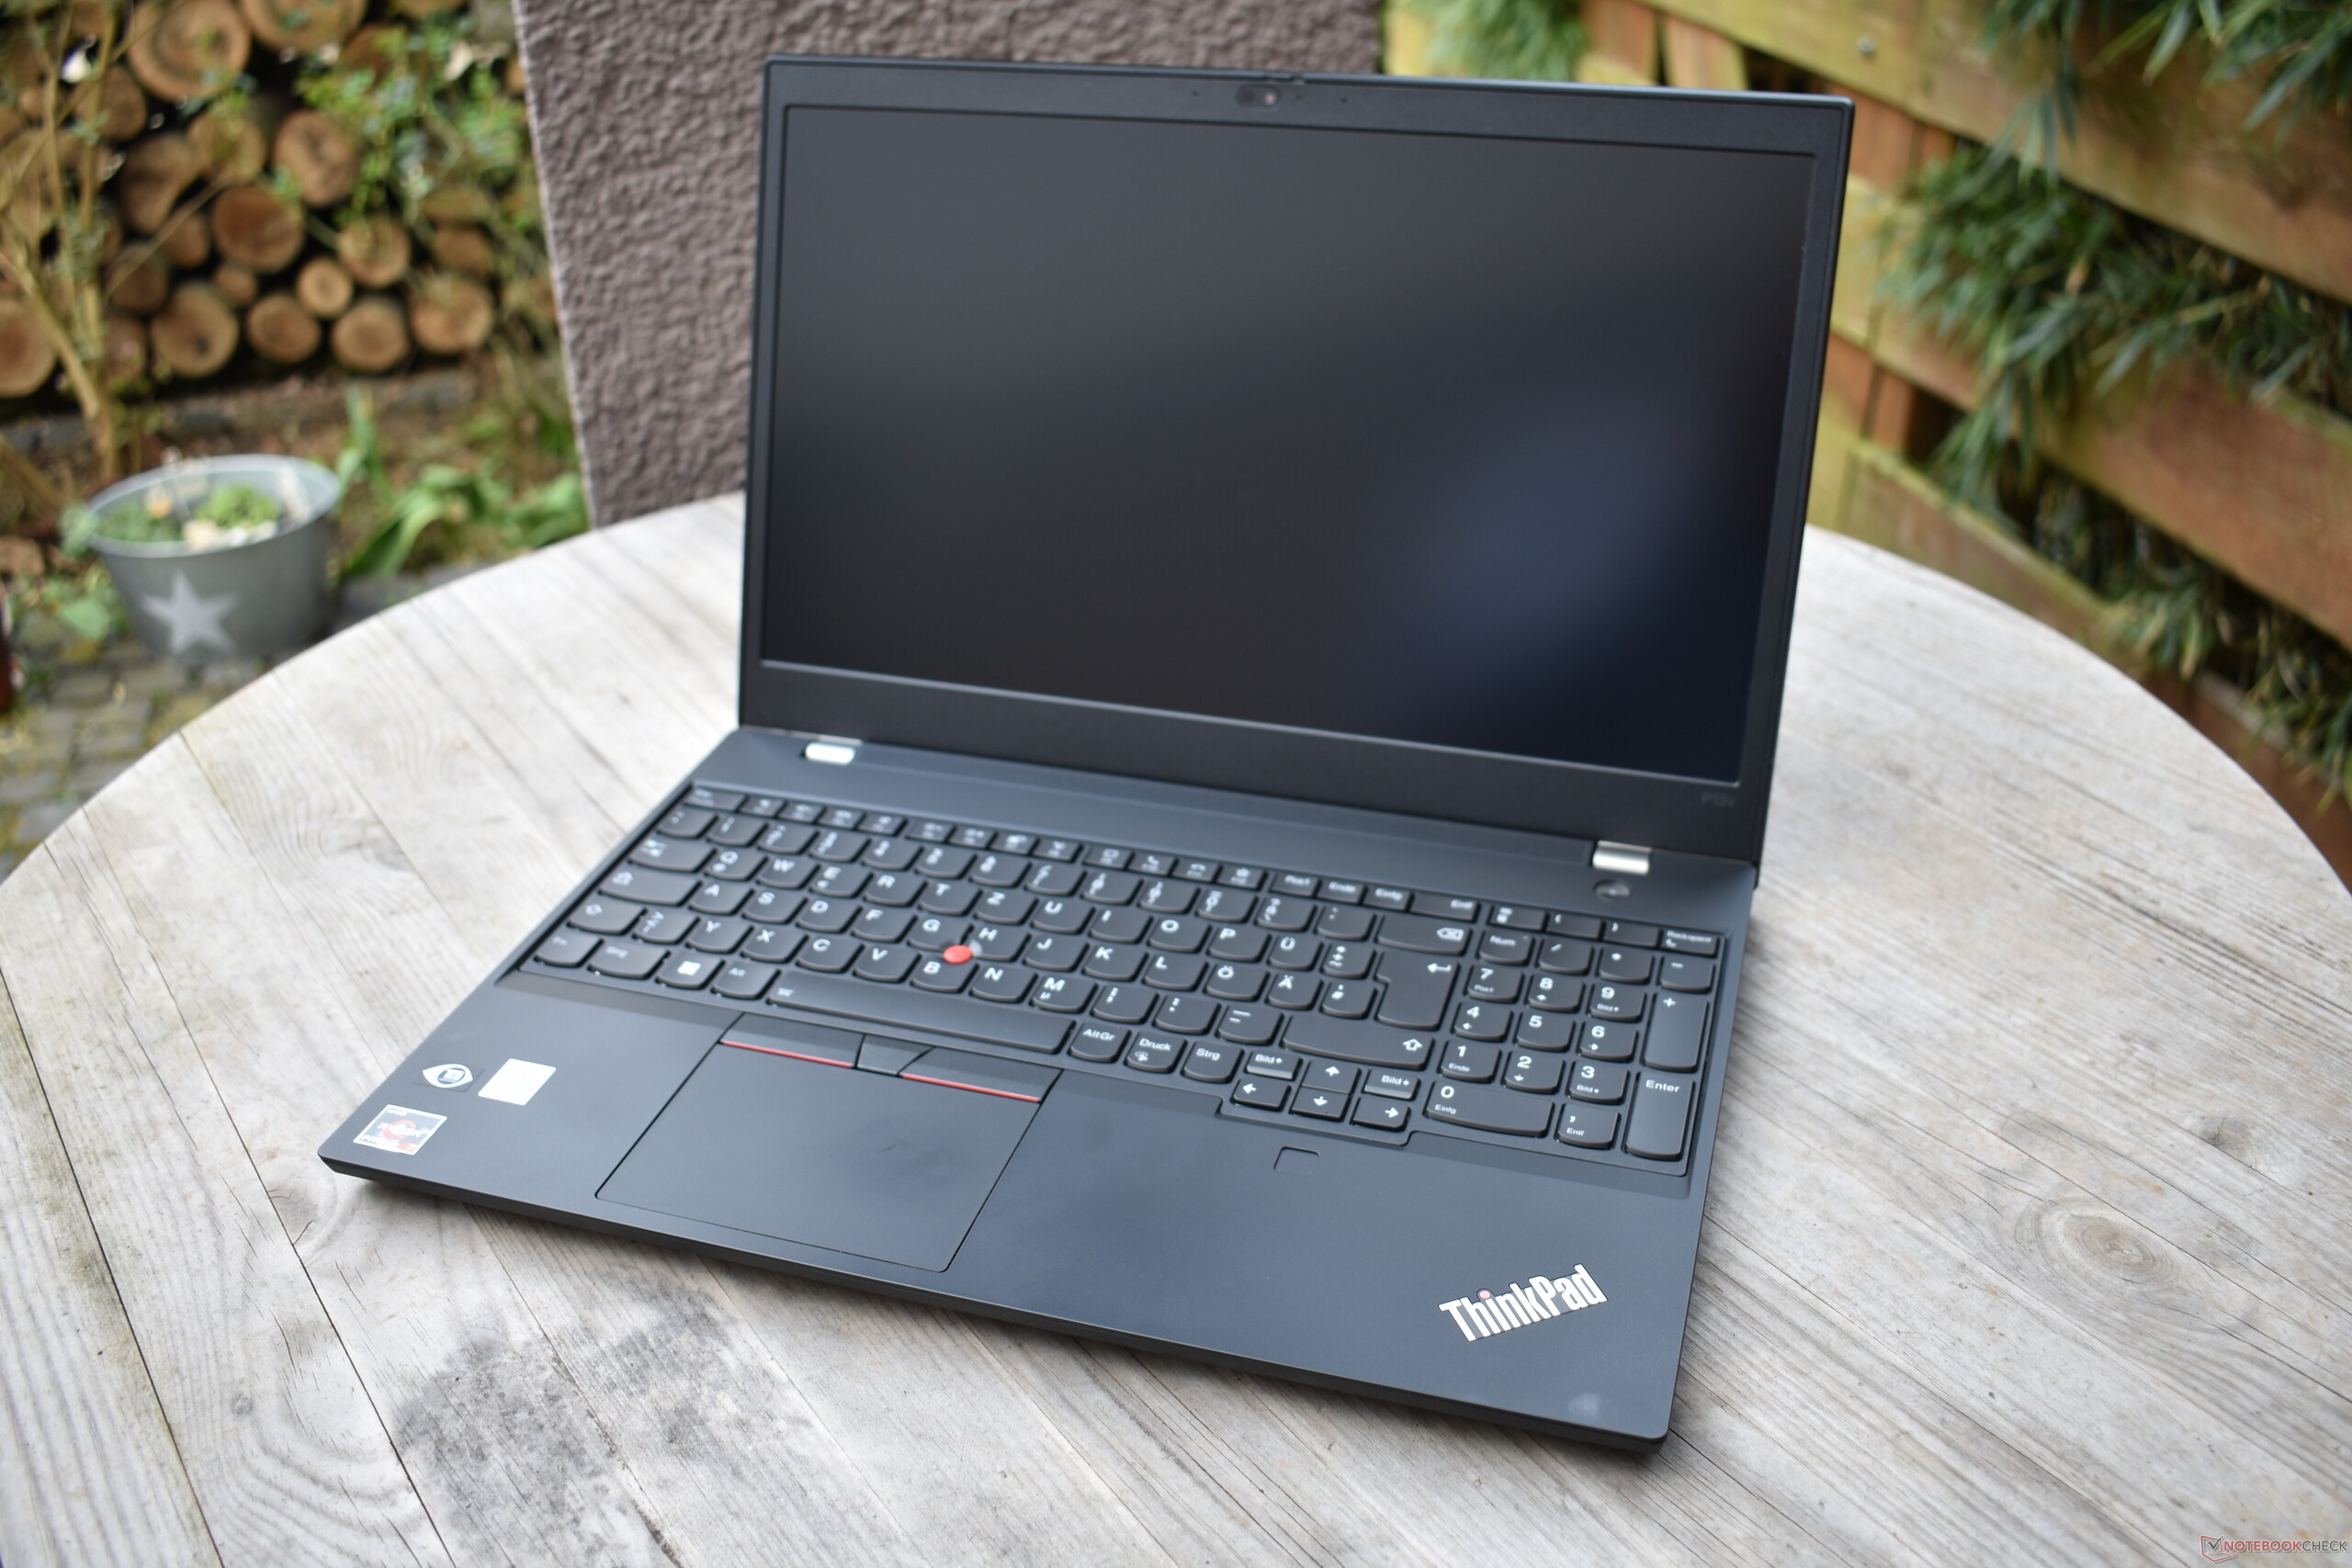
Entre os ThinkPads de 2022, o Lenovo ThinkPad P15v Gen 3 é uma fera especial: é baseado em um design mais antigo que apareceu pela primeira vez em 2020 como o Lenovo ThinkPad T15p ou P15v Gen 1. Por causa disso, ele se parece muito mais com modelos mais antigos como o ThinkPad T15 do que o atual ThinkPad T16. Isso se expressa, entre outras coisas, no formato 16:9, com engastes significativamente mais largos, especialmente abaixo da tela. O P15v Gen 3 também ainda vem em preto profundo, em vez do "Thunder Black" de cor antracite do ThinkPad T16. Portanto, dependendo de seu ponto de vista, o design parece um pouco antiquado ou muito clássico. O ThinkPad P15v Gen 3 parece um ThinkPad típico e se assemelha aos modelos mais antigos do ThinkPad com seu design muito quadrado e angular, que também contrasta fortemente com o ThinkPad P16, que adotou uma abordagem de design muito diferente.
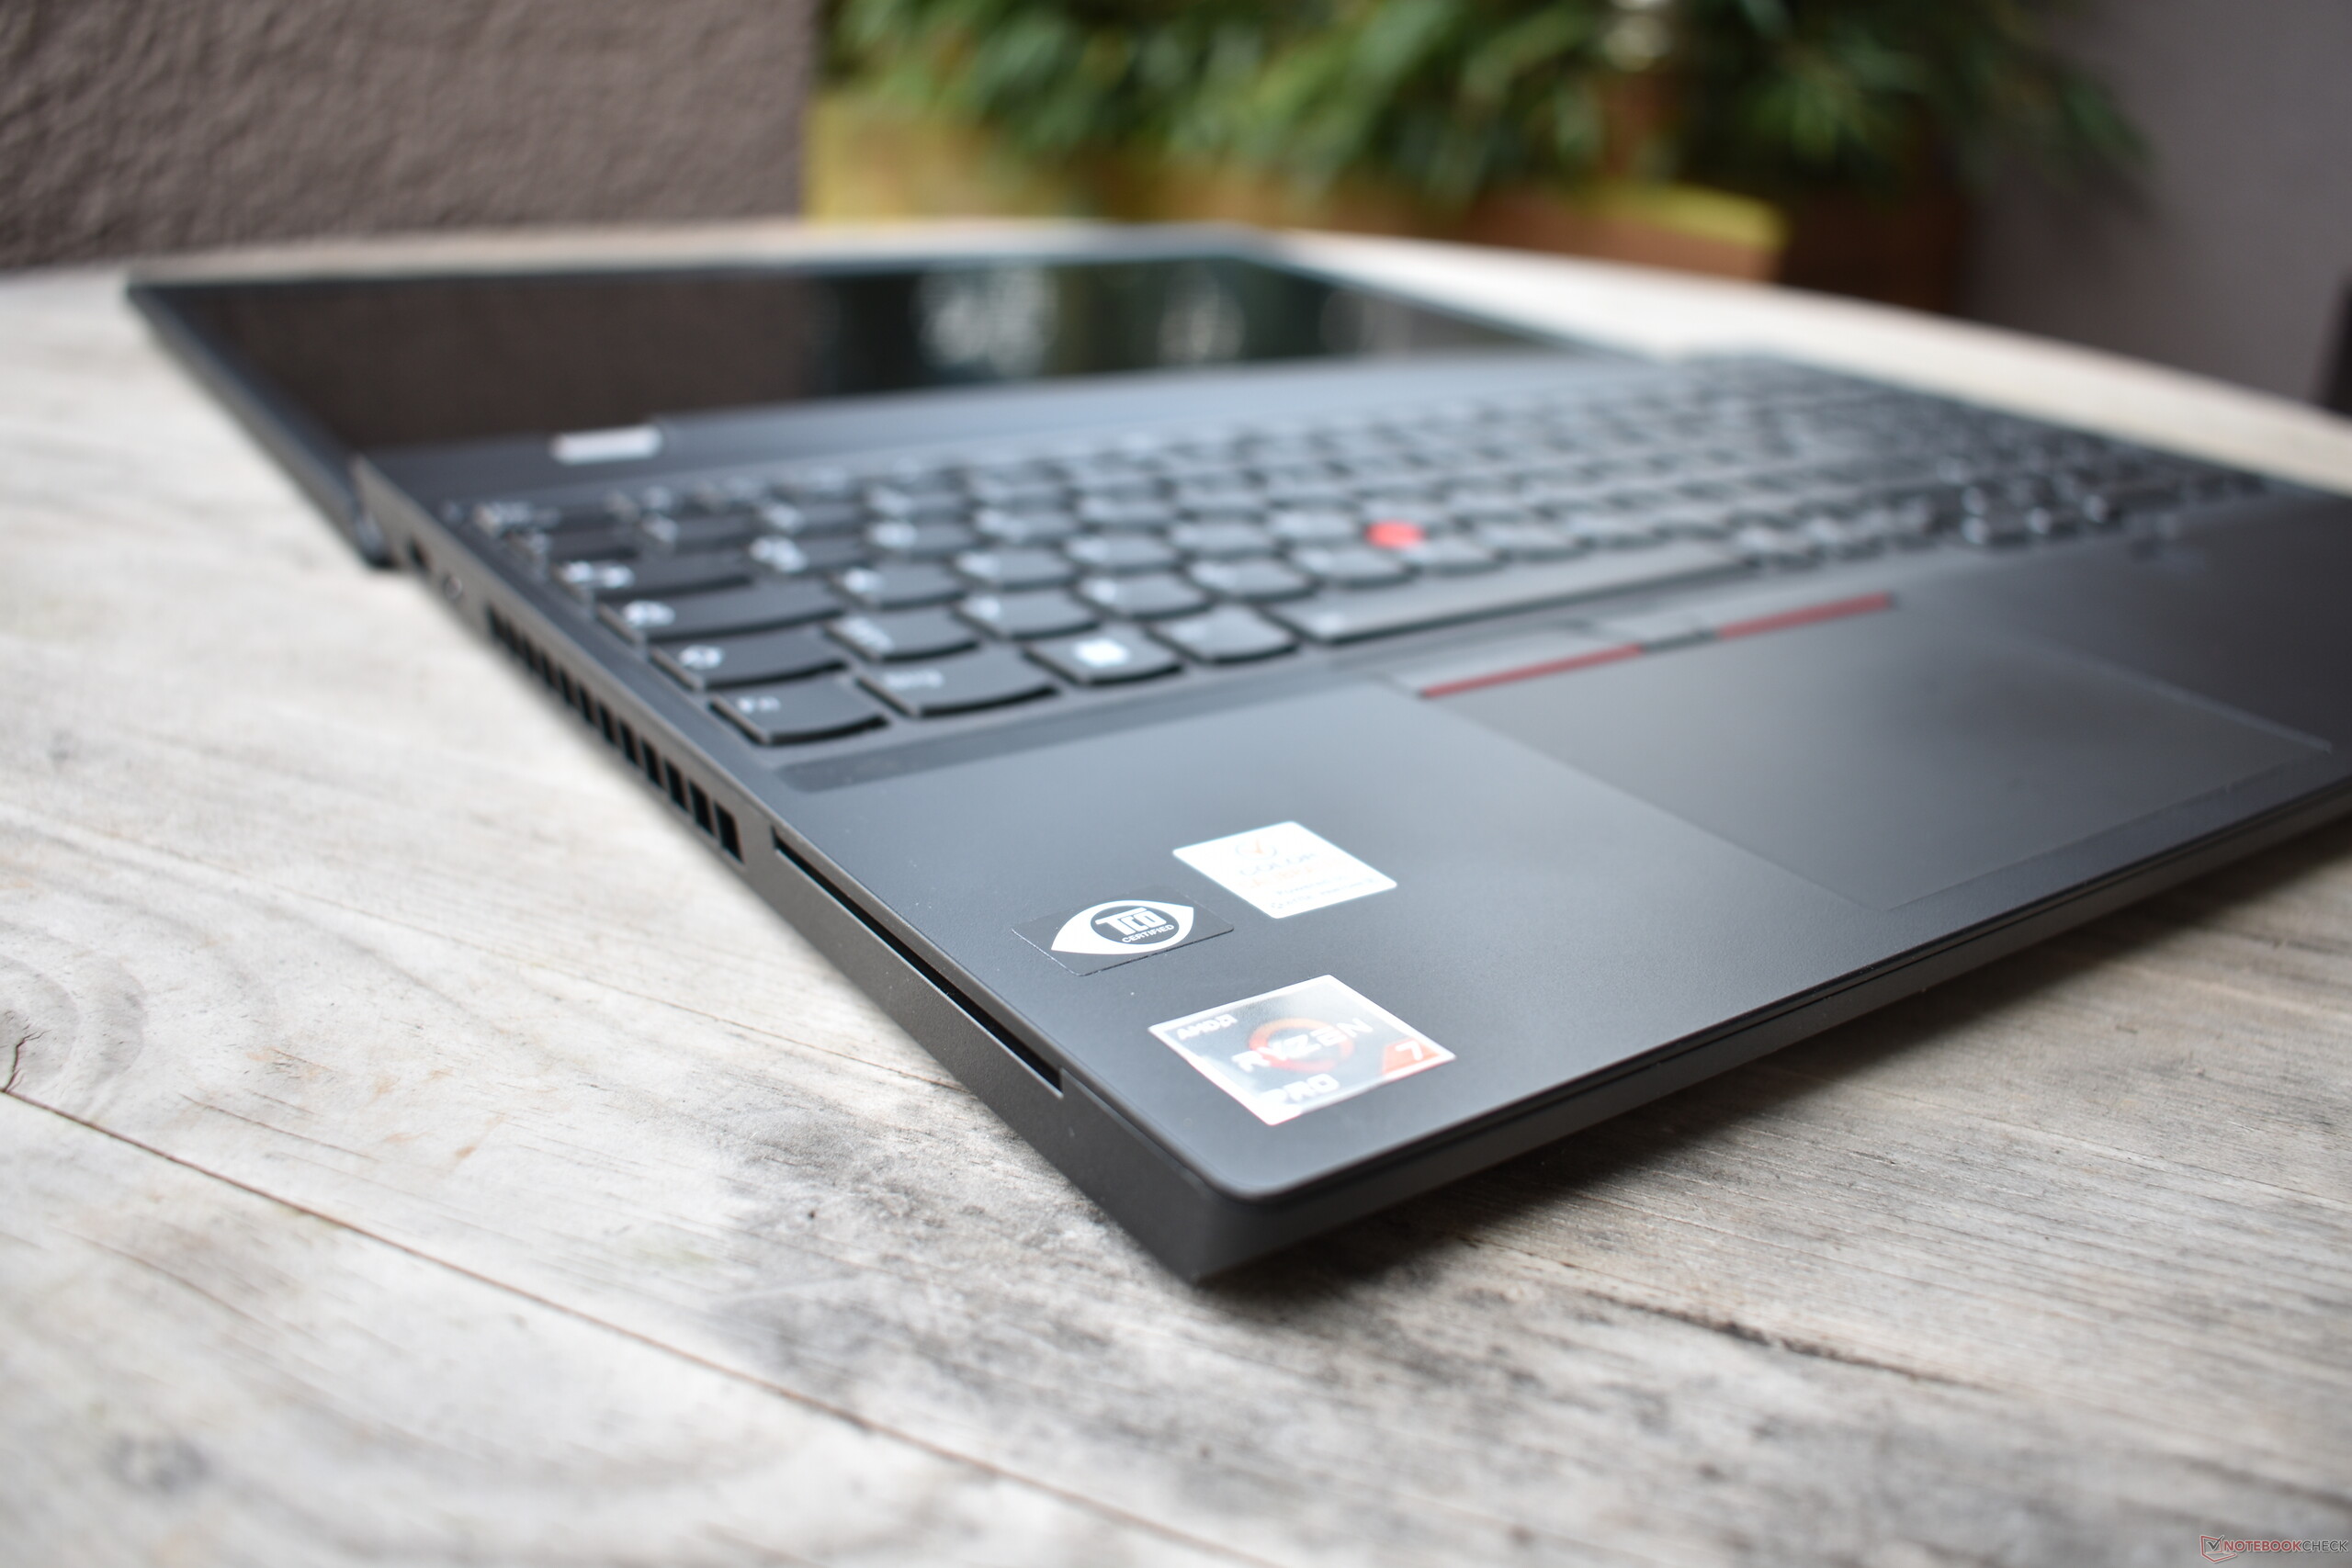
O design do ThinkPad P15v Gen 3 é muito semelhante ao da série ThinkPad T. A placa-mãe é fixada no apoio para as mãos ou na estrutura do teclado por baixo, que também é reforçada com uma estrutura de magnésio. Isso garante uma alta estabilidade na área do teclado, somente o plástico acima do leitor de cartões SD é um pouco flexível. O acabamento é absolutamente impecável, mas a sensação fica atrás de outros ThinkPads: infelizmente, o gabinete é feito de plástico ABS na parte externa. A área do apoio para as mãos tem um revestimento aveludado, a parte inferior e as bordas da tela são ásperas e a tampa da tela é feita de plástico liso sem revestimento. Todas as superfícies são relativamente sensíveis à sujeira. Falando da tampa da tela: O gabinete é relativamente fácil de torcer, embora a Lenovo esteja usando uma capa bastante grossa. A pressão na parte traseira da tela, no entanto, não parece afetar a tela.
As duas grandes dobradiças suspensas com tampas de metal têm uma boa aderência à tampa, permitindo que ela seja aberta em até 180 graus, e a tela também pode ser aberta com uma mão.
Em comparação com o ThinkPad P16, o Lenovo ThinkPad P15v Gen 3 AMD é uma opção muito mais móvel, pesando cerca de 0,8 kg a menos e com um gabinete significativamente mais fino. O principal concorrente da HP, o HP ZBook Power 15 G9, é um pouco mais leve e compacto.
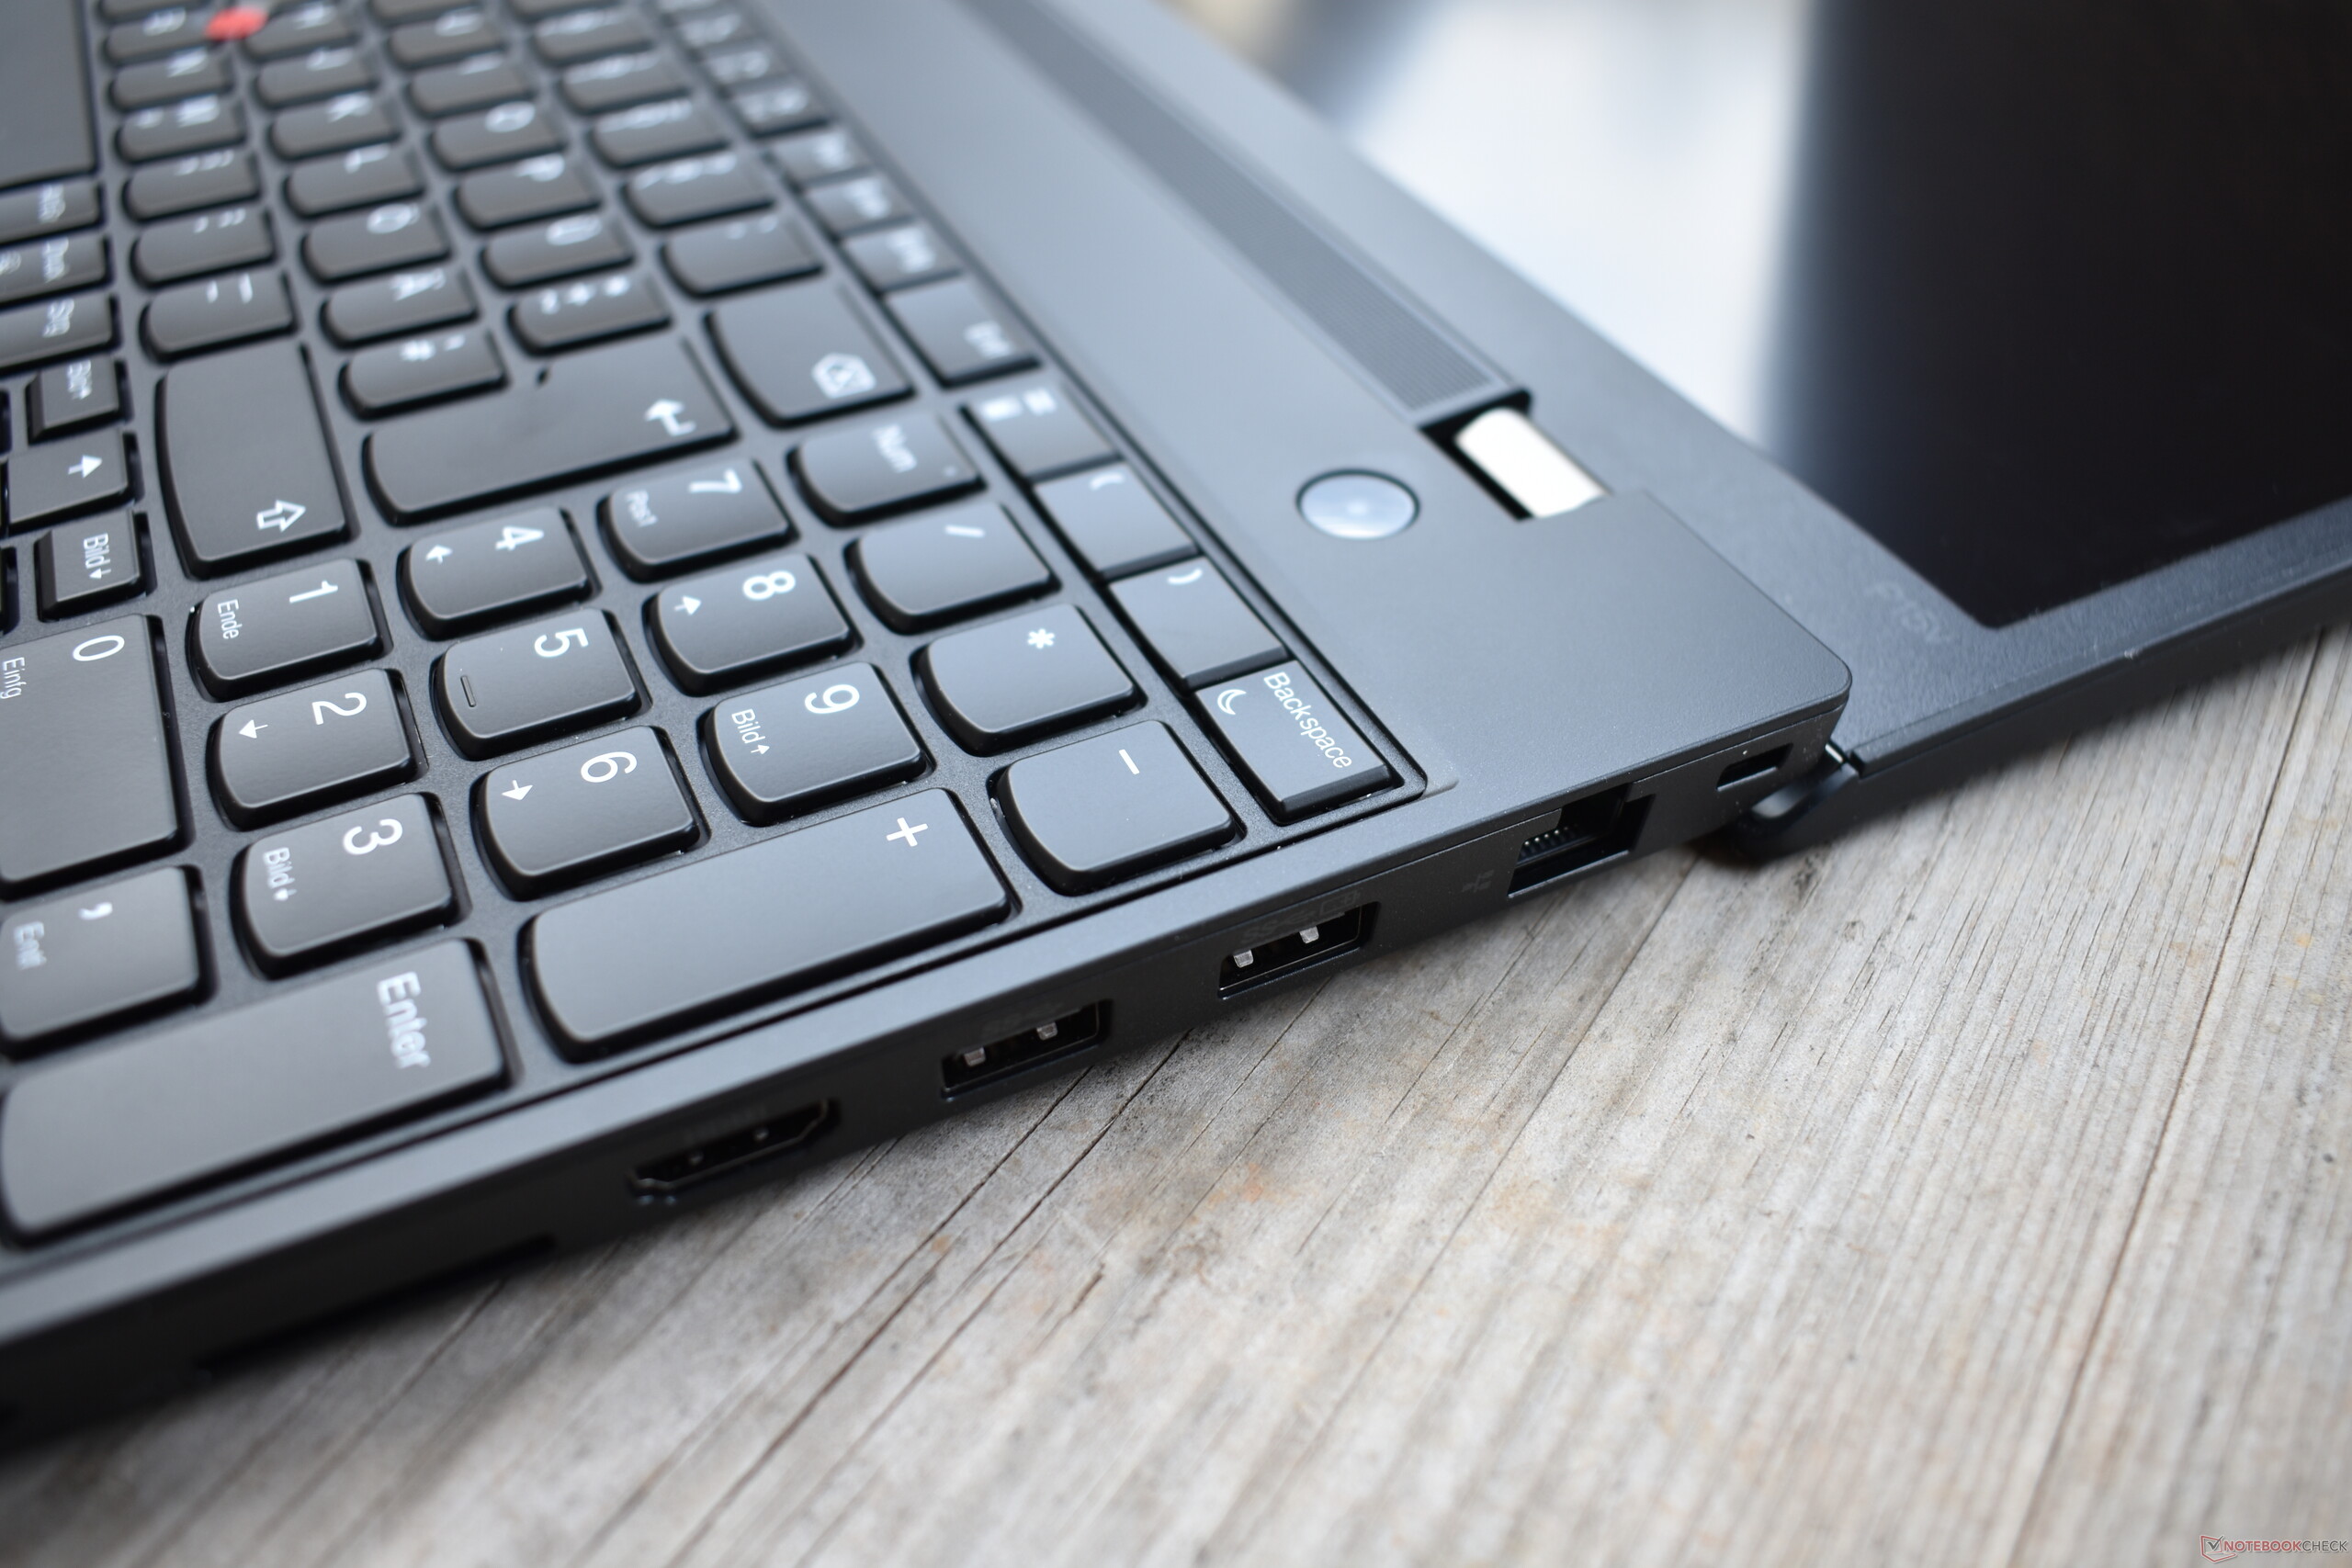
Recursos: Muita conectividade, mas sem WWAN
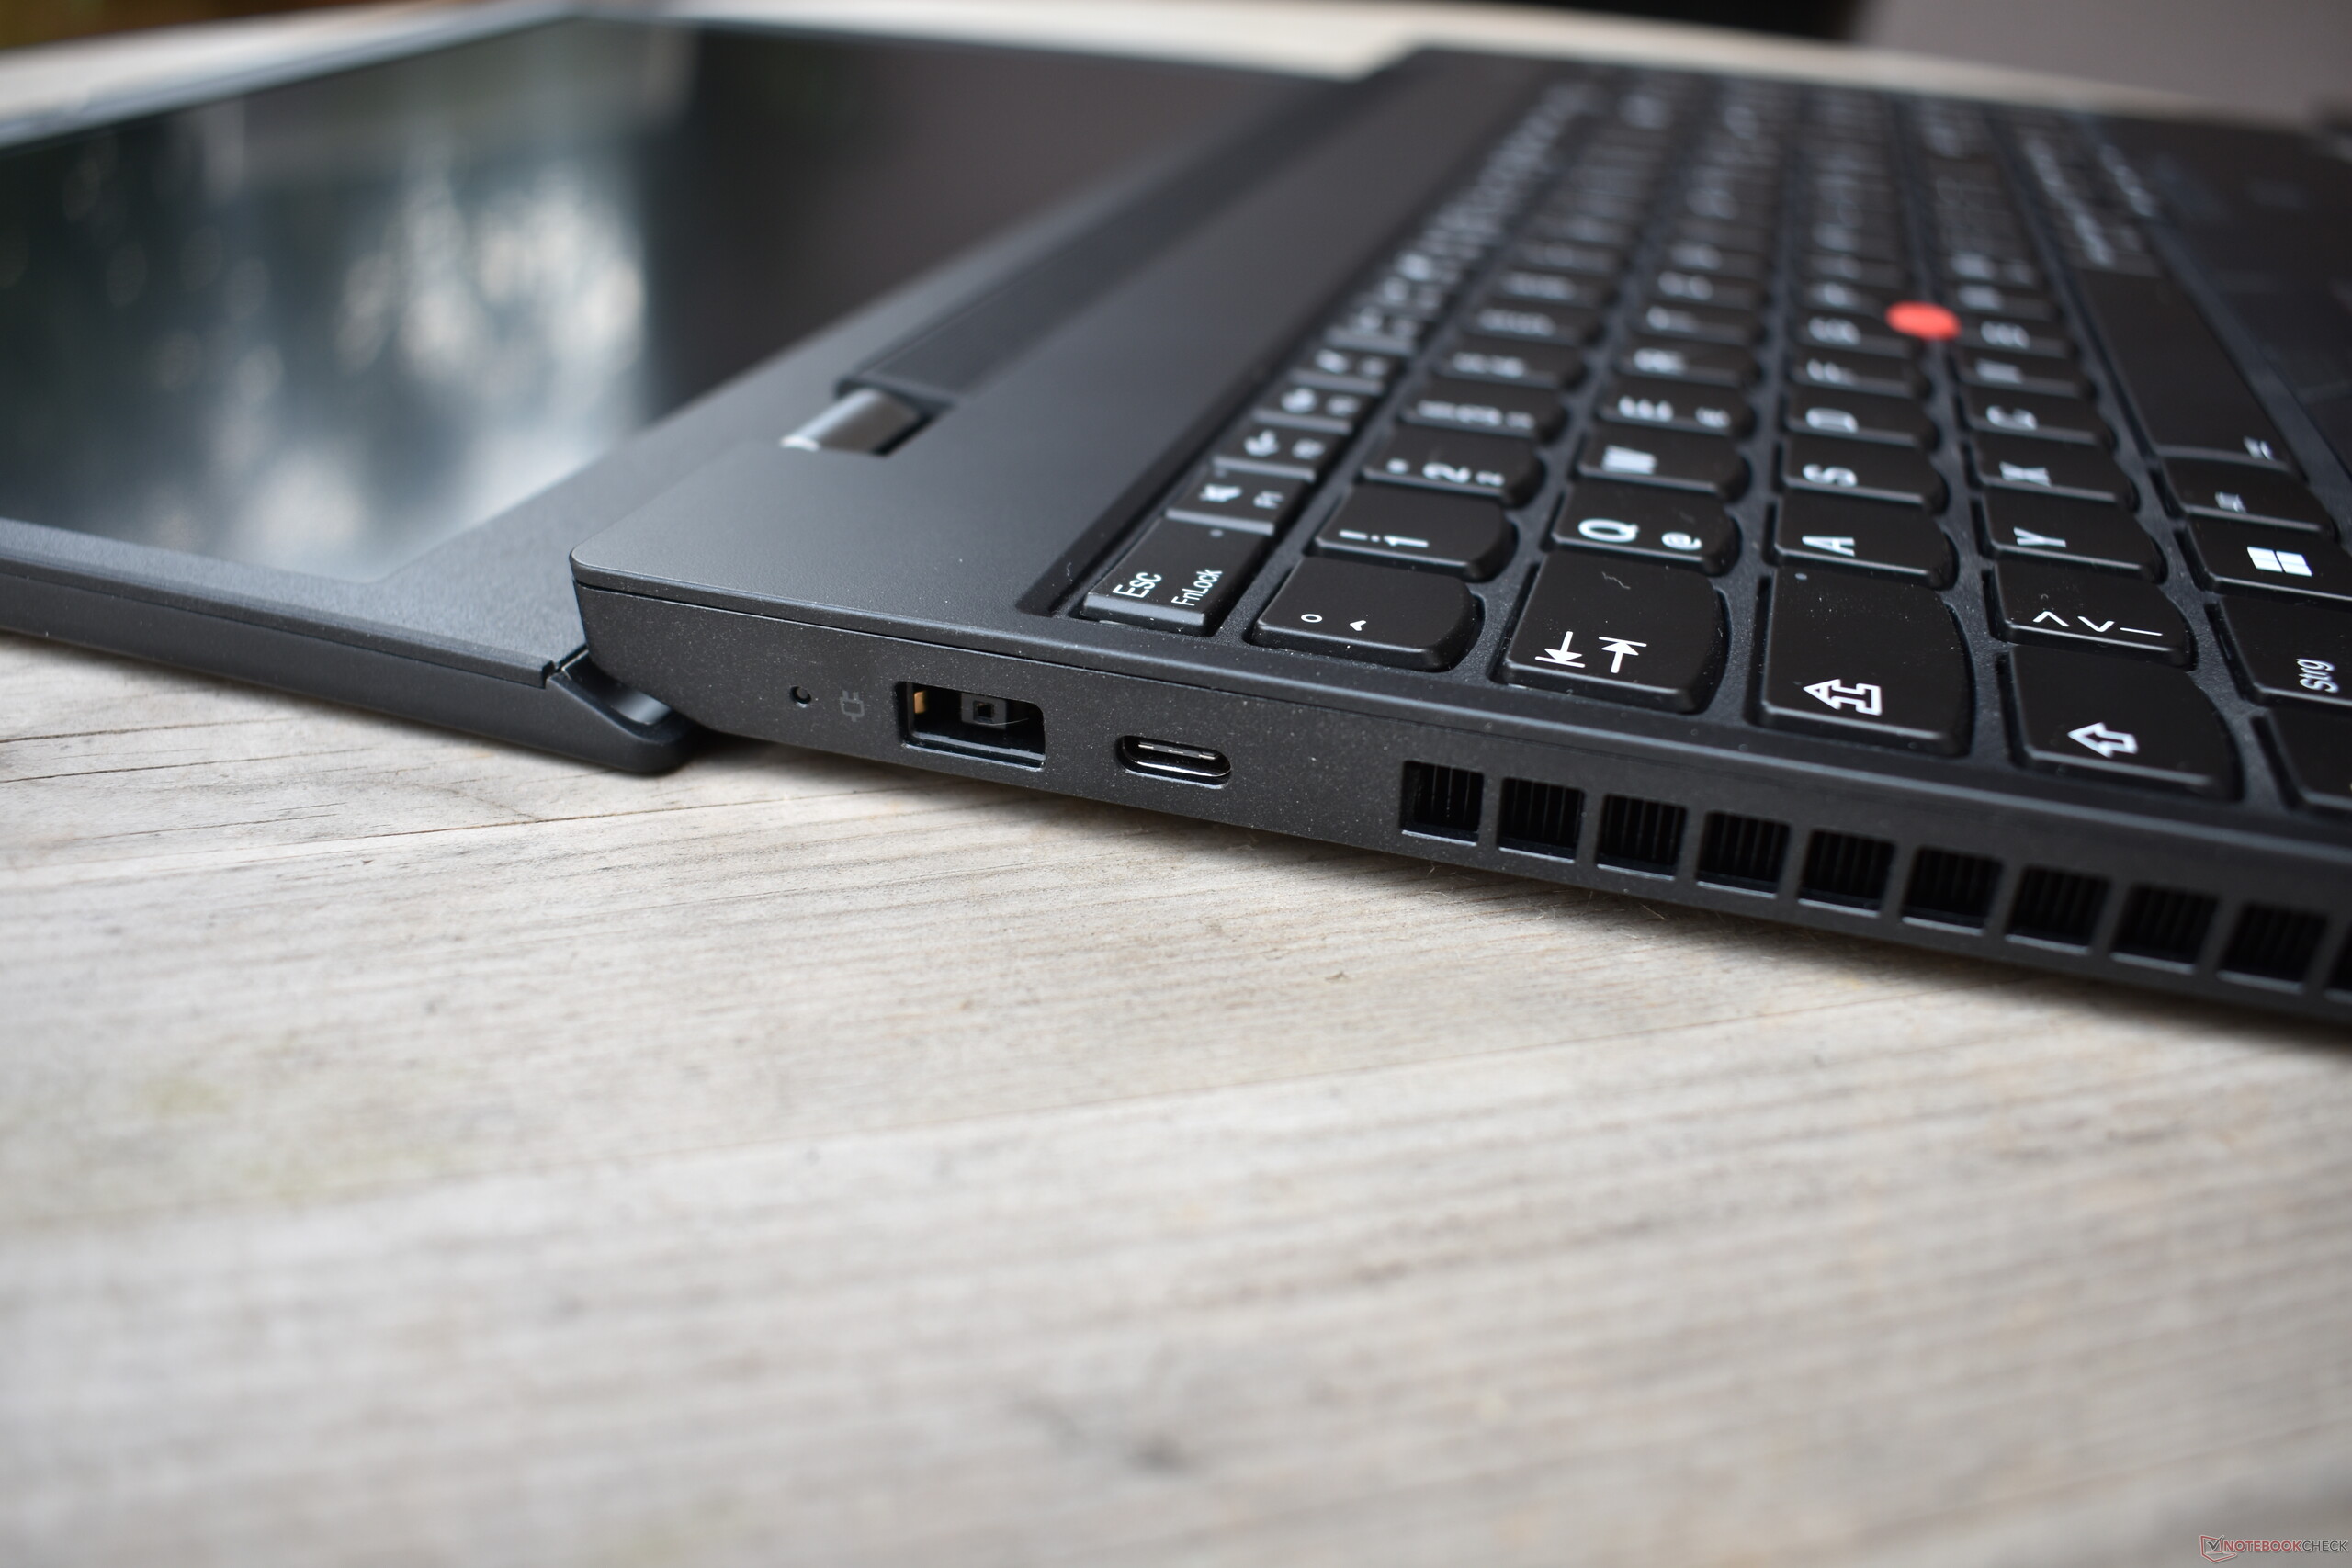
A Lenovo não mudou muito as opções de conectividade desde que o ThinkPad P15v foi lançado em 2020. Uma característica especial da versão AMD é a presença de USB4 em vez de Thunderbolt - o fato de haver apenas uma conexão desse tipo é um pouco limitante. Em compensação, o ThinkPad P15v G3 ainda tem Ethernet Rj45, que não encontramos no ThinkPad P16 maior.
Leitor de cartão SD
Ao contrário do HP ZBook Power 15, o ThinkPad P15v tem um leitor de cartão SD. Isso proporcionou altas velocidades em nosso teste de leitura com o cartão de referência AV Pro 128 GB V60. Ao gravar dados, a velocidade cai pela metade, mas ainda é suficiente para superar o ThinkPad P16, que é mais caro.
| SD Card Reader | |
| average JPG Copy Test (av. of 3 runs) | |
| Dell Precision 7670 (Toshiba Exceria Pro SDXC 64 GB UHS-II) | |
| Média da turma Workstation (49.6 - 681, n=14, últimos 2 anos) | |
| Lenovo ThinkPad P15v G2 21A9000XGE | |
| Lenovo ThinkPad P15v G3 21EM001AGE (AV Pro V60) | |
| Lenovo ThinkPad P16 G1 21D6001DMB (AV Pro V60) | |
| maximum AS SSD Seq Read Test (1GB) | |
| Lenovo ThinkPad P15v G2 21A9000XGE | |
| Média da turma Workstation (87.6 - 1455, n=14, últimos 2 anos) | |
| Lenovo ThinkPad P15v G3 21EM001AGE (AV Pro V60) | |
| Dell Precision 7670 (Toshiba Exceria Pro SDXC 64 GB UHS-II) | |
| Lenovo ThinkPad P16 G1 21D6001DMB (AV Pro V60) | |
Comunicação
Como todos os atuais ThinkPads Lenovo baseados em AMD, o P15v Gen 3 conta com uma solução 2x2 WiFi 6E da Qualcomm. Até agora, esse módulo WiFi teve um bom desempenho em nossos testes, o que tornou a baixa estabilidade do sinal do ThinkPad P15v G3 ainda mais surpreendente para nós. Houve quedas de desempenho repetidas e reproduzíveis tanto no envio quanto no recebimento de dados. Ao receber dados, esse fenômeno não foi tão grave quanto ao transmitir, onde o módulo da Qualcomm estava longe de seu desempenho máximo.
Webcam
O ThinkPad P15v G3 é um dos últimos ThinkPads a ser vendido exclusivamente com webcams de 720p. A imagem não é particularmente boa, e uma solução externa seria muito melhor para chamadas com vídeo. A câmera instalada aqui deve ser usada como último recurso.


Segurança
A Lenovo não economiza quando se trata de segurança: Uma trava Kensington está disponível, bem como um leitor de impressões digitais dedicado no apoio para as mãos, um leitor de cartão inteligente ou a abertura mecânica da câmera. O BIOS tem recursos como detecção de violação e Computrace, e há também um chip TPM 2.0 dedicado.
Acessórios
Além do adaptador de energia com a porta proprietária de ponta fina, nenhum outro acessório está incluído. O ThinkPad Thunderbolt 4 Workstation Dock é um dock específico para cada modelo.
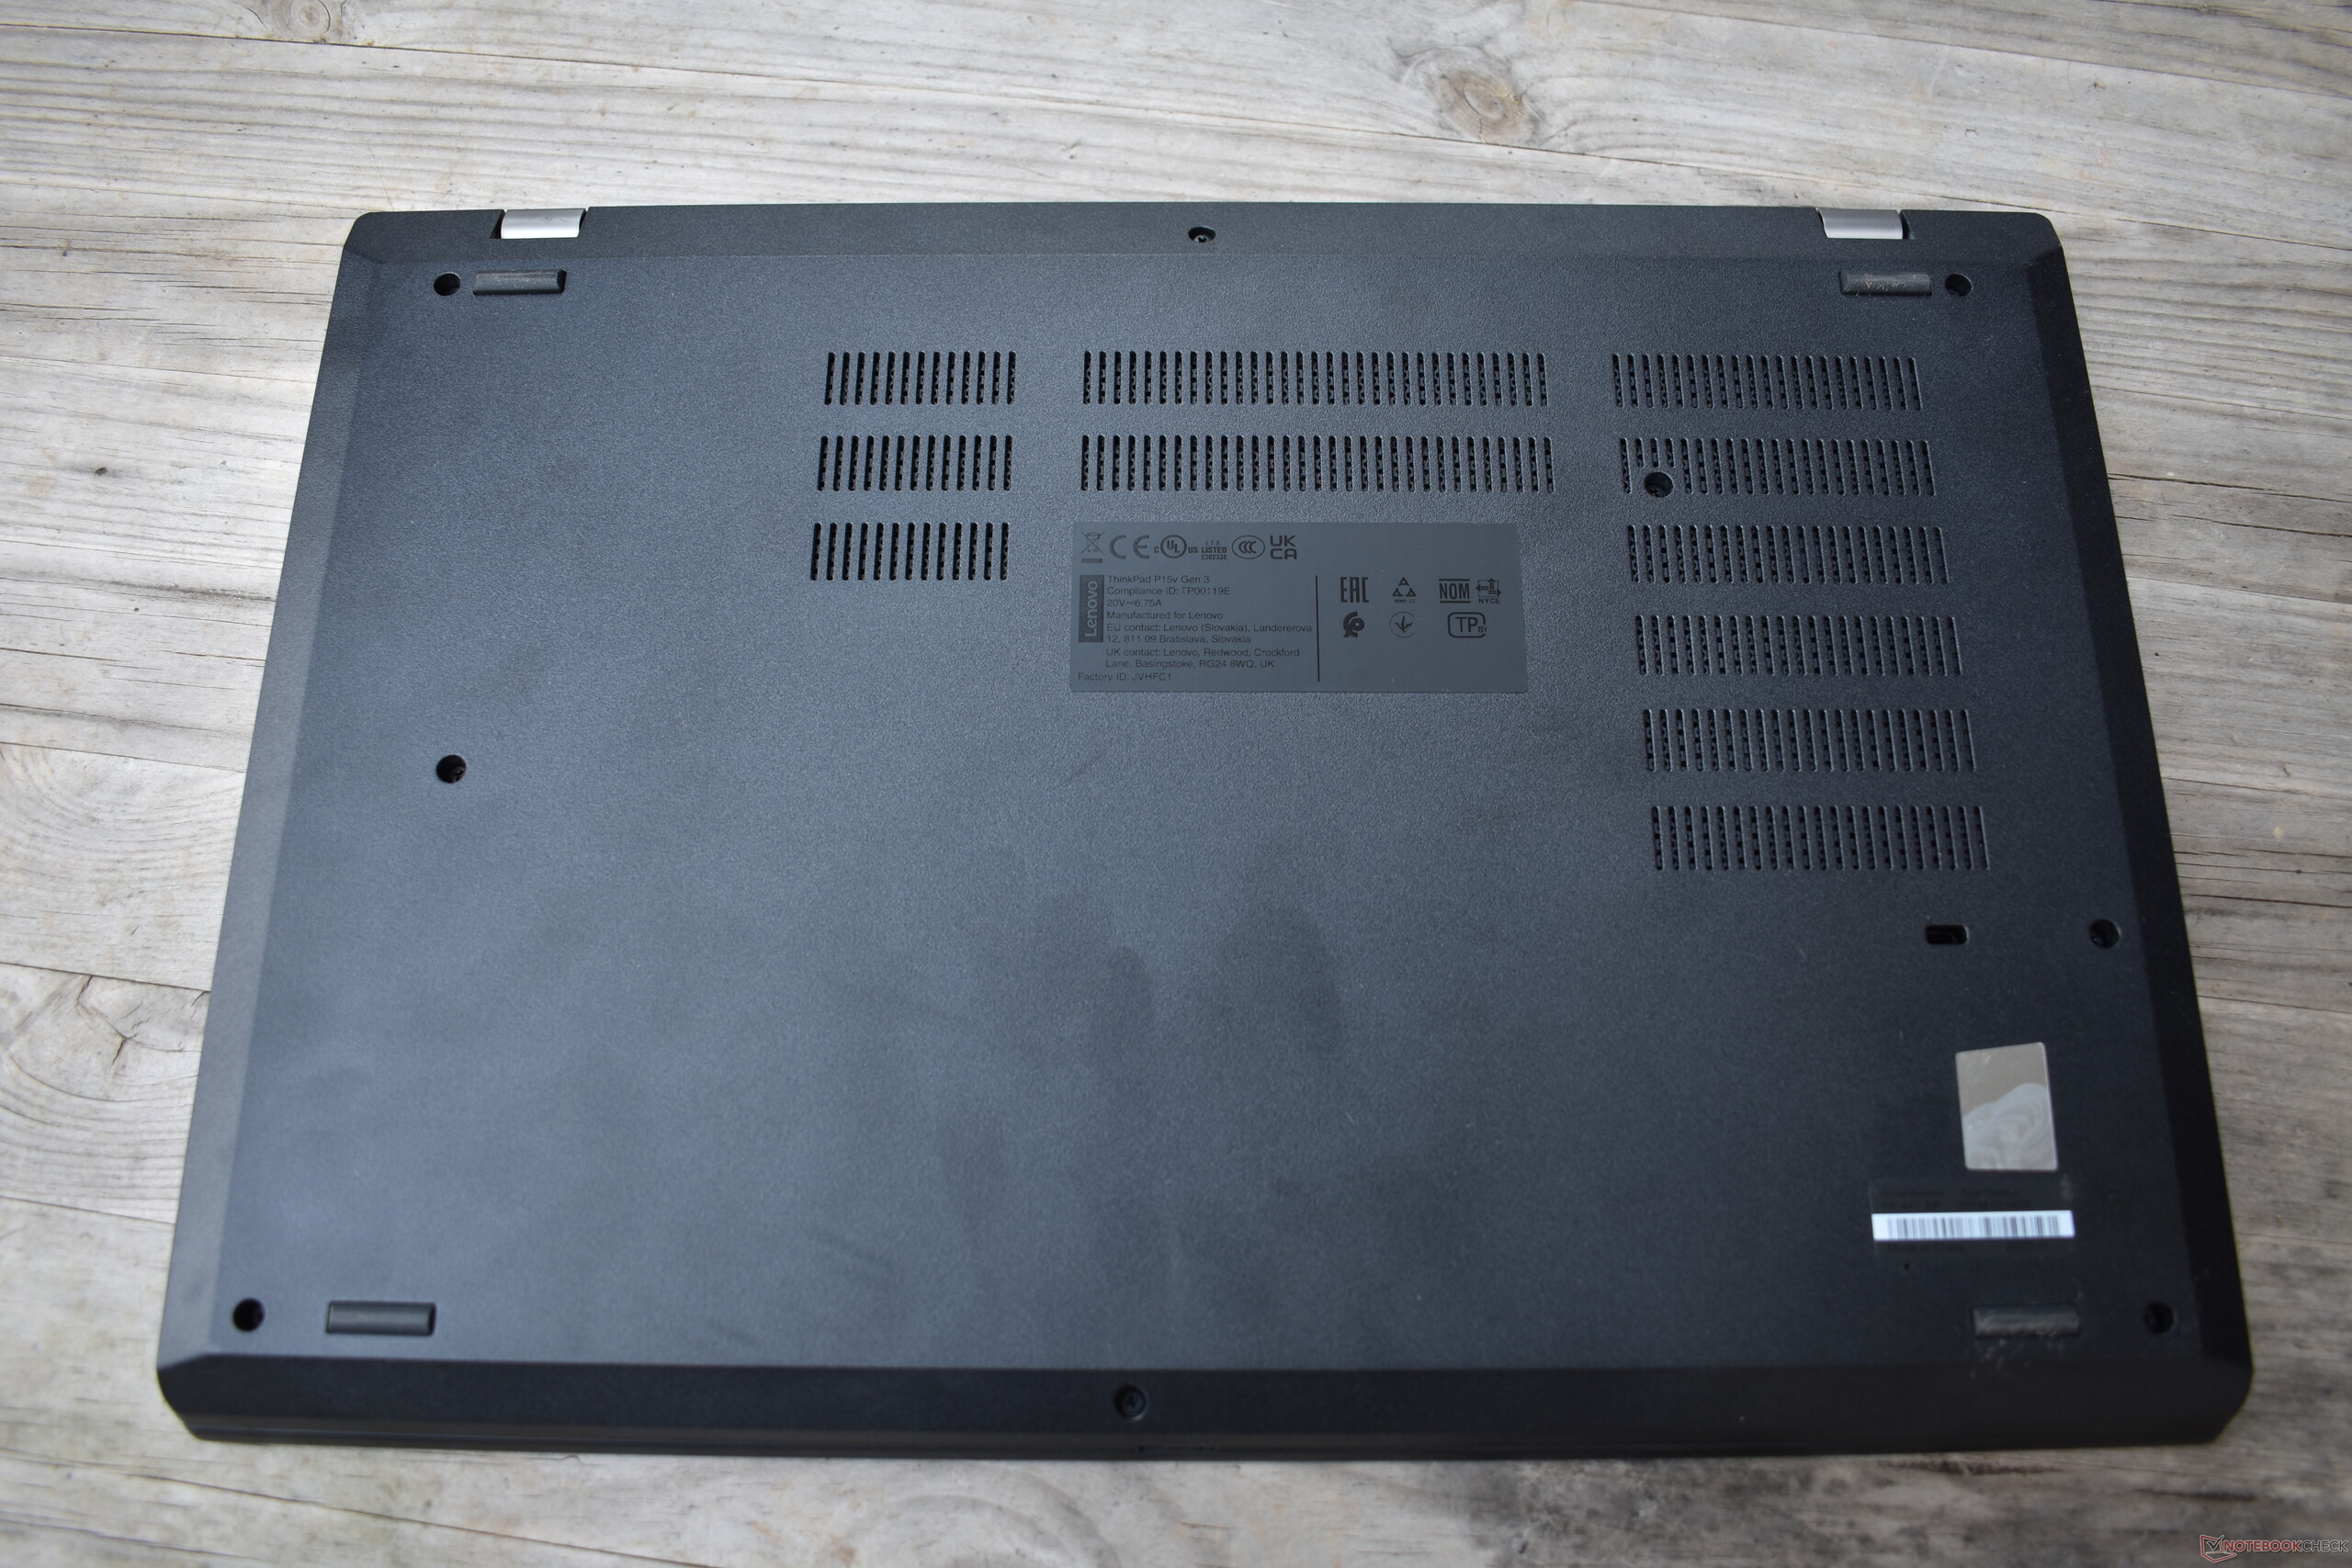
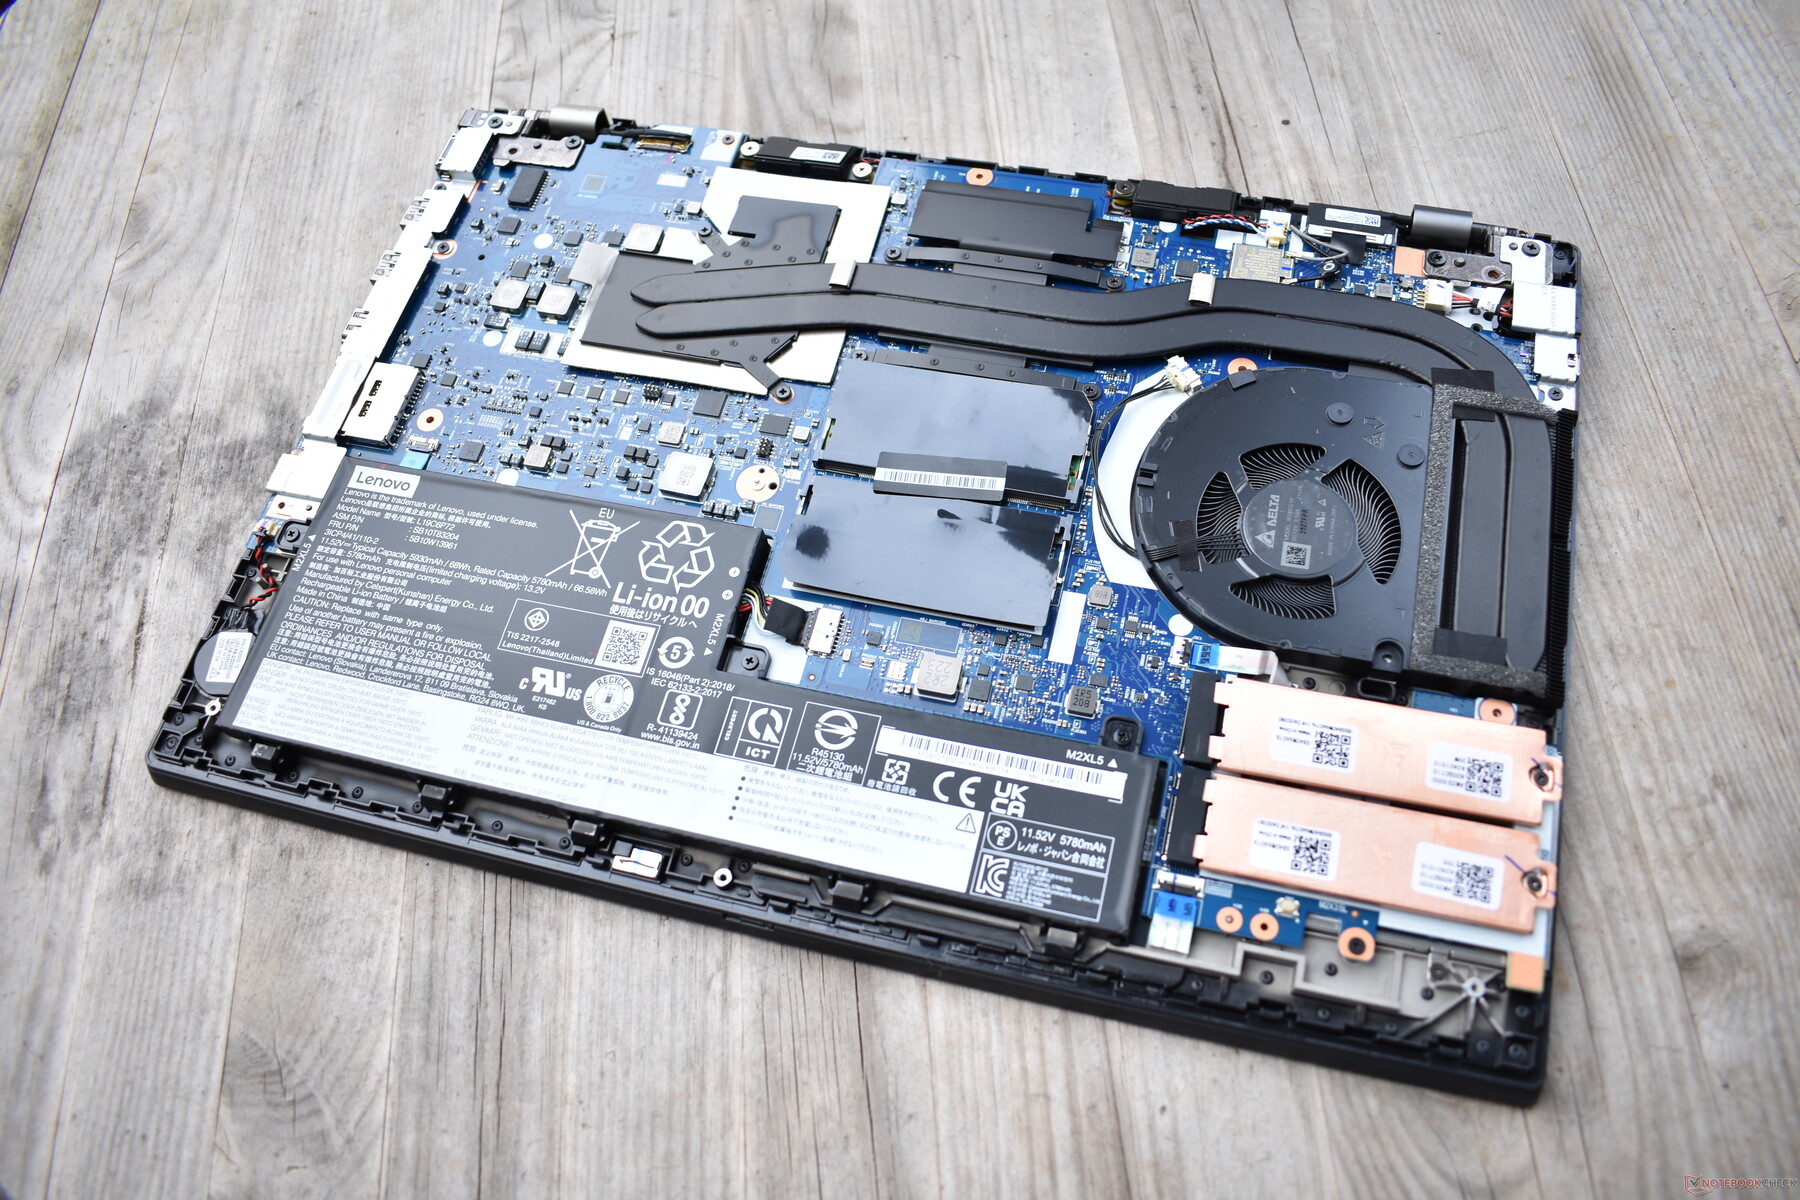
Manutenção
O acesso ao funcionamento interno do dispositivo é possível através da placa de base removível, que pode ser retirada depois de soltar nove parafusos e alguns clipes na parte traseira. O ThinkPad P15v G3 é muito atualizável, e somente o processador e o módulo WiFi são soldados. Há dois slots M.2 2280 para SSDs, dois slots SO-DIMM para até 64 GB de RAM e a bateria e o sistema de resfriamento também podem ser reparados. Por outro lado, a WWAN não é suportada e não há nenhum slot correspondente disponível.
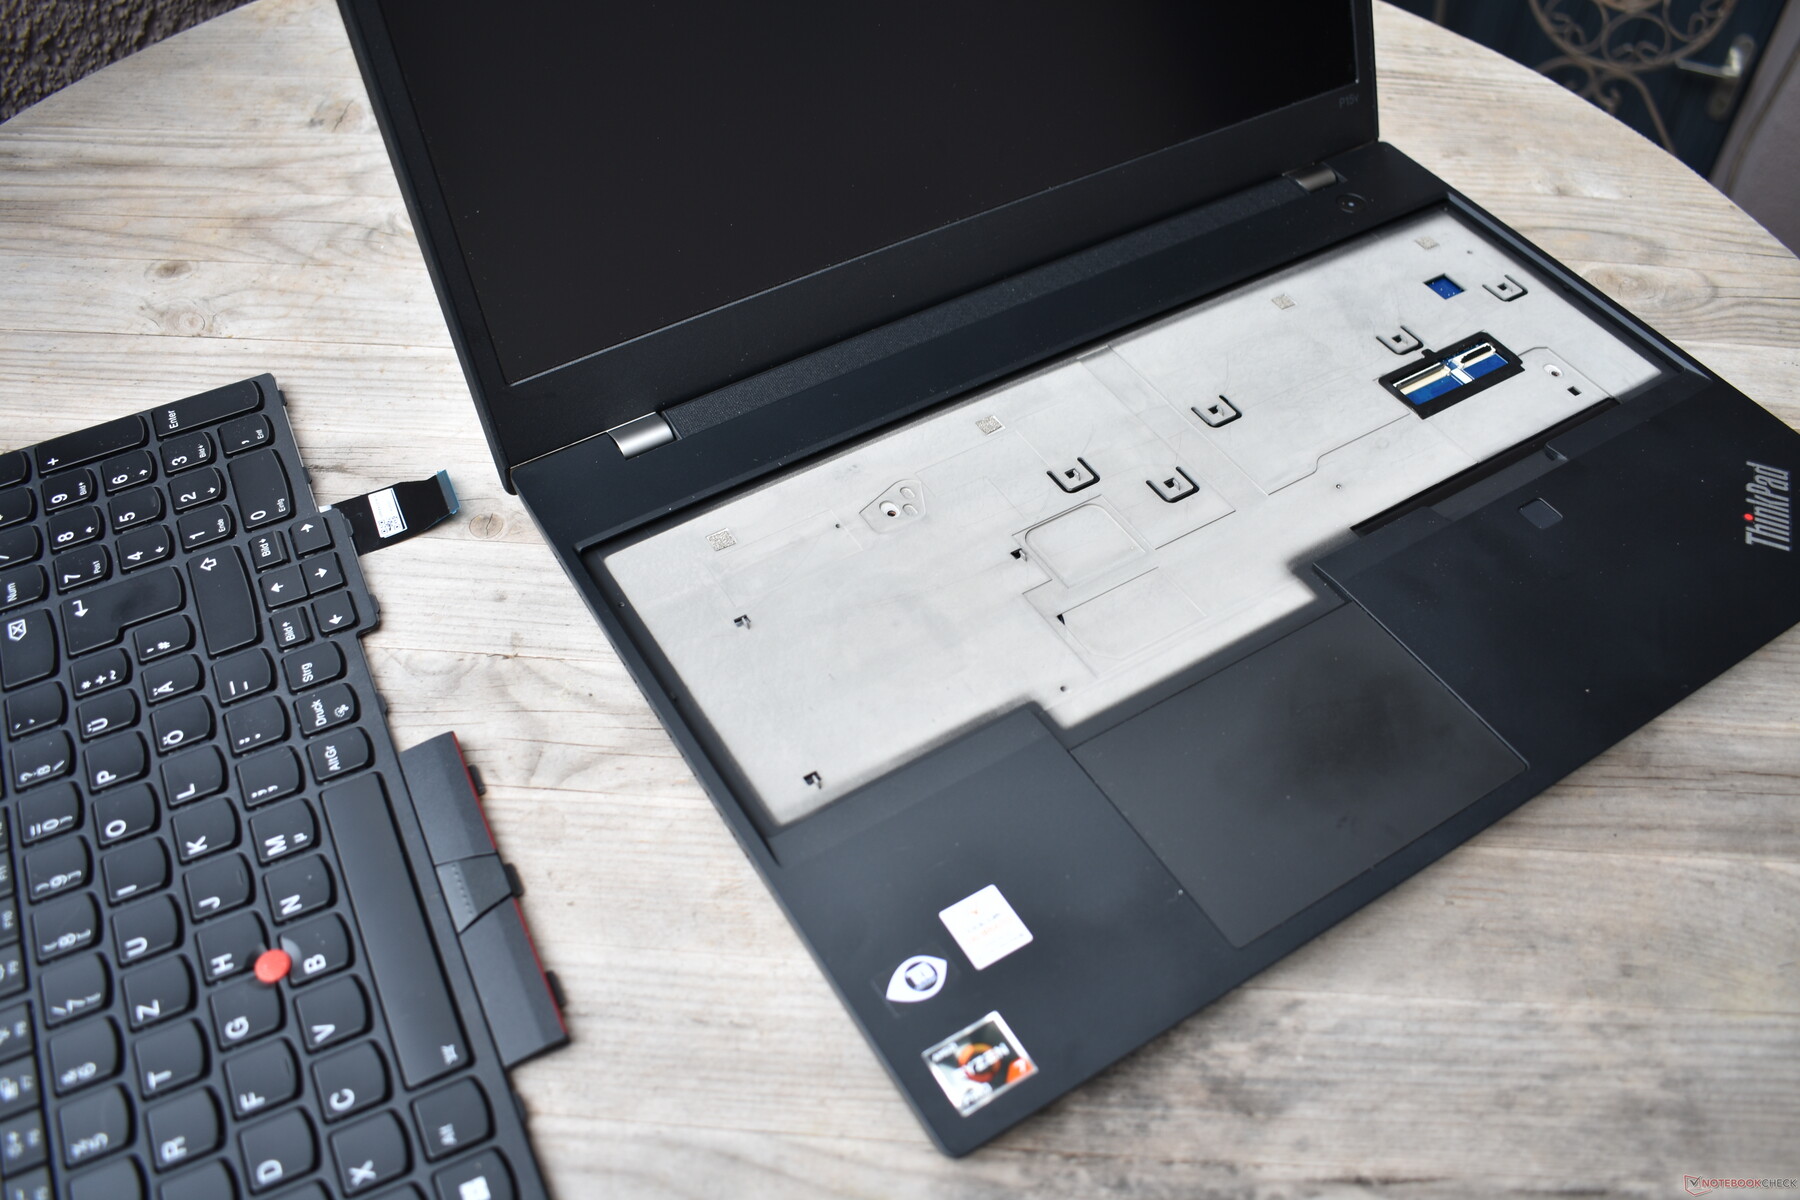
Um recurso especial do ThinkPad P15v Gen 3 é o teclado facilmente intercambiável, que pode ser removido rapidamente depois de soltar dois parafusos. Como o teclado é uma peça consumível, esse é um projeto muito louvável.
Garantia
Se você comprar o ThinkPad P15v Gen 3 em sua configuração atual, a Lenovo concederá uma garantia voluntária do fabricante de três anos, válida em todo o mundo. O serviço inclui serviço de depósito como padrão, portanto, o laptop precisa ser enviado para reparos.
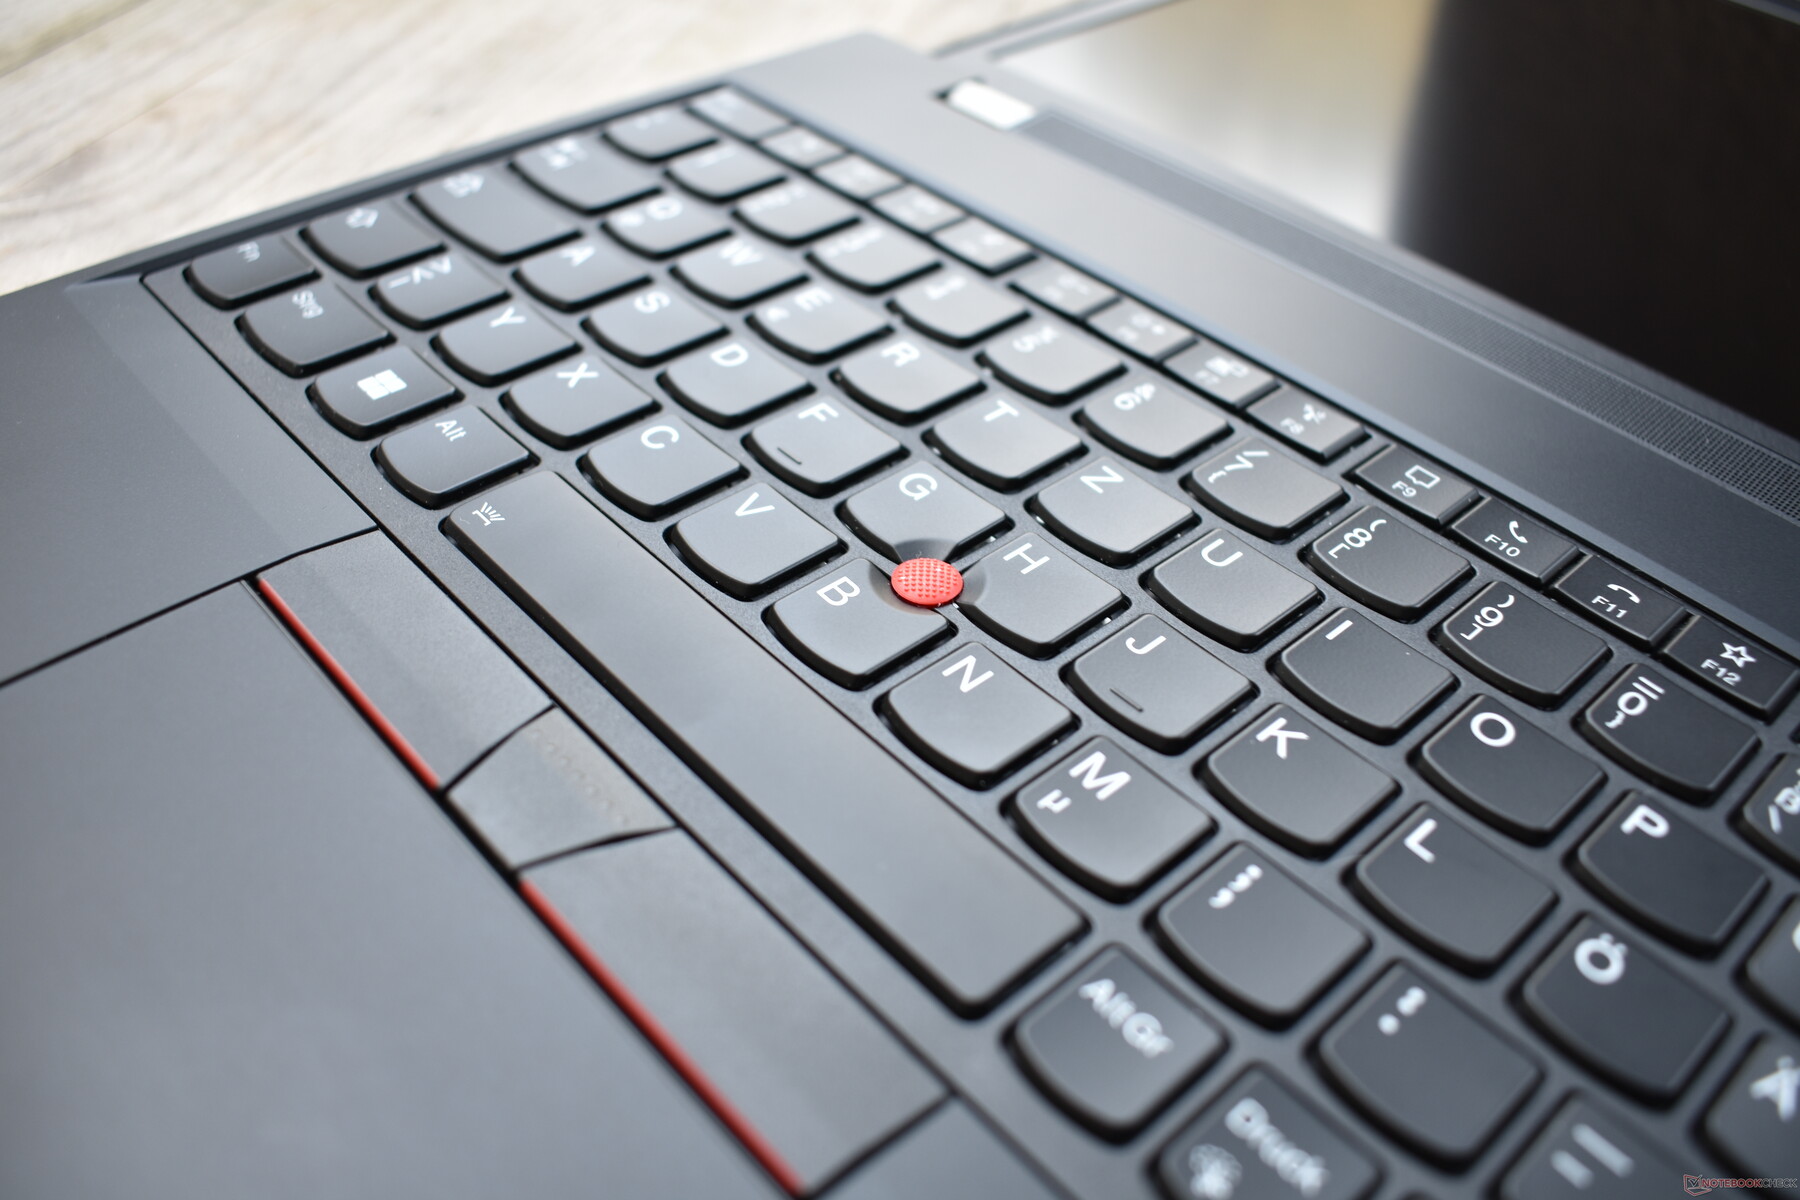
Dispositivos de entrada: Sensação de digitação clássica do ThinkPad com 1,8 mm de deslocamento
Teclado
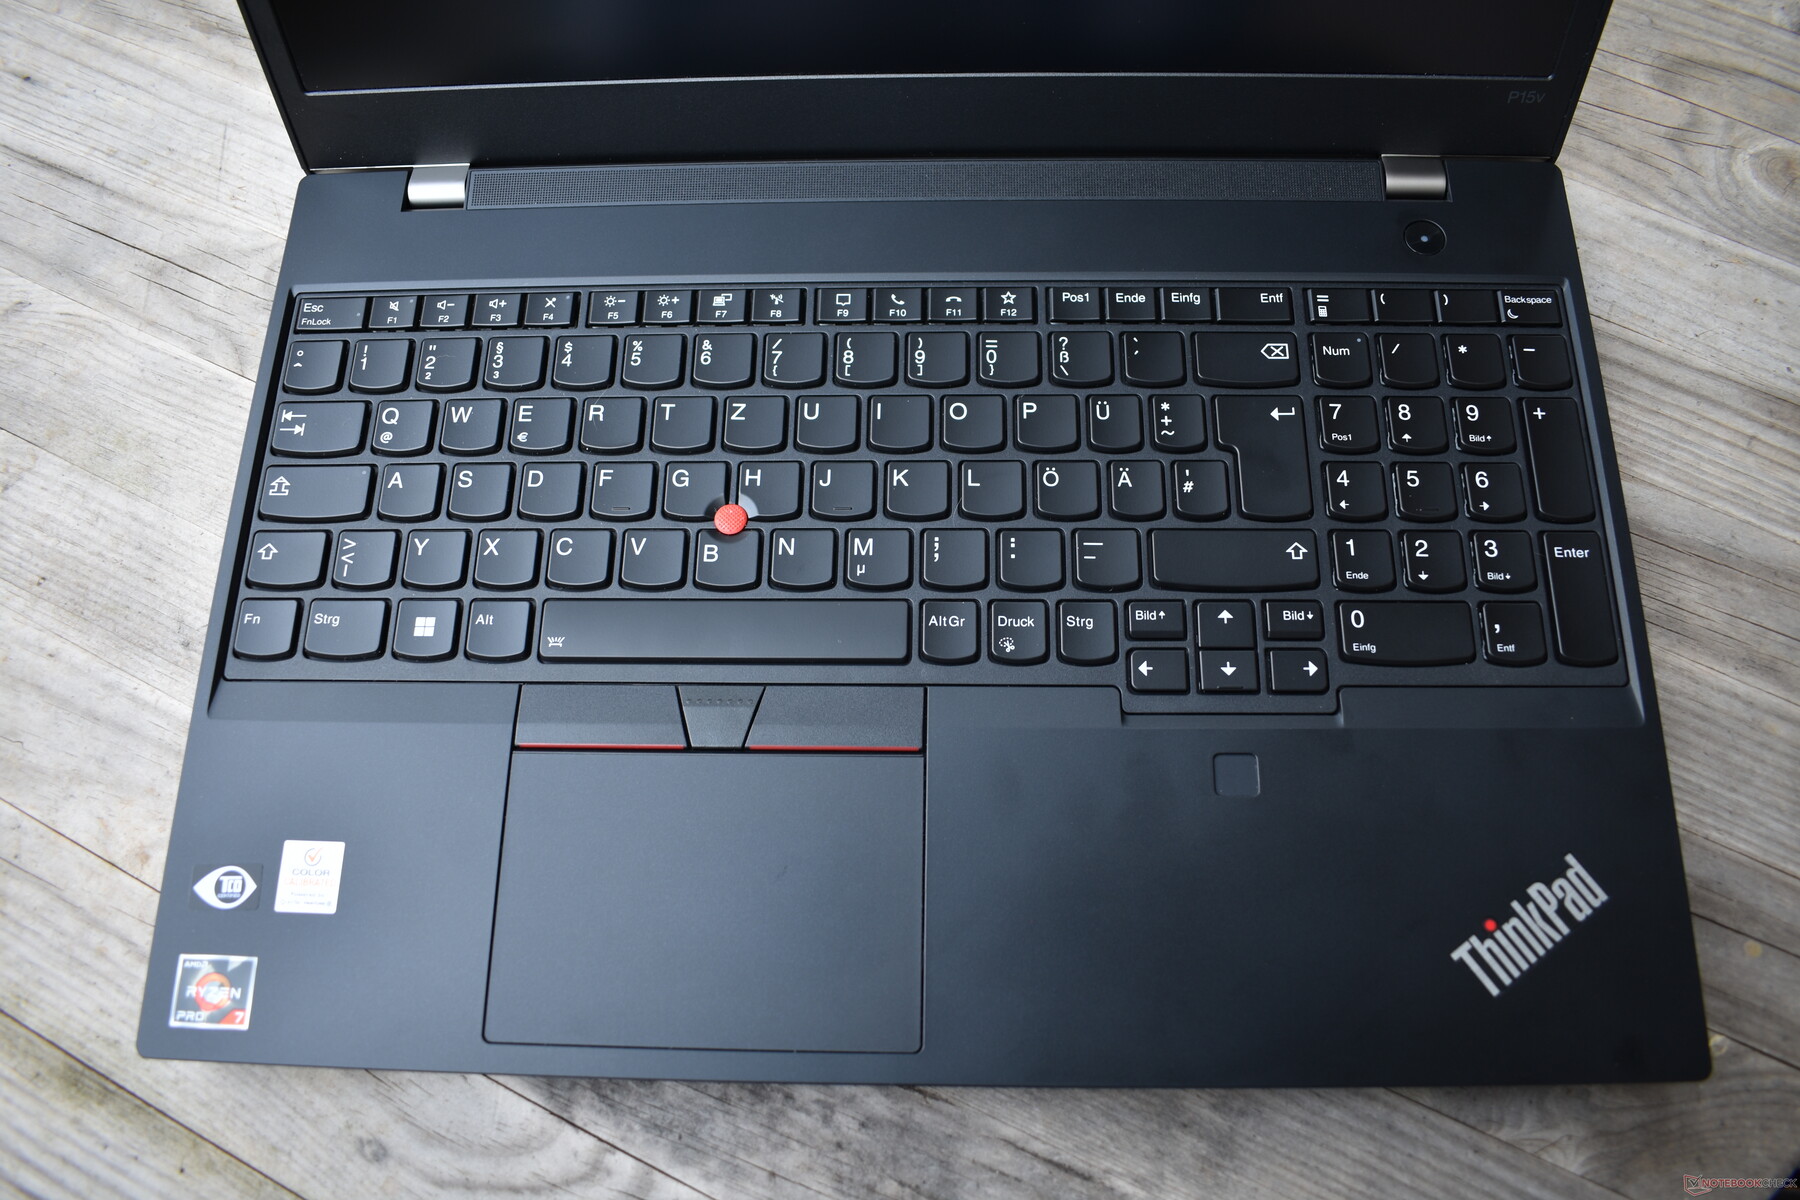
Praticamente todos os laptops ThinkPad passaram de teclados com 1,8 milímetros de curso para aqueles com 1,5 mm de curso nos últimos anos. O Lenovo ThinkPad P15v Gen 3 é uma exceção precisamente porque ainda tem aquele design de 2020, portanto, quando se trata da qualidade do teclado, nenhum outro ThinkPad atual pode acompanhar o P15v G3. O hub adicional, junto com a altura maior das teclas, garante uma experiência de digitação luxuosa e muito agradável. As teclas pretas têm um toque suave e apresentam uma luz de fundo azul e branca de nível duplo.
Como a maioria dos laptops para estações de trabalho, o ThinkPad P15v Gen 3 tem um teclado de tamanho normal com um teclado numérico à direita do teclado. Como resultado, o teclado é deslocado para a esquerda - não é o ideal, mas certamente é um compromisso aceitável para os usuários que dependem do teclado numérico. Todos os outros teriam que usar outros modelos, como o ThinkPad X1 Extreme G5.
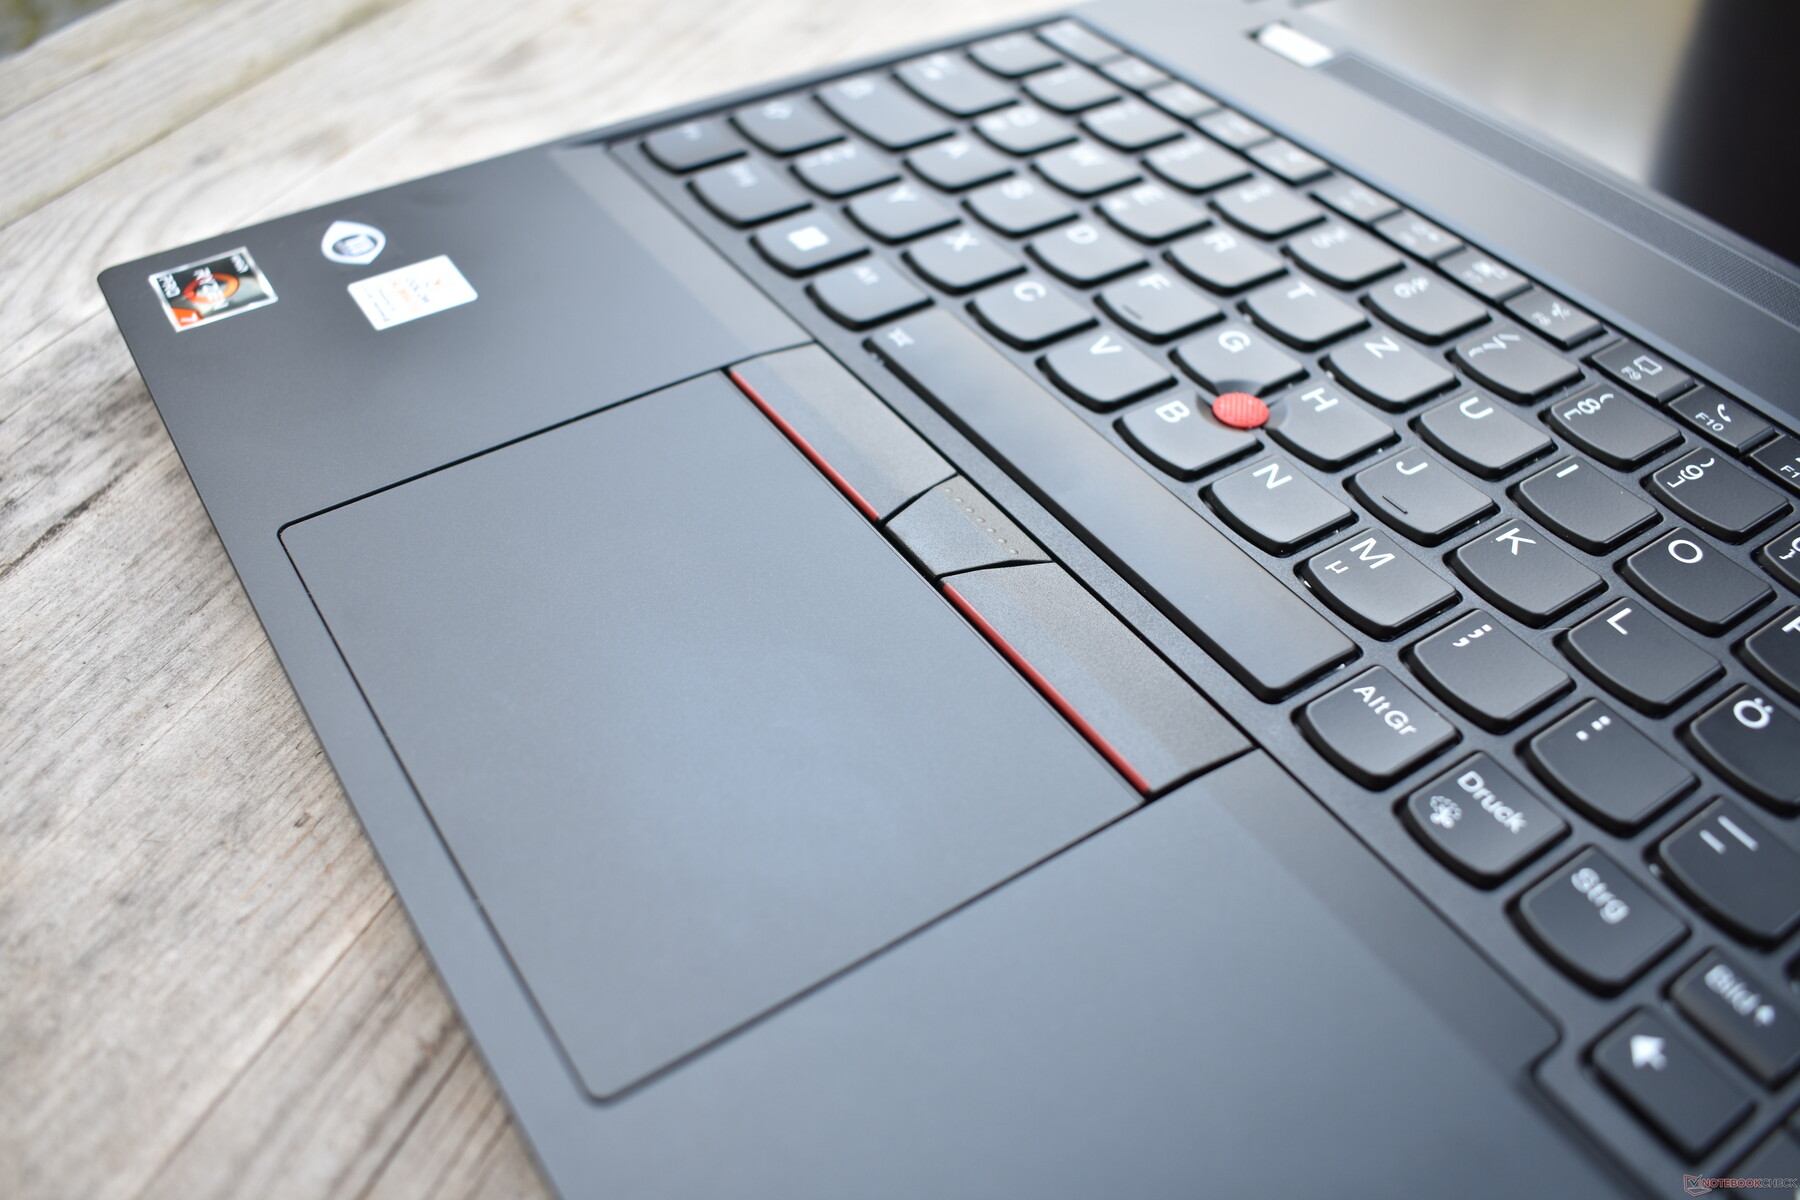
Touchpad
O Lenovo ThinkPad P15v G3 tem a combinação usual do ThinkPad de touchpad e TrackPoint. O touchpad tem um tamanho razoável, com uma superfície feita de plástico, mas não é tão suave como nos ThinkPads mais novos - como o resto do gabinete, o touchpad também é muito sensível à sujeira. O touchpad faz bem o seu trabalho sem ir muito além. Os touchpads de vidro são definitivamente melhores, mas não há nada do que reclamar aqui. O mecanismo de clique também é agradavelmente amortecido.
Como segunda opção, há o já mencionado TrackPoint da Synaptics. O TrackPoint é muito útil, especialmente ao digitar, para mover o ponteiro do mouse com rapidez e precisão. Em condições de espaço apertado, por exemplo, em um avião, achamos que ele ainda é superior ao touchpad. Os botões dedicados acima do touchpad pertencem ao TrackPoint e funcionam perfeitamente. Curiosamente, o botão direito do mouse é mais barulhento do que o esquerdo.
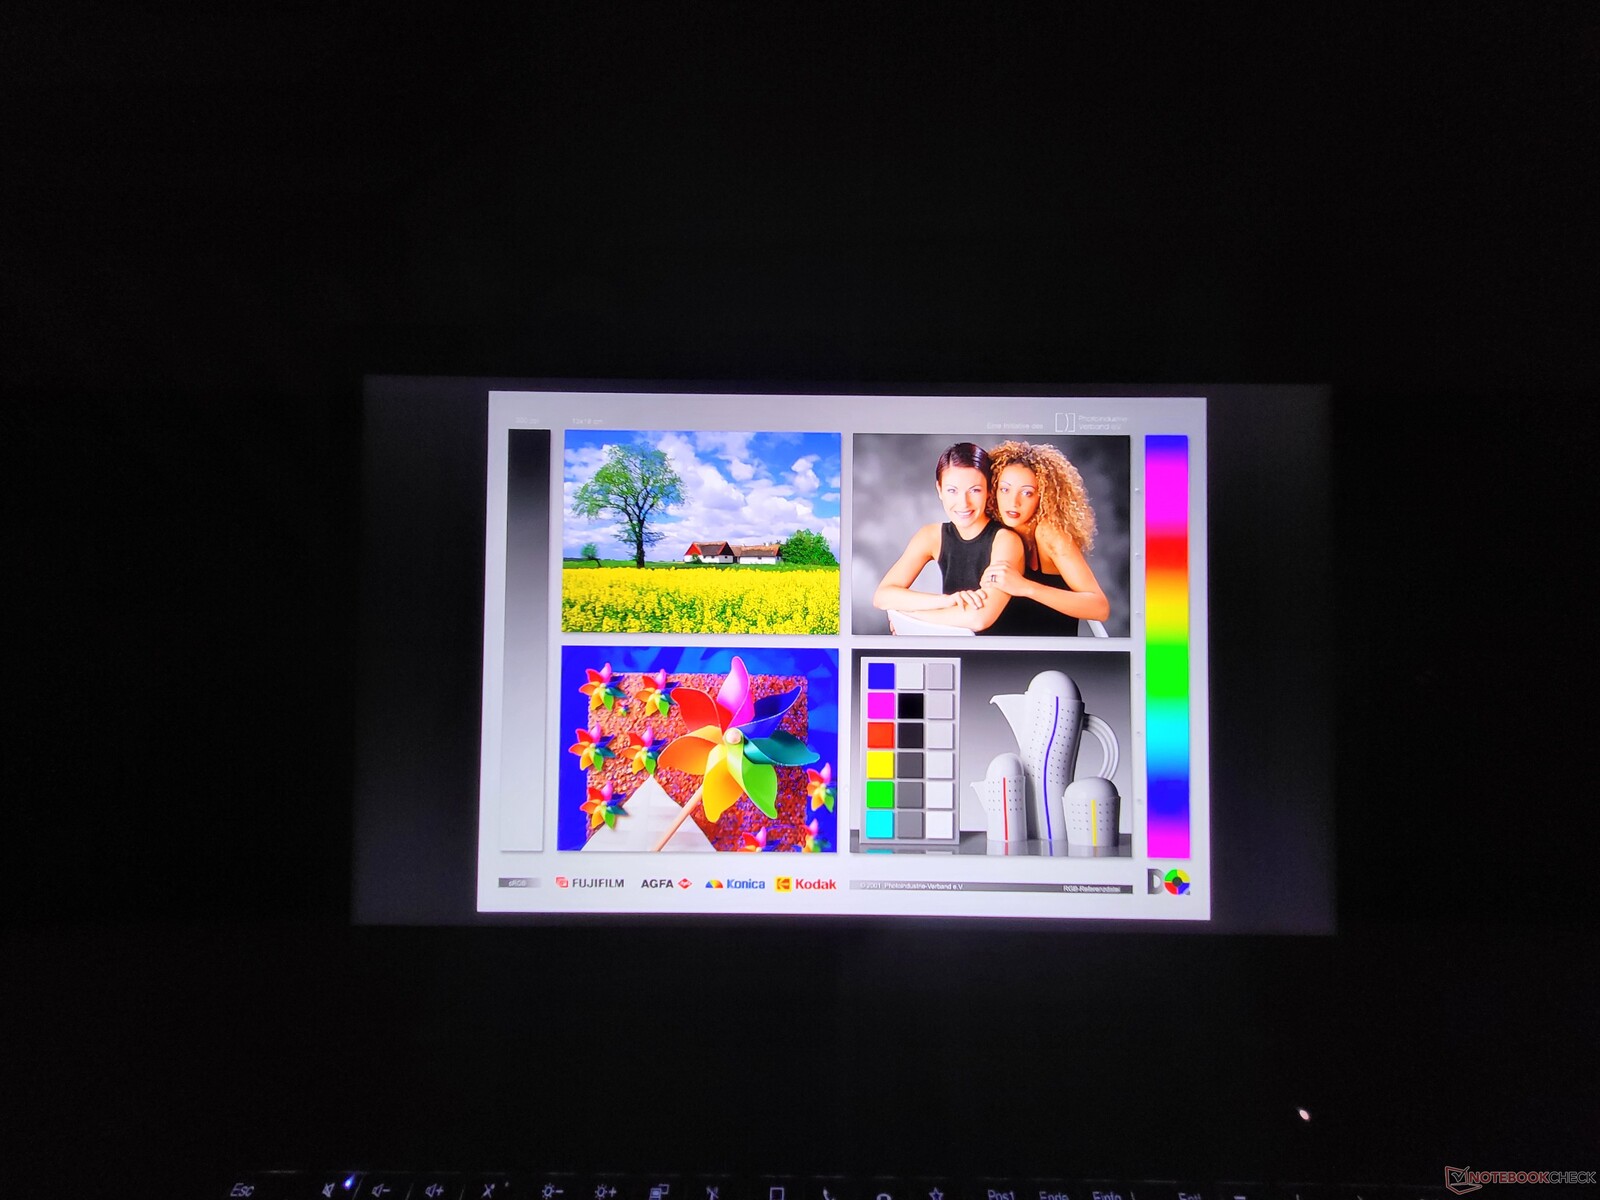
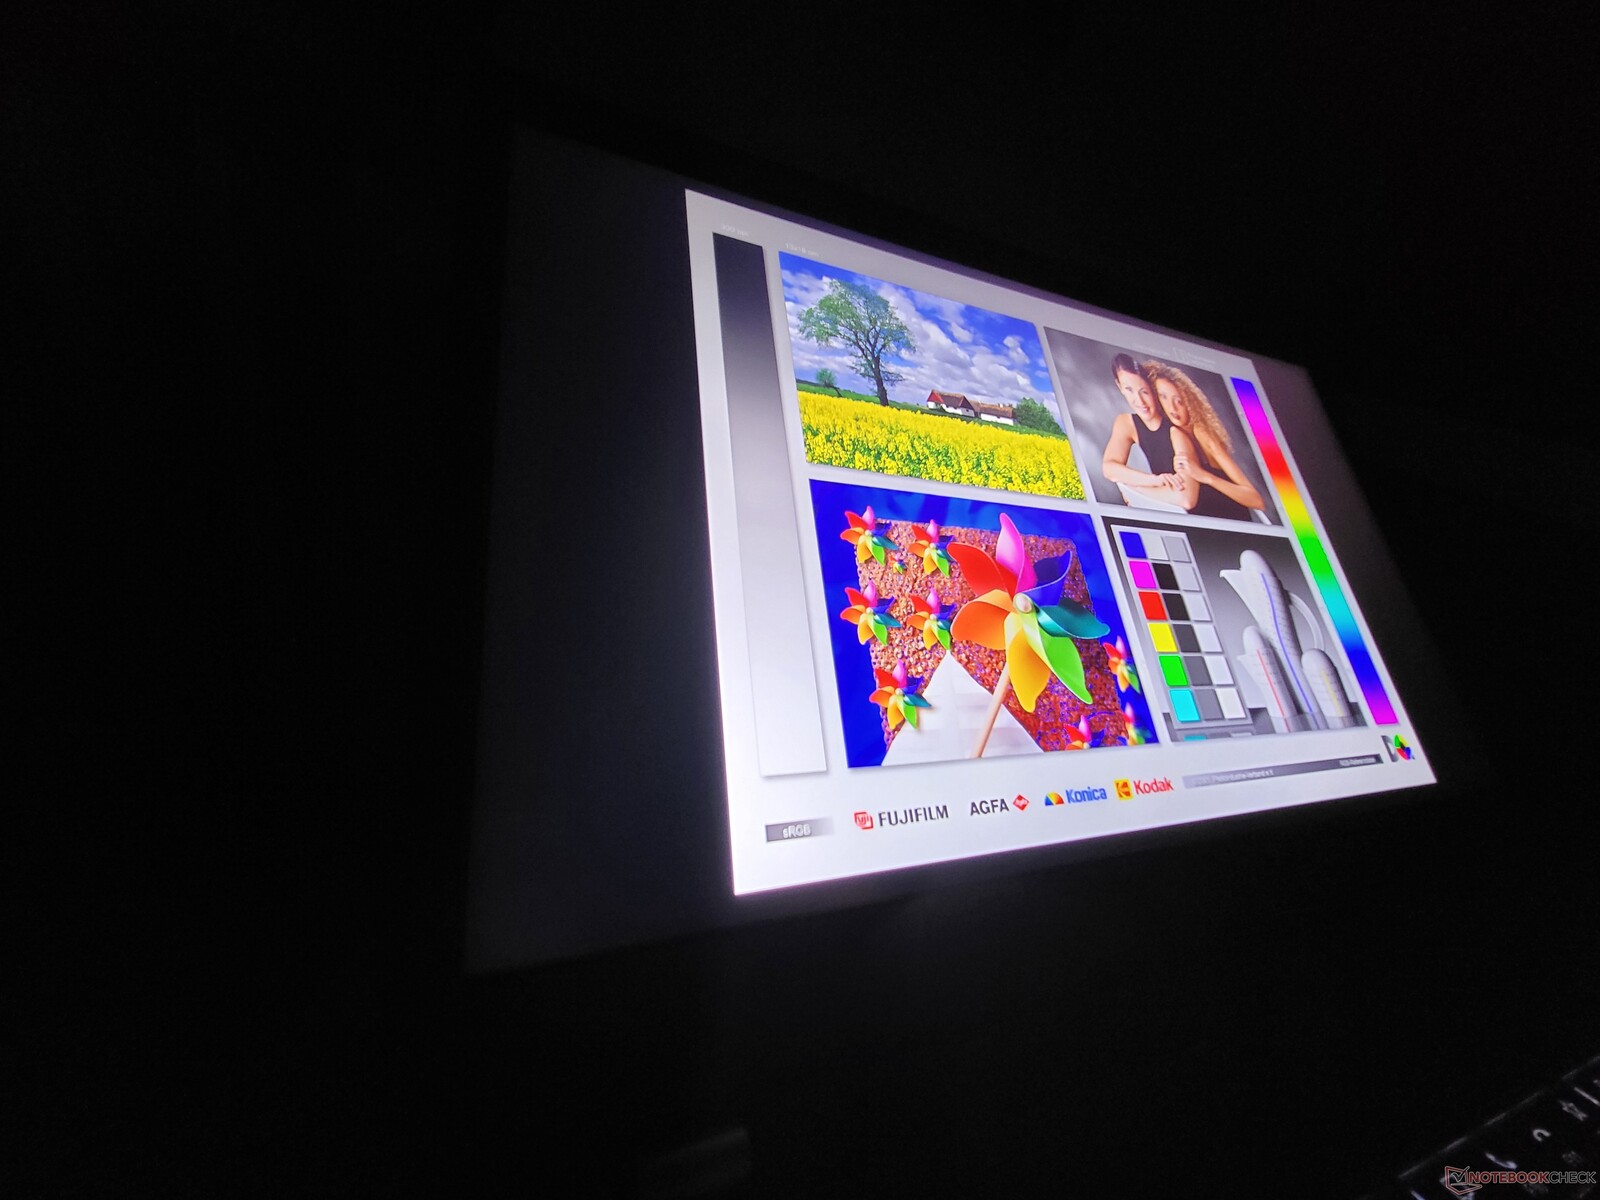
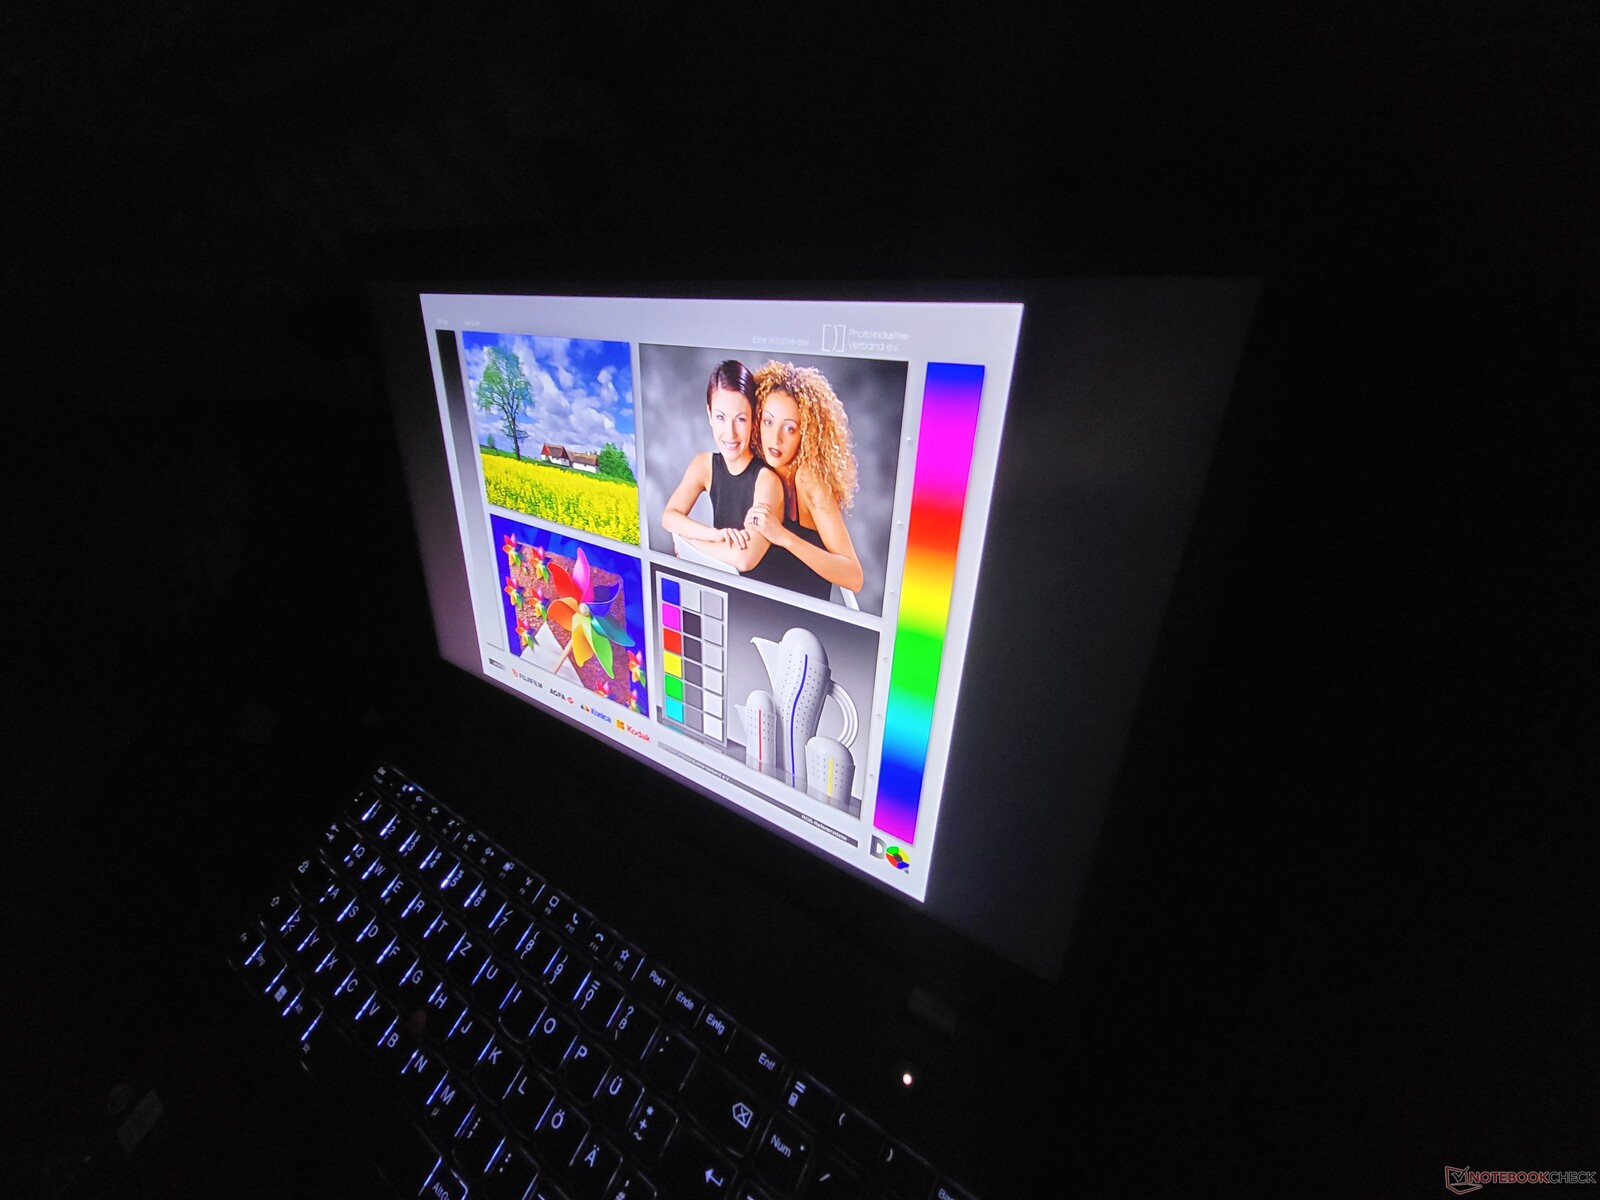
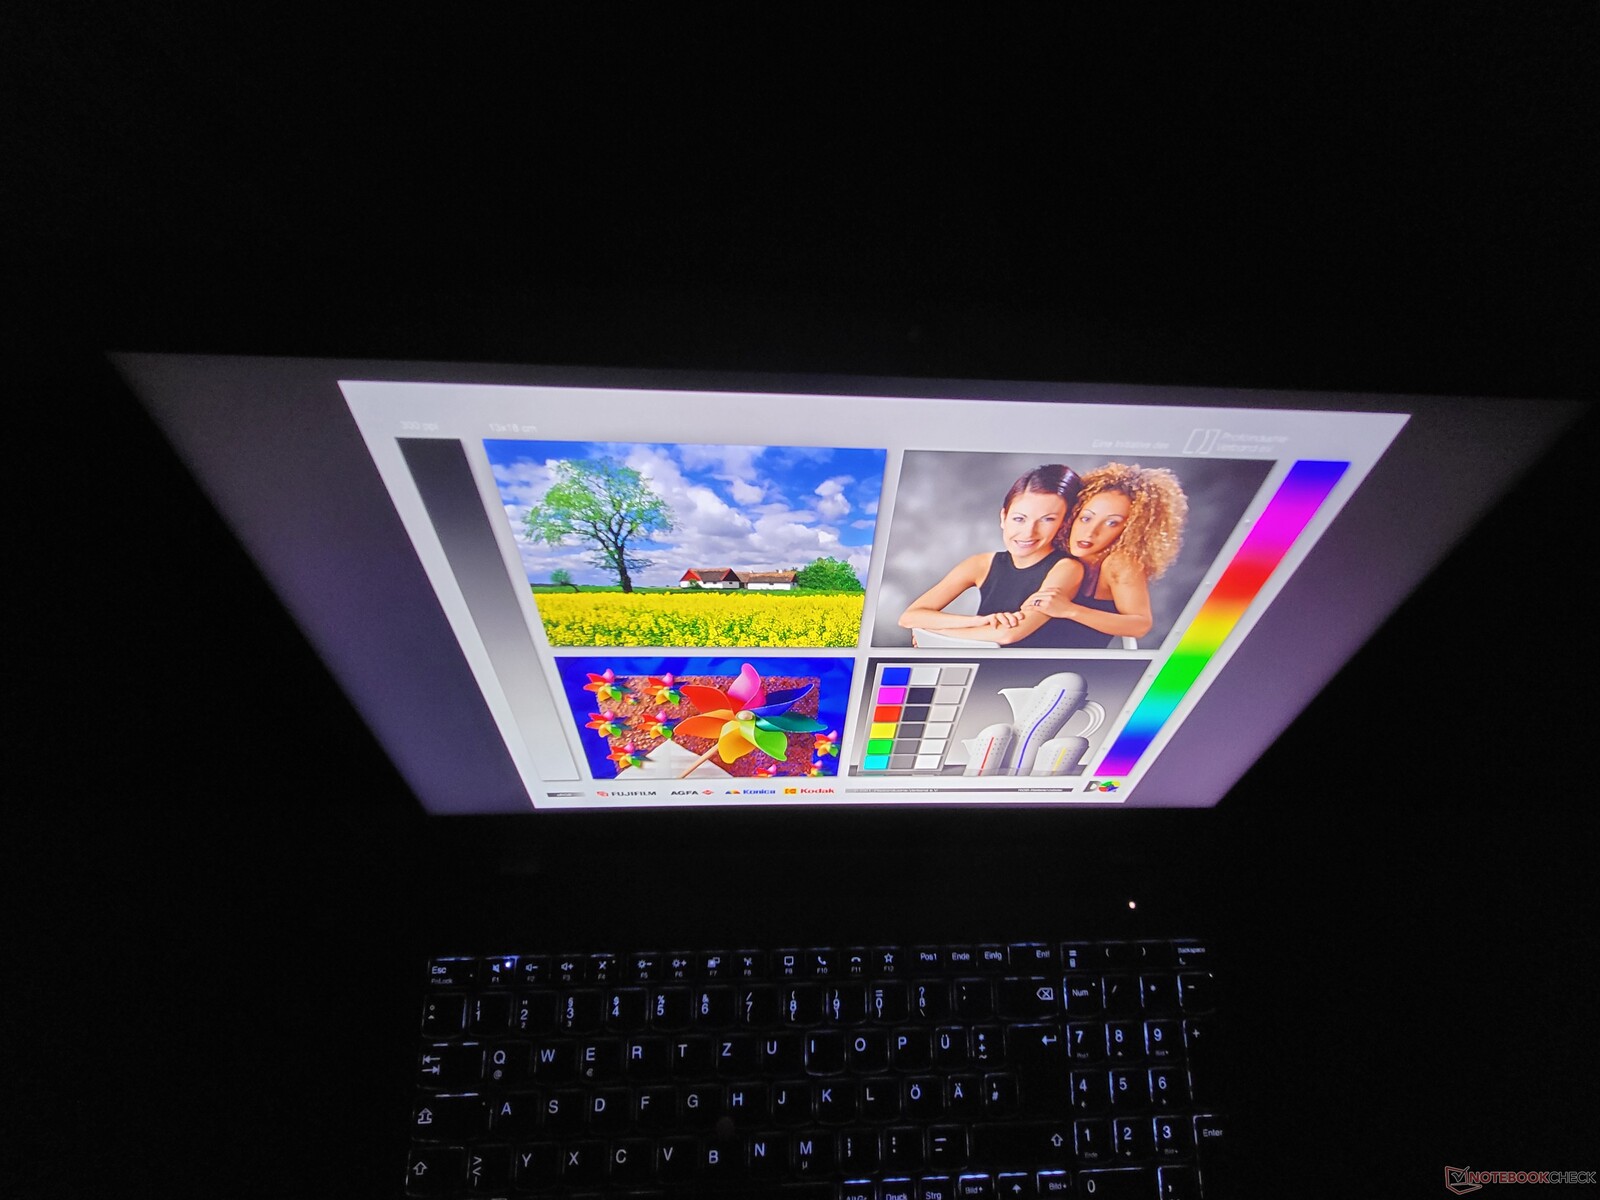
Tela: Painel 4K-UHD fosco com 100% AdobeRGB

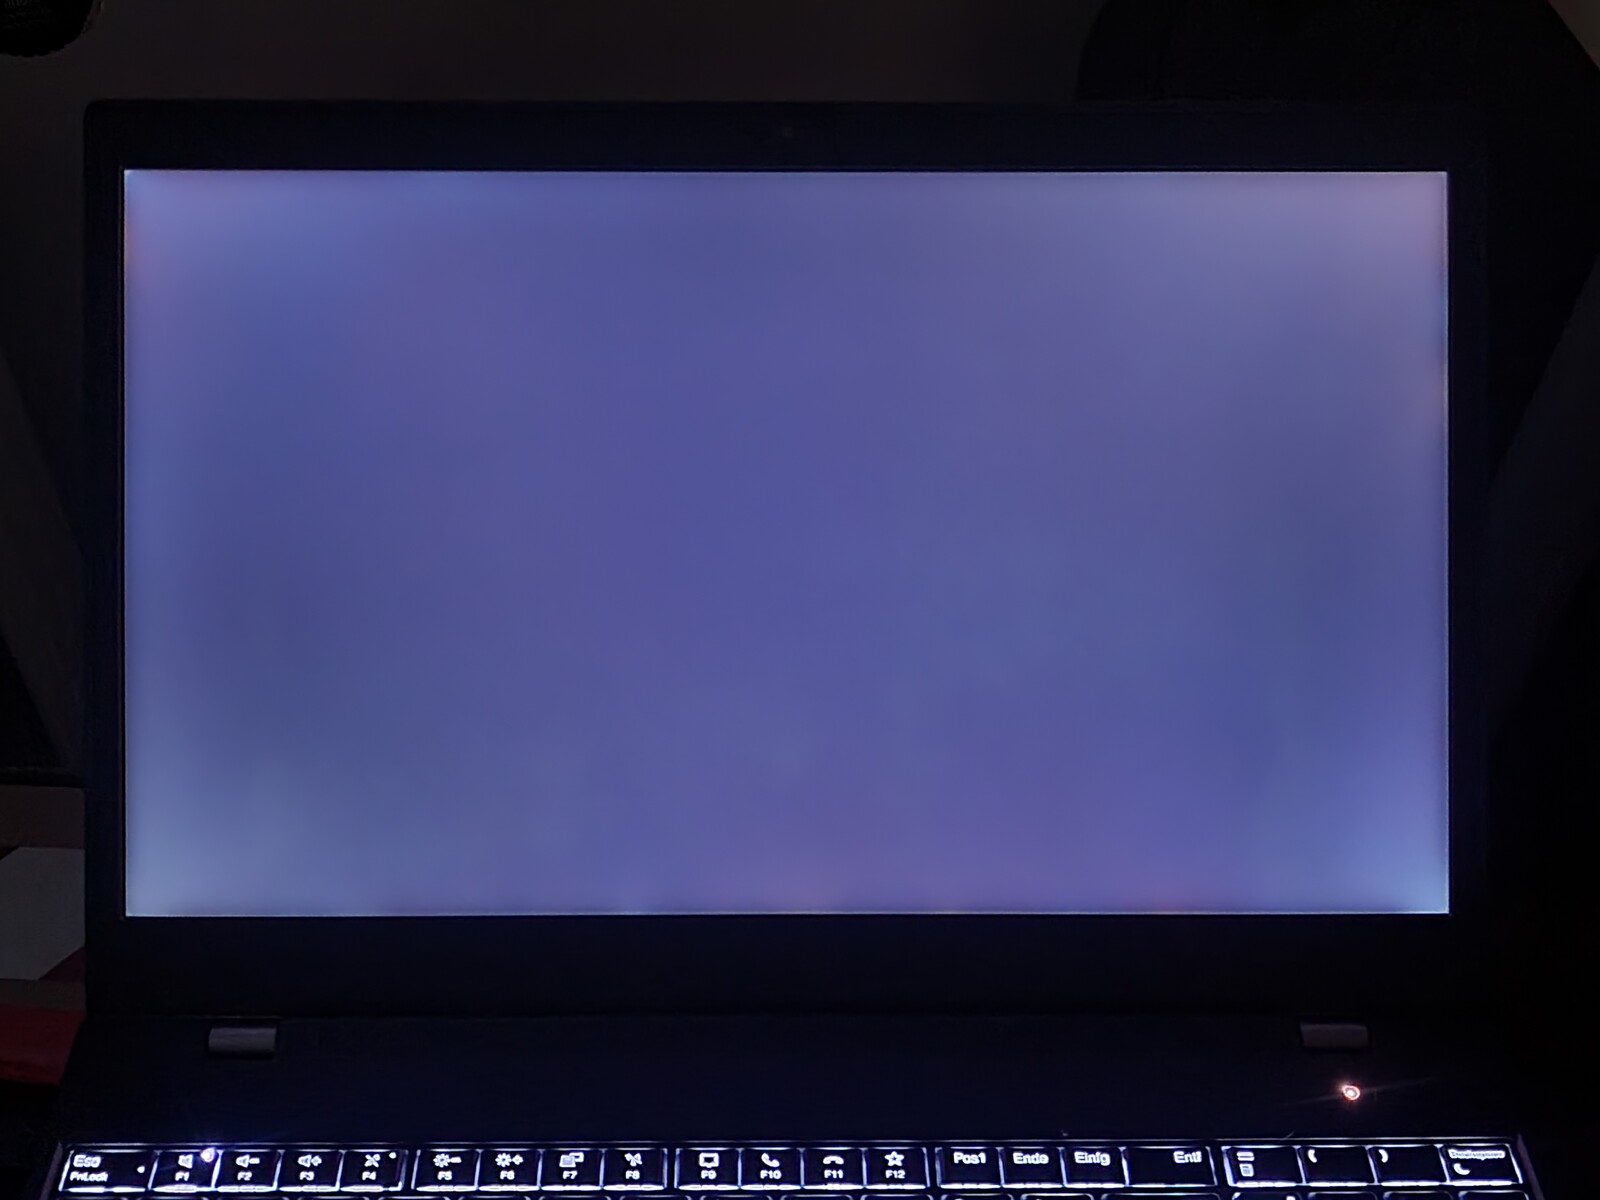
Como um dos últimos ThinkPads de 2022, o Lenovo ThinkPad P15v Gen 3 ainda usa uma tela 16:9. Há um total de três LCDs IPS foscos diferentes com uma diagonal de 15,6 polegadas para escolher:
- Full HD (1.920 x 1.080), 300 cd/m², 45% NTSC
- Full HD (1.920 x 1.080), 300 cd/m², 72% NTSC
- 4K UHD (3840 x 2160), 600 nits, 100% AdobeRGB
O painel BOE instalado aqui não atinge a marca de 600 cd/m²; ele tem um máximo de 590 cd/m² e uma média de 536 cd/m². Embora isso não seja ótimo, a tela ainda é significativamente mais brilhante do que a tela 4K UHD do HP ZBook Power 15 G9. O brilho pode ser melhorado em 83%, mas, felizmente, não notamos nenhum sombreamento visível a olho nu.
| |||||||||||||||||||||||||
iluminação: 83 %
iluminação com acumulador: 588 cd/m²
Contraste: 1547:1 (Preto: 0.38 cd/m²)
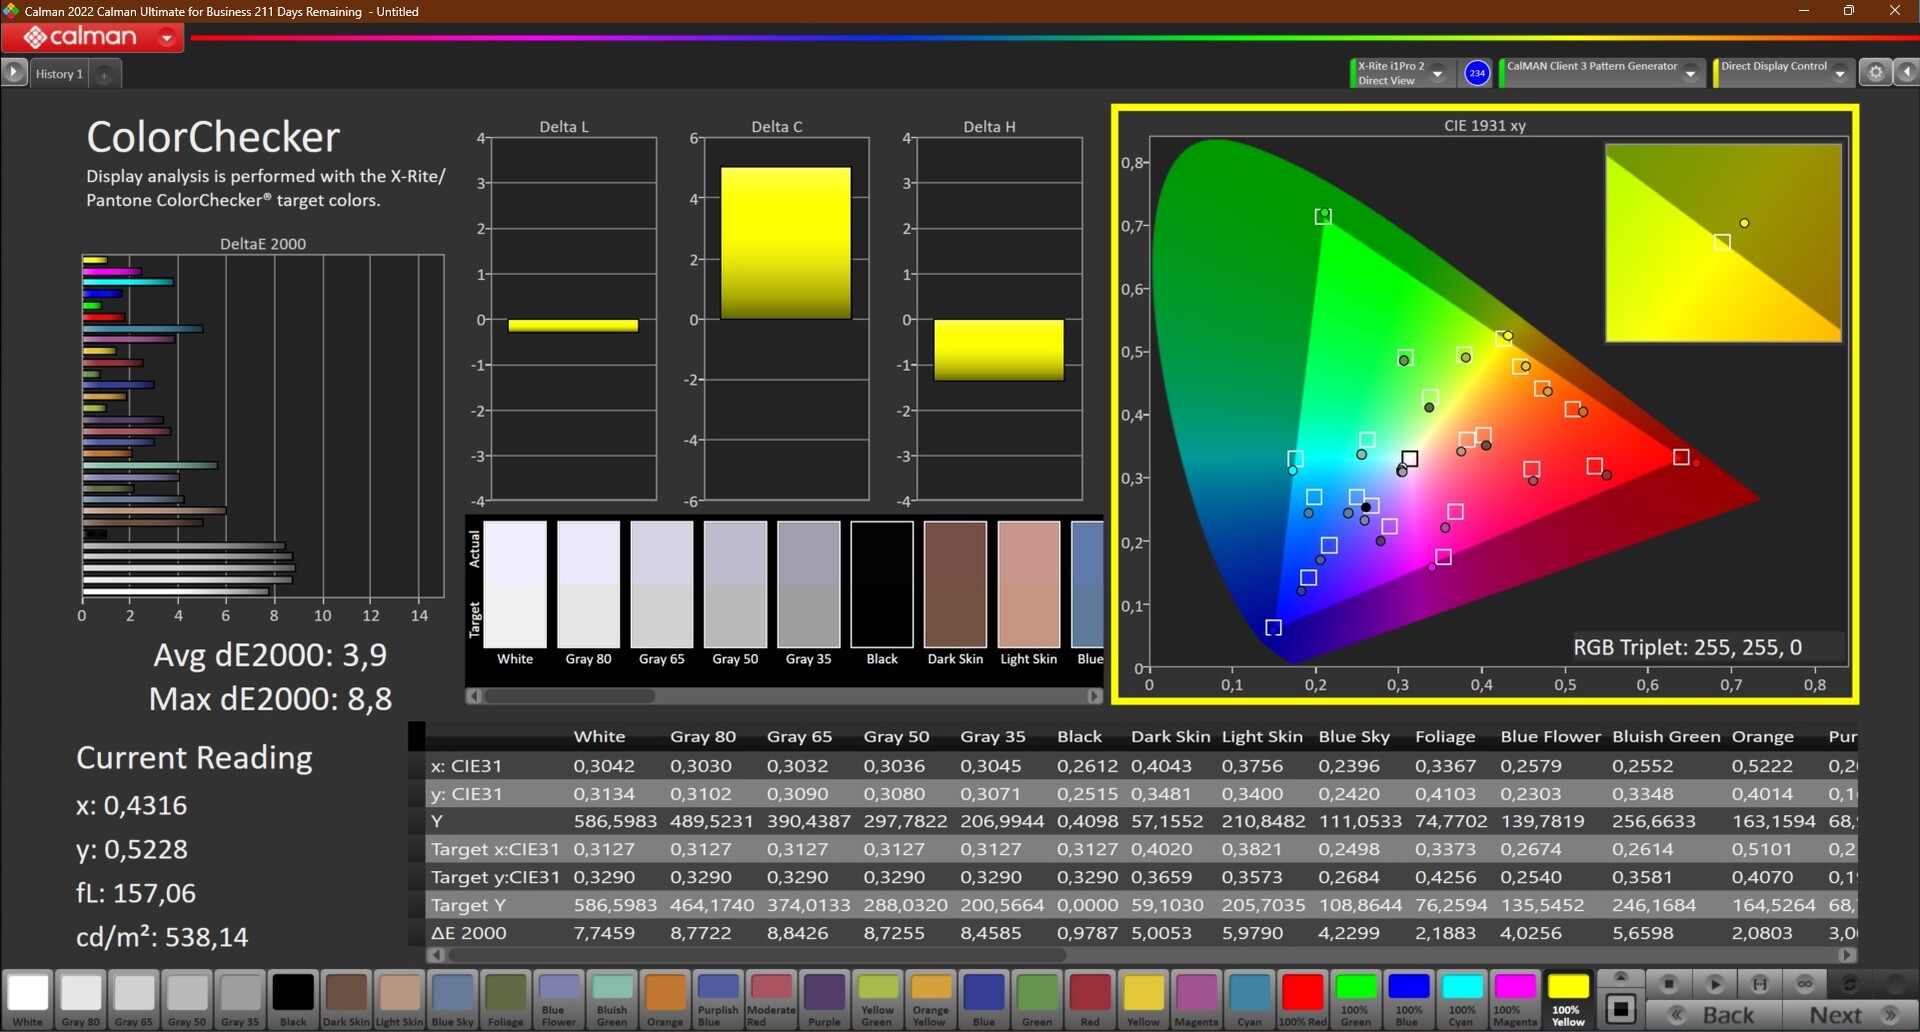
ΔE ColorChecker Calman: 3.9 | ∀{0.5-29.43 Ø4.71}
calibrated: 1
ΔE Greyscale Calman: 7.1 | ∀{0.09-98 Ø4.96}
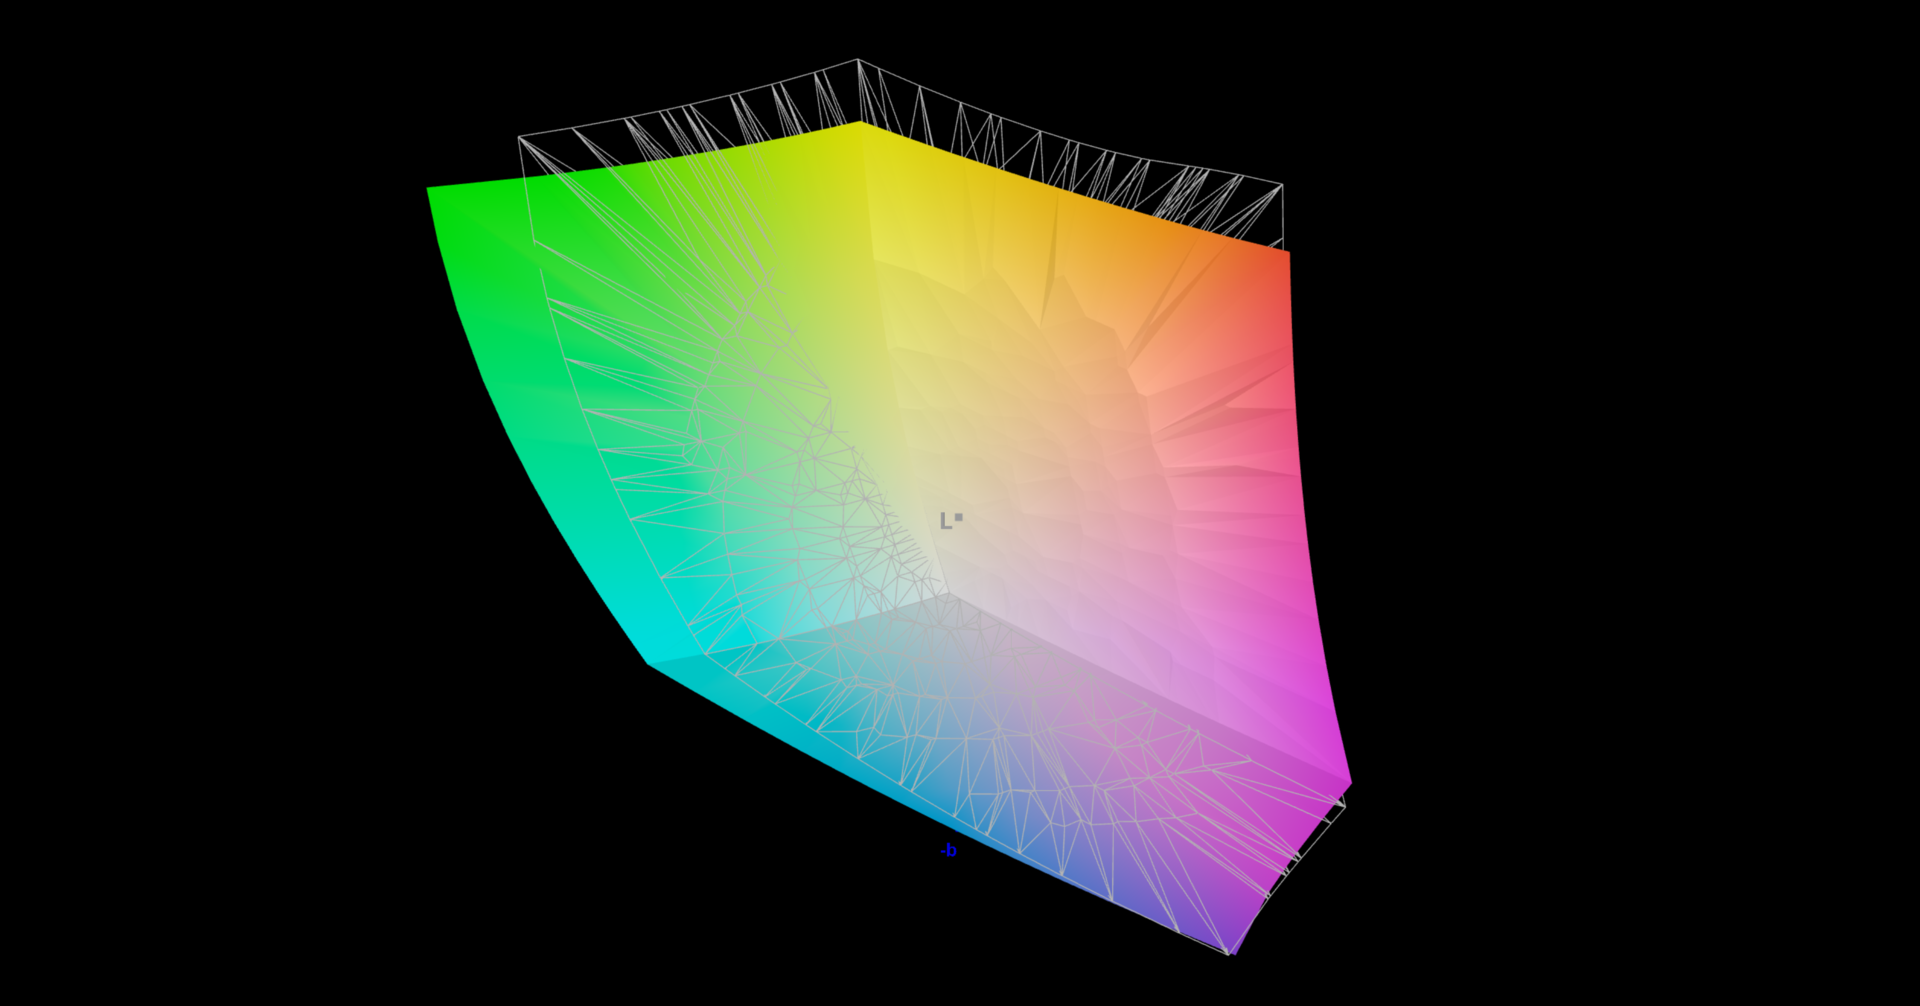
99.9% AdobeRGB 1998 (Argyll 3D)
100% sRGB (Argyll 3D)
89.9% Display P3 (Argyll 3D)
Gamma: 2.12
CCT: 7268 K
| Lenovo ThinkPad P15v G3 21EM001AGE NE156QUM-N6C, IPS LED, 3840x2160, 15.6" | Lenovo ThinkPad P16 G1 21D6001DMB NE160QDM-N63 , IPS LED, 2560x1600, 16" | Lenovo ThinkPad P15v G2 21A9000XGE N156HCA-EAC, IPS LED, 1920x1080, 15.6" | HP ZBook Power 15 G9 6B8C4EA LGD073F, IPS, 3840x2160, 15.6" | Dell Precision 7670 Samsung 160YV03, OLED, 3840x2400, 16" | Lenovo ThinkPad P16 G1 RTX A5500 LP160UQ1-SPB1, IPS, 3840x2400, 16" | |
|---|---|---|---|---|---|---|
| Display | -16% | -47% | -18% | 3% | -4% | |
| Display P3 Coverage (%) | 89.9 | 71.5 -20% | 43.7 -51% | 69.1 -23% | 99.9 11% | 82.9 -8% |
| sRGB Coverage (%) | 100 | 100 0% | 65.1 -35% | 97.7 -2% | 100 0% | 98.9 -1% |
| AdobeRGB 1998 Coverage (%) | 99.9 | 73.3 -27% | 45.3 -55% | 69.6 -30% | 97.5 -2% | 95.9 -4% |
| Response Times | 12% | -3% | -2% | 95% | -17% | |
| Response Time Grey 50% / Grey 80% * (ms) | 46.7 ? | 37.7 ? 19% | 48 ? -3% | 45.8 ? 2% | 1.9 ? 96% | 45.6 ? 2% |
| Response Time Black / White * (ms) | 27.3 ? | 26.3 ? 4% | 28 ? -3% | 28.6 ? -5% | 2 ? 93% | 36.8 ? -35% |
| PWM Frequency (Hz) | 59.5 ? | |||||
| Screen | 16% | -68% | 14% | 6% | 14% | |
| Brightness middle (cd/m²) | 588 | 424 -28% | 305 -48% | 392 -33% | 340.1 -42% | 601.9 2% |
| Brightness (cd/m²) | 536 | 398 -26% | 281 -48% | 388 -28% | 342 -36% | 569 6% |
| Brightness Distribution (%) | 83 | 90 8% | 88 6% | 88 6% | 98 18% | 77 -7% |
| Black Level * (cd/m²) | 0.38 | 0.24 37% | 0.32 16% | 0.15 61% | 0.47 -24% | |
| Contrast (:1) | 1547 | 1767 14% | 953 -38% | 2613 69% | 1281 -17% | |
| Colorchecker dE 2000 * | 3.9 | 2.6 33% | 5.9 -51% | 3.2 18% | 2.5 36% | 2.45 37% |
| Colorchecker dE 2000 max. * | 8.8 | 4.9 44% | 20.1 -128% | 7 20% | 8.19 7% | 4.46 49% |
| Colorchecker dE 2000 calibrated * | 1 | 0.8 20% | 4.5 -350% | 1.2 -20% | ||
| Greyscale dE 2000 * | 7.1 | 4.1 42% | 5.3 25% | 4.9 31% | 3.5 51% | 2.6 63% |
| Gamma | 2.12 104% | 2.13 103% | 2.1 105% | 2.13 103% | 2.12 104% | 2.3 96% |
| CCT | 7268 89% | 7252 90% | 6307 103% | 5982 109% | 6704 97% | 6805 96% |
| Média Total (Programa/Configurações) | 4% /
9% | -39% /
-55% | -2% /
5% | 35% /
21% | -2% /
5% |
* ... menor é melhor
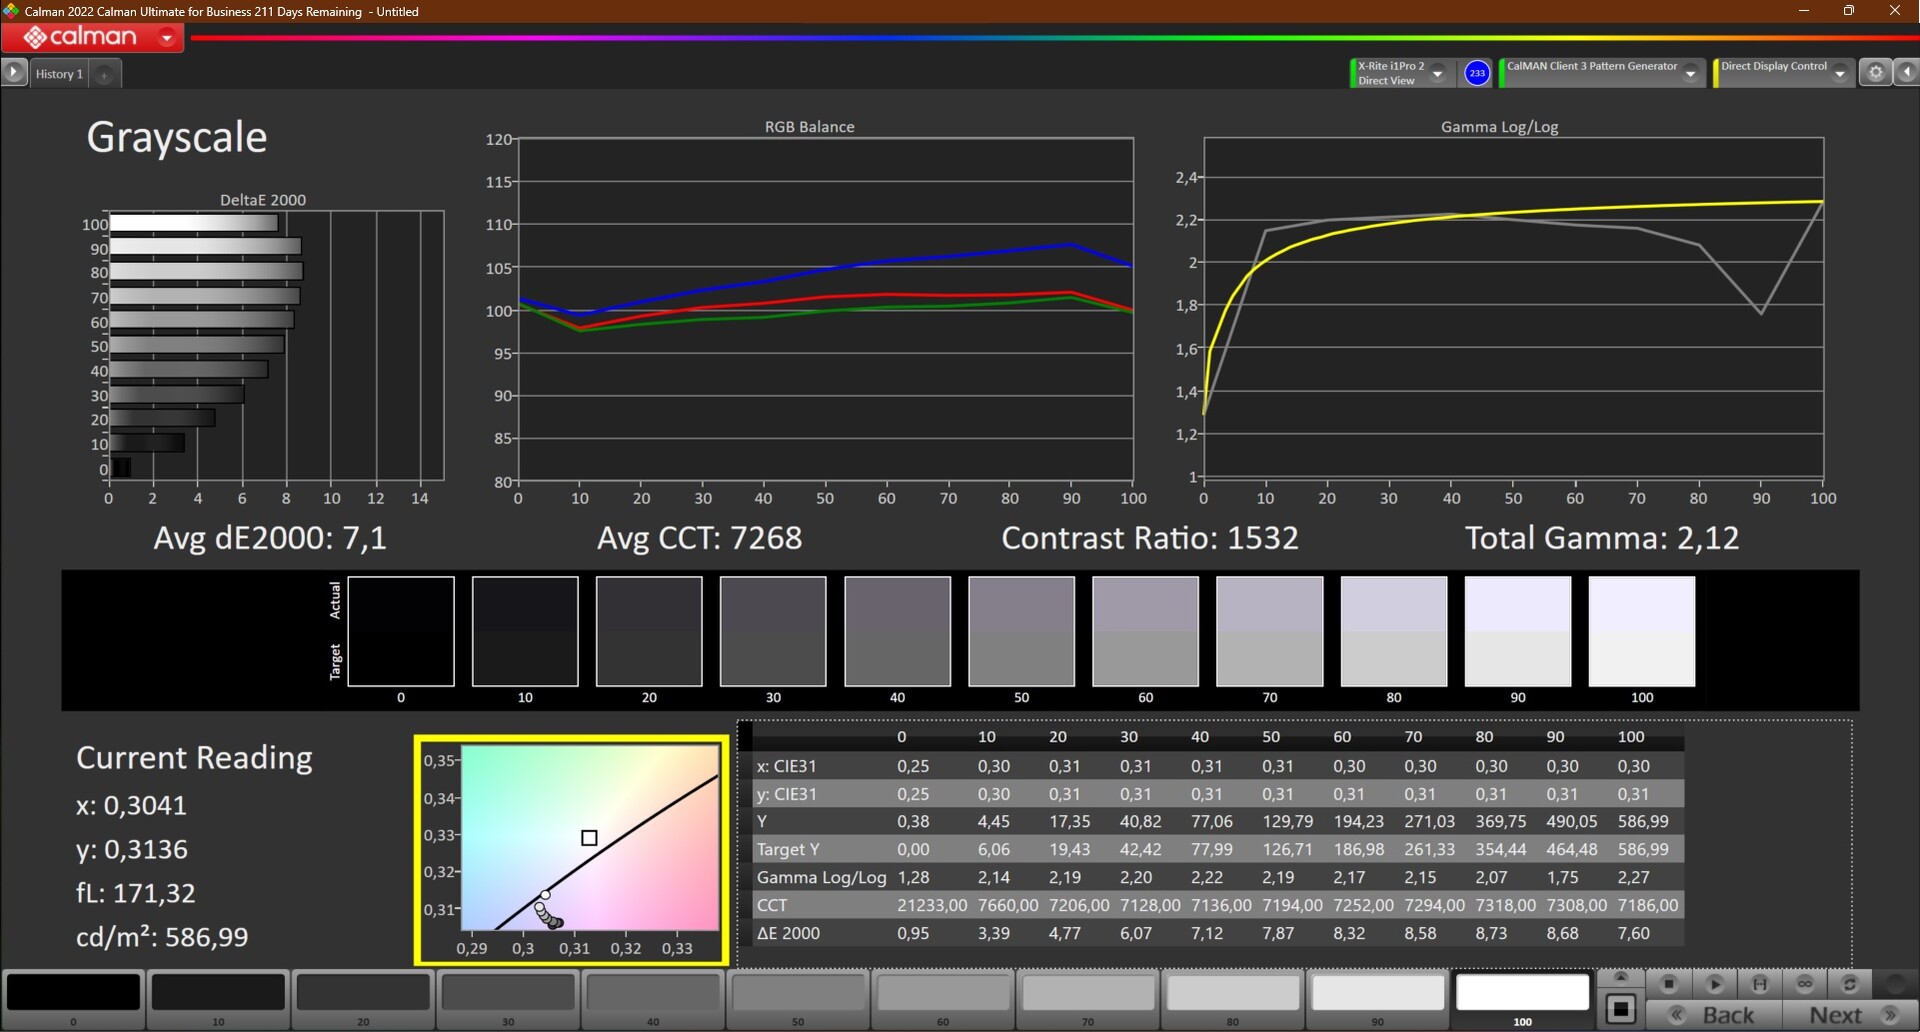

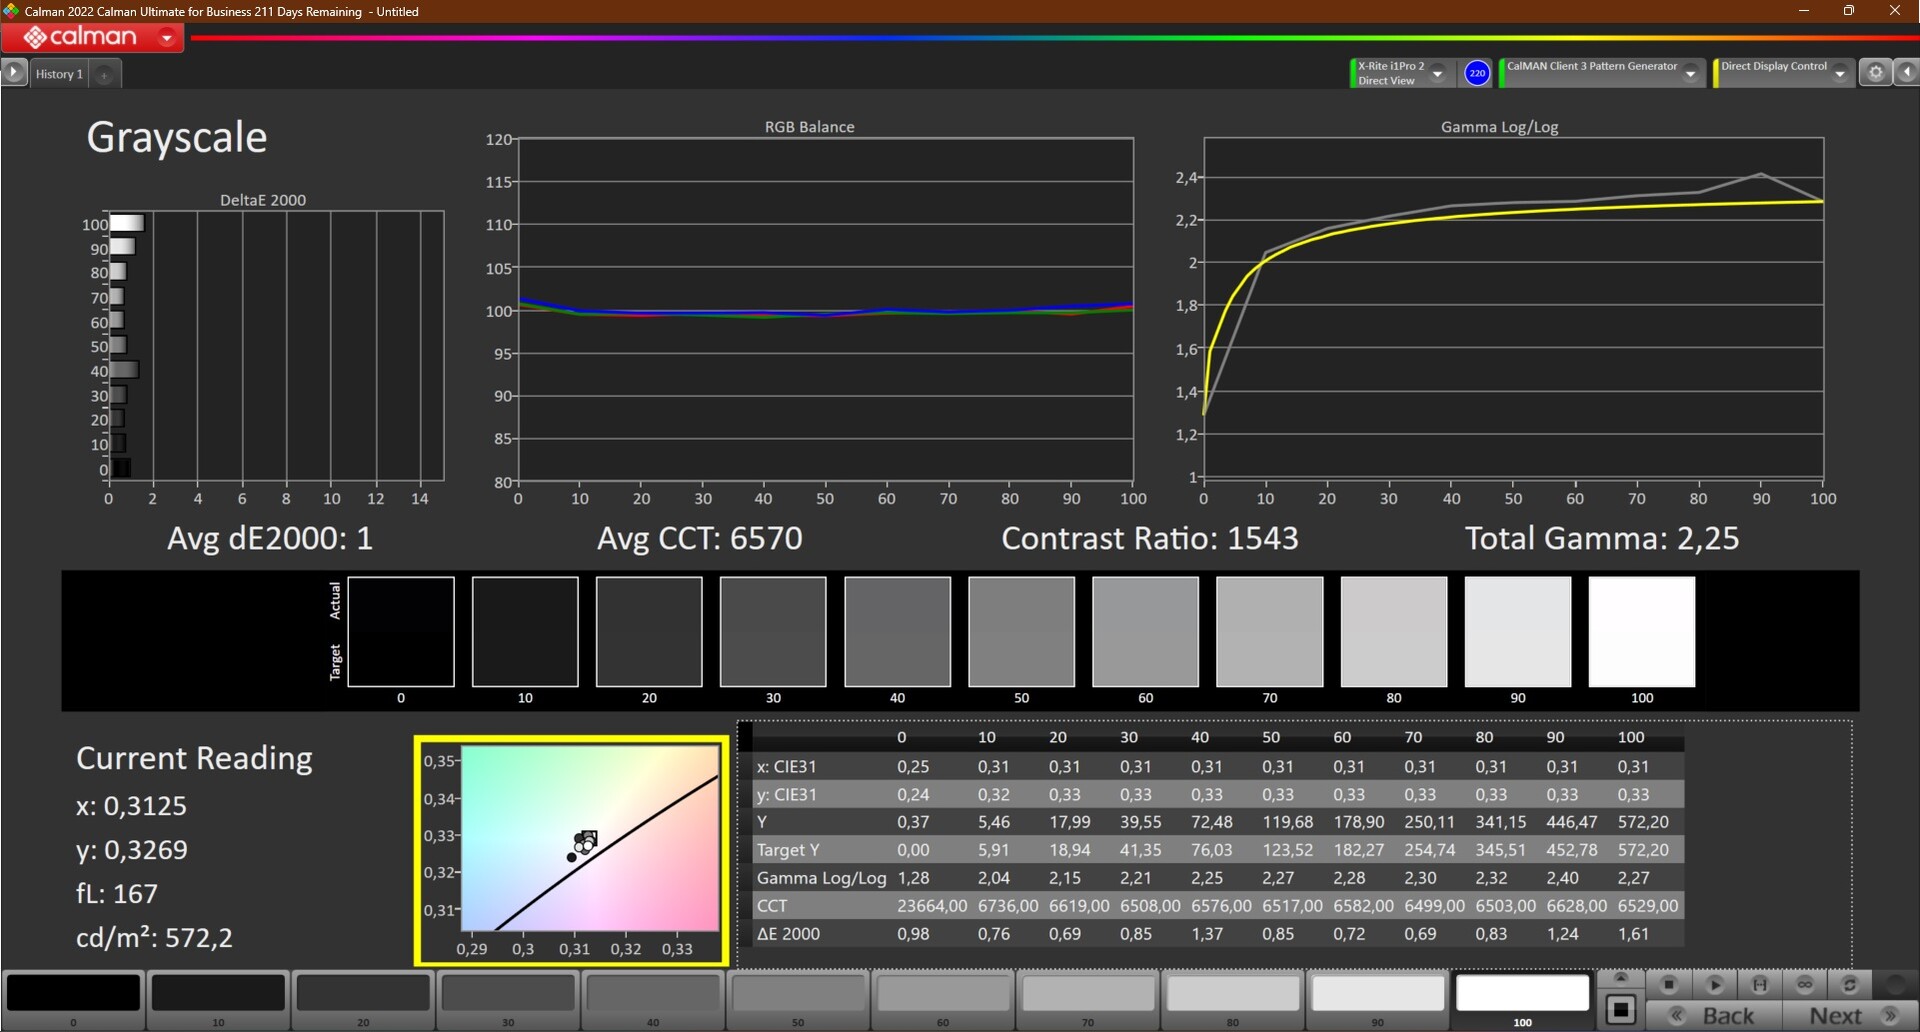
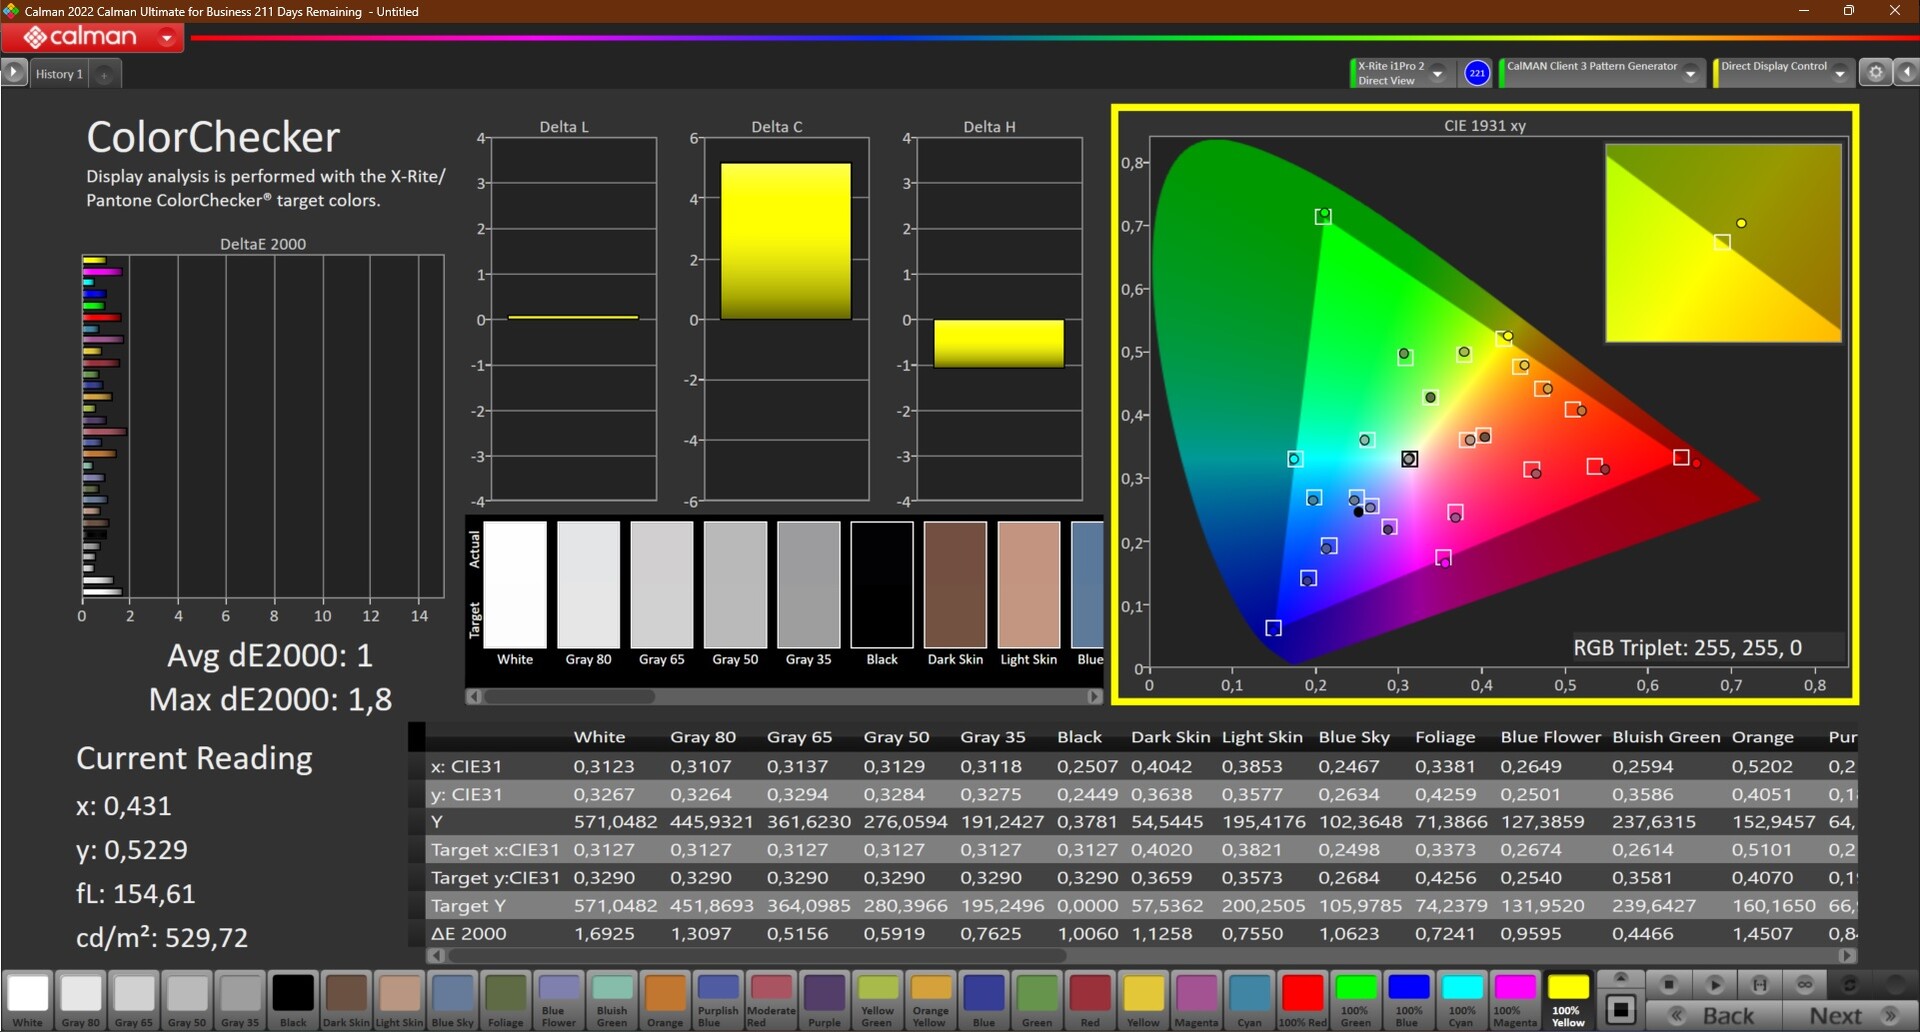
Fora da caixa, os desvios na escala de cinza medidos com o CalMAN são particularmente fortes, o que fica claro pelo alto valor deltaE na escala de cinza. Após a calibração com o Colorímetro X-Rite i1Pro 2 e o X-Rite i1Profiler, o valor deltaE geral foi um valor médio de 1, o que é um resultado muito bom.
Embora a Lenovo não tenha cumprido o brilho prometido, a especificação para a cobertura do espaço de cores está correta: medimos 99,99% de cobertura para o amplo espaço de cores AdobeRGB. Isso torna esse painel uma ótima opção para edição de imagens.


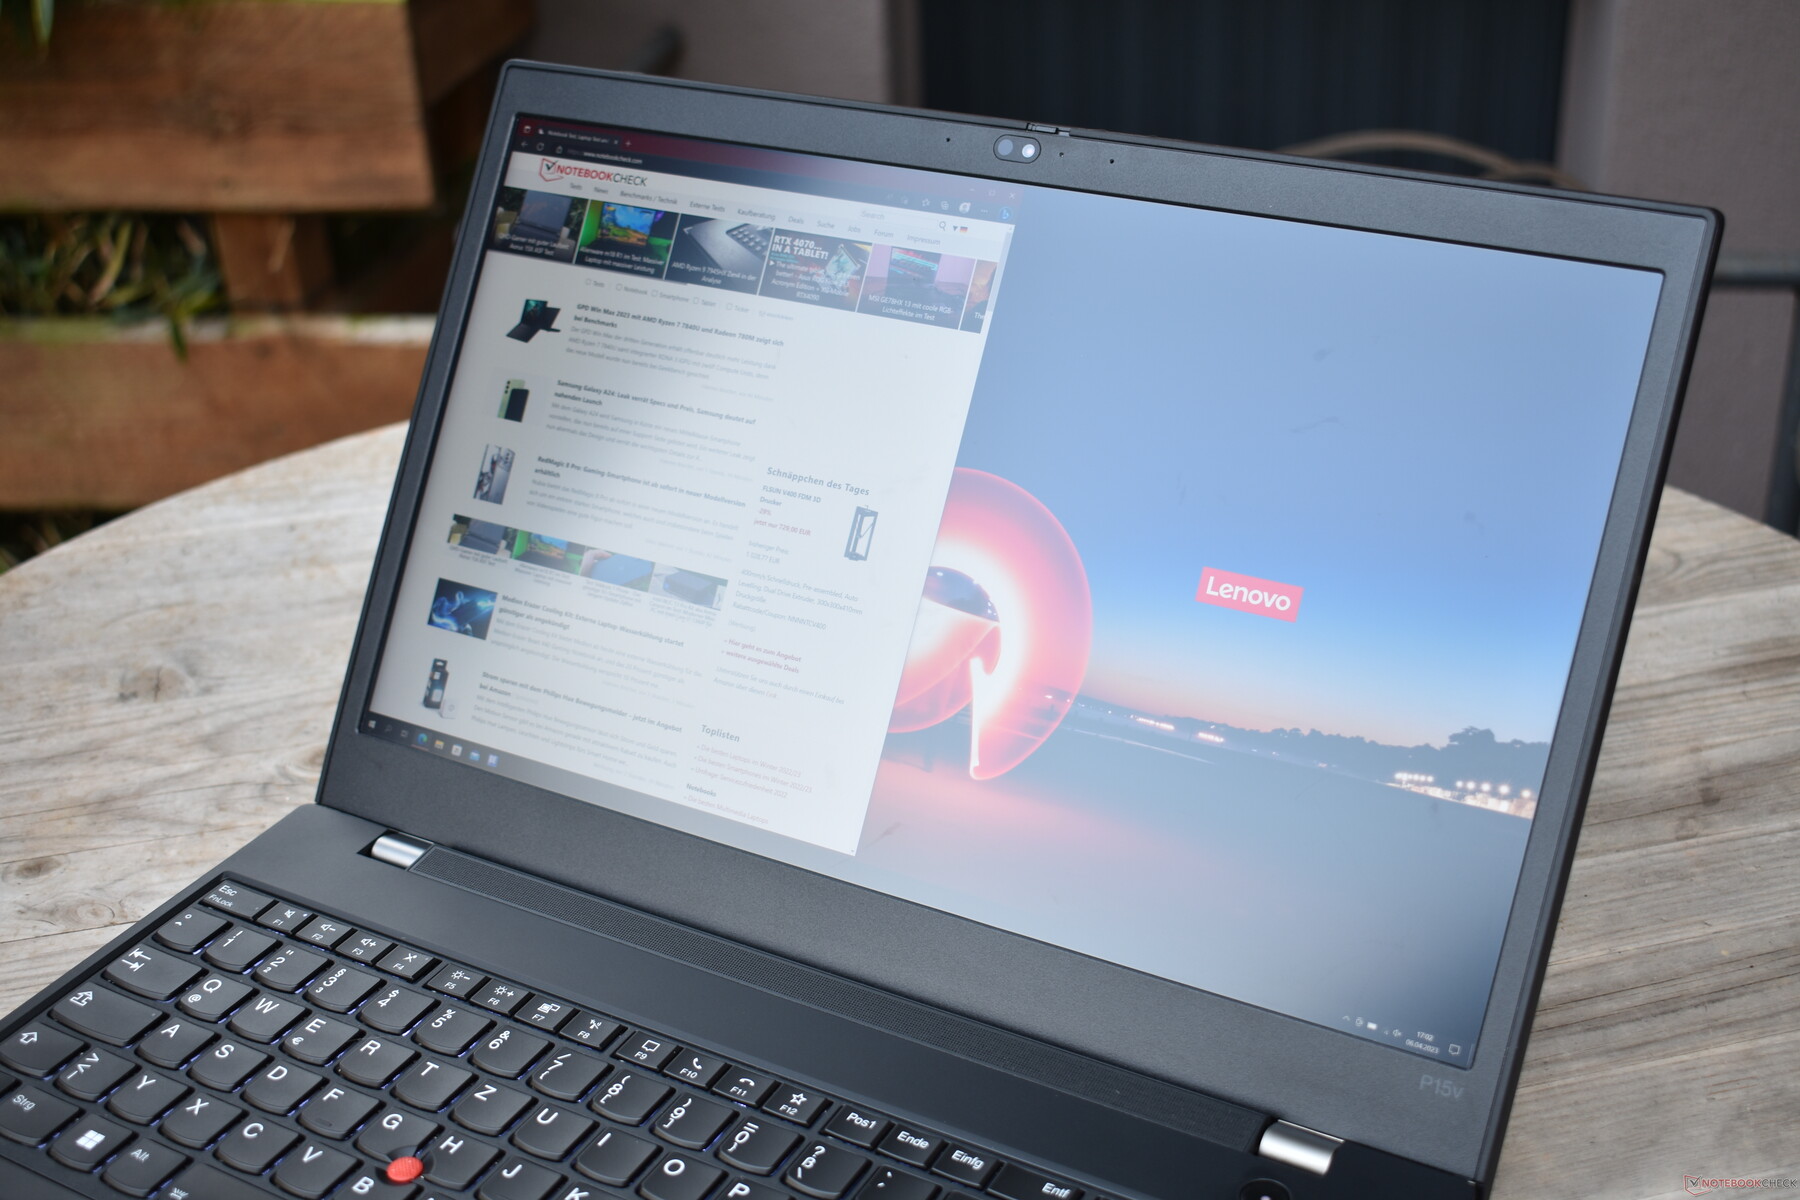
Com uma superfície de tela fosca e valores de brilho acima da marca de 500 cd/m², não é surpresa que o Lenovo ThinkPads P15v Gen 3 AMD seja adequado para uso externo.
Exibir tempos de resposta
| ↔ Tempo de resposta preto para branco | ||
|---|---|---|
| 27.3 ms ... ascensão ↗ e queda ↘ combinadas | ↗ 14.3 ms ascensão | 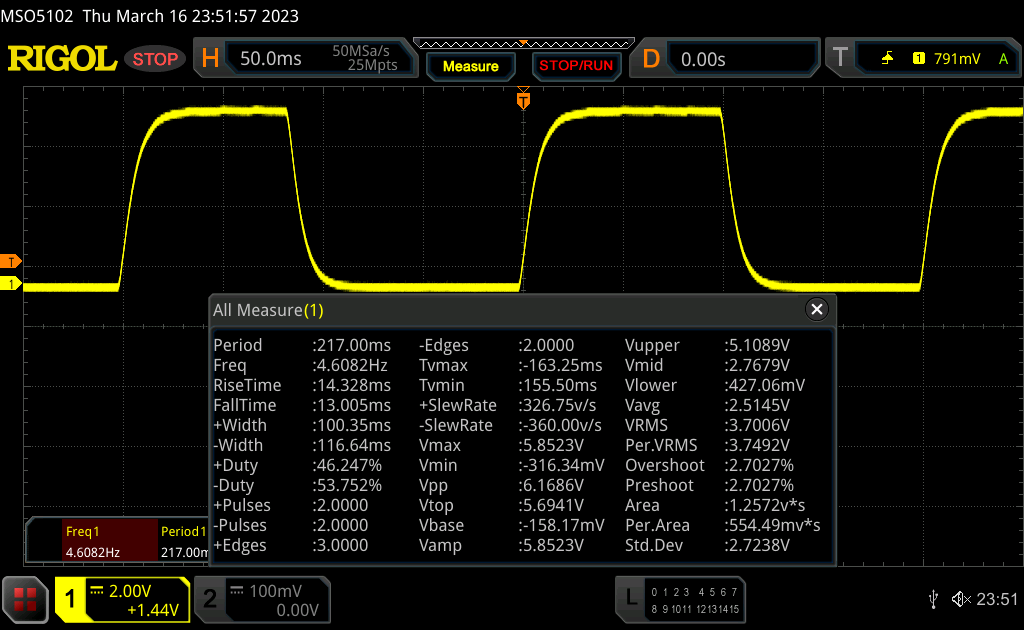 |
| ↘ 13 ms queda | ||
| A tela mostra taxas de resposta relativamente lentas em nossos testes e pode ser muito lenta para os jogadores. Em comparação, todos os dispositivos testados variam de 0.1 (mínimo) a 240 (máximo) ms. » 70 % de todos os dispositivos são melhores. Isso significa que o tempo de resposta medido é pior que a média de todos os dispositivos testados (19.8 ms). | ||
| ↔ Tempo de resposta 50% cinza a 80% cinza | ||
| 46.7 ms ... ascensão ↗ e queda ↘ combinadas | ↗ 21.5 ms ascensão | 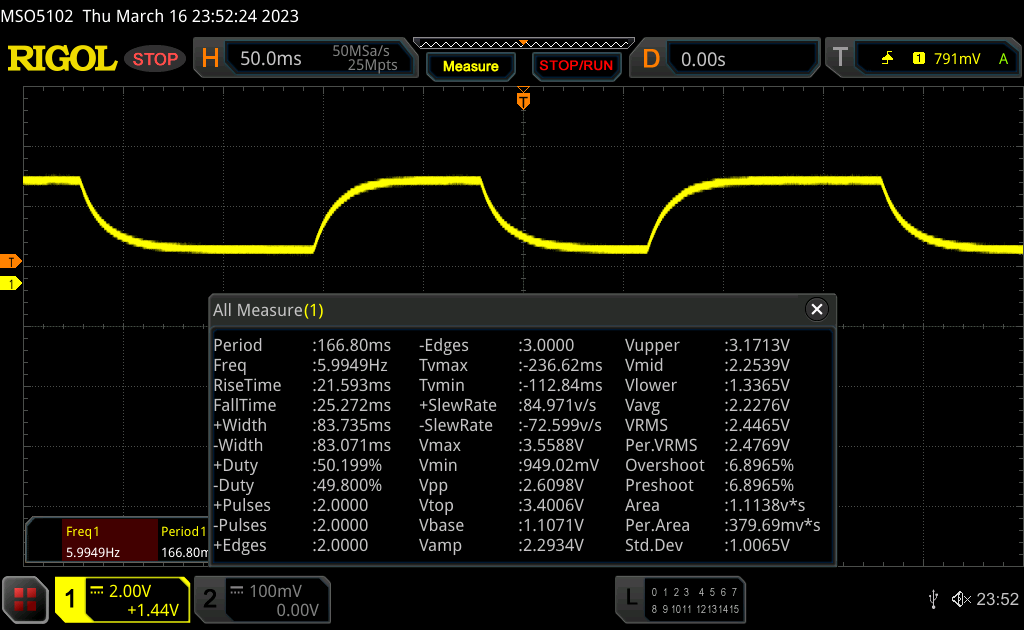 |
| ↘ 25.2 ms queda | ||
| A tela mostra taxas de resposta lentas em nossos testes e será insatisfatória para os jogadores. Em comparação, todos os dispositivos testados variam de 0.165 (mínimo) a 636 (máximo) ms. » 81 % de todos os dispositivos são melhores. Isso significa que o tempo de resposta medido é pior que a média de todos os dispositivos testados (31 ms). | ||
Cintilação da tela / PWM (modulação por largura de pulso)
| Tela tremeluzindo / PWM não detectado | 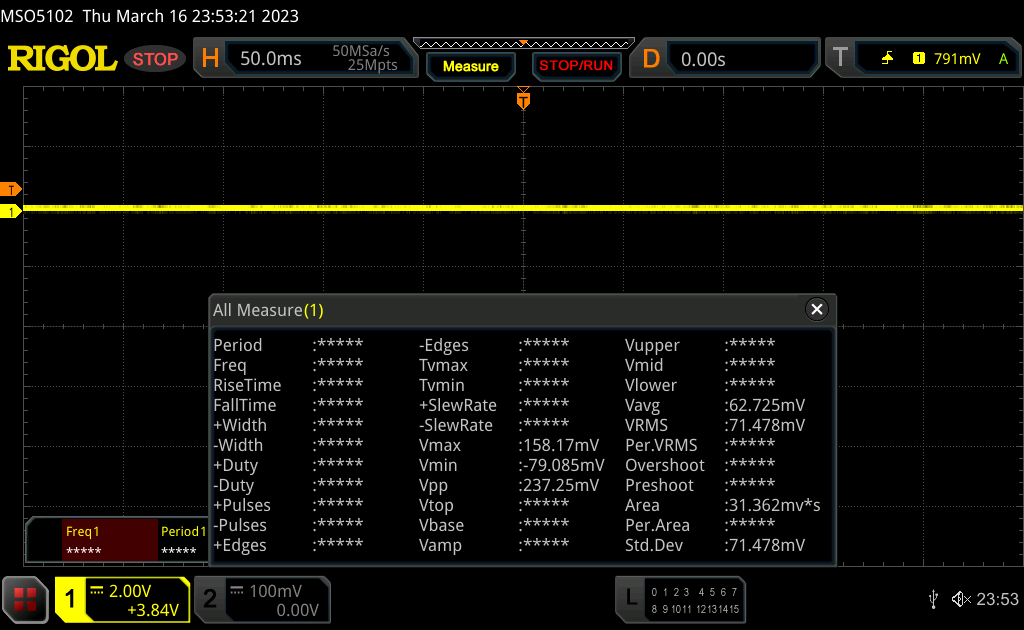 | ||
[pwm_comparison] Em comparação: 52 % de todos os dispositivos testados não usam PWM para escurecer a tela. Se PWM foi detectado, uma média de 7757 (mínimo: 5 - máximo: 343500) Hz foi medida. | |||
Desempenho: O desempenho muito bom da CPU encontra uma GPU limitada
A Lenovo oferece um total de dois processadores no ThinkPad P15v Gen 3 AMD: você pode escolher entre o Ryzen 7 Pro 6850H ou o Ryzen 5 Pro 6650H. Há mais uma opção para os chips gráficos, sendo que todos os três são da Nvidia: o T600, o RTX A1000 e o RTX A2000. Não há nenhuma variante sem uma GPU dedicada.
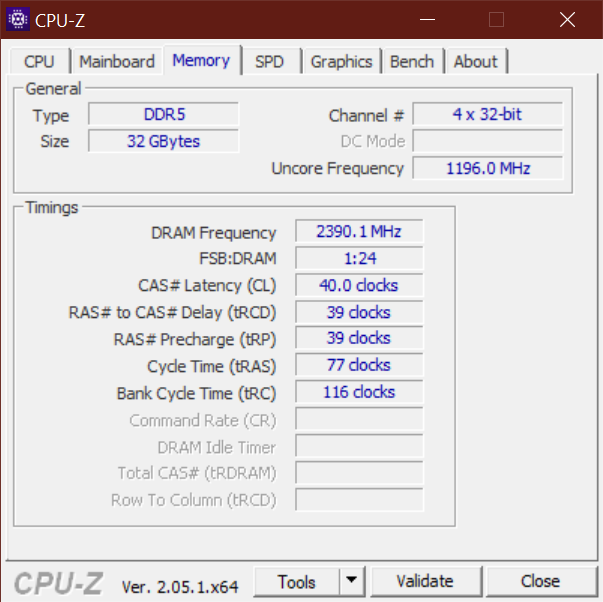
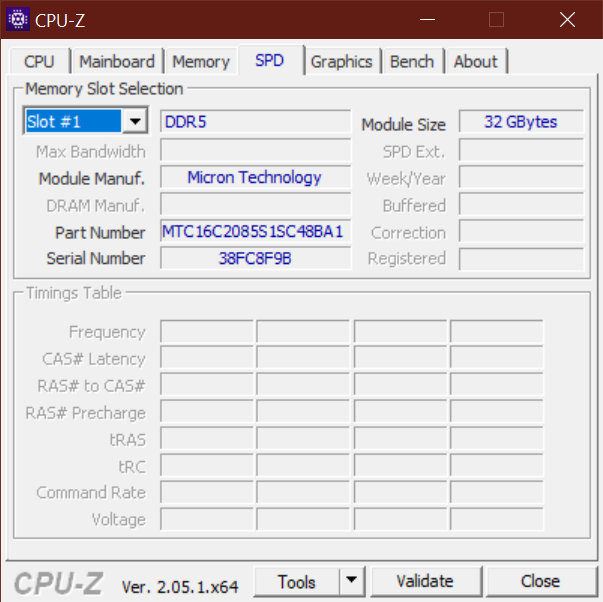
A expansão máxima da RAM é de 64 GB DDR5-4800, com dois slots SO-DIMM disponíveis. Há também dois slots M.2 2280, com a Lenovo oferecendo até 4 TB de espaço de armazenamento (dois de 2 TB).
Condições de teste
Há um total de dois modos de desempenho que podem ser selecionados nas configurações do Windows. Com o modo "Mais eficiência da bateria" ativado, o processador é limitado a 15 watts. Se o modo "melhor desempenho" ou "melhor desempenho" for selecionado, a CPU poderá consumir 65 watts brevemente, com um limite de energia de longo prazo de 54 watts.
O ThinkPad P15v G3 foi entregue com o Windows 10 Pro de 64 bits. Como no caso do ThinkPad P16 maior, tivemos o problema de que o Cinebench R15 era executado como uma tarefa em segundo plano e, portanto, o desempenho total não estava sendo usado. Portanto, mudamos para o mais recente Cinebench R23 para nosso teste de resistência.
Processador
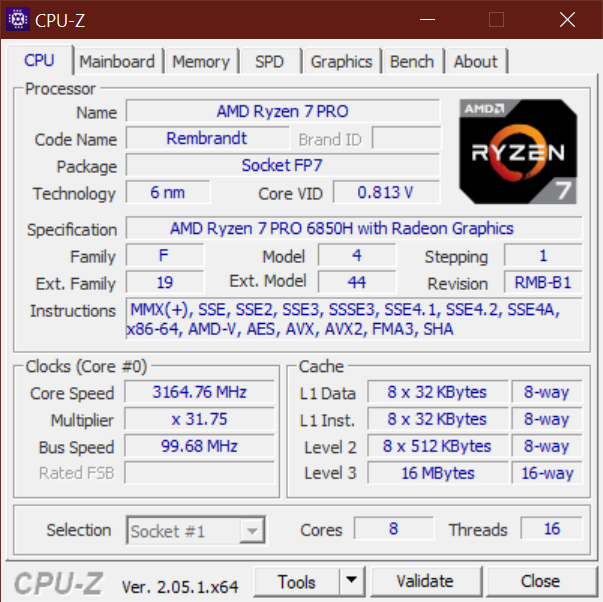
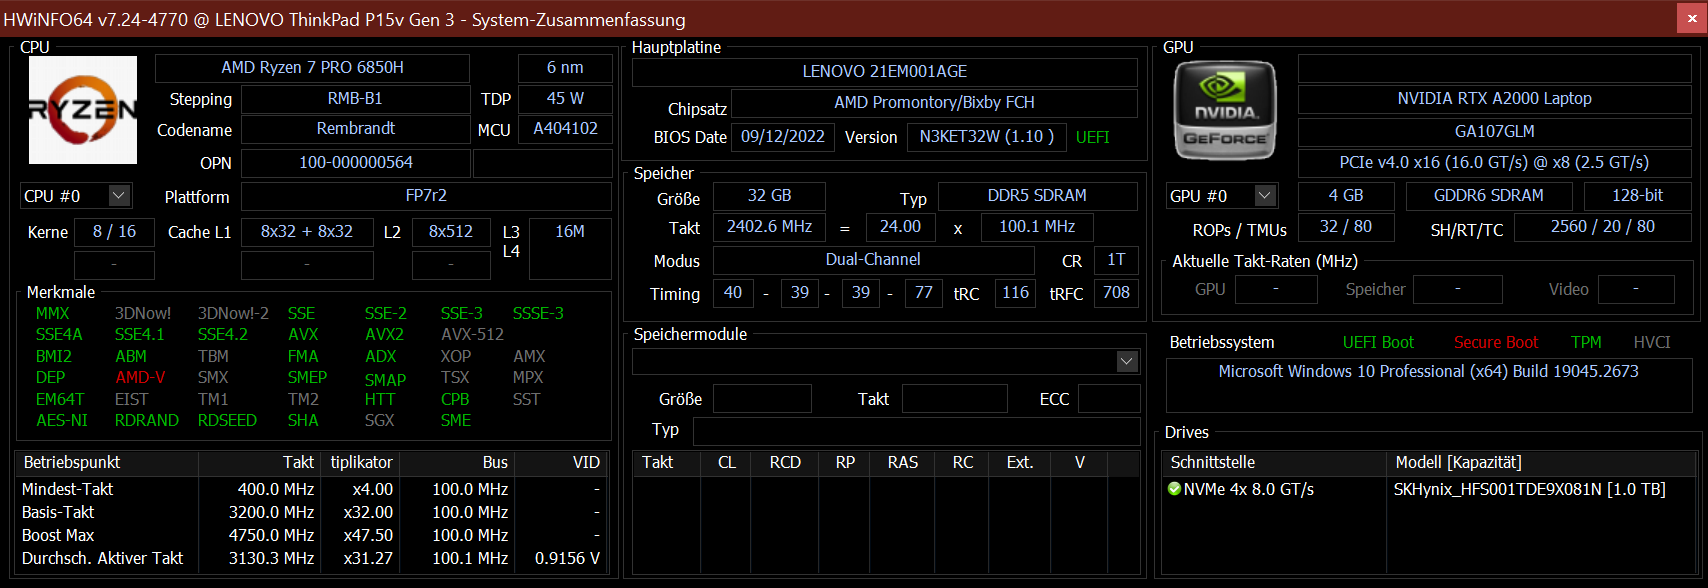
O AMD Ryzen 7 Pro 6850H é um processador de oito núcleos da geração "Rembrandt". A taxa de clock máxima é de 4,7 GHz, o clock base é de 3,2 GHz. Como um processador H, o TDP típico é de 45 watts. Nossa lista de CPUs pode ser usada para outras comparações de benchmark com outras CPUs.
O ThinkPad P15v G3 AMD tem um desempenho bastante bom nos benchmarks de CPU, considerando que o Lenovo ThinkPad P16 maior e o Dell Precision 7670 usam CPUs Intel HX55 nominalmente mais potentes, e está até mesmo empatado com o laptop Dell em carga contínua. No entanto, o resultado geral é prejudicado pelo desempenho de núcleo único; os concorrentes da Intel estão claramente à frente aqui. Somente o ThinkPad P16 é claramente mais rápido em todos os testes de CPU.
O desempenho do processador é reduzido no modo de bateria. Em vez de 4946 pontos, o ThinkPad P15v G3 atinge 2990 pontos no teste multi-core Cinebench R23. Isso corresponde a uma redução de energia de 40%.
Cinebench R23 Multi endurance test
Cinebench R23: Multi Core | Single Core
Cinebench R20: CPU (Multi Core) | CPU (Single Core)
Cinebench R15: CPU Multi 64Bit | CPU Single 64Bit
Blender: v2.79 BMW27 CPU
7-Zip 18.03: 7z b 4 | 7z b 4 -mmt1
Geekbench 5.5: Multi-Core | Single-Core
HWBOT x265 Benchmark v2.2: 4k Preset
LibreOffice : 20 Documents To PDF
R Benchmark 2.5: Overall mean
| CPU Performance rating | |
| Média da turma Workstation | |
| Lenovo ThinkPad P16 G1 21D6001DMB | |
| Dell Precision 7670 | |
| HP ZBook Power 15 G9 6B8C4EA | |
| Média AMD Ryzen 7 PRO 6850H | |
| Lenovo ThinkPad P15v G3 21EM001AGE | |
| Lenovo ThinkPad P15v G2 21A9000XGE -1! | |
| Cinebench R23 / Multi Core | |
| Média da turma Workstation (14621 - 38520, n=23, últimos 2 anos) | |
| Lenovo ThinkPad P16 G1 21D6001DMB | |
| Dell Precision 7670 | |
| HP ZBook Power 15 G9 6B8C4EA | |
| Lenovo ThinkPad P15v G3 21EM001AGE | |
| Média AMD Ryzen 7 PRO 6850H (12016 - 12770, n=2) | |
| Lenovo ThinkPad P15v G2 21A9000XGE | |
| Cinebench R23 / Single Core | |
| Média da turma Workstation (1712 - 2228, n=23, últimos 2 anos) | |
| Lenovo ThinkPad P16 G1 21D6001DMB | |
| HP ZBook Power 15 G9 6B8C4EA | |
| Dell Precision 7670 | |
| Média AMD Ryzen 7 PRO 6850H (1469 - 1491, n=2) | |
| Lenovo ThinkPad P15v G3 21EM001AGE | |
| Cinebench R20 / CPU (Multi Core) | |
| Média da turma Workstation (5760 - 15043, n=23, últimos 2 anos) | |
| Lenovo ThinkPad P16 G1 21D6001DMB | |
| Dell Precision 7670 | |
| HP ZBook Power 15 G9 6B8C4EA | |
| Lenovo ThinkPad P15v G3 21EM001AGE | |
| Lenovo ThinkPad P15v G3 21EM001AGE | |
| Média AMD Ryzen 7 PRO 6850H (2990 - 4946, n=3) | |
| Lenovo ThinkPad P15v G2 21A9000XGE | |
| Cinebench R20 / CPU (Single Core) | |
| Média da turma Workstation (671 - 857, n=23, últimos 2 anos) | |
| Lenovo ThinkPad P16 G1 21D6001DMB | |
| Dell Precision 7670 | |
| HP ZBook Power 15 G9 6B8C4EA | |
| Lenovo ThinkPad P15v G3 21EM001AGE | |
| Lenovo ThinkPad P15v G3 21EM001AGE | |
| Média AMD Ryzen 7 PRO 6850H (564 - 583, n=3) | |
| Lenovo ThinkPad P15v G2 21A9000XGE | |
| Cinebench R15 / CPU Multi 64Bit | |
| Média da turma Workstation (2489 - 5810, n=23, últimos 2 anos) | |
| Lenovo ThinkPad P16 G1 21D6001DMB | |
| Dell Precision 7670 | |
| Lenovo ThinkPad P15v G3 21EM001AGE | |
| Média AMD Ryzen 7 PRO 6850H (2081 - 2090, n=2) | |
| HP ZBook Power 15 G9 6B8C4EA | |
| Lenovo ThinkPad P15v G2 21A9000XGE | |
| Cinebench R15 / CPU Single 64Bit | |
| Média da turma Workstation (191.4 - 328, n=23, últimos 2 anos) | |
| Lenovo ThinkPad P16 G1 21D6001DMB | |
| Dell Precision 7670 | |
| HP ZBook Power 15 G9 6B8C4EA | |
| Lenovo ThinkPad P15v G2 21A9000XGE | |
| Média AMD Ryzen 7 PRO 6850H (166.2 - 244, n=2) | |
| Lenovo ThinkPad P15v G3 21EM001AGE | |
| Blender / v2.79 BMW27 CPU | |
| Lenovo ThinkPad P15v G2 21A9000XGE | |
| Lenovo ThinkPad P15v G3 21EM001AGE | |
| Média AMD Ryzen 7 PRO 6850H (235 - 248, n=2) | |
| HP ZBook Power 15 G9 6B8C4EA | |
| Dell Precision 7670 | |
| Lenovo ThinkPad P16 G1 21D6001DMB | |
| Média da turma Workstation (91 - 222, n=23, últimos 2 anos) | |
| 7-Zip 18.03 / 7z b 4 | |
| Média da turma Workstation (60489 - 116969, n=23, últimos 2 anos) | |
| Lenovo ThinkPad P16 G1 21D6001DMB | |
| HP ZBook Power 15 G9 6B8C4EA | |
| Média AMD Ryzen 7 PRO 6850H (52391 - 56498, n=2) | |
| Dell Precision 7670 | |
| Lenovo ThinkPad P15v G3 21EM001AGE | |
| Lenovo ThinkPad P15v G2 21A9000XGE | |
| 7-Zip 18.03 / 7z b 4 -mmt1 | |
| Média da turma Workstation (5126 - 6960, n=23, últimos 2 anos) | |
| Lenovo ThinkPad P16 G1 21D6001DMB | |
| HP ZBook Power 15 G9 6B8C4EA | |
| Dell Precision 7670 | |
| Lenovo ThinkPad P15v G3 21EM001AGE | |
| Média AMD Ryzen 7 PRO 6850H (5374 - 5460, n=2) | |
| Lenovo ThinkPad P15v G2 21A9000XGE | |
| Geekbench 5.5 / Multi-Core | |
| Média da turma Workstation (11542 - 25554, n=23, últimos 2 anos) | |
| Lenovo ThinkPad P16 G1 21D6001DMB | |
| HP ZBook Power 15 G9 6B8C4EA | |
| Dell Precision 7670 | |
| Média AMD Ryzen 7 PRO 6850H (8093 - 8851, n=2) | |
| Lenovo ThinkPad P15v G3 21EM001AGE | |
| Lenovo ThinkPad P15v G2 21A9000XGE | |
| Geekbench 5.5 / Single-Core | |
| Média da turma Workstation (1783 - 2183, n=23, últimos 2 anos) | |
| Lenovo ThinkPad P16 G1 21D6001DMB | |
| Dell Precision 7670 | |
| HP ZBook Power 15 G9 6B8C4EA | |
| Média AMD Ryzen 7 PRO 6850H (1474 - 1481, n=2) | |
| Lenovo ThinkPad P15v G2 21A9000XGE | |
| Lenovo ThinkPad P15v G3 21EM001AGE | |
| HWBOT x265 Benchmark v2.2 / 4k Preset | |
| Média da turma Workstation (17.8 - 40.5, n=23, últimos 2 anos) | |
| Dell Precision 7670 | |
| Lenovo ThinkPad P16 G1 21D6001DMB | |
| HP ZBook Power 15 G9 6B8C4EA | |
| Média AMD Ryzen 7 PRO 6850H (12.7 - 15.9, n=2) | |
| Lenovo ThinkPad P15v G3 21EM001AGE | |
| Lenovo ThinkPad P15v G2 21A9000XGE | |
| LibreOffice / 20 Documents To PDF | |
| Lenovo ThinkPad P15v G3 21EM001AGE | |
| Média AMD Ryzen 7 PRO 6850H (50.7 - 95.2, n=2) | |
| Lenovo ThinkPad P15v G2 21A9000XGE | |
| Dell Precision 7670 | |
| Média da turma Workstation (37.1 - 74.7, n=23, últimos 2 anos) | |
| Lenovo ThinkPad P16 G1 21D6001DMB | |
| HP ZBook Power 15 G9 6B8C4EA | |
| R Benchmark 2.5 / Overall mean | |
| Lenovo ThinkPad P15v G2 21A9000XGE | |
| Lenovo ThinkPad P15v G3 21EM001AGE | |
| Média AMD Ryzen 7 PRO 6850H (0.516 - 0.524, n=2) | |
| HP ZBook Power 15 G9 6B8C4EA | |
| Dell Precision 7670 | |
| Lenovo ThinkPad P16 G1 21D6001DMB | |
| Média da turma Workstation (0.3825 - 0.603, n=23, últimos 2 anos) | |
* ... menor é melhor
AIDA64: FP32 Ray-Trace | FPU Julia | CPU SHA3 | CPU Queen | FPU SinJulia | FPU Mandel | CPU AES | CPU ZLib | FP64 Ray-Trace | CPU PhotoWorxx
| Performance rating | |
| Média da turma Workstation | |
| Lenovo ThinkPad P16 G1 21D6001DMB | |
| Lenovo ThinkPad P15v G3 21EM001AGE | |
| Média AMD Ryzen 7 PRO 6850H | |
| HP ZBook Power 15 G9 6B8C4EA | |
| Dell Precision 7670 | |
| Lenovo ThinkPad P15v G2 21A9000XGE | |
| AIDA64 / FP32 Ray-Trace | |
| Média da turma Workstation (16730 - 61611, n=23, últimos 2 anos) | |
| Lenovo ThinkPad P16 G1 21D6001DMB | |
| Média AMD Ryzen 7 PRO 6850H (15009 - 15301, n=2) | |
| Lenovo ThinkPad P15v G3 21EM001AGE | |
| HP ZBook Power 15 G9 6B8C4EA | |
| Dell Precision 7670 | |
| Lenovo ThinkPad P15v G2 21A9000XGE | |
| AIDA64 / FPU Julia | |
| Média da turma Workstation (89597 - 186971, n=23, últimos 2 anos) | |
| Média AMD Ryzen 7 PRO 6850H (93021 - 94997, n=2) | |
| Lenovo ThinkPad P15v G3 21EM001AGE | |
| Lenovo ThinkPad P16 G1 21D6001DMB | |
| Dell Precision 7670 | |
| HP ZBook Power 15 G9 6B8C4EA | |
| Lenovo ThinkPad P15v G2 21A9000XGE | |
| AIDA64 / CPU SHA3 | |
| Média da turma Workstation (4178 - 8975, n=23, últimos 2 anos) | |
| Lenovo ThinkPad P16 G1 21D6001DMB | |
| Lenovo ThinkPad P15v G2 21A9000XGE | |
| HP ZBook Power 15 G9 6B8C4EA | |
| Média AMD Ryzen 7 PRO 6850H (3155 - 3169, n=2) | |
| Lenovo ThinkPad P15v G3 21EM001AGE | |
| Dell Precision 7670 | |
| AIDA64 / CPU Queen | |
| Média da turma Workstation (60778 - 144411, n=23, últimos 2 anos) | |
| Média AMD Ryzen 7 PRO 6850H (100724 - 102905, n=2) | |
| Lenovo ThinkPad P15v G3 21EM001AGE | |
| HP ZBook Power 15 G9 6B8C4EA | |
| Lenovo ThinkPad P16 G1 21D6001DMB | |
| Lenovo ThinkPad P15v G2 21A9000XGE | |
| Dell Precision 7670 | |
| AIDA64 / FPU SinJulia | |
| Média da turma Workstation (8165 - 29343, n=23, últimos 2 anos) | |
| Média AMD Ryzen 7 PRO 6850H (12309 - 12638, n=2) | |
| Lenovo ThinkPad P15v G3 21EM001AGE | |
| Lenovo ThinkPad P16 G1 21D6001DMB | |
| Dell Precision 7670 | |
| Lenovo ThinkPad P15v G2 21A9000XGE | |
| HP ZBook Power 15 G9 6B8C4EA | |
| AIDA64 / FPU Mandel | |
| Média da turma Workstation (44497 - 98153, n=23, últimos 2 anos) | |
| Média AMD Ryzen 7 PRO 6850H (51299 - 51802, n=2) | |
| Lenovo ThinkPad P15v G3 21EM001AGE | |
| Lenovo ThinkPad P16 G1 21D6001DMB | |
| Dell Precision 7670 | |
| HP ZBook Power 15 G9 6B8C4EA | |
| Lenovo ThinkPad P15v G2 21A9000XGE | |
| AIDA64 / CPU AES | |
| Lenovo ThinkPad P15v G3 21EM001AGE | |
| Média da turma Workstation (73133 - 187841, n=23, últimos 2 anos) | |
| Média AMD Ryzen 7 PRO 6850H (60476 - 128243, n=2) | |
| Lenovo ThinkPad P16 G1 21D6001DMB | |
| Lenovo ThinkPad P15v G2 21A9000XGE | |
| Dell Precision 7670 | |
| HP ZBook Power 15 G9 6B8C4EA | |
| AIDA64 / CPU ZLib | |
| Média da turma Workstation (929 - 2148, n=23, últimos 2 anos) | |
| Lenovo ThinkPad P16 G1 21D6001DMB | |
| HP ZBook Power 15 G9 6B8C4EA | |
| Dell Precision 7670 | |
| Lenovo ThinkPad P15v G3 21EM001AGE | |
| Média AMD Ryzen 7 PRO 6850H (806 - 809, n=2) | |
| Lenovo ThinkPad P15v G2 21A9000XGE | |
| AIDA64 / FP64 Ray-Trace | |
| Média da turma Workstation (8545 - 32891, n=23, últimos 2 anos) | |
| Lenovo ThinkPad P16 G1 21D6001DMB | |
| Média AMD Ryzen 7 PRO 6850H (7876 - 8104, n=2) | |
| Lenovo ThinkPad P15v G3 21EM001AGE | |
| Dell Precision 7670 | |
| HP ZBook Power 15 G9 6B8C4EA | |
| Lenovo ThinkPad P15v G2 21A9000XGE | |
| AIDA64 / CPU PhotoWorxx | |
| Média da turma Workstation (37151 - 93684, n=23, últimos 2 anos) | |
| HP ZBook Power 15 G9 6B8C4EA | |
| Dell Precision 7670 | |
| Lenovo ThinkPad P16 G1 21D6001DMB | |
| Média AMD Ryzen 7 PRO 6850H (18157 - 26176, n=2) | |
| Lenovo ThinkPad P15v G3 21EM001AGE | |
| Lenovo ThinkPad P15v G2 21A9000XGE | |
Desempenho do sistema
Os benchmarks de desempenho do sistema mostram um quadro misto. O ThinkPad P15v Gen 3 AMD alcança um resultado muito bom no PCMark 10, mas é mais lento do que a concorrência no CrossMark. A memória, em particular, é mais lenta do que os modelos Intel. No entanto, no uso diário, o P15v funciona muito rapidamente.
CrossMark: Overall | Productivity | Creativity | Responsiveness
| PCMark 10 / Score | |
| Média da turma Workstation (6563 - 10409, n=19, últimos 2 anos) | |
| Dell Precision 7670 | |
| Lenovo ThinkPad P15v G3 21EM001AGE | |
| Média AMD Ryzen 7 PRO 6850H, NVIDIA RTX A2000 Laptop GPU (n=1) | |
| HP ZBook Power 15 G9 6B8C4EA | |
| Lenovo ThinkPad P16 G1 21D6001DMB | |
| Lenovo ThinkPad P15v G2 21A9000XGE | |
| PCMark 10 / Essentials | |
| Dell Precision 7670 | |
| Média da turma Workstation (9622 - 11157, n=19, últimos 2 anos) | |
| Lenovo ThinkPad P16 G1 21D6001DMB | |
| Lenovo ThinkPad P15v G3 21EM001AGE | |
| Média AMD Ryzen 7 PRO 6850H, NVIDIA RTX A2000 Laptop GPU (n=1) | |
| HP ZBook Power 15 G9 6B8C4EA | |
| Lenovo ThinkPad P15v G2 21A9000XGE | |
| PCMark 10 / Productivity | |
| Média da turma Workstation (8789 - 20616, n=19, últimos 2 anos) | |
| Lenovo ThinkPad P16 G1 21D6001DMB | |
| Dell Precision 7670 | |
| Lenovo ThinkPad P15v G3 21EM001AGE | |
| Média AMD Ryzen 7 PRO 6850H, NVIDIA RTX A2000 Laptop GPU (n=1) | |
| Lenovo ThinkPad P15v G2 21A9000XGE | |
| HP ZBook Power 15 G9 6B8C4EA | |
| PCMark 10 / Digital Content Creation | |
| Média da turma Workstation (8108 - 15631, n=19, últimos 2 anos) | |
| Lenovo ThinkPad P15v G3 21EM001AGE | |
| Média AMD Ryzen 7 PRO 6850H, NVIDIA RTX A2000 Laptop GPU (n=1) | |
| HP ZBook Power 15 G9 6B8C4EA | |
| Dell Precision 7670 | |
| Lenovo ThinkPad P16 G1 21D6001DMB | |
| Lenovo ThinkPad P15v G2 21A9000XGE | |
| CrossMark / Overall | |
| Média da turma Workstation (1307 - 2267, n=22, últimos 2 anos) | |
| Lenovo ThinkPad P16 G1 21D6001DMB | |
| HP ZBook Power 15 G9 6B8C4EA | |
| Dell Precision 7670 | |
| Lenovo ThinkPad P15v G2 21A9000XGE | |
| Lenovo ThinkPad P15v G3 21EM001AGE | |
| Média AMD Ryzen 7 PRO 6850H, NVIDIA RTX A2000 Laptop GPU (n=1) | |
| CrossMark / Productivity | |
| Média da turma Workstation (1130 - 2122, n=22, últimos 2 anos) | |
| Lenovo ThinkPad P16 G1 21D6001DMB | |
| HP ZBook Power 15 G9 6B8C4EA | |
| Dell Precision 7670 | |
| Lenovo ThinkPad P15v G3 21EM001AGE | |
| Média AMD Ryzen 7 PRO 6850H, NVIDIA RTX A2000 Laptop GPU (n=1) | |
| Lenovo ThinkPad P15v G2 21A9000XGE | |
| CrossMark / Creativity | |
| Média da turma Workstation (1657 - 2725, n=22, últimos 2 anos) | |
| Lenovo ThinkPad P16 G1 21D6001DMB | |
| HP ZBook Power 15 G9 6B8C4EA | |
| Dell Precision 7670 | |
| Lenovo ThinkPad P15v G2 21A9000XGE | |
| Lenovo ThinkPad P15v G3 21EM001AGE | |
| Média AMD Ryzen 7 PRO 6850H, NVIDIA RTX A2000 Laptop GPU (n=1) | |
| CrossMark / Responsiveness | |
| Média da turma Workstation (993 - 2096, n=22, últimos 2 anos) | |
| Lenovo ThinkPad P16 G1 21D6001DMB | |
| HP ZBook Power 15 G9 6B8C4EA | |
| Lenovo ThinkPad P15v G3 21EM001AGE | |
| Média AMD Ryzen 7 PRO 6850H, NVIDIA RTX A2000 Laptop GPU (n=1) | |
| Dell Precision 7670 | |
| Lenovo ThinkPad P15v G2 21A9000XGE | |
| PCMark 10 Score | 6457 pontos | |
Ajuda | ||
| AIDA64 / Memory Copy | |
| Média da turma Workstation (56003 - 164795, n=23, últimos 2 anos) | |
| HP ZBook Power 15 G9 6B8C4EA | |
| Dell Precision 7670 | |
| Lenovo ThinkPad P16 G1 21D6001DMB | |
| Média AMD Ryzen 7 PRO 6850H (30324 - 48504, n=2) | |
| Lenovo ThinkPad P15v G3 21EM001AGE | |
| Lenovo ThinkPad P15v G2 21A9000XGE | |
| AIDA64 / Memory Read | |
| Média da turma Workstation (55795 - 121563, n=23, últimos 2 anos) | |
| Dell Precision 7670 | |
| HP ZBook Power 15 G9 6B8C4EA | |
| Lenovo ThinkPad P16 G1 21D6001DMB | |
| Média AMD Ryzen 7 PRO 6850H (33791 - 42736, n=2) | |
| Lenovo ThinkPad P15v G3 21EM001AGE | |
| Lenovo ThinkPad P15v G2 21A9000XGE | |
| AIDA64 / Memory Write | |
| Média da turma Workstation (55663 - 214520, n=23, últimos 2 anos) | |
| HP ZBook Power 15 G9 6B8C4EA | |
| Dell Precision 7670 | |
| Lenovo ThinkPad P16 G1 21D6001DMB | |
| Média AMD Ryzen 7 PRO 6850H (32728 - 51157, n=2) | |
| Lenovo ThinkPad P15v G3 21EM001AGE | |
| Lenovo ThinkPad P15v G2 21A9000XGE | |
| AIDA64 / Memory Latency | |
| Média da turma Workstation (84.5 - 165.2, n=23, últimos 2 anos) | |
| Média AMD Ryzen 7 PRO 6850H (93.5 - 132.1, n=2) | |
| Lenovo ThinkPad P16 G1 21D6001DMB | |
| Lenovo ThinkPad P15v G2 21A9000XGE | |
| Lenovo ThinkPad P15v G3 21EM001AGE | |
| HP ZBook Power 15 G9 6B8C4EA | |
| Dell Precision 7670 | |
* ... menor é melhor
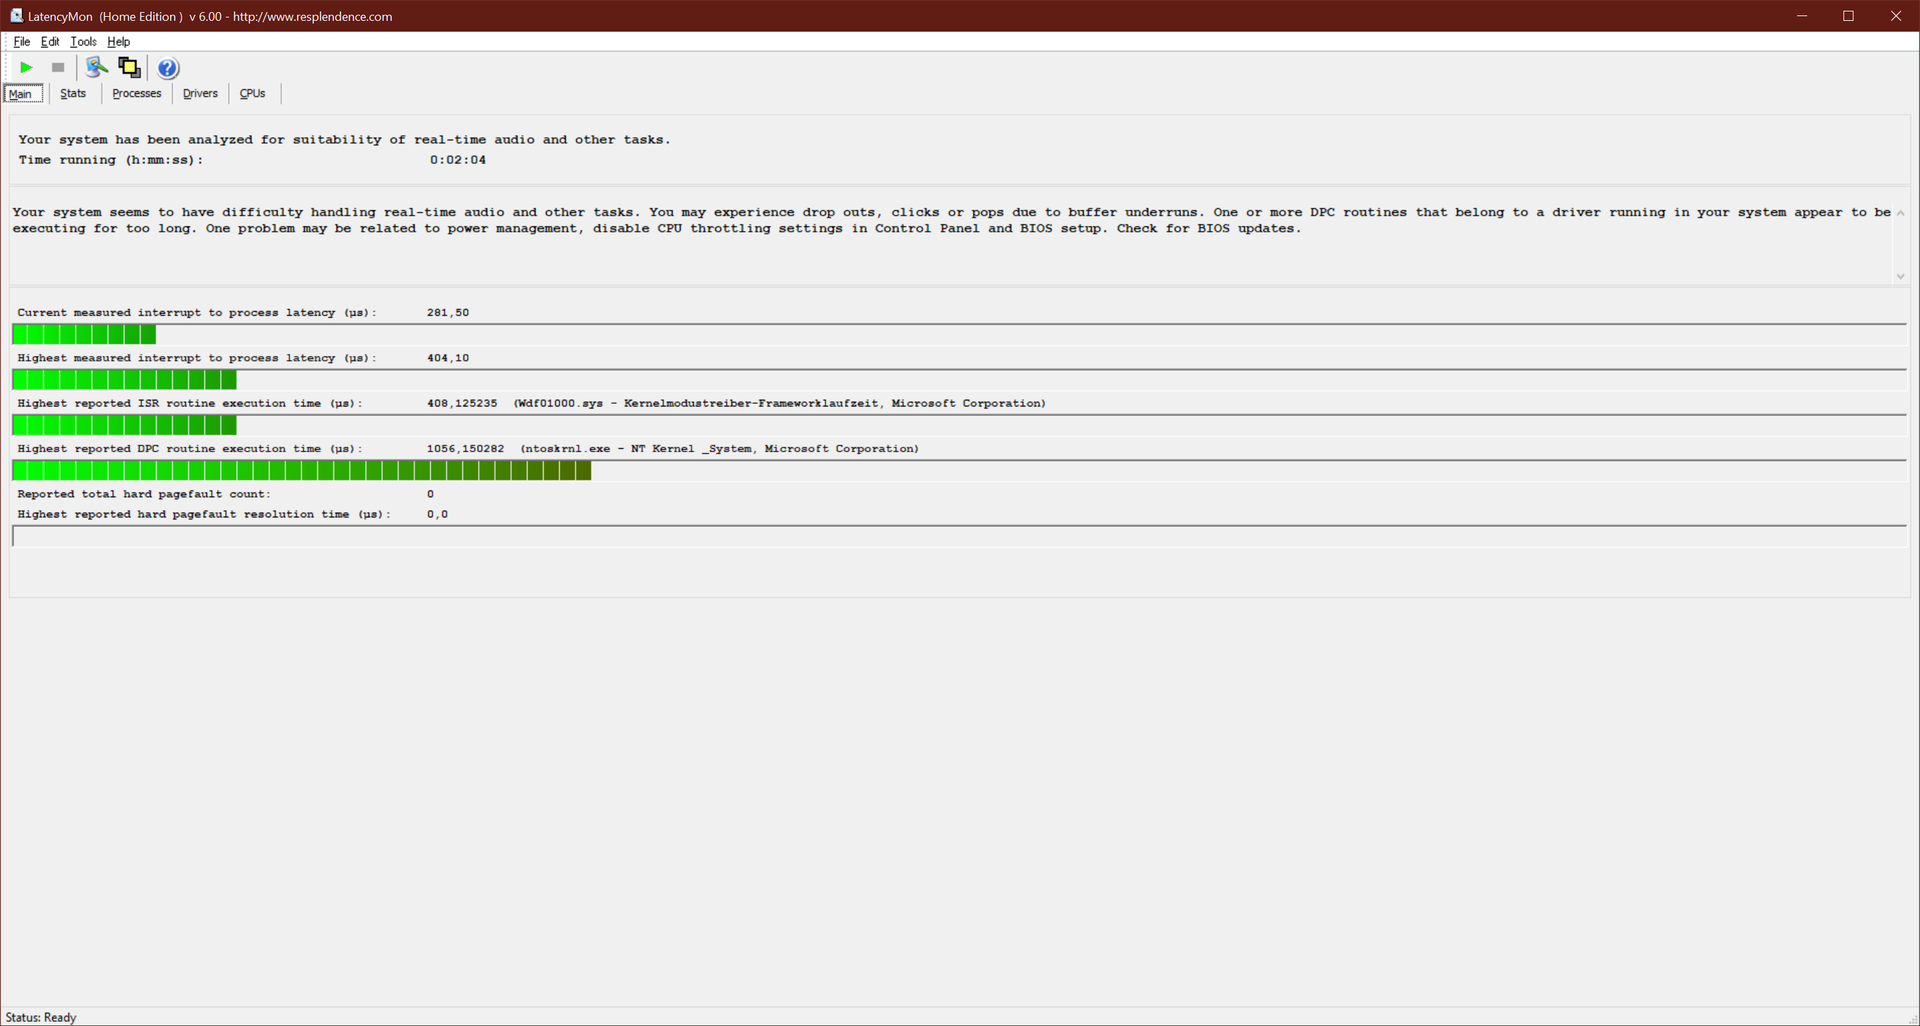
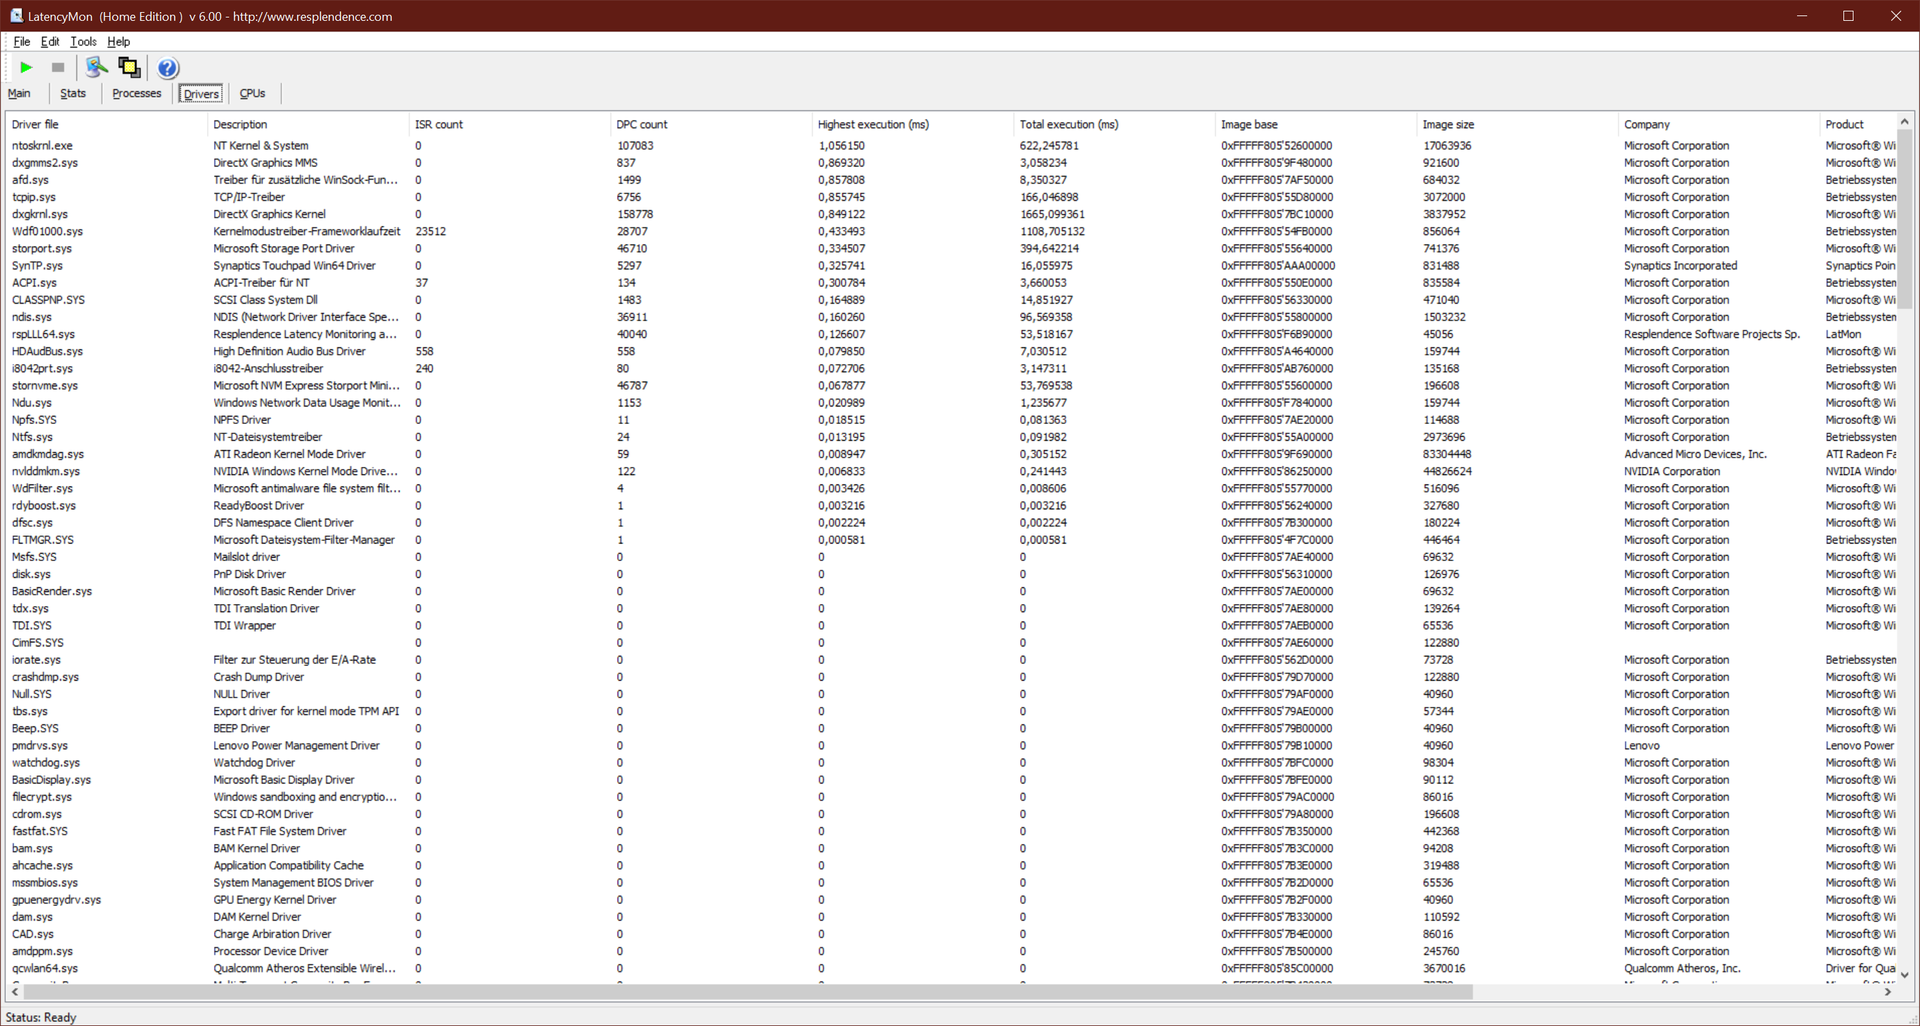
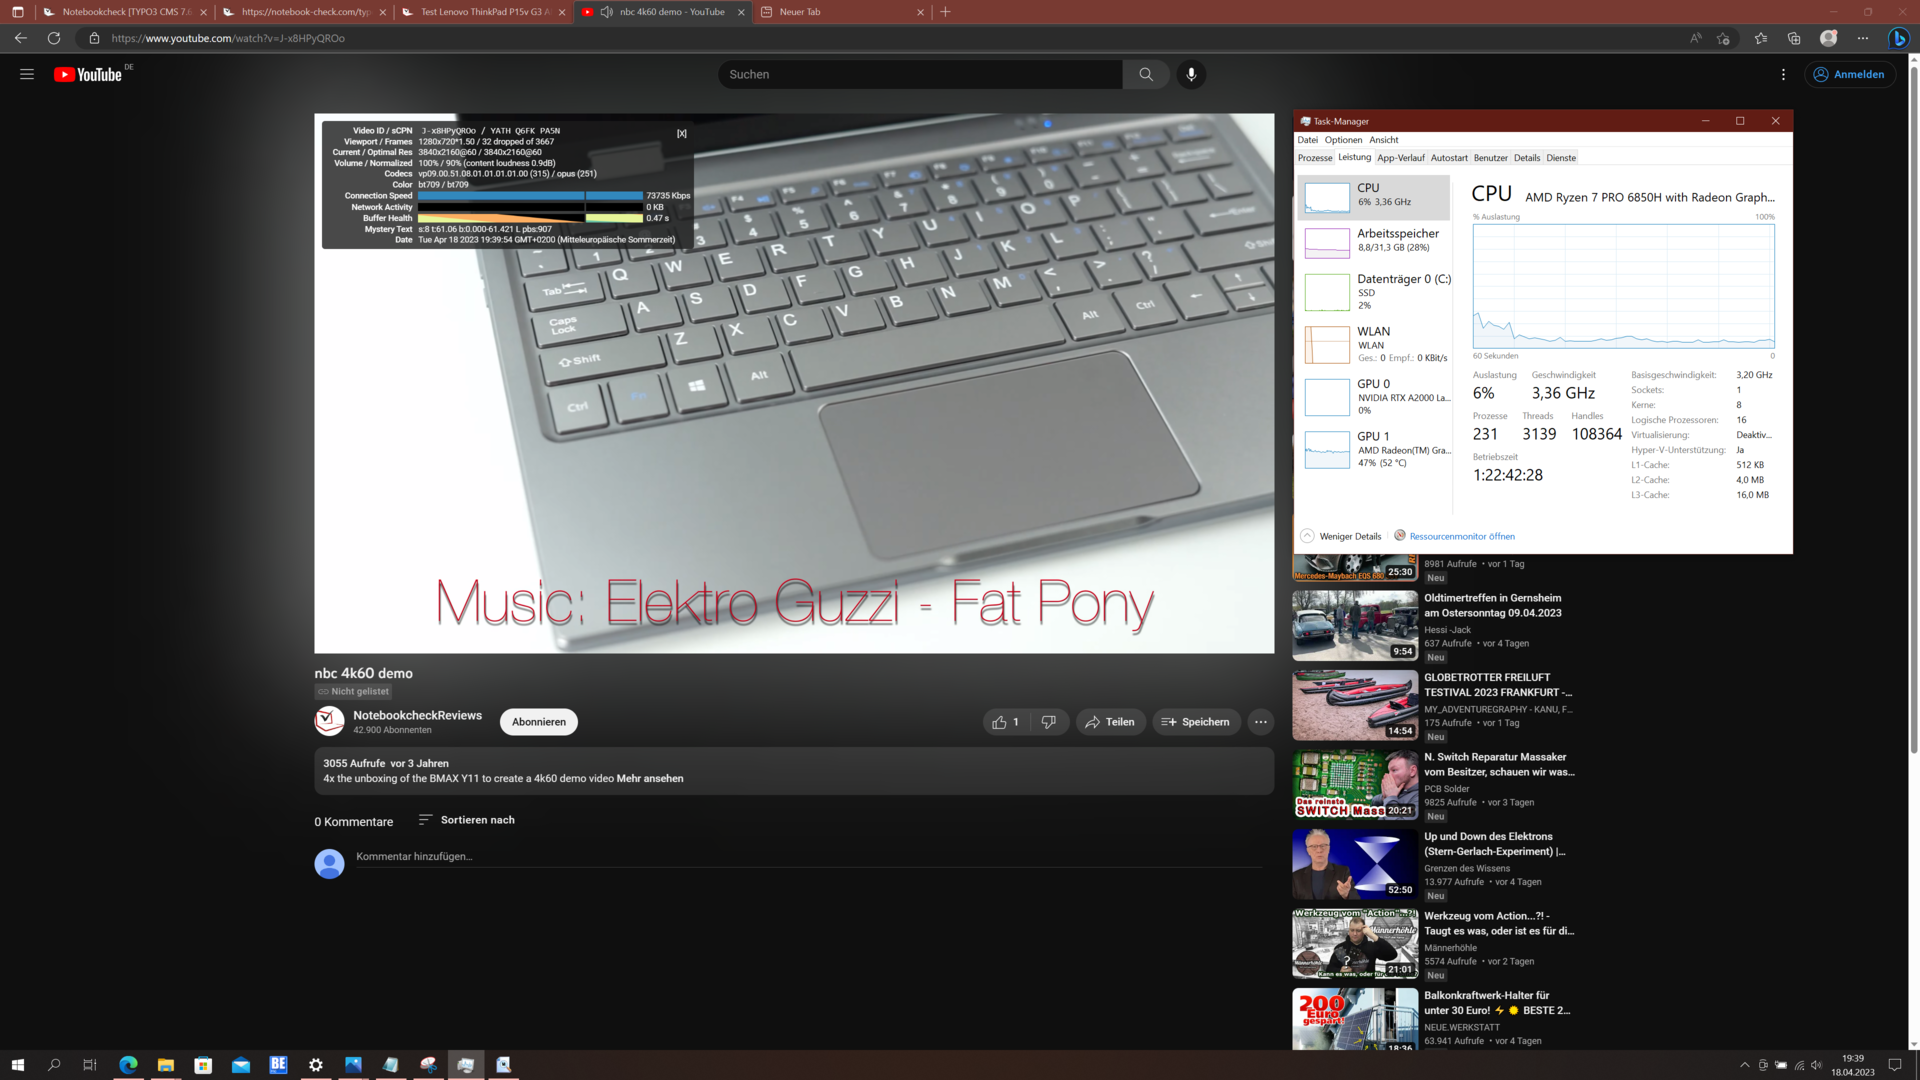
Latência DPC
A latência DPC é menor do que a da concorrência, mas esse laptop Lenovo ainda tem problemas com a reprodução de vídeo. Observamos um total de 32 quadros perdidos no teste do YouTube. No entanto, esse comportamento pode mudar a qualquer momento com uma atualização de driver.
| DPC Latencies / LatencyMon - interrupt to process latency (max), Web, Youtube, Prime95 | |
| Lenovo ThinkPad P15v G2 21A9000XGE | |
| Dell Precision 7670 | |
| Lenovo ThinkPad P16 G1 21D6001DMB | |
| HP ZBook Power 15 G9 6B8C4EA | |
| Lenovo ThinkPad P15v G3 21EM001AGE | |
* ... menor é melhor
Armazenamento em massa
A Lenovo envia o ThinkPad P15v G3 AMD com um máximo de dois SSDs M.2 2280. Nossa unidade de teste teve que se contentar com uma SSD, uma rápida SSD NVMe PCIe 4.0 de 1 TB da SK Hynix. Seu desempenho foi bastante alto e também é bom sob carga contínua.

* ... menor é melhor
Continuous read: DiskSpd Read Loop, Queue Depth 8
GPU
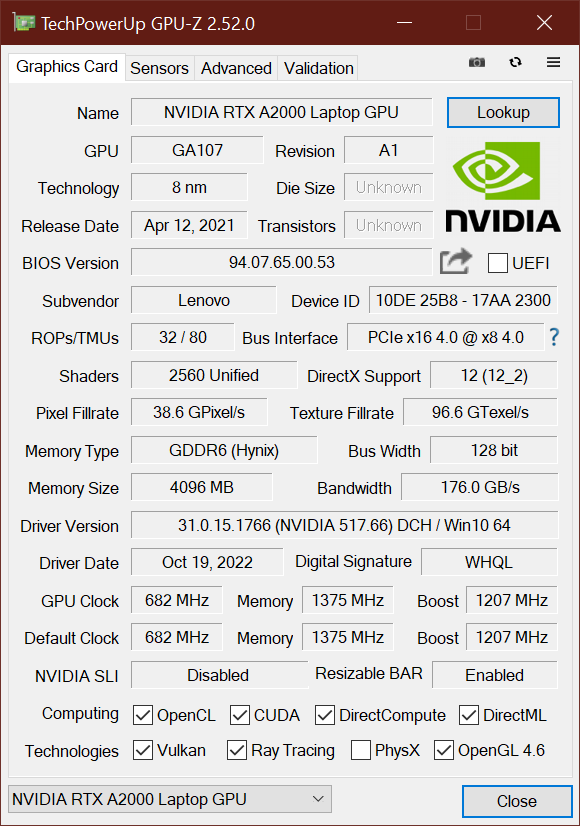
A Nvidia RTX A2000 é uma GPU de nível básico para aplicativos profissionais da Nvidia, com os drivers certificados pela ISV sendo particularmente otimizados para CAD. As 2.560 unidades de sombreamento funcionam a um máximo de 1,69 GHz, o TGP é de no máximo 95 watts, enquanto a memória principal é de quatro a oito gigabytes. É possível fazer comparações de benchmark com nossa lista de comparação de GPUs.
A Lenovo especifica um TGP de 35 watts para a GPU, o mínimo absoluto para o RTX A2000. Essa também é a variante mais fraca com 4 GB de memória. O consumo máximo do nosso dispositivo de teste é de 40 watts, o que ainda é bastante baixo. Tanto o ThinkPad P16 G1 (60 watts) quanto o Dell Precision 7670 (95 watts) permitem que o mesmo chip gráfico consuma significativamente mais. Nesse sentido, os resultados de benchmark de GPU bastante baixos do P15v Gen 3 não são surpreendentes - ao mesmo tempo, ele ainda é a estação de trabalho ThinkPad mais poderosa com um processador AMD.
No modo de bateria, a estação de trabalho da Lenovo ainda alcançou 11.792 pontos no teste gráfico 3DMark 11. Isso corresponde a uma redução no desempenho da GPU de cerca de 20%.
| SPECviewperf Performance rating - Percent | |
| Média da turma Workstation -1! | |
| Lenovo ThinkPad P16 G1 RTX A5500 | |
| Dell Precision 7670 -1! | |
| HP ZBook Power 15 G9 6B8C4EA -8! | |
| Média NVIDIA RTX A2000 Laptop GPU | |
| Lenovo ThinkPad P15v G3 21EM001AGE | |
| Lenovo ThinkPad P15v G2 21A9000XGE -8! | |
| 3DMark 11 Performance | 14564 pontos | |
| 3DMark Cloud Gate Standard Score | 36070 pontos | |
| 3DMark Fire Strike Score | 10333 pontos | |
| 3DMark Time Spy Score | 4566 pontos | |
Ajuda | ||
* ... menor é melhor
Desempenho em jogos
O desempenho em jogos está mais ou menos de acordo com o que esperávamos dos benchmarks sintéticos: o desempenho é melhor que o do ThinkPad P15v Gen 2 com Nvidia T1200, mas pior que o de todos os outros concorrentes. É suficiente para jogos em Full HD, mas as taxas de quadros caem rapidamente em resoluções mais altas.
| The Witcher 3 - 1920x1080 Ultra Graphics & Postprocessing (HBAO+) | |
| Lenovo ThinkPad P16 G1 RTX A5500 | |
| Média da turma Workstation (n=1últimos 2 anos) | |
| Dell Precision 7670 | |
| HP ZBook Power 15 G9 6B8C4EA | |
| Lenovo ThinkPad P15v G3 21EM001AGE | |
| Lenovo ThinkPad P15v G2 21A9000XGE | |
| Final Fantasy XV Benchmark - 1920x1080 High Quality | |
| Lenovo ThinkPad P16 G1 RTX A5500 | |
| Média da turma Workstation (26.4 - 197.6, n=23, últimos 2 anos) | |
| Dell Precision 7670 | |
| HP ZBook Power 15 G9 6B8C4EA | |
| Lenovo ThinkPad P15v G3 21EM001AGE | |
| Lenovo ThinkPad P15v G2 21A9000XGE | |
| Strange Brigade - 1920x1080 ultra AA:ultra AF:16 | |
| Média da turma Workstation (93.2 - 418, n=17, últimos 2 anos) | |
| Lenovo ThinkPad P16 G1 RTX A5500 | |
| Dell Precision 7670 | |
| HP ZBook Power 15 G9 6B8C4EA | |
| Lenovo ThinkPad P15v G3 21EM001AGE | |
| Lenovo ThinkPad P15v G2 21A9000XGE | |
| Dota 2 Reborn - 1920x1080 ultra (3/3) best looking | |
| Lenovo ThinkPad P16 G1 RTX A5500 | |
| Média da turma Workstation (50.7 - 178.4, n=23, últimos 2 anos) | |
| Dell Precision 7670 | |
| HP ZBook Power 15 G9 6B8C4EA | |
| Lenovo ThinkPad P15v G2 21A9000XGE | |
| Lenovo ThinkPad P15v G3 21EM001AGE | |
Witcher 3 FPS diagram
| baixo | média | alto | ultra | QHD | 4K | |
|---|---|---|---|---|---|---|
| GTA V (2015) | 167.3 | 157.6 | 117.2 | 61.1 | 44.1 | 41.2 |
| The Witcher 3 (2015) | 218 | 145.6 | 82.2 | 43.9 | 29.2 | |
| Dota 2 Reborn (2015) | 122.3 | 111.1 | 105.3 | 100.4 | 64.2 | |
| Final Fantasy XV Benchmark (2018) | 112.5 | 62.5 | 46 | 33.4 | 17.7 | |
| X-Plane 11.11 (2018) | 88.2 | 77 | 63.2 | 51.3 | ||
| Strange Brigade (2018) | 238 | 113.8 | 89.9 | 77.9 | 57.1 | 33 |
| F1 22 (2022) | 130.3 | 125.8 | 89.5 | 27.6 | 16.7 | 7.1 |
Emissões: o ThinkPad P15v é mais silencioso do que a concorrência
Emissões de ruído
O Lenovo ThinkPad P15v G3 tem um sistema de resfriamento fraco para uma estação de trabalho, com apenas uma ventoinha. Apesar do bom desempenho do laptop, a ventoinha geralmente permanece silenciosa ou comparativamente silenciosa. O ruído máximo do ventilador fica abaixo de 40 dB(a) - alguns dos dispositivos de comparação são significativamente mais altos.
Não detectamos nenhum ruído de bobina no Lenovo ThinkPad.
Barulho
| Ocioso |
| 23.2 / 23.2 / 23.2 dB |
| Carga |
| 35 / 37.5 dB |
 | ||
30 dB silencioso 40 dB(A) audível 50 dB(A) ruidosamente alto |
||
min: | ||
| Lenovo ThinkPad P15v G3 21EM001AGE RTX A2000 Laptop GPU, R7 PRO 6850H, SK Hynix PC711 1TB HFS001TDE9X081N | Lenovo ThinkPad P16 G1 21D6001DMB RTX A2000 Laptop GPU, i7-12850HX, Micron 3400 1TB MTFDKBA1T0TFH | Lenovo ThinkPad P15v G2 21A9000XGE T1200 Laptop GPU, i7-11800H, Toshiba XG6 KXG6AZNV512G | HP ZBook Power 15 G9 6B8C4EA RTX A2000 Laptop GPU, i7-12700H, Samsung PM9A1 MZVL21T0HCLR | Dell Precision 7670 RTX A2000 Laptop GPU, i7-12850HX, SK Hynix HFS001TEJ9X115N | |
|---|---|---|---|---|---|
| Noise | -11% | -9% | -11% | -14% | |
| desligado / ambiente * (dB) | 23.2 | 23.2 -0% | 25.21 -9% | 23.8 -3% | 22.7 2% |
| Idle Minimum * (dB) | 23.2 | 23.2 -0% | 25.21 -9% | 23.8 -3% | 22.9 1% |
| Idle Average * (dB) | 23.2 | 23.2 -0% | 25.21 -9% | 23.8 -3% | 22.9 1% |
| Idle Maximum * (dB) | 23.2 | 23.2 -0% | 25.21 -9% | 23.8 -3% | 24.5 -6% |
| Load Average * (dB) | 35 | 47.8 -37% | 39.09 -12% | 42.9 -23% | 48.7 -39% |
| Witcher 3 ultra * (dB) | 37.9 | 34.1 10% | 36.6 3% | 44.5 -17% | 45.2 -19% |
| Load Maximum * (dB) | 37.5 | 56.3 -50% | 43.53 -16% | 47.9 -28% | 52.1 -39% |
* ... menor é melhor
Temperatura
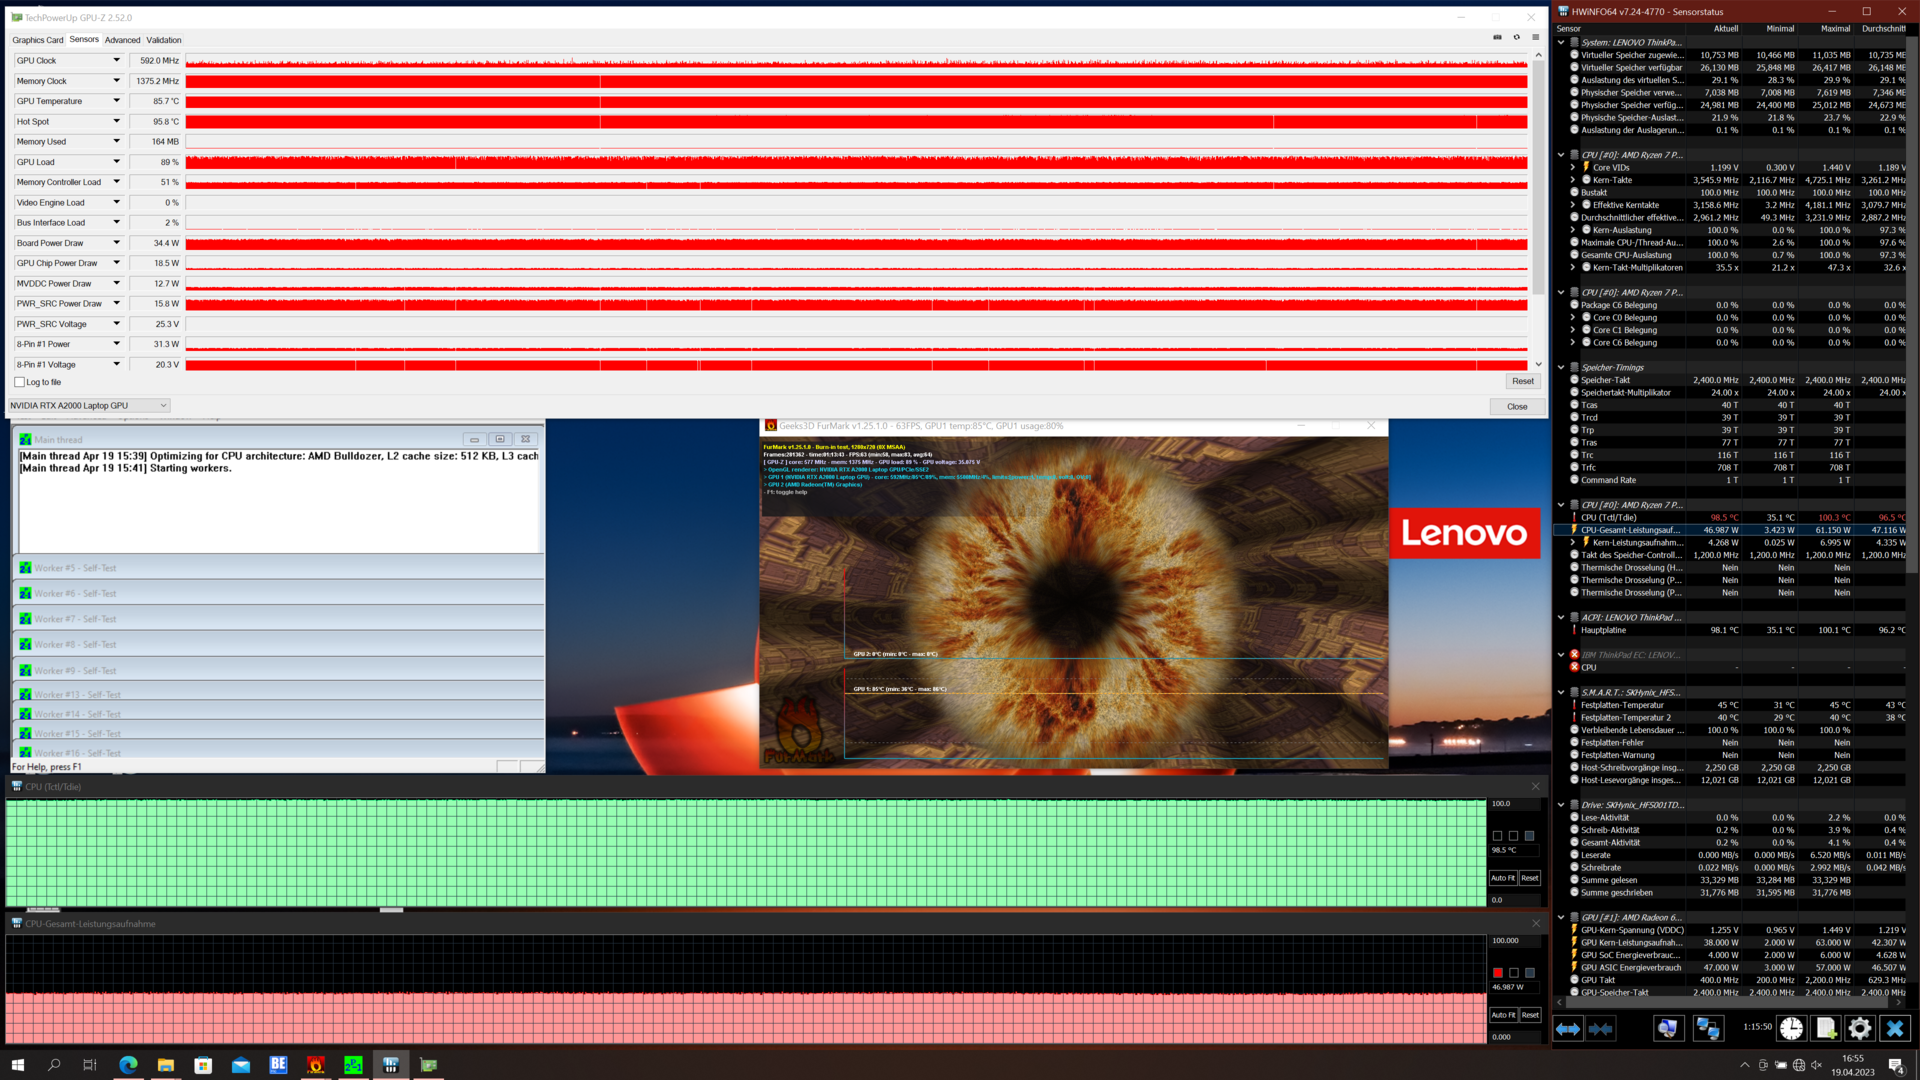
O laptop Lenovo fica particularmente quente acima do teclado e no meio da parte inferior, com o ThinkPad esquentando um pouco mais durante o teste Witcher 3. A temperatura máxima que registramos foi de 53 graus Celsius na parte inferior, com o apoio para as mãos permanecendo relativamente frio em qualquer caso.
Após cerca de uma hora de teste de estresse contínuo, o limite de energia da CPU estava em 45 watts e o chip gráfico estava consumindo 35 watts. Não houve limitação.
(-) A temperatura máxima no lado superior é 48.7 °C / 120 F, em comparação com a média de 38.2 °C / 101 F , variando de 22.2 a 69.8 °C para a classe Workstation.
(-) A parte inferior aquece até um máximo de 50.5 °C / 123 F, em comparação com a média de 41.1 °C / 106 F
(+) Em uso inativo, a temperatura média para o lado superior é 24.3 °C / 76 F, em comparação com a média do dispositivo de 32 °C / ### class_avg_f### F.
(-) Jogando The Witcher 3, a temperatura média para o lado superior é 38.8 °C / 102 F, em comparação com a média do dispositivo de 32 °C / ## #class_avg_f### F.
(+) Os apoios para as mãos e o touchpad estão atingindo a temperatura máxima da pele (35.1 °C / 95.2 F) e, portanto, não estão quentes.
(-) A temperatura média da área do apoio para as mãos de dispositivos semelhantes foi 27.8 °C / 82 F (-7.3 °C / -13.2 F).
| Lenovo ThinkPad P15v G3 21EM001AGE AMD Ryzen 7 PRO 6850H, NVIDIA RTX A2000 Laptop GPU | Lenovo ThinkPad P16 G1 21D6001DMB Intel Core i7-12850HX, NVIDIA RTX A2000 Laptop GPU | Lenovo ThinkPad P15v G2 21A9000XGE Intel Core i7-11800H, NVIDIA T1200 Laptop GPU | HP ZBook Power 15 G9 6B8C4EA Intel Core i7-12700H, NVIDIA RTX A2000 Laptop GPU | Dell Precision 7670 Intel Core i7-12850HX, NVIDIA RTX A2000 Laptop GPU | |
|---|---|---|---|---|---|
| Heat | 5% | -8% | 8% | -13% | |
| Maximum Upper Side * (°C) | 48.7 | 43.1 11% | 53.8 -10% | 40.3 17% | 51 -5% |
| Maximum Bottom * (°C) | 50.5 | 39.9 21% | 52.1 -3% | 48.3 4% | 45.8 9% |
| Idle Upper Side * (°C) | 25 | 26 -4% | 27.6 -10% | 23.7 5% | 31.8 -27% |
| Idle Bottom * (°C) | 25.4 | 27.6 -9% | 27.7 -9% | 23.8 6% | 32.6 -28% |
* ... menor é melhor
Alto-falantes
Os alto-falantes do ThinkPad P15v G3 AMD poderiam ser melhorados. Acima de tudo, eles são relativamente silenciosos e não têm graves. Os alto-falantes da HP ZBook Power 15 não são significativamente melhores, mas são pelo menos um pouco mais altos.
Lenovo ThinkPad P15v G3 21EM001AGE análise de áudio
(-) | alto-falantes não muito altos (###valor### dB)
Graves 100 - 315Hz
(-) | quase nenhum baixo - em média 22.3% menor que a mediana
(±) | a linearidade dos graves é média (12% delta para a frequência anterior)
Médios 400 - 2.000 Hz
(+) | médios equilibrados - apenas 3.1% longe da mediana
(±) | a linearidade dos médios é média (8.1% delta para frequência anterior)
Altos 2 - 16 kHz
(+) | agudos equilibrados - apenas 3% longe da mediana
(+) | os máximos são lineares (2.6% delta da frequência anterior)
Geral 100 - 16.000 Hz
(±) | a linearidade do som geral é média (21.4% diferença em relação à mediana)
Comparado com a mesma classe
» 77% de todos os dispositivos testados nesta classe foram melhores, 6% semelhantes, 18% piores
» O melhor teve um delta de 7%, a média foi 17%, o pior foi 35%
Comparado com todos os dispositivos testados
» 60% de todos os dispositivos testados foram melhores, 7% semelhantes, 33% piores
» O melhor teve um delta de 4%, a média foi 23%, o pior foi 134%
HP ZBook Power 15 G9 6B8C4EA análise de áudio
(±) | o volume do alto-falante é médio, mas bom (###valor### dB)
Graves 100 - 315Hz
(-) | quase nenhum baixo - em média 28.5% menor que a mediana
(±) | a linearidade dos graves é média (9.4% delta para a frequência anterior)
Médios 400 - 2.000 Hz
(+) | médios equilibrados - apenas 3.9% longe da mediana
(+) | médios são lineares (5.1% delta para frequência anterior)
Altos 2 - 16 kHz
(±) | máximos mais altos - em média 5.1% maior que a mediana
(+) | os máximos são lineares (4.1% delta da frequência anterior)
Geral 100 - 16.000 Hz
(±) | a linearidade do som geral é média (22.9% diferença em relação à mediana)
Comparado com a mesma classe
» 82% de todos os dispositivos testados nesta classe foram melhores, 3% semelhantes, 15% piores
» O melhor teve um delta de 7%, a média foi 17%, o pior foi 35%
Comparado com todos os dispositivos testados
» 68% de todos os dispositivos testados foram melhores, 6% semelhantes, 26% piores
» O melhor teve um delta de 4%, a média foi 23%, o pior foi 134%
Gerenciamento de energia: Apesar da bateria pequena, a duração da bateria não é tão ruim
Consumo de energia
O Lenovo ThinkPad P15v Gen 3 AMD não funciona de forma muito eficiente, o que não é surpreendente, dados os componentes ineficientes, especialmente a tela 4K UHD. O baixo consumo do HP ZBook Power 15 é bastante surpreendente em comparação, enquanto o ThinkPad P16 (com LCD 4K) e o Dell Precision 7670 têm um consumo ocioso ainda maior em geral.
Com um máximo de 124 watts no pico de carga, o ThinkPad P15v G3 não é um milagre de economia de energia. Entretanto, o consumo permanece dentro dos limites do adaptador de energia compacto de 135 watts.
| desligado | |
| Ocioso | |
| Carga |
|
Key:
min: | |
| Lenovo ThinkPad P15v G3 21EM001AGE R7 PRO 6850H, RTX A2000 Laptop GPU, SK Hynix PC711 1TB HFS001TDE9X081N, IPS LED, 3840x2160, 15.6" | Lenovo ThinkPad P16 G1 21D6001DMB i7-12850HX, RTX A2000 Laptop GPU, Micron 3400 1TB MTFDKBA1T0TFH, IPS LED, 2560x1600, 16" | Lenovo ThinkPad P15v G2 21A9000XGE i7-11800H, T1200 Laptop GPU, Toshiba XG6 KXG6AZNV512G, IPS LED, 1920x1080, 15.6" | HP ZBook Power 15 G9 6B8C4EA i7-12700H, RTX A2000 Laptop GPU, Samsung PM9A1 MZVL21T0HCLR, IPS, 3840x2160, 15.6" | Dell Precision 7670 i7-12850HX, RTX A2000 Laptop GPU, SK Hynix HFS001TEJ9X115N, OLED, 3840x2400, 16" | Lenovo ThinkPad P16 G1 RTX A5500 i9-12950HX, RTX A5500 Laptop GPU, WDC PC SN810 2TB, IPS, 3840x2400, 16" | Média NVIDIA RTX A2000 Laptop GPU | Média da turma Workstation | |
|---|---|---|---|---|---|---|---|---|
| Power Consumption | 0% | 9% | 19% | -47% | -95% | -16% | -25% | |
| Idle Minimum * (Watt) | 6.3 | 5.1 19% | 5.96 5% | 3.9 38% | 7.5 -19% | 7.5 -19% | 6.6 ? -5% | 9.11 ? -45% |
| Idle Average * (Watt) | 13.9 | 9.2 34% | 8.37 40% | 7.2 48% | 9.5 32% | 20.1 -45% | 11.8 ? 15% | 13.8 ? 1% |
| Idle Maximum * (Watt) | 14.5 | 9.9 32% | 9.05 38% | 8.5 41% | 28.4 -96% | 40 -176% | 16.7 ? -15% | 17.9 ? -23% |
| Load Average * (Watt) | 82.8 | 124.1 -50% | 91.82 -11% | 87.2 -5% | 139.1 -68% | 137 -65% | 116.3 ? -40% | 96 ? -16% |
| Witcher 3 ultra * (Watt) | 88.8 | 87.7 1% | 102 -15% | 86.8 2% | 134 -51% | 208 -134% | ||
| Load Maximum * (Watt) | 124.8 | 168.9 -35% | 126.38 -1% | 139 -11% | 220.8 -77% | 285.9 -129% | 171.2 ? -37% | 180.3 ? -44% |
* ... menor é melhor
Power consumption Witcher 3 / Stress test
Power consumption with an external monitor
Duração da bateria
A bateria interna de polímero de lítio tem uma capacidade de apenas 68 watts-hora, e todos os dispositivos que comparamos tinham uma capacidade de bateria maior. No entanto, o Lenovo ThinkPad P15v G3 AMD alcança uma duração de bateria respeitável - com uma bateria maior ou uma tela Full HD que economiza energia, ele poderia até ser um campeão de duração de bateria entre as estações de trabalho.
| Lenovo ThinkPad P15v G3 21EM001AGE R7 PRO 6850H, RTX A2000 Laptop GPU, 68 Wh | Lenovo ThinkPad P16 G1 21D6001DMB i7-12850HX, RTX A2000 Laptop GPU, 94 Wh | Lenovo ThinkPad P15v G2 21A9000XGE i7-11800H, T1200 Laptop GPU, 68 Wh | HP ZBook Power 15 G9 6B8C4EA i7-12700H, RTX A2000 Laptop GPU, 83 Wh | Dell Precision 7670 i7-12850HX, RTX A2000 Laptop GPU, 83 Wh | Lenovo ThinkPad P16 G1 RTX A5500 i9-12950HX, RTX A5500 Laptop GPU, 94 Wh | Média da turma Workstation | |
|---|---|---|---|---|---|---|---|
| Duração da bateria | 18% | -22% | 45% | -21% | -16% | -1% | |
| H.264 (h) | 10.7 | 8 -25% | 10.1 ? -6% | ||||
| WiFi v1.3 (h) | 6.9 | 9.4 36% | 7.5 9% | 10 45% | 5.9 -14% | 5.8 -16% | 8.55 ? 24% |
| Load (h) | 1.8 | 1.8 0% | 0.9 -50% | 1.3 -28% | 1.441 ? -20% |
Pro
Contra
Conclusão: o ThinkPad P15v Gen 3 AMD é uma combinação rara com pontos fortes e fracos

O Lenovo ThinkPad P15v Gen 3 representa o nível de entrada para a linha mais potente de estações de trabalho ThinkPad. Por causa disso, há alguns lugares onde a Lenovo cortou alguns cantos. O modelo que testamos tem uma bateria pequena, a WWAN não está disponível na variante AMD, as telas ainda estão no formato 16:9 e a Lenovo optou por uma fraca webcam 720p e alto-falantes que são muito silenciosos. Todos esses são pontos válidos de crítica; além disso, o desempenho do WiFi varia dentro e fora.
Ao mesmo tempo, esse laptop da Lenovo também tem alguns pontos fortes e é até um pouco superior ao ThinkPad P16, mais caro. O P15v Gen 3 tem um teclado melhor e funciona muito mais silenciosamente, mesmo sob carga, por exemplo, o que é possível graças ao eficiente processador AMD, que também ajuda a elevar a duração da bateria a um nível aceitável, apesar da capacidade limitada da bateria. O P15v Gen 3 tem um leitor de cartão SD rápido, bem como Ethernet RJ45, uma tela 4K UHD brilhante e fosca que cobre o espaço de cores AdobeRGB e também oferece um desempenho muito bom do processador graças à CPU AMD-H. Ao mesmo tempo, a capacidade de atualização ou manutenção desse modelo é bastante alta. A GPU é bastante fraca, mas, para ser justo, o concorrente direto da HP nessa faixa de preço não se sai melhor nesse aspecto.
ThinkPad P15v G3 AMD: Um teclado com deslocamento longo e AMD Ryzen 6000 é uma combinação vencedora, mas com alguns pontos fracos claros.
Na linha da Lenovo, o Lenovo ThinkPad P15v Gen 3 AMD é um modelo muito interessante - um dos últimos modelos com o design mais antigo, mas ao mesmo tempo agora vem com processadores AMD muito eficientes e modernos. É uma pena que a Lenovo não tenha incluído recursos WWAN nesse modelo e que não ofereça uma bateria maior, pelo menos como uma opção de atualização. Esses erros custaram ao P15v o primeiro lugar absoluto nessa categoria, mas ele ainda é um laptop muito útil e bom para trabalhar.
Há uma história semelhante com o principal concorrente do P15v, o ZBook Power 15 da HP, que tem um gabinete de metal de maior qualidade e uma bateria maior, mas só está disponível com CPUs Intel e não tem um leitor de cartão SD.
Preço e disponibilidade
O Lenovo ThinkPad P15v Gen 3 AMD está disponível na configuração testada por $2.293 na Amazon. Ele também pode ser encontrado no site da Lenovo a partir de US$ 1.496,95.
Lenovo ThinkPad P15v G3 21EM001AGE
- 04/24/2023 v7 (old)
Benjamin Herzig
Transparência
A seleção dos dispositivos a serem analisados é feita pela nossa equipe editorial. A amostra de teste foi fornecida ao autor como empréstimo pelo fabricante ou varejista para fins desta revisão. O credor não teve influência nesta revisão, nem o fabricante recebeu uma cópia desta revisão antes da publicação. Não houve obrigação de publicar esta revisão. Como empresa de mídia independente, a Notebookcheck não está sujeita à autoridade de fabricantes, varejistas ou editores.
É assim que o Notebookcheck está testando
Todos os anos, o Notebookcheck analisa de forma independente centenas de laptops e smartphones usando procedimentos padronizados para garantir que todos os resultados sejam comparáveis. Desenvolvemos continuamente nossos métodos de teste há cerca de 20 anos e definimos padrões da indústria no processo. Em nossos laboratórios de teste, equipamentos de medição de alta qualidade são utilizados por técnicos e editores experientes. Esses testes envolvem um processo de validação em vários estágios. Nosso complexo sistema de classificação é baseado em centenas de medições e benchmarks bem fundamentados, o que mantém a objetividade.Price comparison

