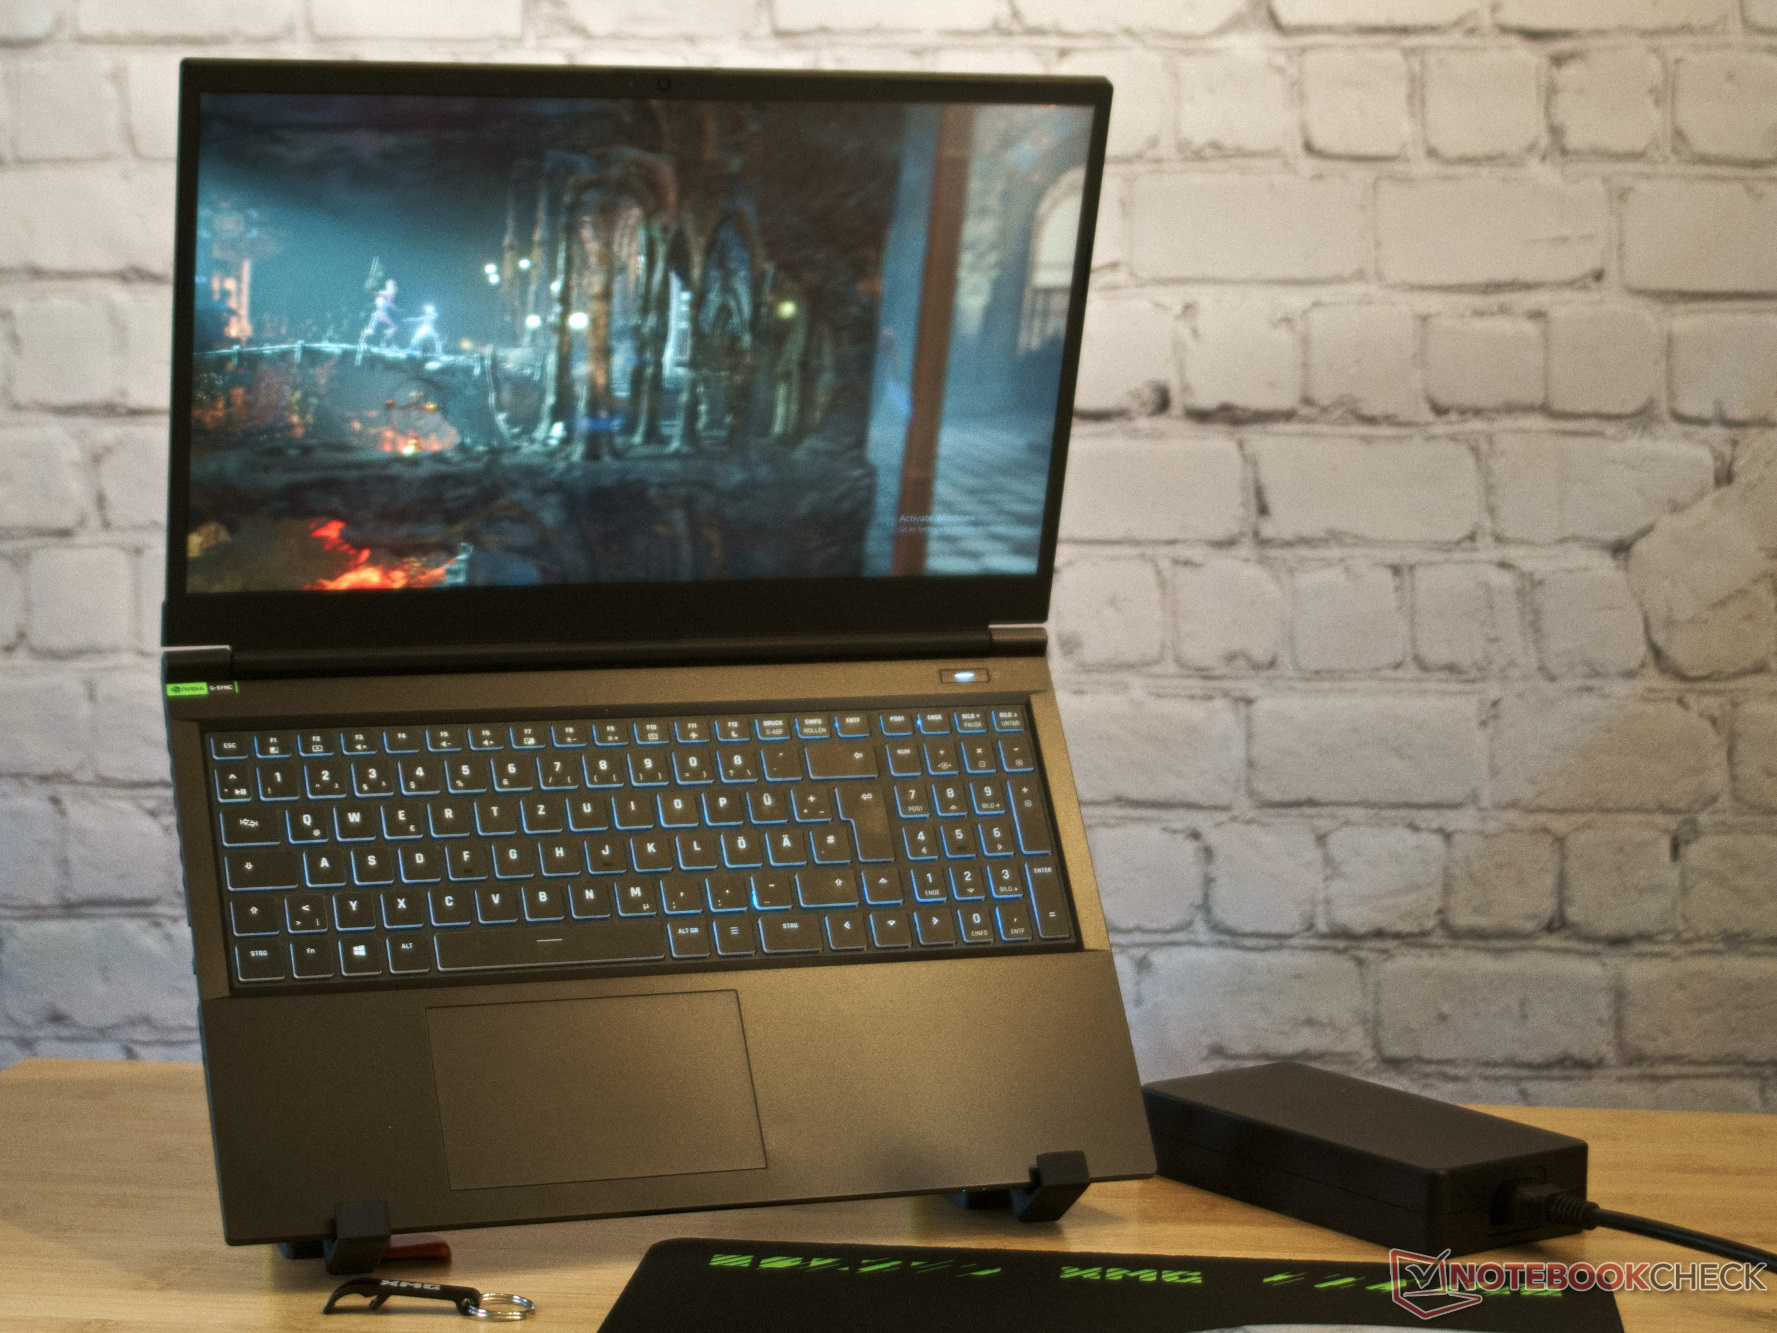
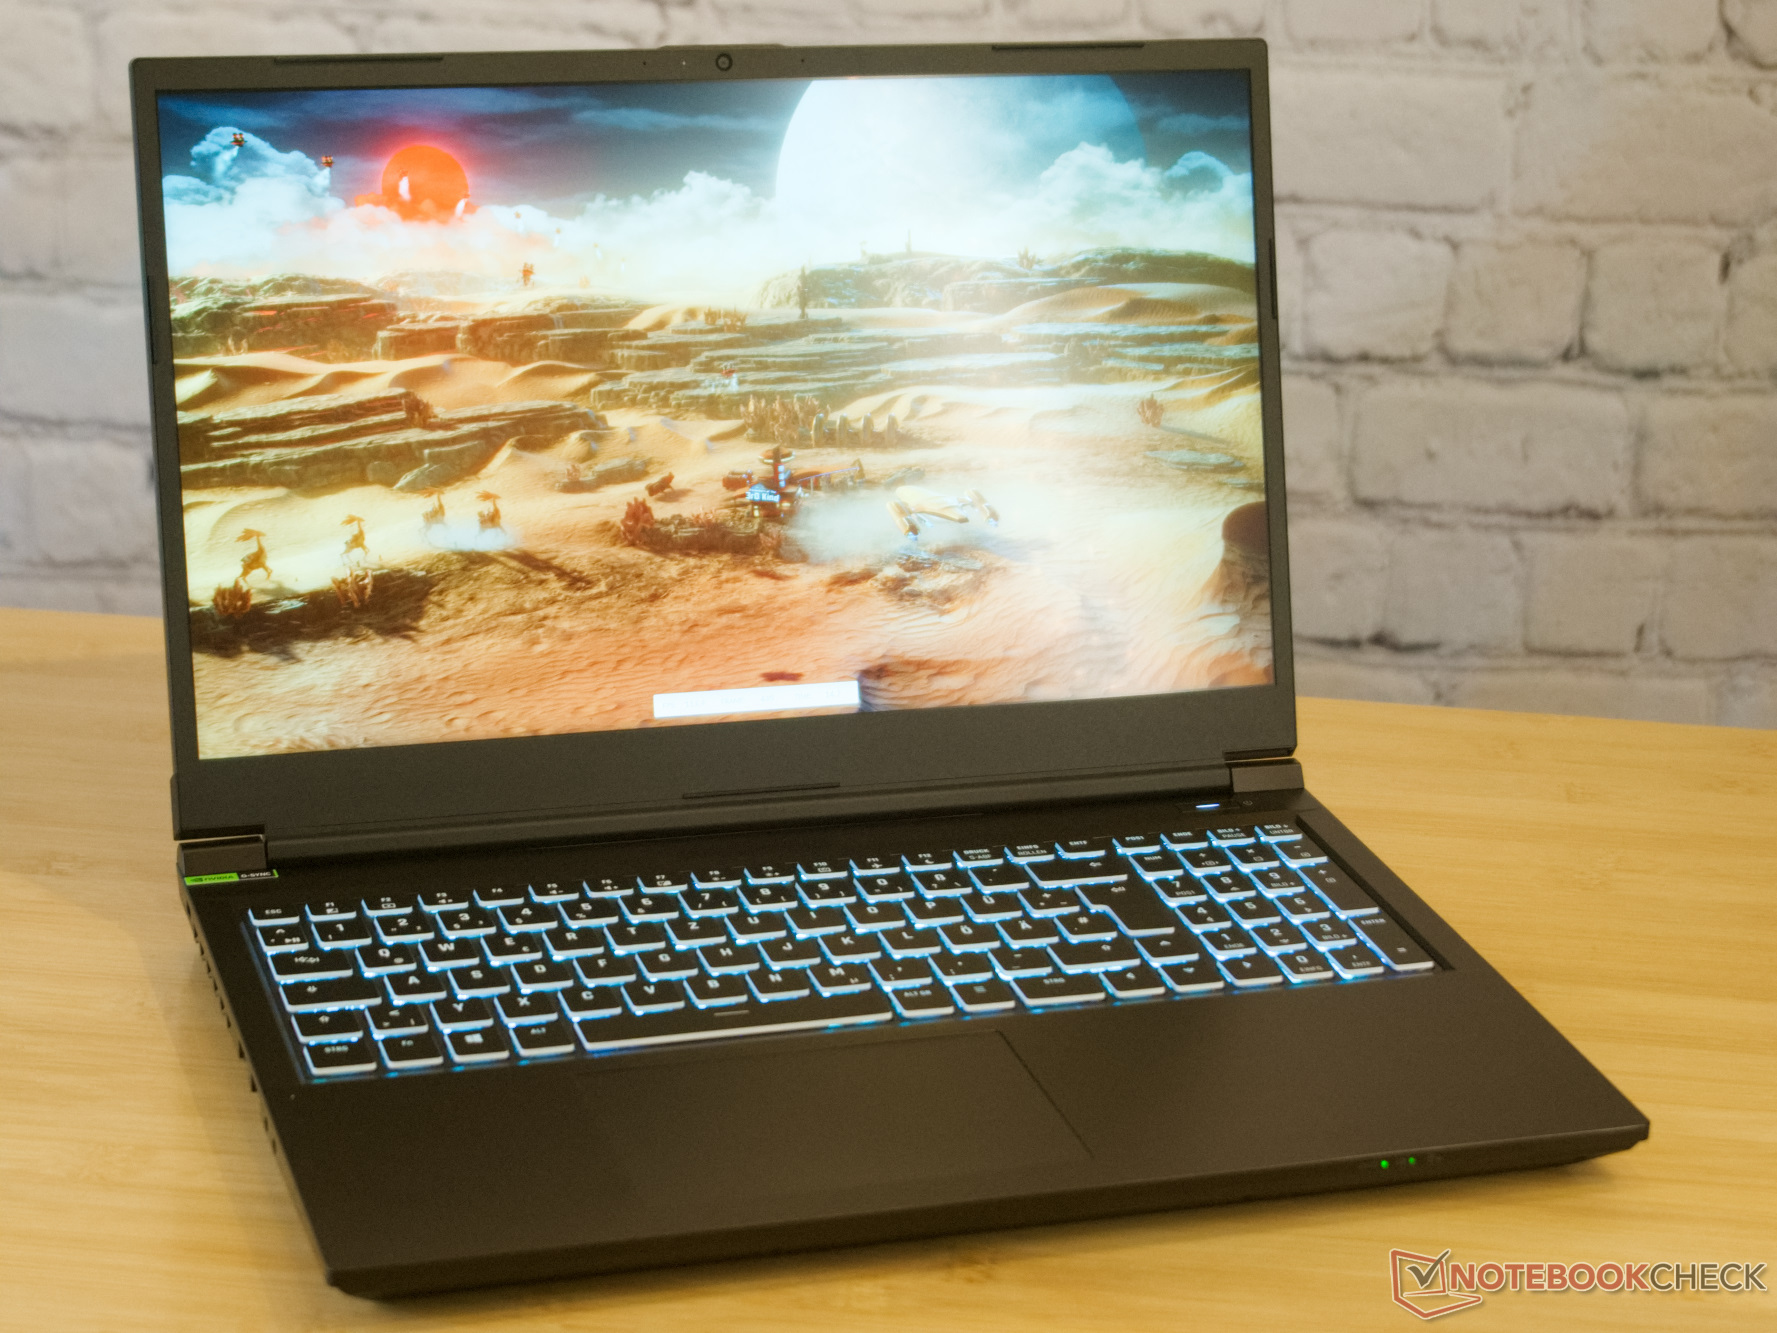
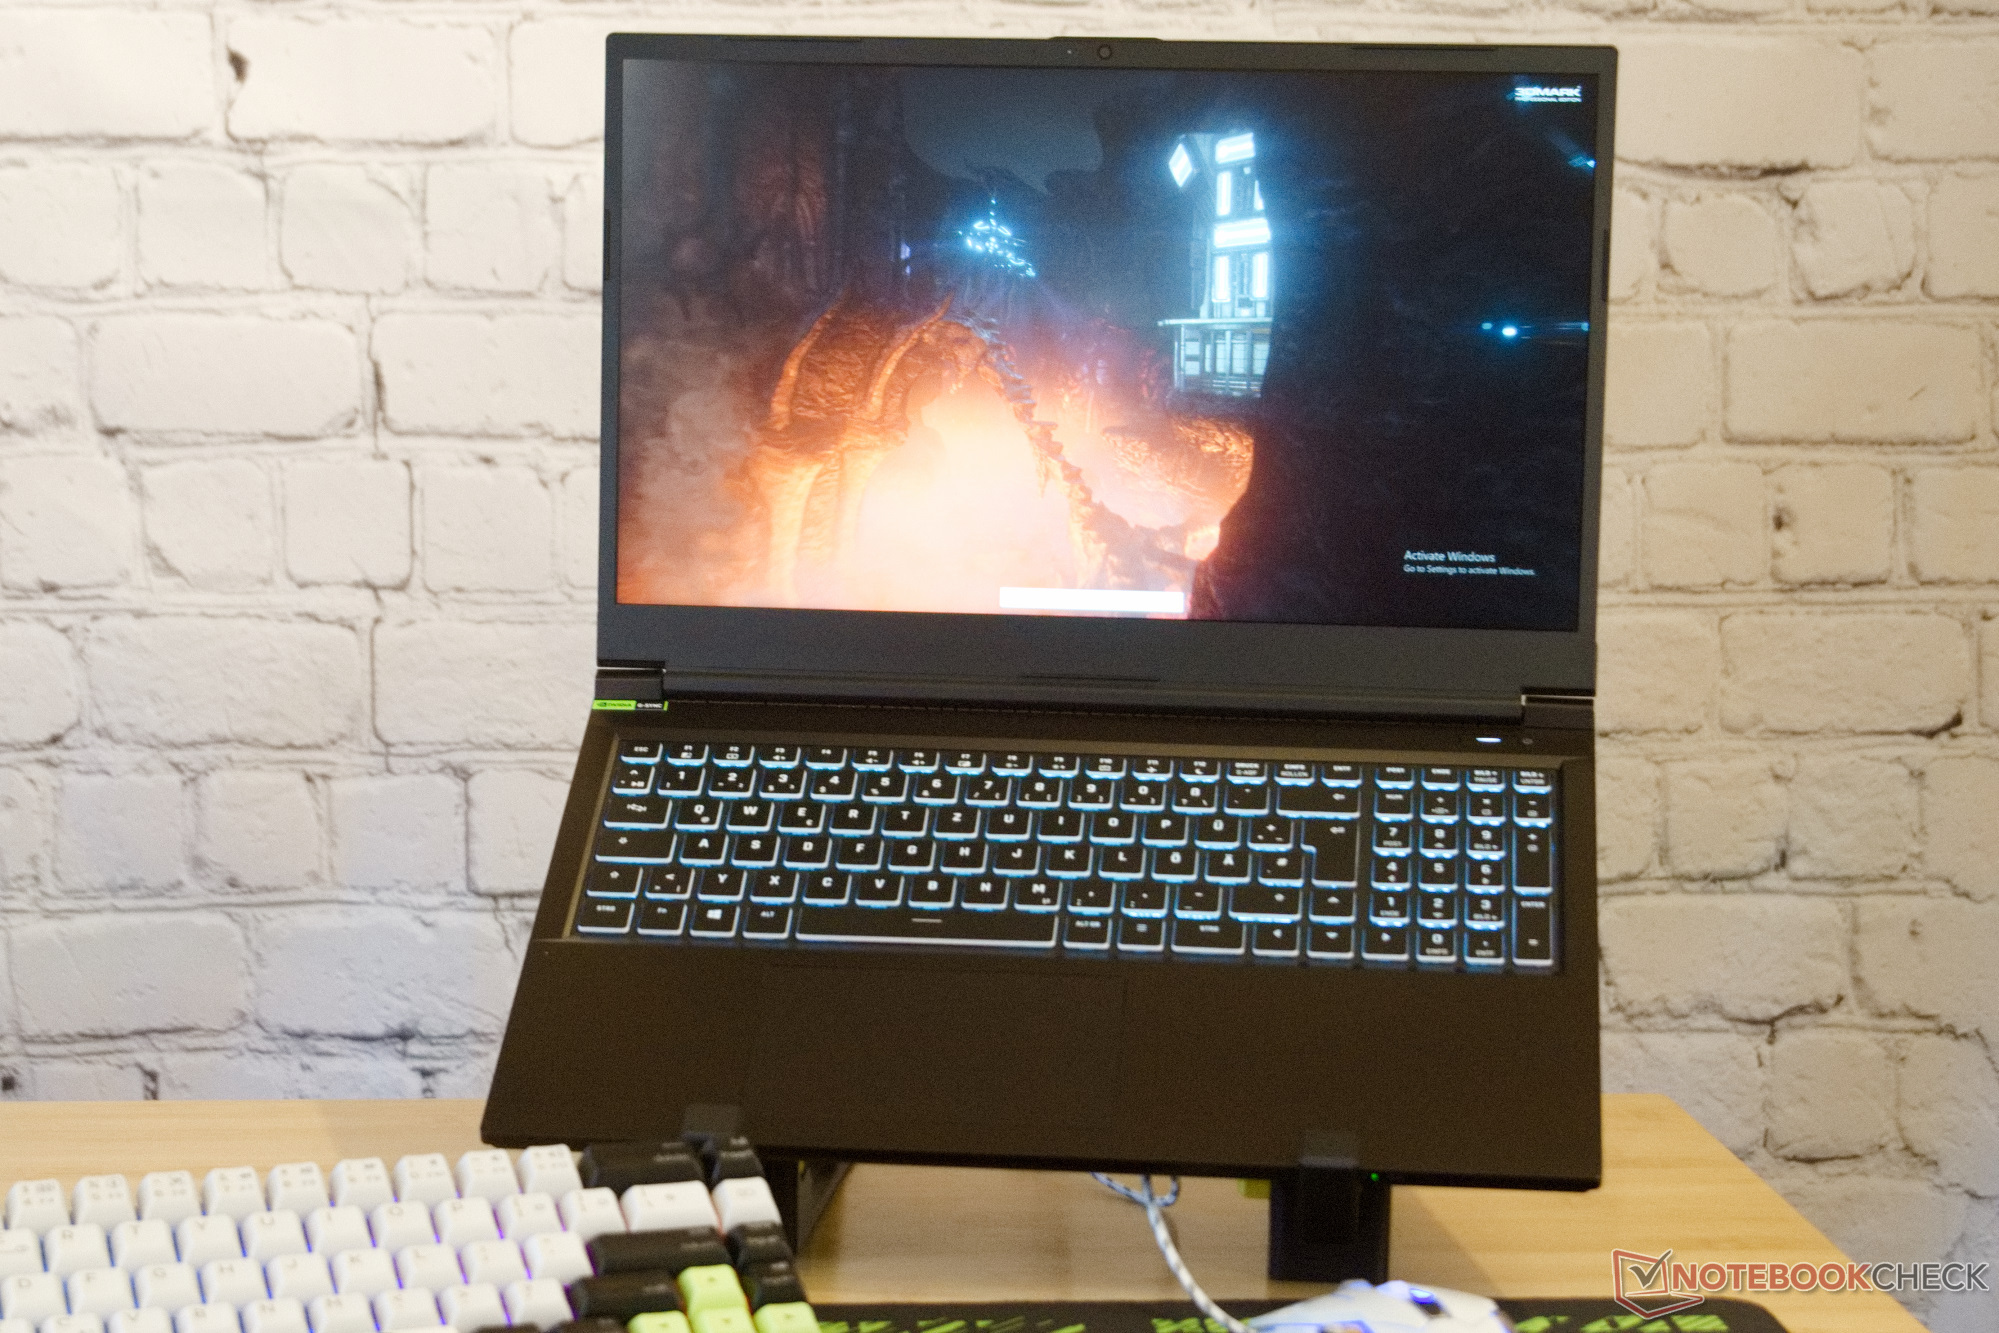
Análise do laptop econômico para jogos Schenker XMG Focus 15 (E23): Muito desempenho por um preço menor que o do Pro 15

Primeiro testamos oXMG Focus 15no final de 2021. O Focus 15 era um laptop que usava a então novíssimaGPU para laptop RTX 3050 Tiaté seus limites. Apesar de seu resfriamento, o XMG Focus 15 apresentou apenas um desempenho acima da média sob altas temperaturas.
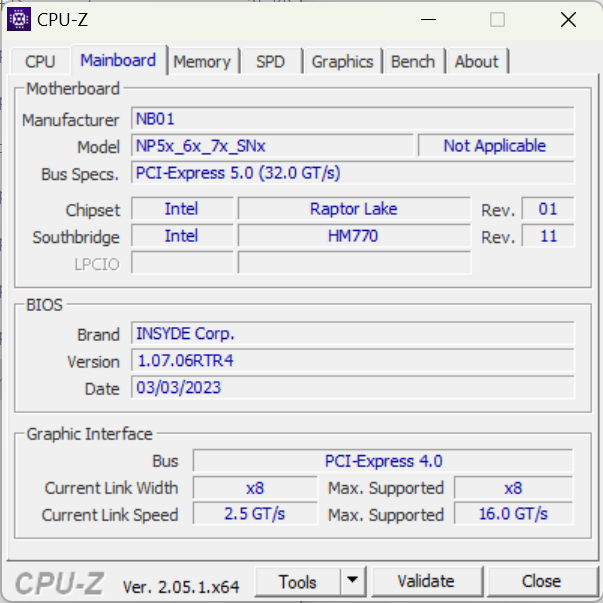
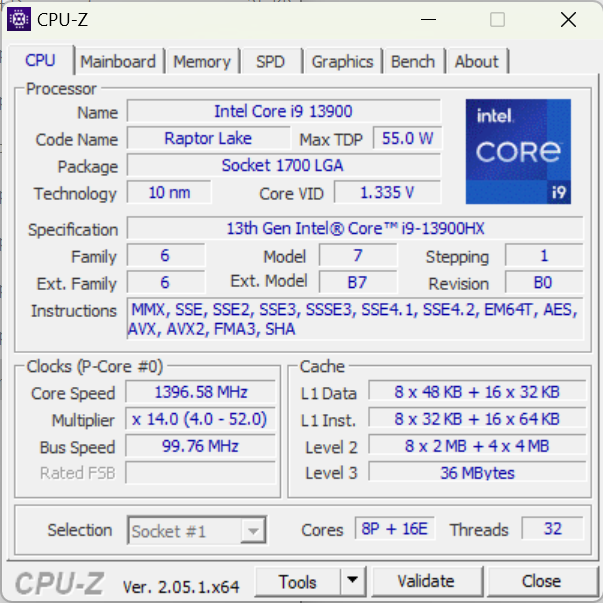
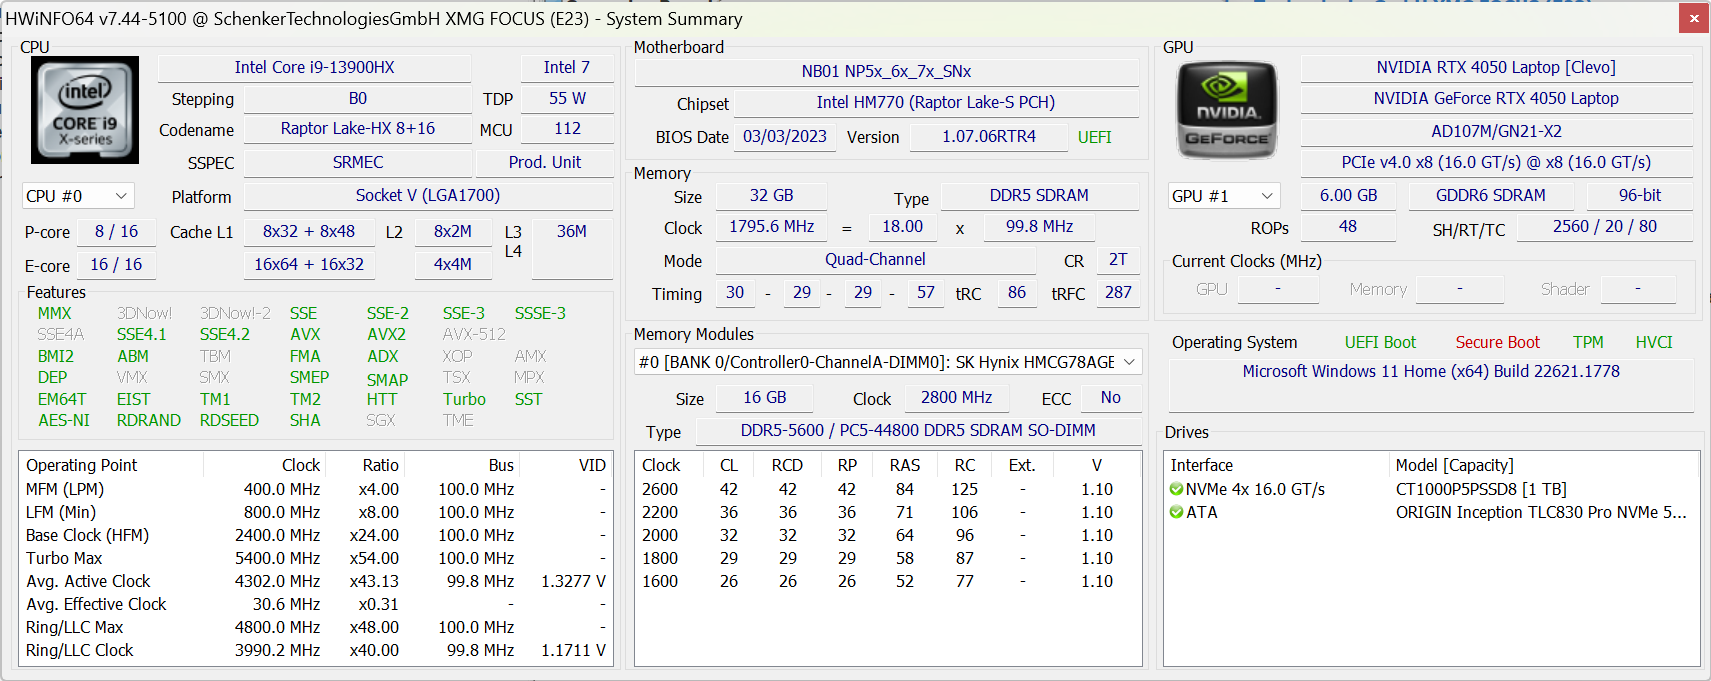
A Schenker mais uma vez conta com um barebone da Clevo para o Focus 15 atual, e desta vez é o chassi NP50SNC. Semelhante ao recentemente testadoXMG Pro 15encontramos um processadorIntel Core i9-13900HXinstalado no novo Focus 15.
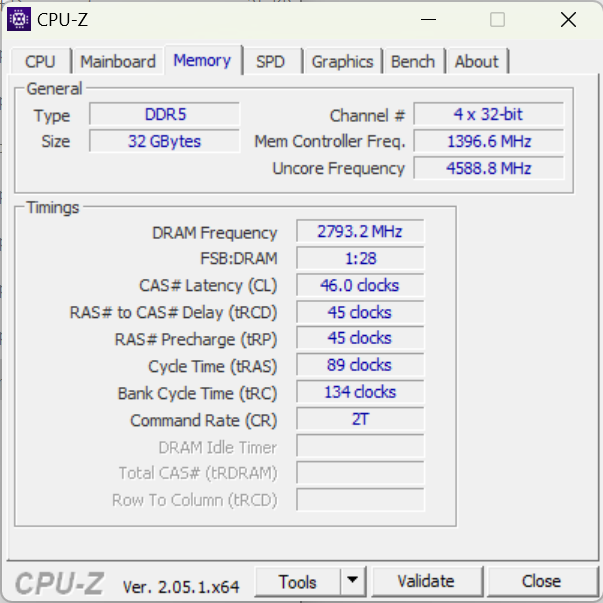
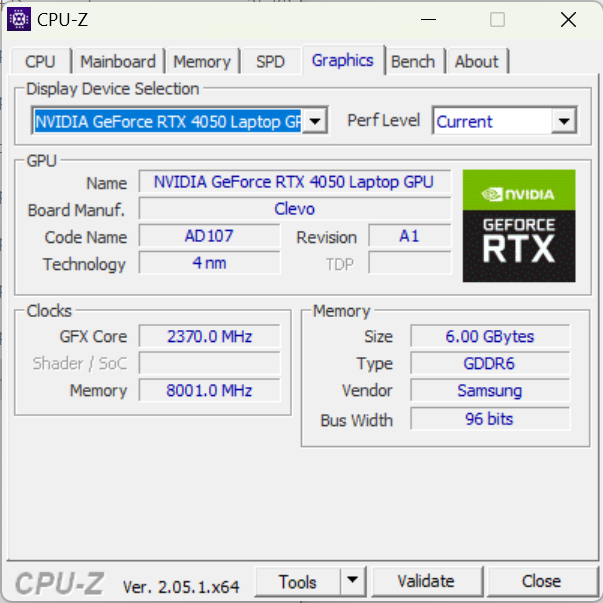
O processador de ponta do Focus 15 é complementado por uma GPU de nível básico, aGPU para laptop Nvidia GeForce RTX 405032 GB de memória de trabalho e um SSD Crucial NVMe de 1 TB.
Como de costume, a Schenker oferece uma ampla gama de opções de configuração. Os compradores também podem configurar o Focus 15 com umaGPU para laptop RTX 4060ou umaGPU para laptop RTX 4070juntamente com opções adicionais de RAM.
Devido aos gráficos de nível básico da nossa amostra de análise, classificamos o XMG Pro 15 como um laptop para jogos de nível básico. No entanto, os notebooks para jogos de nível básico geralmente não têm um processador de alto desempenho e não mais do que 16 GB de memória de trabalho, portanto, também procuramos dispositivos de comparação correspondentes entre os notebooks multimídia de ponta.
Entre eles estão dispositivos como oMSI Katana 15ou oAsus TUF A15como laptops para jogos e oSamsung Galaxy Book3 Ultra 16ou oAcer Swift X SFX14-71Gcomo notebooks multimídia. OXMG Pro 15também tem lugar nesta comparação - o laptop mais caro da Schenker difere de seu primo mais barato apenas em alguns aspectos.
Possíveis concorrentes em comparação
Avaliação | Data | Modelo | Peso | Altura | Size | Resolução | Preço |
|---|---|---|---|---|---|---|---|
| 85.1 % v7 (old) | 07/2023 | Schenker XMG Focus 15 (E23) i9-13900HX, GeForce RTX 4050 Laptop GPU | 2.4 kg | 26.9 mm | 15.60" | 2569x1440 | |
| 86.2 % v7 (old) | 07/2023 | Schenker XMG Pro 15 (E23) i9-13900HX, GeForce RTX 4060 Laptop GPU | 2.4 kg | 24.9 mm | 15.60" | 2560x1440 | |
| 86.3 % v7 (old) | 06/2023 | Asus TUF A15 FA507 R7 7735HS, GeForce RTX 4050 Laptop GPU | 2.2 kg | 24.9 mm | 15.60" | 1920x1080 | |
| 82.9 % v7 (old) | 03/2023 | MSI Katana 15 B12VEK i7-12650H, GeForce RTX 4050 Laptop GPU | 2.3 kg | 24.9 mm | 15.60" | 1920x1080 | |
| 86.3 % v7 (old) | 07/2023 | Acer Swift X SFX14-71G i7-13700H, GeForce RTX 4050 Laptop GPU | 1.5 kg | 17.9 mm | 14.50" | 2880x1800 | |
| 89.4 % v7 (old) | 04/2023 | Samsung Galaxy Book3 Ultra 16 i7-13700H, GeForce RTX 4050 Laptop GPU | 1.8 kg | 16.5 mm | 16.00" | 2880x1800 | |
| 89.4 % v7 (old) | 05/2023 | Gigabyte Aero 14 OLED BMF i7-13700H, GeForce RTX 4050 Laptop GPU | 1.4 kg | 17 mm | 14.00" | 2880x1800 |
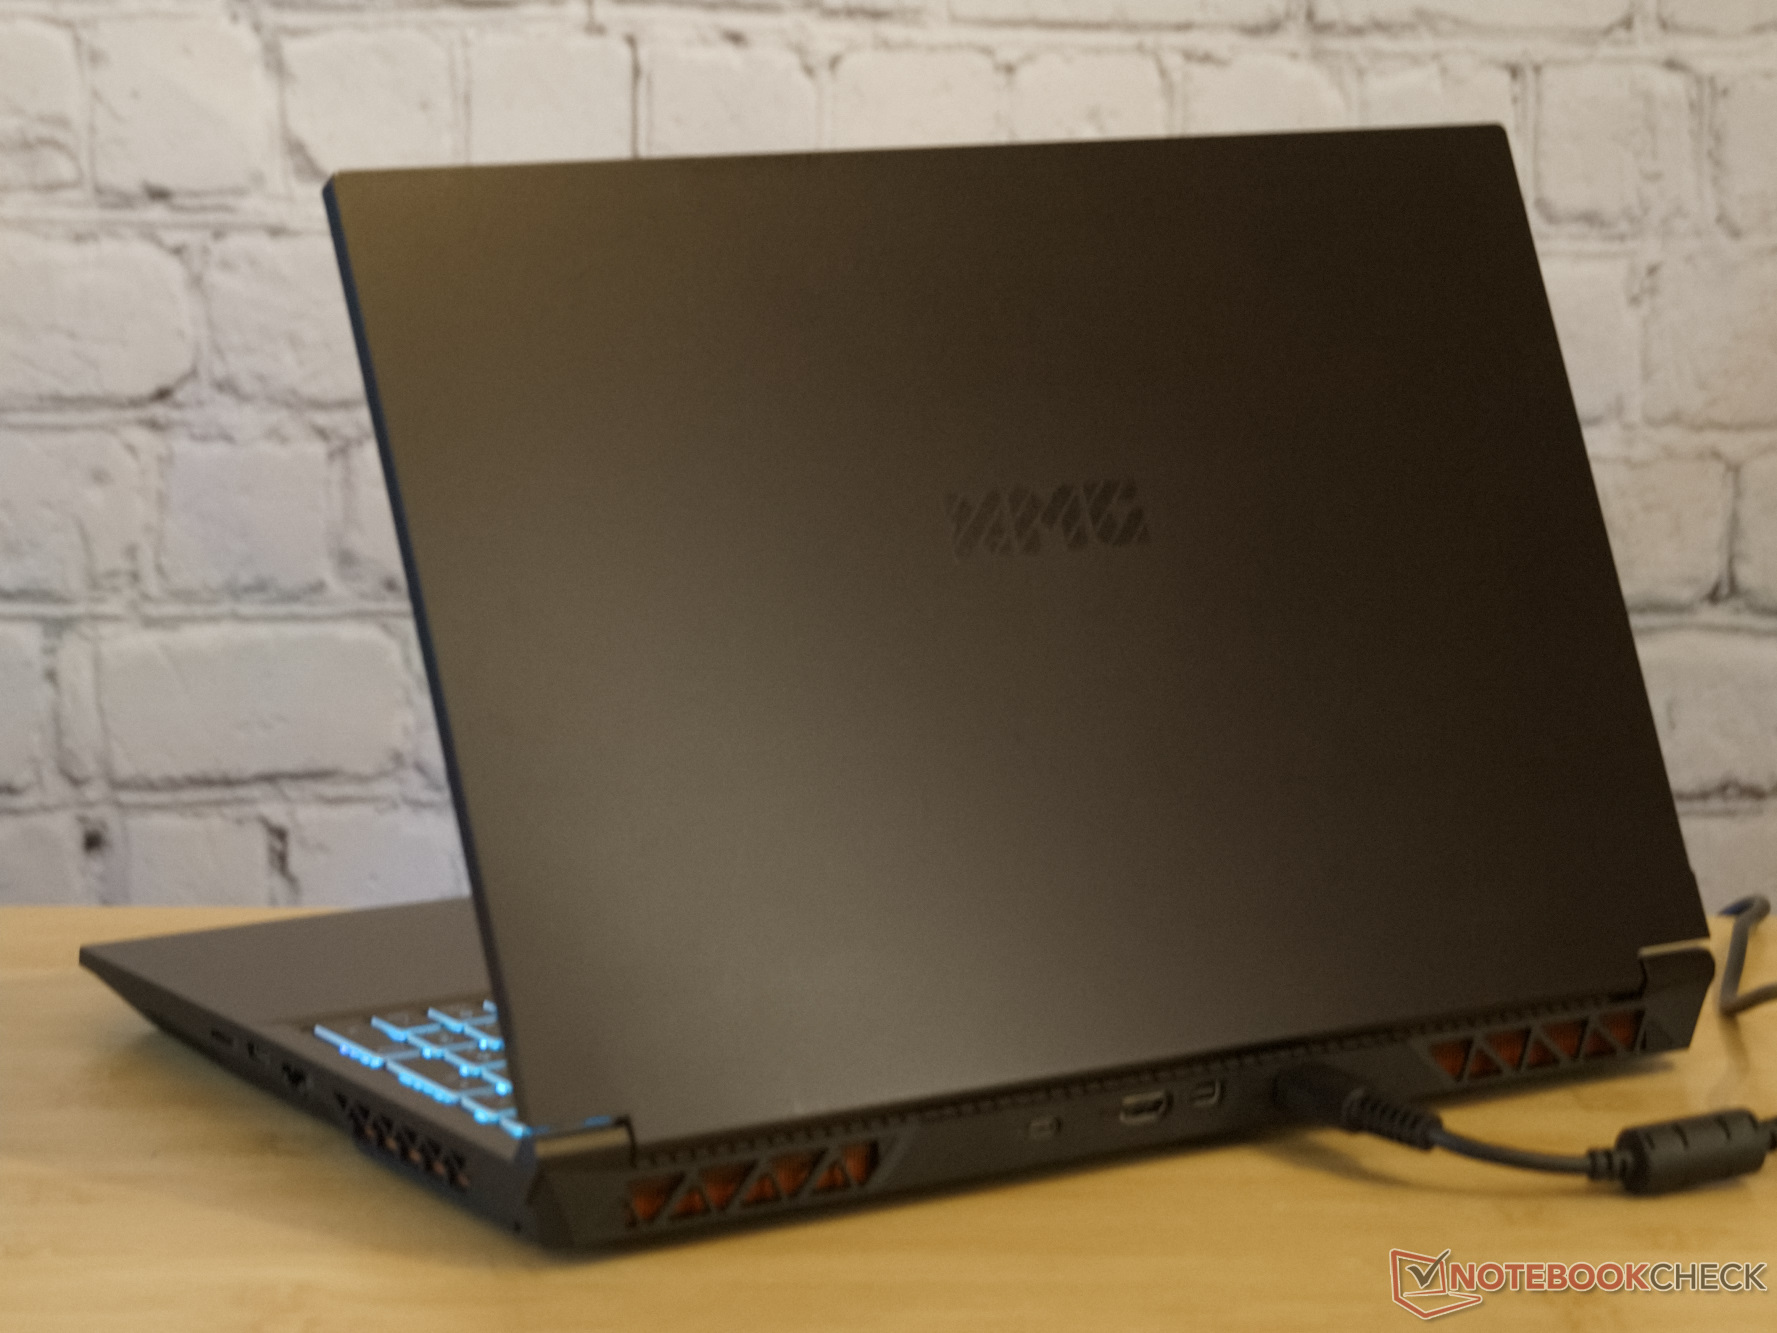
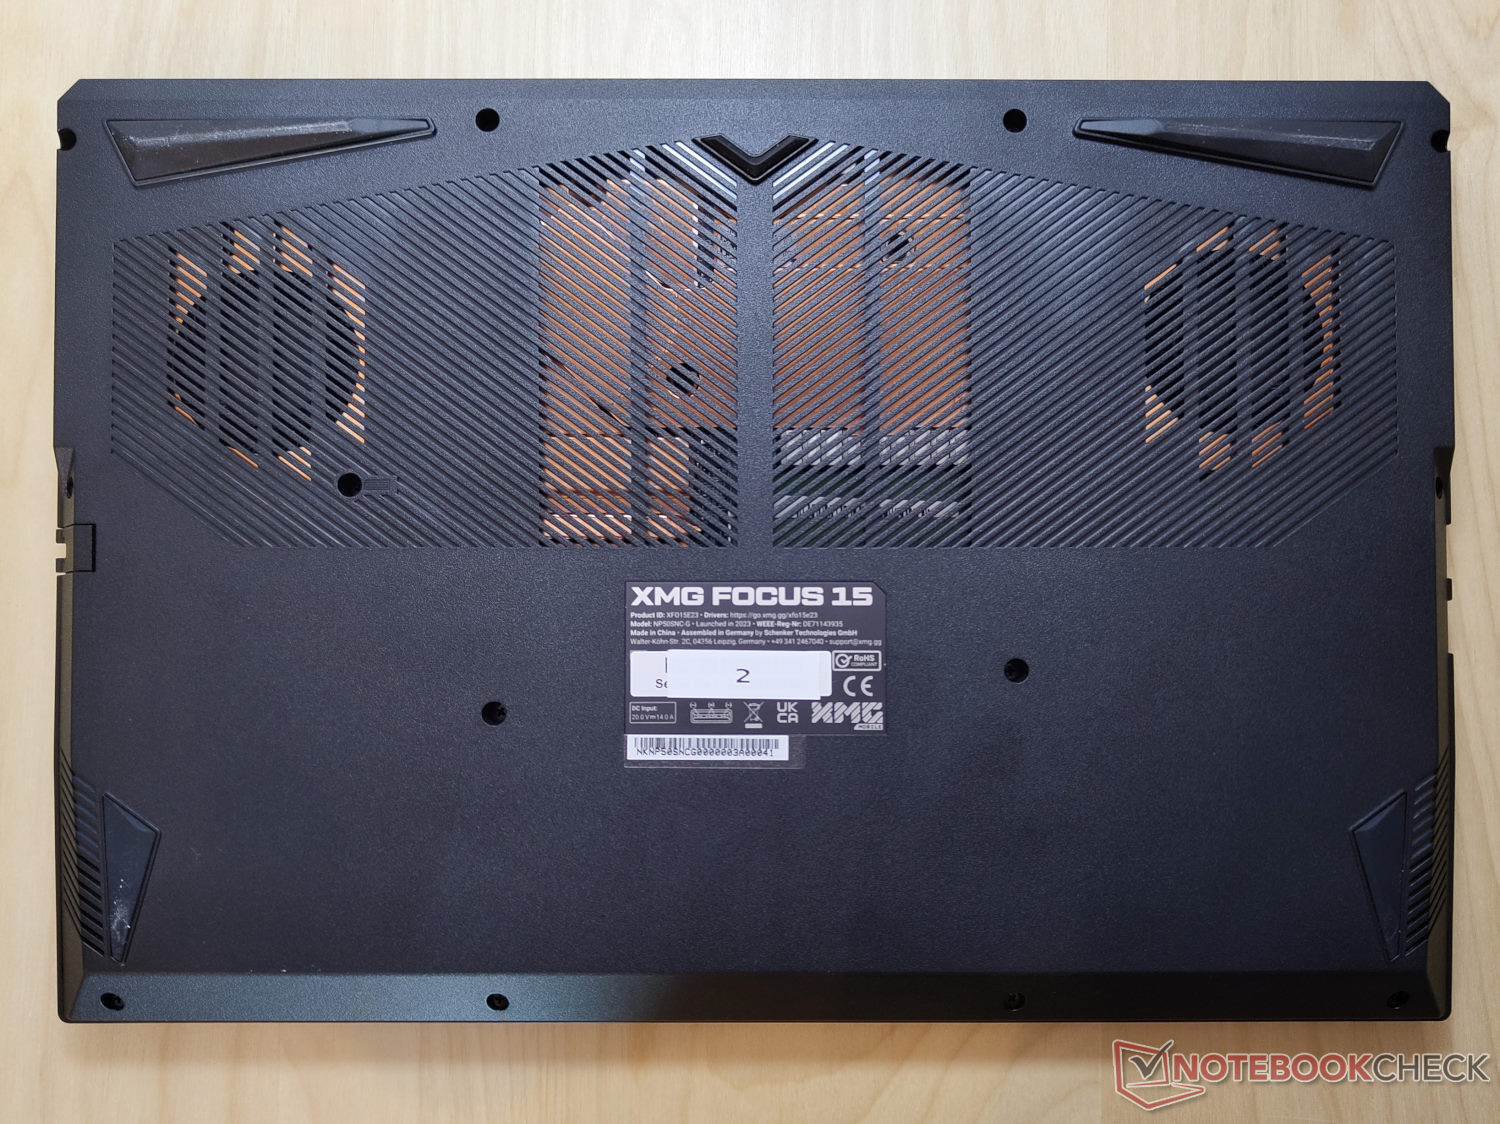
Chassi: Plástico robusto
A carcaça do laptop é totalmente feita de plástico robusto e o metal só é visível do lado de fora, atrás das grades, na forma do dissipador de calor. A Clevo e a Schenker mantiveram o design bastante simples. A marca é encontrada apenas na forma do logotipo XMG preto em um fundo preto.
Embora o gabinete seja feito principalmente de plástico, não encontramos nenhum ponto fraco em termos de qualidade. O laptop parece resistente em todos os aspectos, não range ao ser torcido e apresenta aberturas muito estreitas e uniformes. A tampa da tela pode ser aberta a cerca de 140° com uma mão e mantém sua posição durante todo o tempo.
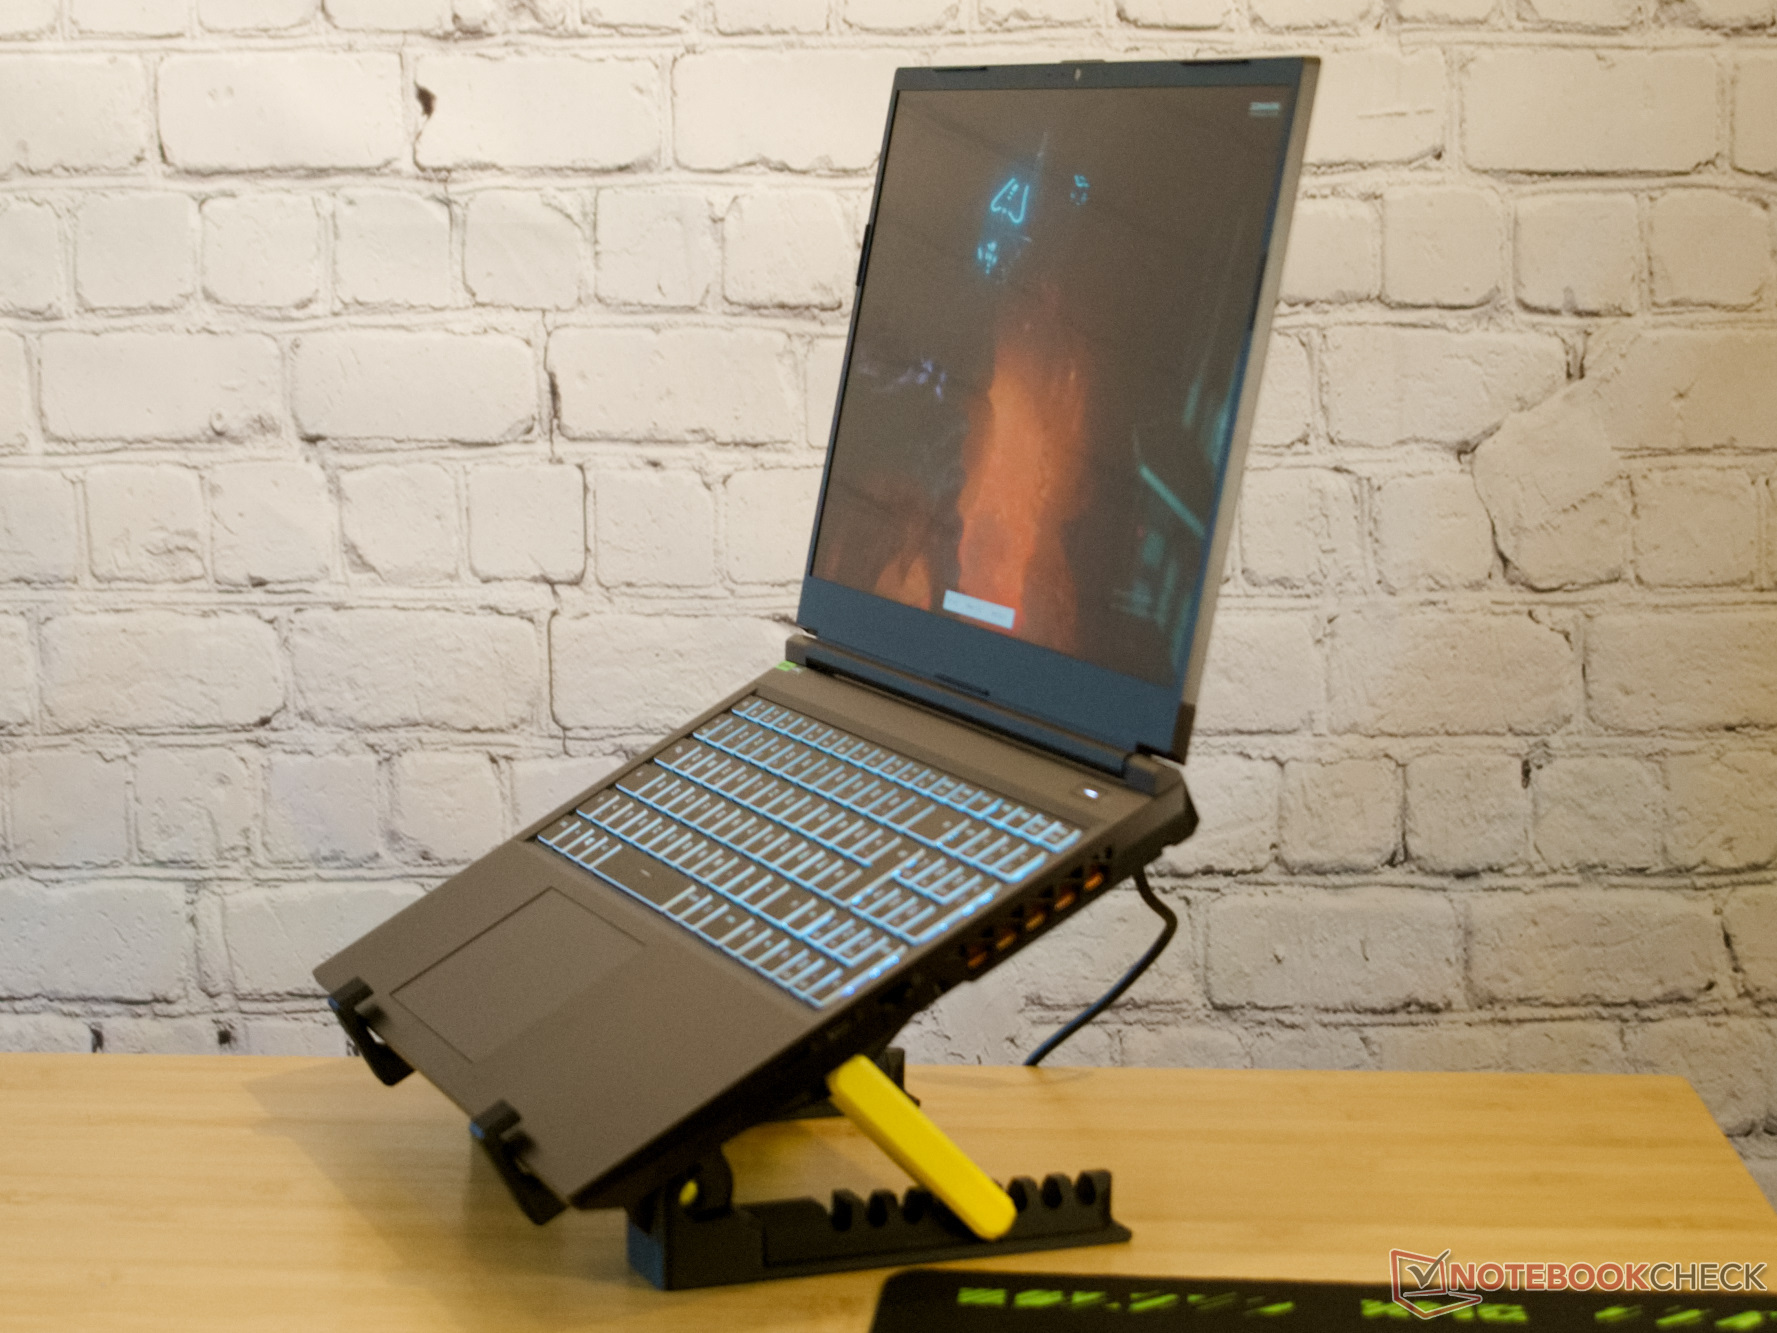
Nem o peso nem a espessura são atípicos para um laptop para jogos de 15,6 polegadas no formato 16:10. Entretanto, uma comparação com outros laptops multimídia mostra que aqueles com hardware semelhante também poderiam ser um pouco mais finos.
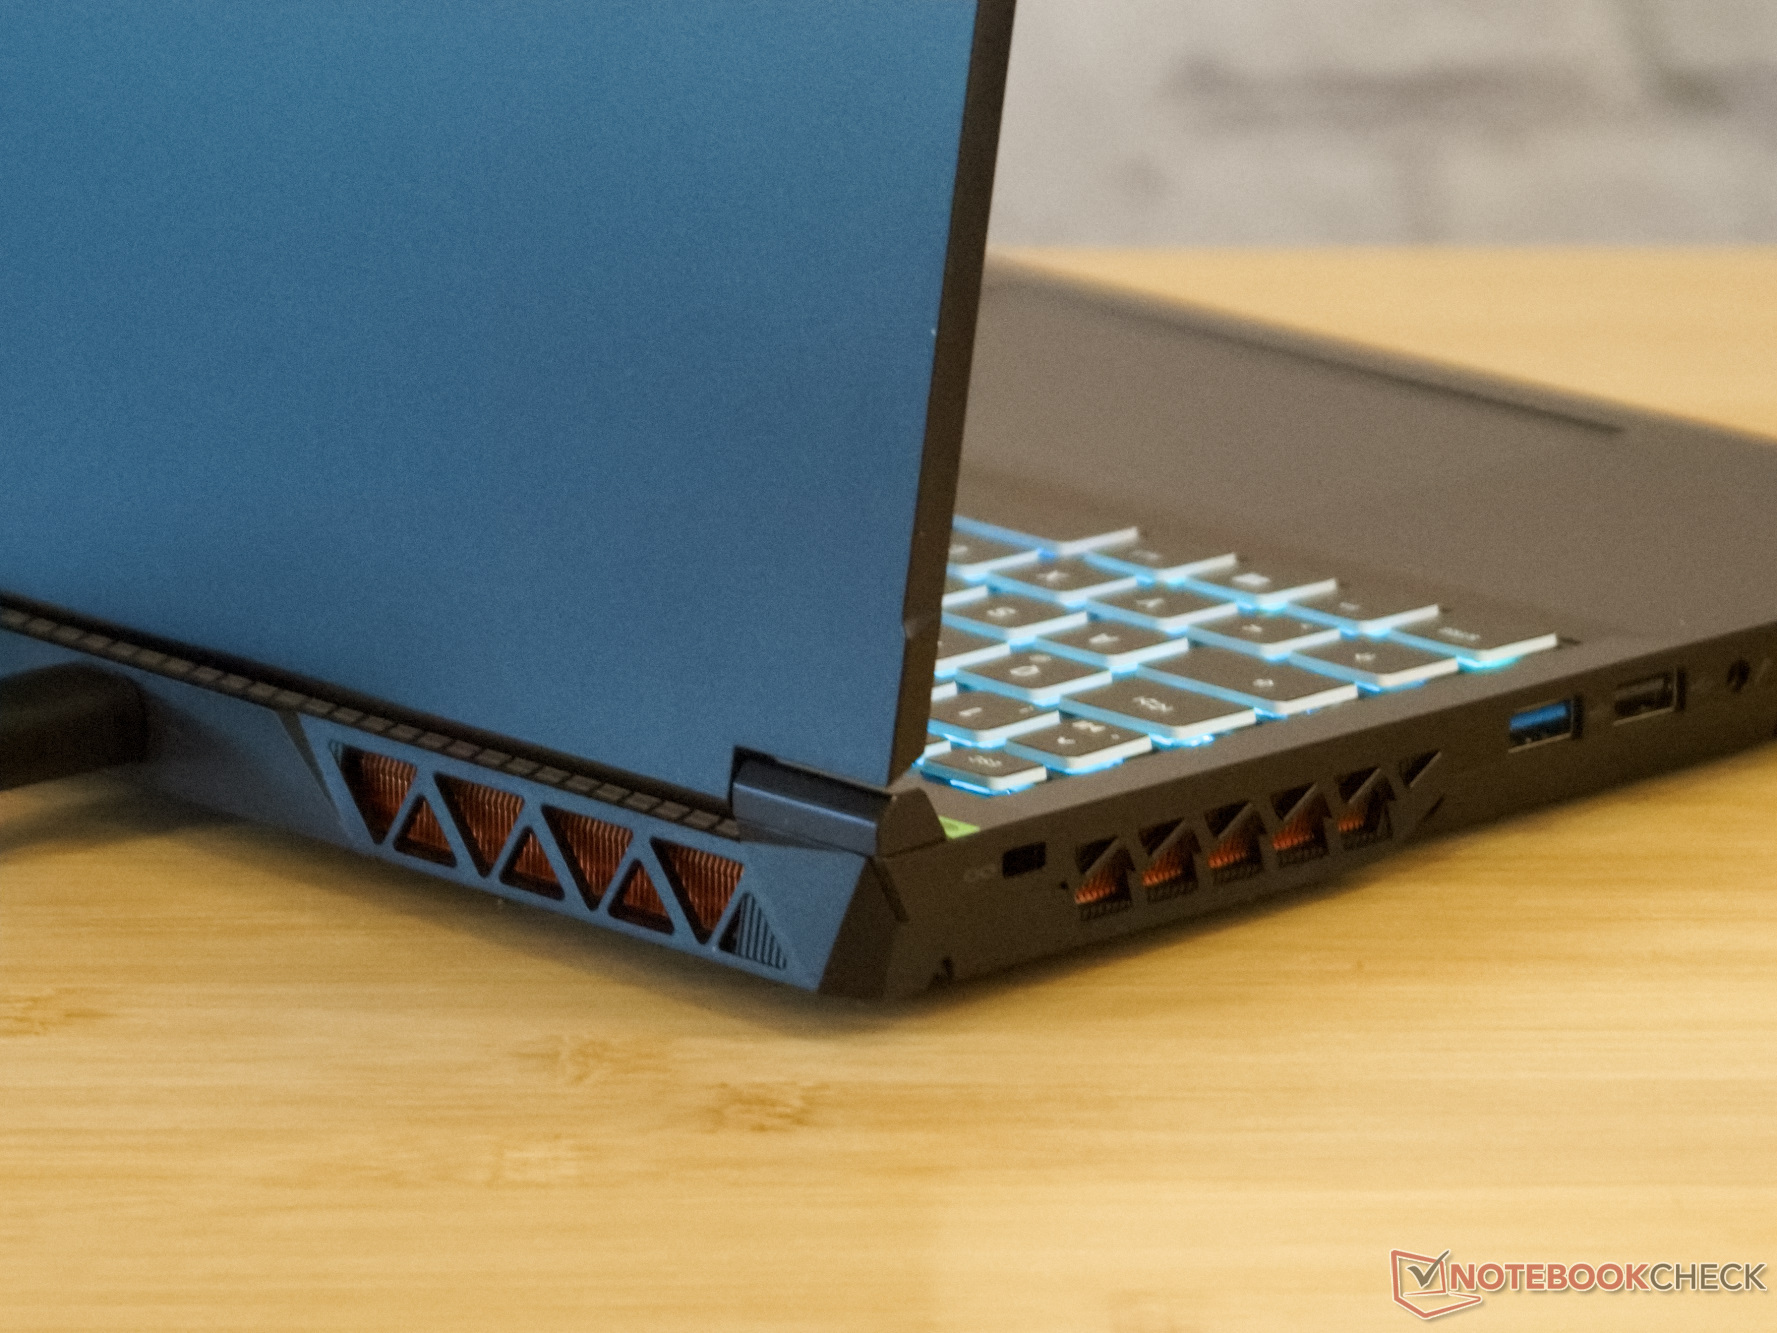
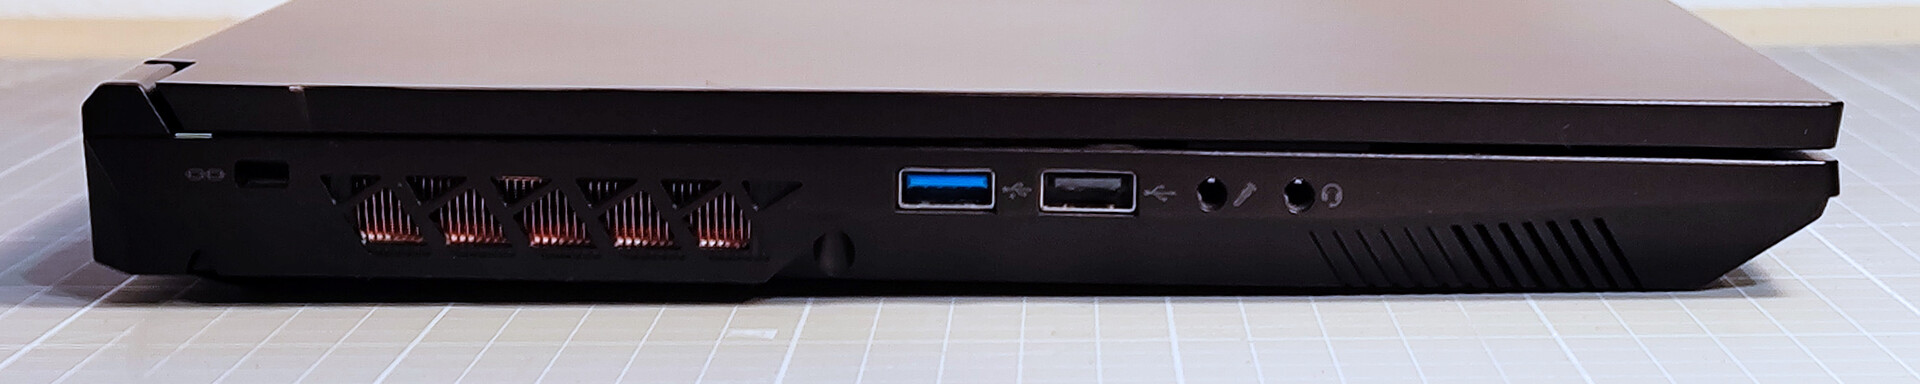
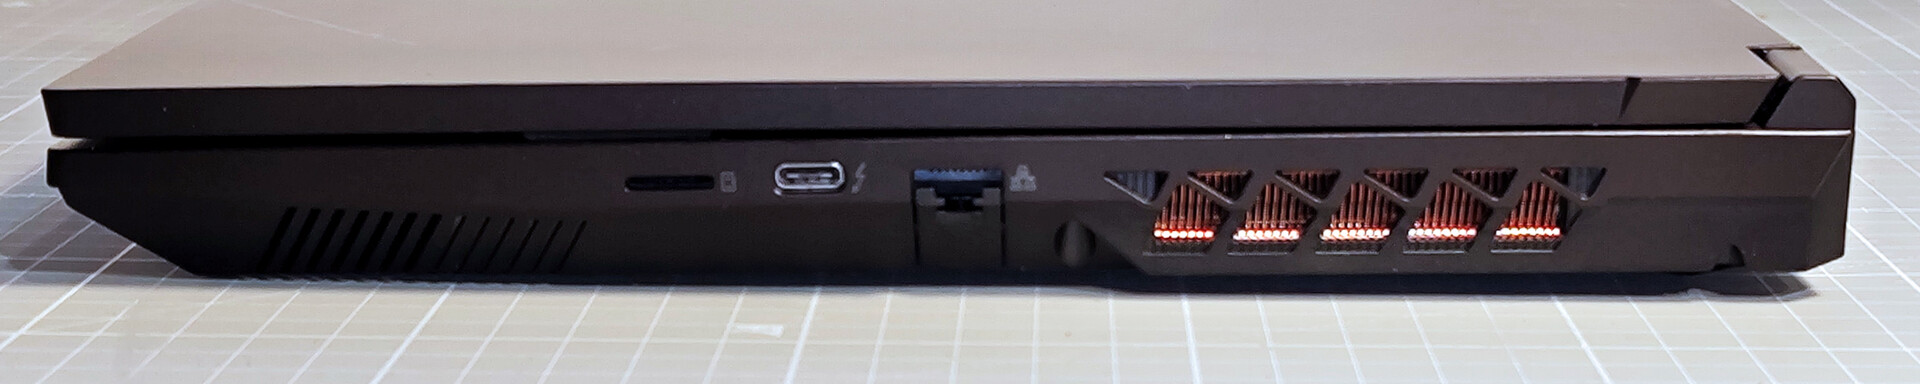
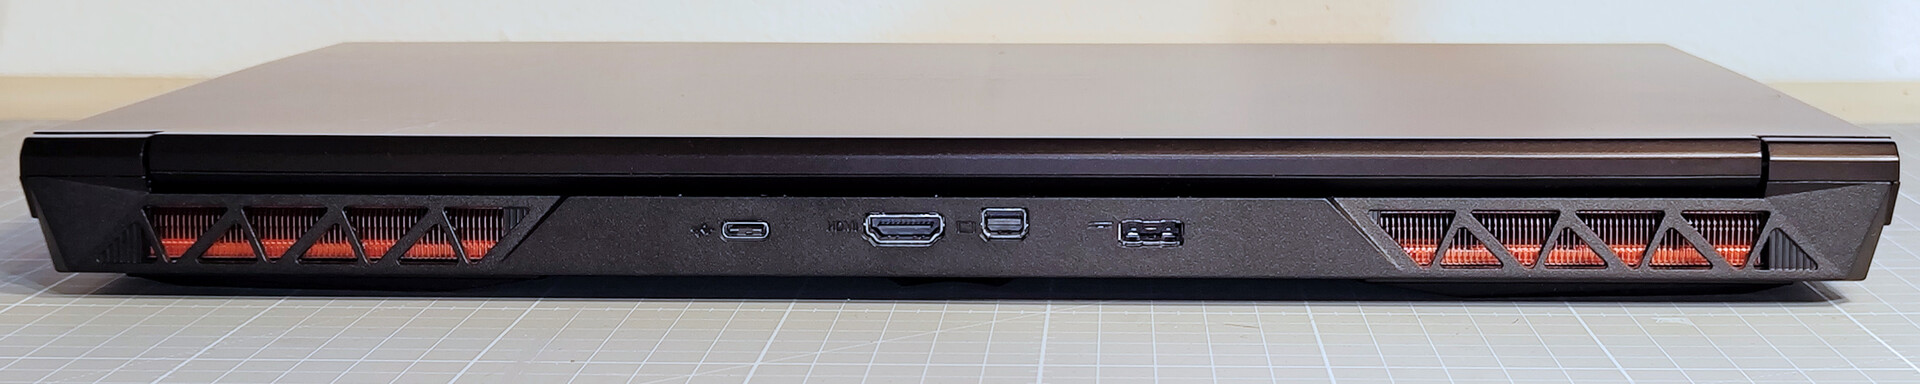
Equipamentos: Portas USB em três lados
Os aspectos de conectividade do XMG Focus 15 praticamente não mudaram desde nossa última análise. A única adição nova é outra porta USB-C, mas o leitor de cartão SD foi reduzido para o formato microSD.
Ambas as portas USB tipo C não oferecem fornecimento de energia. Portanto, você provavelmente sempre terá que levar o adaptador de energia com você, que pesa quase 1 kg.
Leitor de cartão SD
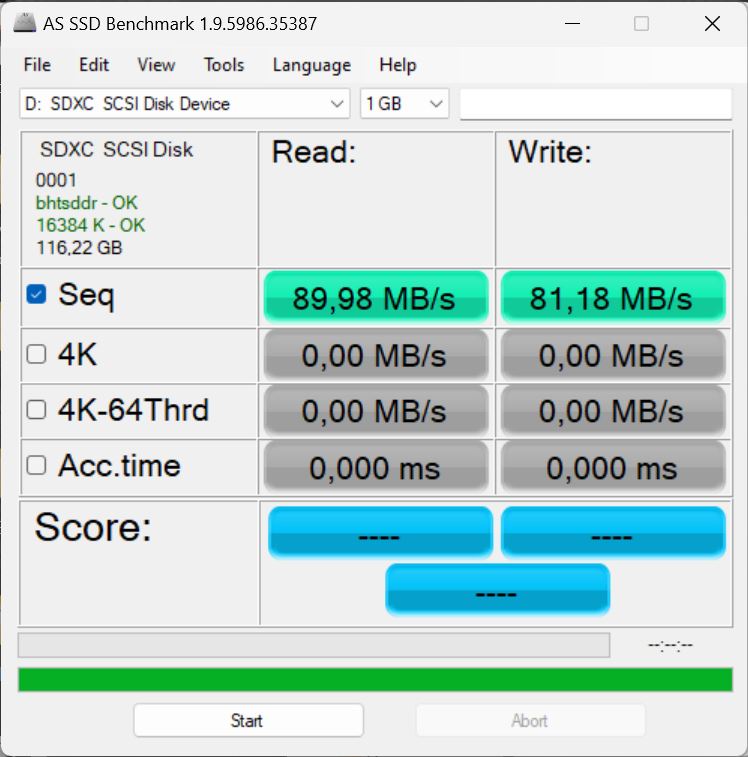
As taxas de transferência do cartão SD são boas usando o AV PRO microSD 128 GB V60 com nosso dispositivo de teste ou o Pro 15embora não sejam excelentes.
Os outros dois notebooks para jogos em nossa comparação vêm sem leitor de cartão.
| SD Card Reader - maximum AS SSD Seq Read Test (1GB) | |
| Gigabyte Aero 14 OLED BMF | |
| Média da turma Gaming (25.5 - 261, n=50, últimos 2 anos) | |
| Schenker XMG Focus 15 (E23) | |
| Acer Swift X SFX14-71G (Angelbird AV Pro V60) | |
| Samsung Galaxy Book3 Ultra 16 (AV PRO microSD 128 GB V60) | |
Comunicação
O módulo Wi-Fi Intel AX211 do Focus 15 oferece altas velocidades de transmissão na rede Wi-Fi 6E com nosso roteador de referência Asus ROG Rapture AXE-GT11000.
Por outro lado, as velocidades de transmissão na rede Wi-Fi 6 de 5 GHz parecem estar abaixo da média com a mesma configuração de teste.
Webcam
A webcam Full HD do novo Focus 15 focaliza perfeitamente apenas o centro da imagem. Portanto, o centro é nítido e rico em contraste, enquanto as bordas parecem um pouco desbotadas.
Os altos desvios de cor da câmera são irritantes, e os tons de pele, em particular, são mal reproduzidos.

 GeForce RTX 4050 Laptop GPU, i9-13900HX, Crucial P5 Plus 1TB CT1000P5PSSD8")
 GeForce RTX 4050 Laptop GPU, i9-13900HX, Crucial P5 Plus 1TB CT1000P5PSSD8")
Segurança
Não há opções de autenticação biométrica para o Focus 15. Um slot de segurança Kensington oferece proteção contra roubo físico.
O TPM 2.0 e o SecureBoot podem proteger contra o acesso não autorizado a dados.
Acessórios
Na caixa, encontramos um extenso pacote de acessórios, além da fonte de alimentação e da documentação. Você recebe um mouse pad grande com o logotipo da XMG e um abridor de garrafas correspondente, além de um CD de instalação e uma unidade USB contendo o Windows com programas e drivers correspondentes.
Manutenção
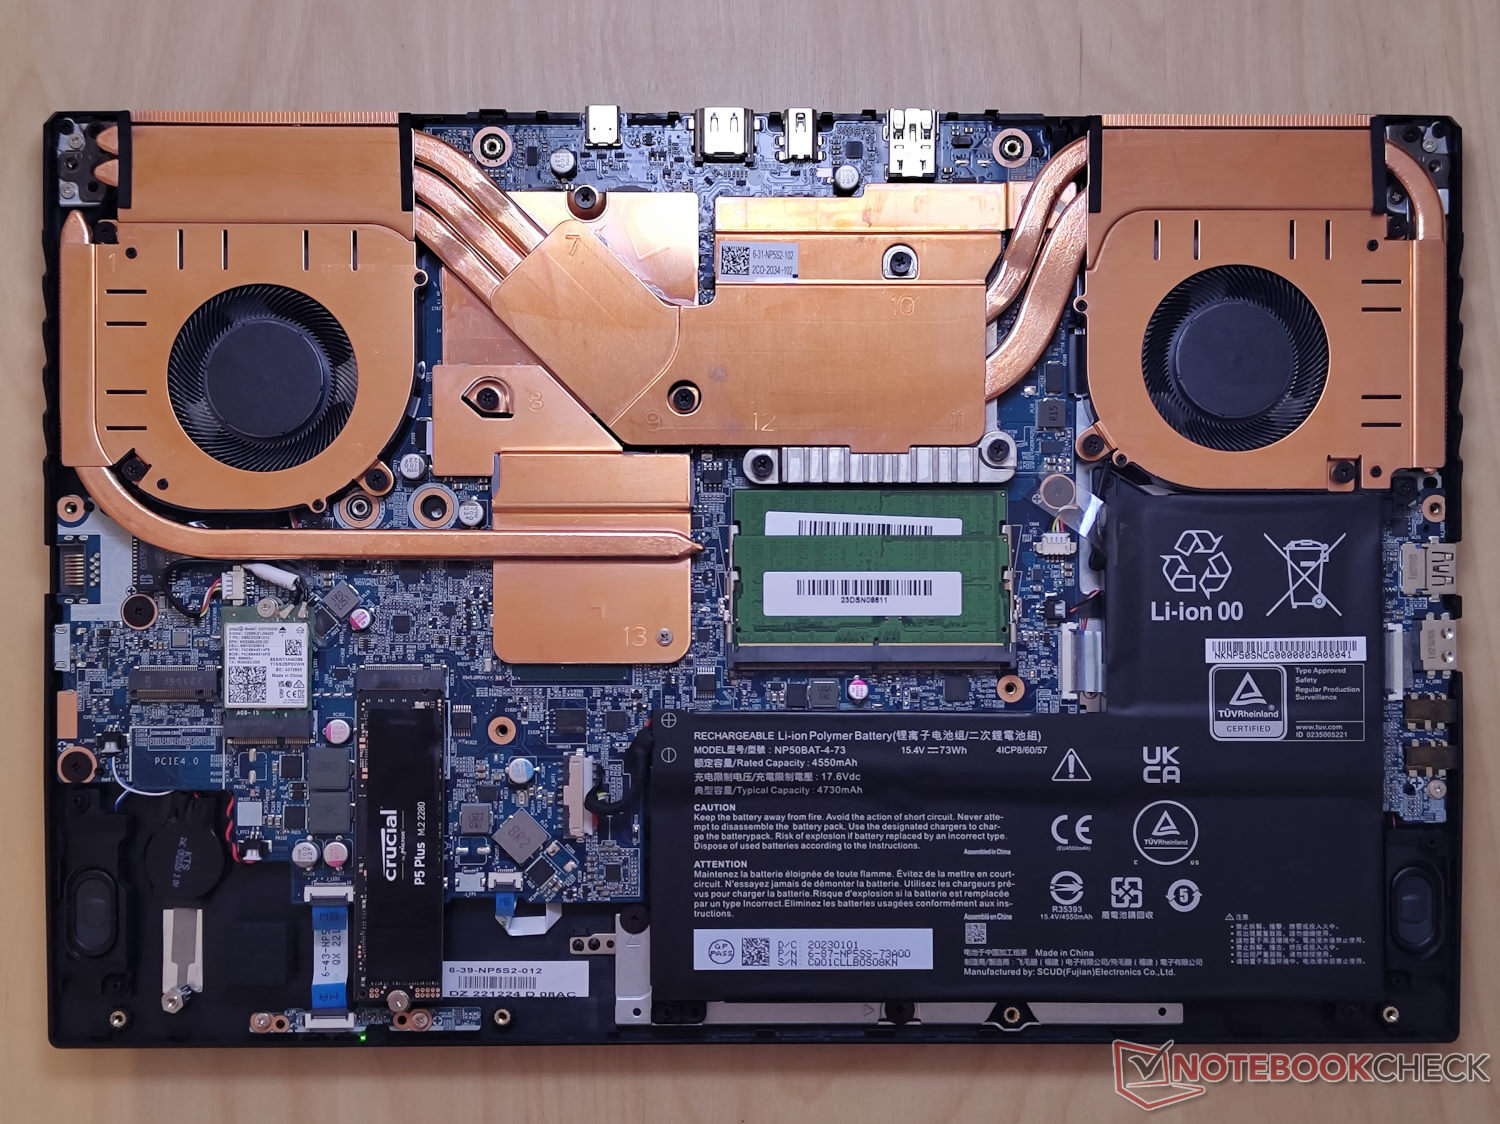
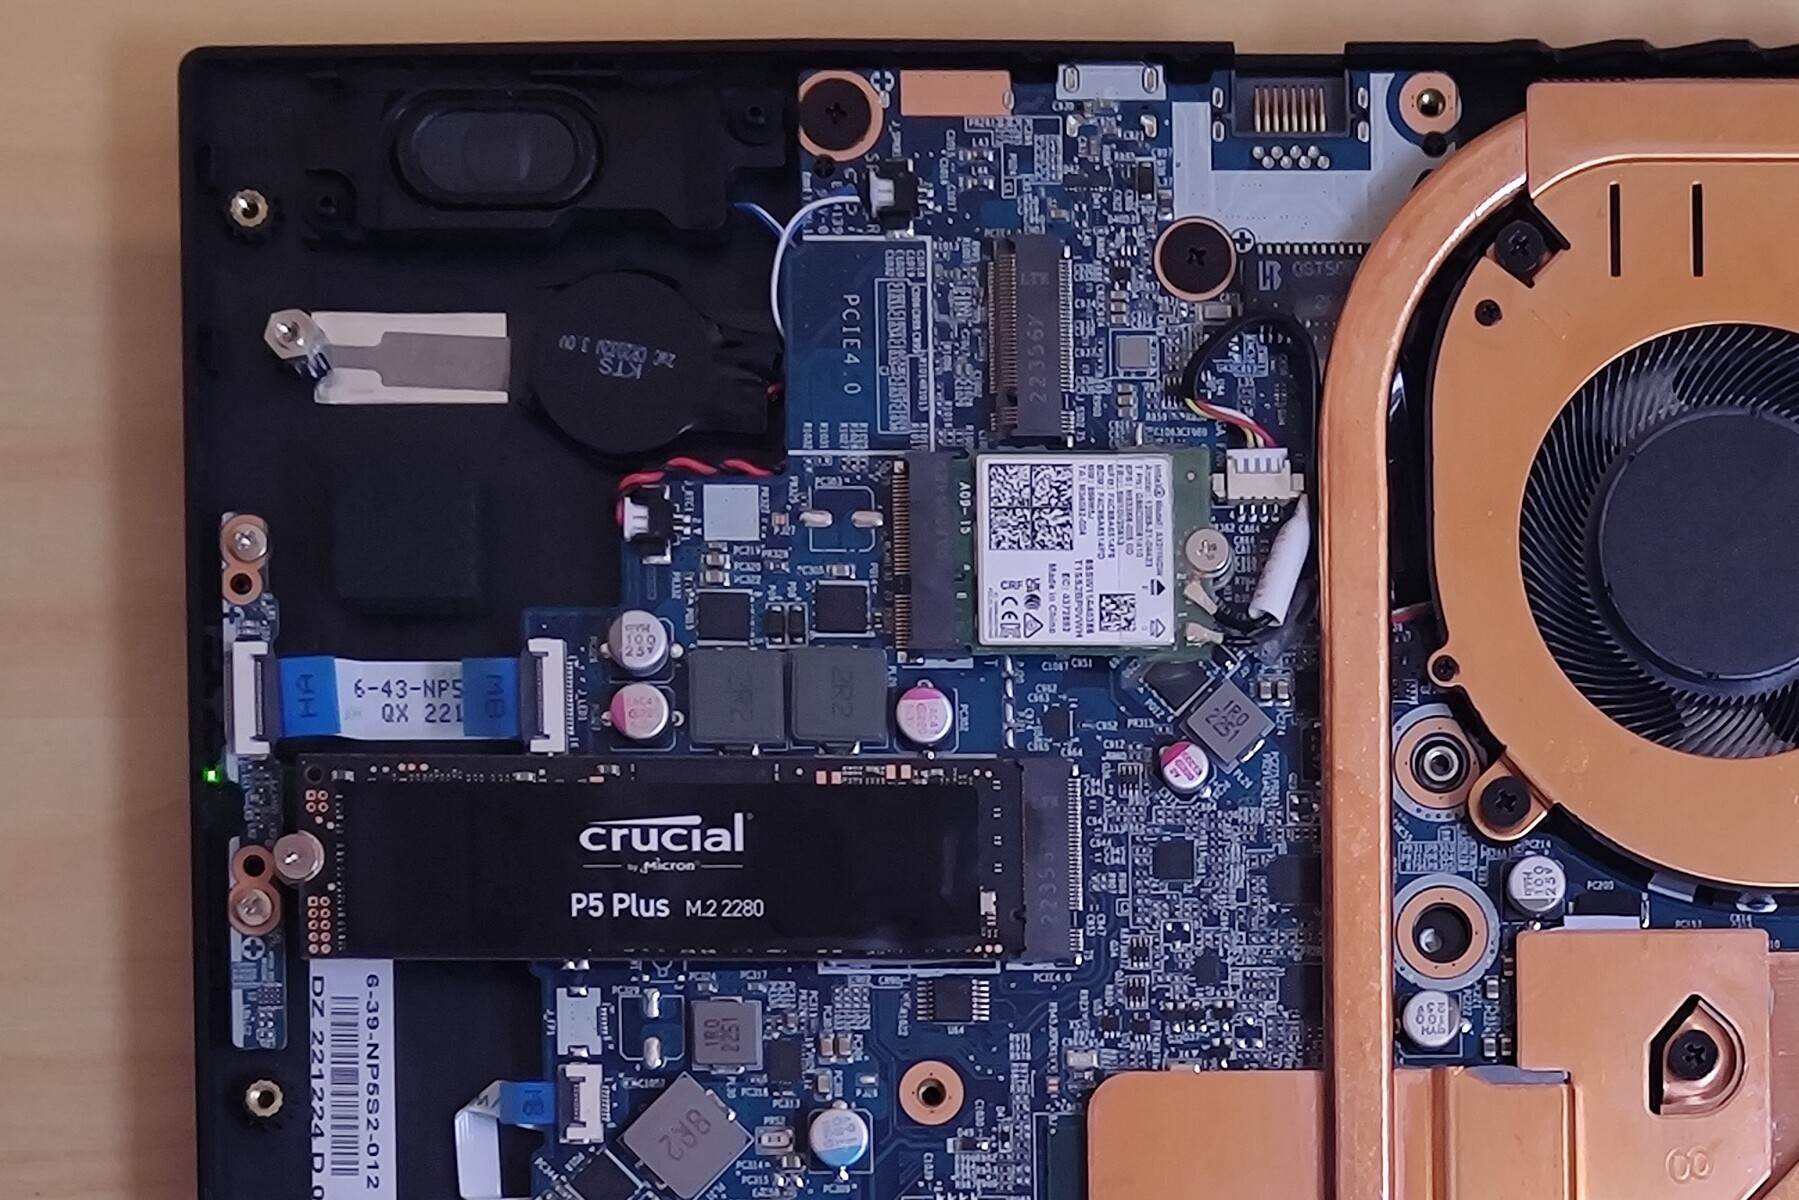
O SSD, a memória de trabalho e o módulo WLAN do XMG Focus 15 são substituíveis. Um slot M.2 PCIe 4.0 livre está disponível em nosso dispositivo de teste.
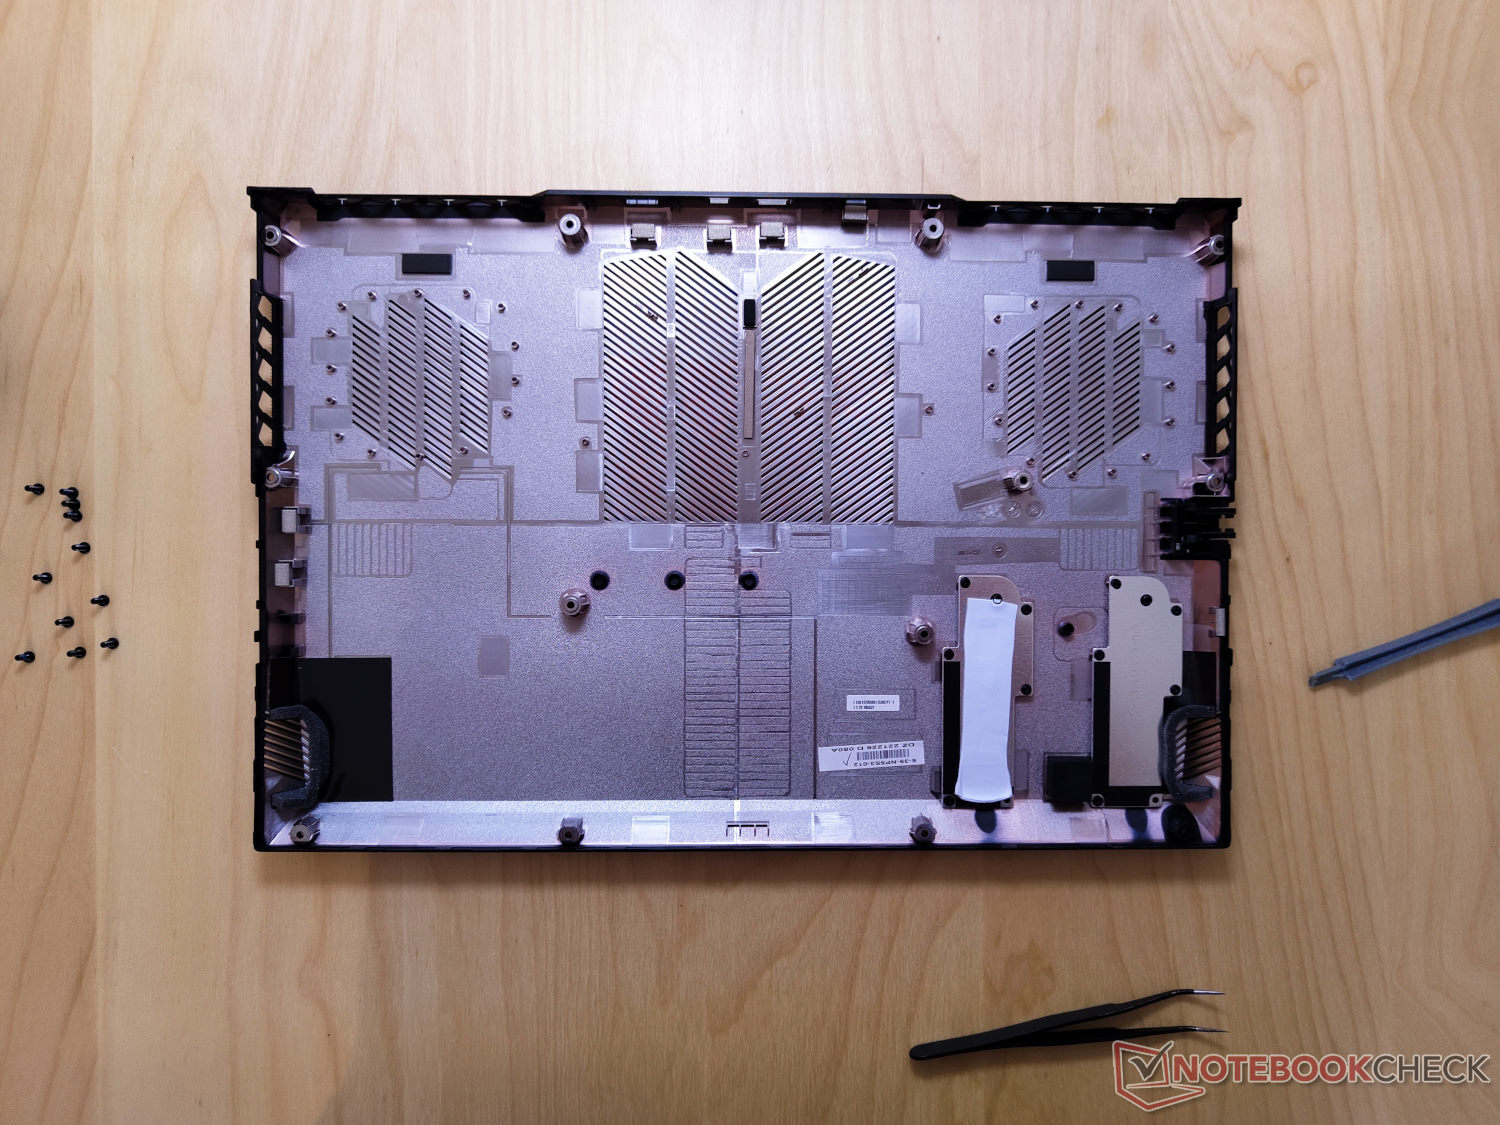
Toda a placa de base do laptop é fixada com 11 parafusos PH0 e pode ser removida com bastante facilidade para acessar os componentes correspondentes. Depois de soltar os parafusos, a tampa pode ser levantada sem problemas.
Garantia
A Schenker concede uma garantia básica gratuita de 24 meses para o laptop. Outras opções de garantia podem ser adicionadas via Bestware durante o checkout.
Input devices: RGB keyboard
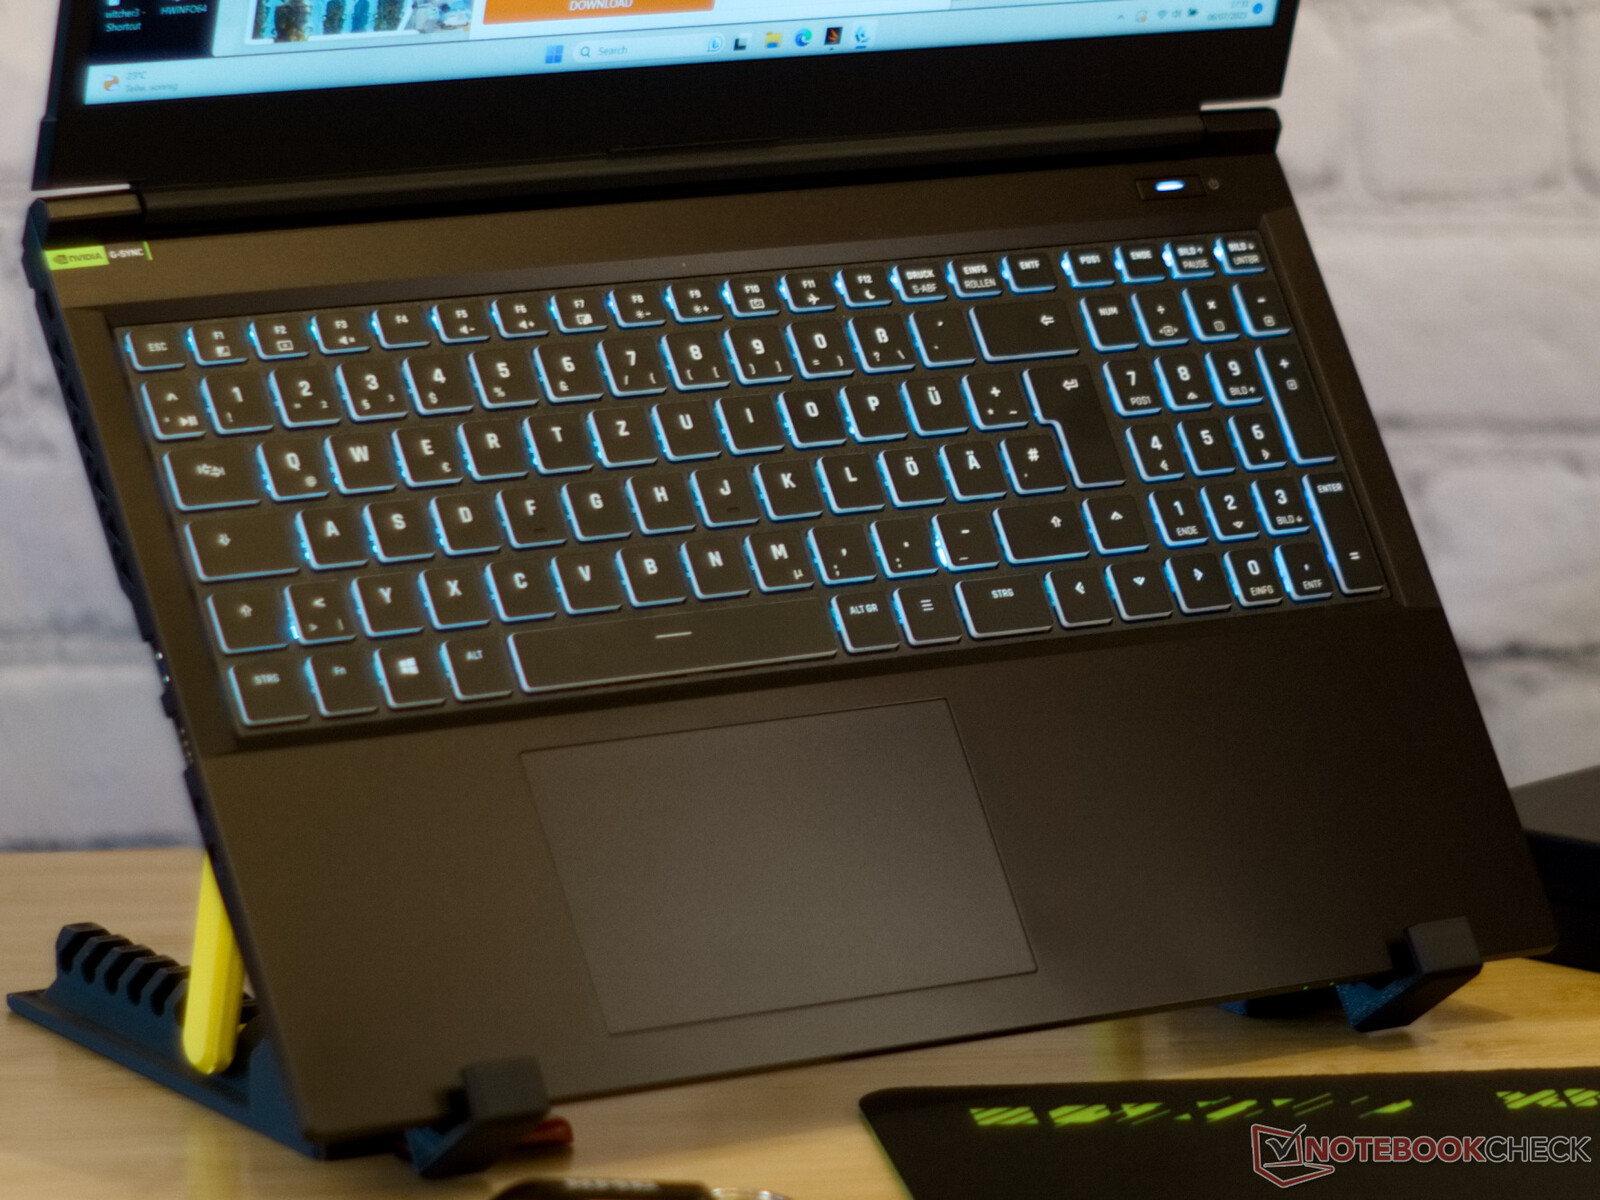
Teclado
A digitação no teclado preto do laptop com teclas com letras brancas é boa graças ao forte feedback tátil e ao deslocamento das teclas de 1,5 mm. A Schenker grava a laser todos os layouts de idiomas imagináveis na superfície preta, mediante solicitação. A iluminação RGB permite que o teclado brilhe na cor desejada.
Touchpad
Com cerca de 7 cm × 12 cm, o touchpad do Focus 15 é menor do que o da maioria dos notebooks para jogos. Entretanto, ele é grande o suficiente para navegar confortavelmente por toda a tela com vários dedos e realizar todos os gestos multitoque possíveis.
A posição e o tamanho do touchpad também oferecem espaço suficiente para evitar entradas errôneas com a palma da mão. A superfície lisa e os cliques confortáveis tornam a entrada do mouse fluida.
Tela: QHD a 240 Hz
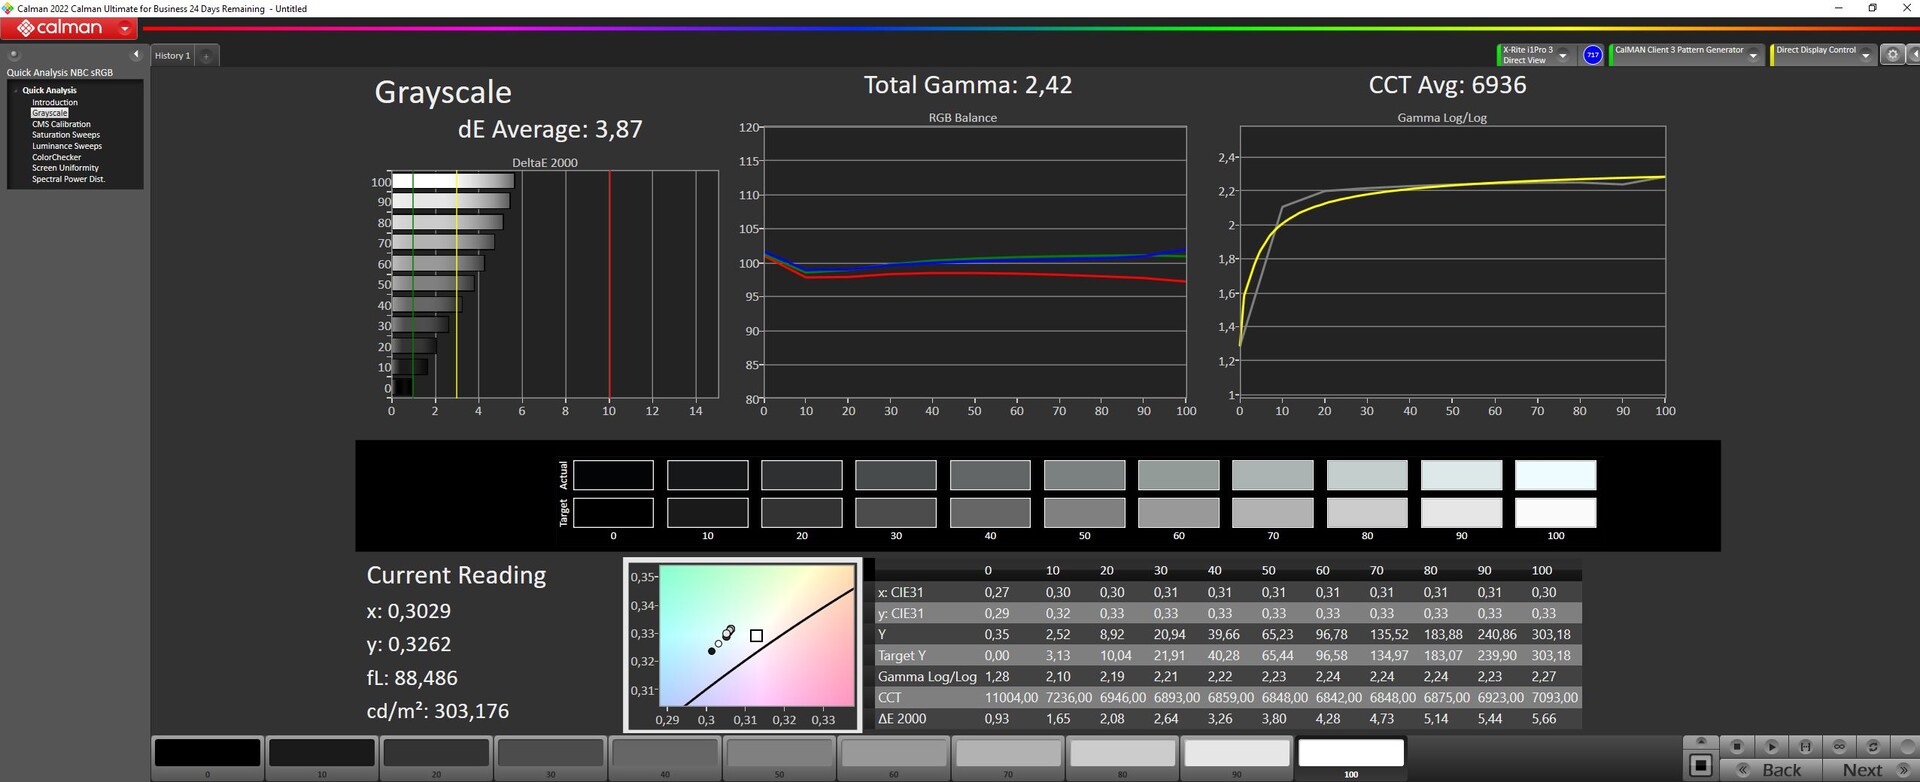
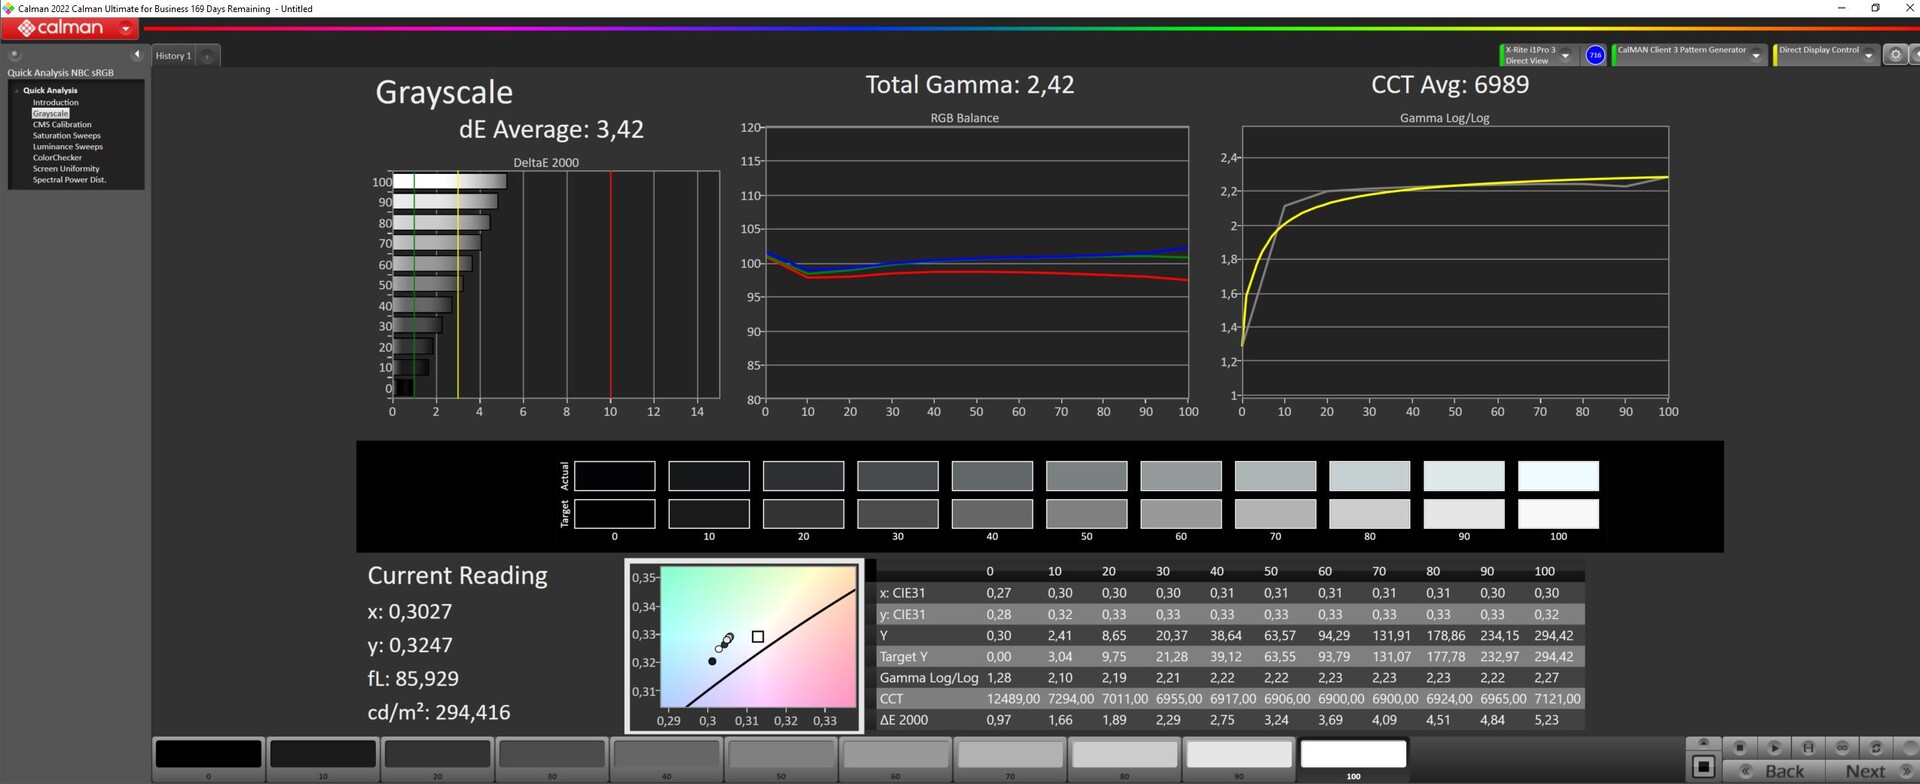
O Focus 15 usa o mesmo painel IPS de alta qualidade que o XMG Pro 15. No entanto, ele é um pouco mais escuro do que o Pro 15, com um brilho médio de 302 cd/m² em nossa amostra de análise. A tela tem uma taxa de atualização de 240 Hz e apresenta uma resolução de 2.560 × 1.440.
O valor de preto e o contraste da tela fosca são aceitáveis, e a iluminação também é boa. O sangramento da luz de fundo é pouco visível na tela.
Além da tela QHD, a Schenker também oferece uma opção de tela Full HD para o XMG Focus 15. Ela tem uma taxa de atualização de 165 Hz e representa apenas 95% do espaço de cores sRGB, de acordo com a Schenker. No entanto, ambas as opções de tela suportam G-Sync.
Aqueles que comprarem o laptop como um dispositivo exclusivamente para jogos e quiserem usá-lo com a RTX 4050 devem considerar a escolha da tela Full HD, que é cerca de 80 euros mais barata. De qualquer forma, a maioria dos jogos suporta apenas o espaço de cores sRGB e pode utilizar totalmente os recursos da tela em combinação com o RTX 4050.
Os jogos em QHD ou 4K só são possíveis até certo ponto com os gráficos Nvidia de nível básico.
| |||||||||||||||||||||||||
iluminação: 85 %
iluminação com acumulador: 302 cd/m²
Contraste: 839:1 (Preto: 0.36 cd/m²)
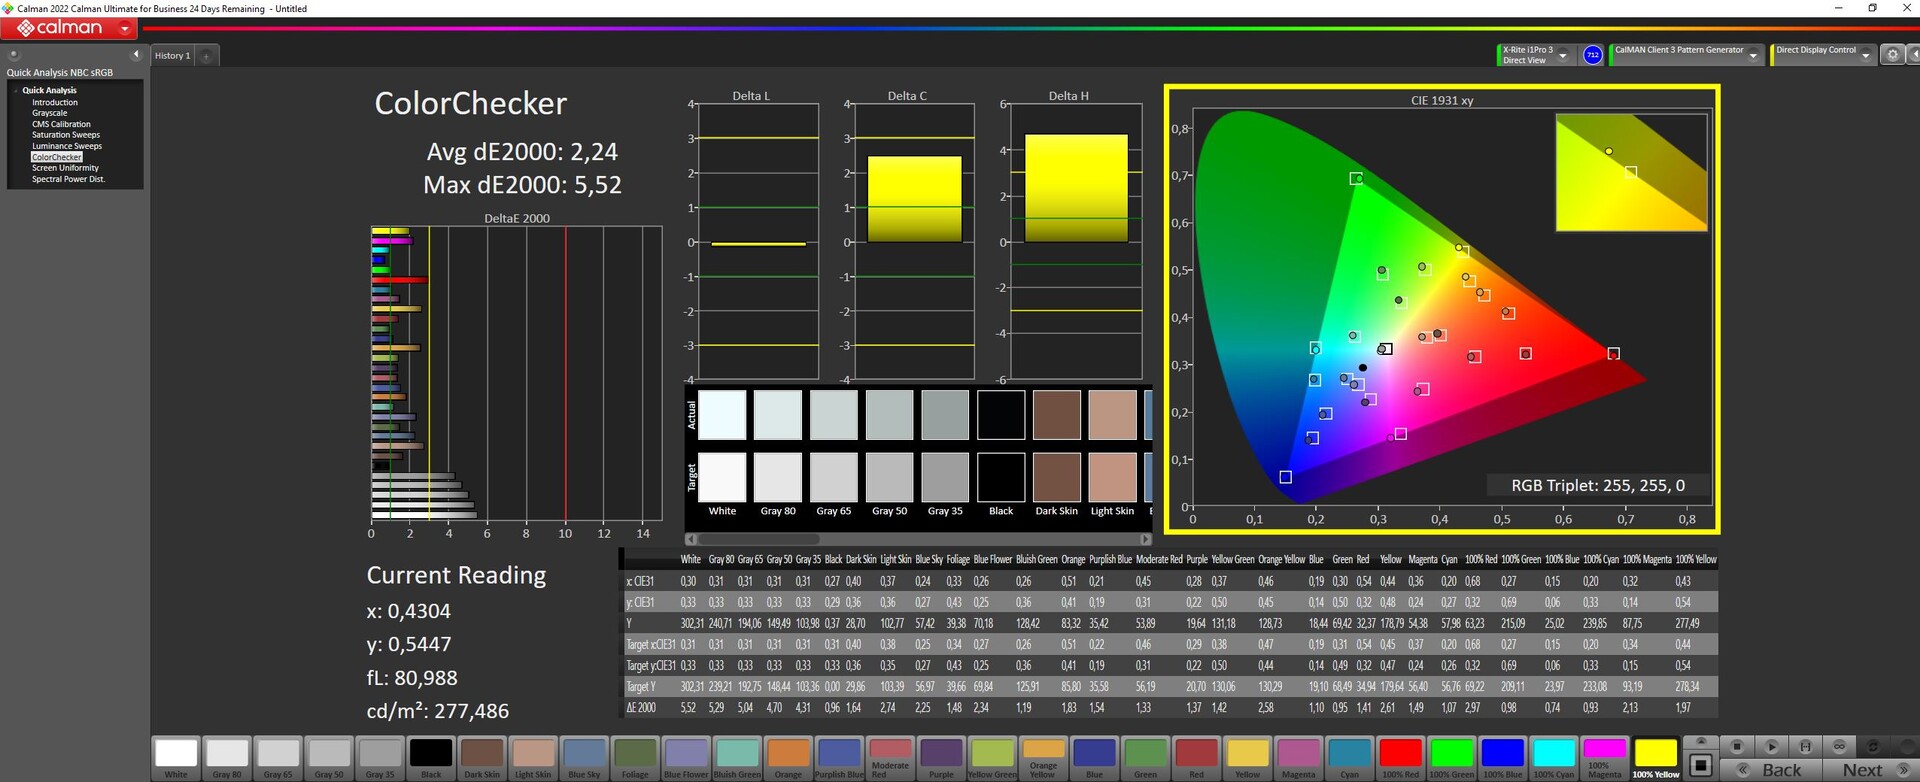
ΔE ColorChecker Calman: 2.24 | ∀{0.5-29.43 Ø4.72}
ΔE Greyscale Calman: 3.87 | ∀{0.09-98 Ø4.97}
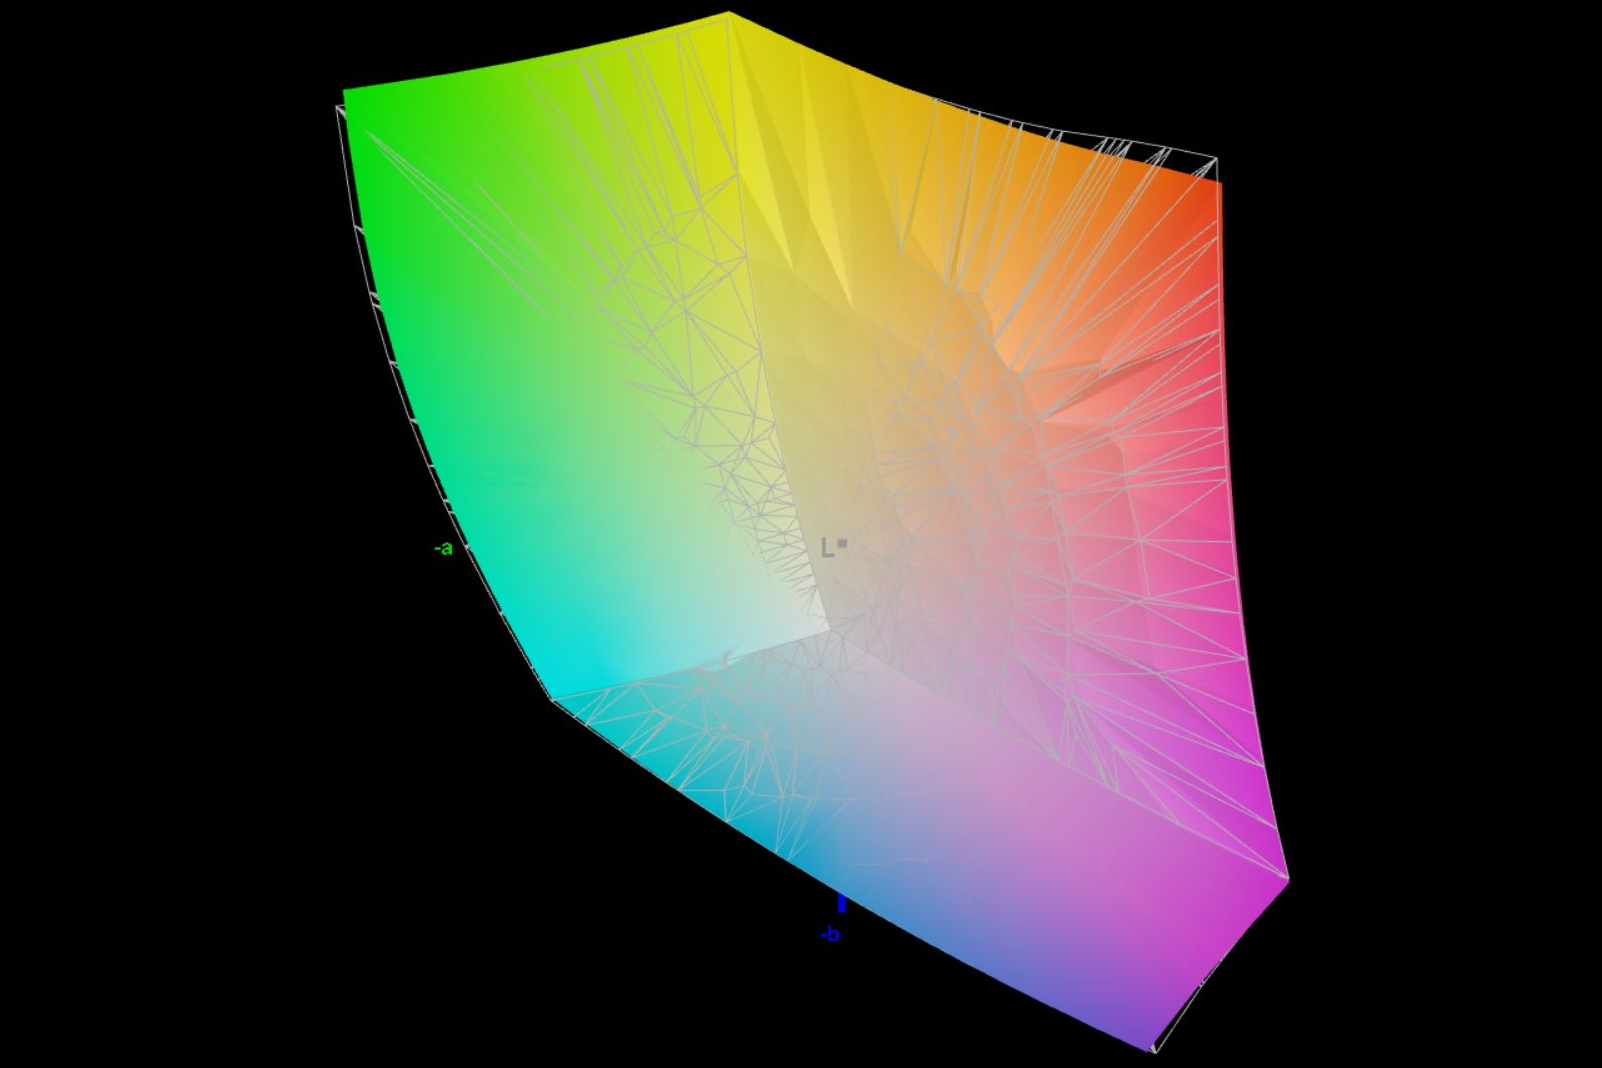
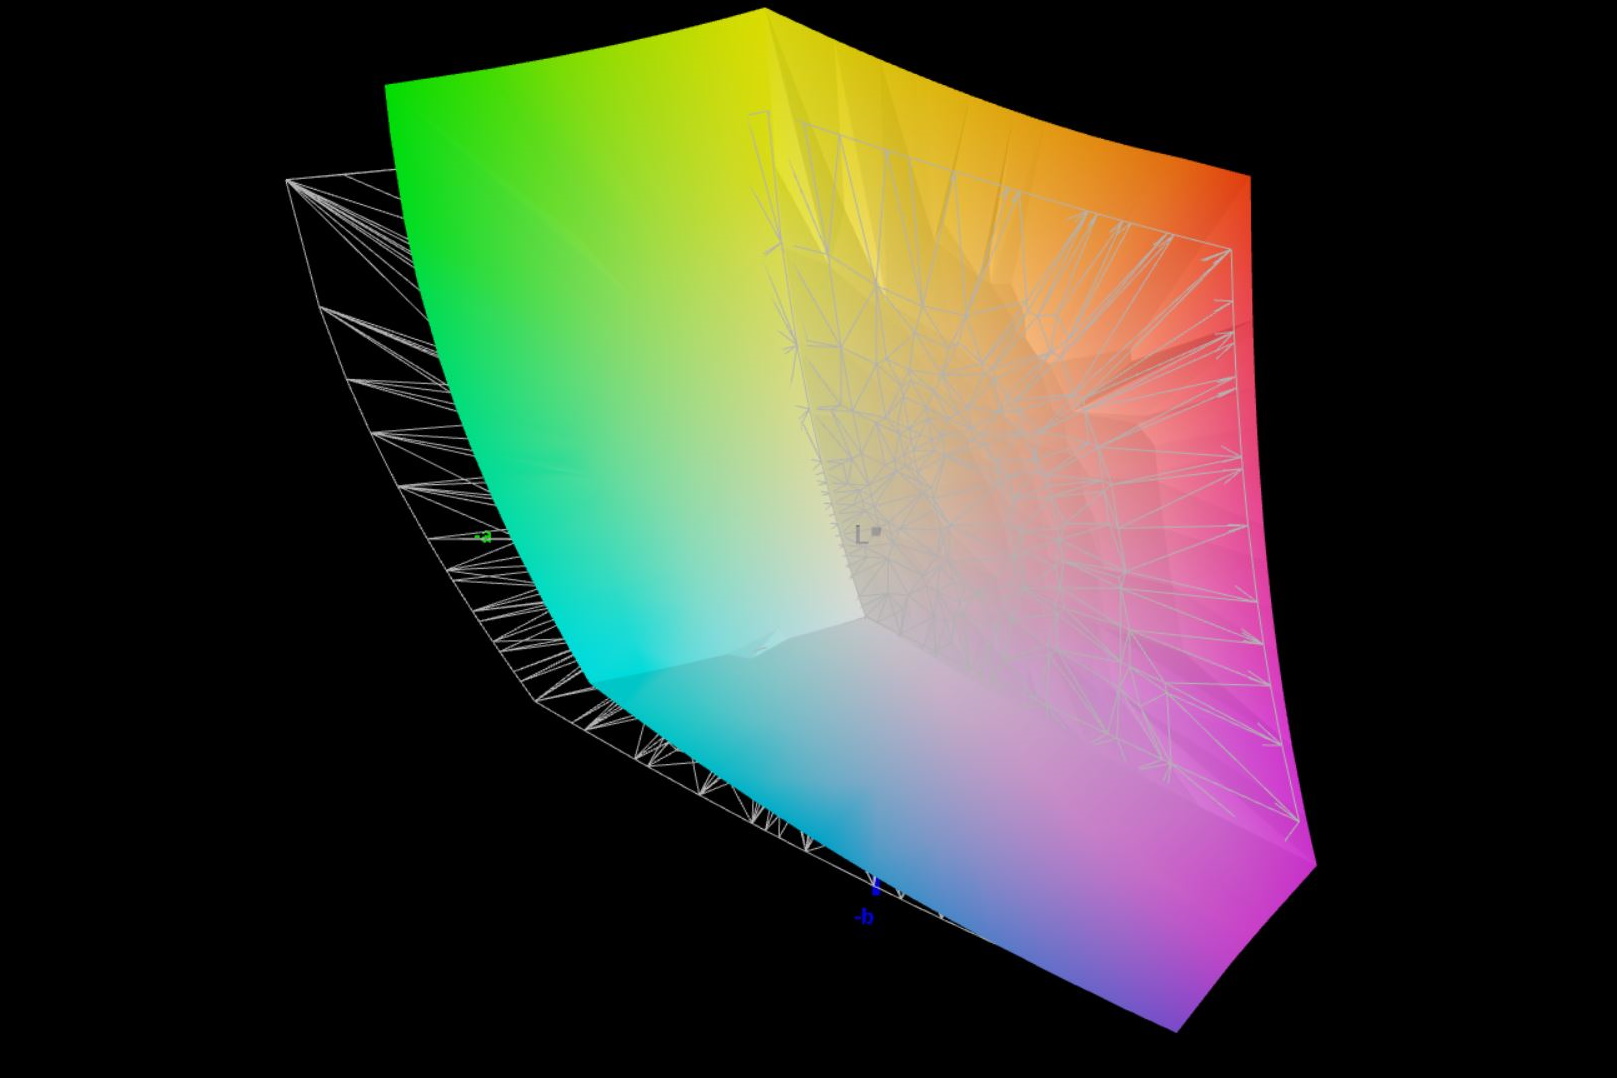
86.3% AdobeRGB 1998 (Argyll 3D)
99.9% sRGB (Argyll 3D)
98.6% Display P3 (Argyll 3D)
Gamma: 2.42
CCT: 6936 K
| Schenker XMG Focus 15 (E23) BOE0AD1, IPS, 2569x1440, 15.6" | Schenker XMG Pro 15 (E23) BOE0AD1, IPS, 2560x1440, 15.6" | Asus TUF A15 FA507 N156HMA-GA1, IPS, 1920x1080, 15.6" | MSI Katana 15 B12VEK AUOAF90 (B156HAN08.4), IPS, 1920x1080, 15.6" | Acer Swift X SFX14-71G ATNA45AF03-0, OLED, 2880x1800, 14.5" | Samsung Galaxy Book3 Ultra 16 Samsung ATNA60CL03-0, AMOLED, 2880x1800, 16" | Gigabyte Aero 14 OLED BMF Samsung SDC4192 (ATNA40YK14-0), OLED, 2880x1800, 14" | |
|---|---|---|---|---|---|---|---|
| Display | -1% | -20% | -53% | 4% | 4% | 1% | |
| Display P3 Coverage (%) | 98.6 | 97.8 -1% | 64.9 -34% | 38.1 -61% | 99.9 1% | 99.9 1% | 99.8 1% |
| sRGB Coverage (%) | 99.9 | 99.9 0% | 96.5 -3% | 56.8 -43% | 99.9 0% | 100 0% | 100 0% |
| AdobeRGB 1998 Coverage (%) | 86.3 | 85.4 -1% | 66.6 -23% | 39.3 -54% | 96.2 11% | 96.3 12% | 88.7 3% |
| Response Times | 14% | -87% | -140% | 96% | 96% | 82% | |
| Response Time Grey 50% / Grey 80% * (ms) | 15.6 ? | 14 ? 10% | 30.4 ? -95% | 38.8 ? -149% | 0.4 ? 97% | 0.49 ? 97% | 2.4 ? 85% |
| Response Time Black / White * (ms) | 11.6 ? | 9.6 ? 17% | 20.8 ? -79% | 26.8 ? -131% | 0.6 ? 95% | 0.65 ? 94% | 2.4 ? 79% |
| PWM Frequency (Hz) | 240 ? | 240 ? | 300 | ||||
| Screen | 10% | 30% | -38% | 30% | 215% | 103% | |
| Brightness middle (cd/m²) | 302 | 322 7% | 288 -5% | 261 -14% | 388 28% | 400 32% | 423 40% |
| Brightness (cd/m²) | 278 | 301 8% | 271 -3% | 258 -7% | 390 40% | 399 44% | 427 54% |
| Brightness Distribution (%) | 85 | 85 0% | 91 7% | 92 8% | 98 15% | 93 9% | 98 15% |
| Black Level * (cd/m²) | 0.36 | 0.36 -0% | 0.17 53% | 0.19 47% | 0.03 92% | 0.1 72% | |
| Contrast (:1) | 839 | 894 7% | 1694 102% | 1374 64% | 13333 1489% | 4230 404% | |
| Colorchecker dE 2000 * | 2.24 | 1.98 12% | 1.9 15% | 5.57 -149% | 2.2 2% | 2.3 -3% | 0.55 75% |
| Colorchecker dE 2000 max. * | 5.52 | 5.24 5% | 3.3 40% | 20.6 -273% | 3.9 29% | 4.15 25% | 1.15 79% |
| Greyscale dE 2000 * | 3.87 | 2.44 37% | 2.7 30% | 3.19 18% | 1.4 64% | 2.7 30% | 0.69 82% |
| Gamma | 2.42 91% | 2.42 91% | 2.32 95% | 2.45 90% | 2.22 99% | 2.266 97% | 2.42 91% |
| CCT | 6936 94% | 6984 93% | 6535 99% | 6146 106% | 6380 102% | 7047 92% | 6479 100% |
| Colorchecker dE 2000 calibrated * | 1.98 | 0.9 | 4.63 | 1.9 | 1.66 | 1.15 | |
| Média Total (Programa/Configurações) | 8% /
8% | -26% /
0% | -77% /
-57% | 43% /
35% | 105% /
148% | 62% /
76% |
* ... menor é melhor
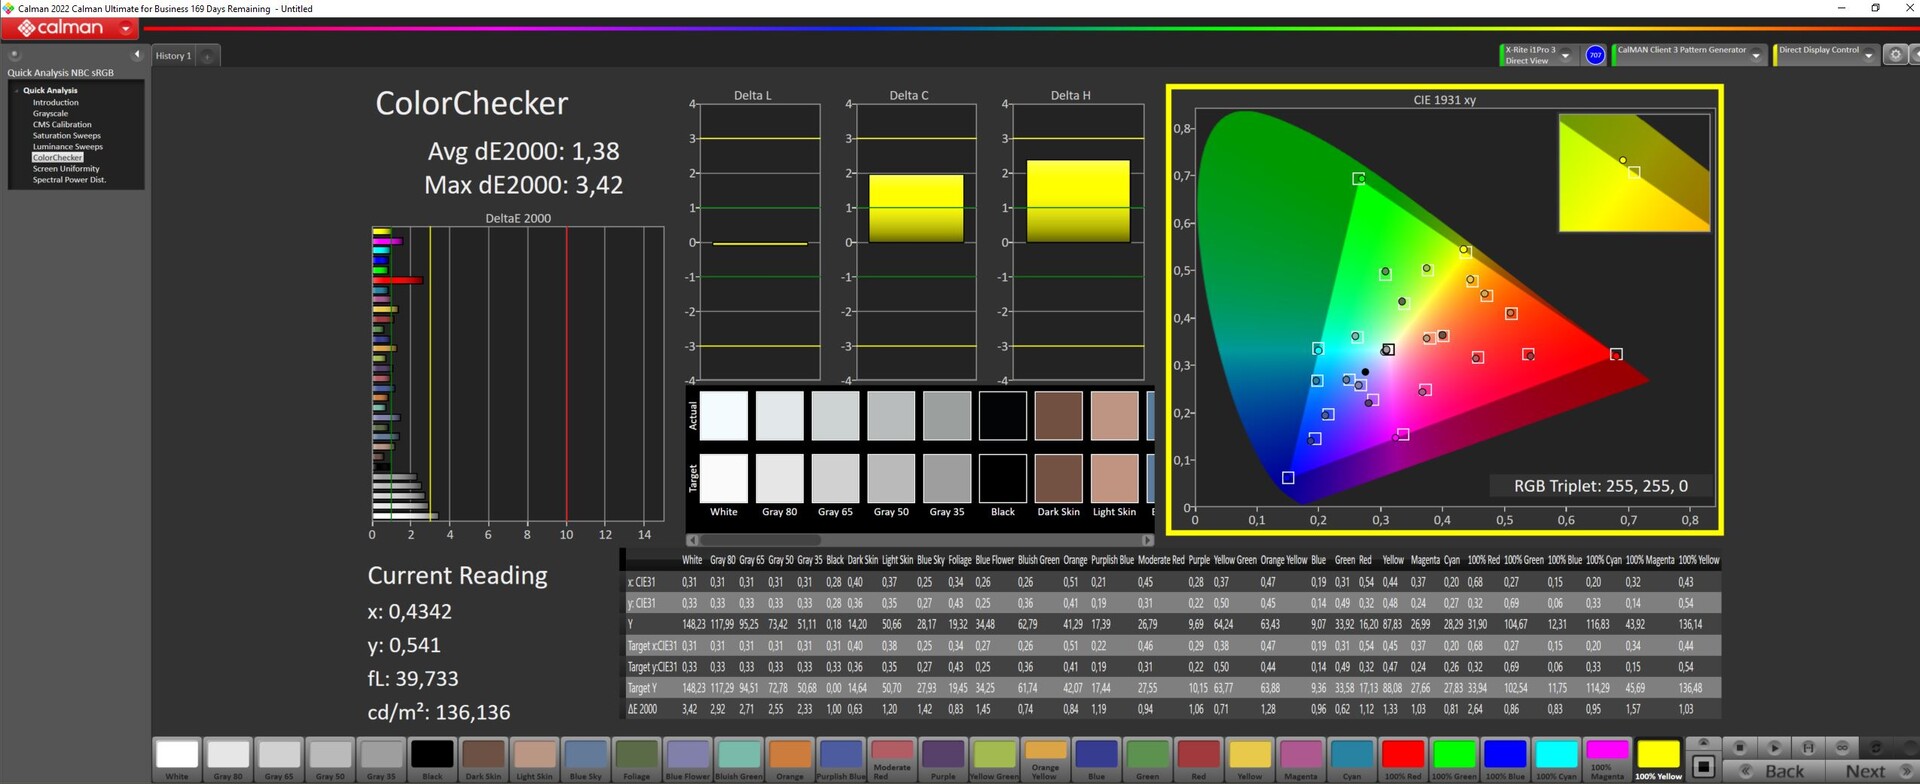
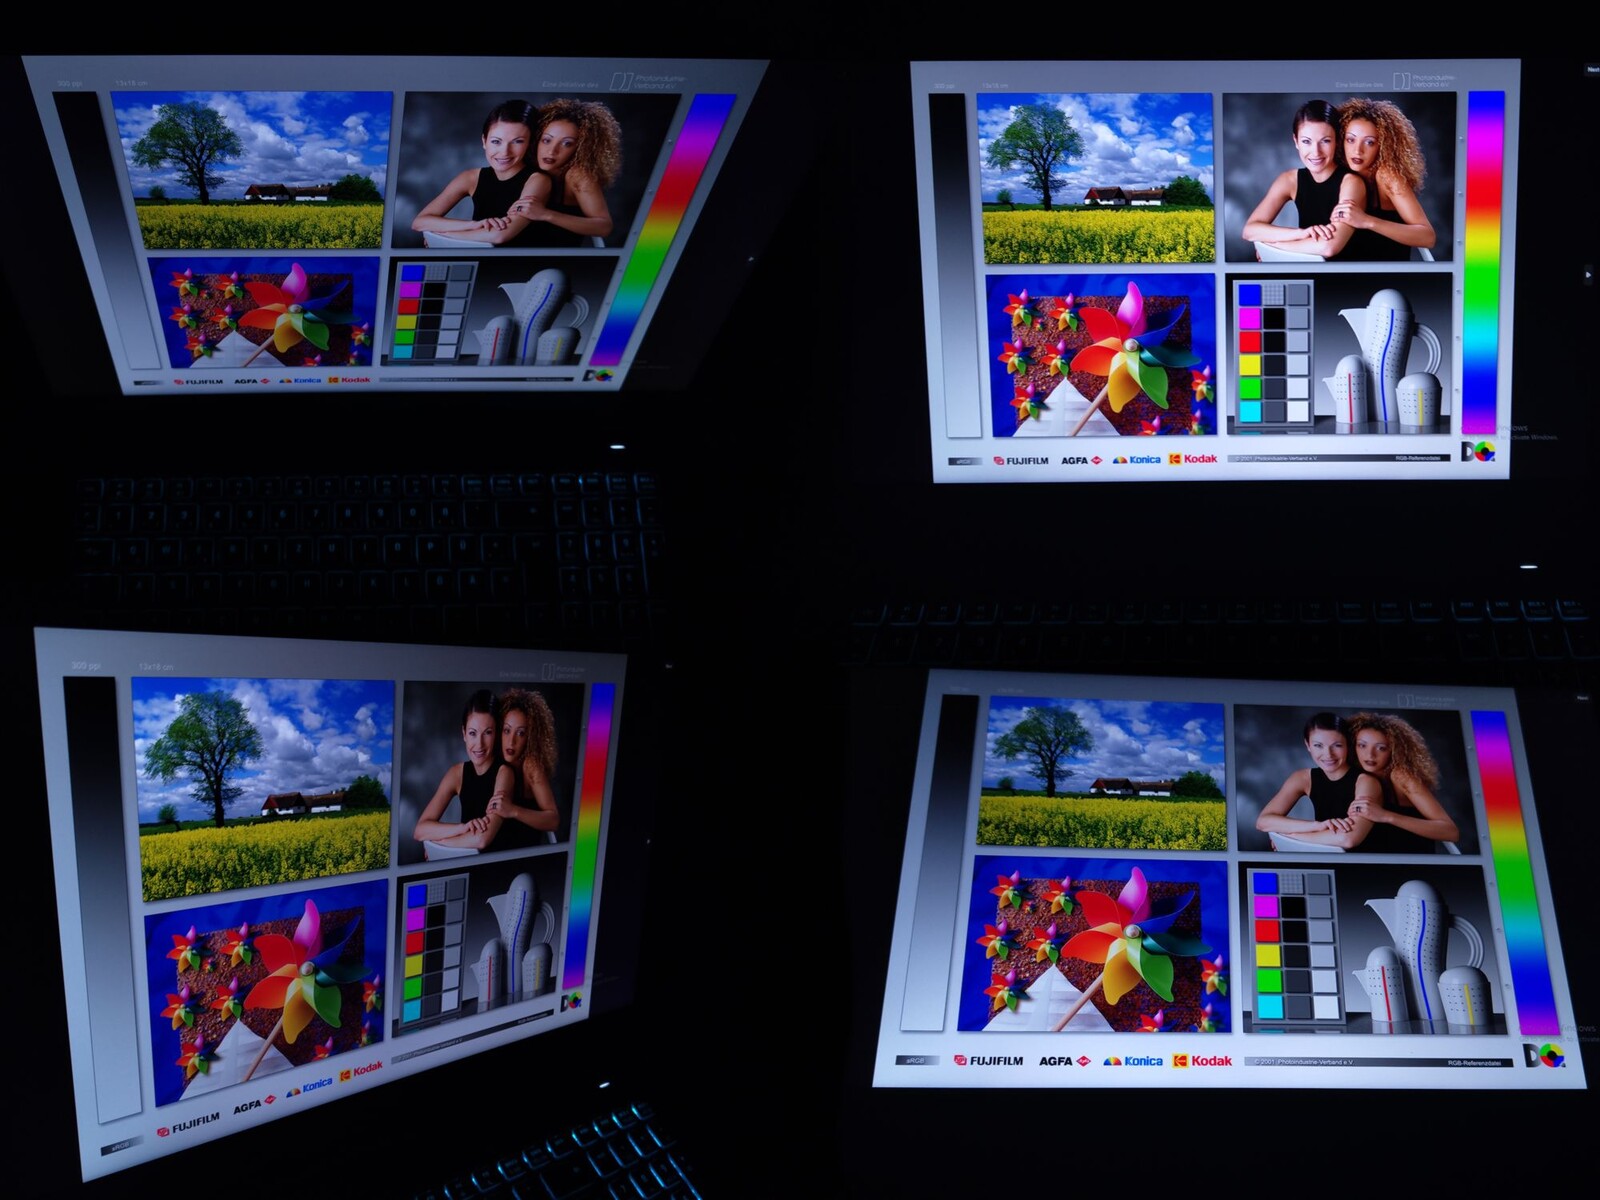
Para videógrafos e criadores de conteúdo, a cobertura quase completa do espaço de cores Display P3 no XMG Focus 15 deve ser uma vantagem. O espaço de cores AdobeRGB é mais importante para edição e impressão de fotos, e o Focus 15 consegue reproduzir apenas 88% desse espaço.
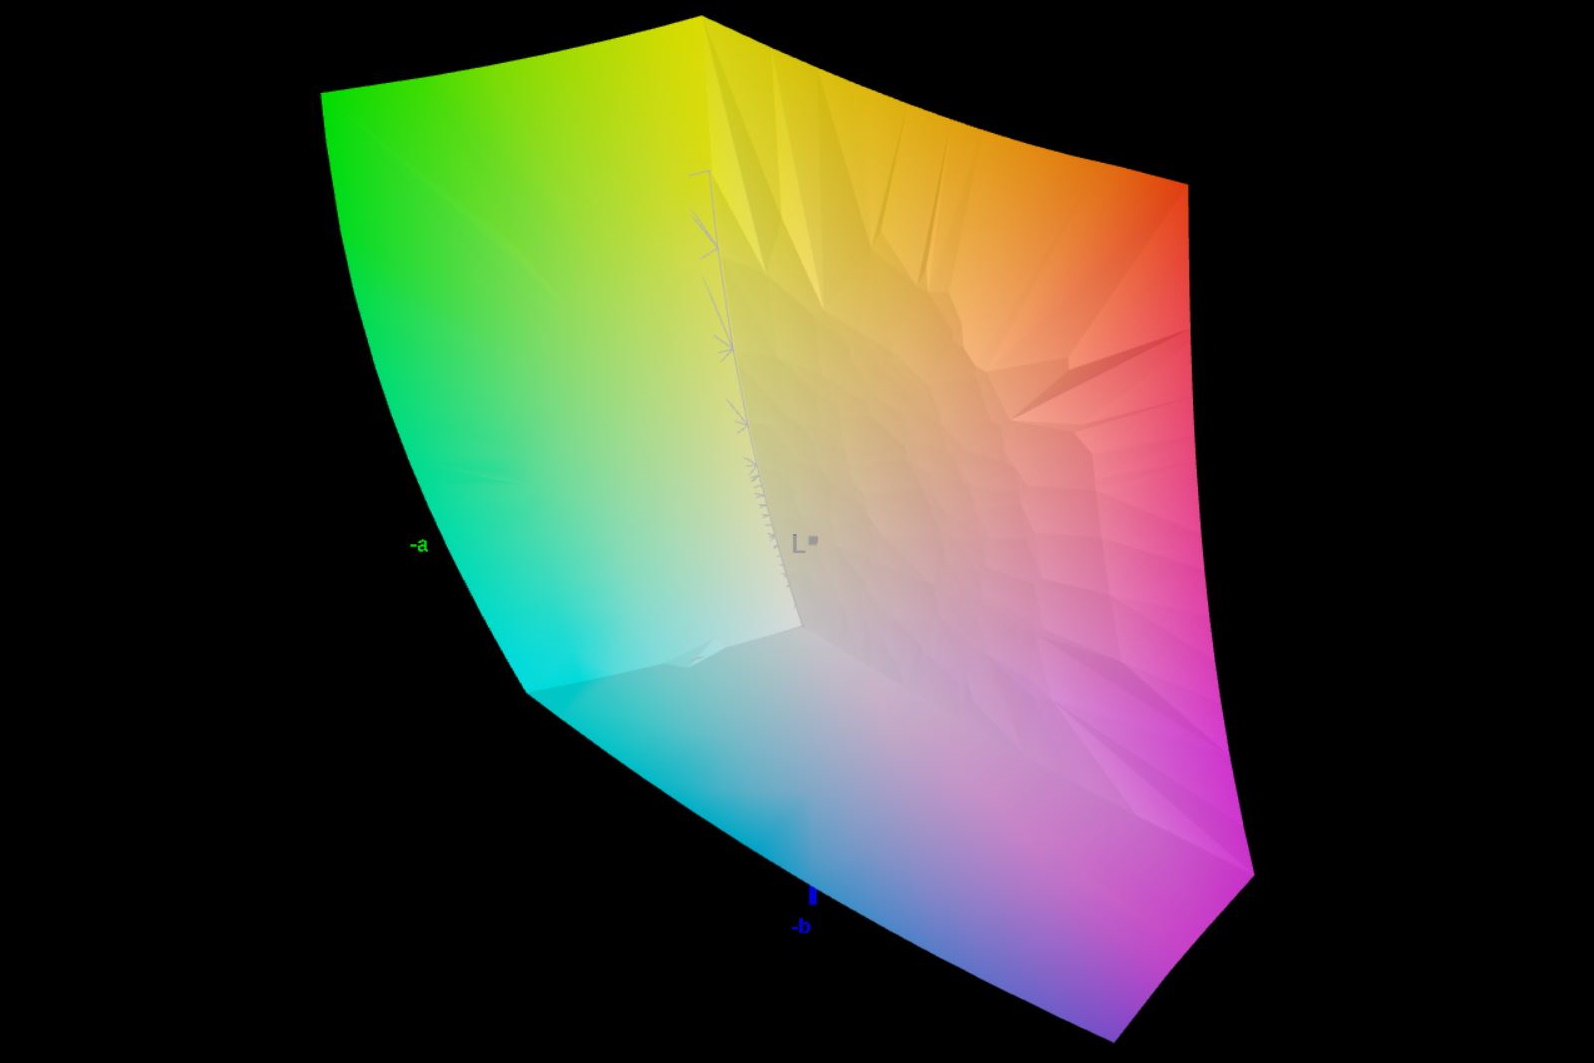
A tela do nosso dispositivo de teste tem uma boa reprodução de cores, com um desvio médio de cor de ΔΕ 2,24 na fábrica. Os valores melhoram ainda mais com a calibração.
Descobrimos que a reprodução de cores também pode ser melhorada quando a iluminação é definida para 150 nits.

Exibir tempos de resposta
| ↔ Tempo de resposta preto para branco | ||
|---|---|---|
| 11.6 ms ... ascensão ↗ e queda ↘ combinadas | ↗ 5.8 ms ascensão | 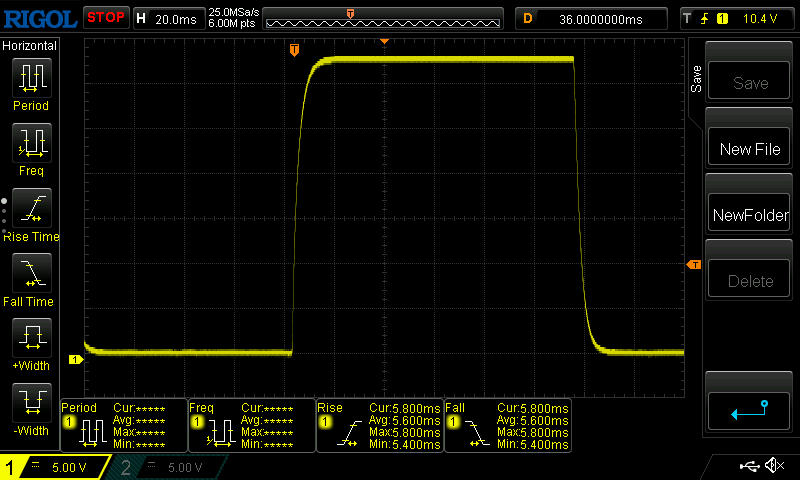 |
| ↘ 5.8 ms queda | ||
| A tela mostra boas taxas de resposta em nossos testes, mas pode ser muito lenta para jogadores competitivos. Em comparação, todos os dispositivos testados variam de 0.1 (mínimo) a 240 (máximo) ms. » 31 % de todos os dispositivos são melhores. Isso significa que o tempo de resposta medido é melhor que a média de todos os dispositivos testados (19.8 ms). | ||
| ↔ Tempo de resposta 50% cinza a 80% cinza | ||
| 15.6 ms ... ascensão ↗ e queda ↘ combinadas | ↗ 7.4 ms ascensão | 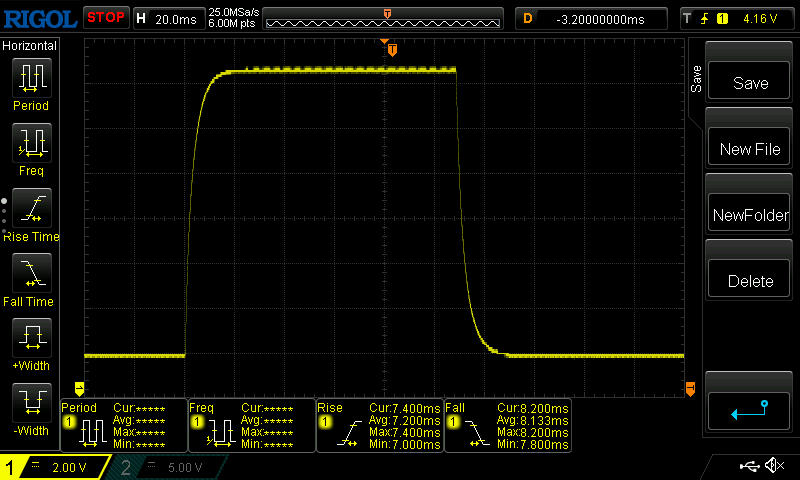 |
| ↘ 8.2 ms queda | ||
| A tela mostra boas taxas de resposta em nossos testes, mas pode ser muito lenta para jogadores competitivos. Em comparação, todos os dispositivos testados variam de 0.165 (mínimo) a 636 (máximo) ms. » 30 % de todos os dispositivos são melhores. Isso significa que o tempo de resposta medido é melhor que a média de todos os dispositivos testados (31 ms). | ||
Cintilação da tela / PWM (modulação por largura de pulso)
| Tela tremeluzindo / PWM não detectado |  | ||
[pwm_comparison] Em comparação: 52 % de todos os dispositivos testados não usam PWM para escurecer a tela. Se PWM foi detectado, uma média de 7753 (mínimo: 5 - máximo: 343500) Hz foi medida. | |||
Com sua superfície fosca, a tela razoavelmente brilhante também pode ser usada em ambientes externos, desde que a localização e o ângulo em relação ao sol sejam cuidados. Felizmente, geralmente é possível encontrar uma posição favorável, pois os ângulos de visão da tela são bastante estáveis.
Desempenho: Core i9 com desempenho extremo
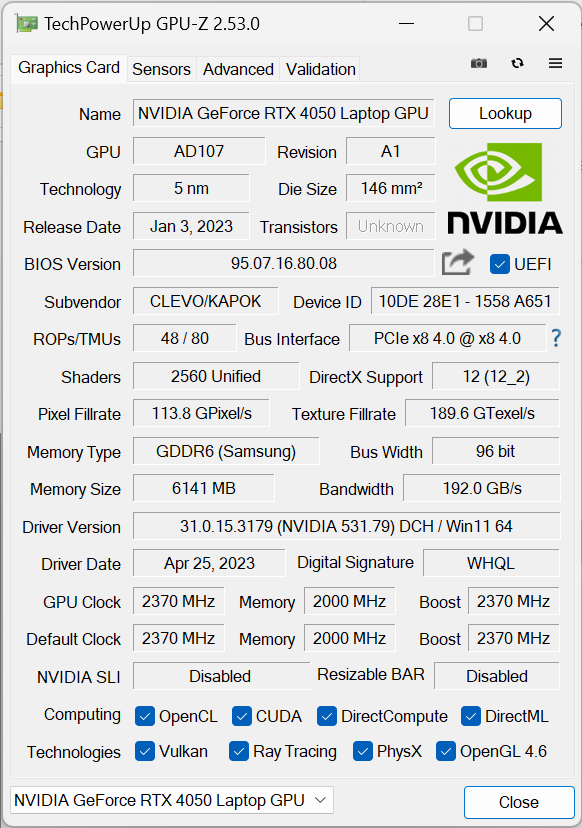
A Schenker oferece uma ampla gama de opções de configuração para o XMG Focus 15. O processador em todas elas é o Intel Core i9-13900HX. Ele é suportado por um chip Nvidia com GeForce RTX 4050, RTX 4060 ou RTX 4070disponíveis no processo de configuração na Bestware, juntamente com várias opções de memória.
Nosso dispositivo de teste está equipado com a GPU para laptop Nvidia GeForce RTX 4050 e 32 GB de memória de trabalho. Com o chip gráfico mais baixo da geração Ada Lovelace, o laptop é capaz de executar muitos jogos atuais sem problemas, embora você provavelmente tenha que limitar as configurações de qualidade se quiser utilizar a resolução QHD completa da tela.
Condições de teste
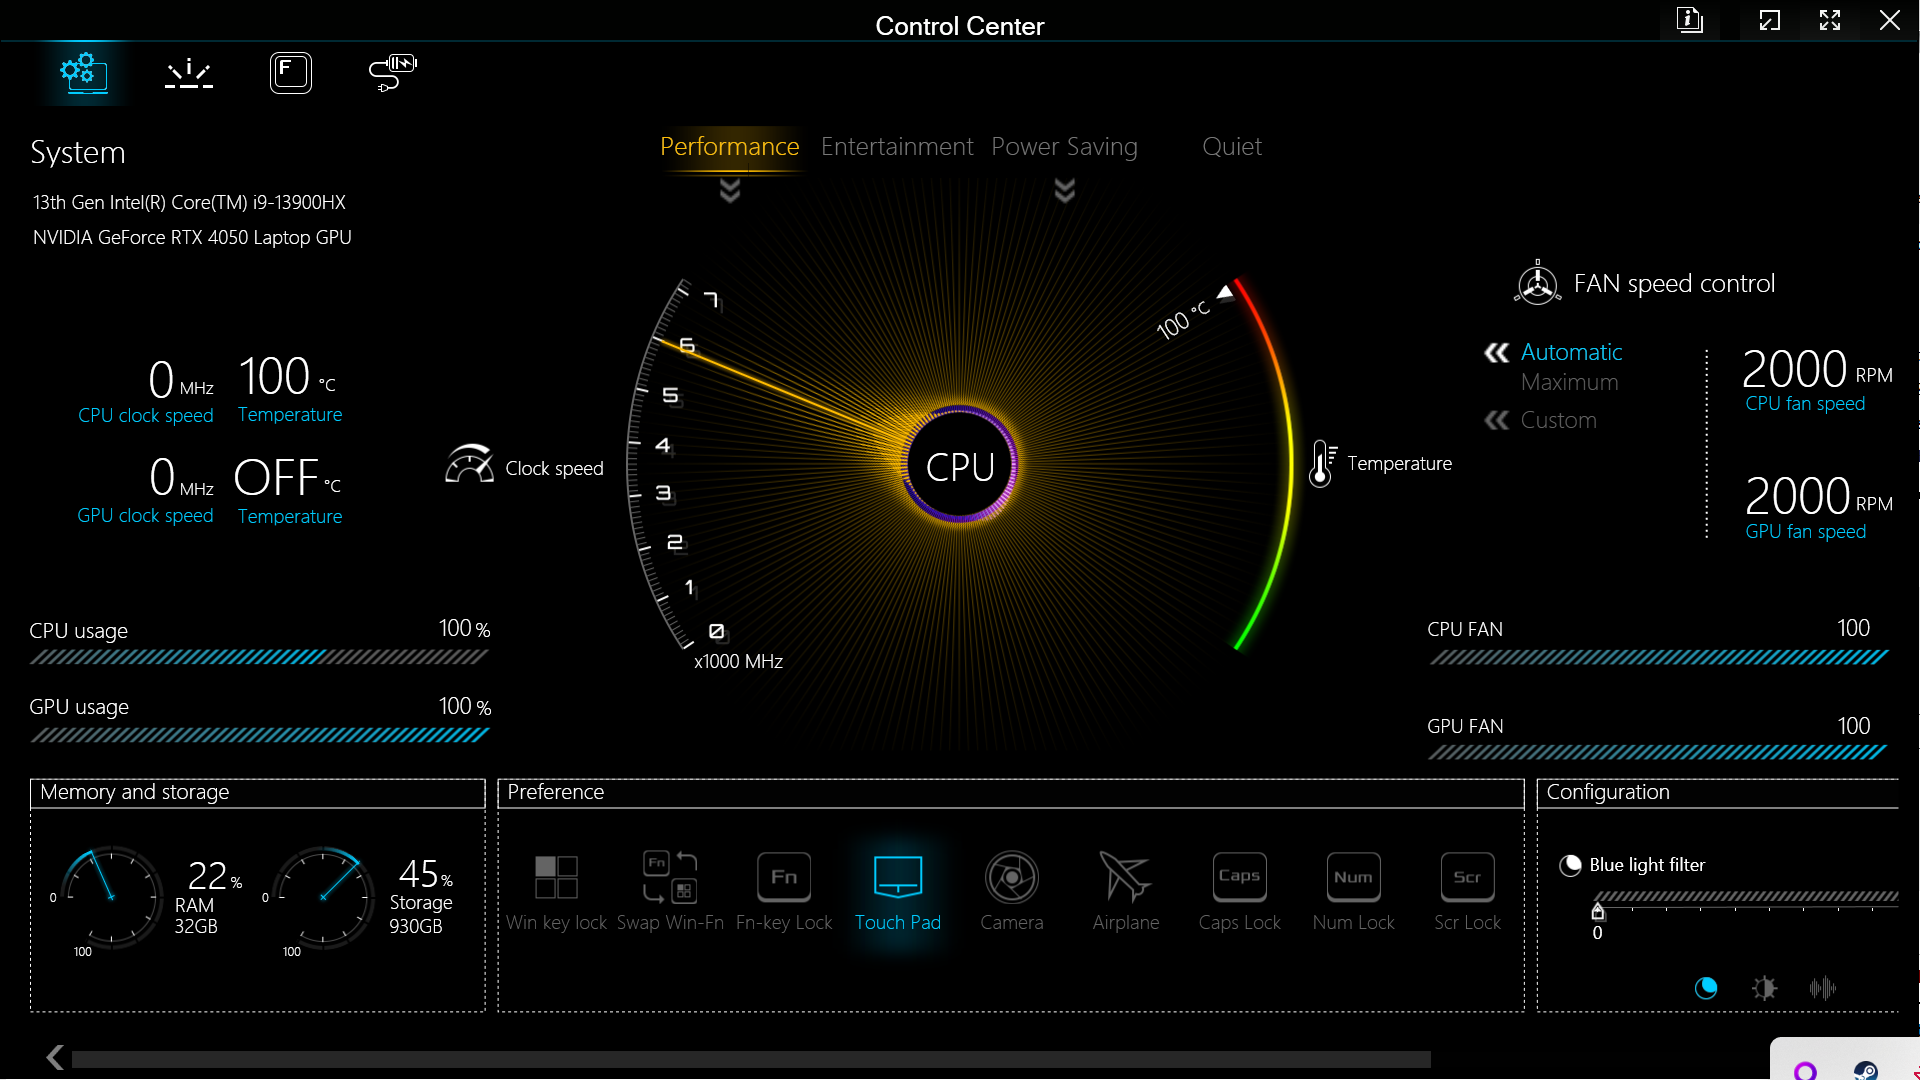
Quatro planos de desempenho diferentes podem ser acessados por meio do Centro de Controle da Schenker. Embora o modo de economia de energia e o modo de suspensão limitem visivelmente o desempenho do dispositivo de teste, os benchmarks dos modos Desempenho e Entretenimento costumam ser bastante próximos um do outro quando se exige muito desempenho do laptop por períodos mais longos.
Dito isso, a fase de aceleração do processador dura consideravelmente mais no modo Desempenho. Com quase 1,5 minuto de aumento, o processador passa facilmente por benchmarks como Cinebench R23 ou testes do Blender. Os limites de energia em modos individuais são os seguintes:
| Modo: | Modo de energia | Modo de entretenimento | Modo de economia de energia |
|---|---|---|---|
| CPU PL1 | 135 W | 55 W | 15 W |
| CPU PL2 | 162 W | 130 W | 30 W |
| Temperatura alvo CPU | 93 °C | 87 °C | 85 °C |
| GPU TGP + Dynamic Boost | 115 W + 25 W | 115 W + 0 W | 115 W + 0 W |
| Temperatura alvo GPU | 87 °C | 87 °C | 87 °C |
Em nossos testes, o laptop pode atingir as altas taxas de meta do modo Desempenho. Elas correspondem exatamente aos valores que a Schenker também alcançou com o XMG Pro 15. Portanto, o desempenho dos dois processadores no Focus e no Pro é praticamente idêntico.
Para fazer uma comparação melhor entre os dois dispositivos, decidimos executar todos os benchmarks no modo Performance também no XMG Focus 15.
Processador
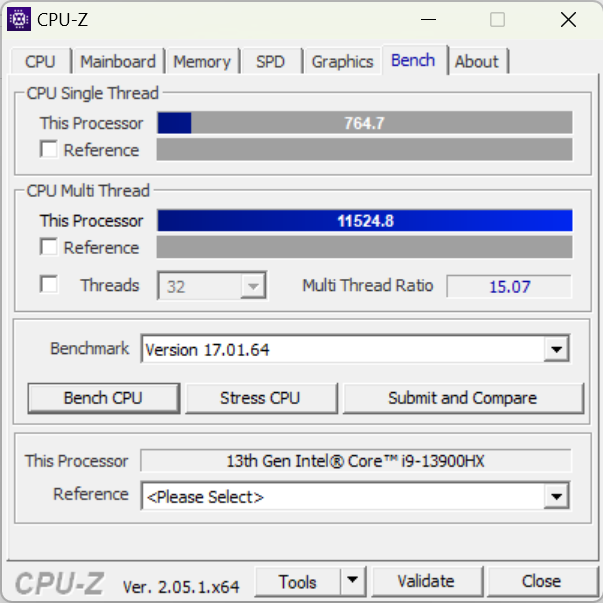
Com o Intel Core i9-13900HXum dos processadores de laptop mais avançados da geração Raptor Lake-HX está instalado no XMG Focus 15. Aqui o processador é até um pouco mais rápido do que o do Pro 15.
A diferença é mais perceptível na área de funcionamento suave dos processadores modernos. Com 8 núcleos P e 16 núcleos E, o processador tem 32 threads que proporcionam multitarefa extrema. O Focus 15 e o Pro 15 estão no topo dos dispositivos de comparação.
Cinebench R15 Multi Loop Test
Cinebench R23: Multi Core | Single Core
Cinebench R20: CPU (Multi Core) | CPU (Single Core)
Cinebench R15: CPU Multi 64Bit | CPU Single 64Bit
Blender: v2.79 BMW27 CPU
7-Zip 18.03: 7z b 4 | 7z b 4 -mmt1
Geekbench 5.5: Multi-Core | Single-Core
HWBOT x265 Benchmark v2.2: 4k Preset
LibreOffice : 20 Documents To PDF
R Benchmark 2.5: Overall mean
| CPU Performance rating | |
| Média Intel Core i9-13900HX | |
| Média da turma Gaming | |
| Schenker XMG Focus 15 (E23) | |
| Schenker XMG Pro 15 (E23) | |
| Gigabyte Aero 14 OLED BMF | |
| Acer Swift X SFX14-71G | |
| Samsung Galaxy Book3 Ultra 16 | |
| MSI Katana 15 B12VEK | |
| Asus TUF A15 FA507 | |
| Cinebench R23 / Multi Core | |
| Média Intel Core i9-13900HX (24270 - 32623, n=23) | |
| Média da turma Gaming (10488 - 40970, n=107, últimos 2 anos) | |
| Schenker XMG Pro 15 (E23) | |
| Schenker XMG Focus 15 (E23) | |
| Acer Swift X SFX14-71G | |
| MSI Katana 15 B12VEK | |
| Samsung Galaxy Book3 Ultra 16 | |
| Gigabyte Aero 14 OLED BMF | |
| Asus TUF A15 FA507 | |
| Cinebench R23 / Single Core | |
| Média Intel Core i9-13900HX (1867 - 2105, n=20) | |
| Média da turma Gaming (1166 - 2356, n=107, últimos 2 anos) | |
| Schenker XMG Focus 15 (E23) | |
| Acer Swift X SFX14-71G | |
| Schenker XMG Pro 15 (E23) | |
| Gigabyte Aero 14 OLED BMF | |
| Samsung Galaxy Book3 Ultra 16 | |
| MSI Katana 15 B12VEK | |
| Asus TUF A15 FA507 | |
| Cinebench R20 / CPU (Multi Core) | |
| Média Intel Core i9-13900HX (9152 - 12541, n=21) | |
| Média da turma Gaming (4029 - 16108, n=106, últimos 2 anos) | |
| Schenker XMG Pro 15 (E23) | |
| Schenker XMG Focus 15 (E23) | |
| Acer Swift X SFX14-71G | |
| MSI Katana 15 B12VEK | |
| Samsung Galaxy Book3 Ultra 16 | |
| Gigabyte Aero 14 OLED BMF | |
| Asus TUF A15 FA507 | |
| Cinebench R20 / CPU (Single Core) | |
| Média Intel Core i9-13900HX (722 - 810, n=21) | |
| Média da turma Gaming (442 - 895, n=106, últimos 2 anos) | |
| Schenker XMG Focus 15 (E23) | |
| Acer Swift X SFX14-71G | |
| Schenker XMG Pro 15 (E23) | |
| Gigabyte Aero 14 OLED BMF | |
| Samsung Galaxy Book3 Ultra 16 | |
| MSI Katana 15 B12VEK | |
| Asus TUF A15 FA507 | |
| Cinebench R15 / CPU Multi 64Bit | |
| Média Intel Core i9-13900HX (3913 - 4970, n=22) | |
| Schenker XMG Focus 15 (E23) | |
| Média da turma Gaming (1578 - 6271, n=105, últimos 2 anos) | |
| Schenker XMG Pro 15 (E23) | |
| Samsung Galaxy Book3 Ultra 16 | |
| Gigabyte Aero 14 OLED BMF | |
| Acer Swift X SFX14-71G | |
| Asus TUF A15 FA507 | |
| MSI Katana 15 B12VEK | |
| Cinebench R15 / CPU Single 64Bit | |
| Média da turma Gaming (188.8 - 343, n=106, últimos 2 anos) | |
| Média Intel Core i9-13900HX (247 - 304, n=22) | |
| Acer Swift X SFX14-71G | |
| Schenker XMG Focus 15 (E23) | |
| Gigabyte Aero 14 OLED BMF | |
| Asus TUF A15 FA507 | |
| MSI Katana 15 B12VEK | |
| Schenker XMG Pro 15 (E23) | |
| Samsung Galaxy Book3 Ultra 16 | |
| Blender / v2.79 BMW27 CPU | |
| Acer Swift X SFX14-71G | |
| MSI Katana 15 B12VEK | |
| Gigabyte Aero 14 OLED BMF | |
| Asus TUF A15 FA507 | |
| Samsung Galaxy Book3 Ultra 16 | |
| Média da turma Gaming (80 - 330, n=104, últimos 2 anos) | |
| Schenker XMG Pro 15 (E23) | |
| Schenker XMG Focus 15 (E23) | |
| Média Intel Core i9-13900HX (101 - 153, n=22) | |
| 7-Zip 18.03 / 7z b 4 | |
| Média Intel Core i9-13900HX (90675 - 127283, n=21) | |
| Schenker XMG Focus 15 (E23) | |
| Schenker XMG Pro 15 (E23) | |
| Média da turma Gaming (33491 - 148086, n=105, últimos 2 anos) | |
| Samsung Galaxy Book3 Ultra 16 | |
| Asus TUF A15 FA507 | |
| MSI Katana 15 B12VEK | |
| Gigabyte Aero 14 OLED BMF | |
| Acer Swift X SFX14-71G | |
| 7-Zip 18.03 / 7z b 4 -mmt1 | |
| Média Intel Core i9-13900HX (6340 - 7177, n=21) | |
| Média da turma Gaming (4199 - 7436, n=105, últimos 2 anos) | |
| Schenker XMG Focus 15 (E23) | |
| Schenker XMG Pro 15 (E23) | |
| Acer Swift X SFX14-71G | |
| Gigabyte Aero 14 OLED BMF | |
| Asus TUF A15 FA507 | |
| MSI Katana 15 B12VEK | |
| Samsung Galaxy Book3 Ultra 16 | |
| Geekbench 5.5 / Multi-Core | |
| Média Intel Core i9-13900HX (17614 - 21075, n=22) | |
| Schenker XMG Focus 15 (E23) | |
| Schenker XMG Pro 15 (E23) | |
| Média da turma Gaming (6460 - 27010, n=105, últimos 2 anos) | |
| Acer Swift X SFX14-71G | |
| Samsung Galaxy Book3 Ultra 16 | |
| MSI Katana 15 B12VEK | |
| Gigabyte Aero 14 OLED BMF | |
| Asus TUF A15 FA507 | |
| Geekbench 5.5 / Single-Core | |
| Média da turma Gaming (986 - 2474, n=105, últimos 2 anos) | |
| Média Intel Core i9-13900HX (1345 - 2093, n=22) | |
| Gigabyte Aero 14 OLED BMF | |
| Acer Swift X SFX14-71G | |
| Schenker XMG Pro 15 (E23) | |
| Samsung Galaxy Book3 Ultra 16 | |
| MSI Katana 15 B12VEK | |
| Asus TUF A15 FA507 | |
| Schenker XMG Focus 15 (E23) | |
| HWBOT x265 Benchmark v2.2 / 4k Preset | |
| Média Intel Core i9-13900HX (23.5 - 34.4, n=22) | |
| Média da turma Gaming (11.5 - 44.3, n=105, últimos 2 anos) | |
| Schenker XMG Focus 15 (E23) | |
| Schenker XMG Pro 15 (E23) | |
| MSI Katana 15 B12VEK | |
| Asus TUF A15 FA507 | |
| Samsung Galaxy Book3 Ultra 16 | |
| Gigabyte Aero 14 OLED BMF | |
| Acer Swift X SFX14-71G | |
| LibreOffice / 20 Documents To PDF | |
| Schenker XMG Pro 15 (E23) | |
| Asus TUF A15 FA507 | |
| Samsung Galaxy Book3 Ultra 16 | |
| Média da turma Gaming (33.2 - 88.8, n=105, últimos 2 anos) | |
| MSI Katana 15 B12VEK | |
| Média Intel Core i9-13900HX (32.8 - 51.1, n=21) | |
| Gigabyte Aero 14 OLED BMF | |
| Acer Swift X SFX14-71G | |
| Schenker XMG Focus 15 (E23) | |
| R Benchmark 2.5 / Overall mean | |
| Asus TUF A15 FA507 | |
| MSI Katana 15 B12VEK | |
| Samsung Galaxy Book3 Ultra 16 | |
| Schenker XMG Pro 15 (E23) | |
| Gigabyte Aero 14 OLED BMF | |
| Acer Swift X SFX14-71G | |
| Schenker XMG Focus 15 (E23) | |
| Média da turma Gaming (0.3439 - 0.759, n=106, últimos 2 anos) | |
| Média Intel Core i9-13900HX (0.375 - 0.4564, n=22) | |
* ... menor é melhor
AIDA64: FP32 Ray-Trace | FPU Julia | CPU SHA3 | CPU Queen | FPU SinJulia | FPU Mandel | CPU AES | CPU ZLib | FP64 Ray-Trace | CPU PhotoWorxx
| Performance rating | |
| Média da turma Gaming | |
| Média Intel Core i9-13900HX | |
| Schenker XMG Focus 15 (E23) | |
| Schenker XMG Pro 15 (E23) | |
| Asus TUF A15 FA507 | |
| Gigabyte Aero 14 OLED BMF | |
| Samsung Galaxy Book3 Ultra 16 | |
| MSI Katana 15 B12VEK | |
| Acer Swift X SFX14-71G | |
| AIDA64 / FP32 Ray-Trace | |
| Média da turma Gaming (10227 - 85542, n=104, últimos 2 anos) | |
| Média Intel Core i9-13900HX (17589 - 27615, n=22) | |
| Schenker XMG Focus 15 (E23) | |
| Schenker XMG Pro 15 (E23) | |
| Asus TUF A15 FA507 | |
| MSI Katana 15 B12VEK | |
| Samsung Galaxy Book3 Ultra 16 | |
| Gigabyte Aero 14 OLED BMF | |
| Acer Swift X SFX14-71G | |
| AIDA64 / FPU Julia | |
| Média da turma Gaming (51376 - 238426, n=104, últimos 2 anos) | |
| Média Intel Core i9-13900HX (88686 - 137015, n=22) | |
| Schenker XMG Focus 15 (E23) | |
| Asus TUF A15 FA507 | |
| Schenker XMG Pro 15 (E23) | |
| MSI Katana 15 B12VEK | |
| Samsung Galaxy Book3 Ultra 16 | |
| Gigabyte Aero 14 OLED BMF | |
| Acer Swift X SFX14-71G | |
| AIDA64 / CPU SHA3 | |
| Média da turma Gaming (2180 - 9817, n=104, últimos 2 anos) | |
| Média Intel Core i9-13900HX (4362 - 7029, n=22) | |
| Schenker XMG Focus 15 (E23) | |
| Schenker XMG Pro 15 (E23) | |
| Asus TUF A15 FA507 | |
| Samsung Galaxy Book3 Ultra 16 | |
| MSI Katana 15 B12VEK | |
| Gigabyte Aero 14 OLED BMF | |
| Acer Swift X SFX14-71G | |
| AIDA64 / CPU Queen | |
| Schenker XMG Focus 15 (E23) | |
| Média Intel Core i9-13900HX (125644 - 141385, n=22) | |
| Schenker XMG Pro 15 (E23) | |
| Média da turma Gaming (49785 - 173351, n=91, últimos 2 anos) | |
| Gigabyte Aero 14 OLED BMF | |
| Acer Swift X SFX14-71G | |
| Asus TUF A15 FA507 | |
| Samsung Galaxy Book3 Ultra 16 | |
| MSI Katana 15 B12VEK | |
| AIDA64 / FPU SinJulia | |
| Média Intel Core i9-13900HX (12334 - 17179, n=22) | |
| Média da turma Gaming (4424 - 33636, n=104, últimos 2 anos) | |
| Schenker XMG Focus 15 (E23) | |
| Asus TUF A15 FA507 | |
| Schenker XMG Pro 15 (E23) | |
| Samsung Galaxy Book3 Ultra 16 | |
| Gigabyte Aero 14 OLED BMF | |
| MSI Katana 15 B12VEK | |
| Acer Swift X SFX14-71G | |
| AIDA64 / FPU Mandel | |
| Média da turma Gaming (25115 - 128721, n=104, últimos 2 anos) | |
| Média Intel Core i9-13900HX (43850 - 69202, n=22) | |
| Asus TUF A15 FA507 | |
| Schenker XMG Focus 15 (E23) | |
| Schenker XMG Pro 15 (E23) | |
| MSI Katana 15 B12VEK | |
| Samsung Galaxy Book3 Ultra 16 | |
| Gigabyte Aero 14 OLED BMF | |
| Acer Swift X SFX14-71G | |
| AIDA64 / CPU AES | |
| Média Intel Core i9-13900HX (89413 - 237881, n=22) | |
| Gigabyte Aero 14 OLED BMF | |
| Média da turma Gaming (39258 - 247074, n=104, últimos 2 anos) | |
| Schenker XMG Focus 15 (E23) | |
| Schenker XMG Pro 15 (E23) | |
| Acer Swift X SFX14-71G | |
| Samsung Galaxy Book3 Ultra 16 | |
| MSI Katana 15 B12VEK | |
| Asus TUF A15 FA507 | |
| AIDA64 / CPU ZLib | |
| Média Intel Core i9-13900HX (1284 - 1958, n=22) | |
| Schenker XMG Focus 15 (E23) | |
| Média da turma Gaming (574 - 2531, n=104, últimos 2 anos) | |
| Schenker XMG Pro 15 (E23) | |
| Samsung Galaxy Book3 Ultra 16 | |
| MSI Katana 15 B12VEK | |
| Gigabyte Aero 14 OLED BMF | |
| Acer Swift X SFX14-71G | |
| Asus TUF A15 FA507 | |
| AIDA64 / FP64 Ray-Trace | |
| Média da turma Gaming (5509 - 45446, n=104, últimos 2 anos) | |
| Média Intel Core i9-13900HX (9481 - 15279, n=22) | |
| Schenker XMG Focus 15 (E23) | |
| Schenker XMG Pro 15 (E23) | |
| Asus TUF A15 FA507 | |
| MSI Katana 15 B12VEK | |
| Samsung Galaxy Book3 Ultra 16 | |
| Gigabyte Aero 14 OLED BMF | |
| Acer Swift X SFX14-71G | |
| AIDA64 / CPU PhotoWorxx | |
| Gigabyte Aero 14 OLED BMF | |
| Schenker XMG Focus 15 (E23) | |
| Schenker XMG Pro 15 (E23) | |
| Média Intel Core i9-13900HX (42994 - 51994, n=22) | |
| Samsung Galaxy Book3 Ultra 16 | |
| Média da turma Gaming (12271 - 89891, n=104, últimos 2 anos) | |
| Acer Swift X SFX14-71G | |
| MSI Katana 15 B12VEK | |
| Asus TUF A15 FA507 | |
Desempenho do sistema
Com a GPU de nível básico da Nvidia, a GeForce RTX 4050o Focus não consegue marcar tantos pontos no benchmark PCMark 10 quanto o Pro 15. Ainda assim, o Focus 15 consegue se manter no mesmo nível dos outros dispositivos de comparação.
O processador ligeiramente mais rápido do Focus 15 é novamente perceptível no benchmark CrossMark. A amostra de análise obteve uma pontuação ligeiramente superior à do Pro 15. O CrossMark considera o desempenho da placa de vídeo muito menos do que o PCMark.
CrossMark: Overall | Productivity | Creativity | Responsiveness
| PCMark 10 / Score | |
| Média da turma Gaming (5828 - 11574, n=93, últimos 2 anos) | |
| Schenker XMG Pro 15 (E23) | |
| Gigabyte Aero 14 OLED BMF | |
| Acer Swift X SFX14-71G | |
| Asus TUF A15 FA507 | |
| Schenker XMG Focus 15 (E23) | |
| Média Intel Core i9-13900HX, NVIDIA GeForce RTX 4050 Laptop GPU (n=1) | |
| MSI Katana 15 B12VEK | |
| Samsung Galaxy Book3 Ultra 16 | |
| PCMark 10 / Essentials | |
| Gigabyte Aero 14 OLED BMF | |
| Schenker XMG Pro 15 (E23) | |
| Acer Swift X SFX14-71G | |
| Média da turma Gaming (8810 - 11935, n=97, últimos 2 anos) | |
| Asus TUF A15 FA507 | |
| Samsung Galaxy Book3 Ultra 16 | |
| MSI Katana 15 B12VEK | |
| Schenker XMG Focus 15 (E23) | |
| Média Intel Core i9-13900HX, NVIDIA GeForce RTX 4050 Laptop GPU (n=1) | |
| PCMark 10 / Productivity | |
| Média da turma Gaming (6845 - 21327, n=95, últimos 2 anos) | |
| Schenker XMG Pro 15 (E23) | |
| MSI Katana 15 B12VEK | |
| Schenker XMG Focus 15 (E23) | |
| Média Intel Core i9-13900HX, NVIDIA GeForce RTX 4050 Laptop GPU (n=1) | |
| Acer Swift X SFX14-71G | |
| Gigabyte Aero 14 OLED BMF | |
| Asus TUF A15 FA507 | |
| Samsung Galaxy Book3 Ultra 16 | |
| PCMark 10 / Digital Content Creation | |
| Média da turma Gaming (7602 - 19657, n=95, últimos 2 anos) | |
| Asus TUF A15 FA507 | |
| Acer Swift X SFX14-71G | |
| Gigabyte Aero 14 OLED BMF | |
| Schenker XMG Pro 15 (E23) | |
| Schenker XMG Focus 15 (E23) | |
| Média Intel Core i9-13900HX, NVIDIA GeForce RTX 4050 Laptop GPU (n=1) | |
| Samsung Galaxy Book3 Ultra 16 | |
| MSI Katana 15 B12VEK | |
| CrossMark / Overall | |
| Schenker XMG Focus 15 (E23) | |
| Média Intel Core i9-13900HX, NVIDIA GeForce RTX 4050 Laptop GPU (n=1) | |
| Média da turma Gaming (1366 - 2409, n=93, últimos 2 anos) | |
| Schenker XMG Pro 15 (E23) | |
| Acer Swift X SFX14-71G | |
| Gigabyte Aero 14 OLED BMF | |
| MSI Katana 15 B12VEK | |
| Samsung Galaxy Book3 Ultra 16 | |
| Asus TUF A15 FA507 | |
| CrossMark / Productivity | |
| Schenker XMG Focus 15 (E23) | |
| Média Intel Core i9-13900HX, NVIDIA GeForce RTX 4050 Laptop GPU (n=1) | |
| Acer Swift X SFX14-71G | |
| Média da turma Gaming (1386 - 2254, n=93, últimos 2 anos) | |
| Schenker XMG Pro 15 (E23) | |
| Gigabyte Aero 14 OLED BMF | |
| MSI Katana 15 B12VEK | |
| Asus TUF A15 FA507 | |
| Samsung Galaxy Book3 Ultra 16 | |
| CrossMark / Creativity | |
| Schenker XMG Focus 15 (E23) | |
| Média Intel Core i9-13900HX, NVIDIA GeForce RTX 4050 Laptop GPU (n=1) | |
| Média da turma Gaming (1343 - 2729, n=93, últimos 2 anos) | |
| Schenker XMG Pro 15 (E23) | |
| Acer Swift X SFX14-71G | |
| Gigabyte Aero 14 OLED BMF | |
| MSI Katana 15 B12VEK | |
| Asus TUF A15 FA507 | |
| Samsung Galaxy Book3 Ultra 16 | |
| CrossMark / Responsiveness | |
| Acer Swift X SFX14-71G | |
| Schenker XMG Focus 15 (E23) | |
| Média Intel Core i9-13900HX, NVIDIA GeForce RTX 4050 Laptop GPU (n=1) | |
| Schenker XMG Pro 15 (E23) | |
| Gigabyte Aero 14 OLED BMF | |
| Média da turma Gaming (1226 - 2334, n=93, últimos 2 anos) | |
| MSI Katana 15 B12VEK | |
| Samsung Galaxy Book3 Ultra 16 | |
| Asus TUF A15 FA507 | |
| PCMark 10 Score | 6926 pontos | |
Ajuda | ||
| AIDA64 / Memory Copy | |
| Gigabyte Aero 14 OLED BMF | |
| Schenker XMG Focus 15 (E23) | |
| Schenker XMG Pro 15 (E23) | |
| Média Intel Core i9-13900HX (67716 - 79193, n=22) | |
| Samsung Galaxy Book3 Ultra 16 | |
| Média da turma Gaming (21750 - 129946, n=104, últimos 2 anos) | |
| Acer Swift X SFX14-71G | |
| MSI Katana 15 B12VEK | |
| Asus TUF A15 FA507 | |
| AIDA64 / Memory Read | |
| Schenker XMG Focus 15 (E23) | |
| Schenker XMG Pro 15 (E23) | |
| Média Intel Core i9-13900HX (73998 - 88462, n=22) | |
| Gigabyte Aero 14 OLED BMF | |
| Média da turma Gaming (22956 - 118858, n=104, últimos 2 anos) | |
| Samsung Galaxy Book3 Ultra 16 | |
| MSI Katana 15 B12VEK | |
| Acer Swift X SFX14-71G | |
| Asus TUF A15 FA507 | |
| AIDA64 / Memory Write | |
| Gigabyte Aero 14 OLED BMF | |
| Samsung Galaxy Book3 Ultra 16 | |
| Schenker XMG Focus 15 (E23) | |
| Média da turma Gaming (22297 - 135096, n=104, últimos 2 anos) | |
| Schenker XMG Pro 15 (E23) | |
| Média Intel Core i9-13900HX (65472 - 77045, n=22) | |
| Acer Swift X SFX14-71G | |
| MSI Katana 15 B12VEK | |
| Asus TUF A15 FA507 | |
| AIDA64 / Memory Latency | |
| Média da turma Gaming (75.3 - 259, n=104, últimos 2 anos) | |
| Acer Swift X SFX14-71G | |
| Samsung Galaxy Book3 Ultra 16 | |
| MSI Katana 15 B12VEK | |
| Gigabyte Aero 14 OLED BMF | |
| Média Intel Core i9-13900HX (75.3 - 91.1, n=22) | |
| Schenker XMG Focus 15 (E23) | |
| Schenker XMG Pro 15 (E23) | |
| Asus TUF A15 FA507 | |
* ... menor é melhor
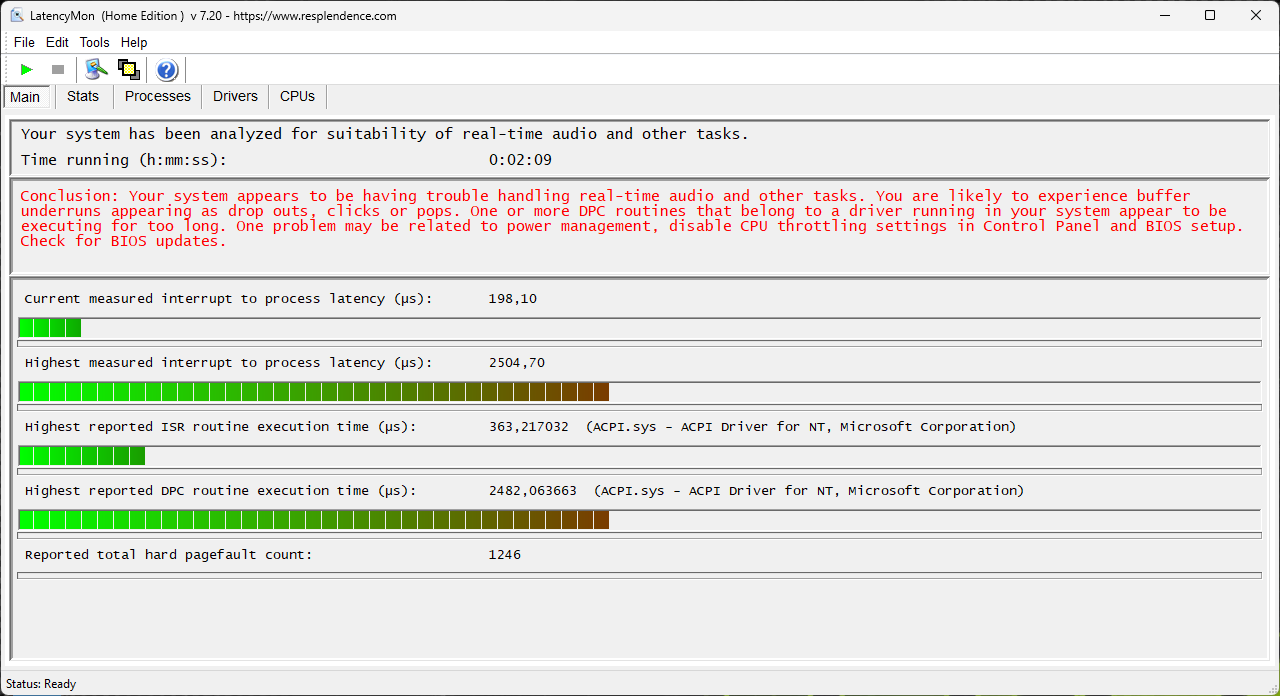
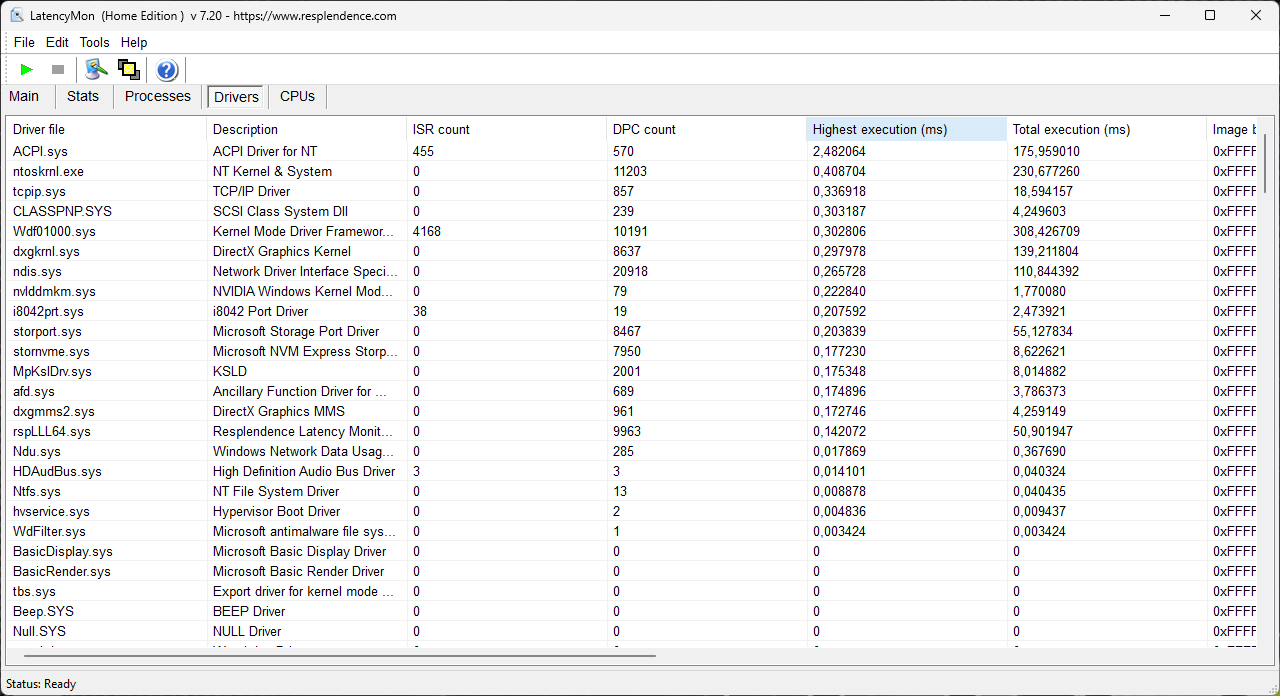
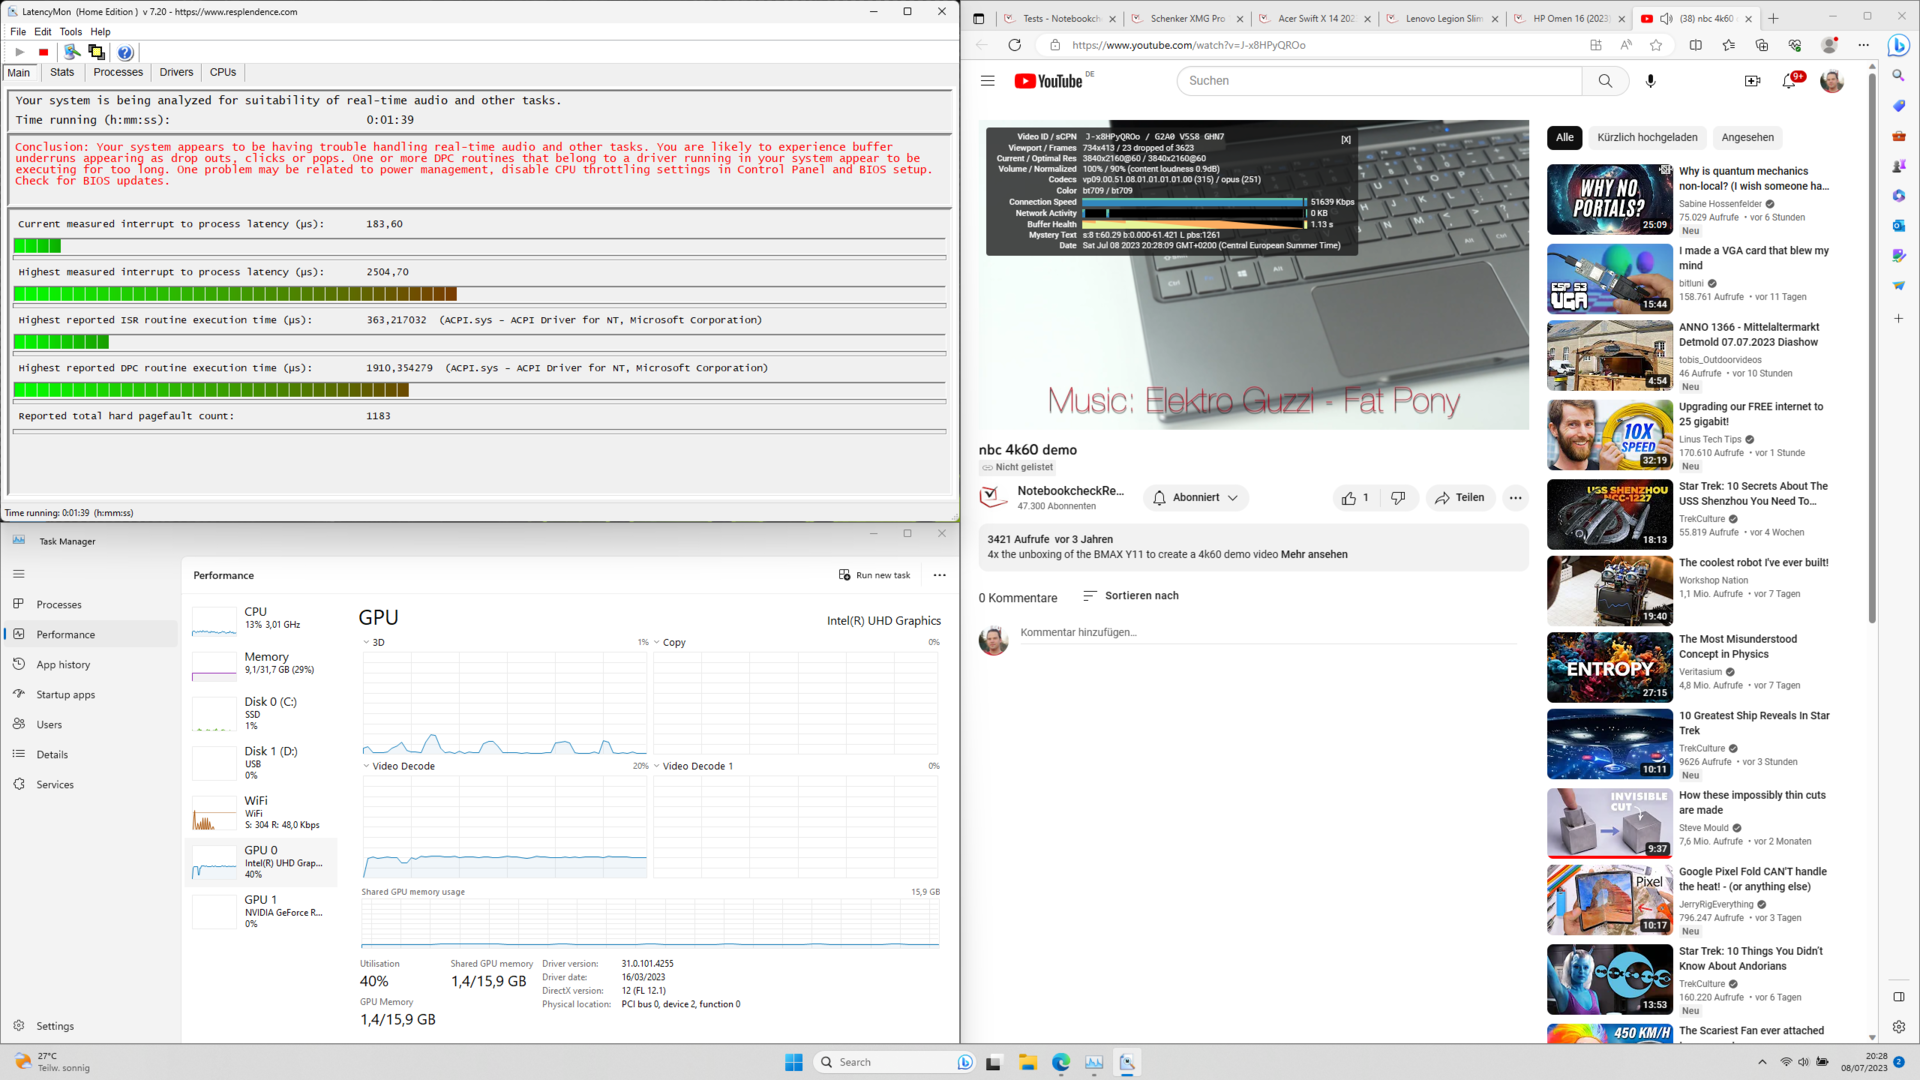
Latência DPC
Nosso teste de latência com várias guias do navegador, reprodução do YouTube e Prime95 mostra que o laptop para jogos infelizmente tem latências DPC bastante altas.
O driver ACPI, que estabelece a conexão entre o BIOS/UEFI e o Windows, é evidente aqui. Uma atualização da UEFI não melhorou esse problema.
| DPC Latencies / LatencyMon - interrupt to process latency (max), Web, Youtube, Prime95 | |
| MSI Katana 15 B12VEK | |
| Acer Swift X SFX14-71G | |
| Samsung Galaxy Book3 Ultra 16 | |
| Schenker XMG Focus 15 (E23) | |
| Gigabyte Aero 14 OLED BMF | |
| Schenker XMG Pro 15 (E23) | |
* ... menor é melhor
Armazenamento em massa
OCrucial P5 Plus no dispositivo de teste oferece boas velocidades de transferência. No entanto, ele aparentemente superaquece durante cargas mais longas.
Em nosso teste de longo prazo da velocidade de gravação, o SSD NVMe claramente perde desempenho após algum tempo.

* ... menor é melhor
Disk throttling: DiskSpd Read Loop, Queue Depth 8
Placa de vídeo
Em nossa amostra Focus 15, o desempenho do chip gráfico é cerca de 15 a 20% inferior ao daRTX 4060 no modelo Pro 15. Uma olhada no Aorus 15X ASF também mostra onde o desempenho do Focus 15 em combinação com uma RTX 4070 poderia estar. Como os três notebooks têm valores de TGP equivalentes, os desempenhos devem ser comparáveis aqui quando os notebooks são equipados com o mesmo chip gráfico.
A GPU Nvidia RTX 4050 é classificada com um TGP de até 140 W. Esse valor está no topo das configurações de TGP recomendadas pela Nvidia. No entanto, isso não dá à placa de vídeo nenhuma vantagem sobre os outros notebooks para jogos em todos os benchmarks.
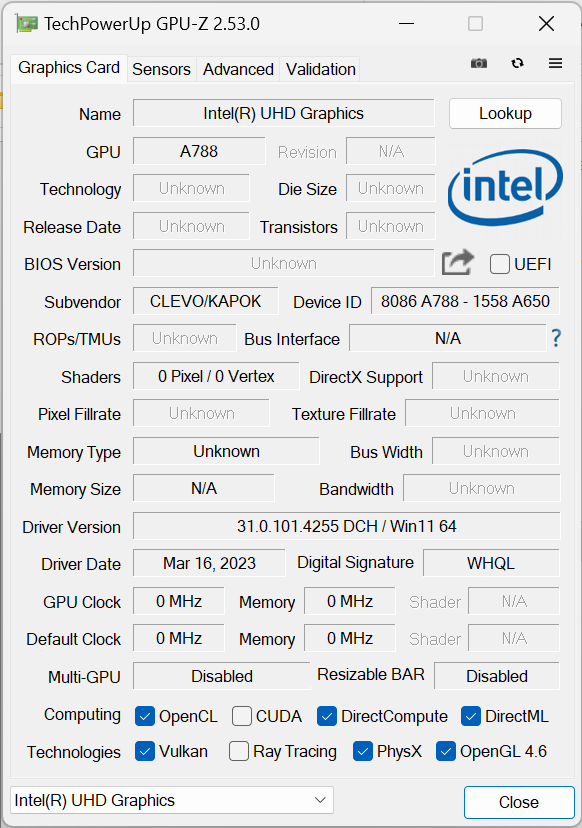
O chip gráfico pode ser selecionado diretamente no Focus 15 por meio dos interruptores Optimus e MUX - a iGPU do Core i9 também está disponível. Dito isso, o Intel UHD Graphics 770 com 32 EUs no 13900HX é uma das opções gráficas mais fracas que a Intel oferece nos processadores atuais. Portanto, ele só pode executar tarefas básicas.
| 3DMark 11 Performance | 27613 pontos | |
| 3DMark Ice Storm Standard Score | 134251 pontos | |
| 3DMark Cloud Gate Standard Score | 52615 pontos | |
| 3DMark Fire Strike Score | 20964 pontos | |
| 3DMark Time Spy Score | 9236 pontos | |
Ajuda | ||
| Geekbench 6.7 - GPU OpenCL | |
| Média da turma Gaming (67235 - 253130, n=103, últimos 2 anos) | |
| Schenker XMG Focus 15 (E23) | |
| Média NVIDIA GeForce RTX 4050 Laptop GPU (60815 - 86892, n=21) | |
* ... menor é melhor
Desempenho em jogos
Conforme indicado anteriormente, os gráficos podem ser gerenciados pelo chip Intel ou pelo chip Nvidia GeForce RTX 4050. Na verdade, queríamos usar o modo de GPU dupla com alternância automática para todos os benchmarks. Entretanto, a seleção automática não funcionou bem em todos os casos. Portanto, nossos benchmarks de jogos foram executados no modo somente dGPU.
Entre os dispositivos de comparação com a RTX 4050, o Focus 15 apresenta o melhor desempenho em jogos. Com exceção do The Witcher 3 , o RTX 4050 produz fps ligeiramente mais altos do que o normal aqui. Os resultados deDota 2 Reborn e X-Plane 11podem parecer evidentes. O Focus 15 atinge mais fps em ambos os jogos do que oPro 15 com a mais potente RTX 4060.
No entanto, os dois jogos agora são mais limitados pelo desempenho da CPU do que pelo desempenho da GPU. Isso fica especialmente claro quando você compara o desempenho do Galaxy Book3 Ultra 16 com o Acer Swift Go. Ambos os dispositivos usam oIntel Core i7-13700H com valores de TDP semelhantes e podem mostrar fps semelhantes no Dota 2 Reborn.
| The Witcher 3 - 1920x1080 Ultra Graphics & Postprocessing (HBAO+) | |
| Média da turma Gaming (104.7 - 240, n=6, últimos 2 anos) | |
| Schenker XMG Pro 15 (E23) | |
| MSI Katana 15 B12VEK | |
| Asus TUF A15 FA507 | |
| Gigabyte Aero 14 OLED BMF | |
| Gigabyte Aero 14 OLED BMF | |
| Schenker XMG Focus 15 (E23) | |
| Samsung Galaxy Book3 Ultra 16 | |
| Acer Swift X SFX14-71G | |
| Acer Swift Go SFG16-71 | |
| Final Fantasy XV Benchmark - 1920x1080 High Quality | |
| Média da turma Gaming (41 - 215, n=95, últimos 2 anos) | |
| Schenker XMG Focus 15 (E23) | |
| MSI Katana 15 B12VEK | |
| Asus TUF A15 FA507 | |
| Acer Swift X SFX14-71G | |
| Gigabyte Aero 14 OLED BMF | |
| Samsung Galaxy Book3 Ultra 16 | |
| Acer Swift Go SFG16-71 | |
| baixo | média | alto | ultra | QHD | 4K | |
|---|---|---|---|---|---|---|
| GTA V (2015) | 185.6 | 175.8 | 93.7 | |||
| The Witcher 3 (2015) | 64 | |||||
| Dota 2 Reborn (2015) | 193.2 | 181.6 | 175.8 | 160.7 | 106.6 | |
| Final Fantasy XV Benchmark (2018) | 114.1 | 85 | 58.5 | |||
| X-Plane 11.11 (2018) | 165.2 | 144.9 | 117 | 108.6 | ||
| Far Cry 5 (2018) | 141 | 131 | 123 | 86 | ||
| Strange Brigade (2018) | 417 | 218 | 175.4 | 151.2 | ||
| F1 22 (2022) | 244 | 234 | 174.7 | 55.7 | ||
| F1 23 (2023) | 259 | 235 | 164.5 | 45.3 | 36.9 |
Emissões: Apoio quente para a palma da mão direita
Emissões de ruído
O Focus 15 tem níveis de ruído da ventoinha típicos de laptops para jogos. Com até 55 dB(A) medidos a uma distância de 15 cm, o dispositivo de teste às vezes fica desagradavelmente alto no modo Desempenho.
O modo Entretenimento mostra emissões de ruído em torno da marca de 50 dB(A). Você também pode executar o notebook quase silenciosamente com o modo Dormir, mas com perda significativa de potência de computação.
Barulho
| Ocioso |
| 24 / 25.14 / 35.14 dB |
| Carga |
| 55.93 / 56.34 dB |
 | ||
30 dB silencioso 40 dB(A) audível 50 dB(A) ruidosamente alto |
||
min: | ||
| Schenker XMG Focus 15 (E23) GeForce RTX 4050 Laptop GPU, i9-13900HX, Crucial P5 Plus 1TB CT1000P5PSSD8 | Schenker XMG Pro 15 (E23) GeForce RTX 4060 Laptop GPU, i9-13900HX, Crucial P5 Plus 1TB CT1000P5PSSD8 | Asus TUF A15 FA507 GeForce RTX 4050 Laptop GPU, R7 7735HS, Micron 2400 MTFDKBA512QFM | MSI Katana 15 B12VEK GeForce RTX 4050 Laptop GPU, i7-12650H, Micron 2400 MTFDKBA1T0QFM | Acer Swift X SFX14-71G GeForce RTX 4050 Laptop GPU, i7-13700H, Samsung PM9A1 MZVL21T0HCLR | Samsung Galaxy Book3 Ultra 16 GeForce RTX 4050 Laptop GPU, i7-13700H, Samsung PM9A1 MZVL2512HCJQ | Gigabyte Aero 14 OLED BMF GeForce RTX 4050 Laptop GPU, i7-13700H, Gigabyte AG470S1TB-SI B10 | |
|---|---|---|---|---|---|---|---|
| Noise | 7% | 20% | 13% | 1% | 12% | 6% | |
| desligado / ambiente * (dB) | 24 | 24 -0% | 23.3 3% | 24 -0% | 24.8 -3% | 25 -4% | 24 -0% |
| Idle Minimum * (dB) | 24 | 24 -0% | 23.3 3% | 24 -0% | 28.2 -18% | 26 -8% | 24 -0% |
| Idle Average * (dB) | 25.14 | 24 5% | 23.3 7% | 24 5% | 31.8 -26% | 27 -7% | 24 5% |
| Idle Maximum * (dB) | 35.14 | 24 32% | 23.3 34% | 24 32% | 31.8 10% | 28 20% | 35.71 -2% |
| Load Average * (dB) | 55.93 | 53.65 4% | 29.6 47% | 37.71 33% | 38.2 32% | 40 28% | |
| Witcher 3 ultra * (dB) | 54.62 | 53.53 2% | 43 21% | 45.75 16% | 50 8% | 39 29% | 40.22 26% |
| Load Maximum * (dB) | 56.34 | 53.65 5% | 43 24% | 54.55 3% | 52.2 7% | 41 27% | 51.93 8% |
* ... menor é melhor
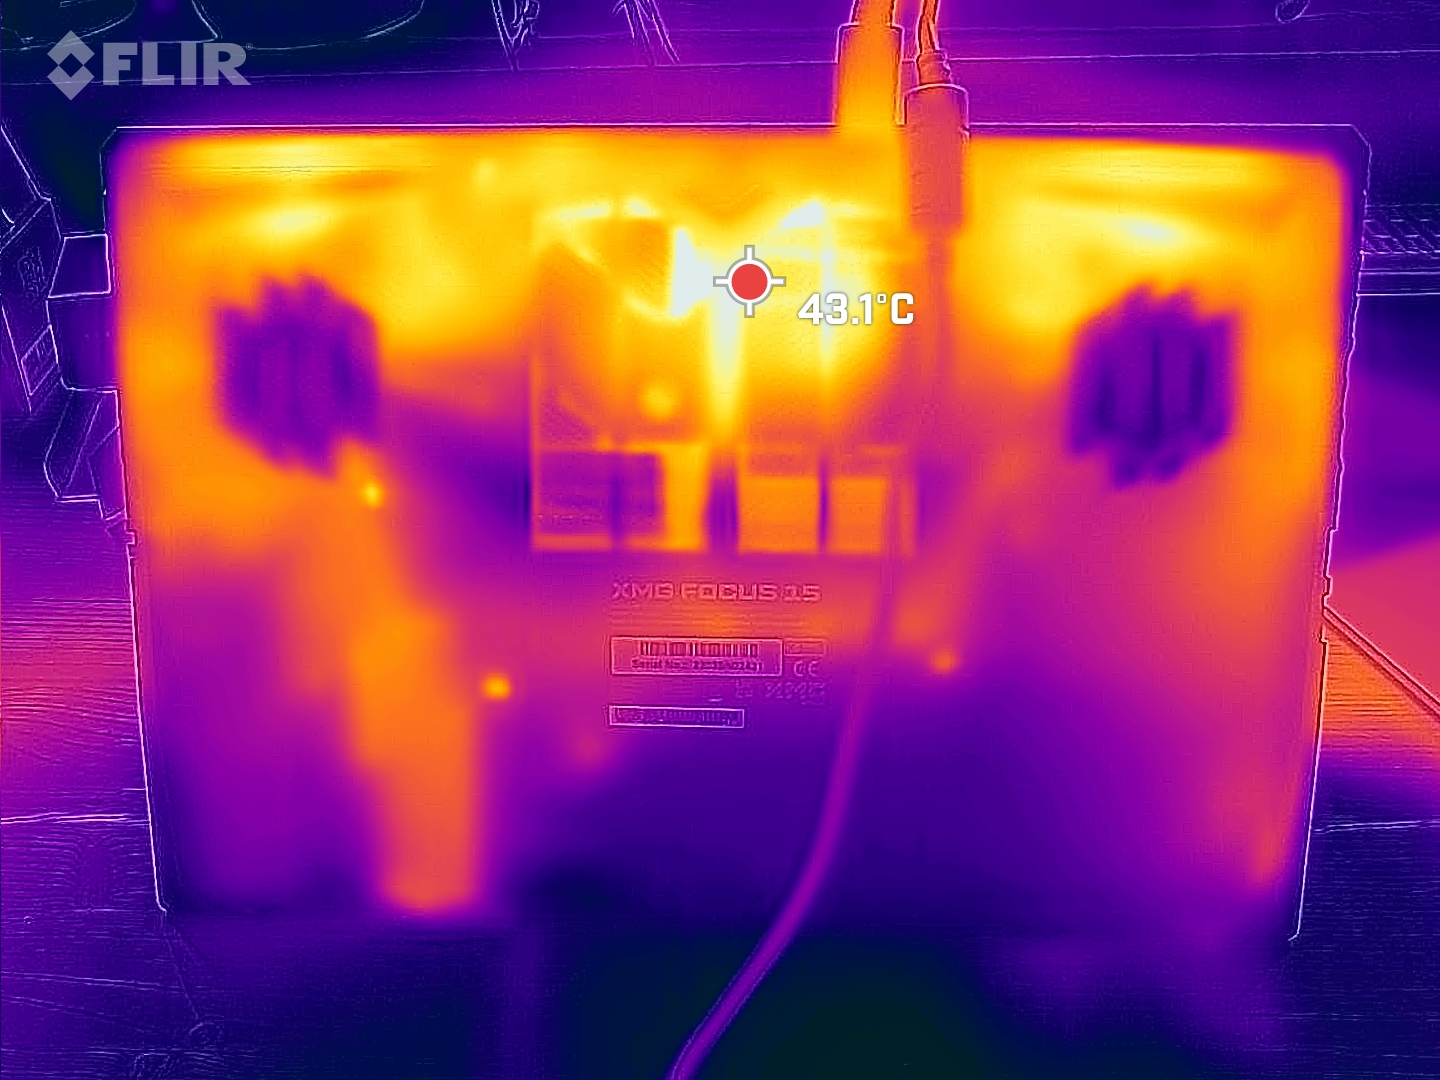
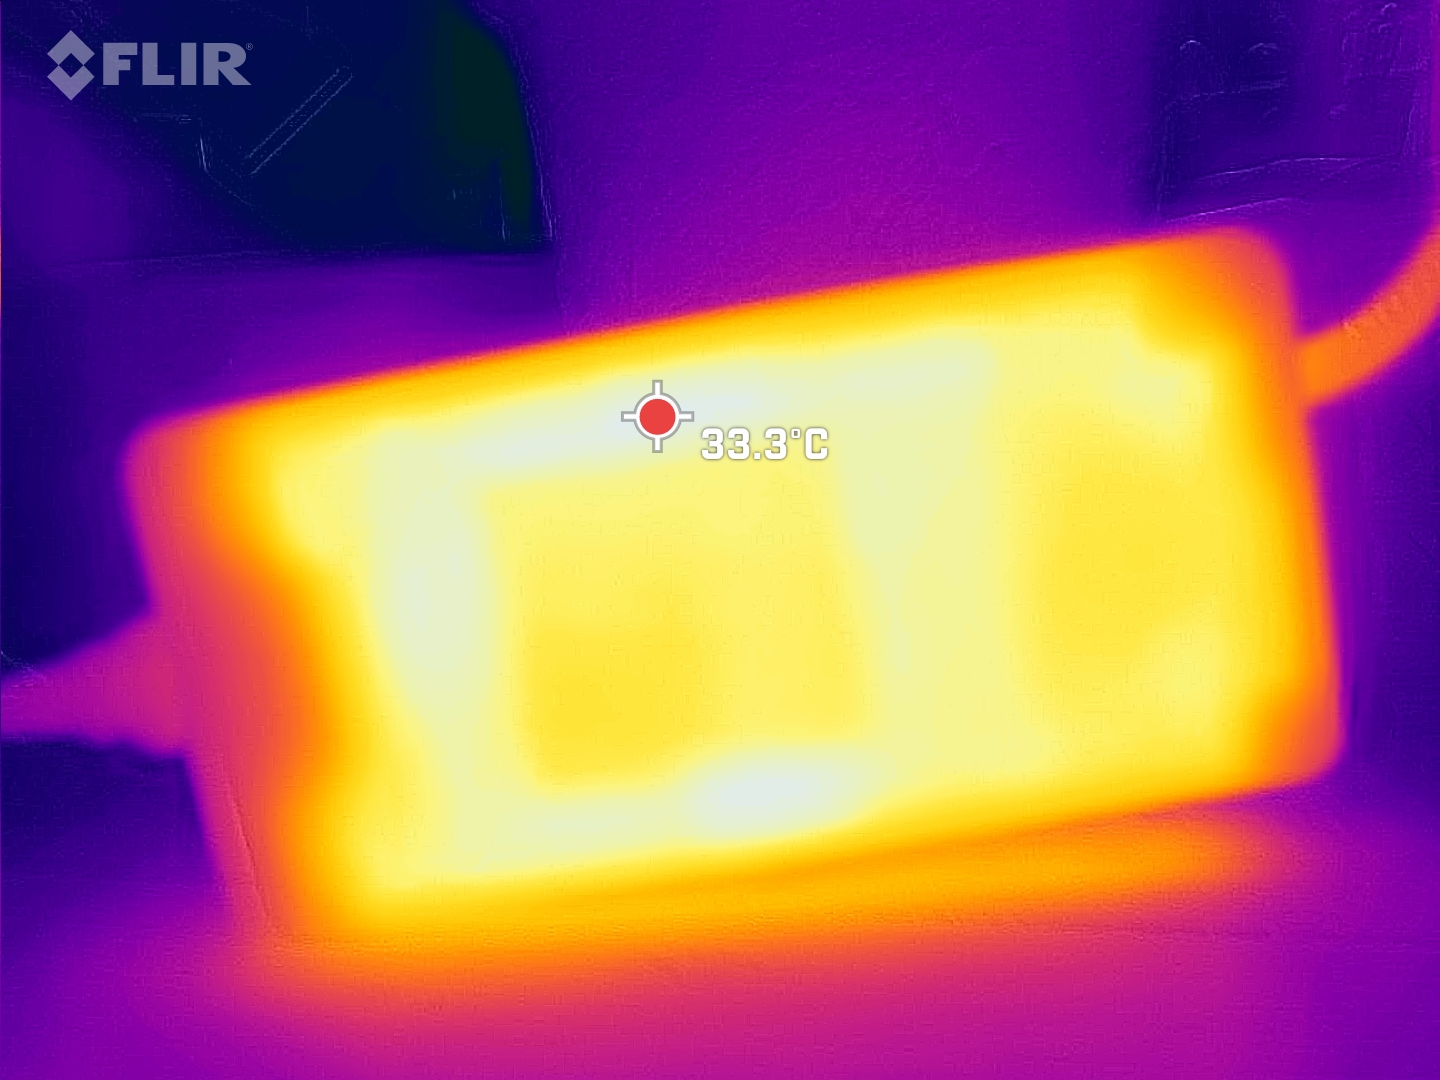
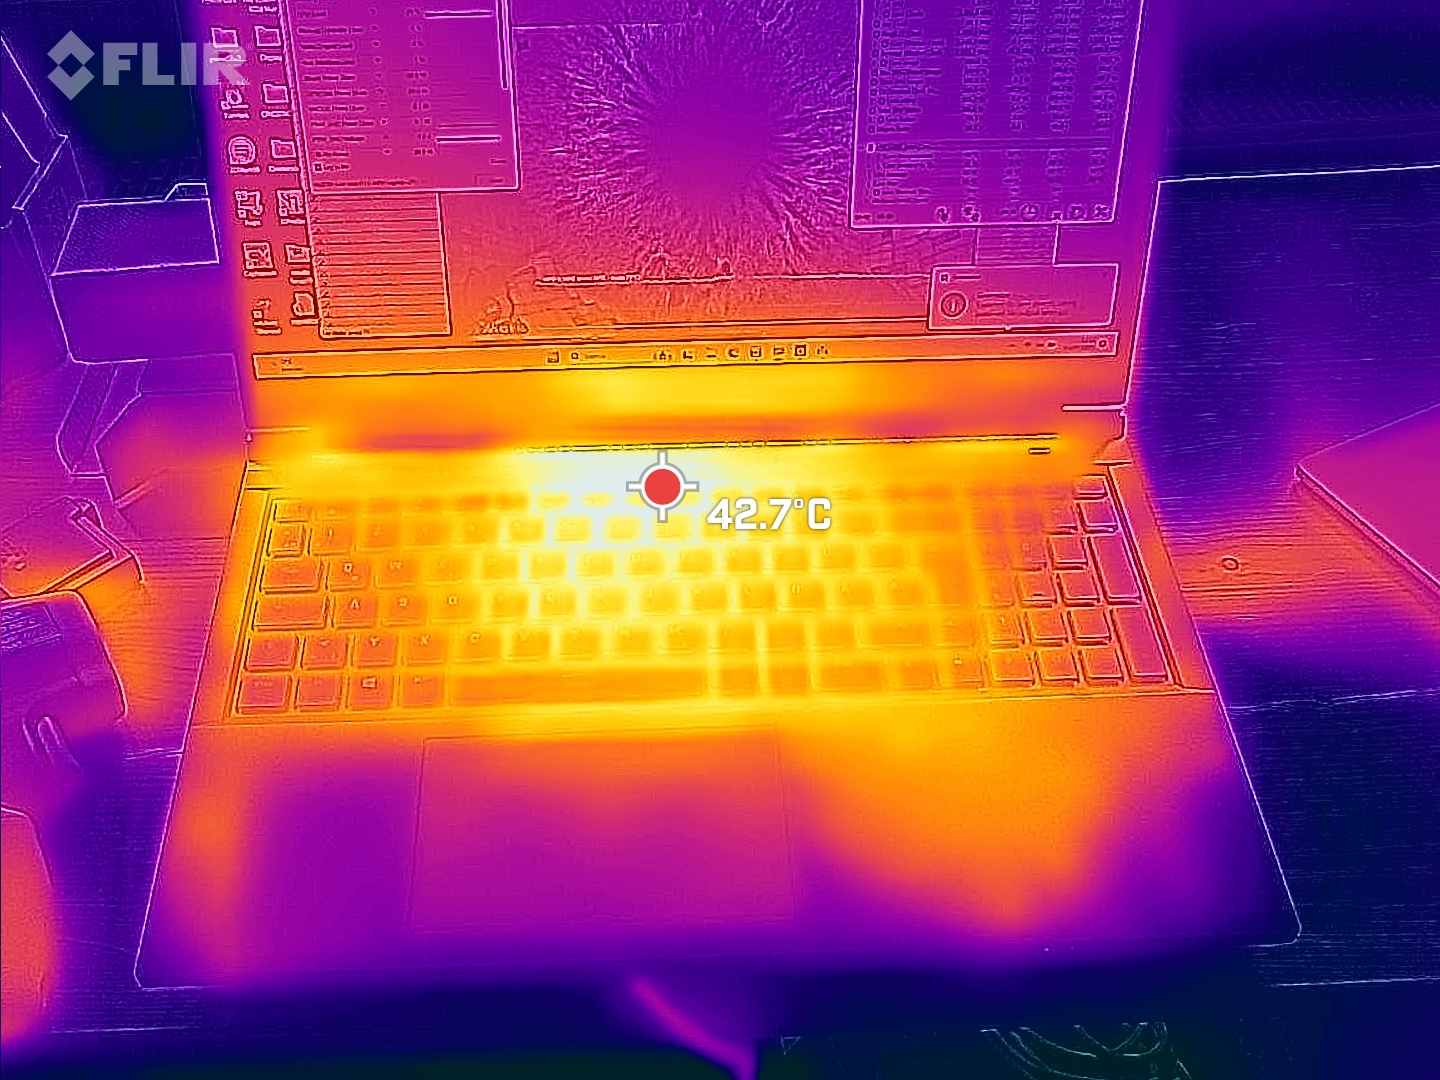
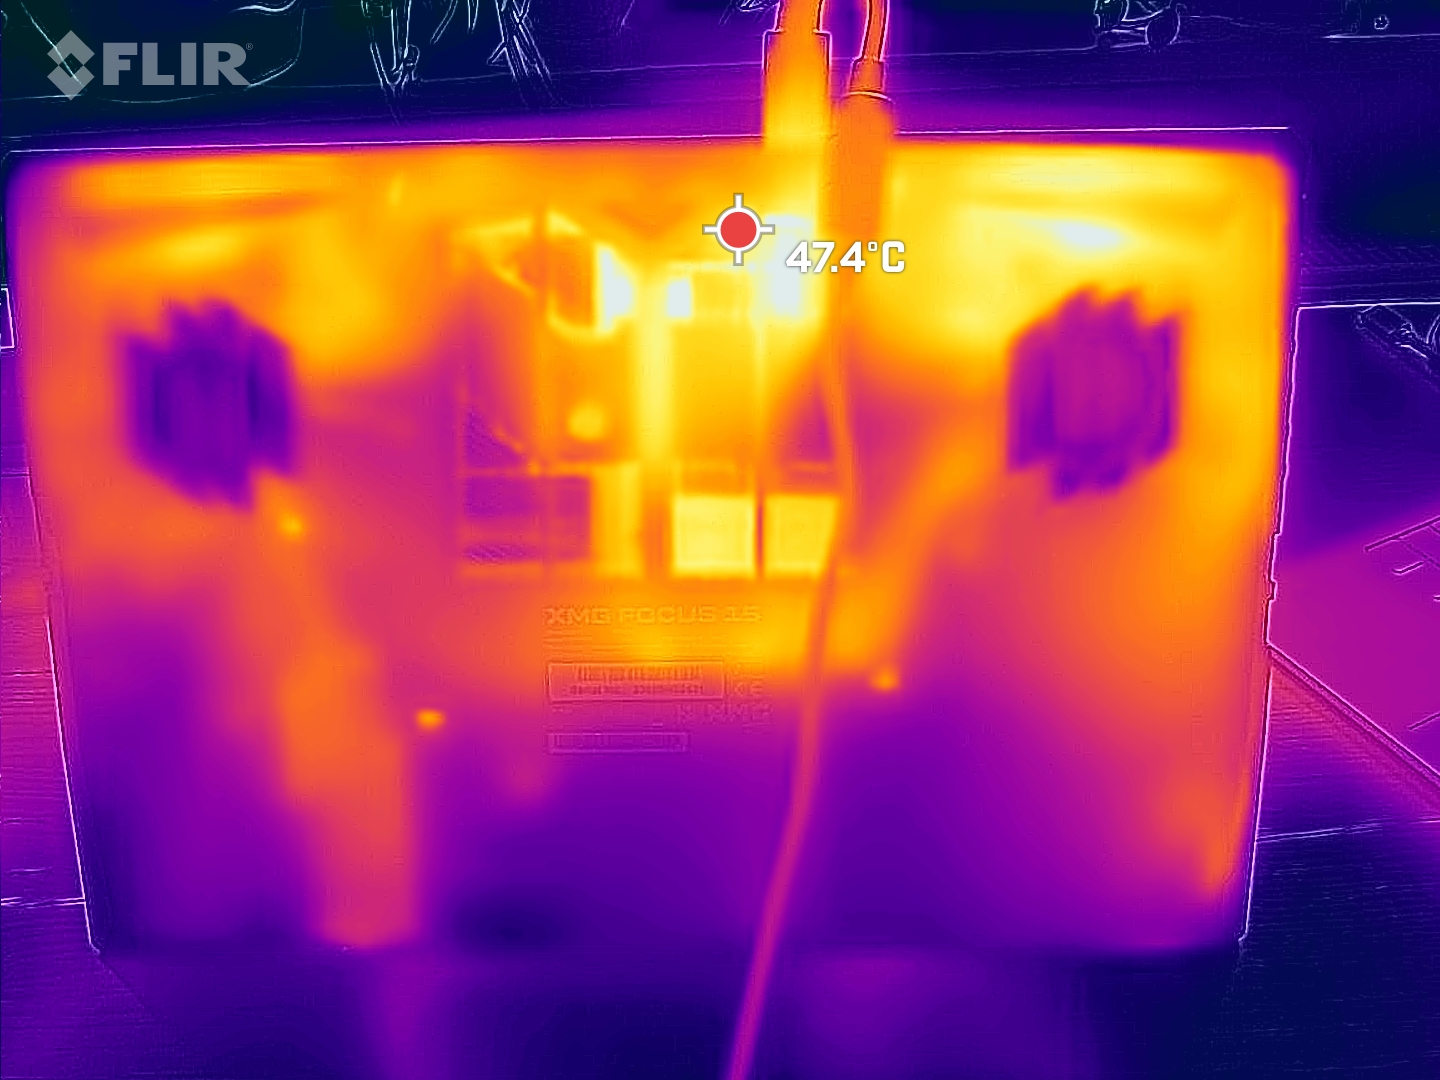
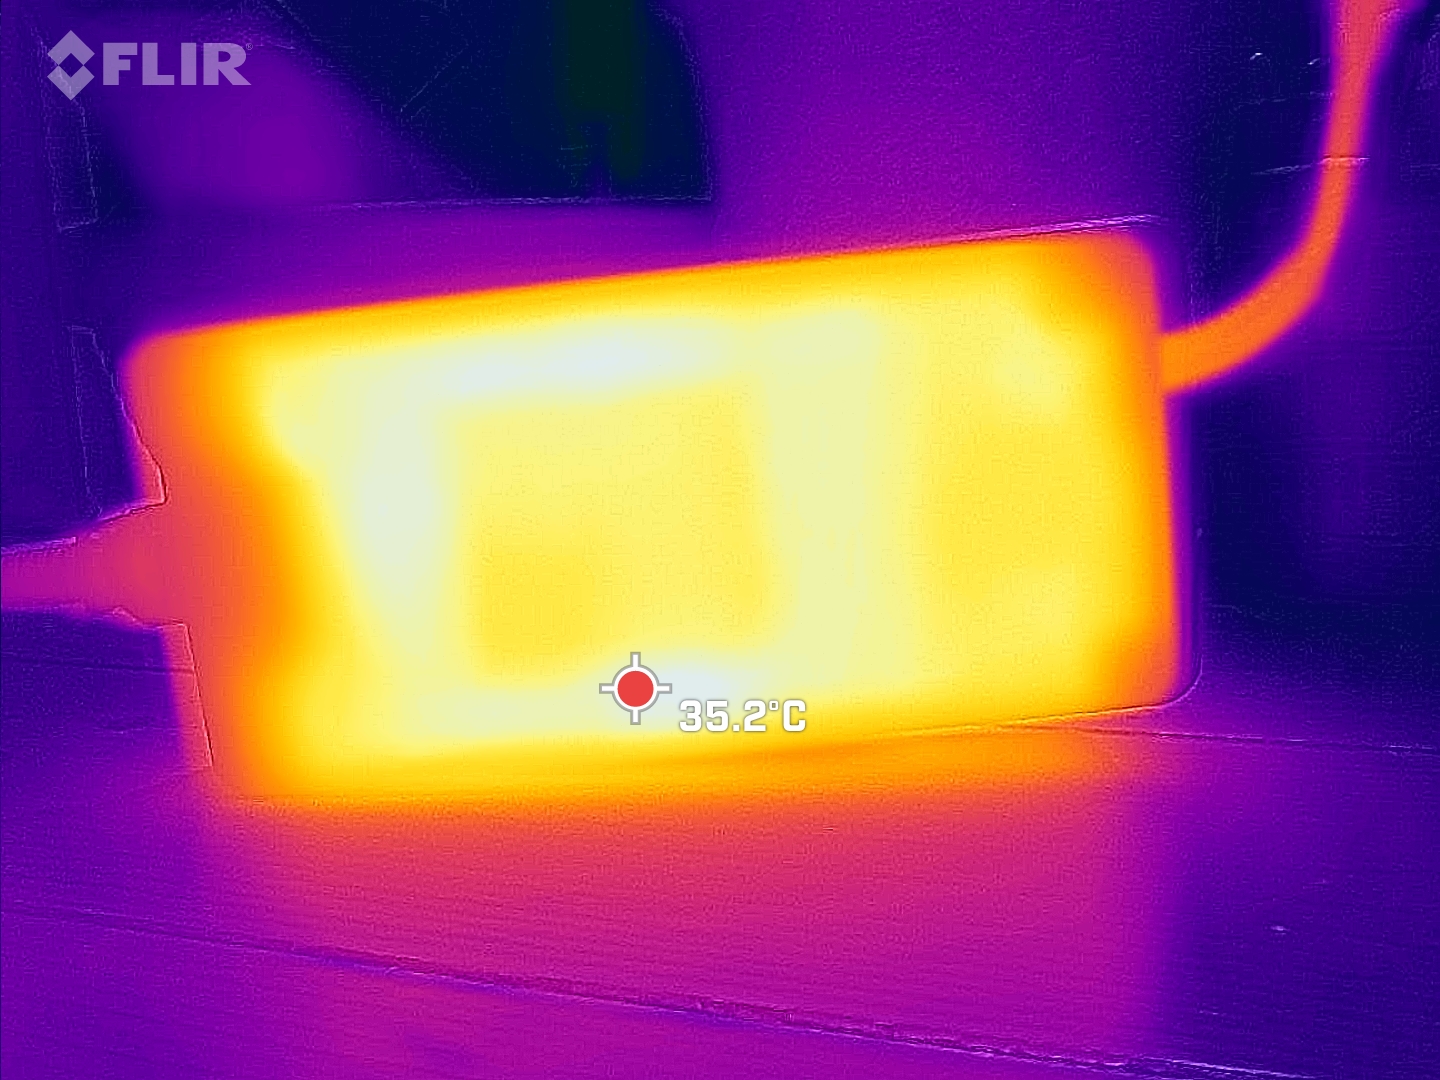
Temperatura
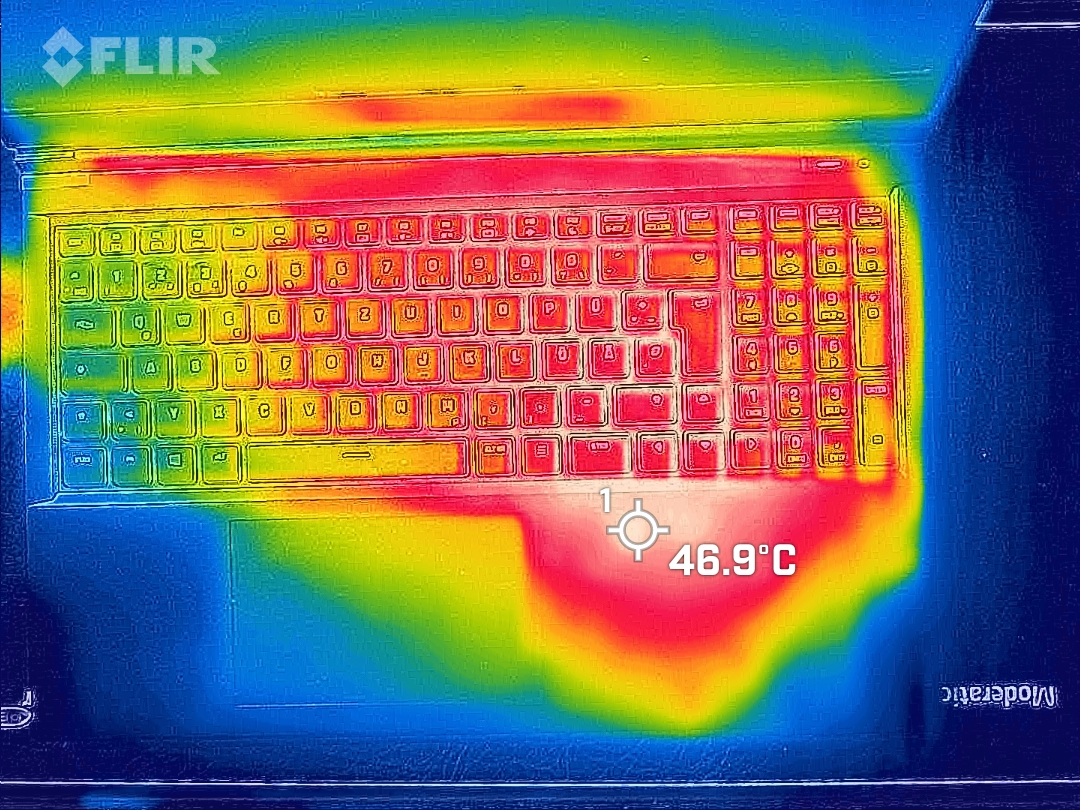
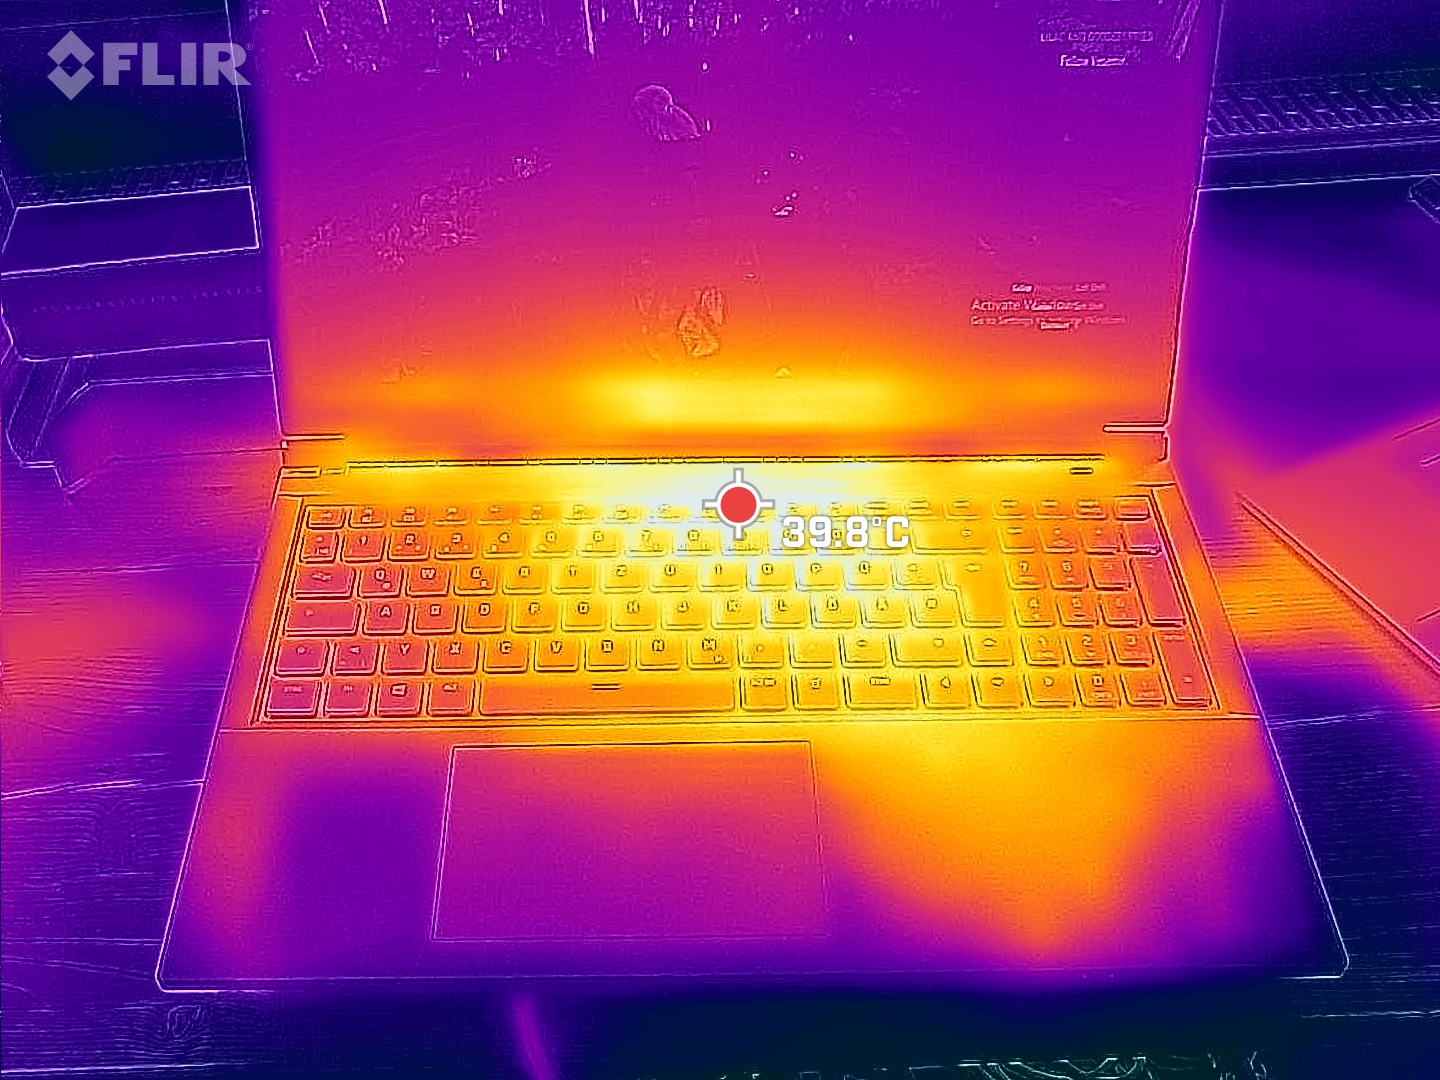
As temperaturas da superfície desse laptop para jogos não são nada frias. Medimos pontos de aquecimento de 51 °C, mas felizmente eles estão longe dos pontos de contato habituais.
Entretanto, o laptop também esquenta muito no apoio para a palma da mão direita durante o uso. Como normalmente se usa um mouse externo para jogos, isso provavelmente não é um grande problema para os destros. O apoio para a mão esquerda e as teclas W, A, S e D permanecem frios.
Mesmo a carga mais longa do SSD NVMe instalado parece ser suficiente para aumentar significativamente a temperatura do apoio para as mãos. Ele atingiu quase 46 °C quando instalamos nossos jogos de teste.
(-) A temperatura máxima no lado superior é 51 °C / 124 F, em comparação com a média de 40.4 °C / 105 F , variando de 21.2 a 68.8 °C para a classe Gaming.
(-) A parte inferior aquece até um máximo de 53 °C / 127 F, em comparação com a média de 43.2 °C / 110 F
(+) Em uso inativo, a temperatura média para o lado superior é 25.8 °C / 78 F, em comparação com a média do dispositivo de 33.9 °C / ### class_avg_f### F.
(±) Jogando The Witcher 3, a temperatura média para o lado superior é 36.2 °C / 97 F, em comparação com a média do dispositivo de 33.9 °C / ## #class_avg_f### F.
(±) Os apoios para as mãos e o touchpad podem ficar muito quentes ao toque, com um máximo de 36 °C / 96.8 F.
(-) A temperatura média da área do apoio para as mãos de dispositivos semelhantes foi 28.8 °C / 83.8 F (-7.2 °C / -13 F).
| Schenker XMG Focus 15 (E23) Intel Core i9-13900HX, NVIDIA GeForce RTX 4050 Laptop GPU | Schenker XMG Pro 15 (E23) Intel Core i9-13900HX, NVIDIA GeForce RTX 4060 Laptop GPU | Asus TUF A15 FA507 AMD Ryzen 7 7735HS, NVIDIA GeForce RTX 4050 Laptop GPU | MSI Katana 15 B12VEK Intel Core i7-12650H, NVIDIA GeForce RTX 4050 Laptop GPU | Acer Swift X SFX14-71G Intel Core i7-13700H, NVIDIA GeForce RTX 4050 Laptop GPU | Samsung Galaxy Book3 Ultra 16 Intel Core i7-13700H, NVIDIA GeForce RTX 4050 Laptop GPU | Gigabyte Aero 14 OLED BMF Intel Core i7-13700H, NVIDIA GeForce RTX 4050 Laptop GPU | |
|---|---|---|---|---|---|---|---|
| Heat | -3% | 9% | -8% | 9% | 18% | 10% | |
| Maximum Upper Side * (°C) | 51 | 50 2% | 48.9 4% | 47 8% | 46.4 9% | 41 20% | 42 18% |
| Maximum Bottom * (°C) | 53 | 50 6% | 44.6 16% | 48 9% | 49 8% | 44 17% | 52 2% |
| Idle Upper Side * (°C) | 29 | 33 -14% | 27.1 7% | 35 -21% | 26.5 9% | 23 21% | 26 10% |
| Idle Bottom * (°C) | 30 | 32 -7% | 27.5 8% | 38 -27% | 26.6 11% | 26 13% | 27 10% |
* ... menor é melhor
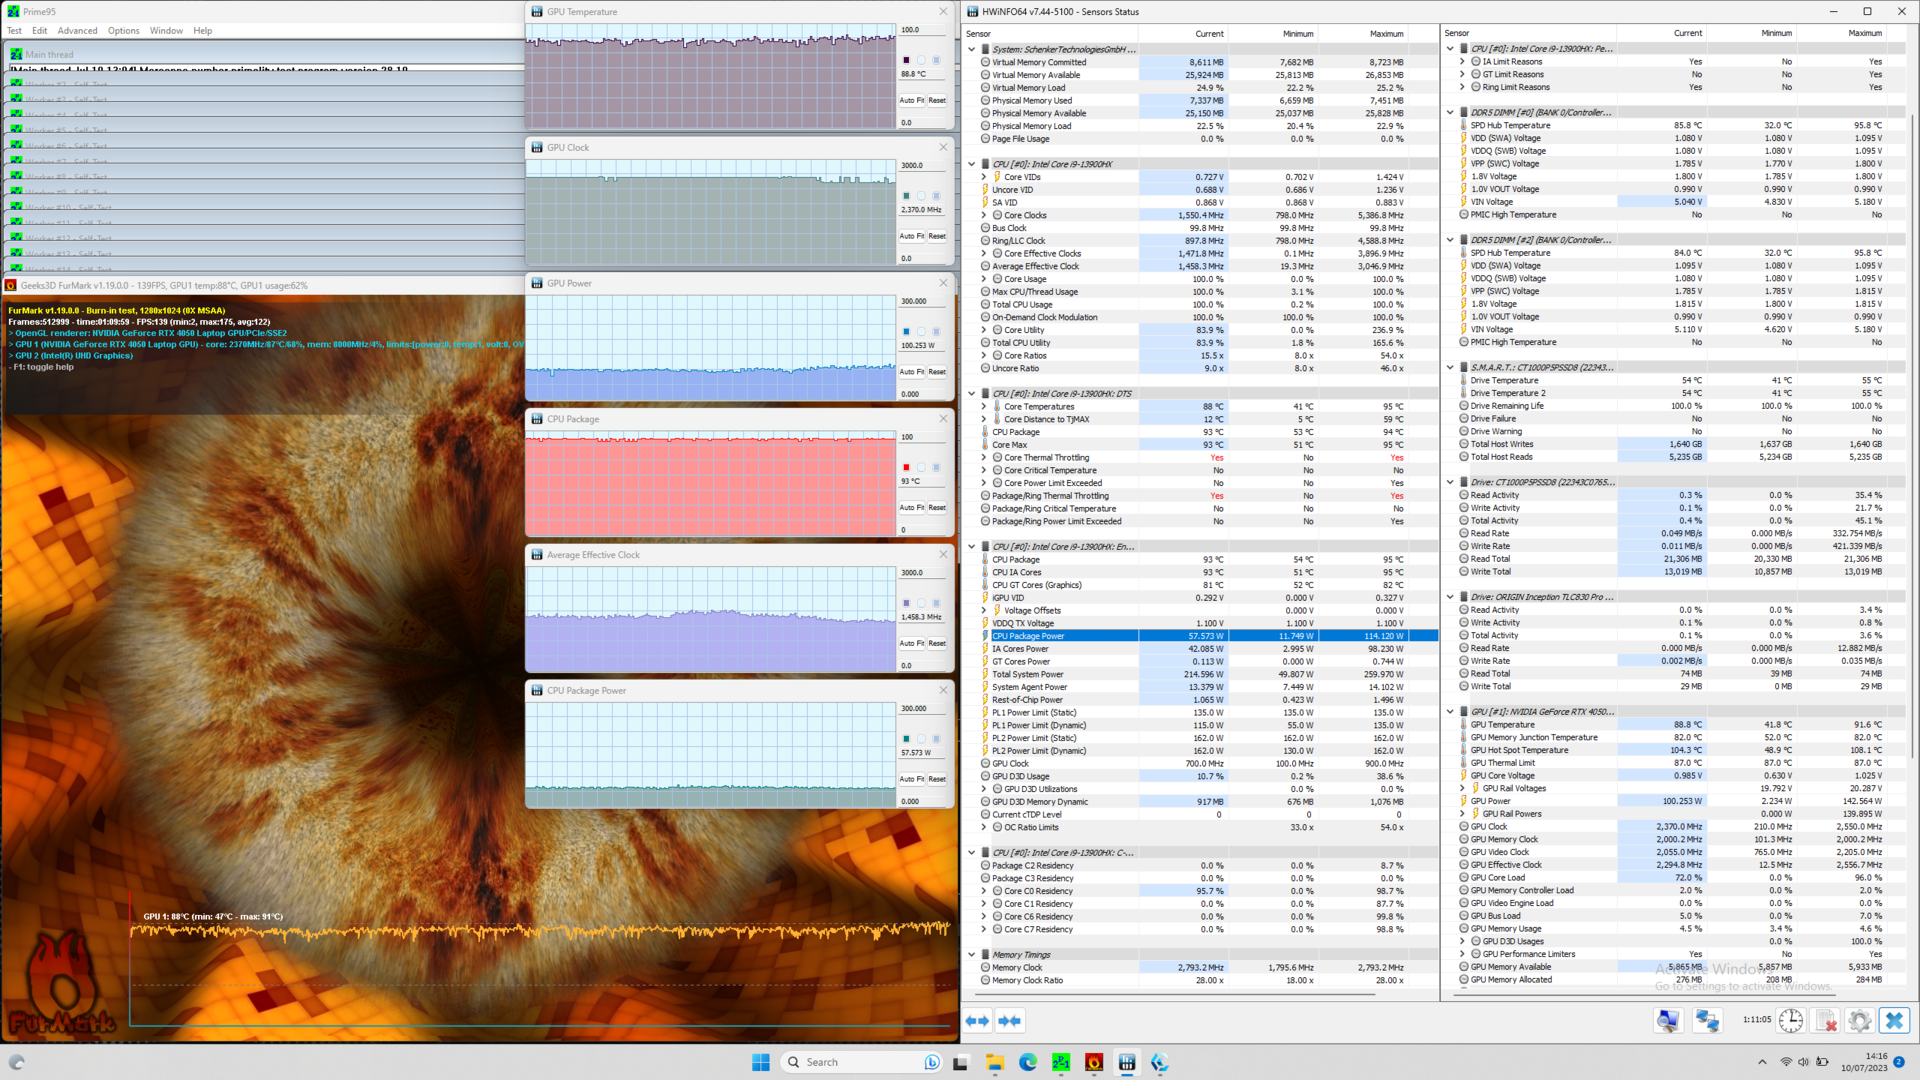
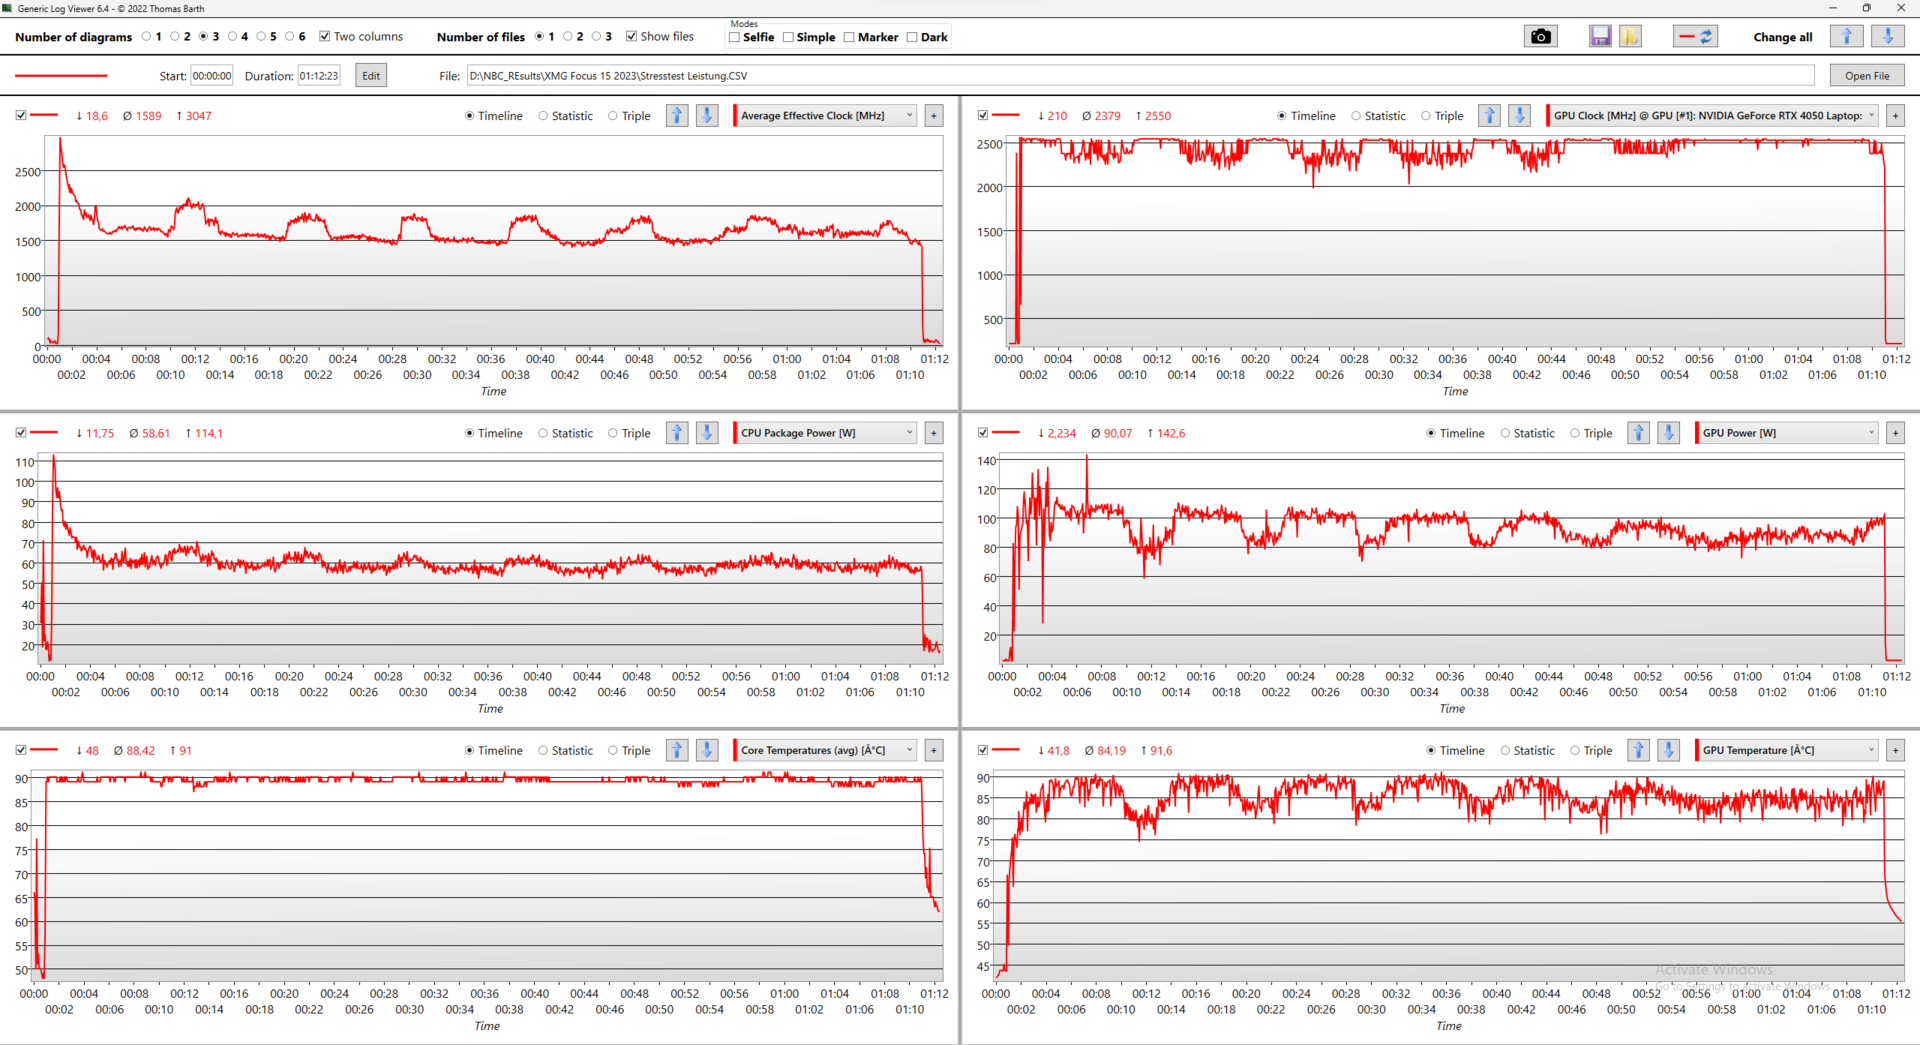
Teste de estresse
O XMG Focus 15 sobrevive ao teste de estresse com o Prime95 e o Furmark em altas temperaturas com desempenho constante. Não foi possível determinar uma queda no clock da CPU ou da GPU após a fase de aumento.
Em contrapartida, as temperaturas do Core i9 são relativamente altas, em torno de 90 °C. Entretanto, observando os registros do teste de estresse, temos que notar que os valores declarados por Schenker não são mantidos a longo prazo.
Após cerca de 10 minutos no teste de estresse, o desempenho da CPU se estabiliza em torno de 60 W e o consumo de energia da GPU em 100 W. Enquanto isso, o Dynamic Boost de 15 W é alternado entre o processador e o chip gráfico de vez em quando.
Alto-falante
Os alto-falantes do Focus 15 apresentam os sons médios e agudos relativamente bem, mas quase não conseguem reproduzir os graves. Portanto, o Focus 15 soa um pouco melhor do que o Pro 15.
Se os alto-falantes integrados parecerem inadequados, você sempre poderá usar dispositivos externos conectados via Bluetooth ou pelo conector de 3,5 mm.
Schenker XMG Focus 15 (E23) análise de áudio
(±) | o volume do alto-falante é médio, mas bom (###valor### dB)
Graves 100 - 315Hz
(-) | quase nenhum baixo - em média 29% menor que a mediana
(±) | a linearidade dos graves é média (9.5% delta para a frequência anterior)
Médios 400 - 2.000 Hz
(±) | médios mais altos - em média 5.2% maior que a mediana
(±) | a linearidade dos médios é média (7.2% delta para frequência anterior)
Altos 2 - 16 kHz
(±) | máximos mais altos - em média 5.4% maior que a mediana
(+) | os máximos são lineares (3.4% delta da frequência anterior)
Geral 100 - 16.000 Hz
(±) | a linearidade do som geral é média (24.9% diferença em relação à mediana)
Comparado com a mesma classe
» 89% de todos os dispositivos testados nesta classe foram melhores, 3% semelhantes, 7% piores
» O melhor teve um delta de 6%, a média foi 18%, o pior foi 132%
Comparado com todos os dispositivos testados
» 76% de todos os dispositivos testados foram melhores, 5% semelhantes, 19% piores
» O melhor teve um delta de 4%, a média foi 23%, o pior foi 134%
Schenker XMG Pro 15 (E23) análise de áudio
(±) | o volume do alto-falante é médio, mas bom (###valor### dB)
Graves 100 - 315Hz
(±) | graves reduzidos - em média 12.9% menor que a mediana
(±) | a linearidade dos graves é média (7.2% delta para a frequência anterior)
Médios 400 - 2.000 Hz
(±) | médios mais altos - em média 6.2% maior que a mediana
(±) | a linearidade dos médios é média (7.8% delta para frequência anterior)
Altos 2 - 16 kHz
(+) | agudos equilibrados - apenas 2.5% longe da mediana
(+) | os máximos são lineares (4.6% delta da frequência anterior)
Geral 100 - 16.000 Hz
(±) | a linearidade do som geral é média (18% diferença em relação à mediana)
Comparado com a mesma classe
» 55% de todos os dispositivos testados nesta classe foram melhores, 9% semelhantes, 36% piores
» O melhor teve um delta de 6%, a média foi 18%, o pior foi 132%
Comparado com todos os dispositivos testados
» 38% de todos os dispositivos testados foram melhores, 8% semelhantes, 54% piores
» O melhor teve um delta de 4%, a média foi 23%, o pior foi 134%
Gerenciamento de energia: Laptop para jogos que consome muita energia
Consumo de energia
O Schenker XMG Focus 15 vem com uma fome de energia padrão da classe. Está incluída uma grande fonte de alimentação que pode fornecer até 280 W.
É interessante notar que o consumo de carga de pico é maior no Focus 15 do que no Pro 15, portanto, a saída da fonte de alimentação também é totalmente utilizada.
Quando executado em um monitor externo, o laptop fica estável acima de 280 W no teste de estresse. Com o monitor interno, o consumo de energia caiu um pouco em um curto espaço de tempo.
| desligado | |
| Ocioso | |
| Carga |
|
Key:
min: | |
| Schenker XMG Focus 15 (E23) i9-13900HX, GeForce RTX 4050 Laptop GPU, Crucial P5 Plus 1TB CT1000P5PSSD8, IPS, 2569x1440, 15.6" | Schenker XMG Pro 15 (E23) i9-13900HX, GeForce RTX 4060 Laptop GPU, Crucial P5 Plus 1TB CT1000P5PSSD8, IPS, 2560x1440, 15.6" | Asus TUF A15 FA507 R7 7735HS, GeForce RTX 4050 Laptop GPU, Micron 2400 MTFDKBA512QFM, IPS, 1920x1080, 15.6" | MSI Katana 15 B12VEK i7-12650H, GeForce RTX 4050 Laptop GPU, Micron 2400 MTFDKBA1T0QFM, IPS, 1920x1080, 15.6" | Acer Swift X SFX14-71G i7-13700H, GeForce RTX 4050 Laptop GPU, Samsung PM9A1 MZVL21T0HCLR, OLED, 2880x1800, 14.5" | Samsung Galaxy Book3 Ultra 16 i7-13700H, GeForce RTX 4050 Laptop GPU, Samsung PM9A1 MZVL2512HCJQ, AMOLED, 2880x1800, 16" | Gigabyte Aero 14 OLED BMF i7-13700H, GeForce RTX 4050 Laptop GPU, Gigabyte AG470S1TB-SI B10, OLED, 2880x1800, 14" | Média NVIDIA GeForce RTX 4050 Laptop GPU | Média da turma Gaming | |
|---|---|---|---|---|---|---|---|---|---|
| Power Consumption | -39% | 40% | 41% | 47% | 64% | 54% | 23% | 2% | |
| Idle Minimum * (Watt) | 11.4 | 21.6 -89% | 8 30% | 8.5 25% | 8.4 26% | 3 74% | 7.4 35% | 9.95 ? 13% | 13 ? -14% |
| Idle Average * (Watt) | 16.7 | 29 -74% | 12.1 28% | 10.2 39% | 11.5 31% | 5 70% | 8.3 50% | 15.8 ? 5% | 18.6 ? -11% |
| Idle Maximum * (Watt) | 25.8 | 42.7 -66% | 12.5 52% | 11.3 56% | 11.9 54% | 11 57% | 8.7 66% | 20.1 ? 22% | 24.2 ? 6% |
| Load Average * (Watt) | 139 | 190 -37% | 74.9 46% | 84 40% | 84.9 39% | 72 48% | 76 45% | 88 ? 37% | 108.7 ? 22% |
| Witcher 3 ultra * (Watt) | 265 | 189 29% | 136.6 48% | 128 52% | 83.6 68% | 69.7 74% | 70 74% | ||
| Load Maximum * (Watt) | 280 | 269 4% | 185 34% | 189 32% | 104.2 63% | 108 61% | 132 53% | 176.3 ? 37% | 255 ? 9% |
* ... menor é melhor
Power consumption: The Witcher 3 / Stress test
Power consumption: External Monitor
Duração da bateria
Determinamos quase seis horas de tempo de execução no teste prático de navegação na Web por Wi-Fi. Portanto, o dispositivo de teste está apenas dois minutos abaixo da média dos notebooks para jogos.
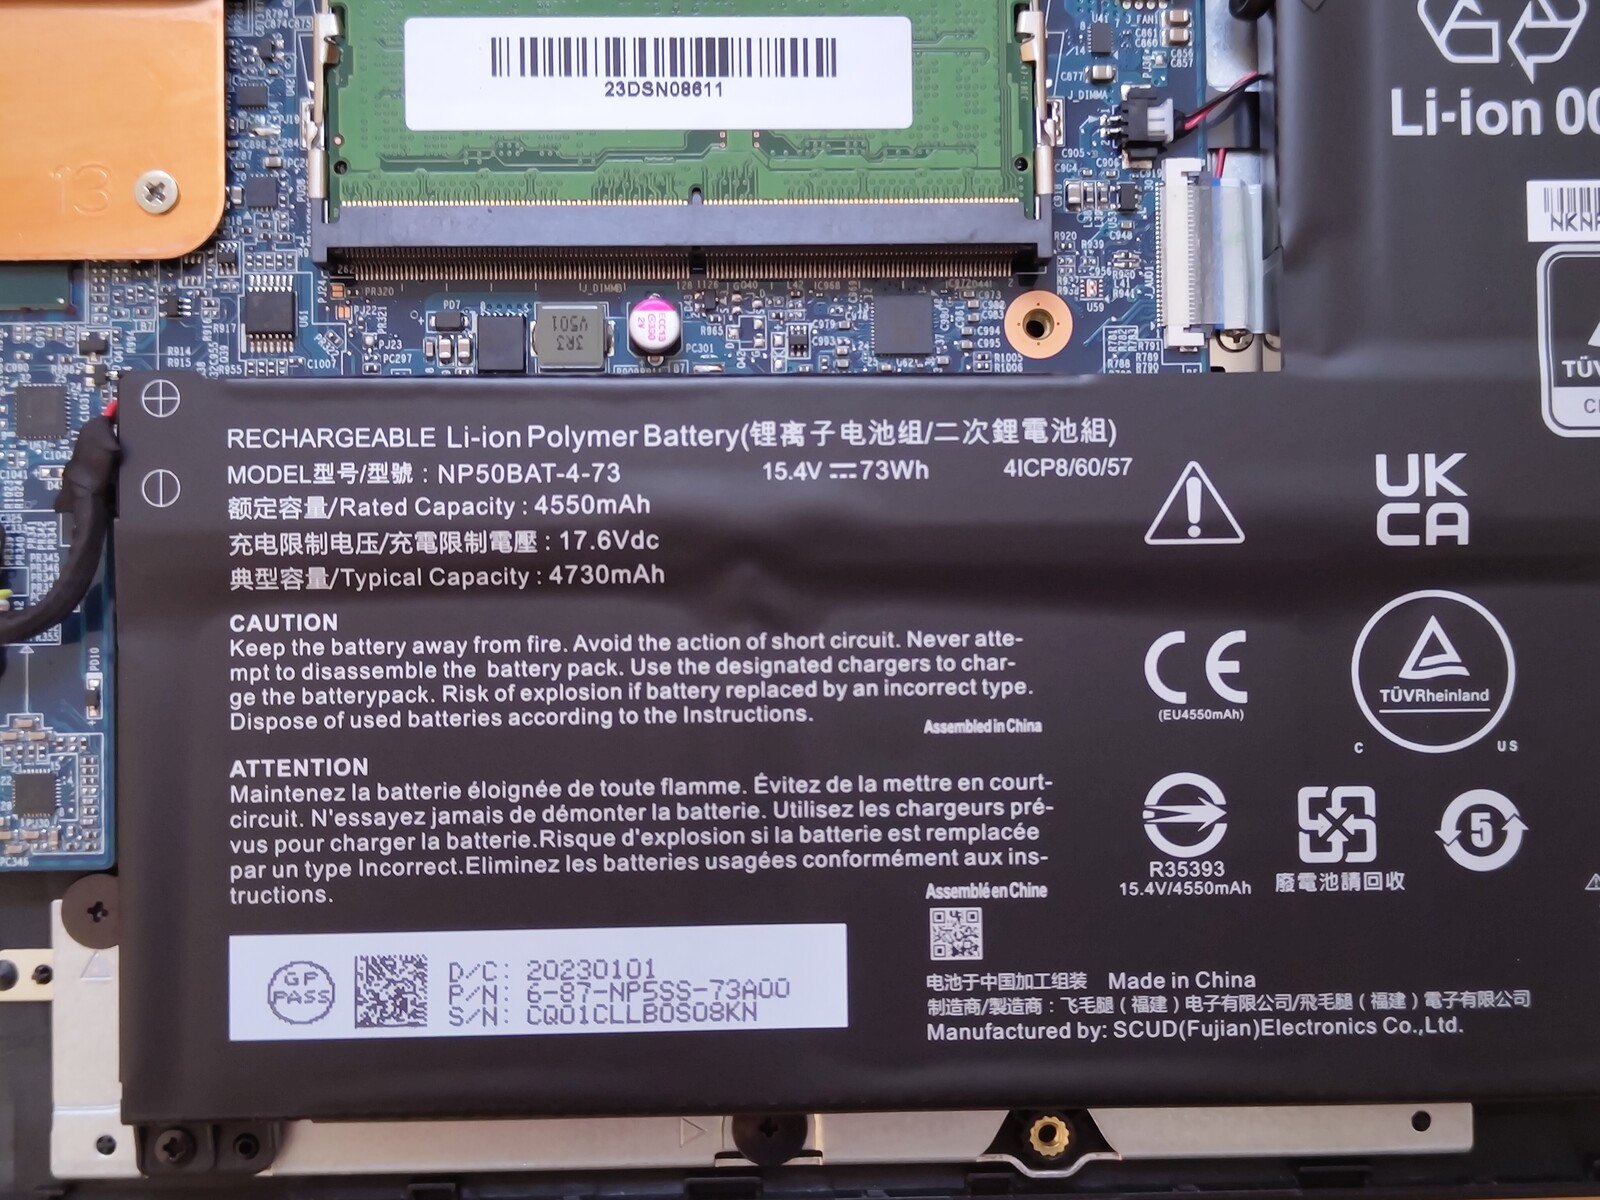
Enquanto isso, os gamers podem conseguir tempos de execução significativamente mais longos no modo de bateria. Entretanto, a capacidade de 73 Wh da bateria é esgotada rapidamente.
| Schenker XMG Focus 15 (E23) i9-13900HX, GeForce RTX 4050 Laptop GPU, 73 Wh | Schenker XMG Pro 15 (E23) i9-13900HX, GeForce RTX 4060 Laptop GPU, 80 Wh | Asus TUF A15 FA507 R7 7735HS, GeForce RTX 4050 Laptop GPU, 90 Wh | MSI Katana 15 B12VEK i7-12650H, GeForce RTX 4050 Laptop GPU, 53.5 Wh | Acer Swift X SFX14-71G i7-13700H, GeForce RTX 4050 Laptop GPU, 76 Wh | Samsung Galaxy Book3 Ultra 16 i7-13700H, GeForce RTX 4050 Laptop GPU, 76 Wh | Gigabyte Aero 14 OLED BMF i7-13700H, GeForce RTX 4050 Laptop GPU, 63 Wh | Média da turma Gaming | |
|---|---|---|---|---|---|---|---|---|
| Duração da bateria | 22% | 38% | -6% | -8% | 51% | 22% | 18% | |
| WiFi v1.3 (h) | 5.9 | 5.7 -3% | 11.7 98% | 4.3 -27% | 7.7 31% | 9.6 63% | 7.6 29% | 7.07 ? 20% |
| Load (h) | 1.3 | 1.9 46% | 1 -23% | 1.5 15% | 0.7 -46% | 1.8 38% | 1.5 15% | 1.502 ? 16% |
| H.264 (h) | 12.5 | 4.4 | 9.5 | 13.4 | 8.64 ? | |||
| Reader / Idle (h) | 18.2 | 11.3 | 8.71 ? |
Pro
Contra
Veredicto: O XMG captura a essência dos jogos
Se você quiser um laptop de 15,6 polegadas com uma GPU Nvidia atual da Schenker ou da XMG, poderá escolher entre oXMG Apex 15 Max e Focus, bem como o Schenker Key e Media. O XMG Pro 15 e o XMG Focus 15 estão muito próximos um do outro no teste.
O Focus 15 se concentra no básico. O laptop para jogos convence principalmente com hardware de computação de alto desempenho. OIntel Core i9-13900HX e Nvidia GeForce RTX 4050 trabalham em um nível de desempenho muito alto. Embora isso resulte em altas pontuações nos benchmarks, também contribui para altas temperaturas de superfície, ventoinhas mais barulhentas e menor duração da bateria em comparação com muitos de seus contemporâneos, como o Asus TUF A15.
Se o chassi deve ser feito de metal, como o do Pro 15, ou de plástico, é uma questão de gosto. Por fora, o Pro 15 e o Focus 15 são muito parecidos. No entanto, a amostra da análise oferece menos conectividade e não tem uma porta USB Type-C com Power Delivery.
O XMG Focus 15 atende aos requisitos básicos de um notebook para jogos. Graças às muitas opções de configuração, ele pode ser adaptado às necessidades do usuário.
Assim como no Pro 15, apenas alguns pontos negativos podem ser encontrados no Focus 15. Isso ocorre porque todas as desvantagens que o laptop apresenta são típicas de sua classe de preço e desempenho.
Em comparação com outros notebooks para jogos mais baratos, como o Asus TUF A15 ou o MSI Katana 15, o extremamente potente Core i9-13900HX e a boa tela QHD do XMG Focus se destacam positivamente.
Preço e disponibilidade
O XMG Focus 15 pode ser configurado livremente na Bestware. Estão disponíveis duas opções de tela, três opções de GPU e várias combinações de memória. Na configuração básica absoluta, com apenas 8 GB de memória de trabalho e sem SSD ou Windows, o preço de entrada é de cerca de € 1.440 euros (~US$ 1.618).
Para uma configuração com uma tela Full HD, 16 GB de memória de trabalho e um SSD Samsung de 1 TB, a Bestware cobra cerca de € 1.560. Nossa configuração de teste custa cerca de 300 euros a mais. Se você planeja fazer tudo e selecionar os componentes mais caros, espere gastar mais de €3.500 por esse notebook.
Schenker XMG Focus 15 (E23)
- 07/10/2023 v7 (old)
Marc Herter
Transparência
A seleção dos dispositivos a serem analisados é feita pela nossa equipe editorial. A amostra de teste foi fornecida ao autor como empréstimo pelo fabricante ou varejista para fins desta revisão. O credor não teve influência nesta revisão, nem o fabricante recebeu uma cópia desta revisão antes da publicação. Não houve obrigação de publicar esta revisão. Como empresa de mídia independente, a Notebookcheck não está sujeita à autoridade de fabricantes, varejistas ou editores.
É assim que o Notebookcheck está testando
Todos os anos, o Notebookcheck analisa de forma independente centenas de laptops e smartphones usando procedimentos padronizados para garantir que todos os resultados sejam comparáveis. Desenvolvemos continuamente nossos métodos de teste há cerca de 20 anos e definimos padrões da indústria no processo. Em nossos laboratórios de teste, equipamentos de medição de alta qualidade são utilizados por técnicos e editores experientes. Esses testes envolvem um processo de validação em vários estágios. Nosso complexo sistema de classificação é baseado em centenas de medições e benchmarks bem fundamentados, o que mantém a objetividade.Price comparison
