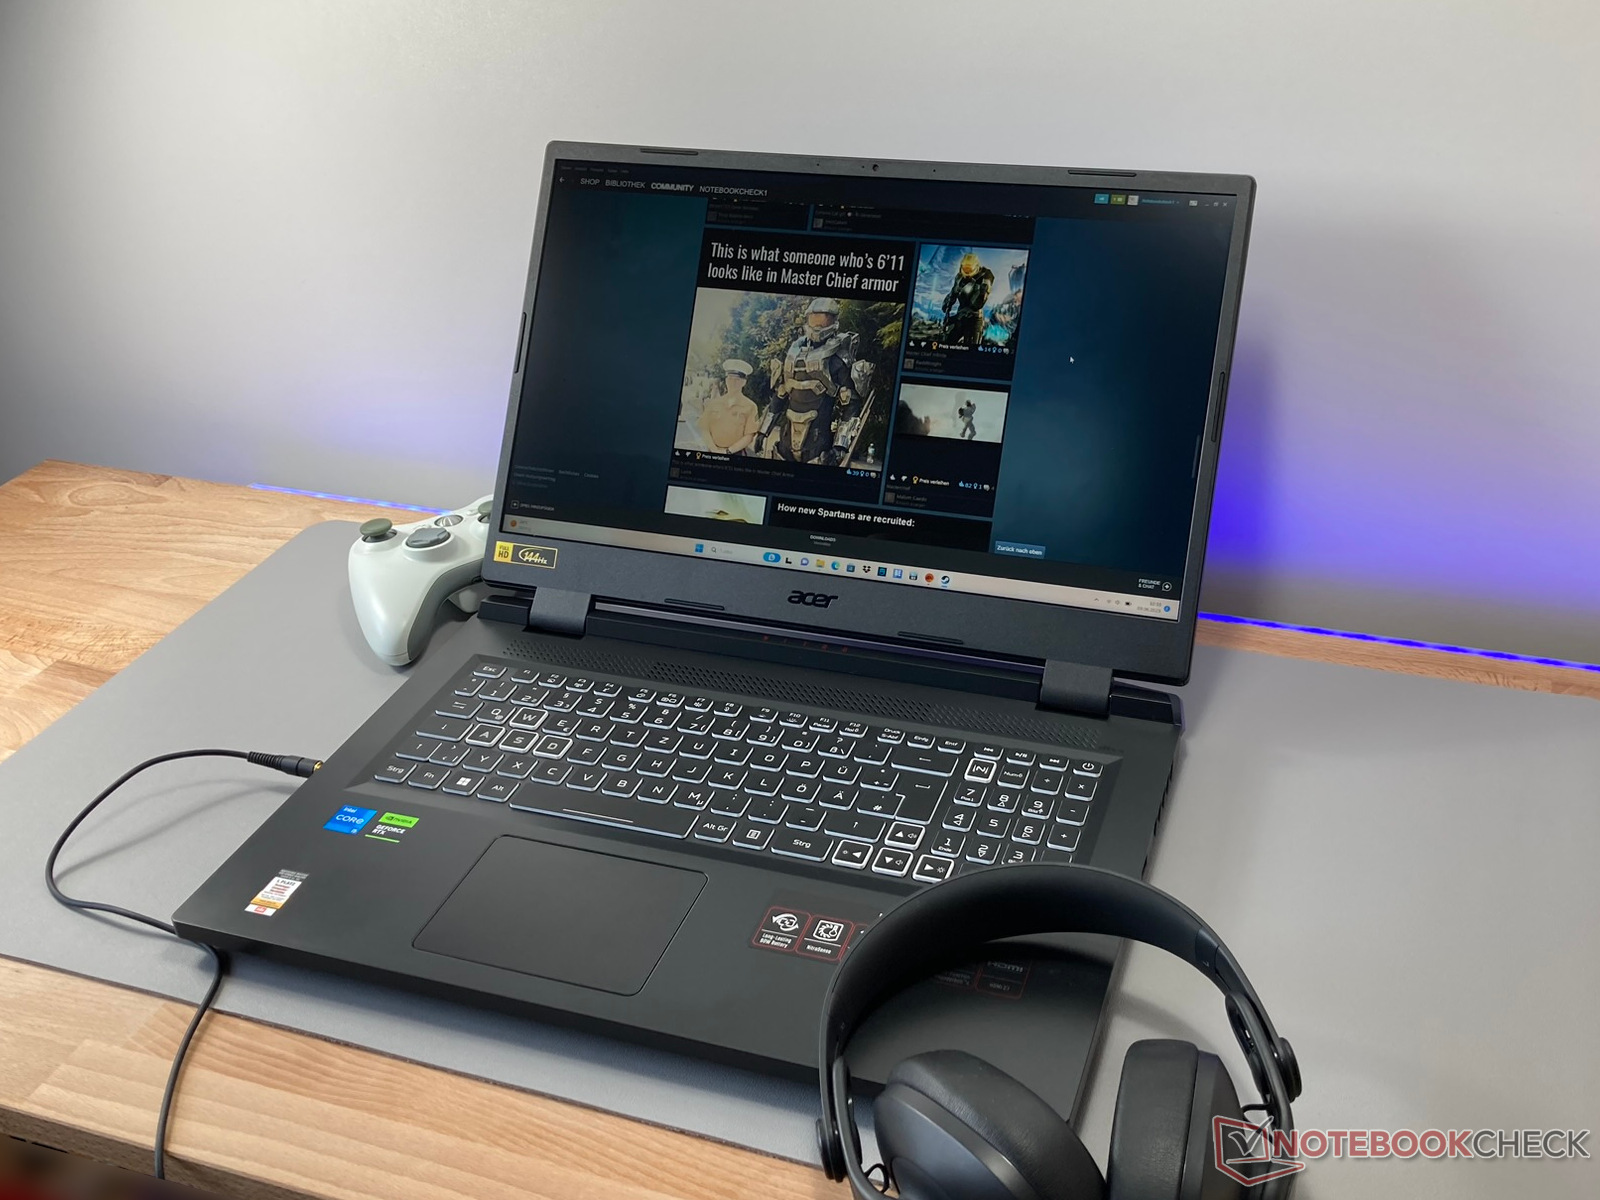
Análise do Acer Nitro 5 AN517: Um laptop para jogos com uma RTX 4050 silenciosa

O Acer Nitro 5 AN517, relativamente grande, possui um processador Alder Lake - que não é mais o mais novo do mercado - e é combinado com uma placa de vídeo Nvidia GeForce RTX série 4000. O resultado é um laptop sólido para jogos de nível básico, com especificações decentes, iluminação RGB, um painel de 144 Hz e uma porta Thunderbolt 4.
No ano passado, analisamos o antecessor muito semelhante, oAcer Nitro 5 AN517-55-738Rcom uma placaRTX 3060entre outras coisas, ele chamou a atenção devido aos níveis excessivos de ruído. É exatamente nessa área que a Acer fez melhorias e, ao mesmo tempo, consegue se beneficiar da RTX 4050conforme constatado em nosso modelo de análise. Nossa análise revela o nível de jogos silenciosos que você pode esperar.
Os concorrentes com tecnologia comparável são Medion Erazer Scout E20que é equipado com um processador maior e mais novo, ou o Asus TUF Gaming A16que optou por componentes AMD.
Possíveis concorrentes em comparação
Avaliação | Data | Modelo | Peso | Altura | Size | Resolução | Preço |
|---|---|---|---|---|---|---|---|
| 85.5 % v7 (old) | 06/2023 | Acer Nitro 5 AN517-55-5552 i5-12500H, GeForce RTX 4050 Laptop GPU | 3 kg | 28.9 mm | 17.30" | 1920x1080 | |
| 86.9 % v7 (old) | 06/2023 | Asus TUF Gaming A16 FA617XS R9 7940HS, Radeon RX 7600S | 2.2 kg | 22.1 mm | 16.00" | 1920x1200 | |
| 83.9 % v7 (old) | 08/2022 | Acer Nitro 5 AN517-55-738R i7-12700H, GeForce RTX 3060 Laptop GPU | 3.1 kg | 28.6 mm | 17.30" | 1920x1080 | |
| 83 % v7 (old) | 05/2023 | Medion Erazer Scout E20 i7-13700H, GeForce RTX 4050 Laptop GPU | 2.8 kg | 29 mm | 17.30" | 1920x1080 | |
| 82.9 % v7 (old) | 03/2023 | MSI Katana 15 B12VEK i7-12650H, GeForce RTX 4050 Laptop GPU | 2.3 kg | 24.9 mm | 15.60" | 1920x1080 | |
| 82.4 % v7 (old) | 04/2023 | MSI Cyborg 15 A12VF i7-12650H, GeForce RTX 4060 Laptop GPU | 2 kg | 22.9 mm | 15.60" | 1920x1080 |
Estojo - O grande Nitro 5 precisa de espaço
A profundidade bem acima da média do Acer Nitro 5 é considerável, mesmo para um dispositivo de 17,3 polegadas. Portanto, não é de surpreender que o dispositivo seja um pouco mais pesado do que os concorrentes equipados de forma semelhante. Em compensação, o laptop tem uma construção muito sólida.
As dobradiças são firmes, podem ser abertas em um ângulo de até 145° e evitam que a tela grande balance. Todo o gabinete é feito de plástico, o que não afeta negativamente a rigidez de torção da unidade. A estrutura da tela pode ser levemente torcida. Por outro lado, a base permanece absolutamente sólida o tempo todo - e silenciosa.
É claro que as opiniões podem se dividir em relação ao design. No entanto, os cantos prateados levemente deslocados e as finas listras coloridas parecem pouco ousados. É questionável se a diferença em relação a um gabinete totalmente preto seria sequer perceptível.


Recursos - Um laptop para jogos com os extras necessários
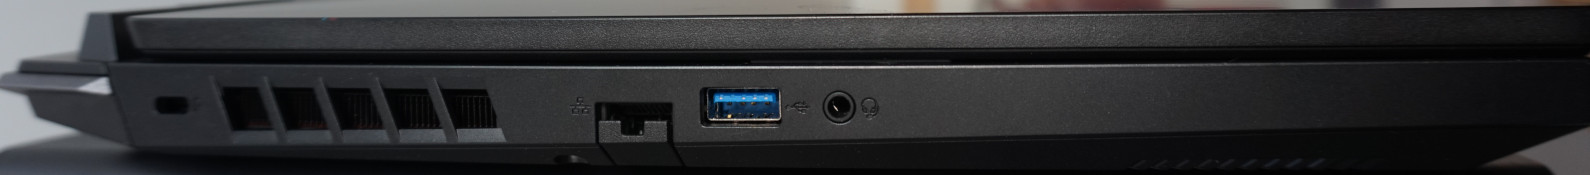
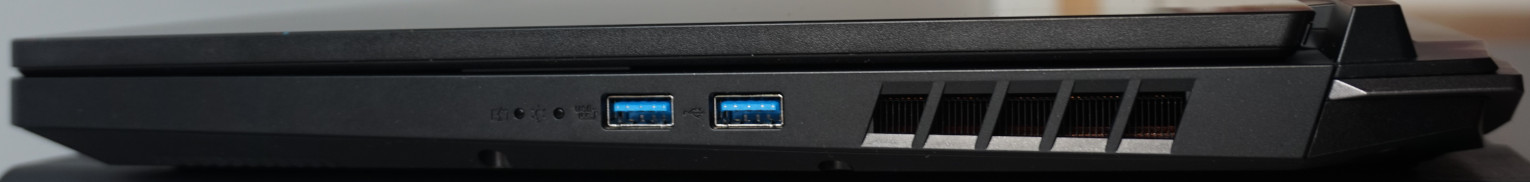
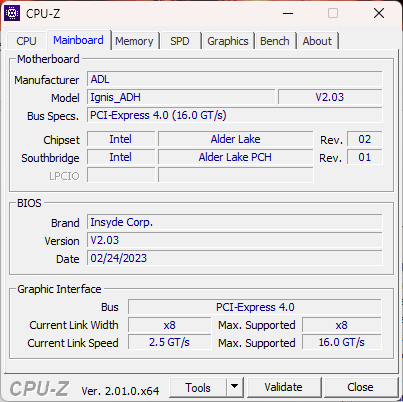
A seleção de portas é limitada, mas, felizmente, as mais importantes estão à mão. À esquerda e à direita estão as portas USB-A, sendo que o lado direito abriga duas. Elas têm uma taxa de transferência máxima de 10 Gbit/s (USB 3.2 Gen2). Na parte traseira do laptop, você encontrará uma porta HDMI e Thunderbolt 4, bem como duas saídas de vídeo. Além disso, a TB4 tem uma interface adequada para poder usar um SSD externo em sua velocidade máxima.
Não há um slot para cartão e não há uma terceira saída de vídeo, às vezes usada como Mini DP, mas geralmente como uma porta USB-C adicional com suporte a DP. Além disso, a porta LAN tem uma taxa de transferência de dados de apenas 1 Gbit/s.

Comunicação
O módulo Wi-Fi Killer Wi-Fi 6 AX1650i funciona como esperado. Se a distância até o roteador for curta, é possível atingir velocidades de mais de 1,5 Gbit/s.
O Wi-Fi 6E não é compatível, o que significa que se deve esperar uma redução notável nas velocidades de transferência de dados teoricamente possíveis, especialmente em áreas com várias redes sem fio.
Webcam
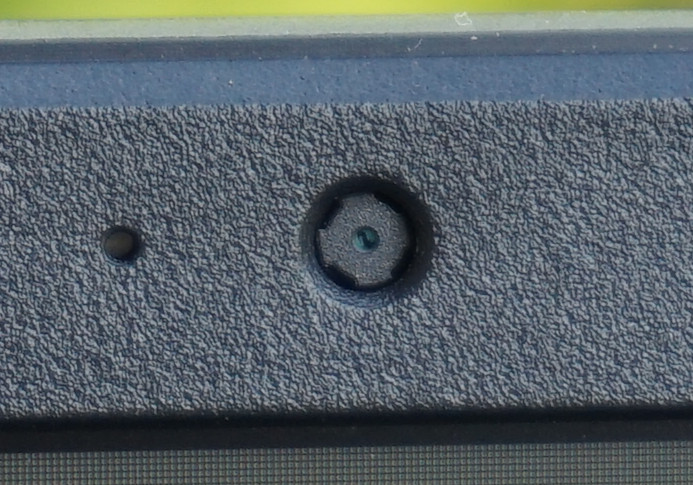
A webcam tem um desempenho ruim com resolução HD, máximo de 30 fps e qualidade de imagem pouco aceitável. Mas, pelo menos, há um brilho decente em condições de pouca luz, sem produzir muito ruído na imagem.
Em uma inspeção mais detalhada, o microfone de matriz dupla se sai muito melhor. Ele faz um bom trabalho ao gravar a voz do usuário de várias direções e distâncias em um volume relativamente estável e não há distorções, ruídos ou tons metálicos. Isso torna o laptop bem equipado para lidar com chamadas de vídeo ou bate-papos em jogos.


Serviços
Abrir o Acer Nitro 5 não é particularmente problemático: Em primeiro lugar, é necessário remover doze parafusos de cabeça cruzada de tamanho idêntico. Depois disso, é possível retirar a base removendo-a pelos cantos traseiros - e tudo isso com o mínimo de esforço.
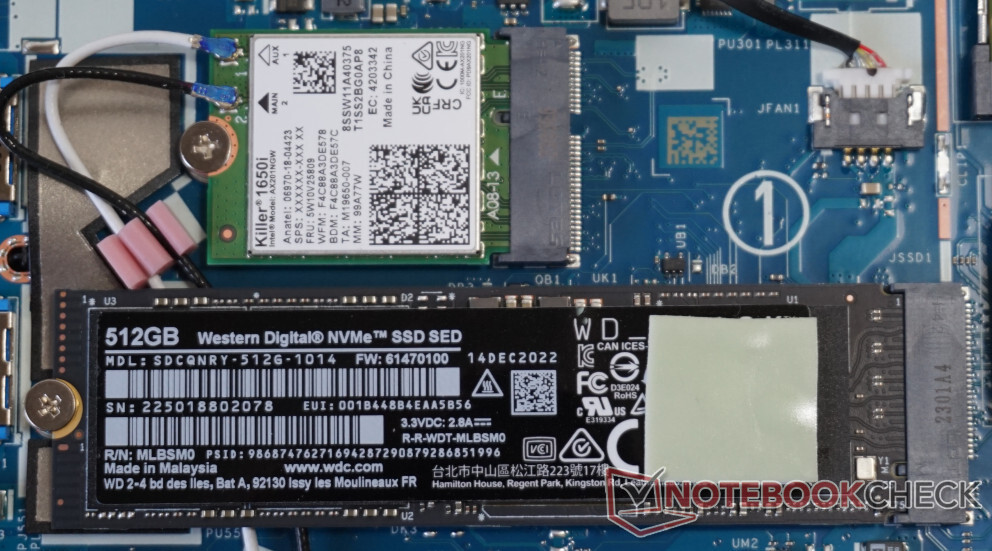
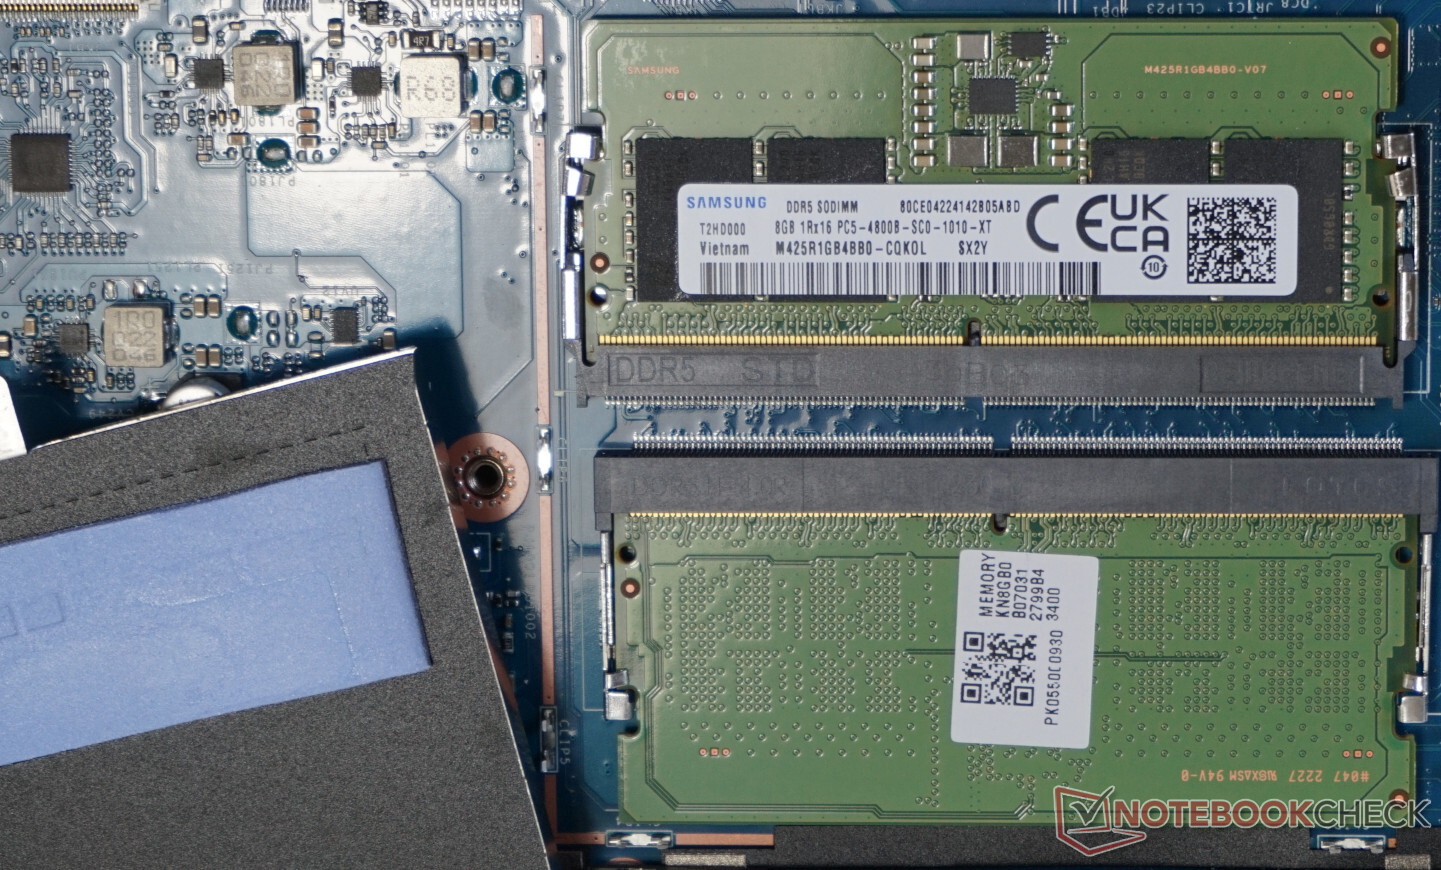
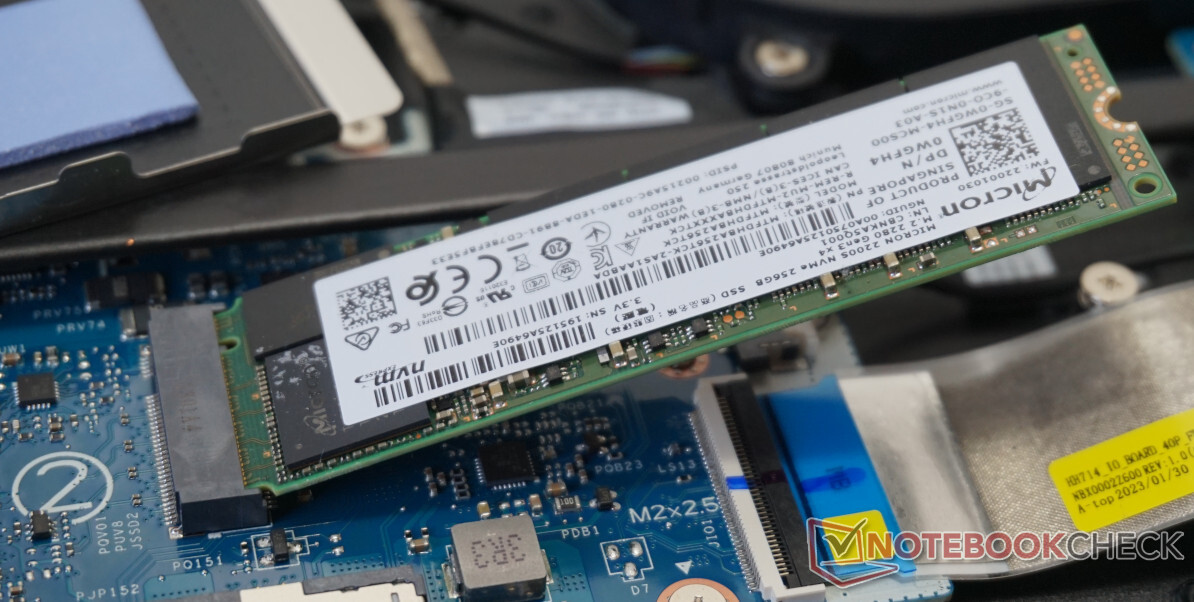
Uma rápida olhada no interior revela uma área grande e espaçosa. No entanto, o espaço livre disponível poderia ter sido usado um pouco melhor, especialmente na área ao redor da bateria, para algo como SSDs M.2. Os dois slots também são facilmente acessíveis. O segundo slot pode ser colocado em operação posteriormente e está claramente marcado com o número "2". O módulo Wi-Fi, os chips de memória e a bateria podem ser facilmente substituídos.
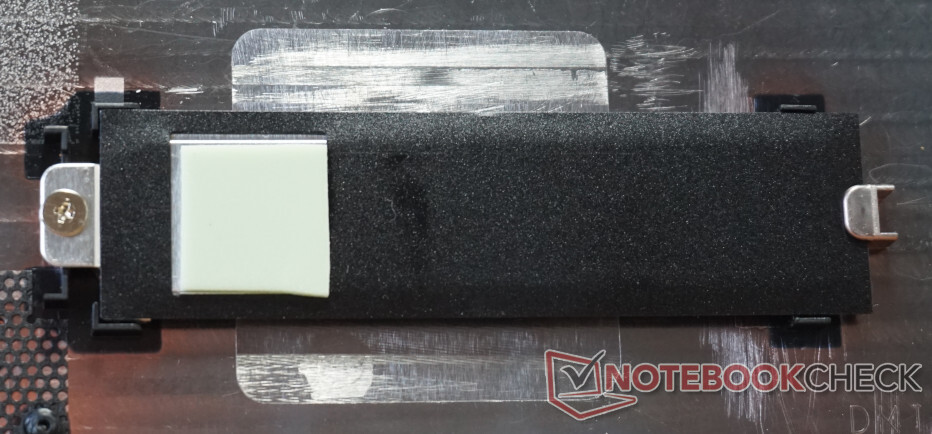
Um grande número de elementos de resfriamento passivo chama a atenção. A RAM sob a tampa é equipada com grandes almofadas térmicas. Além disso, há também uma almofada desse tipo no controlador da SSD, que entra em contato com um elemento de resfriamento na placa de base quando a tampa está fechada. Esse elemento e uma almofada térmica também são pré-montados para o segundo slot M.2.

Dispositivos de entrada
A experiência de digitação é agradável. Não é como um teclado mecânico, é claro, mas ele ainda apresenta um deslocamento de teclas de 1,5 mm (nossa medição), com resistência uniforme e tranquilizadora, bem como uma estrutura de teclado estável.
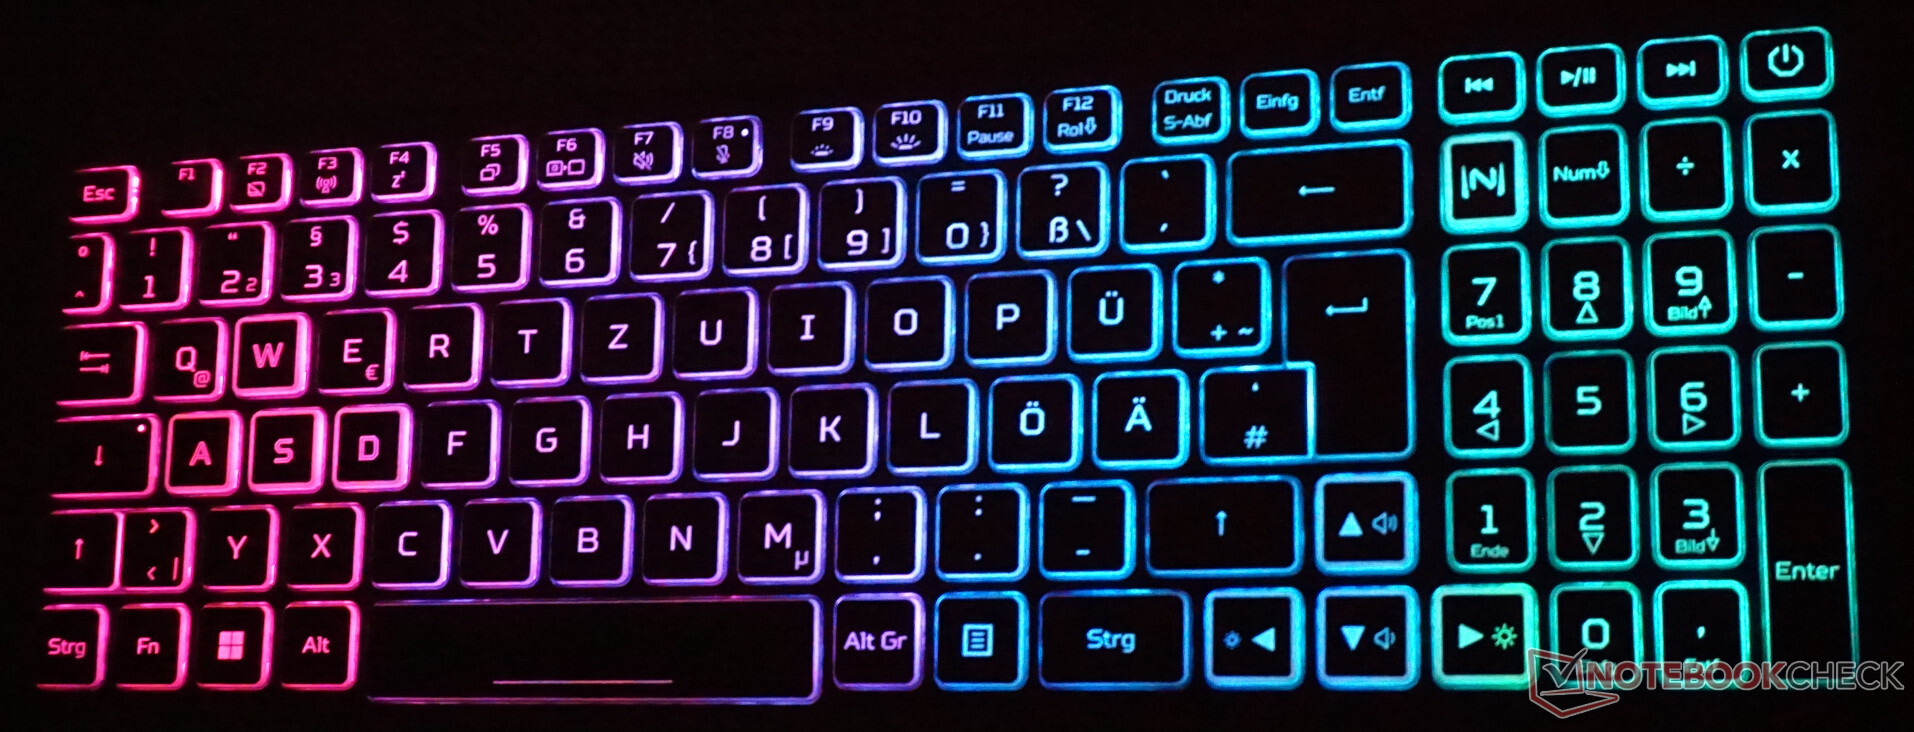
Além disso, o design visual também é bem feito: Graças às bordas brancas, as teclas se destacam umas das outras. As teclas de seta, "WASD" e uma tecla especial para o software "NitroSense" da Acer têm uma marcação adicional que facilita muito sua localização, especialmente com o canto do olho.
A iluminação colorida das teclas usa apenas quatro áreas personalizáveis. Ao mesmo tempo, um espectro de cores amplo e finamente graduado está disponível, tornando o efeito arco-íris, entre outras coisas, realmente eficaz.
O touchpad é muito menos impressionante e, com 10 x 8 cm, não é particularmente grande. As teclas ocultas nem sempre respondem imediatamente. Isso foi percebido várias vezes com representações imprecisas dos movimentos dos dedos. Entretanto, como acontece com a maioria dos laptops para jogos, isso não deve ocorrer durante os jogos.

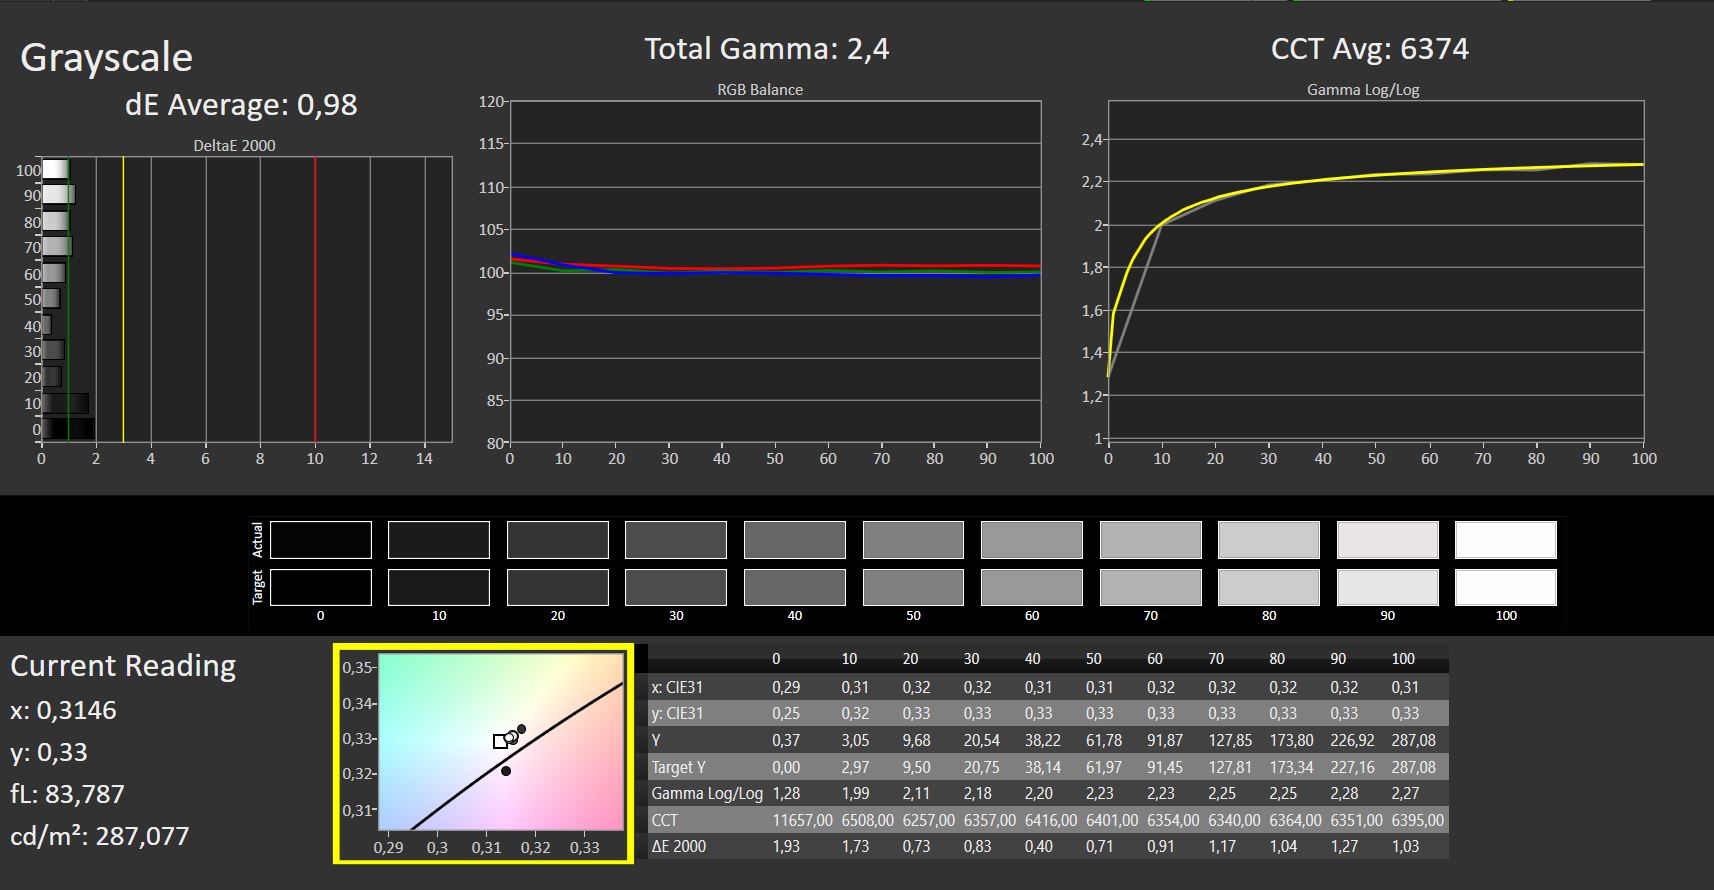
Tela - Muito escura e sem brilho para um laptop para jogos
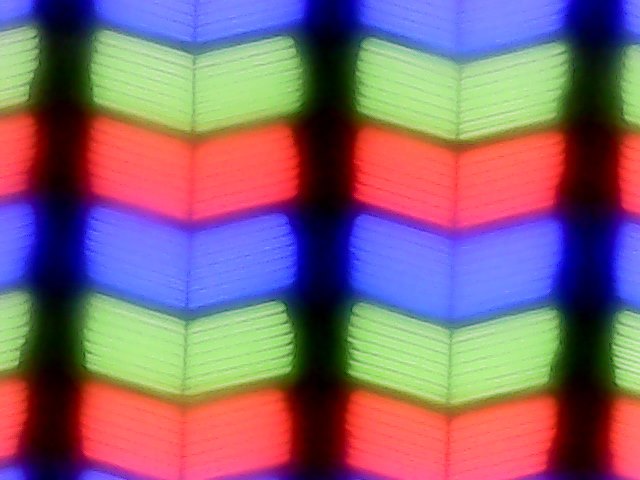

O painel IPS muito básico do Acer Nitro 5 quase nos faz lembrar de um monitor de escritório, se não fosse pela taxa de atualização de 144 Hz. E isso está em harmonia com a resolução Full HD, bem como com o desempenho gráfico limitado. Além disso, os tempos de resposta medidos também são decentes.
Infelizmente, todos os outros aspectos estão abaixo da média. Um brilho médio de quase 250 cd/m² e níveis de preto relativamente ruins resultam em contraste ruim. Ao visualizar uma imagem escura em uma sala escura, é possível observar um sangramento significativo da tela ao redor do monitor.
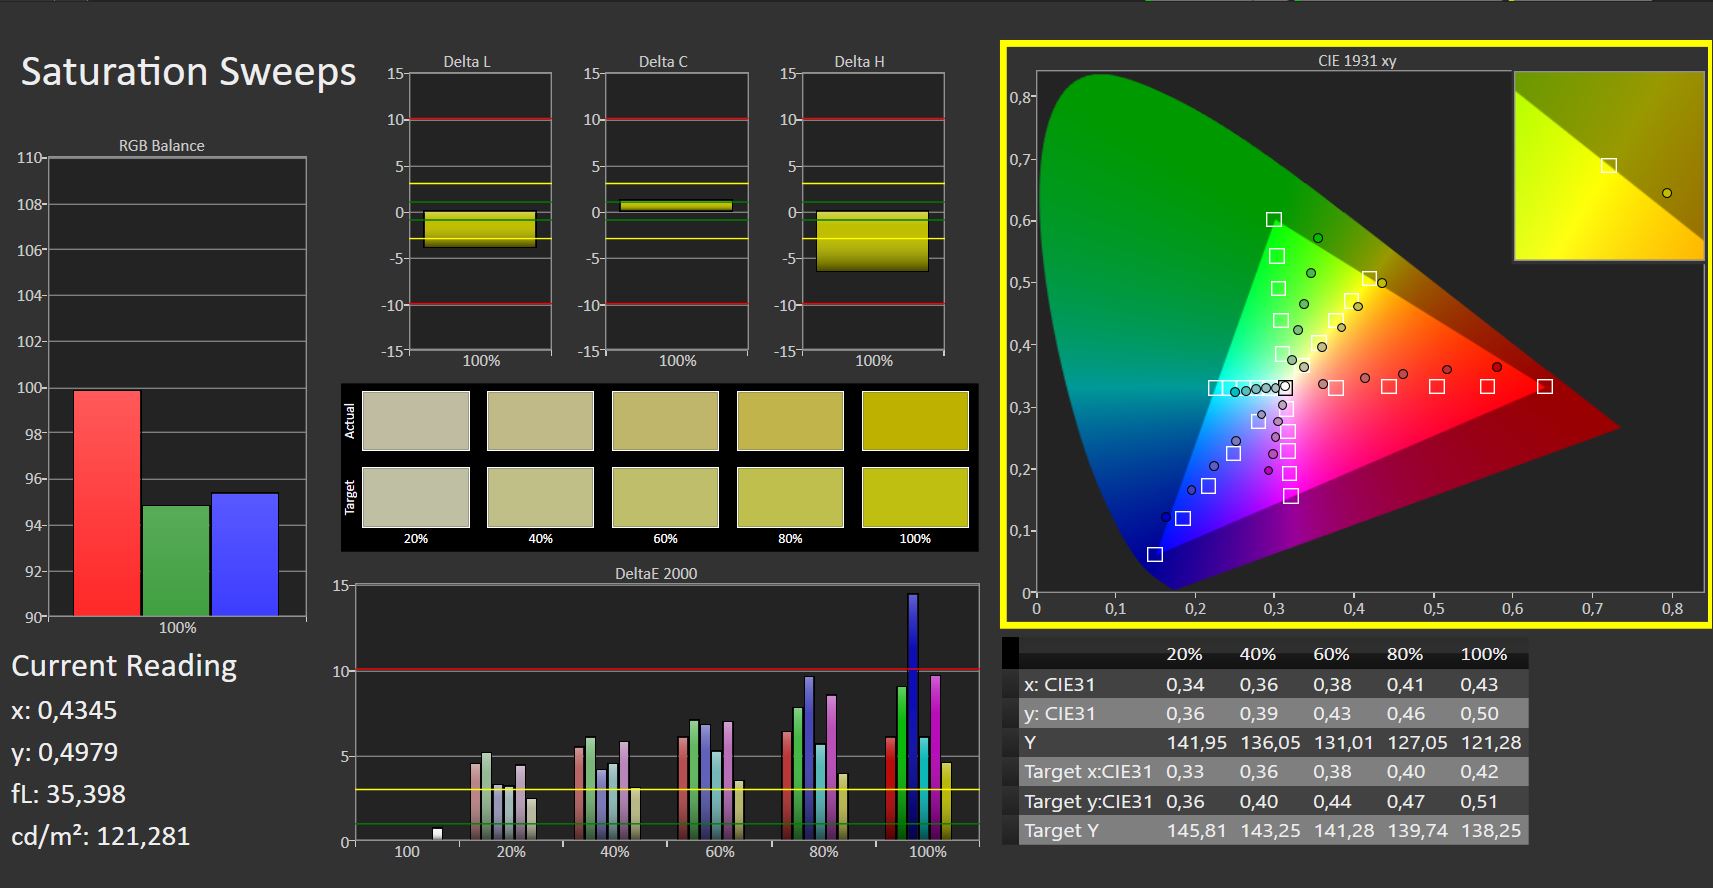
A variedade de cores, a precisão da reprodução de cores e a iluminação também são consistentemente ruins. Isso não afeta negativamente a reprodução de jogos, mas faz com que alguns efeitos não sejam tão atraentes.
Além disso, isso restringe a versatilidade do laptop. A tela não é uma opção séria, mesmo para fotógrafos amadores modestamente ambiciosos.
| |||||||||||||||||||||||||
iluminação: 81 %
iluminação com acumulador: 285 cd/m²
Contraste: 491:1 (Preto: 0.58 cd/m²)
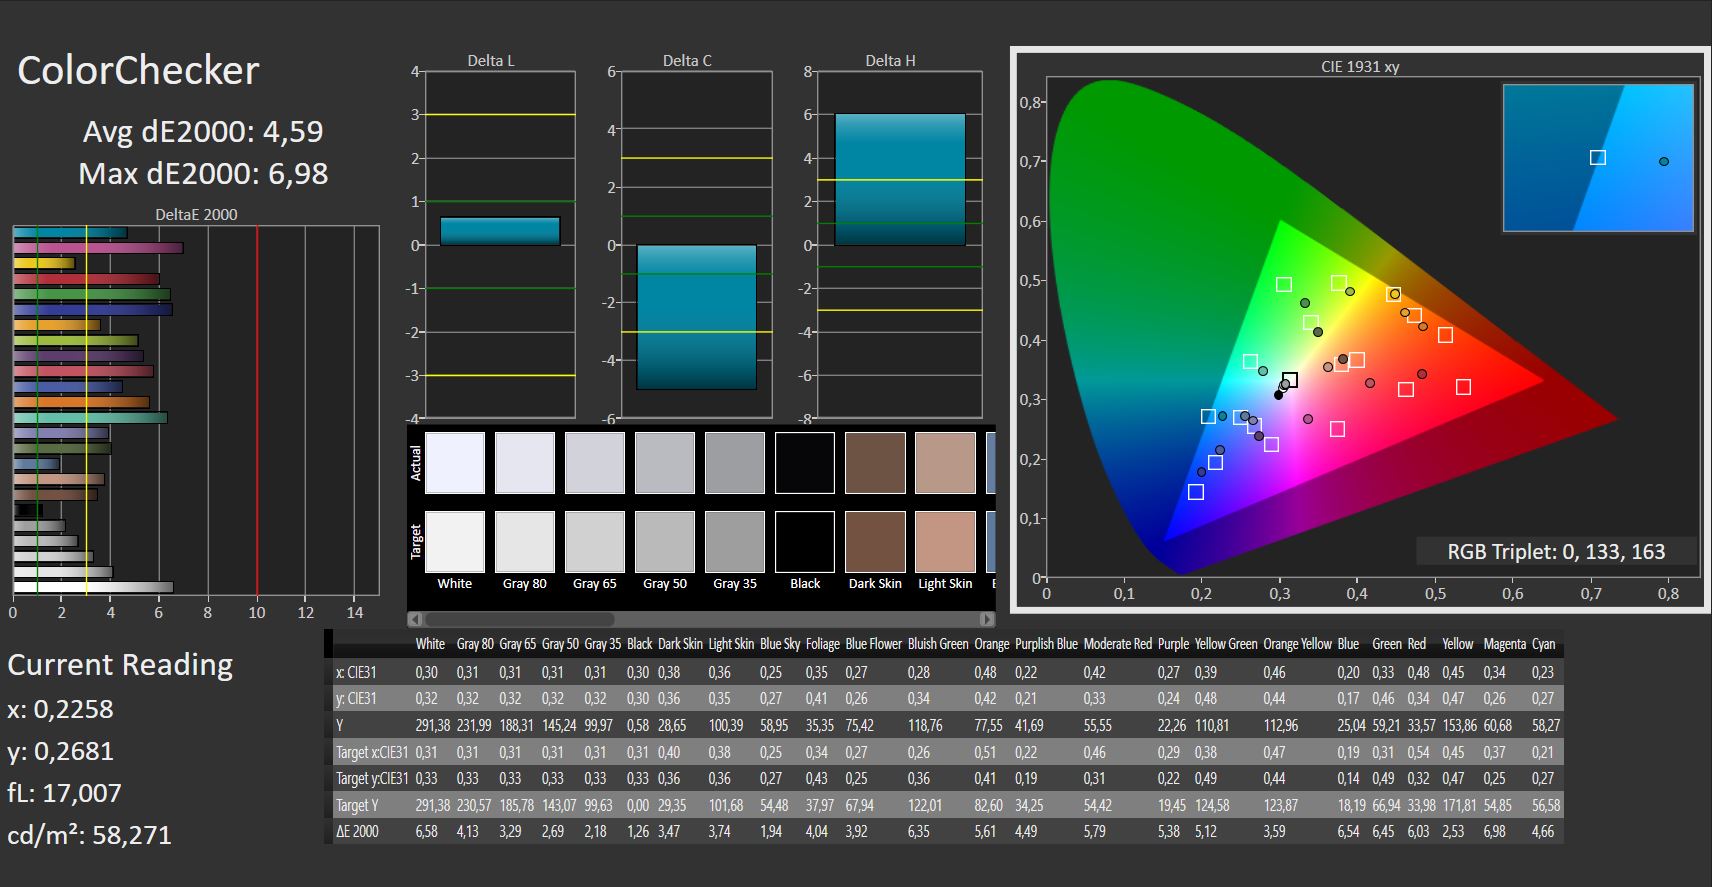
ΔE ColorChecker Calman: 4.59 | ∀{0.5-29.43 Ø4.71}
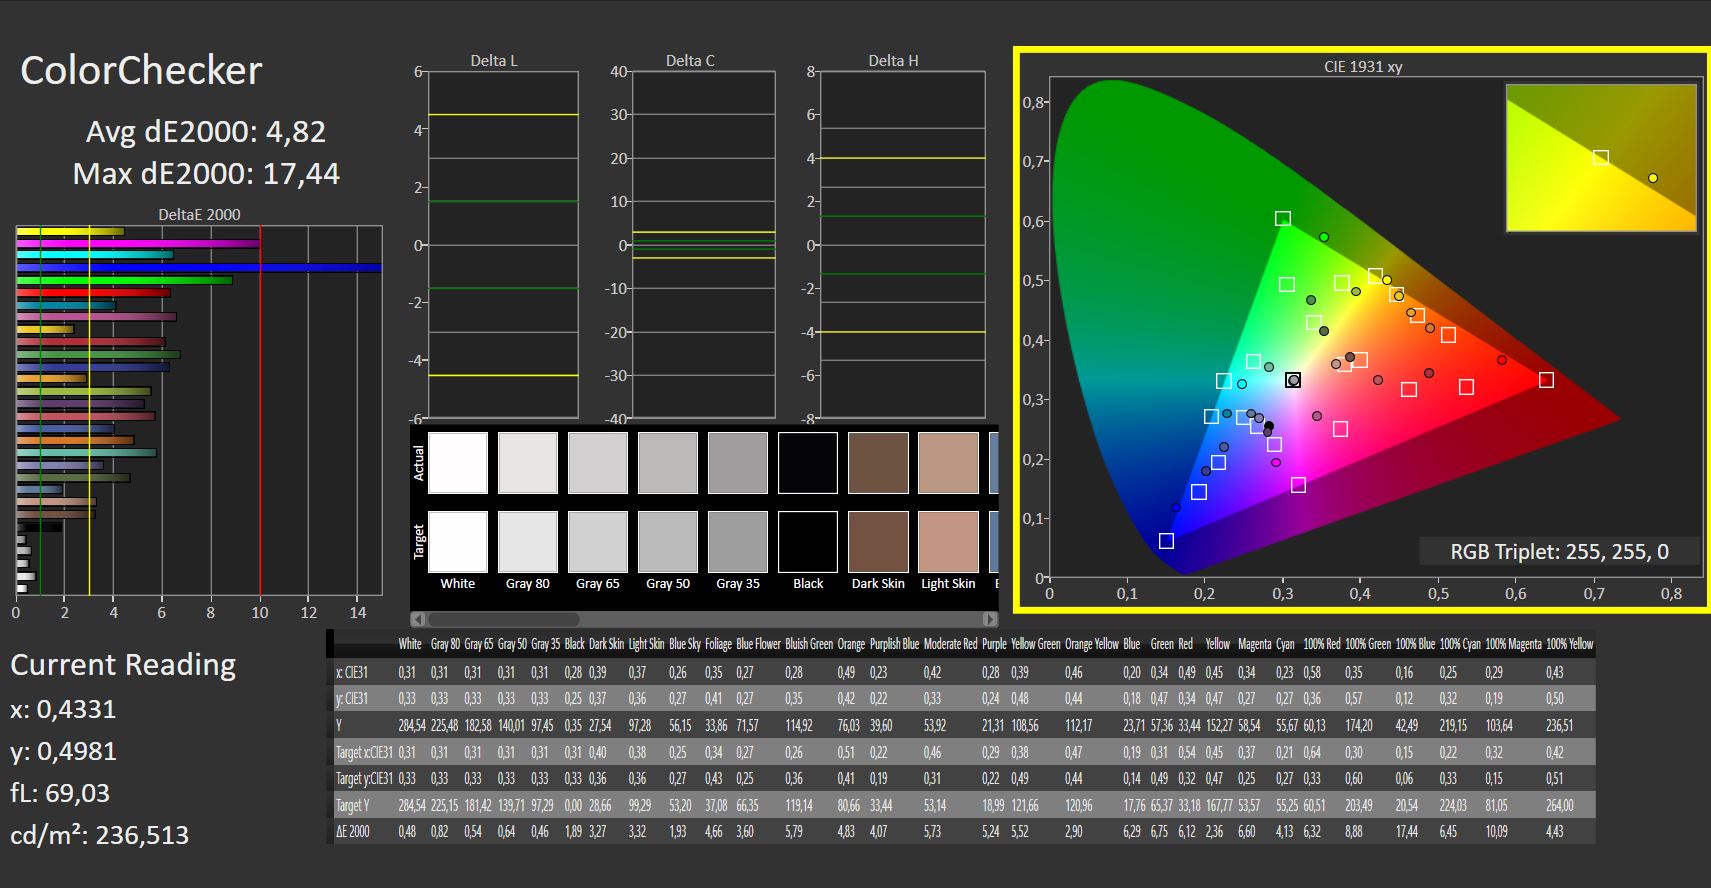
calibrated: 4.82
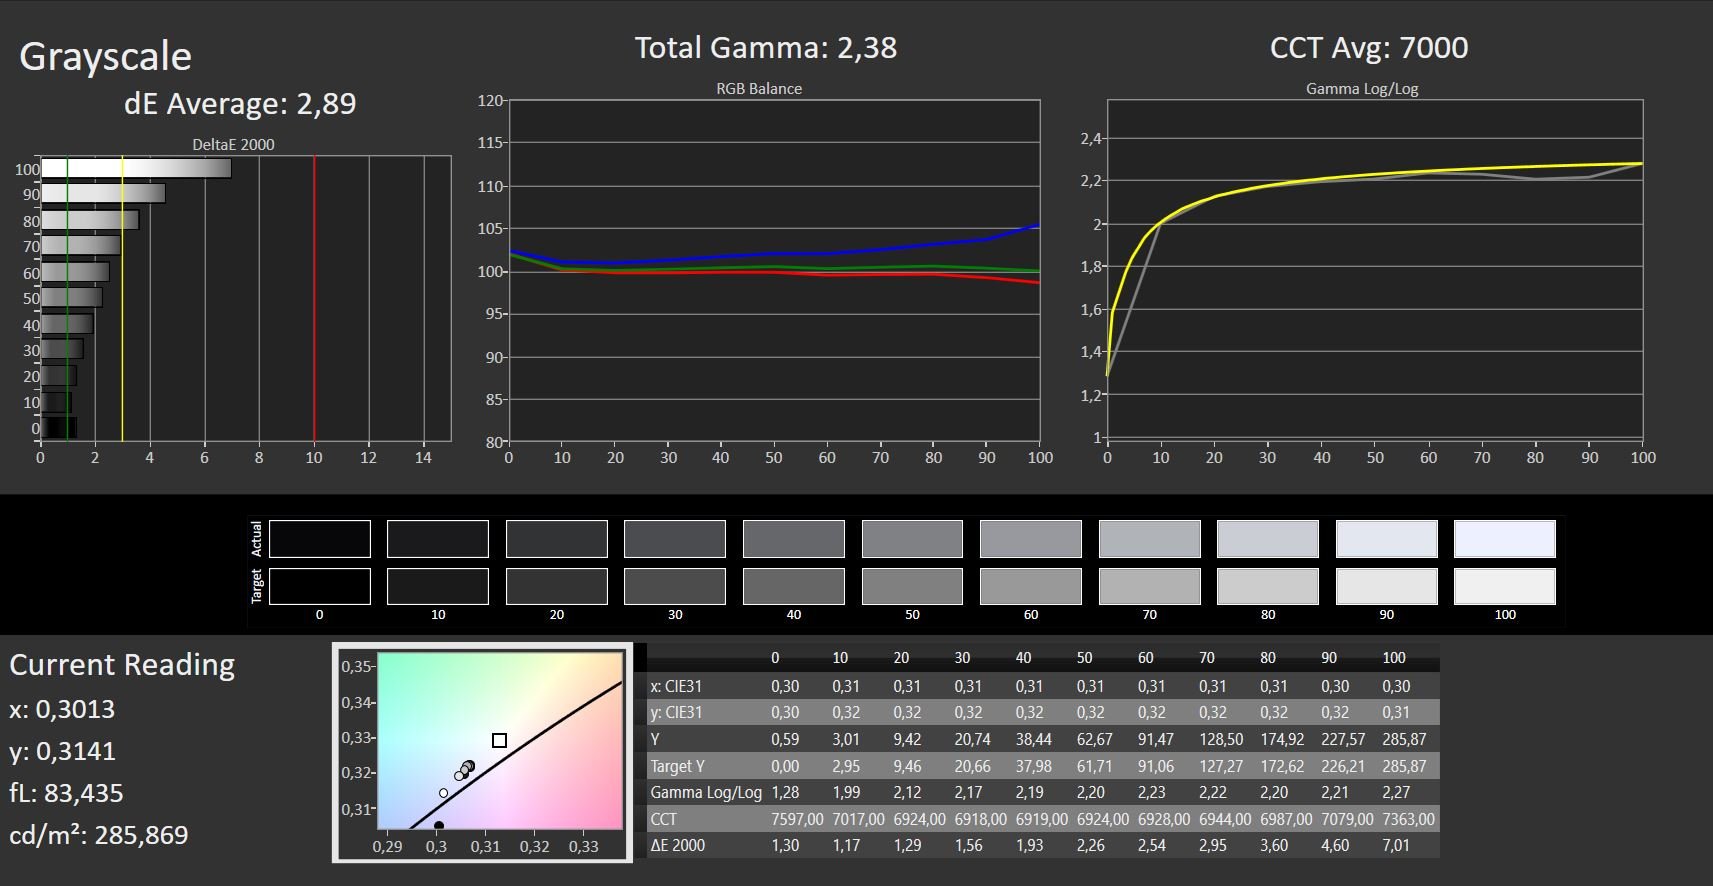
ΔE Greyscale Calman: 2.89 | ∀{0.09-98 Ø4.96}
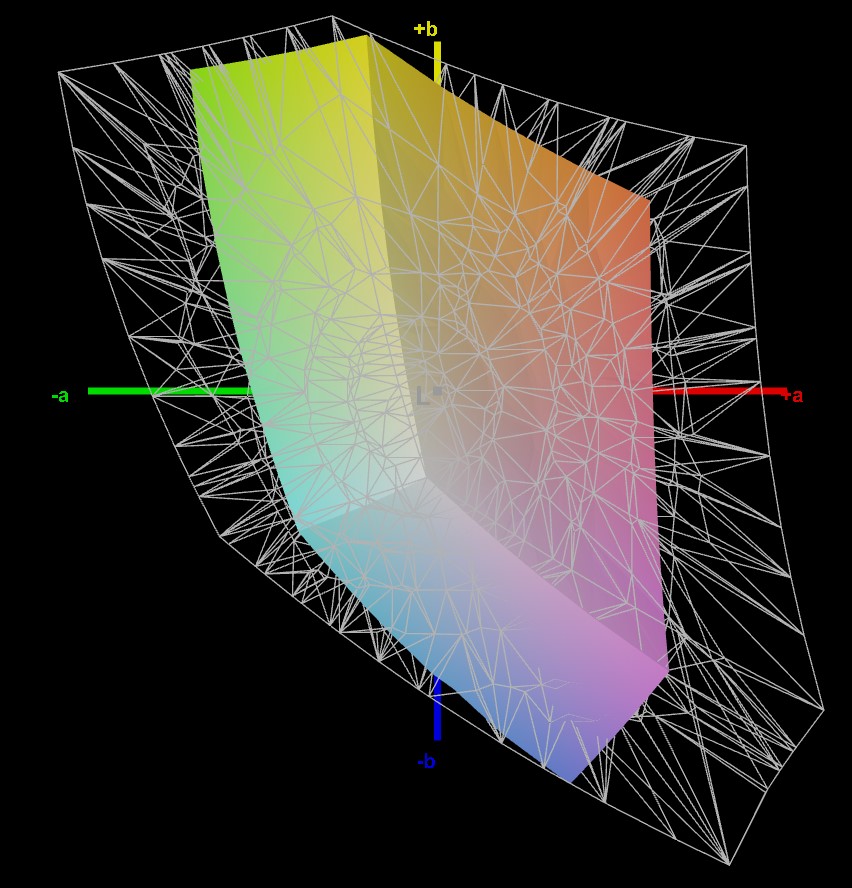
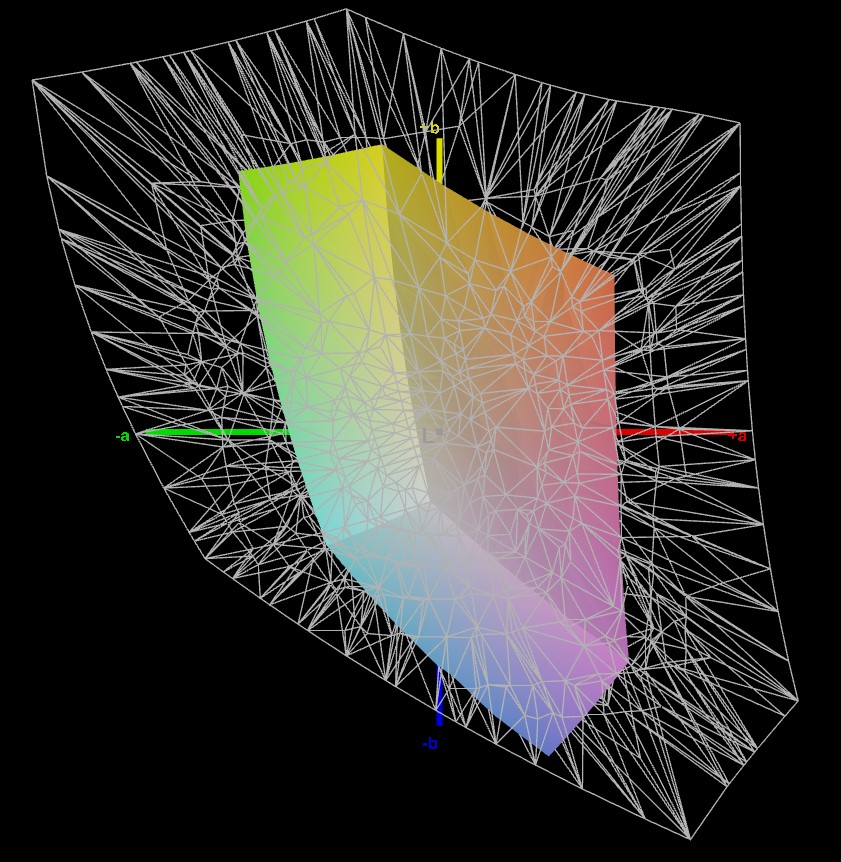
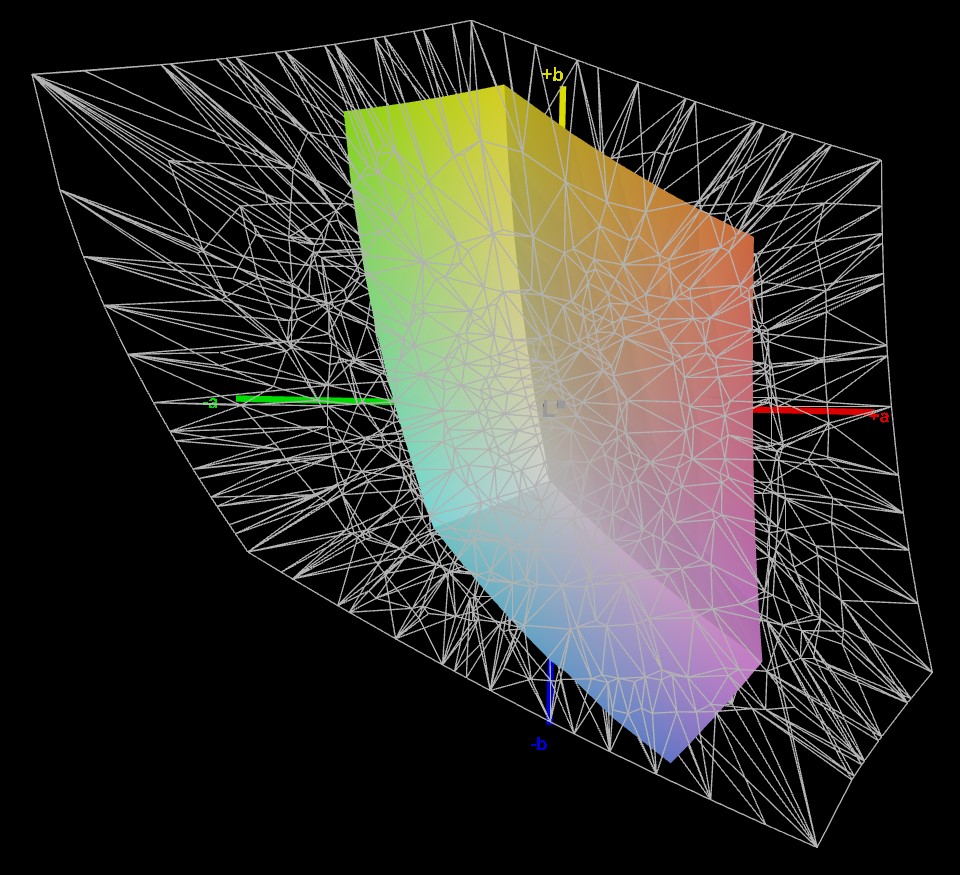
38.9% AdobeRGB 1998 (Argyll 3D)
56.4% sRGB (Argyll 3D)
37.6% Display P3 (Argyll 3D)
Gamma: 2.38
CCT: 7000 K
| Acer Nitro 5 AN517-55-5552 BOE0A6F NV173FHM-NX4, IPS, 1920x1080, 17.3" | Asus TUF Gaming A16 FA617XS BOE NE160WUM-NX2, IPS, 1920x1200, 16" | Acer Nitro 5 AN517-55-738R B173HAN04.0, IPS, 1920x1080, 17.3" | Medion Erazer Scout E20 LG Philips LGD0611, IPS, 1920x1080, 17.3" | MSI Katana 15 B12VEK AUOAF90 (B156HAN08.4), IPS, 1920x1080, 15.6" | MSI Cyborg 15 A12VF AU Optronics B156HAN15.1, IPS, 1920x1080, 15.6" | |
|---|---|---|---|---|---|---|
| Display | 80% | 55% | 72% | 1% | 12% | |
| Display P3 Coverage (%) | 37.6 | 69.3 84% | 58.9 57% | 65.1 73% | 38.1 1% | 42.3 12% |
| sRGB Coverage (%) | 56.4 | 97.3 73% | 86.4 53% | 96.7 71% | 56.8 1% | 62.6 11% |
| AdobeRGB 1998 Coverage (%) | 38.9 | 70.7 82% | 60.5 56% | 66.5 71% | 39.3 1% | 43.7 12% |
| Response Times | 21% | 55% | 22% | -104% | -11% | |
| Response Time Grey 50% / Grey 80% * (ms) | 18 ? | 15.6 ? 13% | 6 ? 67% | 14.8 ? 18% | 38.8 ? -116% | 22 ? -22% |
| Response Time Black / White * (ms) | 14 ? | 10 ? 29% | 8 ? 43% | 10.4 ? 26% | 26.8 ? -91% | 14 ? -0% |
| PWM Frequency (Hz) | ||||||
| Screen | 55% | 24% | 41% | 3% | 24% | |
| Brightness middle (cd/m²) | 285 | 301 6% | 286 0% | 312 9% | 261 -8% | 247 -13% |
| Brightness (cd/m²) | 257 | 294 14% | 278 8% | 303 18% | 258 0% | 234 -9% |
| Brightness Distribution (%) | 81 | 94 16% | 89 10% | 91 12% | 92 14% | 89 10% |
| Black Level * (cd/m²) | 0.58 | 0.21 64% | 0.32 45% | 0.25 57% | 0.19 67% | 0.25 57% |
| Contrast (:1) | 491 | 1433 192% | 894 82% | 1248 154% | 1374 180% | 988 101% |
| Colorchecker dE 2000 * | 4.59 | 1.79 61% | 3.05 34% | 2.65 42% | 5.57 -21% | 3.78 18% |
| Colorchecker dE 2000 max. * | 6.98 | 3.48 50% | 5.83 16% | 6.44 8% | 20.6 -195% | 6.42 8% |
| Colorchecker dE 2000 calibrated * | 4.82 | 1.2 75% | 3.13 35% | 0.96 80% | 4.63 4% | 3.94 18% |
| Greyscale dE 2000 * | 2.89 | 2.5 13% | 3.17 -10% | 3.2 -11% | 3.19 -10% | 2.16 25% |
| Gamma | 2.38 92% | 2.265 97% | 2.29 96% | 2.246 98% | 2.45 90% | 2.33 94% |
| CCT | 7000 93% | 6157 106% | 6916 94% | 7258 90% | 6146 106% | 6906 94% |
| Média Total (Programa/Configurações) | 52% /
55% | 45% /
35% | 45% /
45% | -33% /
-12% | 8% /
16% |
* ... menor é melhor
A tela pode exibir aproximadamente mais da metade do sRGB, o espaço de cores normalmente usado em jogos. Como resultado, a gradação de cores finas, como uma representação do céu, pode acabar parecendo um bloco. Seria correto esperar uma cobertura pelo menos quase completa do sRGB, como visto no antecessor, oNitro 5 AN517-55-738R. Mas, infelizmente, esse não é o caso aqui. É bom o suficiente para jogos, mas ainda assim é decepcionante.
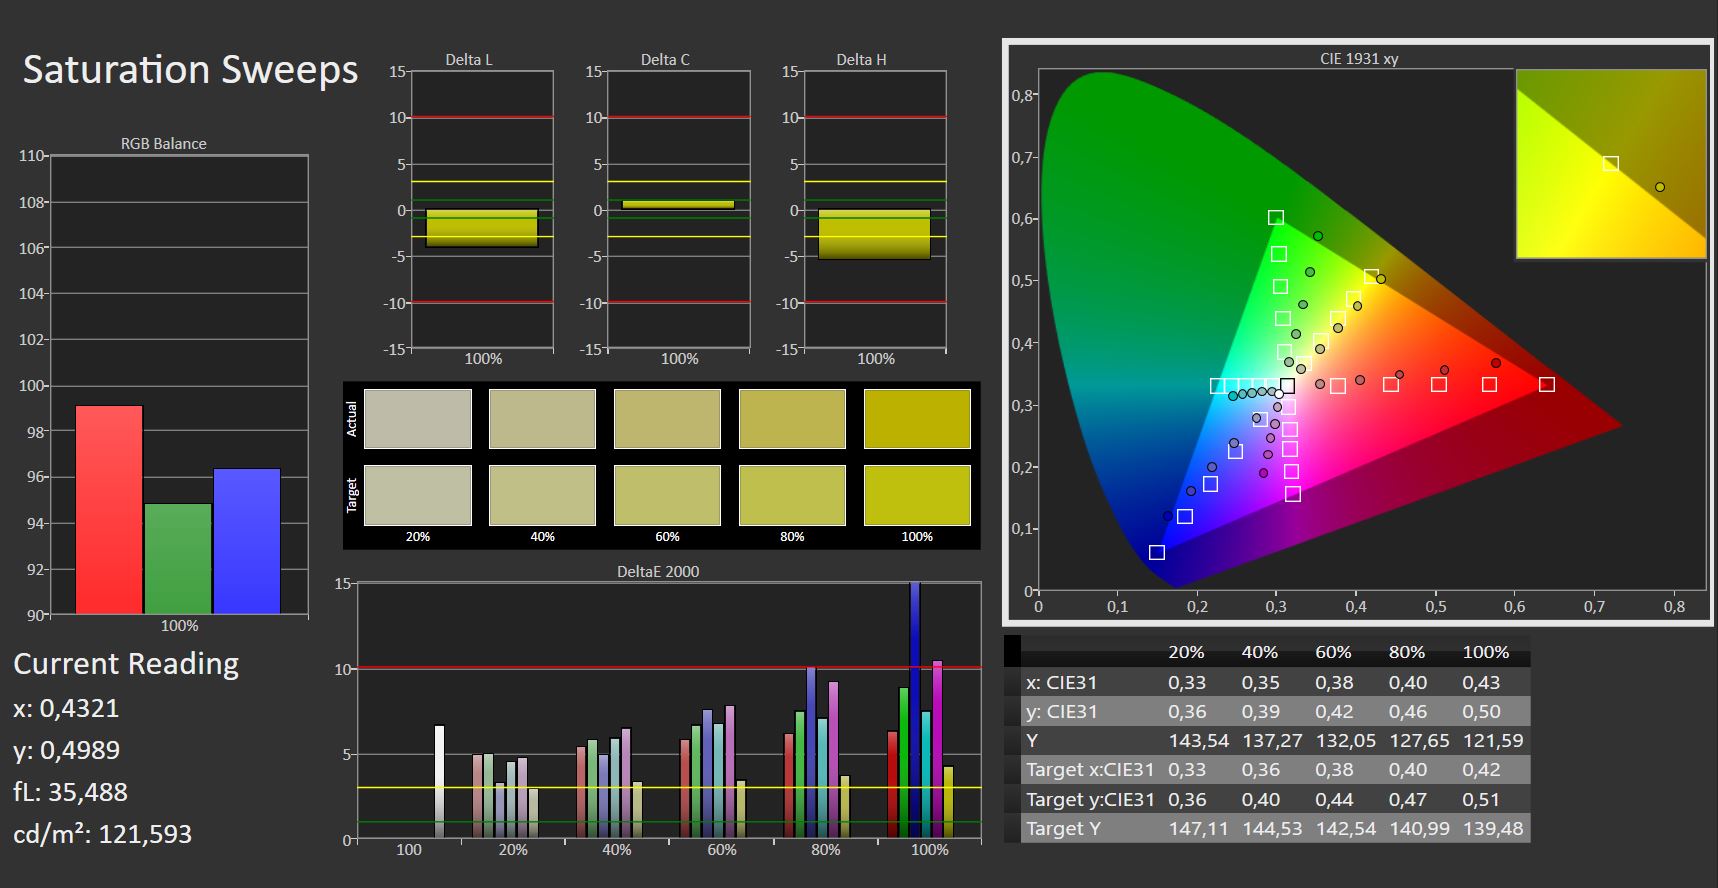
Medimos um desvio na reprodução de cores, especialmente quando se tratava de tons azuis, e isso também era visível para olhos menos experientes. No entanto, não se poderia esperar um resultado melhor, tendo em vista a má reprodução geral das cores. Um DeltaE médio de pouco menos de 5, que não pode ser melhorado por meio de calibração, é bastante decente, se o foco for basicamente apenas os jogos.
Exibir tempos de resposta
| ↔ Tempo de resposta preto para branco | ||
|---|---|---|
| 14 ms ... ascensão ↗ e queda ↘ combinadas | ↗ 7 ms ascensão |  |
| ↘ 7 ms queda | ||
| A tela mostra boas taxas de resposta em nossos testes, mas pode ser muito lenta para jogadores competitivos. Em comparação, todos os dispositivos testados variam de 0.1 (mínimo) a 240 (máximo) ms. » 34 % de todos os dispositivos são melhores. Isso significa que o tempo de resposta medido é melhor que a média de todos os dispositivos testados (19.8 ms). | ||
| ↔ Tempo de resposta 50% cinza a 80% cinza | ||
| 18 ms ... ascensão ↗ e queda ↘ combinadas | ↗ 8 ms ascensão |  |
| ↘ 10 ms queda | ||
| A tela mostra boas taxas de resposta em nossos testes, mas pode ser muito lenta para jogadores competitivos. Em comparação, todos os dispositivos testados variam de 0.165 (mínimo) a 636 (máximo) ms. » 32 % de todos os dispositivos são melhores. Isso significa que o tempo de resposta medido é melhor que a média de todos os dispositivos testados (31 ms). | ||
Cintilação da tela / PWM (modulação por largura de pulso)
| Tela tremeluzindo / PWM não detectado |  | ||
[pwm_comparison] Em comparação: 52 % de todos os dispositivos testados não usam PWM para escurecer a tela. Se PWM foi detectado, uma média de 7754 (mínimo: 5 - máximo: 343500) Hz foi medida. | |||
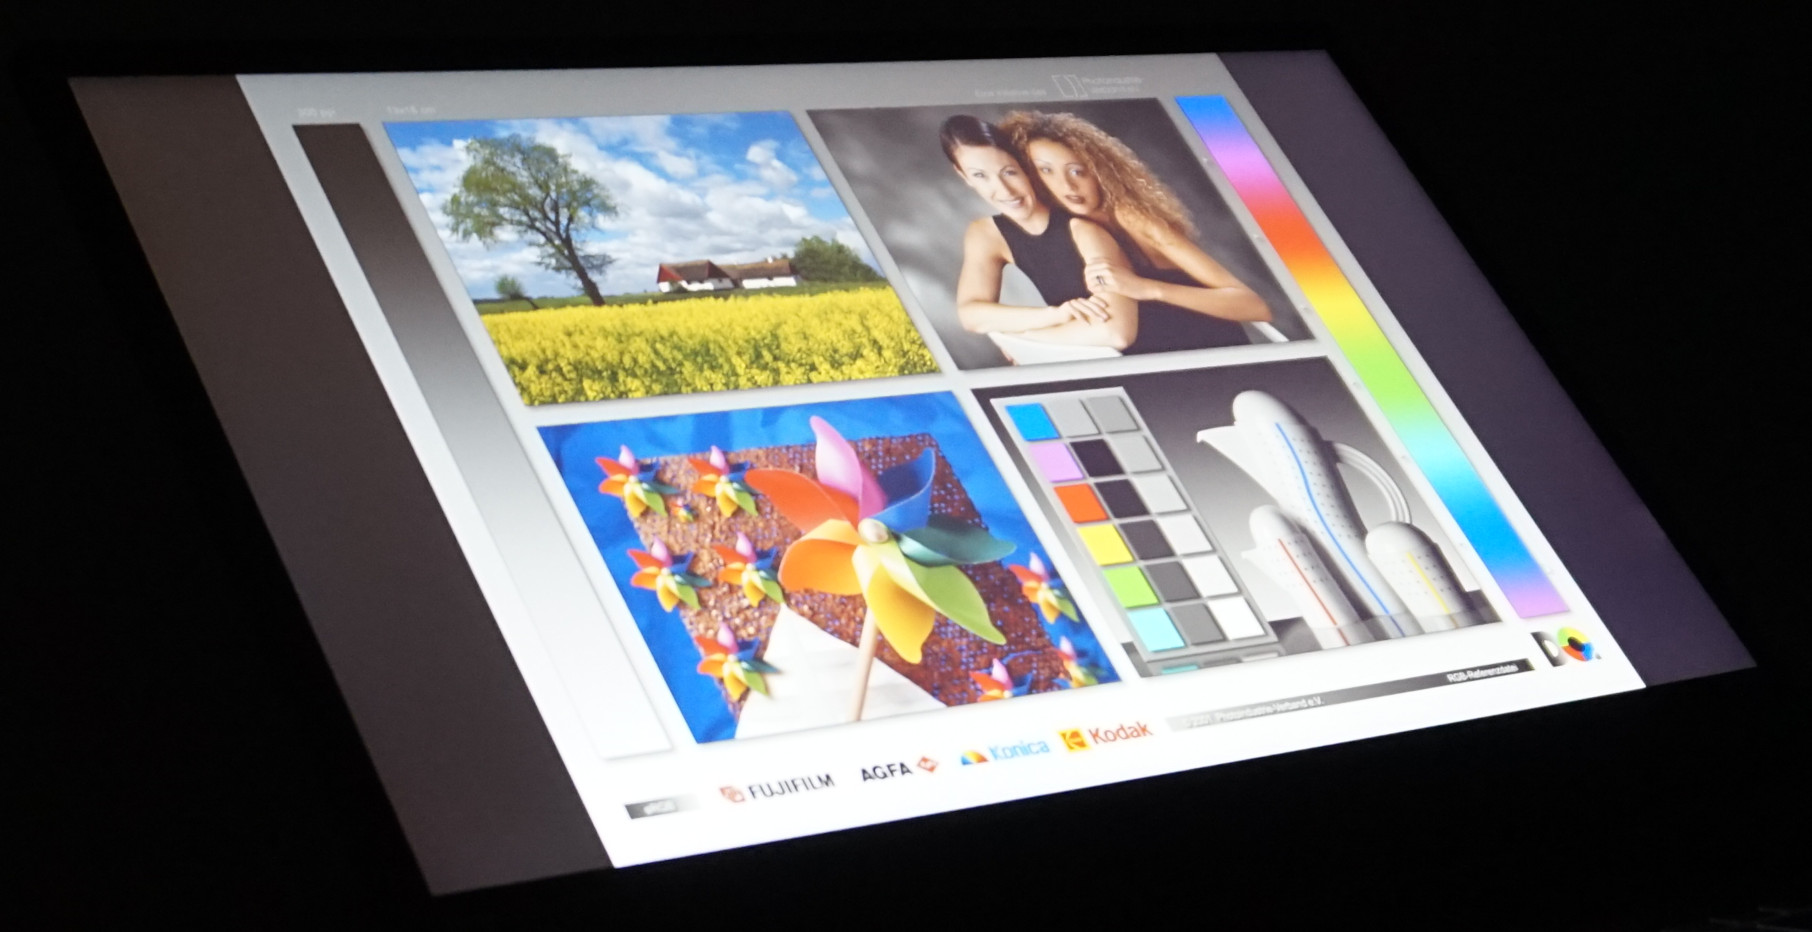
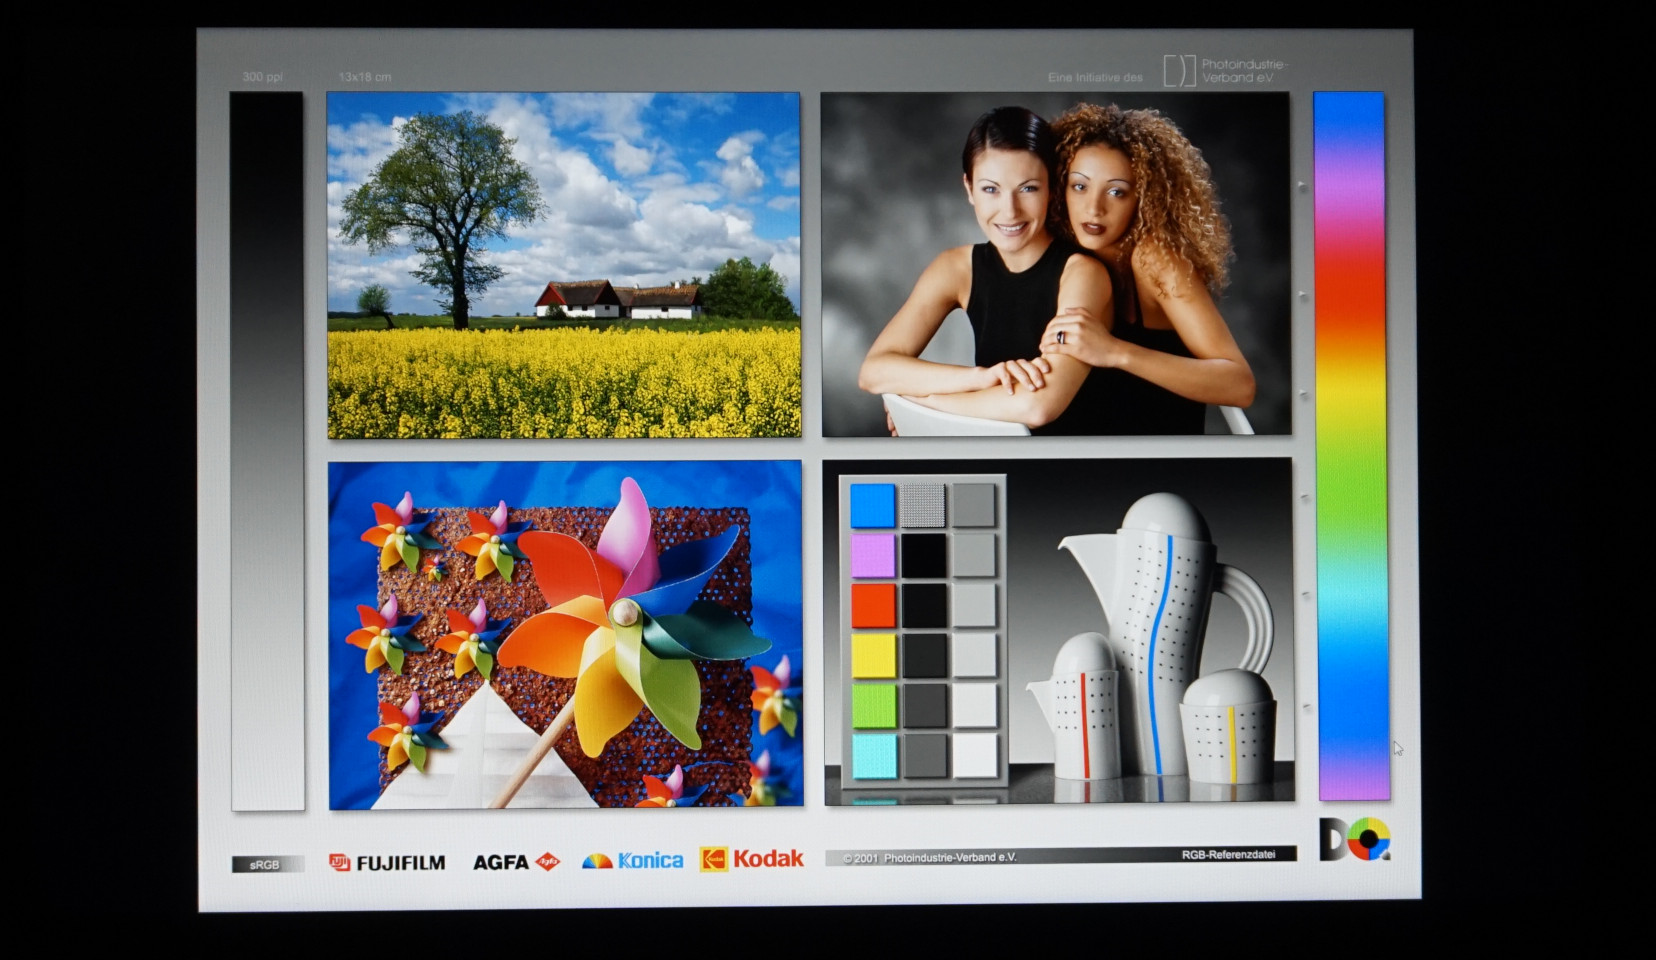
Na sombra, as fotos e o texto são claramente legíveis, embora um pouco acinzentados. Assim que a luz do sol incide sobre a tela ou o céu é refletido por trás, até mesmo o texto pode ser difícil de decifrar.


A decepção com a tela não diminuiu quando passamos para os ângulos de visão: Em um ângulo de cerca de 45°, são visíveis distorções significativas de cores, mudando para amarelo ou azul. Para um painel IPS, esse desempenho é excepcionalmente ruim.

Desempenho - O Acer Nitro 517 é impressionante, mas apenas graças à RTX 4050
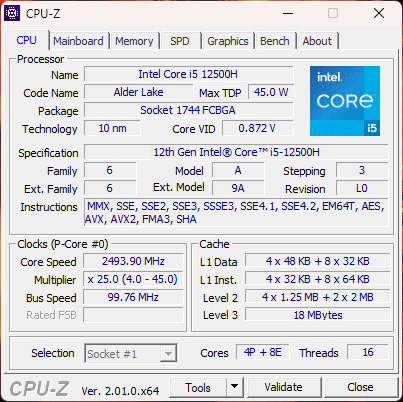
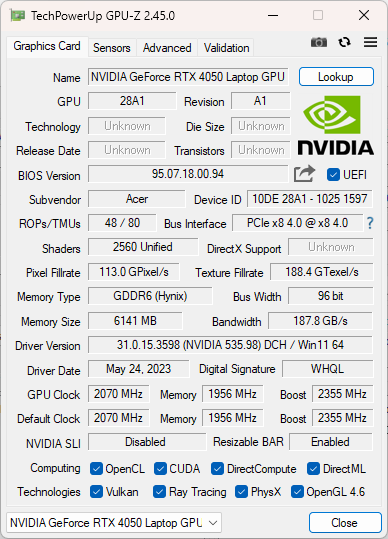
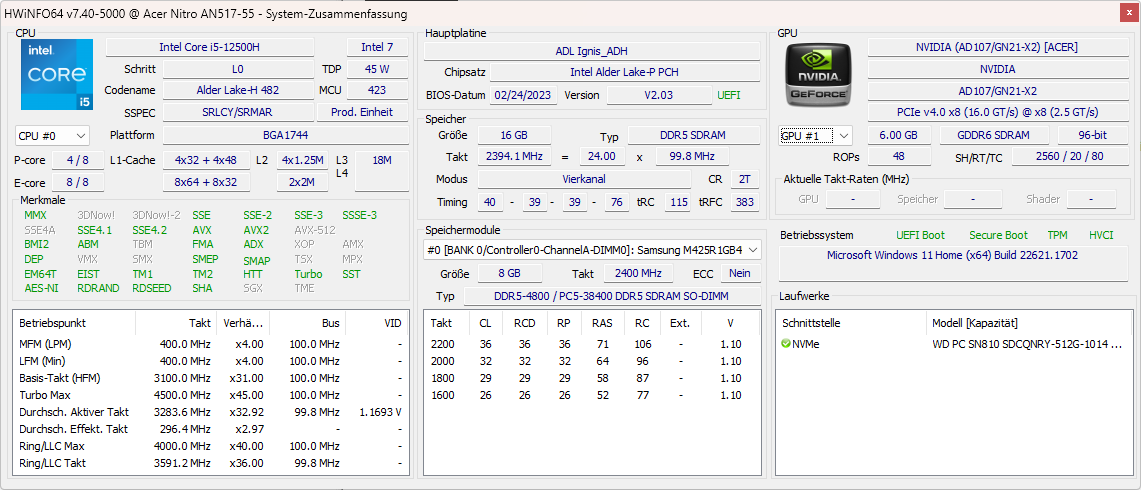
Com a menor GPU da série RTX 4000, a RTX 4050o Nitro pertence à classe de laptops para jogos de nível básico. Ele é acompanhado por um chip já lançado no início de 2022, o Intel Core i5-12500H. Ele não era um modelo de ponta, mesmo quando foi lançado, mas ainda oferece potência computacional suficiente para o uso pretendido. Além disso, ambos os componentes podem ser fornecidos com muita energia, pelo menos no papel. A CPU consome até 115 watts e a GPU chega a 140 watts com aumento dinâmico.
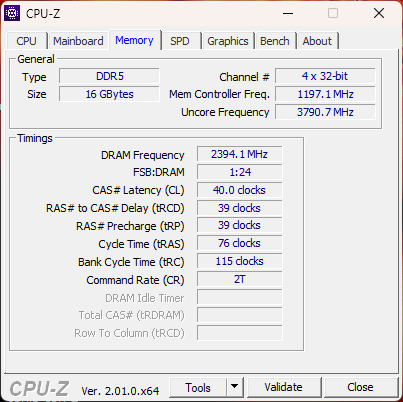
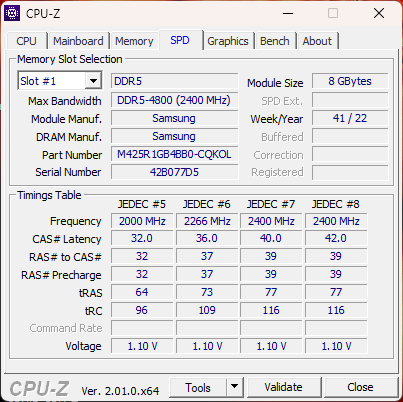
Além disso, temos 16 GB de RAM DDR5 4800 da Samsung, que é suficientemente rápida para altas taxas de quadros em jogos menos exigentes. Para jogos em Full HD, o básico parece ser relativamente coerente, desde que você possa viver sem um ou dois detalhes aqui ou ali.
Condições de teste
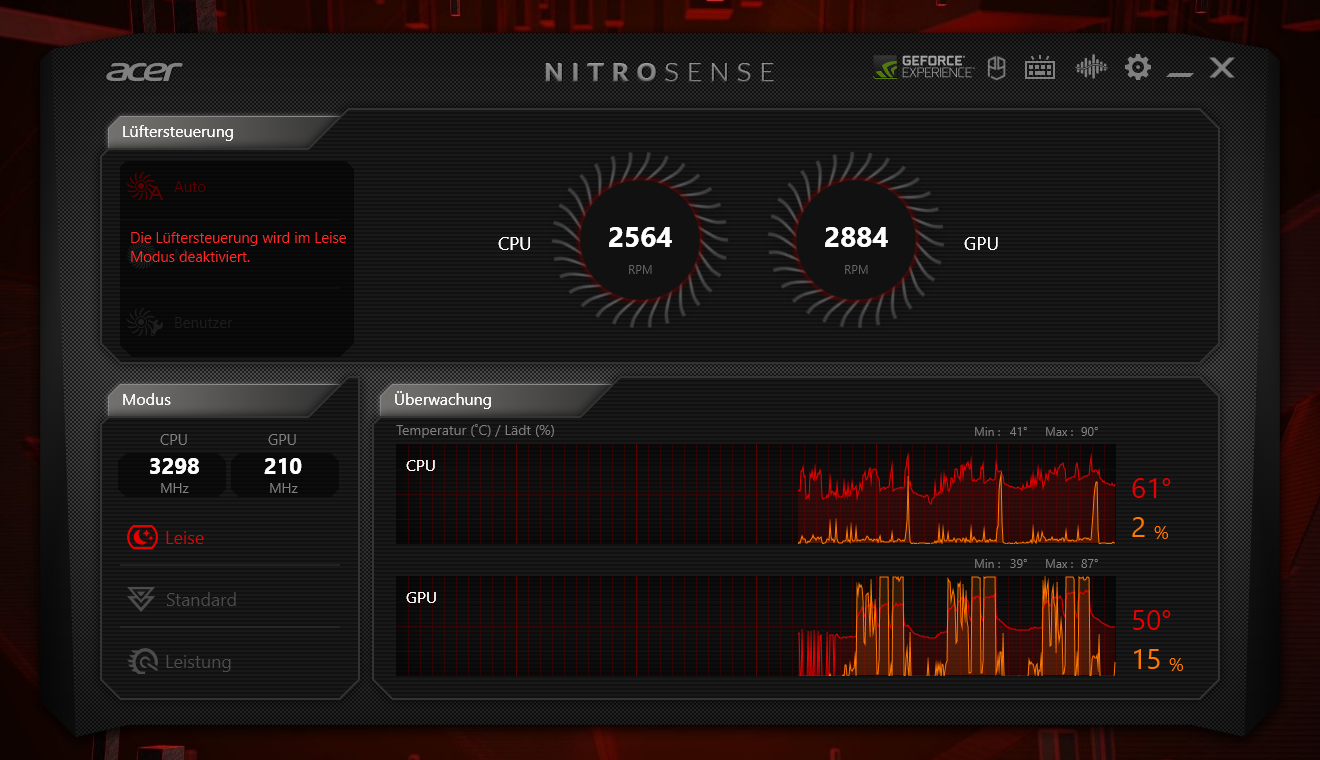
O software de controle "NitroSense" fornecido pela Acer pode ser acessado por meio de um botão designado e permite o acesso às várias configurações do modo de desempenho, bem como ao gerenciamento da ventoinha. Além disso, a iluminação das teclas pode ser ajustada, os perfis de som dos alto-falantes podem ser selecionados e algumas configurações básicas podem ser feitas.
Para nossos testes de jogos e benchmarks, selecionamos o perfil "Performance" e mantivemos a ventoinha automática. Usando o perfil "Standard", os níveis de ruído são reduzidos substancialmente e, no modo "Quiet", o volume do som de resfriamento diminui ainda mais, mas permanece continuamente audível.
| Desempenho | Padrão | Silencioso | Modo de bateria | |
| PL1 | 95 watts | 80 watts | 80 watts | 70 watts |
| PL2 | 115 watts | 115 watts | 115 watts | 115 watts |
Processador
O Intel Core i5-12500Hé um processador pequeno - pelo menos para um laptop para jogos - e oferece doze núcleos, dos quais quatro são núcleos de desempenho e oito núcleos de eficiência com um total de 16 threads. Isso é suficiente para multitarefa de alto nível. O laptop ainda é fácil de usar, mesmo com programas exigentes. A velocidade máxima do clock é de apenas 4,5 GHz e, com 18 MB, o cache L3 não é muito grande.
Apesar dessas especificações modestas, o loop do Cinebench R15 funcionou muito bem. Por exemplo, oMedion Erazer Defender P40consegue 30% a mais no início com seu processador consideravelmente mais rápido i7-13700HX. No final do ciclo, a vantagem não chega nem a 10%. É nesse ponto que o resfriamento generoso vem à tona e pode ser visto na série de medições quase sem alterações. O processador pode consumir 95 watts por um período mais longo e 115 watts por períodos curtos sem um aumento drástico nas temperaturas.
Também no modo "Silencioso" (a linha verde no loop do Cinebench) - durante o qual os ruídos perturbadores eram quase inaudíveis - foram obtidos resultados sólidos que, em média, estavam no mesmo nível doMSI Cyborg 15 A12VF. O Nitro consome menos energia, apesar de o MSI ter uma CPU maior. O fato de o Nitro 5 continuar a ter um bom desempenho aqui se deve a uma redução para 70 watts, enquanto o breve máximo de 115 watts permanece inalterado. Nos modos "Padrão" e de bateria, o limite de energia é de 80 watts.
Outros benchmarks e informações podem ser encontrados aqui em nossaLista de benchmarks de CPU.
Cinebench R15 Multi continuous test
Cinebench R23: Multi Core | Single Core
Cinebench R20: CPU (Multi Core) | CPU (Single Core)
Cinebench R15: CPU Multi 64Bit | CPU Single 64Bit
Blender: v2.79 BMW27 CPU
7-Zip 18.03: 7z b 4 | 7z b 4 -mmt1
Geekbench 5.5: Multi-Core | Single-Core
HWBOT x265 Benchmark v2.2: 4k Preset
LibreOffice : 20 Documents To PDF
R Benchmark 2.5: Overall mean
| CPU Performance rating | |
| Média da turma Gaming | |
| Asus TUF Gaming A16 FA617XS | |
| Medion Erazer Scout E20 | |
| MSI Cyborg 15 A12VF | |
| MSI Katana 15 B12VEK | |
| Acer Nitro 5 AN517-55-738R | |
| Acer Nitro 5 AN517-55-5552 | |
| Média Intel Core i5-12500H | |
| Cinebench R23 / Multi Core | |
| Média da turma Gaming (10488 - 42661, n=107, últimos 2 anos) | |
| Asus TUF Gaming A16 FA617XS | |
| Medion Erazer Scout E20 | |
| MSI Katana 15 B12VEK | |
| MSI Cyborg 15 A12VF | |
| Acer Nitro 5 AN517-55-5552 | |
| Acer Nitro 5 AN517-55-738R | |
| Média Intel Core i5-12500H (11330 - 14686, n=9) | |
| Cinebench R23 / Single Core | |
| Média da turma Gaming (1166 - 2415, n=107, últimos 2 anos) | |
| Medion Erazer Scout E20 | |
| Acer Nitro 5 AN517-55-738R | |
| Asus TUF Gaming A16 FA617XS | |
| MSI Cyborg 15 A12VF | |
| MSI Katana 15 B12VEK | |
| Média Intel Core i5-12500H (1558 - 1701, n=9) | |
| Acer Nitro 5 AN517-55-5552 | |
| Cinebench R20 / CPU (Multi Core) | |
| Média da turma Gaming (4029 - 16433, n=106, últimos 2 anos) | |
| Asus TUF Gaming A16 FA617XS | |
| Medion Erazer Scout E20 | |
| Acer Nitro 5 AN517-55-738R | |
| MSI Katana 15 B12VEK | |
| MSI Cyborg 15 A12VF | |
| Acer Nitro 5 AN517-55-5552 | |
| Média Intel Core i5-12500H (4687 - 5640, n=9) | |
| Cinebench R20 / CPU (Single Core) | |
| Média da turma Gaming (442 - 913, n=106, últimos 2 anos) | |
| Medion Erazer Scout E20 | |
| Asus TUF Gaming A16 FA617XS | |
| Acer Nitro 5 AN517-55-738R | |
| MSI Cyborg 15 A12VF | |
| MSI Katana 15 B12VEK | |
| Média Intel Core i5-12500H (602 - 656, n=9) | |
| Acer Nitro 5 AN517-55-5552 | |
| Cinebench R15 / CPU Multi 64Bit | |
| Média da turma Gaming (1578 - 6330, n=105, últimos 2 anos) | |
| Medion Erazer Scout E20 | |
| Asus TUF Gaming A16 FA617XS | |
| Acer Nitro 5 AN517-55-738R | |
| MSI Katana 15 B12VEK | |
| Acer Nitro 5 AN517-55-5552 | |
| MSI Cyborg 15 A12VF | |
| Média Intel Core i5-12500H (1970 - 2283, n=10) | |
| Cinebench R15 / CPU Single 64Bit | |
| Média da turma Gaming (188.8 - 350, n=106, últimos 2 anos) | |
| Asus TUF Gaming A16 FA617XS | |
| Medion Erazer Scout E20 | |
| Acer Nitro 5 AN517-55-738R | |
| MSI Katana 15 B12VEK | |
| MSI Cyborg 15 A12VF | |
| Média Intel Core i5-12500H (220 - 250, n=9) | |
| Acer Nitro 5 AN517-55-5552 | |
| Blender / v2.79 BMW27 CPU | |
| MSI Cyborg 15 A12VF | |
| Média Intel Core i5-12500H (223 - 288, n=9) | |
| MSI Katana 15 B12VEK | |
| Acer Nitro 5 AN517-55-5552 | |
| Acer Nitro 5 AN517-55-738R | |
| Medion Erazer Scout E20 | |
| Asus TUF Gaming A16 FA617XS | |
| Média da turma Gaming (79 - 330, n=104, últimos 2 anos) | |
| 7-Zip 18.03 / 7z b 4 | |
| Média da turma Gaming (33491 - 148086, n=105, últimos 2 anos) | |
| Asus TUF Gaming A16 FA617XS | |
| Medion Erazer Scout E20 | |
| MSI Katana 15 B12VEK | |
| MSI Cyborg 15 A12VF | |
| Acer Nitro 5 AN517-55-738R | |
| Acer Nitro 5 AN517-55-5552 | |
| Média Intel Core i5-12500H (44105 - 54380, n=9) | |
| 7-Zip 18.03 / 7z b 4 -mmt1 | |
| Asus TUF Gaming A16 FA617XS | |
| Média da turma Gaming (4199 - 7436, n=105, últimos 2 anos) | |
| Medion Erazer Scout E20 | |
| MSI Cyborg 15 A12VF | |
| Acer Nitro 5 AN517-55-738R | |
| MSI Katana 15 B12VEK | |
| Média Intel Core i5-12500H (5151 - 5563, n=9) | |
| Acer Nitro 5 AN517-55-5552 | |
| Geekbench 5.5 / Multi-Core | |
| Média da turma Gaming (6460 - 28263, n=105, últimos 2 anos) | |
| Acer Nitro 5 AN517-55-738R | |
| Medion Erazer Scout E20 | |
| Asus TUF Gaming A16 FA617XS | |
| MSI Katana 15 B12VEK | |
| MSI Cyborg 15 A12VF | |
| Acer Nitro 5 AN517-55-5552 | |
| Média Intel Core i5-12500H (7962 - 10828, n=9) | |
| Geekbench 5.5 / Single-Core | |
| Média da turma Gaming (986 - 2474, n=105, últimos 2 anos) | |
| Asus TUF Gaming A16 FA617XS | |
| Medion Erazer Scout E20 | |
| MSI Cyborg 15 A12VF | |
| Acer Nitro 5 AN517-55-738R | |
| MSI Katana 15 B12VEK | |
| Média Intel Core i5-12500H (1471 - 1693, n=9) | |
| Acer Nitro 5 AN517-55-5552 | |
| HWBOT x265 Benchmark v2.2 / 4k Preset | |
| Média da turma Gaming (11.5 - 44.4, n=105, últimos 2 anos) | |
| Asus TUF Gaming A16 FA617XS | |
| MSI Katana 15 B12VEK | |
| Medion Erazer Scout E20 | |
| Acer Nitro 5 AN517-55-5552 | |
| MSI Cyborg 15 A12VF | |
| MSI Cyborg 15 A12VF | |
| Média Intel Core i5-12500H (12 - 16.6, n=9) | |
| Acer Nitro 5 AN517-55-738R | |
| LibreOffice / 20 Documents To PDF | |
| Acer Nitro 5 AN517-55-5552 | |
| Acer Nitro 5 AN517-55-738R | |
| Média da turma Gaming (33.2 - 88.8, n=105, últimos 2 anos) | |
| Média Intel Core i5-12500H (40.1 - 58.5, n=9) | |
| MSI Katana 15 B12VEK | |
| Medion Erazer Scout E20 | |
| Asus TUF Gaming A16 FA617XS | |
| MSI Cyborg 15 A12VF | |
| R Benchmark 2.5 / Overall mean | |
| Acer Nitro 5 AN517-55-5552 | |
| Média Intel Core i5-12500H (0.4748 - 0.535, n=9) | |
| MSI Katana 15 B12VEK | |
| MSI Cyborg 15 A12VF | |
| Acer Nitro 5 AN517-55-738R | |
| Medion Erazer Scout E20 | |
| Média da turma Gaming (0.3439 - 0.759, n=106, últimos 2 anos) | |
| Asus TUF Gaming A16 FA617XS | |
* ... menor é melhor
AIDA64: FP32 Ray-Trace | FPU Julia | CPU SHA3 | CPU Queen | FPU SinJulia | FPU Mandel | CPU AES | CPU ZLib | FP64 Ray-Trace | CPU PhotoWorxx
| Performance rating | |
| Média da turma Gaming | |
| Asus TUF Gaming A16 FA617XS | |
| Medion Erazer Scout E20 | |
| MSI Katana 15 B12VEK | |
| MSI Cyborg 15 A12VF | |
| Acer Nitro 5 AN517-55-5552 | |
| Média Intel Core i5-12500H | |
| Acer Nitro 5 AN517-55-738R | |
| AIDA64 / FP32 Ray-Trace | |
| Média da turma Gaming (10227 - 85542, n=105, últimos 2 anos) | |
| Asus TUF Gaming A16 FA617XS (v6.75.6100) | |
| MSI Katana 15 B12VEK (v6.85.6300) | |
| Medion Erazer Scout E20 (v6.75.6100) | |
| Acer Nitro 5 AN517-55-5552 (v6.75.6100) | |
| MSI Cyborg 15 A12VF (v6.75.6100) | |
| Média Intel Core i5-12500H (6851 - 13947, n=9) | |
| Acer Nitro 5 AN517-55-738R (v6.50.5800) | |
| AIDA64 / FPU Julia | |
| Média da turma Gaming (51376 - 238426, n=105, últimos 2 anos) | |
| Asus TUF Gaming A16 FA617XS (v6.75.6100) | |
| MSI Katana 15 B12VEK (v6.85.6300) | |
| Medion Erazer Scout E20 | |
| MSI Cyborg 15 A12VF (v6.75.6100) | |
| Acer Nitro 5 AN517-55-5552 (v6.75.6100) | |
| Média Intel Core i5-12500H (29874 - 68178, n=9) | |
| Acer Nitro 5 AN517-55-738R (v6.50.5800) | |
| AIDA64 / CPU SHA3 | |
| Média da turma Gaming (2180 - 10115, n=105, últimos 2 anos) | |
| Asus TUF Gaming A16 FA617XS (v6.75.6100) | |
| MSI Katana 15 B12VEK (v6.85.6300) | |
| Medion Erazer Scout E20 (v6.75.6100) | |
| Acer Nitro 5 AN517-55-5552 (v6.75.6100) | |
| MSI Cyborg 15 A12VF (v6.75.6100) | |
| Média Intel Core i5-12500H (2287 - 3337, n=9) | |
| Acer Nitro 5 AN517-55-738R (v6.50.5800) | |
| AIDA64 / CPU Queen | |
| Asus TUF Gaming A16 FA617XS (v6.75.6100) | |
| Média da turma Gaming (49785 - 173351, n=90, últimos 2 anos) | |
| Medion Erazer Scout E20 (v6.75.6100) | |
| Acer Nitro 5 AN517-55-738R (v6.50.5800) | |
| MSI Katana 15 B12VEK (v6.85.6300) | |
| MSI Cyborg 15 A12VF (v6.75.6100) | |
| Média Intel Core i5-12500H (77935 - 80703, n=9) | |
| Acer Nitro 5 AN517-55-5552 (v6.75.6100) | |
| AIDA64 / FPU SinJulia | |
| Asus TUF Gaming A16 FA617XS (v6.75.6100) | |
| Média da turma Gaming (4424 - 33636, n=105, últimos 2 anos) | |
| Medion Erazer Scout E20 (v6.75.6100) | |
| Acer Nitro 5 AN517-55-738R (v6.50.5800) | |
| MSI Katana 15 B12VEK (v6.85.6300) | |
| MSI Cyborg 15 A12VF (v6.75.6100) | |
| Acer Nitro 5 AN517-55-5552 (v6.75.6100) | |
| Média Intel Core i5-12500H (6590 - 7431, n=9) | |
| AIDA64 / FPU Mandel | |
| Média da turma Gaming (25115 - 128721, n=105, últimos 2 anos) | |
| Asus TUF Gaming A16 FA617XS (v6.75.6100) | |
| MSI Katana 15 B12VEK (v6.85.6300) | |
| Medion Erazer Scout E20 (v6.75.6100) | |
| Acer Nitro 5 AN517-55-5552 (v6.75.6100) | |
| MSI Cyborg 15 A12VF (v6.75.6100) | |
| Média Intel Core i5-12500H (18252 - 34041, n=9) | |
| Acer Nitro 5 AN517-55-738R (v6.50.5800) | |
| AIDA64 / CPU AES | |
| Média da turma Gaming (39258 - 247074, n=105, últimos 2 anos) | |
| Média Intel Core i5-12500H (50298 - 111567, n=9) | |
| Asus TUF Gaming A16 FA617XS (v6.75.6100) | |
| Medion Erazer Scout E20 (v6.75.6100) | |
| MSI Katana 15 B12VEK (v6.85.6300) | |
| MSI Cyborg 15 A12VF (v6.75.6100) | |
| Acer Nitro 5 AN517-55-5552 (v6.75.6100) | |
| Acer Nitro 5 AN517-55-738R (v6.50.5800) | |
| AIDA64 / CPU ZLib | |
| Média da turma Gaming (574 - 2531, n=105, últimos 2 anos) | |
| Asus TUF Gaming A16 FA617XS (v6.75.6100) | |
| Medion Erazer Scout E20 (v6.75.6100) | |
| Acer Nitro 5 AN517-55-738R (v6.50.5800) | |
| Acer Nitro 5 AN517-55-5552 (v6.75.6100) | |
| MSI Cyborg 15 A12VF (v6.75.6100) | |
| MSI Katana 15 B12VEK (v6.85.6300) | |
| Média Intel Core i5-12500H (746 - 924, n=9) | |
| AIDA64 / FP64 Ray-Trace | |
| Média da turma Gaming (5509 - 45446, n=105, últimos 2 anos) | |
| Asus TUF Gaming A16 FA617XS (v6.75.6100) | |
| MSI Katana 15 B12VEK (v6.85.6300) | |
| Medion Erazer Scout E20 (v6.75.6100) | |
| Acer Nitro 5 AN517-55-5552 (v6.75.6100) | |
| MSI Cyborg 15 A12VF (v6.75.6100) | |
| Média Intel Core i5-12500H (3848 - 7405, n=9) | |
| Acer Nitro 5 AN517-55-738R (v6.50.5800) | |
| AIDA64 / CPU PhotoWorxx | |
| Média da turma Gaming (12271 - 89891, n=105, últimos 2 anos) | |
| Medion Erazer Scout E20 (v6.75.6100) | |
| MSI Katana 15 B12VEK (v6.85.6300) | |
| MSI Cyborg 15 A12VF (v6.75.6100) | |
| Acer Nitro 5 AN517-55-5552 (v6.75.6100) | |
| Média Intel Core i5-12500H (13686 - 43813, n=9) | |
| Asus TUF Gaming A16 FA617XS (v6.75.6100) | |
| Acer Nitro 5 AN517-55-738R (v6.50.5800) | |
Desempenho do sistema
Com a CPU não muito potente, os resultados do CrossMark e do PCMark também não são exatamente empolgantes. Laptops para jogos comparáveis podem atingir alguns pontos percentuais a mais.
No entanto, estamos lidando com um processador potente de 16 threads que não tem dificuldades para lidar com multitarefas, iniciar programas e processos de instalação e desinstalação. Abrir o navegador, reproduzir vídeos e outras tarefas cotidianas podem ser realizadas sem nenhum atraso.
CrossMark: Overall | Productivity | Creativity | Responsiveness
| PCMark 10 / Score | |
| Média da turma Gaming (5828 - 12414, n=93, últimos 2 anos) | |
| Asus TUF Gaming A16 FA617XS | |
| Medion Erazer Scout E20 | |
| MSI Cyborg 15 A12VF | |
| MSI Katana 15 B12VEK | |
| Acer Nitro 5 AN517-55-5552 | |
| Média Intel Core i5-12500H, NVIDIA GeForce RTX 4050 Laptop GPU (6220 - 6719, n=2) | |
| Gigabyte G7 KE | |
| PCMark 10 / Essentials | |
| Medion Erazer Scout E20 | |
| Asus TUF Gaming A16 FA617XS | |
| MSI Cyborg 15 A12VF | |
| Média da turma Gaming (8810 - 11935, n=97, últimos 2 anos) | |
| Gigabyte G7 KE | |
| MSI Katana 15 B12VEK | |
| Acer Nitro 5 AN517-55-5552 | |
| Média Intel Core i5-12500H, NVIDIA GeForce RTX 4050 Laptop GPU (9418 - 9985, n=2) | |
| PCMark 10 / Productivity | |
| Média da turma Gaming (6845 - 25323, n=95, últimos 2 anos) | |
| Asus TUF Gaming A16 FA617XS | |
| MSI Cyborg 15 A12VF | |
| Medion Erazer Scout E20 | |
| MSI Katana 15 B12VEK | |
| Gigabyte G7 KE | |
| Acer Nitro 5 AN517-55-5552 | |
| Média Intel Core i5-12500H, NVIDIA GeForce RTX 4050 Laptop GPU (8822 - 8980, n=2) | |
| PCMark 10 / Digital Content Creation | |
| Média da turma Gaming (7602 - 19954, n=95, últimos 2 anos) | |
| Asus TUF Gaming A16 FA617XS | |
| Medion Erazer Scout E20 | |
| Acer Nitro 5 AN517-55-5552 | |
| MSI Cyborg 15 A12VF | |
| MSI Katana 15 B12VEK | |
| Média Intel Core i5-12500H, NVIDIA GeForce RTX 4050 Laptop GPU (7862 - 9180, n=2) | |
| Gigabyte G7 KE | |
| CrossMark / Overall | |
| Média da turma Gaming (1366 - 2409, n=94, últimos 2 anos) | |
| Medion Erazer Scout E20 | |
| Gigabyte G7 KE | |
| MSI Cyborg 15 A12VF | |
| Asus TUF Gaming A16 FA617XS | |
| Acer Nitro 5 AN517-55-5552 | |
| MSI Katana 15 B12VEK | |
| Média Intel Core i5-12500H, NVIDIA GeForce RTX 4050 Laptop GPU (1702 - 1726, n=2) | |
| CrossMark / Productivity | |
| Medion Erazer Scout E20 | |
| Média da turma Gaming (1386 - 2254, n=94, últimos 2 anos) | |
| Gigabyte G7 KE | |
| MSI Cyborg 15 A12VF | |
| Asus TUF Gaming A16 FA617XS | |
| Acer Nitro 5 AN517-55-5552 | |
| Média Intel Core i5-12500H, NVIDIA GeForce RTX 4050 Laptop GPU (1648 - 1675, n=2) | |
| MSI Katana 15 B12VEK | |
| CrossMark / Creativity | |
| Média da turma Gaming (1343 - 2786, n=94, últimos 2 anos) | |
| Medion Erazer Scout E20 | |
| Asus TUF Gaming A16 FA617XS | |
| MSI Cyborg 15 A12VF | |
| MSI Katana 15 B12VEK | |
| Gigabyte G7 KE | |
| Acer Nitro 5 AN517-55-5552 | |
| Média Intel Core i5-12500H, NVIDIA GeForce RTX 4050 Laptop GPU (1752 - 1775, n=2) | |
| CrossMark / Responsiveness | |
| Gigabyte G7 KE | |
| Medion Erazer Scout E20 | |
| Acer Nitro 5 AN517-55-5552 | |
| Média Intel Core i5-12500H, NVIDIA GeForce RTX 4050 Laptop GPU (1718 - 1736, n=2) | |
| Média da turma Gaming (1226 - 2334, n=94, últimos 2 anos) | |
| MSI Cyborg 15 A12VF | |
| MSI Katana 15 B12VEK | |
| Asus TUF Gaming A16 FA617XS | |
| PCMark 10 Score | 6719 pontos | |
Ajuda | ||
| AIDA64 / Memory Copy | |
| Média da turma Gaming (21750 - 129946, n=105, últimos 2 anos) | |
| Asus TUF Gaming A16 FA617XS | |
| Medion Erazer Scout E20 | |
| MSI Cyborg 15 A12VF | |
| MSI Katana 15 B12VEK | |
| Acer Nitro 5 AN517-55-5552 | |
| Média Intel Core i5-12500H (23850 - 66598, n=9) | |
| Acer Nitro 5 AN517-55-738R | |
| AIDA64 / Memory Read | |
| Média da turma Gaming (22956 - 118858, n=105, últimos 2 anos) | |
| Medion Erazer Scout E20 | |
| MSI Katana 15 B12VEK | |
| MSI Cyborg 15 A12VF | |
| Asus TUF Gaming A16 FA617XS | |
| Acer Nitro 5 AN517-55-5552 | |
| Média Intel Core i5-12500H (24879 - 68013, n=9) | |
| Acer Nitro 5 AN517-55-738R | |
| AIDA64 / Memory Write | |
| Média da turma Gaming (22297 - 135096, n=105, últimos 2 anos) | |
| Asus TUF Gaming A16 FA617XS | |
| Medion Erazer Scout E20 | |
| MSI Katana 15 B12VEK | |
| MSI Cyborg 15 A12VF | |
| Acer Nitro 5 AN517-55-5552 | |
| Acer Nitro 5 AN517-55-738R | |
| Média Intel Core i5-12500H (23543 - 58797, n=9) | |
| AIDA64 / Memory Latency | |
| Média da turma Gaming (75.3 - 259, n=105, últimos 2 anos) | |
| Acer Nitro 5 AN517-55-5552 | |
| Média Intel Core i5-12500H (83.8 - 114.7, n=9) | |
| Medion Erazer Scout E20 | |
| MSI Katana 15 B12VEK | |
| MSI Cyborg 15 A12VF | |
| Asus TUF Gaming A16 FA617XS | |
| Acer Nitro 5 AN517-55-738R | |
* ... menor é melhor
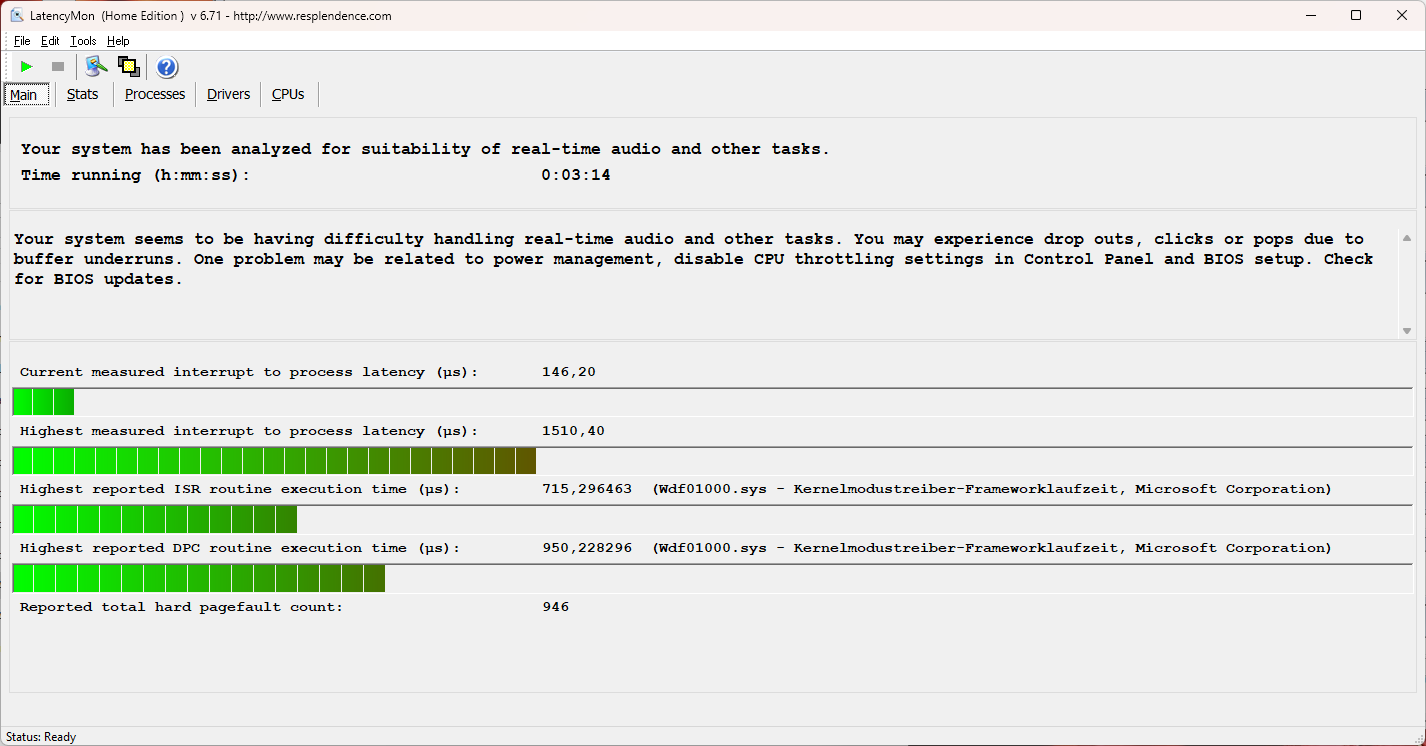
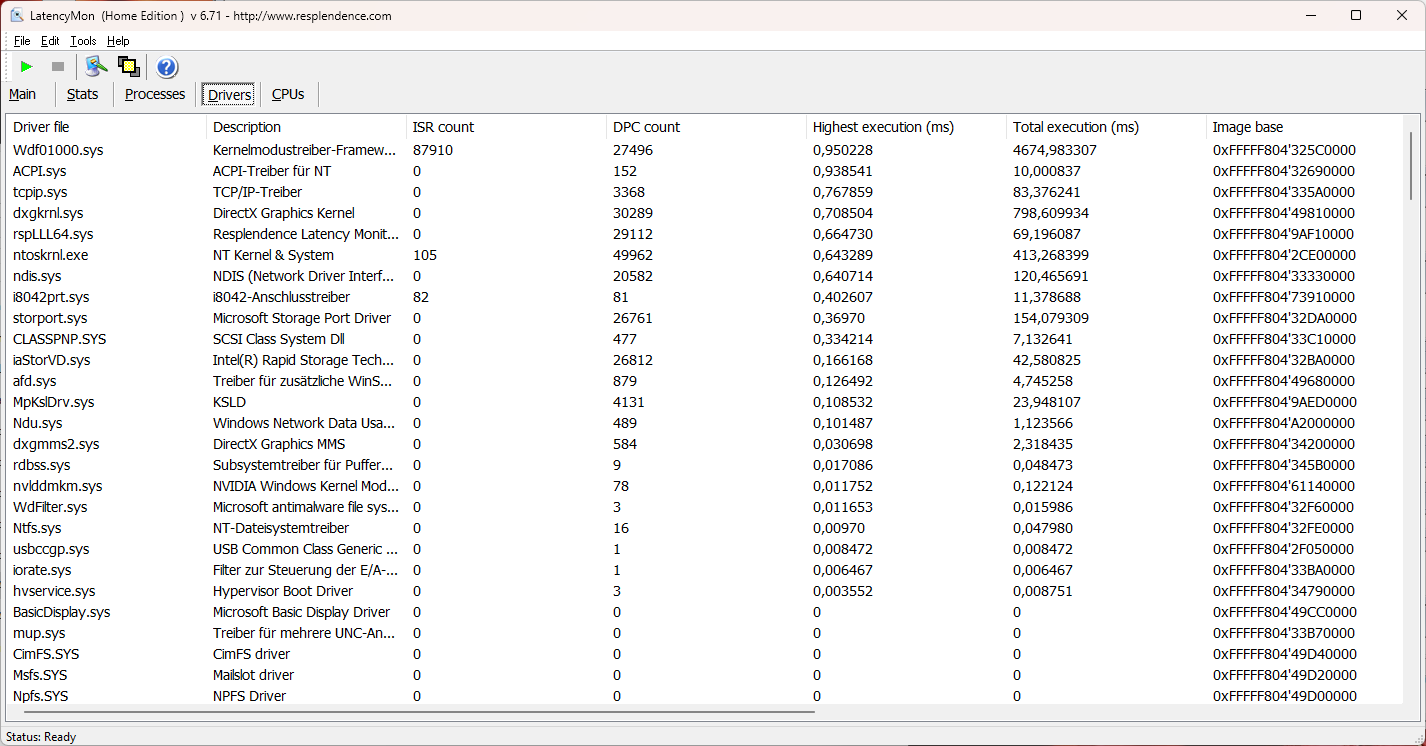
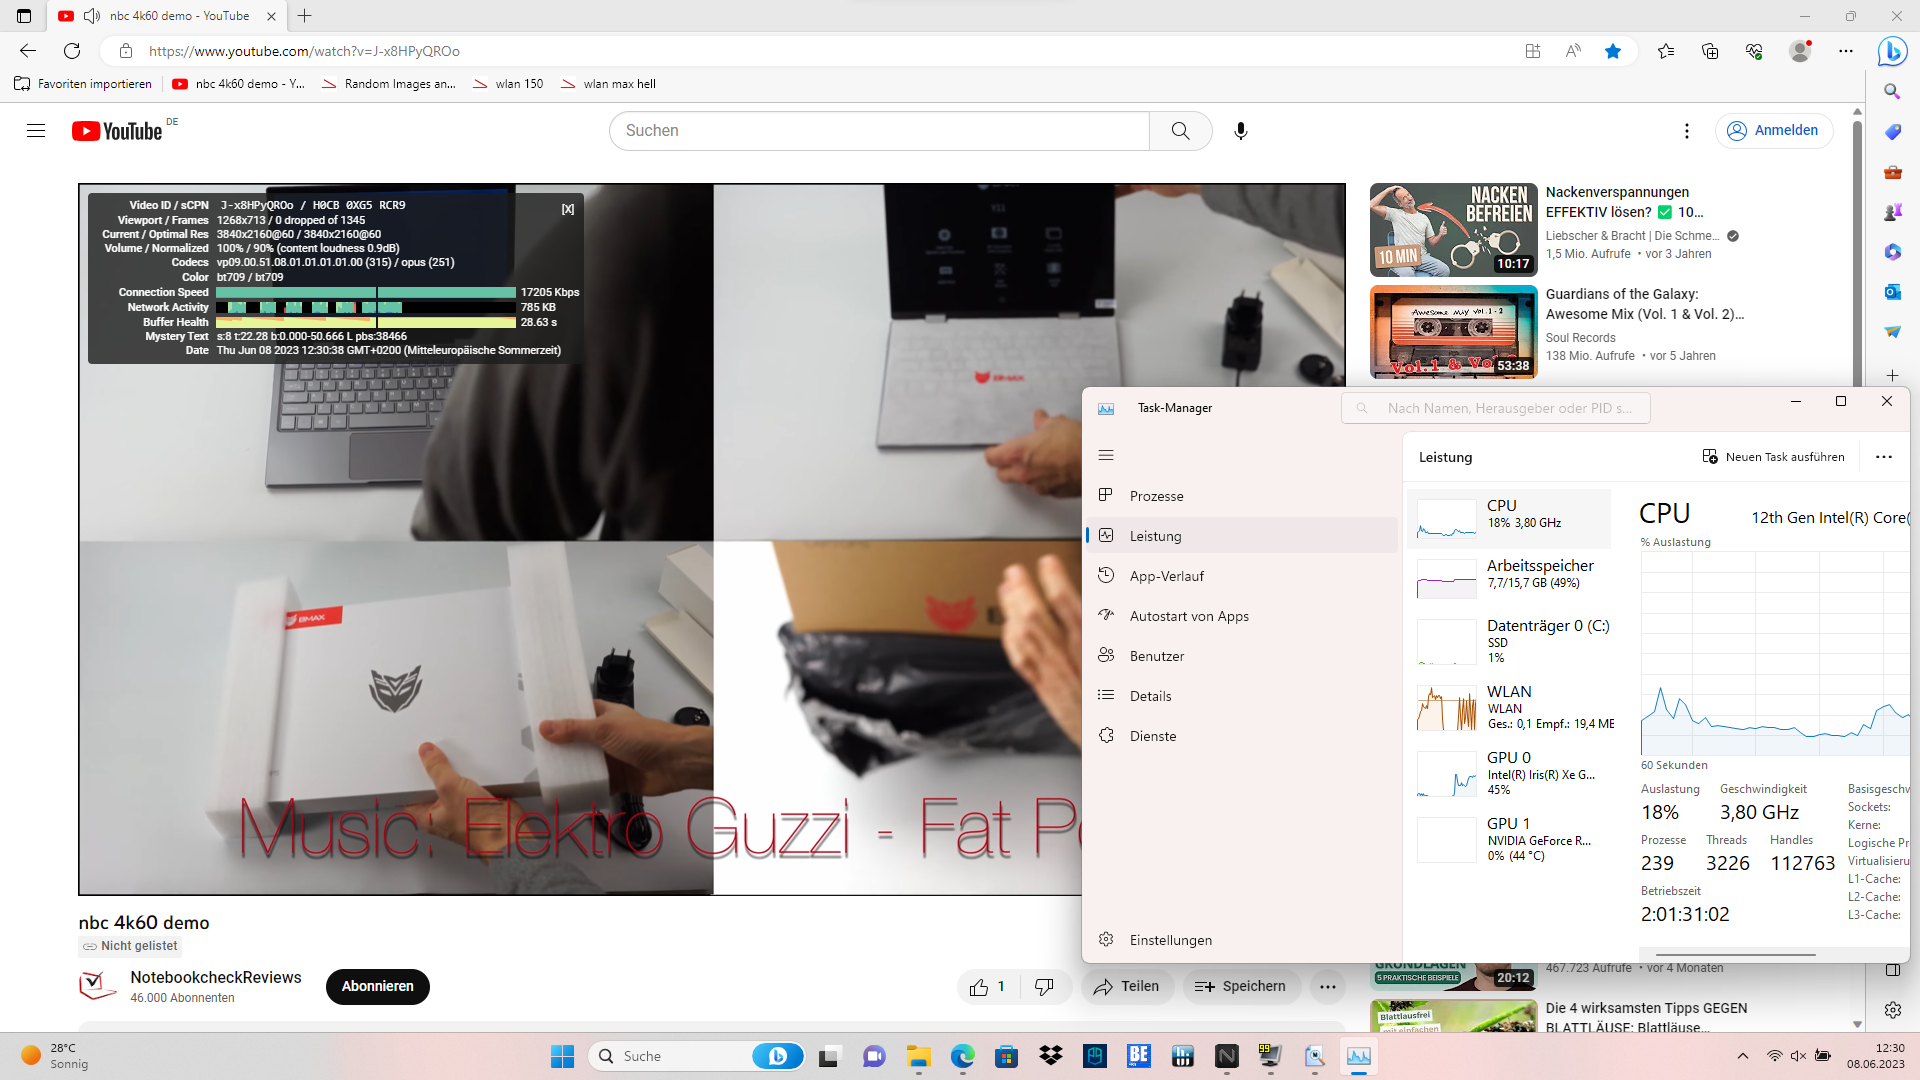
Latências de DPC
Nosso teste LatencyMon foi muito sólido. Para testes especiais, como edição de áudio em tempo real, o Acer Nitro 5 oferece apenas uma adequação limitada, mas ainda é capaz de lidar com isso com pouquíssimas falhas.
Atualmente, o driver da Nvidia contribui para as quedas de desempenho medidas. As atualizações e os drivers geralmente alterados ou excluídos podem melhorar ou piorar significativamente os resultados.
a reprodução de vídeo 4K foi executada em paralelo sem problemas. Os quadros pulados não foram detectados. A iGPU está sobrecarregada em quase 40% e a culpa por isso pode ser atribuída à maioria dos processadores Alder Lake.
| DPC Latencies / LatencyMon - interrupt to process latency (max), Web, Youtube, Prime95 | |
| MSI Katana 15 B12VEK | |
| Medion Erazer Scout E20 | |
| Acer Nitro 5 AN517-55-5552 | |
| MSI Cyborg 15 A12VF | |
| Asus TUF Gaming A16 FA617XS | |
| Acer Nitro 5 AN517-55-738R | |
* ... menor é melhor
Armazenamento em massa
O SSD M.2 NVMe da Western Digital obteve um excelente resultado, melhor do que a média do armazenamento em massa do nosso laptop para jogos analisado.
Apesar de um controlador com resfriamento passivo, ele não conseguiu manter uma taxa de acesso muito alta no teste contínuo, mas, ainda assim, alcançou uma média de mais de 6 GB/s.

* ... menor é melhor
Continuous Performance Read: DiskSpd Read Loop, Queue Depth 8
Placa de vídeo
ANvidia GeForce RTX 4050 é o modelo de nível básico da série RTX 4000 com um nível de desempenho comparável a um RTX 3060. Diferentemente da geração anterior, o TDP da GPU é de 140 watts, incluindo um aumento dinâmico de 25 watts. Era um máximo de 105 watts com aRTX 3050(mas também 140 watts com aRTX 3060).
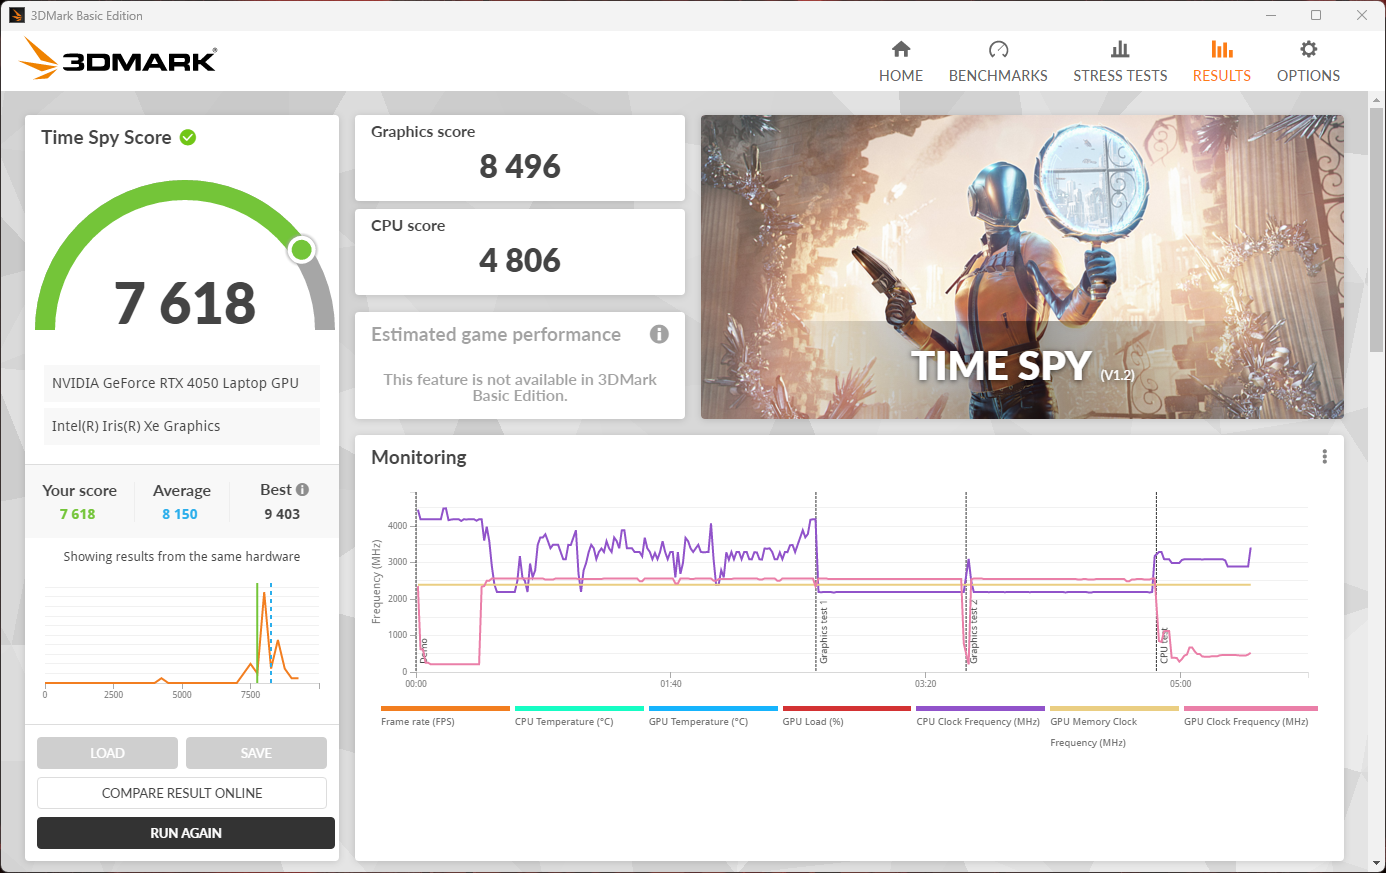
O Acer Nitro 5's RTX 4050do Acer Nitro 5 só atinge esse valor em situações extremas. No teste de estresse da placa de vídeo, medimos brevemente o máximo possível de 140 watts, mas, fora isso, o consumo de energia com o mais alto desempenho e a velocidade máxima da ventoinha ficou em torno de 100 watts porque atingir a temperatura crítica da GPU é responsável por uma queda na velocidade do clock. Por um período mais longo, por exemplo, no teste contínuo Witcher 3, apenas 80 watts estão disponíveis de forma consistente e, no modo silencioso, são apenas 50 watts.
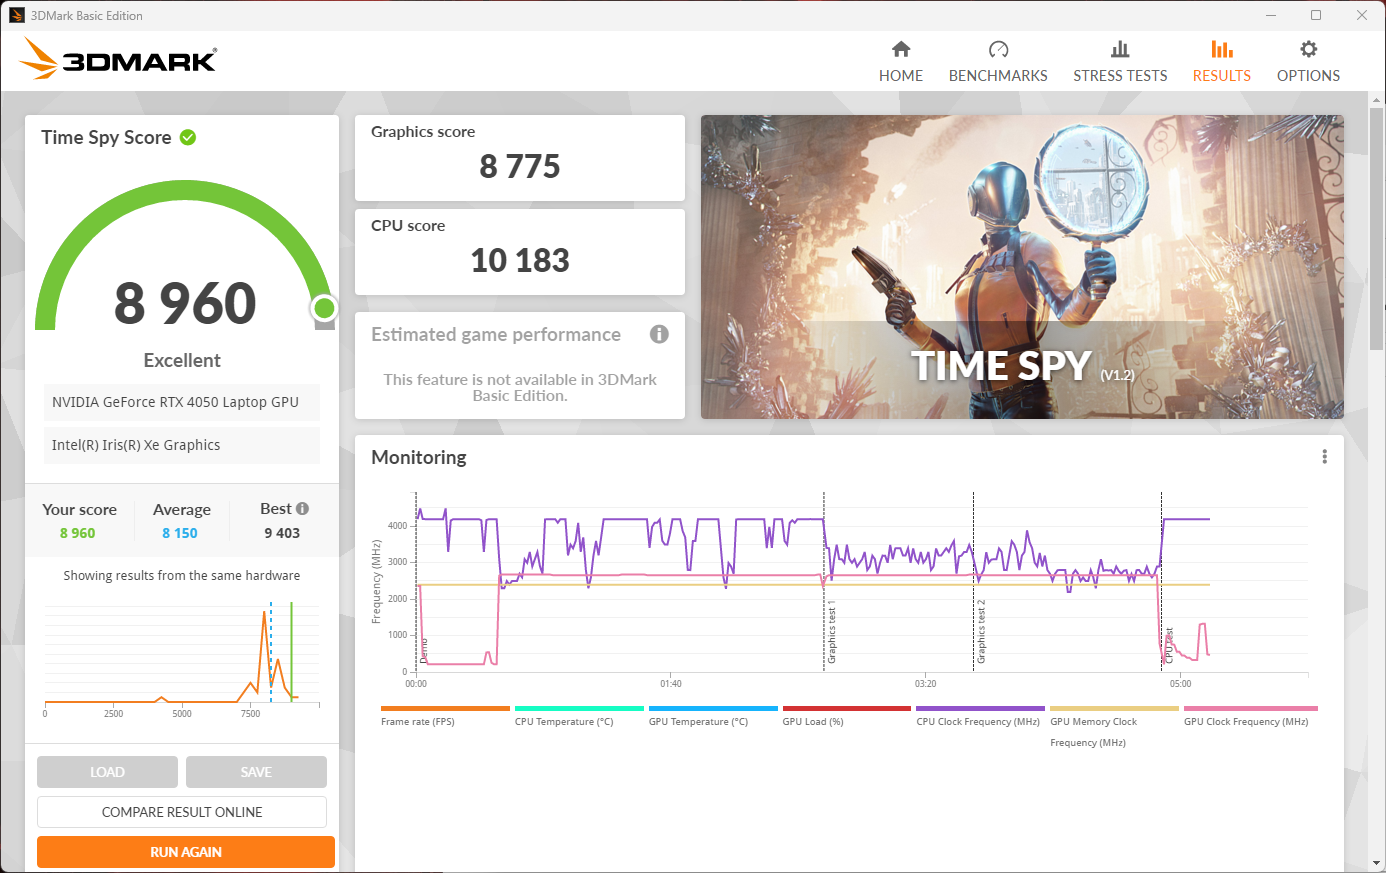
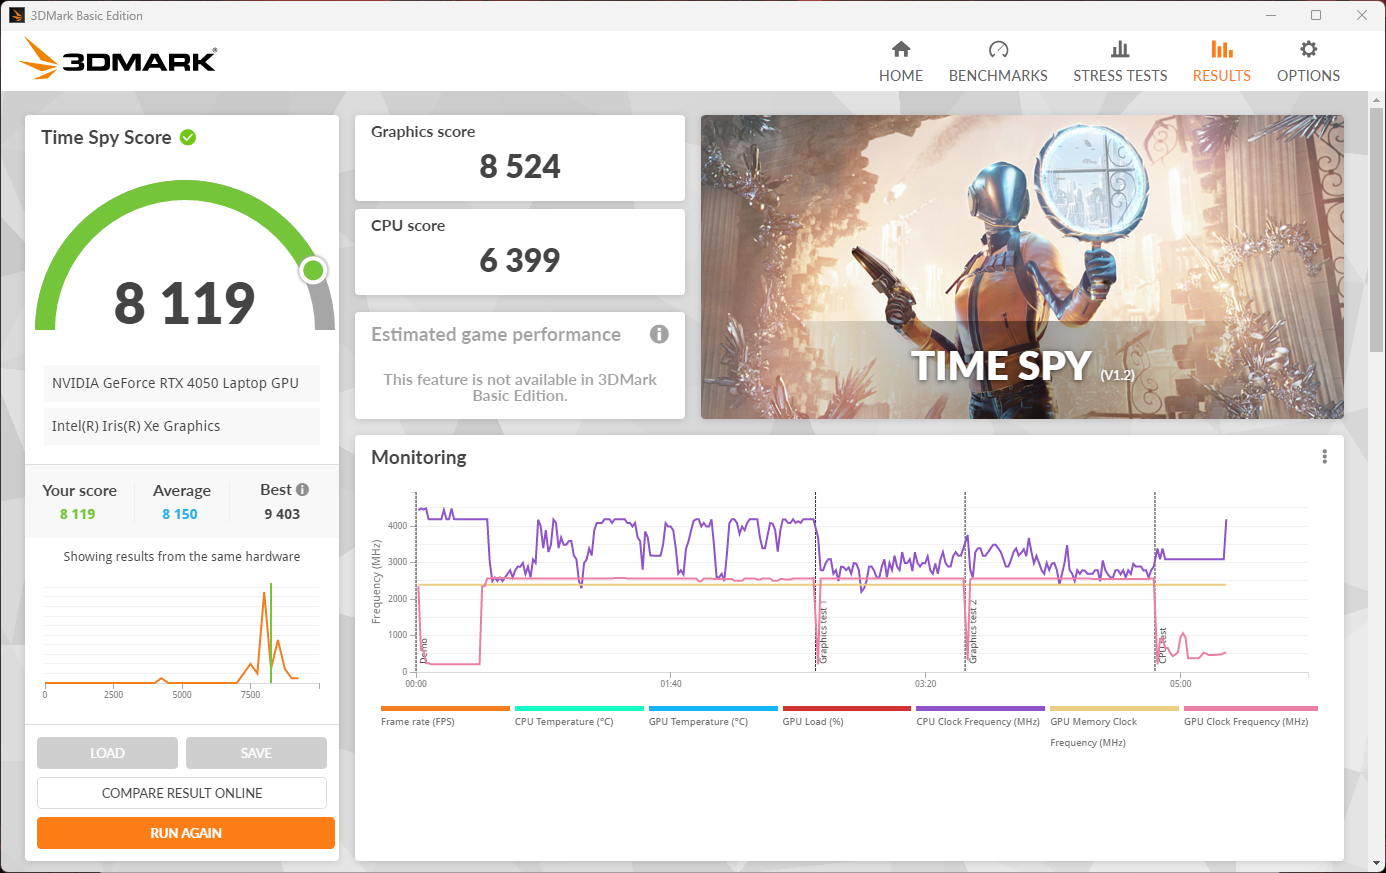
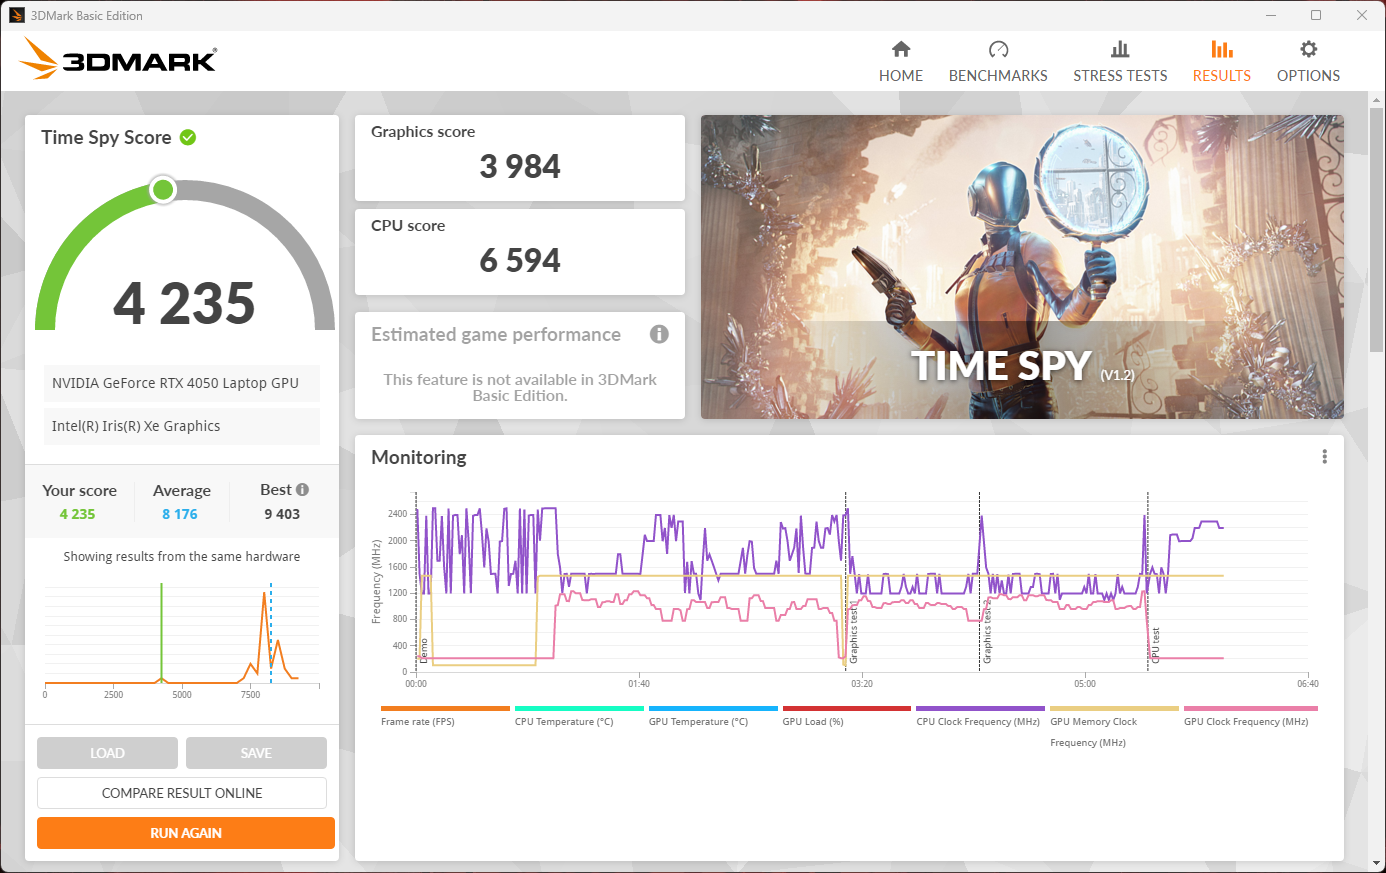
Ao mesmo tempo, nossas medições em Witcher 3 e benchmarks sintéticos não apresentaram nenhuma queda de desempenho, se os ventiladores estiverem configurados para "Quiet". Em situações de jogos reais, a taxa média de quadros caiu menos de 10% e apenas 15% no 3DMark Time Spy. Nos benchmarks do Blender, os valores diferem em apenas 1 segundo.
O desempenho gráfico permaneceu alto no modo silencioso e os aplicativos graficamente exigentes foram executados sem problemas, embora o consumo de energia tenha sido bastante reduzido. Em contrapartida, isso reduz significativamente os requisitos de resfriamento.
| 3DMark Performance rating - Percent | |
| Média da turma Gaming | |
| Medion Erazer Defender P40 | |
| Asus TUF Gaming A16 FA617XS | |
| Acer Nitro 5 AN517-55-5552 | |
| MSI Katana 15 B12VEK | |
| Medion Erazer Scout E20 | |
| Acer Nitro 5 AN517-55-5552 | |
| MSI Cyborg 15 A12VF | |
| Média NVIDIA GeForce RTX 4050 Laptop GPU | |
| Acer Nitro 5 AN517-55-738R | |
| 3DMark 11 Performance | 27855 pontos | |
| 3DMark Cloud Gate Standard Score | 56305 pontos | |
| 3DMark Fire Strike Score | 19904 pontos | |
| 3DMark Time Spy Score | 8960 pontos | |
Ajuda | ||
* ... menor é melhor
Desempenho em jogos
Quando se trata de desempenho em jogos, o Nitro 5 AN517 atinge taxas de quadros decentes, mesmo em jogos atuais. Se você puder dispensar alguns detalhes aqui e ali, os jogos exigentes podem ser executados a mais de 60 fps. Isso corresponde aos resultados que obtivemos com laptops para jogos equipados de forma semelhante. A geração anterior do Nitro 5da geração anterior, com uma RTX 3060está, em sua maior parte, no mesmo nível. Da mesma forma, isso também se aplica ao AMD Asus TUF Gaming A16. O desempenho do sistema é consistente com a resolução de tela Full HD do dispositivo.
Os benchmarks do Nitro são especialmente interessantes quando se trata de resfriamento silencioso, com alguns dos resultados permanecendo quase idênticos. Às vezes, eles estão minimamente abaixo das medições de desempenho máximo. Somente no GTA V notamos que a taxa de quadros caiu cerca de 22%. Isso significa que houve uma diferença de apenas 6% em seis jogos. Tirando o GTA V de cena, a diferença foi de apenas 3%, embora os níveis de ruído do ventilador tenham caído cerca de um terço.
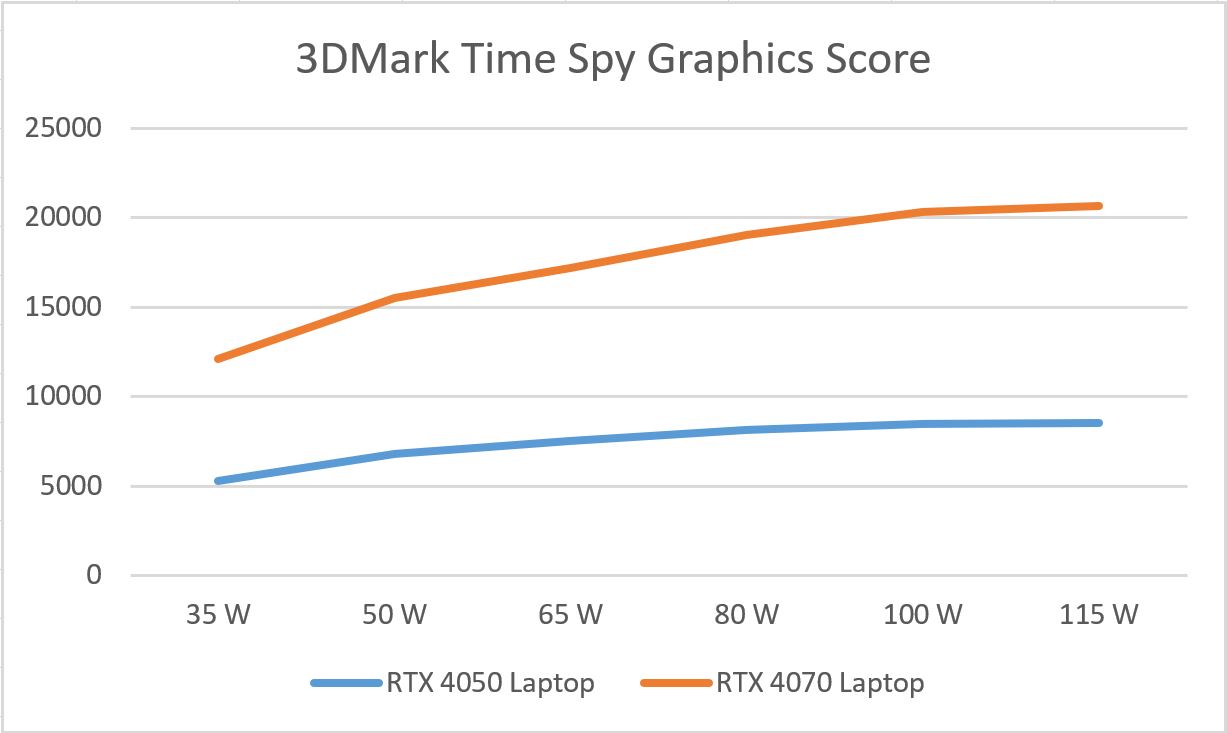
Isso significa que, com um consumo adicional de energia de 40 a 50 watts e uma produção de ruído consideravelmente maior, devem ser esperados apenas pequenos ganhos de desempenho. A RTX 4050 parece ser muito eficiente, mas com quase nenhum benefício quando é executada em seus requisitos máximos de energia possíveis. Nossa análise dos valores de desempenho da Valores de desempenho da GPU sob diferentes cargas. O gráfico do artigo é exibido à direita.
| Performance rating - Percent | |
| Média da turma Gaming | |
| Medion Erazer Defender P40 | |
| Medion Erazer Scout E20 | |
| MSI Katana 15 B12VEK | |
| MSI Cyborg 15 A12VF | |
| Acer Nitro 5 AN517-55-738R | |
| Acer Nitro 5 AN517-55-5552 | |
| Asus TUF Gaming A16 FA617XS | |
| Acer Nitro 5 AN517-55-5552 | |
| The Witcher 3 - 1920x1080 Ultra Graphics & Postprocessing (HBAO+) | |
| Média da turma Gaming (104.7 - 240, n=7, últimos 2 anos) | |
| Medion Erazer Defender P40 | |
| Asus TUF Gaming A16 FA617XS (neu) | |
| Acer Nitro 5 AN517-55-5552 | |
| Acer Nitro 5 AN517-55-5552 (Leiser Modus) | |
| Medion Erazer Scout E20 | |
| Acer Nitro 5 AN517-55-738R | |
| MSI Katana 15 B12VEK | |
| MSI Cyborg 15 A12VF | |
| GTA V - 1920x1080 Highest AA:4xMSAA + FX AF:16x | |
| Média da turma Gaming (48.3 - 186.9, n=94, últimos 2 anos) | |
| Medion Erazer Defender P40 | |
| Medion Erazer Scout E20 | |
| Asus TUF Gaming A16 FA617XS | |
| MSI Katana 15 B12VEK | |
| MSI Cyborg 15 A12VF | |
| Acer Nitro 5 AN517-55-5552 | |
| Acer Nitro 5 AN517-55-738R | |
| Acer Nitro 5 AN517-55-5552 (Leiser Modus) | |
| Final Fantasy XV Benchmark - 1920x1080 High Quality | |
| Média da turma Gaming (41 - 215, n=95, últimos 2 anos) | |
| Medion Erazer Defender P40 (1.3) | |
| Asus TUF Gaming A16 FA617XS (1.3) | |
| Acer Nitro 5 AN517-55-5552 (1.3) | |
| MSI Katana 15 B12VEK (1.3) | |
| Medion Erazer Scout E20 (1.3) | |
| MSI Cyborg 15 A12VF (1.3) | |
| Acer Nitro 5 AN517-55-5552 (Leiser Modus) | |
| Acer Nitro 5 AN517-55-738R (1.3) | |
| Strange Brigade - 1920x1080 ultra AA:ultra AF:16 | |
| Média da turma Gaming (76.3 - 458, n=87, últimos 2 anos) | |
| Medion Erazer Defender P40 (1.47.22.14 D3D12) | |
| Asus TUF Gaming A16 FA617XS (1.47.22.14 D3D12) | |
| Acer Nitro 5 AN517-55-5552 (1.47.22.14 D3D12) | |
| MSI Katana 15 B12VEK (1.47.22.14 D3D12) | |
| Acer Nitro 5 AN517-55-5552 (Leiser Modus) | |
| Medion Erazer Scout E20 (1.47.22.14 D3D12) | |
| Acer Nitro 5 AN517-55-738R (1.47.22.14 D3D12) | |
| MSI Cyborg 15 A12VF (1.47.22.14 D3D12) | |
| Dota 2 Reborn - 1920x1080 ultra (3/3) best looking | |
| Acer Nitro 5 AN517-55-738R | |
| Média da turma Gaming (84.8 - 248, n=107, últimos 2 anos) | |
| Medion Erazer Defender P40 | |
| MSI Katana 15 B12VEK | |
| Medion Erazer Scout E20 | |
| MSI Cyborg 15 A12VF | |
| Acer Nitro 5 AN517-55-5552 | |
| Acer Nitro 5 AN517-55-5552 (Leiser Modus) | |
| Asus TUF Gaming A16 FA617XS | |
| X-Plane 11.11 - 1920x1080 high (fps_test=3) | |
| Medion Erazer Defender P40 | |
| Medion Erazer Scout E20 | |
| Média da turma Gaming (55.5 - 143.5, n=109, últimos 2 anos) | |
| MSI Katana 15 B12VEK | |
| MSI Cyborg 15 A12VF | |
| Acer Nitro 5 AN517-55-738R | |
| Acer Nitro 5 AN517-55-5552 (Leiser Modus) | |
| Acer Nitro 5 AN517-55-5552 | |
| Asus TUF Gaming A16 FA617XS | |
| The Witcher 3 | |
| 1920x1080 High Graphics & Postprocessing (Nvidia HairWorks Off) | |
| Média da turma Gaming (341 - 404, n=2, últimos 2 anos) | |
| Asus TUF Gaming A16 FA617XS | |
| Acer Nitro 5 AN517-55-5552 | |
| MSI Katana 15 B12VEK | |
| Acer Nitro 5 AN517-55-738R | |
| Medion Erazer Scout E20 | |
| Média NVIDIA GeForce RTX 4050 Laptop GPU (87 - 177, n=28) | |
| MSI Cyborg 15 A12VF | |
| 1920x1080 Ultra Graphics & Postprocessing (HBAO+) | |
| Média da turma Gaming (104.7 - 240, n=7, últimos 2 anos) | |
| Asus TUF Gaming A16 FA617XS | |
| Acer Nitro 5 AN517-55-5552 | |
| Medion Erazer Scout E20 | |
| Acer Nitro 5 AN517-55-738R | |
| MSI Katana 15 B12VEK | |
| MSI Cyborg 15 A12VF | |
| Média NVIDIA GeForce RTX 4050 Laptop GPU (18.5 - 94.7, n=40) | |
| Hogwarts Legacy | |
| 1920x1080 High Preset AA:High T | |
| MSI Cyborg 15 A12VF | |
| Asus TUF Gaming A16 FA617XS | |
| Acer Nitro 5 AN517-55-5552 | |
| Média NVIDIA GeForce RTX 4050 Laptop GPU (44.8 - 93.6, n=8) | |
| 1920x1080 Ultra Preset AA:High T | |
| Média da turma Gaming (n=1últimos 2 anos) | |
| MSI Cyborg 15 A12VF | |
| Asus TUF Gaming A16 FA617XS | |
| Média NVIDIA GeForce RTX 4050 Laptop GPU (39 - 77.3, n=8) | |
| Acer Nitro 5 AN517-55-5552 | |
| Sons of the Forest | |
| 1920x1080 Ultra Preset AA:T | |
| Asus TUF Gaming A16 FA617XS | |
| Acer Nitro 5 AN517-55-5552 | |
| Média NVIDIA GeForce RTX 4050 Laptop GPU (61.9 - 76, n=4) | |
| MSI Cyborg 15 A12VF | |
| 1920x1080 High Preset AA:T | |
| Asus TUF Gaming A16 FA617XS | |
| Acer Nitro 5 AN517-55-5552 | |
| Média NVIDIA GeForce RTX 4050 Laptop GPU (63.5 - 76, n=4) | |
| MSI Cyborg 15 A12VF | |
| Star Wars Jedi Survivor | |
| 1920x1080 High Preset | |
| Medion Erazer Scout E20 | |
| Média NVIDIA GeForce RTX 4050 Laptop GPU (51.6 - 65.9, n=7) | |
| Acer Nitro 5 AN517-55-5552 | |
| Média da turma Gaming (n=1últimos 2 anos) | |
| 1920x1080 Epic Preset | |
| Acer Nitro 5 AN517-55-5552 | |
| Média NVIDIA GeForce RTX 4050 Laptop GPU (48.4 - 56, n=7) | |
| Medion Erazer Scout E20 | |
No teste de resistência Witcher 3, o Acer Nitro 5 AN517 não apresentou pontos fracos, com as taxas de quadros permanecendo consistentemente estáveis. As pequenas flutuações correspondem ao ritmo dos ciclos de dia e noite no jogo.
Por outro lado, usando o modo "Silencioso", observamos uma ligeira queda. No início, a linha verde (silencioso) permaneceu quase congruente com a linha vermelha (desempenho). Com a velocidade de clock e a fonte de alimentação mais baixas, houve uma medição de fps 7% menor após uma hora.
Além disso, houve pequenas quedas. Como os ventiladores não podem ser simplesmente aumentados em "Quiet" (Silencioso), a velocidade do clock teve de ser reduzida por um curto período mais uma vez. No entanto, esse valor permaneceu em um nível alto e só ficou abaixo de 60 fps uma vez. OMedion Erazer Scout E20com a mesma placa de vídeo, só alcançou valores de fps comparáveis no modo de desempenho.
Witcher 3 FPS diagram
| baixo | média | alto | ultra | |
|---|---|---|---|---|
| GTA V (2015) | 162.4 | 88.8 | ||
| The Witcher 3 (2015) | 164 | 88 | ||
| Dota 2 Reborn (2015) | 129 | 123.1 | ||
| Final Fantasy XV Benchmark (2018) | 83.6 | |||
| X-Plane 11.11 (2018) | 79.7 | |||
| Far Cry 5 (2018) | 123 | 116 | ||
| Strange Brigade (2018) | 174.8 | 152 | ||
| Cyberpunk 2077 1.6 (2022) | 91.3 | 79.4 | ||
| F1 22 (2022) | 149 | 55 | ||
| Hogwarts Legacy (2023) | 67 | 53 | ||
| Sons of the Forest (2023) | 75 | 73 | ||
| Star Wars Jedi Survivor (2023) | 56 | 53 |
Emissões - O Nitro 5, silencioso e quente
Emissões de ruído
Mesmo quando o sistema está sob carga leve, os ventiladores são ativados. Isso resulta em ruído de fundo que não atrapalha as sessões de jogos nem seus próprios pensamentos.
Por outro lado, o laptop para jogos fica muito alto usando a configuração "Desempenho". É possível perceber quando alguém está jogando, mesmo atrás de uma porta fechada. Isso muda consideravelmente em "Silencioso". Medimos apenas um terço do nível de ruído original.
Os sons produzidos ficam acima dos níveis de ruído encontrados, por exemplo, em um laptop comercial com suas ventoinhas. No entanto, você nunca sente a necessidade de pegar um par de fones de ouvido. Alguns PCs desktop e a maioria dos laptops para jogos são muito mais barulhentos.

Barulho
| Ocioso |
| 25.7 / 31.5 / 31.2 dB |
| Carga |
| 62.9 / 67.5 dB |
 | ||
30 dB silencioso 40 dB(A) audível 50 dB(A) ruidosamente alto |
||
min: | ||
| Acer Nitro 5 AN517-55-5552 GeForce RTX 4050 Laptop GPU, i5-12500H, WDC PC SN810 512GB | Asus TUF Gaming A16 FA617XS Radeon RX 7600S, R9 7940HS, Micron 2400 MTFDKBA512QFM | Acer Nitro 5 AN517-55-738R GeForce RTX 3060 Laptop GPU, i7-12700H, Samsung PM9A1 MZVL2512HCJQ | Medion Erazer Scout E20 GeForce RTX 4050 Laptop GPU, i7-13700H, Phison PS5021-E21 1TB | MSI Katana 15 B12VEK GeForce RTX 4050 Laptop GPU, i7-12650H, Micron 2400 MTFDKBA1T0QFM | MSI Cyborg 15 A12VF GeForce RTX 4060 Laptop GPU, i7-12650H, Samsung PM9B1 1024GB MZVL41T0HBLB | |
|---|---|---|---|---|---|---|
| Noise | 14% | 8% | 6% | 20% | -4% | |
| desligado / ambiente * (dB) | 25.7 | 25 3% | 25.5 1% | 25 3% | 24 7% | 27 -5% |
| Idle Minimum * (dB) | 25.7 | 25 3% | 25.5 1% | 26 -1% | 24 7% | 27 -5% |
| Idle Average * (dB) | 31.5 | 26 17% | 25.5 19% | 27 14% | 24 24% | 37.5 -19% |
| Idle Maximum * (dB) | 31.2 | 28 10% | 27 13% | 32 -3% | 24 23% | 38 -22% |
| Load Average * (dB) | 62.9 | 43 32% | 52.6 16% | 57 9% | 37.71 40% | 56.3 10% |
| Load Maximum * (dB) | 67.5 | 53 21% | 68.2 -1% | 57 16% | 54.55 19% | 56.3 17% |
| Witcher 3 ultra * (dB) | 51 | 50 | 45.75 |
* ... menor é melhor
Temperatura
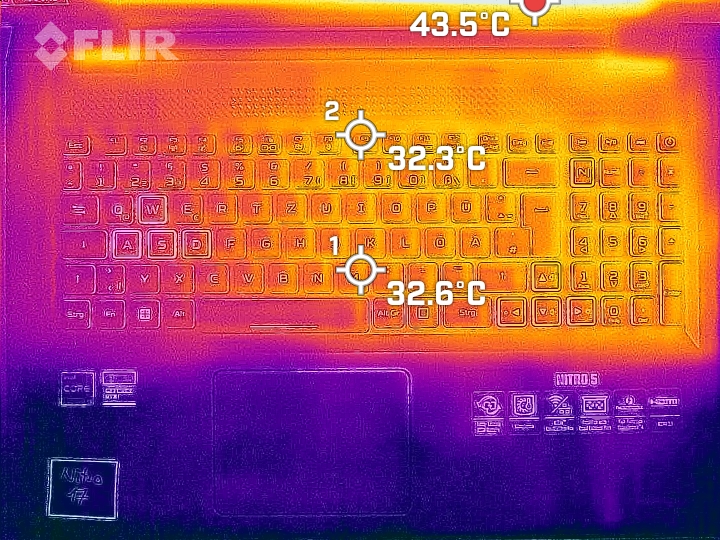
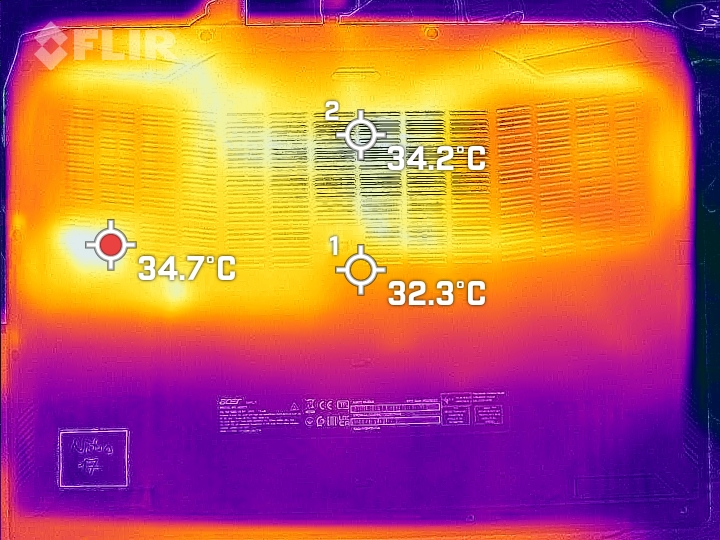
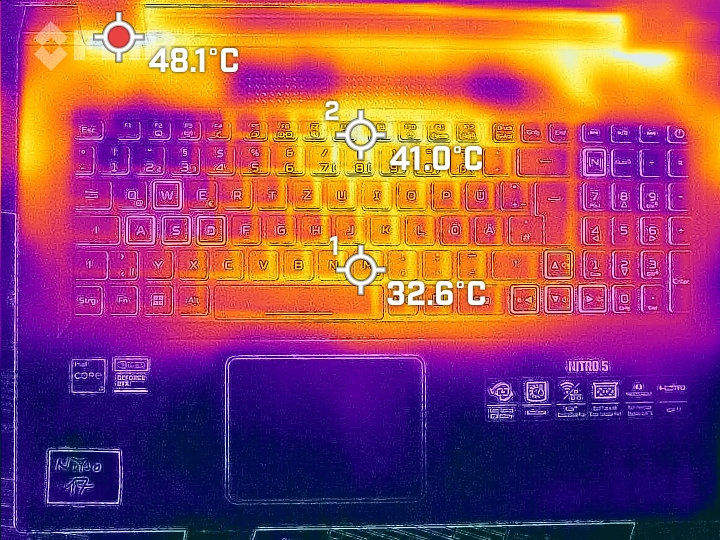
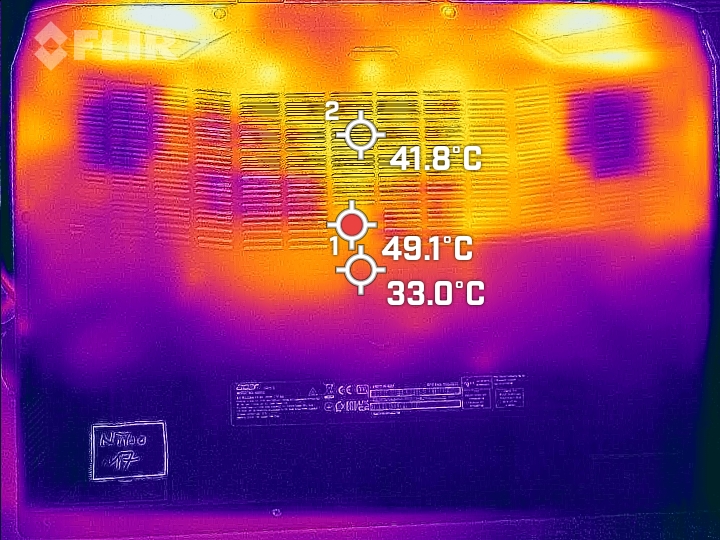
Como você já pode imaginar pela imagem vista na seção "Manutenção", o descanso para as mãos permanece frio, mesmo funcionando sob o cenário bastante teórico de carga máxima. Medimos apenas um pouco mais de 30 °C no meio. Por outro lado, em Witcher 3 não houve aumento significativo de temperatura.
Isso significa que, pelo menos, a área do teclado permanece abaixo de 40 °C. Não é o ideal, mas ainda assim é possível gerenciá-lo. Na área traseira, onde estão localizados os ventiladores, a temperatura aumenta, mas permanece abaixo de 50 °C, algo que o antecessor não conseguiu atingir.
Nos outros modos de desempenho, a dissipação de calor permanece comparável. Isso significa que você pode esperar um teclado quente.
(±) A temperatura máxima no lado superior é 42.4 °C / 108 F, em comparação com a média de 40.4 °C / 105 F , variando de 21.2 a 68.8 °C para a classe Gaming.
(-) A parte inferior aquece até um máximo de 48.2 °C / 119 F, em comparação com a média de 43.2 °C / 110 F
(+) Em uso inativo, a temperatura média para o lado superior é 29.2 °C / 85 F, em comparação com a média do dispositivo de 33.9 °C / ### class_avg_f### F.
(±) Jogando The Witcher 3, a temperatura média para o lado superior é 32.2 °C / 90 F, em comparação com a média do dispositivo de 33.9 °C / ## #class_avg_f### F.
(+) Os apoios para as mãos e o touchpad são mais frios que a temperatura da pele, com um máximo de 27.4 °C / 81.3 F e, portanto, são frios ao toque.
(±) A temperatura média da área do apoio para as mãos de dispositivos semelhantes foi 28.8 °C / 83.8 F (+1.4 °C / 2.5 F).
| Acer Nitro 5 AN517-55-5552 Intel Core i5-12500H, NVIDIA GeForce RTX 4050 Laptop GPU | Asus TUF Gaming A16 FA617XS AMD Ryzen 9 7940HS, AMD Radeon RX 7600S | Acer Nitro 5 AN517-55-738R Intel Core i7-12700H, NVIDIA GeForce RTX 3060 Laptop GPU | Medion Erazer Scout E20 Intel Core i7-13700H, NVIDIA GeForce RTX 4050 Laptop GPU | MSI Katana 15 B12VEK Intel Core i7-12650H, NVIDIA GeForce RTX 4050 Laptop GPU | MSI Cyborg 15 A12VF Intel Core i7-12650H, NVIDIA GeForce RTX 4060 Laptop GPU | |
|---|---|---|---|---|---|---|
| Heat | -3% | -10% | 9% | -9% | 9% | |
| Maximum Upper Side * (°C) | 42.4 | 53 -25% | 48.3 -14% | 41 3% | 47 -11% | 47.5 -12% |
| Maximum Bottom * (°C) | 48.2 | 48 -0% | 52 -8% | 39 19% | 48 -0% | 35.5 26% |
| Idle Upper Side * (°C) | 31.6 | 30 5% | 34.5 -9% | 31 2% | 35 -11% | 27.7 12% |
| Idle Bottom * (°C) | 33.1 | 30 9% | 35.8 -8% | 29 12% | 38 -15% | 29.5 11% |
* ... menor é melhor
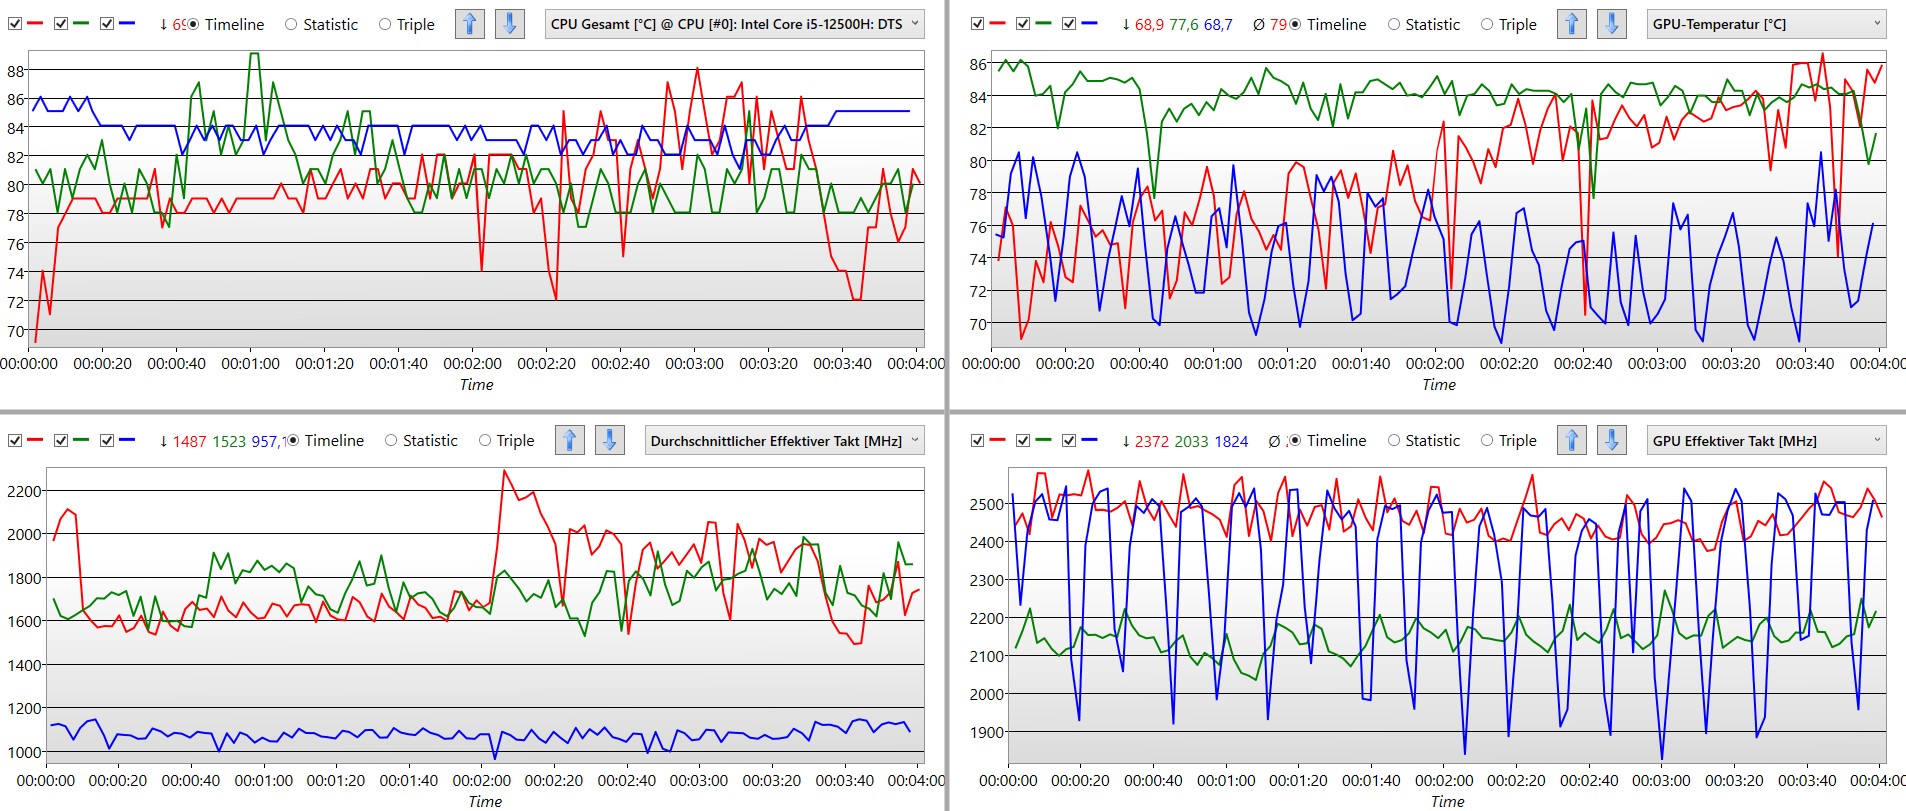
Teste de estresse
Mesmo sob carga máxima, o processador não atinge o consumo de energia máximo possível de 115 watts. Por alguns instantes, medimos quase 100 watts enquanto a temperatura subia para 100 °C, o que, por sua vez, reduziu o consumo de energia.
Por outro lado, a CPU pode consumir brevemente 140 watts e consegue se manter permanentemente bem abaixo de 90 °C a mais de 100 watts. É exatamente assim que se faz um laptop para jogos.
A comparação dos modos de desempenho é interessante, especialmente quando definido como "Silencioso" (linha azul): O desempenho do processador é claramente restrito, enquanto o chip gráfico ainda consegue atingir o nível que normalmente só é permitido quando se usa o modo "Desempenho". Embora pareça irregular em nosso diagrama, a taxa de clock da GPU só oscila entre 1.800 e mais de 2.500 MHz. Ao mesmo tempo, a temperatura permanece significativamente acima de 80 °C.
O modo "Quiet" (Silencioso) permite um alto desempenho gráfico sem produção excessiva de calor, pois a potência do processador é muito limitada.
Alto-falantes
Os pequenos alto-falantes estéreo atendem aos requisitos mínimos. Em particular, a reprodução de voz é bem feita. Desde a palavra falada até os vocais sofisticados, o som é bom.
Os graves são praticamente inexistentes e os médios são pouco definidos. Os alto-falantes do Nitro 5 não são realmente adequados para música, mas são suficientes para streaming de vídeo ou jogos.
Acer Nitro 5 AN517-55-5552 análise de áudio
(±) | o volume do alto-falante é médio, mas bom (###valor### dB)
Graves 100 - 315Hz
(-) | quase nenhum baixo - em média 23.4% menor que a mediana
(±) | a linearidade dos graves é média (14.9% delta para a frequência anterior)
Médios 400 - 2.000 Hz
(+) | médios equilibrados - apenas 2.2% longe da mediana
(+) | médios são lineares (5.8% delta para frequência anterior)
Altos 2 - 16 kHz
(+) | agudos equilibrados - apenas 4.6% longe da mediana
(+) | os máximos são lineares (4.8% delta da frequência anterior)
Geral 100 - 16.000 Hz
(±) | a linearidade do som geral é média (17.1% diferença em relação à mediana)
Comparado com a mesma classe
» 46% de todos os dispositivos testados nesta classe foram melhores, 12% semelhantes, 43% piores
» O melhor teve um delta de 6%, a média foi 18%, o pior foi 132%
Comparado com todos os dispositivos testados
» 31% de todos os dispositivos testados foram melhores, 8% semelhantes, 61% piores
» O melhor teve um delta de 4%, a média foi 23%, o pior foi 134%
Apple MacBook Pro 16 2021 M1 Pro análise de áudio
(+) | os alto-falantes podem tocar relativamente alto (###valor### dB)
Graves 100 - 315Hz
(+) | bons graves - apenas 3.8% longe da mediana
(+) | o baixo é linear (5.2% delta para a frequência anterior)
Médios 400 - 2.000 Hz
(+) | médios equilibrados - apenas 1.3% longe da mediana
(+) | médios são lineares (2.1% delta para frequência anterior)
Altos 2 - 16 kHz
(+) | agudos equilibrados - apenas 1.9% longe da mediana
(+) | os máximos são lineares (2.7% delta da frequência anterior)
Geral 100 - 16.000 Hz
(+) | o som geral é linear (4.6% diferença em relação à mediana)
Comparado com a mesma classe
» 0% de todos os dispositivos testados nesta classe foram melhores, 0% semelhantes, 100% piores
» O melhor teve um delta de 5%, a média foi 17%, o pior foi 45%
Comparado com todos os dispositivos testados
» 0% de todos os dispositivos testados foram melhores, 0% semelhantes, 100% piores
» O melhor teve um delta de 4%, a média foi 23%, o pior foi 134%
Gerenciamento de energia
Consumo de energia
O fato de o processador não estar atualizado é perceptível em termos de consumo. Com pouco mais de 7 watts, o consumo mínimo de energia é bom, mas poderia ser um pouco menor, como o Medion Erazer Scoutcom seu processadori7-13700H. Mesmo com uso típico, 150 watts é um valor bastante ruim. A média doRTX 4050fica abaixo de 100 watts. Entretanto, no modo silencioso, o consumo total de energia também fica em torno de 100 watts.
O consumo máximo de energia de 244 watts só foi registrado em uma única medição de pico. A PSU de 230 watts deve, portanto, ser suficiente e ter reservas suficientes para carregar a bateria.
| desligado | |
| Ocioso | |
| Carga |
|
Key:
min: | |
| Acer Nitro 5 AN517-55-5552 i5-12500H, GeForce RTX 4050 Laptop GPU, WDC PC SN810 512GB, IPS, 1920x1080, 17.3" | Asus TUF Gaming A16 FA617XS R9 7940HS, Radeon RX 7600S, Micron 2400 MTFDKBA512QFM, IPS, 1920x1200, 16" | Acer Nitro 5 AN517-55-738R i7-12700H, GeForce RTX 3060 Laptop GPU, Samsung PM9A1 MZVL2512HCJQ, IPS, 1920x1080, 17.3" | Medion Erazer Scout E20 i7-13700H, GeForce RTX 4050 Laptop GPU, Phison PS5021-E21 1TB, IPS, 1920x1080, 17.3" | MSI Katana 15 B12VEK i7-12650H, GeForce RTX 4050 Laptop GPU, Micron 2400 MTFDKBA1T0QFM, IPS, 1920x1080, 15.6" | MSI Cyborg 15 A12VF i7-12650H, GeForce RTX 4060 Laptop GPU, Samsung PM9B1 1024GB MZVL41T0HBLB, IPS, 1920x1080, 15.6" | Média NVIDIA GeForce RTX 4050 Laptop GPU | Média da turma Gaming | |
|---|---|---|---|---|---|---|---|---|
| Power Consumption | 13% | -14% | 7% | 17% | 33% | -6% | -36% | |
| Idle Minimum * (Watt) | 7.6 | 7 8% | 9.7 -28% | 5 34% | 8.5 -12% | 6 21% | 9.95 ? -31% | 13 ? -71% |
| Idle Average * (Watt) | 11.3 | 10 12% | 14.6 -29% | 11 3% | 10.2 10% | 8.8 22% | 15.8 ? -40% | 19 ? -68% |
| Idle Maximum * (Watt) | 15.4 | 15 3% | 16.7 -8% | 22 -43% | 11.3 27% | 11.9 23% | 20.1 ? -31% | 24.6 ? -60% |
| Load Average * (Watt) | 151 | 86 43% | 166 -10% | 96 36% | 84 44% | 89 41% | 88 ? 42% | 110.7 ? 27% |
| Witcher 3 ultra * (Watt) | 137.8 | 160.6 -17% | 145.2 -5% | 128 7% | 90.3 34% | |||
| Load Maximum * (Watt) | 244 | 172 30% | 235 4% | 201 18% | 189 23% | 99 59% | 176.3 ? 28% | 259 ? -6% |
* ... menor é melhor
Power consumption Witcher 3 / stress test
Power consumption with an external monitor
Duração da bateria
A duração da bateria do Acer Nitro 5 é muito prática: mesmo com o brilho máximo da tela, o laptop conseguiu consideravelmente mais de 8 horas em nosso teste de Wi-Fi enquanto alternava entre sites. Com brilho limitado, você pode esperar uma hora extra. Entretanto, com 90 Wh, a capacidade da bateria também é muito alta.
OAsus TUF Gaming 16- que consegue obter 12 horas ou mais com uma bateria do mesmo tamanho, mostra que um notebook para jogos pode funcionar com muito mais eficiência.
| Acer Nitro 5 AN517-55-5552 i5-12500H, GeForce RTX 4050 Laptop GPU, 90 Wh | Asus TUF Gaming A16 FA617XS R9 7940HS, Radeon RX 7600S, 90 Wh | Acer Nitro 5 AN517-55-738R i7-12700H, GeForce RTX 3060 Laptop GPU, 90.61 Wh | Medion Erazer Scout E20 i7-13700H, GeForce RTX 4050 Laptop GPU, 53.35 Wh | MSI Katana 15 B12VEK i7-12650H, GeForce RTX 4050 Laptop GPU, 53.5 Wh | MSI Cyborg 15 A12VF i7-12650H, GeForce RTX 4060 Laptop GPU, 53.5 Wh | Média da turma Gaming | |
|---|---|---|---|---|---|---|---|
| Duração da bateria | 50% | -30% | -44% | -48% | -6% | -6% | |
| H.264 (h) | 7.4 | 12.4 68% | 5.3 -28% | 4.6 -38% | 4.4 -41% | 8 8% | 8.32 ? 12% |
| WiFi v1.3 (h) | 9.4 | 12.4 32% | 6.5 -31% | 4.7 -50% | 4.3 -54% | 7.5 -20% | 7.11 ? -24% |
Pro
Contra
Veredicto - A eficiente GPU do Nitro 5 é bem implementada
Com o simples i5-12500H e a placa de vídeo RTX 4050 de nível básico, o Acer Nitro 5 não oferece um desempenho ruim, mas, na melhor das hipóteses, médio. Em seguida, o modo "Silencioso" é ativado:
Com ruídos audíveis, mas nunca irritantes, do ventilador, o desempenho em jogos cai minimamente, especialmente em jogos, onde determinamos uma diferença de apenas alguns pontos percentuais. O Nitro executa os jogos atuais sem problemas em resolução Full HD, com configurações de detalhes altos e nunca excede os níveis de ruído encontrados em seus concorrentes.
Ventiladores silenciosos e jogos em Full HD não são mutuamente exclusivos no Acer Nitro 5.
Isso é possível graças ao eficiente chip gráfico da Nvidia, que não se beneficia do maior consumo de energia. No entanto, isso também é possível graças ao gabinete muito grande e a um sistema de resfriamento igualmente grande que possui configurações inteligentes. Além disso, há um teclado RGB, Thunderbolt 4 e duas portas USB de 10 Gbit/s.
O que é realmente decepcionante é a tela: Embora a resolução e o tamanho se ajustem perfeitamente ao tamanho do laptop Acer, a reprodução de cores, o contraste e o brilho máximo estão claramente abaixo da média, mesmo para os padrões de nível básico que se destacam em termos de preço.
Se o objetivo for apenas o desempenho em jogos, há laptops mais rápidos. Por exemplo, oMedion Erazer Scout E20 também está equipado com umaRTX 4050 e também tem uma tela significativamente melhor. No entanto, ele não é tão silencioso quanto o Nitro e é um pouco mais caro.
Preço e disponibilidade
O Acer Nitro 5 (RTX 4050, 16 GB de RAM DDR5) está disponível na Amazon por cerca de US$ 1225.
Acer Nitro 5 AN517-55-5552
- 06/13/2023 v7 (old)
Mario Petzold
Transparência
A seleção dos dispositivos a serem analisados é feita pela nossa equipe editorial. A amostra de teste foi fornecida ao autor como empréstimo pelo fabricante ou varejista para fins desta revisão. O credor não teve influência nesta revisão, nem o fabricante recebeu uma cópia desta revisão antes da publicação. Não houve obrigação de publicar esta revisão. Como empresa de mídia independente, a Notebookcheck não está sujeita à autoridade de fabricantes, varejistas ou editores.
É assim que o Notebookcheck está testando
Todos os anos, o Notebookcheck analisa de forma independente centenas de laptops e smartphones usando procedimentos padronizados para garantir que todos os resultados sejam comparáveis. Desenvolvemos continuamente nossos métodos de teste há cerca de 20 anos e definimos padrões da indústria no processo. Em nossos laboratórios de teste, equipamentos de medição de alta qualidade são utilizados por técnicos e editores experientes. Esses testes envolvem um processo de validação em vários estágios. Nosso complexo sistema de classificação é baseado em centenas de medições e benchmarks bem fundamentados, o que mantém a objetividade.Price comparison

