Asus ROG Flow Z13 Revisão ACRNM - Conversível para jogos com o notebook RTX 4070
O Asus ROG Flow Z13 é um tablet de jogos com um poderoso processador e placa gráfica dedicada. Além do modelo regular 2023 com o Core i9-13900H e até o GeForce RTX 4060 Laptop, que também está atualmente em revisão, a Asus também oferece uma edição especial em cooperação com a marca de moda alemã ACRONYM, que recebe um chassi completamente reformulado, bem como o mais potente GeForce RTX 4070 Laptop. Revisamos o descapotável para saber se o preço de 3400 euros se justifica. O conversível também apresenta uma tela WQHD IPS de 13,4 polegadas com taxa de atualização de 165 Hz, 32 GB LPDDR5-RAM, bem como um SSD compacto de 1 TB M.2-2230 SSD, que pode ser substituído.
Também é possível usar o conversível para jogos com o GPU móvel Asus XG externo com o laptop RTX 4090, mas é uma opção muito cara a 2500 euros. Também incluiremos alguns benchmarks de eGPU durante a revisão.
Possíveis concorrentes em comparação
Avaliação | Data | Modelo | Peso | Altura | Size | Resolução | Preço |
|---|---|---|---|---|---|---|---|
| 89.4 % v7 (old) | 04/2023 | Asus ROG Flow Z13 ACRNM i9-13900H, GeForce RTX 4070 Laptop GPU | 1.7 kg | 20 mm | 13.40" | 2560x1600 | |
| 86.8 % v7 (old) | 03/2022 | Asus ROG Flow Z13 GZ301ZE i9-12900H, GeForce RTX 3050 Ti Laptop GPU | 1.2 kg | 12 mm | 13.40" | 1920x1200 | |
| 86.7 % v7 (old) | 03/2022 | Alienware x14 i7 RTX 3060 i7-12700H, GeForce RTX 3060 Laptop GPU | 1.8 kg | 14.5 mm | 14.00" | 1920x1080 | |
| 89.4 % v7 (old) | 05/2022 | Razer Blade 14 Ryzen 9 6900HX R9 6900HX, GeForce RTX 3070 Ti Laptop GPU | 1.8 kg | 16.8 mm | 14.00" | 2560x1440 | |
| 86.7 % v7 (old) | 03/2022 | Asus ROG Zephyrus G14 GA402RK R9 6900HS, Radeon RX 6800S | 1.7 kg | 19.5 mm | 14.00" | 2560x1600 |
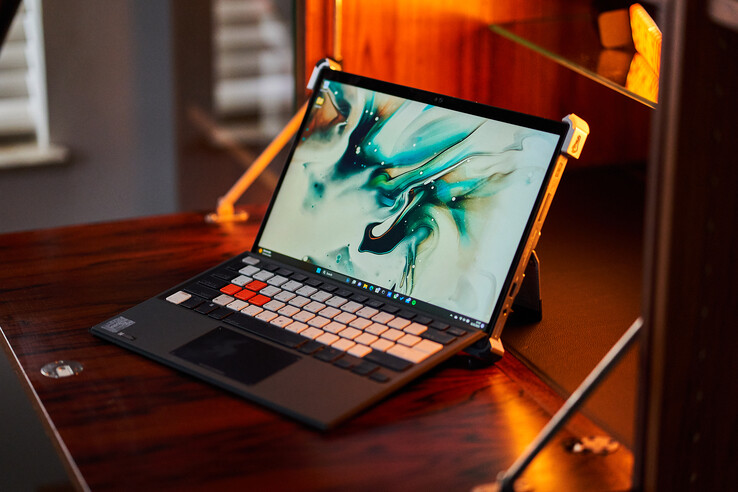
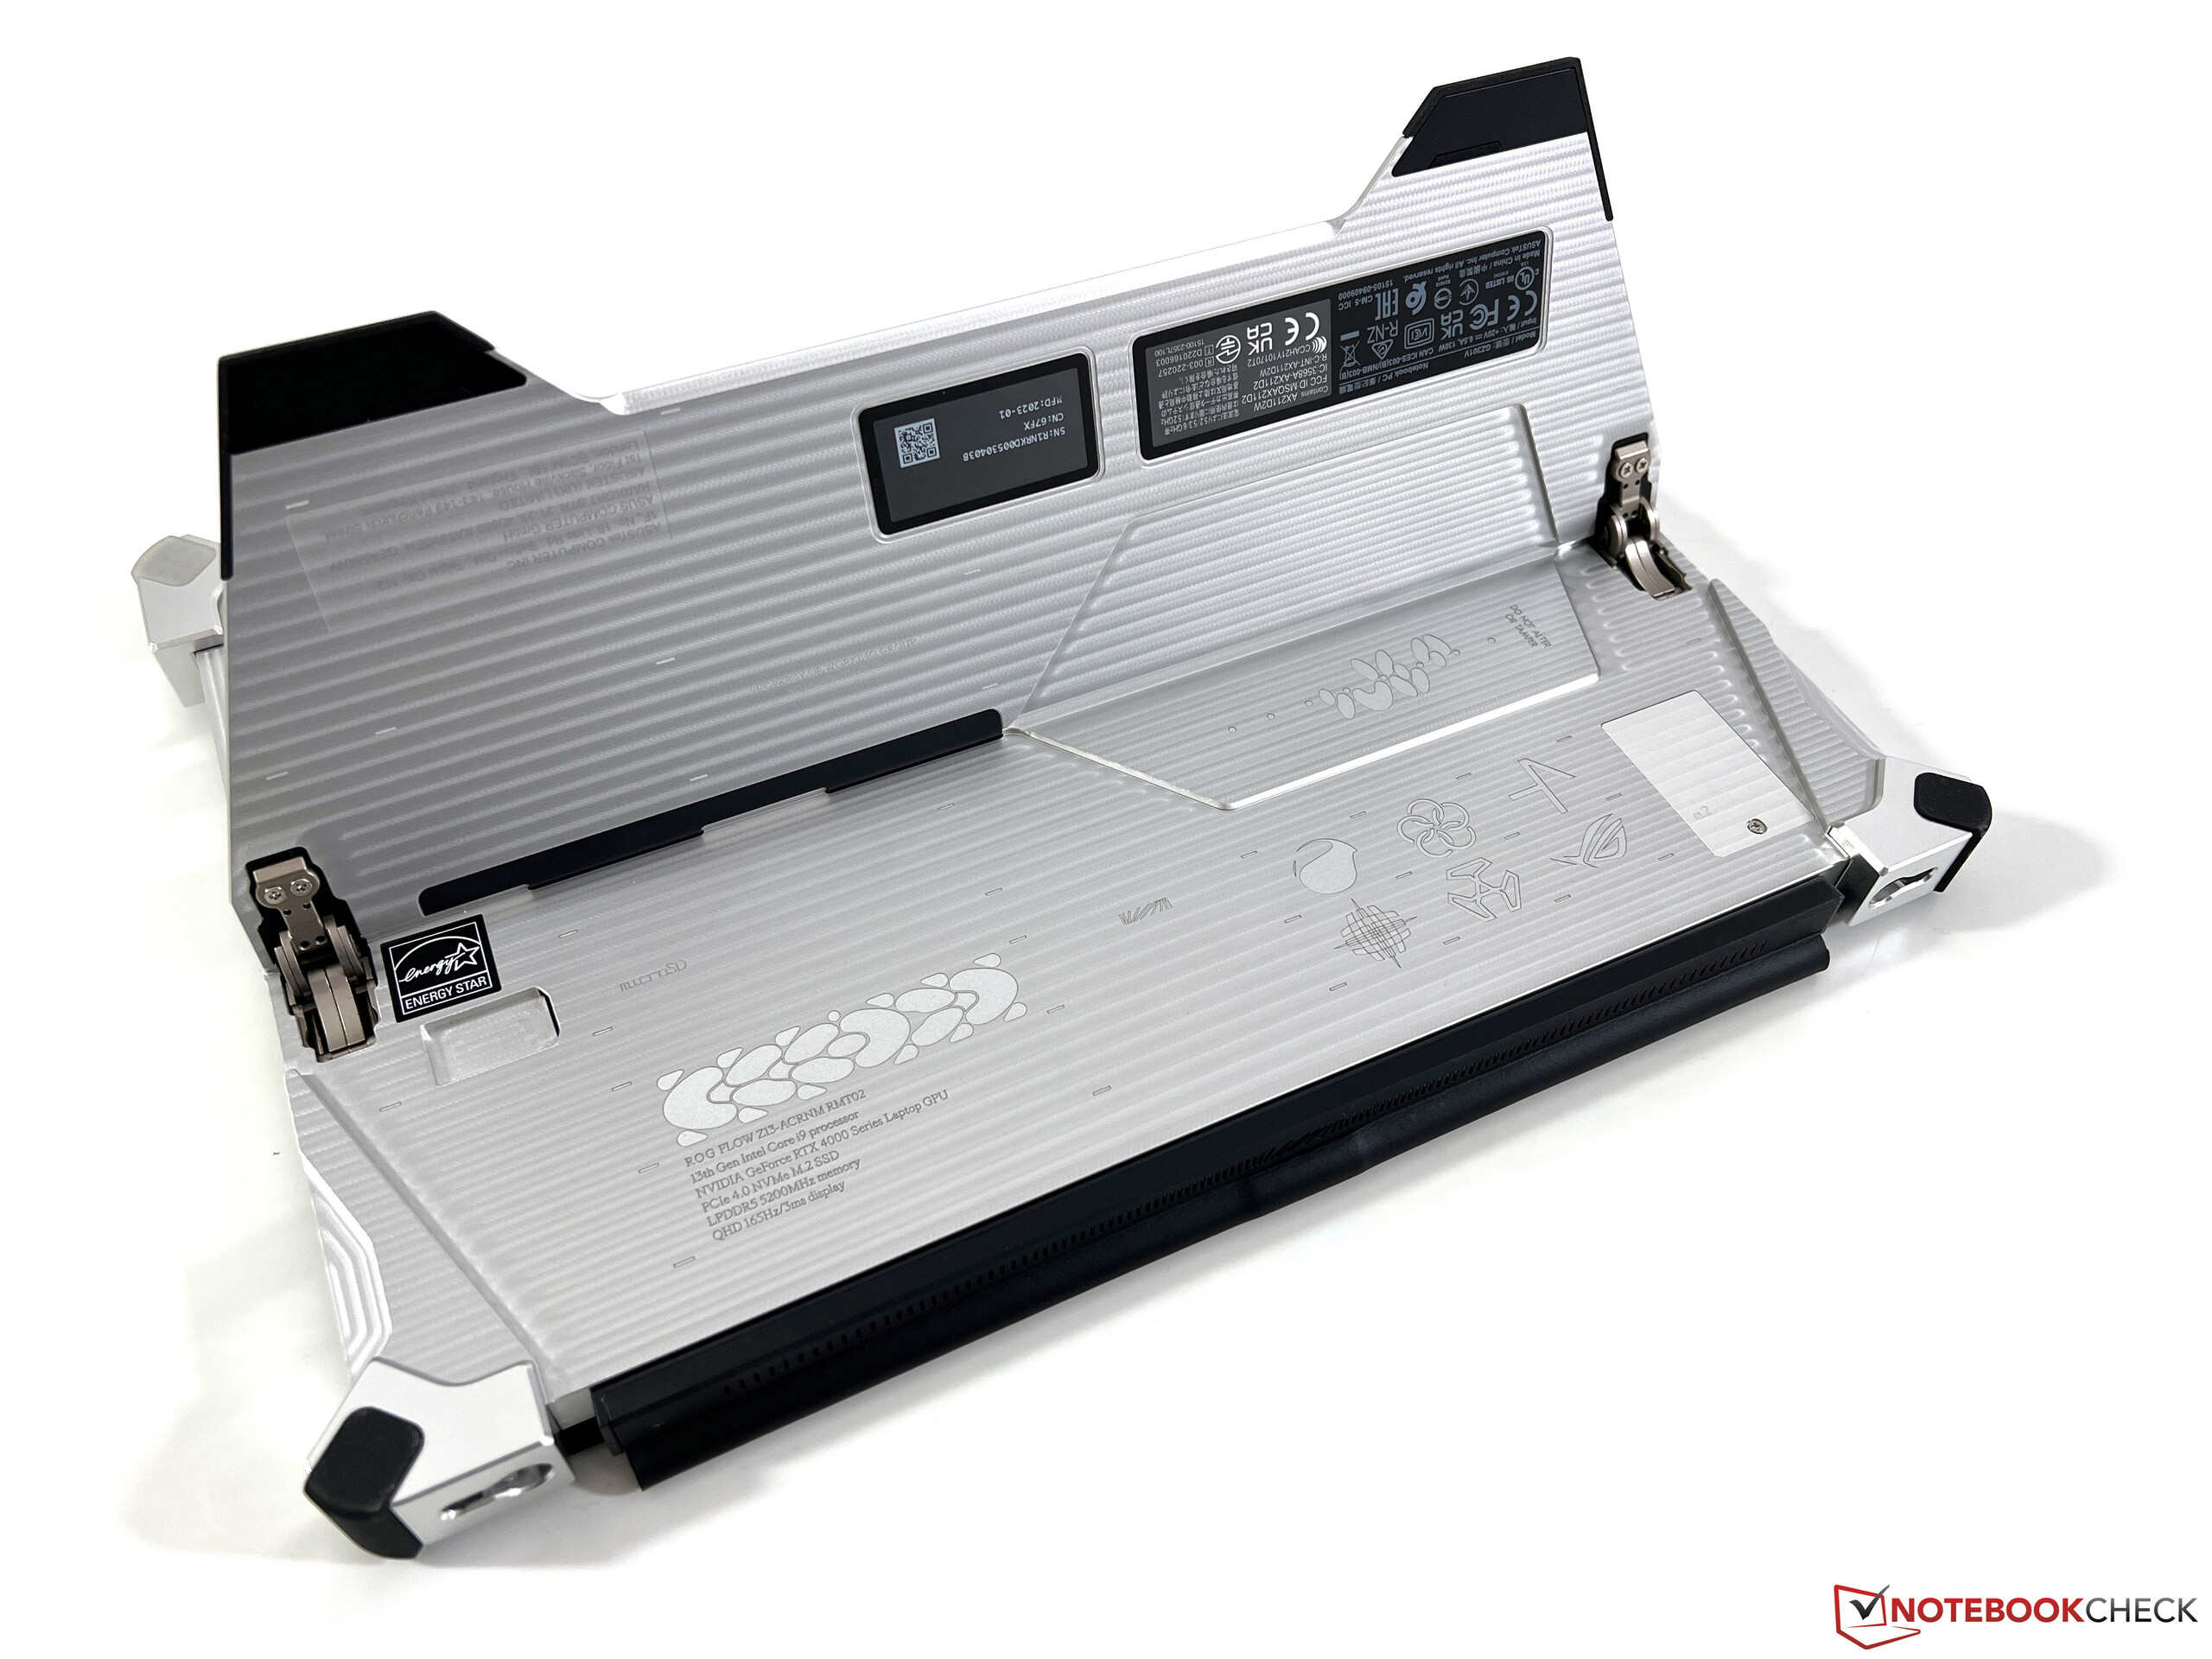
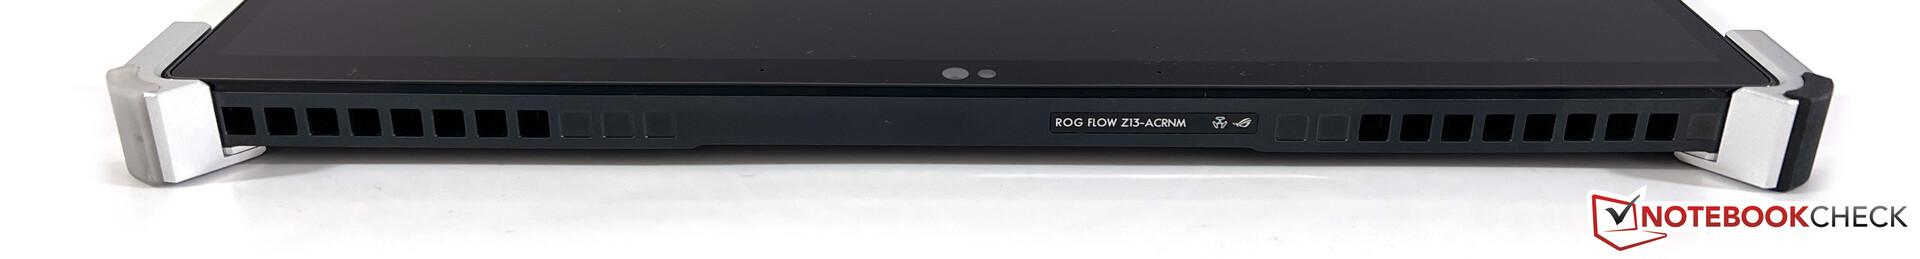
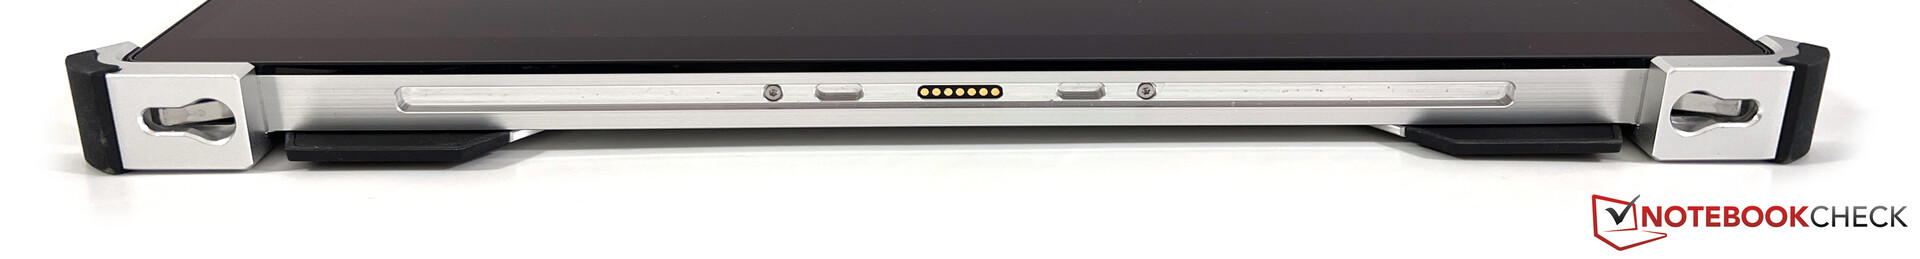
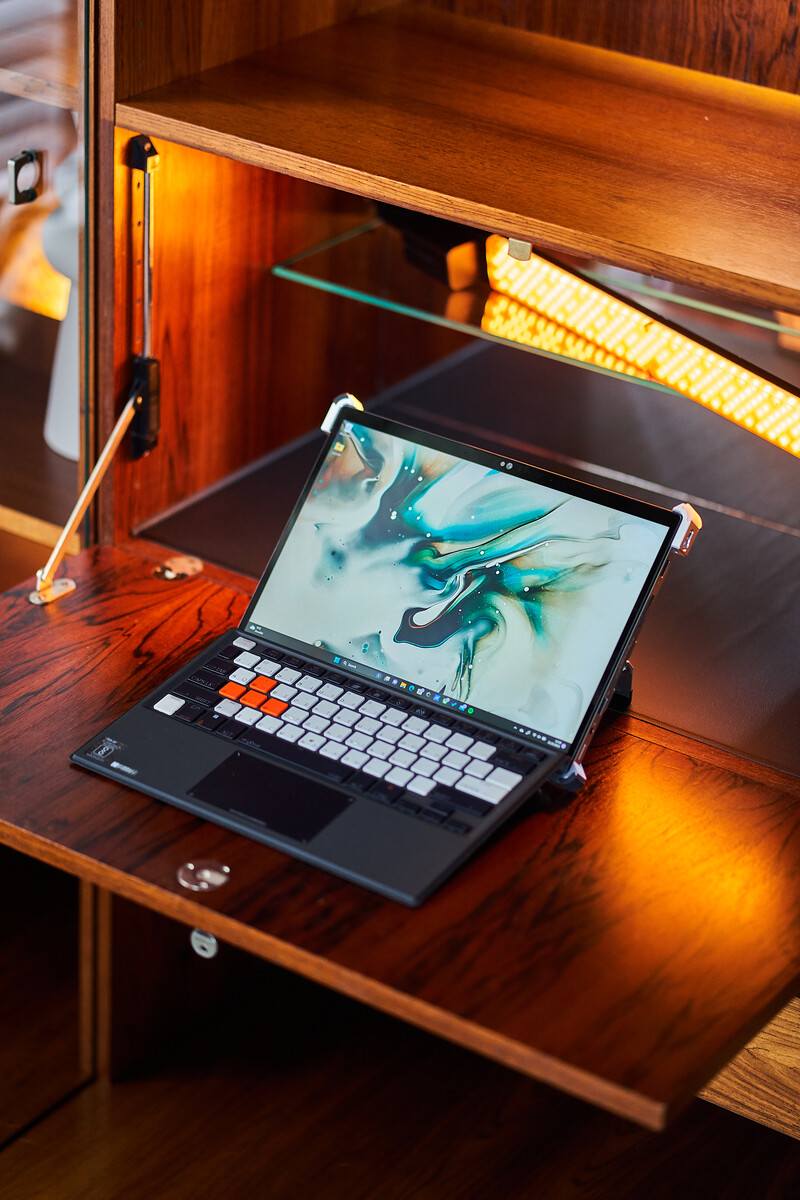
Estojo - Fluxo Z13 com chassi de alumínio de impacto
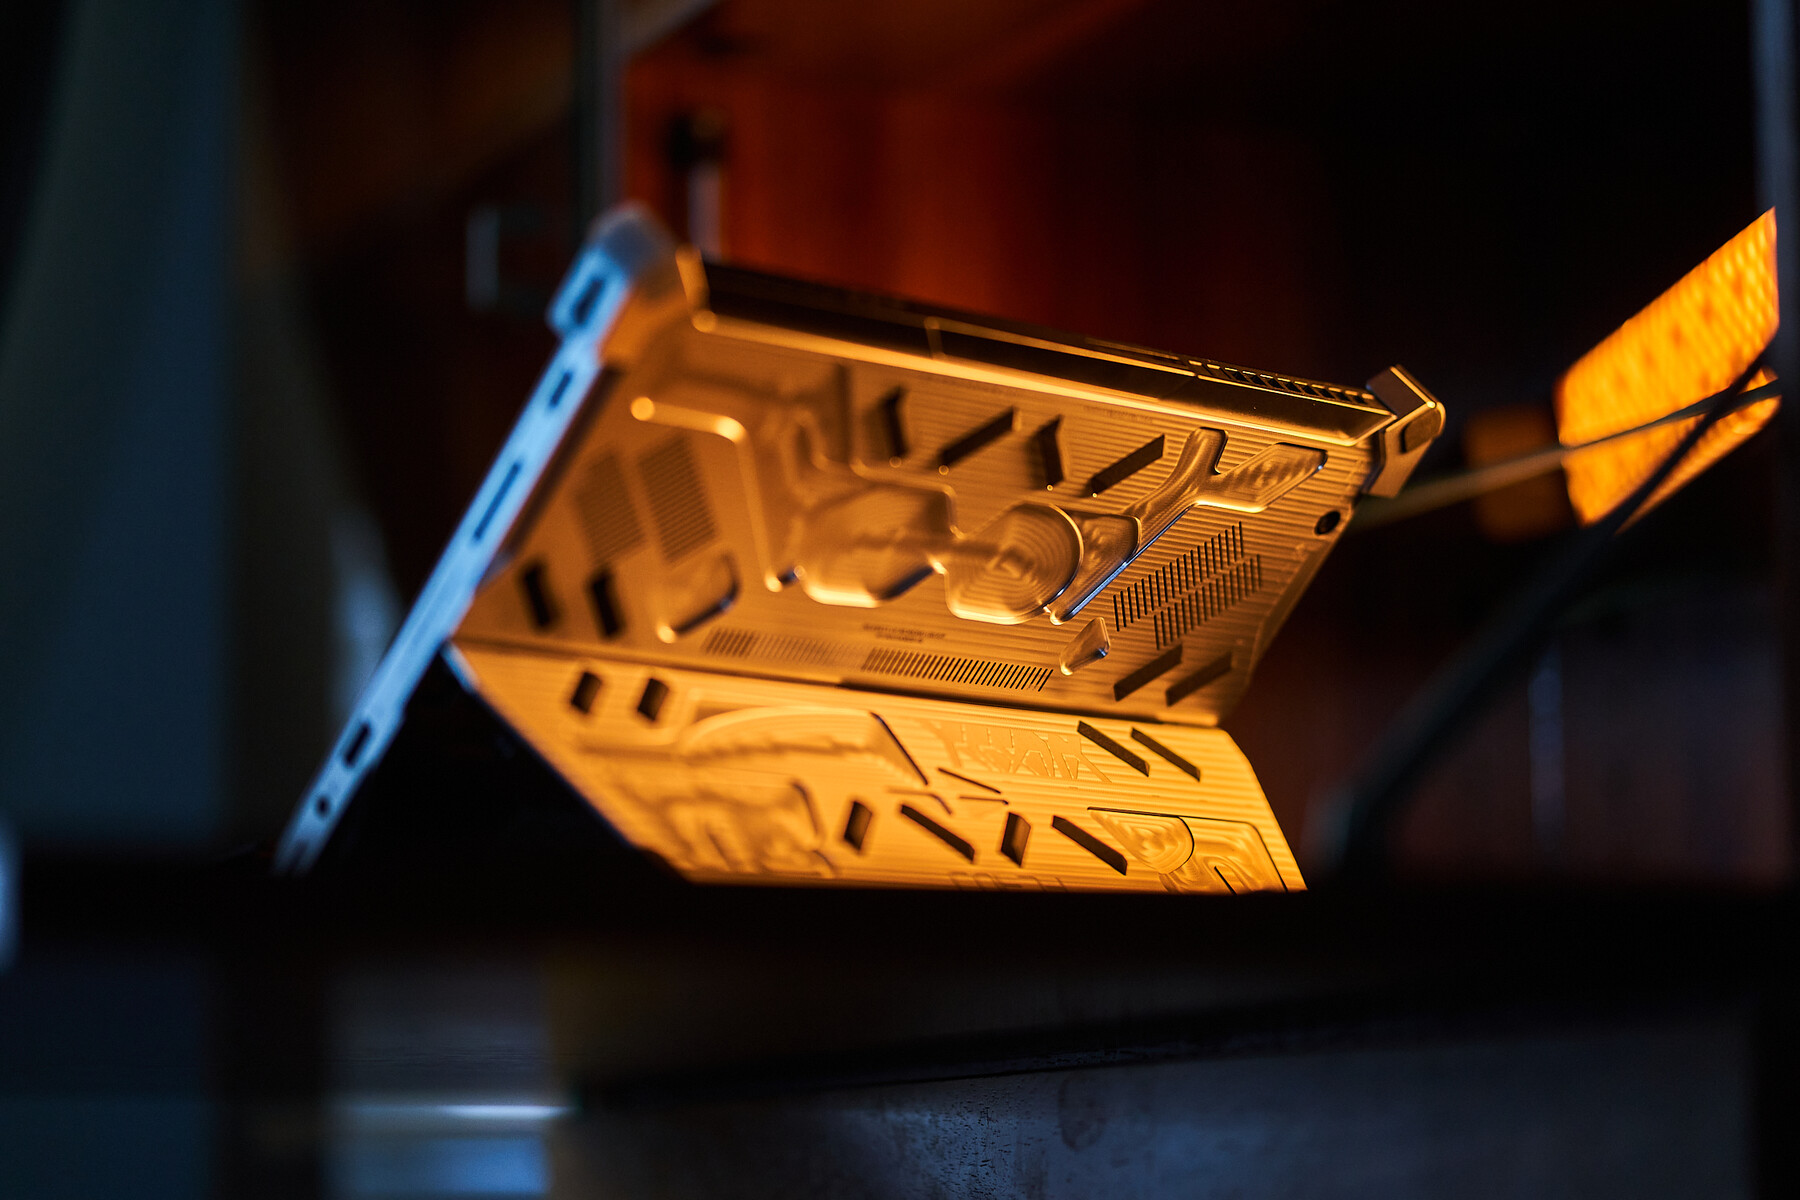
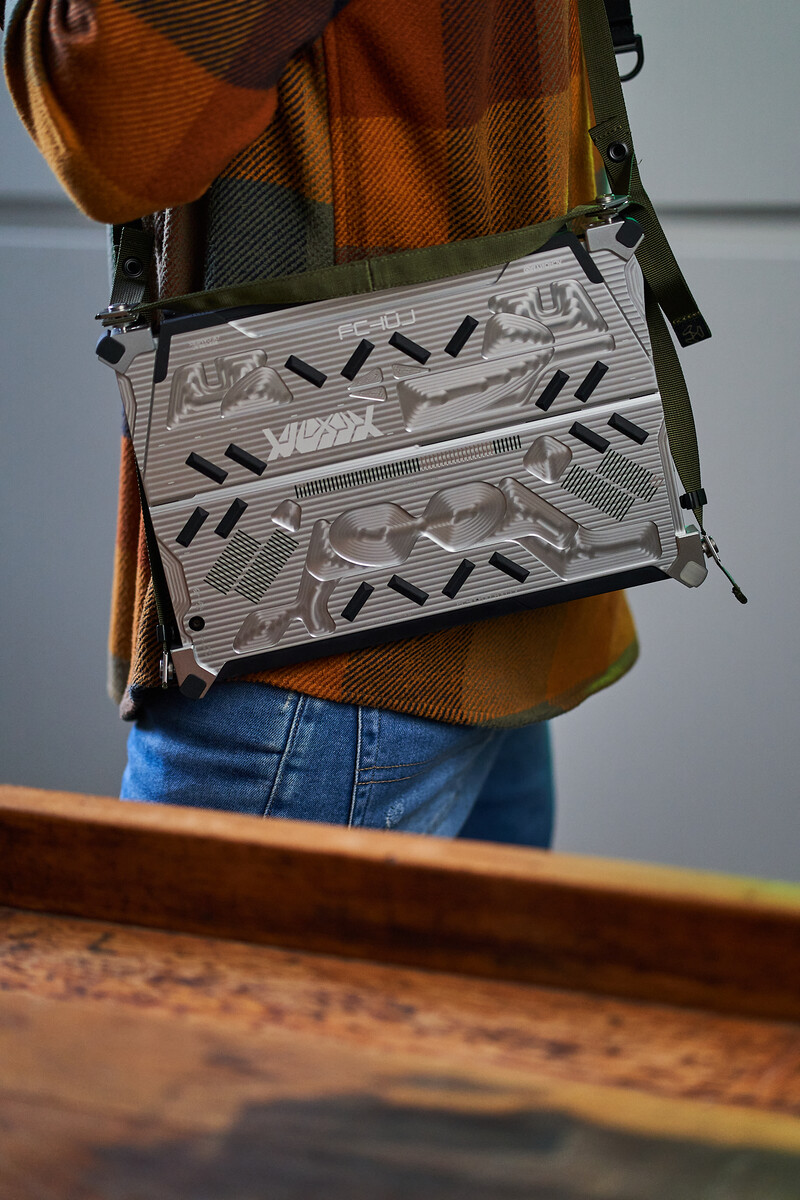
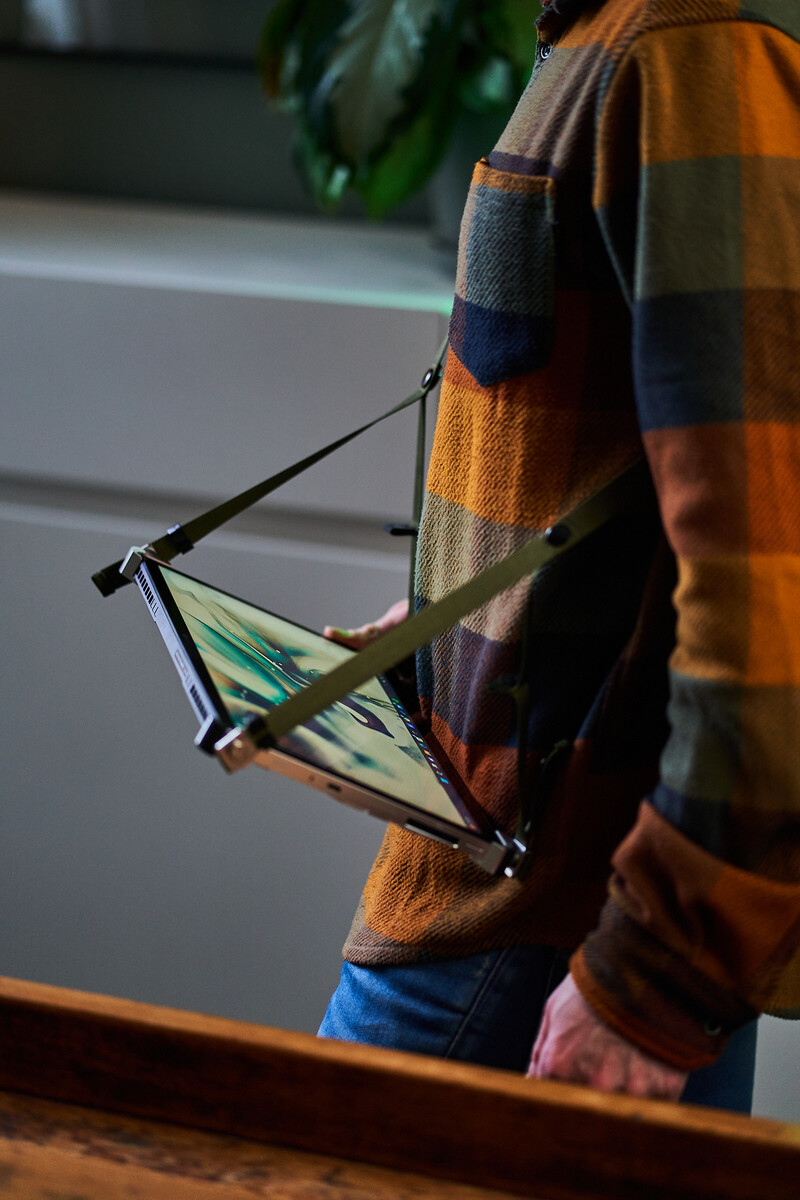
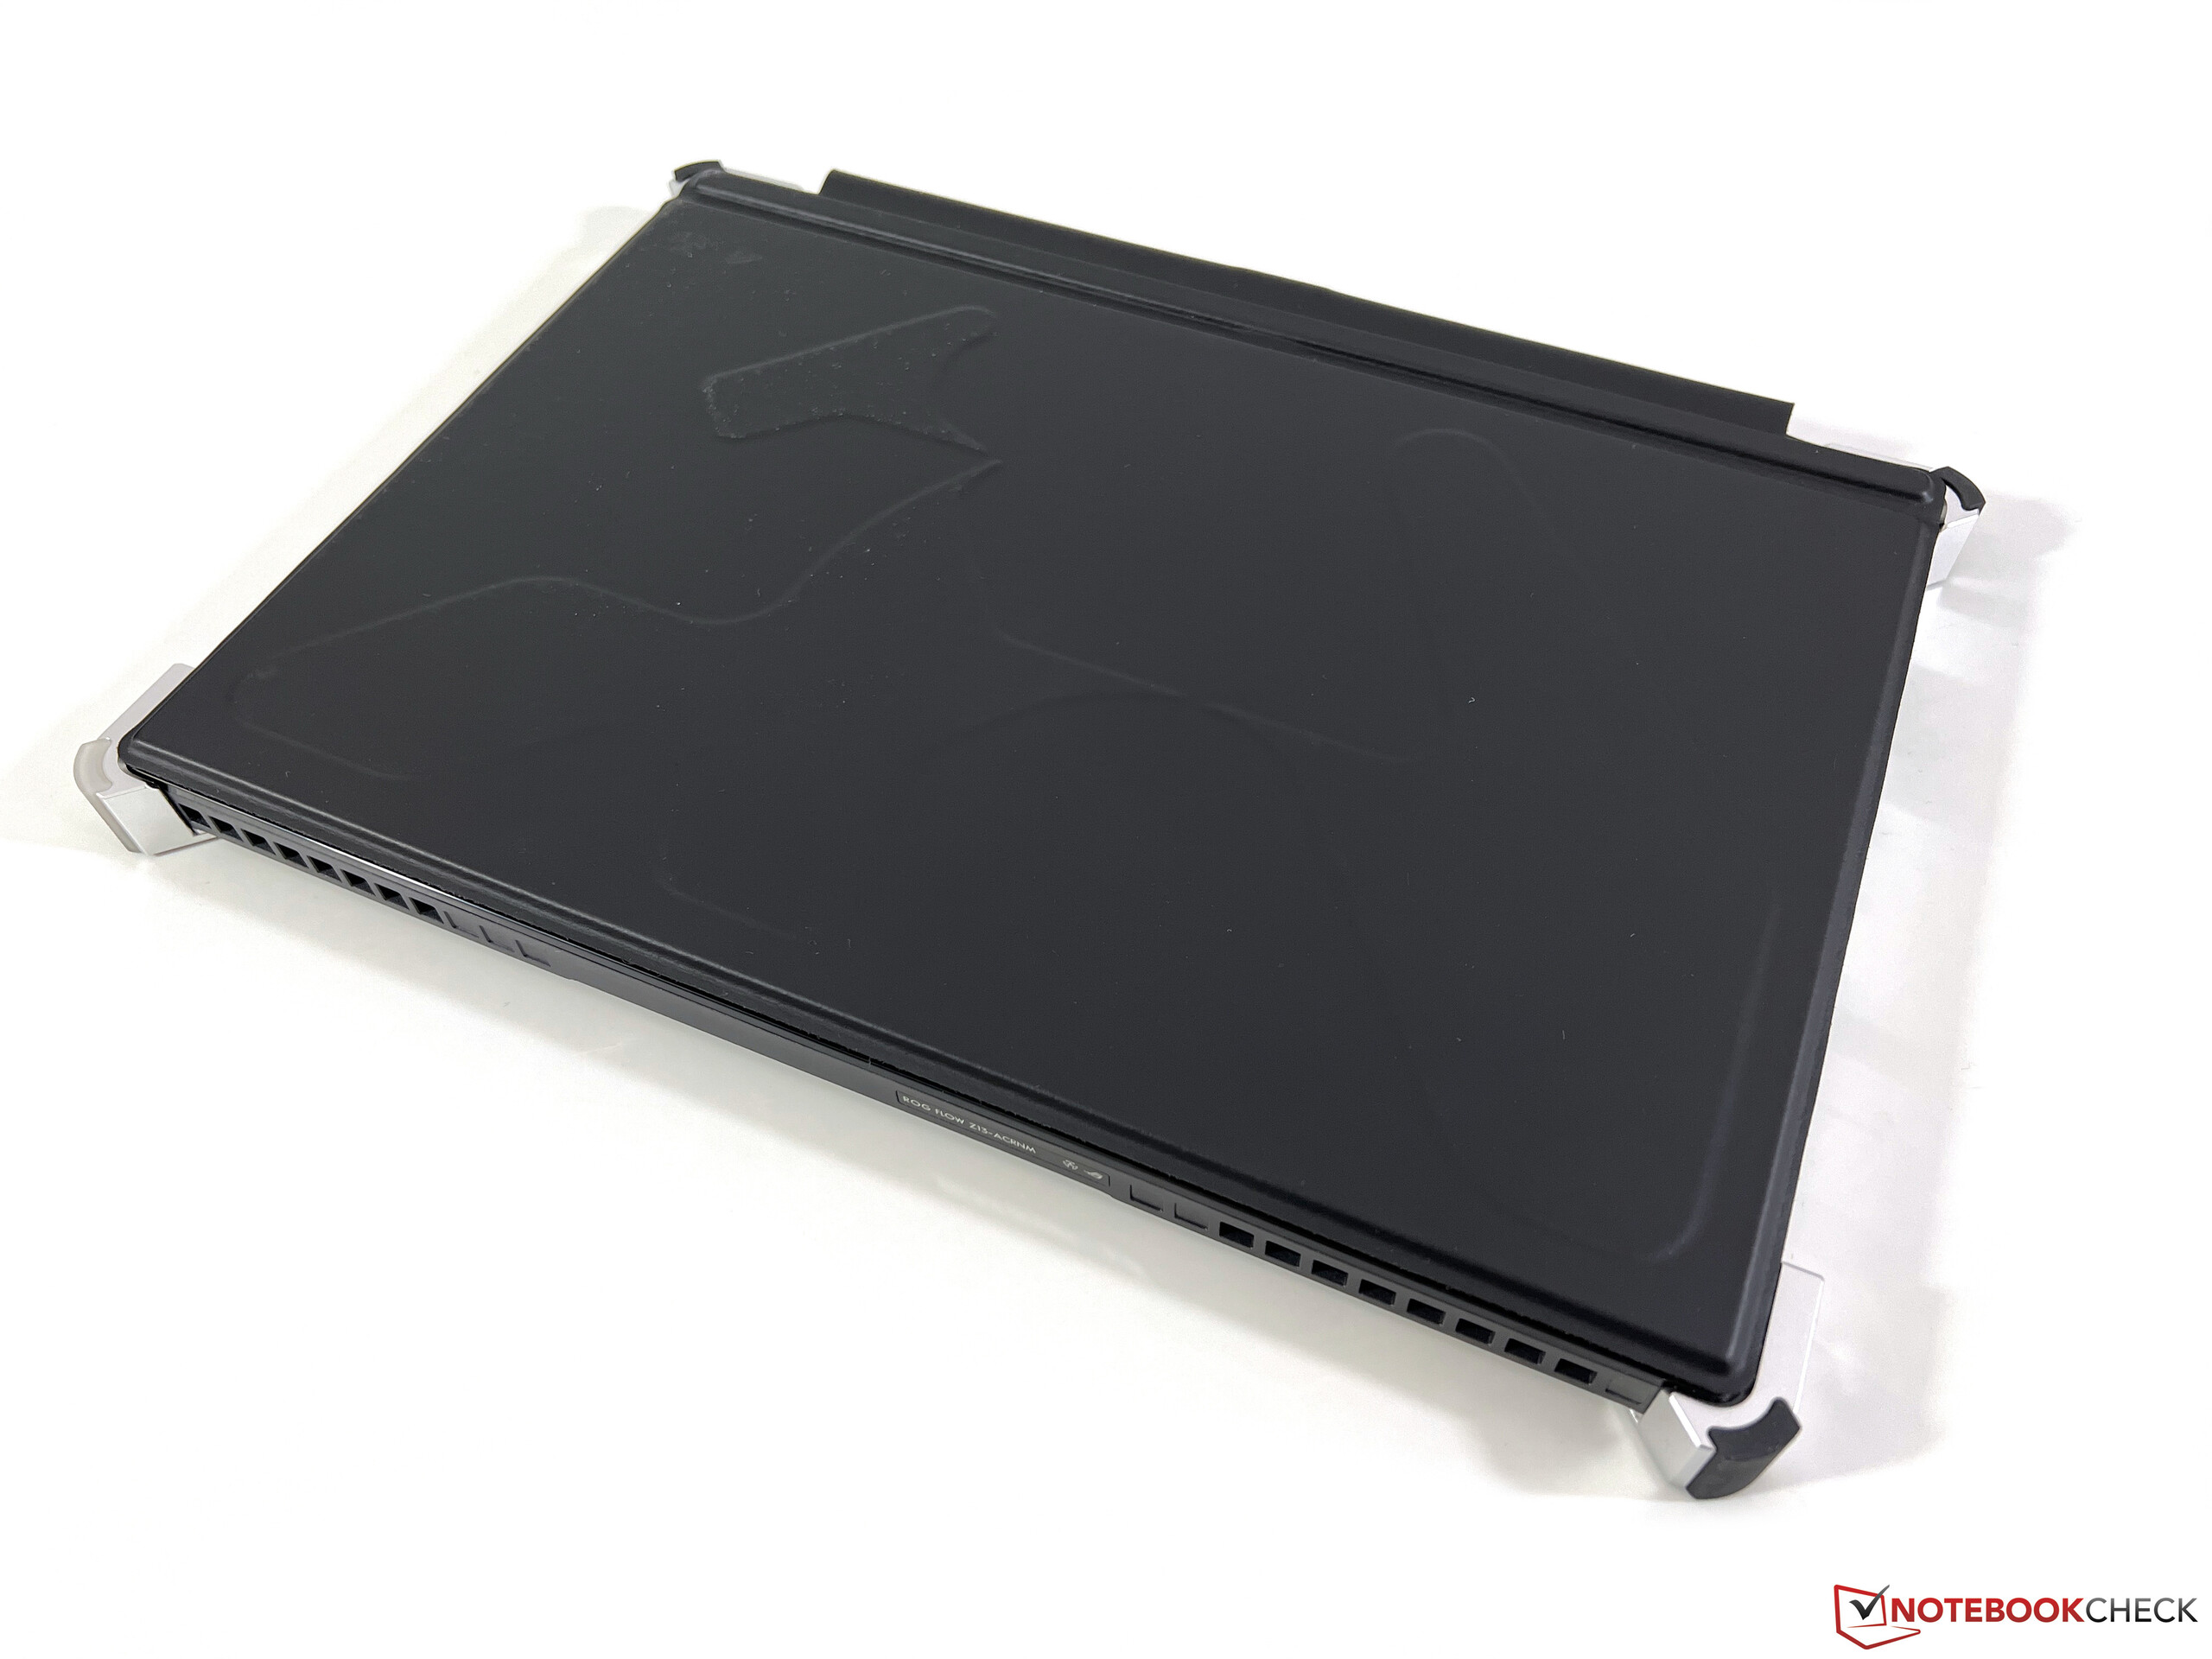
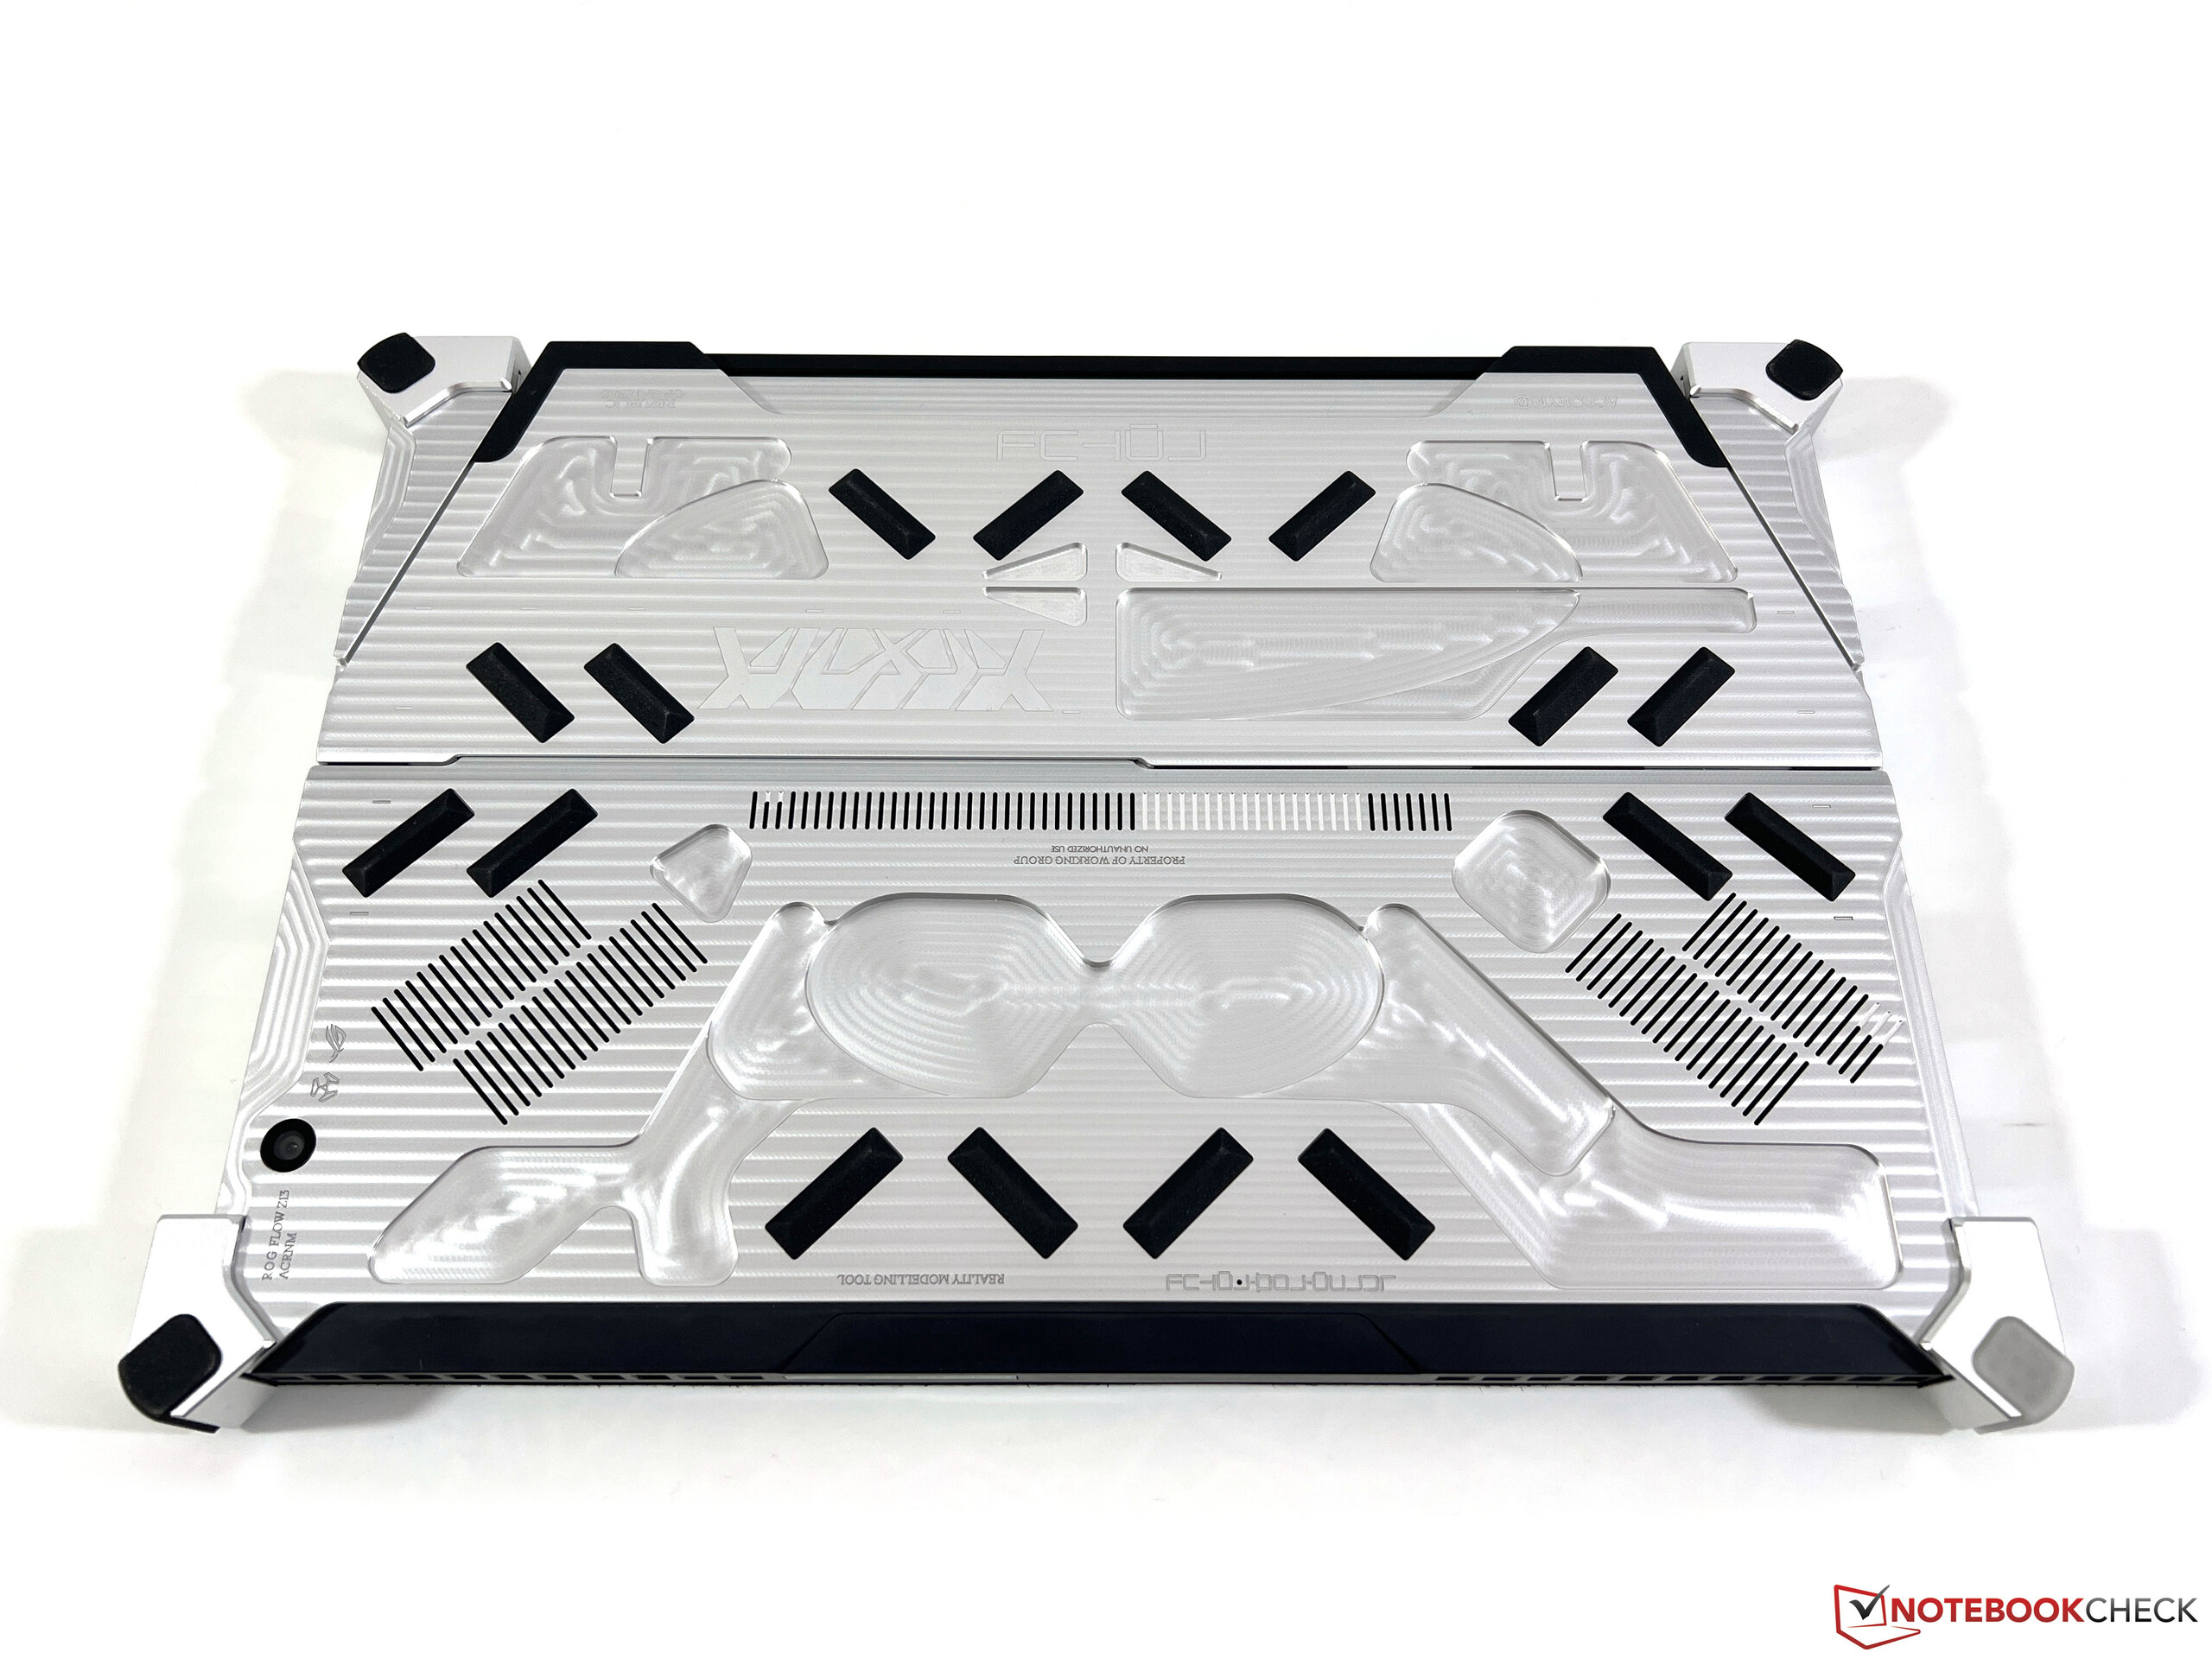
Você pode ver imediatamente que a edição especial da ACRNM utiliza um chassi completamente diferente em comparação com o chassi normalFluxo ROG Z13. A característica mais marcante é a tampa traseira de alumínio usinado CNC e você pode realmente ver onde a máquina removeu o material. Asus também incluiu tiras de borracha para melhor aderência e há material adicional ao redor dos cantos. O ROG Flow Z13 ACRNM quase parece uma pastilha robusta e a estabilidade certamente satisfaria os requisitos, mas o dispositivo também é bastante pesado como resultado, com 1,7 kg (conversível + tampa do teclado). O Asus também sabe disso e os quatro cantos também são pontos de fixação para as alças incluídas. Elas podem ser usadas para carregar o dispositivo como uma bolsa ao redor do ombro ou usá-lo na frente do corpo, o que está ilustrado nas fotos abaixo.
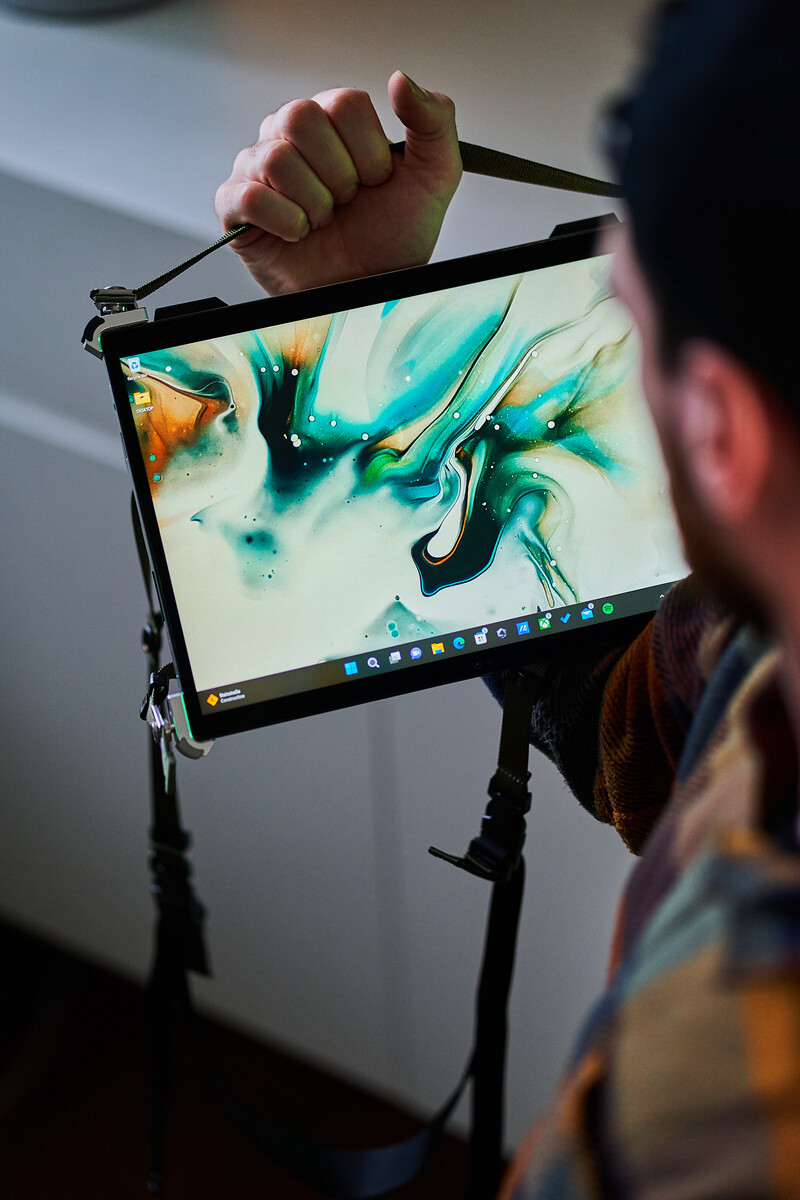
O chicote integrado na parte traseira também deixa uma boa impressão e não há oscilação nas dobradiças. Gostamos particularmente do fato de que os cantos do kickstand também são emborrachados, o que significa que não há arranhões e é possível até mesmo usar o conversível no modo retrato.
Em resumo, a edição ACRNM do ROG Flow Z13 é definitivamente um design muito marcante e nem todos vão gostar dele. Nós gostamos dele e achamos que se adapta à orientação do dispositivo. Não é possível abrir o chassi para limpar os ventiladores, por exemplo, mas é possível ao menos acessar o compacto M.2-2230 SSD através da escotilha de manutenção na parte de trás.
Já mencionamos o alto peso de 1,7 kg (seção em pastilhas ~1,3 kg) e o chassi também é mais volumoso em comparação com o normalFluxo ROG Z13. O adaptador de energia compacto de 130W ponta a escala em 565 gramas.
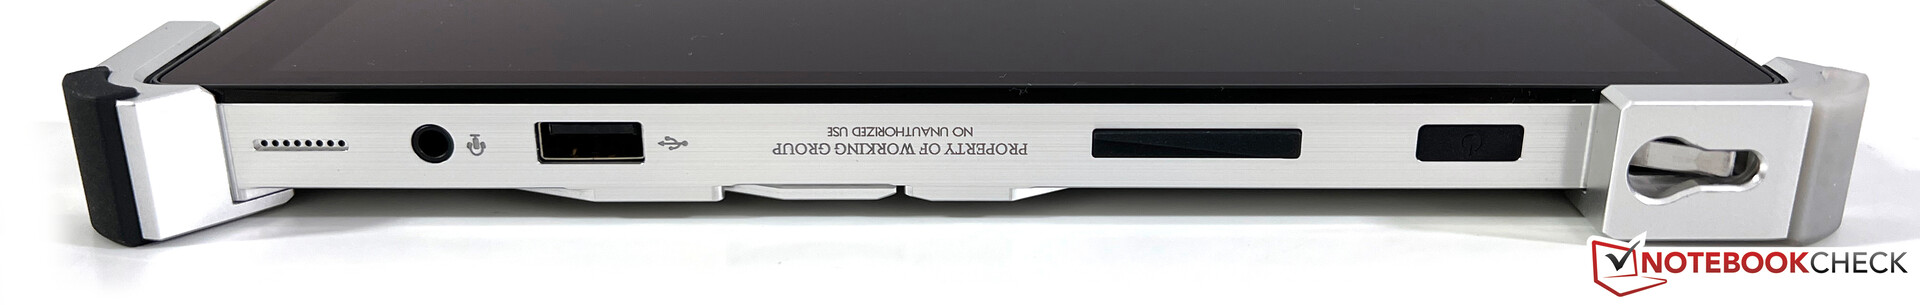
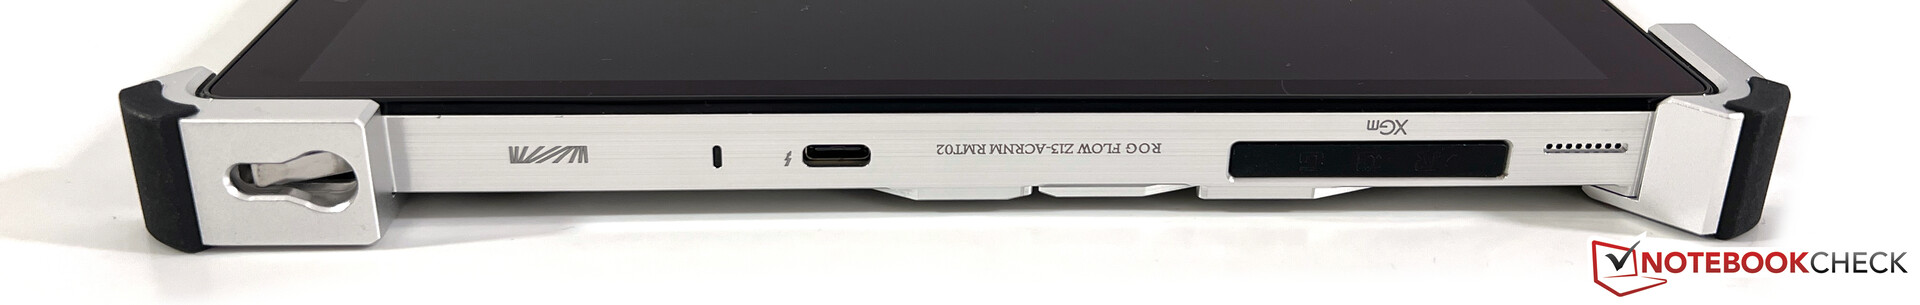
Conectividade - Thunderbolt e eGPU
O fluxo Z13 ainda é um conversível, portanto, a variedade do porto é limitada. Entretanto, a situação não é tão ruim e você obtém uma porta USB-A comum em combinação com duas portas USB-C, assim como o conector para a GPU externa. As duas portas USB-C podem ser usadas para carregar o conversível e também suportam a saída de vídeo.
Leitor de cartões SD
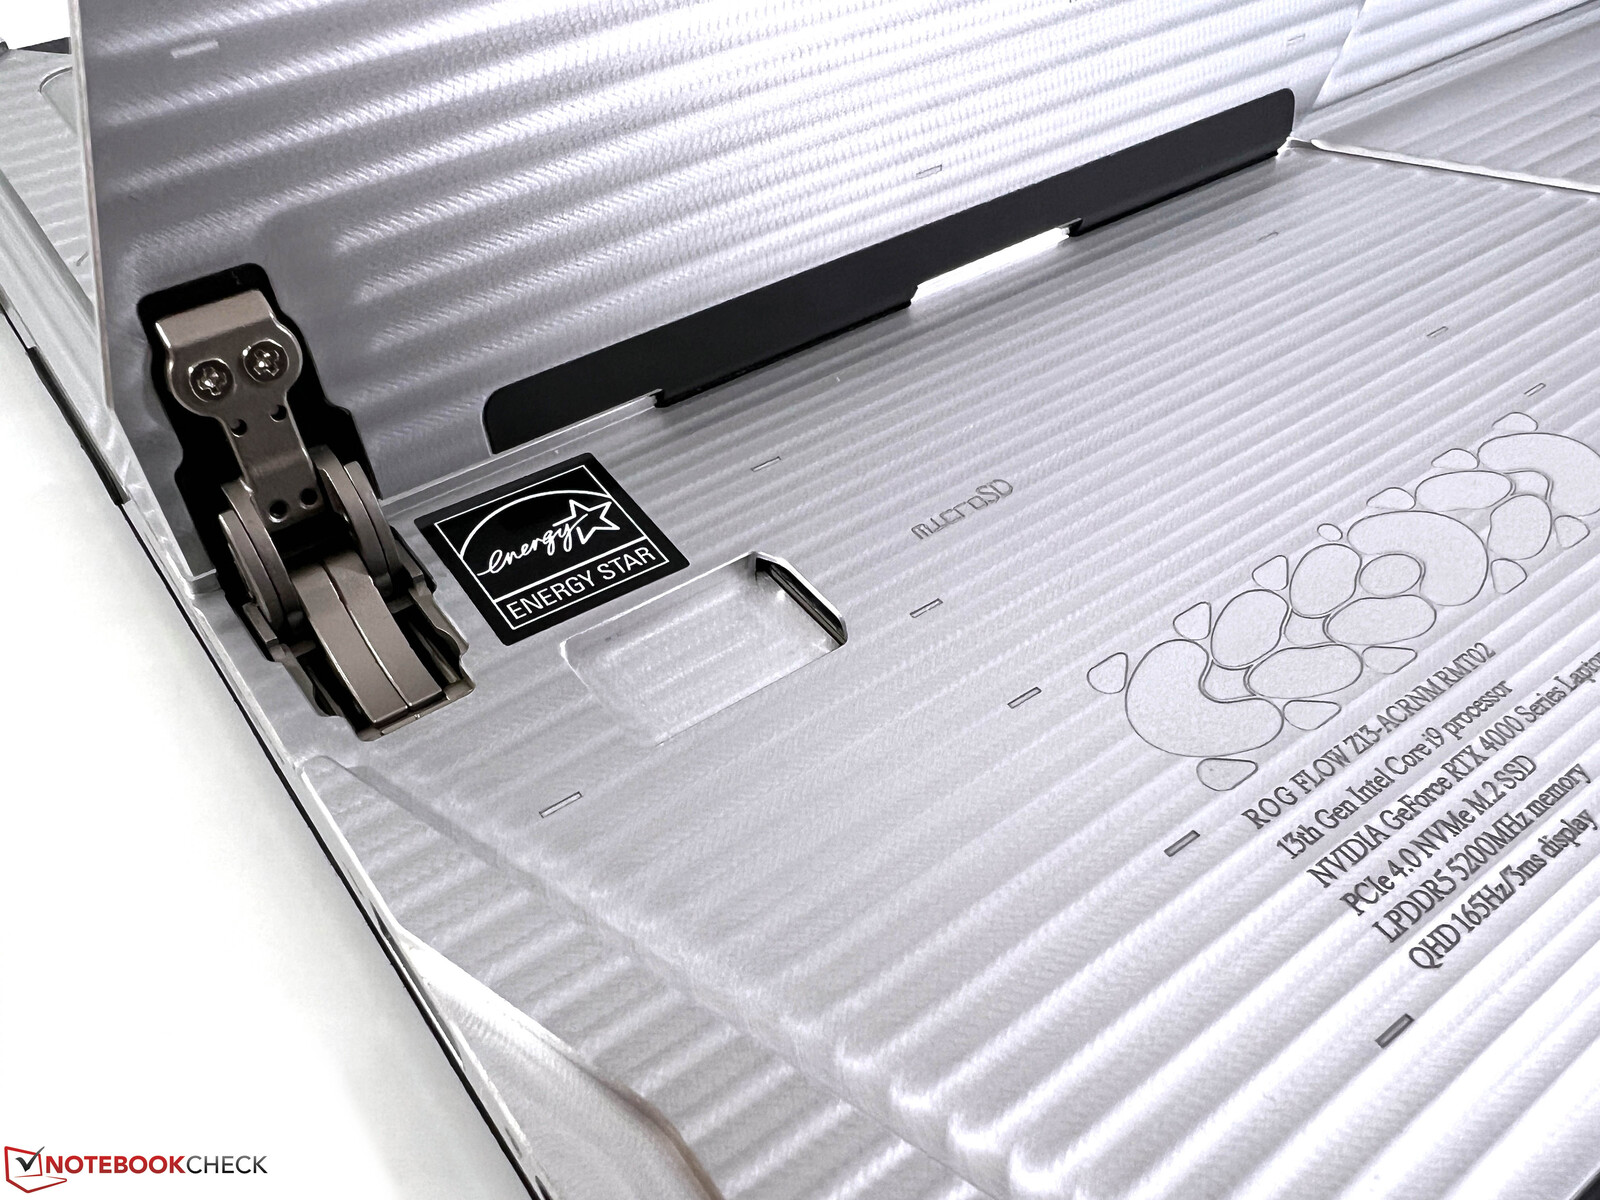
A Asus implementou um leitor microSD (mecanismo de mola) atrás do suporte de chute, que é de fácil acesso. Medimos taxas de transferência de até 211 MB/s e 190 MB/s quando copiamos arquivos de imagem de nosso cartão de referência (Angelbird AV Pro V60).
| SD Card Reader | |
| average JPG Copy Test (av. of 3 runs) | |
| Alienware x14 i7 RTX 3060 (Angelbird AV Pro V60) | |
| Asus ROG Flow Z13 ACRNM (Angelbird AV Pro V60) | |
| Asus ROG Zephyrus G14 GA402RK (AV PRO microSD 128 GB V60) | |
| Média da turma Gaming (20.9 - 210, n=54, últimos 2 anos) | |
| Asus ROG Flow Z13 GZ301ZE (Angelbird AV Pro V60) | |
| maximum AS SSD Seq Read Test (1GB) | |
| Asus ROG Flow Z13 GZ301ZE (Angelbird AV Pro V60) | |
| Alienware x14 i7 RTX 3060 (Angelbird AV Pro V60) | |
| Asus ROG Flow Z13 ACRNM (Angelbird AV Pro V60) | |
| Asus ROG Zephyrus G14 GA402RK (AV PRO microSD 128 GB V60) | |
| Média da turma Gaming (25.5 - 261, n=51, últimos 2 anos) | |
Comunicação
O ROG Flow Z13 utiliza o atual módulo Intel Wi-Fi AX211, que também suporta o mais recente padrão Wi-Fi 6E. Entretanto, pudemos estabelecer uma conexão com a rede correspondente de 6 GHz de nosso roteador de referência da Asus, mas o desempenho com a rede de 5 GHz também foi muito bom e estável.
| Networking | |
| Asus ROG Flow Z13 ACRNM | |
| iperf3 transmit AXE11000 | |
| iperf3 receive AXE11000 | |
| Asus ROG Flow Z13 GZ301ZE | |
| iperf3 transmit AX12 | |
| iperf3 receive AX12 | |
| Alienware x14 i7 RTX 3060 | |
| iperf3 transmit AX12 | |
| iperf3 receive AX12 | |
| Razer Blade 14 Ryzen 9 6900HX | |
| iperf3 transmit AX12 | |
| iperf3 receive AX12 | |
| Asus ROG Zephyrus G14 GA402RK | |
| iperf3 transmit AXE11000 | |
| iperf3 receive AXE11000 | |
Webcam
Além de uma câmera IR de 5 MP para Windows Olá, o Asus também inclui uma nova câmera de 13 MP na moldura superior do visor. A qualidade da imagem é muito melhor em comparação com as câmeras normais de 720p ou mesmo 1080p em laptops normais. Também incluímos uma amostra de gravação (vídeo e áudio) em nosso YouTube reviewpara que você possa ter uma melhor impressão do desempenho.


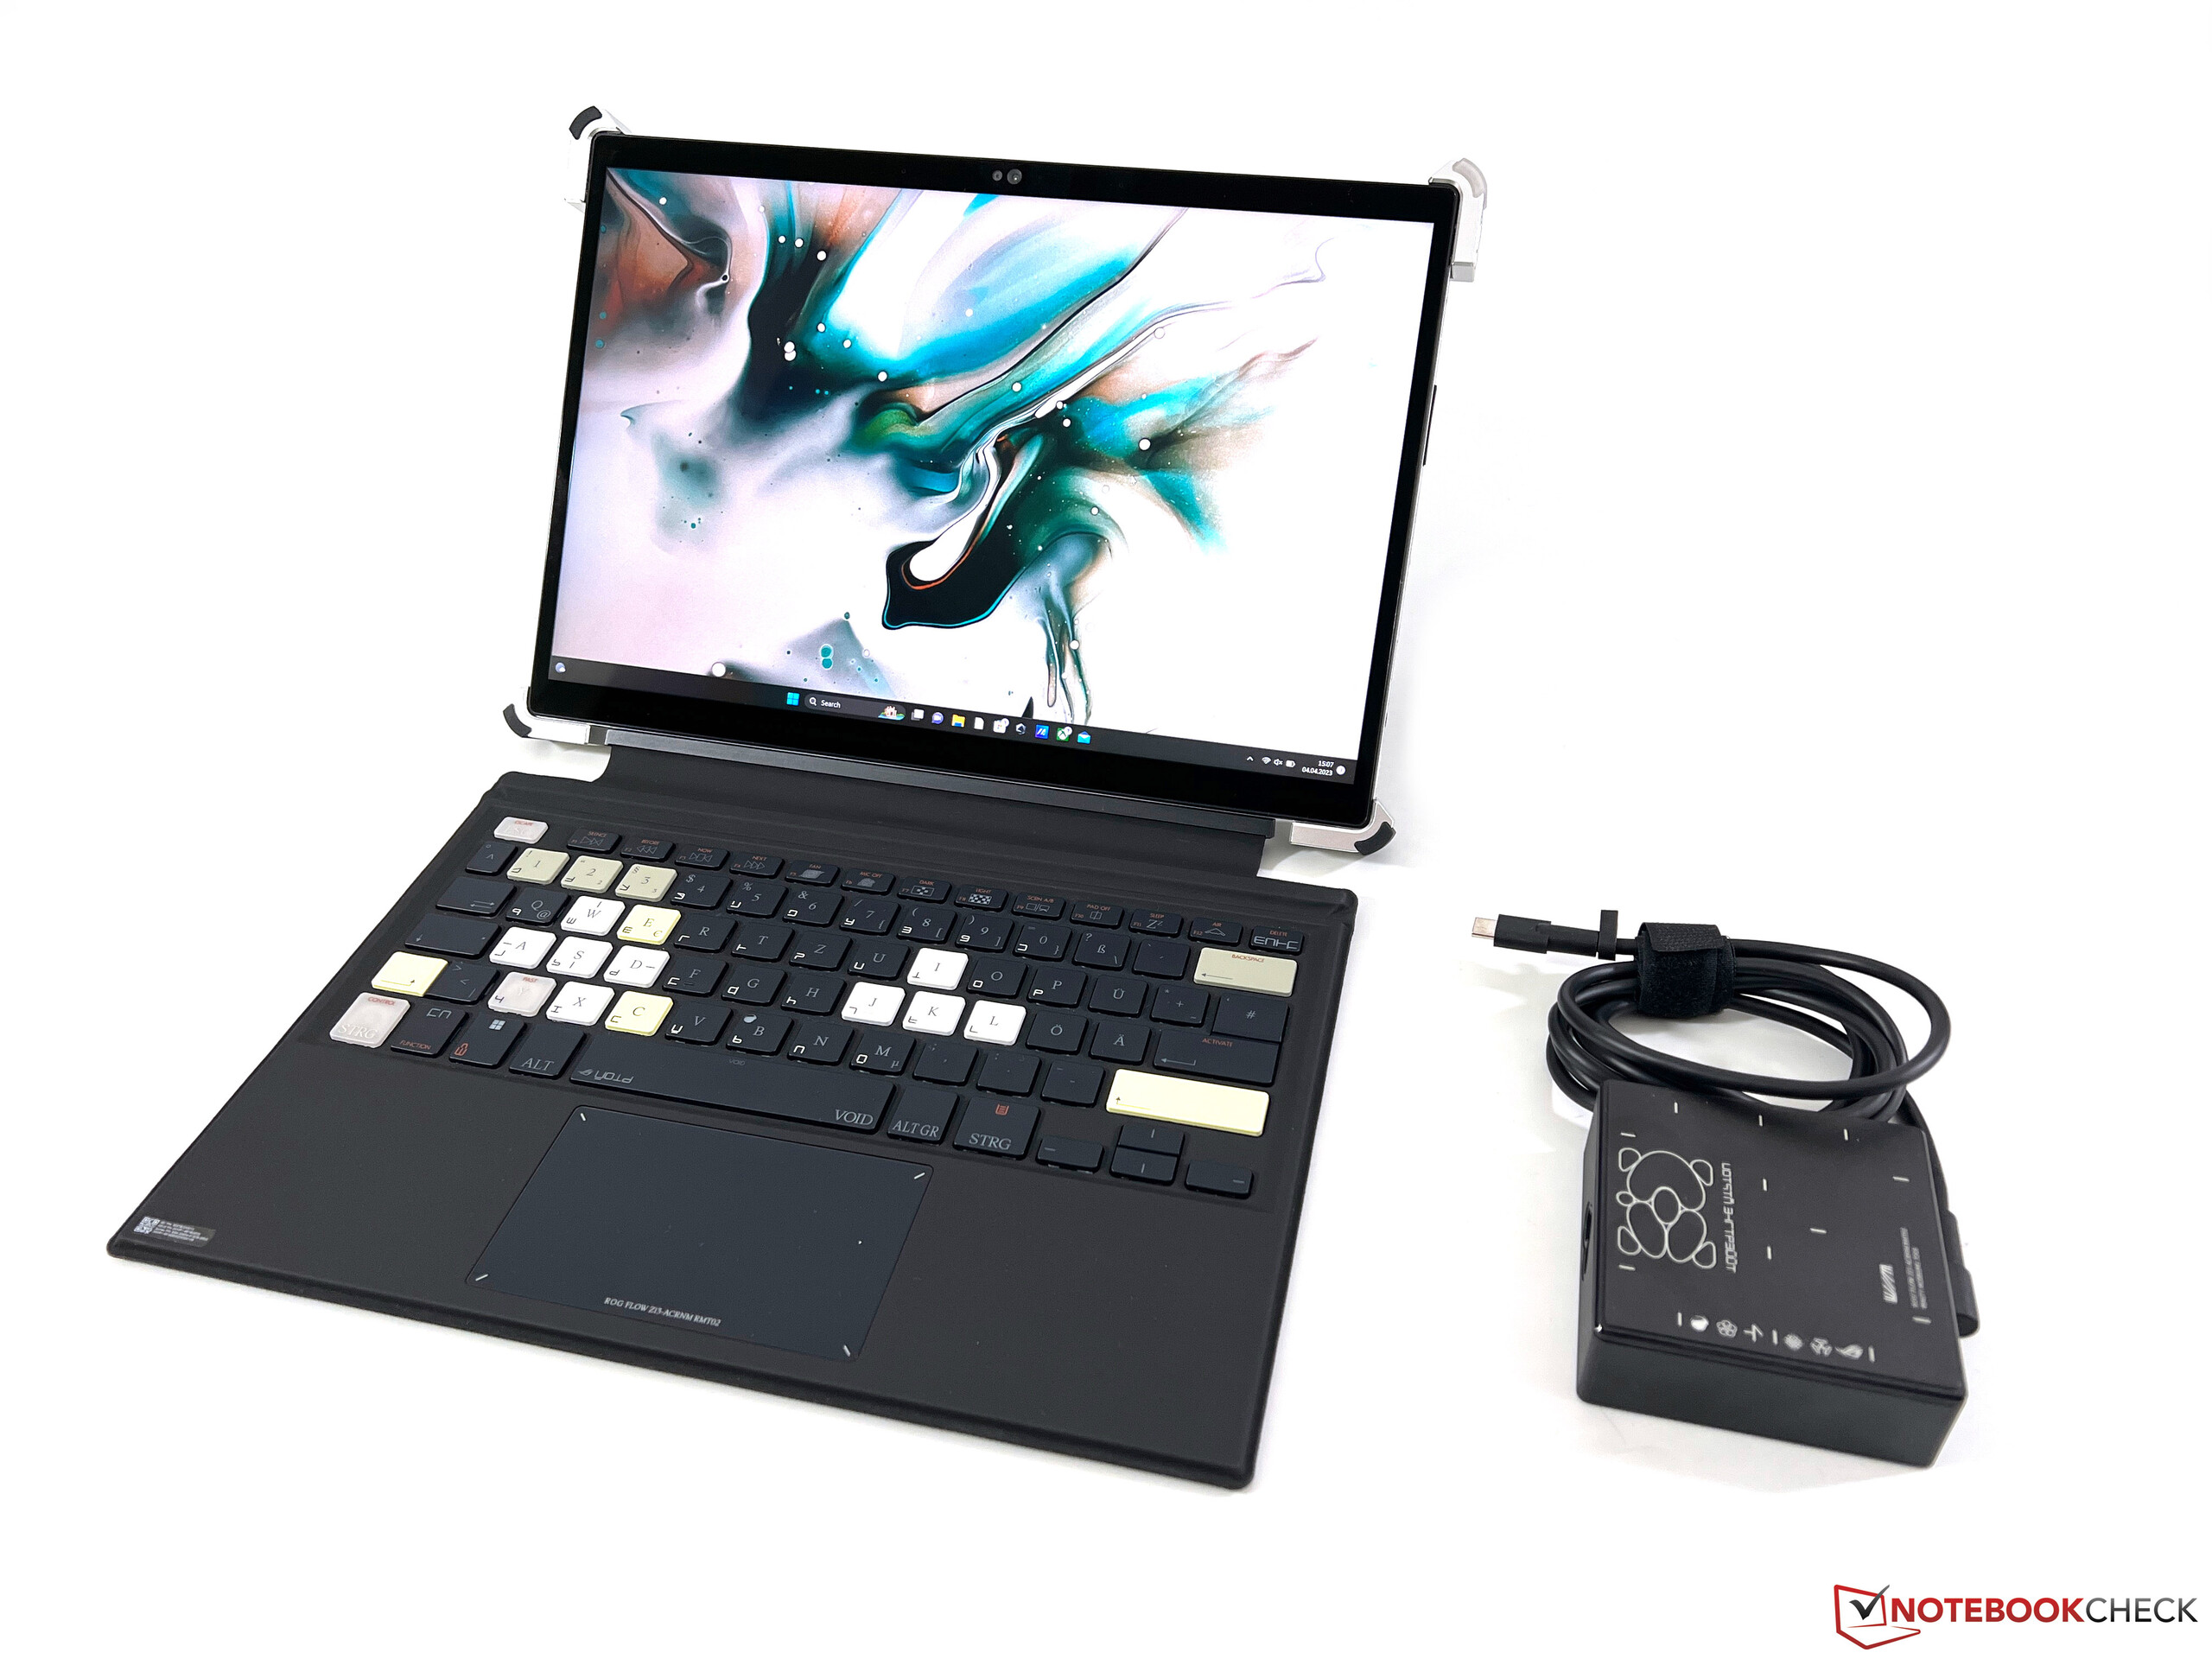
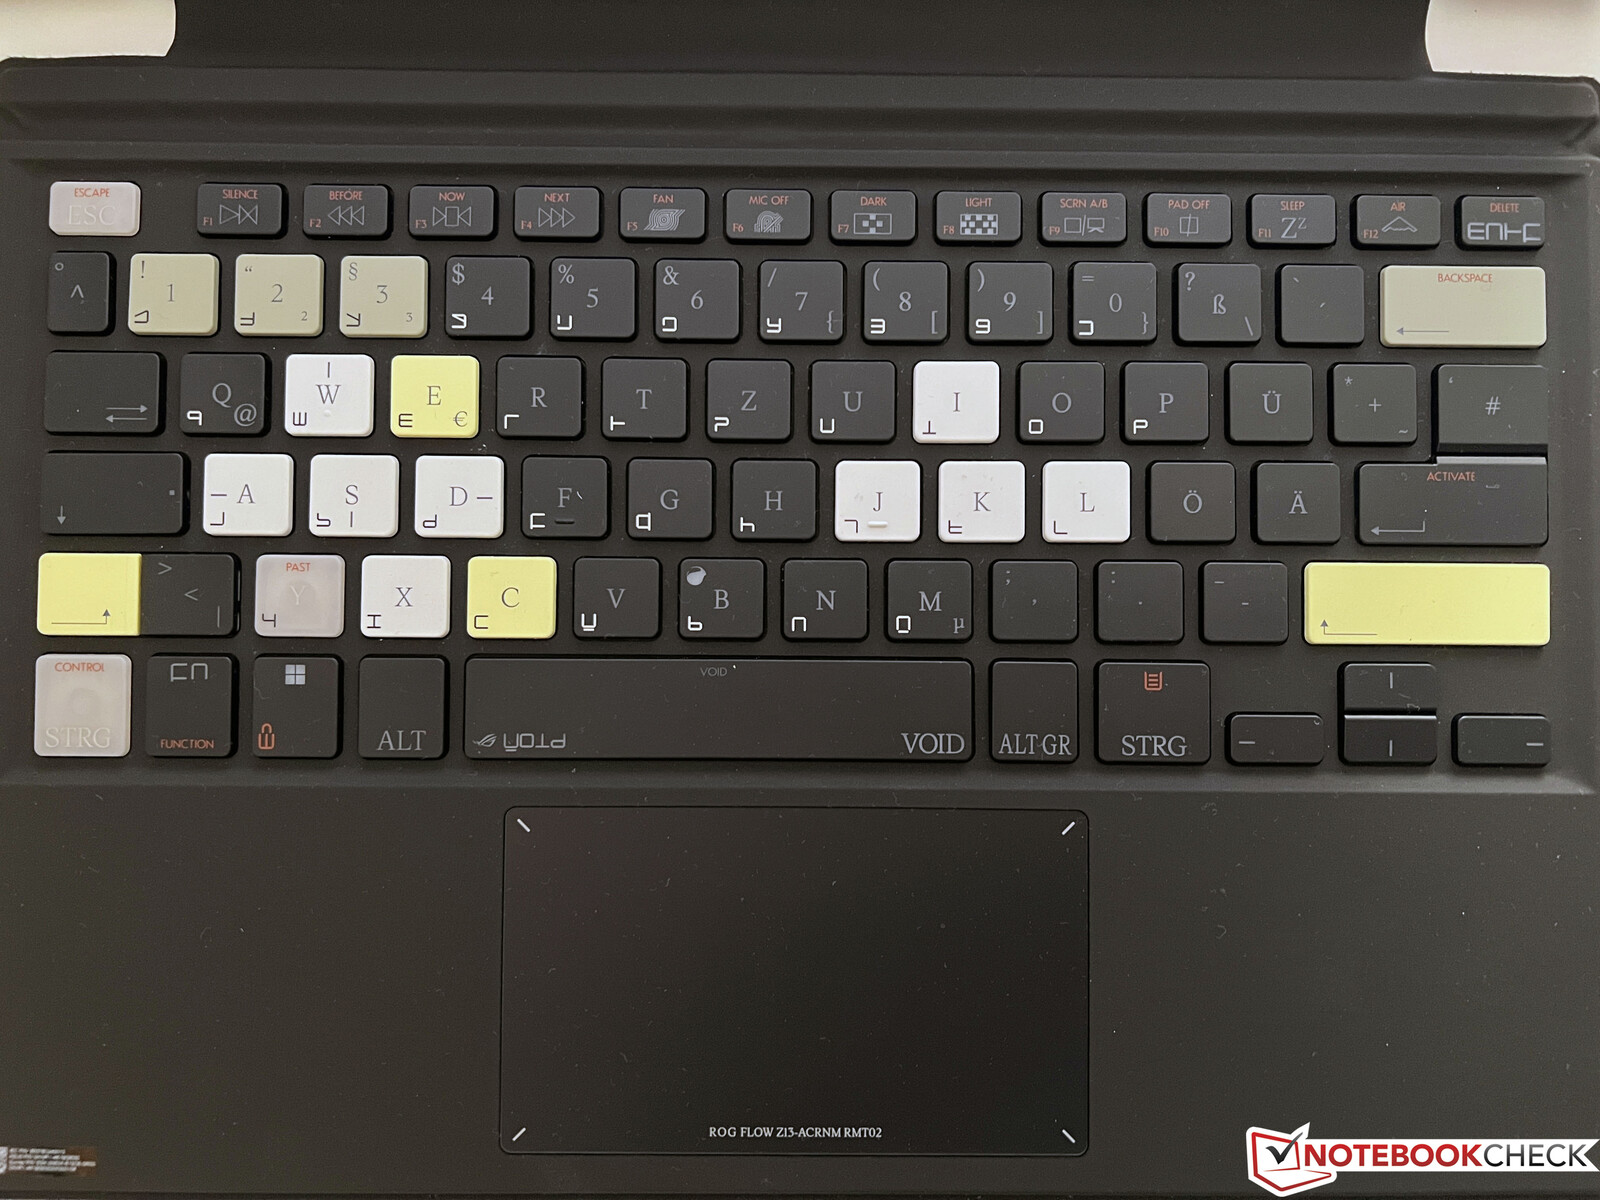
Dispositivos de entrada - ROG Flow com dois teclados
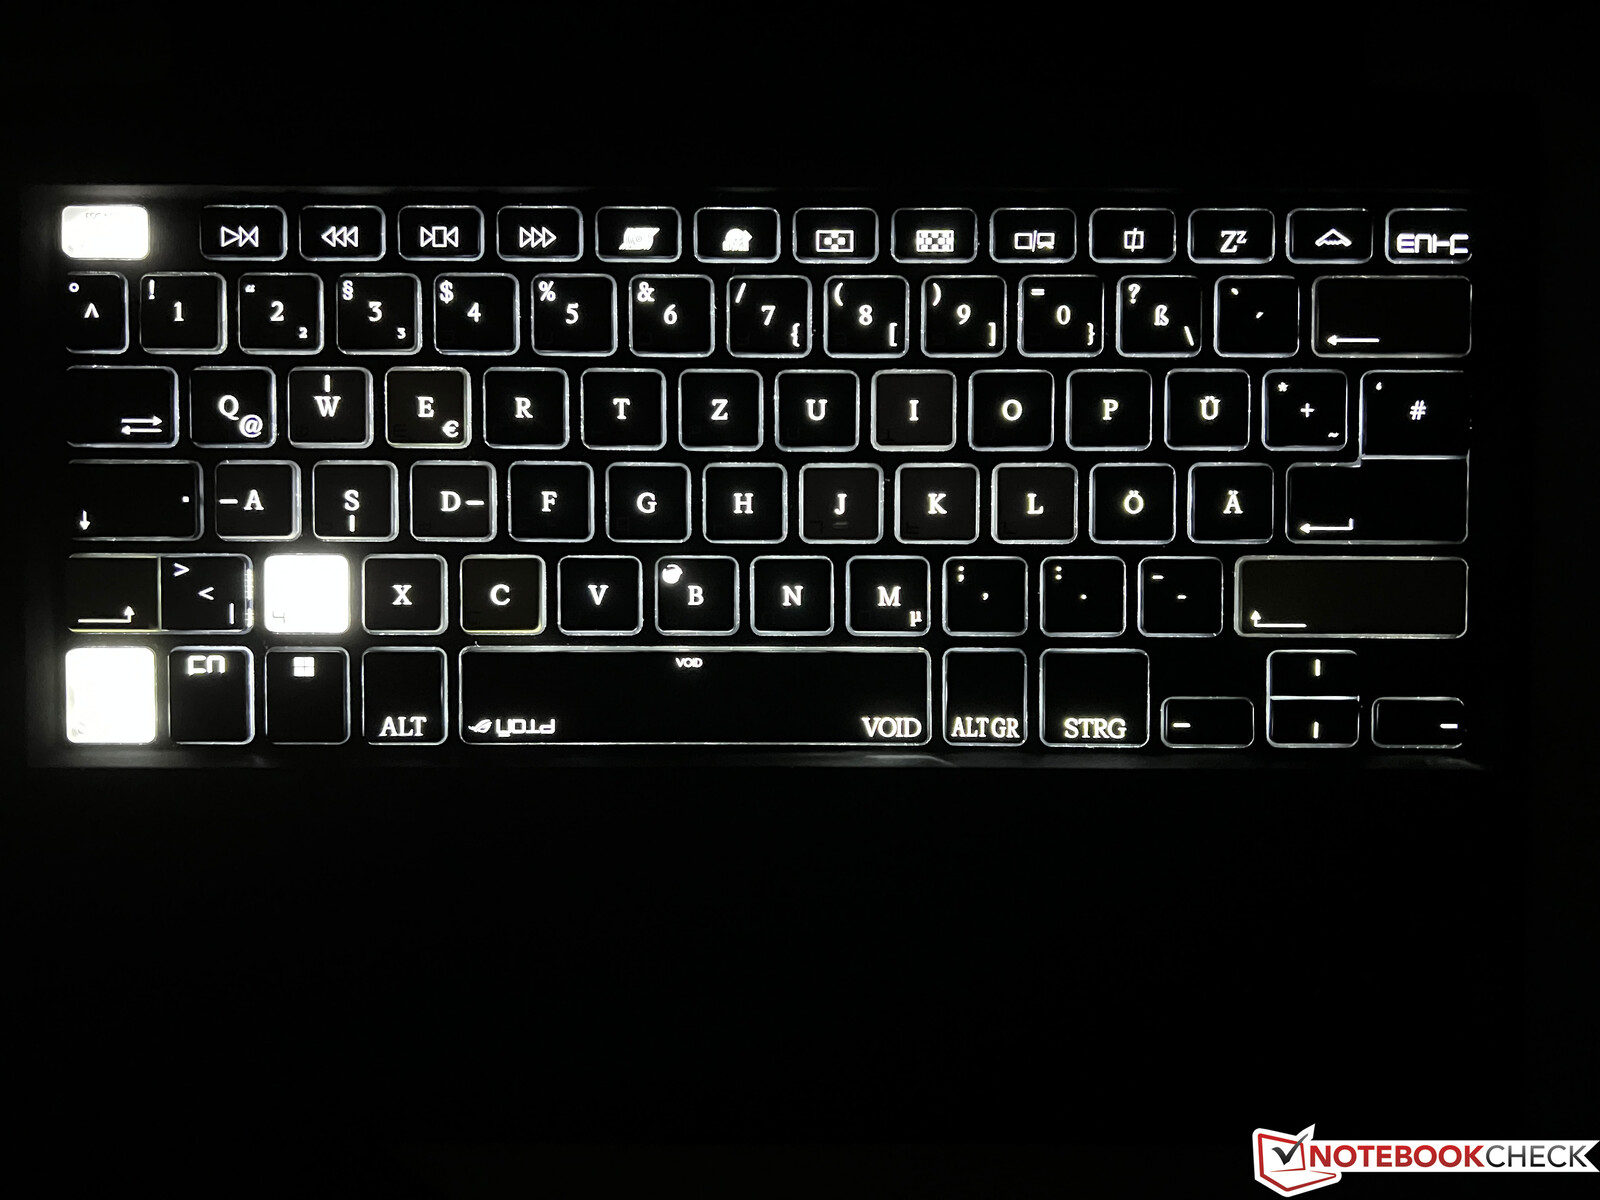
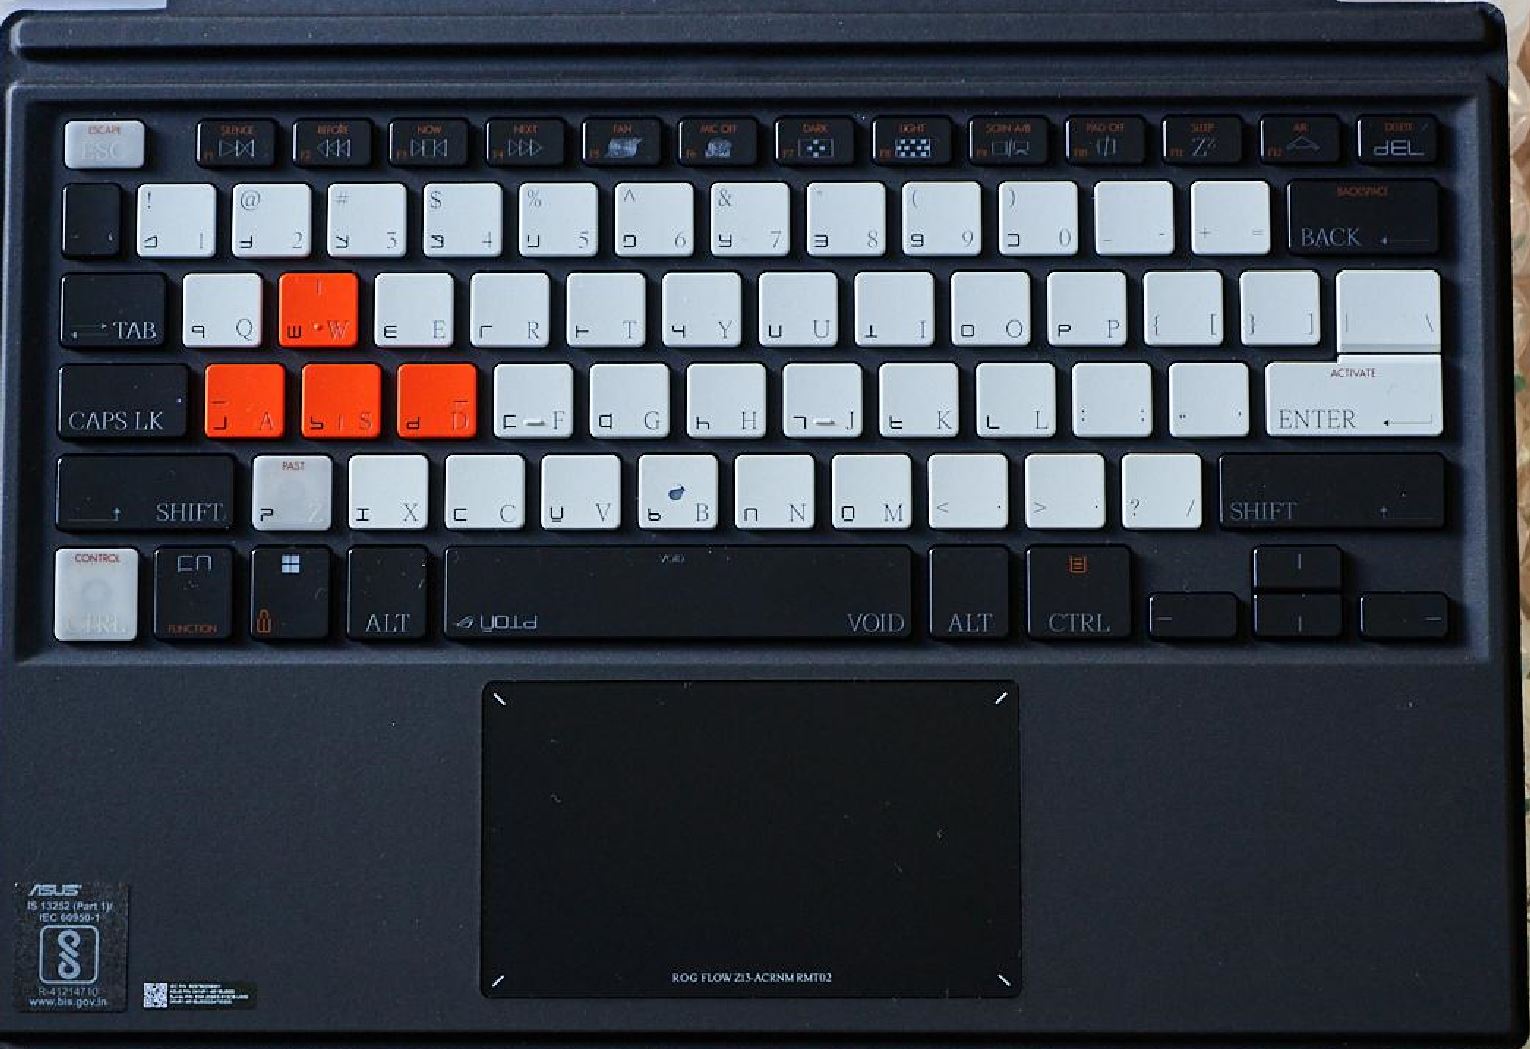
A Asus envia a edição ROG Flow z13 ACRNM com duas capas de teclado diferentes, que também são bastante pesadas (358 gramas) e grossas para um conversível. Como de costume, você pode usar o teclado em dois ângulos, ou plano na superfície ou ligeiramente inclinado. O teclado é surpreendentemente robusto e o percurso da chave também é bastante longo para um teclado destacável.
O design das teclas é tão incomum quanto o chassi e isso cria alguns problemas, já que os símbolos adicionais nas teclas podem ser bastante confusos diariamente quando não se pode digitar sem olhar. O contraste das teclas pretas simplesmente não é suficiente, enquanto os símbolos adicionais têm um alto contraste ao mesmo tempo, o que é irritante. O problema desaparece em ambientes escuros, já que a iluminação do teclado apenas ilumina os símbolos importantes.
O touchpad é bem pequeno a 10,5 x 6 cm e os sons de clique são bem altos, mas funciona bem. A tela tátil capacitiva não revela nenhum problema e você também pode usá-la com um digitalizador. O Asus envia o conversível com o estilete SA203 (4096 níveis de pressão) e não notamos nenhum problema.
Display - WQHD com 165 Hz
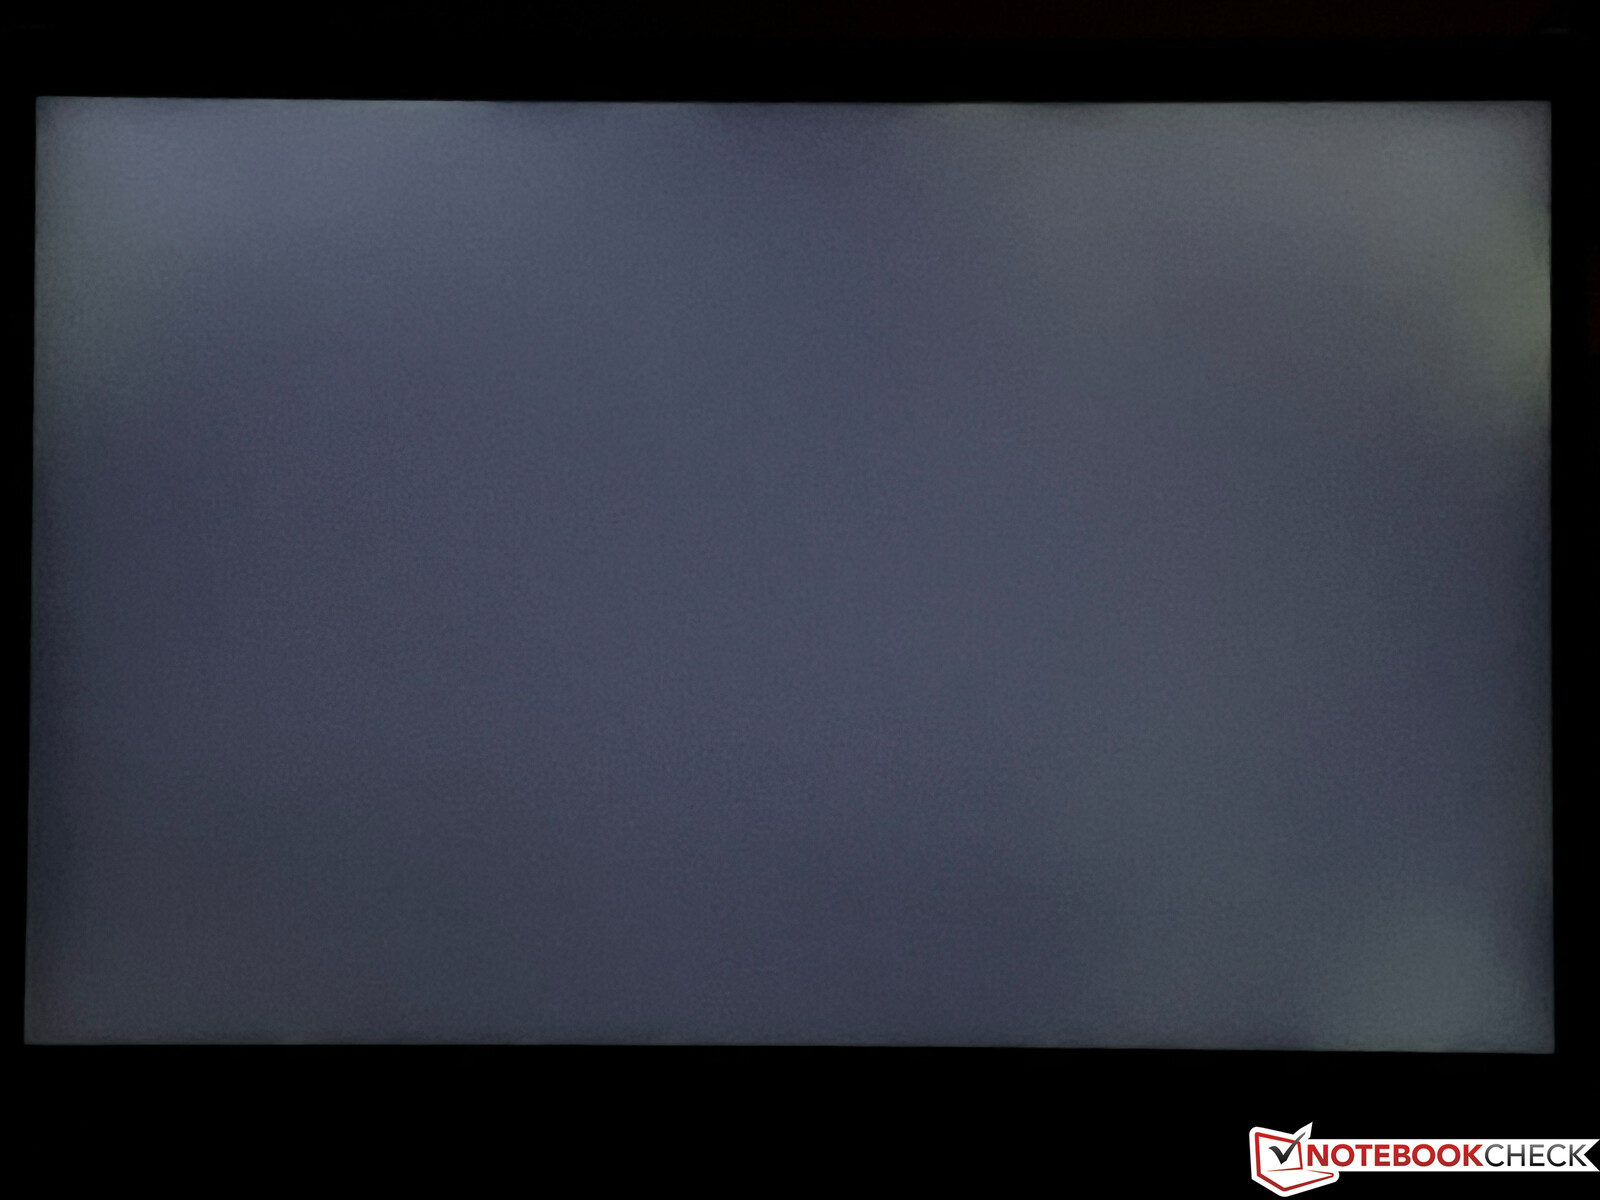
Asus também atualizou o display e não há diferença entre nossa edição ACRNM e a versão regular do ROG Flow Z13. Ambos usam um painel WQHD de maior resolução (2560 x 1600 pixels, 16:10) com uma taxa de atualização de 165 Hz mais alta. A qualidade da imagem subjetiva é excelente e os movimentos são muito suaves. Também determinamos tempos de resposta rápidos e não há sinal de PWM tremeluzente. Nossa unidade de revisão também não teve problemas maciços com sangramento de luz de fundo.
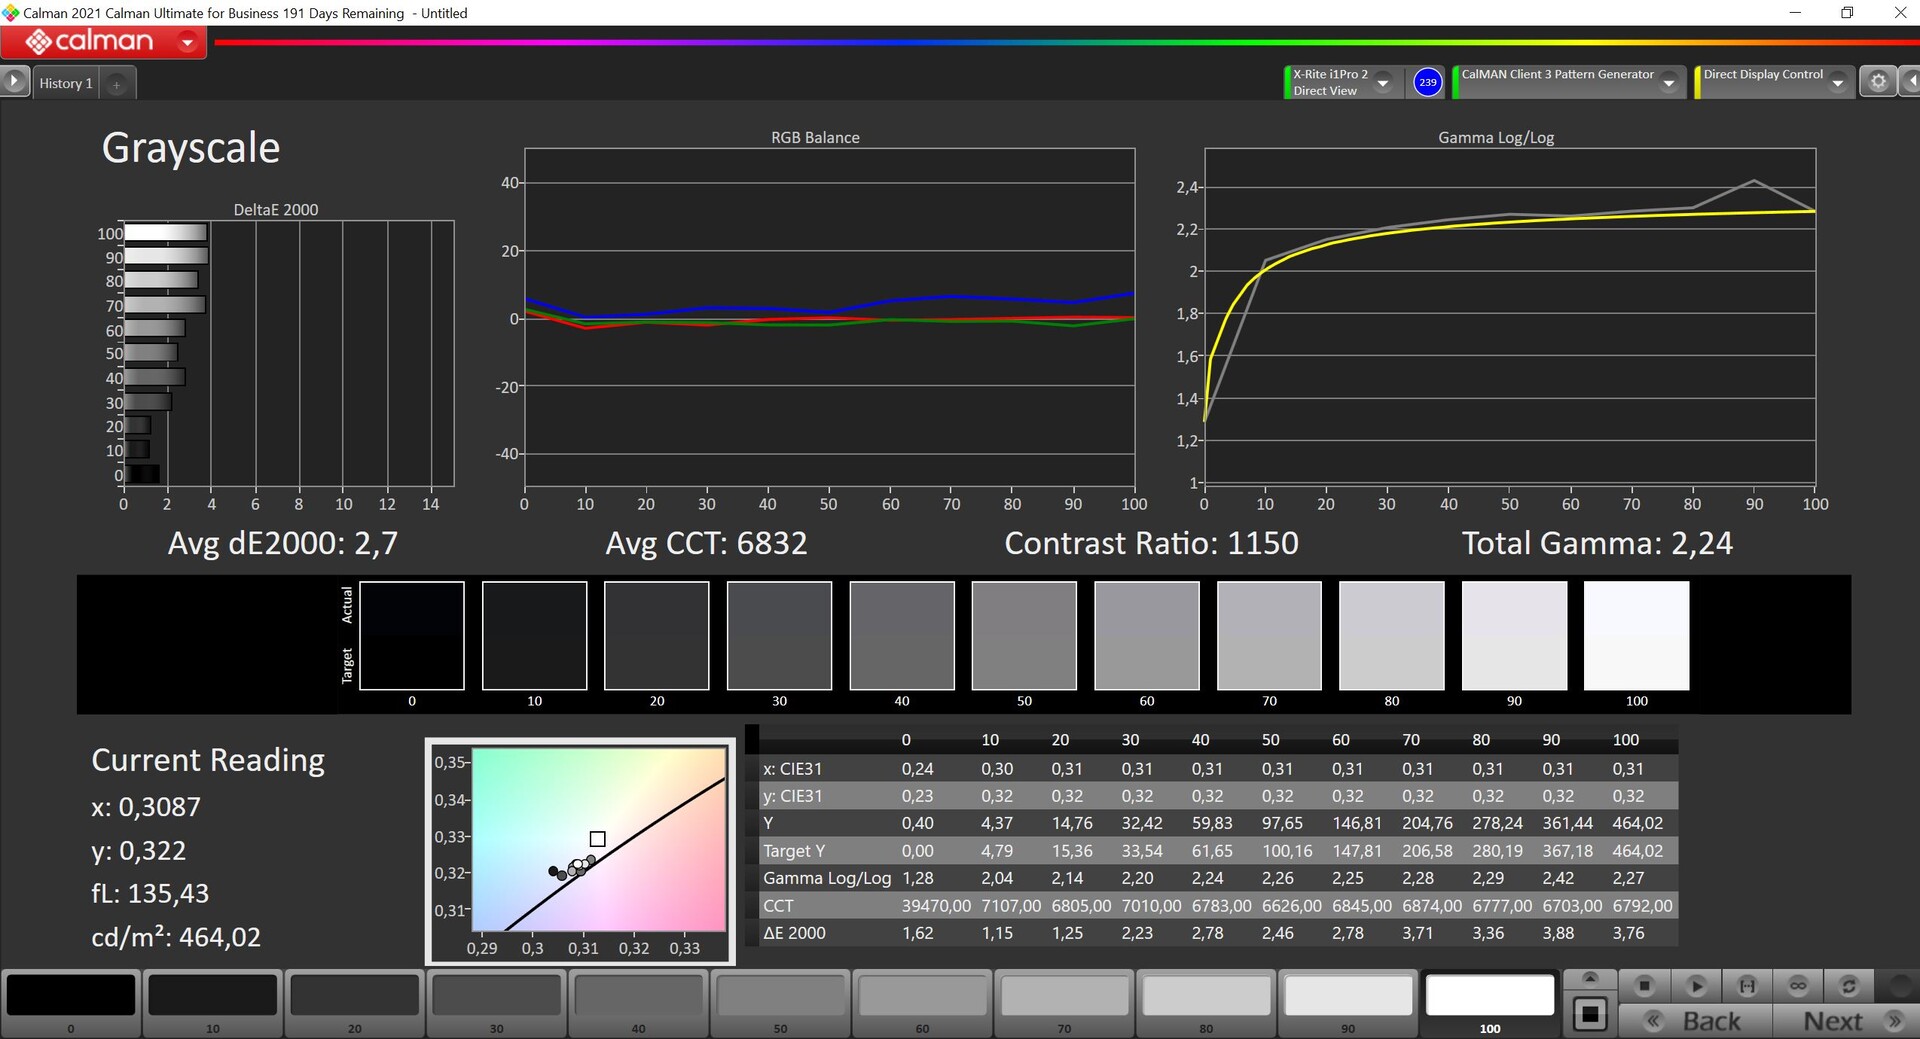
Determinamos um brilho médio de 455 lêndeas em combinação com um valor de preto ligeiramente elevado de 0,4, o que resulta em uma relação de contraste de 1160:1. Este é um resultado decente, mas todos os rivais baseados em IPS (incluindo o predecessor), exceto oLâmina Razer 14oferecem melhores resultados de contraste. O brilho do painel não pode ser controlado por meio de sensor de luz ambiente.
| |||||||||||||||||||||||||
iluminação: 89 %
iluminação com acumulador: 464 cd/m²
Contraste: 1160:1 (Preto: 0.4 cd/m²)
ΔE ColorChecker Calman: 2 | ∀{0.5-29.43 Ø4.71}
calibrated: 1.2
ΔE Greyscale Calman: 2.7 | ∀{0.09-98 Ø4.96}
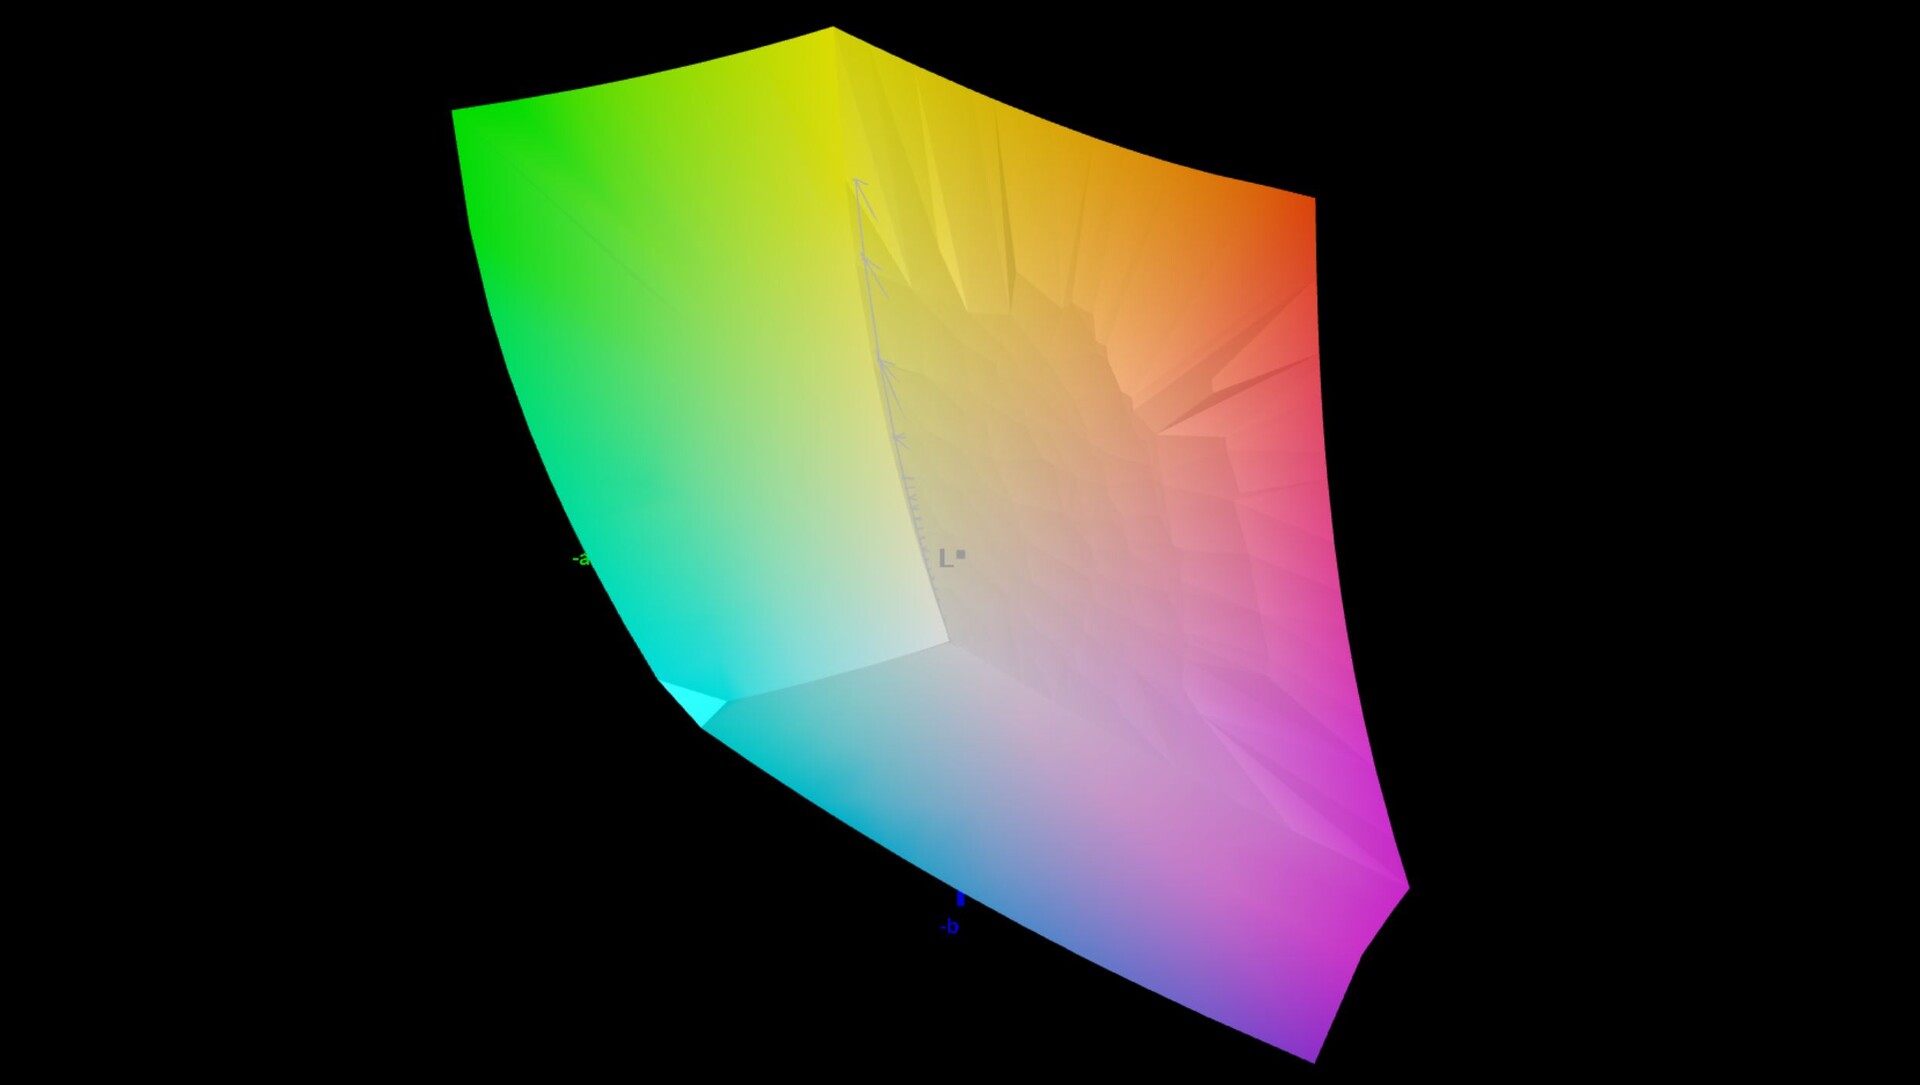
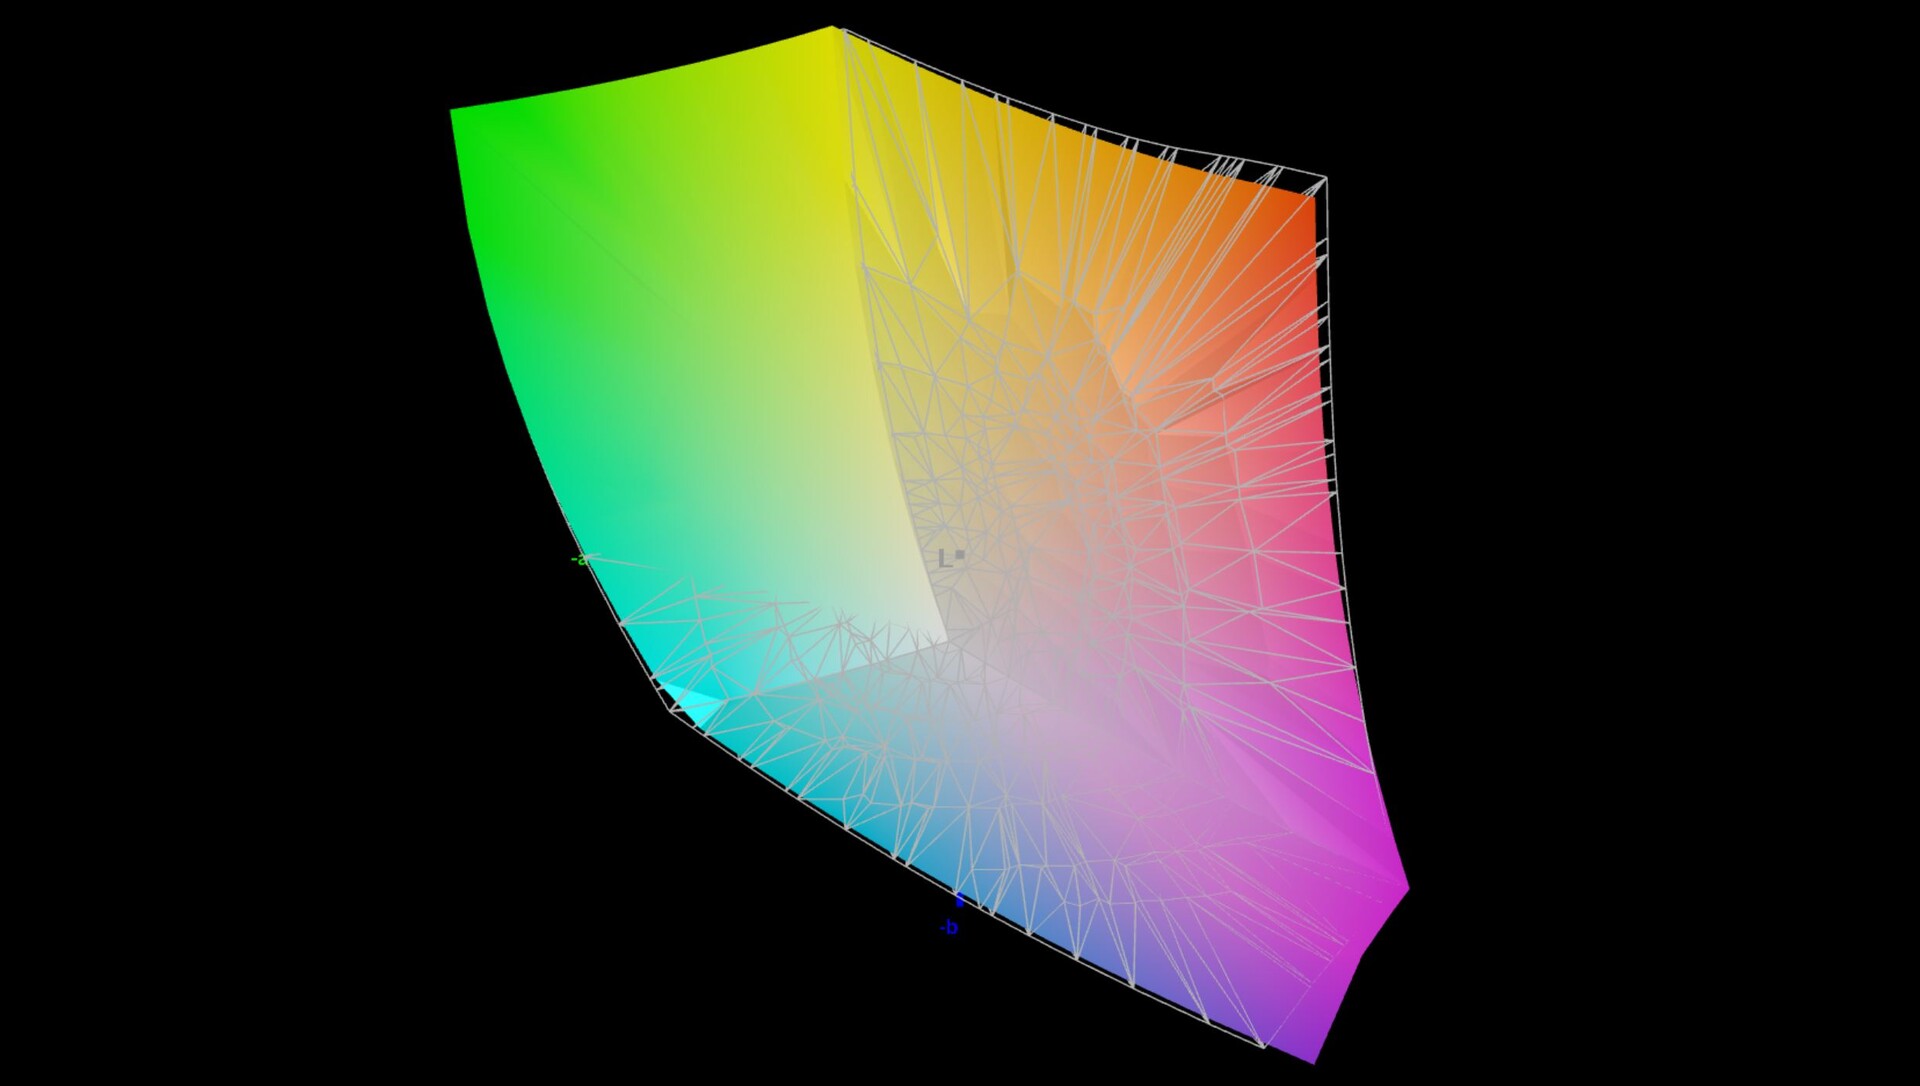
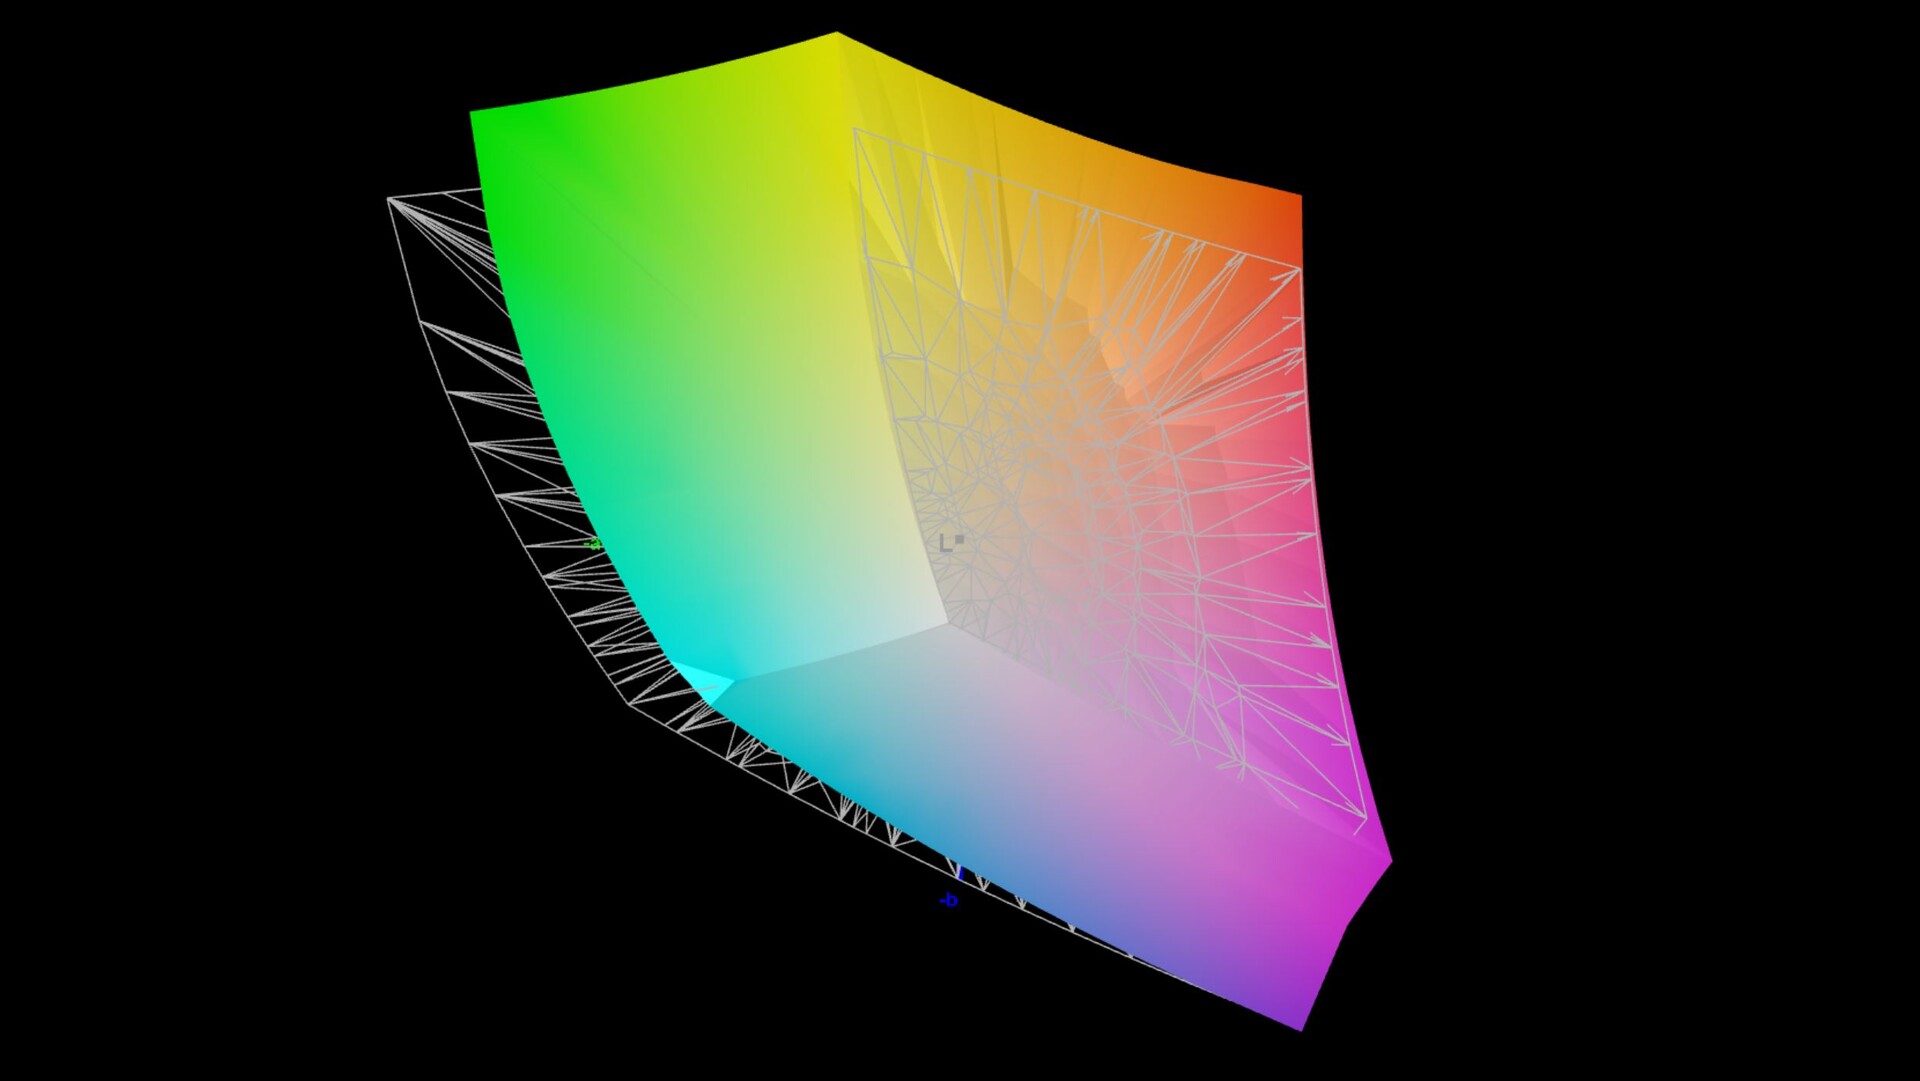
85.17% AdobeRGB 1998 (Argyll 3D)
99.92% sRGB (Argyll 3D)
96.94% Display P3 (Argyll 3D)
Gamma: 2.24
CCT: 6832 K
| Asus ROG Flow Z13 ACRNM TL134ADXP01-0, IPS, 2560x1600, 13.4" | Asus ROG Flow Z13 GZ301ZE LQ134N1JW54, IPS, 1920x1200, 13.4" | Alienware x14 i7 RTX 3060 SHP154D, IPS, 1920x1080, 14" | Razer Blade 14 Ryzen 9 6900HX TL140BDXP02-0, IPS, 2560x1440, 14" | Asus ROG Zephyrus G14 GA402RK NE140QDM-NX1 (BOE0A1D), IPS-Level, 2560x1600, 14" | |
|---|---|---|---|---|---|
| Display | -17% | 2% | 0% | 0% | |
| Display P3 Coverage (%) | 96.94 | 67.5 -30% | 99.6 3% | 97.2 0% | 97.4 0% |
| sRGB Coverage (%) | 99.92 | 97.1 -3% | 100 0% | 99.9 0% | 99.9 0% |
| AdobeRGB 1998 Coverage (%) | 85.17 | 69.3 -19% | 87.6 3% | 85.7 1% | 85.5 0% |
| Response Times | -1241% | -255% | -554% | -210% | |
| Response Time Grey 50% / Grey 80% * (ms) | 2.1 ? | 44 ? -1995% | 9.6 ? -357% | 16.8 ? -700% | 8.8 ? -319% |
| Response Time Black / White * (ms) | 3 ? | 17.6 ? -487% | 7.6 ? -153% | 15.2 ? -407% | 6 ? -100% |
| PWM Frequency (Hz) | 27170 ? | ||||
| Screen | 10% | -11% | 0% | -20% | |
| Brightness middle (cd/m²) | 464 | 515 11% | 434 -6% | 354 -24% | 480 3% |
| Brightness (cd/m²) | 455 | 476 5% | 411 -10% | 328 -28% | 456 0% |
| Brightness Distribution (%) | 89 | 87 -2% | 89 0% | 86 -3% | 80 -10% |
| Black Level * (cd/m²) | 0.4 | 0.35 13% | 0.25 37% | 0.37 7% | 0.48 -20% |
| Contrast (:1) | 1160 | 1471 27% | 1736 50% | 957 -17% | 1000 -14% |
| Colorchecker dE 2000 * | 2 | 1.6 20% | 3 -50% | 1.66 17% | 2.62 -31% |
| Colorchecker dE 2000 max. * | 4.2 | 4 5% | 7.1 -69% | 3.83 9% | 6.71 -60% |
| Colorchecker dE 2000 calibrated * | 1.2 | 1.2 -0% | 0.7 42% | 1.12 7% | |
| Greyscale dE 2000 * | 2.7 | 2.5 7% | 5.1 -89% | 1.6 41% | 4.2 -56% |
| Gamma | 2.24 98% | 2.2 100% | 2.19 100% | 2.23 99% | 2.16 102% |
| CCT | 6832 95% | 6939 94% | 6204 105% | 6542 99% | 7122 91% |
| Média Total (Programa/Configurações) | -416% /
-175% | -88% /
-43% | -185% /
-85% | -77% /
-43% |
* ... menor é melhor
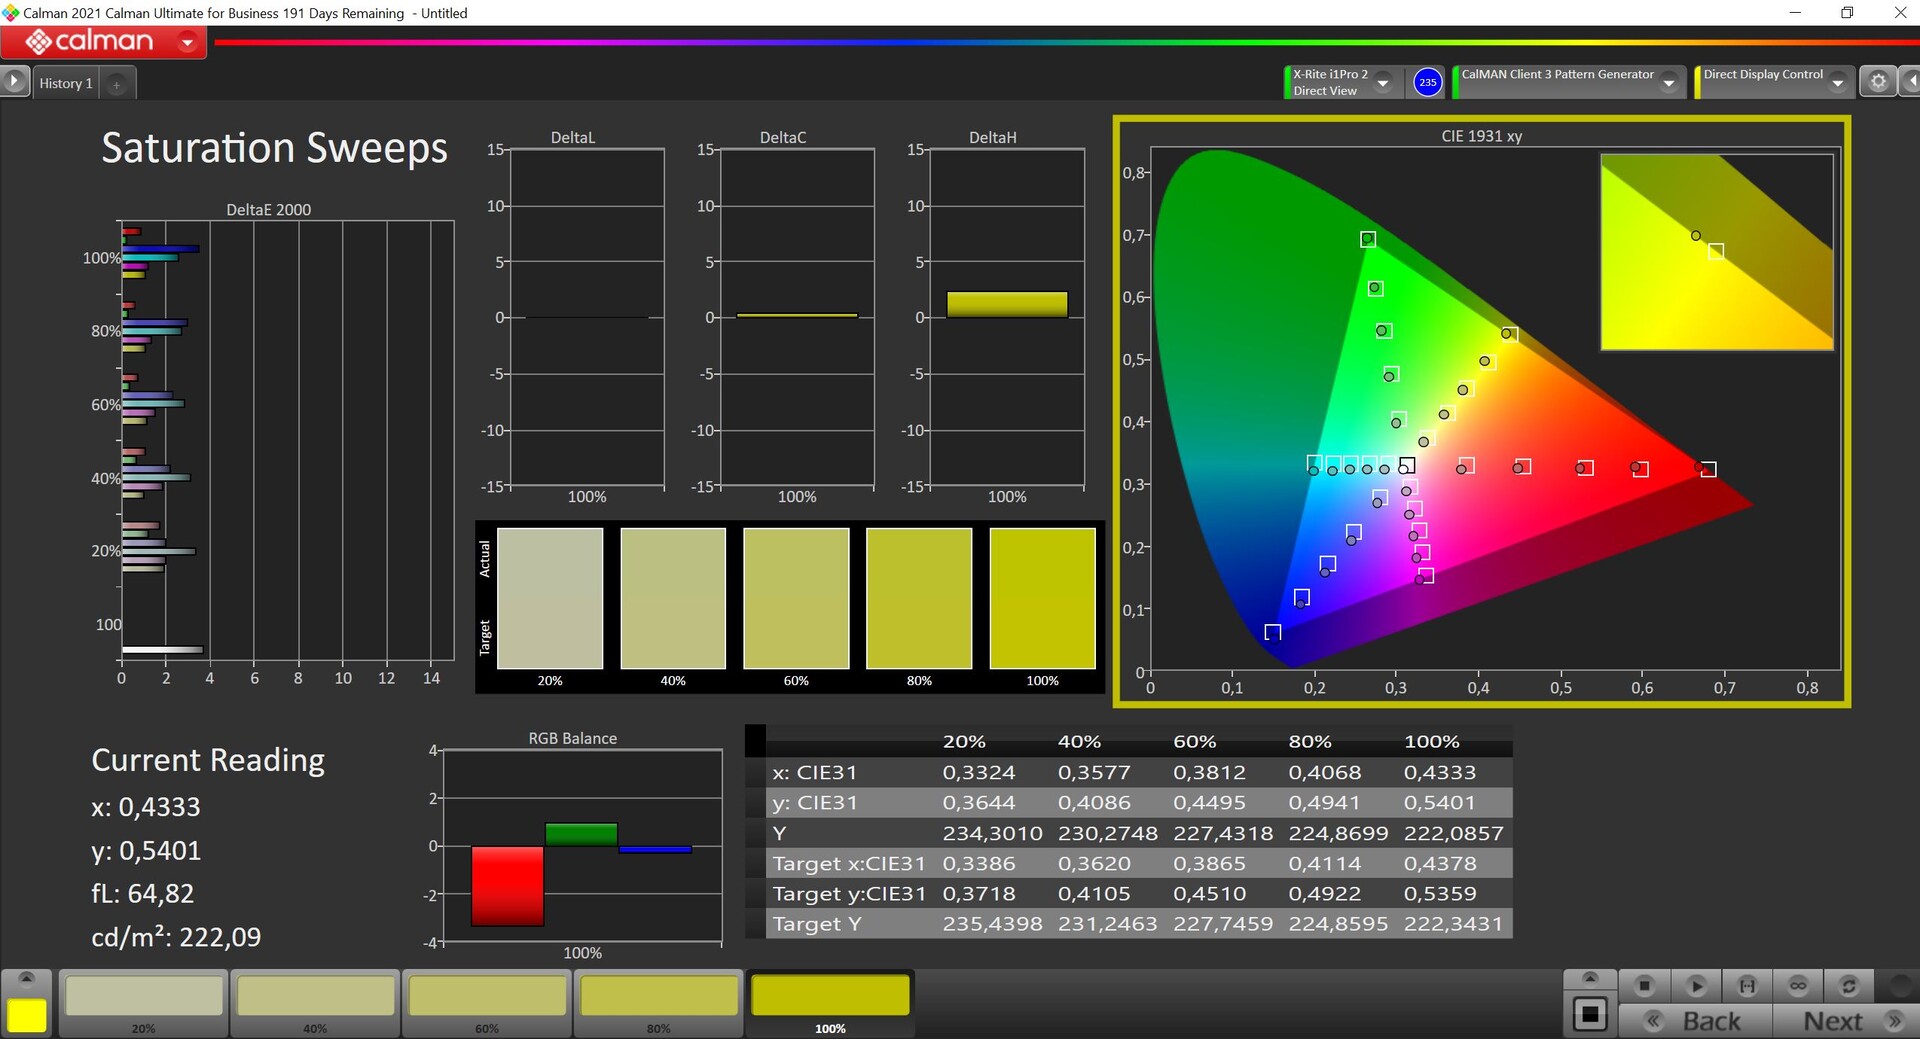
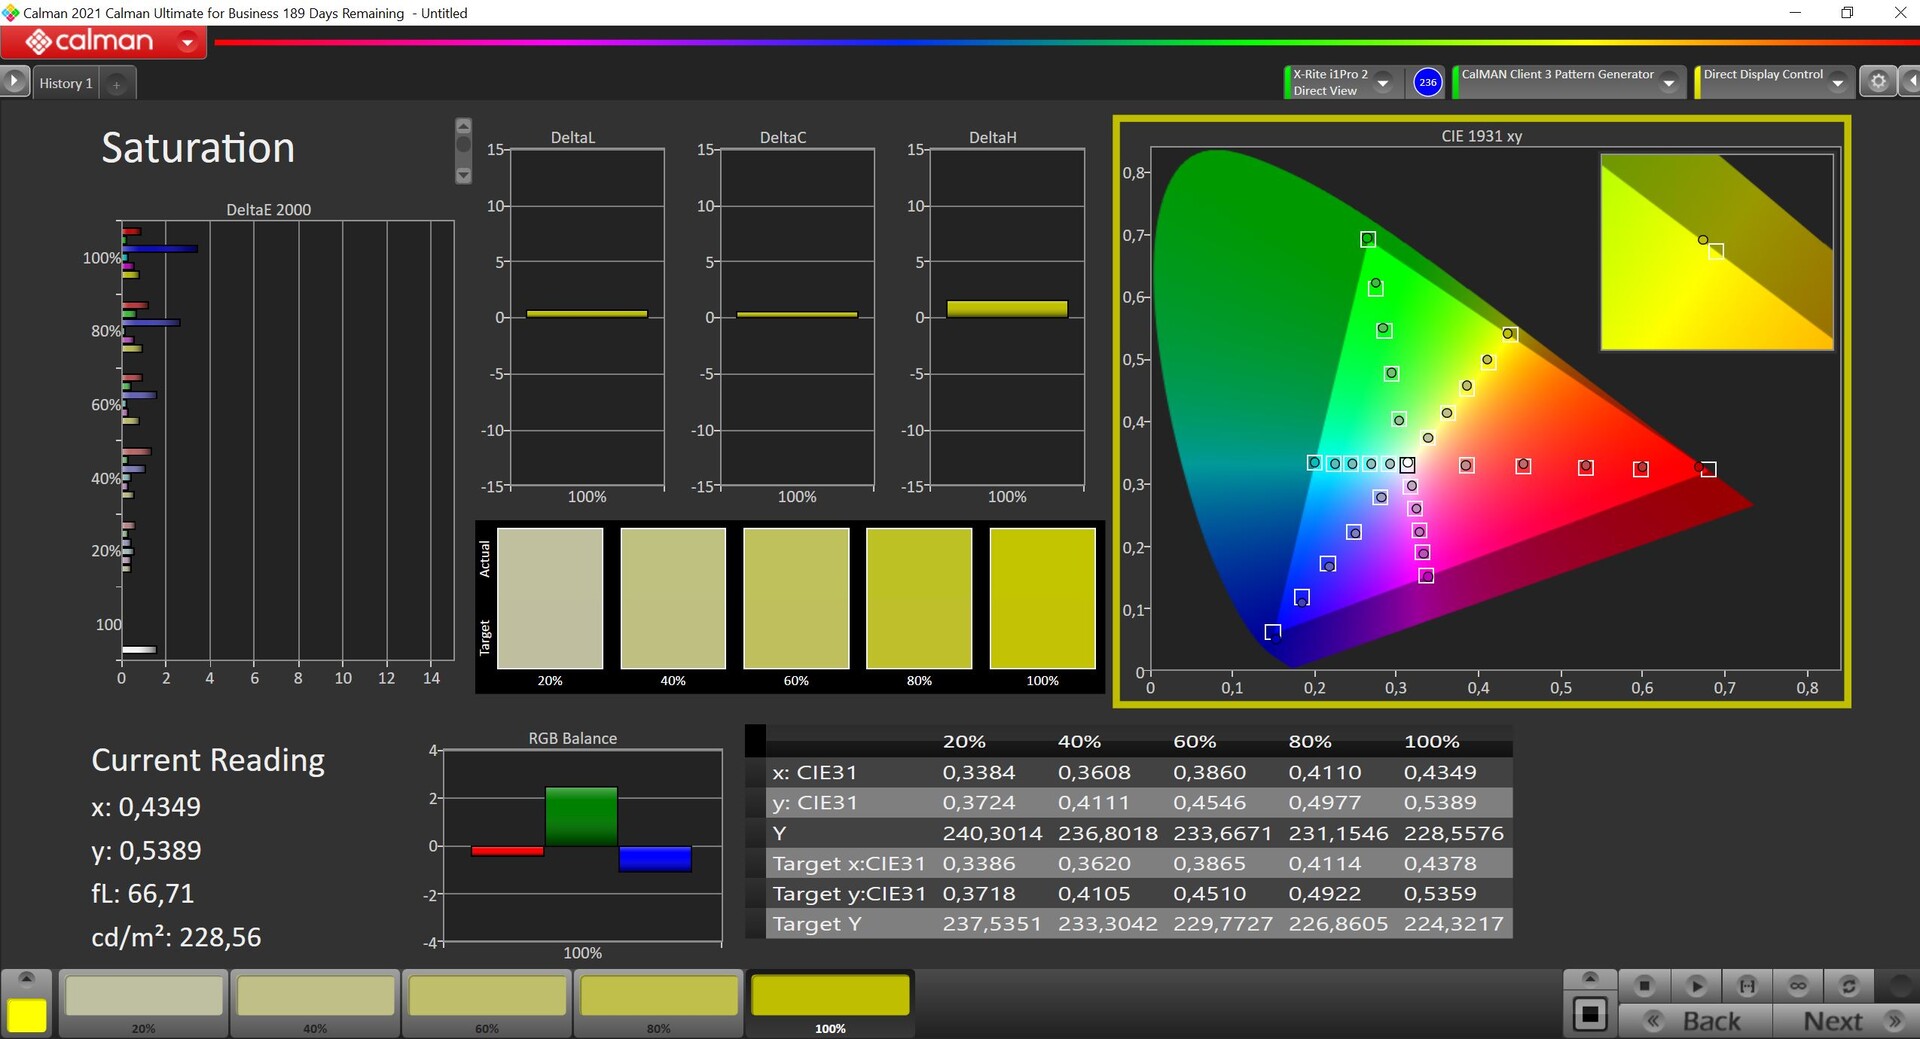
Analisamos o painel com o software profissional CalMAN (X-Rite i1 Pro2) com o perfil de cor nativa do software Armoury Crate. Há também um perfil sRGB dedicado quando se deseja trabalhar no espaço de cor menor. Os resultados já são decentes fora da caixa e apenas um punhado de cores se desviam do objetivo DeltaE-2000 de 3. Há também um pequeno elenco azul em combinação com uma temperatura de cor ligeiramente mais fria, mas isto só é perceptível em comparação direta com uma tela calibrada.
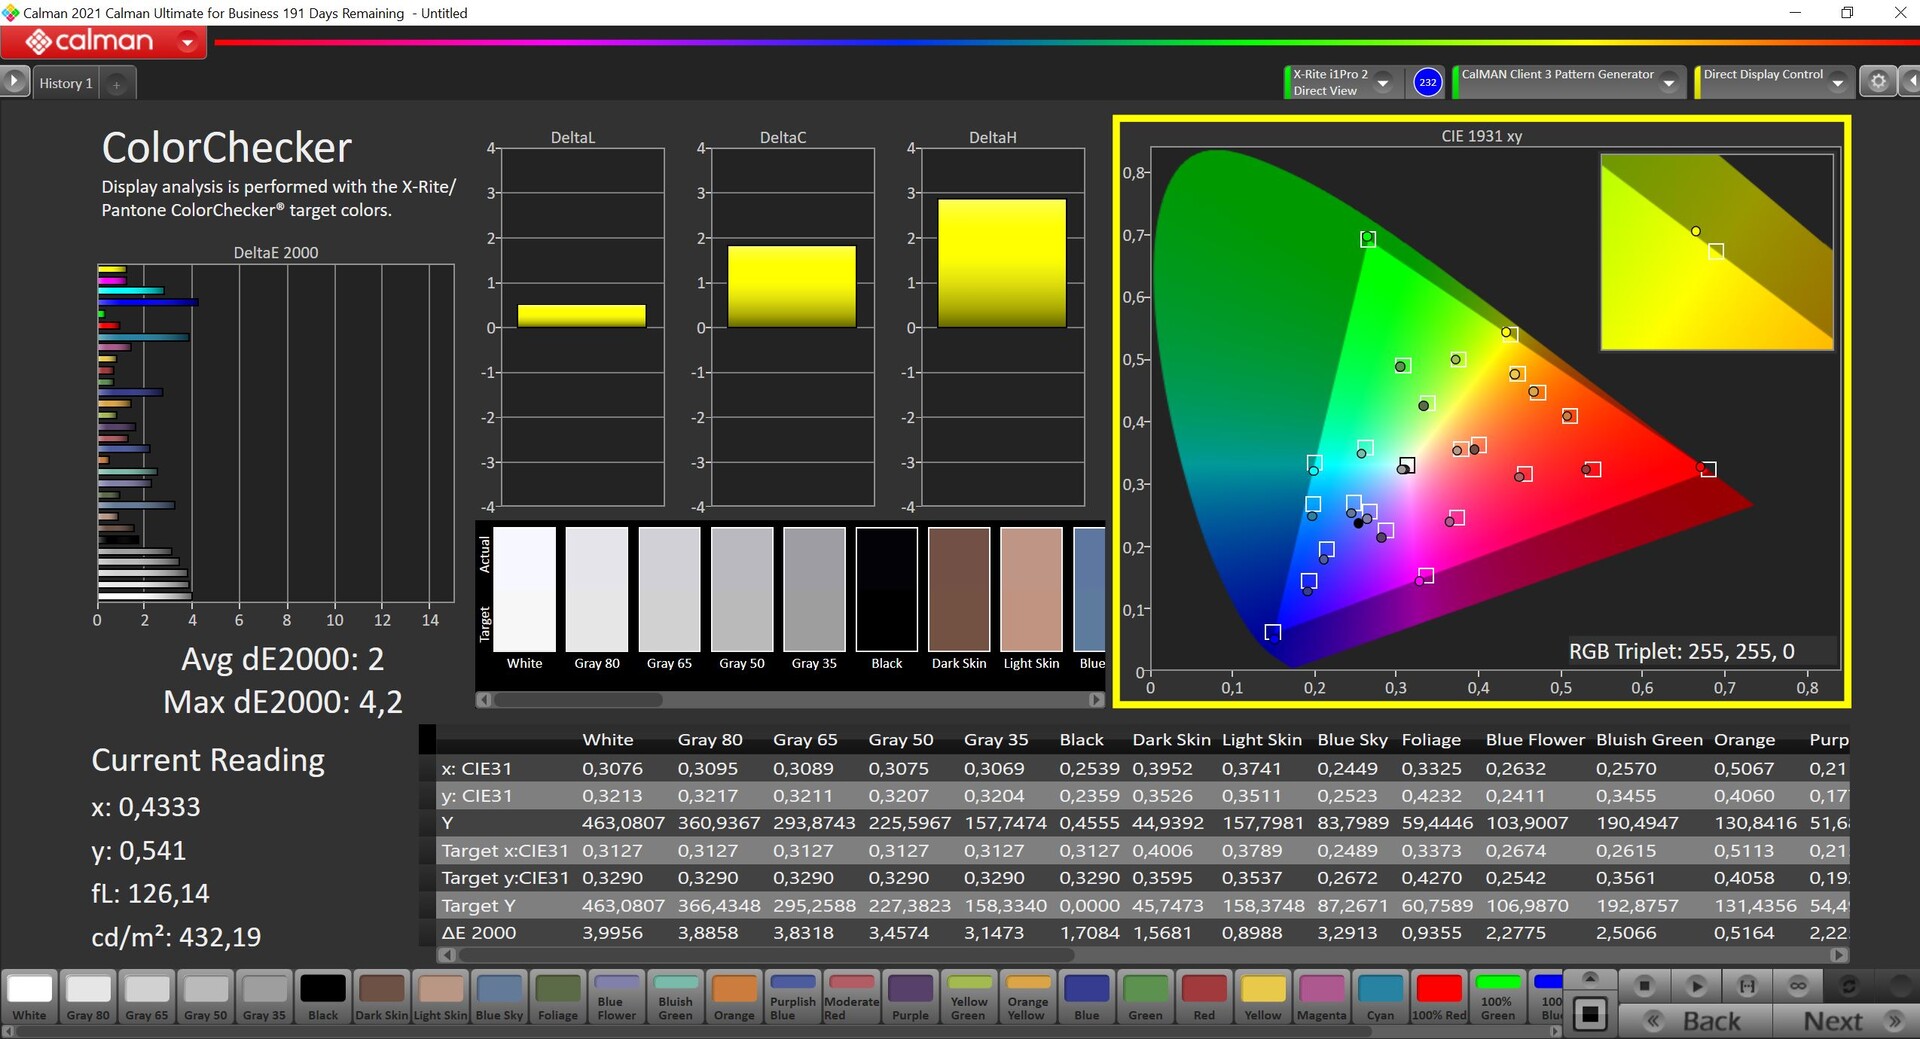
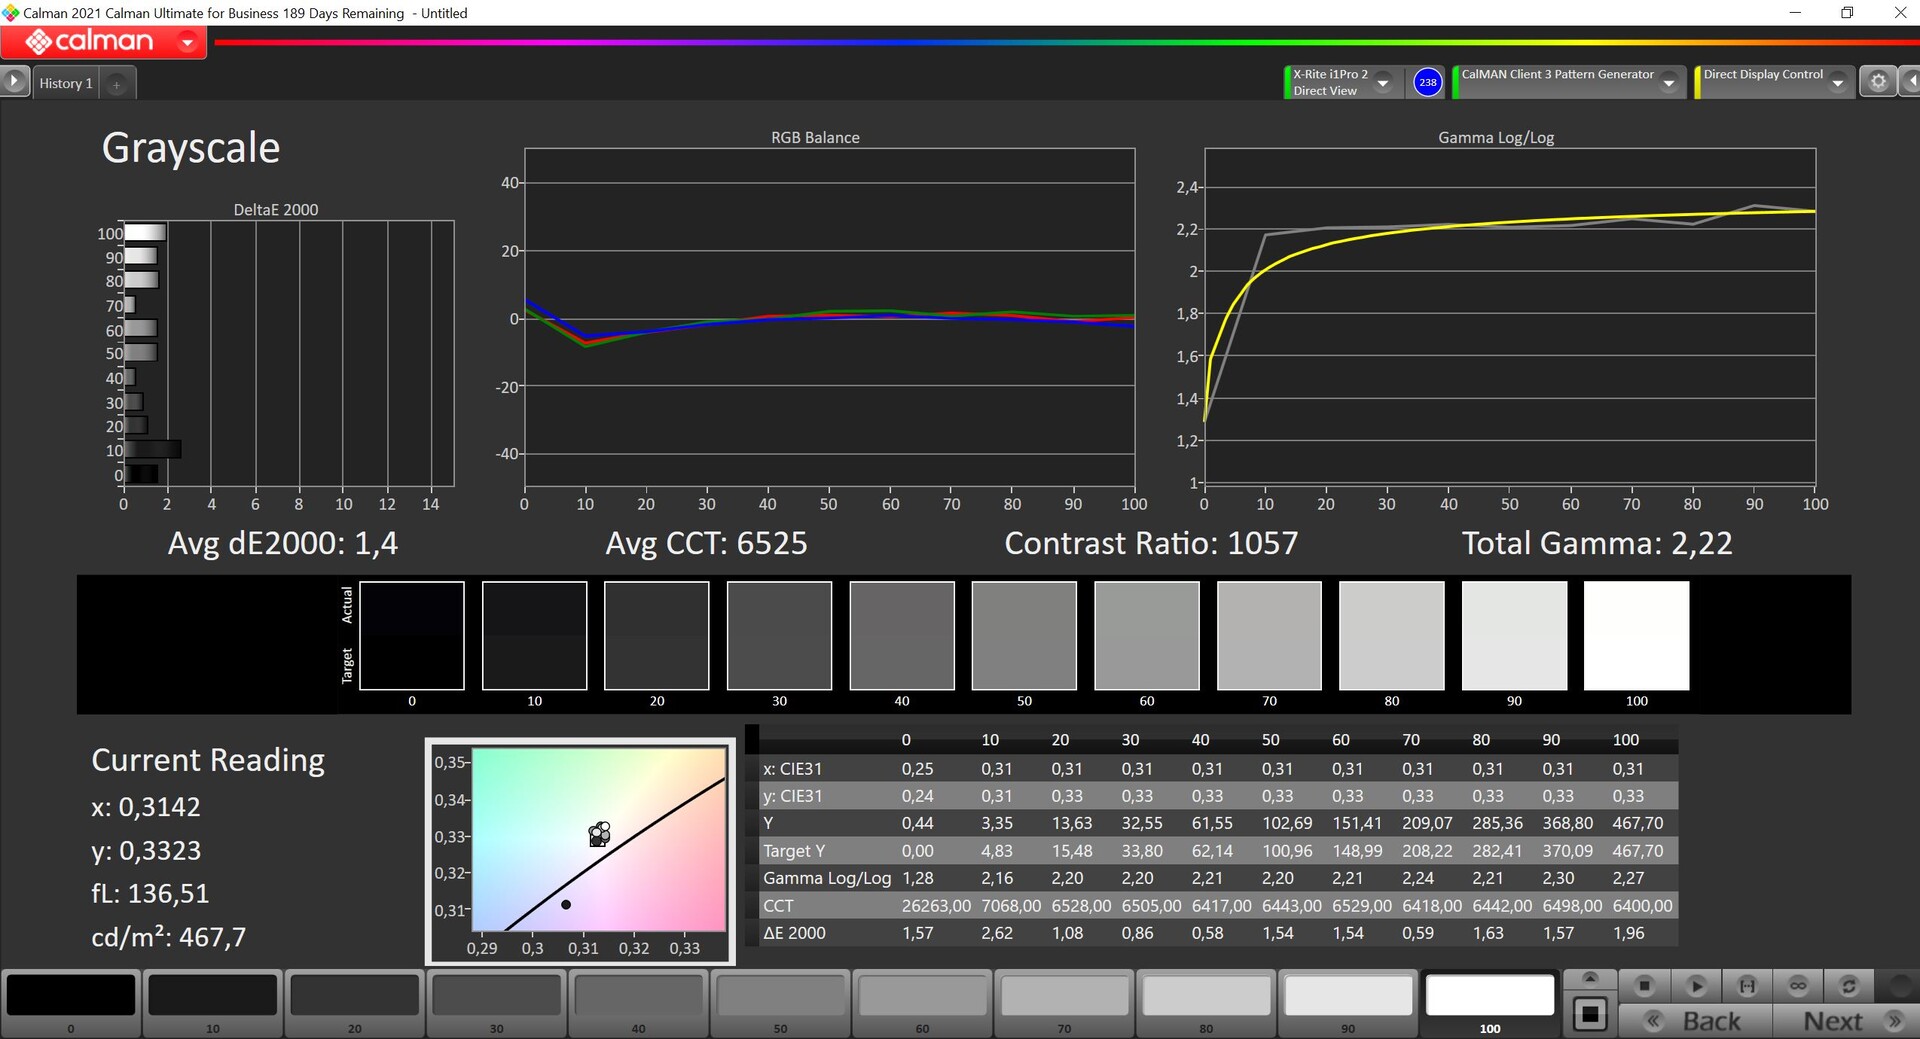
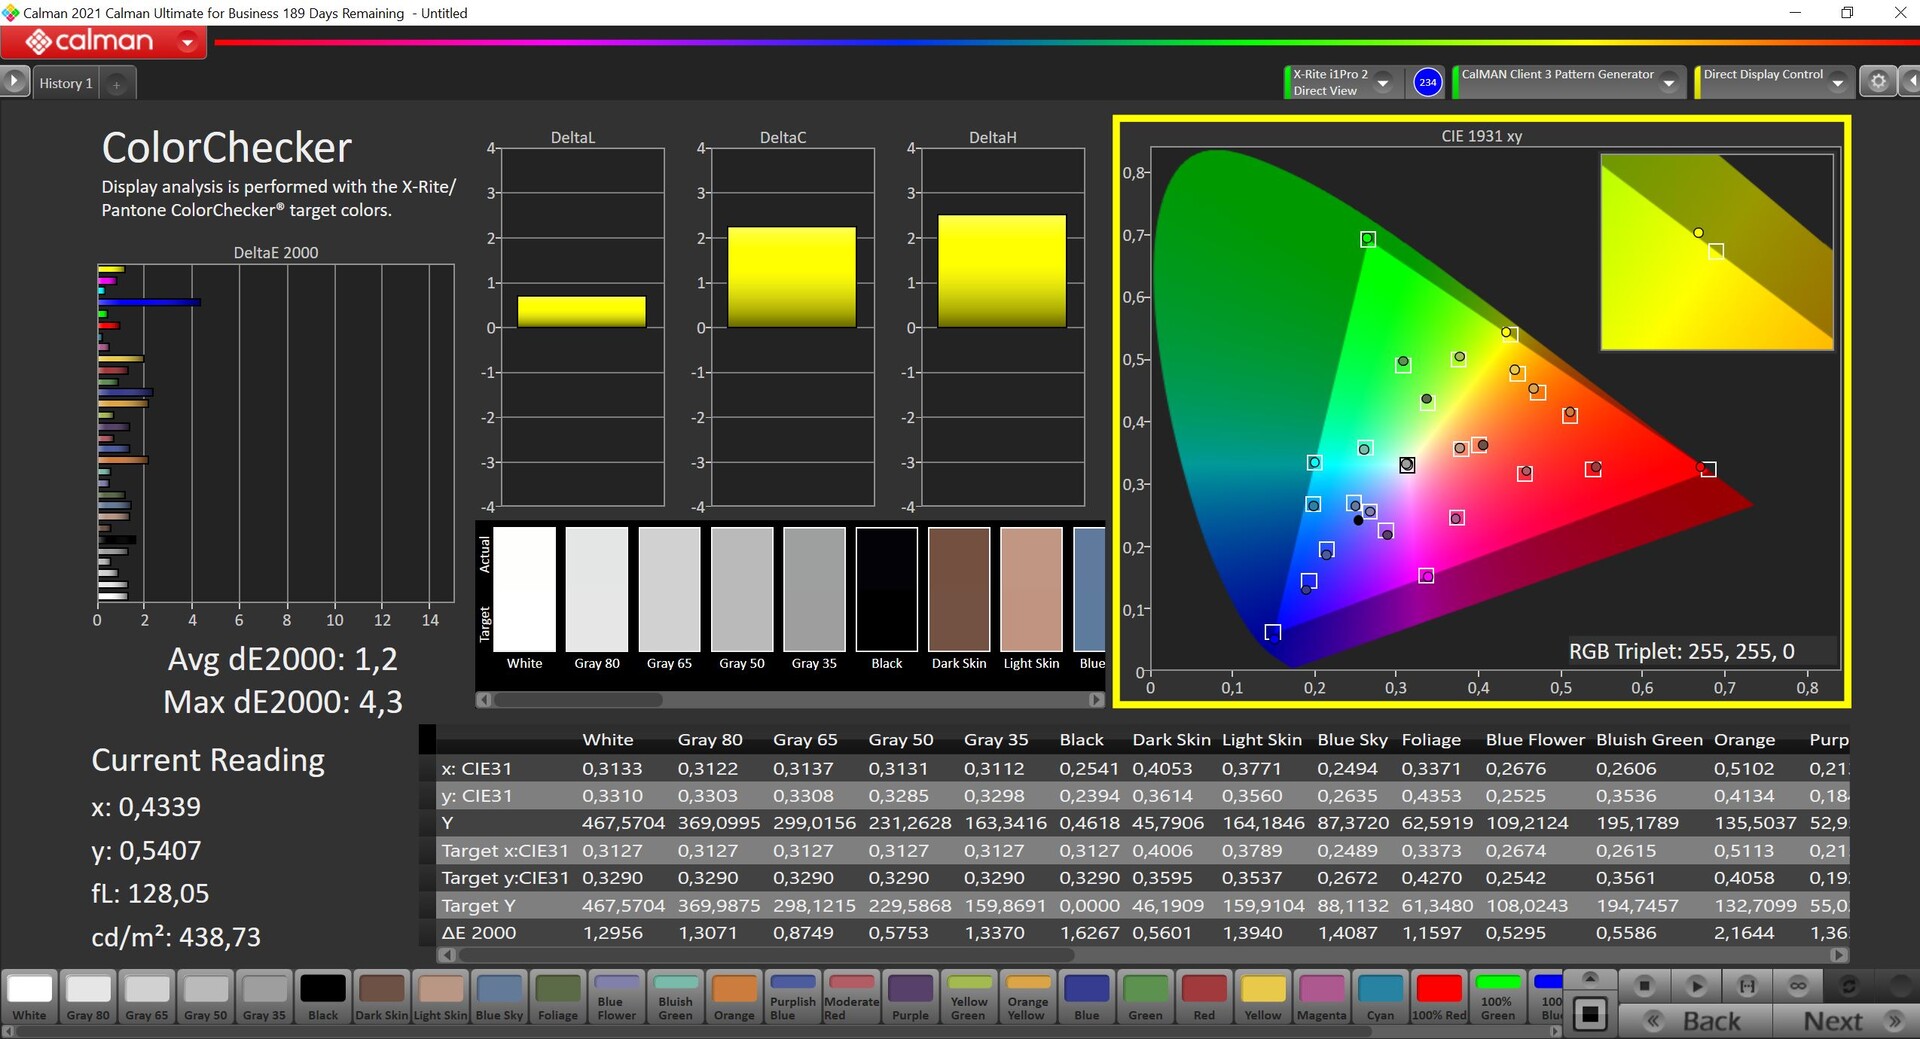
Nossa própria calibração (o perfil correspondente pode ser baixado na caixa acima gratuitamente) melhora a qualidade da escala de cinza, bem como a apresentação das cores. Apenas 100% azul ainda é um outlier, mas você ainda pode usar o painel para alguma edição de imagem e vídeo em combinação com a alta cobertura do DCI-P3. Se você quiser apenas jogar jogos com o Flow Z13, não é realmente necessário calibrar a tela.
Exibir tempos de resposta
| ↔ Tempo de resposta preto para branco | ||
|---|---|---|
| 3 ms ... ascensão ↗ e queda ↘ combinadas | ↗ 3 ms ascensão | 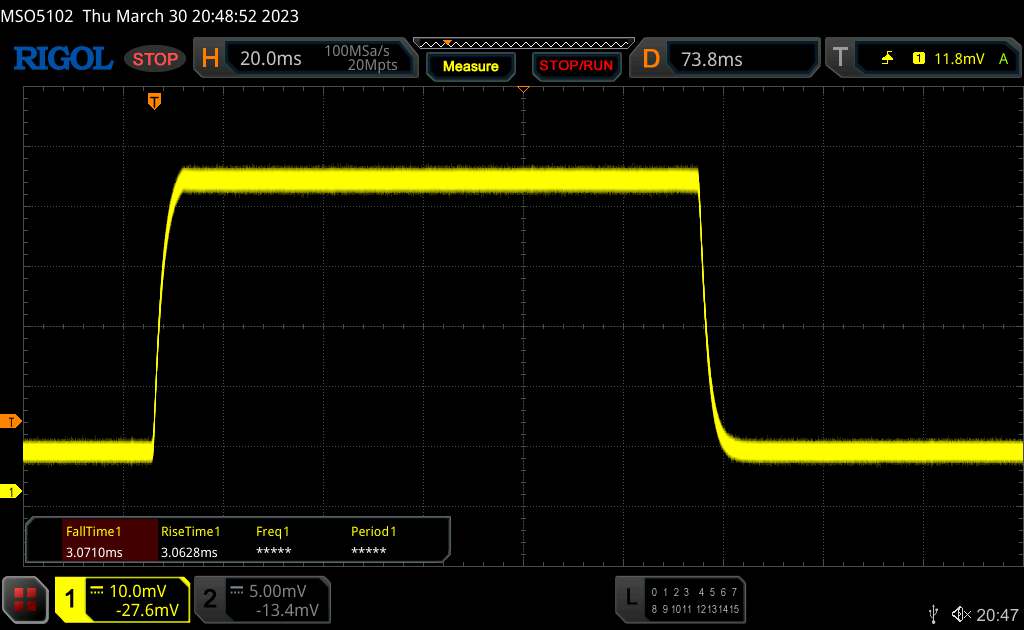 |
| ↘ 3 ms queda | ||
| A tela mostra taxas de resposta muito rápidas em nossos testes e deve ser muito adequada para jogos em ritmo acelerado. Em comparação, todos os dispositivos testados variam de 0.1 (mínimo) a 240 (máximo) ms. » 15 % de todos os dispositivos são melhores. Isso significa que o tempo de resposta medido é melhor que a média de todos os dispositivos testados (19.8 ms). | ||
| ↔ Tempo de resposta 50% cinza a 80% cinza | ||
| 2.1 ms ... ascensão ↗ e queda ↘ combinadas | ↗ 2.1 ms ascensão | 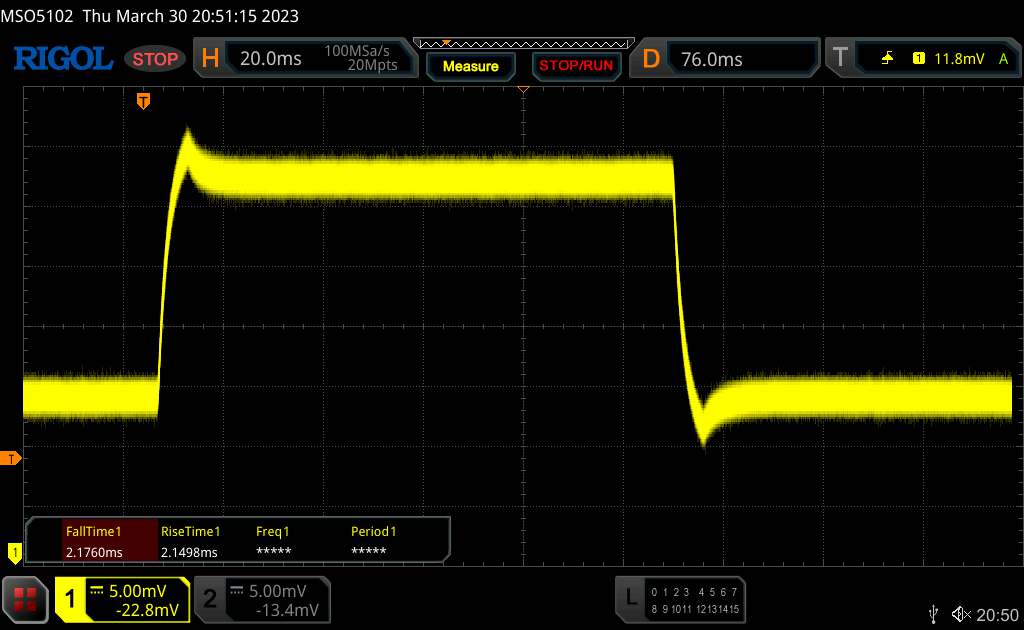 |
| ↘ 2.1 ms queda | ||
| A tela mostra taxas de resposta muito rápidas em nossos testes e deve ser muito adequada para jogos em ritmo acelerado. Em comparação, todos os dispositivos testados variam de 0.165 (mínimo) a 636 (máximo) ms. » 11 % de todos os dispositivos são melhores. Isso significa que o tempo de resposta medido é melhor que a média de todos os dispositivos testados (31 ms). | ||
Cintilação da tela / PWM (modulação por largura de pulso)
| Tela tremeluzindo / PWM não detectado | 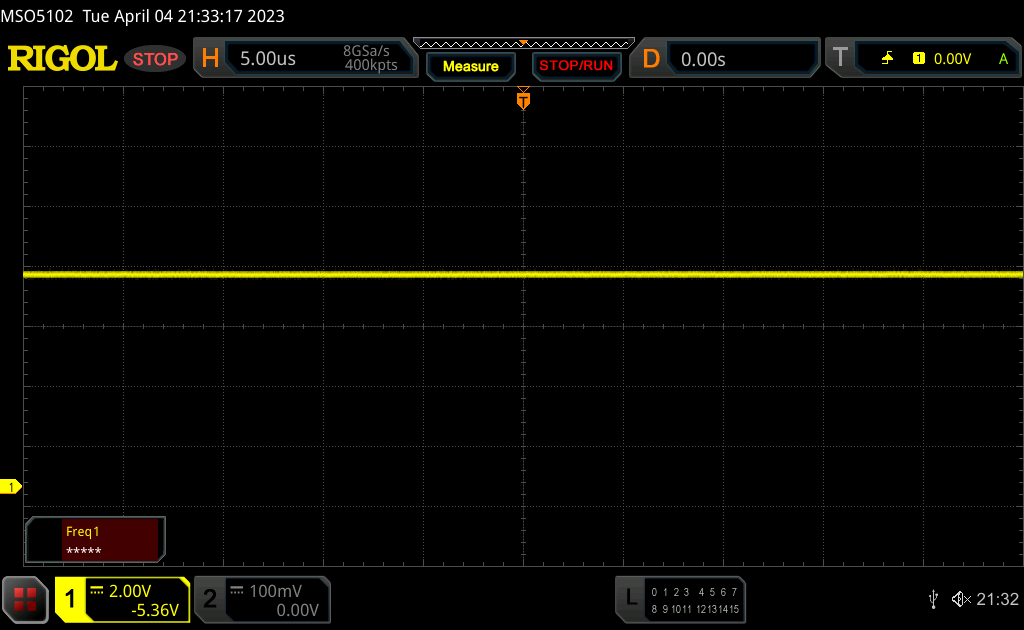 | ||
[pwm_comparison] Em comparação: 52 % de todos os dispositivos testados não usam PWM para escurecer a tela. Se PWM foi detectado, uma média de 7757 (mínimo: 5 - máximo: 343500) Hz foi medida. | |||
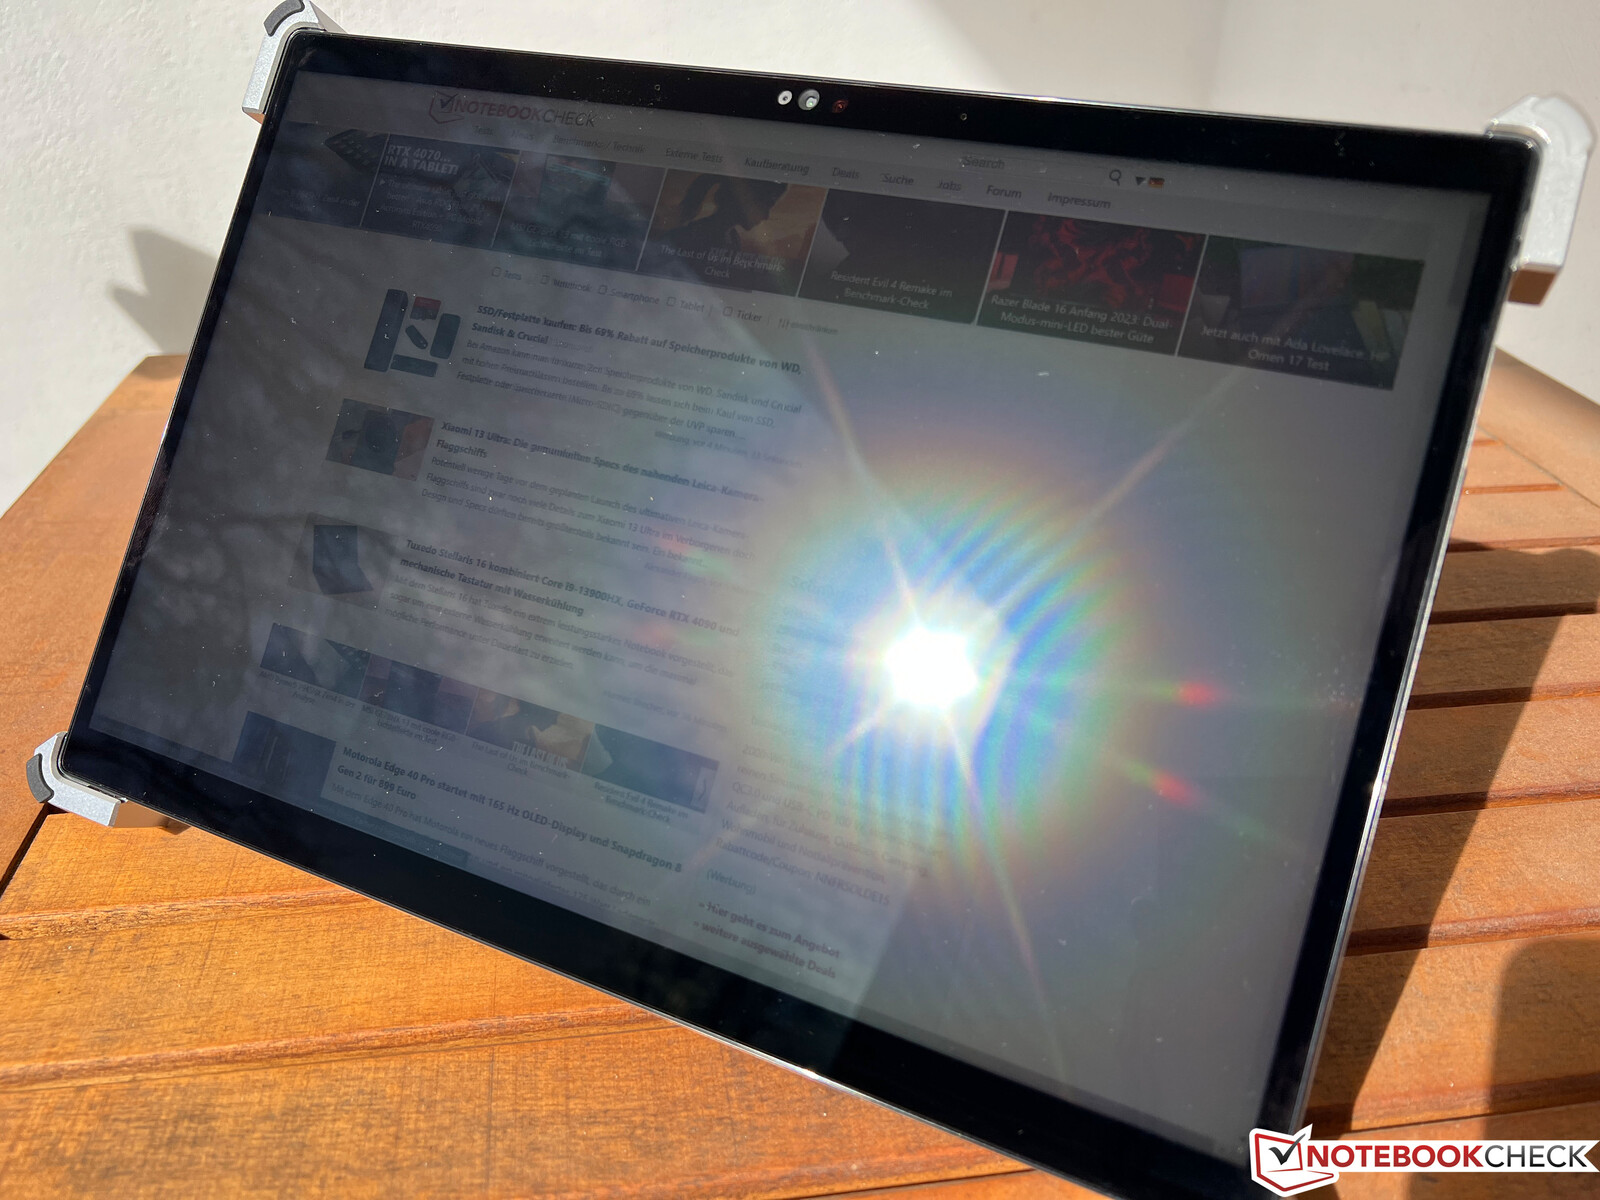
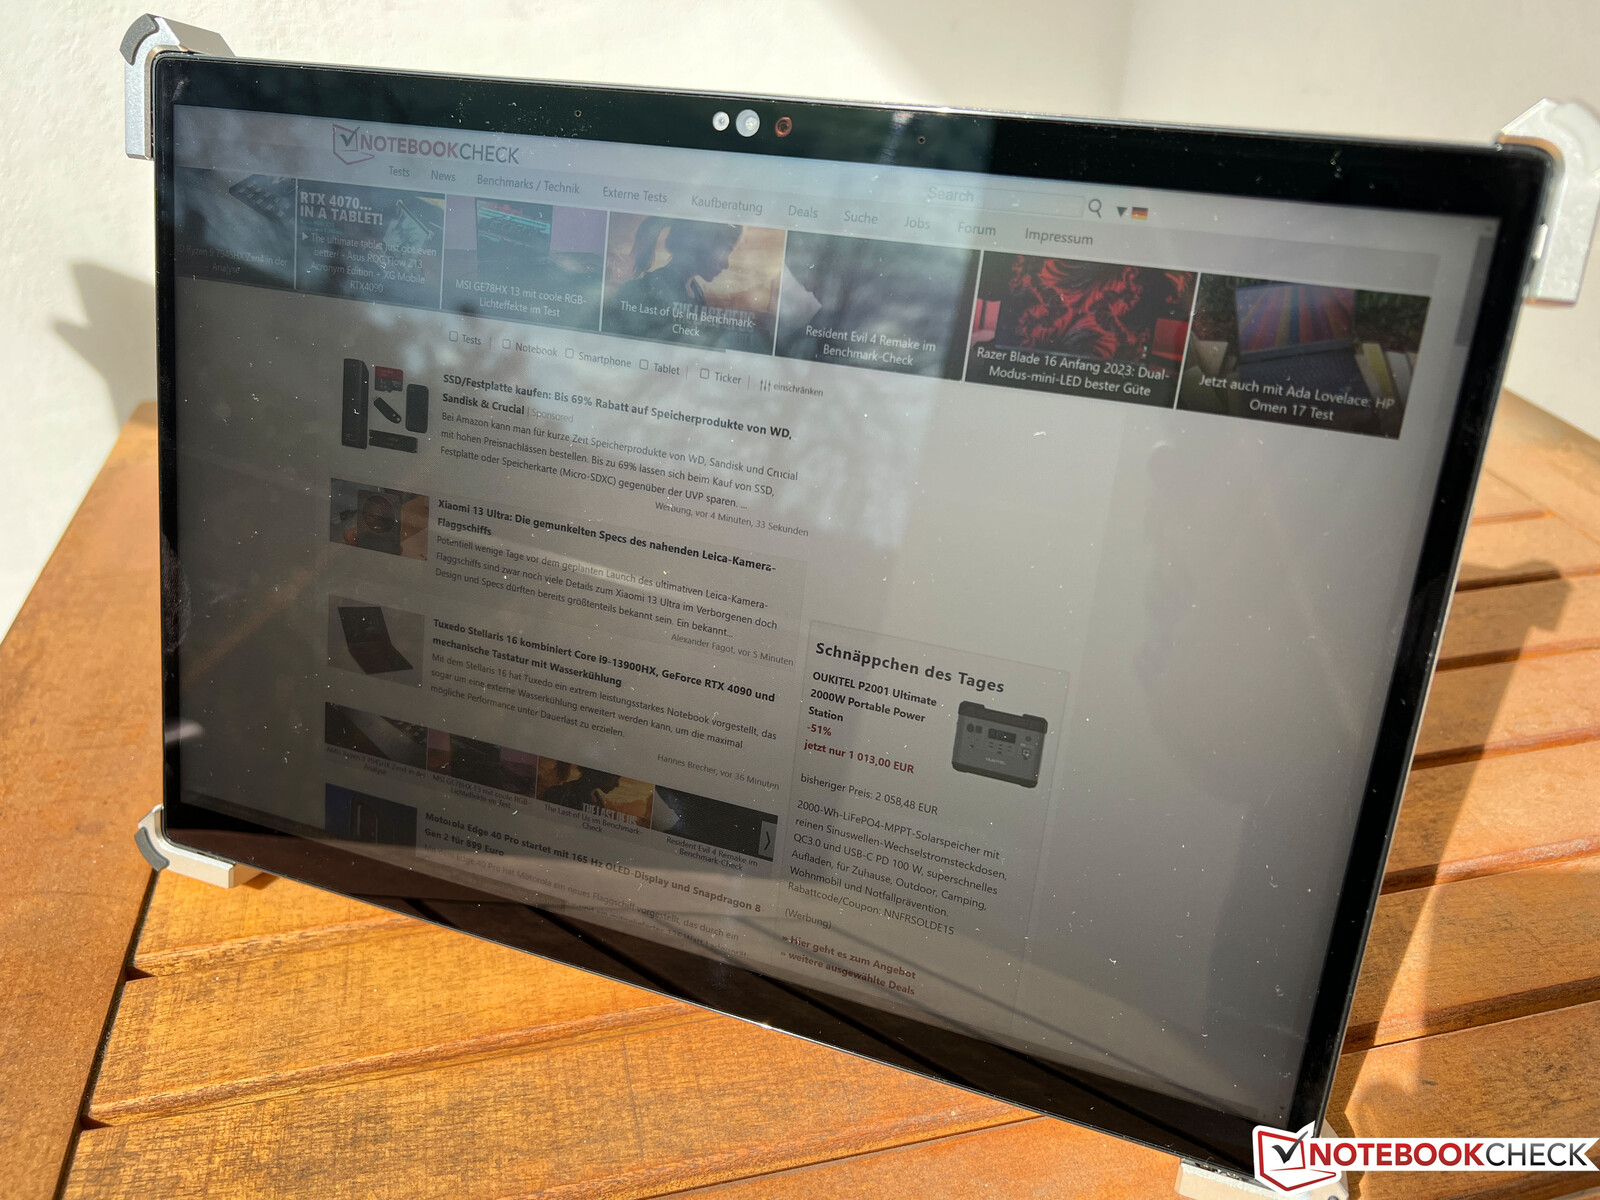
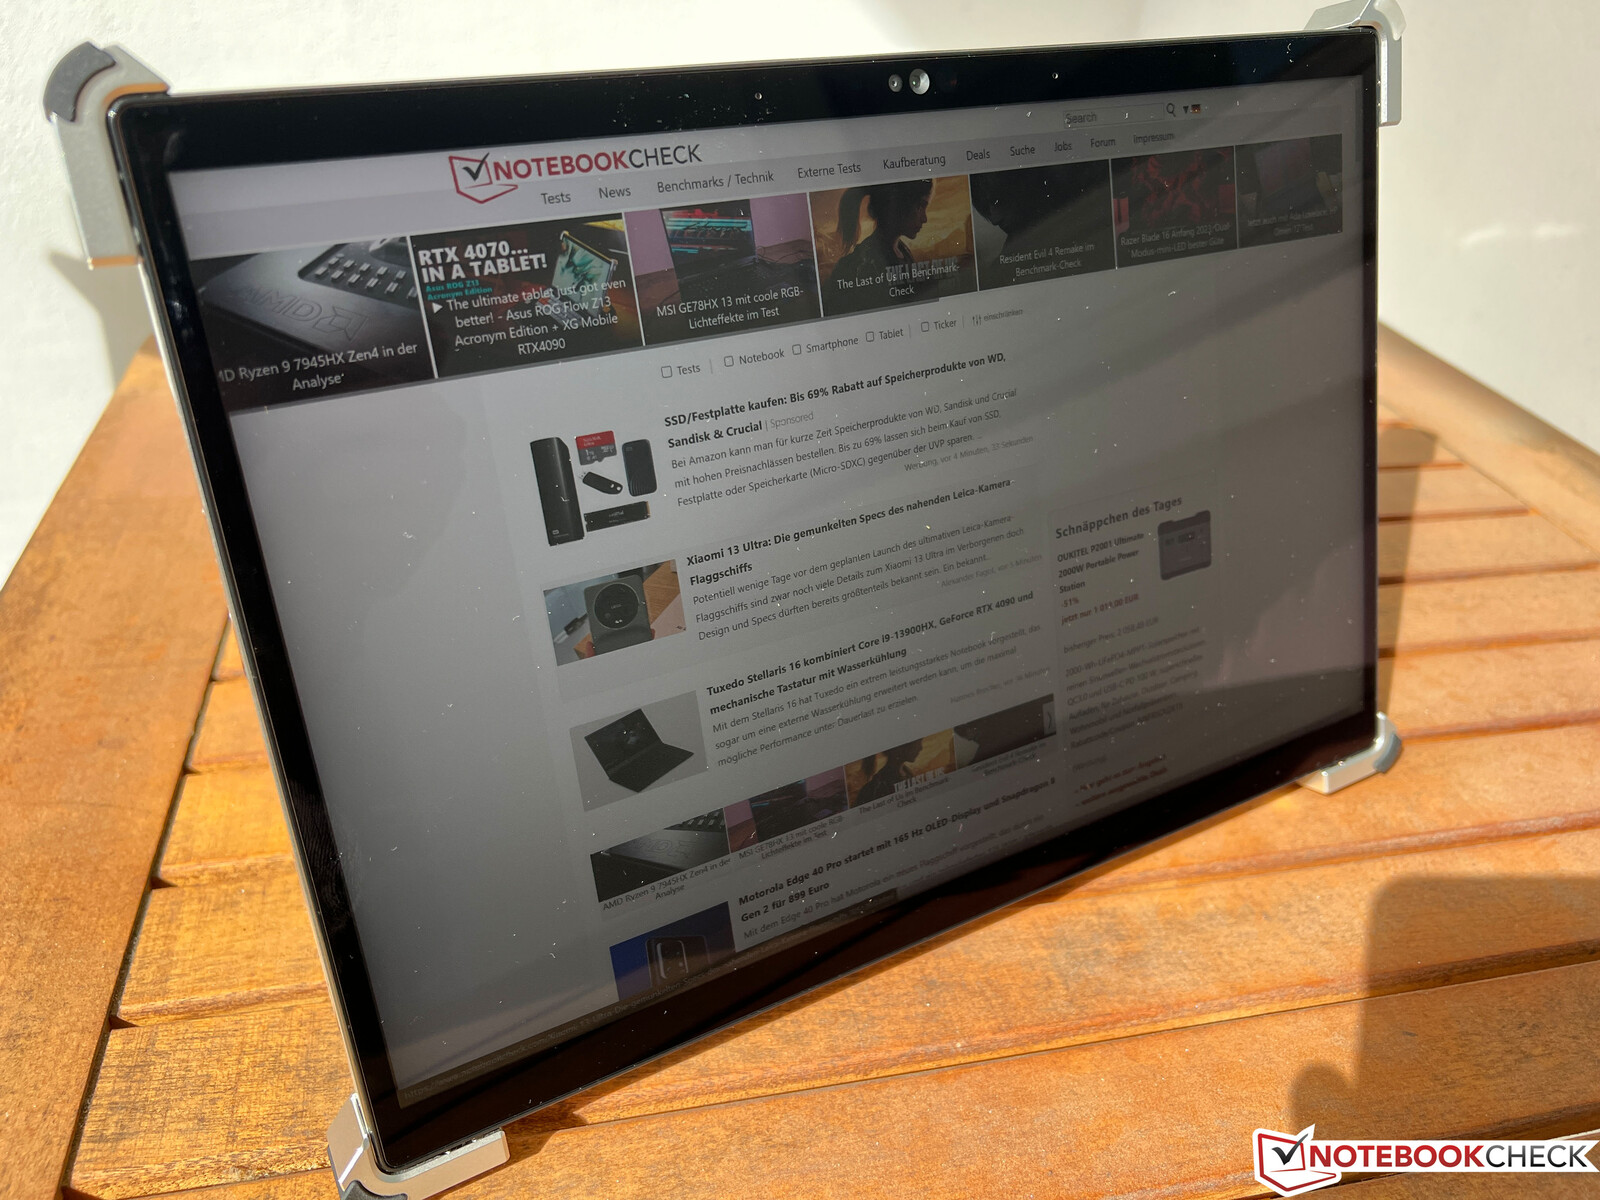
Você deve obviamente evitar reflexos de fontes de luz direta na tela de toque brilhante, mas não é tão reflexivo quanto muitos outros painéis e você ainda pode realmente usar o conversível em ambientes muito brilhantes. A estabilidade do ângulo de visão da tela IPS é muito boa.

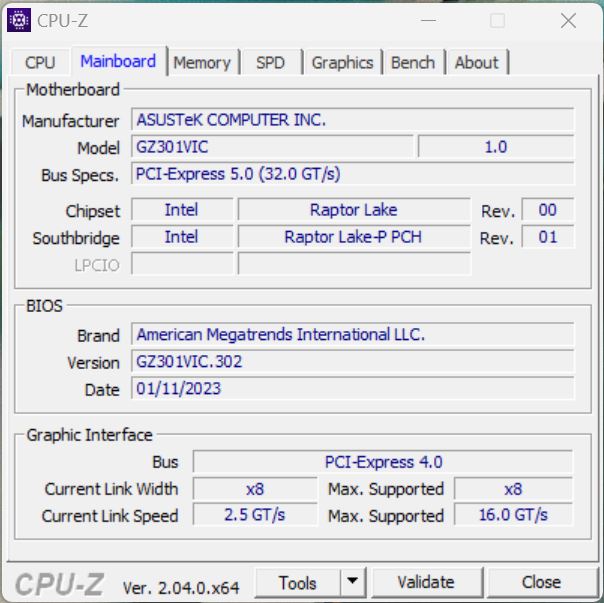
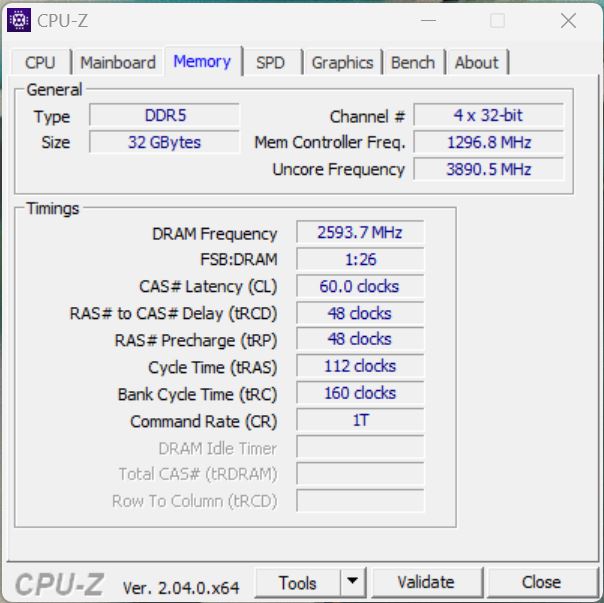
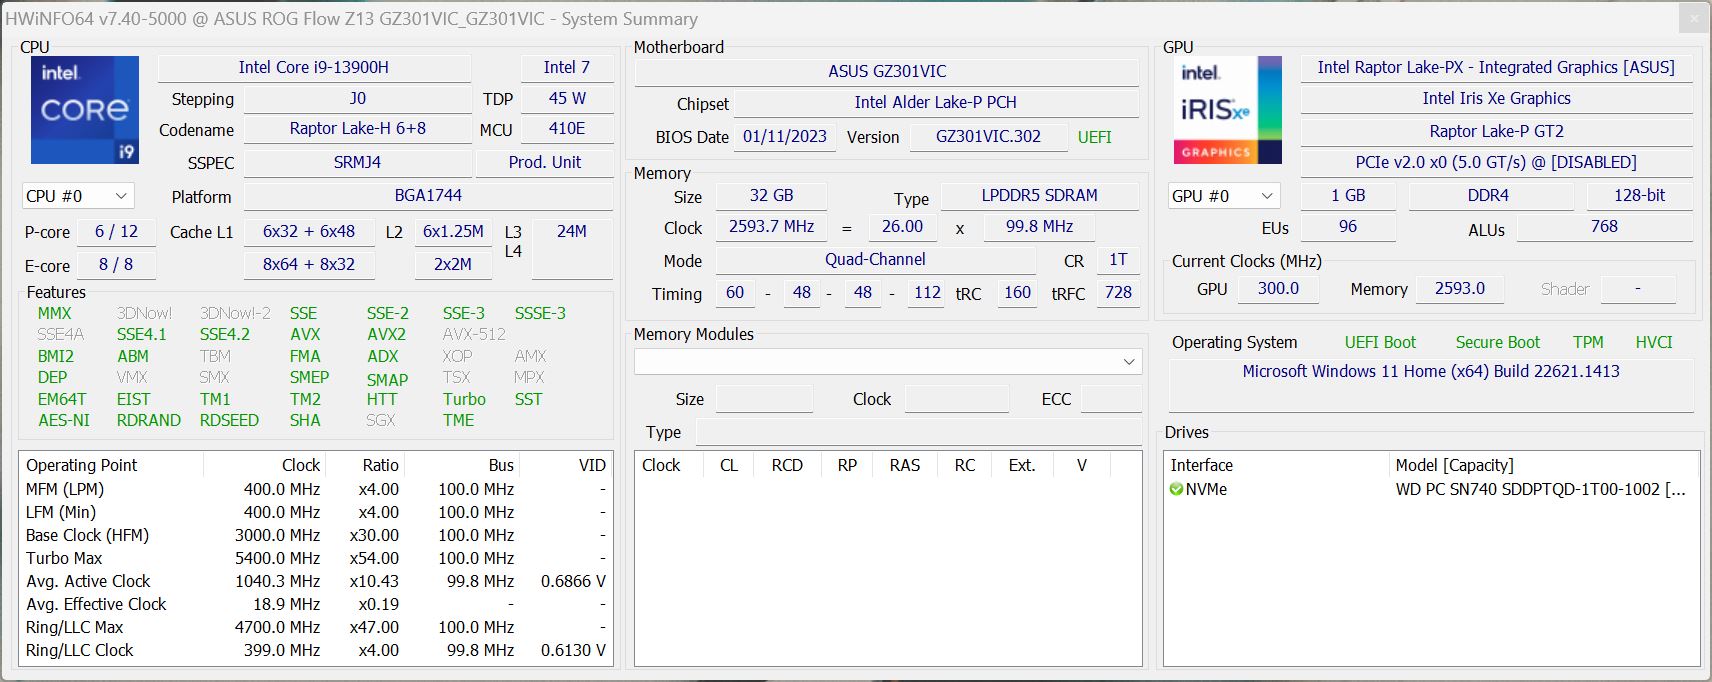
Desempenho - Raptor Lake e Ada Lovelace
Todas as versões do ROG Flow Z13 2023 são equipadas com oIntel Core i9-13900Hmas nossa edição especial ACRNM também recebe o novoNvidia GeForce RTX 4070 Laptop(versão 65W). Nossa unidade é fornecida com 32 GB LPDDR5-5200 RAM, assim como um SSD PCIe-4.0 de 1 TB.
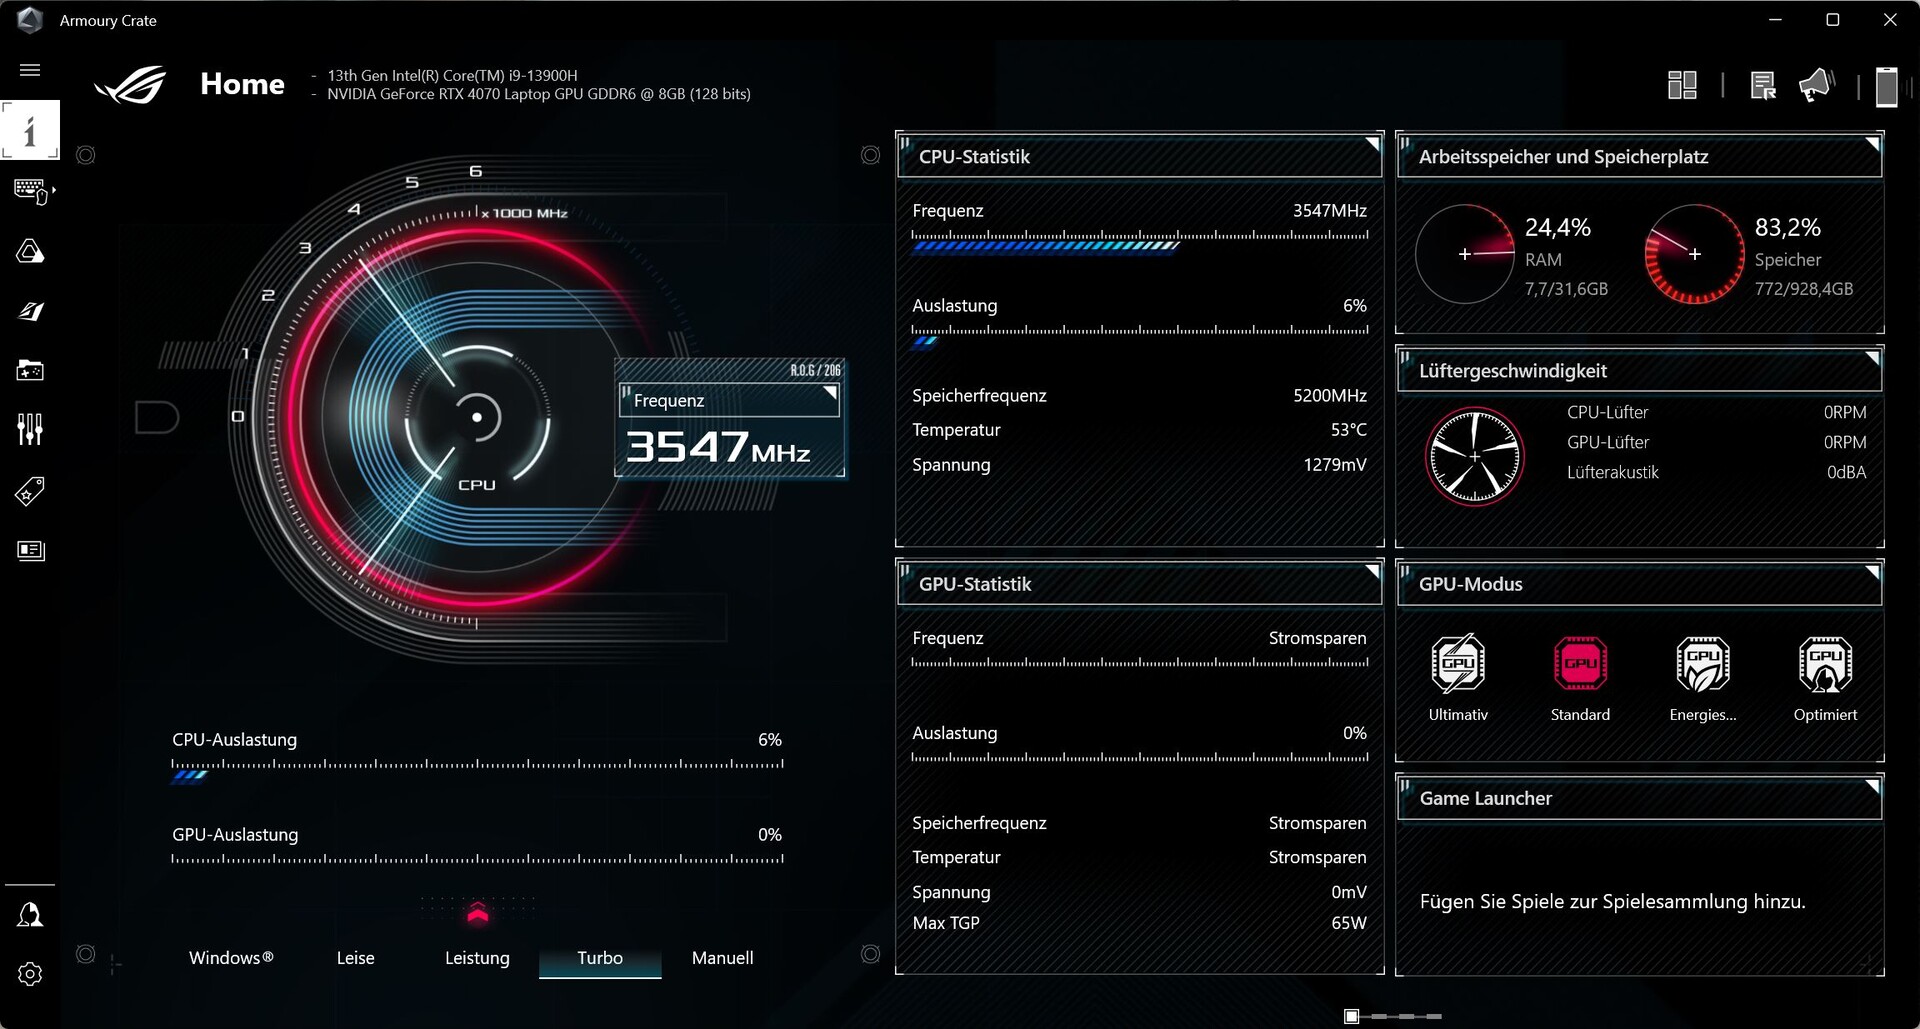
Configurações de revisão
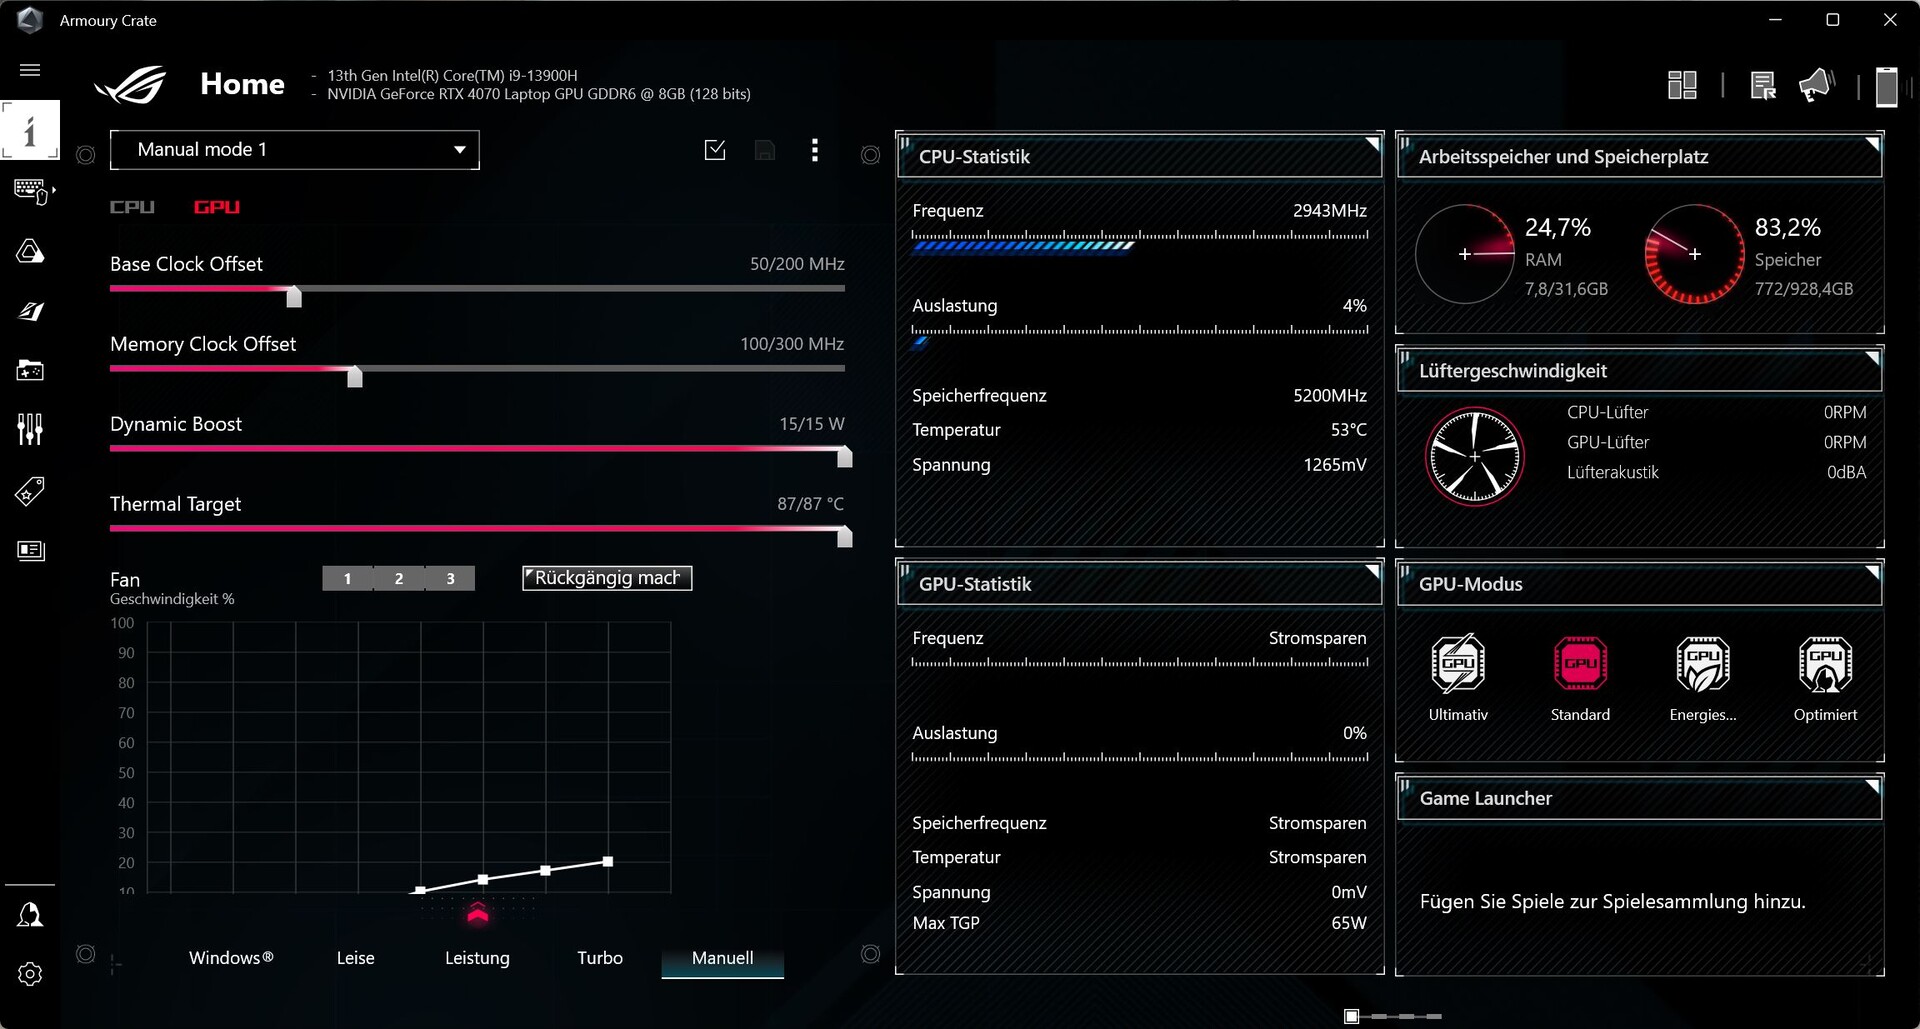
Já estamos familiarizados com o software Armoury Crate de outros dispositivos ROG e ele oferece configurações abrangentes para os modos de potência, bem como o comportamento das GPUs. É possível, por exemplo, desativar completamente a iGPU. Similar a outros modelos ROG, notamos que a GPU dedicada deve estar ativa quando você anexa uma tela externa, o que aumentará o consumo de energia em situações diárias. Listamos os modos de potência do ROG na tabela a seguir:
| Carga da CPU | Carga da GPU | Teste de estresse | Ruído máximo do ventilador | CB R23 Multi | Time Spy Gráficos | |
|---|---|---|---|---|---|---|
| Silencioso | 36/20 Watts | 35 Watts | CPU: 20 Watts GPU: 35 Watts |
36,5 dB(A) | 8207 pontos | 7344 pontos |
| Desempenho | 100/55 Watts | 50 Watts | CPU: ~35 Watts GPU: 30 Watts |
43,4 dB(A) | 15557 pontos | 8720 pontos |
| Turbo | 100/65 Watts | 65 Watts | CPU: 30-50 Watts GPU: 45 Watts |
46,9 dB(A) | 18682 pontos | 9513 pontos |
Utilizamos o modo Turbo para nossos benchmarks e medições para o desempenho máximo da GPU. Favor observar que o modo Turbo só está disponível quando a PSU é anexada. Também vamos dar uma olhada no ruído do ventilador com os outros perfis de potência.
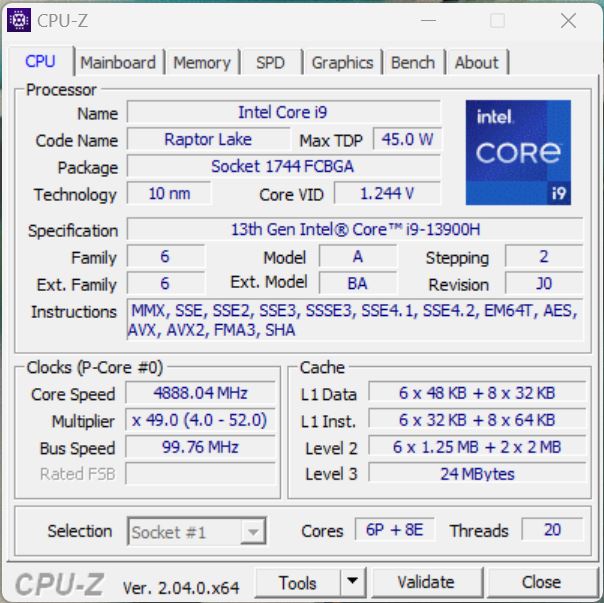
Processador - Core i9-13900H
O novo Intel Raptor LakeNúcleo i9-13900Hé basicamente o antigoNúcleo i9-12900Hda versão anterior com frequências Turbo ligeiramente aumentadas. A CPU pode consumir 100 Watts por curtos períodos e 65 Watts para cargas de trabalho sustentadas no modo Turbo power. Isto significa que ainda estamos muito longe do potencial máximo do Core i9, mas os resultados gerais ainda são muito bons considerando o tamanho compacto. O consumo de energia da bateria é limitado a 40 Watts, o que significa que você perderá cerca de 25% de desempenho da CPU em cenários multi-core. Por favor, veja nosso seção técnica para mais benchmarks.
Cinebench R15 Multi Loop
Cinebench R23: Multi Core | Single Core
Cinebench R20: CPU (Multi Core) | CPU (Single Core)
Cinebench R15: CPU Multi 64Bit | CPU Single 64Bit
Blender: v2.79 BMW27 CPU
7-Zip 18.03: 7z b 4 | 7z b 4 -mmt1
Geekbench 5.5: Multi-Core | Single-Core
HWBOT x265 Benchmark v2.2: 4k Preset
LibreOffice : 20 Documents To PDF
R Benchmark 2.5: Overall mean
| CPU Performance rating | |
| Média da turma Gaming | |
| Asus ROG Zephyrus M16 GU604VY-NM042X | |
| Asus ROG Flow Z13 GZ301V | |
| Asus ROG Flow Z13 ACRNM | |
| Asus ROG Flow Z13 GZ301ZE | |
| Média Intel Core i9-13900H | |
| Gigabyte AERO 16 OLED BSF | |
| Apple MacBook Pro 14 2023 M2 Pro -6! | |
| Alienware x14 i7 RTX 3060 | |
| Razer Blade 14 Ryzen 9 6900HX | |
| Asus ROG Zephyrus G14 GA402RK | |
| Microsoft Surface Pro 9, i7-1255U | |
| Cinebench R20 / CPU (Multi Core) | |
| Média da turma Gaming (4029 - 16433, n=106, últimos 2 anos) | |
| Asus ROG Zephyrus M16 GU604VY-NM042X | |
| Gigabyte AERO 16 OLED BSF | |
| Asus ROG Flow Z13 ACRNM | |
| Asus ROG Flow Z13 GZ301V | |
| Média Intel Core i9-13900H (4935 - 7716, n=25) | |
| Alienware x14 i7 RTX 3060 | |
| Asus ROG Flow Z13 GZ301ZE | |
| Razer Blade 14 Ryzen 9 6900HX | |
| Asus ROG Zephyrus G14 GA402RK | |
| Apple MacBook Pro 14 2023 M2 Pro | |
| Microsoft Surface Pro 9, i7-1255U | |
| Cinebench R20 / CPU (Single Core) | |
| Asus ROG Flow Z13 GZ301V | |
| Média da turma Gaming (442 - 913, n=106, últimos 2 anos) | |
| Asus ROG Flow Z13 ACRNM | |
| Asus ROG Zephyrus M16 GU604VY-NM042X | |
| Asus ROG Flow Z13 GZ301ZE | |
| Média Intel Core i9-13900H (428 - 792, n=25) | |
| Alienware x14 i7 RTX 3060 | |
| Gigabyte AERO 16 OLED BSF | |
| Microsoft Surface Pro 9, i7-1255U | |
| Asus ROG Zephyrus G14 GA402RK | |
| Razer Blade 14 Ryzen 9 6900HX | |
| Apple MacBook Pro 14 2023 M2 Pro | |
| Cinebench R15 / CPU Multi 64Bit | |
| Média da turma Gaming (1578 - 6330, n=105, últimos 2 anos) | |
| Asus ROG Zephyrus M16 GU604VY-NM042X | |
| Gigabyte AERO 16 OLED BSF | |
| Asus ROG Flow Z13 GZ301V | |
| Asus ROG Flow Z13 ACRNM | |
| Asus ROG Flow Z13 GZ301ZE | |
| Média Intel Core i9-13900H (2061 - 3100, n=26) | |
| Alienware x14 i7 RTX 3060 | |
| Razer Blade 14 Ryzen 9 6900HX | |
| Apple MacBook Pro 14 2023 M2 Pro | |
| Asus ROG Zephyrus G14 GA402RK | |
| Microsoft Surface Pro 9, i7-1255U | |
| Cinebench R15 / CPU Single 64Bit | |
| Média da turma Gaming (188.8 - 350, n=106, últimos 2 anos) | |
| Asus ROG Flow Z13 GZ301V | |
| Asus ROG Zephyrus M16 GU604VY-NM042X | |
| Asus ROG Flow Z13 ACRNM | |
| Asus ROG Flow Z13 GZ301ZE | |
| Média Intel Core i9-13900H (211 - 297, n=26) | |
| Asus ROG Zephyrus G14 GA402RK | |
| Alienware x14 i7 RTX 3060 | |
| Razer Blade 14 Ryzen 9 6900HX | |
| Gigabyte AERO 16 OLED BSF | |
| Apple MacBook Pro 14 2023 M2 Pro | |
| Microsoft Surface Pro 9, i7-1255U | |
| Blender / v2.79 BMW27 CPU | |
| Microsoft Surface Pro 9, i7-1255U | |
| Asus ROG Zephyrus G14 GA402RK | |
| Alienware x14 i7 RTX 3060 | |
| Razer Blade 14 Ryzen 9 6900HX | |
| Asus ROG Flow Z13 GZ301ZE | |
| Média Intel Core i9-13900H (166 - 268, n=24) | |
| Asus ROG Flow Z13 GZ301V | |
| Asus ROG Flow Z13 ACRNM | |
| Gigabyte AERO 16 OLED BSF | |
| Asus ROG Zephyrus M16 GU604VY-NM042X | |
| Média da turma Gaming (79 - 330, n=104, últimos 2 anos) | |
| 7-Zip 18.03 / 7z b 4 -mmt1 | |
| Asus ROG Flow Z13 GZ301V | |
| Média da turma Gaming (4199 - 7436, n=105, últimos 2 anos) | |
| Asus ROG Flow Z13 ACRNM | |
| Asus ROG Zephyrus M16 GU604VY-NM042X | |
| Asus ROG Flow Z13 GZ301ZE | |
| Média Intel Core i9-13900H (3665 - 6600, n=25) | |
| Asus ROG Zephyrus G14 GA402RK | |
| Razer Blade 14 Ryzen 9 6900HX | |
| Alienware x14 i7 RTX 3060 | |
| Gigabyte AERO 16 OLED BSF | |
| Microsoft Surface Pro 9, i7-1255U | |
| HWBOT x265 Benchmark v2.2 / 4k Preset | |
| Média da turma Gaming (11.5 - 44.4, n=105, últimos 2 anos) | |
| Asus ROG Zephyrus M16 GU604VY-NM042X | |
| Gigabyte AERO 16 OLED BSF | |
| Asus ROG Flow Z13 ACRNM | |
| Asus ROG Flow Z13 GZ301V | |
| Média Intel Core i9-13900H (14.1 - 22.3, n=25) | |
| Razer Blade 14 Ryzen 9 6900HX | |
| Alienware x14 i7 RTX 3060 | |
| Asus ROG Flow Z13 GZ301ZE | |
| Asus ROG Zephyrus G14 GA402RK | |
| Microsoft Surface Pro 9, i7-1255U | |
| LibreOffice / 20 Documents To PDF | |
| Asus ROG Flow Z13 ACRNM | |
| Gigabyte AERO 16 OLED BSF | |
| Microsoft Surface Pro 9, i7-1255U | |
| Asus ROG Zephyrus M16 GU604VY-NM042X | |
| Razer Blade 14 Ryzen 9 6900HX | |
| Média da turma Gaming (33.2 - 88.8, n=105, últimos 2 anos) | |
| Asus ROG Zephyrus G14 GA402RK | |
| Média Intel Core i9-13900H (34.4 - 82.8, n=25) | |
| Asus ROG Flow Z13 GZ301ZE | |
| Asus ROG Flow Z13 GZ301V | |
| Alienware x14 i7 RTX 3060 | |
| R Benchmark 2.5 / Overall mean | |
| Microsoft Surface Pro 9, i7-1255U | |
| Gigabyte AERO 16 OLED BSF | |
| Razer Blade 14 Ryzen 9 6900HX | |
| Asus ROG Zephyrus G14 GA402RK | |
| Alienware x14 i7 RTX 3060 | |
| Média Intel Core i9-13900H (0.4052 - 0.723, n=25) | |
| Média da turma Gaming (0.3439 - 0.759, n=106, últimos 2 anos) | |
| Asus ROG Flow Z13 GZ301ZE | |
| Asus ROG Flow Z13 ACRNM | |
| Asus ROG Zephyrus M16 GU604VY-NM042X | |
| Asus ROG Flow Z13 GZ301V | |
* ... menor é melhor
AIDA64: FP32 Ray-Trace | FPU Julia | CPU SHA3 | CPU Queen | FPU SinJulia | FPU Mandel | CPU AES | CPU ZLib | FP64 Ray-Trace | CPU PhotoWorxx
| Performance rating | |
| Média da turma Gaming | |
| Gigabyte AERO 16 OLED BSF | |
| Razer Blade 14 Ryzen 9 6900HX | |
| Asus ROG Flow Z13 ACRNM | |
| Asus ROG Zephyrus G14 GA402RK | |
| Asus ROG Flow Z13 GZ301V | |
| Média Intel Core i9-13900H | |
| Alienware x14 i7 RTX 3060 | |
| Asus ROG Flow Z13 GZ301ZE | |
| AIDA64 / FP32 Ray-Trace | |
| Média da turma Gaming (10227 - 85542, n=105, últimos 2 anos) | |
| Gigabyte AERO 16 OLED BSF | |
| Asus ROG Flow Z13 ACRNM | |
| Razer Blade 14 Ryzen 9 6900HX | |
| Asus ROG Flow Z13 GZ301V | |
| Média Intel Core i9-13900H (6788 - 19557, n=25) | |
| Asus ROG Zephyrus G14 GA402RK | |
| Alienware x14 i7 RTX 3060 | |
| Asus ROG Flow Z13 GZ301ZE | |
| AIDA64 / FPU Julia | |
| Média da turma Gaming (51376 - 238426, n=105, últimos 2 anos) | |
| Razer Blade 14 Ryzen 9 6900HX | |
| Gigabyte AERO 16 OLED BSF | |
| Asus ROG Zephyrus G14 GA402RK | |
| Asus ROG Flow Z13 ACRNM | |
| Asus ROG Flow Z13 GZ301V | |
| Média Intel Core i9-13900H (22551 - 95579, n=25) | |
| Alienware x14 i7 RTX 3060 | |
| Asus ROG Flow Z13 GZ301ZE | |
| AIDA64 / CPU SHA3 | |
| Média da turma Gaming (2180 - 10115, n=105, últimos 2 anos) | |
| Gigabyte AERO 16 OLED BSF | |
| Asus ROG Flow Z13 ACRNM | |
| Média Intel Core i9-13900H (2491 - 4270, n=25) | |
| Asus ROG Flow Z13 GZ301V | |
| Razer Blade 14 Ryzen 9 6900HX | |
| Asus ROG Zephyrus G14 GA402RK | |
| Alienware x14 i7 RTX 3060 | |
| Asus ROG Flow Z13 GZ301ZE | |
| AIDA64 / CPU Queen | |
| Média da turma Gaming (49785 - 173351, n=90, últimos 2 anos) | |
| Asus ROG Flow Z13 GZ301V | |
| Asus ROG Flow Z13 ACRNM | |
| Média Intel Core i9-13900H (65121 - 120936, n=25) | |
| Asus ROG Flow Z13 GZ301ZE | |
| Asus ROG Zephyrus G14 GA402RK | |
| Razer Blade 14 Ryzen 9 6900HX | |
| Alienware x14 i7 RTX 3060 | |
| Gigabyte AERO 16 OLED BSF | |
| AIDA64 / FPU SinJulia | |
| Média da turma Gaming (4424 - 33636, n=105, últimos 2 anos) | |
| Razer Blade 14 Ryzen 9 6900HX | |
| Asus ROG Zephyrus G14 GA402RK | |
| Asus ROG Flow Z13 ACRNM | |
| Gigabyte AERO 16 OLED BSF | |
| Asus ROG Flow Z13 GZ301V | |
| Média Intel Core i9-13900H (6108 - 11631, n=25) | |
| Alienware x14 i7 RTX 3060 | |
| Asus ROG Flow Z13 GZ301ZE | |
| AIDA64 / FPU Mandel | |
| Média da turma Gaming (25115 - 128721, n=105, últimos 2 anos) | |
| Razer Blade 14 Ryzen 9 6900HX | |
| Asus ROG Zephyrus G14 GA402RK | |
| Gigabyte AERO 16 OLED BSF | |
| Asus ROG Flow Z13 ACRNM | |
| Asus ROG Flow Z13 GZ301V | |
| Média Intel Core i9-13900H (11283 - 48474, n=25) | |
| Alienware x14 i7 RTX 3060 | |
| Asus ROG Flow Z13 GZ301ZE | |
| AIDA64 / CPU AES | |
| Gigabyte AERO 16 OLED BSF | |
| Razer Blade 14 Ryzen 9 6900HX | |
| Asus ROG Zephyrus G14 GA402RK | |
| Média da turma Gaming (39258 - 247074, n=105, últimos 2 anos) | |
| Alienware x14 i7 RTX 3060 | |
| Média Intel Core i9-13900H (3691 - 149377, n=25) | |
| Asus ROG Flow Z13 GZ301ZE | |
| Asus ROG Flow Z13 ACRNM | |
| Asus ROG Flow Z13 GZ301V | |
| AIDA64 / CPU ZLib | |
| Média da turma Gaming (574 - 2531, n=105, últimos 2 anos) | |
| Asus ROG Flow Z13 ACRNM | |
| Gigabyte AERO 16 OLED BSF | |
| Asus ROG Flow Z13 GZ301V | |
| Média Intel Core i9-13900H (789 - 1254, n=25) | |
| Alienware x14 i7 RTX 3060 | |
| Asus ROG Flow Z13 GZ301ZE | |
| Razer Blade 14 Ryzen 9 6900HX | |
| Asus ROG Zephyrus G14 GA402RK | |
| AIDA64 / FP64 Ray-Trace | |
| Média da turma Gaming (5509 - 45446, n=105, últimos 2 anos) | |
| Gigabyte AERO 16 OLED BSF | |
| Asus ROG Flow Z13 ACRNM | |
| Razer Blade 14 Ryzen 9 6900HX | |
| Asus ROG Flow Z13 GZ301V | |
| Média Intel Core i9-13900H (3655 - 10716, n=25) | |
| Asus ROG Zephyrus G14 GA402RK | |
| Alienware x14 i7 RTX 3060 | |
| Asus ROG Flow Z13 GZ301ZE | |
| AIDA64 / CPU PhotoWorxx | |
| Alienware x14 i7 RTX 3060 | |
| Média da turma Gaming (12271 - 89891, n=105, últimos 2 anos) | |
| Gigabyte AERO 16 OLED BSF | |
| Asus ROG Flow Z13 ACRNM | |
| Asus ROG Flow Z13 GZ301ZE | |
| Asus ROG Flow Z13 GZ301V | |
| Média Intel Core i9-13900H (10871 - 50488, n=25) | |
| Asus ROG Zephyrus G14 GA402RK | |
| Razer Blade 14 Ryzen 9 6900HX | |
Desempenho do sistema
O desempenho do sistema do ROG Flow Z13 é excelente, o que é apoiado pelas boas pontuações de referência, bem como por nossa impressão de desempenho subjetivo.
CrossMark: Overall | Productivity | Creativity | Responsiveness
| PCMark 10 / Score | |
| Média da turma Gaming (5828 - 12414, n=93, últimos 2 anos) | |
| Gigabyte AERO 16 OLED BSF | |
| Asus ROG Flow Z13 ACRNM | |
| Asus ROG Flow Z13 ACRNM | |
| Asus ROG Zephyrus G14 GA402RK | |
| Média Intel Core i9-13900H, NVIDIA GeForce RTX 4070 Laptop GPU (5855 - 8538, n=8) | |
| Asus ROG Flow Z13 GZ301V | |
| Razer Blade 14 Ryzen 9 6900HX | |
| Alienware x14 i7 RTX 3060 | |
| Asus ROG Flow Z13 GZ301ZE | |
| PCMark 10 / Essentials | |
| Asus ROG Flow Z13 ACRNM | |
| Asus ROG Flow Z13 GZ301V | |
| Gigabyte AERO 16 OLED BSF | |
| Asus ROG Flow Z13 ACRNM | |
| Razer Blade 14 Ryzen 9 6900HX | |
| Asus ROG Zephyrus G14 GA402RK | |
| Média Intel Core i9-13900H, NVIDIA GeForce RTX 4070 Laptop GPU (8835 - 11940, n=8) | |
| Asus ROG Flow Z13 GZ301ZE | |
| Média da turma Gaming (8810 - 11935, n=97, últimos 2 anos) | |
| Alienware x14 i7 RTX 3060 | |
| PCMark 10 / Productivity | |
| Média da turma Gaming (6845 - 25323, n=95, últimos 2 anos) | |
| Asus ROG Flow Z13 ACRNM | |
| Asus ROG Flow Z13 GZ301V | |
| Asus ROG Flow Z13 ACRNM | |
| Média Intel Core i9-13900H, NVIDIA GeForce RTX 4070 Laptop GPU (7967 - 10991, n=8) | |
| Asus ROG Zephyrus G14 GA402RK | |
| Asus ROG Flow Z13 GZ301ZE | |
| Alienware x14 i7 RTX 3060 | |
| Gigabyte AERO 16 OLED BSF | |
| Razer Blade 14 Ryzen 9 6900HX | |
| PCMark 10 / Digital Content Creation | |
| Média da turma Gaming (7602 - 19954, n=95, últimos 2 anos) | |
| Gigabyte AERO 16 OLED BSF | |
| Asus ROG Flow Z13 ACRNM | |
| Asus ROG Zephyrus G14 GA402RK | |
| Média Intel Core i9-13900H, NVIDIA GeForce RTX 4070 Laptop GPU (7738 - 13575, n=8) | |
| Asus ROG Flow Z13 ACRNM | |
| Razer Blade 14 Ryzen 9 6900HX | |
| Asus ROG Flow Z13 GZ301V | |
| Alienware x14 i7 RTX 3060 | |
| Asus ROG Flow Z13 GZ301ZE | |
| CrossMark / Overall | |
| Asus ROG Flow Z13 GZ301ZE | |
| Média da turma Gaming (1366 - 2409, n=94, últimos 2 anos) | |
| Asus ROG Flow Z13 GZ301V | |
| Asus ROG Flow Z13 ACRNM | |
| Alienware x14 i7 RTX 3060 | |
| Gigabyte AERO 16 OLED BSF | |
| Média Intel Core i9-13900H, NVIDIA GeForce RTX 4070 Laptop GPU (1104 - 1974, n=7) | |
| CrossMark / Productivity | |
| Asus ROG Flow Z13 GZ301ZE | |
| Asus ROG Flow Z13 GZ301V | |
| Média da turma Gaming (1386 - 2254, n=94, últimos 2 anos) | |
| Asus ROG Flow Z13 ACRNM | |
| Alienware x14 i7 RTX 3060 | |
| Gigabyte AERO 16 OLED BSF | |
| Média Intel Core i9-13900H, NVIDIA GeForce RTX 4070 Laptop GPU (1058 - 1914, n=7) | |
| CrossMark / Creativity | |
| Média da turma Gaming (1343 - 2786, n=94, últimos 2 anos) | |
| Asus ROG Flow Z13 GZ301V | |
| Asus ROG Flow Z13 ACRNM | |
| Asus ROG Flow Z13 GZ301ZE | |
| Alienware x14 i7 RTX 3060 | |
| Média Intel Core i9-13900H, NVIDIA GeForce RTX 4070 Laptop GPU (1178 - 2254, n=7) | |
| Gigabyte AERO 16 OLED BSF | |
| CrossMark / Responsiveness | |
| Asus ROG Flow Z13 GZ301ZE | |
| Gigabyte AERO 16 OLED BSF | |
| Alienware x14 i7 RTX 3060 | |
| Média da turma Gaming (1226 - 2334, n=94, últimos 2 anos) | |
| Asus ROG Flow Z13 GZ301V | |
| Asus ROG Flow Z13 ACRNM | |
| Média Intel Core i9-13900H, NVIDIA GeForce RTX 4070 Laptop GPU (1037 - 1952, n=7) | |
| PCMark 10 Score | 8018 pontos | |
Ajuda | ||
| AIDA64 / Memory Copy | |
| Alienware x14 i7 RTX 3060 | |
| Asus ROG Flow Z13 GZ301ZE | |
| Média da turma Gaming (21750 - 129946, n=105, últimos 2 anos) | |
| Asus ROG Flow Z13 GZ301V | |
| Asus ROG Flow Z13 ACRNM | |
| Gigabyte AERO 16 OLED BSF | |
| Média Intel Core i9-13900H (37448 - 74486, n=25) | |
| Asus ROG Zephyrus G14 GA402RK | |
| Razer Blade 14 Ryzen 9 6900HX | |
| AIDA64 / Memory Read | |
| Alienware x14 i7 RTX 3060 | |
| Média da turma Gaming (22956 - 118858, n=105, últimos 2 anos) | |
| Asus ROG Flow Z13 GZ301ZE | |
| Gigabyte AERO 16 OLED BSF | |
| Asus ROG Flow Z13 ACRNM | |
| Asus ROG Flow Z13 GZ301V | |
| Média Intel Core i9-13900H (41599 - 75433, n=25) | |
| Asus ROG Zephyrus G14 GA402RK | |
| Razer Blade 14 Ryzen 9 6900HX | |
| AIDA64 / Memory Write | |
| Média da turma Gaming (22297 - 135096, n=105, últimos 2 anos) | |
| Asus ROG Flow Z13 GZ301V | |
| Asus ROG Flow Z13 ACRNM | |
| Gigabyte AERO 16 OLED BSF | |
| Média Intel Core i9-13900H (36152 - 88505, n=25) | |
| Alienware x14 i7 RTX 3060 | |
| Asus ROG Flow Z13 GZ301ZE | |
| Asus ROG Zephyrus G14 GA402RK | |
| Razer Blade 14 Ryzen 9 6900HX | |
| AIDA64 / Memory Latency | |
| Alienware x14 i7 RTX 3060 | |
| Média da turma Gaming (75.3 - 259, n=105, últimos 2 anos) | |
| Asus ROG Flow Z13 GZ301ZE | |
| Gigabyte AERO 16 OLED BSF | |
| Asus ROG Flow Z13 ACRNM | |
| Média Intel Core i9-13900H (75.8 - 102.3, n=25) | |
| Asus ROG Flow Z13 GZ301V | |
| Razer Blade 14 Ryzen 9 6900HX | |
| Asus ROG Zephyrus G14 GA402RK | |
* ... menor é melhor
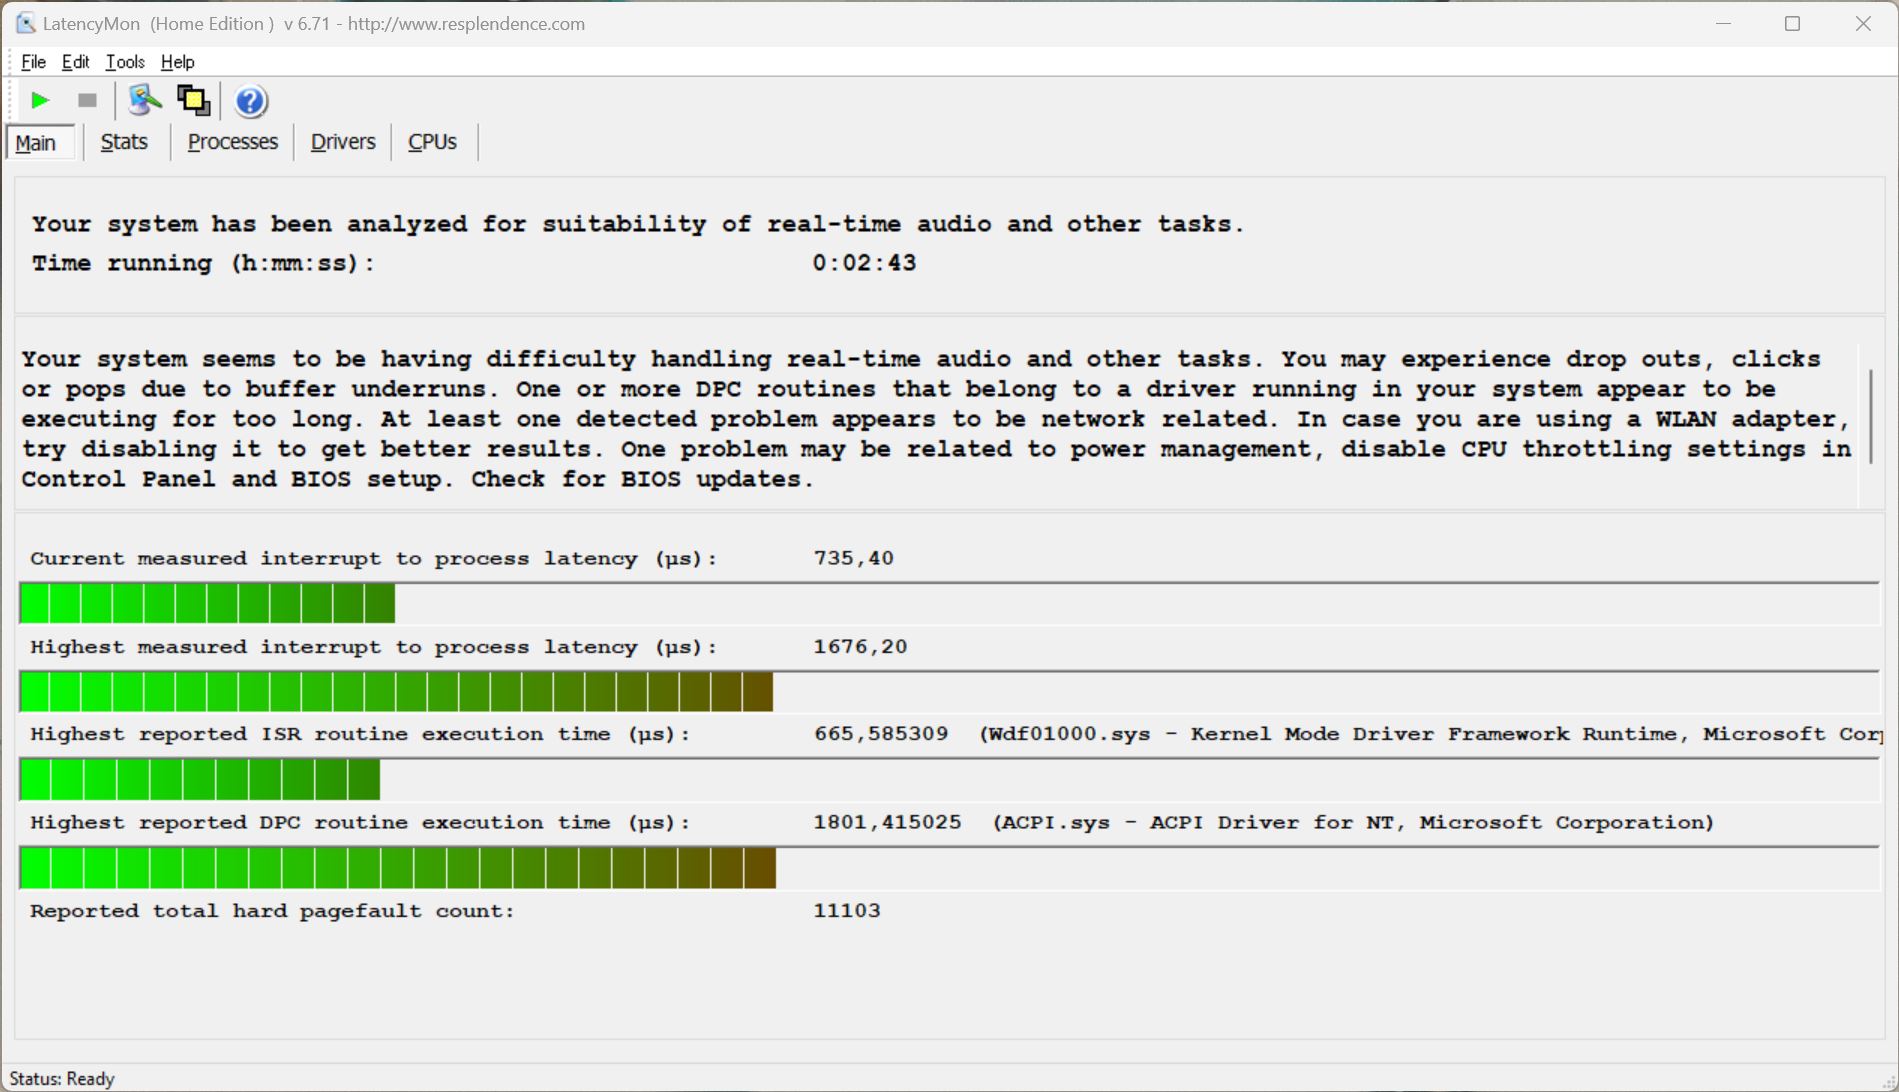
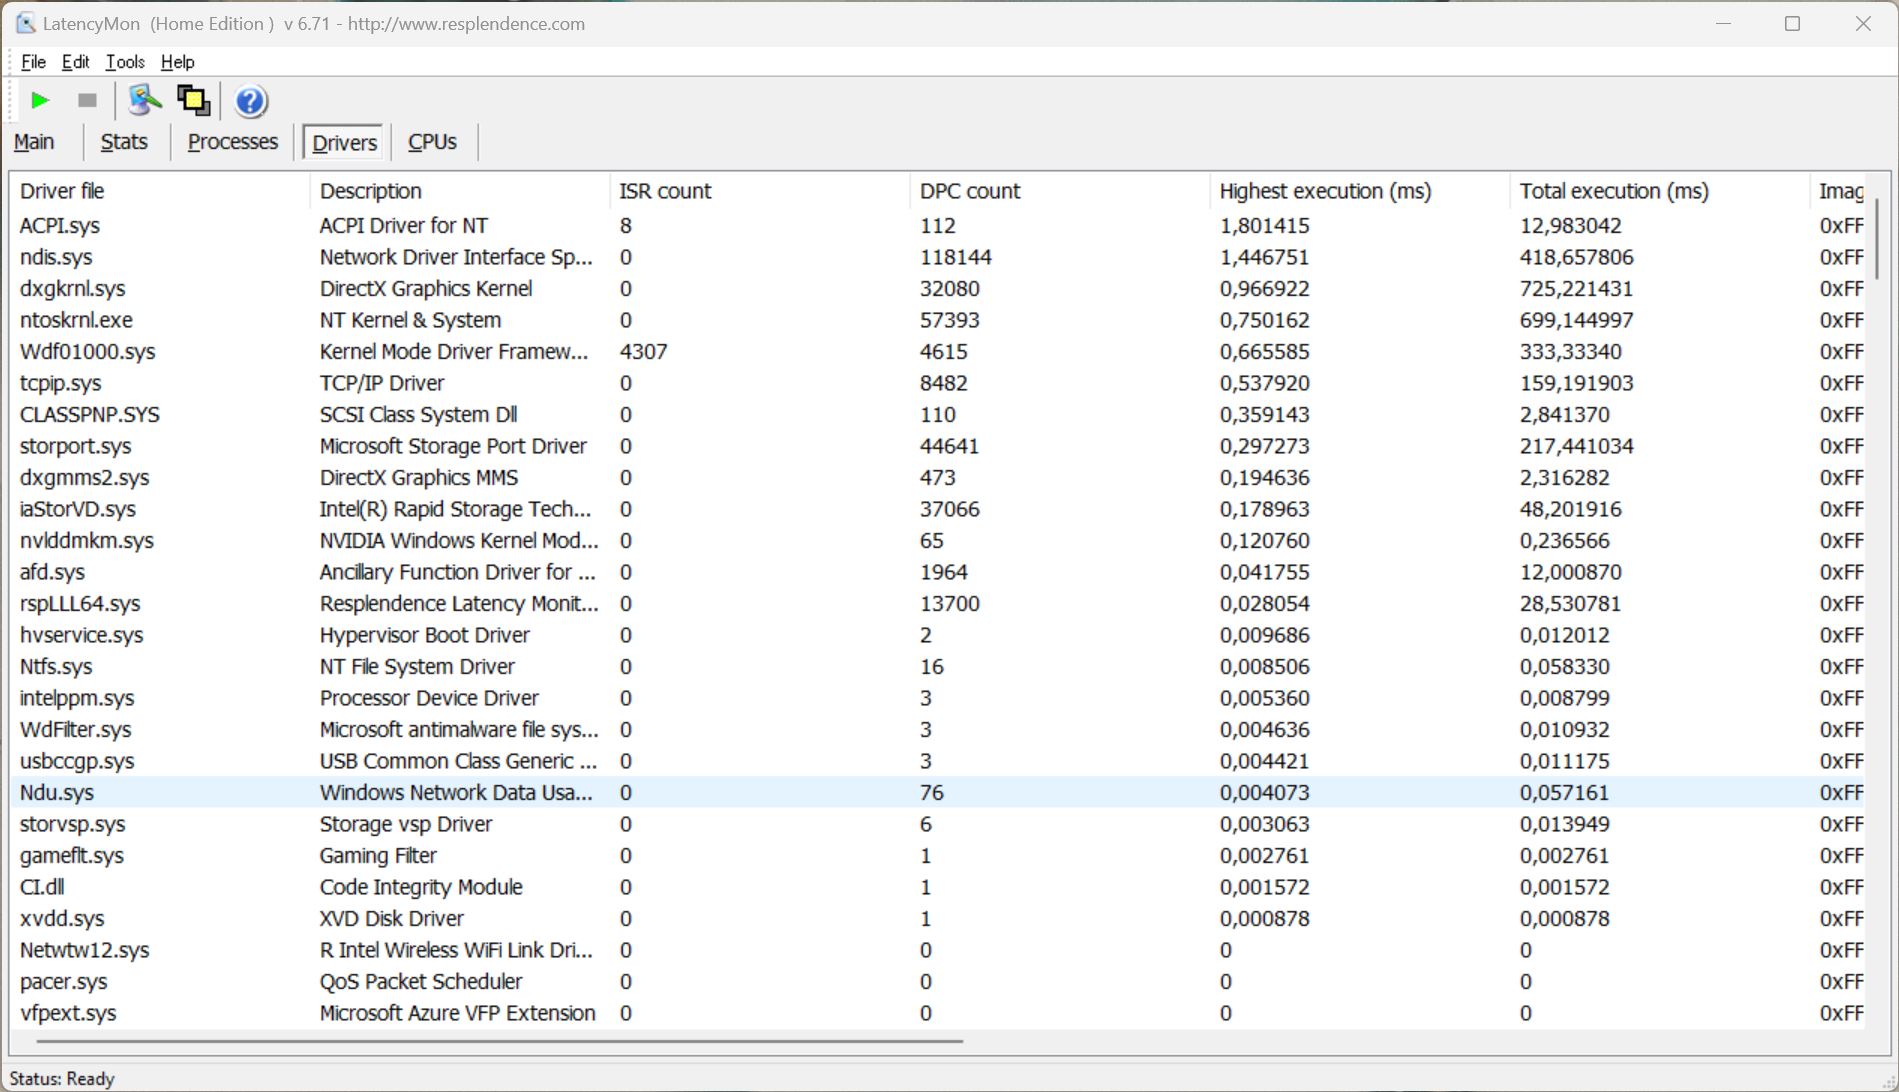
Latência do DPC
Nosso teste de latência padronizado (navegação na web, reprodução no YouTube 4K, carga da CPU) mostra alguns problemas com a versão atual da BIOS, mas também pode ser um resultado do driver da GPU Nvidia (há relatos de problemas de latência da DPC por um tempo agora). A situação pode melhorar com futuras atualizações de software.
| DPC Latencies / LatencyMon - interrupt to process latency (max), Web, Youtube, Prime95 | |
| Asus ROG Zephyrus G14 GA402RK | |
| Asus ROG Flow Z13 ACRNM | |
| Asus ROG Flow Z13 GZ301ZE | |
| Razer Blade 14 Ryzen 9 6900HX | |
| Alienware x14 i7 RTX 3060 | |
* ... menor é melhor
Dispositivos de armazenamento
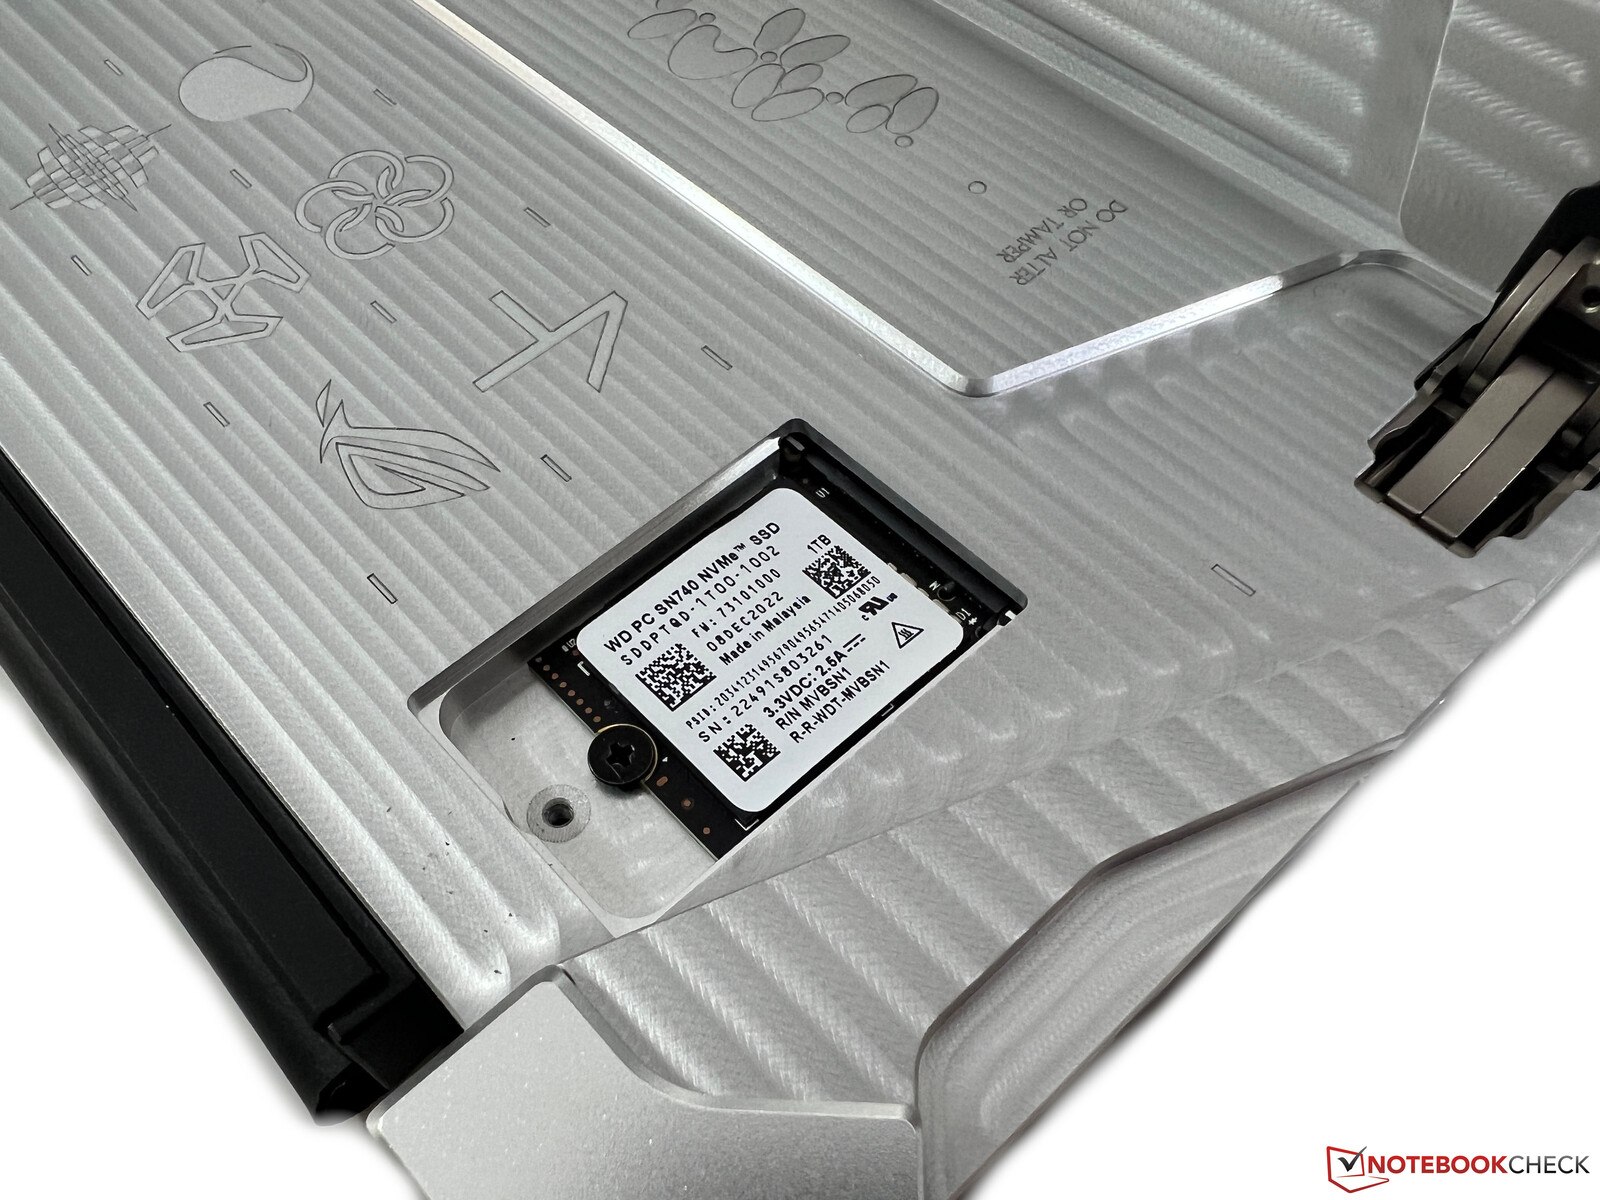
O Asus utiliza um NVMe-SSD M.2-2230 extremamente compacto, que pode ser acessado e substituído através de uma escotilha de manutenção na parte de trás do tablete. Nossa unidade de revisão está equipada com a versão de 1 TB do Western Digital SN740, um moderno drive PCIe 4.0 com taxas máximas de transferência de 5150 MB/s. Isto significa que não é o drive mais rápido, mas atinge o desempenho anunciado e é estável mesmo sob cargas de trabalho sustentadas. Em resumo, um bom resultado para o SSD compacto. Mais referências de SSD são listadas aqui.

* ... menor é melhor
Disk throttling: DiskSpd Read Loop, Queue Depth 8
Desempenho da GPU
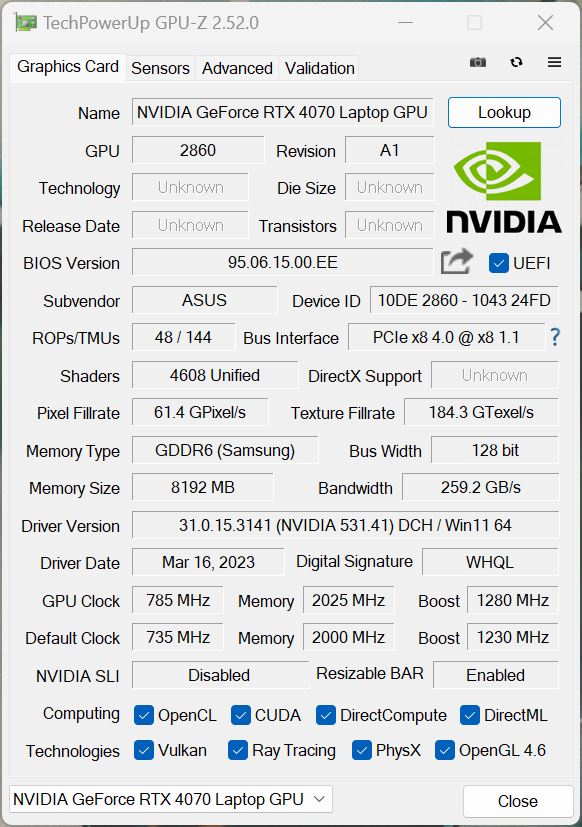
A edição ACRNM do ROG Flow Z13 está equipada com o novoNvidia GeForce RTX 4070 Laptopenquanto a versão normal é limitada aoComputador portátil RTX 4060. Ambos os modelos utilizam as variantes de 65W, o que significa que o desempenho não é comparável às versões que consomem 100-110 Watts que estas GPUs podem consumir (elas não precisam de mais potência durante os jogos, números TGP mais altos são irrelevantes para estas GPUs). Somente a GPU tem um TGP de 50 Watts em combinação com o Dynamic Boost de 15 Watts do processador.
O laptop RTX 4070 é obviamente uma atualização maciça em comparação com oRTX 3050 Tido predecessor e vemos uma vantagem de quase 130 % para o novo modelo nos benchmarks sintéticos. O fluxo regular Z13 com o notebook RTX 4060, por outro lado, é cerca de 20% mais lento. Em comparação com a versão mais rápida do laptop RTX 4070, como é usado noGigabyte Aero 16o modelo 65W é cerca de 20% mais lento e o mais rápido RTX 4060 Laptop (MSI Katana 17por exemplo) também é um pouco mais rápido. Entretanto, o laptop 65W RTX 4070 ainda está à frente do antigoRTX 3070 Tina Lâmina Razer 14 e também noRTX 3060noAlienware x14. Se você investir no XG Mobile eGPU com oComputador portátil RTX 4090(TGP máx. de 150W), você pode praticamente dobrar o desempenho da GPU.
O desempenho geral da GPU é muito bom quando se considera o fator de forma pequeno e o desempenho também é muito estável sob cargas de trabalho sustentadas (Time Spy teste de estresse: 96,3 %). O consumo de energia da GPU é limitado a 35 Watts na potência da bateria, o que resulta em um déficit de desempenho de ~25%. Mais pontos de referência de GPU estão disponíveis em nosso seção técnica.
| 3DMark 11 Performance | 29603 pontos | |
| 3DMark Fire Strike Score | 20875 pontos | |
| 3DMark Time Spy Score | 9917 pontos | |
| 3DMark Steel Nomad Score | 2228 pontos | |
| 3DMark Steel Nomad Light Score | 9949 pontos | |
Ajuda | ||
| Blender / v3.3 Classroom OPTIX/RTX | |
| Asus ROG Flow Z13 GZ301V | |
| Asus ROG Flow Z13 ACRNM | |
| Média NVIDIA GeForce RTX 4070 Laptop GPU (18 - 30, n=68) | |
| Gigabyte AERO 16 OLED BSF | |
| Média da turma Gaming (9 - 32, n=106, últimos 2 anos) | |
| Asus ROG Flow Z13 ACRNM | |
| Blender / v3.3 Classroom CUDA | |
| Asus ROG Flow Z13 GZ301V | |
| Asus ROG Flow Z13 ACRNM | |
| Média NVIDIA GeForce RTX 4070 Laptop GPU (32 - 50, n=67) | |
| Gigabyte AERO 16 OLED BSF | |
| Média da turma Gaming (15 - 228, n=106, últimos 2 anos) | |
| Blender / v3.3 Classroom CPU | |
| Asus ROG Flow Z13 GZ301V | |
| Asus ROG Flow Z13 ACRNM | |
| Gigabyte AERO 16 OLED BSF | |
| Média NVIDIA GeForce RTX 4070 Laptop GPU (158 - 440, n=67) | |
| Média da turma Gaming (122 - 565, n=102, últimos 2 anos) | |
* ... menor é melhor
Desempenho nos jogos
O desempenho do jogo também é muito bom e você também pode jogar títulos modernos na resolução nativa QHD com o máximo de detalhes. No entanto, o rastreamento de raios será muitas vezes muito desafiador, então você terá que usar o upscaling. O Flow Z13 com a versão 65W do laptop RTX 4070 fica mais uma vez atrás das versões mais poderosas do laptop RTX 4070 e também do laptop 4060, mas fica à frente do RTX 3070 Ti. É preciso considerar mais uma vez o formato compacto, e o desempenho de jogo também é estável durante sessões de jogo mais longas.
| Performance rating - Percent | |
| Média da turma Gaming | |
| Asus ROG Flow Z13 ACRNM | |
| Gigabyte AERO 16 OLED BSF | |
| MSI Katana 17 B13VFK | |
| Asus ROG Flow Z13 ACRNM | |
| Razer Blade 14 Ryzen 9 6900HX | |
| Alienware x14 i7 RTX 3060 -1! | |
| Asus ROG Zephyrus G14 GA402RK | |
| The Witcher 3 - 1920x1080 Ultra Graphics & Postprocessing (HBAO+) | |
| Média da turma Gaming (104.7 - 240, n=7, últimos 2 anos) | |
| Asus ROG Flow Z13 ACRNM | |
| Gigabyte AERO 16 OLED BSF | |
| MSI Katana 17 B13VFK | |
| Razer Blade 14 Ryzen 9 6900HX | |
| Asus ROG Zephyrus G14 GA402RK | |
| Asus ROG Flow Z13 ACRNM | |
| Alienware x14 i7 RTX 3060 | |
| Alienware x14 i7 RTX 3060 | |
| GTA V - 1920x1080 Highest AA:4xMSAA + FX AF:16x | |
| Média da turma Gaming (48.3 - 186.9, n=94, últimos 2 anos) | |
| Gigabyte AERO 16 OLED BSF | |
| MSI Katana 17 B13VFK | |
| Asus ROG Flow Z13 ACRNM | |
| Asus ROG Flow Z13 ACRNM | |
| Razer Blade 14 Ryzen 9 6900HX | |
| Alienware x14 i7 RTX 3060 | |
| Asus ROG Zephyrus G14 GA402RK | |
| Final Fantasy XV Benchmark - 1920x1080 High Quality | |
| Média da turma Gaming (41 - 215, n=95, últimos 2 anos) | |
| Asus ROG Flow Z13 ACRNM | |
| Gigabyte AERO 16 OLED BSF | |
| Razer Blade 14 Ryzen 9 6900HX | |
| MSI Katana 17 B13VFK | |
| Asus ROG Flow Z13 ACRNM | |
| Asus ROG Zephyrus G14 GA402RK | |
| Alienware x14 i7 RTX 3060 | |
| Strange Brigade - 1920x1080 ultra AA:ultra AF:16 | |
| Média da turma Gaming (76.3 - 458, n=87, últimos 2 anos) | |
| Asus ROG Flow Z13 ACRNM | |
| Gigabyte AERO 16 OLED BSF | |
| MSI Katana 17 B13VFK | |
| Razer Blade 14 Ryzen 9 6900HX | |
| Asus ROG Zephyrus G14 GA402RK | |
| Asus ROG Flow Z13 ACRNM | |
| Alienware x14 i7 RTX 3060 | |
| Dota 2 Reborn - 1920x1080 ultra (3/3) best looking | |
| MSI Katana 17 B13VFK | |
| Média da turma Gaming (84.8 - 248, n=107, últimos 2 anos) | |
| Alienware x14 i7 RTX 3060 | |
| Gigabyte AERO 16 OLED BSF | |
| Asus ROG Flow Z13 ACRNM | |
| Asus ROG Flow Z13 ACRNM | |
| Razer Blade 14 Ryzen 9 6900HX | |
| Asus ROG Zephyrus G14 GA402RK | |
| X-Plane 11.11 - 1920x1080 high (fps_test=3) | |
| MSI Katana 17 B13VFK | |
| Gigabyte AERO 16 OLED BSF | |
| Asus ROG Flow Z13 ACRNM | |
| Asus ROG Flow Z13 ACRNM | |
| Média da turma Gaming (55.5 - 143.5, n=109, últimos 2 anos) | |
| Razer Blade 14 Ryzen 9 6900HX | |
| Asus ROG Zephyrus G14 GA402RK | |
| Cyberpunk 2077 1.6 - 2560x1440 Ultra Preset | |
| Asus ROG Flow Z13 ACRNM | |
| Asus ROG Flow Z13 ACRNM | |
| Média NVIDIA GeForce RTX 4070 Laptop GPU (30 - 63.9, n=24) | |
| Gigabyte AERO 16 OLED BSF | |
| MSI Katana 17 B13VFK | |
| Razer Blade 14 Ryzen 9 6900HX | |
| Asus ROG Zephyrus G14 GA402RK | |
| Call of Duty Modern Warfare 2 2022 - 2560x1440 Extreme Quality Preset AA:T2X Filmic SM | |
| Asus ROG Flow Z13 ACRNM | |
| Média NVIDIA GeForce RTX 4070 Laptop GPU (59 - 77, n=9) | |
| Gigabyte AERO 16 OLED BSF | |
| Razer Blade 15 OLED (Early 2022) | |
| MSI Katana 17 B13VFK | |
| Asus ROG Flow Z13 ACRNM | |
| Far Cry 6 - 2560x1440 Ultra Graphics Quality + HD Textures AA:T | |
| Média da turma Gaming (n=1últimos 2 anos) | |
| Asus ROG Flow Z13 ACRNM | |
| Média NVIDIA GeForce RTX 4070 Laptop GPU (70 - 91, n=11) | |
| Asus ROG Zephyrus G14 GA402RK | |
| Asus ROG Flow Z13 ACRNM | |
| MSI Katana 17 B13VFK | |
| GTA V - 2560x1440 Highest AA:4xMSAA + FX AF:16x | |
| Média da turma Gaming (36.9 - 183.9, n=72, últimos 2 anos) | |
| Asus ROG Flow Z13 ACRNM | |
| Razer Blade 15 OLED (Early 2022) | |
| Razer Blade 15 OLED (Early 2022) | |
| Gigabyte AERO 16 OLED BSF | |
| Razer Blade 14 Ryzen 9 6900HX | |
| Média NVIDIA GeForce RTX 4070 Laptop GPU (36.9 - 102.2, n=51) | |
| MSI Katana 17 B13VFK | |
| Asus ROG Flow Z13 ACRNM | |
| Spider-Man Miles Morales - 2560x1440 Very High Preset AA:T | |
| Asus ROG Flow Z13 ACRNM | |
| Razer Blade 15 OLED (Early 2022) | |
| Média NVIDIA GeForce RTX 4070 Laptop GPU (53.1 - 86, n=3) | |
| Gigabyte AERO 16 OLED BSF | |
| MSI Katana 17 B13VFK | |
| Asus ROG Flow Z13 ACRNM | |
Witcher 3 FPS chart
| baixo | média | alto | ultra | QHD DLSS | QHD | 4K | |
|---|---|---|---|---|---|---|---|
| GTA V (2015) | 182.2 | 175.4 | 165.8 | 94.8 | 75.9 | ||
| The Witcher 3 (2015) | 83.2 | ||||||
| Dota 2 Reborn (2015) | 171 | 152.5 | 142.8 | 135 | 107 | ||
| Final Fantasy XV Benchmark (2018) | 128.2 | 93.3 | 71.6 | 40.3 | |||
| X-Plane 11.11 (2018) | 165.7 | 141.8 | 110.3 | 103.4 | |||
| Strange Brigade (2018) | 393 | 249 | 202 | 174.8 | 122.8 | ||
| Shadow of the Tomb Raider (2018) | 117 | 86 | |||||
| Assassin´s Creed Valhalla (2020) | 86 | 65 | |||||
| Far Cry 6 (2021) | 92 | 70 | |||||
| Cyberpunk 2077 1.6 (2022) | 71.62 | 53.88 | |||||
| Tiny Tina's Wonderlands (2022) | 79.7 | 57.61 | |||||
| F1 22 (2022) | 192.3 | 190 | 163 | 61.8 | 40.9 | ||
| Call of Duty Modern Warfare 2 2022 (2022) | 80 | 59 | |||||
| Spider-Man Miles Morales (2022) | 82.3 | 53.1 | |||||
| Baldur's Gate 3 (2023) | 86.1 | 62.3 | |||||
| Cyberpunk 2077 (2023) | 66.79 | 49.7 | 40.1 | ||||
| Horizon Forbidden West (2024) | 56.1 | 54.6 | 45.5 | ||||
| Ghost of Tsushima (2024) | 55.3 | 57 | 43.6 | ||||
| F1 24 (2024) | 58.4 | 57 | 36.8 | ||||
| Black Myth: Wukong (2024) | 25 | 28 | 18 | ||||
| Star Wars Outlaws (2024) | 35.4 | 35.3 | 25.9 | ||||
| God of War Ragnarök (2024) | 76.2 | 78 | 60.5 | ||||
| Call of Duty Black Ops 6 (2024) | 71 | 60 | 52 | ||||
| Indiana Jones and the Great Circle (2024) | 97.5 | 55 | 39.4 | ||||
| Monster Hunter Wilds (2025) | 39.7 | 35.69 | 29 |
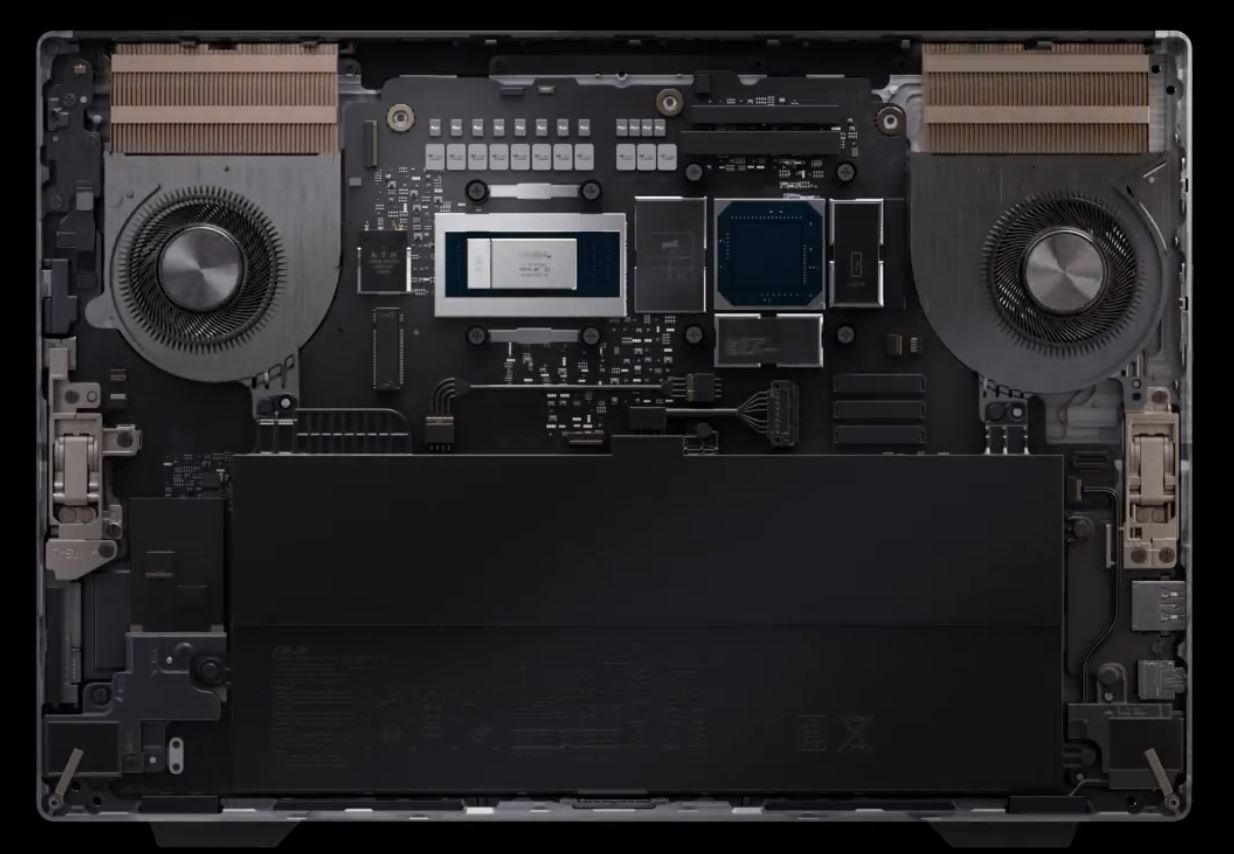
Emissões - Alto-falantes fracos
Ruído do sistema
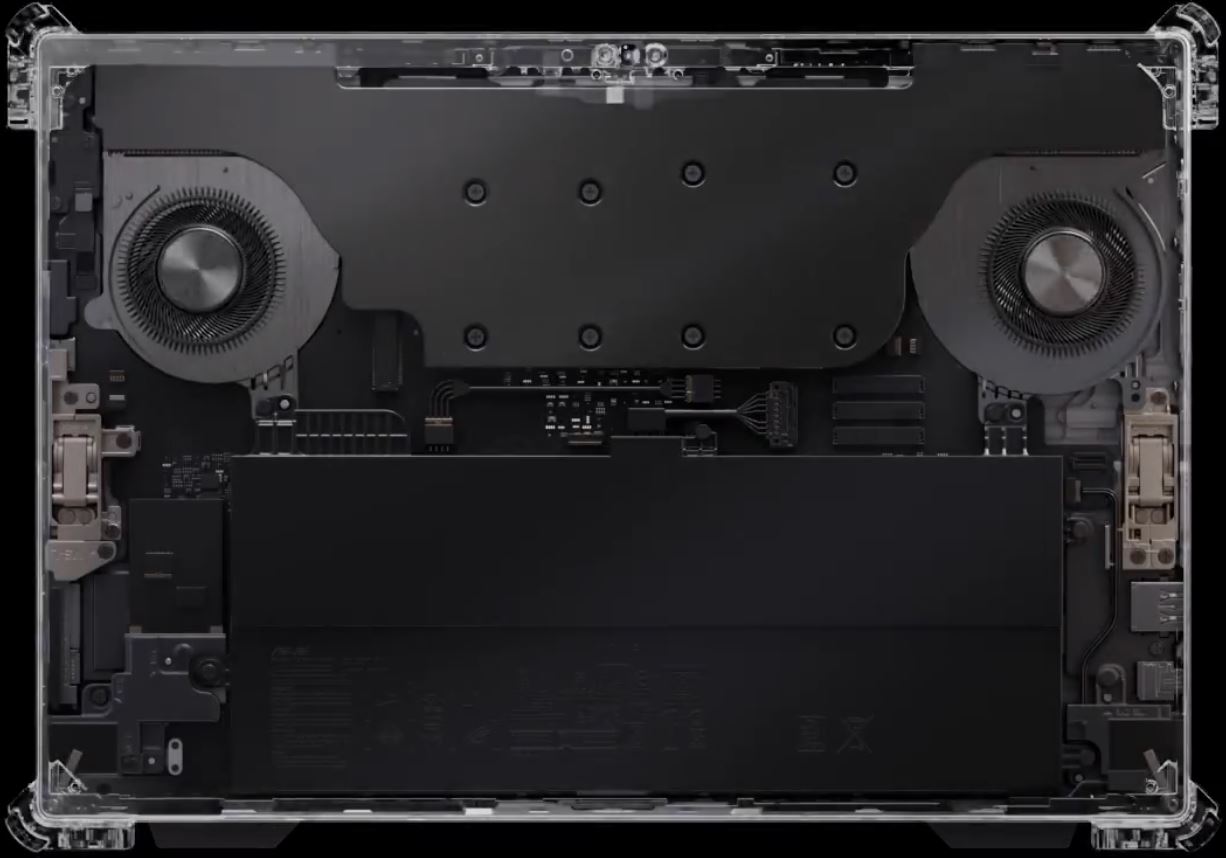
Asus usa dois ventiladores, metal líquido para melhor dissipação de calor, bem como uma câmara de vapor para a solução de resfriamento. O ruído dos ventiladores depende principalmente do perfil de potência selecionado e não recomendamos o modo Turbo para cargas de trabalho diárias, já que os ventiladores saltam imediatamente para 37 dB(A) neste modo quando começam a girar. O modo Silencioso é muito mais adequado e é muito mais silencioso para cargas de trabalho leves. Os ventiladores são geralmente mais altos sob carga em comparação com o modo antigoFluxo ROG Z13 com o RTX 3050 Ti. O murmúrio do ventilador em si não é irritante, mas você nota uma leve vibração em velocidades mais altas do ventilador. Listamos os resultados do ruído com diferentes modos de potência na tabela abaixo:
| Silencioso | Desempenho | Turbo | |
|---|---|---|---|
| Carga Média | 31,3 dB(A) | 40,6 dB(A) | 41,3 dB(A) |
| Witcher 3 Ultra ajustes | 35,7 dB(A) | 40,6 dB(A) | 44,7 dB(A) |
| Teste de estresse | 36,5 dB(A) | 43,4 dB(A) | 46,9 dB(A) |
Também notamos um ruído de alta intensidade quando o dispositivo está em standby e o adaptador de energia está conectado. É silencioso, mas definitivamente perceptível e irritante. O Asus deveria dar uma olhada nesta questão.
Barulho
| Ocioso |
| 24 / 24 / 36.5 dB |
| Carga |
| 41.3 / 46.9 dB |
 | ||
30 dB silencioso 40 dB(A) audível 50 dB(A) ruidosamente alto |
||
min: | ||
| Asus ROG Flow Z13 ACRNM GeForce RTX 4070 Laptop GPU, i9-13900H, WD PC SN740 SDDPTQD-1T00 | Asus ROG Flow Z13 GZ301ZE GeForce RTX 3050 Ti Laptop GPU, i9-12900H, Micron 2450 1TB MTFDKBK1T0TFK | Alienware x14 i7 RTX 3060 GeForce RTX 3060 Laptop GPU, i7-12700H, WDC PC SN810 1TB | Razer Blade 14 Ryzen 9 6900HX GeForce RTX 3070 Ti Laptop GPU, R9 6900HX, Samsung PM9A1 MZVL21T0HCLR | Asus ROG Zephyrus G14 GA402RK Radeon RX 6800S, R9 6900HS, Micron 2450 1TB MTFDKBK1T0TFK | |
|---|---|---|---|---|---|
| Noise | 7% | -2% | 11% | 1% | |
| desligado / ambiente * (dB) | 24 | 24.5 -2% | 24.7 -3% | 23.3 3% | 24 -0% |
| Idle Minimum * (dB) | 24 | 24.5 -2% | 24.7 -3% | 23.3 3% | 24 -0% |
| Idle Average * (dB) | 24 | 24.5 -2% | 24.7 -3% | 23.3 3% | 26 -8% |
| Idle Maximum * (dB) | 36.5 | 24.5 33% | 30.9 15% | 23.3 36% | 31 15% |
| Load Average * (dB) | 41.3 | 41 1% | 40 3% | 34.7 16% | 45 -9% |
| Witcher 3 ultra * (dB) | 44.7 | 41 8% | 51.5 -15% | 42.1 6% | 43 4% |
| Load Maximum * (dB) | 46.9 | 41 13% | 51.5 -10% | 42.1 10% | 45 4% |
* ... menor é melhor
Temperatura
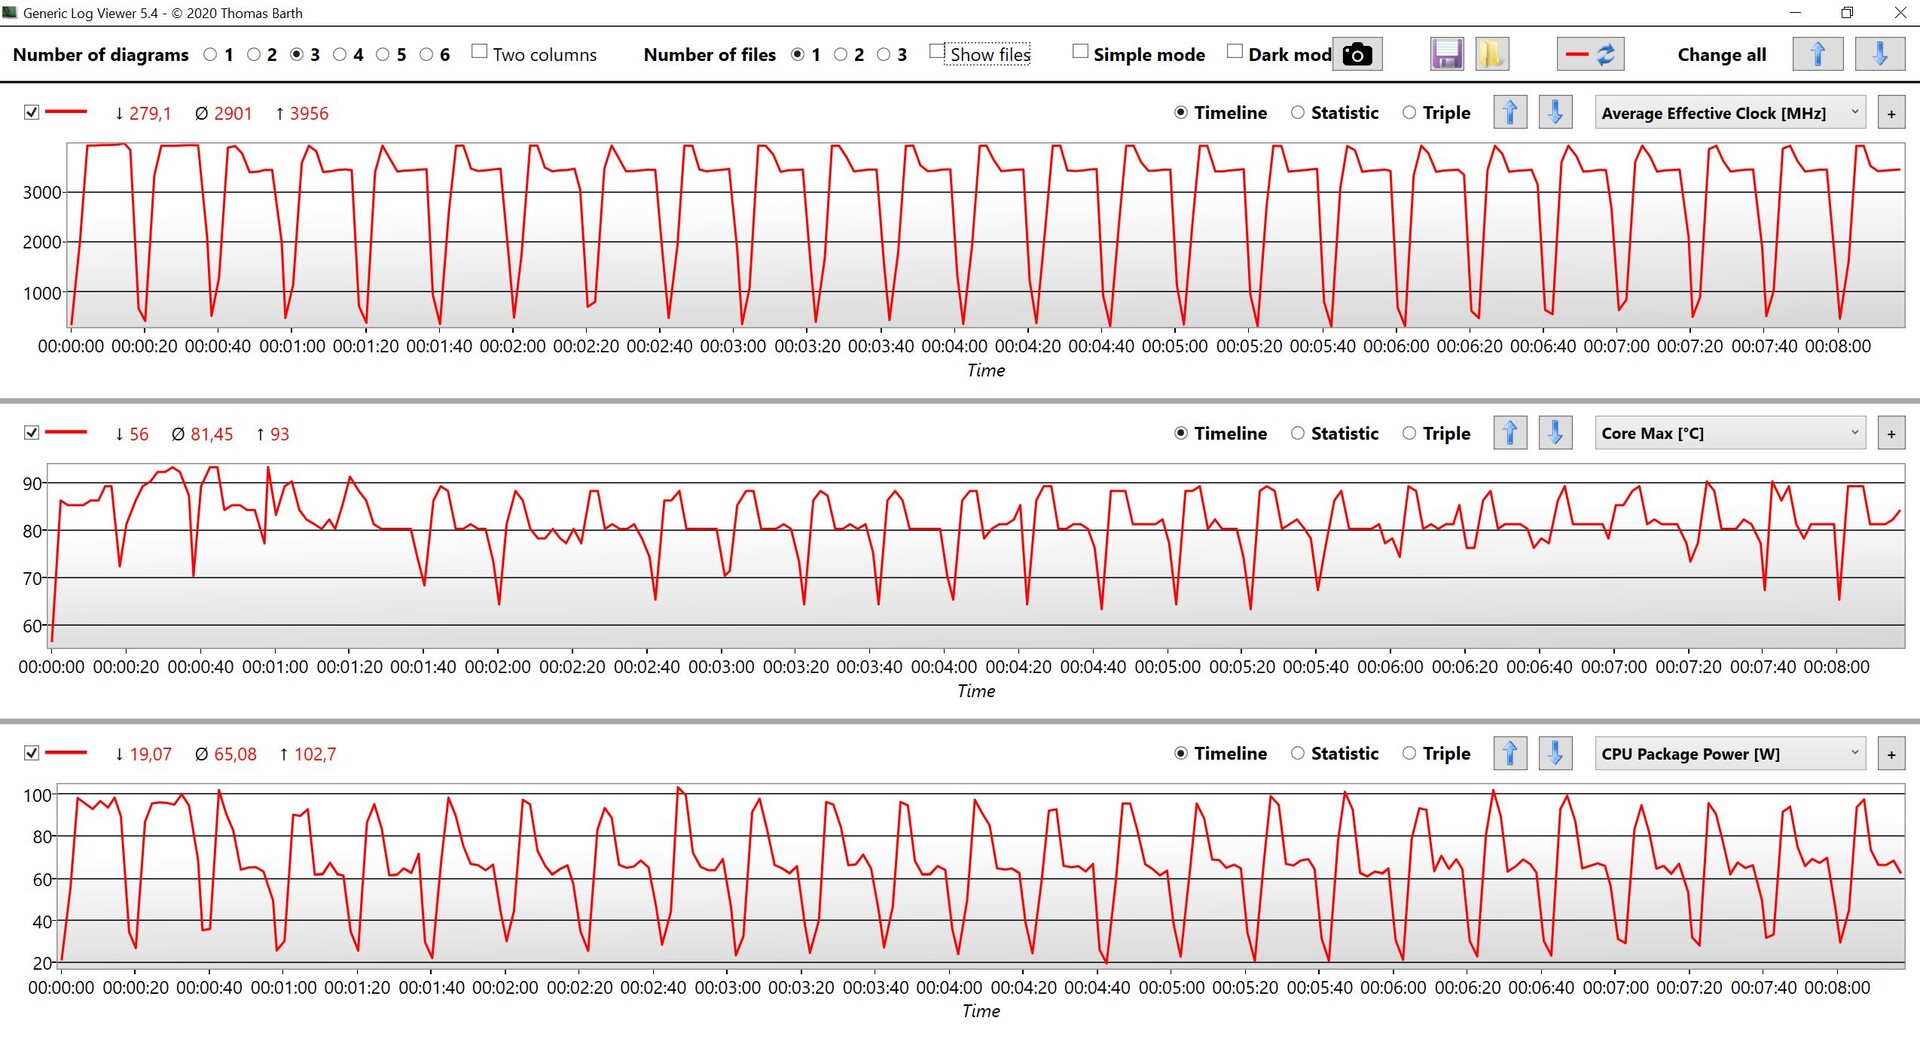
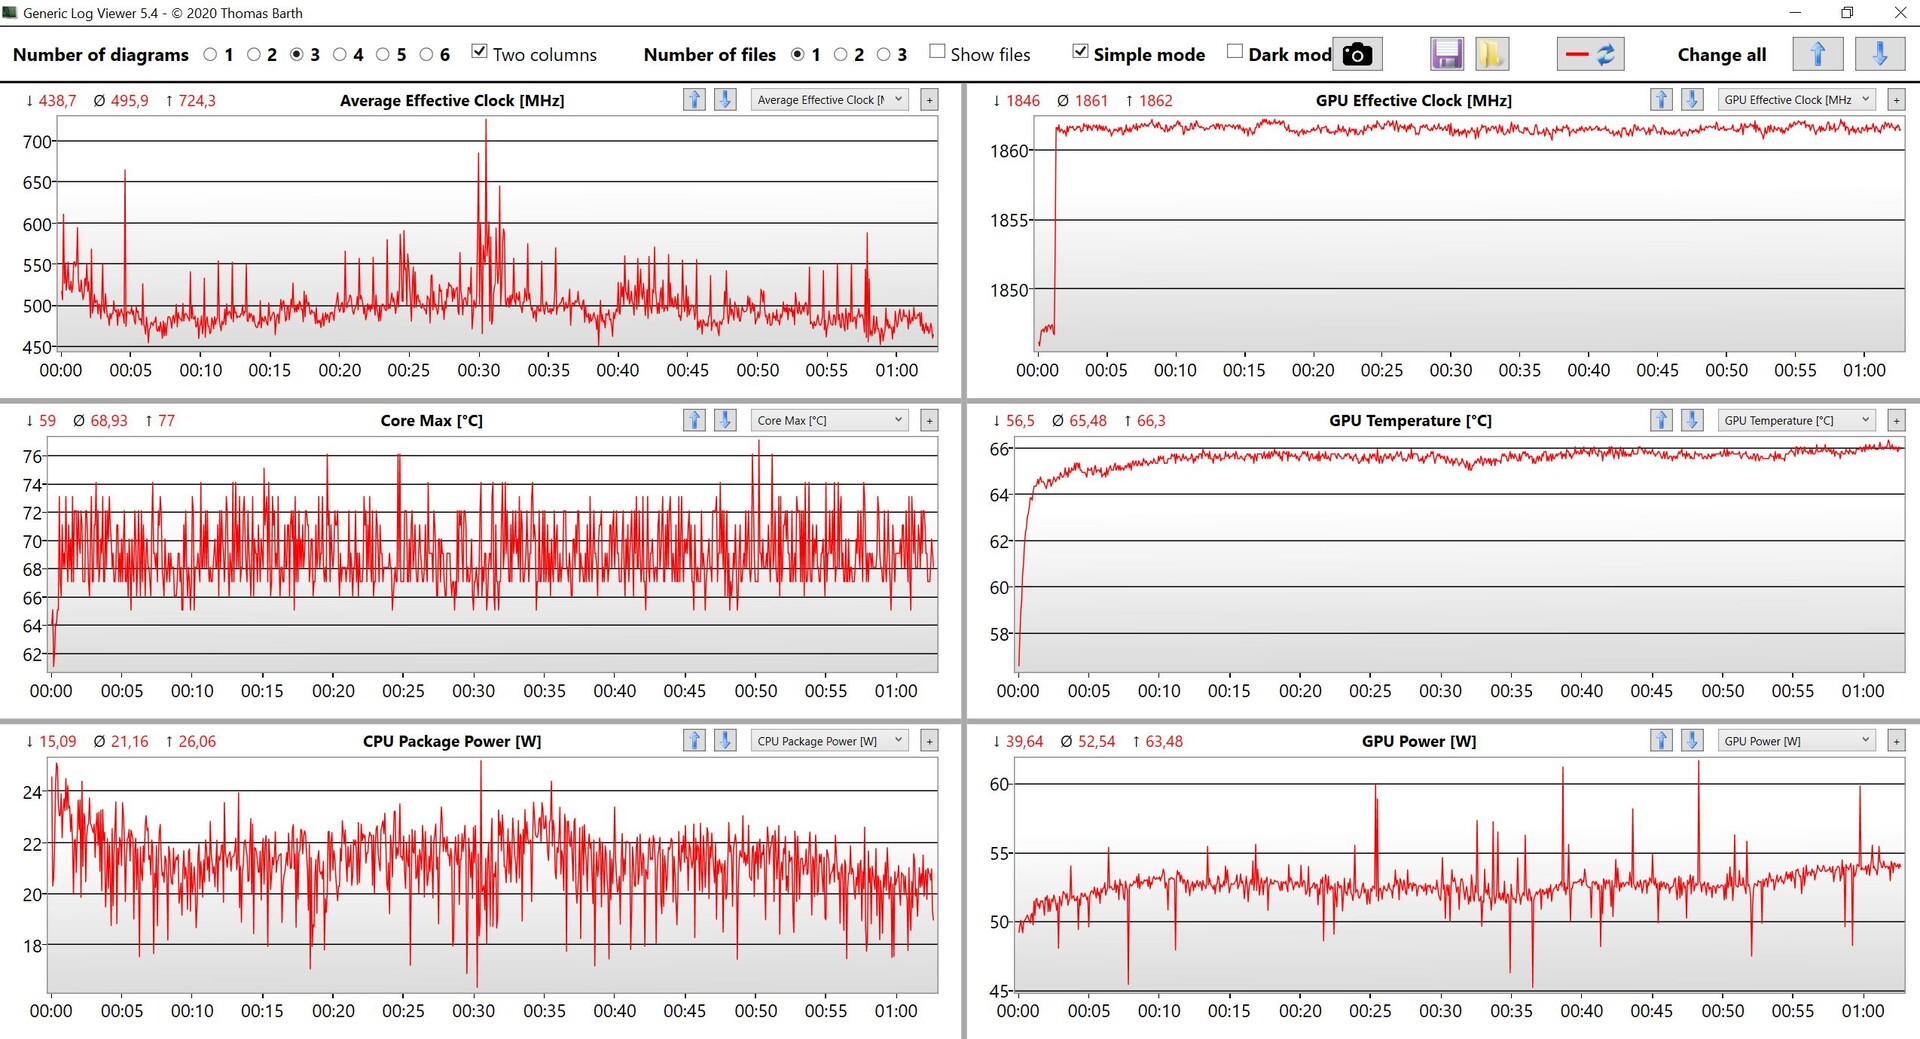
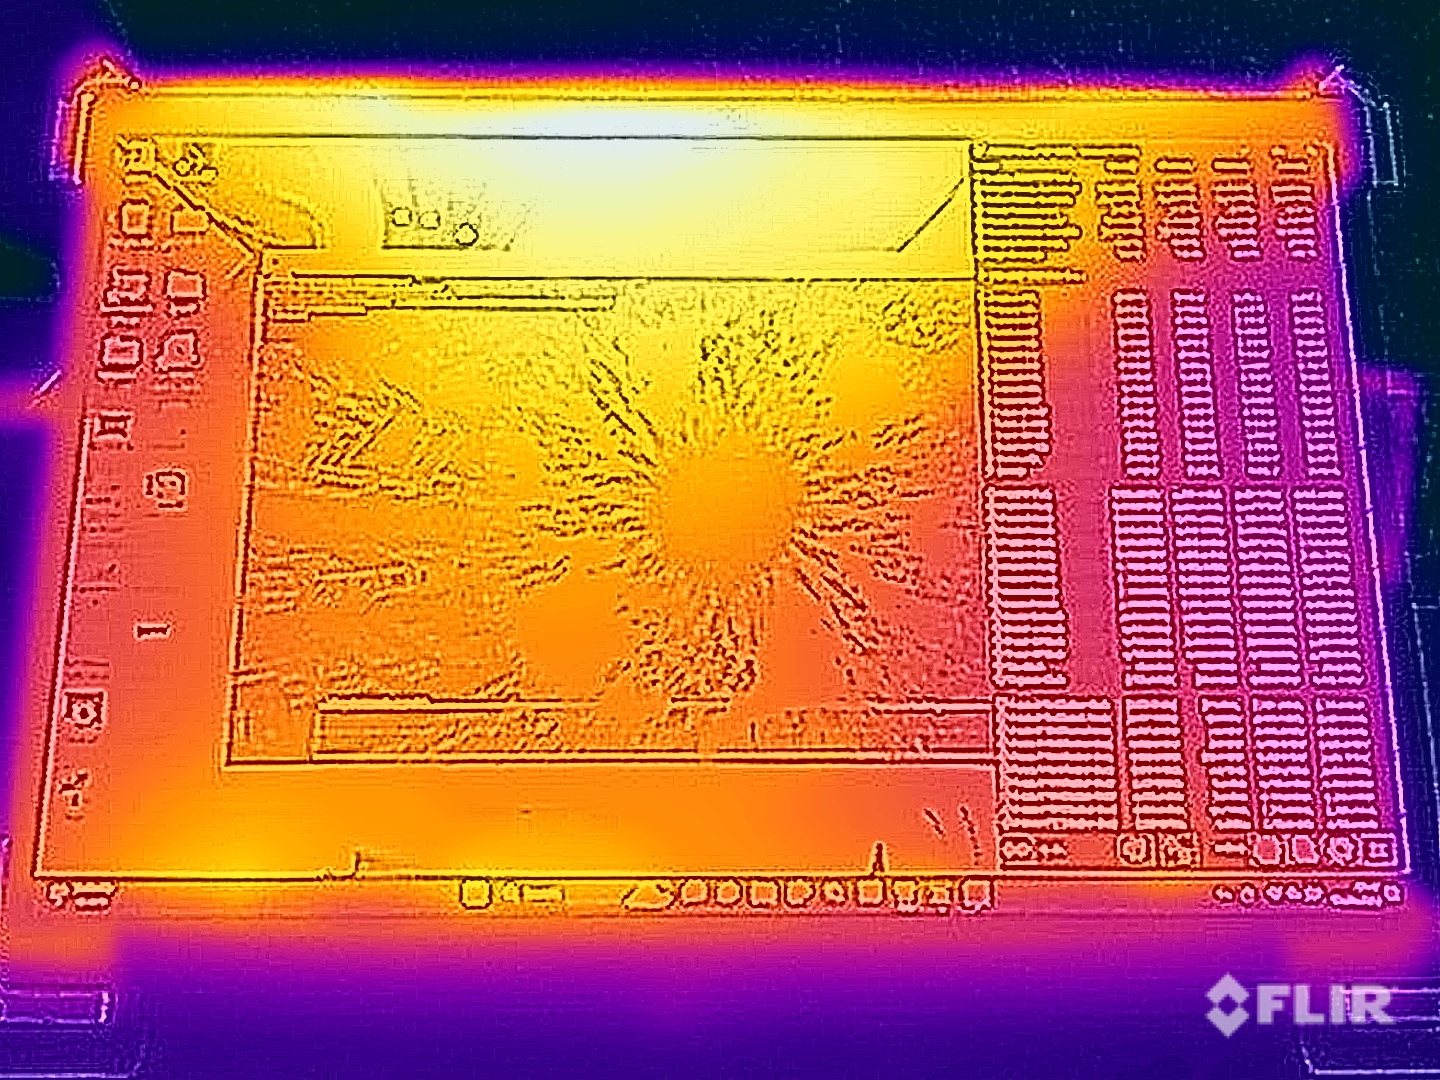
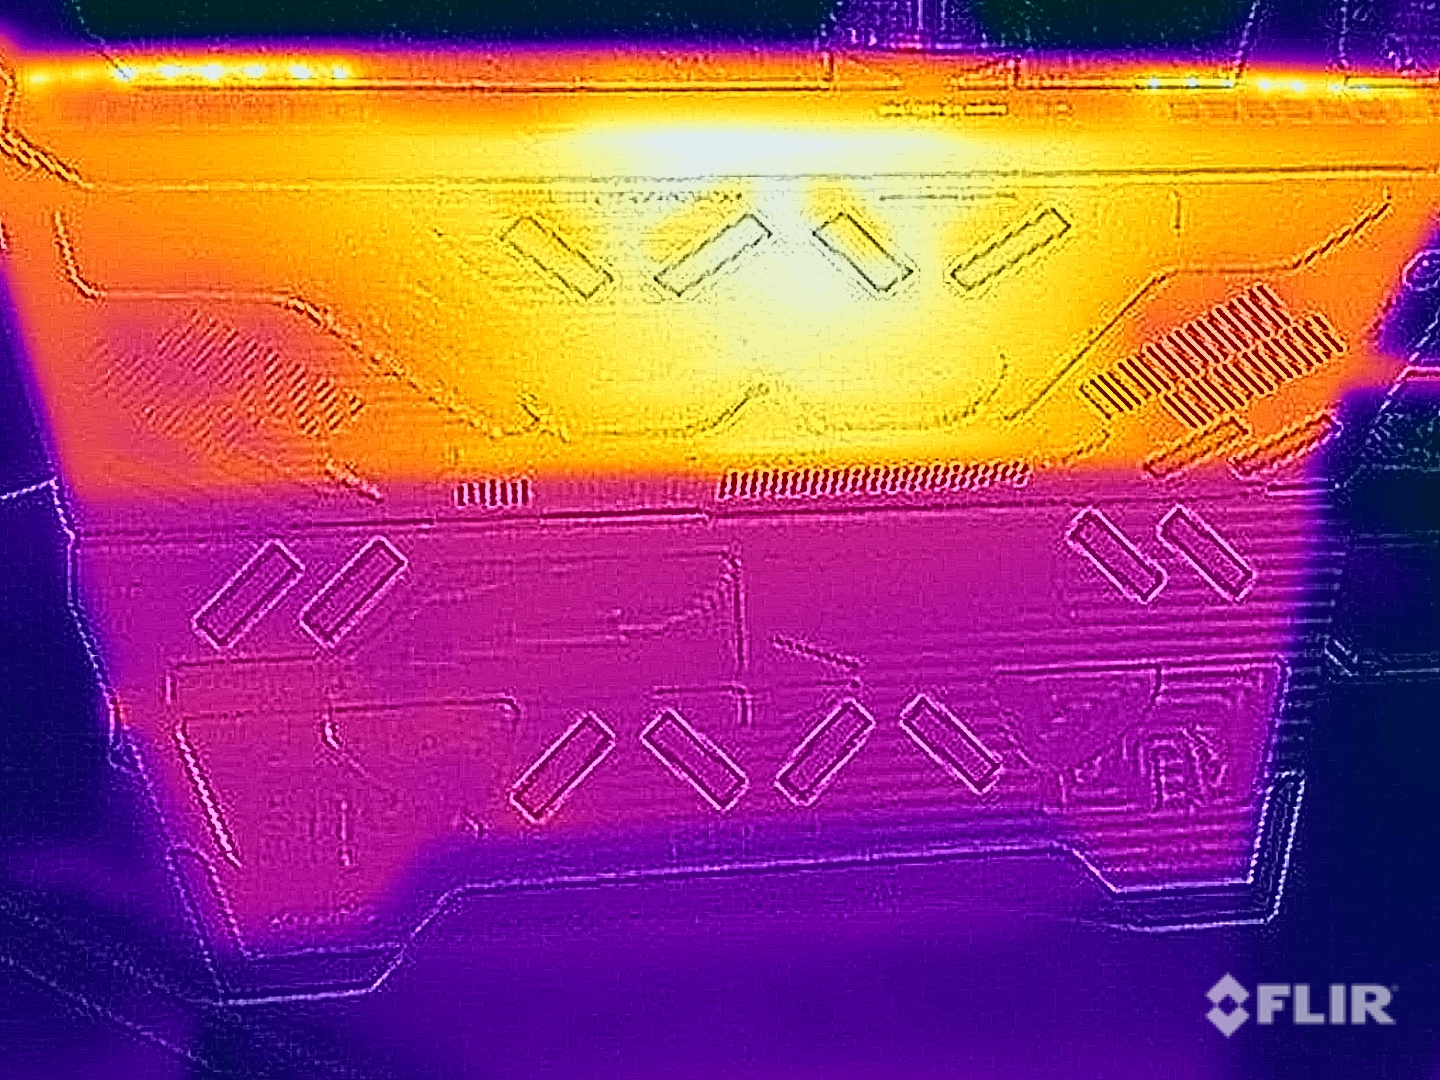
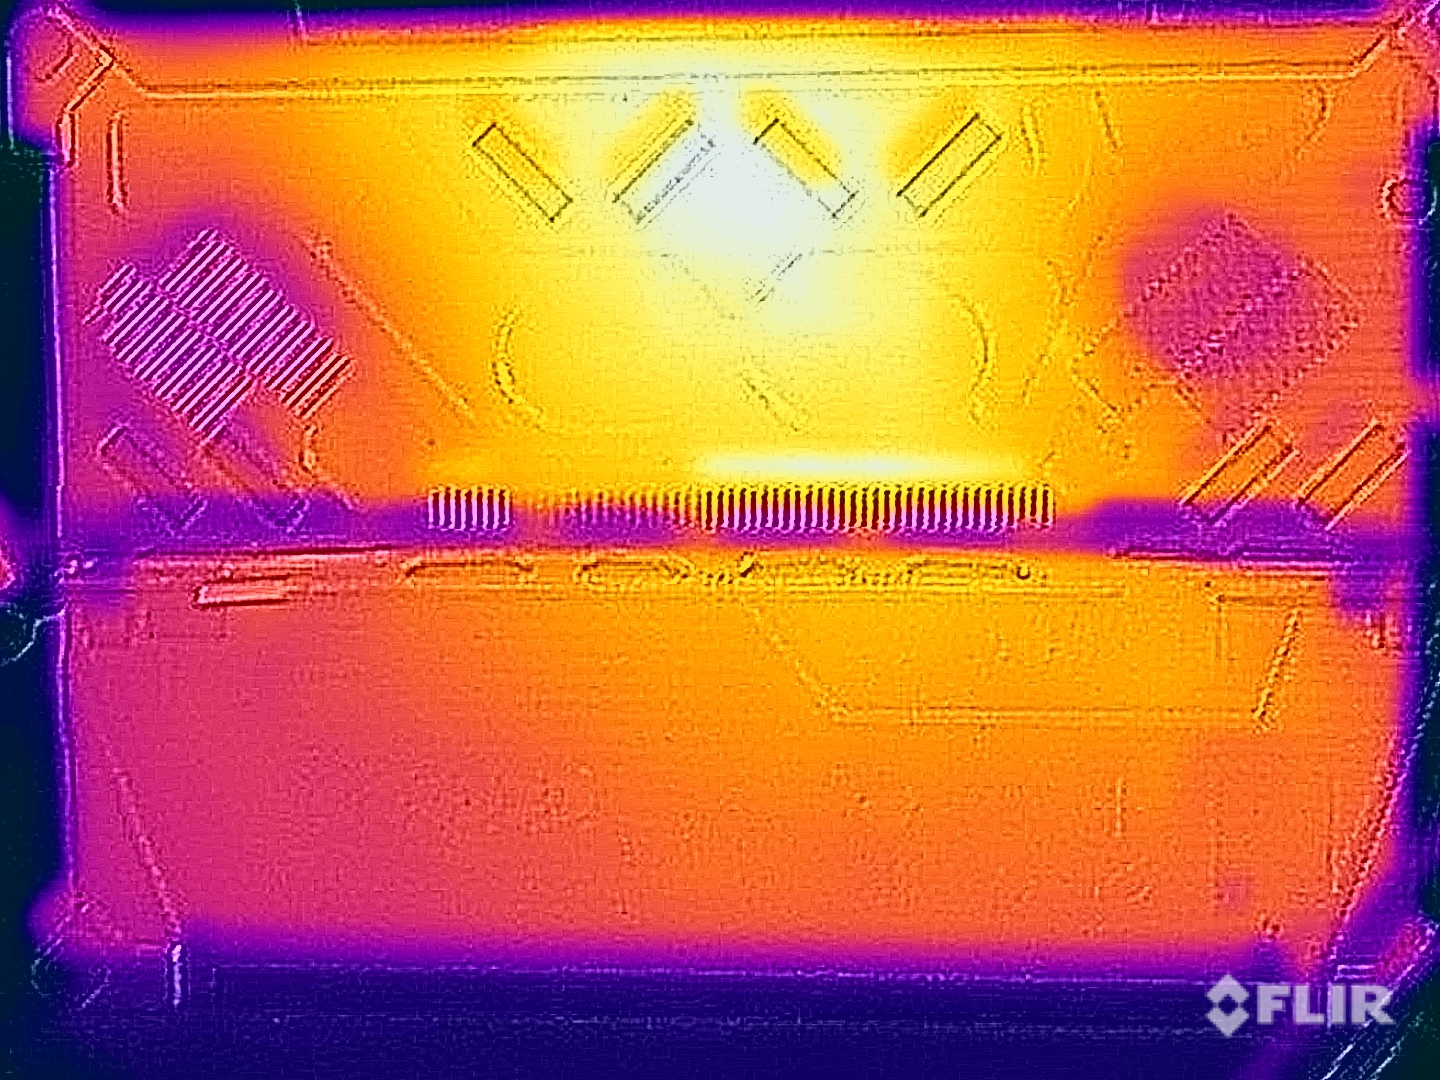
O Asus administra muito bem as temperaturas da superfície do fluxo Z13 ACRNM e o chassi mais volumoso definitivamente tem um impacto positivo nos resultados. O dispositivo é muito frio em cenários de carga de trabalho leve e ainda pode ser usado como um tablete sob carga máxima sem nenhuma limitação. Podemos medir até ~42 °C na parte de trás, o que é uma melhoria notável em comparação com o predecessor com o RTX 3050 Ti (até 48 °C).
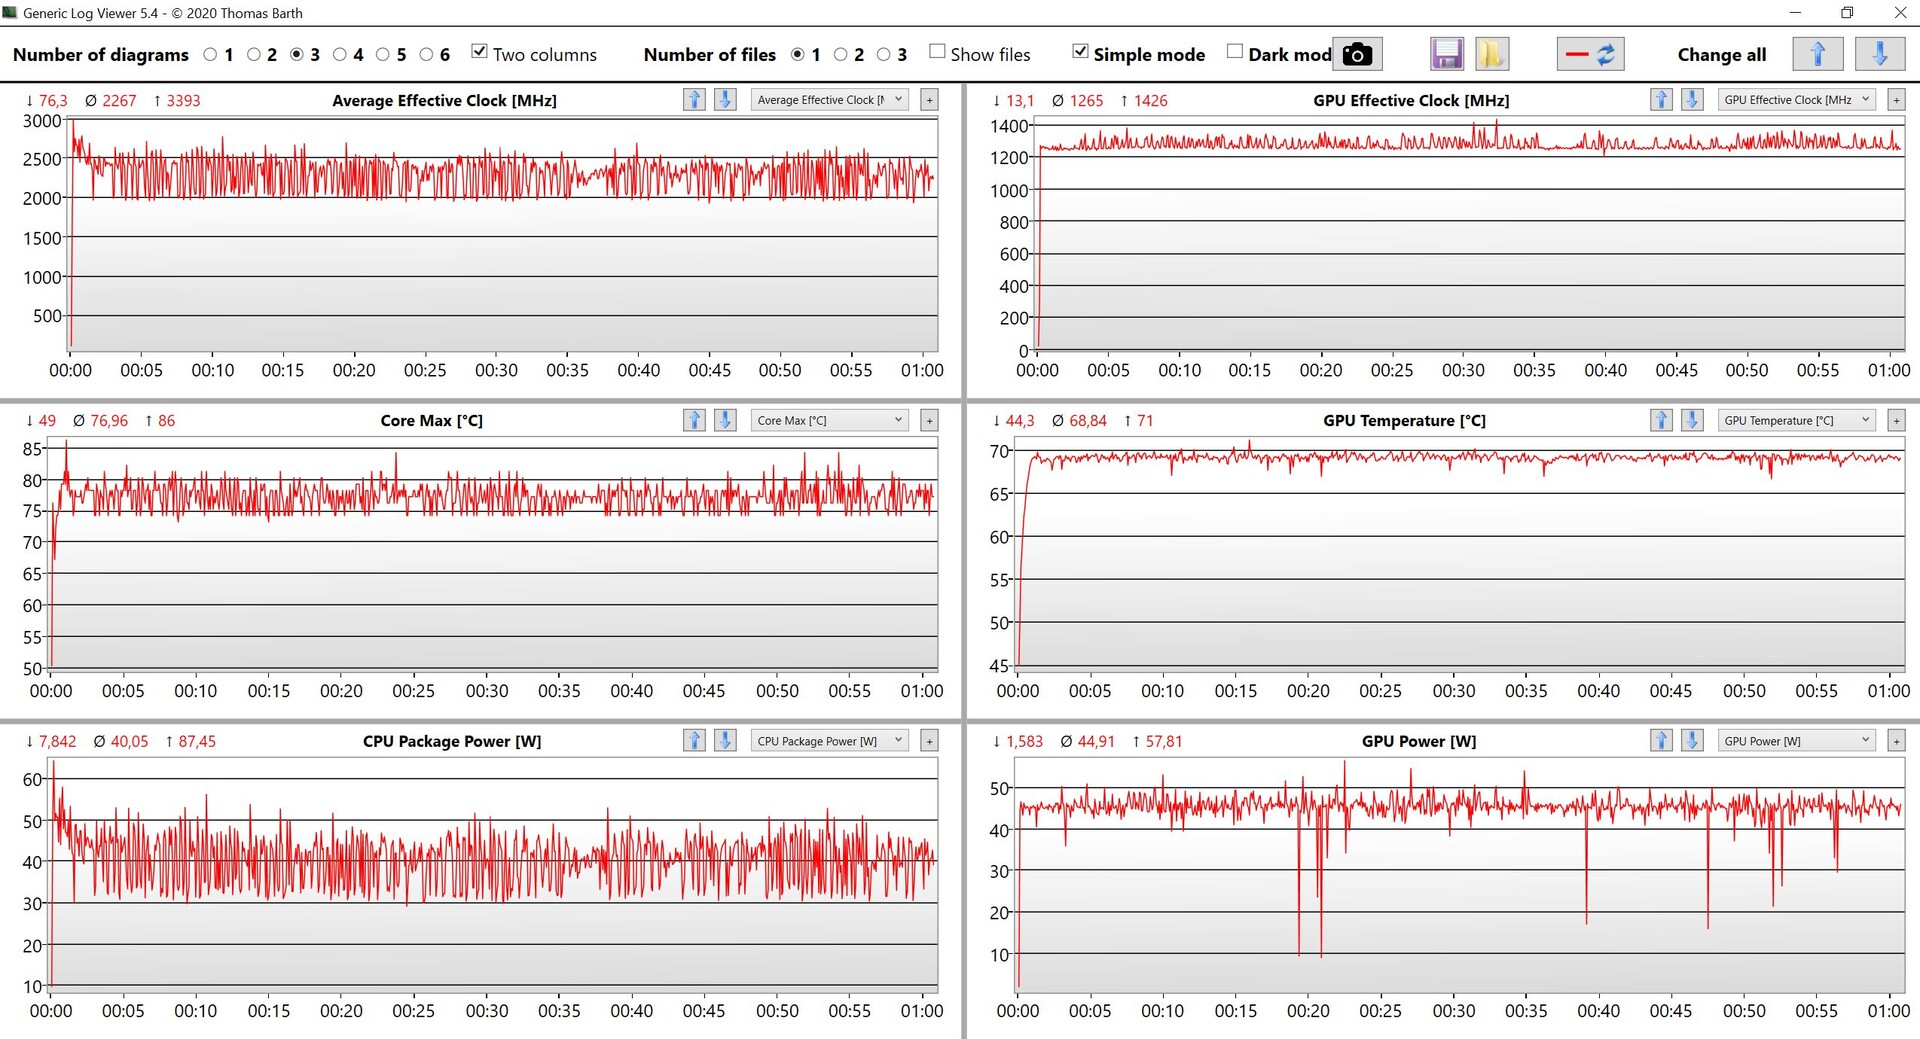
O desempenho durante nosso teste de estresse também é bom. A GPU mantém 45 Watts e o consumo do processador flutua entre 30-50 Watts. Estes valores caem para 18W para a CPU e 26W para a GPU com a energia da bateria. Não notamos uma queda de desempenho imediatamente após o teste de estresse.
(±) A temperatura máxima no lado superior é 42.5 °C / 109 F, em comparação com a média de 40.4 °C / 105 F , variando de 21.2 a 68.8 °C para a classe Gaming.
(±) A parte inferior aquece até um máximo de 42.6 °C / 109 F, em comparação com a média de 43.2 °C / 110 F
(+) Em uso inativo, a temperatura média para o lado superior é 25.6 °C / 78 F, em comparação com a média do dispositivo de 33.9 °C / ### class_avg_f### F.
(±) Jogando The Witcher 3, a temperatura média para o lado superior é 37.4 °C / 99 F, em comparação com a média do dispositivo de 33.9 °C / ## #class_avg_f### F.
(+) Os apoios para as mãos e o touchpad estão atingindo a temperatura máxima da pele (35.2 °C / 95.4 F) e, portanto, não estão quentes.
(-) A temperatura média da área do apoio para as mãos de dispositivos semelhantes foi 28.8 °C / 83.8 F (-6.4 °C / -11.6 F).
| Asus ROG Flow Z13 ACRNM Intel Core i9-13900H, NVIDIA GeForce RTX 4070 Laptop GPU | Asus ROG Flow Z13 GZ301ZE Intel Core i9-12900H, NVIDIA GeForce RTX 3050 Ti Laptop GPU | Alienware x14 i7 RTX 3060 Intel Core i7-12700H, NVIDIA GeForce RTX 3060 Laptop GPU | Razer Blade 14 Ryzen 9 6900HX AMD Ryzen 9 6900HX, NVIDIA GeForce RTX 3070 Ti Laptop GPU | Asus ROG Zephyrus G14 GA402RK AMD Ryzen 9 6900HS, AMD Radeon RX 6800S | |
|---|---|---|---|---|---|
| Heat | -12% | -8% | -21% | -24% | |
| Maximum Upper Side * (°C) | 42.5 | 45.3 -7% | 51.3 -21% | 40.6 4% | 55 -29% |
| Maximum Bottom * (°C) | 42.6 | 48.3 -13% | 44.4 -4% | 42.6 -0% | 55 -29% |
| Idle Upper Side * (°C) | 26.2 | 29.2 -11% | 27.2 -4% | 38 -45% | 30 -15% |
| Idle Bottom * (°C) | 26 | 30 -15% | 26.6 -2% | 37 -42% | 32 -23% |
* ... menor é melhor
Oradores
Os dois alto-falantes estéreo são definitivamente um ponto fraco do conversível, pois o som é muito fino e carece de graves. Nem música, nem filmes, nem jogos são realmente tão agradáveis e você também recebe ruído de fãs durante os jogos, por isso recomendamos um fone de ouvido.
Asus ROG Flow Z13 ACRNM análise de áudio
(±) | o volume do alto-falante é médio, mas bom (###valor### dB)
Graves 100 - 315Hz
(-) | quase nenhum baixo - em média 18.3% menor que a mediana
(±) | a linearidade dos graves é média (10.1% delta para a frequência anterior)
Médios 400 - 2.000 Hz
(+) | médios equilibrados - apenas 3.4% longe da mediana
(+) | médios são lineares (4.5% delta para frequência anterior)
Altos 2 - 16 kHz
(±) | máximos mais altos - em média 6.1% maior que a mediana
(+) | os máximos são lineares (3.5% delta da frequência anterior)
Geral 100 - 16.000 Hz
(±) | a linearidade do som geral é média (19% diferença em relação à mediana)
Comparado com a mesma classe
» 63% de todos os dispositivos testados nesta classe foram melhores, 8% semelhantes, 28% piores
» O melhor teve um delta de 6%, a média foi 18%, o pior foi 132%
Comparado com todos os dispositivos testados
» 45% de todos os dispositivos testados foram melhores, 7% semelhantes, 47% piores
» O melhor teve um delta de 4%, a média foi 23%, o pior foi 134%
Apple MacBook Pro 16 2021 M1 Pro análise de áudio
(+) | os alto-falantes podem tocar relativamente alto (###valor### dB)
Graves 100 - 315Hz
(+) | bons graves - apenas 3.8% longe da mediana
(+) | o baixo é linear (5.2% delta para a frequência anterior)
Médios 400 - 2.000 Hz
(+) | médios equilibrados - apenas 1.3% longe da mediana
(+) | médios são lineares (2.1% delta para frequência anterior)
Altos 2 - 16 kHz
(+) | agudos equilibrados - apenas 1.9% longe da mediana
(+) | os máximos são lineares (2.7% delta da frequência anterior)
Geral 100 - 16.000 Hz
(+) | o som geral é linear (4.6% diferença em relação à mediana)
Comparado com a mesma classe
» 0% de todos os dispositivos testados nesta classe foram melhores, 0% semelhantes, 100% piores
» O melhor teve um delta de 5%, a média foi 17%, o pior foi 45%
Comparado com todos os dispositivos testados
» 0% de todos os dispositivos testados foram melhores, 0% semelhantes, 100% piores
» O melhor teve um delta de 4%, a média foi 23%, o pior foi 134%
Gestão de energia - 165 Hz custos de tempo de execução
Consumo de energia
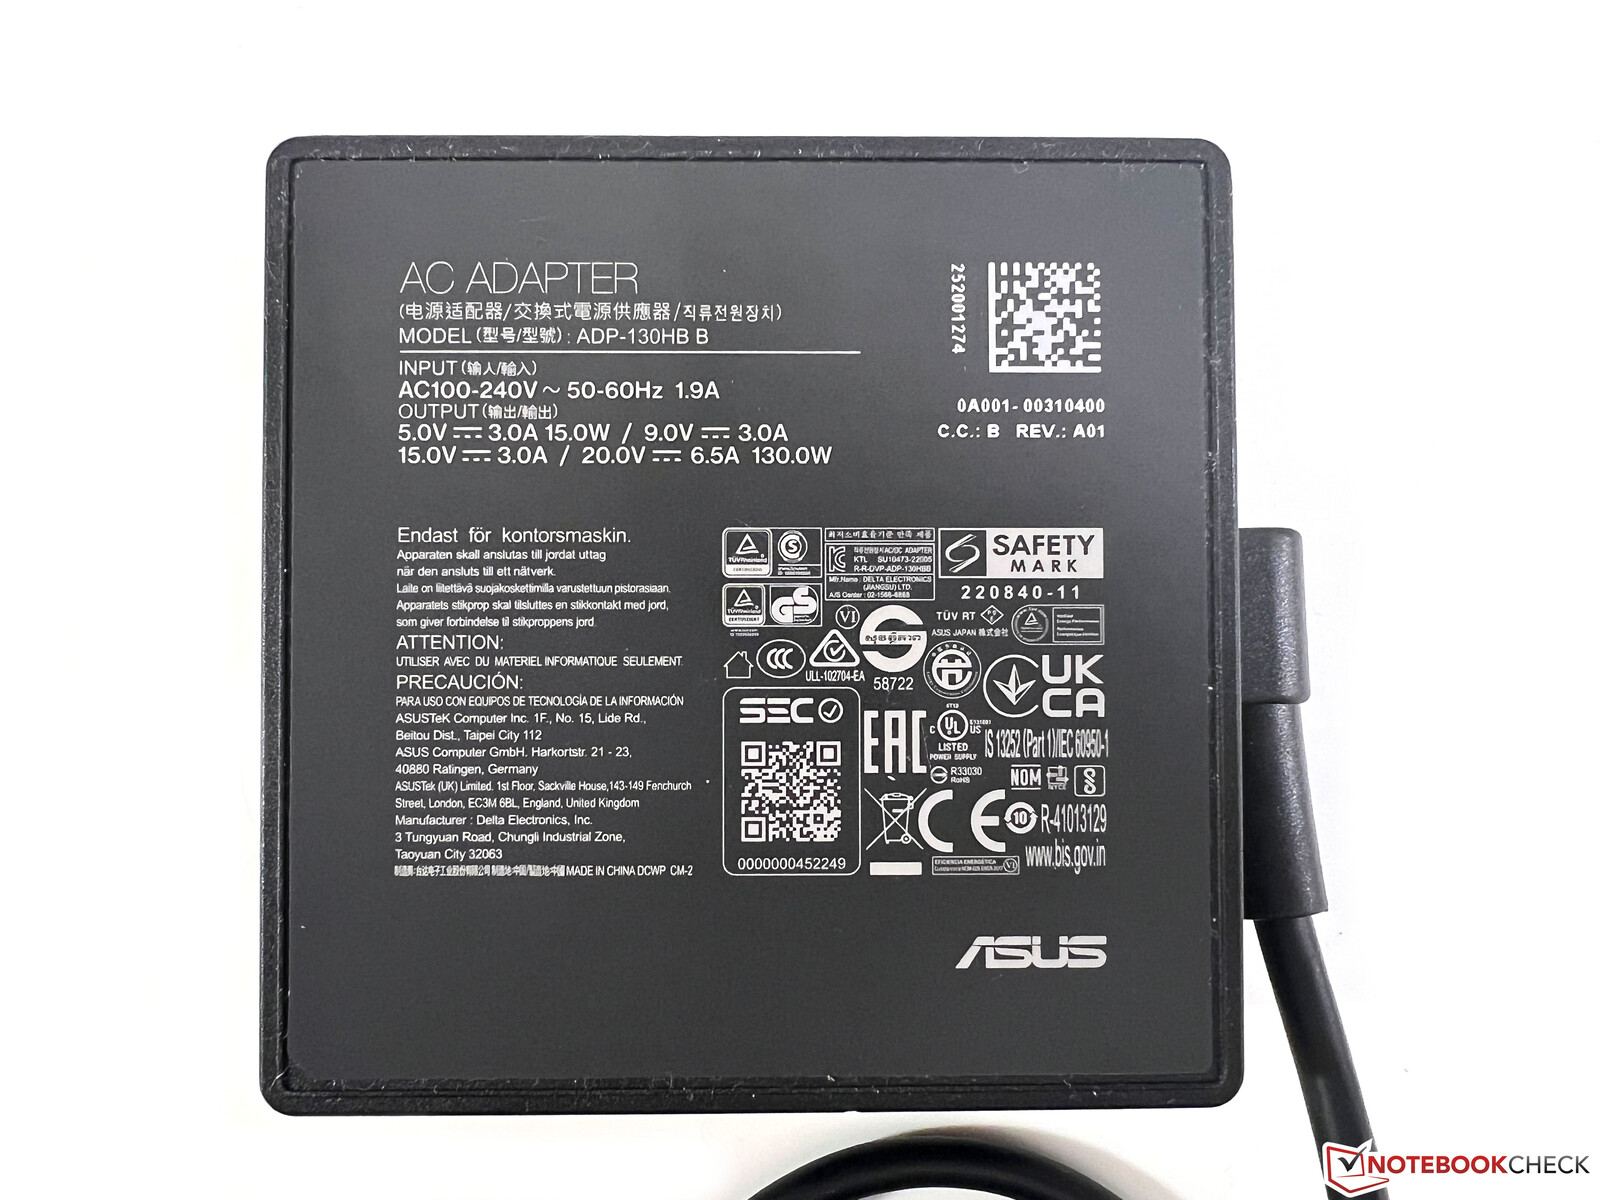
O consumo de energia ociosa é praticamente idêntico em comparação com o antigoFluxo Z13mas a nova versão precisa de muito mais energia sob carga. Medimos cerca de 100 Watts durante os jogos, mas o dispositivo precisa de mais do que o máximo de 133,6 Watts no início do teste de estresse. O sistema também tira entre 4-18 Watts da bateria no primeiro par de segundos, mas o consumo se estabilizará em torno de 115 Watts. Este é um cenário extremo e o adaptador de energia de 130W incluído é, de outra forma, suficiente.
| desligado | |
| Ocioso | |
| Carga |
|
Key:
min: | |
| Asus ROG Flow Z13 ACRNM i9-13900H, GeForce RTX 4070 Laptop GPU, WD PC SN740 SDDPTQD-1T00, IPS, 2560x1600, 13.4" | Asus ROG Flow Z13 GZ301ZE i9-12900H, GeForce RTX 3050 Ti Laptop GPU, Micron 2450 1TB MTFDKBK1T0TFK, IPS, 1920x1200, 13.4" | Alienware x14 i7 RTX 3060 i7-12700H, GeForce RTX 3060 Laptop GPU, WDC PC SN810 1TB, IPS, 1920x1080, 14" | Razer Blade 14 Ryzen 9 6900HX R9 6900HX, GeForce RTX 3070 Ti Laptop GPU, Samsung PM9A1 MZVL21T0HCLR, IPS, 2560x1440, 14" | Asus ROG Zephyrus G14 GA402RK R9 6900HS, Radeon RX 6800S, Micron 2450 1TB MTFDKBK1T0TFK, IPS-Level, 2560x1600, 14" | Média NVIDIA GeForce RTX 4070 Laptop GPU | Média da turma Gaming | |
|---|---|---|---|---|---|---|---|
| Power Consumption | 13% | 1% | -58% | -24% | -50% | -60% | |
| Idle Minimum * (Watt) | 8.9 | 8.8 1% | 7.9 11% | 10.2 -15% | 7 21% | 13.2 ? -48% | 13 ? -46% |
| Idle Average * (Watt) | 12.6 | 12.1 4% | 11.1 12% | 26 -106% | 14 -11% | 18.2 ? -44% | 19 ? -51% |
| Idle Maximum * (Watt) | 13 | 12.7 2% | 11.8 9% | 26.7 -105% | 22 -69% | 24.6 ? -89% | 24.6 ? -89% |
| Load Average * (Watt) | 92.5 | 72.3 22% | 107.4 -16% | 89.3 3% | 98 -6% | 97 ? -5% | 110.7 ? -20% |
| Witcher 3 ultra * (Watt) | 104.4 | 77.3 26% | 111 -6% | 158.7 -52% | 141 -35% | ||
| Load Maximum * (Watt) | 133.6 | 103.1 23% | 140.4 -5% | 227.5 -70% | 188 -41% | 221 ? -65% | 259 ? -94% |
* ... menor é melhor
Power consumption Witcher 3 / Stress test
Power consumption with external screen
Tempo de uso da bateria
A capacidade da bateria ainda é de 56 Wh e determinamos um tempo de funcionamento de mais de 6,5 horas a 60 Hz (~5,5 horas a 165 Hz) para nosso teste Wi-Fi a um brilho ajustado de 150 nits (52% do brilho máximo para nossa unidade de revisão). No brilho máximo, nosso teste Wi-Fi funciona por pouco mais de 5 horas a 60 Hz e um pouco mais de 4 horas a 165 Hz. Estes resultados não são obviamente grandes, mas também não surpreendem considerando o hardware potente e a bateria comparativamente pequena. Você deve definitivamente incluir algumas paradas de carga quando estiver em uma viagem mais longa. Uma carga de 5-60 % leva apenas cerca de 30 minutos quando o dispositivo é ligado; uma carga completa leva cerca de 80 minutos.
| Asus ROG Flow Z13 ACRNM i9-13900H, GeForce RTX 4070 Laptop GPU, 56 Wh | Alienware x14 i7 RTX 3060 i7-12700H, GeForce RTX 3060 Laptop GPU, 80 Wh | Razer Blade 14 Ryzen 9 6900HX R9 6900HX, GeForce RTX 3070 Ti Laptop GPU, 62 Wh | Asus ROG Zephyrus G14 GA402RK R9 6900HS, Radeon RX 6800S, 76 Wh | Asus ROG Flow Z13 GZ301ZE i9-12900H, GeForce RTX 3050 Ti Laptop GPU, 56 Wh | Média da turma Gaming | |
|---|---|---|---|---|---|---|
| Duração da bateria | 35% | 61% | 22% | 11% | 45% | |
| H.264 (h) | 5.2 | 9.4 81% | 6 15% | 8.32 ? 60% | ||
| WiFi v1.3 (h) | 6.6 | 8.9 35% | 9.5 44% | 9.5 44% | 5.6 -15% | 7.11 ? 8% |
| Load (h) | 0.9 | 0.8 -11% | 1.6 78% | 0.9 0% | 1.2 33% | 1.502 ? 67% |
| Witcher 3 ultra (h) | 0.8 | 0.8 |
Pro
Contra
Veredicto - ROG Flow Z13 ACRNM impressiona com design e desempenho
Do ano passadoFluxo ROG Z13já era um produto bastante único com o Core i9-12900H e o GeForce RTX 3050 Ti, mas o modelo 2023 é uma melhoria maciça, especialmente em termos de desempenho da GPU. Nossa edição especial ACRNM está equipada com o novoGeForce Computador portátil RTX 4070que não tem problemas com os jogos modernos na resolução nativa de QHD. O Core i9-13900H é novamente um processador muito poderoso, mas o aspecto mais marcante da edição especial é obviamente o projeto do chassi com a tampa traseira usinada CNC, bem como o material adicional nos cantos, incluindo o ponto de fixação para as correias inclusas. Gostamos do design e o conversível é extremamente robusto - quase como um dispositivo robusto, que também se reflete no alto peso de 1,7 kg (incluindo a tampa do teclado).
A capa do teclado da edição ACRNM também difere daFluxo ROG Z13e você ainda recebe dois modelos diferentes. No entanto, é preciso diferenciar entre os aspectos. As duas capas de teclado são um pouco mais grossas do que a versão normal, o que é bom para a estabilidade e nunca revisamos um teclado destacável com uma experiência de digitação tão boa até agora. As letras e o contraste (ou a falta dele), por outro lado, é uma catástrofe e o design foi claramente mais importante do que a ergonomia. Isto será um problema se você não digitar cegamente.
A edição ACRNM do Asus ROG Flow Z13 é um jogo muito poderoso conversível com um design marcante. Graças ao novo laptop RTX 4070, ele pode até mesmo lidar com jogos modernos na tela WQHD.
O desempenho doComputador portátil RTX 4070é bom, mas é preciso ter em mente que esta é apenas a versão de 65W. Os maiores laptops para jogos com o laptop RTX 4070 e até mesmo o laptop RTX 4060 oferecerão mais desempenho, mas o desempenho geral ainda é excelente considerando o tamanho compacto do Flow Z13 e há também uma melhoria maciça em relação ao modelo anterior. Os ventiladores são muito audíveis no modo Turbo e há ligeiras vibrações. Também notamos um som agudo durante o modo standby.
O display agora apresenta a resolução WQHD com 165 Hz e é usado para o ACRNM, bem como para a versão regular do Flow Z13. No geral, a tela IPS deixa uma boa impressão para jogos com a alta freqüência e os tempos de resposta rápidos. Ela também pode lidar com a edição de imagens e não detectamos nenhuma cintilação de PWM.
O fluxo regular ROG Flow Z13 infelizmente só está disponível com o Laptop RTX 4060 (ou Laptop 4050 e Laptop RTX 2050, respectivamente), mas todos eles também são versões de 65W, portanto esta limitação não é necessária. O design do modelo normal é muito mais conservador e mais atraente para alguns usuários. Também estamos revisando a versão regular com o Laptop RTX 4060 agora mesmo e a revisão será publicada em breve. Nosso perfeito ROG Flow Z13 utilizaria o chassi regular com o laptop RTX 4070 e a capa mais grossa do teclado da edição ACRNM, mas sem as letras desnecessárias. Ainda não há praticamente nenhuma concorrência ROG Flow Z13 no mercado de conversores e você terá que obter um notebook de 14 polegadas para um nível de desempenho comparável.
Preço e Disponibilidade
O ROG Flow Z13 ACRNM pode ser encomendado em na Asus eStore por $2499.
Asus ROG Flow Z13 ACRNM
- 04/09/2023 v7 (old)
Andreas Osthoff
Transparência
A seleção dos dispositivos a serem analisados é feita pela nossa equipe editorial. A amostra de teste foi fornecida ao autor como empréstimo pelo fabricante ou varejista para fins desta revisão. O credor não teve influência nesta revisão, nem o fabricante recebeu uma cópia desta revisão antes da publicação. Não houve obrigação de publicar esta revisão. Como empresa de mídia independente, a Notebookcheck não está sujeita à autoridade de fabricantes, varejistas ou editores.
É assim que o Notebookcheck está testando
Todos os anos, o Notebookcheck analisa de forma independente centenas de laptops e smartphones usando procedimentos padronizados para garantir que todos os resultados sejam comparáveis. Desenvolvemos continuamente nossos métodos de teste há cerca de 20 anos e definimos padrões da indústria no processo. Em nossos laboratórios de teste, equipamentos de medição de alta qualidade são utilizados por técnicos e editores experientes. Esses testes envolvem um processo de validação em vários estágios. Nosso complexo sistema de classificação é baseado em centenas de medições e benchmarks bem fundamentados, o que mantém a objetividade.Price comparison

