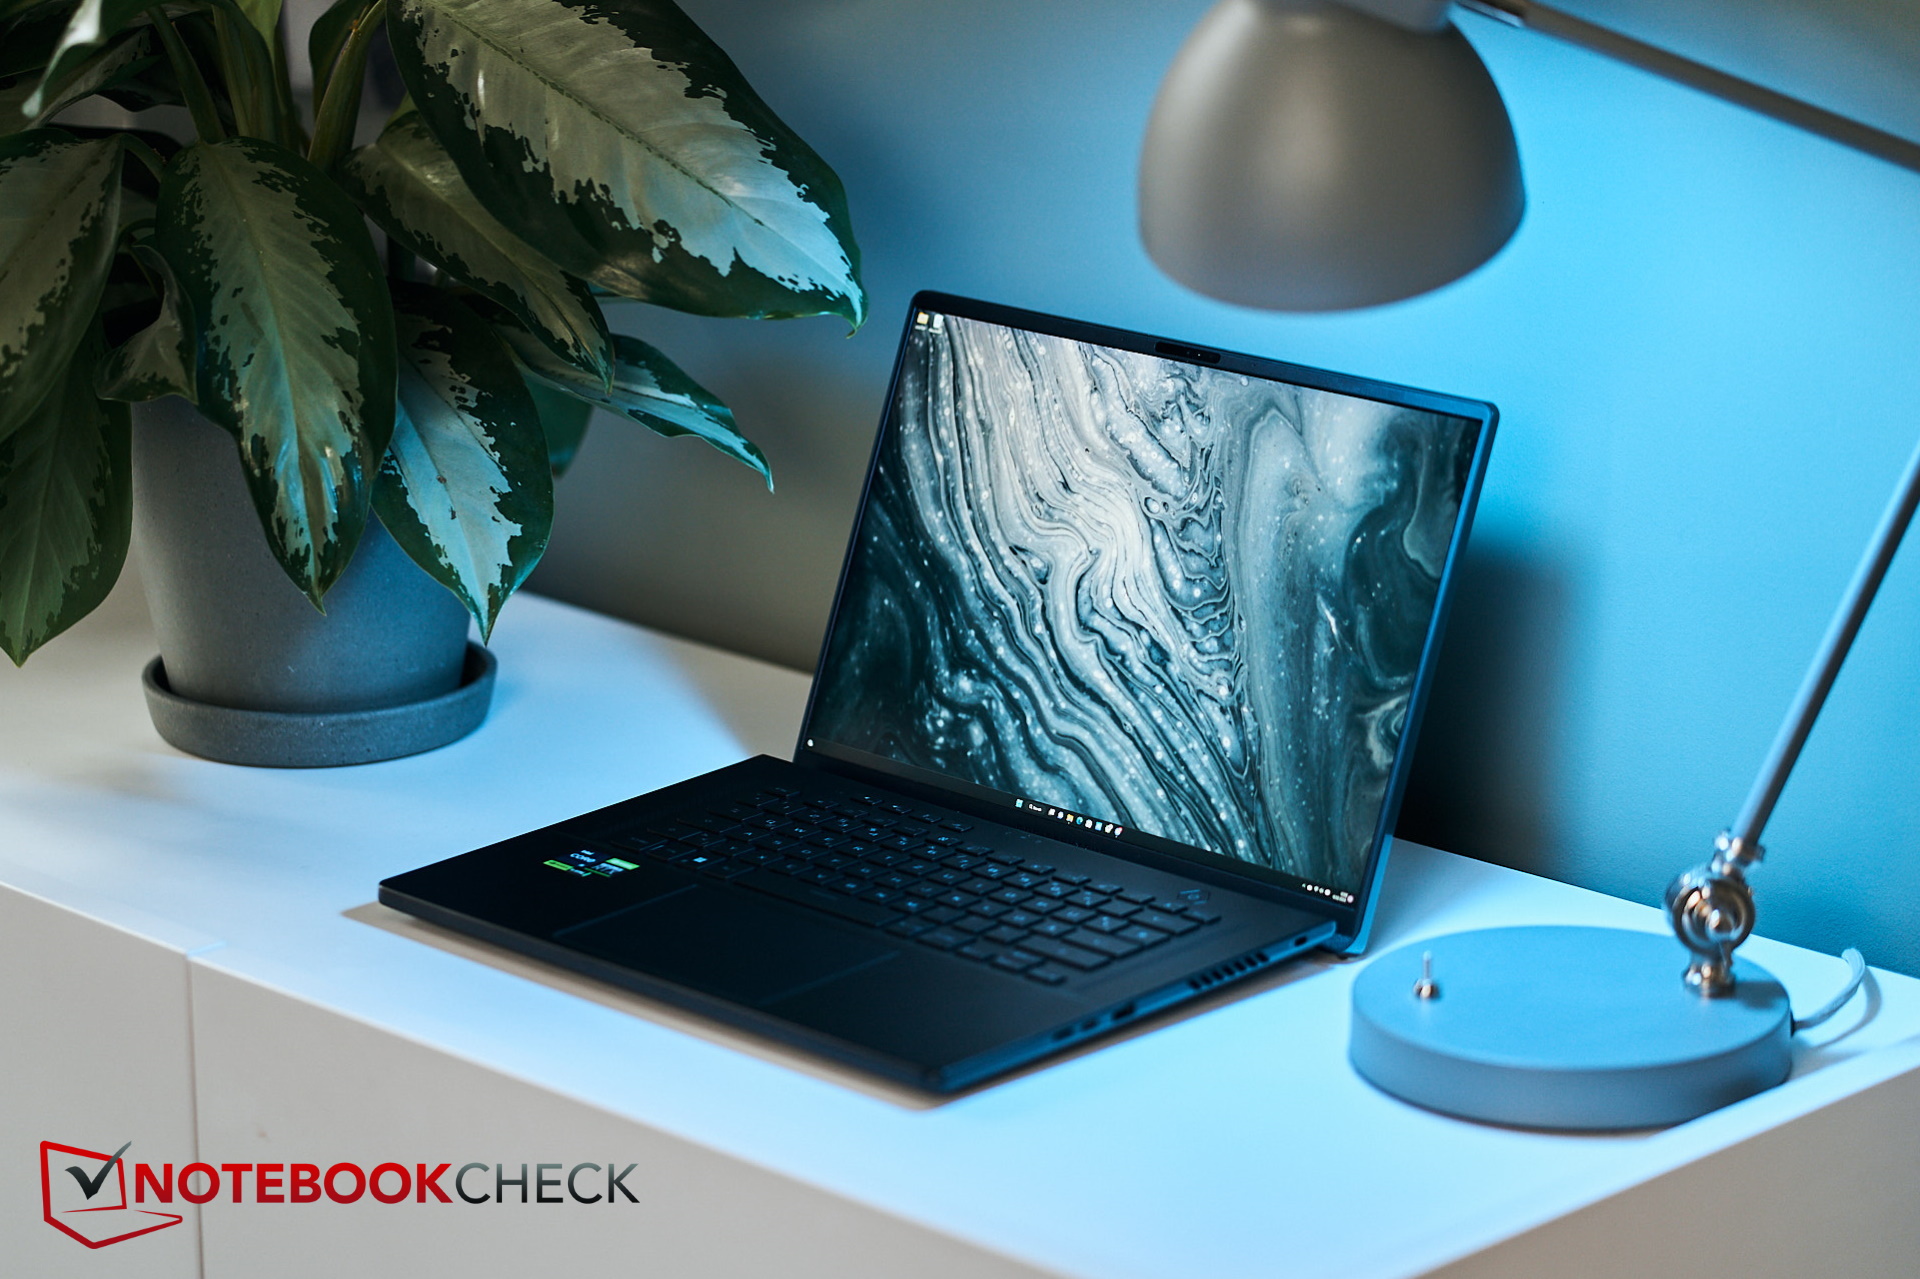
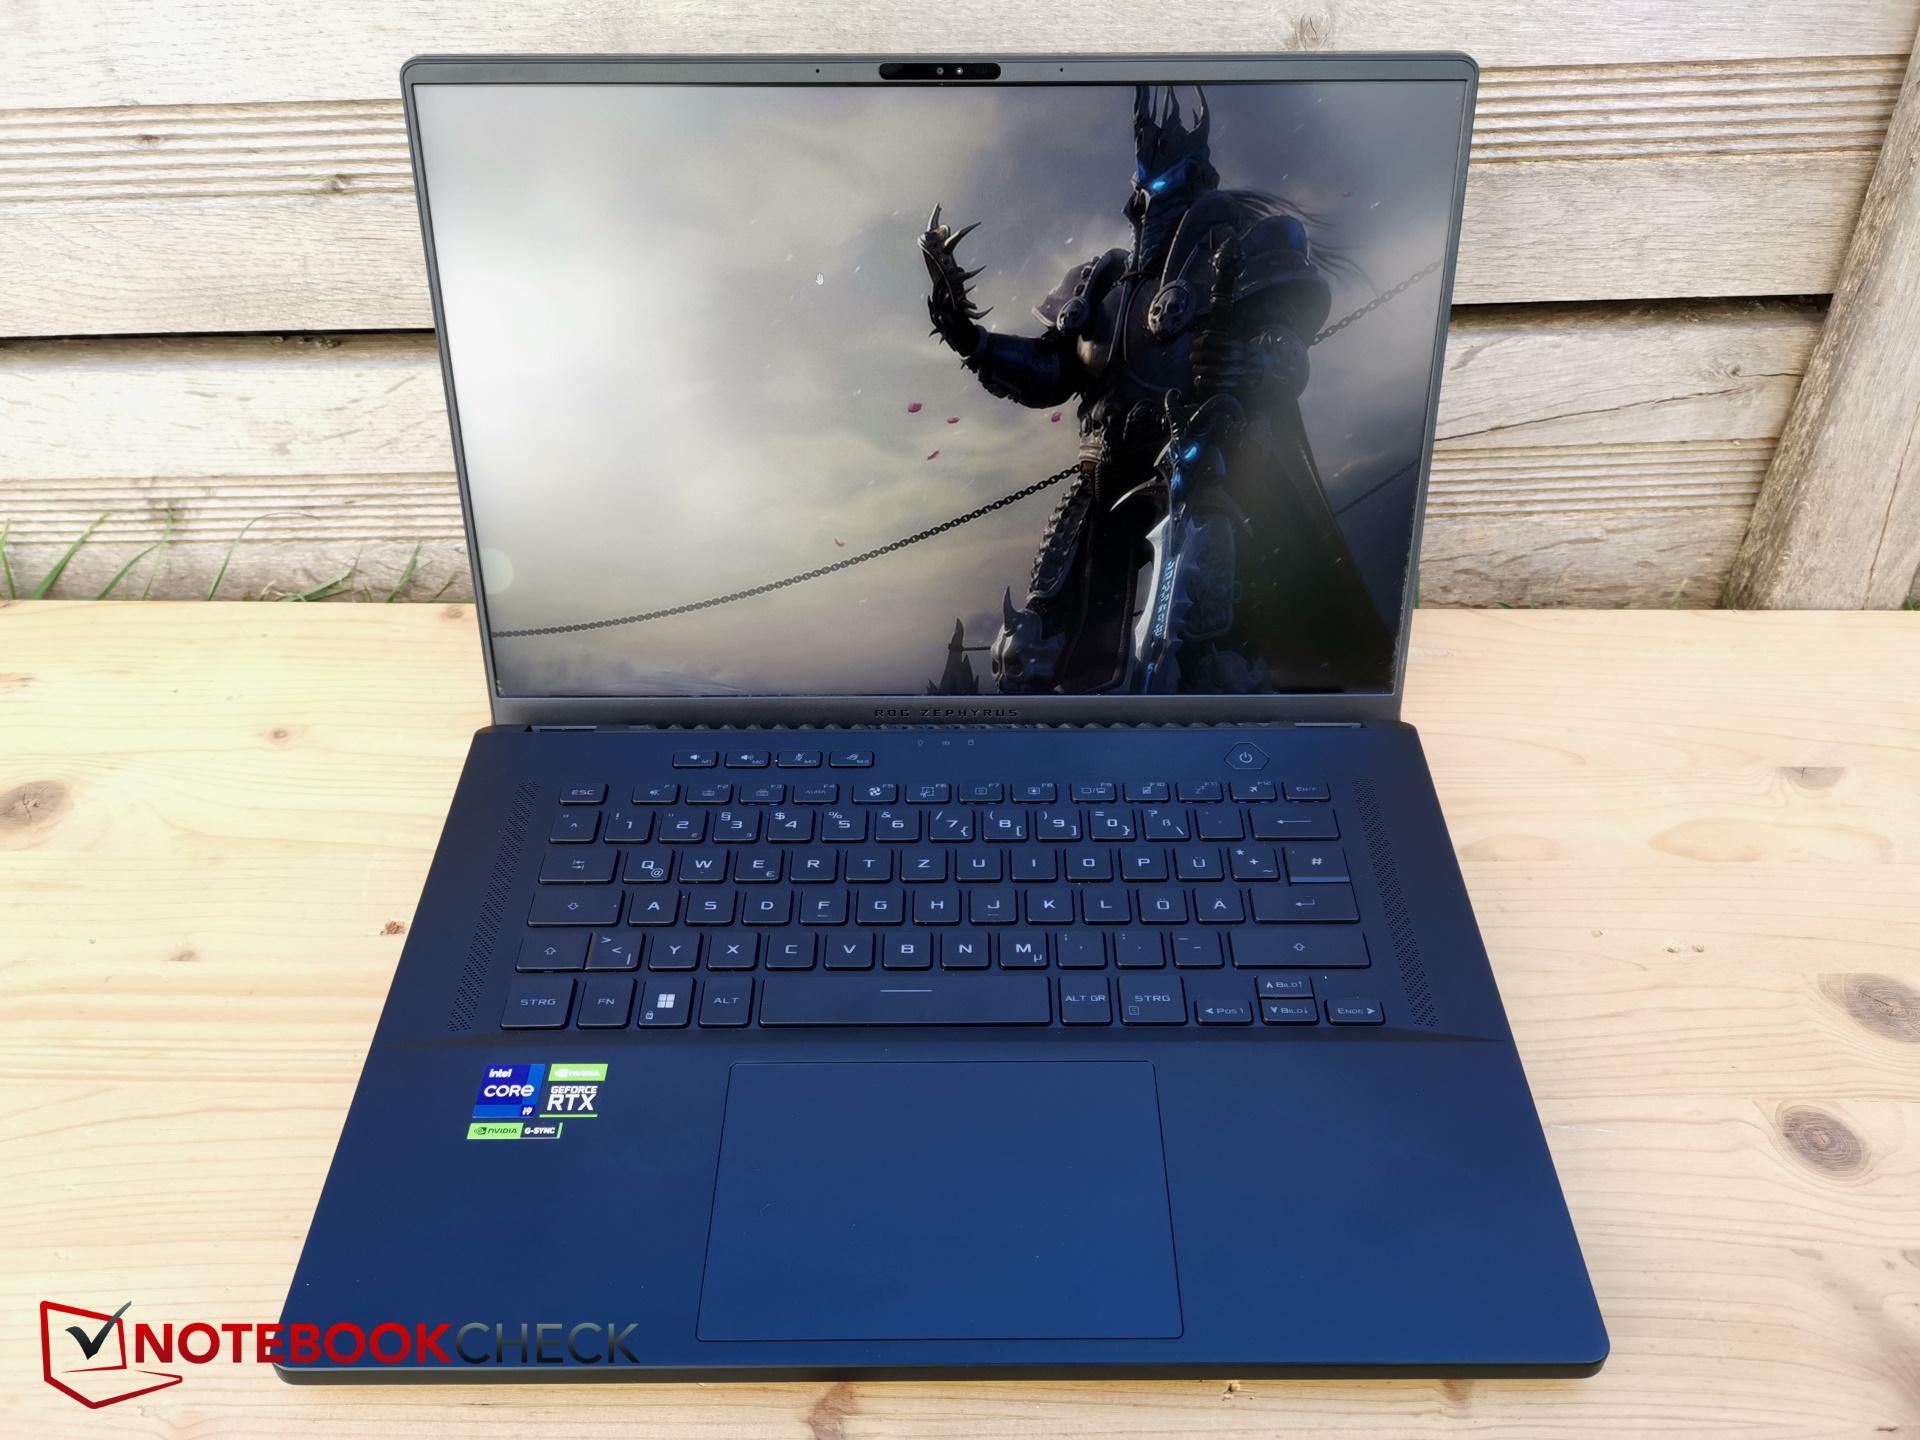
Asus ROG Zephyrus M16 (2023) laptop review: RTX 4090 com um display Mini-LED super brilhante

Como um dos últimos exemplos da "velha" geração CPU/GPU, recentemente revisamos o ROG Zephyrus M16que veio equipado com umNúcleo i9-12900He umRTX 3070 Ti. Mas agora, uma mudança da guarda veio na forma da M16, desta vez com umNúcleo i9-13900He umRTX 4090 embalado dentro de uma caixa "AniMe Matrix". Esta última mudou ligeiramente, já que a matriz se tornou um pouco mais fina. Demos uma olhada detalhada nestas mudanças e investigamos se a M16 pode se dar bem com a RTX 4090.
Escusado será dizer que comparamos o novo dispositivo com o predecessor, bem como com outras máquinas de jogos de alta tecnologia. Como o RTX 4090 é normalmente encontrado em laptops maiores, também olhamos para a M16 de 18 polegadasAsus ROG Strix Scar 18 ou o de 17 polegadasMSI Titan GT77. Também consideramos tanto o Lenovo Legion Pro 7 16IRX e o Lâmina Razer 16 para ser concorrentes.
Possíveis concorrentes em comparação
Avaliação | Data | Modelo | Peso | Altura | Size | Resolução | Preço |
|---|---|---|---|---|---|---|---|
| 89.4 % v7 (old) | 03/2023 | Asus ROG Zephyrus M16 GU604VY-NM042X i9-13900H, GeForce RTX 4090 Laptop GPU | 2.3 kg | 22.9 mm | 16.00" | 2560x1600 | |
| 87.8 % v7 (old) | 02/2023 | Asus ROG Zephyrus M16 GU603Z i9-12900H, GeForce RTX 3070 Ti Laptop GPU | 2.1 kg | 19.9 mm | 16.00" | 2560x1600 | |
| 86.6 % v7 (old) | 02/2023 | Asus ROG Strix Scar 18 2023 G834JY-N6005W i9-13980HX, GeForce RTX 4090 Laptop GPU | 3.1 kg | 30.8 mm | 18.00" | 2560x1600 | |
| 89 % v7 (old) | 02/2023 | MSI Titan GT77 HX 13VI i9-13950HX, GeForce RTX 4090 Laptop GPU | 3.5 kg | 23 mm | 17.30" | 3840x2160 | |
| 89.4 % v7 (old) | 02/2023 | Lenovo Legion Pro 7 16IRX8H i9-13900HX, GeForce RTX 4080 Laptop GPU | 2.7 kg | 26 mm | 16.00" | 2560x1600 | |
| 91.2 % v7 (old) | 02/2023 | Razer Blade 16 Early 2023 i9-13950HX, GeForce RTX 4080 Laptop GPU | 2.4 kg | 21.99 mm | 16.00" | 2560x1600 |
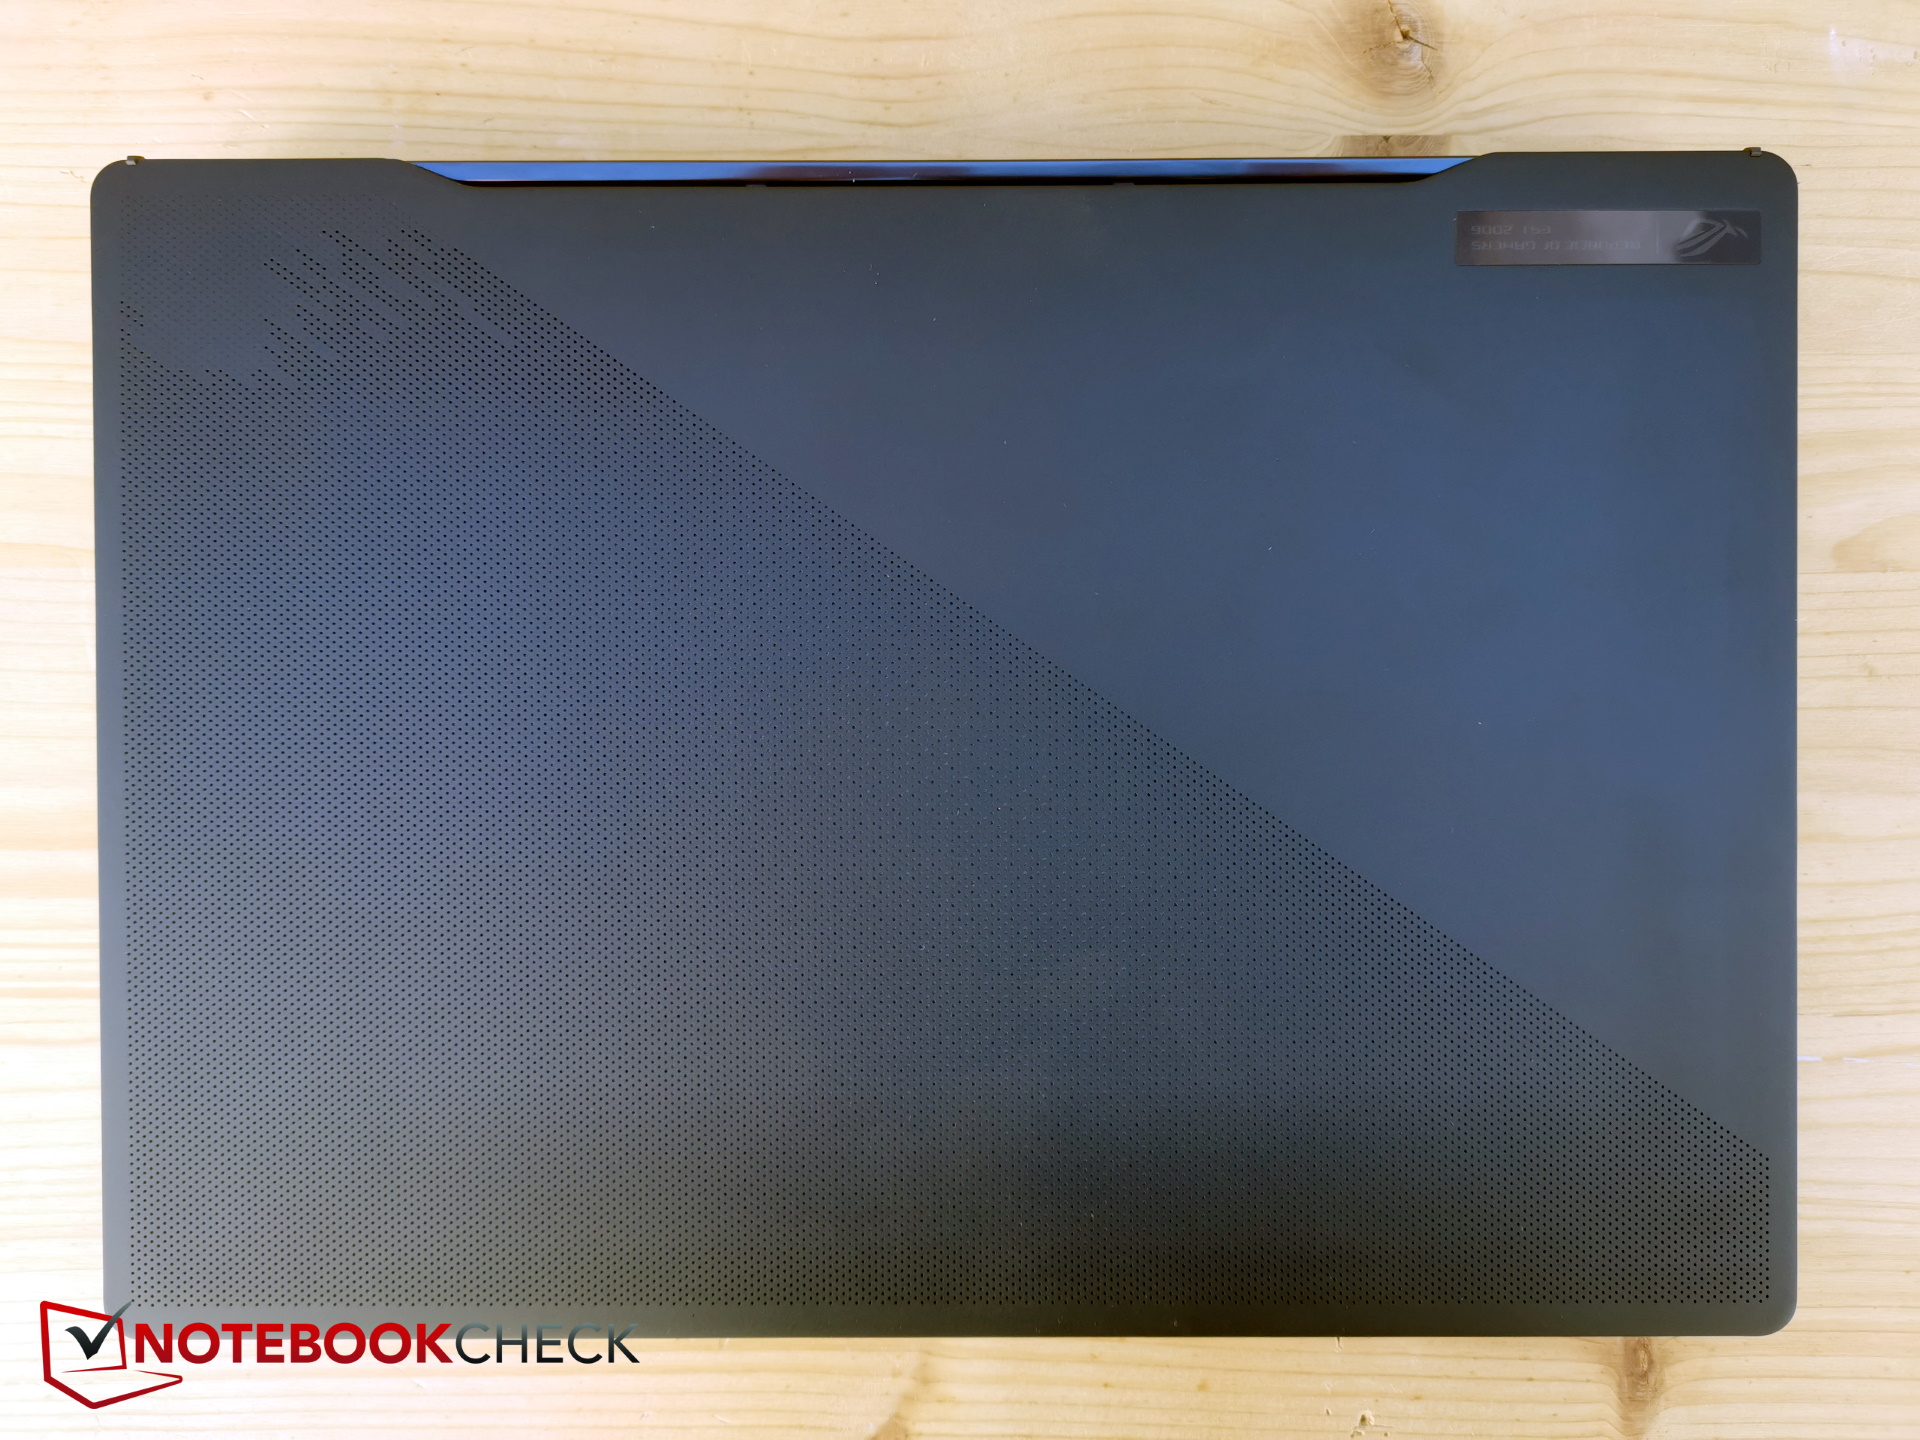
Estojo - Um torno de cabeça AniMe Matrix
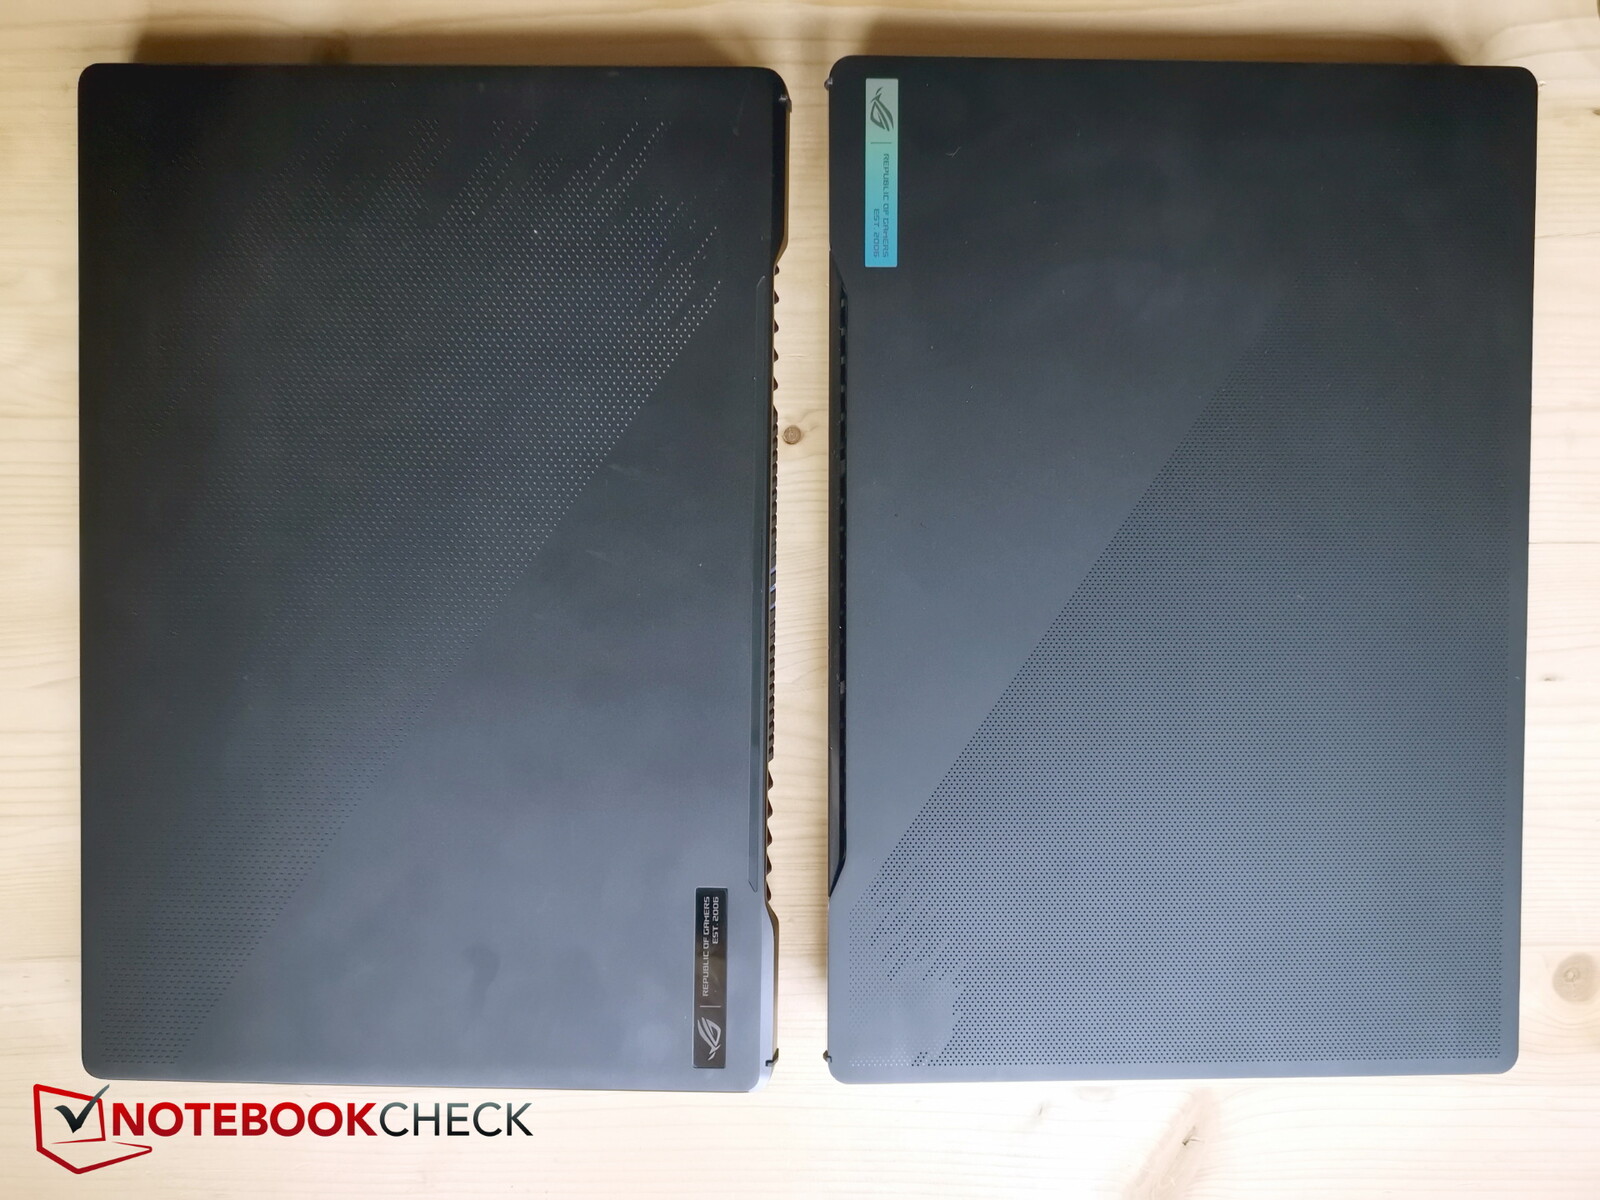
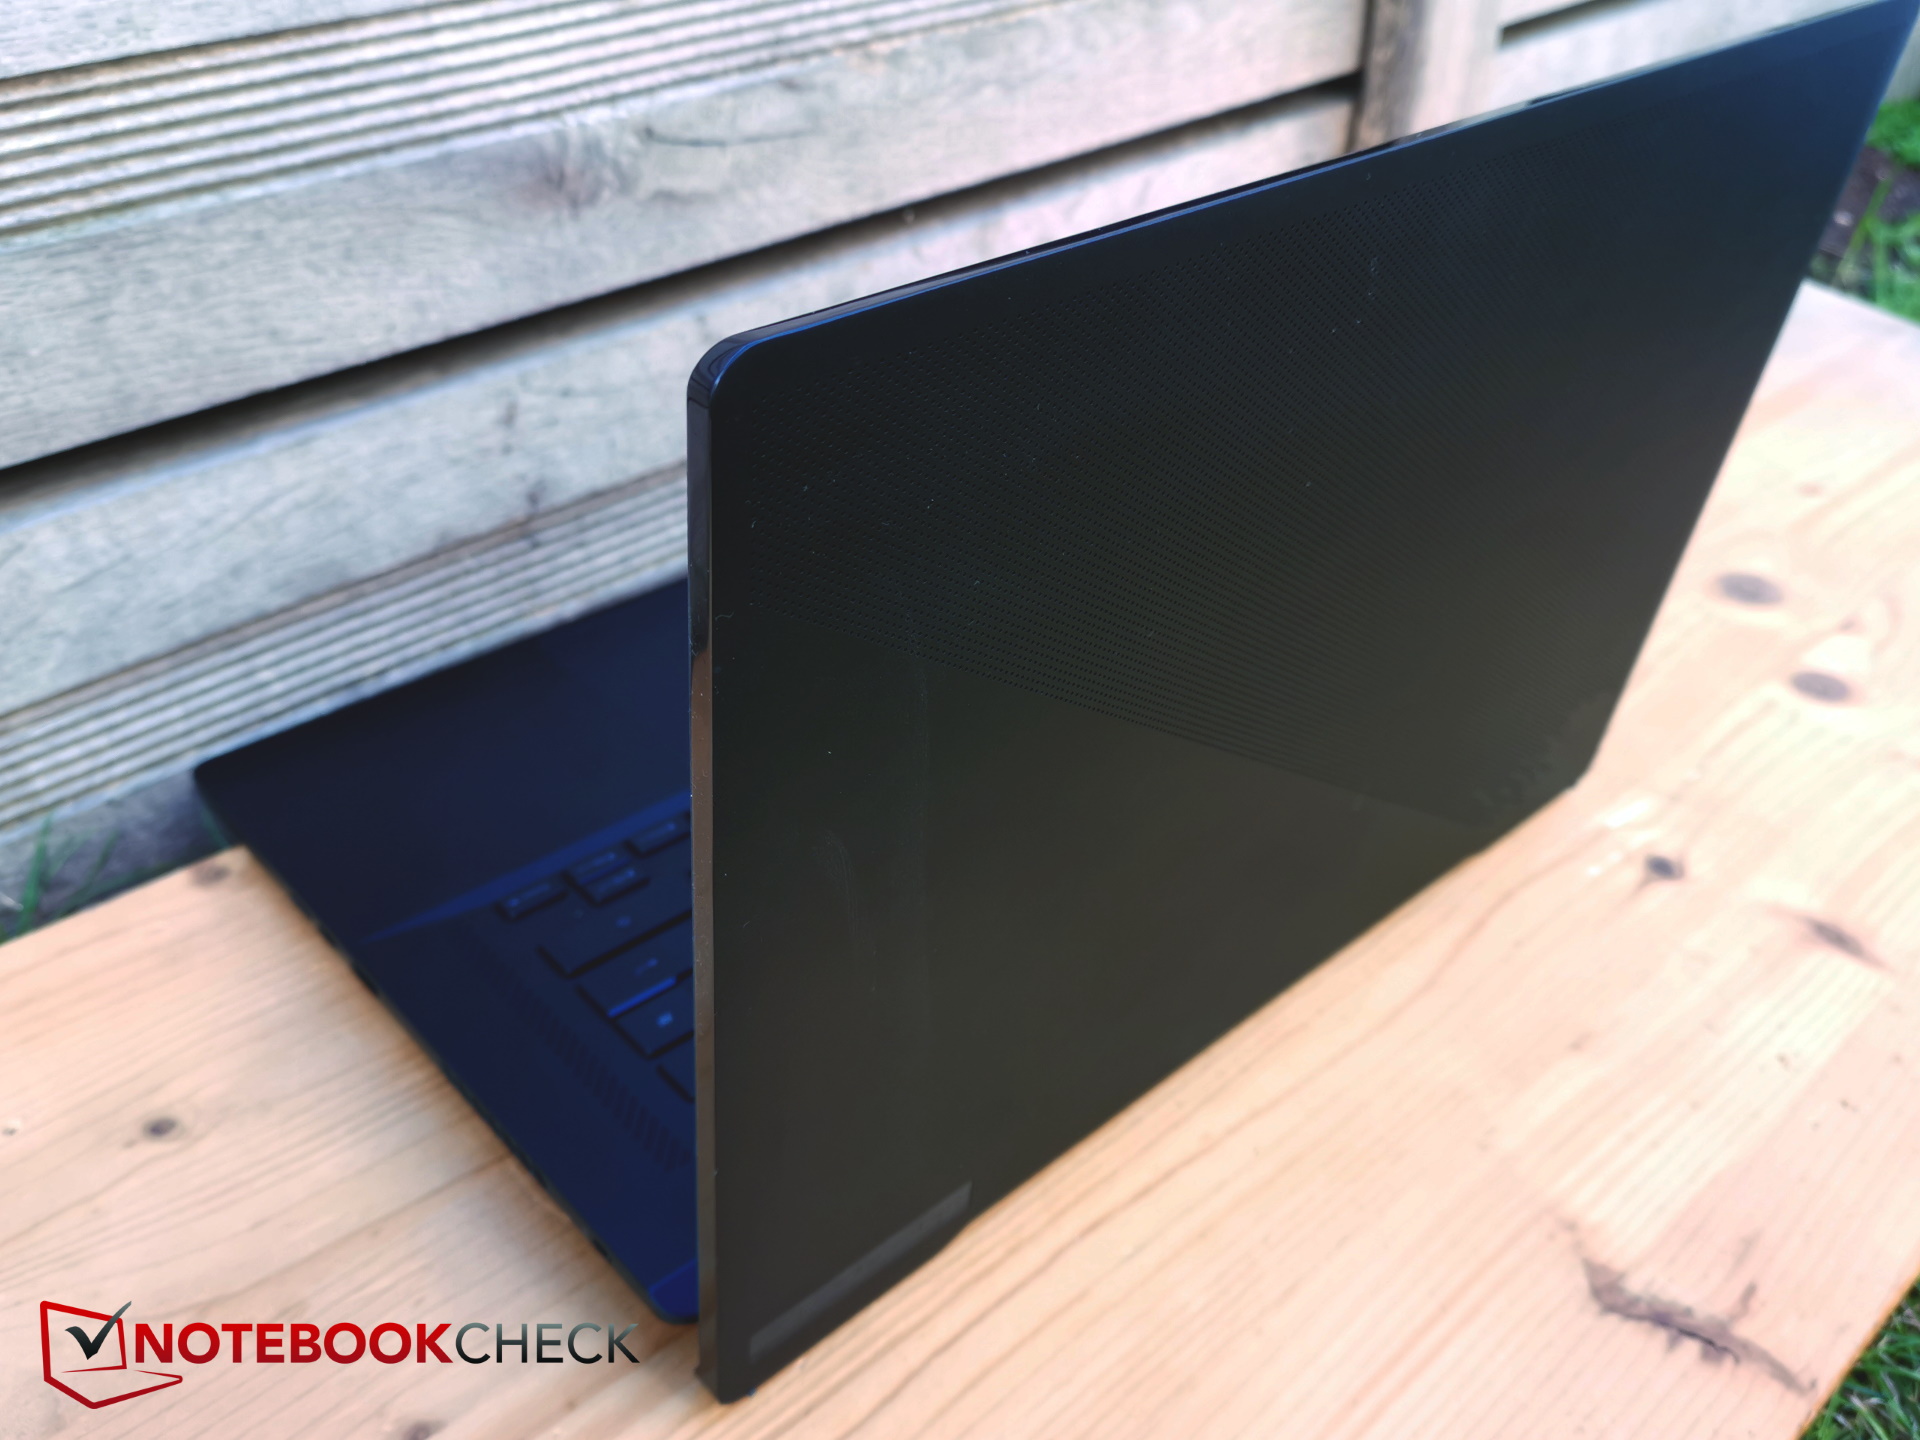
A Gigabyte revisou o caso este ano, mas, à primeira vista, é difícil detectar quaisquer diferenças óbvias. O chassi continua sendo feito de plástico preto, que agora é ligeiramente mais grosso.
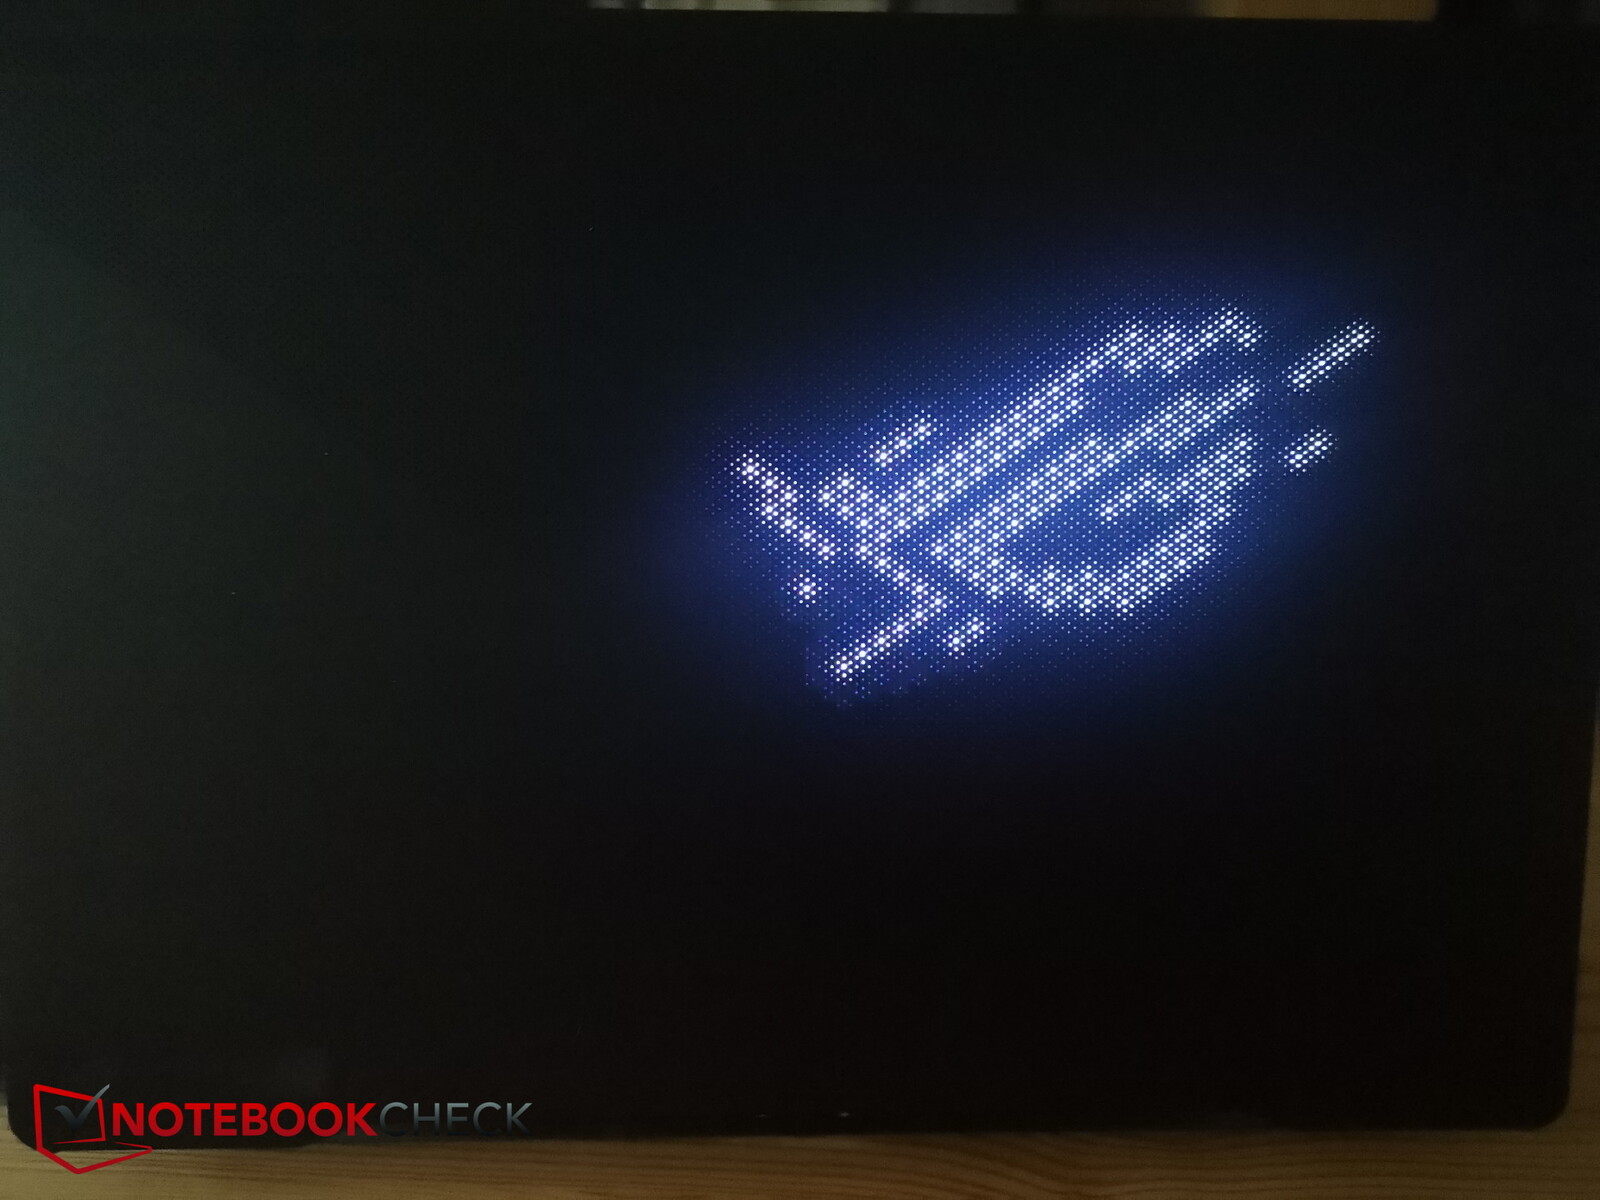
A chamada Matriz AniMe na superfície superior é mais fina e mais detalhada do que antes e pode exibir logotipos ou textos simples e móveis com efeitos adicionais. Por um lado, isto é legal, mas não só é provável que aumente o consumo de energia do dispositivo, mas é amplamente invisível para o usuário quando o laptop está aberto. Por este motivo, o efeito é mais voltado para impressionar os espectadores.
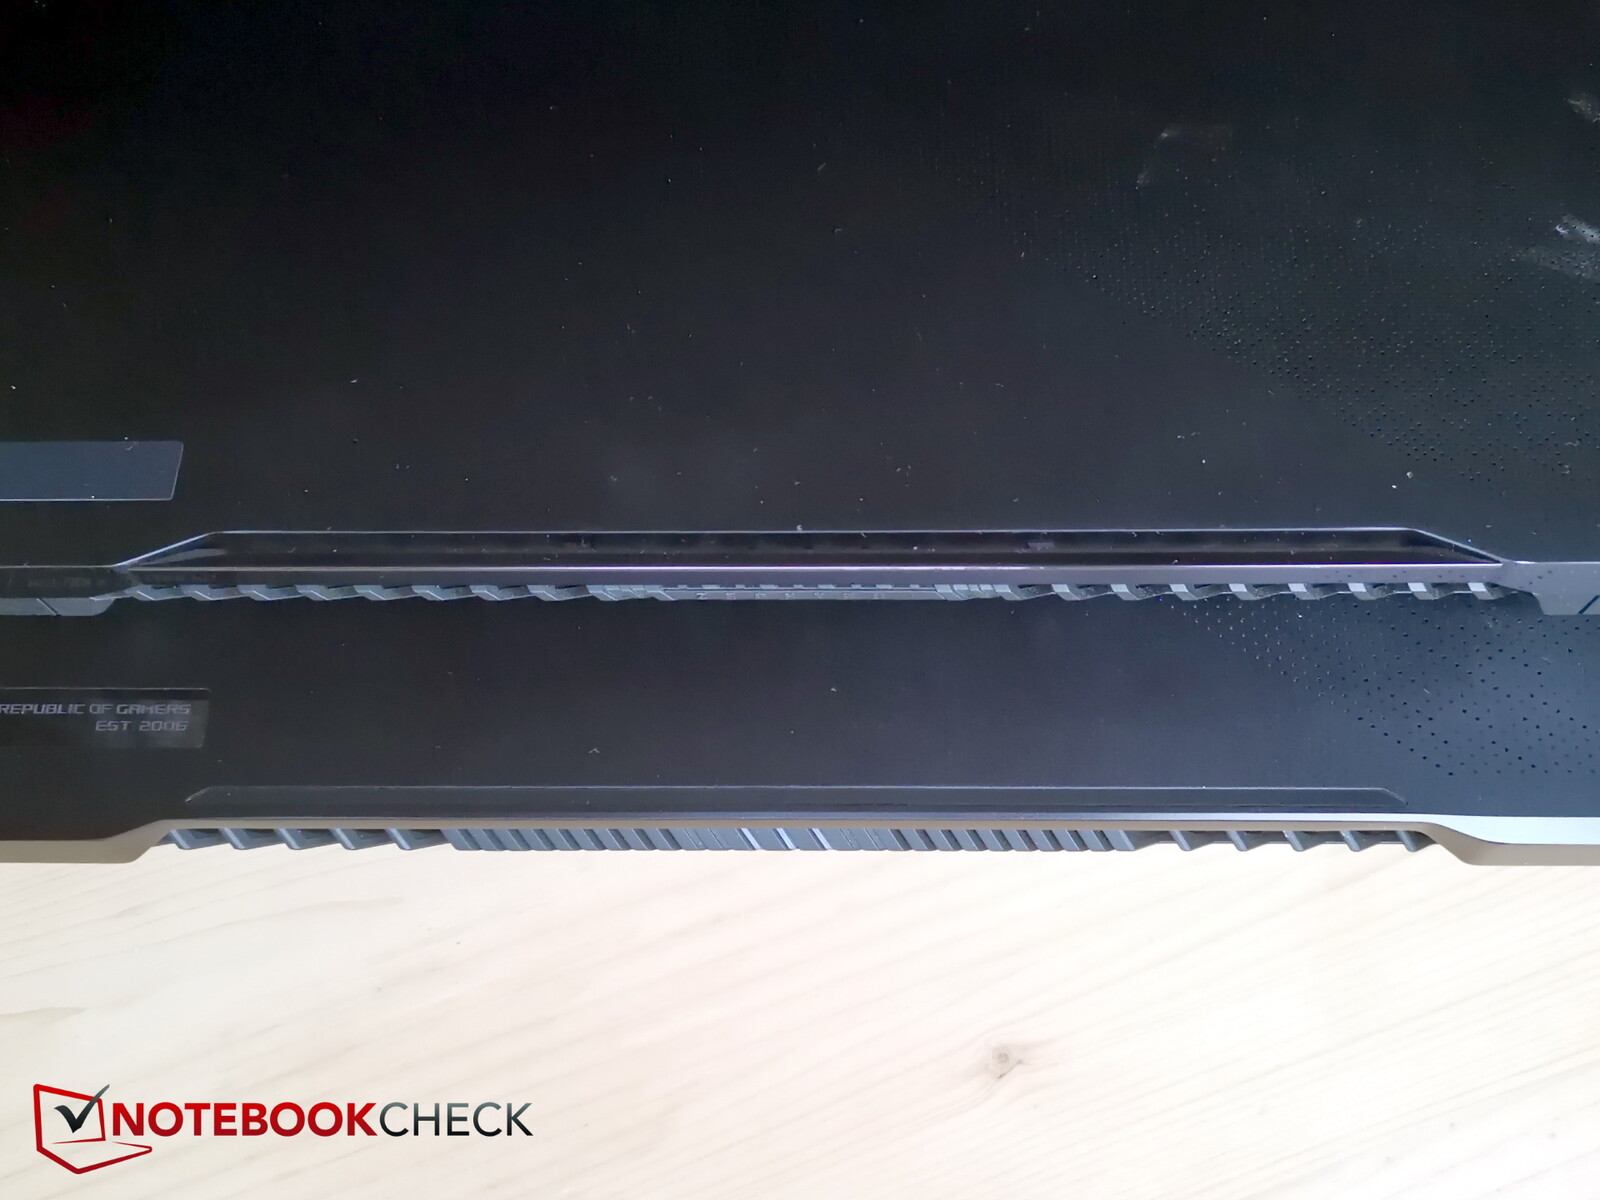
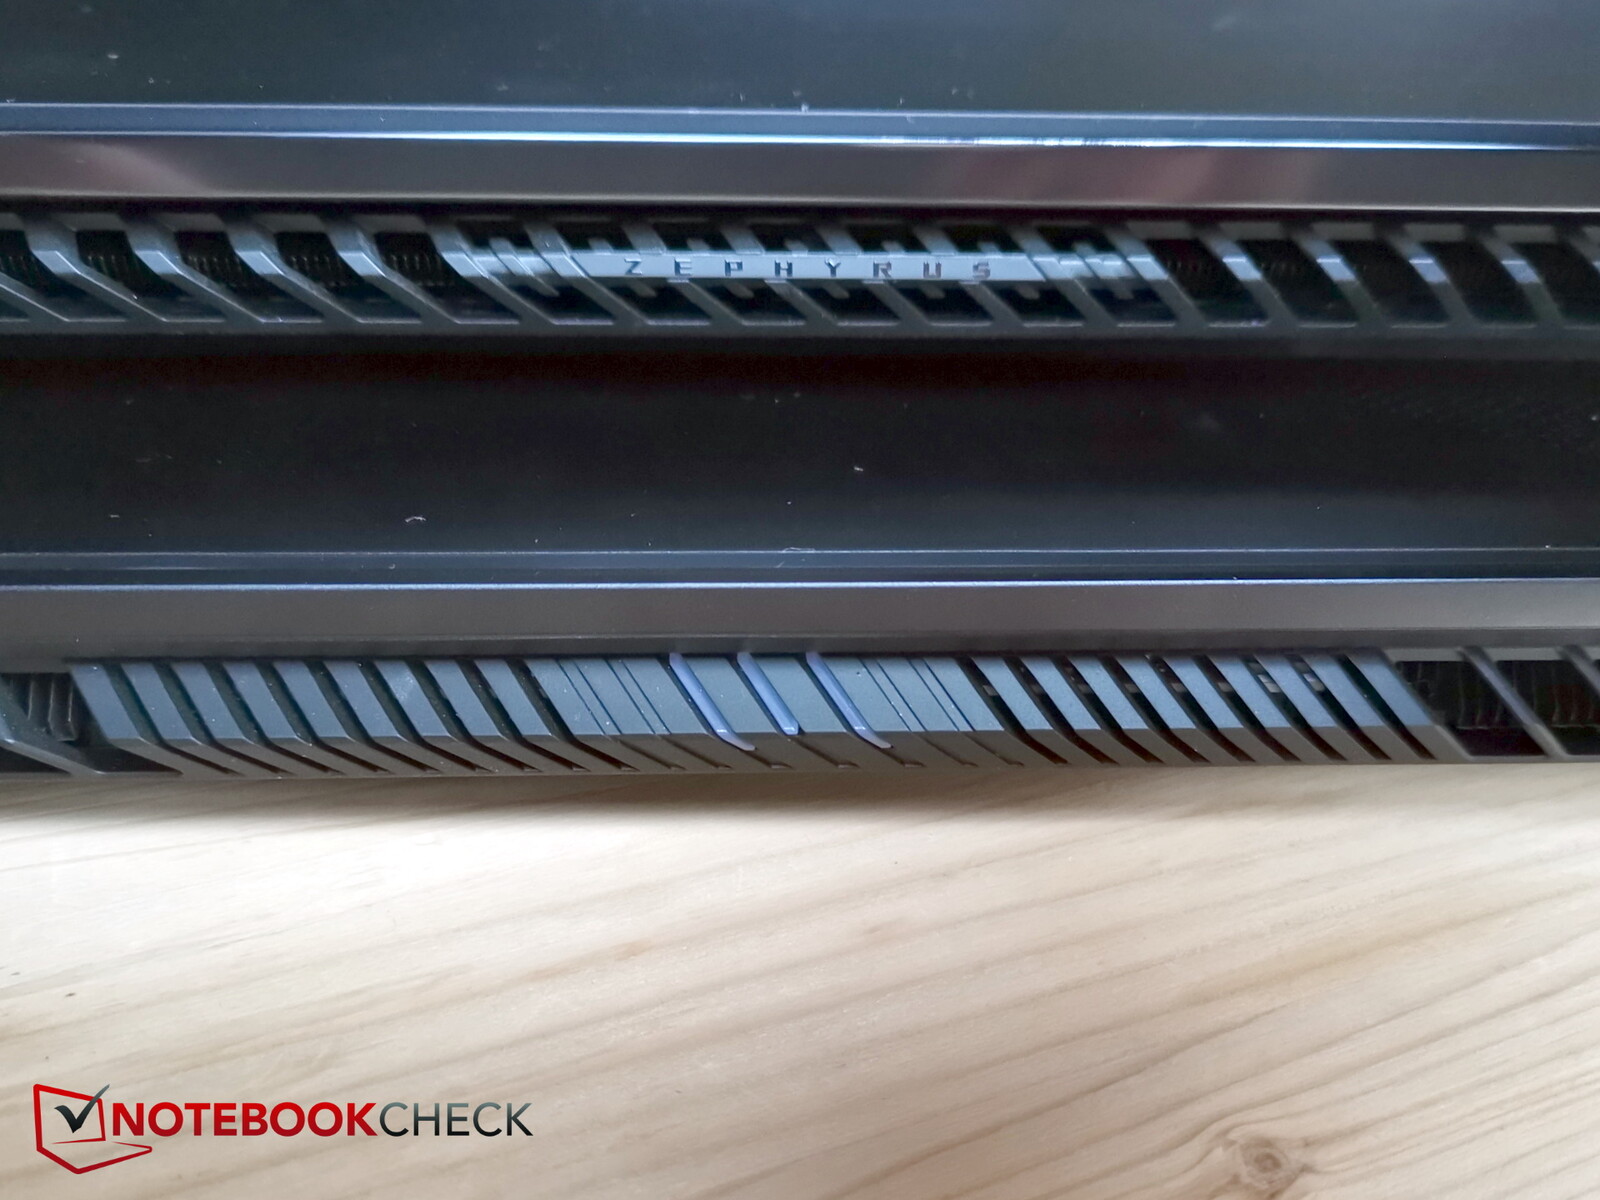
Não ficamos impressionados com a barra de plástico preta em branco na parte de cima da tampa. É um pouco barata, não muito estável e já tinha começado a mostrar sinais de desgaste. No total, quase todas as grelhas de ventilação nas laterais foram ligeiramente alteradas, assim como a localização da porta.
A base parece robusta, mas range e crepita bem alto na tentativa de torcer o caso. Da mesma forma, o mesmo acontece com a tampa do display que pode ser dobrada com bastante facilidade. As dobradiças seguram o visor com bastante segurança e garantem que a tampa possa ser aberta a um ângulo de até 180 graus. Ao abrir o laptop, duas coisas se revelam para o usuário - o teclado se levanta levemente e as moldura do visor são bastante finas.


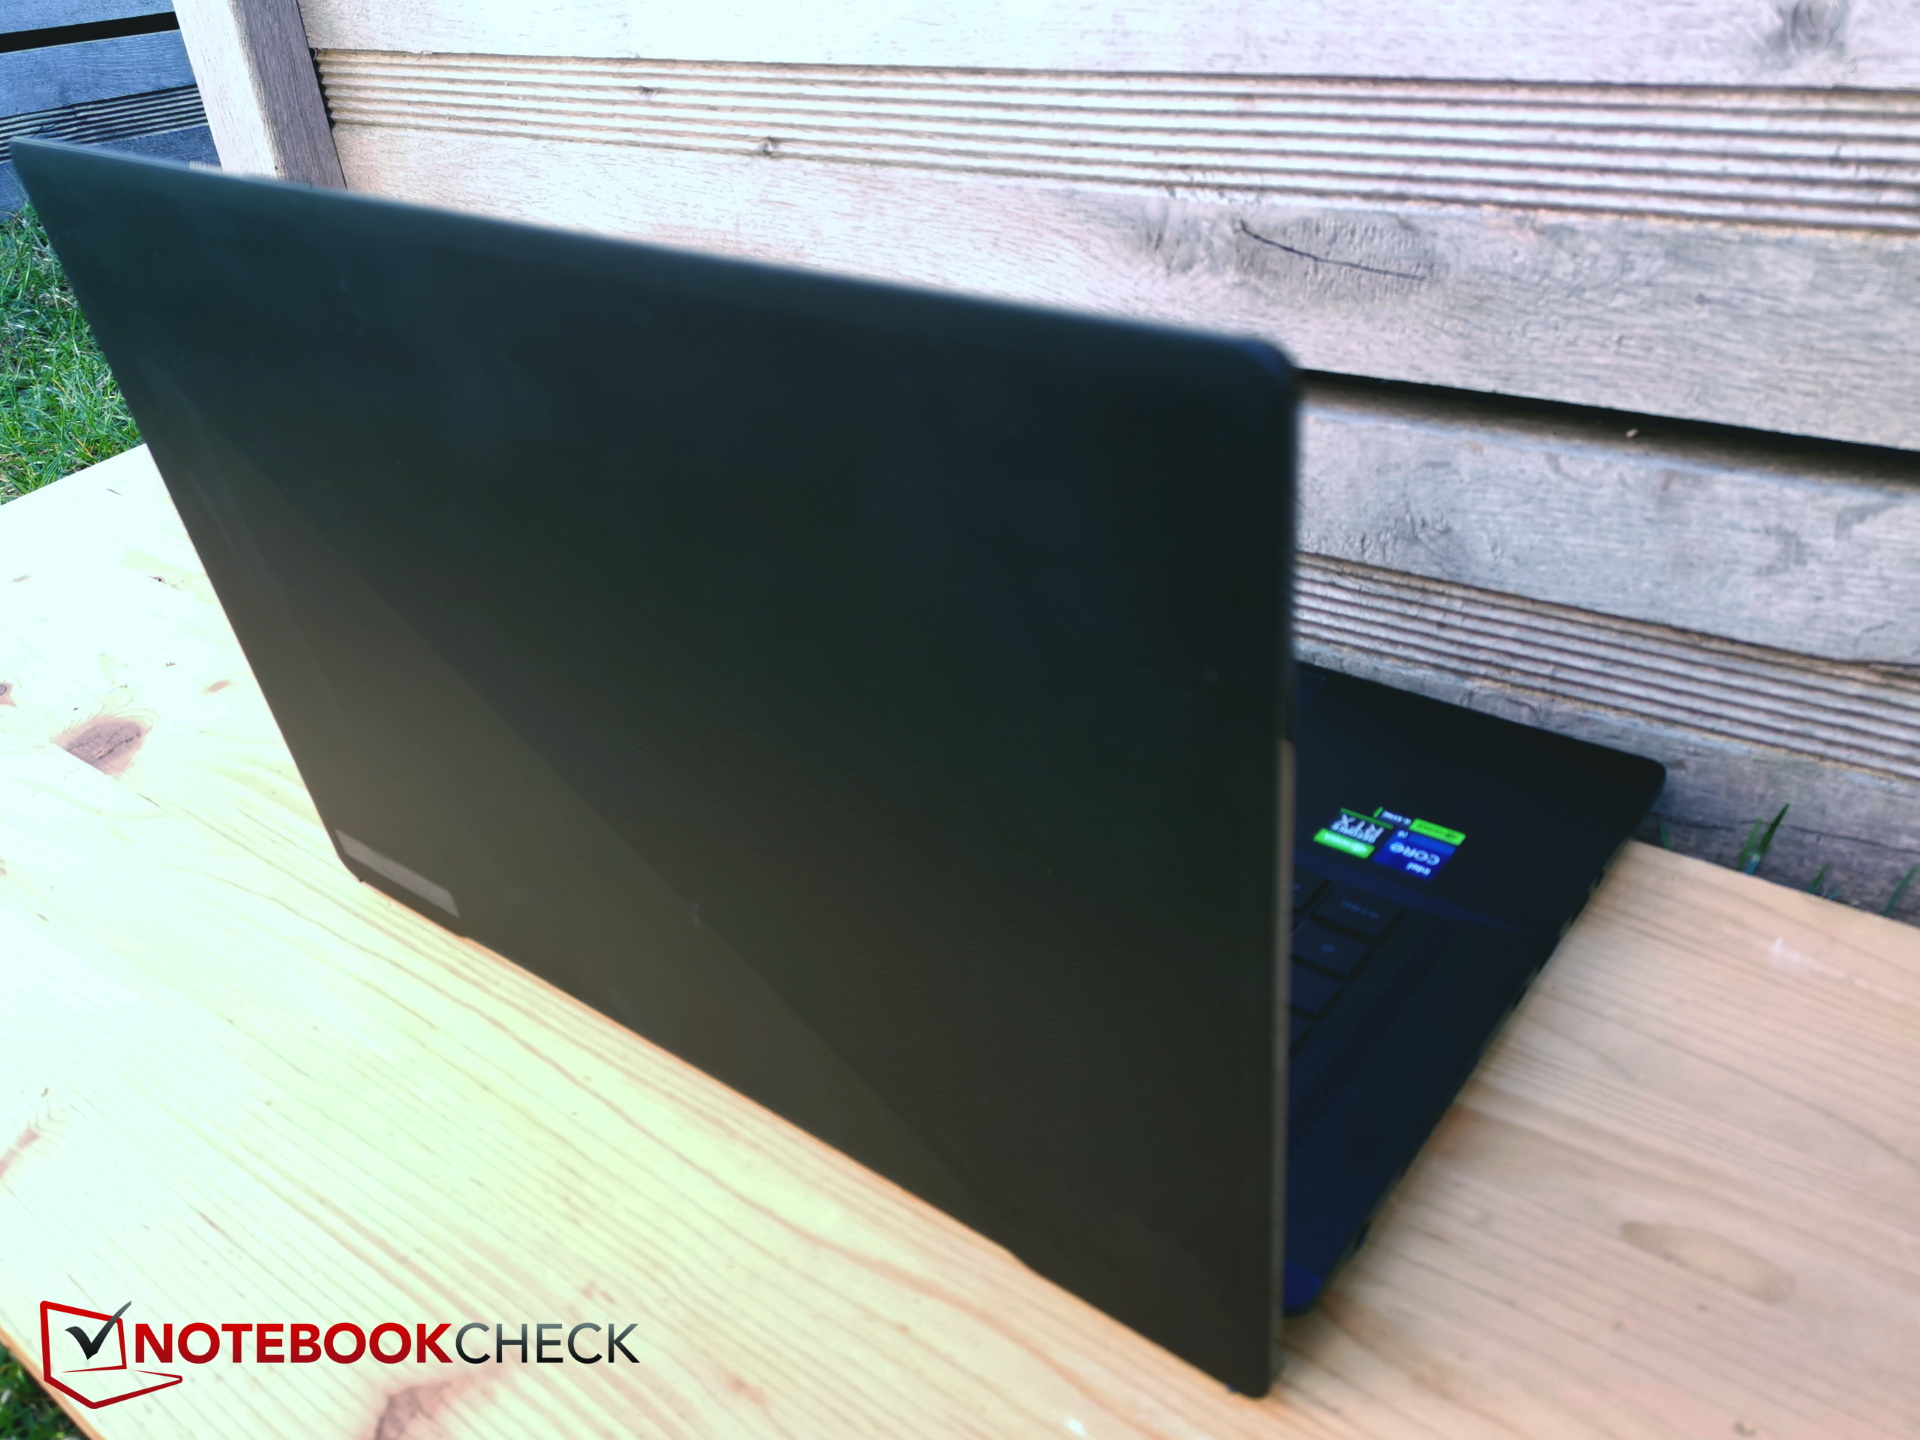
O que é incomum é que a pegada do dispositivo tenha aumentado em comparação com sua predecessor. Ao contrário da tendência de fazer aparelhos menores, mais finos e mais leves, a nova M16 é ligeiramente maior e também 3 mm mais grossa do que o modelo do último gênero.
OLâmina Razer 16 é apenas 1 mm mais fino, e oLenovo Legion Pro 7é marginalmente mais espessa, o que significa que a nova M16 fica em algum lugar no meio, também quando se trata de peso.
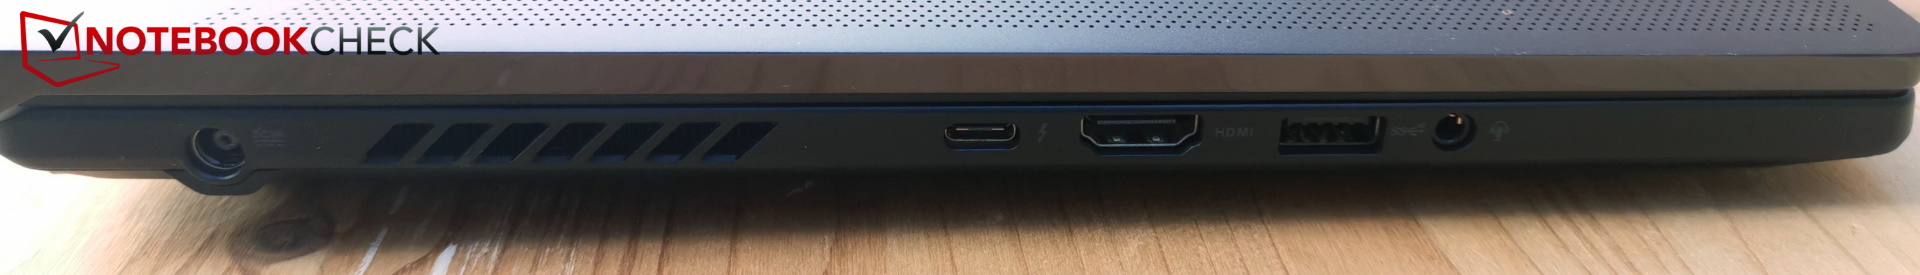
Características - Uma máquina de jogos sem porta LAN
Nem tudo mudou para melhor nesta área também: A porta LAN foi simplesmente omitida, o que significa que uma conexão rápida à Internet só é possível com um adaptador para aqueles jogadores que procuram a latência mais curta e a conexão mais rápida.
Uma das portas USB-C perambulou da esquerda para a direita. Isto significa que há mais espaço disponível do lado esquerdo do dispositivo. Na parte traseira, você ainda só pode encontrar grelhas de ventilador que resultam na falta de espaço para conectores mais volumosos, como HDMI ou a porta LAN que falta.
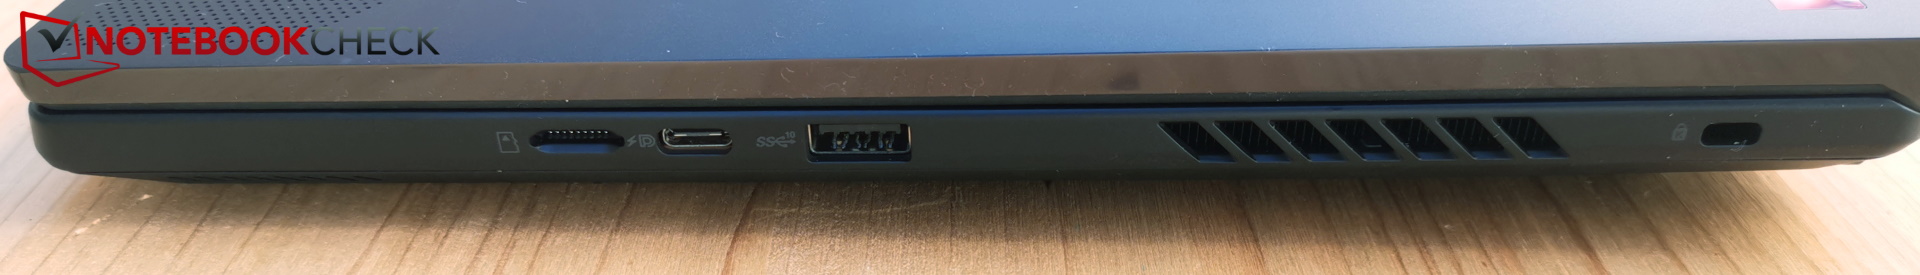
Leitor de cartões SD
Pelo menos o laptop vem com um leitor de cartões SD integrado e, embora infelizmente este seja destinado apenas a cartões microSD, ele ainda é muito rápido. Conseguimos copiar uma imagem de 1 GB no desktop em menos de 6 segundos usando nosso cartão de referência AV PRO microSD 128 GB V60.
| SD Card Reader | |
| average JPG Copy Test (av. of 3 runs) | |
| Asus ROG Zephyrus M16 GU604VY-NM042X | |
| Asus ROG Zephyrus M16 GU603Z | |
| Média da turma Gaming (20.9 - 210, n=54, últimos 2 anos) | |
| Razer Blade 16 Early 2023 (AV PRO microSD 128 GB V60) | |
| MSI Titan GT77 HX 13VI (Angelibird AV Pro V60) | |
| maximum AS SSD Seq Read Test (1GB) | |
| Asus ROG Zephyrus M16 GU603Z | |
| Razer Blade 16 Early 2023 (AV PRO microSD 128 GB V60) | |
| Asus ROG Zephyrus M16 GU604VY-NM042X | |
| Média da turma Gaming (25.5 - 261, n=51, últimos 2 anos) | |
| MSI Titan GT77 HX 13VI (Angelibird AV Pro V60) | |
Comunicação
Infelizmente, o fabricante acabou com a porta LAN e não incluiu um adaptador.
As conexões sem fio são atendidas pelo módulo Intel AX210 WiFi 6E. Este transmite a 2,4 GHz, 5 GHz e 6 GHz.
As taxas de transferência são rápidas e constantes.
Webcam
Nesta área, o fabricante finalmente atualizou para uma câmera FullHD e este modelo tem até mesmo um sensor IR para login no Windows usando o Windows Olá. Entretanto, as imagens têm uma óbvia tonalidade amarela e o desvio de cor é relativamente alto.


Segurança
TPM e um conector Kensington estão ambos a bordo, mas falta um sensor de impressão digital, assim como, infelizmente, um obturador físico de webcam.
Acessórios
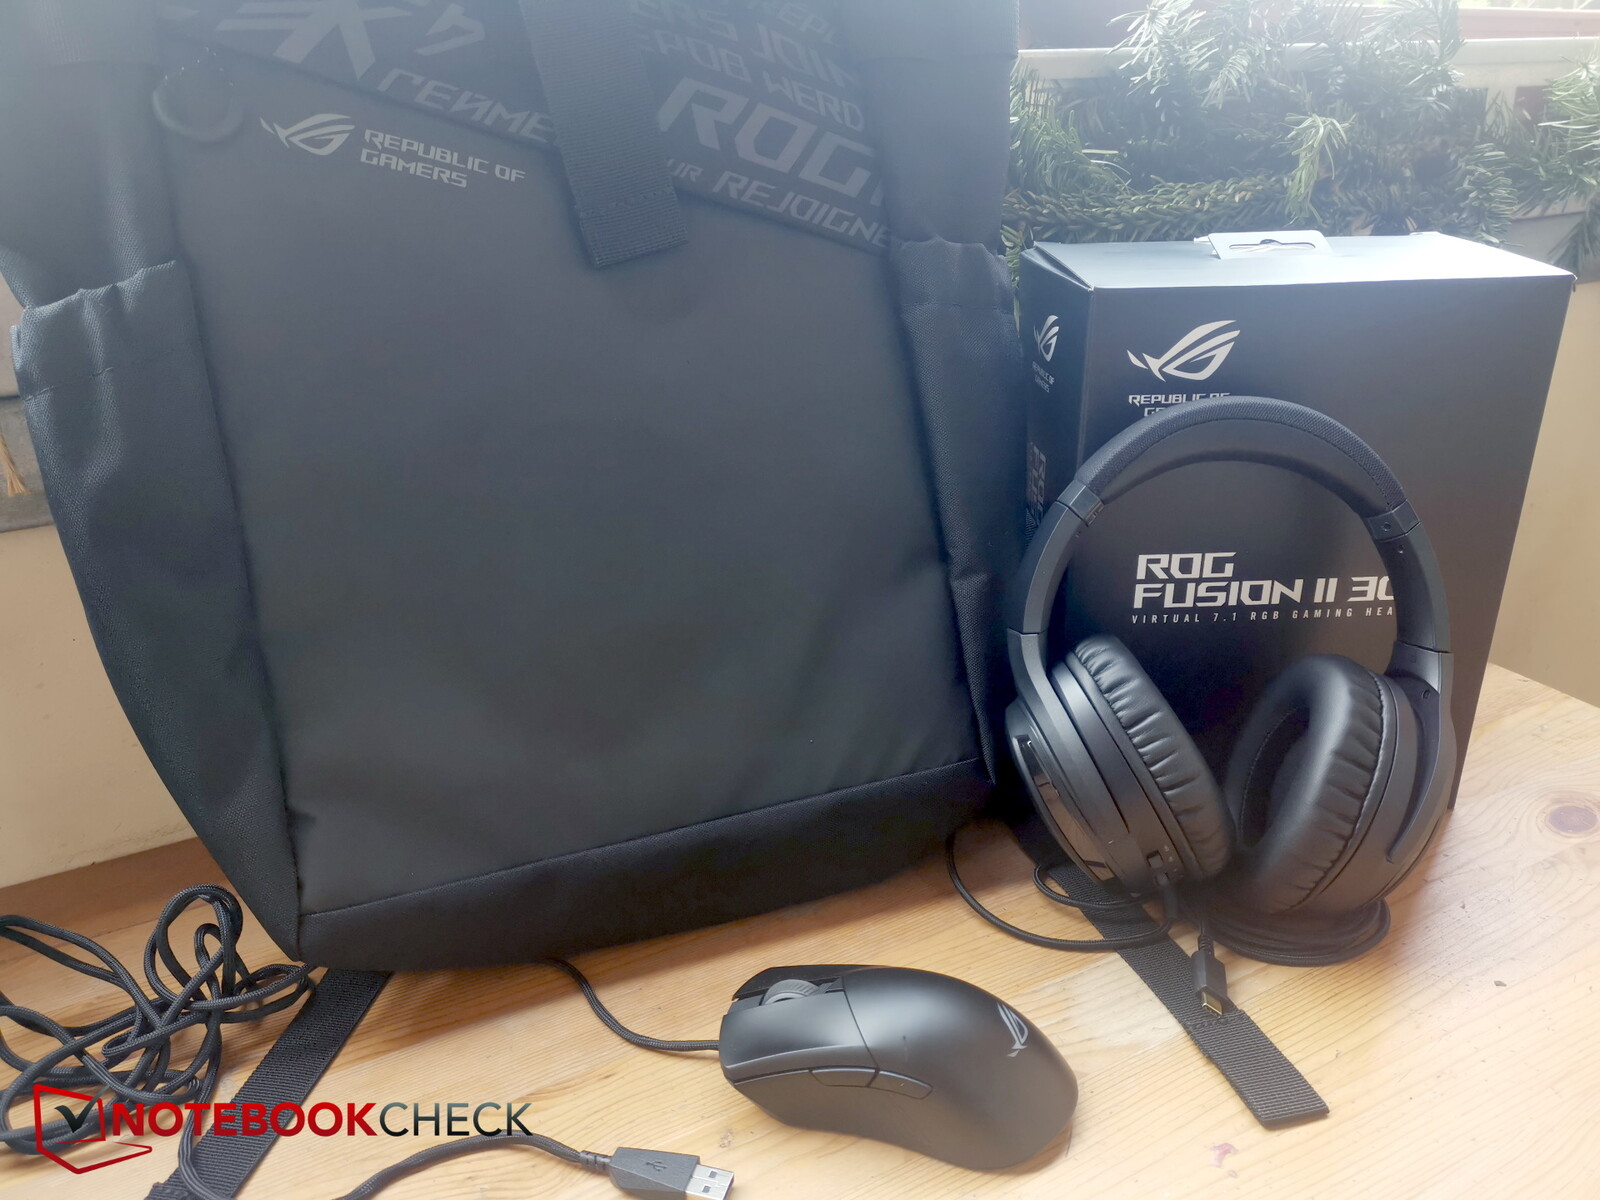
Nosso modelo de revisão veio em um enorme pacote que nos lembrou mais de uma usina elétrica. Em contraste, vários acessórios foram incluídos. Por exemplo, uma bolsa com compartimento para laptop, um mouse (ROG Gladius III) assim como fones de ouvido (ROG Fusion II 300), todos brasonados com a marca ROG.
De acordo com a Asus, estes acessórios vêm com nosso modelo de configuração, mas a M16 também pode ser adquirida como dispositivo autônomo.
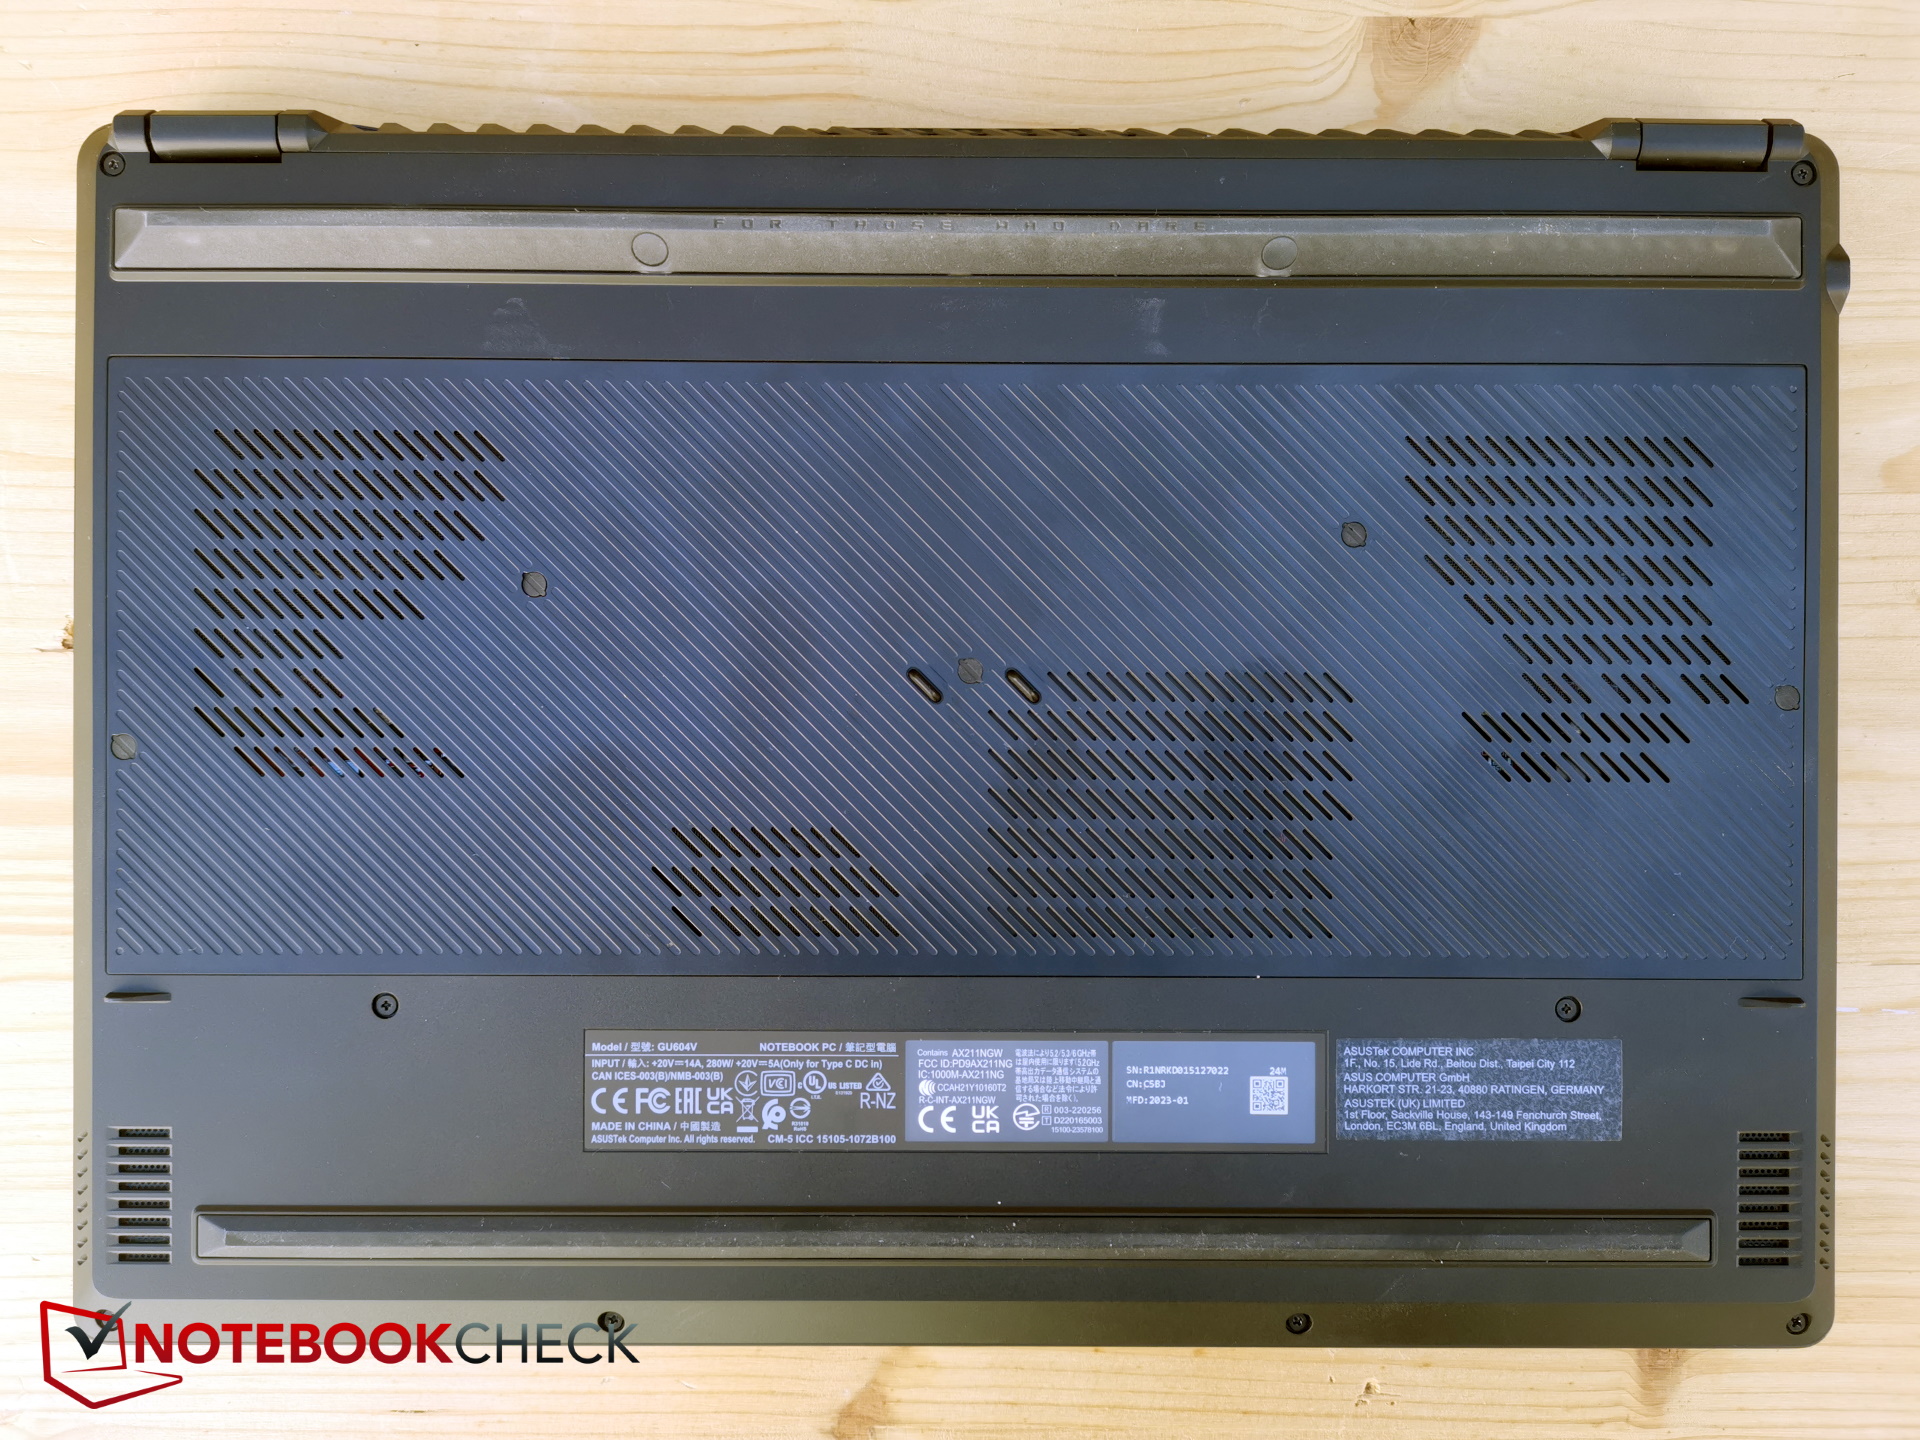
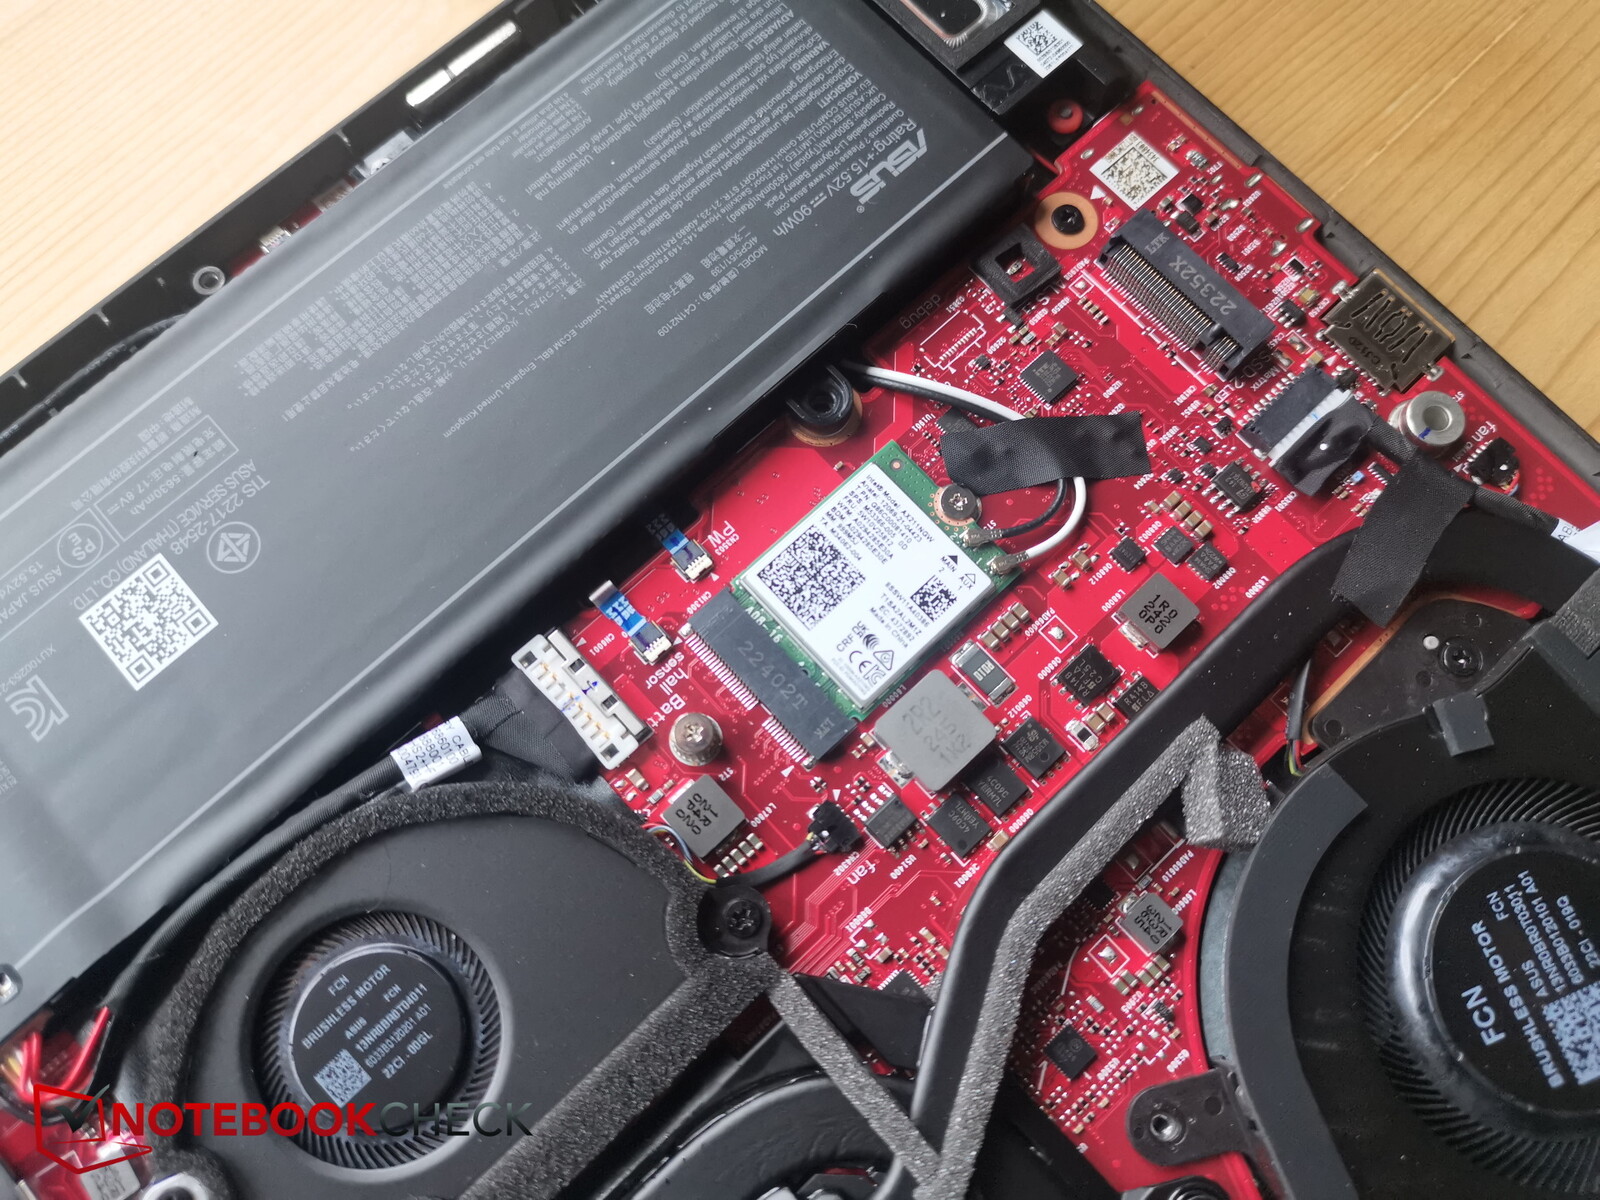
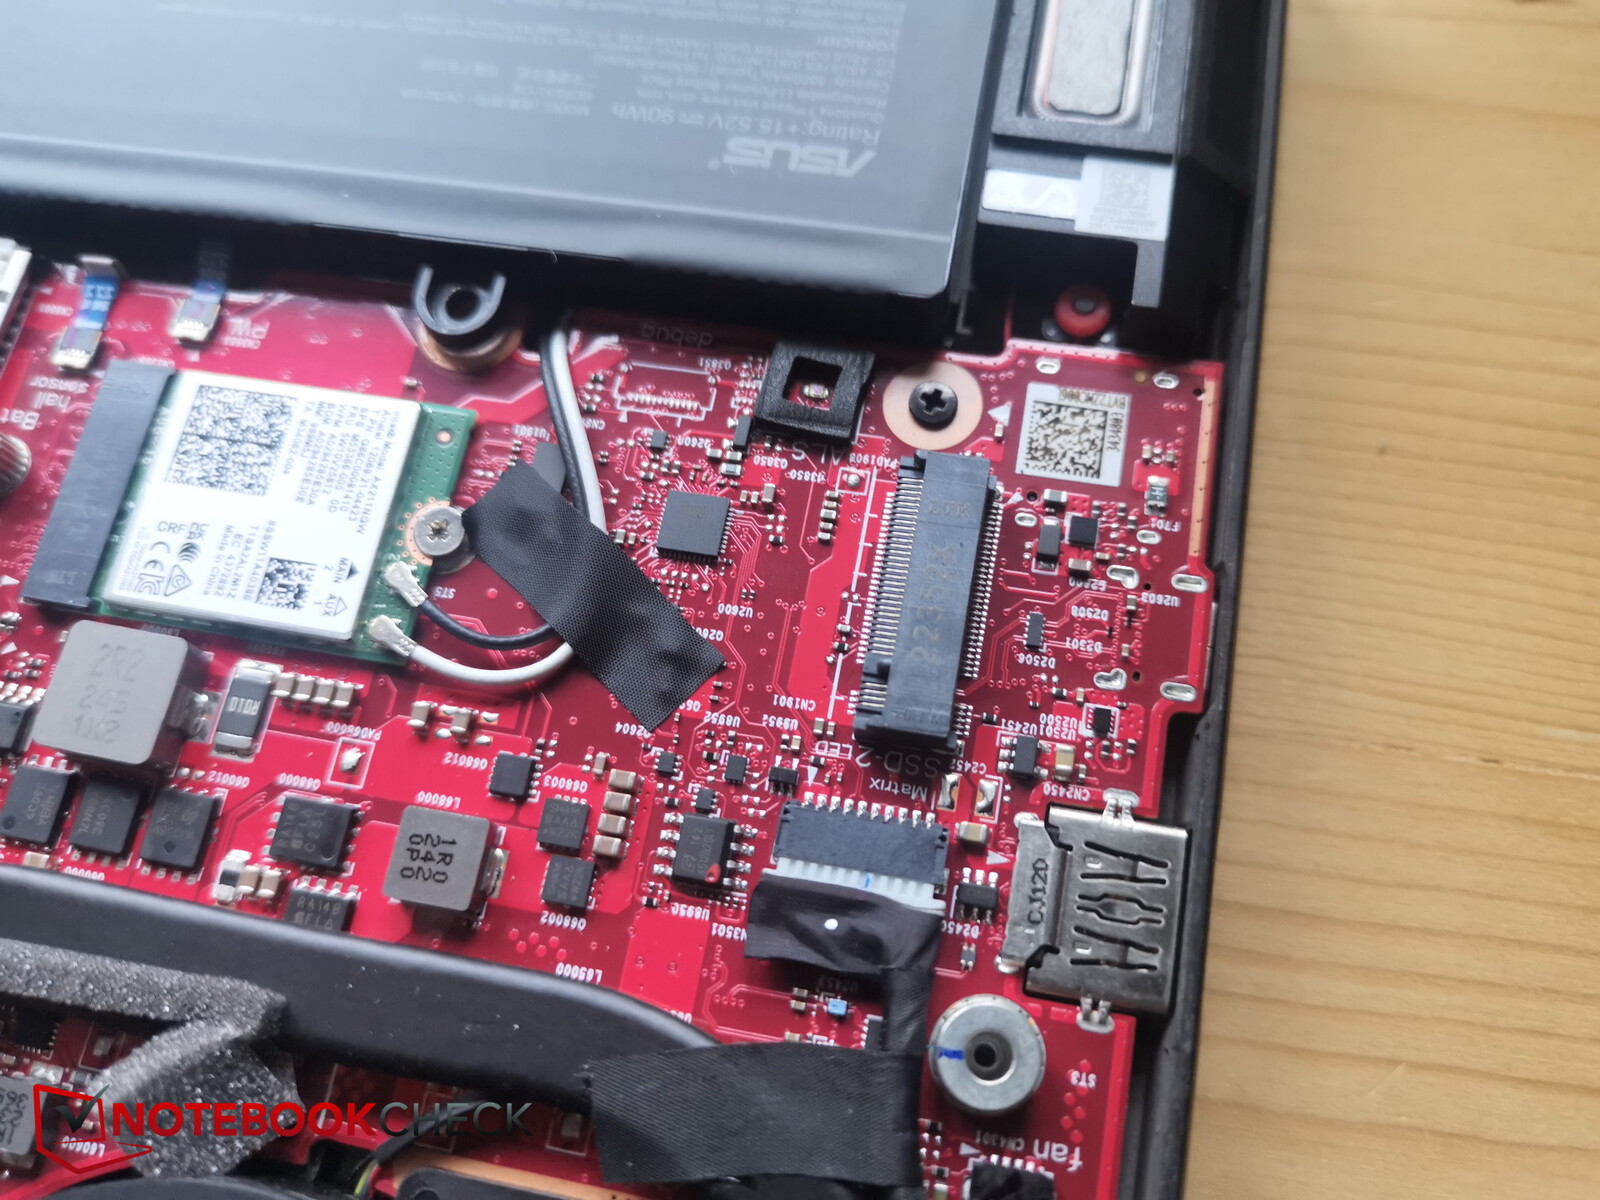
Manutenção
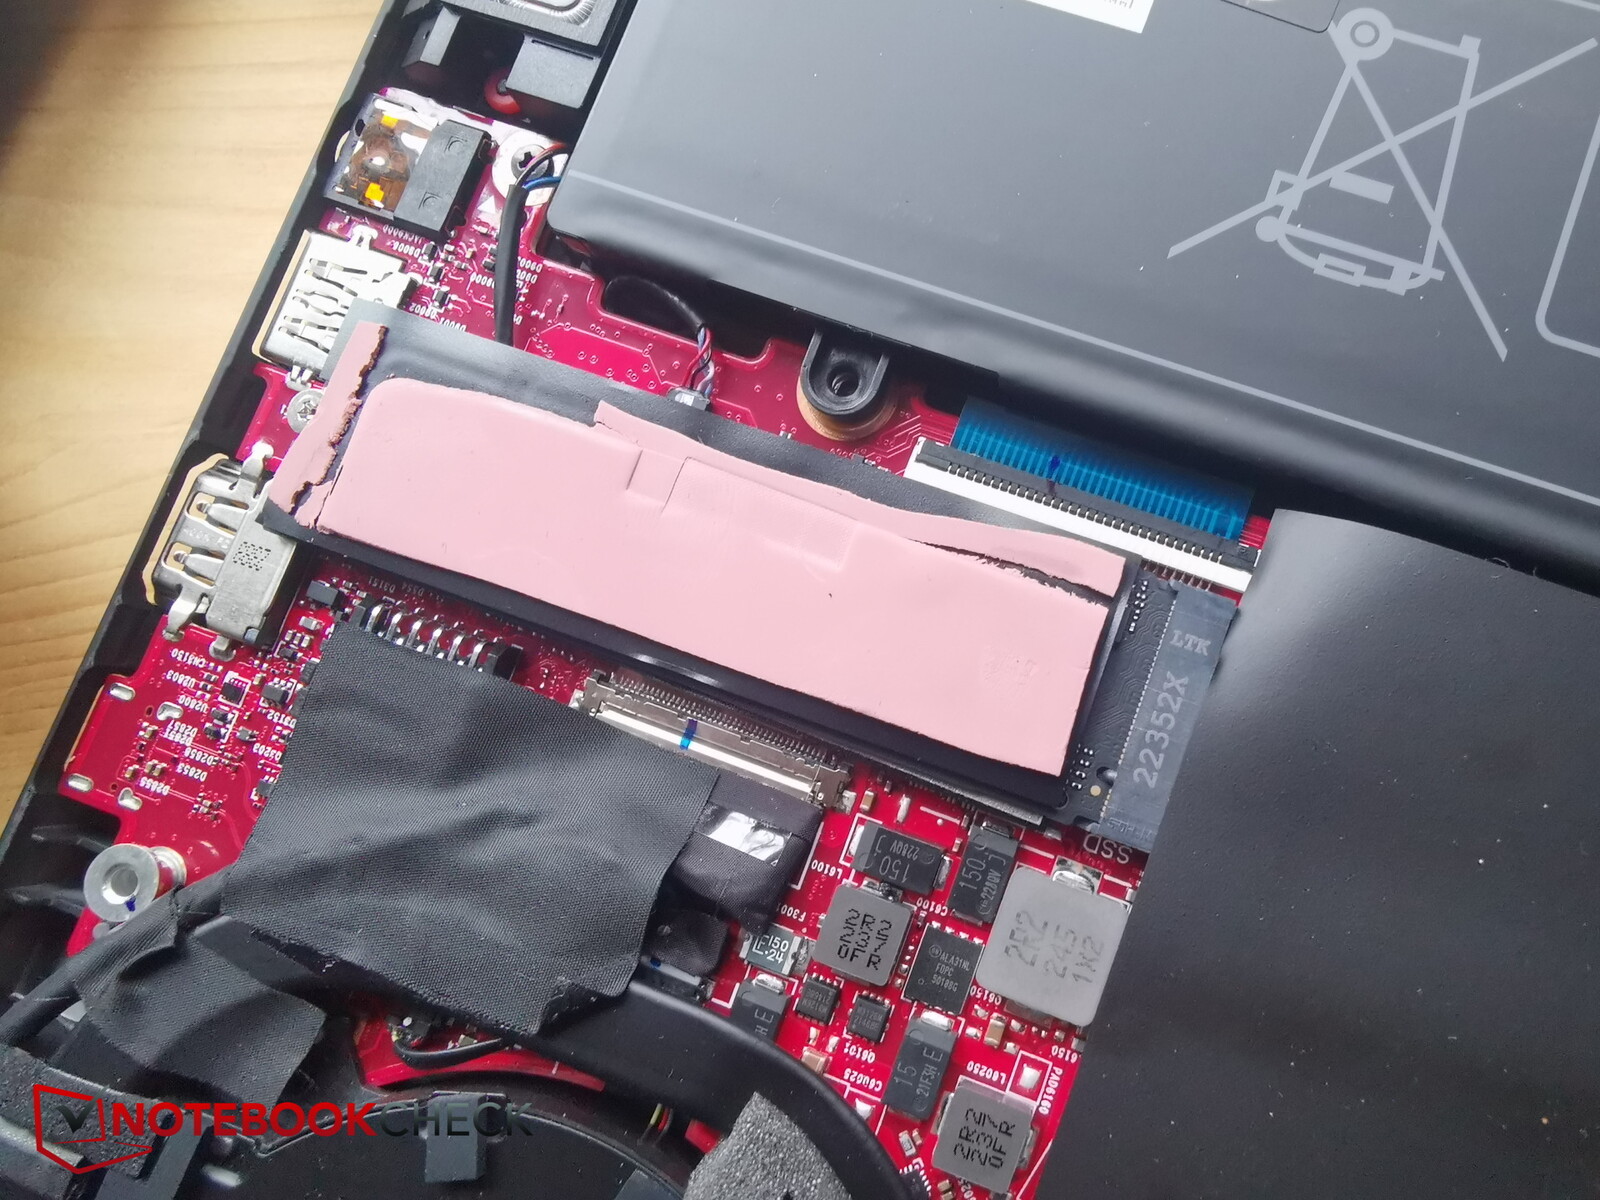
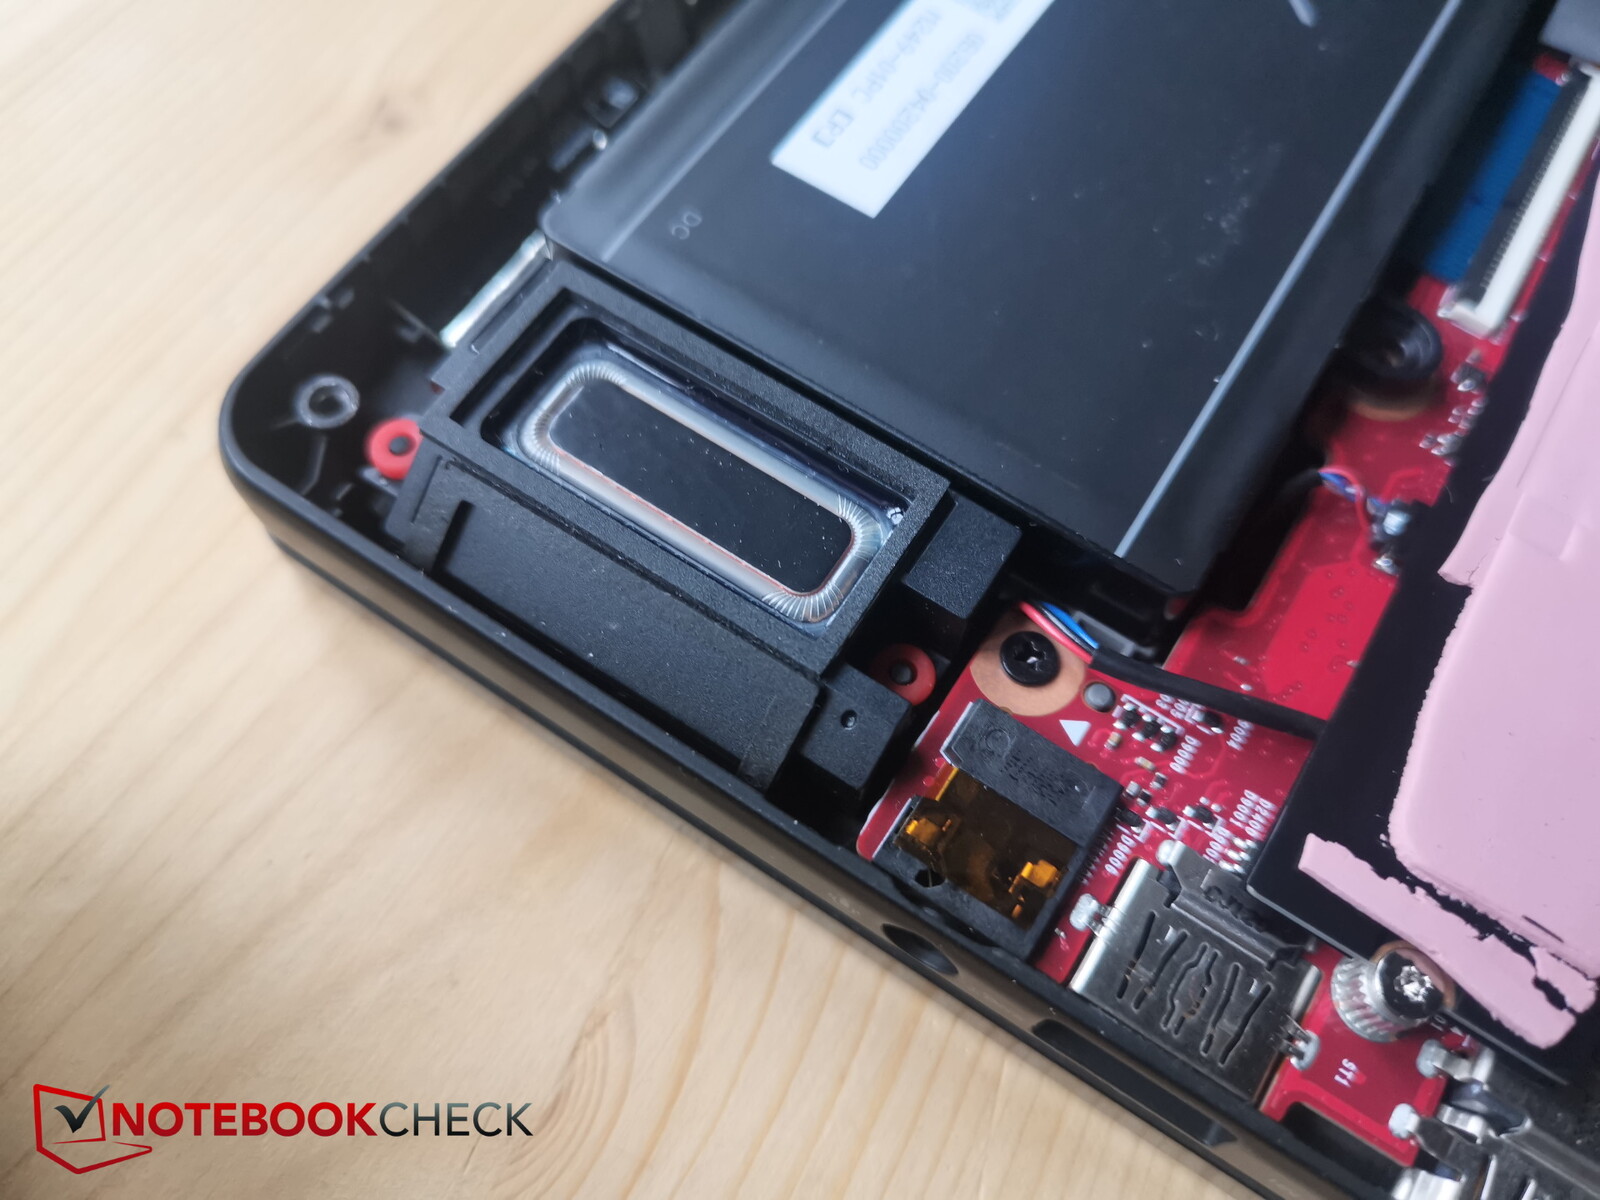
Na base da unidade, 15 parafusos de cabeça cruzada aguardam a remoção. Infelizmente, sete (!) deles se sentam debaixo de rolhas de borracha coladas, cuja remoção é trabalhosa, incômoda e se apresenta como desnecessária e desinteressante.
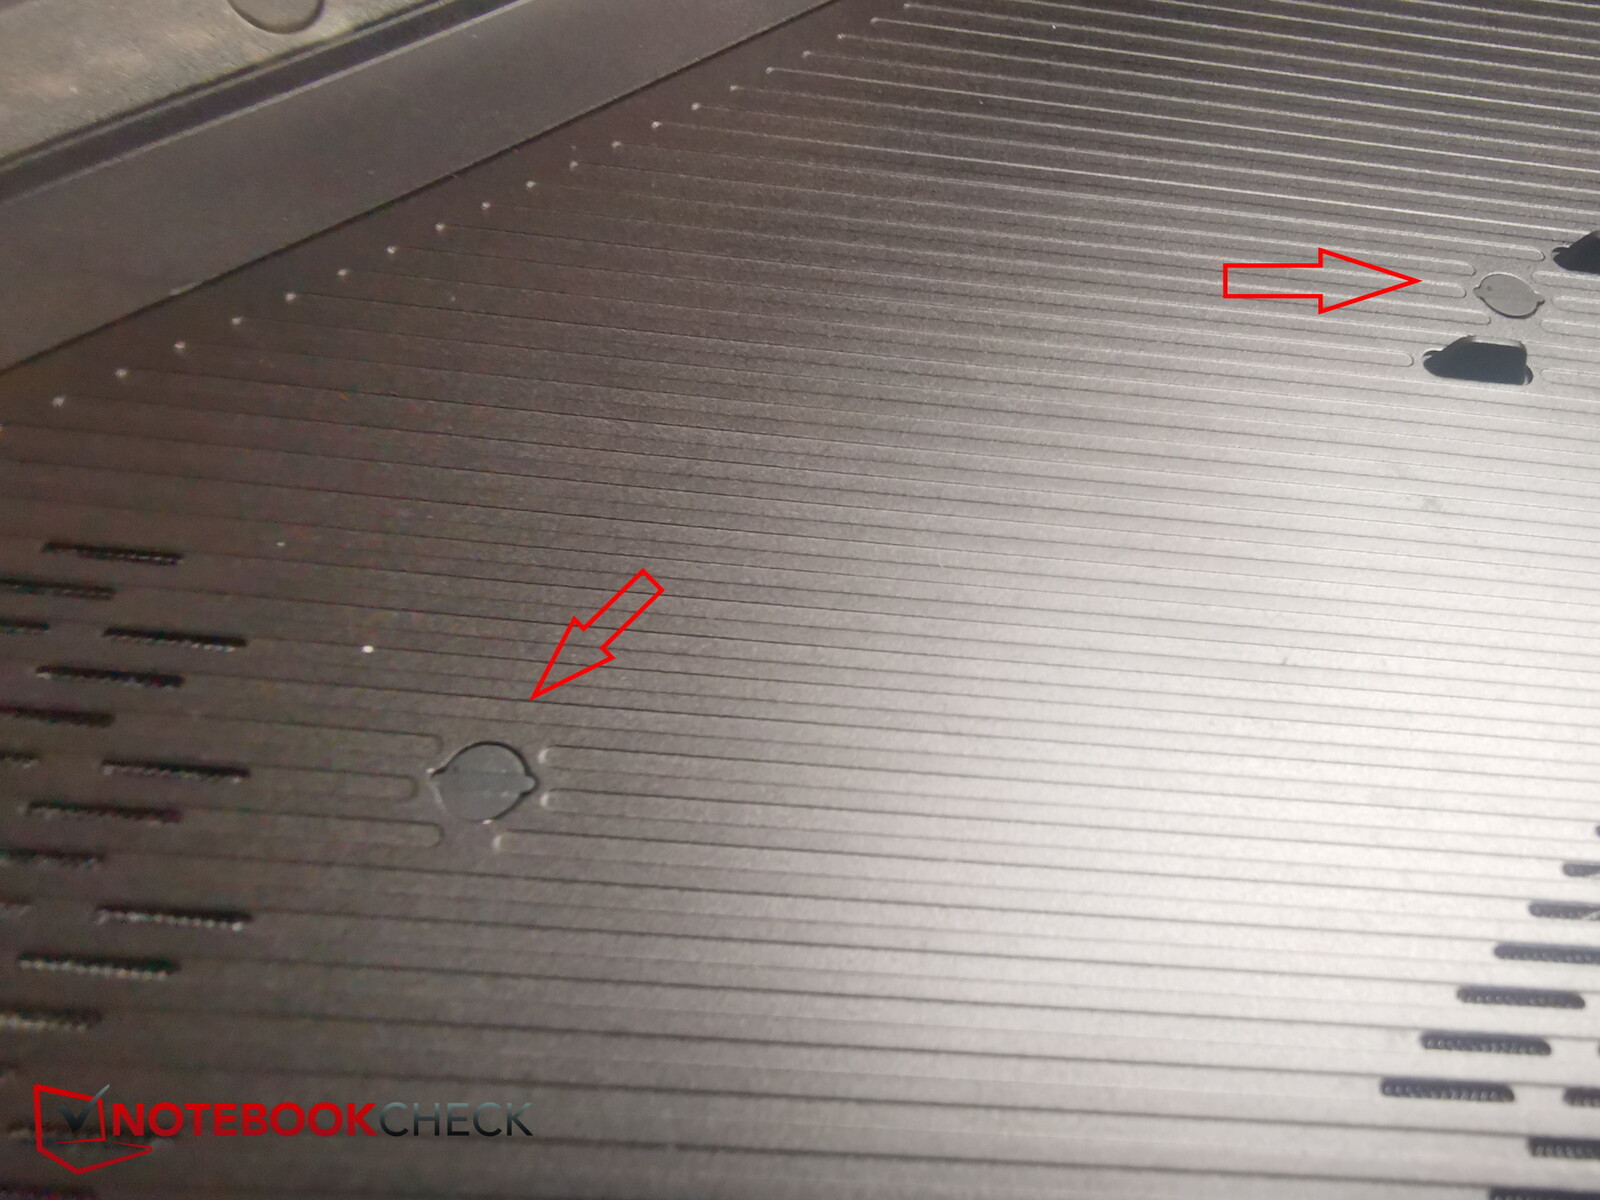
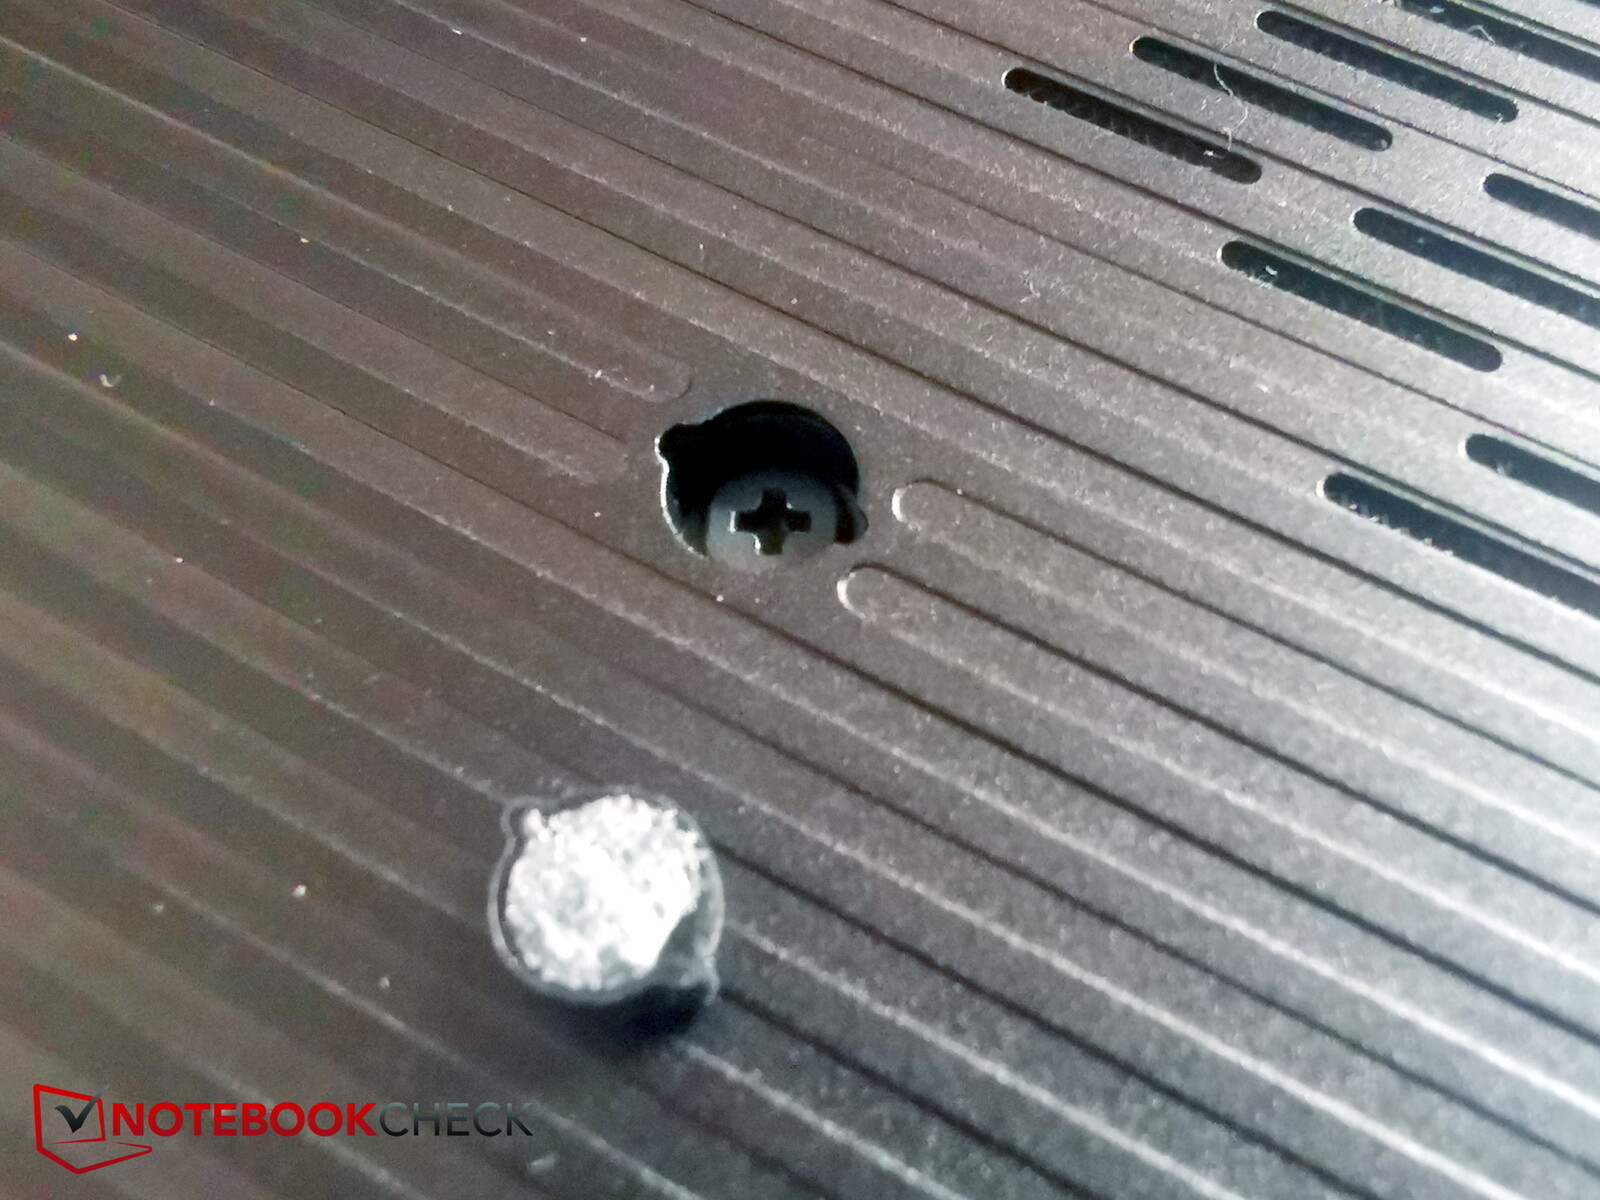
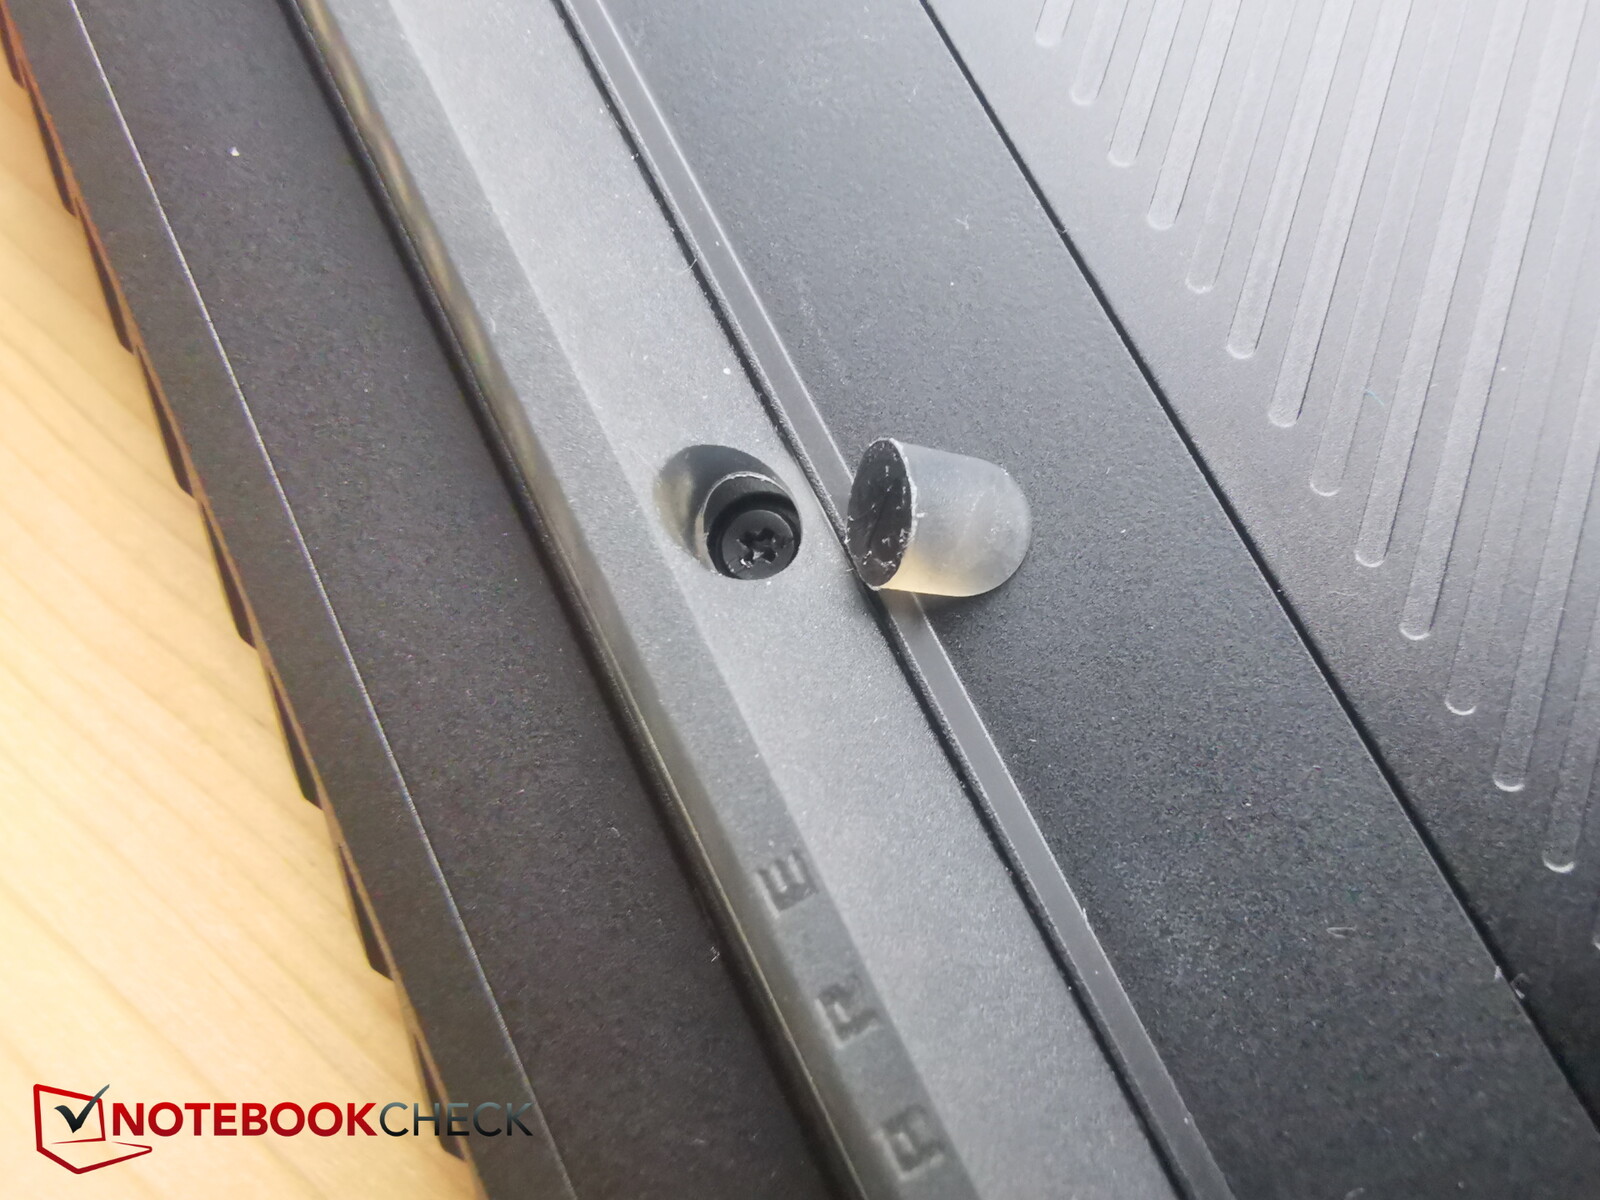
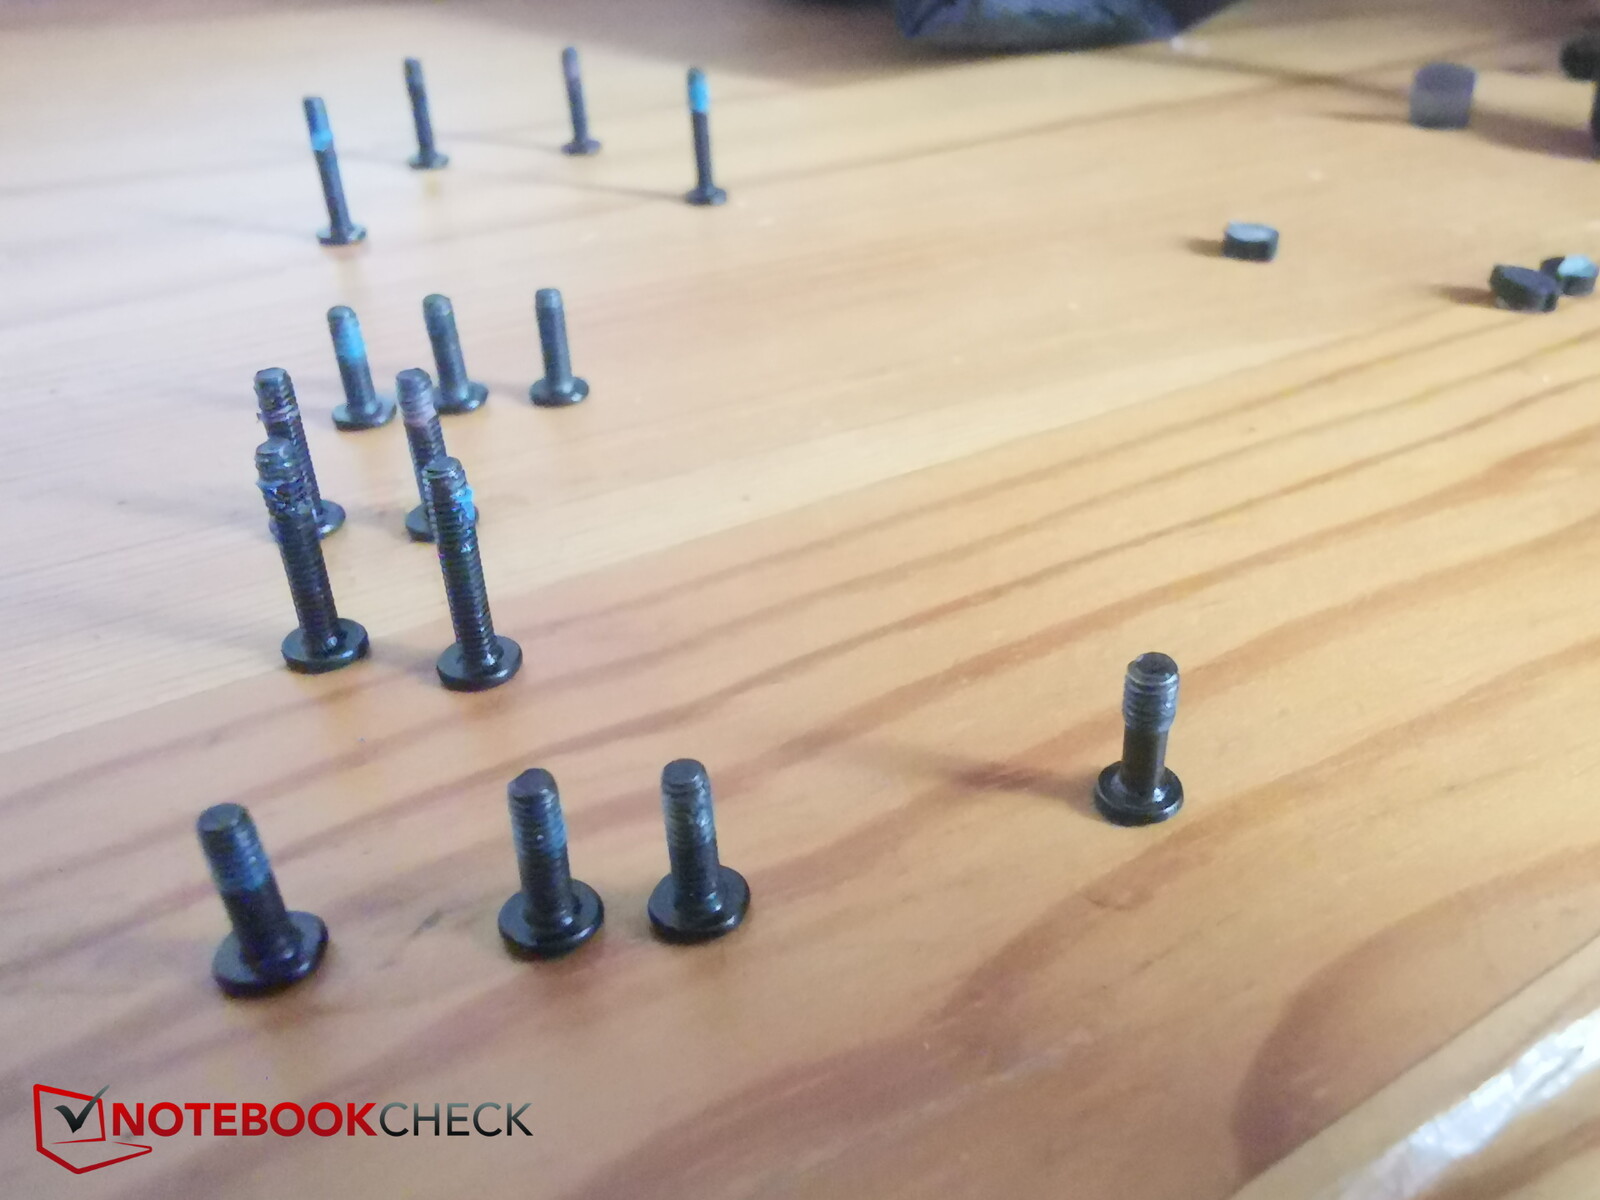
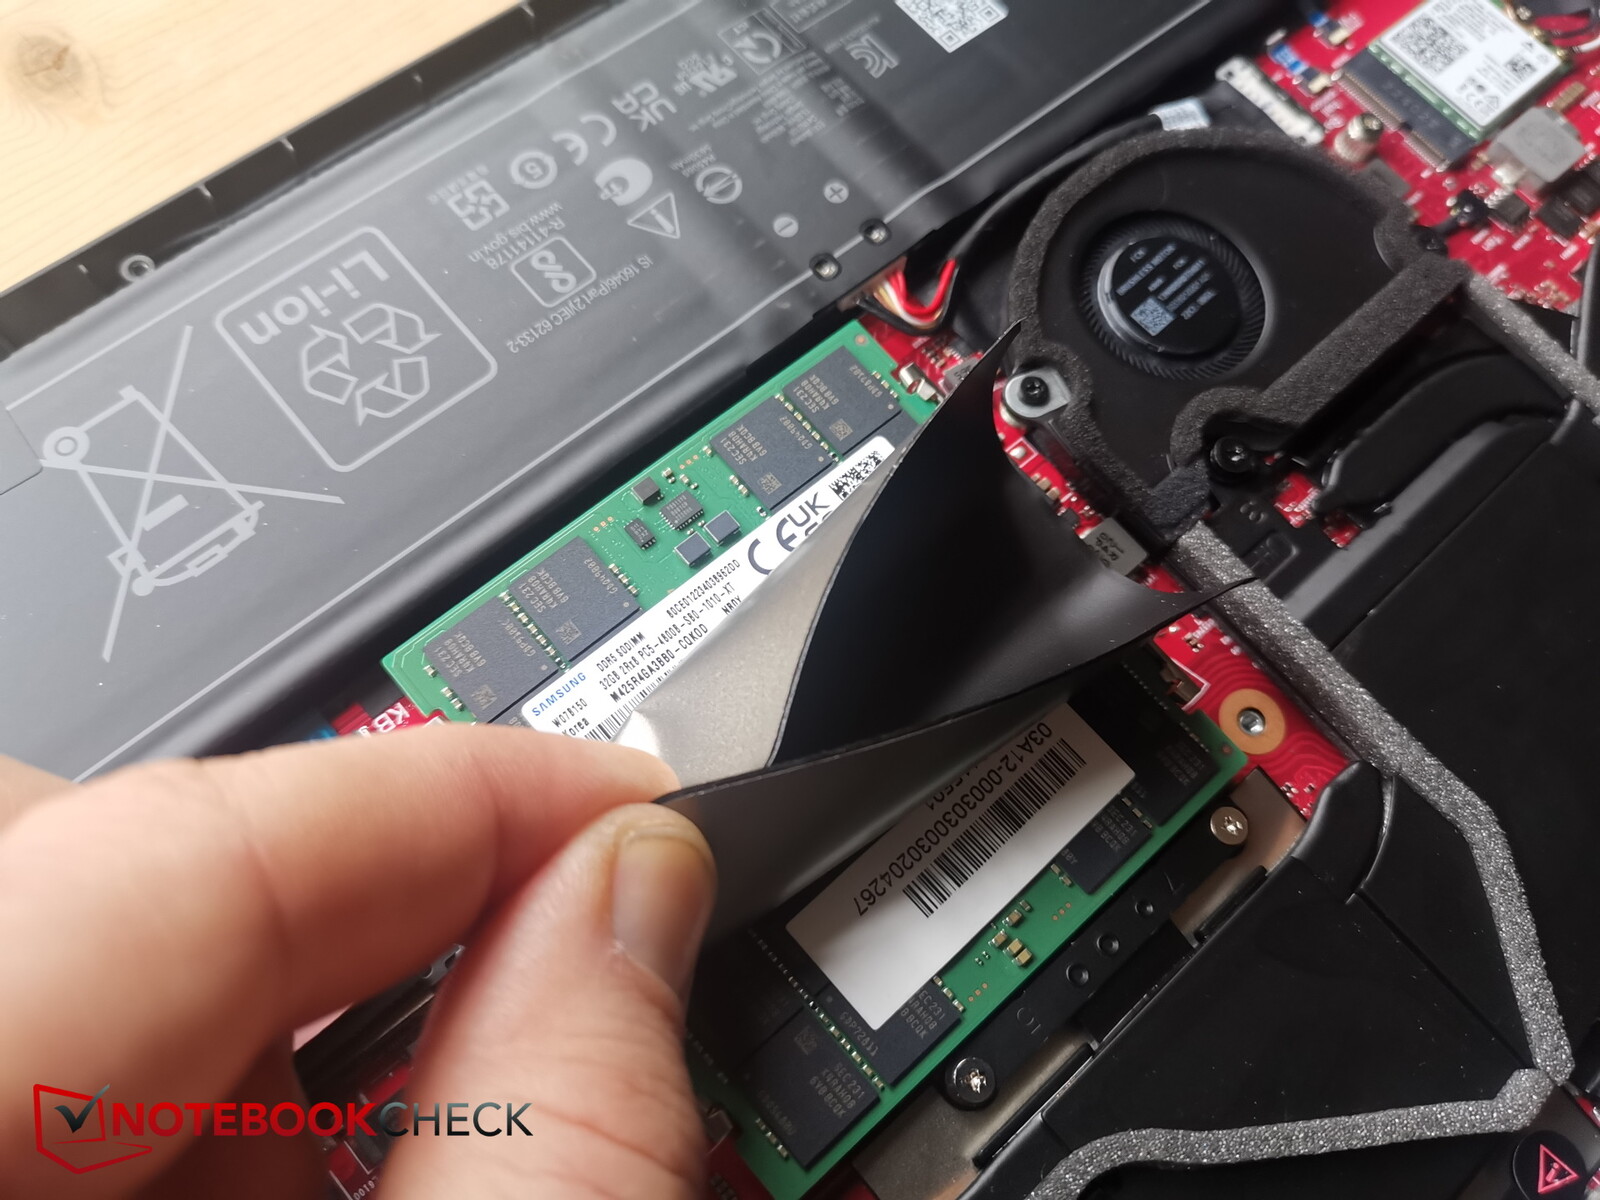
Ao todo, descobrimos 4 comprimentos/tipos diferentes de parafusos! Portanto, vale a pena notar quais pertencem aonde. Junto com os 7 parafusos escondidos e a RAM SO-DIMM, a M16 pode ser considerada difícil de ser atualizada ou reparada.
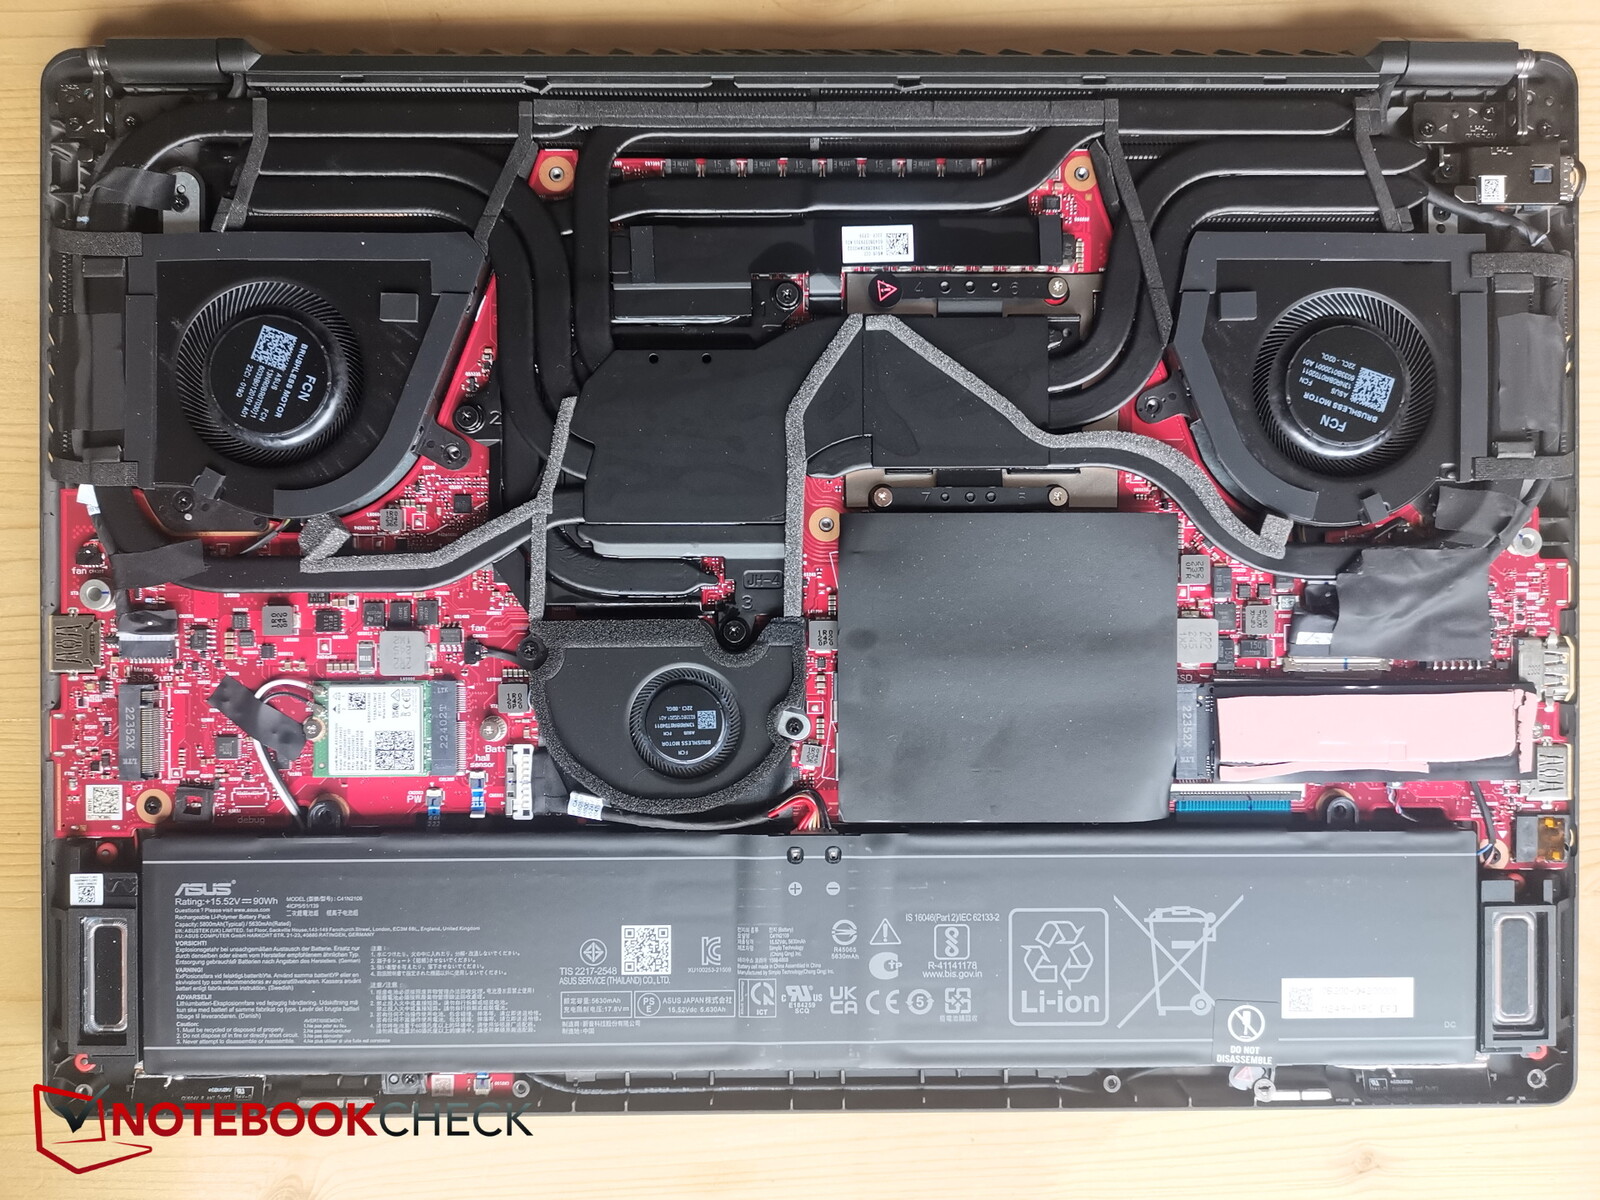
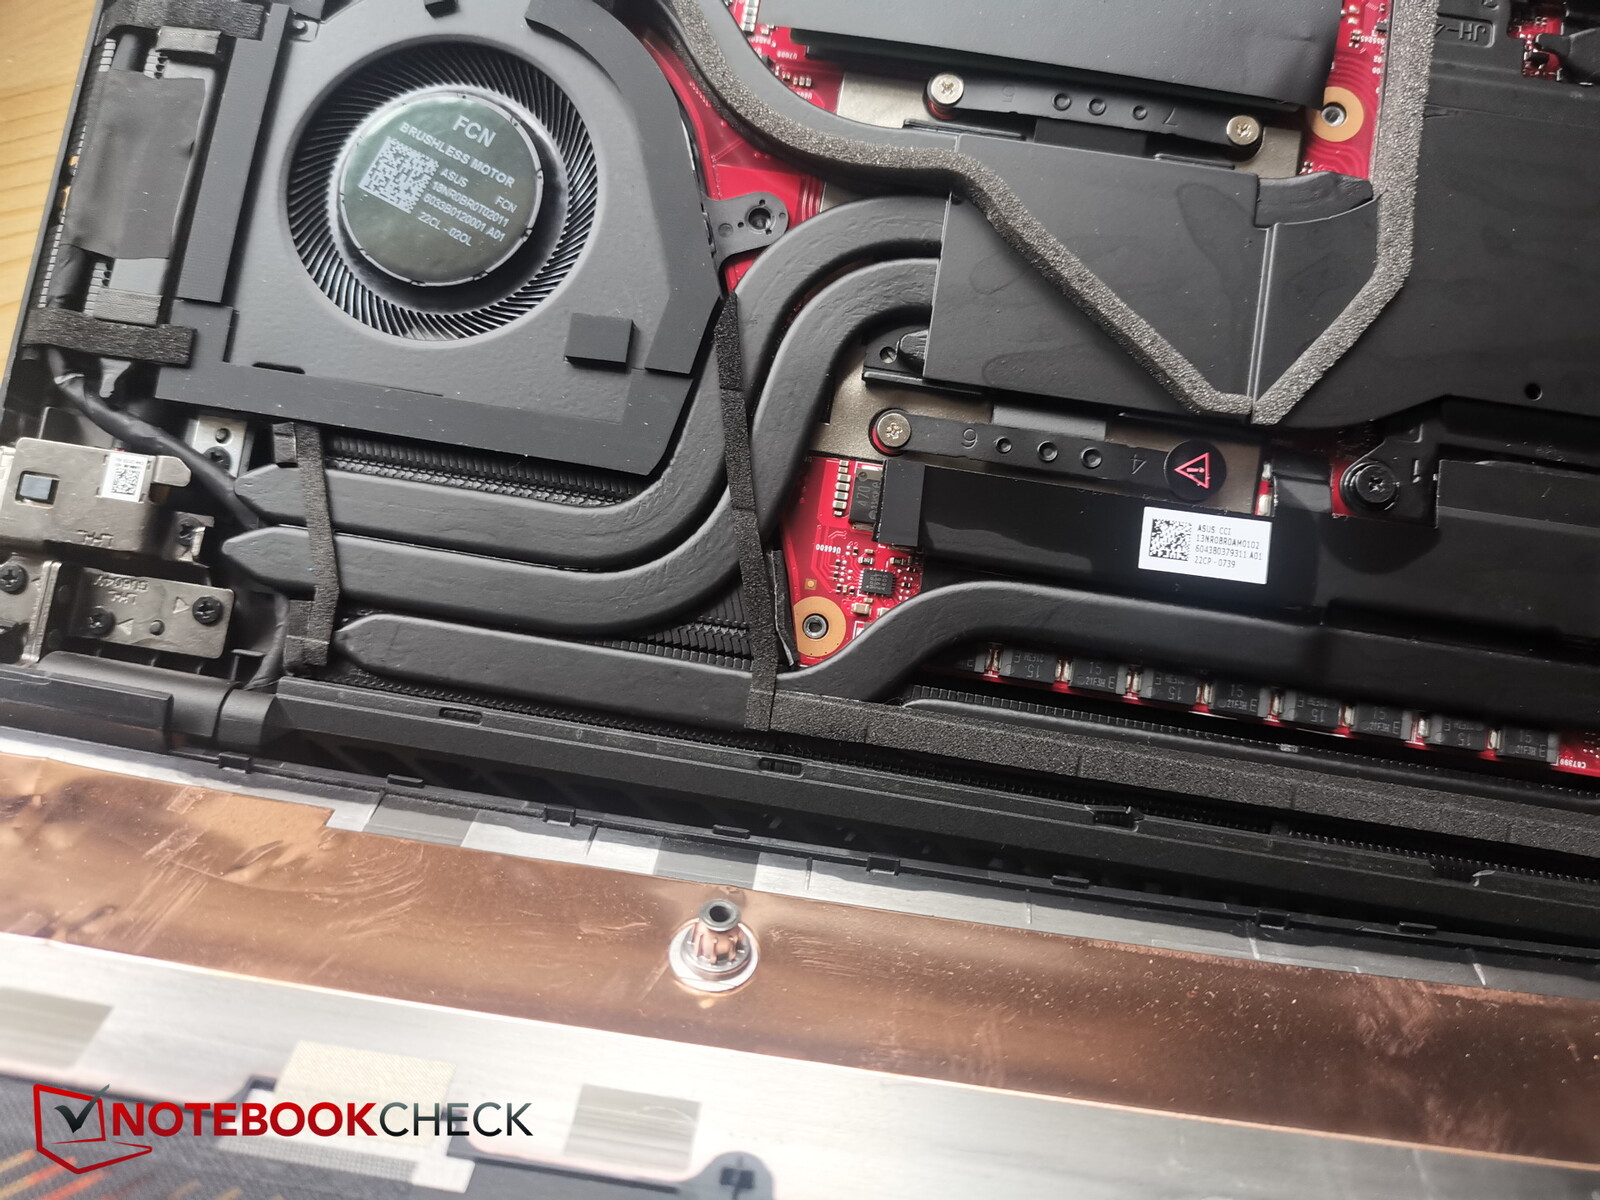
Pelo menos a placa de base pode ser facilmente aberta. Internamente, é possível acessar os três ventiladores, a bateria, o SSD, o segundo slot M.2 SSD, o módulo WiFi substituível. bem como o slot SO-DIMM RAM.
O sistema de resfriamento consiste de 2 ventiladores de tamanho normal e um ventilador pequeno adicional que, presumivelmente, fica em cima da unidade gráfica. O SSD possui uma almofada de resfriamento que parece bastante desgastada em nosso modelo de revisão.
Garantia
Os laptops da Gigabyte vêm com uma garantia de 24 meses.
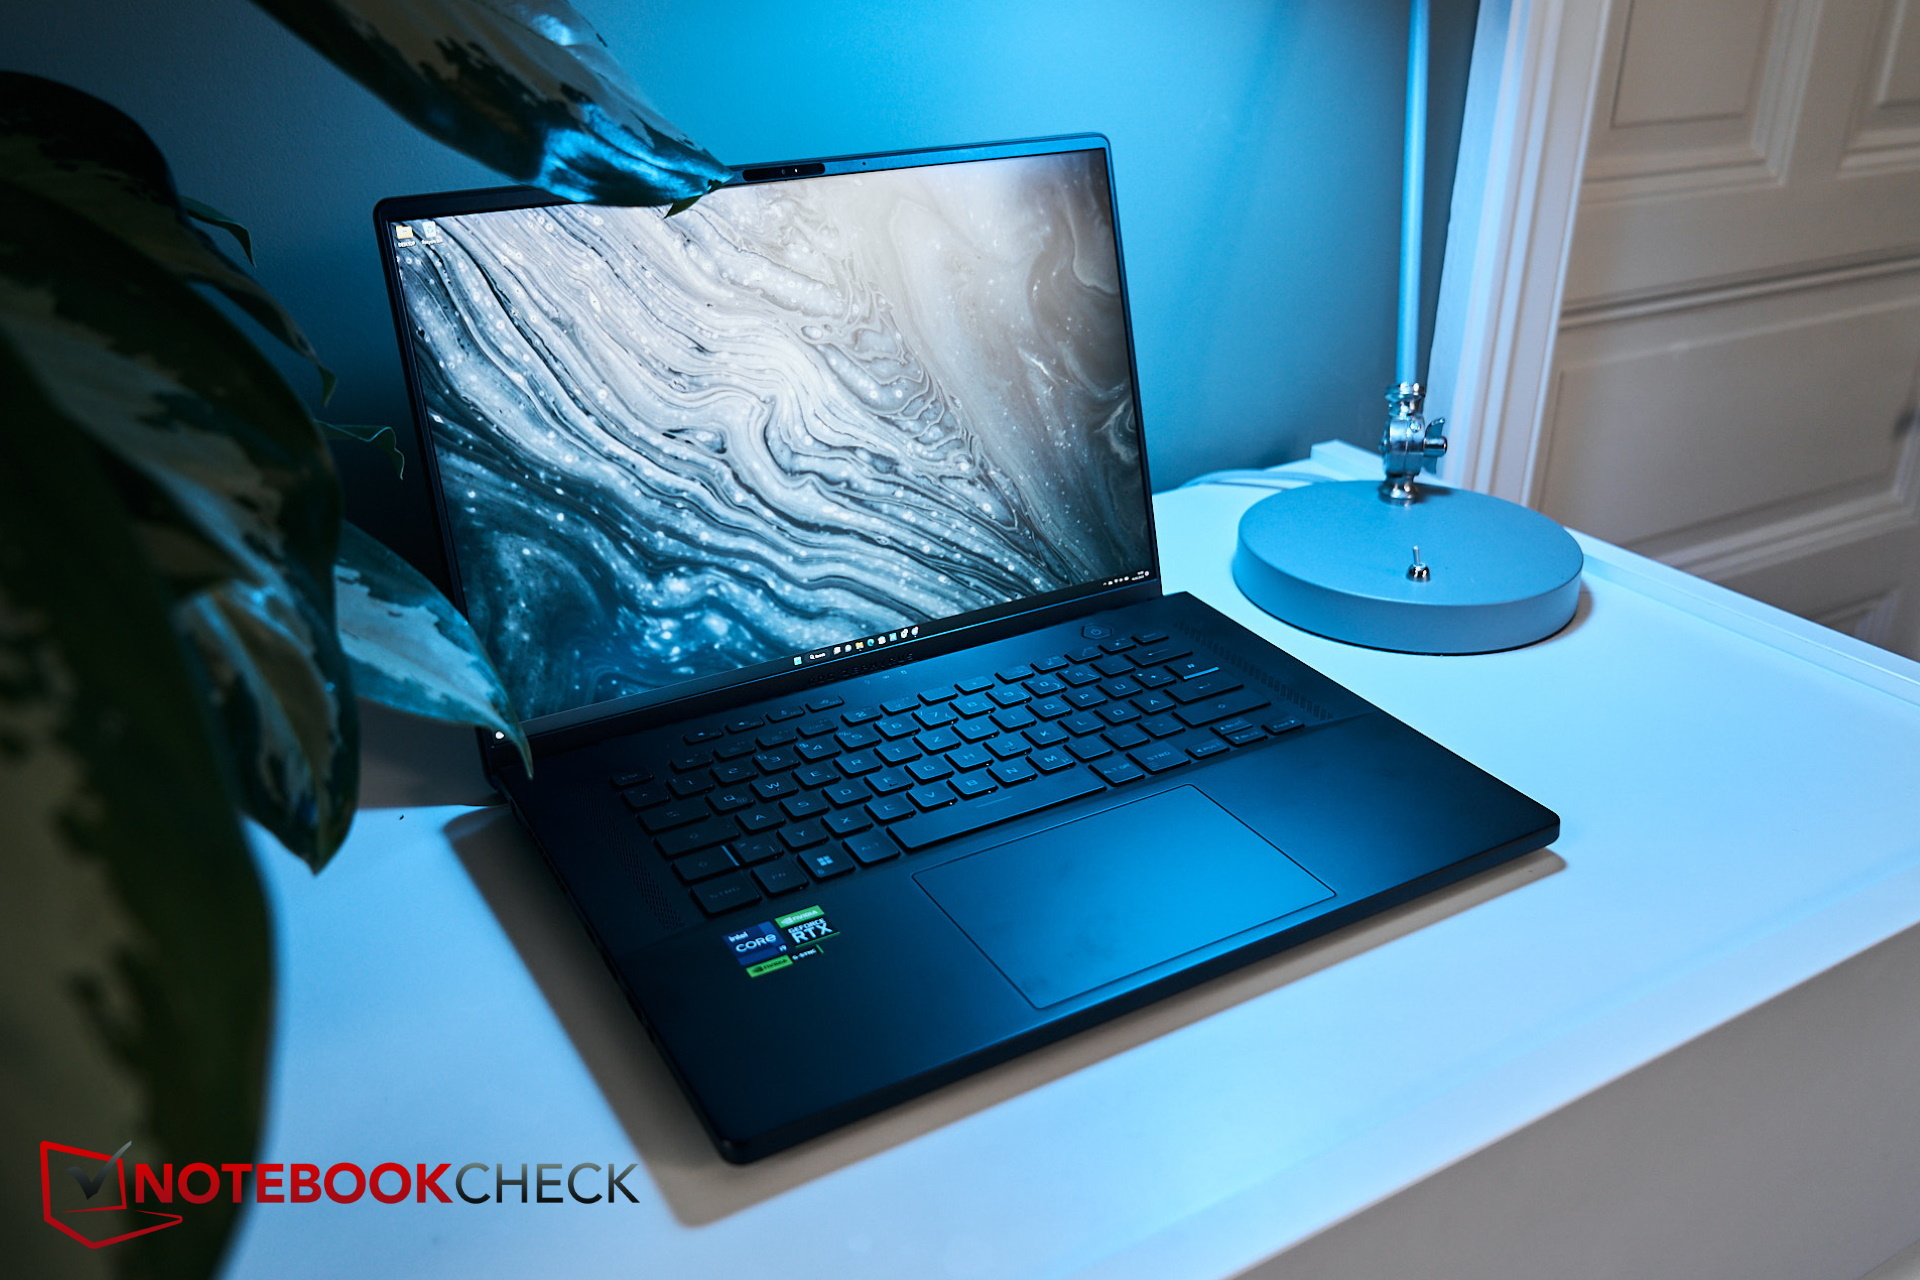
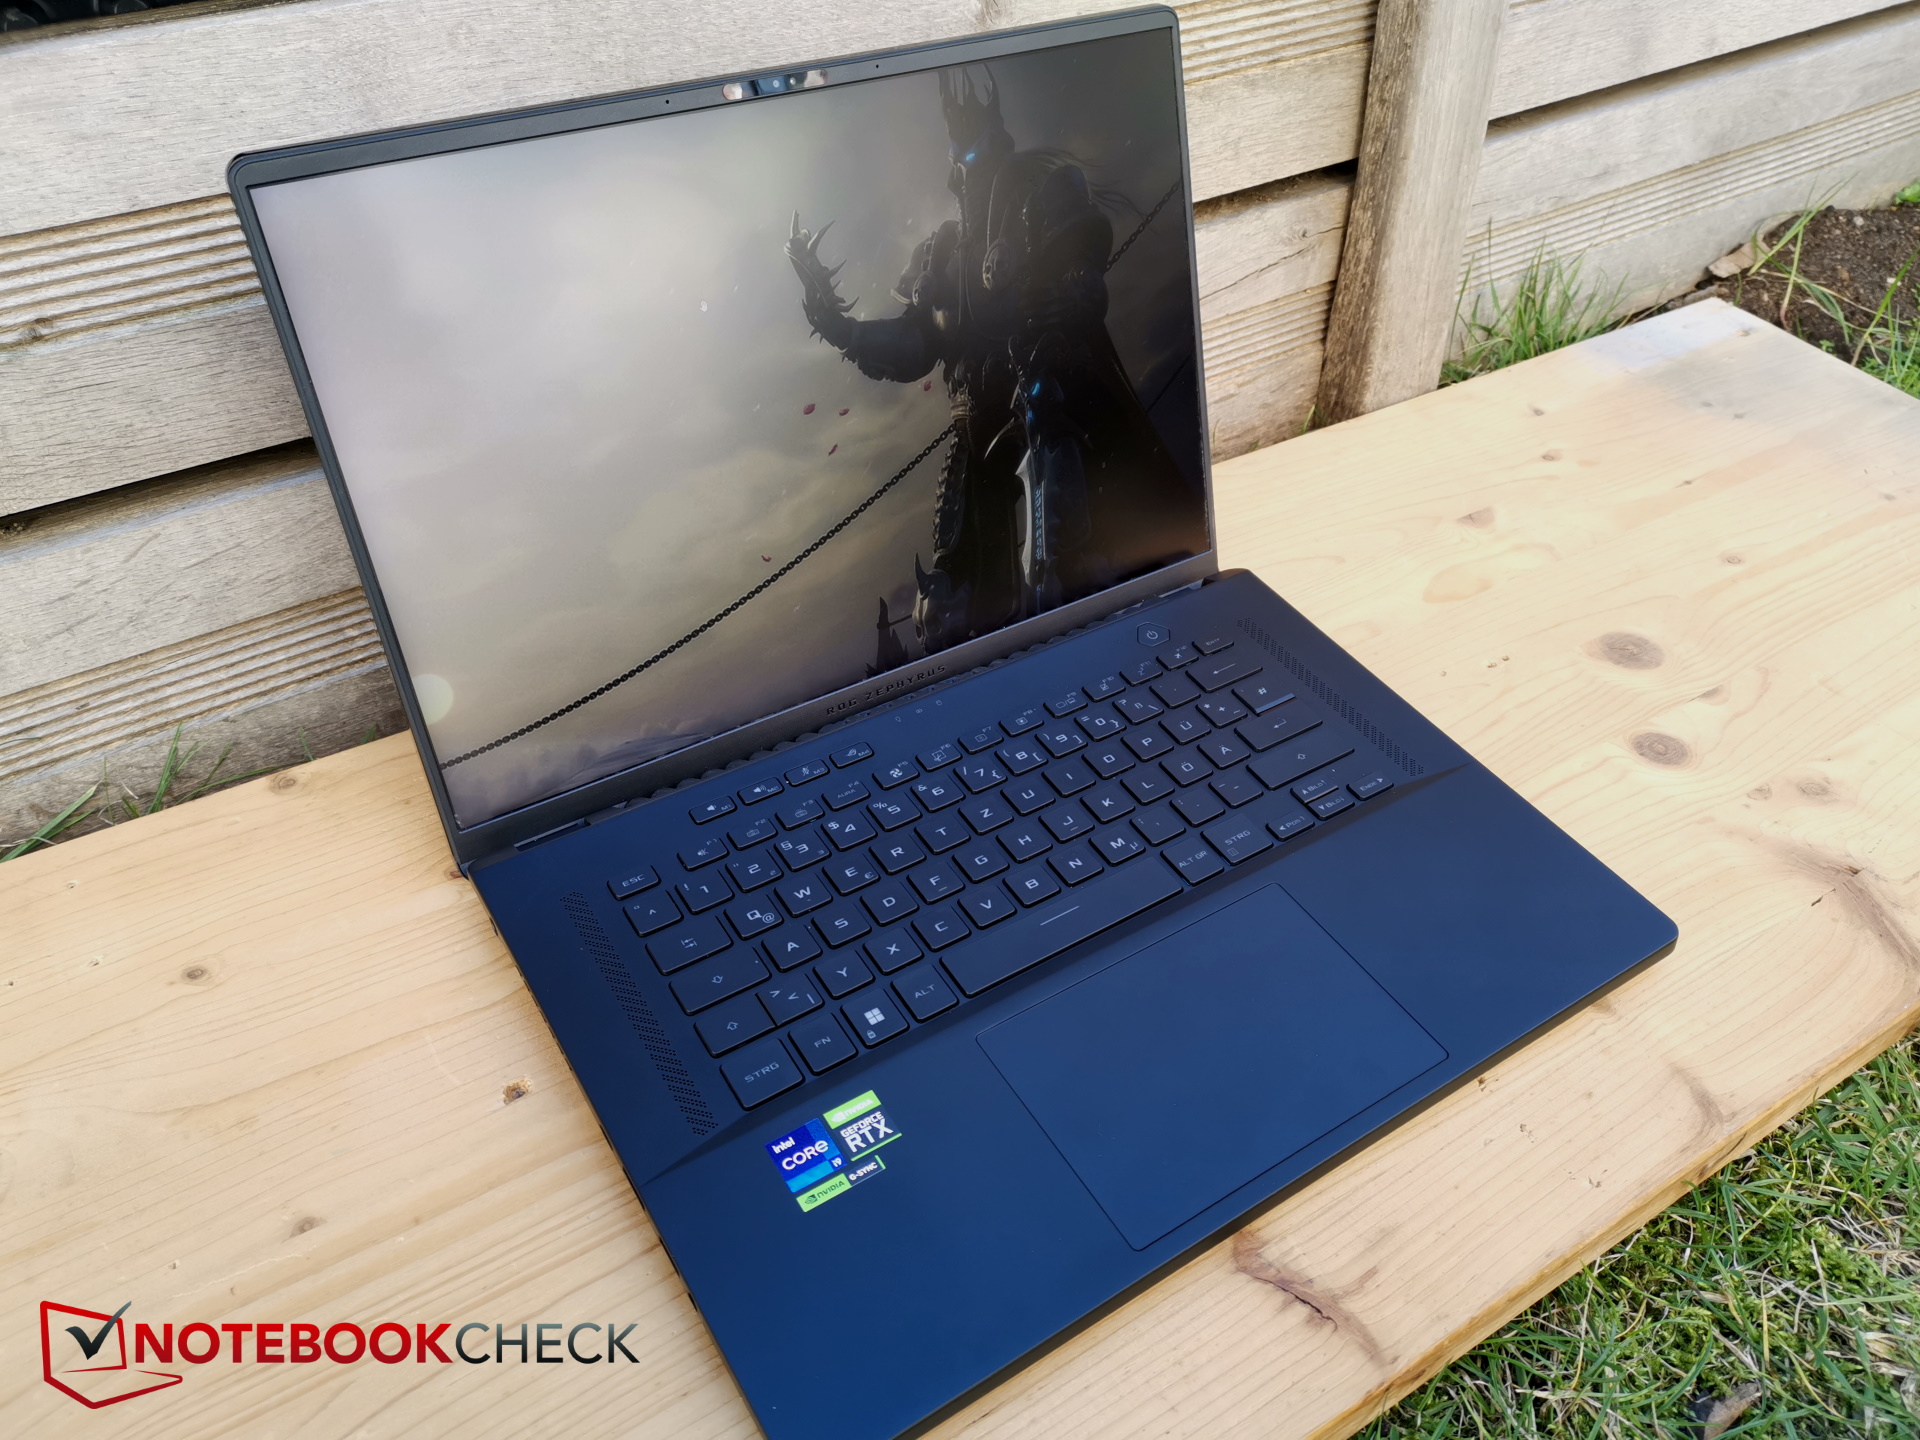
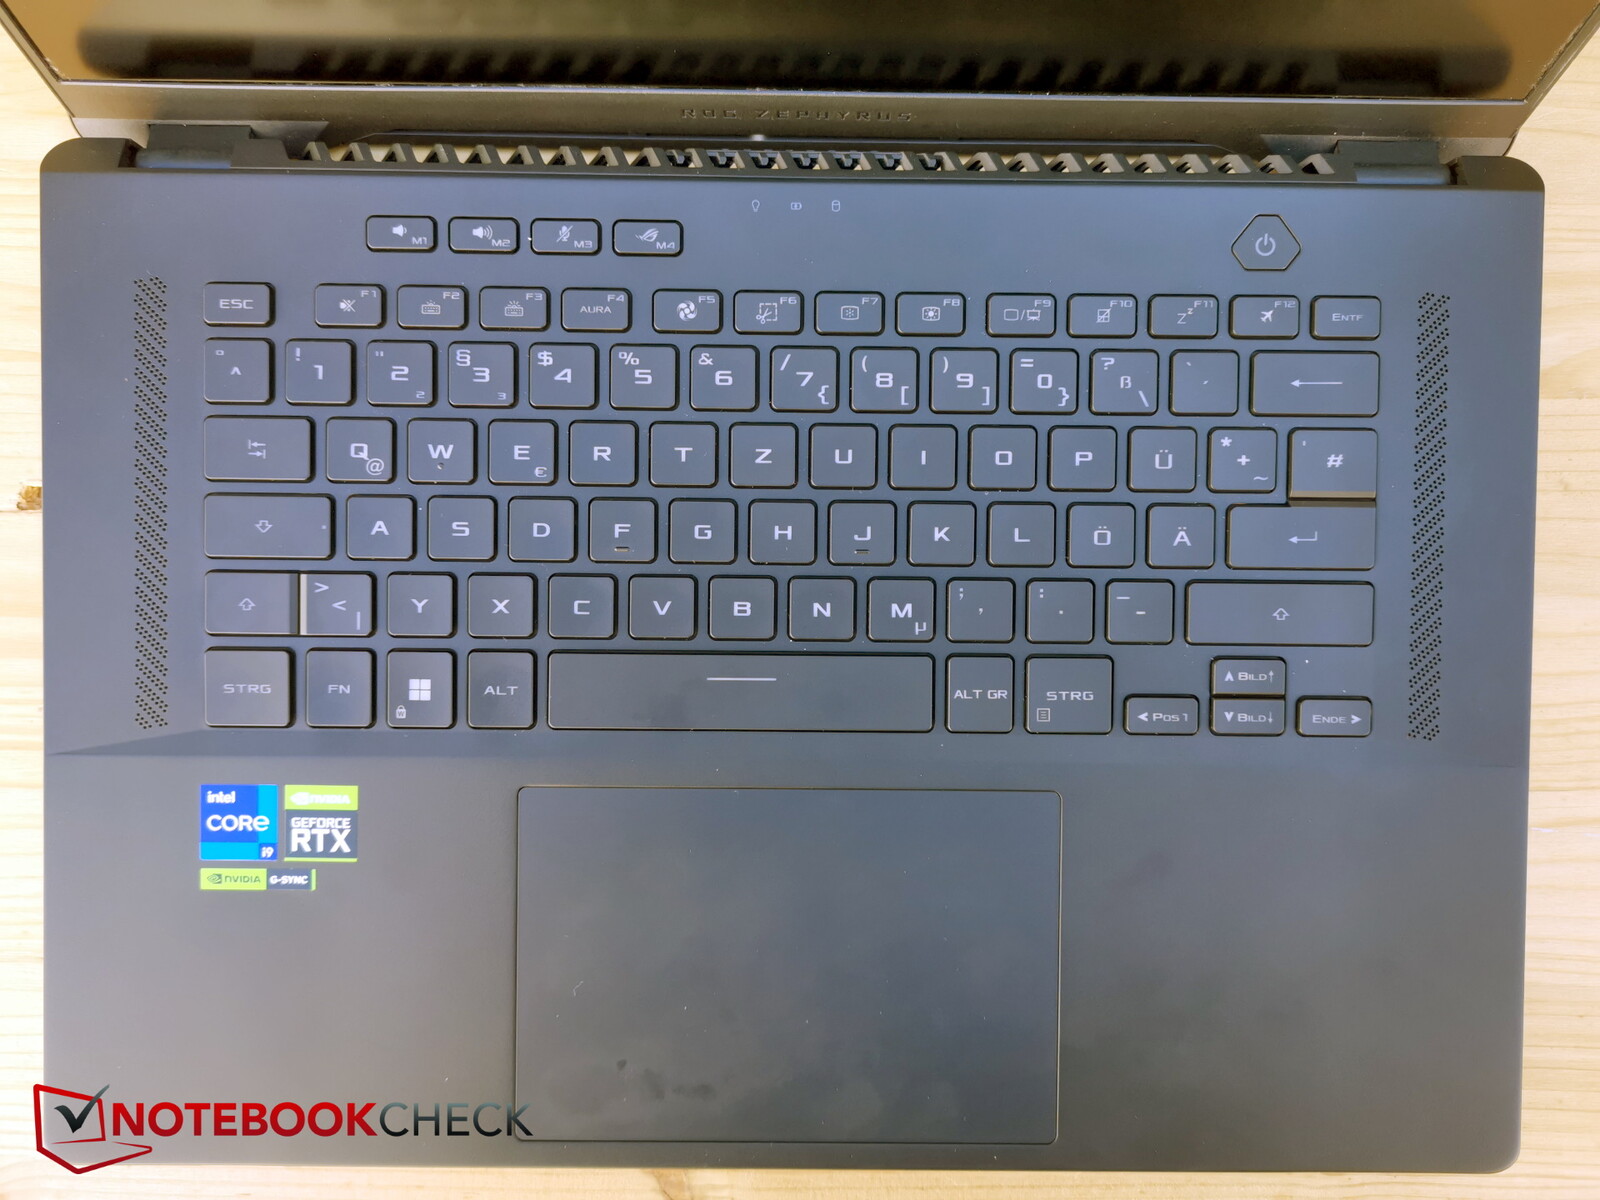
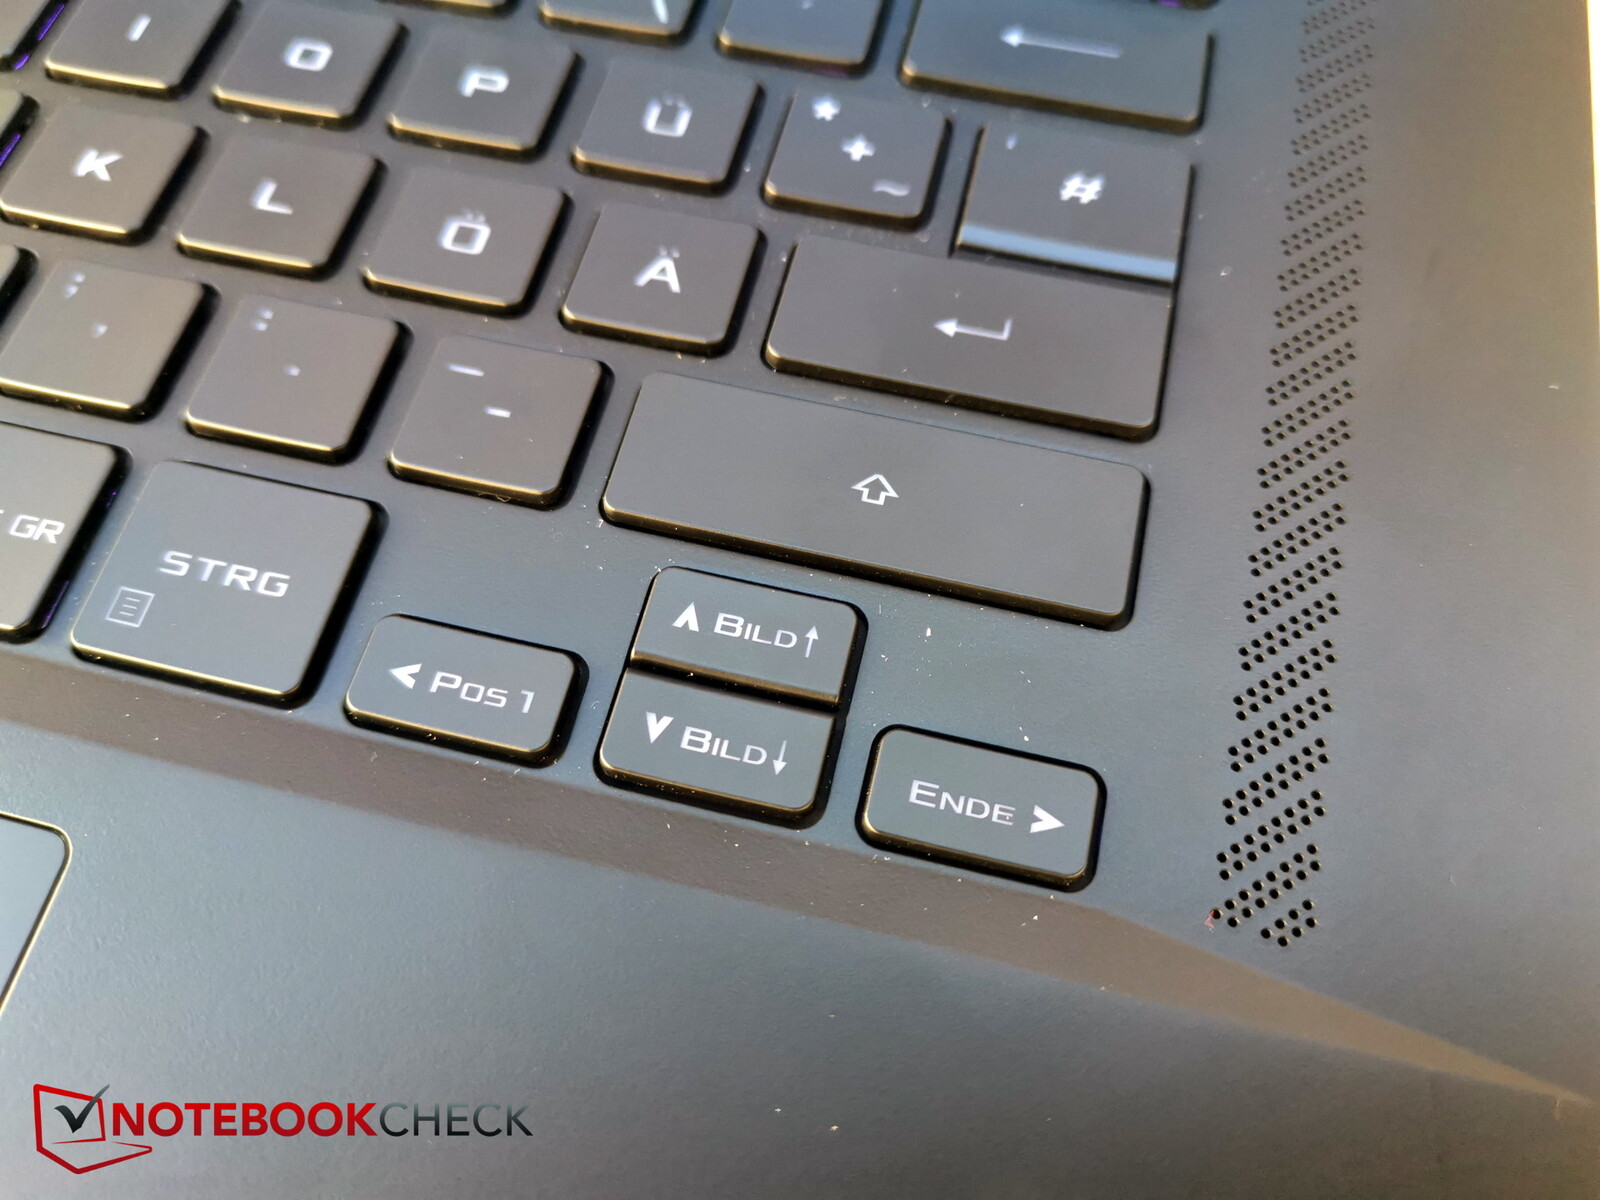
Dispositivos de entrada - Teclas um pouco rasas e um grande touchpad
Teclado
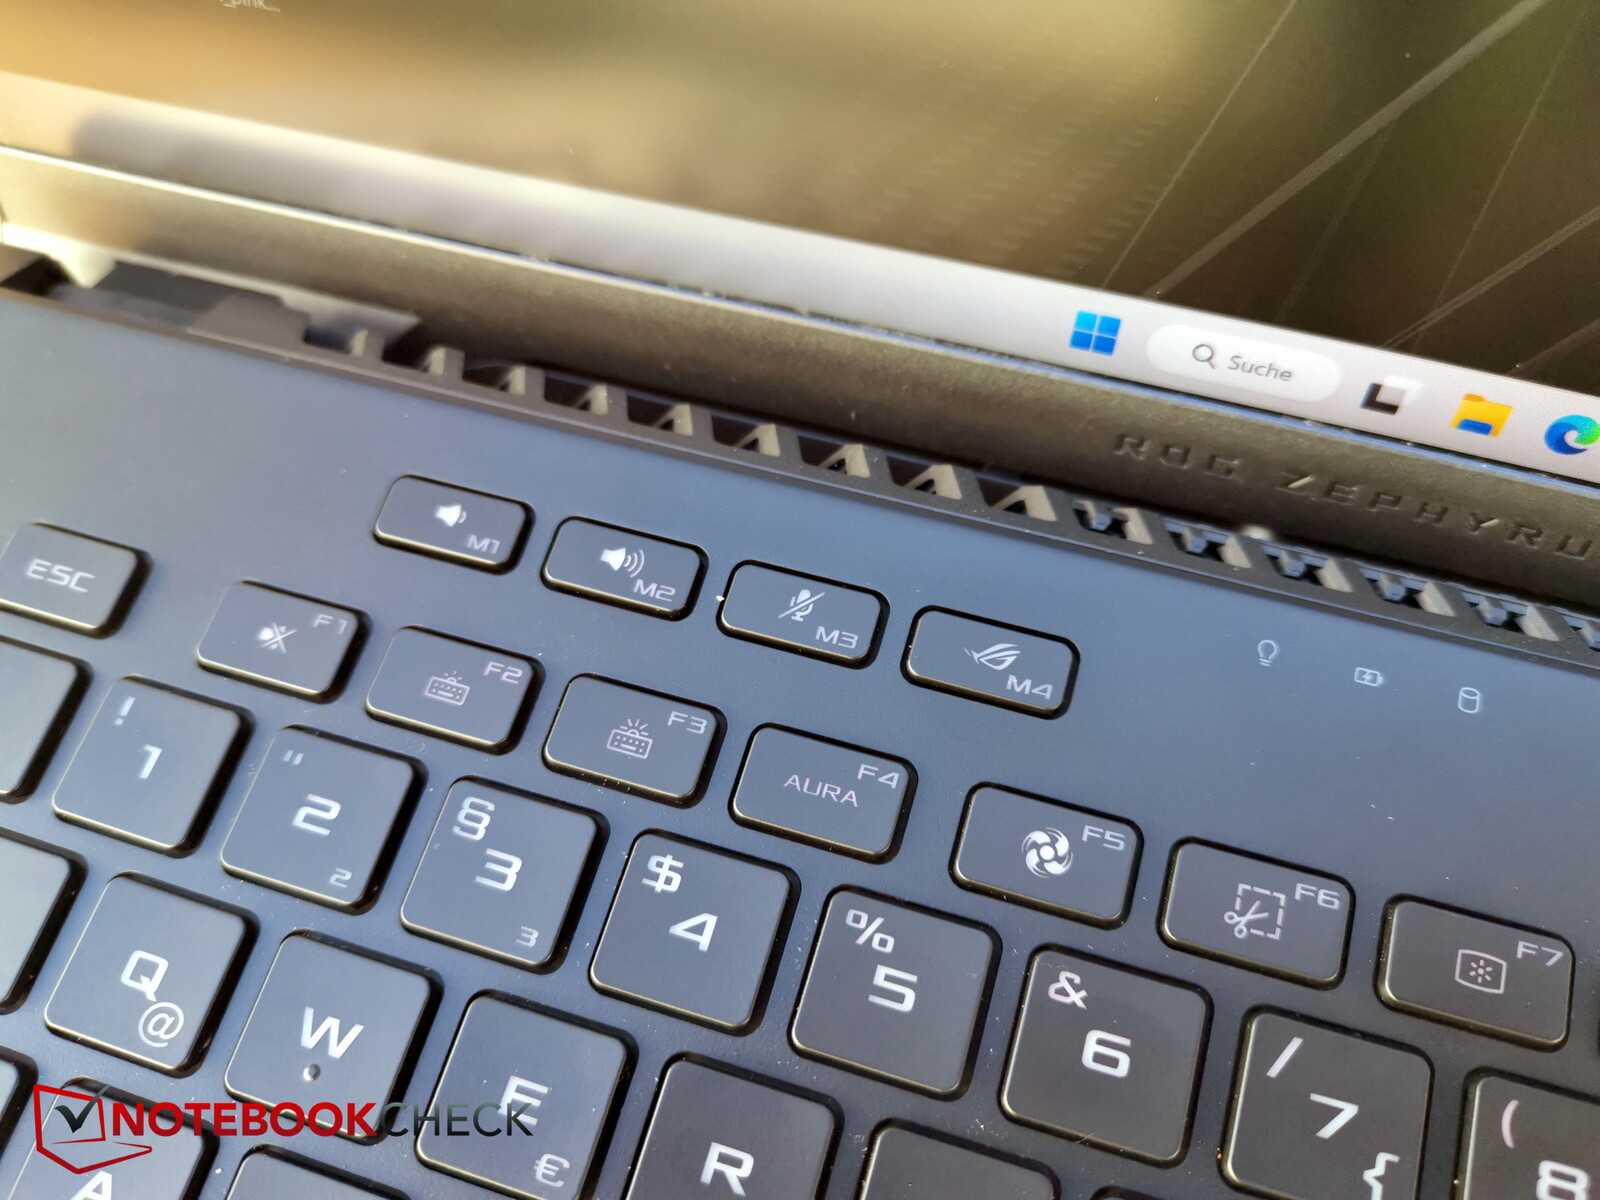
O layout parece muito espaçoso. Na parte superior esquerda, o Asus incluiu quatro teclas especiais adicionais para controle de volume, o microfone e o centro de controle do Asus. Estas também podem ser configuradas manualmente.
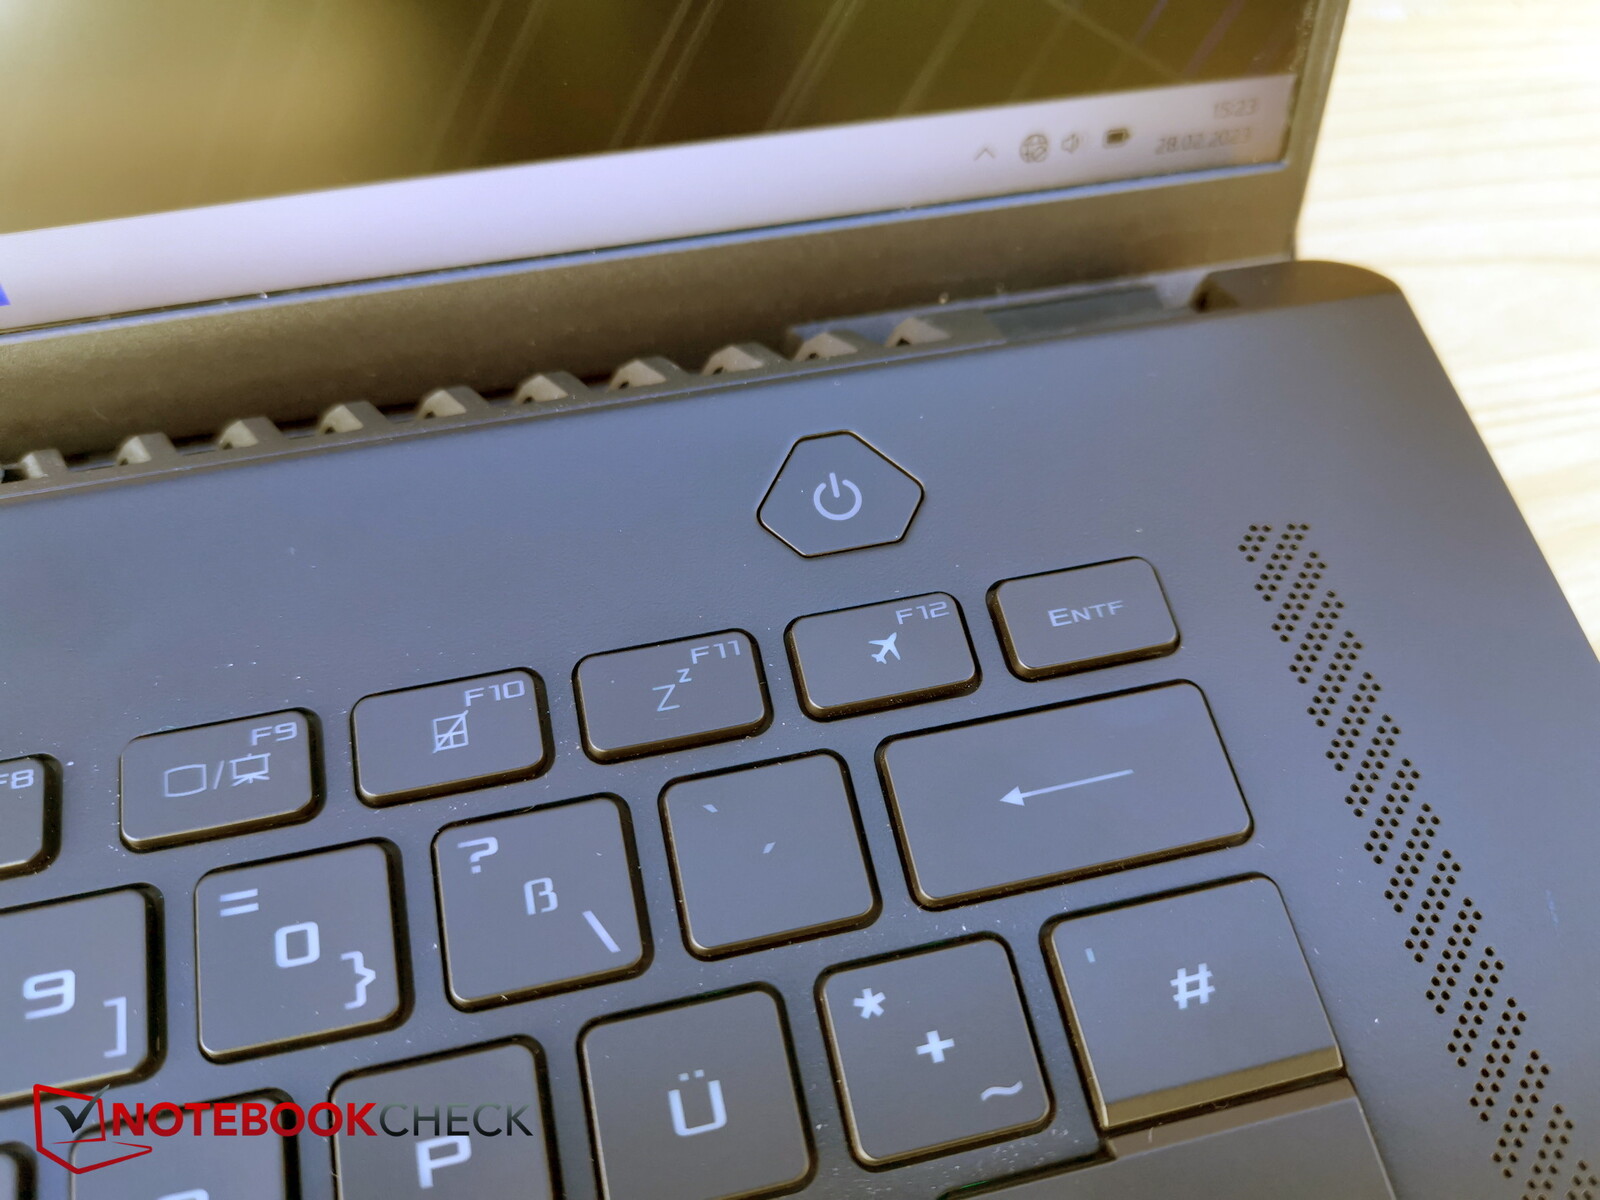
Infelizmente, as teclas de seta são muito estreitas, e o botão de energia, típico para este tipo de teclado, é uma tecla separada. Apesar de ser um dispositivo de 16 polegadas, não existe um teclado numérico.
As chaves possuem viagens muito curtas e o feedback é um pouco raso, mas ainda assim suficientemente preciso. Em geral, embora a experiência de digitação seja bastante boa, teríamos preferido chaves um pouco mais crocantes. O ruído de digitação é moderado.
A luz de fundo de 3 níveis acende em diversas cores RGB, mas somente em uma única zona.
Touchpad
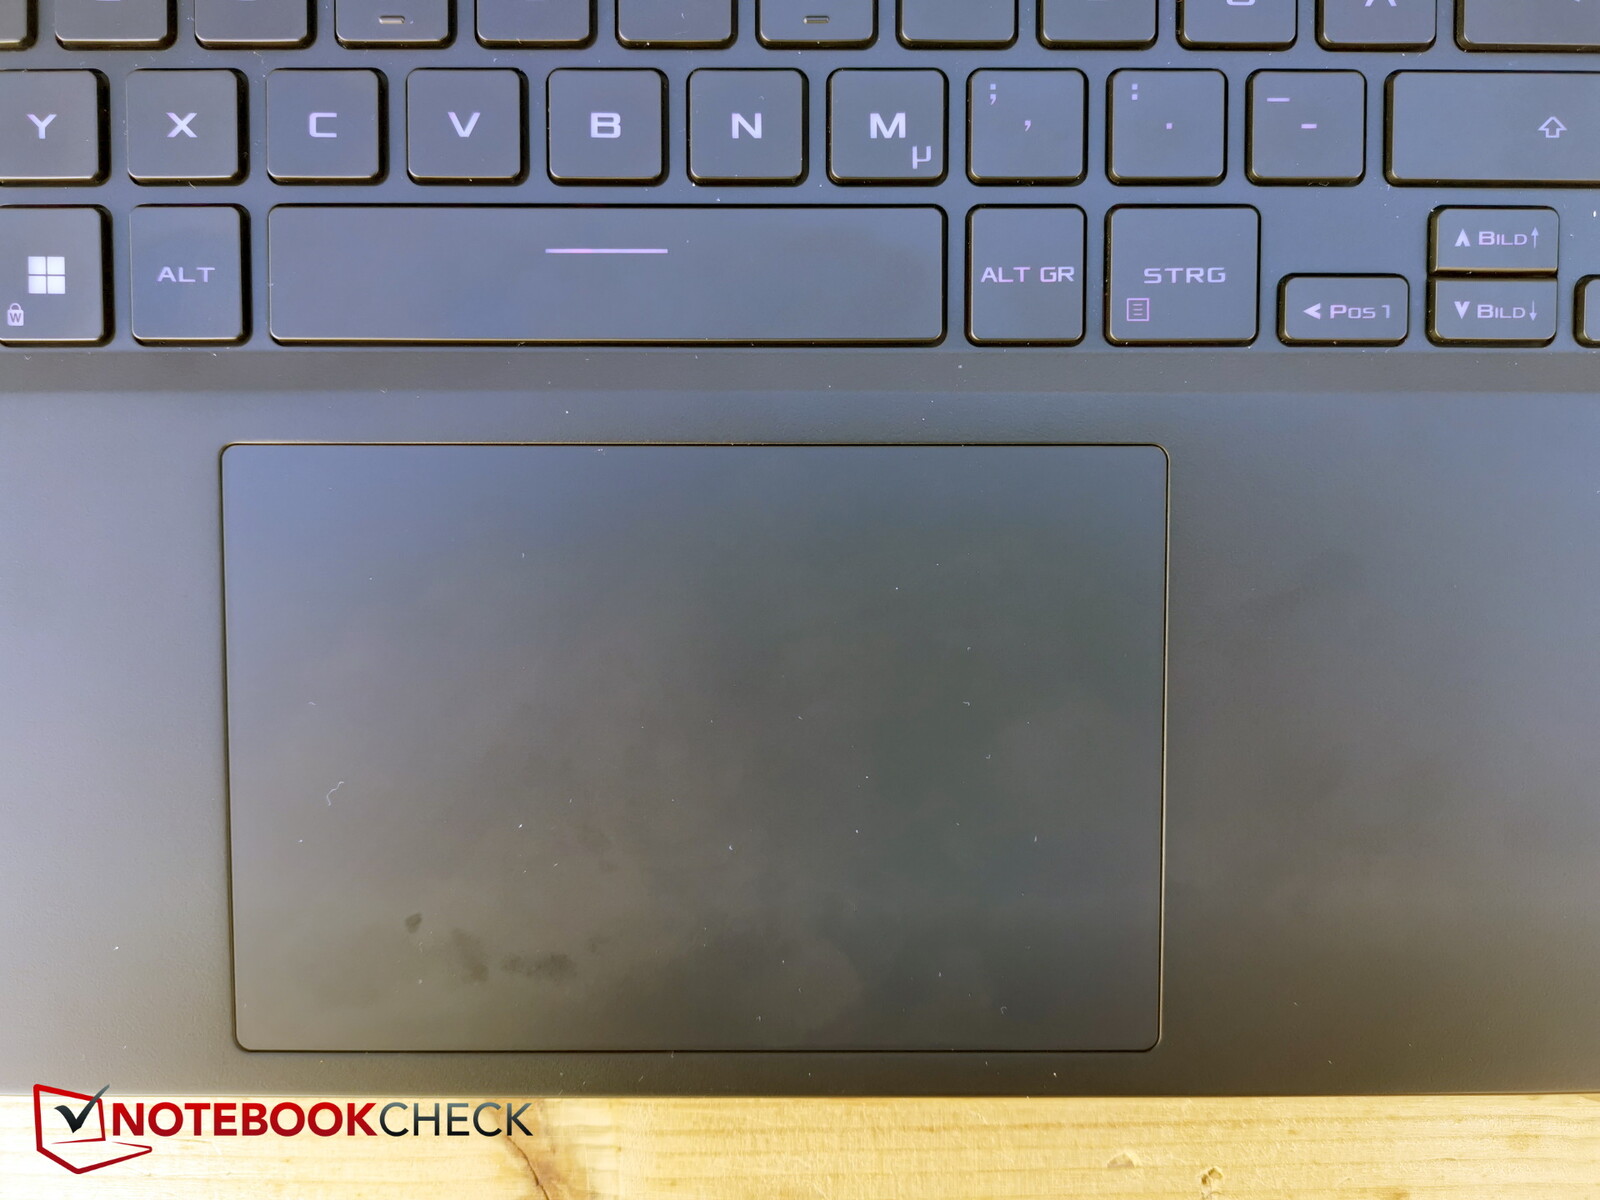
O grande touchpad (aprox. 13 x 8,5 cm) é ligeiramente deslocado para a direita e oferece uma experiência de deslize suave mesmo ao realizar movimentos mais longos.
As teclas integradas têm um ponto de pressão curto, mas bom, com feedback claro. Os ruídos de clique podem ser descritos como silenciosos a moderados.
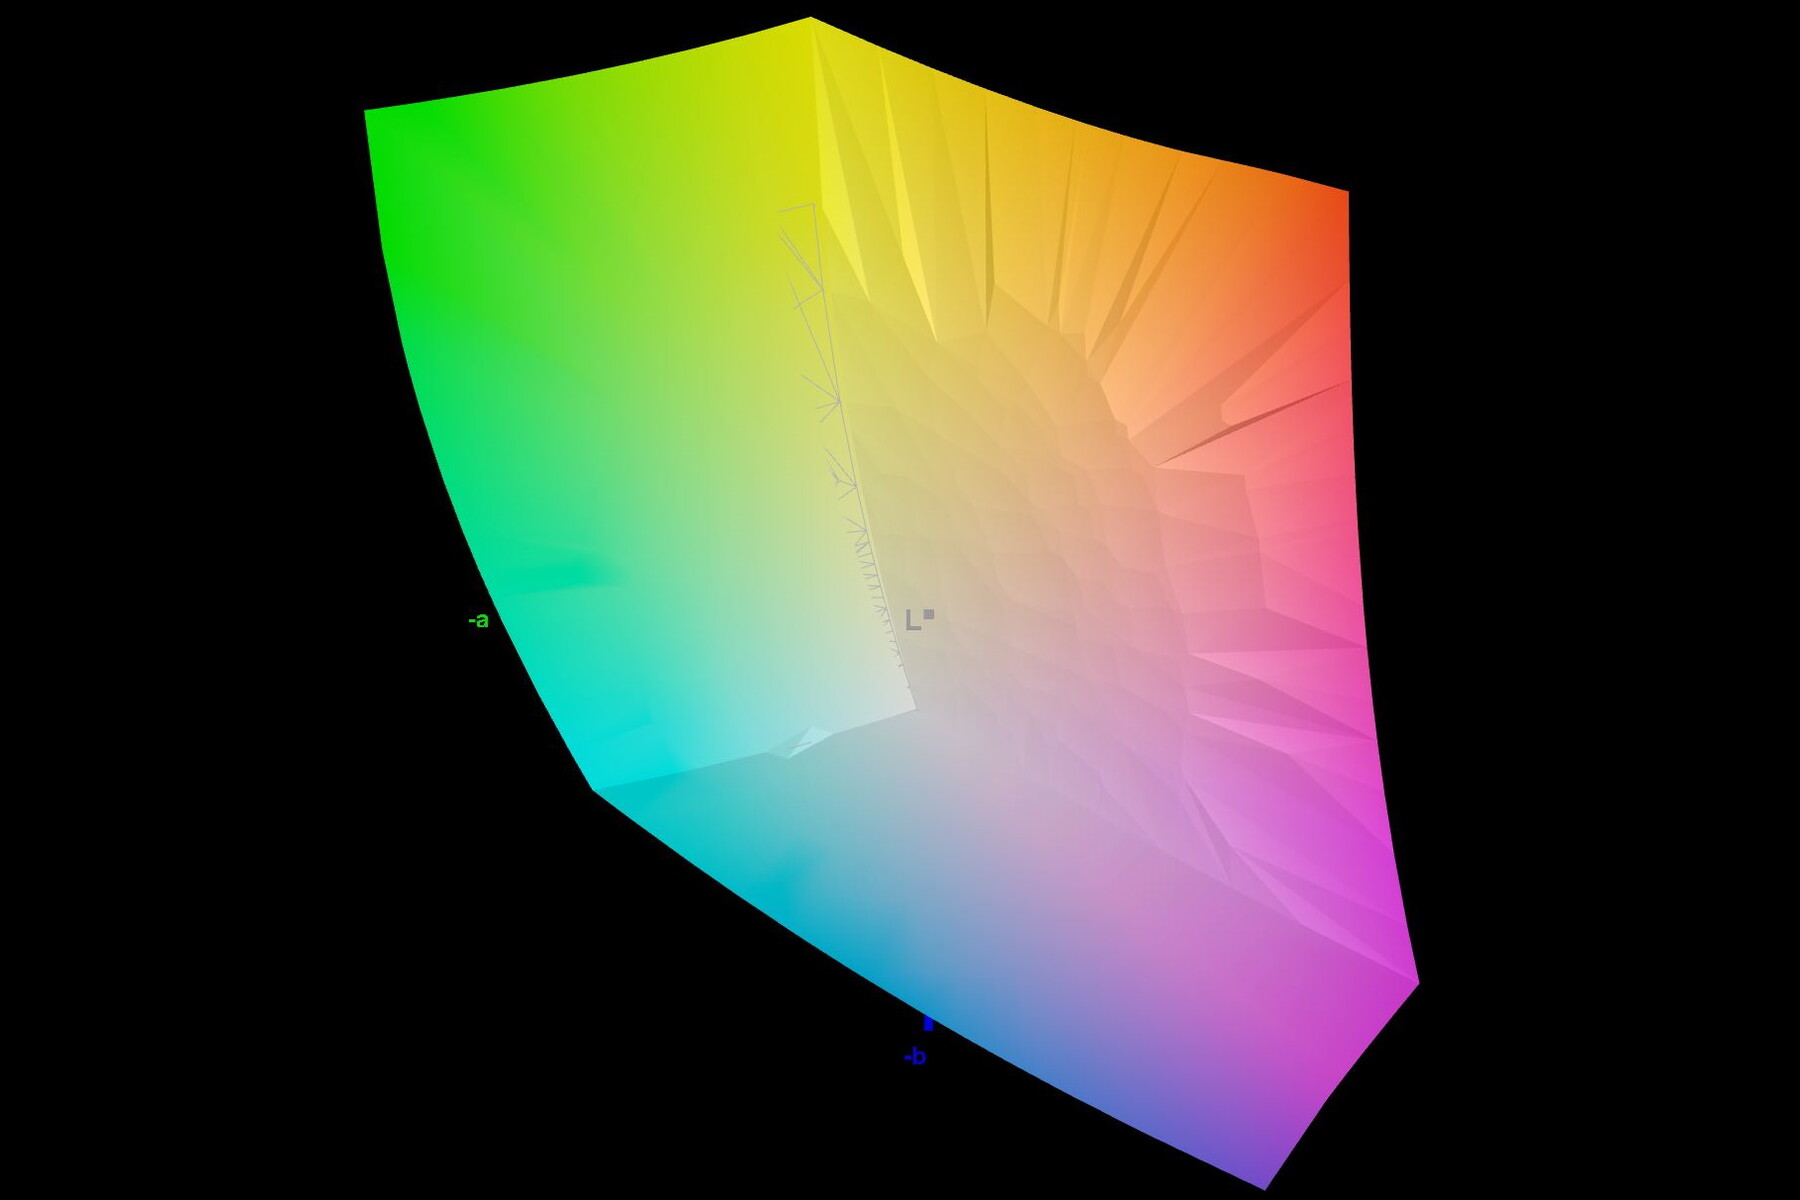
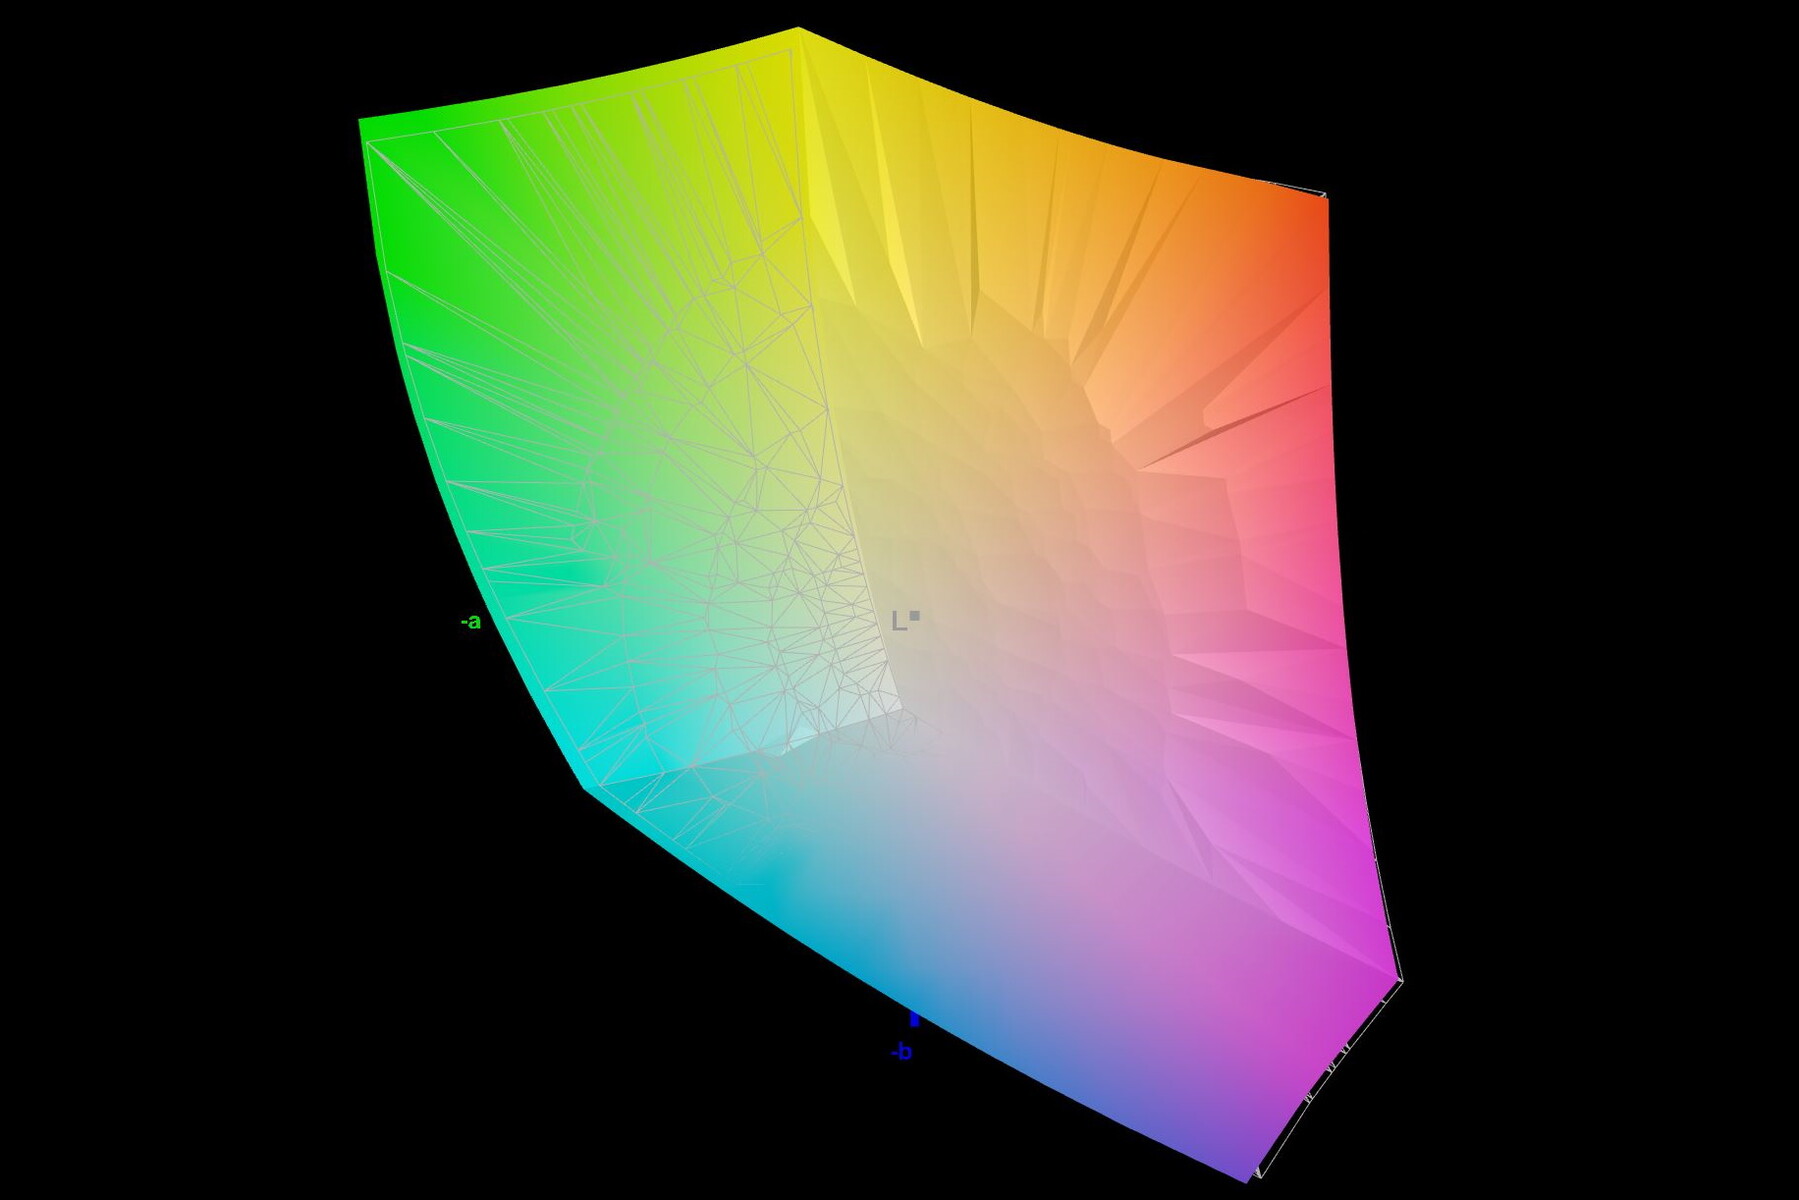
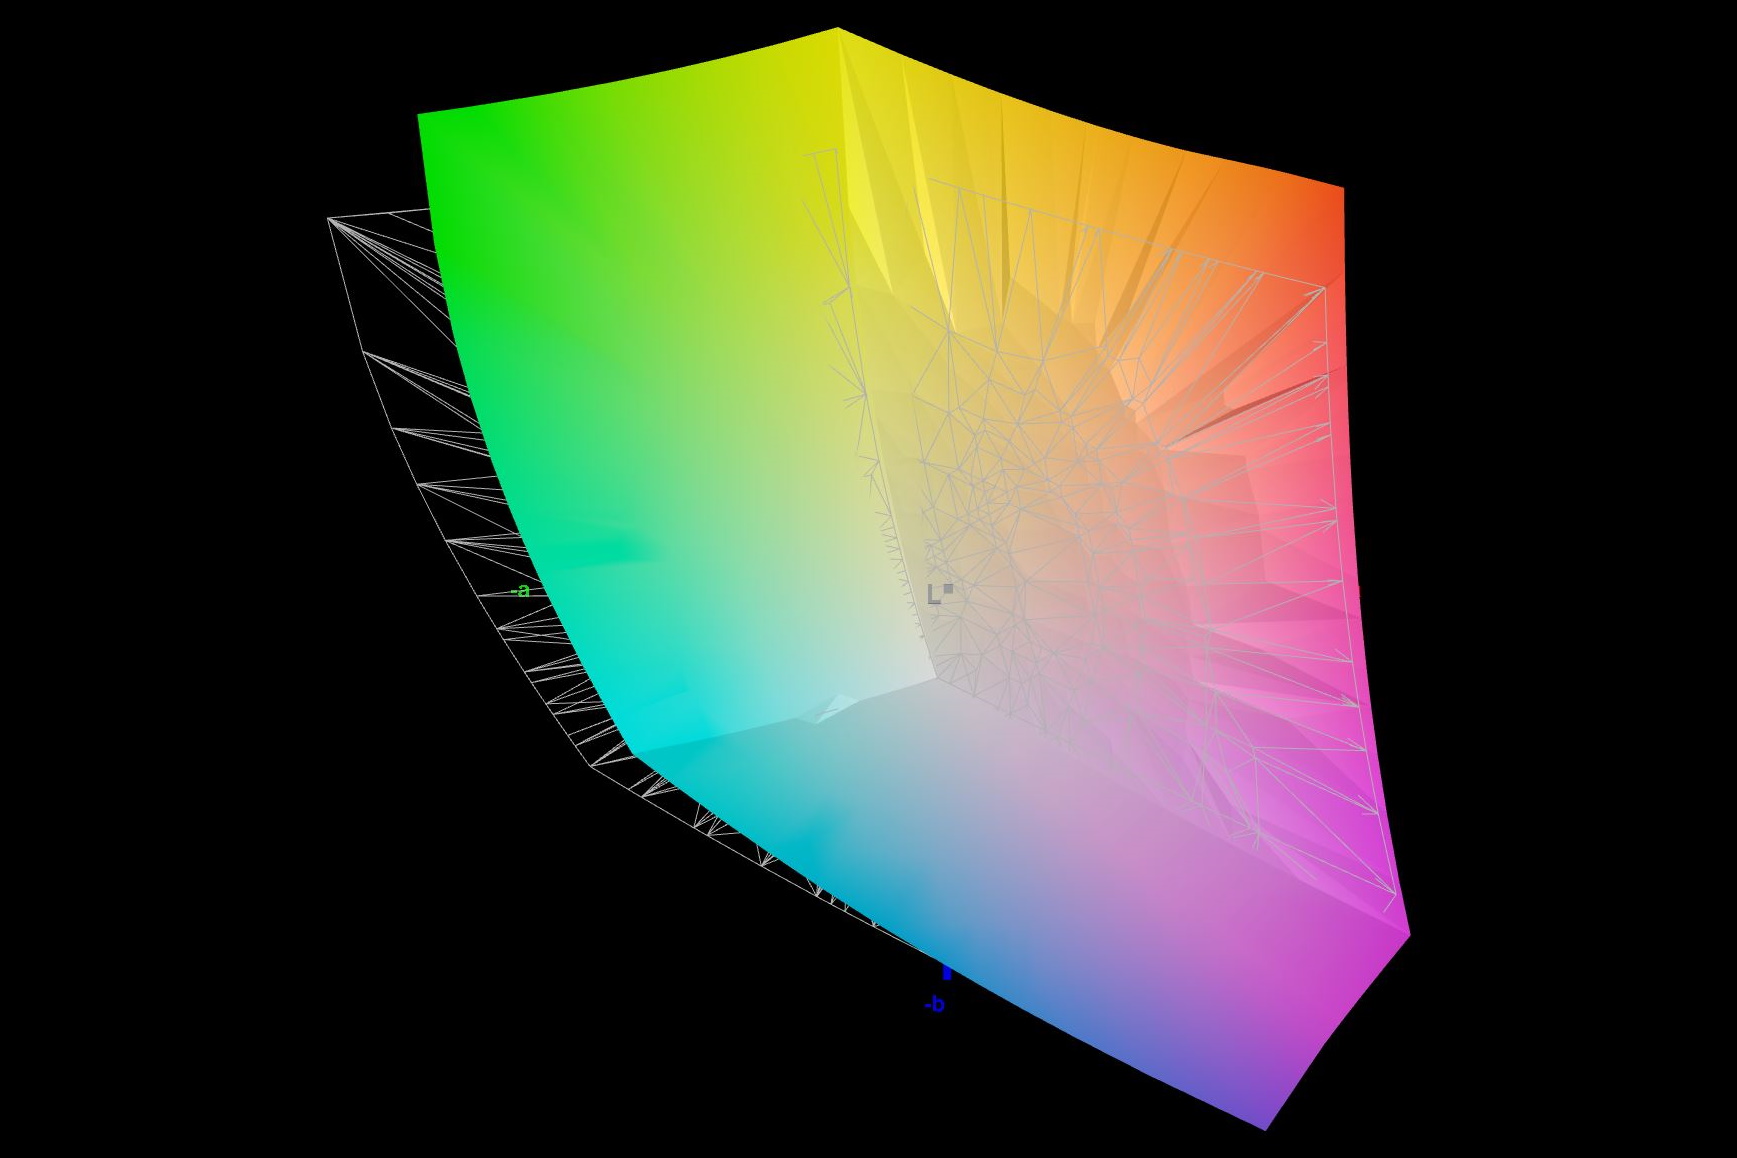
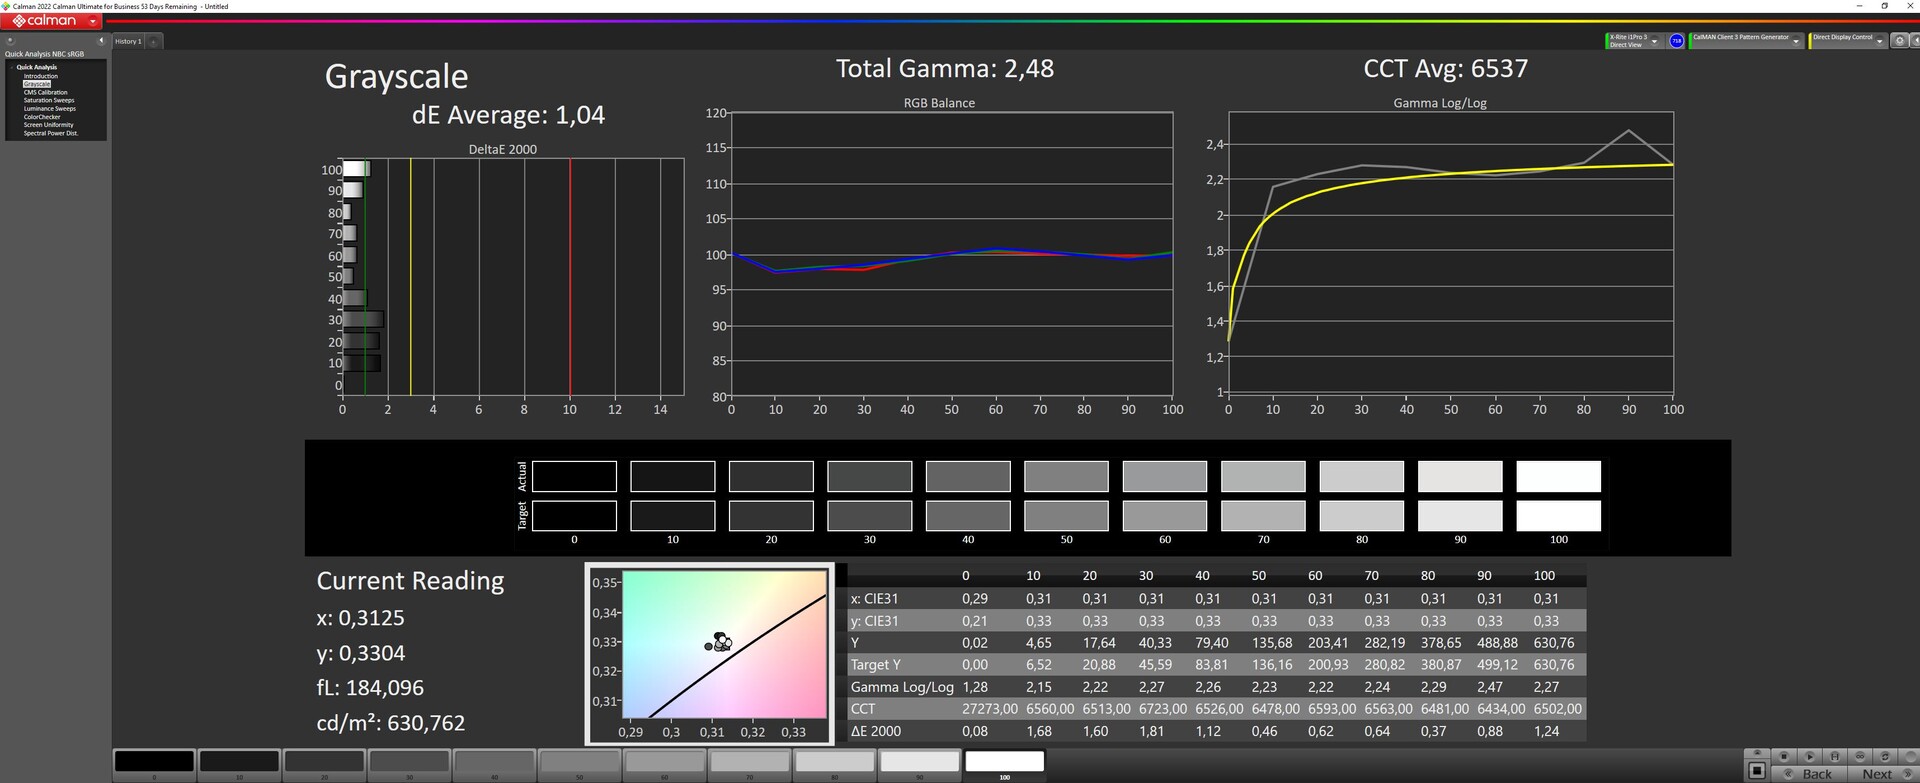
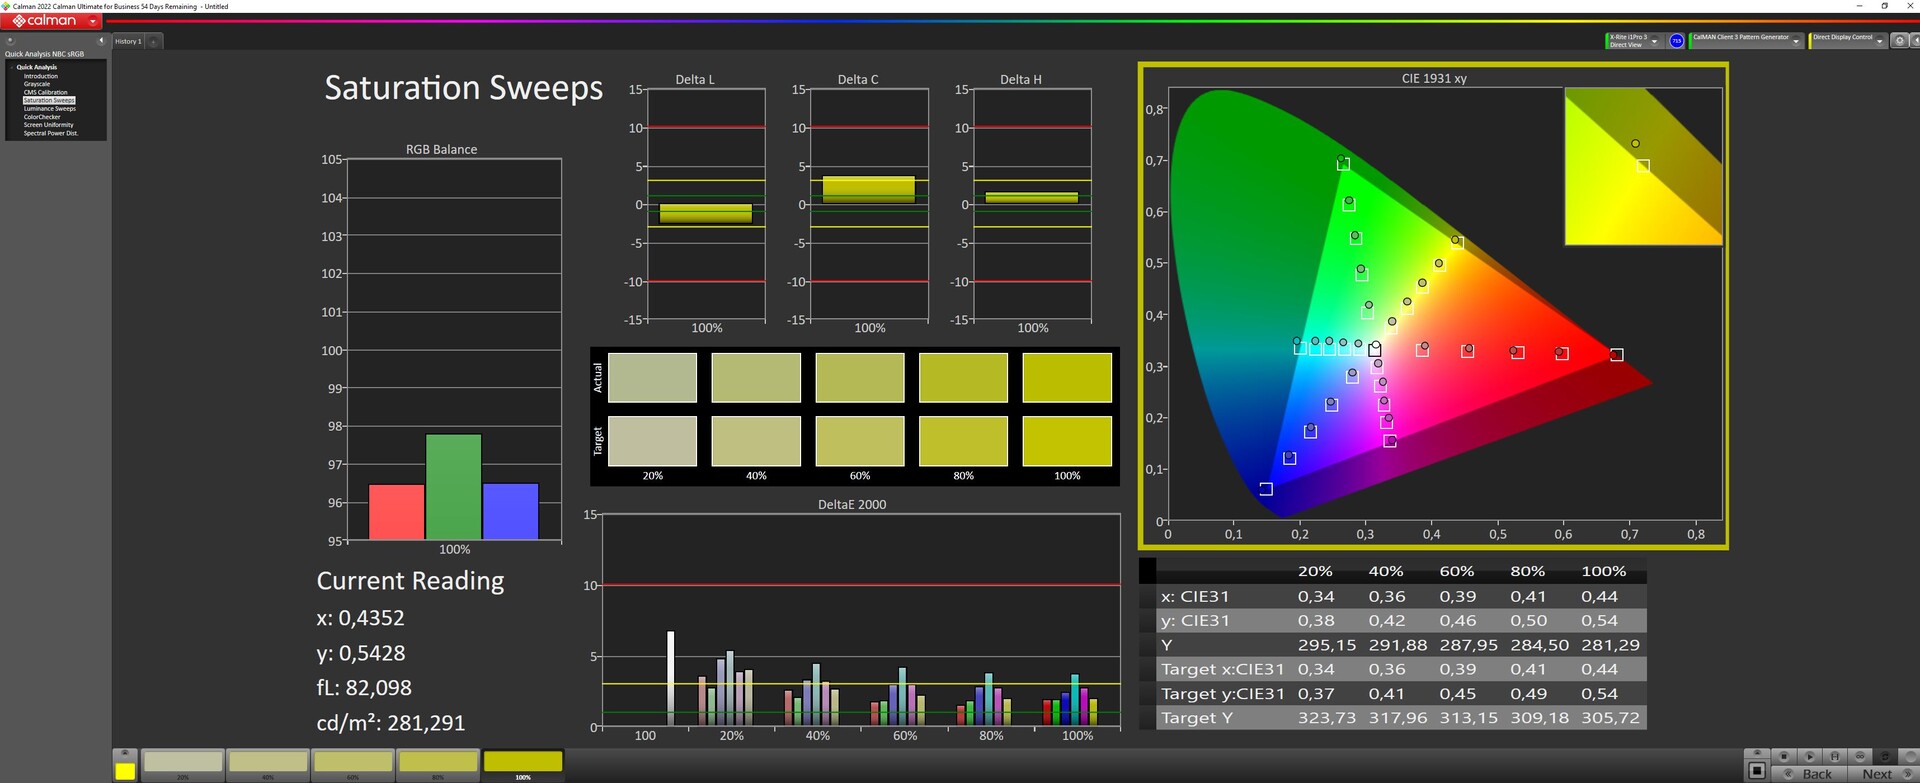
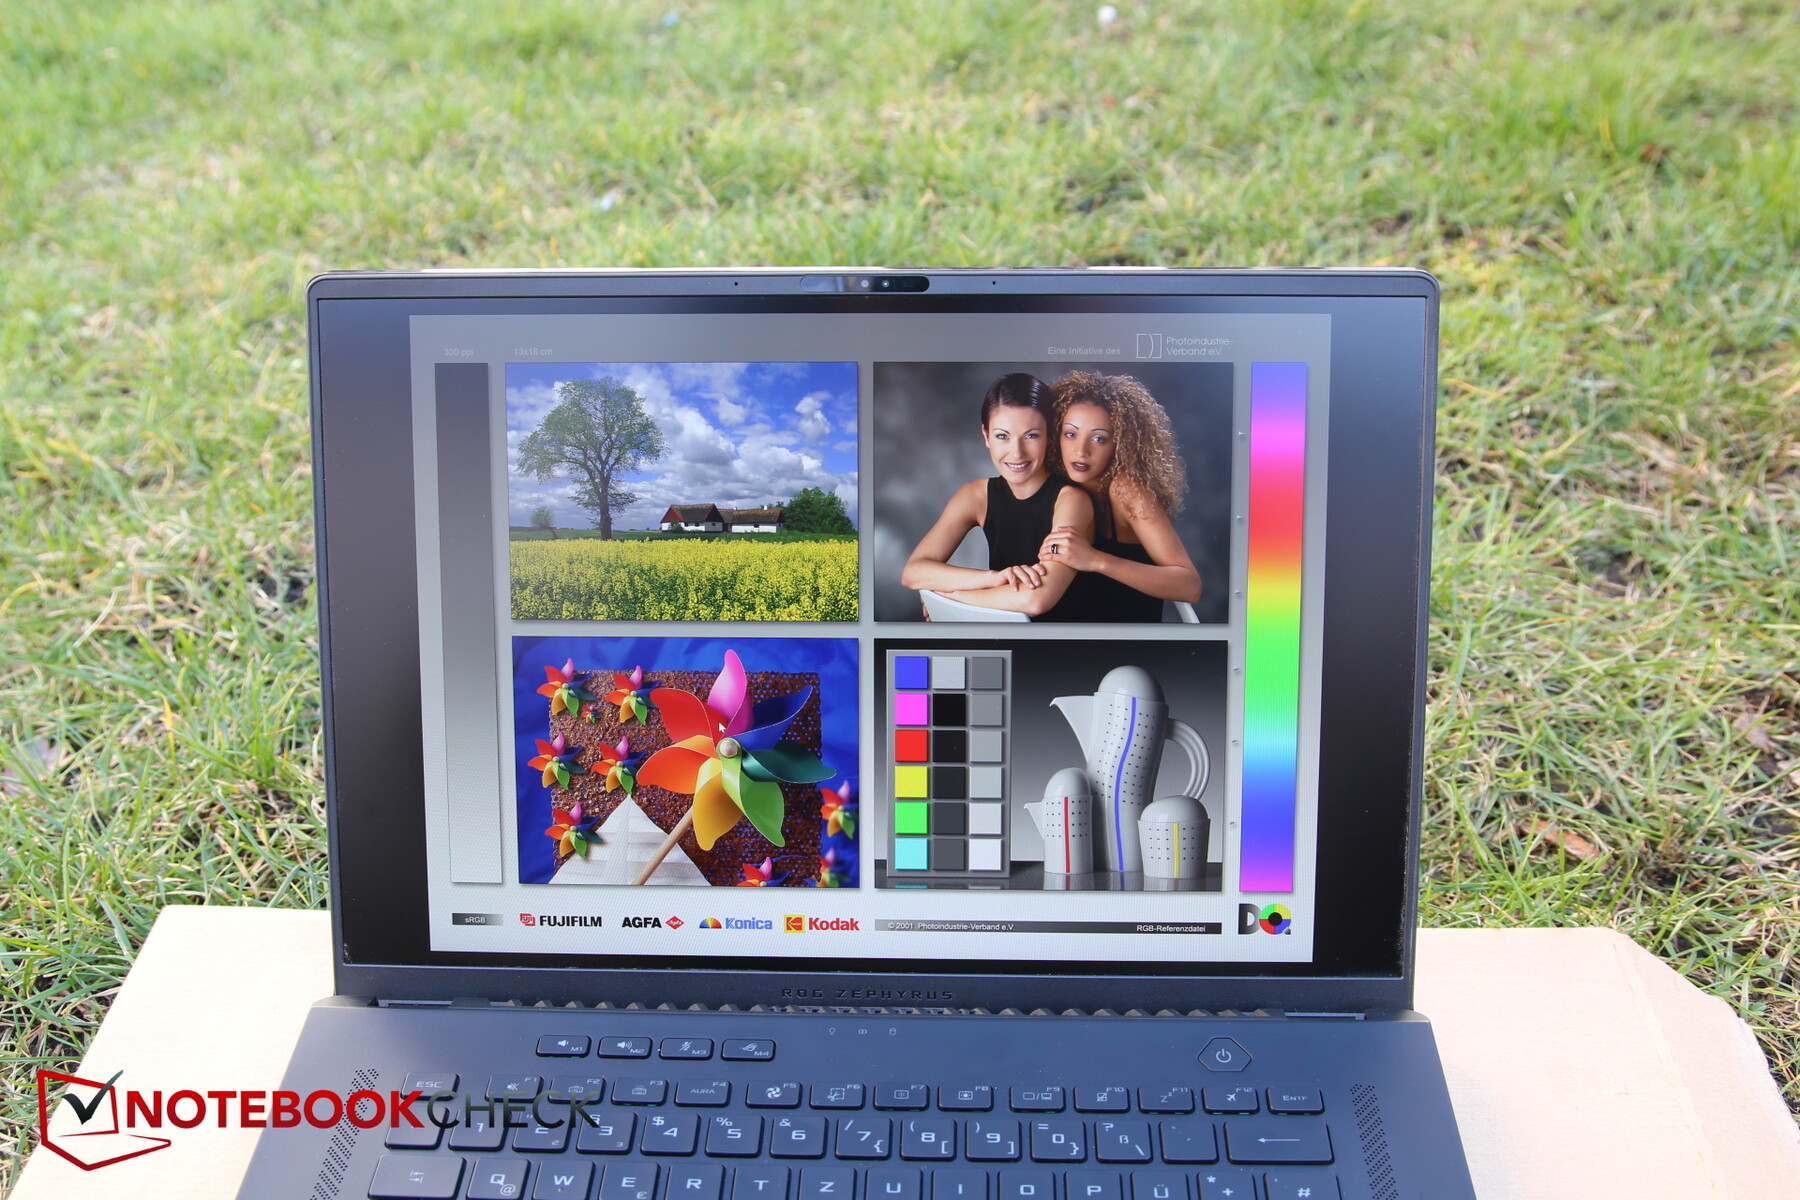
Display - Um Mini-LED muito brilhante com HDR
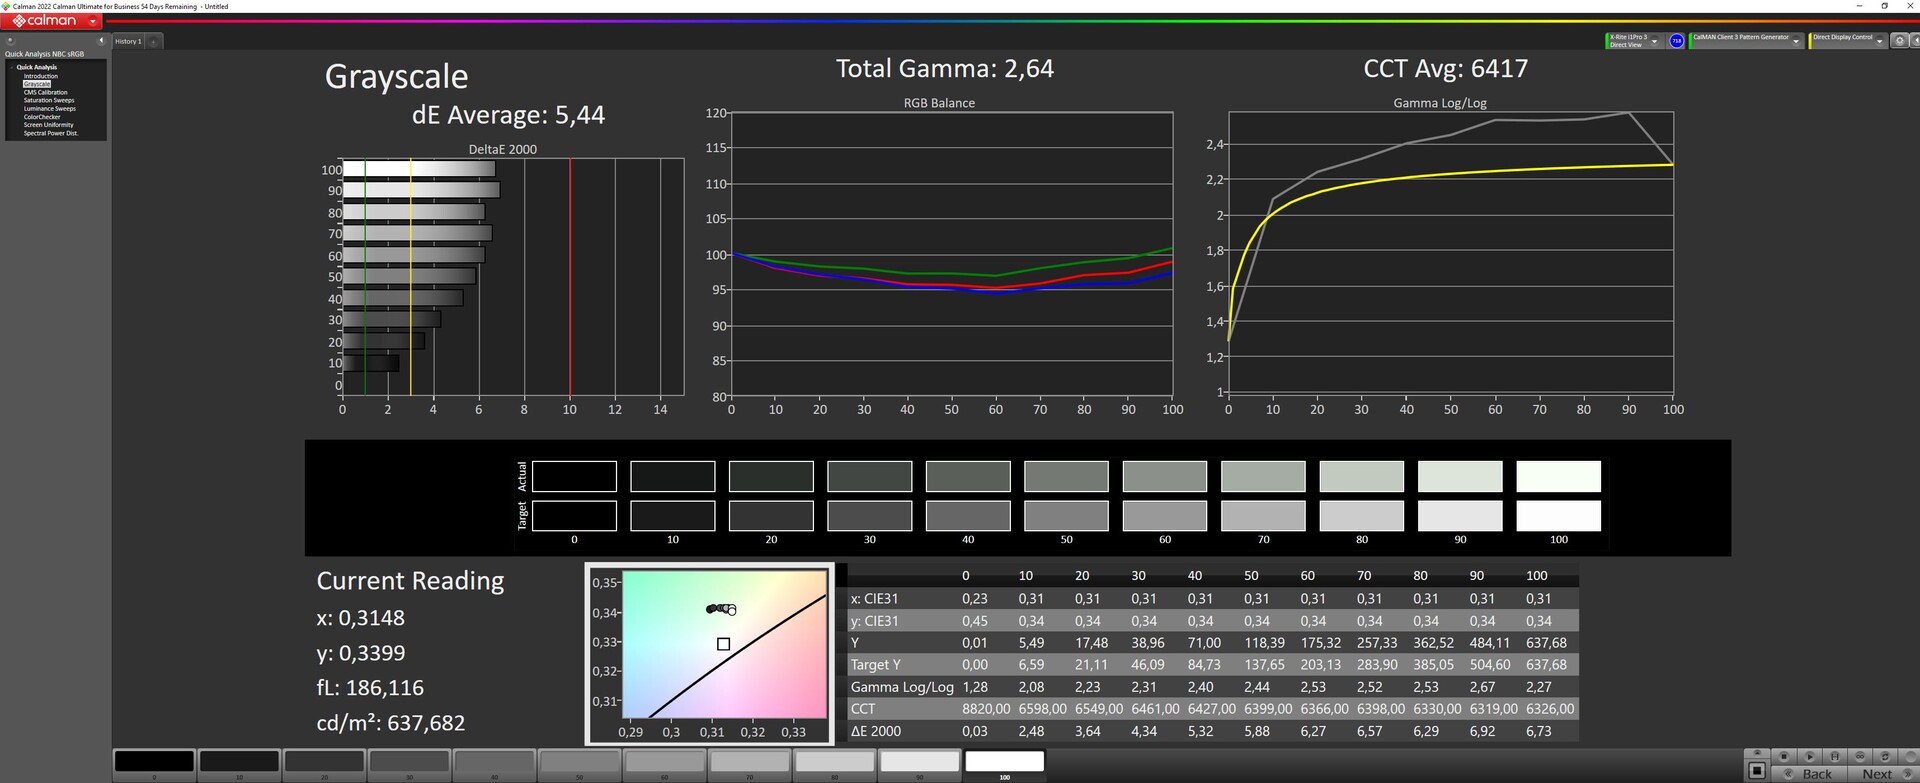
Mais uma vez, o fabricante escolheu um display IPS mate, 16:10, com uma resolução de 2.560 x 1.600 pixels. No entanto, não é o mesmo painel, pois traz um novo número de versão e agora é retroiluminado pela tecnologia Mini-LED. O Asus não revelou o número de zonas de escurecimento empregadas pelo painel.
Algumas coisas devem ser consideradas quando se lida com Mini-LEDs: O brilho máximo só pode ser alcançado quando a iluminação de fundo é definida para várias zonas usando o próprio centro de controle da Asus, o software Armory Crate. No modo HDR, isto é definido automaticamente e se o HDR for desativado (o modo SDR é calibrado e tem menos desvio de cor), o painel acende automaticamente as áreas individuais. Usando esta configuração, a luminosidade é cerca de 100 lêndeas mais baixa.
A seguir, destacamos os valores do modo SDR com multizonas ativadas. No entanto, este modo não é ideal para o processamento de imagens.
Os níveis de preto também são surpreendentes. Usando retroiluminação de uma zona, isto é apenas 0,55, mas o contraste é fraco. Somente quando se usa o ajuste de multi-zona, isto cai para um excelente 0,03. Esta é uma das razões pelas quais realizamos nossas medições com a ativação multizona.
Medimos o brilho em torno de 627 lêndeas (multi-zona, caso contrário, em torno de 519 lêndeas). Com 92 por cento, a iluminação é muito boa, com o brilho a se afastar para o lado direito do visor. Em comparação com seu predecessor, a taxa de atualização do painel aumentou de 165 para 240 Hz.
| |||||||||||||||||||||||||
iluminação: 92 %
iluminação com acumulador: 634 cd/m²
Contraste: 21133:1 (Preto: 0.03 cd/m²)
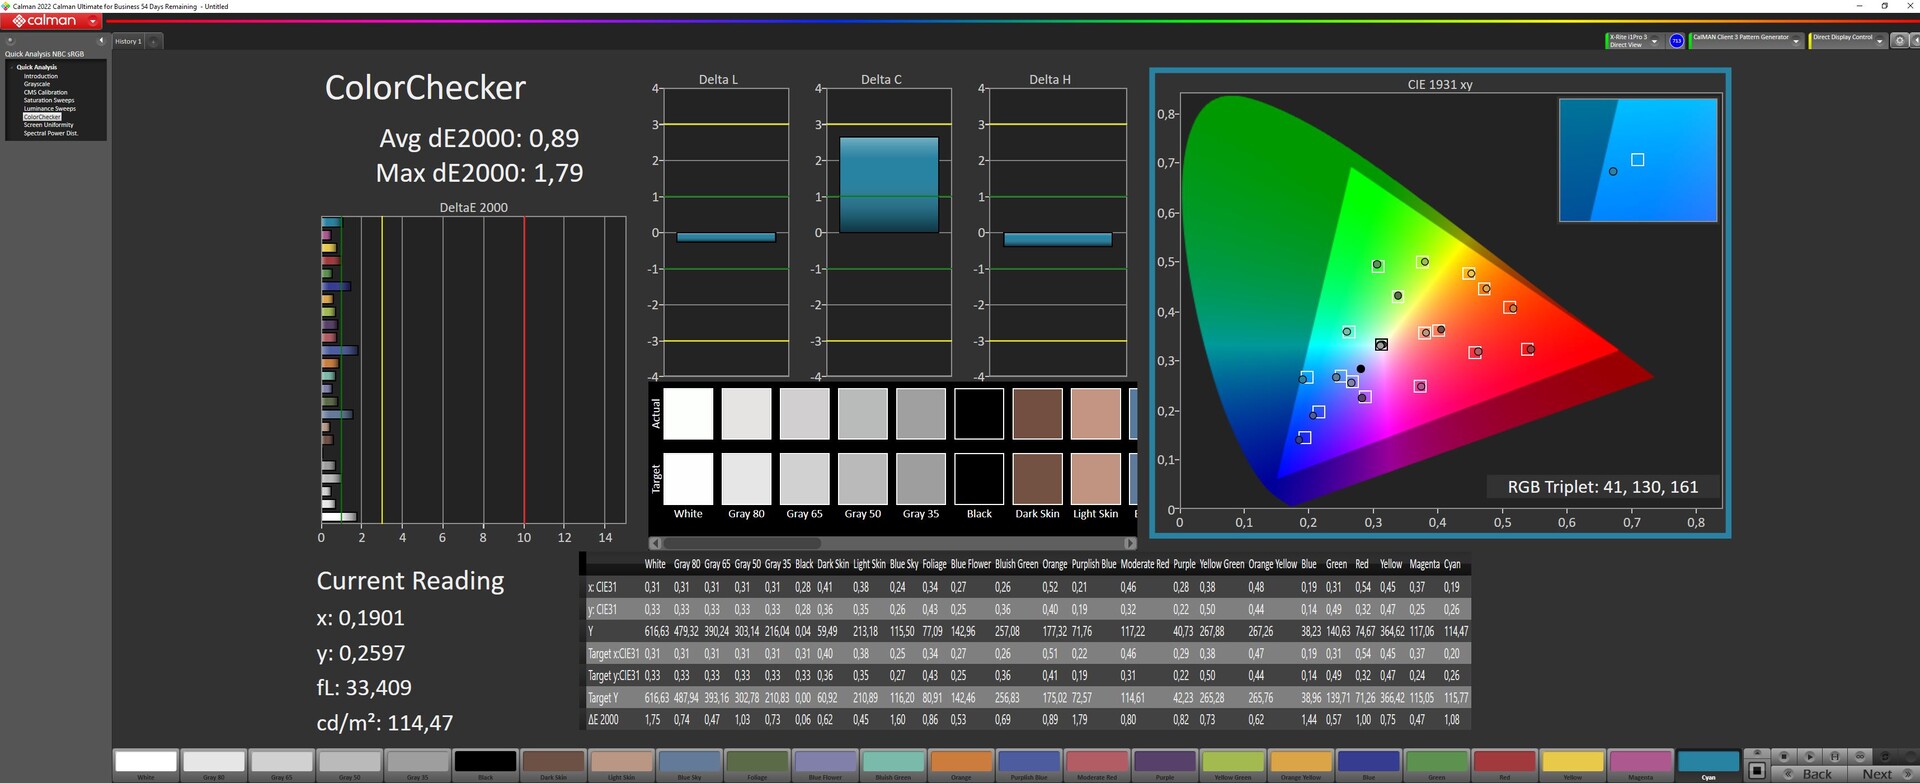
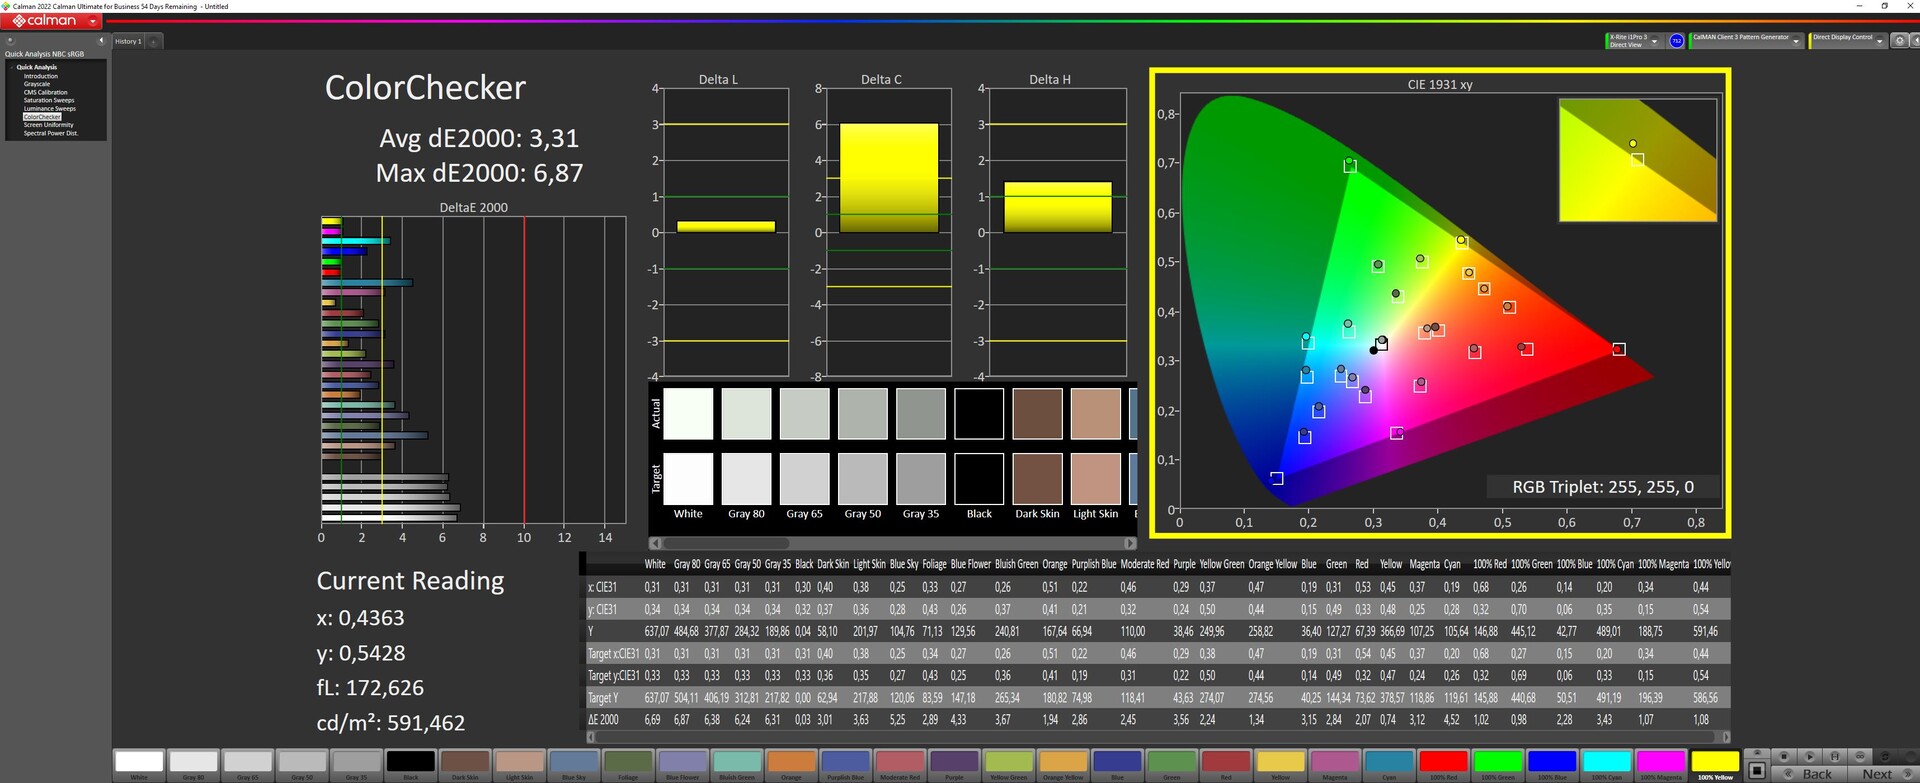
ΔE ColorChecker Calman: 0.89 | ∀{0.5-29.43 Ø4.72}
calibrated: 0.91
ΔE Greyscale Calman: 1.13 | ∀{0.09-98 Ø4.97}
90.01% AdobeRGB 1998 (Argyll 3D)
99.9% sRGB (Argyll 3D)
99.33% Display P3 (Argyll 3D)
Gamma: 2.47
CCT: 6497 K
| Asus ROG Zephyrus M16 GU604VY-NM042X BOE0B74 (NE160QDM-NM4, IPS, 2560x1600, 16" | Asus ROG Zephyrus M16 GU603Z BOE0A0B (BOE CQ NE160QDM-NY3), IPS, 2560x1600, 16" | Asus ROG Strix Scar 18 2023 G834JY-N6005W NE180QDM-NZ2, IPS, 2560x1600, 18" | MSI Titan GT77 HX 13VI B173ZAN06.C, Mini-LED, 3840x2160, 17.3" | Lenovo Legion Pro 7 16IRX8H MNG007DA2-3 (CSO1628), IPS, 2560x1600, 16" | Razer Blade 16 Early 2023 CSOT T3 MNG007DA4-1, IPS, 2560x1600, 16" | |
|---|---|---|---|---|---|---|
| Display | -5% | -3% | -0% | -17% | -0% | |
| Display P3 Coverage (%) | 99.33 | 92.8 -7% | 97.2 -2% | 94.9 -4% | 69.1 -30% | 98.5 -1% |
| sRGB Coverage (%) | 99.9 | 98.5 -1% | 99.9 0% | 99.9 0% | 99.7 0% | 100 0% |
| AdobeRGB 1998 Coverage (%) | 90.01 | 83.1 -8% | 84.9 -6% | 92.4 3% | 71.2 -21% | 89.7 0% |
| Response Times | 76% | 80% | 17% | 78% | 73% | |
| Response Time Grey 50% / Grey 80% * (ms) | 50.8 ? | 7.6 ? 85% | 5.41 ? 89% | 38.4 ? 24% | 12.3 ? 76% | 6.6 ? 87% |
| Response Time Black / White * (ms) | 29.6 ? | 10 ? 66% | 8.62 ? 71% | 26.6 ? 10% | 5.9 ? 80% | 12 ? 59% |
| PWM Frequency (Hz) | 12000 | 2380 ? | ||||
| Screen | -181% | -399% | 3033% | -150% | -212% | |
| Brightness middle (cd/m²) | 634 | 497 -22% | 490 -23% | 606 -4% | 511 -19% | 456.8 -28% |
| Brightness (cd/m²) | 627 | 481 -23% | 468 -25% | 602 -4% | 469 -25% | 437 -30% |
| Brightness Distribution (%) | 92 | 82 -11% | 86 -7% | 93 1% | 86 -7% | 83 -10% |
| Black Level * (cd/m²) | 0.03 | 0.21 -600% | 0.54 -1700% | 0.0001 100% | 0.4 -1233% | 0.35 -1067% |
| Contrast (:1) | 21133 | 2367 -89% | 907 -96% | 6060000 28576% | 1278 -94% | 1305 -94% |
| Colorchecker dE 2000 * | 0.89 | 3.53 -297% | 4.97 -458% | 4.8 -439% | 0.95 -7% | 3.7 -316% |
| Colorchecker dE 2000 max. * | 1.79 | 6.15 -244% | 11.02 -516% | 8.2 -358% | 2.07 -16% | 6.42 -259% |
| Colorchecker dE 2000 calibrated * | 0.91 | 3.53 -288% | 2.97 -226% | 1.8 -98% | 0.91 -0% | 0.66 27% |
| Greyscale dE 2000 * | 1.13 | 1.74 -54% | 7.2 -537% | 6.5 -475% | 0.6 47% | 2.6 -130% |
| Gamma | 2.47 89% | 2.2 100% | 2.161 102% | 2.63 84% | 2.176 101% | 2.3 96% |
| CCT | 6497 100% | 6418 101% | 6515 100% | 6596 99% | 6545 99% | 6108 106% |
| Média Total (Programa/Configurações) | -37% /
-107% | -107% /
-245% | 1017% /
1952% | -30% /
-89% | -46% /
-126% |
* ... menor é melhor
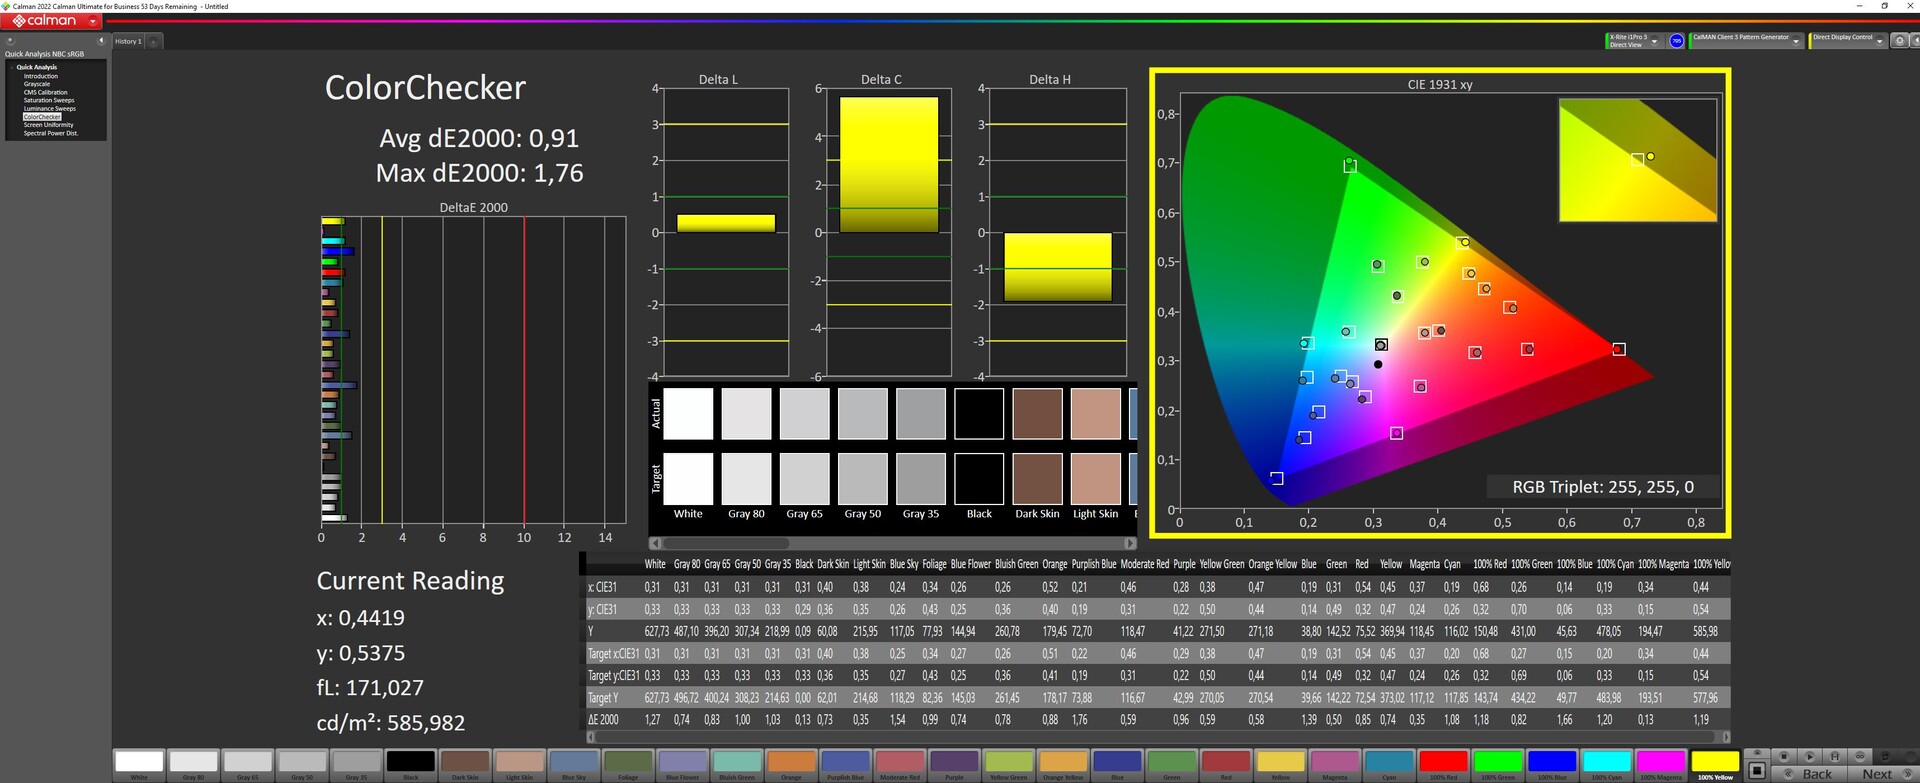
Asus anuncia o dispositivo como tendo 100% DCI P3 e isto é algo que nossa análise foi capaz de confirmar. AdobeRGB é reproduzido a 90 por cento.
Fora da caixa, o painel é muito bem calibrado (SDR) e tem uma escala de cinza DeltaE e valor de ColorChecker de apenas 1,13 e 0,89. Uma nova calibração dificilmente consegue melhorar a situação. A escala de cinza DeltaE mergulhou um pouco enquanto o desvio do ColorChecker aumentou ligeiramente.
Entretanto, no modo HDR, a calibração desapareceu (veja a última linha de nossas capturas de tela abaixo).


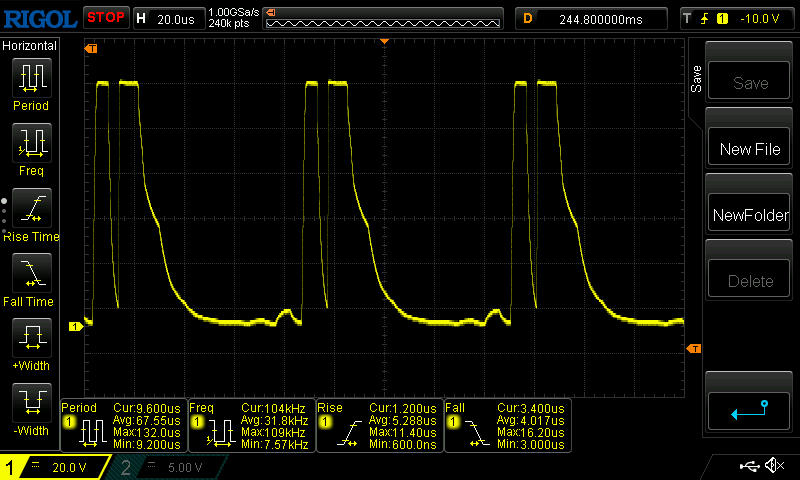
Determinar os tempos de resposta não é fácil com nosso modelo de revisão, pois a freqüência PWM de pelo menos 12 kHz (ver abaixo) se sobrepõe às curvas de tempo de resposta. O Asus especifica isso como 3 ms, mas o faz sem revelar qual técnica de medição eles utilizaram. Na luminosidade total, medimos para estar mais na região de 30 a 50 ms que, por um lado, é alta mas também possivelmente influenciada pela sobreposição da freqüência PWM.
Exibir tempos de resposta
| ↔ Tempo de resposta preto para branco | ||
|---|---|---|
| 29.6 ms ... ascensão ↗ e queda ↘ combinadas | ↗ 25 ms ascensão | 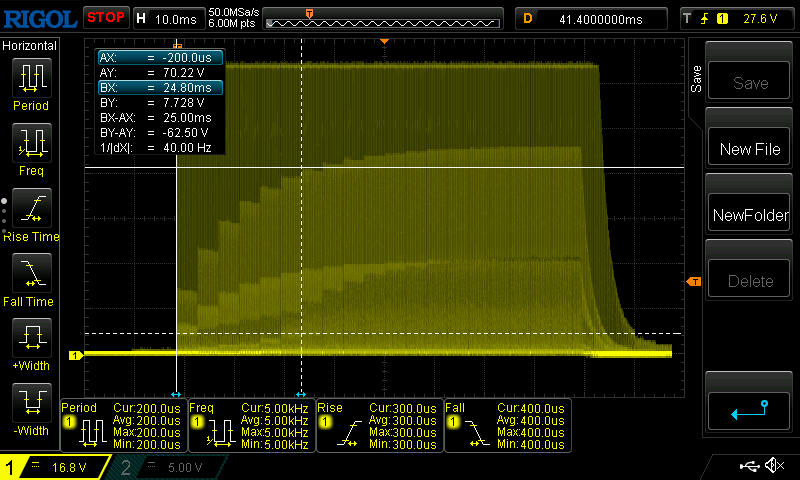 |
| ↘ 4.6 ms queda | ||
| A tela mostra taxas de resposta relativamente lentas em nossos testes e pode ser muito lenta para os jogadores. Em comparação, todos os dispositivos testados variam de 0.1 (mínimo) a 240 (máximo) ms. » 79 % de todos os dispositivos são melhores. Isso significa que o tempo de resposta medido é pior que a média de todos os dispositivos testados (19.8 ms). | ||
| ↔ Tempo de resposta 50% cinza a 80% cinza | ||
| 50.8 ms ... ascensão ↗ e queda ↘ combinadas | ↗ 27.6 ms ascensão | 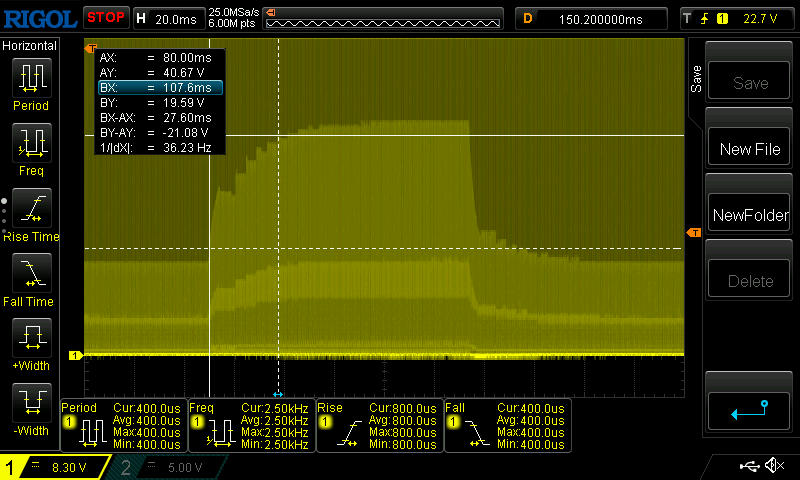 |
| ↘ 23.2 ms queda | ||
| A tela mostra taxas de resposta lentas em nossos testes e será insatisfatória para os jogadores. Em comparação, todos os dispositivos testados variam de 0.165 (mínimo) a 636 (máximo) ms. » 87 % de todos os dispositivos são melhores. Isso significa que o tempo de resposta medido é pior que a média de todos os dispositivos testados (31 ms). | ||
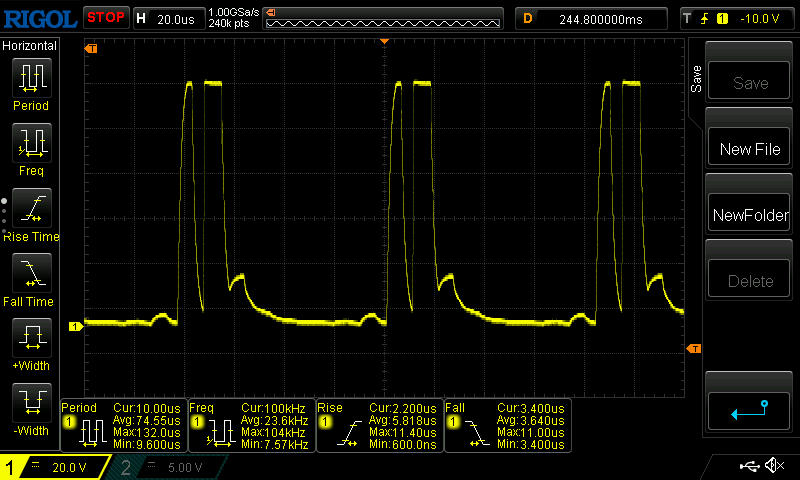
Cintilação da tela / PWM (modulação por largura de pulso)
| Tela tremeluzindo/PWM detectado | 12000 Hz | 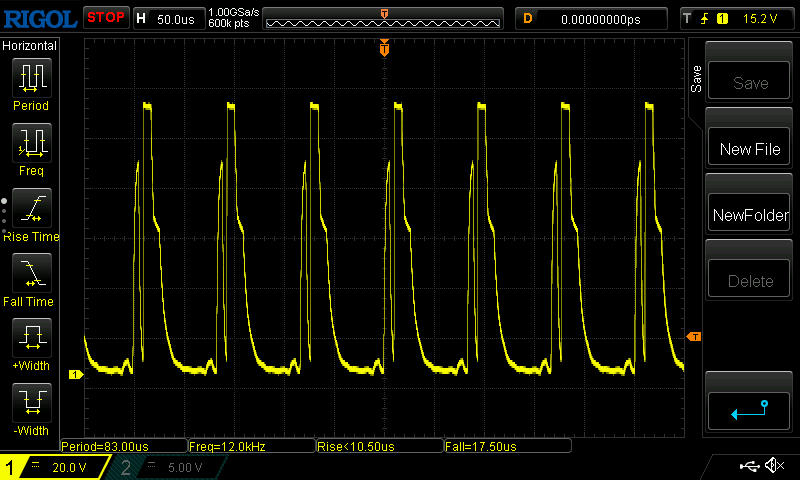 | |
A luz de fundo da tela pisca em 12000 Hz (pior caso, por exemplo, utilizando PWM) . A frequência de 12000 Hz é bastante alta, então a maioria dos usuários sensíveis ao PWM não deve notar nenhuma oscilação. [pwm_comparison] Em comparação: 52 % de todos os dispositivos testados não usam PWM para escurecer a tela. Se PWM foi detectado, uma média de 7769 (mínimo: 5 - máximo: 343500) Hz foi medida. | |||
O PWM é usado para regular a luminosidade. Com uma luminosidade de 100 a 83%, a freqüência se situava em 12 kHz, o que nem deveria ser percebido por pessoas normalmente sensíveis ao PWM. Abaixo disso, a freqüência continuava a subir e estava entre 69 a 100 kHz.
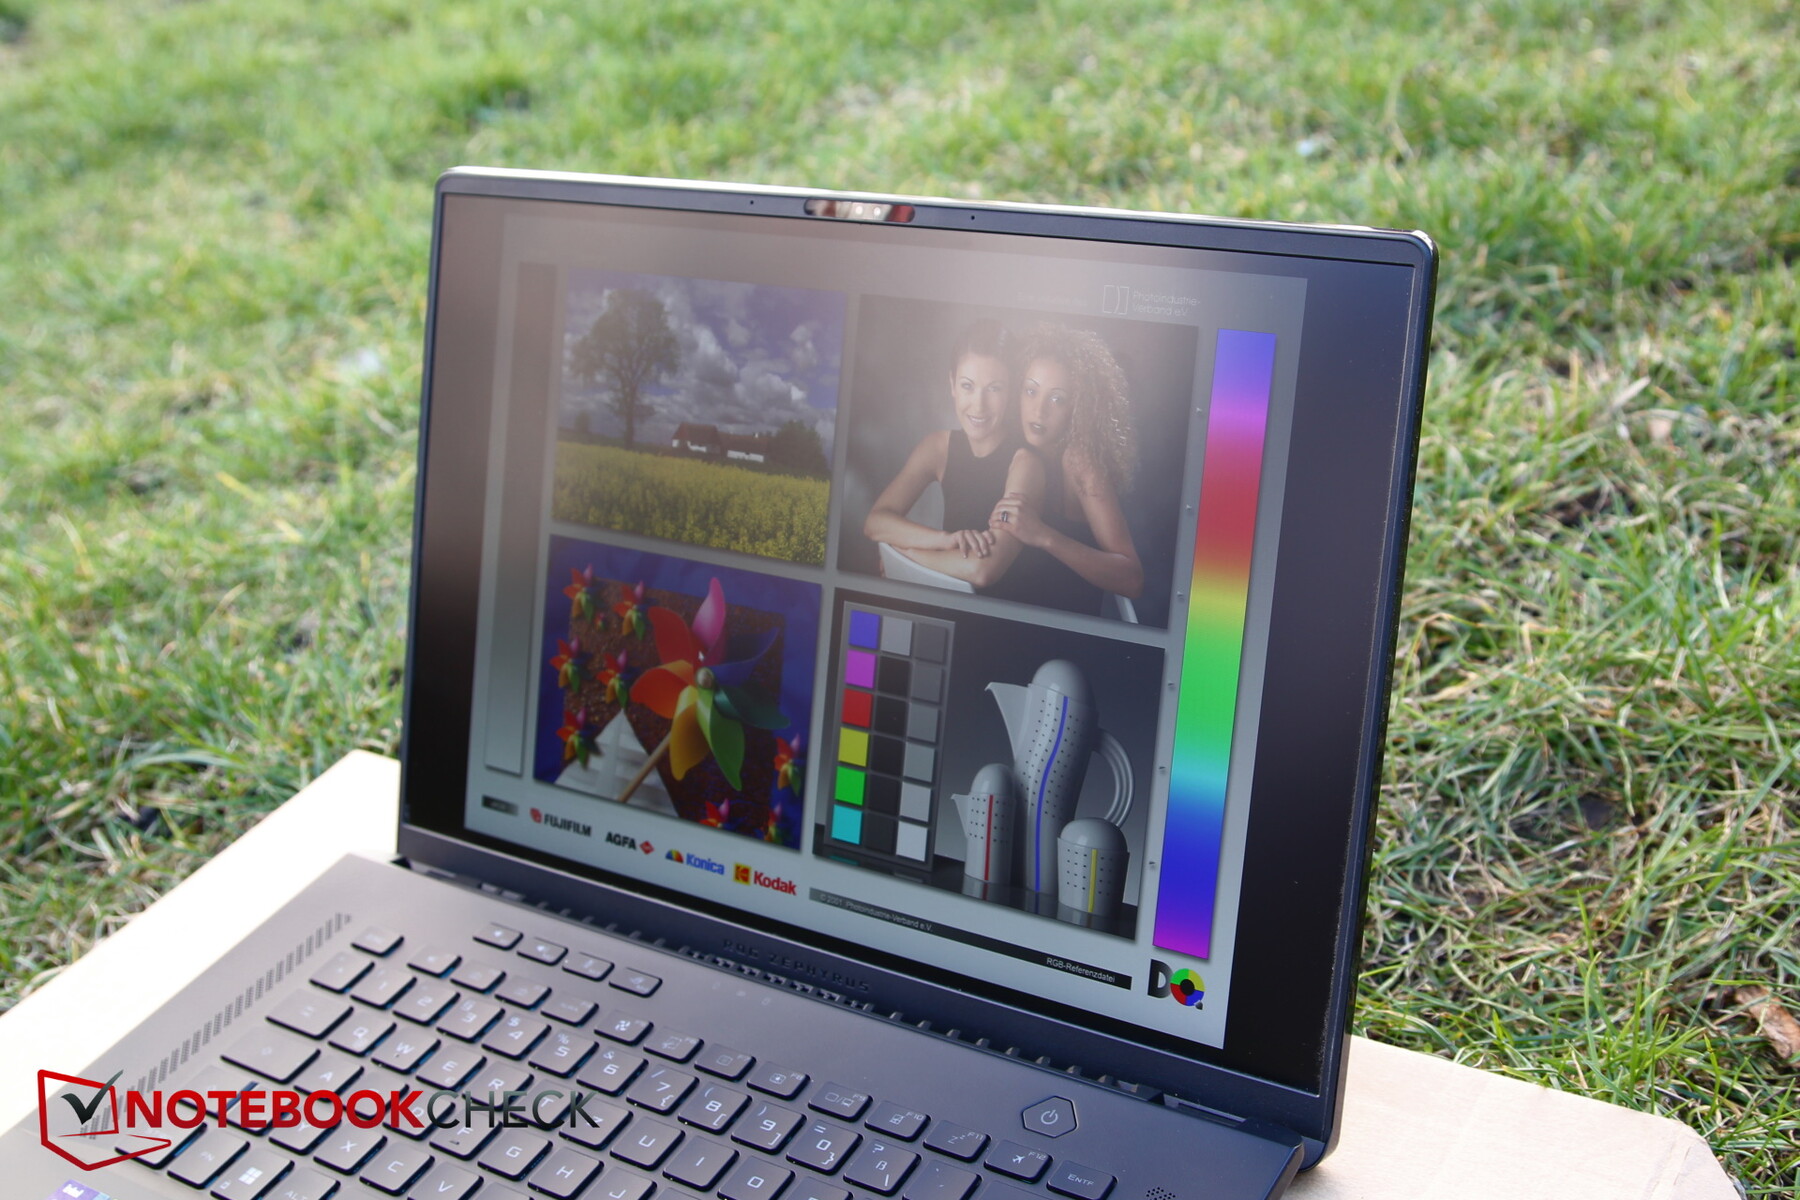
Ao ar livre, a superfície fosca garante um nível comparativamente alto de brilho, bem como uma legibilidade muito boa, pelo menos na sombra. Deve-se tomar cuidado ao visualizar a tela de cima, pois as imagens se tornam muito rapidamente lavadas.

Desempenho - Falta uma faísca para o turbo
No papel, a nova M16 deveria ser um peso pesado de desempenho em um corpo de 16 polegadas: Raptor Lake Núcleo i9-13900H, Nvidia Geforce RTX 4090e 64 GB de RAM jogam a manopla para todos os candidatos ao trono de desempenho.
Condições de teste
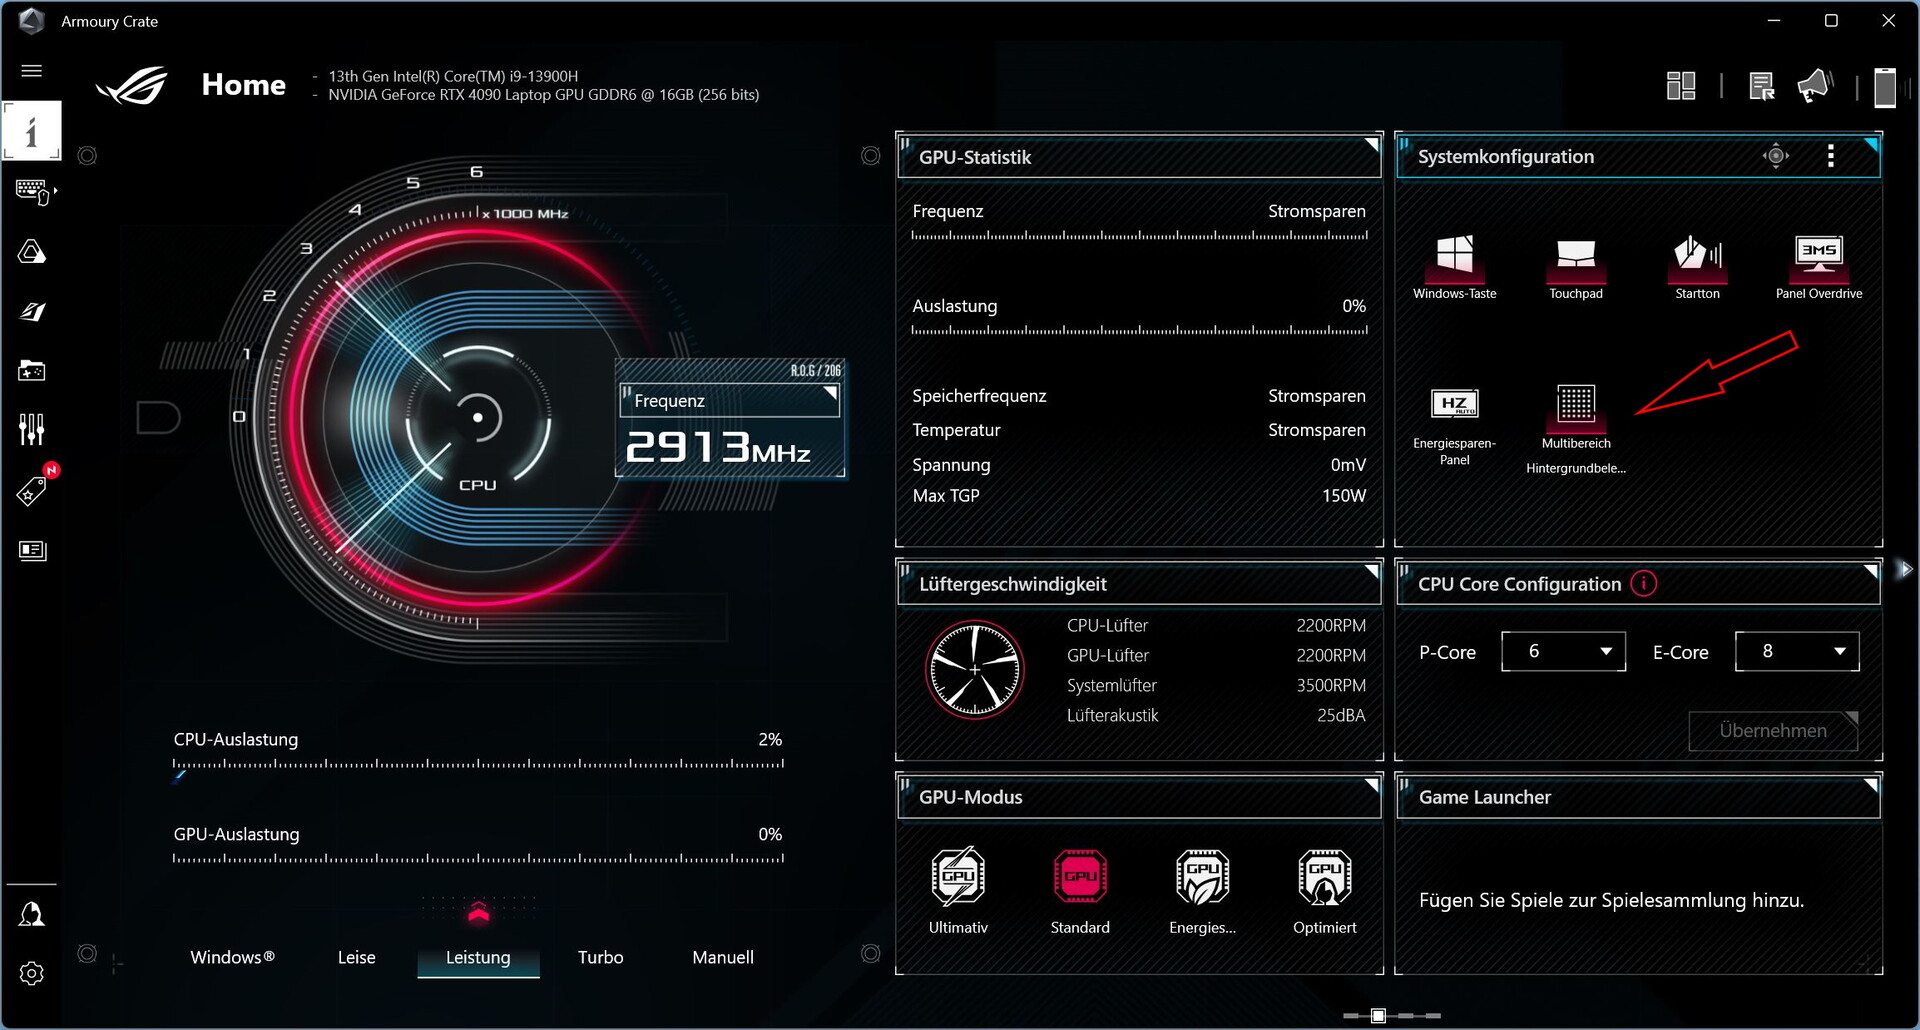
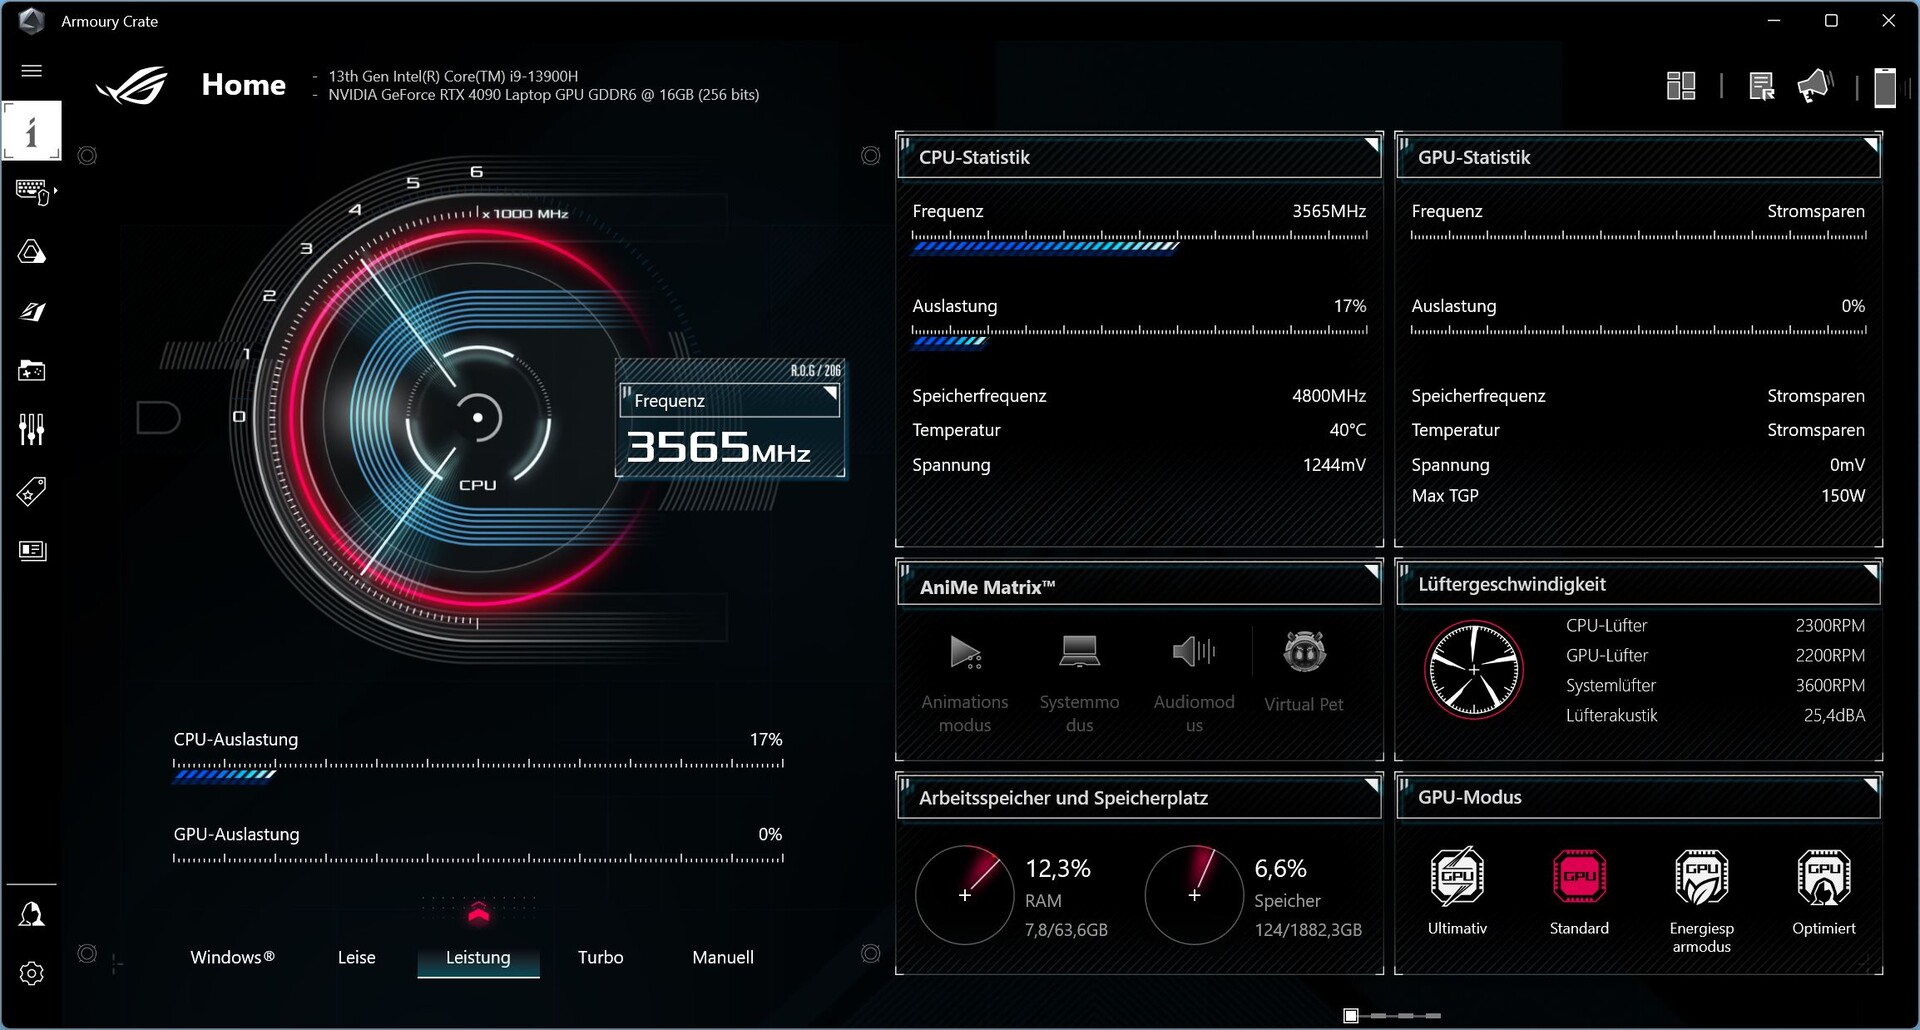
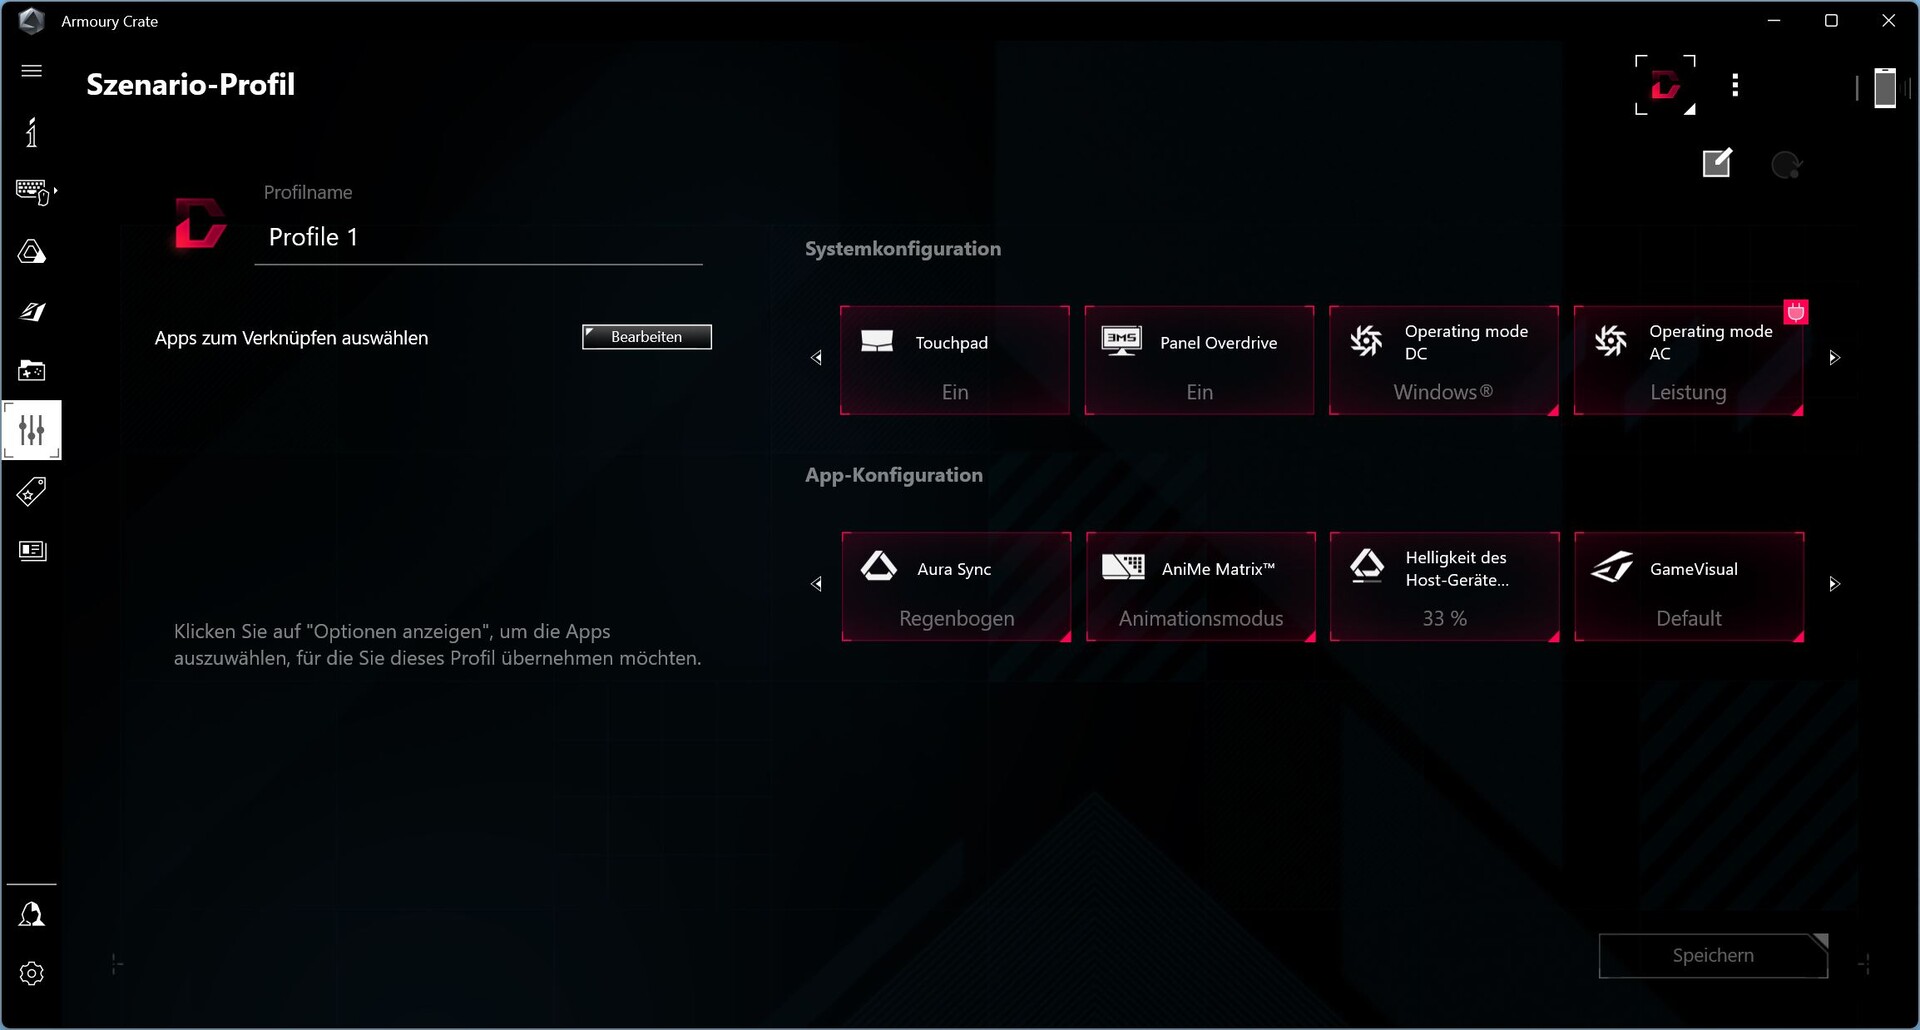
O centro de controle do Asus para jogadores é o software, Amoury Crate. Além dos vários modos de desempenho, é aqui que todas as configurações importantes são feitas e também onde coisas como a Matriz AniMe e as curvas dos ventiladores podem ser personalizadas.
Para nossos benchmarks, selecionamos o modo Turbo no aplicativo, a fim de alcançar os melhores resultados possíveis. Seu predecessor foi testado usando o modo Performance devido às altas emissões de ruído do gênero anterior e é algo mais parecido com o modo Balanceado.
Processador
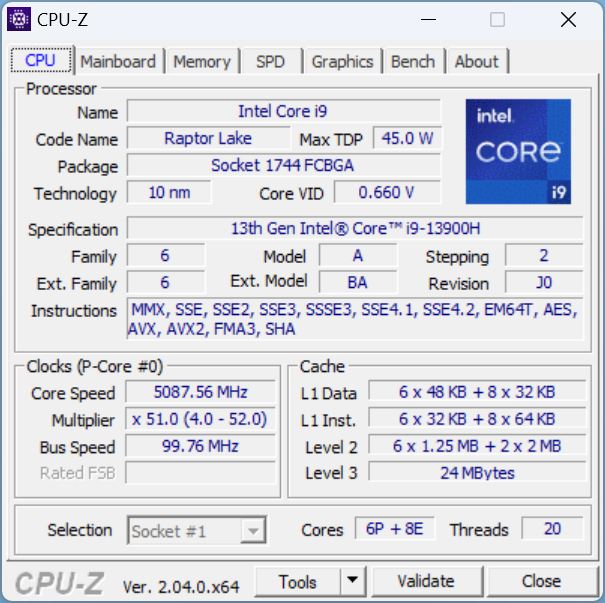
Até o momento, oNúcleo i9-13900Hé a única opção de CPU e um dos processadores mais potentes da nova série Raptor Lake da Intel. Oferece 6 P e 8 E-cores, o antigo com relógio de até 5,4 GHz em turbo. A velocidade do relógio base do E-core fica em 1,9 GHz.
Em nosso loop Cinebench, a M16 ultrapassou toda a concorrência configurada com as CPUs de última geração. Entretanto, a lacuna é relativamente pequena mesmo quando comparada com as CPUs de menor potência i7-12700H encontrado noHP Omen 16. A vantagem sobre seu predecessor é igualmente pequena, com uma pontuação em modo de desempenho provavelmente quase idêntica.
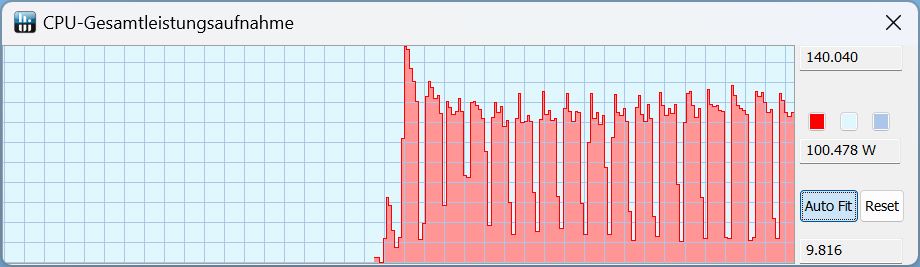
Dando uma olhada no TDP, o primeiro modo Turbo atingiu o pico de 140 watts, com as outras corridas sentadas a cerca de 100 watts.
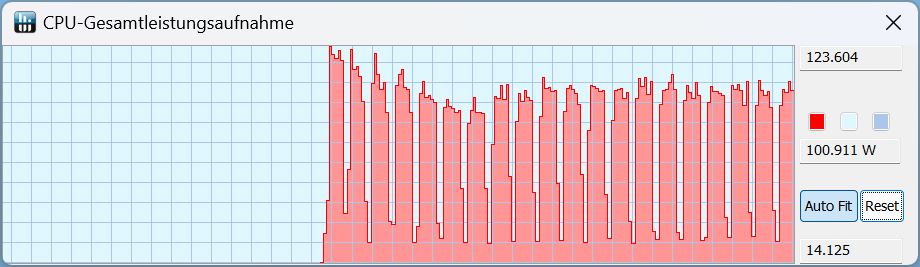
No modo Performance, o pico inicial de 140 watts caiu para aproximadamente 120 watts, mas também aqui o TDP normalmente se situa em cerca de 100 watts.
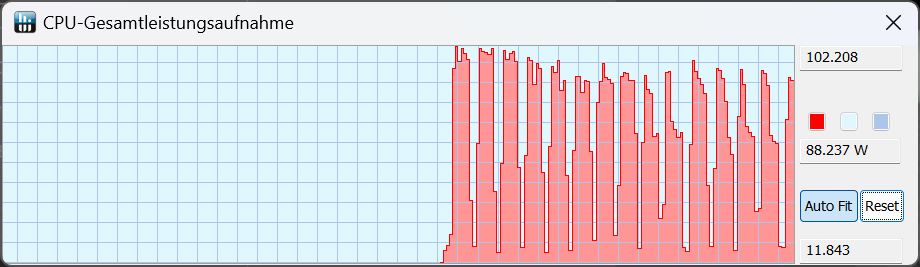
No modo Silencioso, o pico desapareceu com o TDP variando entre 60 e um máximo de 100 watts.
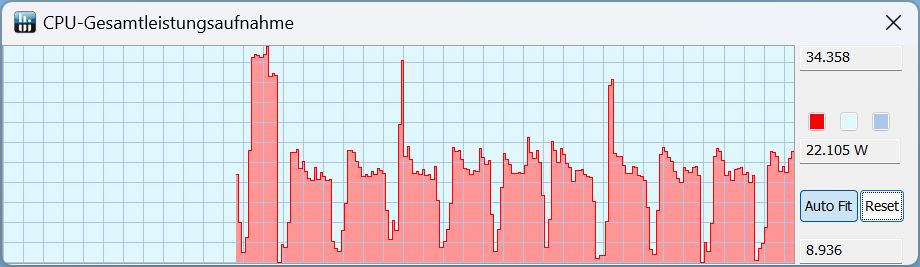
No modo de bateria, o desempenho no mesmo modo(Quiet) é ainda mais baixo com um máximo de 34 watts brevemente disponíveis e apenas pouco mais de 20 watts sendo alcançados durante períodos mais longos de carga sustentada.
Cinebench R15 Multi Continuous
Cinebench R23: Multi Core | Single Core
Cinebench R20: CPU (Multi Core) | CPU (Single Core)
Cinebench R15: CPU Multi 64Bit | CPU Single 64Bit
Blender: v2.79 BMW27 CPU
7-Zip 18.03: 7z b 4 | 7z b 4 -mmt1
Geekbench 5.5: Multi-Core | Single-Core
HWBOT x265 Benchmark v2.2: 4k Preset
LibreOffice : 20 Documents To PDF
R Benchmark 2.5: Overall mean
| CPU Performance rating | |
| Schenker XMG Neo 16 Raptor Lake | |
| Média da turma Gaming | |
| Asus ROG Zephyrus M16 GU604VY-NM042X | |
| MSI Creator Z16P B12UHST | |
| Lenovo Legion 5 Pro 16 G7 i7 RTX 3070Ti | |
| Asus ROG Zephyrus M16 GU603Z | |
| Acer Predator Triton 300 SE | |
| Média Intel Core i9-13900H | |
| HP Omen 17-ck1075ng | |
| Razer Blade 15 RZ09-0421NGG3-R3G1 | |
| Cinebench R23 / Multi Core | |
| Schenker XMG Neo 16 Raptor Lake | |
| Schenker XMG Neo 16 Raptor Lake | |
| Schenker XMG Neo 16 Raptor Lake | |
| Média da turma Gaming (10488 - 40970, n=110, últimos 2 anos) | |
| Asus ROG Zephyrus M16 GU604VY-NM042X | |
| Lenovo Legion 5 Pro 16 G7 i7 RTX 3070Ti | |
| MSI Creator Z16P B12UHST | |
| Média Intel Core i9-13900H (11997 - 20385, n=28) | |
| Razer Blade 15 RZ09-0421NGG3-R3G1 | |
| Acer Predator Triton 300 SE | |
| Asus ROG Zephyrus M16 GU603Z | |
| HP Omen 17-ck1075ng | |
| Cinebench R23 / Single Core | |
| Schenker XMG Neo 16 Raptor Lake | |
| Média da turma Gaming (1166 - 2356, n=110, últimos 2 anos) | |
| Asus ROG Zephyrus M16 GU604VY-NM042X | |
| MSI Creator Z16P B12UHST | |
| Acer Predator Triton 300 SE | |
| Média Intel Core i9-13900H (1297 - 2054, n=26) | |
| Asus ROG Zephyrus M16 GU603Z | |
| Lenovo Legion 5 Pro 16 G7 i7 RTX 3070Ti | |
| HP Omen 17-ck1075ng | |
| Razer Blade 15 RZ09-0421NGG3-R3G1 | |
| Cinebench R20 / CPU (Multi Core) | |
| Schenker XMG Neo 16 Raptor Lake | |
| Média da turma Gaming (4029 - 16108, n=109, últimos 2 anos) | |
| Asus ROG Zephyrus M16 GU604VY-NM042X | |
| Lenovo Legion 5 Pro 16 G7 i7 RTX 3070Ti | |
| MSI Creator Z16P B12UHST | |
| Média Intel Core i9-13900H (4935 - 7716, n=25) | |
| Razer Blade 15 RZ09-0421NGG3-R3G1 | |
| Acer Predator Triton 300 SE | |
| Asus ROG Zephyrus M16 GU603Z | |
| HP Omen 17-ck1075ng | |
| Cinebench R20 / CPU (Single Core) | |
| Média da turma Gaming (442 - 895, n=109, últimos 2 anos) | |
| Schenker XMG Neo 16 Raptor Lake | |
| Asus ROG Zephyrus M16 GU604VY-NM042X | |
| MSI Creator Z16P B12UHST | |
| Acer Predator Triton 300 SE | |
| Média Intel Core i9-13900H (428 - 792, n=25) | |
| Asus ROG Zephyrus M16 GU603Z | |
| Lenovo Legion 5 Pro 16 G7 i7 RTX 3070Ti | |
| HP Omen 17-ck1075ng | |
| Razer Blade 15 RZ09-0421NGG3-R3G1 | |
| Cinebench R15 / CPU Multi 64Bit | |
| Schenker XMG Neo 16 Raptor Lake | |
| Schenker XMG Neo 16 Raptor Lake | |
| Média da turma Gaming (1578 - 6271, n=108, últimos 2 anos) | |
| Asus ROG Zephyrus M16 GU604VY-NM042X | |
| Lenovo Legion 5 Pro 16 G7 i7 RTX 3070Ti | |
| MSI Creator Z16P B12UHST | |
| Média Intel Core i9-13900H (2061 - 3100, n=26) | |
| Razer Blade 15 RZ09-0421NGG3-R3G1 | |
| Asus ROG Zephyrus M16 GU603Z | |
| HP Omen 17-ck1075ng | |
| HP Omen 17-ck1075ng | |
| Acer Predator Triton 300 SE | |
| Cinebench R15 / CPU Single 64Bit | |
| Schenker XMG Neo 16 Raptor Lake | |
| Schenker XMG Neo 16 Raptor Lake | |
| Média da turma Gaming (188.8 - 343, n=109, últimos 2 anos) | |
| Asus ROG Zephyrus M16 GU604VY-NM042X | |
| MSI Creator Z16P B12UHST | |
| Acer Predator Triton 300 SE | |
| Média Intel Core i9-13900H (211 - 297, n=26) | |
| Lenovo Legion 5 Pro 16 G7 i7 RTX 3070Ti | |
| Asus ROG Zephyrus M16 GU603Z | |
| HP Omen 17-ck1075ng | |
| HP Omen 17-ck1075ng | |
| Razer Blade 15 RZ09-0421NGG3-R3G1 | |
| Blender / v2.79 BMW27 CPU | |
| HP Omen 17-ck1075ng | |
| Razer Blade 15 RZ09-0421NGG3-R3G1 | |
| Média Intel Core i9-13900H (166 - 268, n=24) | |
| Acer Predator Triton 300 SE | |
| Asus ROG Zephyrus M16 GU603Z | |
| MSI Creator Z16P B12UHST | |
| Lenovo Legion 5 Pro 16 G7 i7 RTX 3070Ti | |
| Asus ROG Zephyrus M16 GU604VY-NM042X | |
| Média da turma Gaming (80 - 330, n=107, últimos 2 anos) | |
| Schenker XMG Neo 16 Raptor Lake | |
| 7-Zip 18.03 / 7z b 4 | |
| Schenker XMG Neo 16 Raptor Lake | |
| Média da turma Gaming (33491 - 148086, n=108, últimos 2 anos) | |
| Asus ROG Zephyrus M16 GU604VY-NM042X | |
| MSI Creator Z16P B12UHST | |
| Lenovo Legion 5 Pro 16 G7 i7 RTX 3070Ti | |
| Média Intel Core i9-13900H (45045 - 79032, n=25) | |
| Asus ROG Zephyrus M16 GU603Z | |
| Acer Predator Triton 300 SE | |
| Razer Blade 15 RZ09-0421NGG3-R3G1 | |
| HP Omen 17-ck1075ng | |
| 7-Zip 18.03 / 7z b 4 -mmt1 | |
| Schenker XMG Neo 16 Raptor Lake | |
| Média da turma Gaming (4199 - 7436, n=108, últimos 2 anos) | |
| Asus ROG Zephyrus M16 GU604VY-NM042X | |
| Asus ROG Zephyrus M16 GU603Z | |
| MSI Creator Z16P B12UHST | |
| Média Intel Core i9-13900H (3665 - 6600, n=25) | |
| Lenovo Legion 5 Pro 16 G7 i7 RTX 3070Ti | |
| HP Omen 17-ck1075ng | |
| Acer Predator Triton 300 SE | |
| Razer Blade 15 RZ09-0421NGG3-R3G1 | |
| Geekbench 5.5 / Multi-Core | |
| Schenker XMG Neo 16 Raptor Lake | |
| Média da turma Gaming (6460 - 27010, n=108, últimos 2 anos) | |
| Asus ROG Zephyrus M16 GU604VY-NM042X | |
| MSI Creator Z16P B12UHST | |
| Lenovo Legion 5 Pro 16 G7 i7 RTX 3070Ti | |
| Acer Predator Triton 300 SE | |
| Asus ROG Zephyrus M16 GU603Z | |
| Média Intel Core i9-13900H (9094 - 15410, n=26) | |
| Razer Blade 15 RZ09-0421NGG3-R3G1 | |
| HP Omen 17-ck1075ng | |
| Geekbench 5.5 / Single-Core | |
| Média da turma Gaming (986 - 2474, n=108, últimos 2 anos) | |
| Schenker XMG Neo 16 Raptor Lake | |
| Asus ROG Zephyrus M16 GU604VY-NM042X | |
| Média Intel Core i9-13900H (1140 - 2043, n=26) | |
| MSI Creator Z16P B12UHST | |
| Acer Predator Triton 300 SE | |
| Asus ROG Zephyrus M16 GU603Z | |
| HP Omen 17-ck1075ng | |
| Lenovo Legion 5 Pro 16 G7 i7 RTX 3070Ti | |
| Razer Blade 15 RZ09-0421NGG3-R3G1 | |
| HWBOT x265 Benchmark v2.2 / 4k Preset | |
| Schenker XMG Neo 16 Raptor Lake | |
| Média da turma Gaming (11.5 - 44.3, n=108, últimos 2 anos) | |
| Asus ROG Zephyrus M16 GU604VY-NM042X | |
| Lenovo Legion 5 Pro 16 G7 i7 RTX 3070Ti | |
| MSI Creator Z16P B12UHST | |
| Asus ROG Zephyrus M16 GU603Z | |
| Acer Predator Triton 300 SE | |
| Média Intel Core i9-13900H (14.1 - 22.3, n=25) | |
| Razer Blade 15 RZ09-0421NGG3-R3G1 | |
| HP Omen 17-ck1075ng | |
| LibreOffice / 20 Documents To PDF | |
| Razer Blade 15 RZ09-0421NGG3-R3G1 | |
| Asus ROG Zephyrus M16 GU604VY-NM042X | |
| Média da turma Gaming (19 - 88.8, n=108, últimos 2 anos) | |
| Média Intel Core i9-13900H (34.4 - 82.8, n=25) | |
| Schenker XMG Neo 16 Raptor Lake | |
| HP Omen 17-ck1075ng | |
| Asus ROG Zephyrus M16 GU603Z | |
| Lenovo Legion 5 Pro 16 G7 i7 RTX 3070Ti | |
| Acer Predator Triton 300 SE | |
| MSI Creator Z16P B12UHST | |
| R Benchmark 2.5 / Overall mean | |
| Razer Blade 15 RZ09-0421NGG3-R3G1 | |
| HP Omen 17-ck1075ng | |
| Lenovo Legion 5 Pro 16 G7 i7 RTX 3070Ti | |
| Média Intel Core i9-13900H (0.4052 - 0.723, n=25) | |
| Asus ROG Zephyrus M16 GU603Z | |
| MSI Creator Z16P B12UHST | |
| Acer Predator Triton 300 SE | |
| Média da turma Gaming (0.3439 - 0.759, n=109, últimos 2 anos) | |
| Asus ROG Zephyrus M16 GU604VY-NM042X | |
| Schenker XMG Neo 16 Raptor Lake | |
* ... menor é melhor
AIDA64: FP32 Ray-Trace | FPU Julia | CPU SHA3 | CPU Queen | FPU SinJulia | FPU Mandel | CPU AES | CPU ZLib | FP64 Ray-Trace | CPU PhotoWorxx
| Performance rating | |
| MSI Titan GT77 HX 13VI | |
| Asus ROG Strix Scar 18 2023 G834JY-N6005W | |
| Lenovo Legion Pro 7 16IRX8H | |
| Média da turma Gaming | |
| Razer Blade 16 Early 2023 | |
| Asus ROG Zephyrus M16 GU604VY-NM042X | |
| Asus ROG Zephyrus M16 GU603Z | |
| Média Intel Core i9-13900H | |
| AIDA64 / FP32 Ray-Trace | |
| Média da turma Gaming (10227 - 85542, n=107, últimos 2 anos) | |
| MSI Titan GT77 HX 13VI | |
| Asus ROG Strix Scar 18 2023 G834JY-N6005W | |
| Lenovo Legion Pro 7 16IRX8H | |
| Razer Blade 16 Early 2023 | |
| Razer Blade 16 Early 2023 | |
| Razer Blade 16 Early 2023 | |
| Asus ROG Zephyrus M16 GU604VY-NM042X | |
| Asus ROG Zephyrus M16 GU603Z | |
| Média Intel Core i9-13900H (6788 - 19557, n=25) | |
| AIDA64 / FPU Julia | |
| MSI Titan GT77 HX 13VI | |
| Asus ROG Strix Scar 18 2023 G834JY-N6005W | |
| Média da turma Gaming (51376 - 238426, n=107, últimos 2 anos) | |
| Lenovo Legion Pro 7 16IRX8H | |
| Razer Blade 16 Early 2023 | |
| Razer Blade 16 Early 2023 | |
| Razer Blade 16 Early 2023 | |
| Asus ROG Zephyrus M16 GU604VY-NM042X | |
| Média Intel Core i9-13900H (22551 - 95579, n=25) | |
| Asus ROG Zephyrus M16 GU603Z | |
| AIDA64 / CPU SHA3 | |
| MSI Titan GT77 HX 13VI | |
| Asus ROG Strix Scar 18 2023 G834JY-N6005W | |
| Lenovo Legion Pro 7 16IRX8H | |
| Razer Blade 16 Early 2023 | |
| Razer Blade 16 Early 2023 | |
| Razer Blade 16 Early 2023 | |
| Média da turma Gaming (2180 - 9817, n=107, últimos 2 anos) | |
| Asus ROG Zephyrus M16 GU604VY-NM042X | |
| Média Intel Core i9-13900H (2491 - 4270, n=25) | |
| Asus ROG Zephyrus M16 GU603Z | |
| AIDA64 / CPU Queen | |
| Asus ROG Strix Scar 18 2023 G834JY-N6005W | |
| MSI Titan GT77 HX 13VI | |
| Razer Blade 16 Early 2023 | |
| Razer Blade 16 Early 2023 | |
| Lenovo Legion Pro 7 16IRX8H | |
| Asus ROG Zephyrus M16 GU604VY-NM042X | |
| Média da turma Gaming (49785 - 173351, n=95, últimos 2 anos) | |
| Asus ROG Zephyrus M16 GU603Z | |
| Média Intel Core i9-13900H (65121 - 120936, n=25) | |
| AIDA64 / FPU SinJulia | |
| Asus ROG Strix Scar 18 2023 G834JY-N6005W | |
| MSI Titan GT77 HX 13VI | |
| Razer Blade 16 Early 2023 | |
| Razer Blade 16 Early 2023 | |
| Razer Blade 16 Early 2023 | |
| Lenovo Legion Pro 7 16IRX8H | |
| Média da turma Gaming (4424 - 33636, n=107, últimos 2 anos) | |
| Asus ROG Zephyrus M16 GU604VY-NM042X | |
| Média Intel Core i9-13900H (6108 - 11631, n=25) | |
| Asus ROG Zephyrus M16 GU603Z | |
| AIDA64 / FPU Mandel | |
| Média da turma Gaming (25115 - 128721, n=107, últimos 2 anos) | |
| MSI Titan GT77 HX 13VI | |
| Asus ROG Strix Scar 18 2023 G834JY-N6005W | |
| Lenovo Legion Pro 7 16IRX8H | |
| Razer Blade 16 Early 2023 | |
| Razer Blade 16 Early 2023 | |
| Razer Blade 16 Early 2023 | |
| Asus ROG Zephyrus M16 GU604VY-NM042X | |
| Média Intel Core i9-13900H (11283 - 48474, n=25) | |
| Asus ROG Zephyrus M16 GU603Z | |
| AIDA64 / CPU ZLib | |
| MSI Titan GT77 HX 13VI | |
| Asus ROG Strix Scar 18 2023 G834JY-N6005W | |
| Lenovo Legion Pro 7 16IRX8H | |
| Razer Blade 16 Early 2023 | |
| Razer Blade 16 Early 2023 | |
| Razer Blade 16 Early 2023 | |
| Média da turma Gaming (574 - 2531, n=107, últimos 2 anos) | |
| Asus ROG Zephyrus M16 GU604VY-NM042X | |
| Média Intel Core i9-13900H (789 - 1254, n=25) | |
| Asus ROG Zephyrus M16 GU603Z | |
| AIDA64 / FP64 Ray-Trace | |
| Média da turma Gaming (5509 - 45446, n=107, últimos 2 anos) | |
| MSI Titan GT77 HX 13VI | |
| Asus ROG Strix Scar 18 2023 G834JY-N6005W | |
| Lenovo Legion Pro 7 16IRX8H | |
| Razer Blade 16 Early 2023 | |
| Razer Blade 16 Early 2023 | |
| Razer Blade 16 Early 2023 | |
| Asus ROG Zephyrus M16 GU604VY-NM042X | |
| Asus ROG Zephyrus M16 GU603Z | |
| Média Intel Core i9-13900H (3655 - 10716, n=25) | |
| AIDA64 / CPU PhotoWorxx | |
| Razer Blade 16 Early 2023 | |
| Razer Blade 16 Early 2023 | |
| Razer Blade 16 Early 2023 | |
| Lenovo Legion Pro 7 16IRX8H | |
| Asus ROG Zephyrus M16 GU604VY-NM042X | |
| Média da turma Gaming (12271 - 89891, n=107, últimos 2 anos) | |
| Asus ROG Strix Scar 18 2023 G834JY-N6005W | |
| Asus ROG Zephyrus M16 GU603Z | |
| MSI Titan GT77 HX 13VI | |
| Média Intel Core i9-13900H (10871 - 50488, n=25) | |
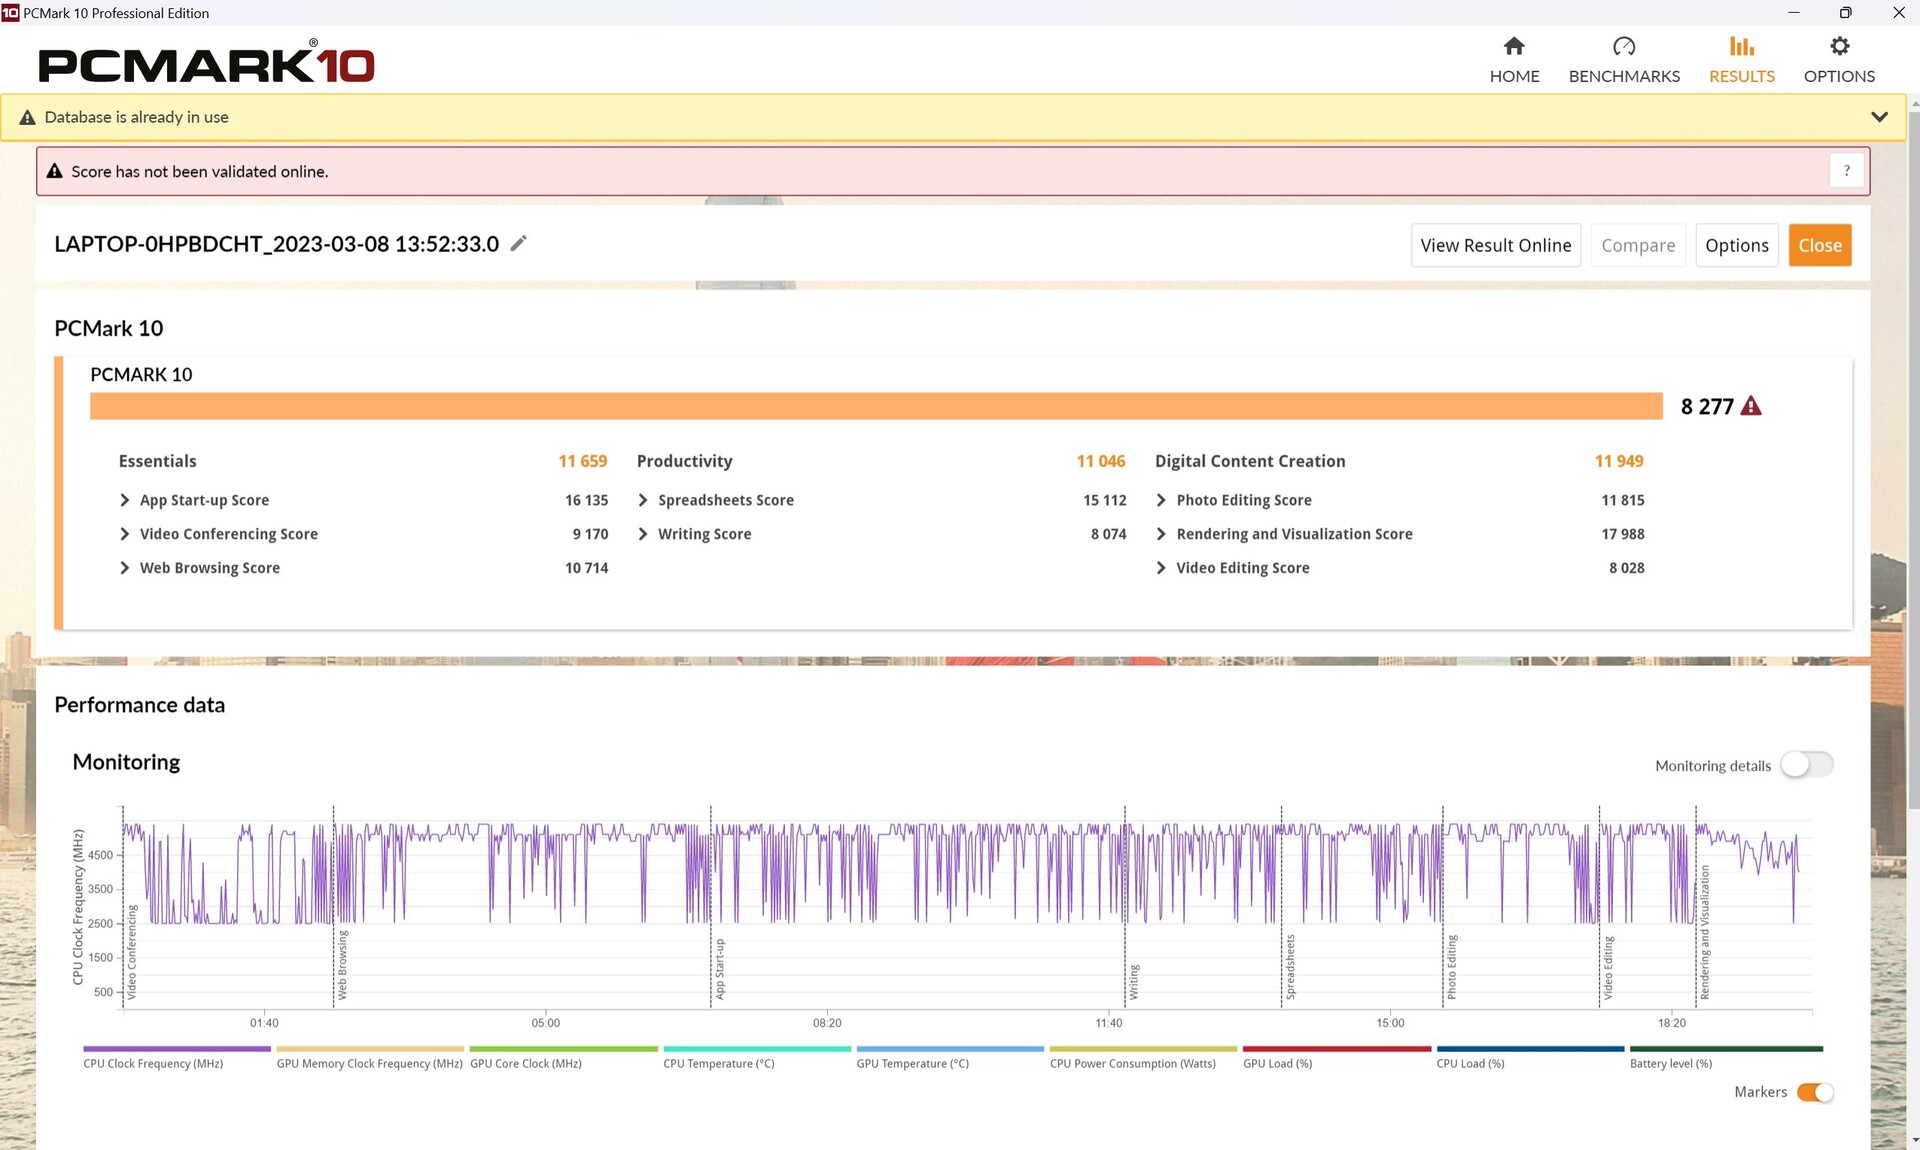
Desempenho do sistema
Nossa M16 não mostrou nenhuma grande fraqueza no PCMark10, mas também não pode ser exatamente acusada de superar a concorrência da última geração. OLegion 7 é na verdade alguns pontos percentuais mais rápido. No teste de criação de conteúdo digital, as notas são um tanto decepcionantes, especialmente nas áreas de edição e renderização.
CrossMark: Overall | Productivity | Creativity | Responsiveness
| PCMark 10 / Score | |
| Lenovo Legion 7 16IAX7-82TD004SGE | |
| Média da turma Gaming (5828 - 11574, n=95, últimos 2 anos) | |
| Asus ROG Zephyrus M16 GU604VY-NM042X | |
| Alienware x17 R2 P48E | |
| Média Intel Core i9-13900H, NVIDIA GeForce RTX 4090 Laptop GPU (7985 - 8277, n=2) | |
| MSI Creator Z16P B12UHST | |
| Acer Predator Triton 500 SE PT516-52s-70KX | |
| Alienware x15 R2 P111F | |
| Asus ROG Zephyrus Duo 16 GX650RX | |
| PCMark 10 / Essentials | |
| Asus ROG Zephyrus M16 GU604VY-NM042X | |
| Média Intel Core i9-13900H, NVIDIA GeForce RTX 4090 Laptop GPU (11500 - 11659, n=2) | |
| Alienware x17 R2 P48E | |
| Lenovo Legion 7 16IAX7-82TD004SGE | |
| Alienware x15 R2 P111F | |
| MSI Creator Z16P B12UHST | |
| Acer Predator Triton 500 SE PT516-52s-70KX | |
| Média da turma Gaming (8810 - 12600, n=99, últimos 2 anos) | |
| Asus ROG Zephyrus Duo 16 GX650RX | |
| PCMark 10 / Productivity | |
| MSI Creator Z16P B12UHST | |
| Asus ROG Zephyrus M16 GU604VY-NM042X | |
| Lenovo Legion 7 16IAX7-82TD004SGE | |
| Média da turma Gaming (6845 - 21327, n=97, últimos 2 anos) | |
| Média Intel Core i9-13900H, NVIDIA GeForce RTX 4090 Laptop GPU (10526 - 11046, n=2) | |
| Alienware x15 R2 P111F | |
| Alienware x17 R2 P48E | |
| Acer Predator Triton 500 SE PT516-52s-70KX | |
| Asus ROG Zephyrus Duo 16 GX650RX | |
| PCMark 10 / Digital Content Creation | |
| Lenovo Legion 7 16IAX7-82TD004SGE | |
| Média da turma Gaming (7602 - 19657, n=97, últimos 2 anos) | |
| Alienware x17 R2 P48E | |
| Asus ROG Zephyrus M16 GU604VY-NM042X | |
| Média Intel Core i9-13900H, NVIDIA GeForce RTX 4090 Laptop GPU (11412 - 11949, n=2) | |
| MSI Creator Z16P B12UHST | |
| Acer Predator Triton 500 SE PT516-52s-70KX | |
| Alienware x15 R2 P111F | |
| Asus ROG Zephyrus Duo 16 GX650RX | |
| CrossMark / Overall | |
| Lenovo Legion 7 16IAX7-82TD004SGE | |
| Schenker XMG Neo 16 Raptor Lake | |
| Média da turma Gaming (1366 - 2409, n=95, últimos 2 anos) | |
| Asus ROG Zephyrus M16 GU604VY-NM042X | |
| Média Intel Core i9-13900H, NVIDIA GeForce RTX 4090 Laptop GPU (n=1) | |
| Alienware x15 R2 P111F | |
| Alienware x17 R2 P48E | |
| Acer Predator Triton 500 SE PT516-52s-70KX | |
| Asus ROG Zephyrus Duo 16 GX650RX | |
| Razer Blade 15 RZ09-0421NGG3-R3G1 | |
| CrossMark / Productivity | |
| Lenovo Legion 7 16IAX7-82TD004SGE | |
| Alienware x15 R2 P111F | |
| Média da turma Gaming (1386 - 2254, n=95, últimos 2 anos) | |
| Asus ROG Zephyrus M16 GU604VY-NM042X | |
| Média Intel Core i9-13900H, NVIDIA GeForce RTX 4090 Laptop GPU (n=1) | |
| Schenker XMG Neo 16 Raptor Lake | |
| Alienware x17 R2 P48E | |
| Acer Predator Triton 500 SE PT516-52s-70KX | |
| Asus ROG Zephyrus Duo 16 GX650RX | |
| Razer Blade 15 RZ09-0421NGG3-R3G1 | |
| CrossMark / Creativity | |
| Schenker XMG Neo 16 Raptor Lake | |
| Lenovo Legion 7 16IAX7-82TD004SGE | |
| Média da turma Gaming (1343 - 2729, n=95, últimos 2 anos) | |
| Asus ROG Zephyrus M16 GU604VY-NM042X | |
| Média Intel Core i9-13900H, NVIDIA GeForce RTX 4090 Laptop GPU (n=1) | |
| Alienware x15 R2 P111F | |
| Alienware x17 R2 P48E | |
| Acer Predator Triton 500 SE PT516-52s-70KX | |
| Razer Blade 15 RZ09-0421NGG3-R3G1 | |
| Asus ROG Zephyrus Duo 16 GX650RX | |
| CrossMark / Responsiveness | |
| Lenovo Legion 7 16IAX7-82TD004SGE | |
| Acer Predator Triton 500 SE PT516-52s-70KX | |
| Alienware x15 R2 P111F | |
| Asus ROG Zephyrus Duo 16 GX650RX | |
| Média da turma Gaming (1226 - 2334, n=95, últimos 2 anos) | |
| Alienware x17 R2 P48E | |
| Asus ROG Zephyrus M16 GU604VY-NM042X | |
| Média Intel Core i9-13900H, NVIDIA GeForce RTX 4090 Laptop GPU (n=1) | |
| Schenker XMG Neo 16 Raptor Lake | |
| Razer Blade 15 RZ09-0421NGG3-R3G1 | |
| PCMark 10 Score | 8277 pontos | |
Ajuda | ||
| AIDA64 / Memory Copy | |
| Razer Blade 16 Early 2023 | |
| Razer Blade 16 Early 2023 | |
| Razer Blade 16 Early 2023 | |
| Lenovo Legion Pro 7 16IRX8H | |
| Média da turma Gaming (21750 - 129946, n=107, últimos 2 anos) | |
| Asus ROG Zephyrus M16 GU604VY-NM042X | |
| Asus ROG Strix Scar 18 2023 G834JY-N6005W | |
| MSI Titan GT77 HX 13VI | |
| Asus ROG Zephyrus M16 GU603Z | |
| Média Intel Core i9-13900H (37448 - 74486, n=25) | |
| AIDA64 / Memory Read | |
| Razer Blade 16 Early 2023 | |
| Razer Blade 16 Early 2023 | |
| Razer Blade 16 Early 2023 | |
| Lenovo Legion Pro 7 16IRX8H | |
| Asus ROG Strix Scar 18 2023 G834JY-N6005W | |
| Média da turma Gaming (22956 - 118858, n=107, últimos 2 anos) | |
| Asus ROG Zephyrus M16 GU604VY-NM042X | |
| Asus ROG Zephyrus M16 GU603Z | |
| MSI Titan GT77 HX 13VI | |
| Média Intel Core i9-13900H (41599 - 75433, n=25) | |
| AIDA64 / Memory Write | |
| Razer Blade 16 Early 2023 | |
| Razer Blade 16 Early 2023 | |
| Razer Blade 16 Early 2023 | |
| Média da turma Gaming (22297 - 135096, n=107, últimos 2 anos) | |
| Asus ROG Zephyrus M16 GU604VY-NM042X | |
| Lenovo Legion Pro 7 16IRX8H | |
| Asus ROG Strix Scar 18 2023 G834JY-N6005W | |
| Asus ROG Zephyrus M16 GU603Z | |
| Média Intel Core i9-13900H (36152 - 88505, n=25) | |
| MSI Titan GT77 HX 13VI | |
| AIDA64 / Memory Latency | |
| Média da turma Gaming (75.3 - 259, n=107, últimos 2 anos) | |
| Razer Blade 16 Early 2023 | |
| Razer Blade 16 Early 2023 | |
| Razer Blade 16 Early 2023 | |
| MSI Titan GT77 HX 13VI | |
| Asus ROG Strix Scar 18 2023 G834JY-N6005W | |
| Média Intel Core i9-13900H (75.8 - 102.3, n=25) | |
| Asus ROG Zephyrus M16 GU603Z | |
| Asus ROG Zephyrus M16 GU604VY-NM042X | |
| Lenovo Legion Pro 7 16IRX8H | |
* ... menor é melhor
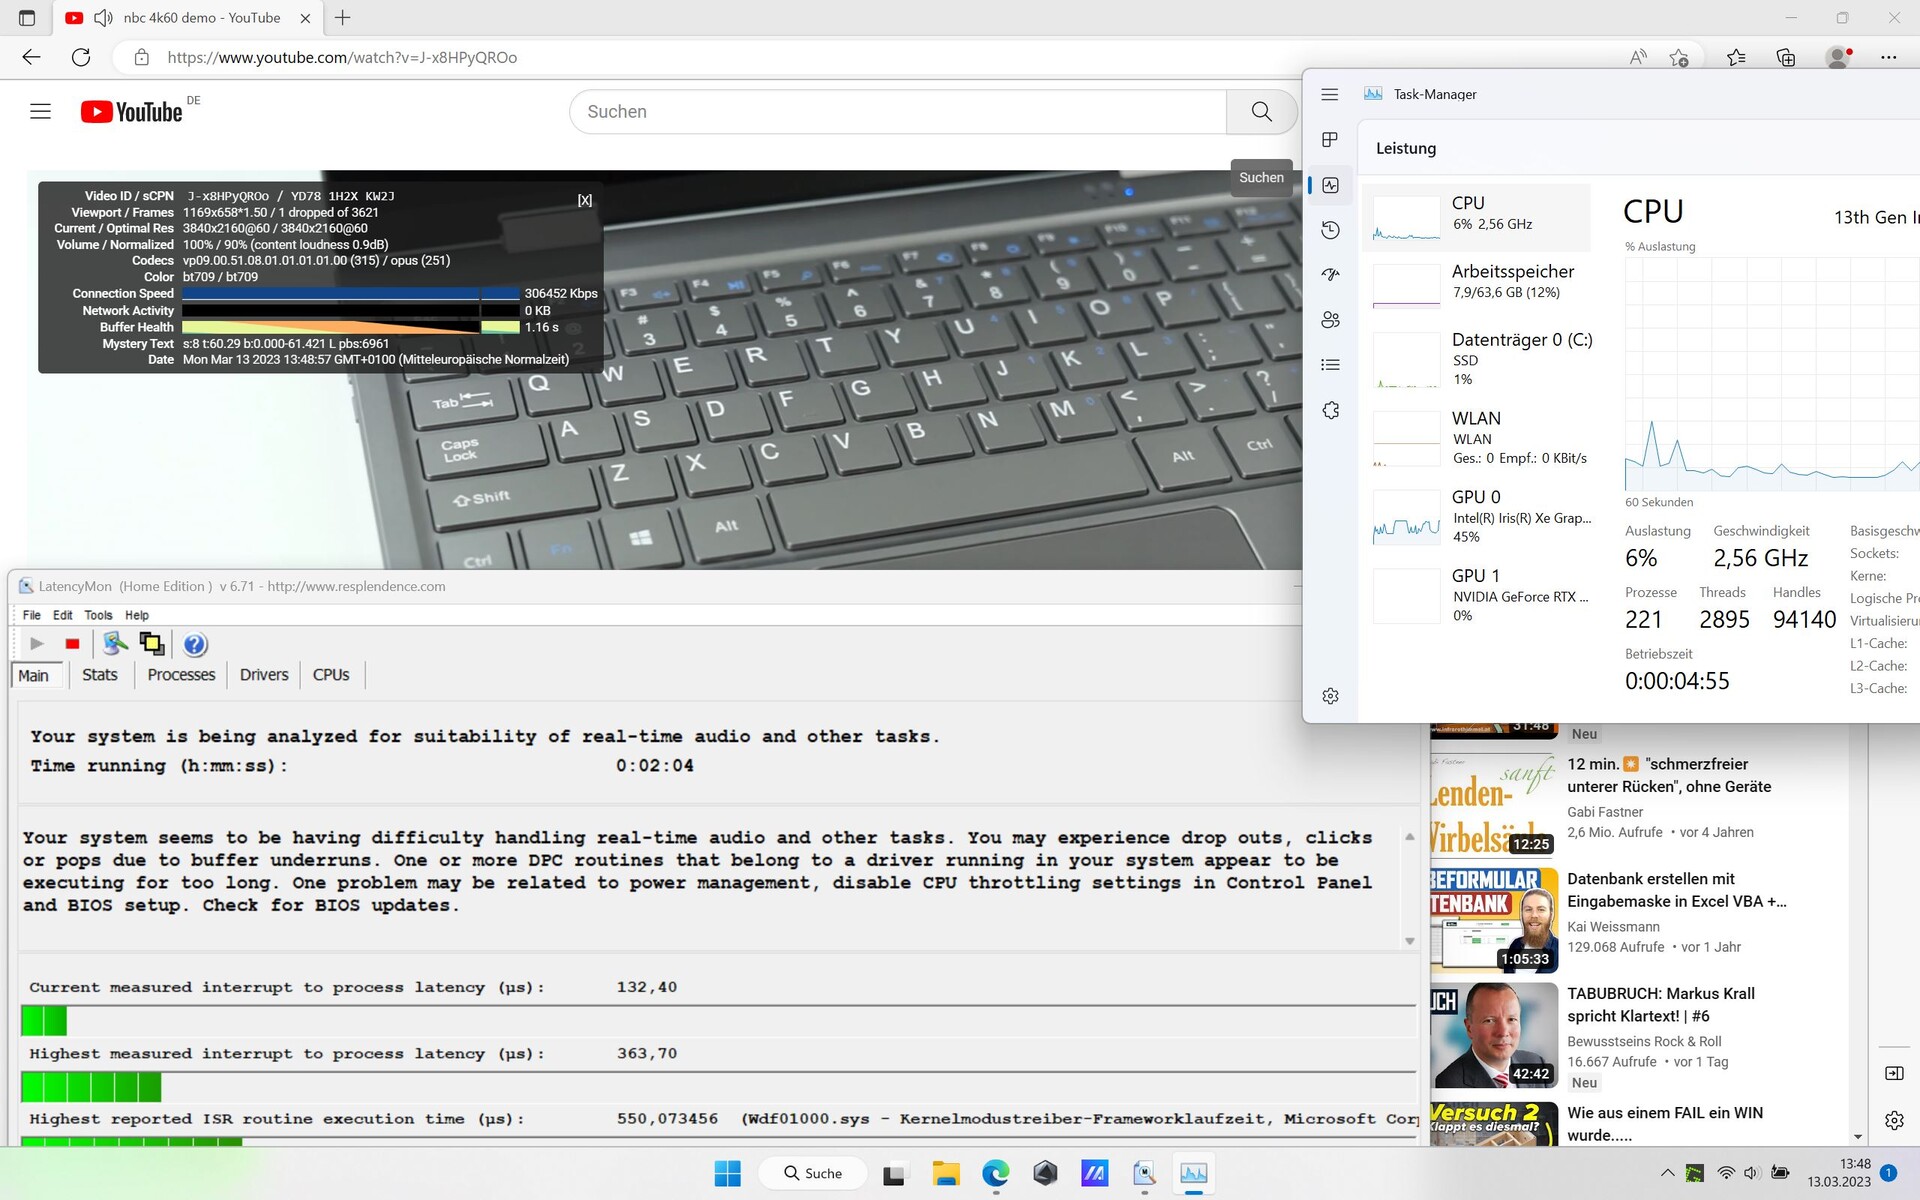
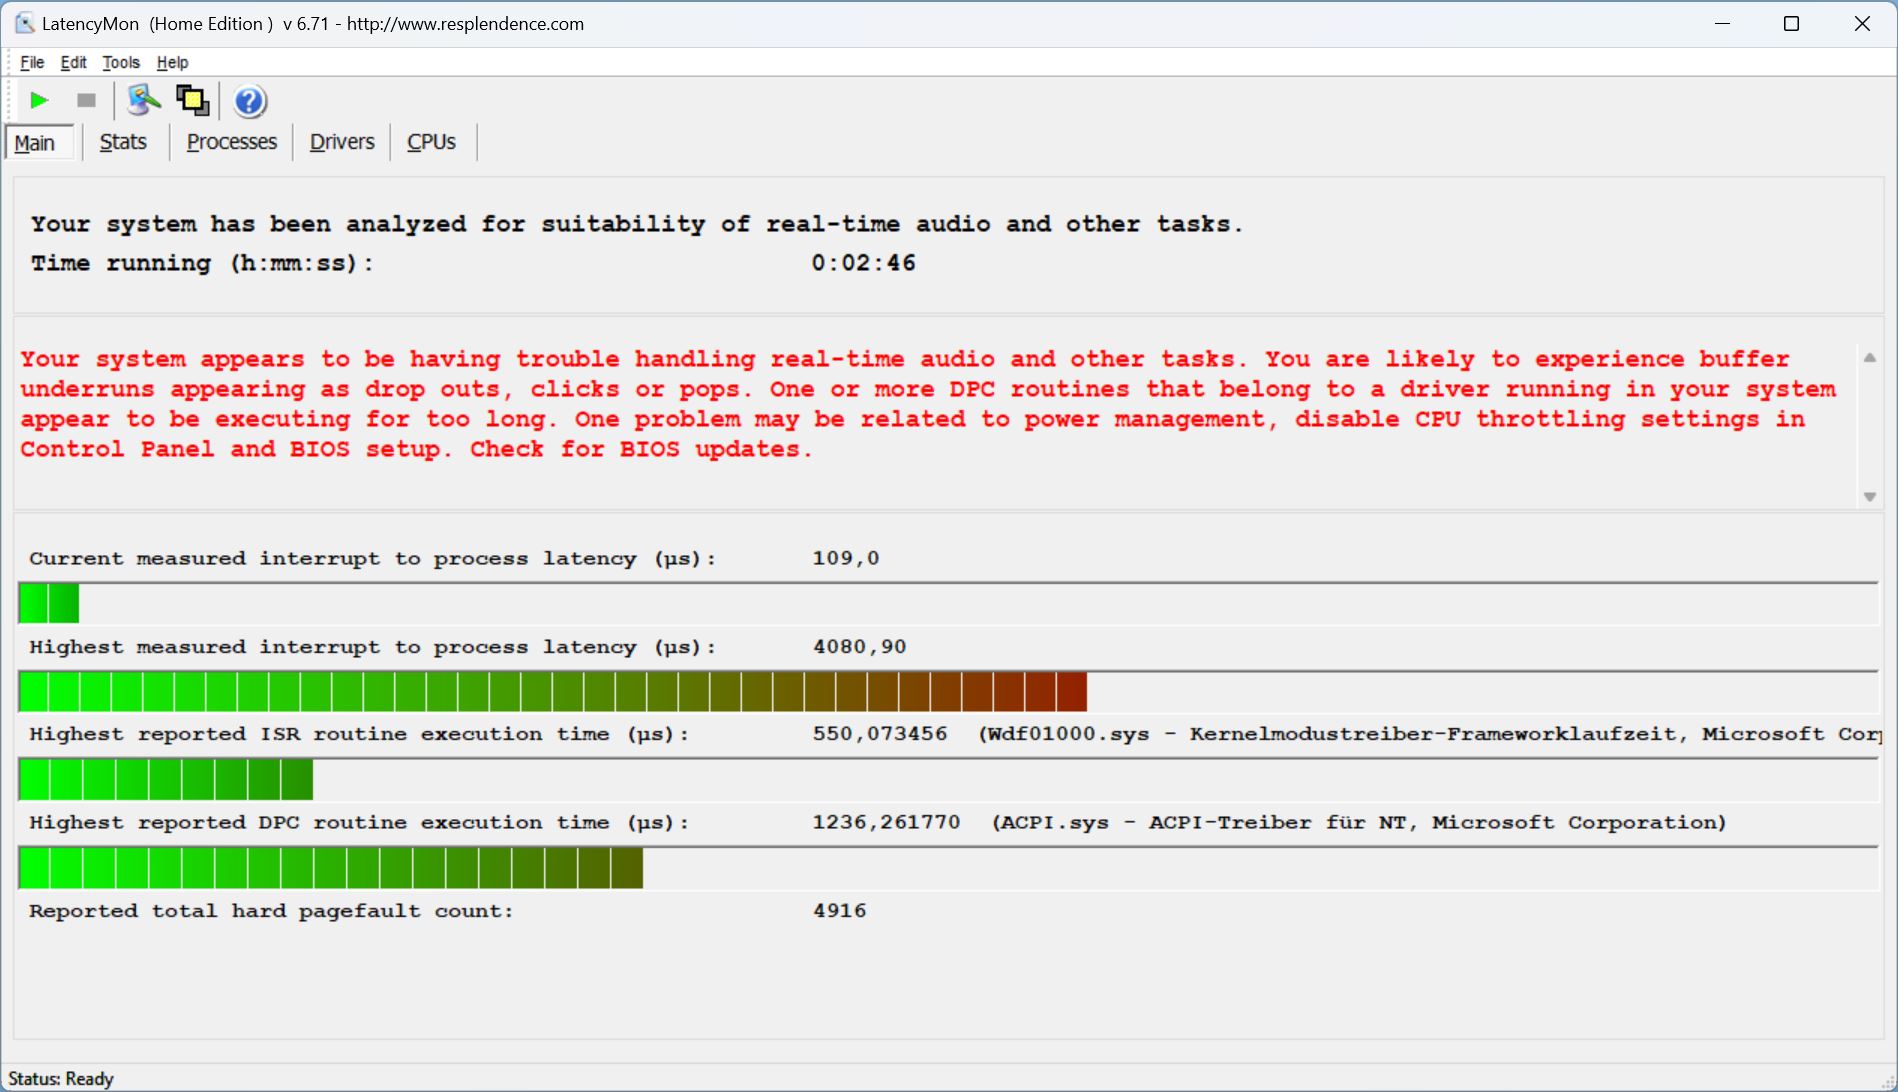
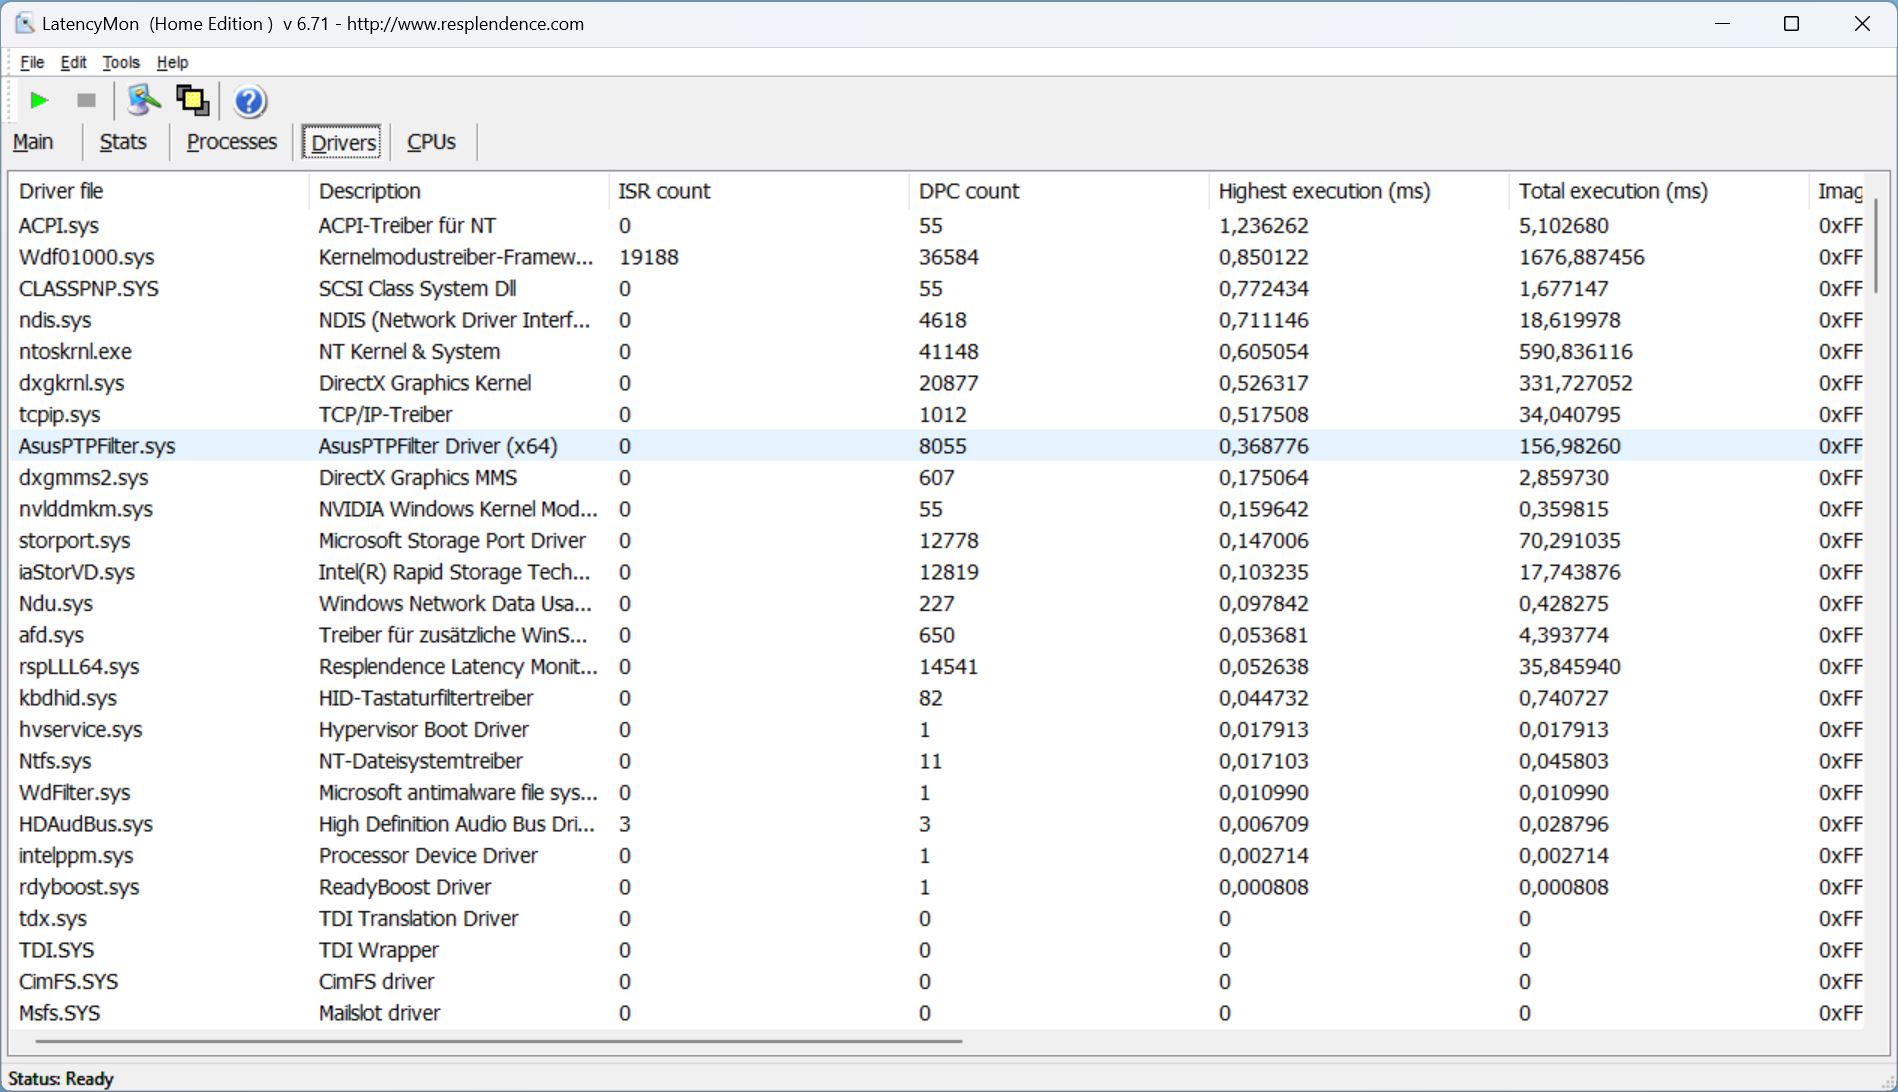
Latências DPC
A M16 não quebra um suor quando desafiada com a abertura de múltiplas abas do navegador. Tudo realmente parecia bom até que grandes latências se instalaram durante a reprodução de nossos vídeos 4k/60 fps no YouTube e posteriormente em Prime95. O que até então tinha sido realmente bons valores, disparou várias vezes.
Desta forma, a M16 tem latências significativamente mais altas do que a concorrência da última geração. Os motoristas da nova geração não parecem estar suficientemente maduros e isto é demonstrado pelos valores de latências igualmente altos observados noMSI Titan.
| DPC Latencies / LatencyMon - interrupt to process latency (max), Web, Youtube, Prime95 | |
| MSI Titan GT77 HX 13VI | |
| Asus ROG Zephyrus M16 GU604VY-NM042X | |
| Razer Blade 16 Early 2023 | |
| Asus ROG Strix Scar 18 2023 G834JY-N6005W | |
| Asus ROG Zephyrus M16 GU603Z | |
| Lenovo Legion Pro 7 16IRX8H | |
* ... menor é melhor
Armazenamento em massa
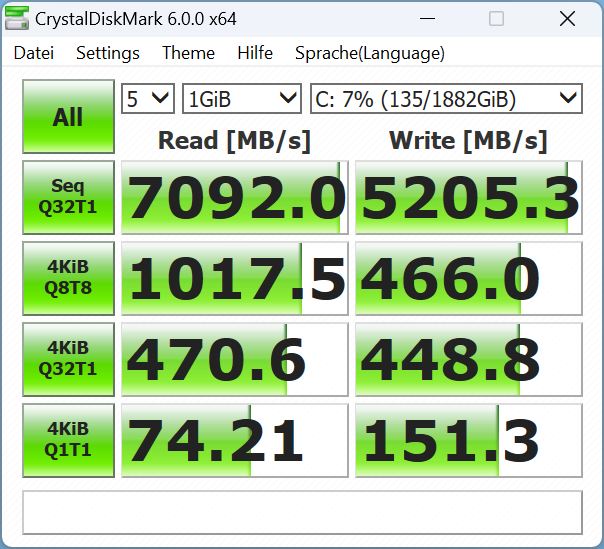
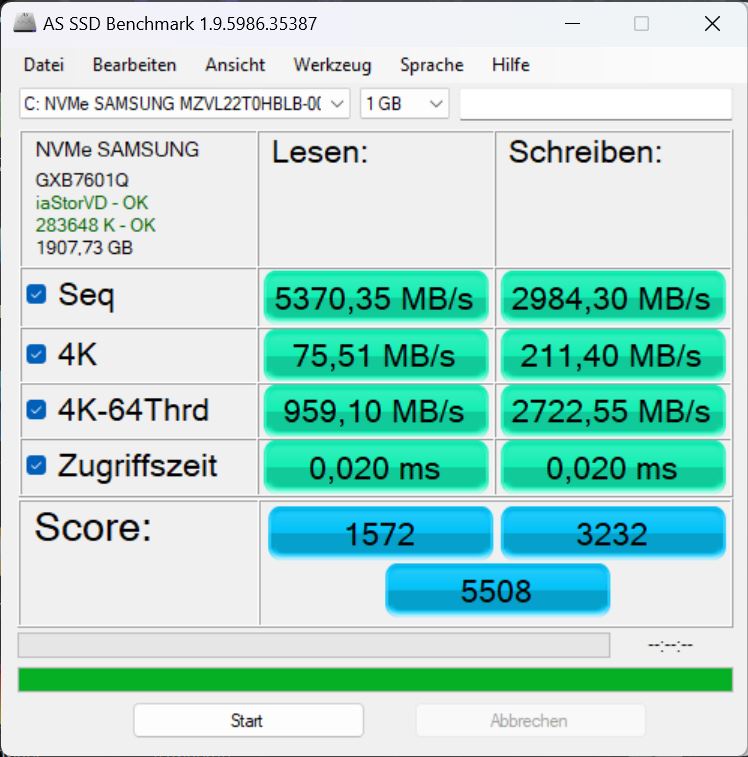
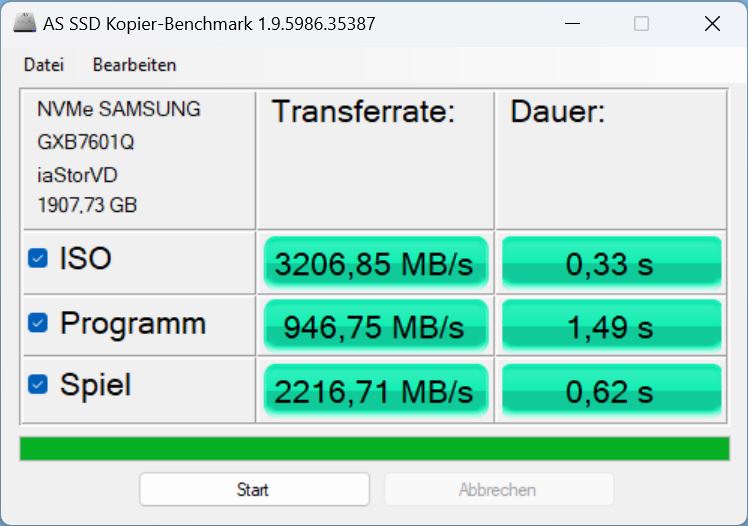
Nossa configuração tem um SSD NVMe Samsung PM9A1 com quatro pistas PCIe 4 e uma capacidade de 2 TB e fica em 11º lugar em nosso melhor lista de SSDs.
O desempenho do SSD da M16 está cerca de 20% abaixo do que pode ser esperado para este tipo de SSD. Entretanto, no uso real, isto passará em grande parte despercebido e, no lado positivo, o desempenho é estável durante períodos de tempo mais longos.

* ... menor é melhor
Continuous performance Read: DiskSpd Read Loop, Queue Depth 8
Placa gráfica
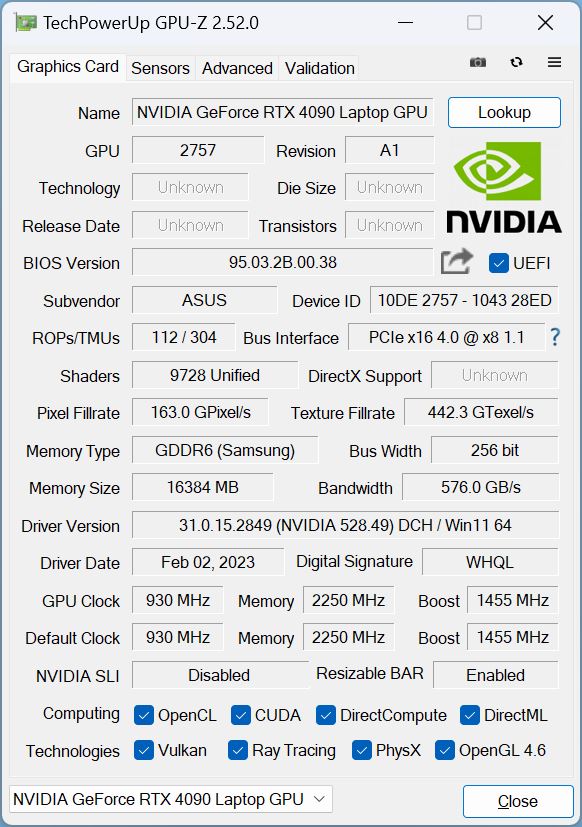
Com a nova M16, você tem uma escolha entre a RTX 4070, RTX 4080e RTX 4090. Em nossa configuração, o modelo superior é o GPU para laptop mais rápido atualmente disponível com seu consumo de energia variando entre 80 e 150 watts mais 15 watts de impulso dinâmico. A M16 pode consumir um máximo de 150 watts, o que inclui o impulso dinâmico de 25 watts.
Nos benchmarks 3DMark, houve problemas ocasionais na troca do dispositivo de exibição para o dGPU via Optimus ou MSHybrid/Standard, o que algumas vezes resultou no início dos testes pelo iGPU. Também nesta área, parece que os drivers não estão totalmente maduros. Em caso de dúvida, o dGPU deve ser ativado manualmente (MUX).
Até o momento, testamos apenas o RTX 4090 emparelhado com um processador HX (veja a competição). É um pouco surpreendente que a GPU do M16 seja, em todos os testes, cerca de 10% mais lenta do que a média da placa de acordo com nosso (ainda) banco de dados limitado. OLâmina Razer 16a diferença entre o RTX 4080 e o RTX 4080 é de apenas 4%.
No modo bateria, o desempenho 3D caiu drasticamente e em Fire Strike, restam apenas 9.000 pontos de um inicial de 44.000, representando uma queda de quase 80 por cento!

| 3DMark Performance rating - Percent | |
| Schenker XMG Neo 16 Raptor Lake | |
| Média NVIDIA GeForce RTX 4090 Laptop GPU | |
| Asus ROG Zephyrus M16 GU604VY-NM042X | |
| Razer Blade 16 Early 2023 | |
| Média da turma Gaming | |
| Lenovo Legion 7 16IAX7-82TD004SGE -1! | |
| Asus ROG Strix Scar 17 SE G733CX-LL014W | |
| MSI Raider GE66 12UHS | |
| Alienware x15 R2 P111F | |
| Acer Predator Triton 500 SE PT516-52s-70KX -1! | |
| Razer Blade 15 RZ09-0421NGG3-R3G1 -1! | |
| Asus ROG Zephyrus M16 GU603Z -1! | |
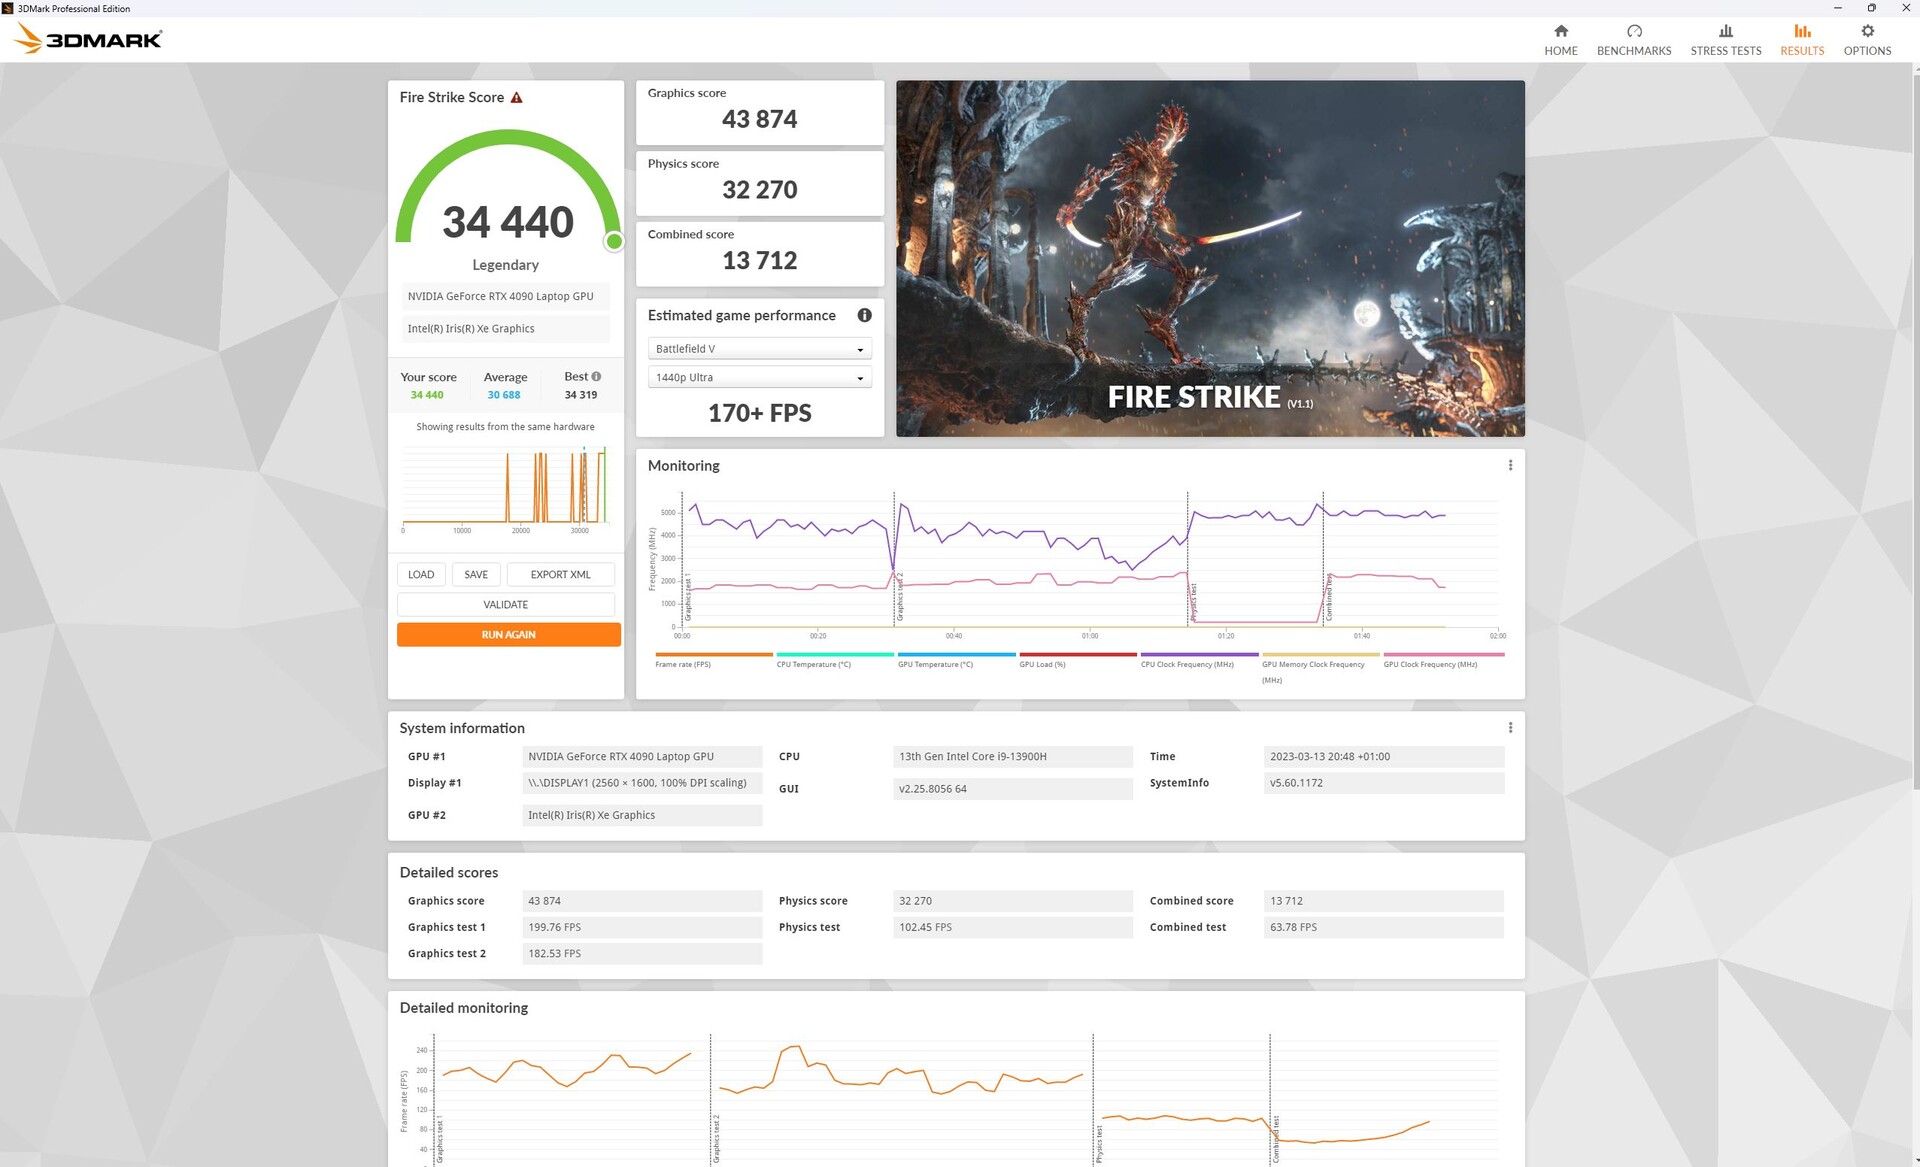
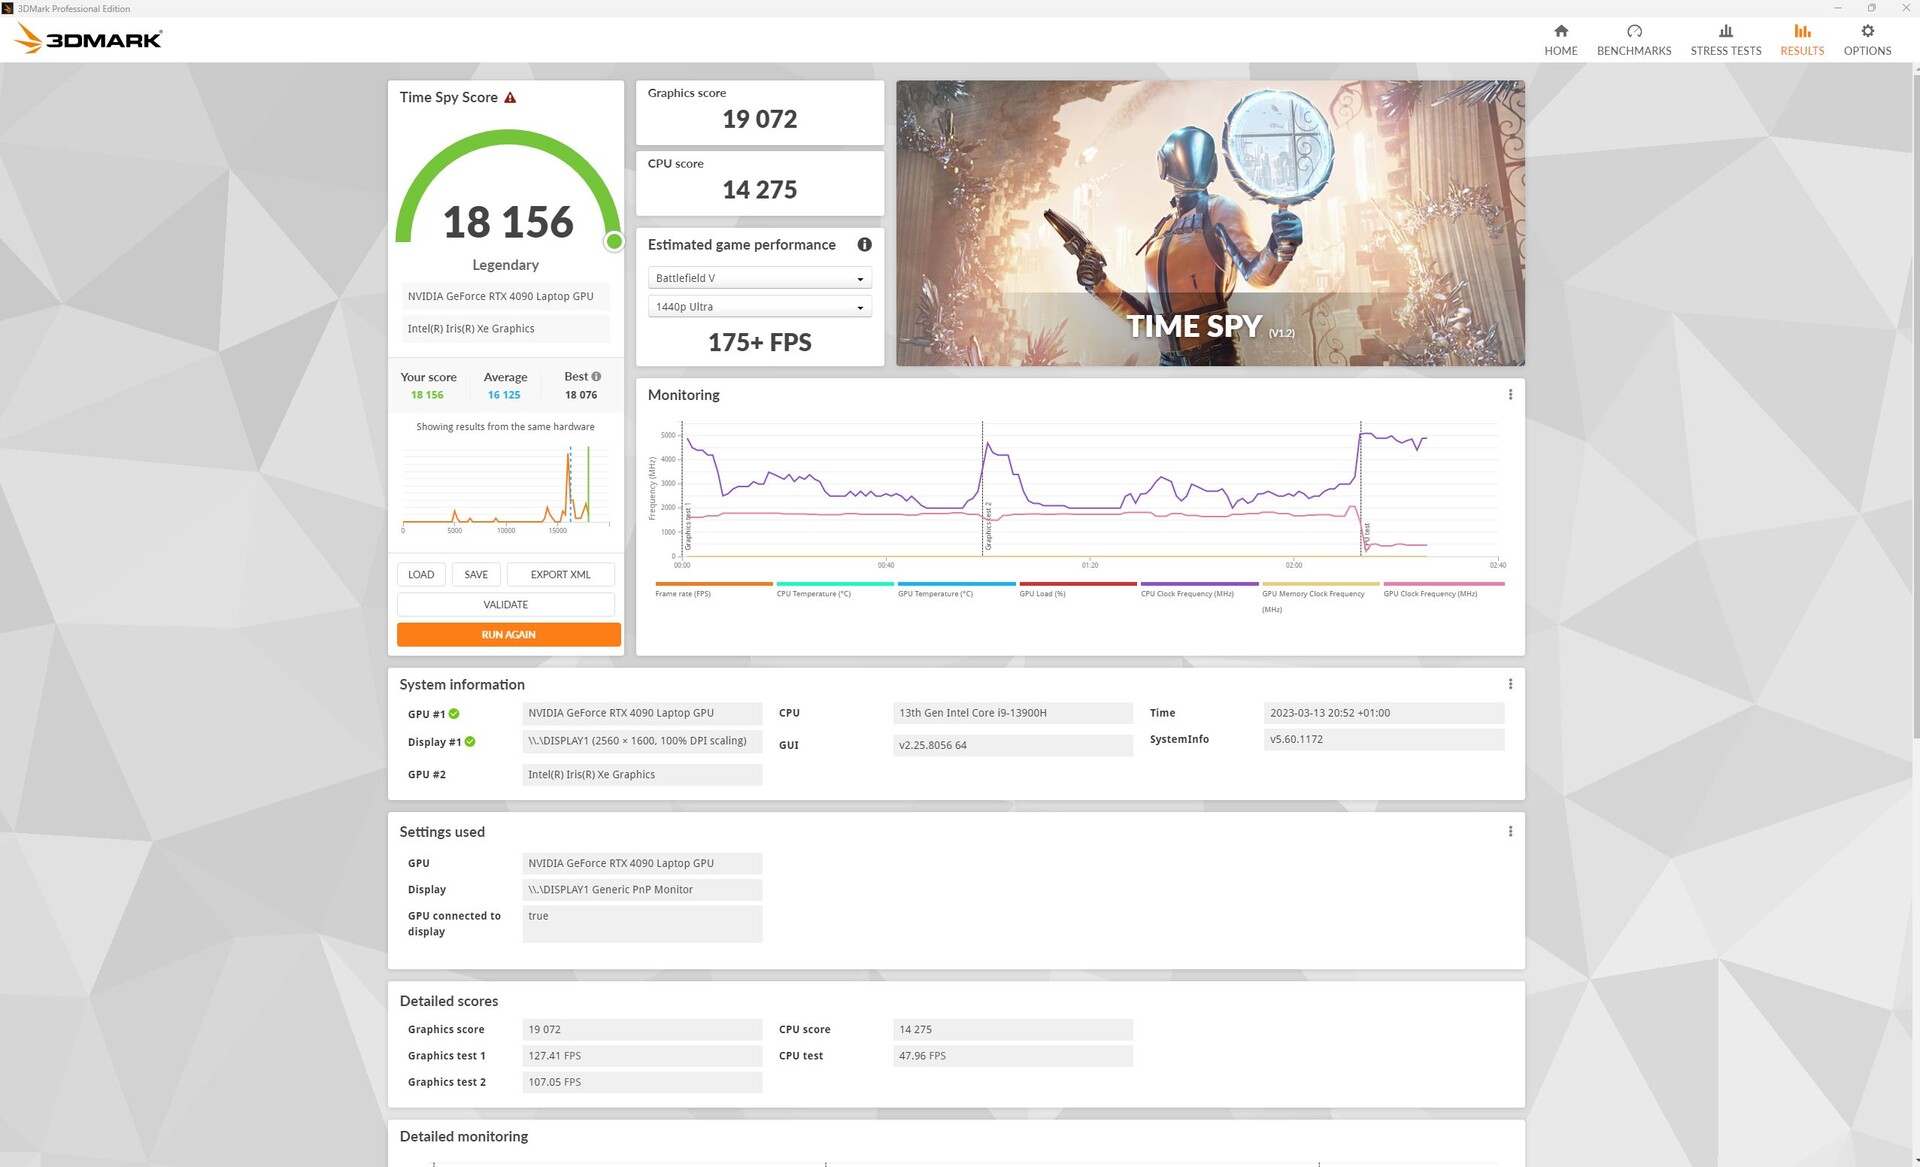
| 3DMark 11 Performance | 41060 pontos | |
| 3DMark Fire Strike Score | 33550 pontos | |
| 3DMark Time Spy Score | 15939 pontos | |
Ajuda | ||
* ... menor é melhor
Desempenho do jogo
Também ao jogar você nota os M16'sRTX 4090 não está emparelhado com uma CPU HX. Portáteis com uma CPU HX eRTX 4080tais como a Lâmina 16 ou oLegion 7são geralmente mais rápidos, especialmente quando definidos para baixas resoluções. OMSI Titancom um RTX 4090 desfruta da maior vantagem de desempenho sobre a M16.
Além disso, a M16 ainda tem muita energia de sobra a 4K, com sobra suficiente no tanque para traçado de raio, especialmente combinado com a tecnologia DLSS 3, AI upscaling. Você pode encontrar referências e informações adicionais a respeito da nova Cartões RTX 40, em nosso artigo de análise.
| The Witcher 3 - 1920x1080 Ultra Graphics & Postprocessing (HBAO+) | |
| MSI Titan GT77 HX 13VI | |
| Asus ROG Zephyrus M16 GU604VY-NM042X | |
| Lenovo Legion Pro 7 16IRX8H | |
| Razer Blade 16 Early 2023 | |
| Média da turma Gaming (95 - 240, n=8, últimos 2 anos) | |
| Asus ROG Zephyrus M16 GU603Z | |
| Far Cry 6 | |
| 2560x1440 Ultra Graphics Quality + HD Textures AA:T | |
| MSI Titan GT77 HX 13VI | |
| Schenker XMG Neo 16 Raptor Lake | |
| Média NVIDIA GeForce RTX 4090 Laptop GPU (85 - 146, n=12) | |
| Razer Blade 16 Early 2023 | |
| Asus ROG Zephyrus M16 GU604VY-NM042X | |
| Média da turma Gaming (74.5 - 116.7, n=2, últimos 2 anos) | |
| 1920x1080 Ultra Graphics Quality + HD Textures + DXR AA:T | |
| Razer Blade 16 Early 2023 | |
| MSI Titan GT77 HX 13VI | |
| Schenker XMG Neo 16 Raptor Lake | |
| Média da turma Gaming (n=1últimos 2 anos) | |
| Asus ROG Zephyrus M16 GU604VY-NM042X | |
| Média NVIDIA GeForce RTX 4090 Laptop GPU (81 - 116, n=5) | |
| Tiny Tina's Wonderlands - 2560x1440 Badass Preset (DX12) | |
| Schenker XMG Neo 16 Raptor Lake | |
| MSI Titan GT77 HX 13VI | |
| Média NVIDIA GeForce RTX 4090 Laptop GPU (103.4 - 137.8, n=14) | |
| Asus ROG Zephyrus M16 GU604VY-NM042X | |
| Média da turma Gaming (58.9 - 111.2, n=3, últimos 2 anos) | |
| Spider-Man Miles Morales - 2560x1440 Very High Preset AA:T | |
| Schenker XMG Neo 16 Raptor Lake | |
| MSI Titan GT77 HX 13VI | |
| Média NVIDIA GeForce RTX 4090 Laptop GPU (93.3 - 119.8, n=7) | |
| Asus ROG Strix Scar 18 2023 G834JY-N6005W | |
| Lenovo Legion Pro 7 16IRX8H | |
| Asus ROG Zephyrus M16 GU604VY-NM042X | |
Após uma hora em nosso Witcher 3 teste de estresse, é realmente óbvio que o desempenho está no mesmo nível de umRTX 4080emparelhado com um processador HX. No entanto, o desempenho é tão alto quanto constante.
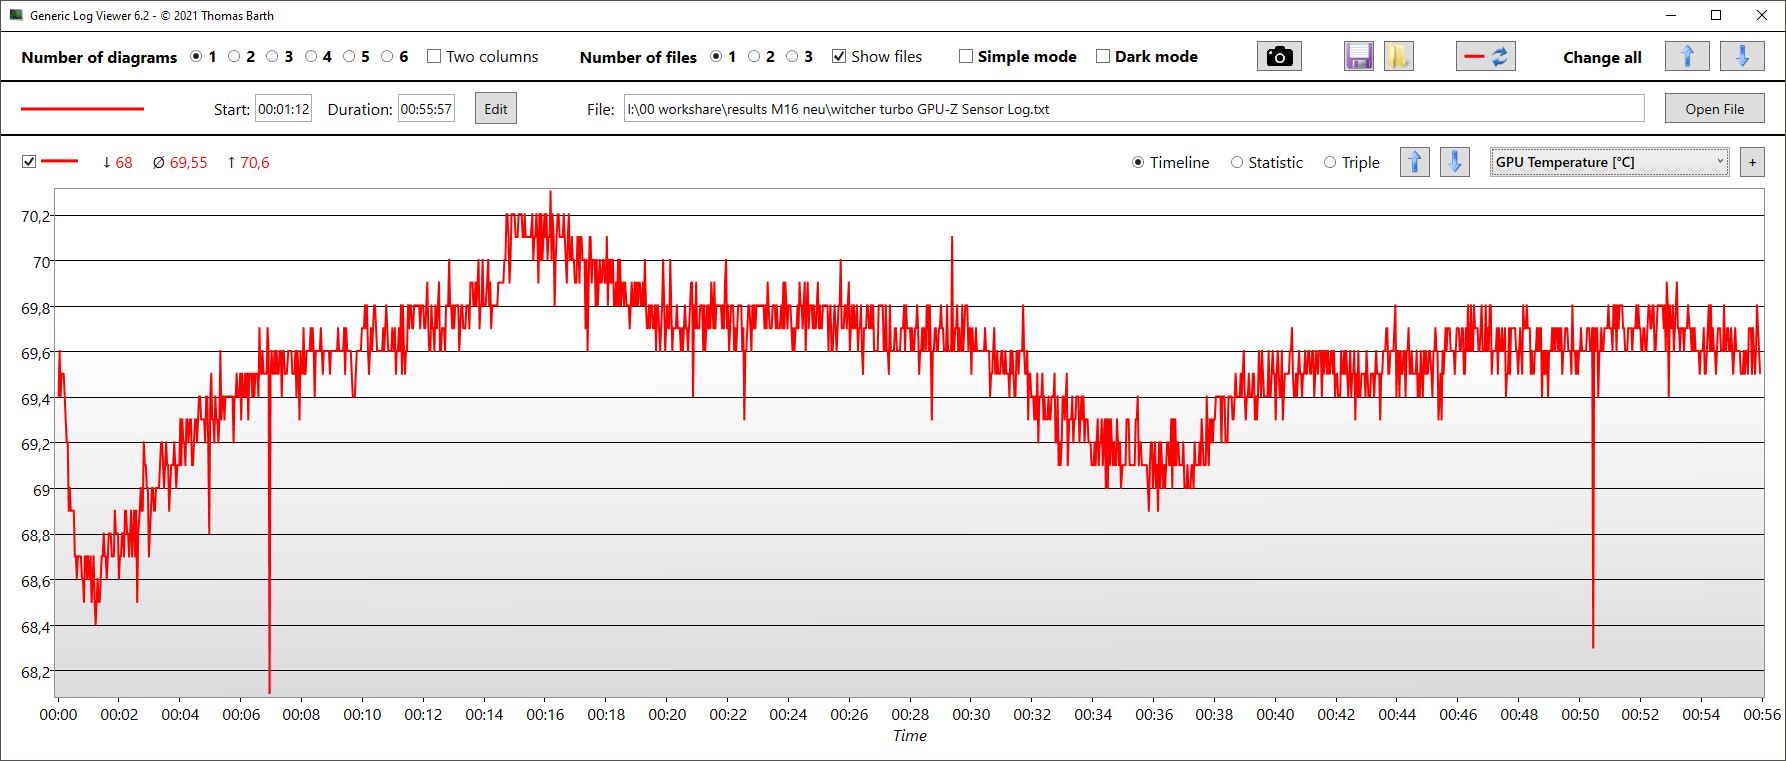
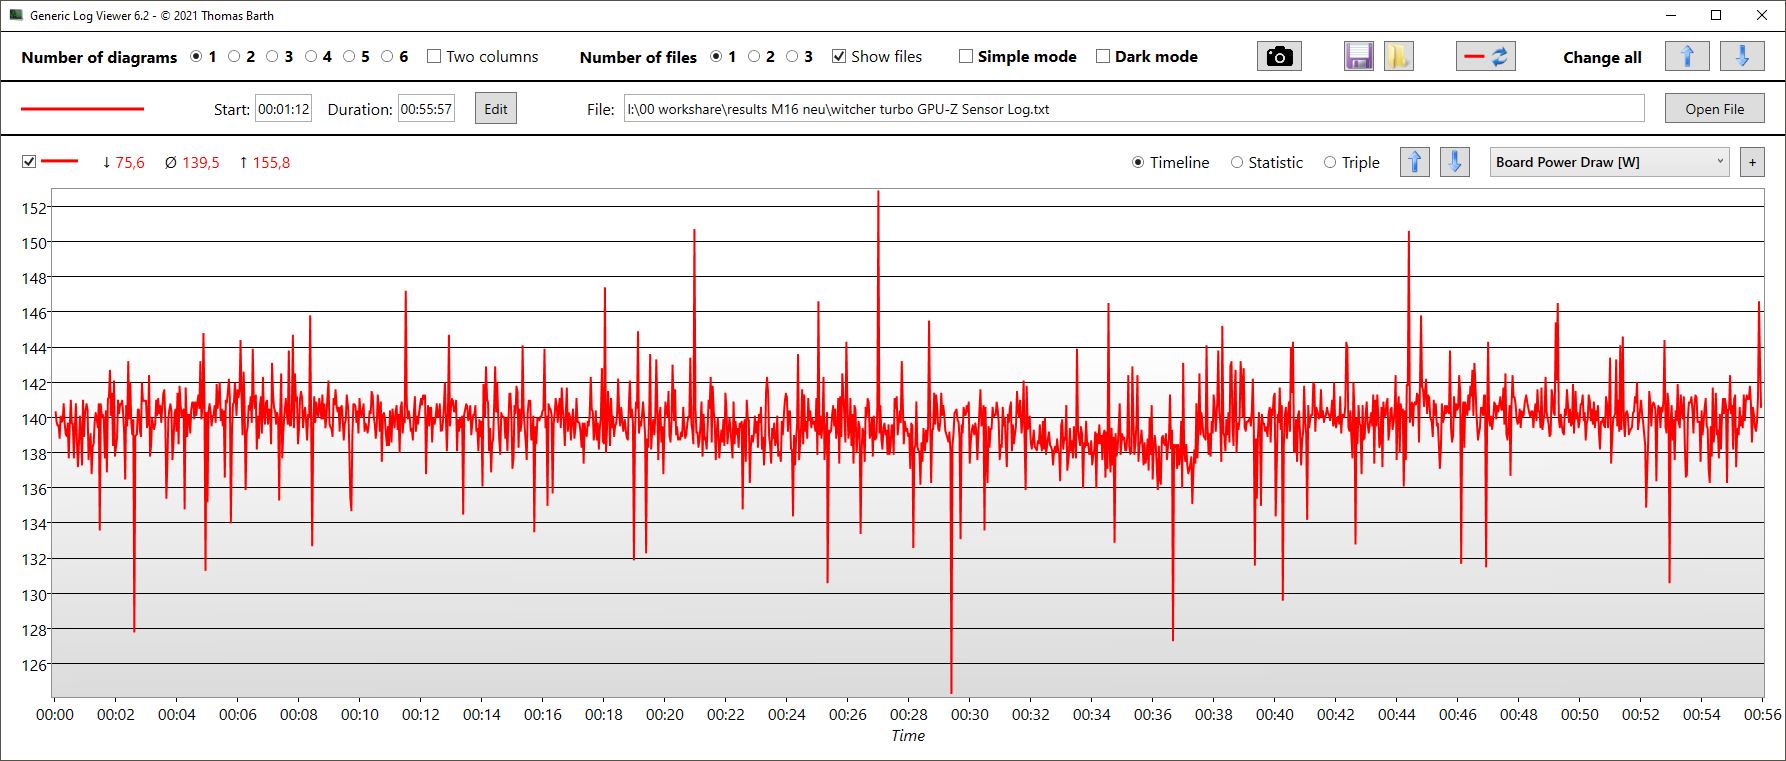
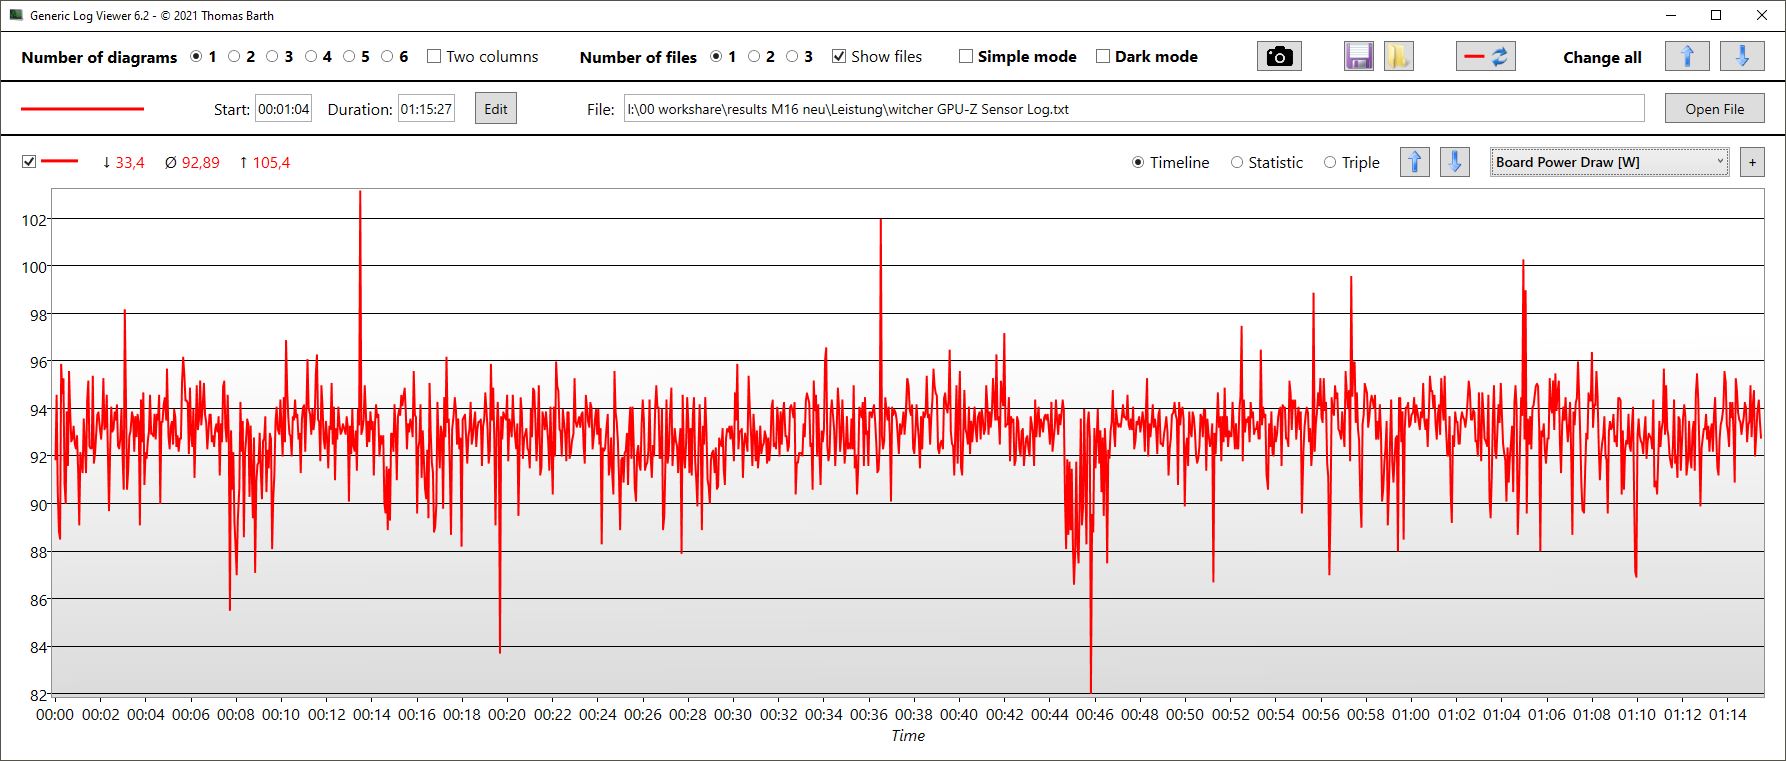
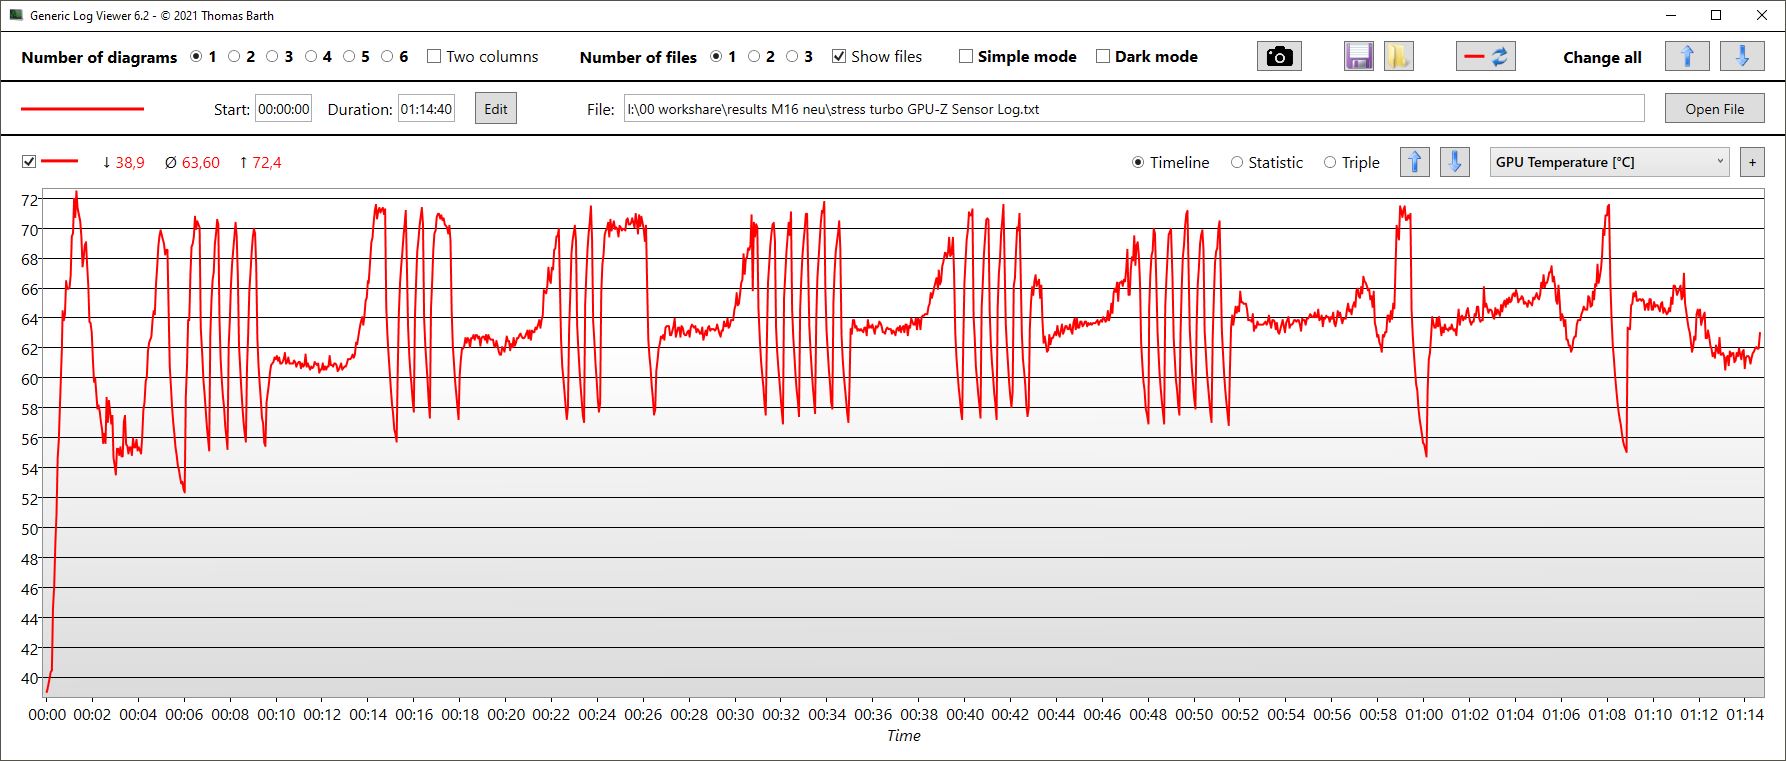
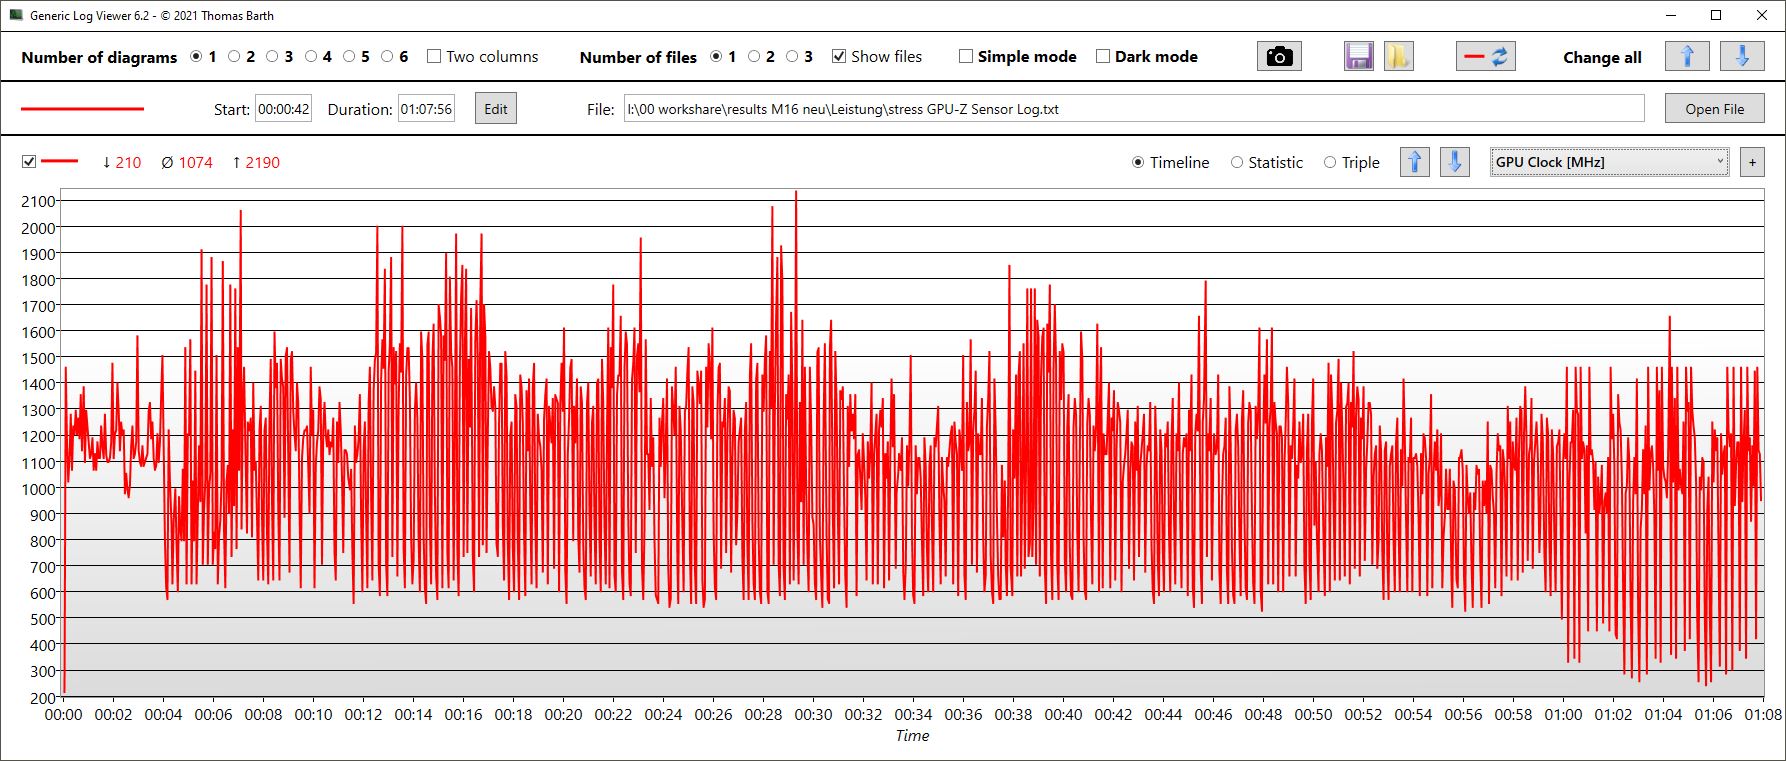
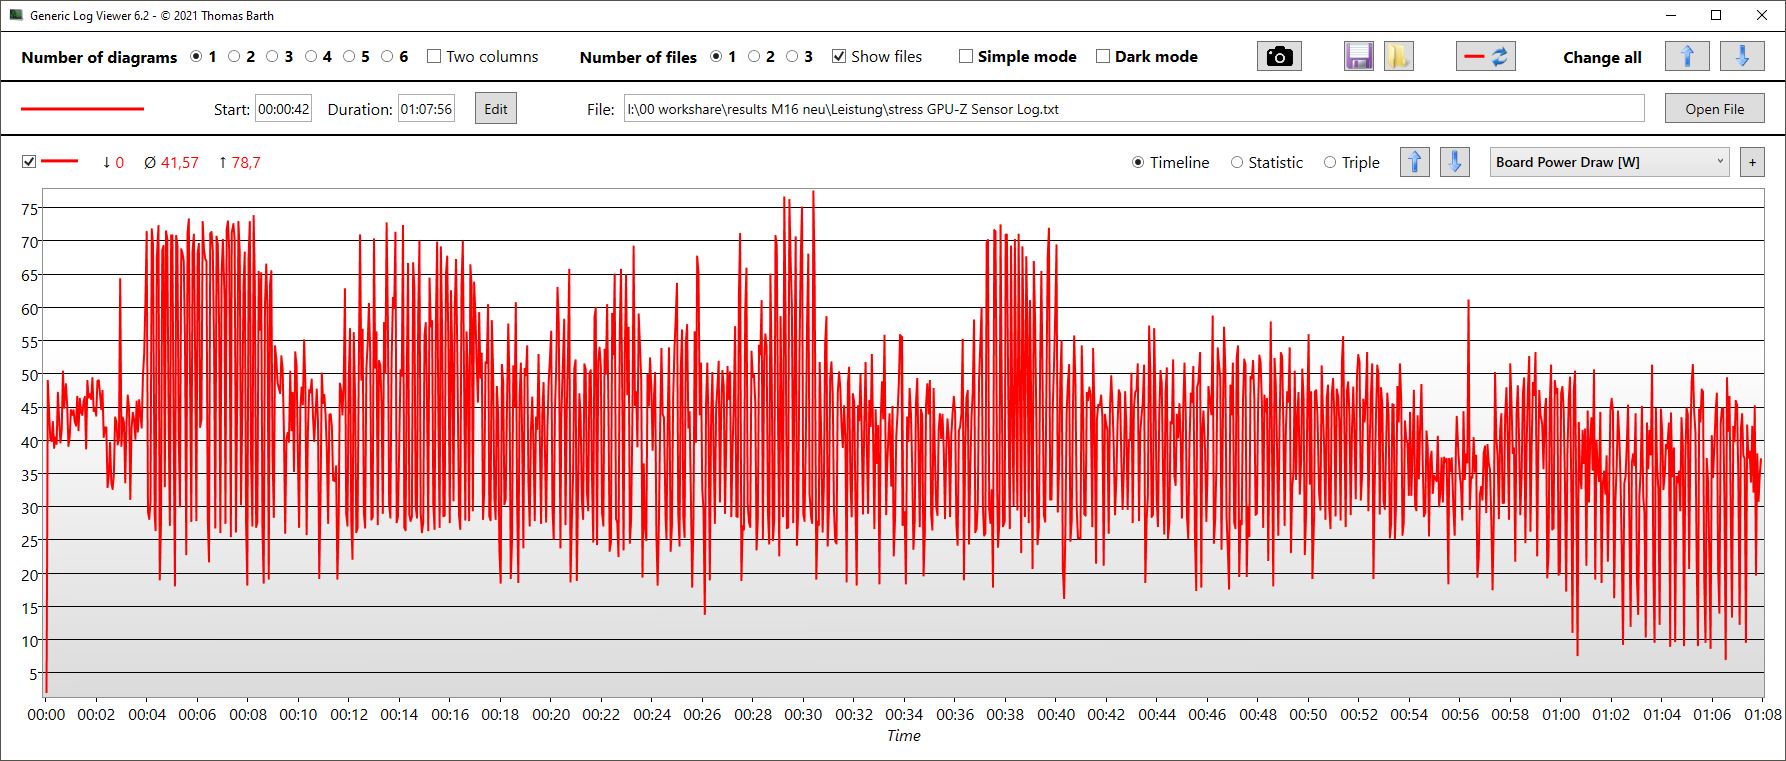
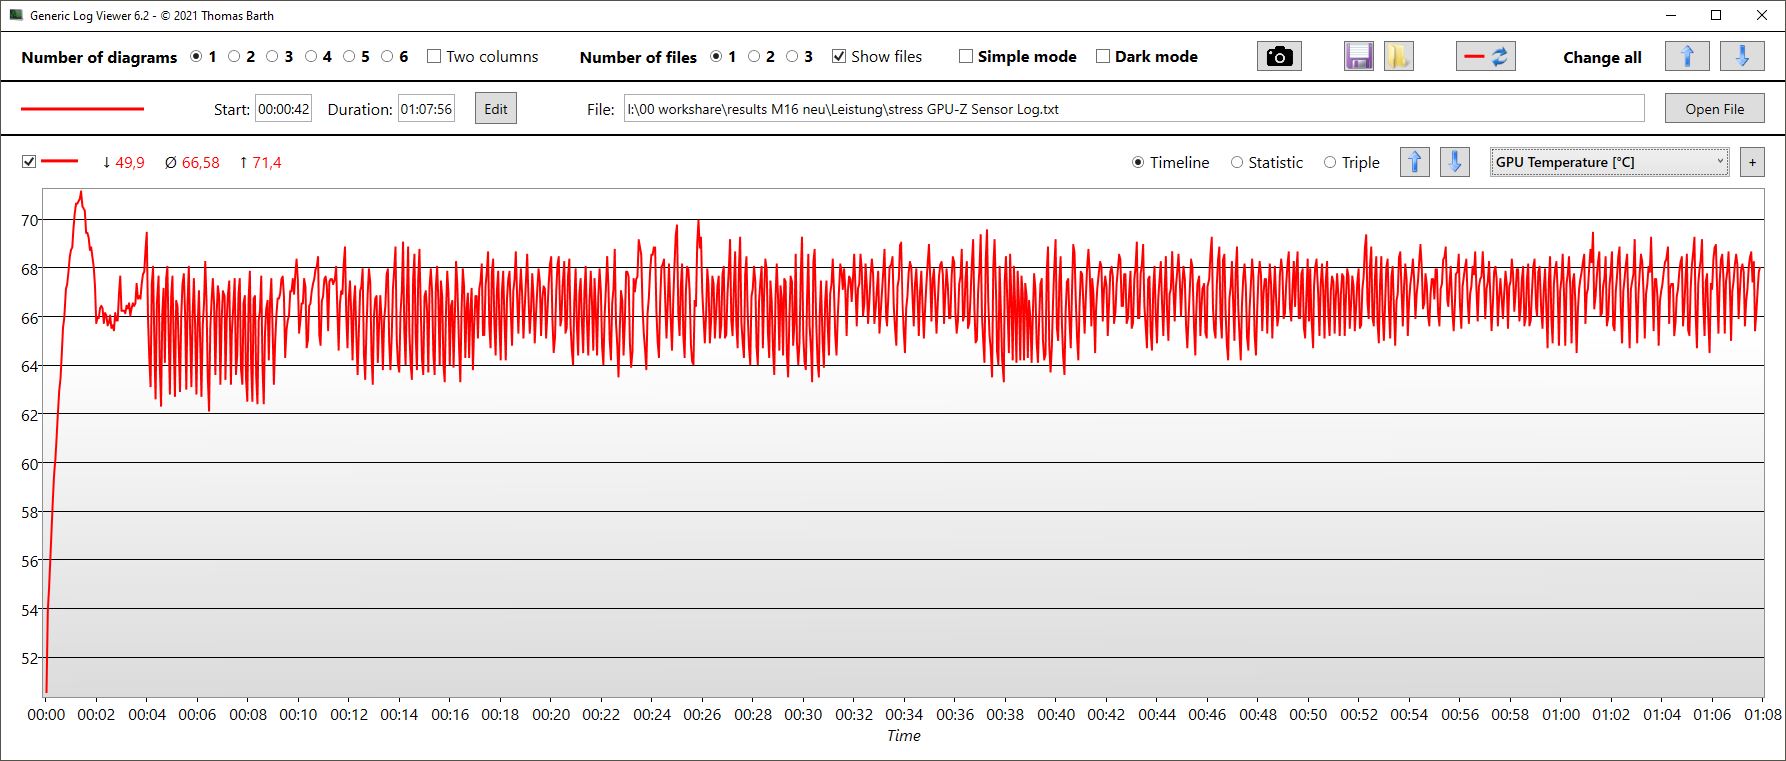
Nossos dados de registro GPU-Z fazem um bom trabalho ao destacar a diferença entre os modosTurbo e Performance: A freqüência do relógio (1,9 vs. 1,5 GHz), temperatura (70 vs. 66 °C), consumo de energia (140 vs 93 watts) e até mesmo a velocidade do relógio de memória (2.275 vs. 2.250 MHz) são todos diferentes. A taxa de quadros caiu de cerca de 175 para aproximadamente 145 fps.
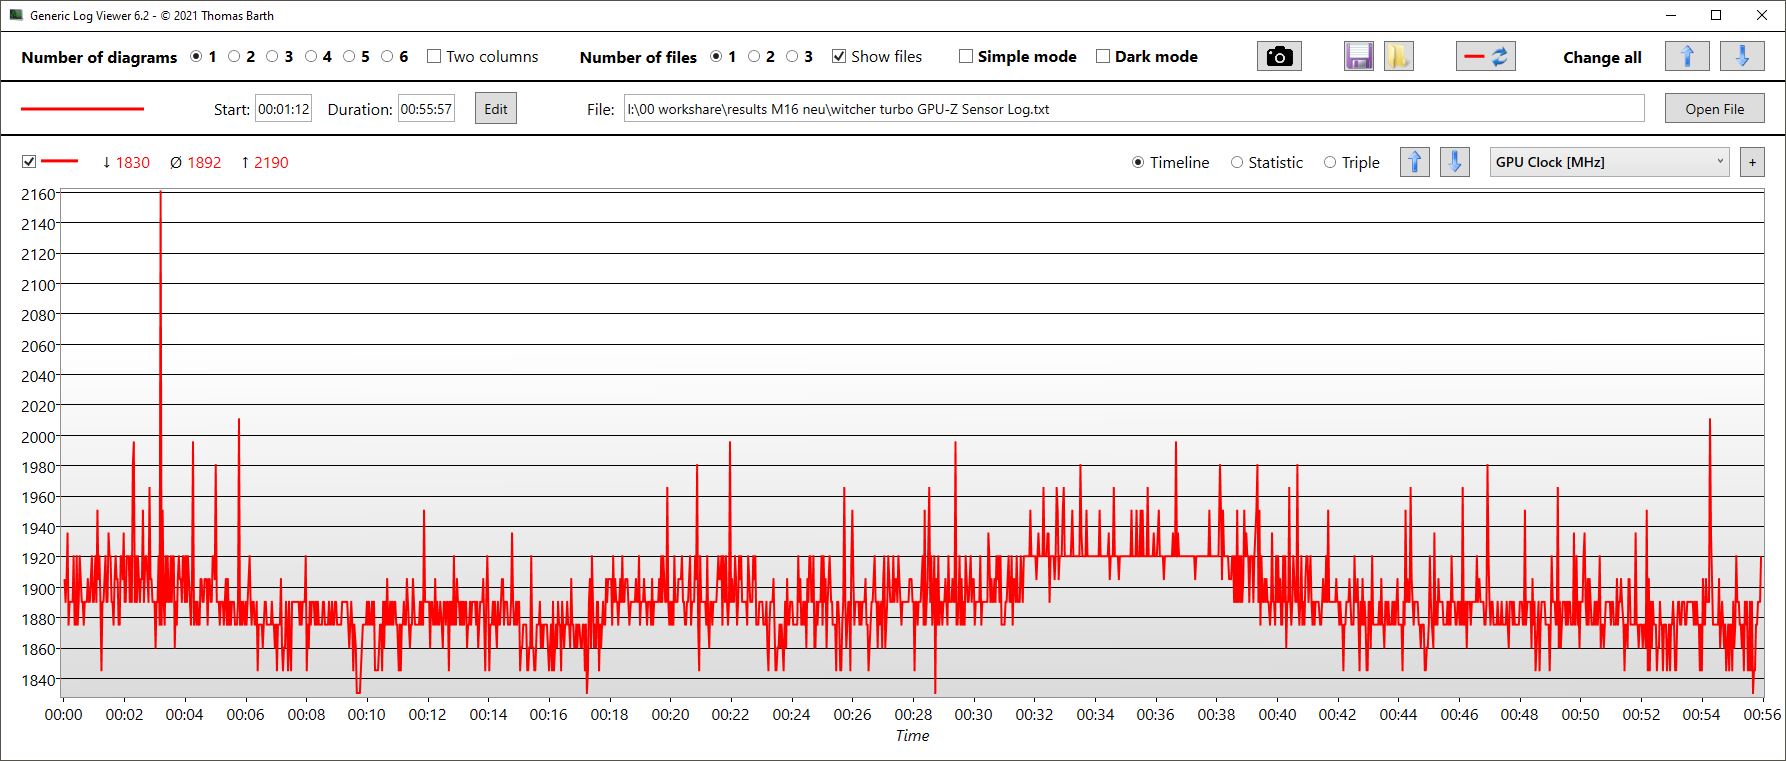
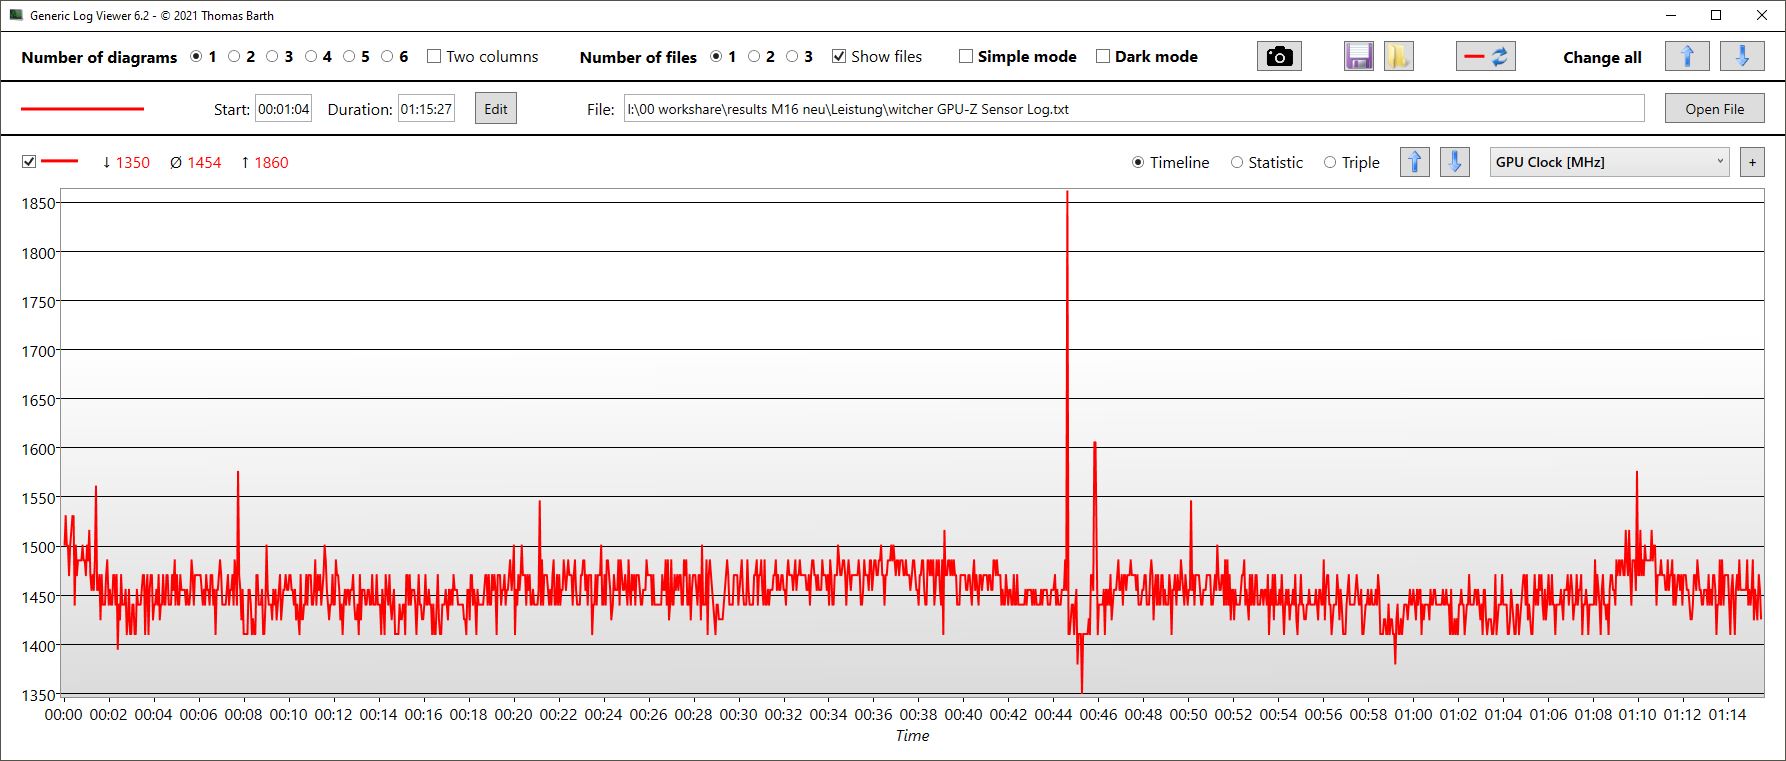
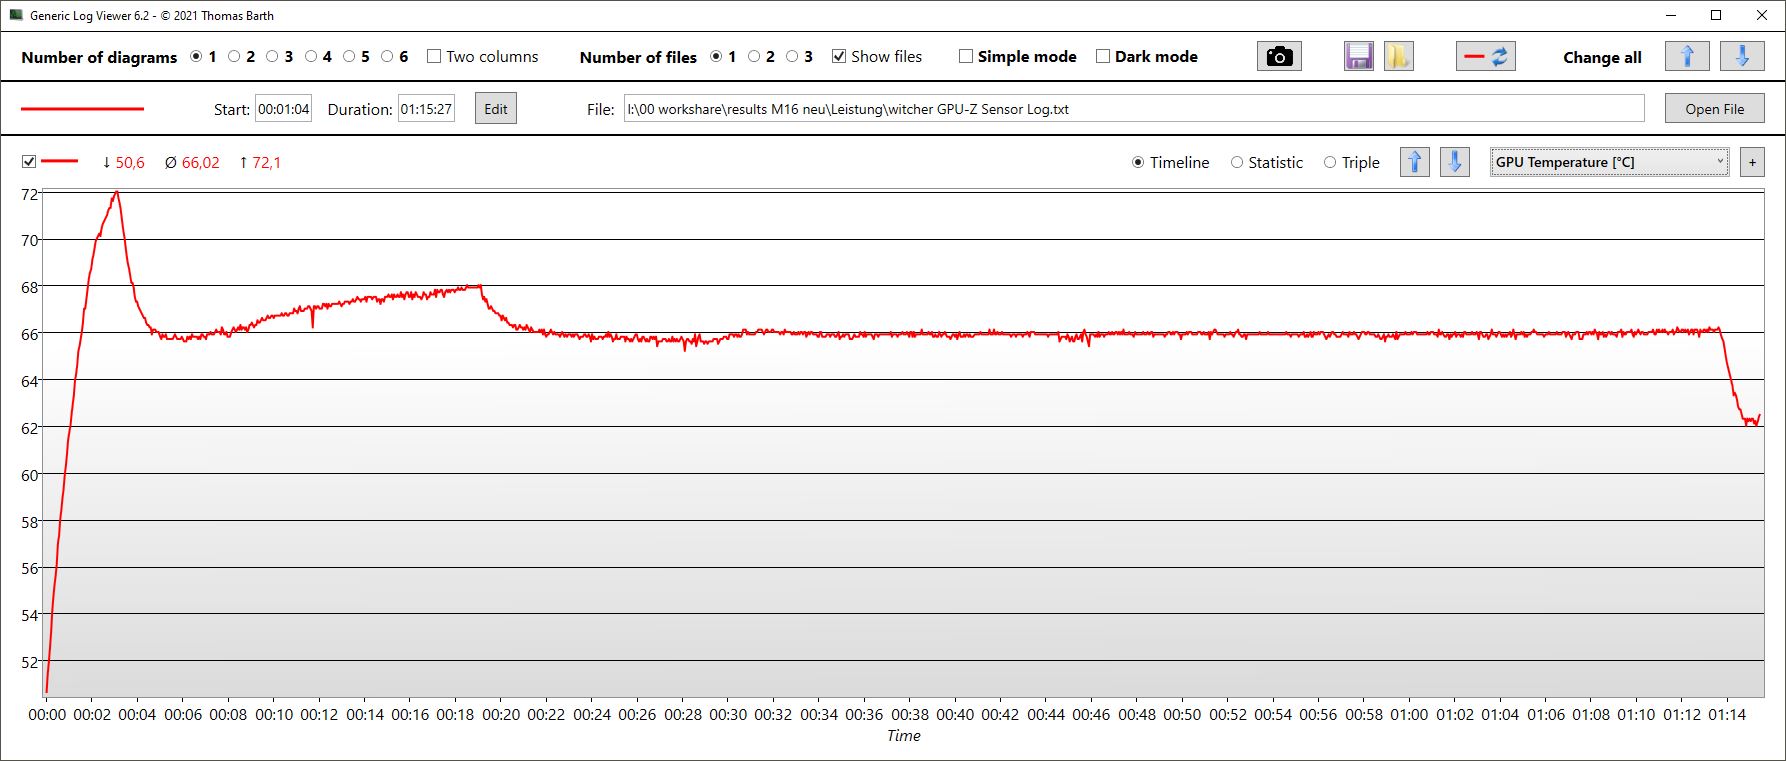
Witcher 3 FPS diagram
| baixo | média | alto | ultra | QHD | 4K DLSS | 4K | |
|---|---|---|---|---|---|---|---|
| GTA V (2015) | 186 | 183.1 | 179.8 | 127.7 | 123 | ||
| The Witcher 3 (2015) | 444 | 371 | 305 | 178 | |||
| Dota 2 Reborn (2015) | 192.9 | 177.3 | 169.9 | 160.7 | 161.9 | ||
| Final Fantasy XV Benchmark (2018) | 199.1 | 184.5 | 158.6 | 129.5 | |||
| X-Plane 11.11 (2018) | 177.2 | 154.7 | 116.4 | 121.8 | |||
| Far Cry 5 (2018) | 195 | 168 | 156 | 133 | 145 | ||
| Strange Brigade (2018) | 445 | 357 | 343 | 315 | 255 | ||
| Shadow of the Tomb Raider (2018) | 172 | 150 | 90 | ||||
| Watch Dogs Legion (2020) | 102 | 91 | 58 | ||||
| Assassin´s Creed Valhalla (2020) | 126 | 111 | 69 | ||||
| Far Cry 6 (2021) | 111 | 108 | 73 | ||||
| Dying Light 2 (2022) | 145.2 | 103.4 | 53.6 | ||||
| Cyberpunk 2077 1.6 (2022) | 104.49 | 75.69 | 41.9 | ||||
| Tiny Tina's Wonderlands (2022) | 144.06 | 109.64 | 62.33 | ||||
| A Plague Tale Requiem (2022) | 59.4 | ||||||
| Call of Duty Modern Warfare 2 2022 (2022) | 148 | 111 | 98 | 69 | |||
| Spider-Man Miles Morales (2022) | 98.1 | 93.3 | 65.7 | ||||
| The Callisto Protocol (2022) | 113.23 | 90.48 | 53.5 |
Emissões - Sem dúvida, os turbos são barulhentos
Emissões sonoras
No modo silencioso, os ventiladores são em sua maioria inativos no uso inativo e também permanecem assim sob cargas leves como escrever ou navegar na Internet. Mesmo no modoPerformance, que o fabricante considera ser semelhante a um modo balanceado, os ventiladores estão freqüentemente funcionando, quando ociosos.
Para nossos benchmarks, usamos o modo Turbo. Os ventiladores só são toleráveis em uso ocioso, nunca são silenciosos e só bramem ao máximo sob carga pesada. Neste ponto, eles permanecem em uma constante 57 dB, tornando-o um dos laptops mais barulhentos de sua classe. Somente o MSI Titan GT77 é mais alto sob carga máxima, mas é pelo menos mais silencioso quando se joga. Vale ressaltar que muitos laptops têm um modo turbo onde os ventiladores funcionam no máximo em uso ocioso, razão pela qual muitas vezes nos abstemos de utilizar este modo de teste. O modo Turbo da M16 é um pouco diferente, mas os fones de ouvido ainda são uma necessidade quando se joga.
No modo de desempenho, os níveis de ruído são toleráveis e comparáveis aos da concorrência. Em Witcher 3, medimos apenas 49 dB em vez de 57. Em contrapartida, o desempenho dos jogos caiu em torno de 15 a 18%.
Barulho
| Ocioso |
| 24 / 29.96 / 34.27 dB |
| Carga |
| 35.89 / 57.54 dB |
 | ||
30 dB silencioso 40 dB(A) audível 50 dB(A) ruidosamente alto |
||
min: | ||
| Asus ROG Zephyrus M16 GU604VY-NM042X GeForce RTX 4090 Laptop GPU, i9-13900H, Samsung PM9A1 MZVL22T0HBLB | Asus ROG Zephyrus M16 GU603Z GeForce RTX 3070 Ti Laptop GPU, i9-12900H, Micron 3400 1TB MTFDKBA1T0TFH | Asus ROG Strix Scar 18 2023 G834JY-N6005W GeForce RTX 4090 Laptop GPU, i9-13980HX, 2x Samsung PM9A1 MZVL21T0HCLR (RAID 0) | MSI Titan GT77 HX 13VI GeForce RTX 4090 Laptop GPU, i9-13950HX, Samsung PM9A1 MZVL22T0HBLB | Lenovo Legion Pro 7 16IRX8H GeForce RTX 4080 Laptop GPU, i9-13900HX, Samsung PM9A1 MZVL21T0HCLR | Razer Blade 16 Early 2023 GeForce RTX 4080 Laptop GPU, i9-13950HX, SSSTC CA6-8D1024 | |
|---|---|---|---|---|---|---|
| Noise | -2% | -0% | -7% | -3% | 11% | |
| desligado / ambiente * (dB) | 24 | 23 4% | 23.9 -0% | 24.6 -3% | 24 -0% | 23 4% |
| Idle Minimum * (dB) | 24 | 23 4% | 23.9 -0% | 29.2 -22% | 26 -8% | 23 4% |
| Idle Average * (dB) | 29.96 | 24 20% | 32.6 -9% | 29.2 3% | 28 7% | 23 23% |
| Idle Maximum * (dB) | 34.27 | 47 -37% | 32.6 5% | 29.2 15% | 34 1% | 23.6 31% |
| Load Average * (dB) | 35.89 | 47.91 -33% | 35.9 -0% | 50.7 -41% | 47 -31% | 39 -9% |
| Witcher 3 ultra * (dB) | 57.5 | 48.91 15% | 53.3 7% | 55 4% | 51.6 10% | |
| Load Maximum * (dB) | 57.54 | 50.25 13% | 55.8 3% | 61 -6% | 56 3% | 51.3 11% |
* ... menor é melhor
Temperatura
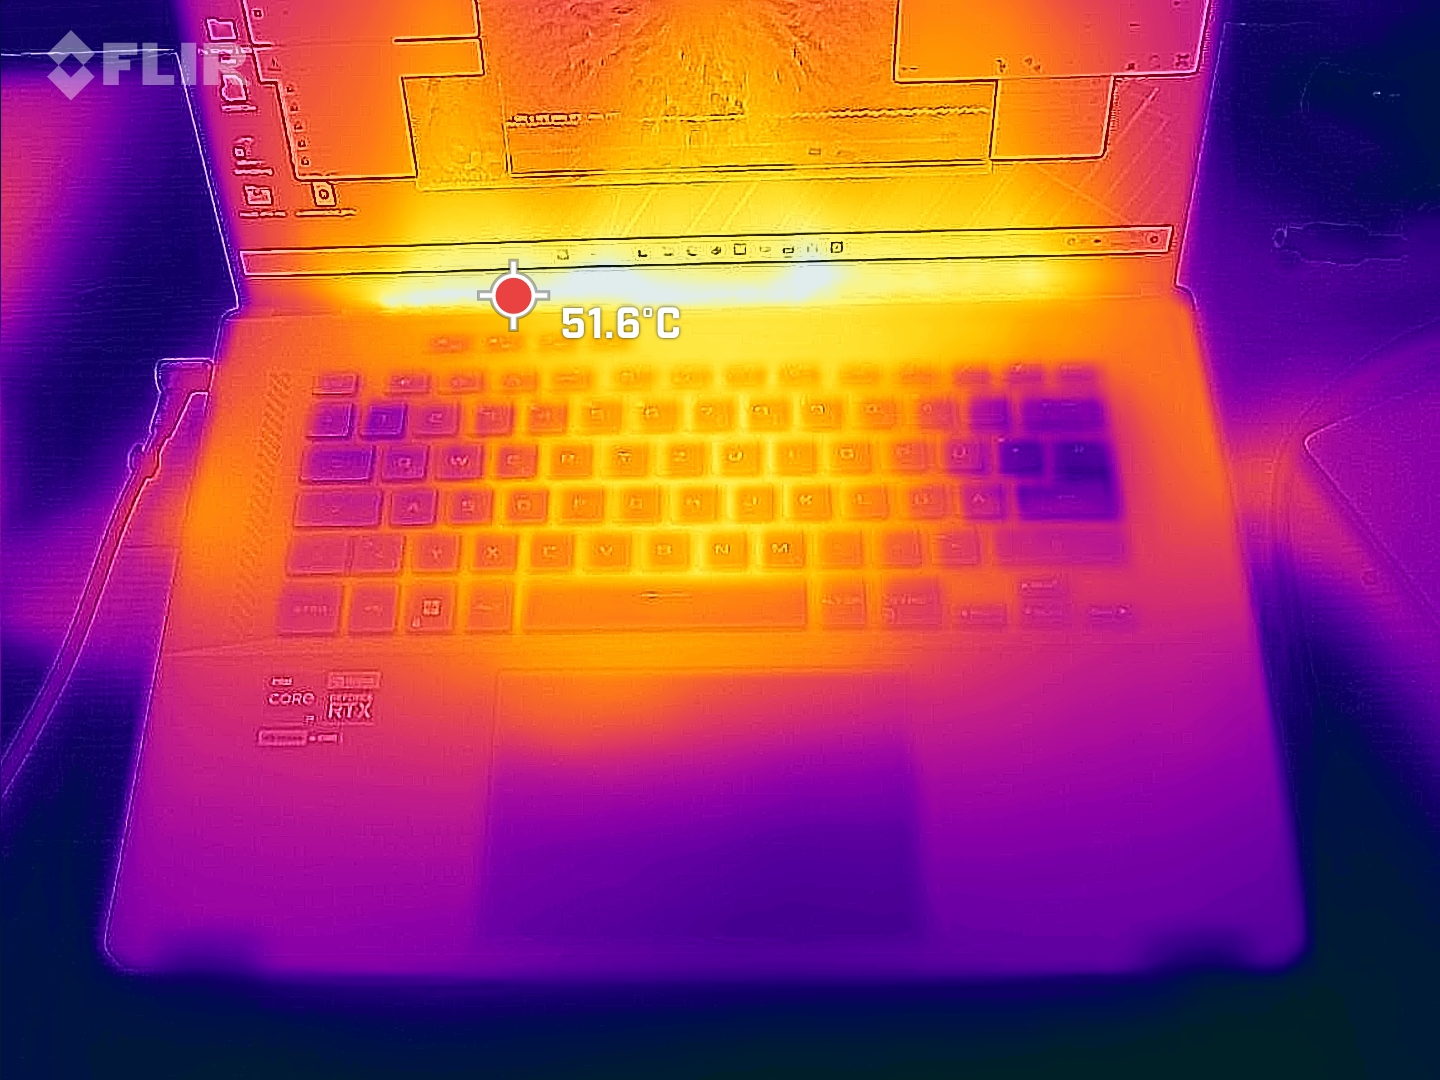
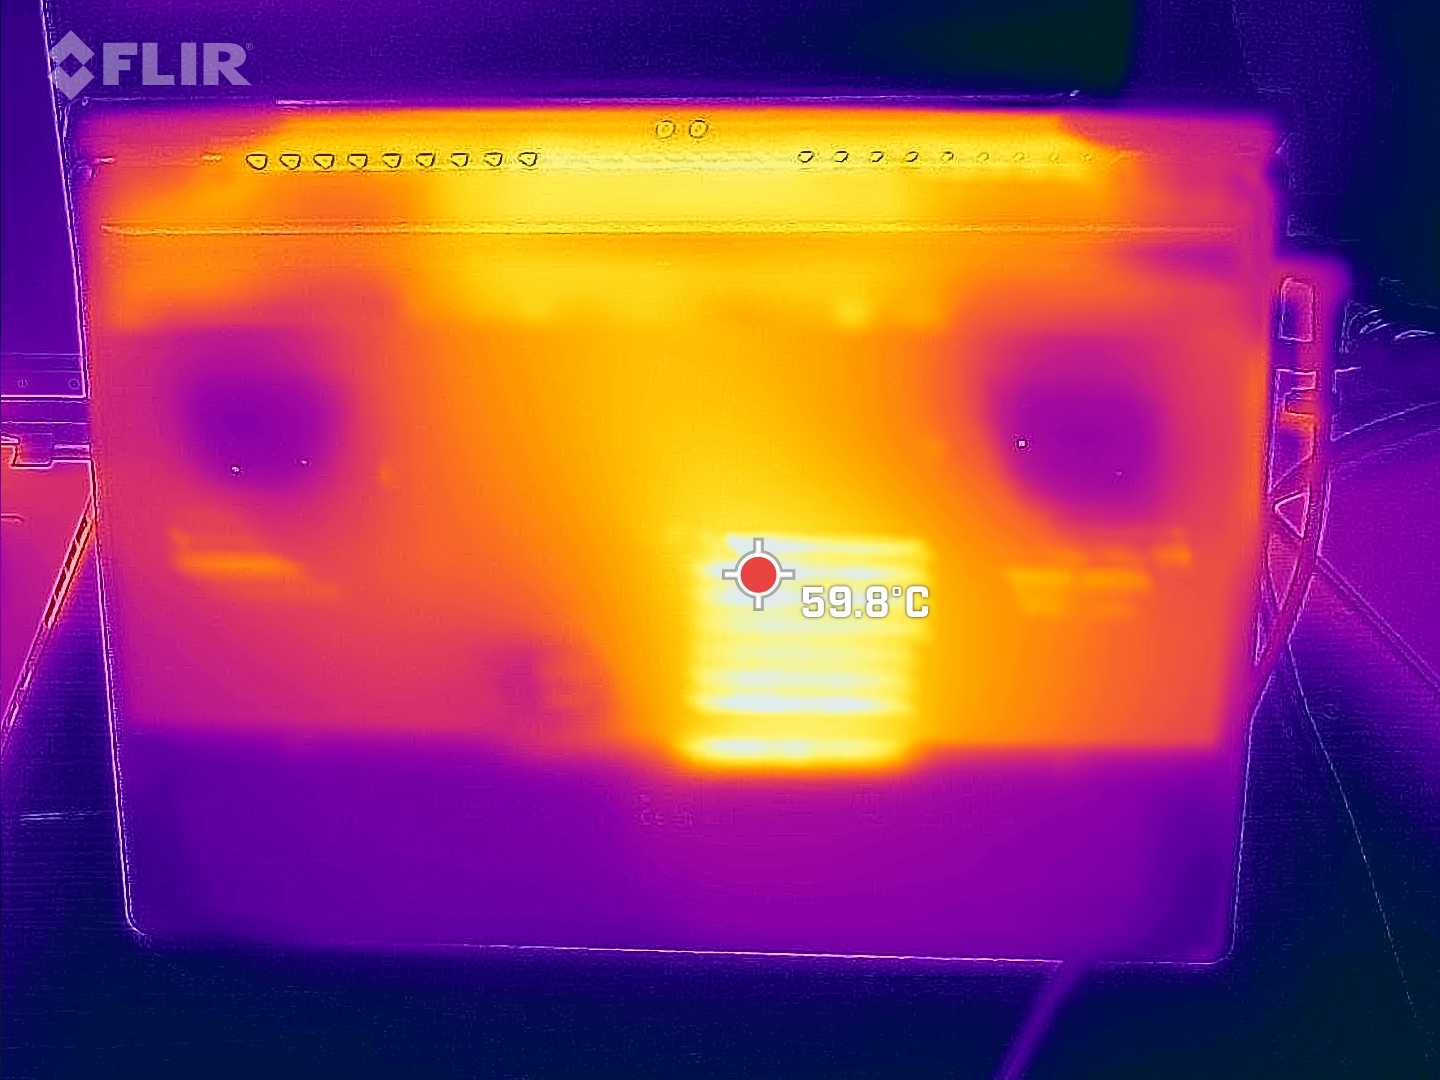
A M16 fica um pouco quente, especialmente na parte inferior do dispositivo. Os pontos quentes medidos estavam apenas a 60 °C sob tensão máxima e podem ser encontrados no centro e nas costas. Ao jogar, os próprios pontos quentes atingiram temperaturas de apenas cerca de 50 °C.
Em contraste, o descanso de palma permaneceu em sua maioria frio, o que também se aplica parcialmente às chaves WASD.
(-) A temperatura máxima no lado superior é 50 °C / 122 F, em comparação com a média de 40.4 °C / 105 F , variando de 21.2 a 68.8 °C para a classe Gaming.
(-) A parte inferior aquece até um máximo de 58 °C / 136 F, em comparação com a média de 43.2 °C / 110 F
(+) Em uso inativo, a temperatura média para o lado superior é 24 °C / 75 F, em comparação com a média do dispositivo de 33.9 °C / ### class_avg_f### F.
(-) Jogando The Witcher 3, a temperatura média para o lado superior é 38.1 °C / 101 F, em comparação com a média do dispositivo de 33.9 °C / ## #class_avg_f### F.
(±) Os apoios para as mãos e o touchpad podem ficar muito quentes ao toque, com um máximo de 37 °C / 98.6 F.
(-) A temperatura média da área do apoio para as mãos de dispositivos semelhantes foi 28.8 °C / 83.8 F (-8.2 °C / -14.8 F).
| Asus ROG Zephyrus M16 GU604VY-NM042X Intel Core i9-13900H, NVIDIA GeForce RTX 4090 Laptop GPU | Asus ROG Zephyrus M16 GU603Z Intel Core i9-12900H, NVIDIA GeForce RTX 3070 Ti Laptop GPU | Asus ROG Strix Scar 18 2023 G834JY-N6005W Intel Core i9-13980HX, NVIDIA GeForce RTX 4090 Laptop GPU | MSI Titan GT77 HX 13VI Intel Core i9-13950HX, NVIDIA GeForce RTX 4090 Laptop GPU | Lenovo Legion Pro 7 16IRX8H Intel Core i9-13900HX, NVIDIA GeForce RTX 4080 Laptop GPU | Razer Blade 16 Early 2023 Intel Core i9-13950HX, NVIDIA GeForce RTX 4080 Laptop GPU | |
|---|---|---|---|---|---|---|
| Heat | -6% | -3% | 10% | -13% | 5% | |
| Maximum Upper Side * (°C) | 50 | 52 -4% | 54 -8% | 40.6 19% | 48 4% | 40 20% |
| Maximum Bottom * (°C) | 58 | 51 12% | 46 21% | 41.1 29% | 49 16% | 37.6 35% |
| Idle Upper Side * (°C) | 26 | 29 -12% | 30 -15% | 26.2 -1% | 40 -54% | 32.4 -25% |
| Idle Bottom * (°C) | 28 | 33 -18% | 31 -11% | 30.3 -8% | 33 -18% | 31.4 -12% |
* ... menor é melhor
Teste de estresse
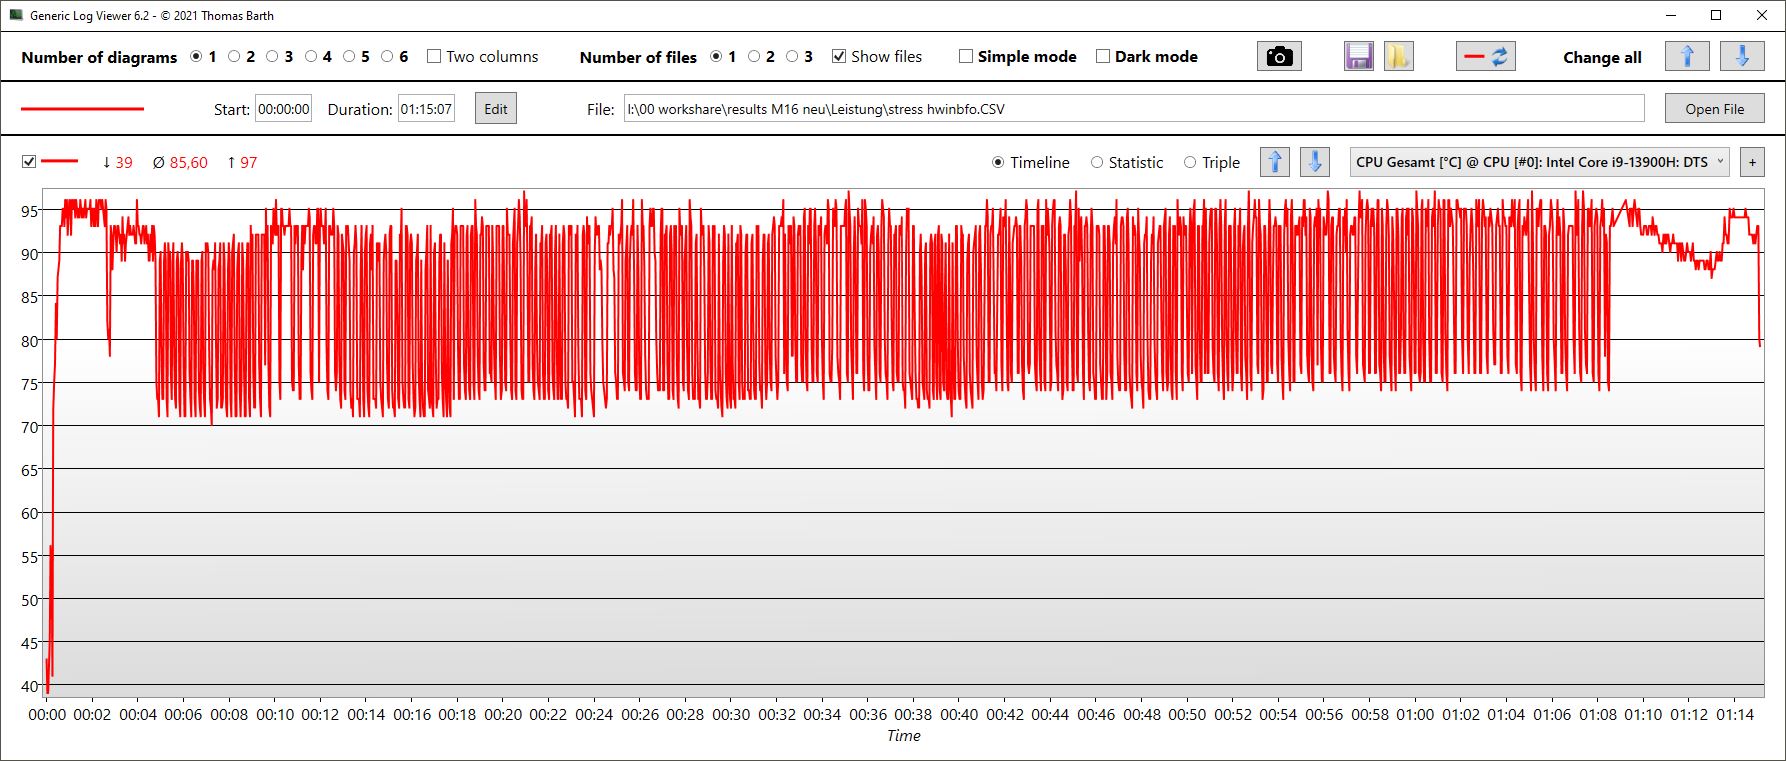
O relógio da CPU flutuou entre 2,2 e 4 GHz no teste de esforço, em que a velocidade do relógio paira em torno da extremidade superior por um período de tempo mais longo. Paralelamente a isto, o consumo de energia da CPU varia e fica, em média, em 77 watts. Entretanto, também pode ir até 120 watts e cair novamente para 40 watts. Dependendo dos outros valores, as temperaturas variam de forma semelhante com o aquecimento da CPU até 98 °C e com uma média de 88 °C.
No modoPerformance, a diferença para a CPU na verdade não é tão grande e as temperaturas, consumo de energia e velocidades do relógio não são particularmente diferentes umas das outras, mas ainda assim flutuam em altas taxas.
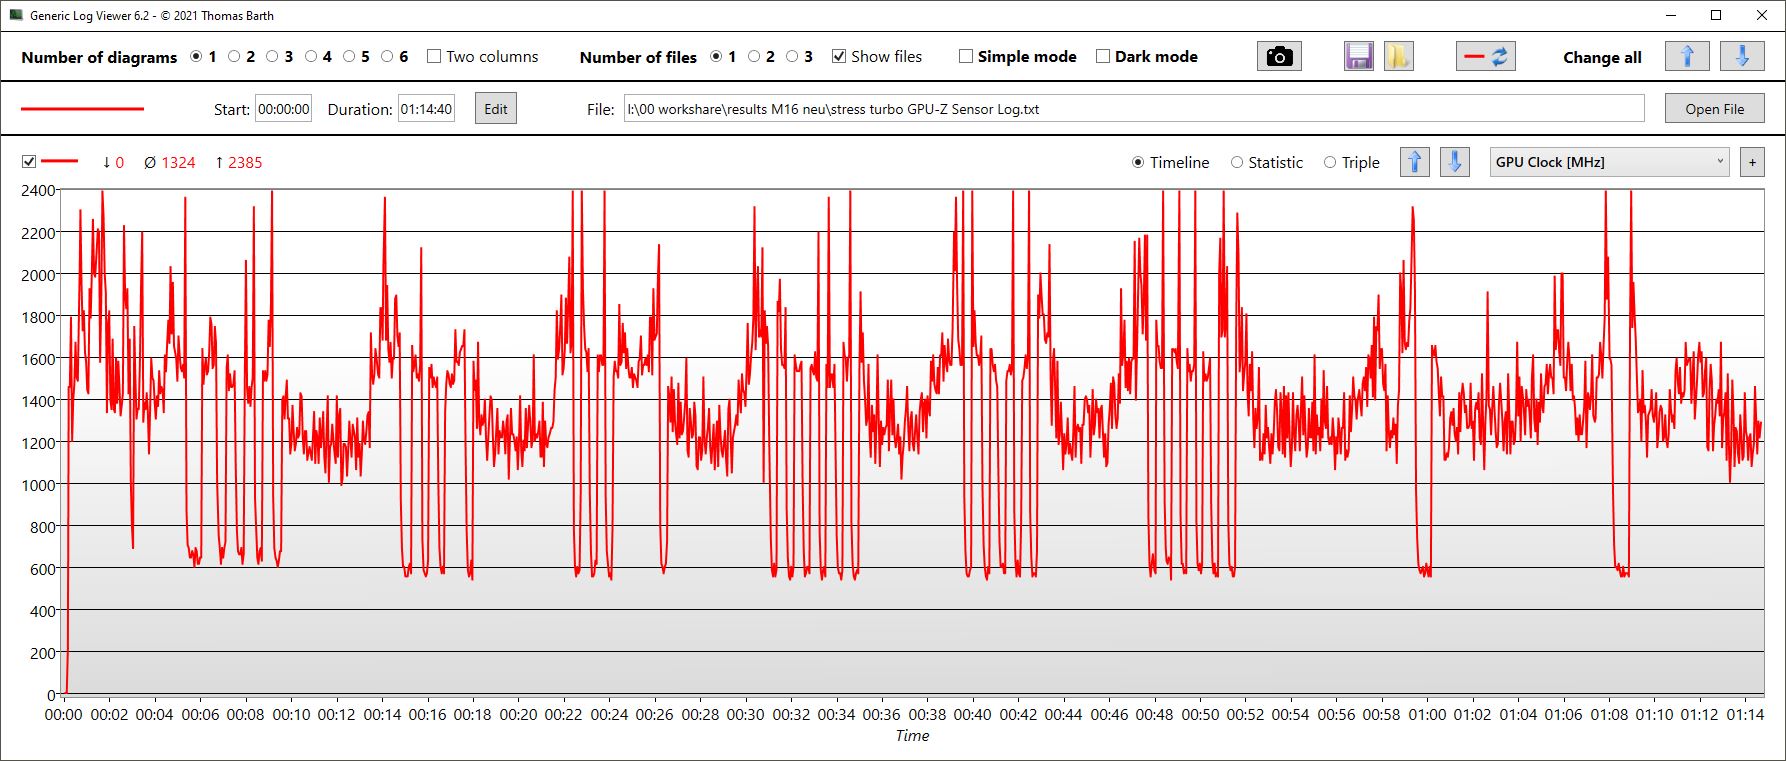
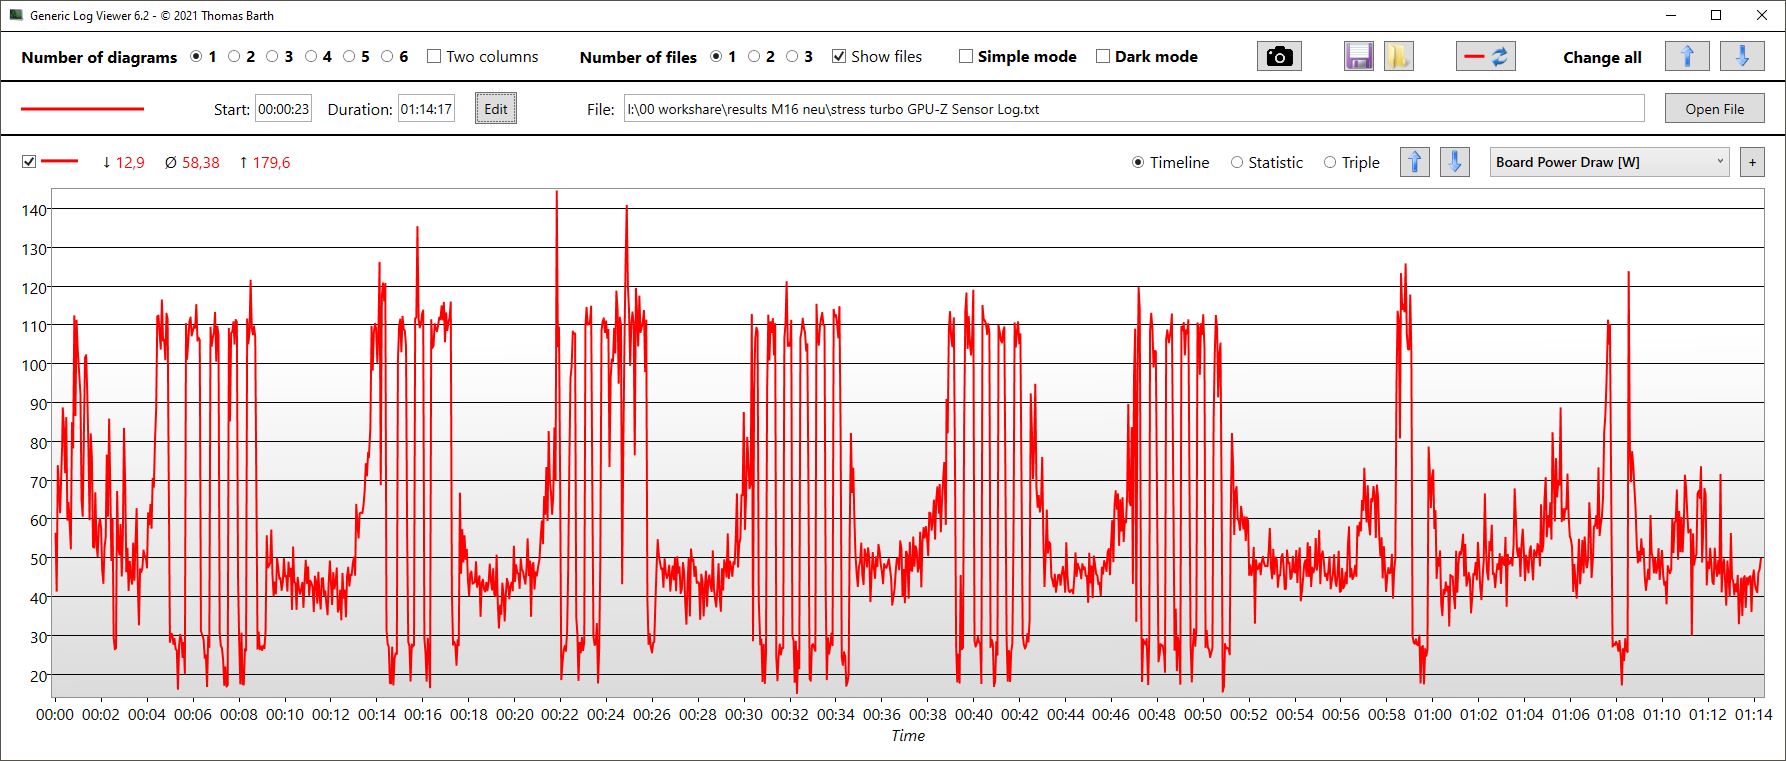
Os valores da GPU (mesmo o relógio de memória) flutuam muito fortemente. A velocidade do relógio central situa-se em média em torno de 1,3 GHz, o consumo de energia é em média de 58 watts e as temperaturas estão em torno de 64 °C.
No modoPerformance, os valores são apenas marginalmente mais baixos. A velocidade do relógio cai em torno de 200 MHz, a temperatura é igualmente alta e o consumo de energia se situa em torno de 42 watts.
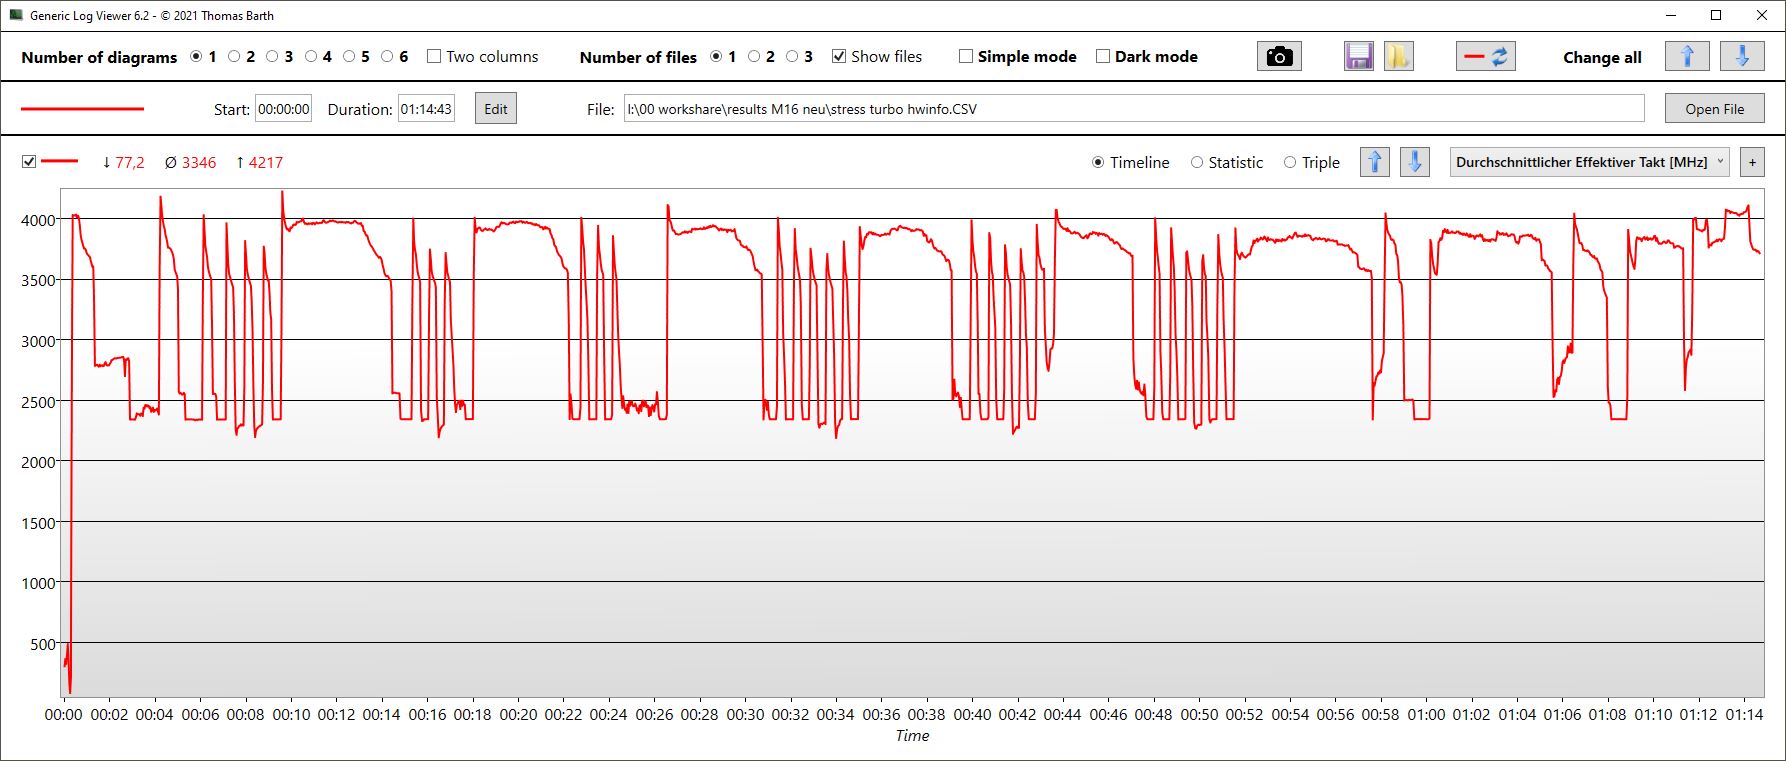
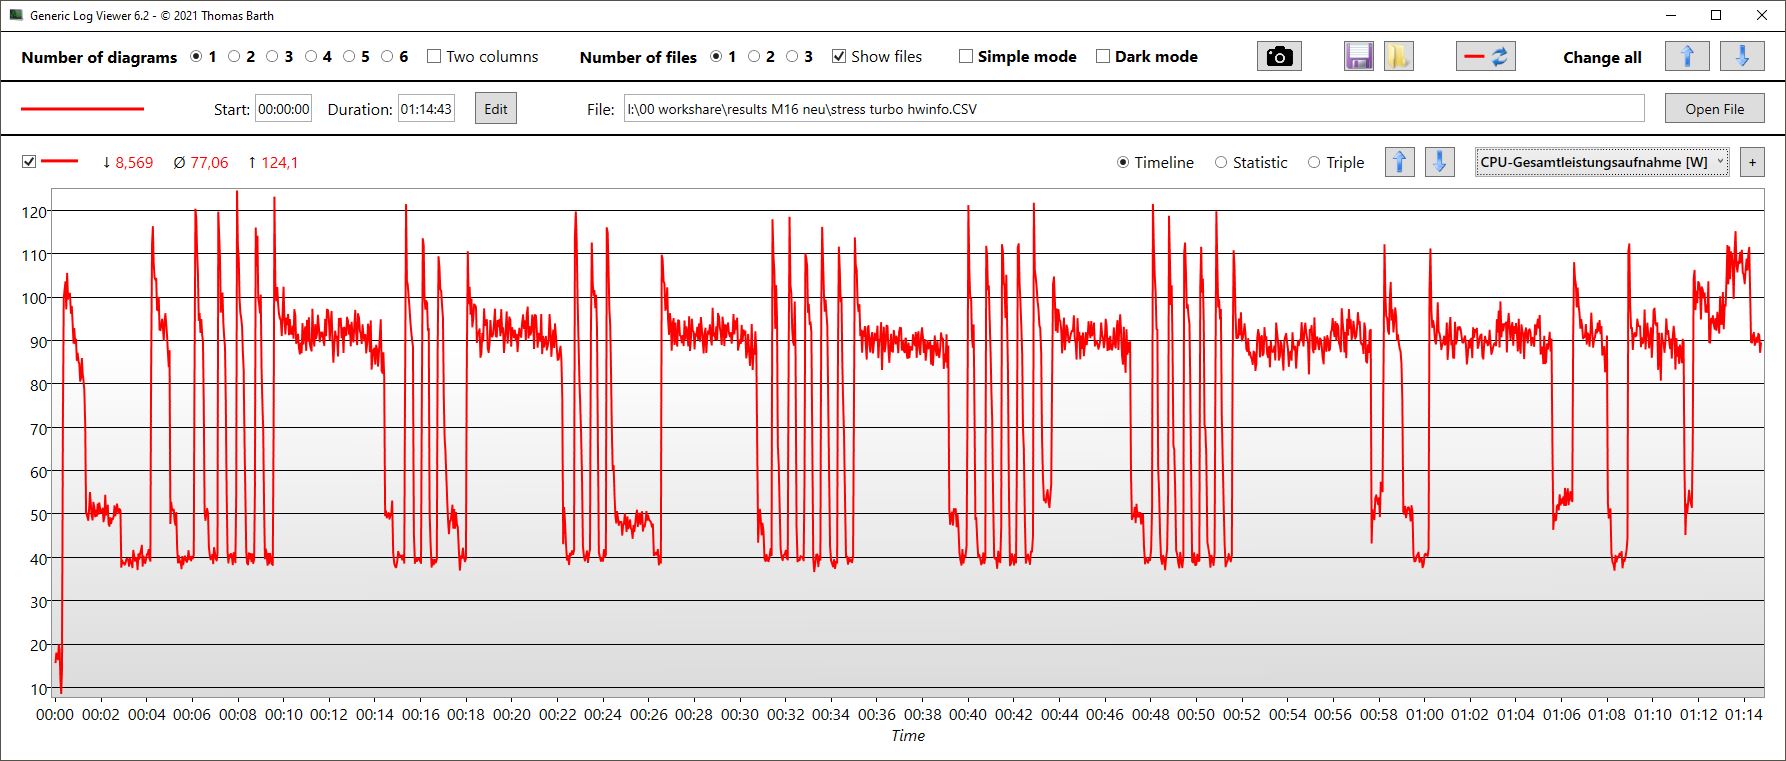
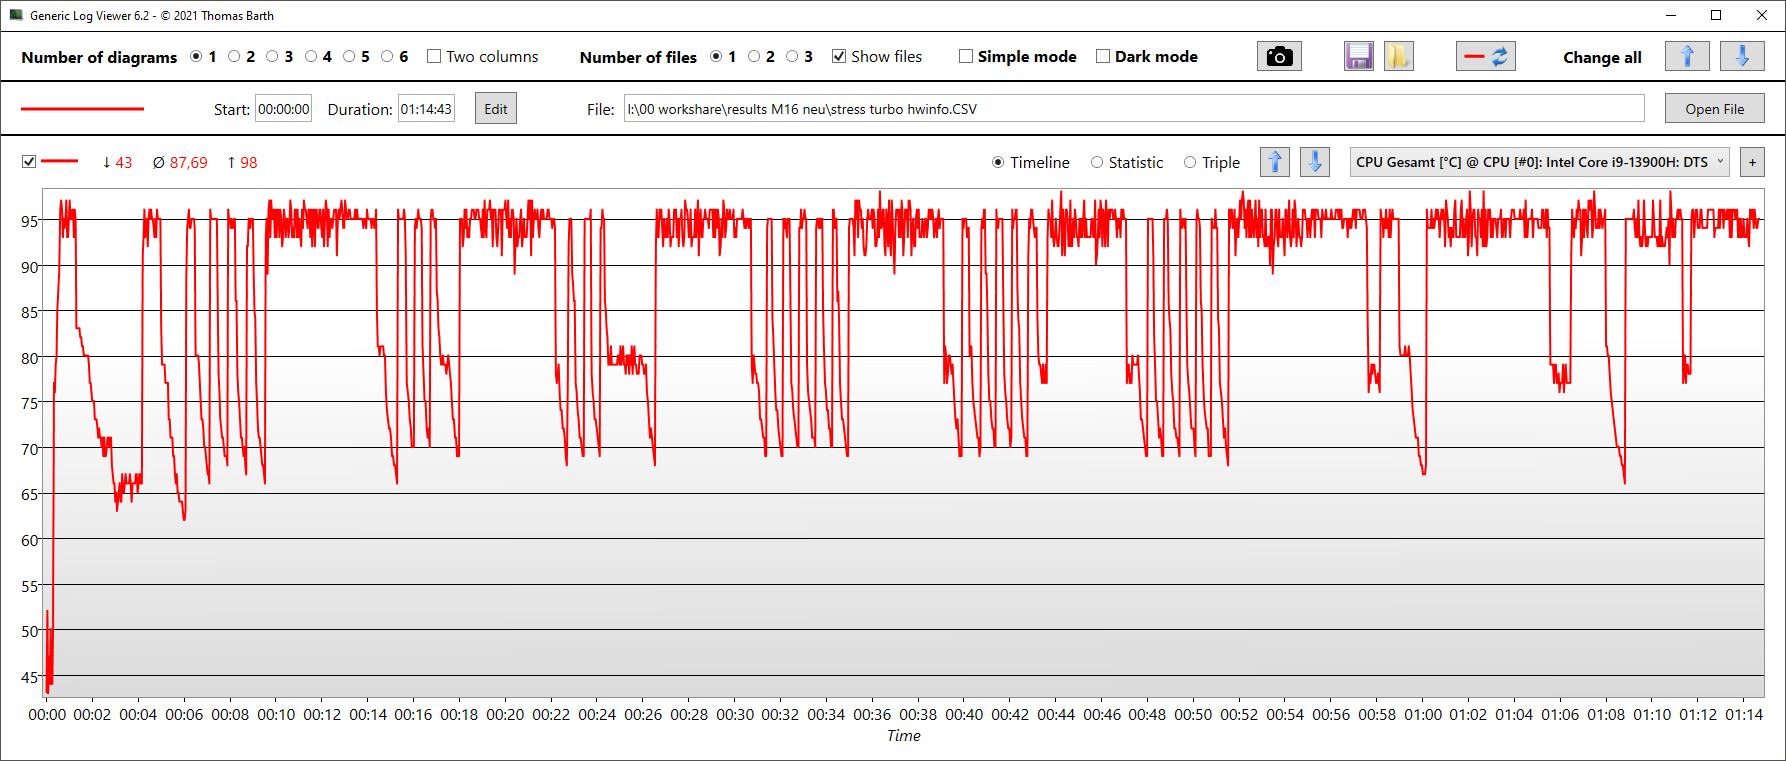

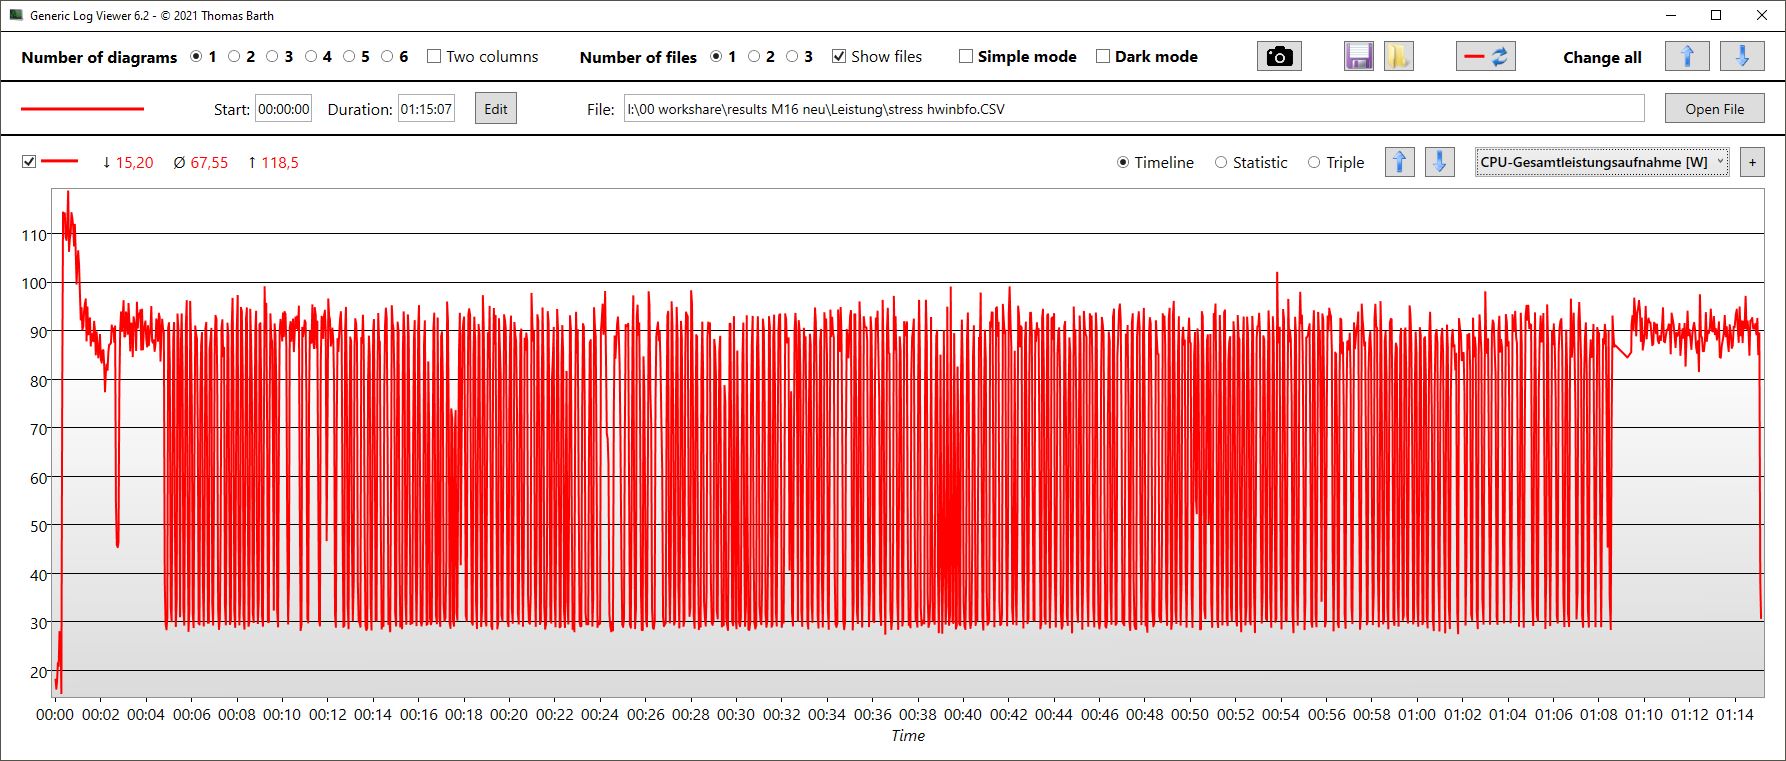
| Relógio CPU (GHz) | Relógio GPU (MHz) | Temperatura média da CPU (°C) | Temperatura média da GPU (°C) | |
| Prime95 + FurMark Stress | 3,3 | 1.324 | 88 | 64 |
| Witcher 3 Estresse | 668 | 1.830 | 69 | 70 |
Oradores
Em comparação com muitos outros fabricantes, a Asus equipou o laptop com quatro alto-falantes em vez de dois. Isto tem um efeito positivo, pois eles podem ficar relativamente altos e médios equilibrados e até mesmo o baixo é um pouco mais potente do que, infelizmente e tipicamente, quando se trata da concorrência.
O prazer adicional de áudio pode ser obtido conectando um dispositivo analógico externo através do conector de áudio de 3,5 mm.
Asus ROG Zephyrus M16 GU604VY-NM042X análise de áudio
(+) | os alto-falantes podem tocar relativamente alto (###valor### dB)
Graves 100 - 315Hz
(±) | graves reduzidos - em média 11.5% menor que a mediana
(±) | a linearidade dos graves é média (10.1% delta para a frequência anterior)
Médios 400 - 2.000 Hz
(+) | médios equilibrados - apenas 4.1% longe da mediana
(+) | médios são lineares (4.9% delta para frequência anterior)
Altos 2 - 16 kHz
(+) | agudos equilibrados - apenas 1.9% longe da mediana
(+) | os máximos são lineares (4.9% delta da frequência anterior)
Geral 100 - 16.000 Hz
(+) | o som geral é linear (11.1% diferença em relação à mediana)
Comparado com a mesma classe
» 8% de todos os dispositivos testados nesta classe foram melhores, 3% semelhantes, 89% piores
» O melhor teve um delta de 6%, a média foi 18%, o pior foi 132%
Comparado com todos os dispositivos testados
» 7% de todos os dispositivos testados foram melhores, 2% semelhantes, 92% piores
» O melhor teve um delta de 4%, a média foi 24%, o pior foi 134%
Razer Blade 16 Early 2023 análise de áudio
(+) | os alto-falantes podem tocar relativamente alto (###valor### dB)
Graves 100 - 315Hz
(-) | quase nenhum baixo - em média 16.4% menor que a mediana
(±) | a linearidade dos graves é média (10.8% delta para a frequência anterior)
Médios 400 - 2.000 Hz
(+) | médios equilibrados - apenas 2.5% longe da mediana
(+) | médios são lineares (2.4% delta para frequência anterior)
Altos 2 - 16 kHz
(+) | agudos equilibrados - apenas 4.9% longe da mediana
(±) | a linearidade dos máximos é média (7.9% delta para frequência anterior)
Geral 100 - 16.000 Hz
(+) | o som geral é linear (12.6% diferença em relação à mediana)
Comparado com a mesma classe
» 16% de todos os dispositivos testados nesta classe foram melhores, 4% semelhantes, 81% piores
» O melhor teve um delta de 6%, a média foi 18%, o pior foi 132%
Comparado com todos os dispositivos testados
» 11% de todos os dispositivos testados foram melhores, 3% semelhantes, 86% piores
» O melhor teve um delta de 4%, a média foi 24%, o pior foi 134%
Gerenciamento de energia - Jogos eficientes, alto consumo ocioso
Consumo de energia
Ajustado para os modos de brilho mínimo, silencioso e de vôo, o consumo de uso ocioso de cerca de 20 watts é um pouco alto. Nos jogos e sob carga pesada, os processadores Intel HX parecem consumir significativamente mais energia do que alguns dos concorrentes HX com capacidade similar (mesmo aqueles com um RTX 4080) consumindo mais energia.
Por pouco tempo, medimos picos de carga de no máximo 267 watts na unidade de alimentação grande, mas plana (cerca de 18 x 8,3 x 2,5 cm). Isto é projetado para 280 watts e, portanto, oferece muitas reservas.
| desligado | |
| Ocioso | |
| Carga |
|
Key:
min: | |
| Asus ROG Zephyrus M16 GU604VY-NM042X i9-13900H, GeForce RTX 4090 Laptop GPU, Samsung PM9A1 MZVL22T0HBLB, IPS, 2560x1600, 16" | Asus ROG Zephyrus M16 GU603Z i9-12900H, GeForce RTX 3070 Ti Laptop GPU, Micron 3400 1TB MTFDKBA1T0TFH, IPS, 2560x1600, 16" | Asus ROG Strix Scar 18 2023 G834JY-N6005W i9-13980HX, GeForce RTX 4090 Laptop GPU, 2x Samsung PM9A1 MZVL21T0HCLR (RAID 0), IPS, 2560x1600, 18" | MSI Titan GT77 HX 13VI i9-13950HX, GeForce RTX 4090 Laptop GPU, Samsung PM9A1 MZVL22T0HBLB, Mini-LED, 3840x2160, 17.3" | Lenovo Legion Pro 7 16IRX8H i9-13900HX, GeForce RTX 4080 Laptop GPU, Samsung PM9A1 MZVL21T0HCLR, IPS, 2560x1600, 16" | Razer Blade 16 Early 2023 i9-13950HX, GeForce RTX 4080 Laptop GPU, SSSTC CA6-8D1024, IPS, 2560x1600, 16" | Média NVIDIA GeForce RTX 4090 Laptop GPU | Média da turma Gaming | |
|---|---|---|---|---|---|---|---|---|
| Power Consumption | 24% | -26% | -10% | -14% | -17% | -11% | 12% | |
| Idle Minimum * (Watt) | 20 | 10.8 46% | 17.3 13% | 14 30% | 18 10% | 15.2 24% | 16.2 ? 19% | 13.2 ? 34% |
| Idle Average * (Watt) | 24 | 17 29% | 27 -13% | 21.6 10% | 24 -0% | 22.8 5% | 23.1 ? 4% | 18.9 ? 21% |
| Idle Maximum * (Watt) | 25 | 17.8 29% | 46 -84% | 24.8 1% | 32 -28% | 49.8 -99% | 34.2 ? -37% | 24.5 ? 2% |
| Load Average * (Watt) | 107 | 116 -8% | 133 -24% | 122.5 -14% | 130 -21% | 121.2 -13% | 130.5 ? -22% | 108.8 ? -2% |
| Witcher 3 ultra * (Watt) | 208 | 144 31% | 265 -27% | 260 -25% | 242 -16% | |||
| Load Maximum * (Watt) | 267 | 220 18% | 329 -23% | 418 -57% | 320 -20% | 273.7 -3% | 324 ? -21% | 254 ? 5% |
* ... menor é melhor
Power consumption Witcher 3 / Stress test
Power consumption with an external monitor
Duração da bateria
O Zephyrus M16 tem uma bateria com capacidade de 90 watts, o que significa que o laptop Asus pode alcançar cerca de 4,5 horas de uso de WiFi com brilho reduzido.
Em pleno brilho, 3 horas de navegação na Internet (Multizone Mini-LED) são possíveis. Com brilho reduzido, isto pode chegar a quase 4,5 horas.
Em resumo, a vida útil da bateria não é particularmente boa e isto se deve ao alto consumo ocioso.
| Asus ROG Zephyrus M16 GU604VY-NM042X i9-13900H, GeForce RTX 4090 Laptop GPU, 90 Wh | Asus ROG Zephyrus M16 GU603Z i9-12900H, GeForce RTX 3070 Ti Laptop GPU, 90 Wh | Asus ROG Strix Scar 18 2023 G834JY-N6005W i9-13980HX, GeForce RTX 4090 Laptop GPU, 90 Wh | MSI Titan GT77 HX 13VI i9-13950HX, GeForce RTX 4090 Laptop GPU, 99.9 Wh | Lenovo Legion Pro 7 16IRX8H i9-13900HX, GeForce RTX 4080 Laptop GPU, 99.9 Wh | Razer Blade 16 Early 2023 i9-13950HX, GeForce RTX 4080 Laptop GPU, 95.2 Wh | Média da turma Gaming | |
|---|---|---|---|---|---|---|---|
| Duração da bateria | 24% | 14% | -1% | -5% | -5% | 29% | |
| H.264 (h) | 4.8 | 7.3 52% | 7 46% | 6 25% | 8.28 ? 73% | ||
| WiFi v1.3 (h) | 4.3 | 7.4 72% | 7.1 65% | 5.3 23% | 5.1 19% | 6.1 42% | 6.96 ? 62% |
| Load (h) | 2.9 | 1.4 -52% | 0.9 -69% | 1.4 -52% | 2.1 -28% | 1.4 -52% | 1.47 ? -49% |
| Witcher 3 ultra (h) | 0.9 | ||||||
| Reader / Idle (h) | 6.4 | 8.9 | 8.71 ? |
Pro
Contra
Veredicto - Não (ainda) tão otimizado quanto seu predecessor

Quando se trata das mais novas gerações de laptops, os fabricantes gostam de nos enviar sistemas high-end. E sim, osRTX 4090e Intel Gen13 não são apenas impressionantes no papel. Em comparação com o gênero anterior, o desempenho e a eficiência melhoraram significativamente. Além disso, a maravilhosa tela da Nebulosa Mini-LED é um concorrente para o destaque principal e quase consegue colocar a CPU e a GPU na sombra.
Já encontramos seu predecessor como sendo uma máquina de jogos bem redonda e otimizada. Geralmente, mas não de forma inequívoca, isso também se aplica ao novo Asus M16. Semelhante à maioria dos laptops atuais e novos, estamos lidando com um duplo salto geracional em termos de CPU e GPU. No entanto, esta mudança nem sempre corre bem. Muitos laptops RTX 40 atualmente sofrem de altas latências devido a otimizações de drivers ainda não finalizadas. Além disso, o consumo de energia ociosa da M16 é um pouco alto demais. Isto leva a uma vida útil sub-ótima da bateria, mas é algo que poderia ser corrigido com a ajuda de uma atualização de software. Também é um pouco irritante que o Asus tenha tornado a manutenção desnecessariamente difícil devido a muitos parafusos ocultos e à RAM SO-DIMM. Além disso, a omissão de uma porta LAN é difícil de ser compreendida pelos jogadores e o RTX 4090 topo de linha com uma CPU H "somente" funciona tão rápido quanto umaRTX 4080emparelhado com uma CPU HX.
O Asus ROG Zephyrus M16 emparelhado com um RTX 4090 é um poderoso pacote de jogos, completo com uma fantástica tela Mini-LED e potência de sobra - mesmo em 4K. No entanto, o preço é íngreme e há alguns pequenos pregos que precisam ser engomados.
Para muitos, o preço muito alto virá como uma verdadeira desvantagem, mas, como sempre, estaremos revendo extensivamente as alternativas possíveis (mais baratas) à medida que e quando elas chegarem.
Preço e disponibilidade
Atualmente, só é possível pré-encomendar a nova M16. Entretanto, a máquina está prevista para aparecer este mês (março de 2023).
Asus ROG Zephyrus M16 GU604VY-NM042X
- 03/15/2023 v7 (old)
Christian Hintze
Transparência
A seleção dos dispositivos a serem analisados é feita pela nossa equipe editorial. A amostra de teste foi fornecida ao autor como empréstimo pelo fabricante ou varejista para fins desta revisão. O credor não teve influência nesta revisão, nem o fabricante recebeu uma cópia desta revisão antes da publicação. Não houve obrigação de publicar esta revisão. Como empresa de mídia independente, a Notebookcheck não está sujeita à autoridade de fabricantes, varejistas ou editores.
É assim que o Notebookcheck está testando
Todos os anos, o Notebookcheck analisa de forma independente centenas de laptops e smartphones usando procedimentos padronizados para garantir que todos os resultados sejam comparáveis. Desenvolvemos continuamente nossos métodos de teste há cerca de 20 anos e definimos padrões da indústria no processo. Em nossos laboratórios de teste, equipamentos de medição de alta qualidade são utilizados por técnicos e editores experientes. Esses testes envolvem um processo de validação em vários estágios. Nosso complexo sistema de classificação é baseado em centenas de medições e benchmarks bem fundamentados, o que mantém a objetividade.Price comparison

