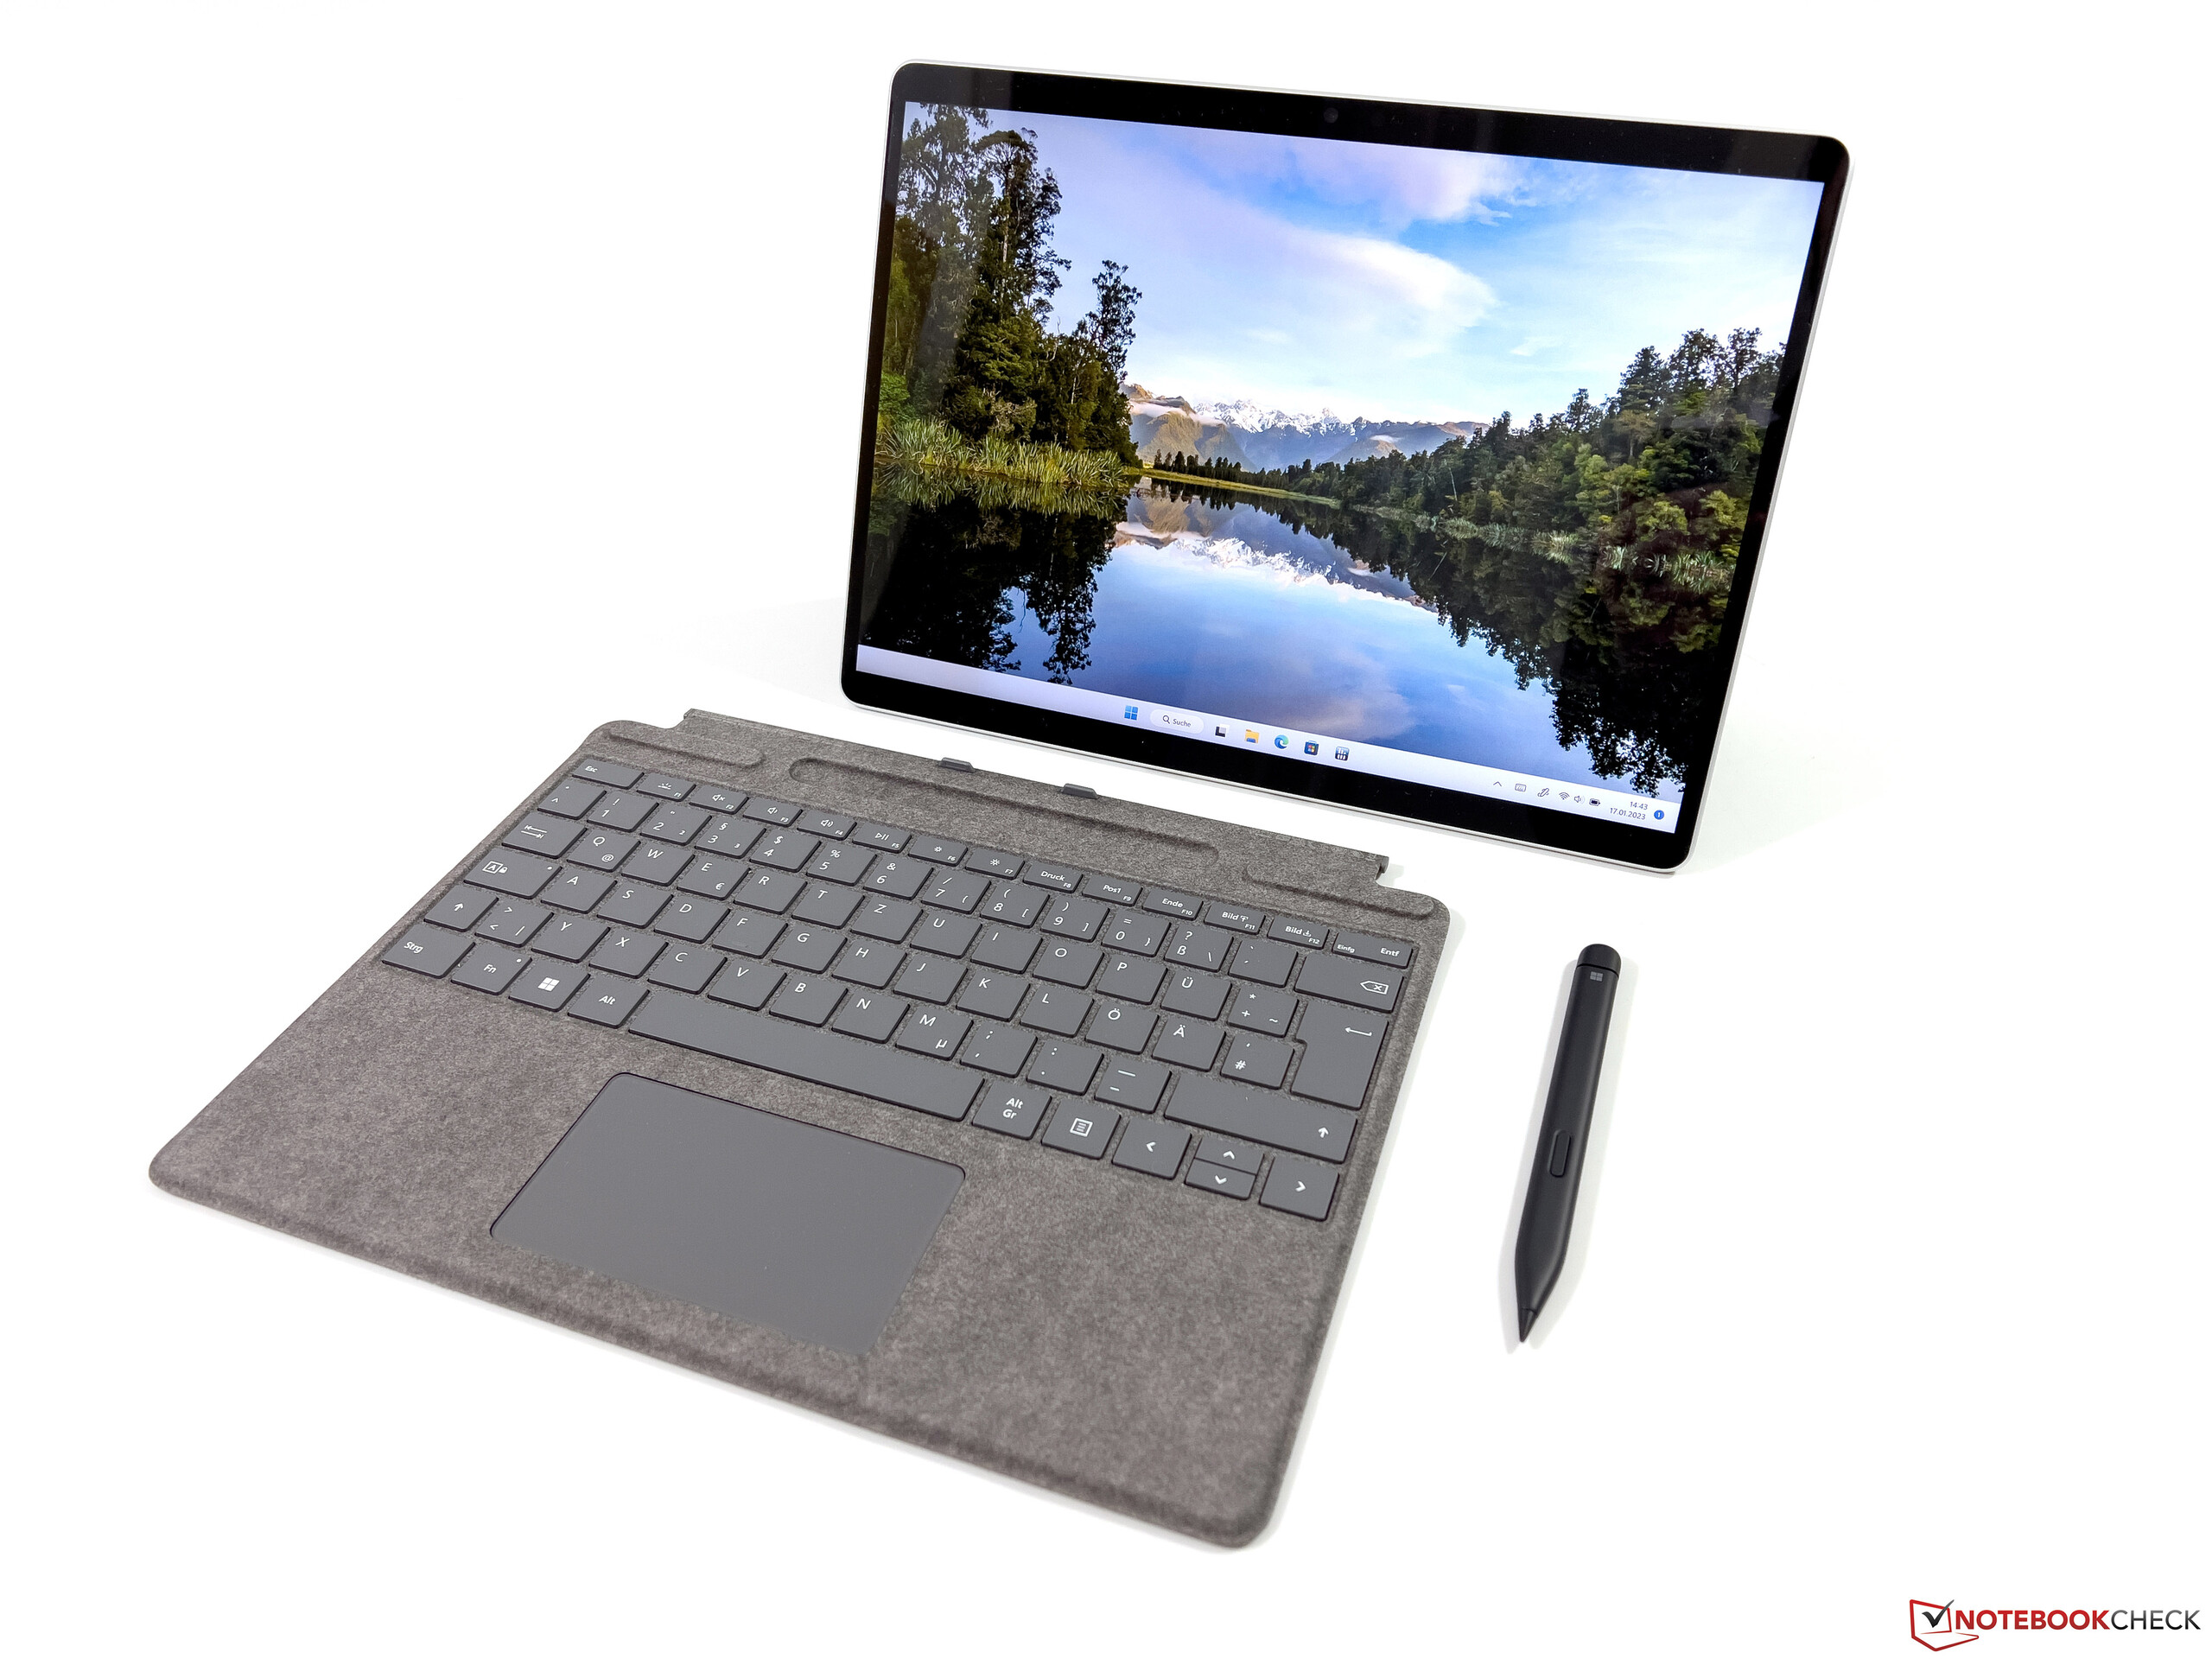
Revisão do Microsoft Surface Pro 9: Conversível agora com significativamente mais potência de CPU

A Microsoft fez várias mudanças em seus produtos Surface Pro 9, uma vez que o anterior tablet Surface Pro X ARM não é mais um produto autônomo e continuará sob o nome Surface Pro 9. Isto significa que agora existem duas variantes do Surface Pro 9, ou seja, uma com um processador Intel regular (a partir de US$ 989,00) e a outra com um chip ARM (US$ 1377,12), que também suporta conectividade 5G. Também revisaremos a nova variante do ARM com o Microsoft SQ3 Adreno 8CX Gen3 em breve, mas o Surface Pro 9 com seu processador Alder Lake-U é nosso primeiro objeto de teste para hoje.
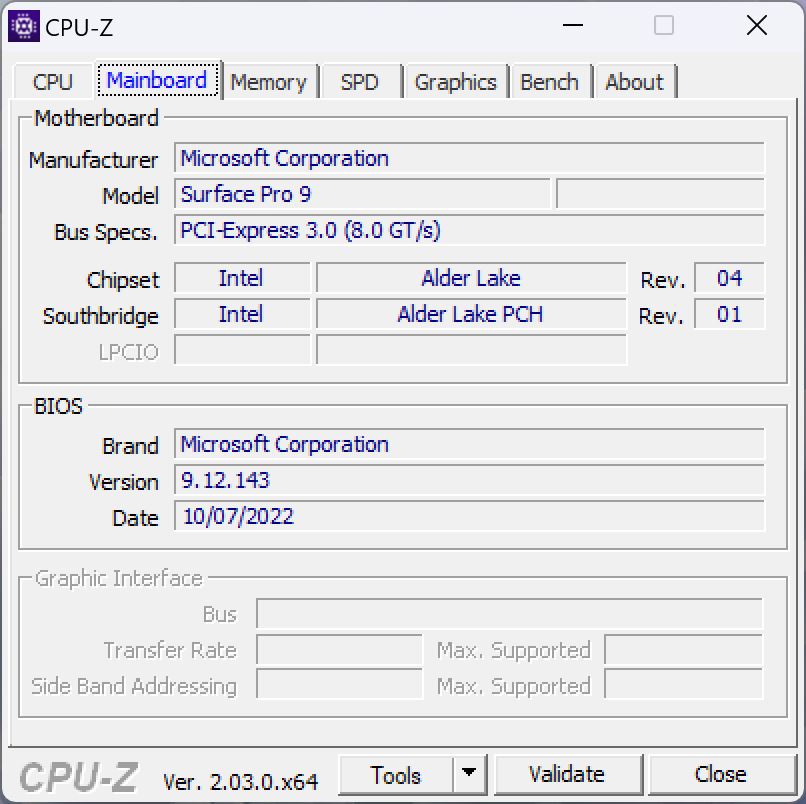
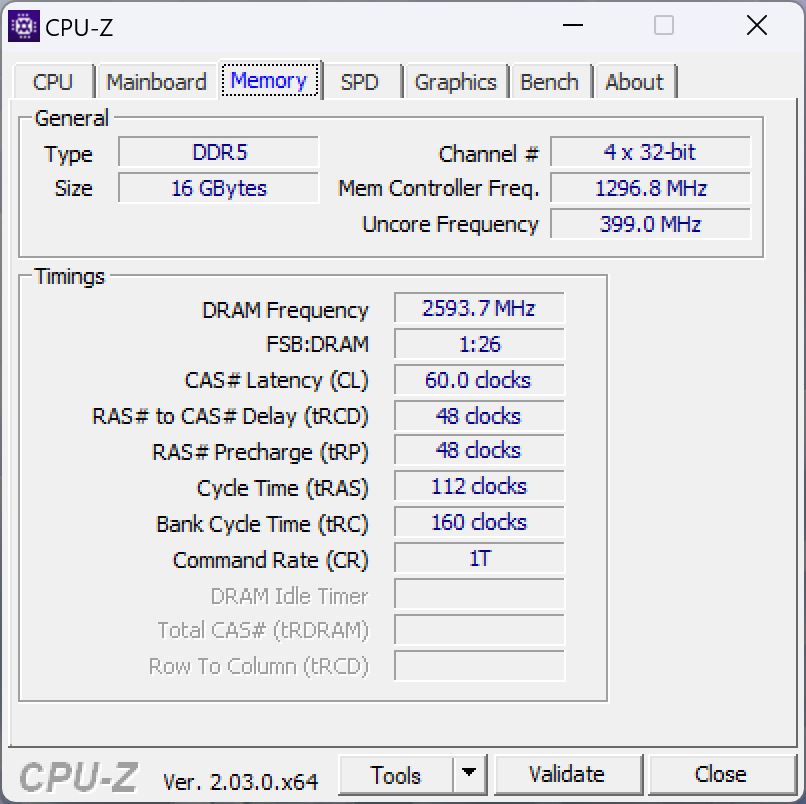
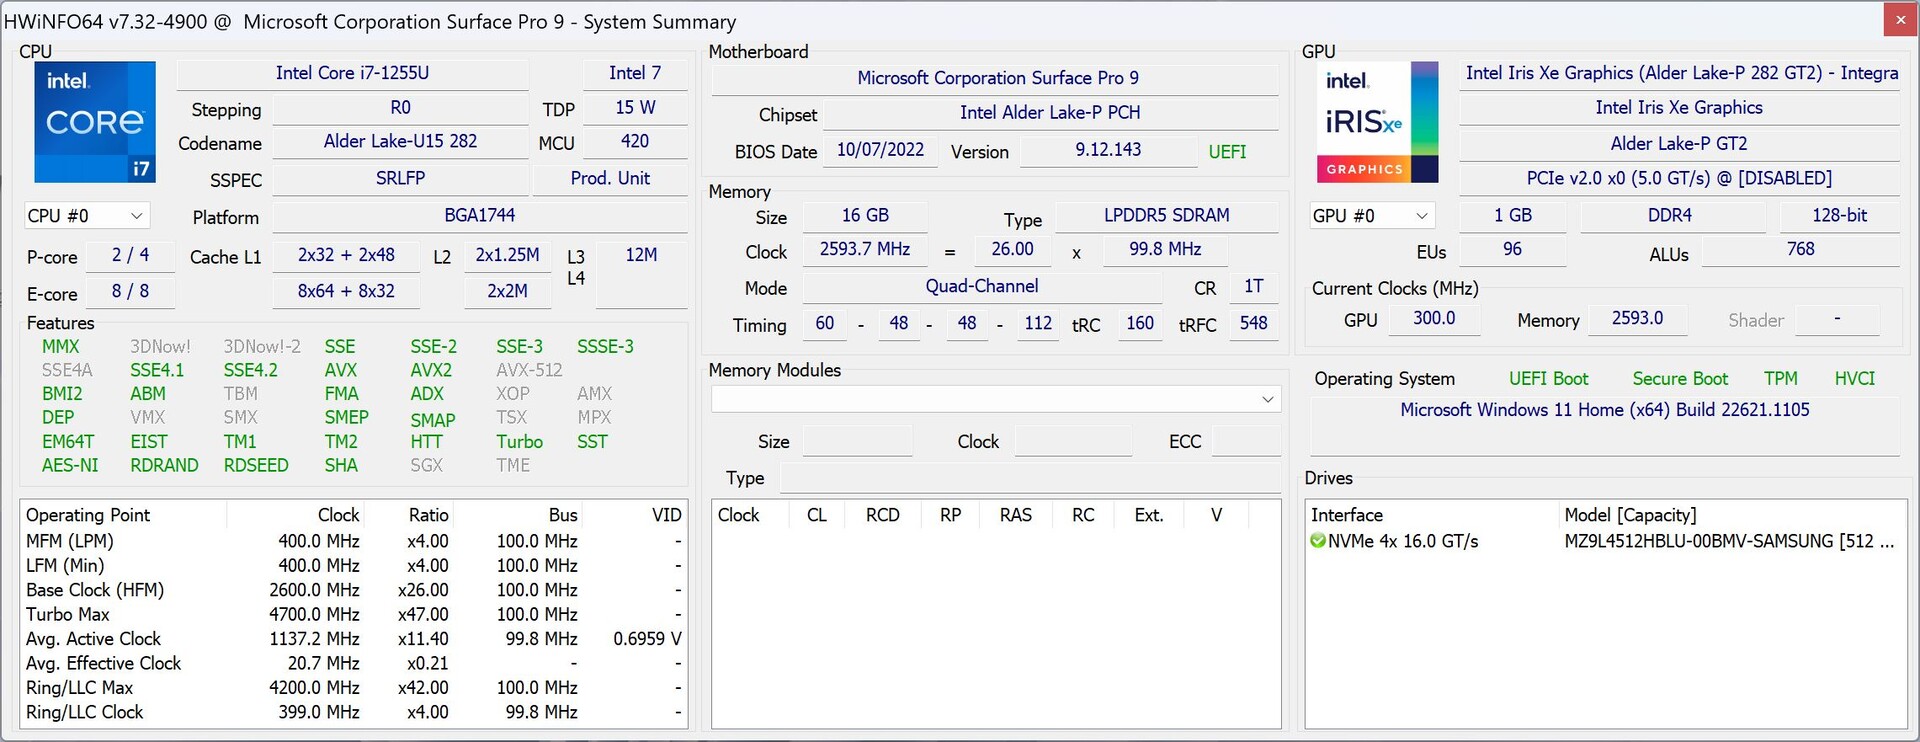
Nossa amostra de revisão é a variante superior da CPU com um Core i7 1255U, 16GB de RAM e 512 GB PCIe-SSD. Nesta configuração, o conversível custa US$1.879,99, embora você tenha que considerar outros ~US$300 para o Signature Keyboard e a Surface Slim Pen 2. Vários varejistas online (dependendo de sua localização) podem oferecer tais pacotes a preços mais baratos - nosso pacote, por exemplo, está disponível a partir de EUR 2130 (~US$2320). Outra mudança diz respeito à versão comercial do Surface Pro 9, que também não está mais disponível com um módulo WWAN na variante Intel.
Além do novo processador Alder Lake, o módulo WLAN atualizado e a remoção da tomada de áudio, não há grandes mudanças técnicas, nem no próprio Surface Pro nem nos dispositivos de entrada. Para obter mais informações, consulte nossas revisões de modelos anteriores do Surface Pro:
Possíveis concorrentes em comparação
Avaliação | Data | Modelo | Peso | Altura | Size | Resolução | Preço |
|---|---|---|---|---|---|---|---|
| 88.4 % v7 (old) | 01/2023 | Microsoft Surface Pro 9, i7-1255U i7-1255U, Iris Xe G7 96EUs | 877 g | 9.3 mm | 13.00" | 2880x1920 | |
| 90.1 % v7 (old) | 11/2022 | Dell XPS 13 9315 2-in-1 Core i5-1230U i5-1230U, Iris Xe G7 80EUs | 764 g | 7.4 mm | 13.00" | 2880x1920 | |
| 88.5 % v7 (old) | 04/2021 | Lenovo ThinkPad X12 20UVS03G00 i7-1160G7, Iris Xe G7 96EUs | 1.1 kg | 14.5 mm | 12.30" | 1920x1280 | |
| 90.3 % v7 (old) | 12/2022 | HP Elite Dragonfly Folio 13.5 G3 i7-1265U, Iris Xe G7 96EUs | 1.4 kg | 17.8 mm | 13.50" | 1920x1280 | |
| 91.8 % v7 (old) | 11/2022 | Apple iPad Pro 12.9 2022 M2, M2 10-Core GPU | 682 g | 6.4 mm | 12.90" | 2732x2048 | |
| 86.8 % v7 (old) | 03/2022 | Asus ROG Flow Z13 GZ301ZE i9-12900H, GeForce RTX 3050 Ti Laptop GPU | 1.2 kg | 12 mm | 13.40" | 1920x1200 |
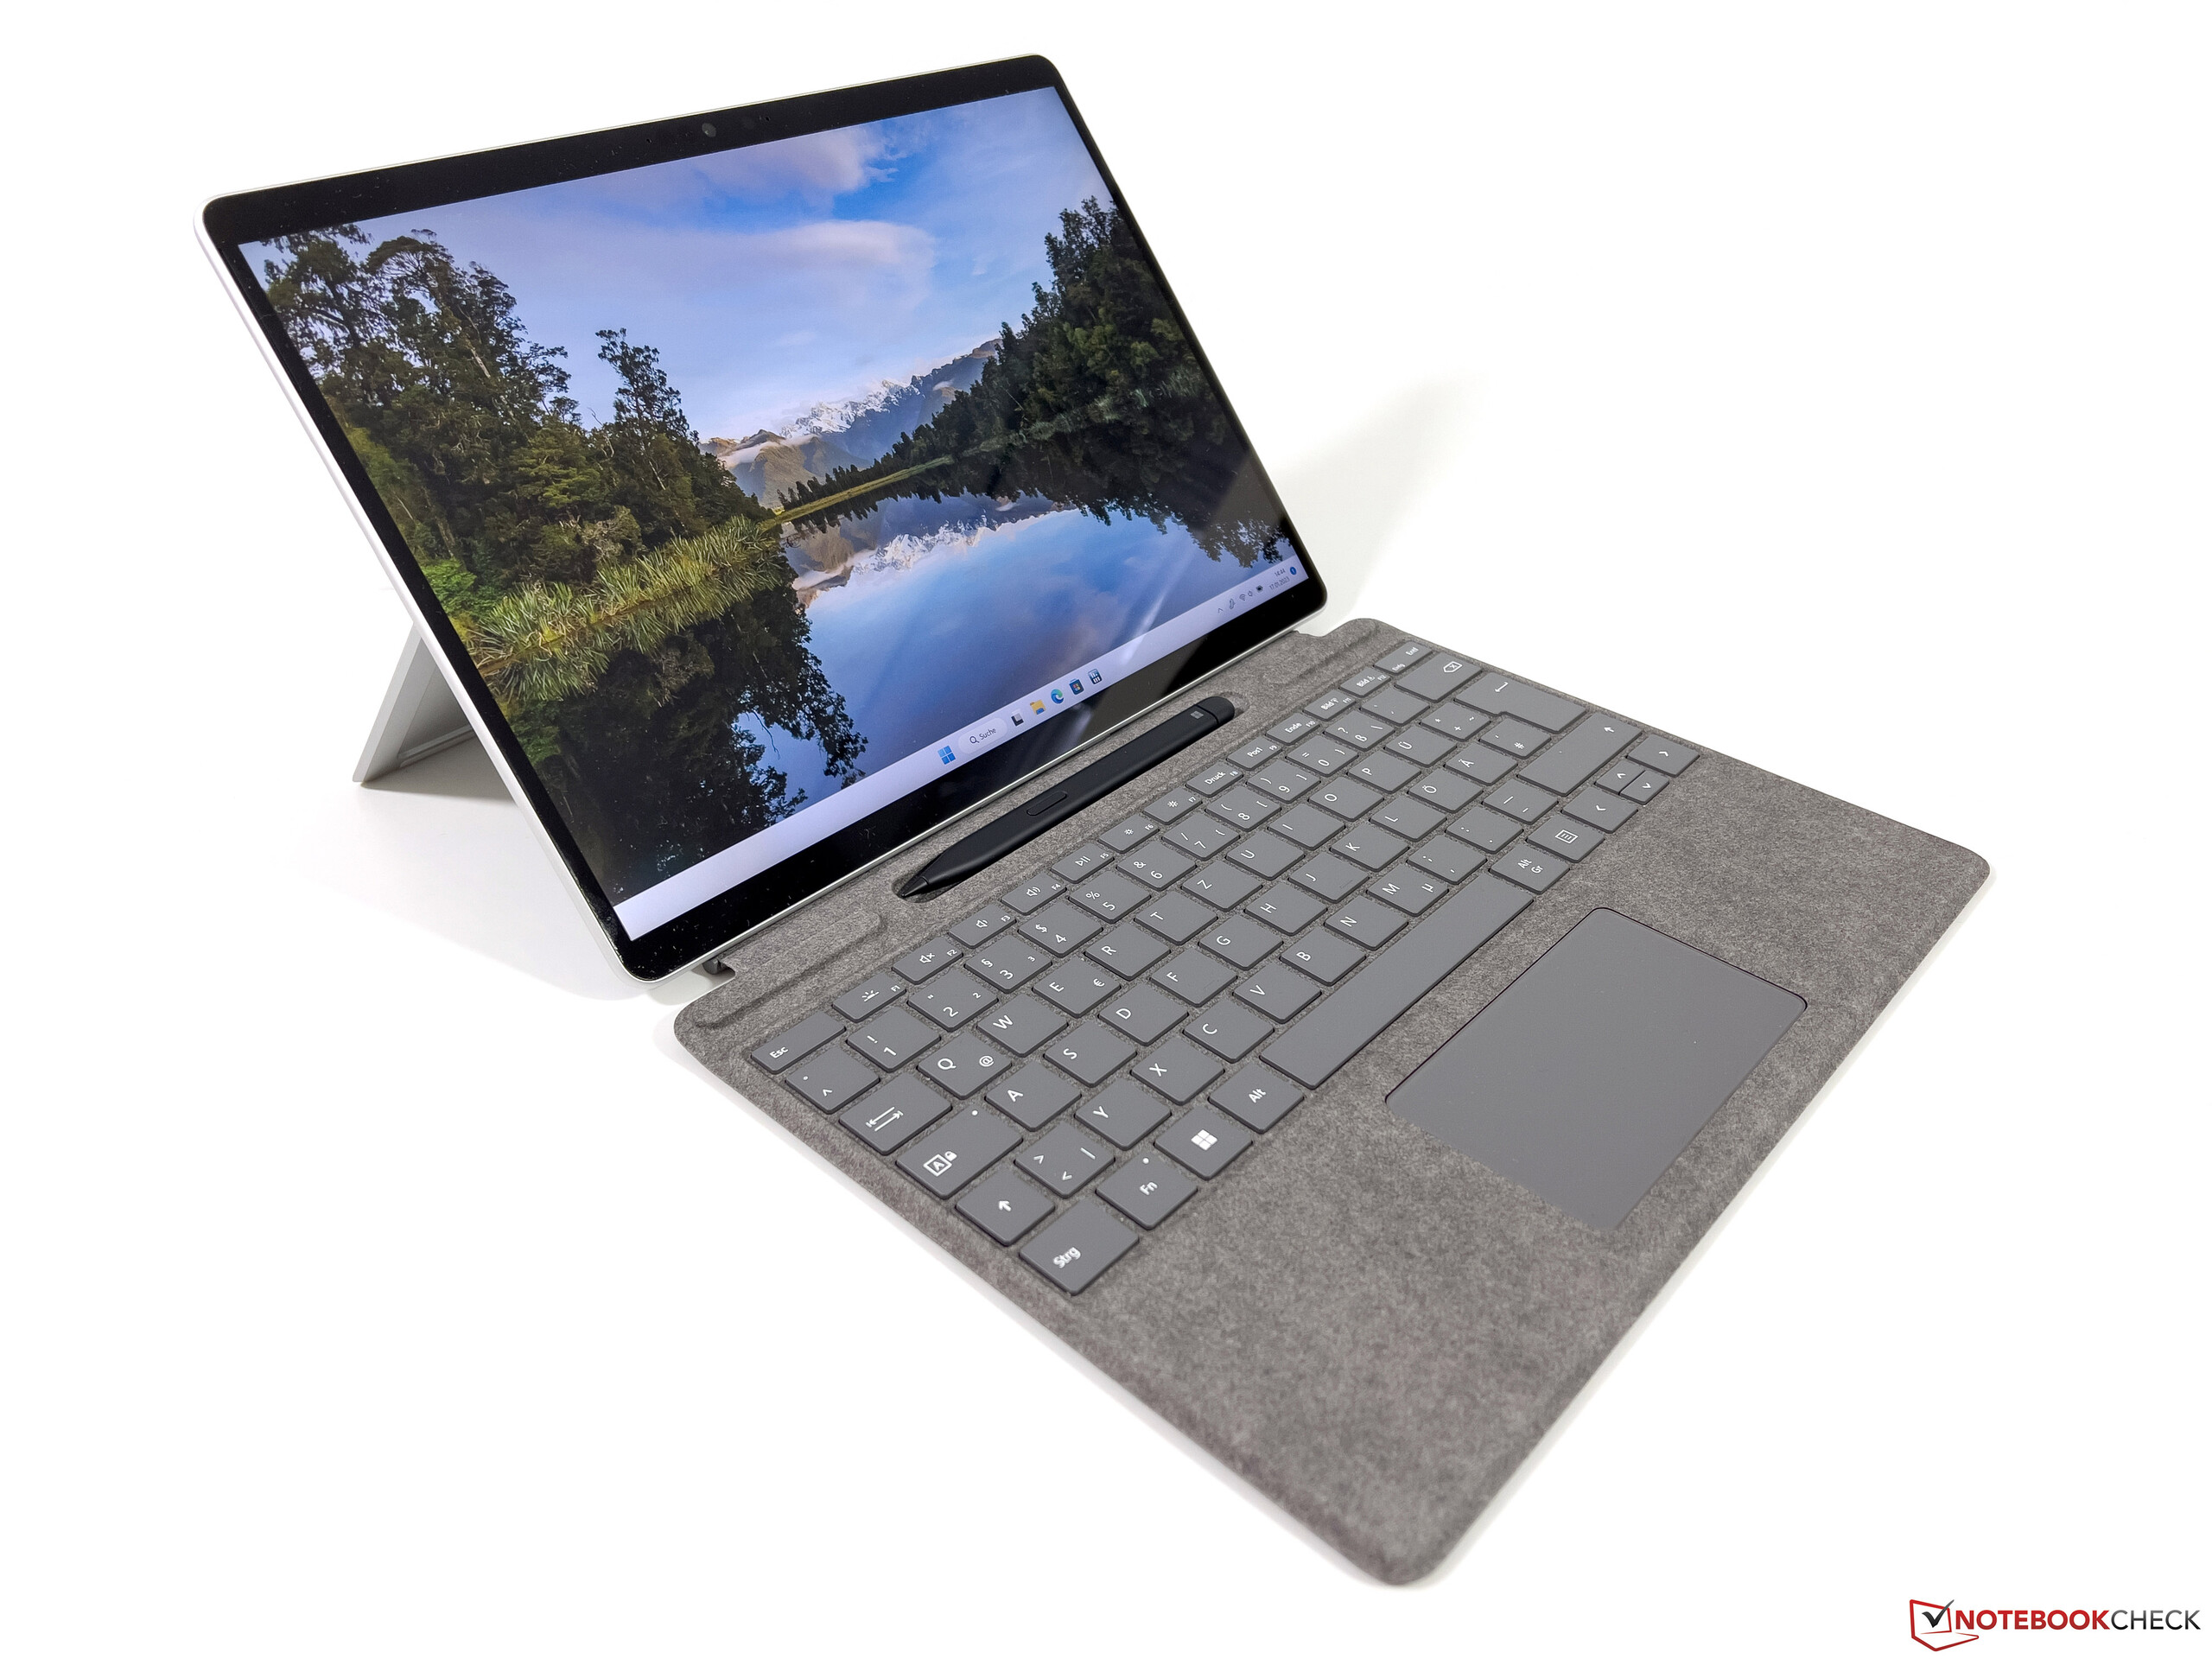
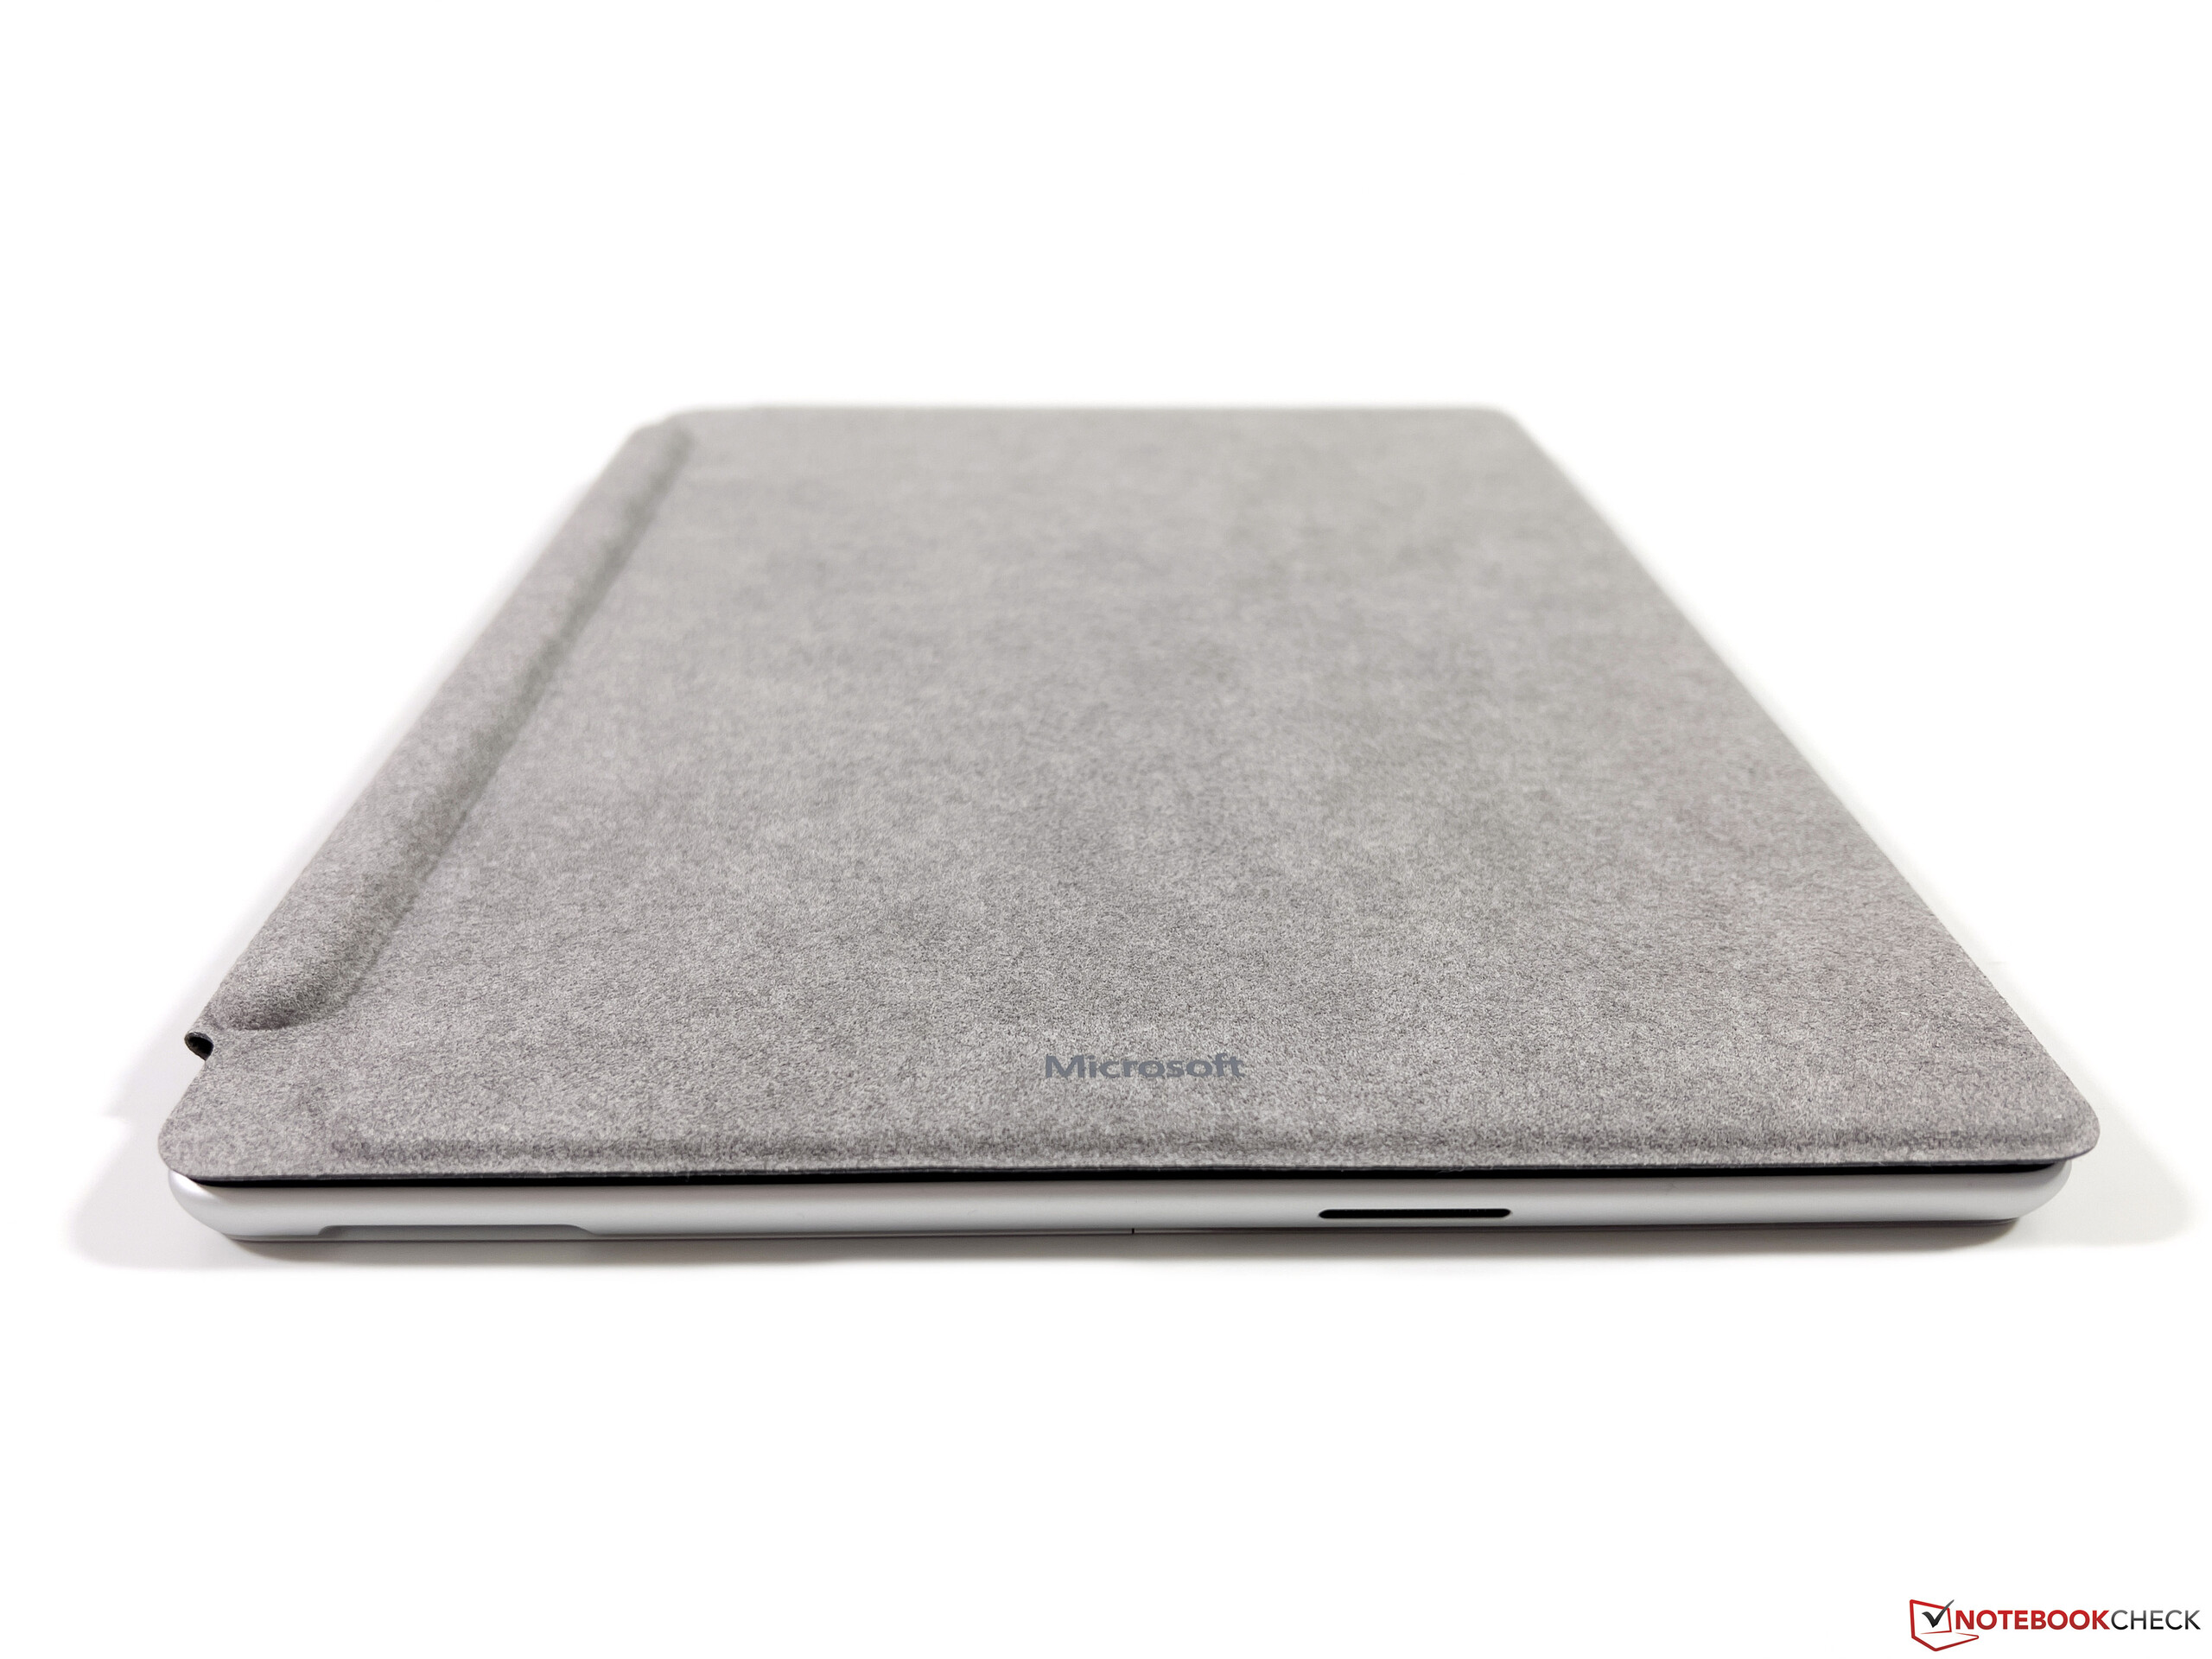
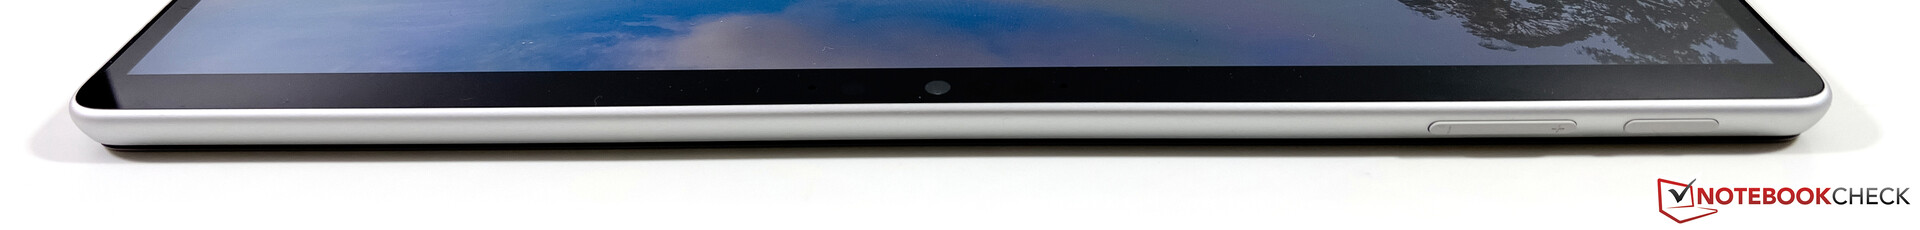
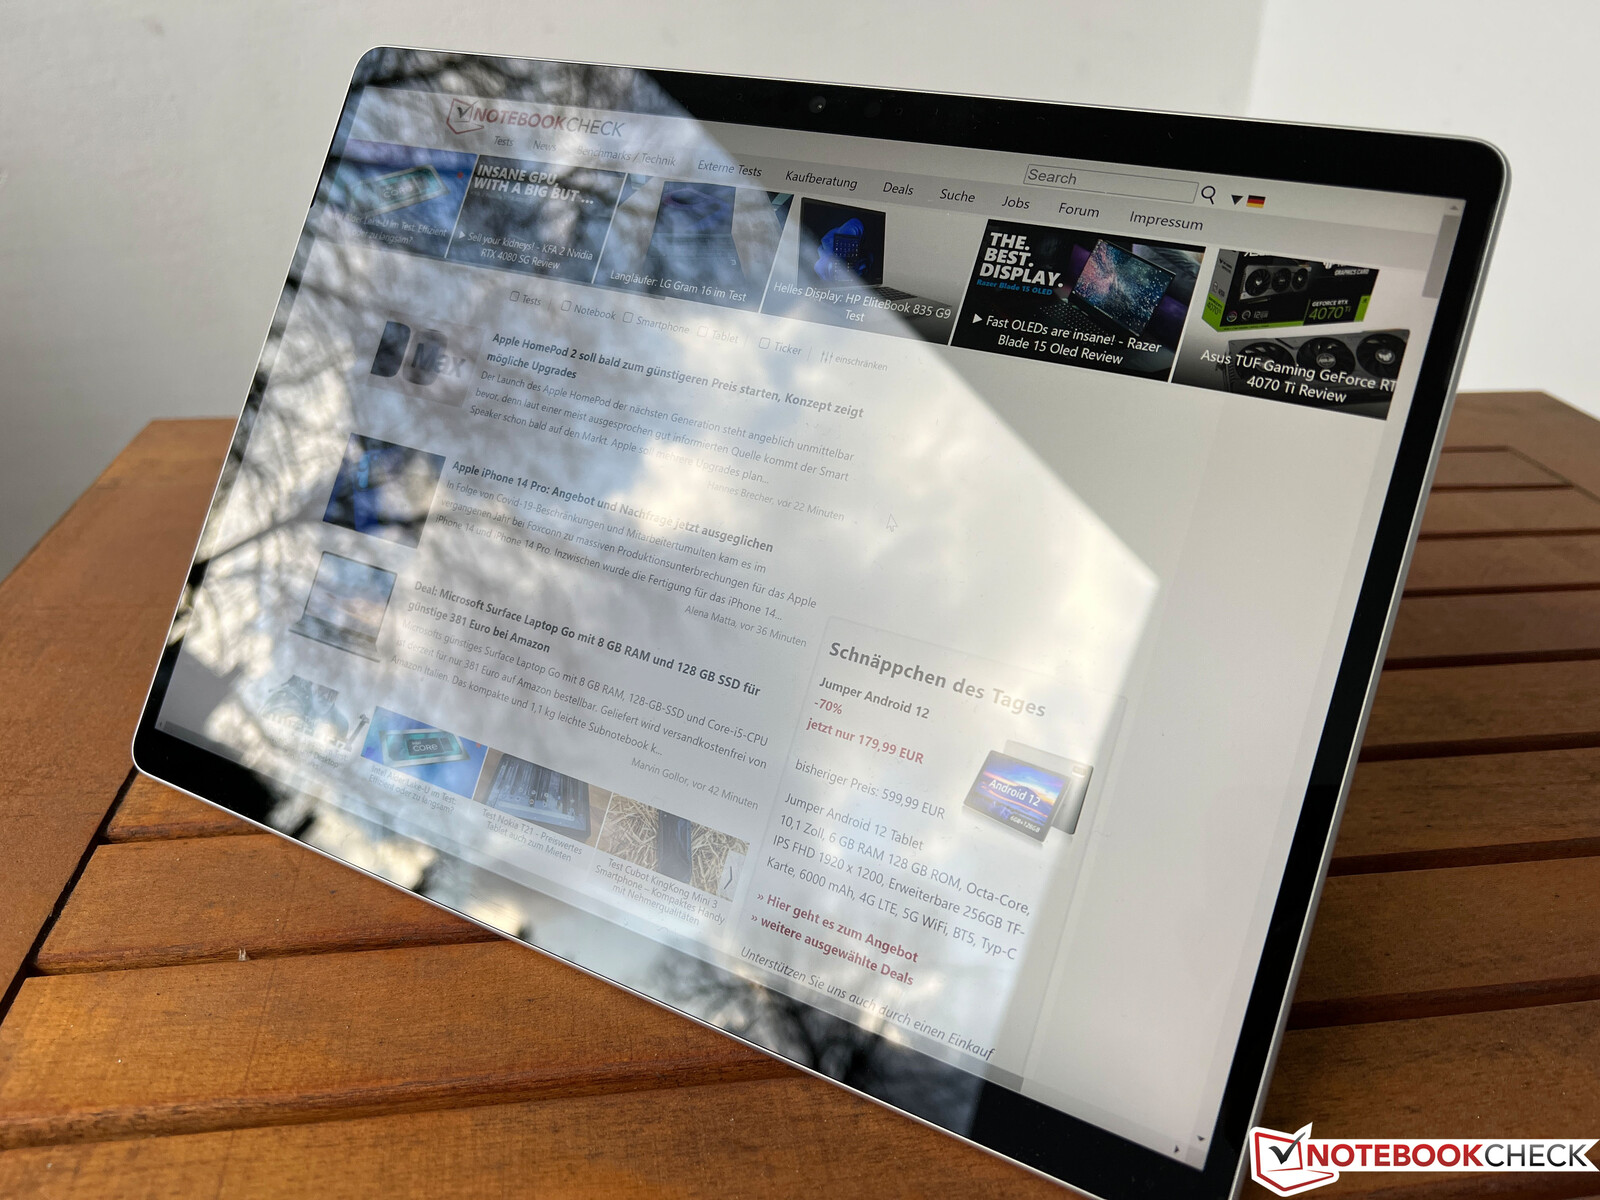
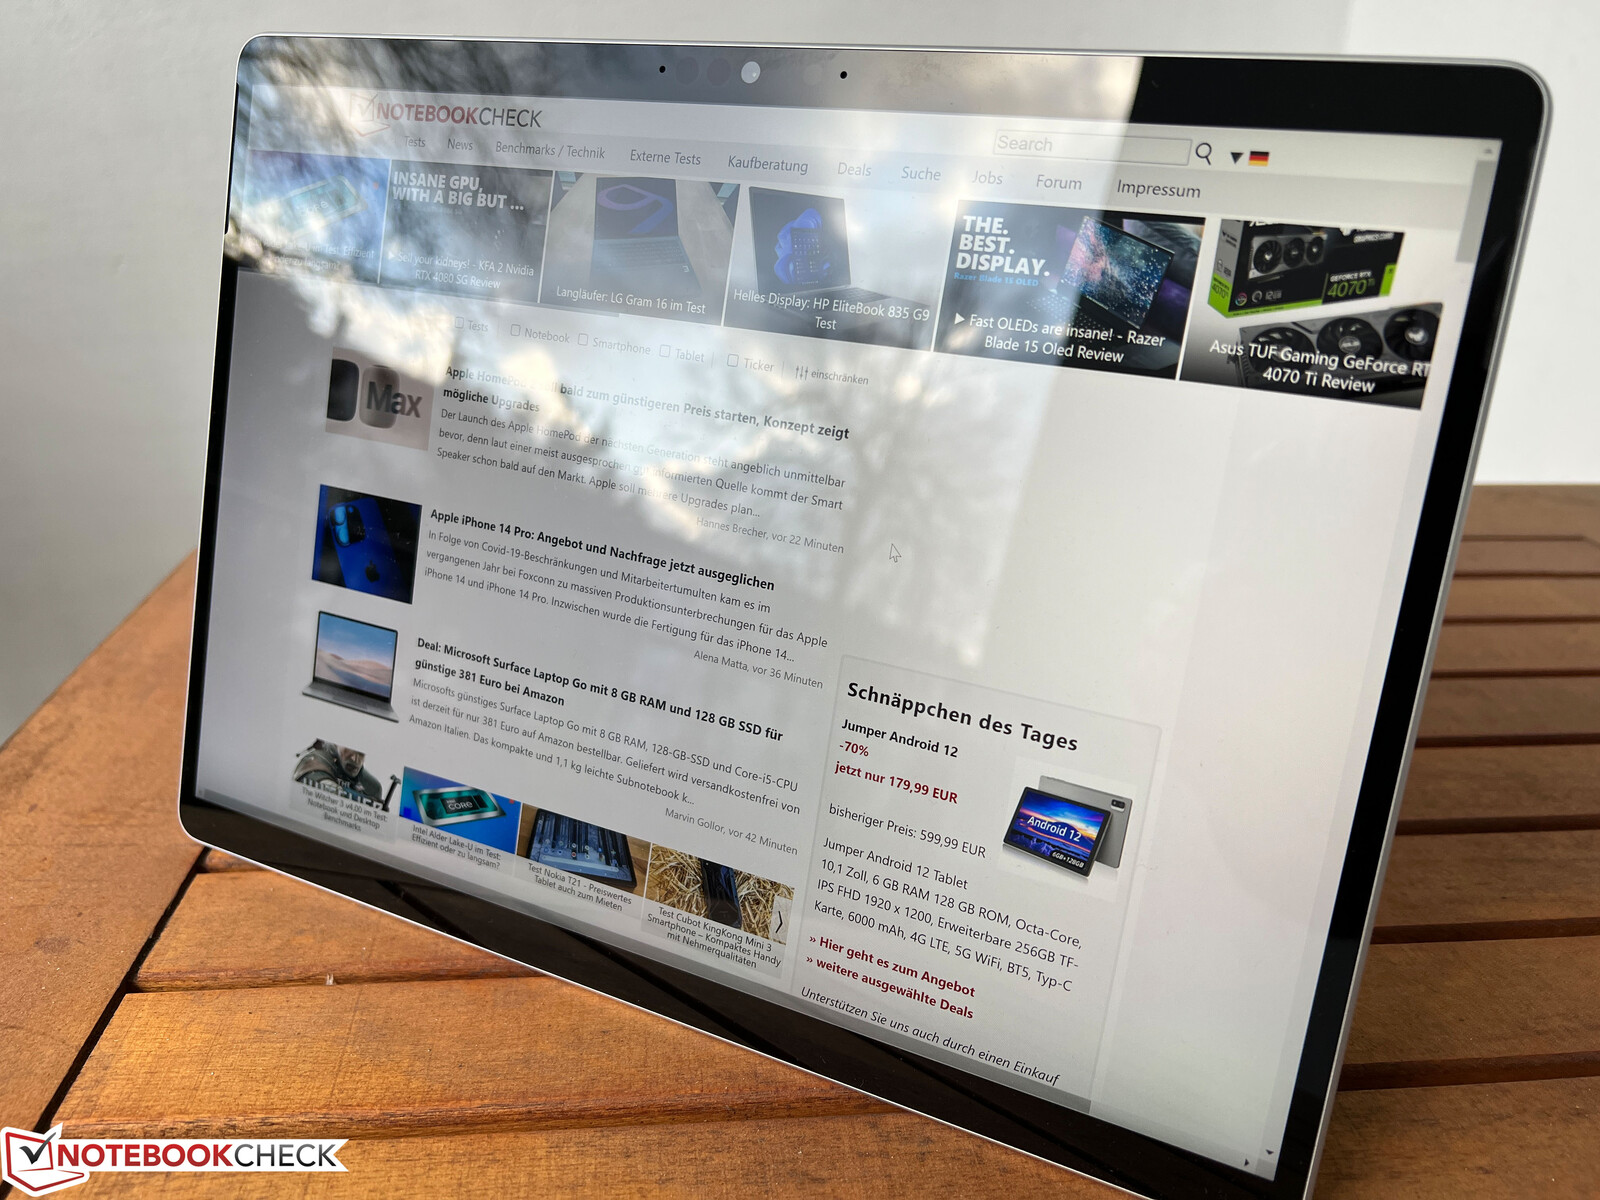
Caso - Pequenas mudanças no conversível
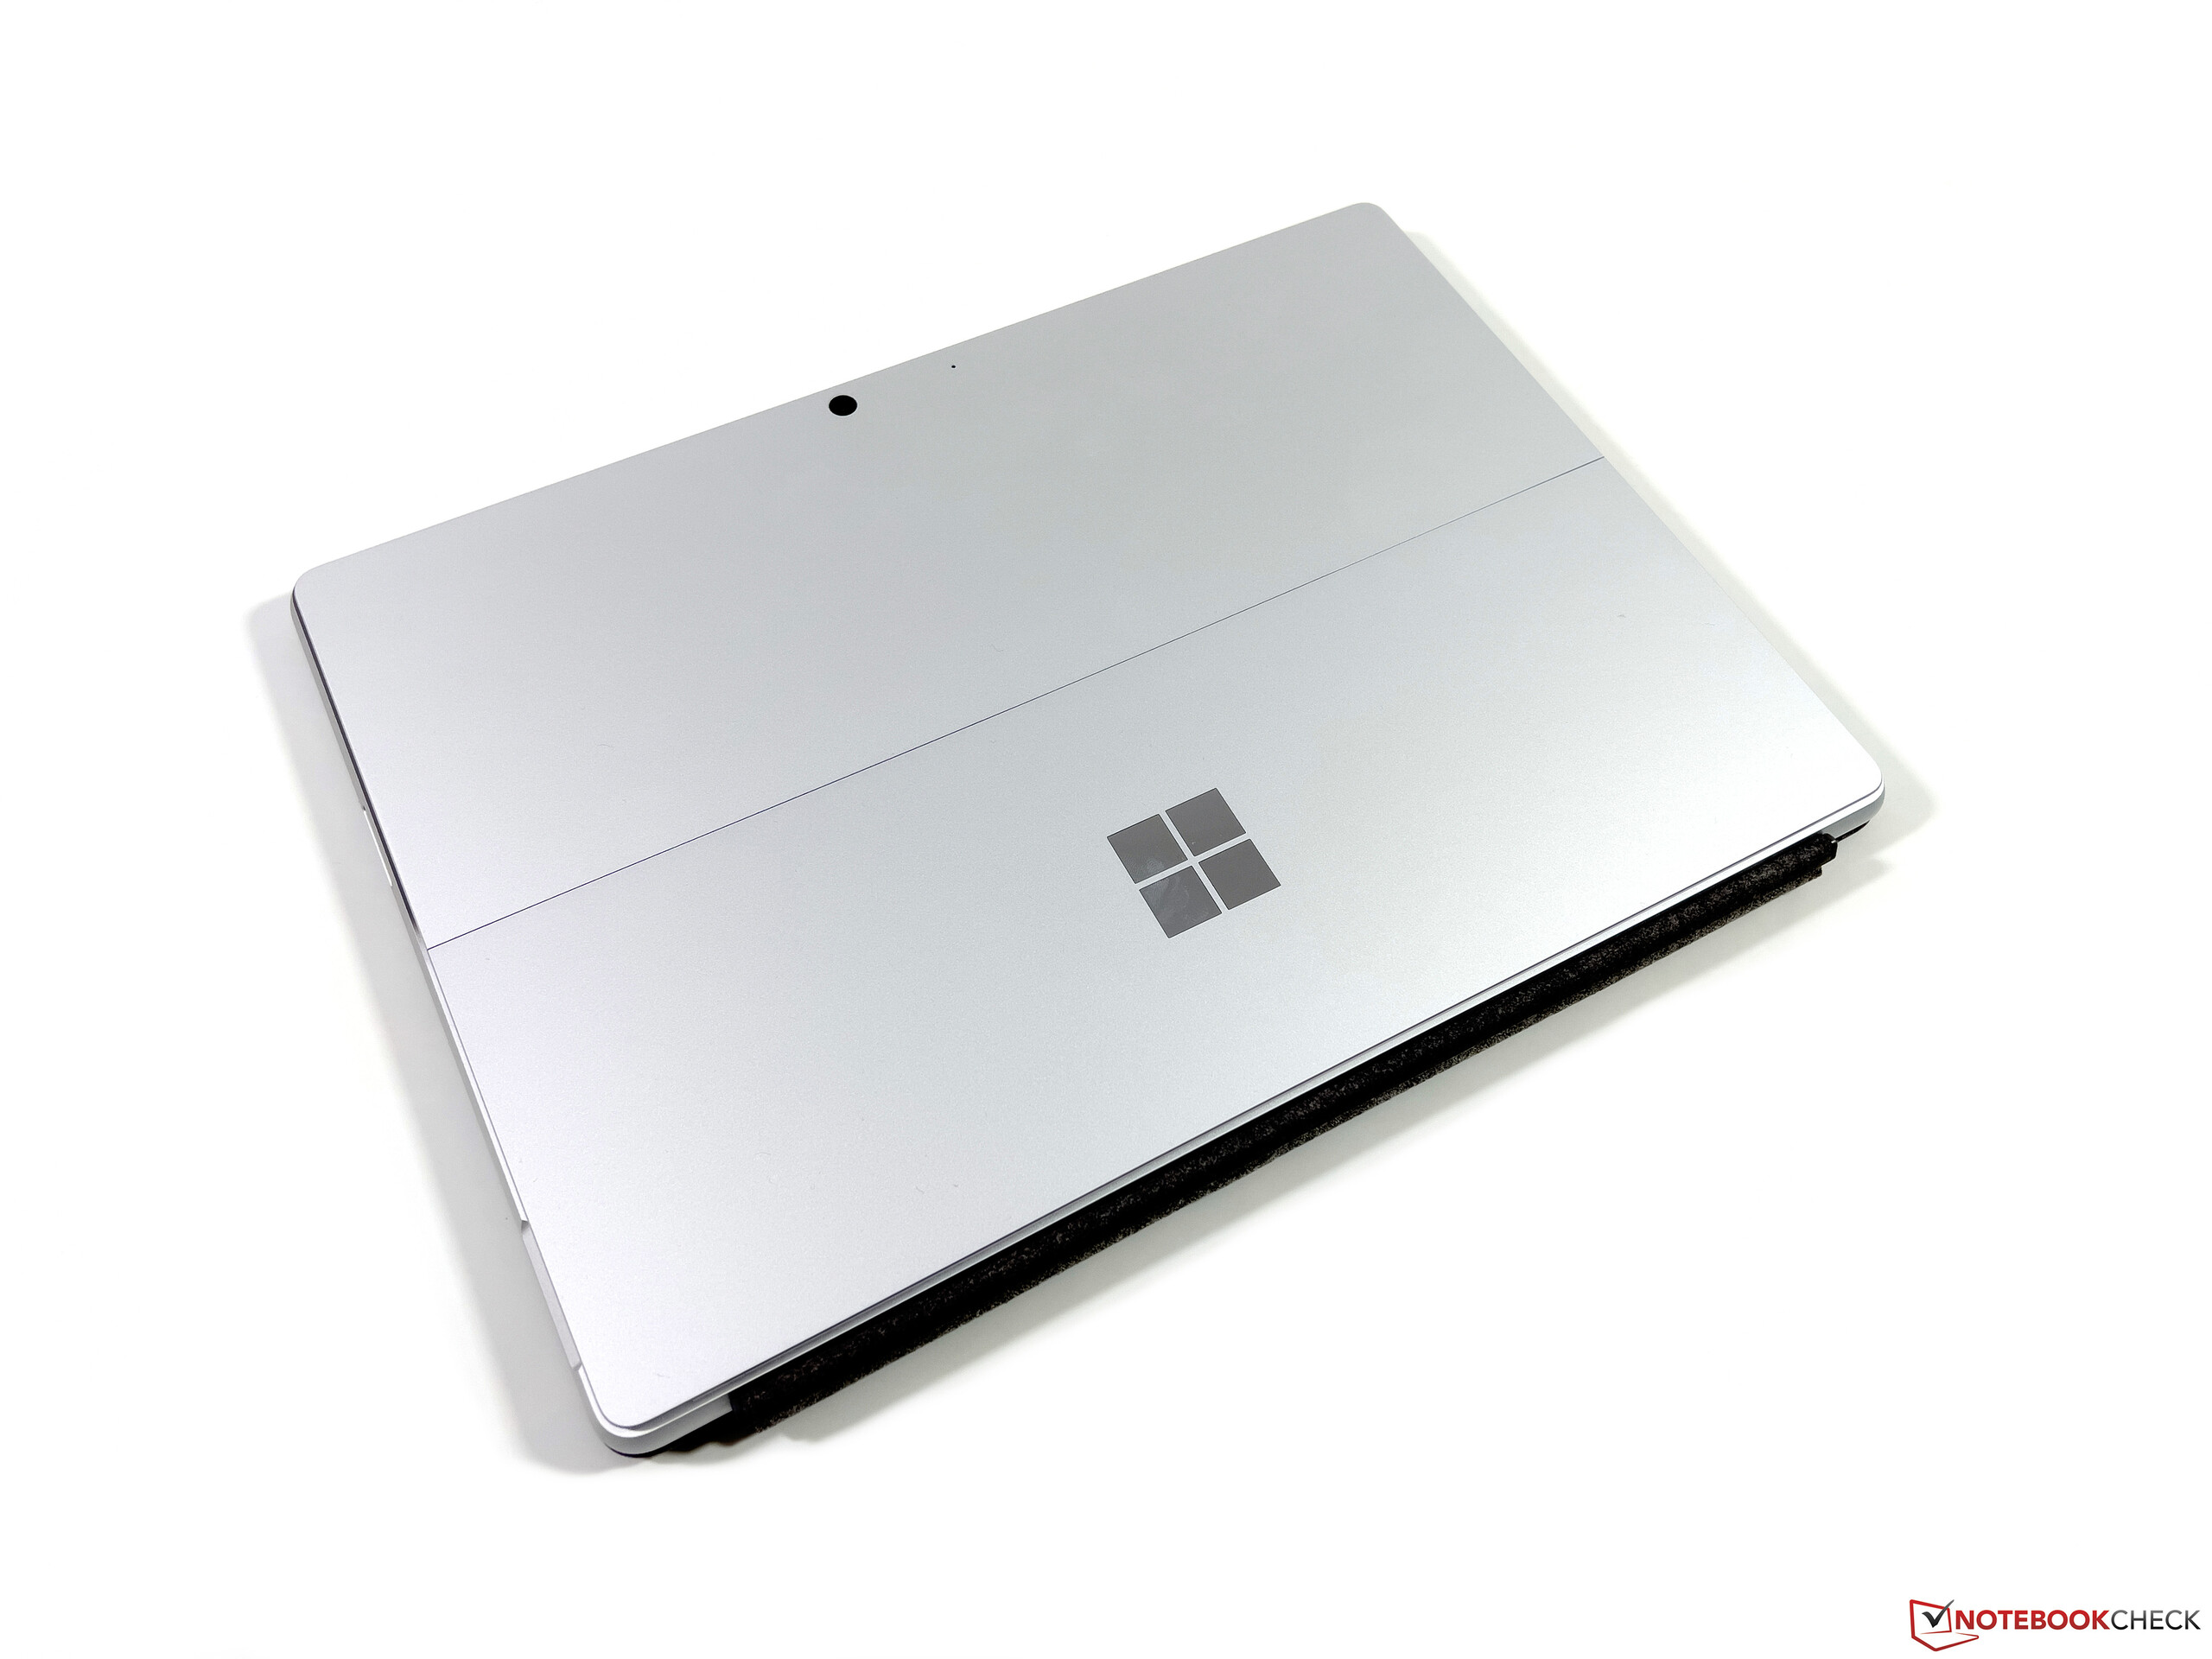
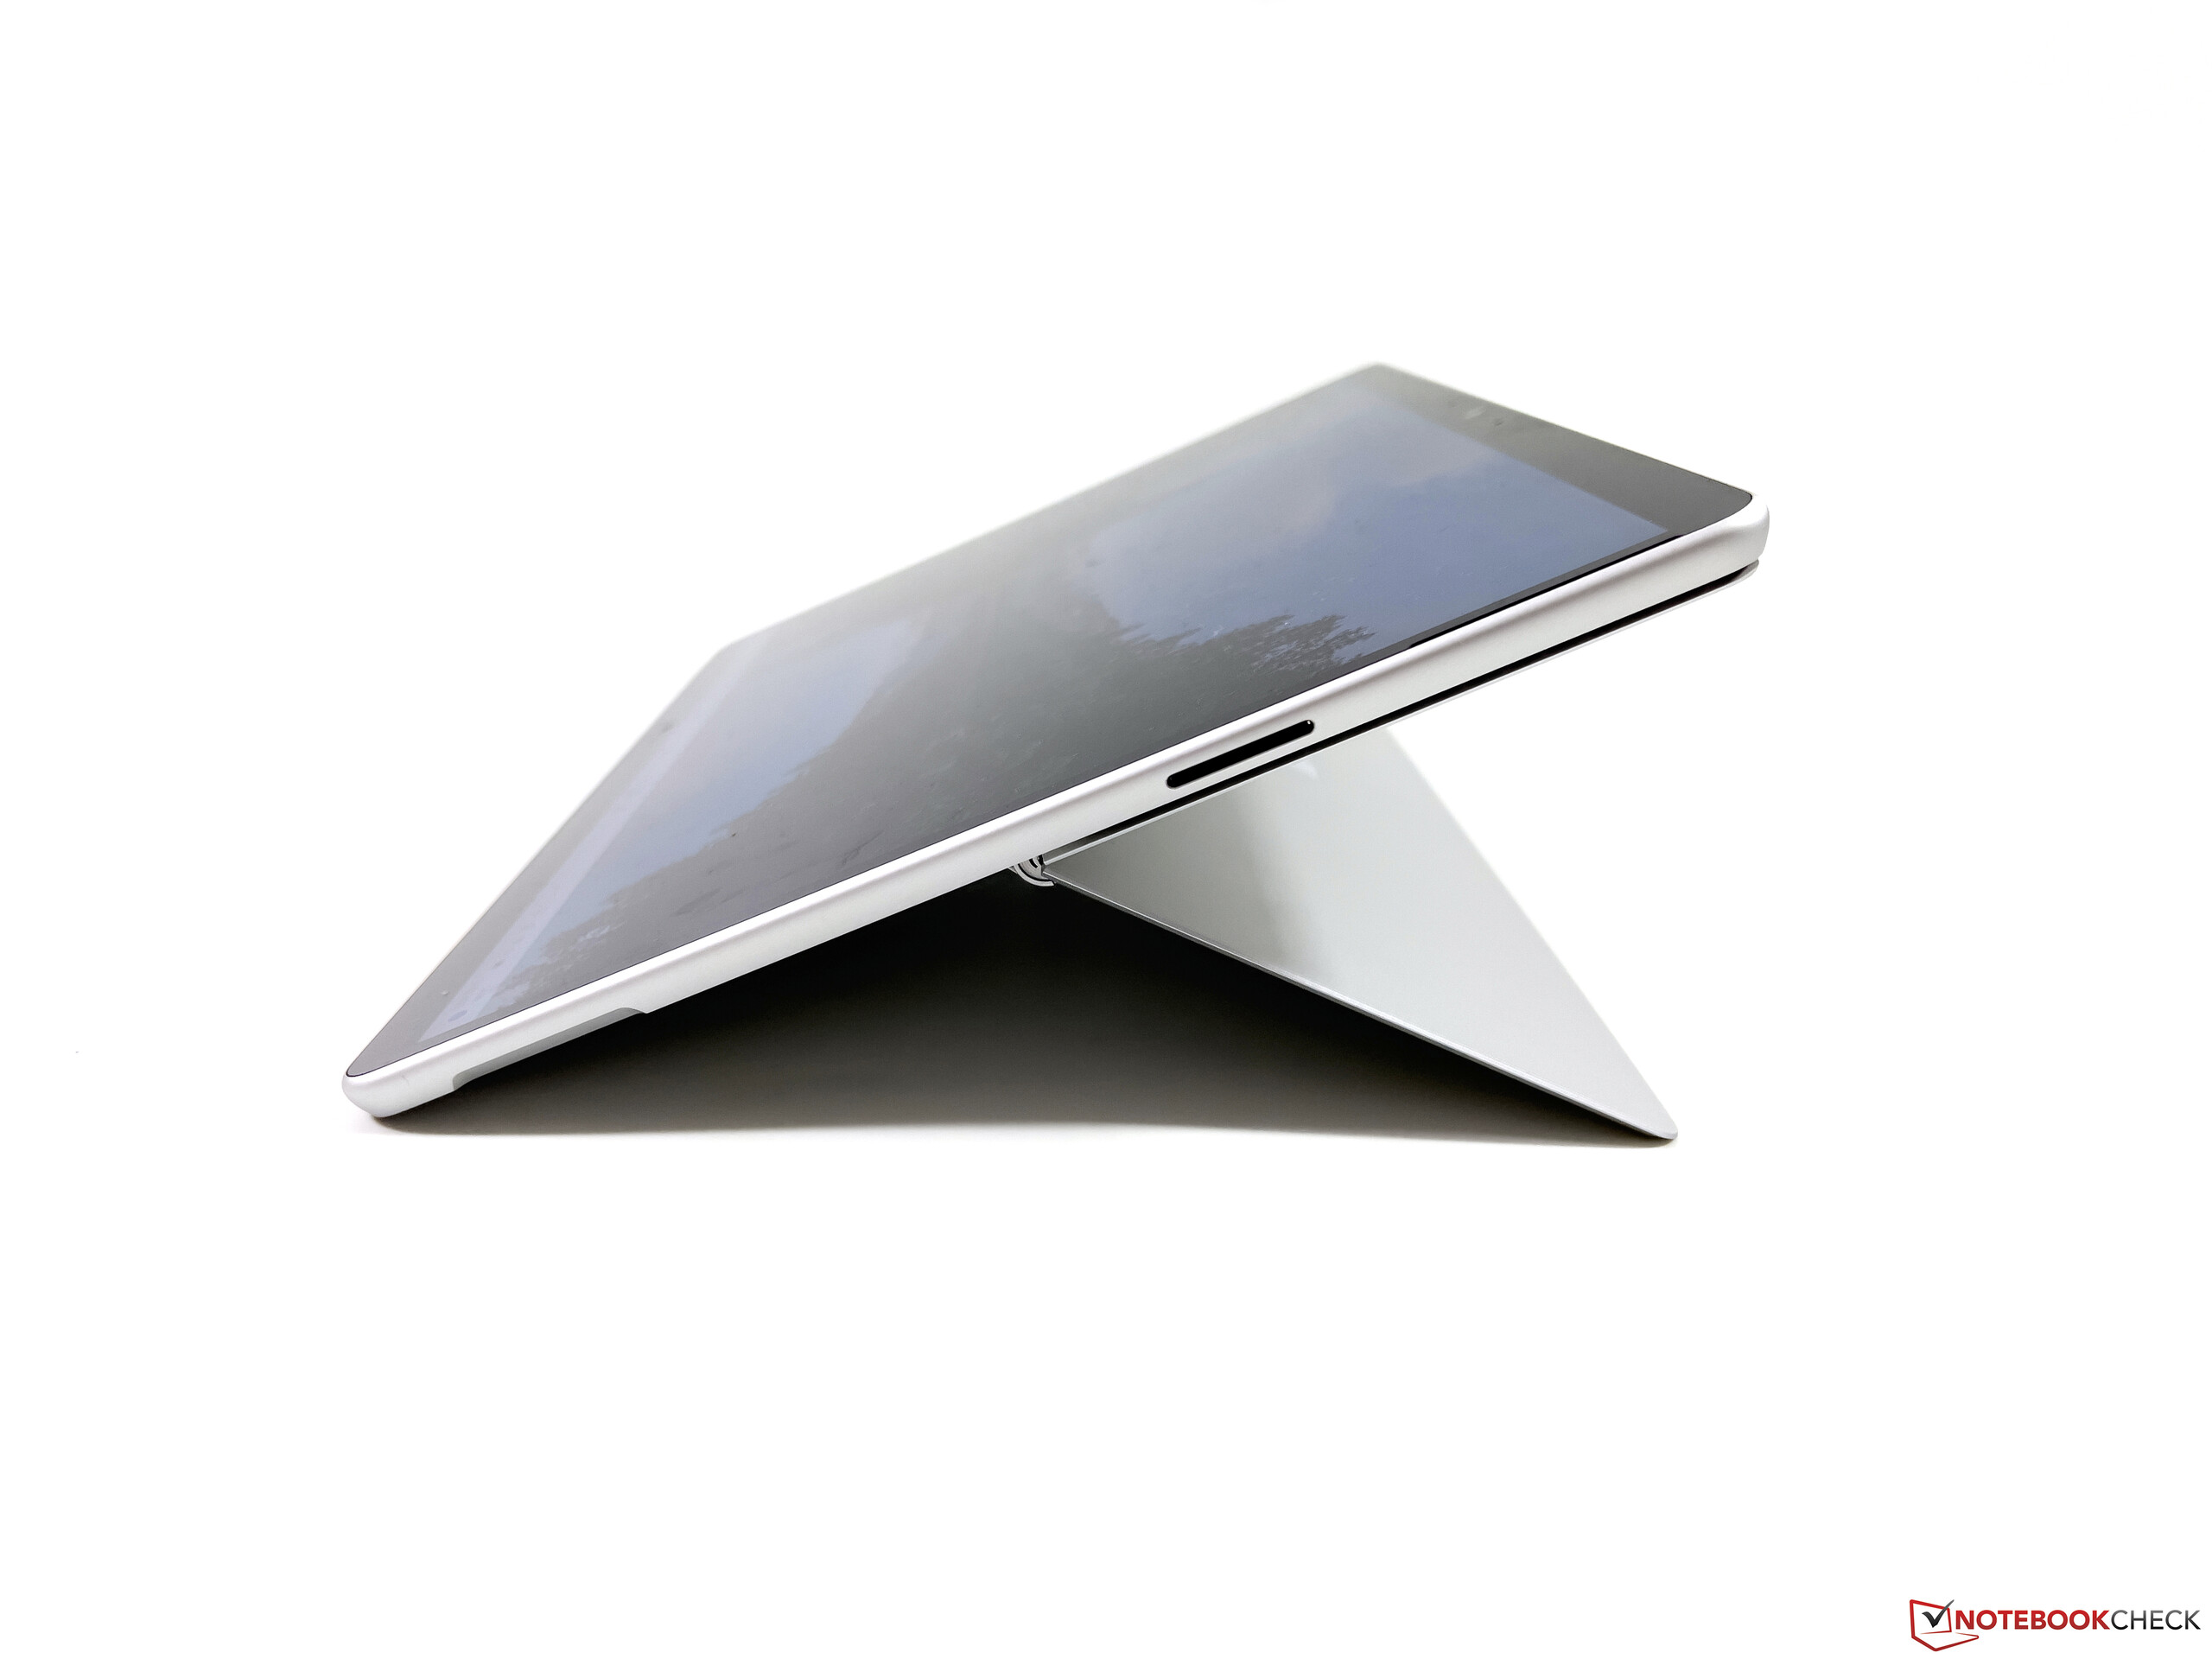
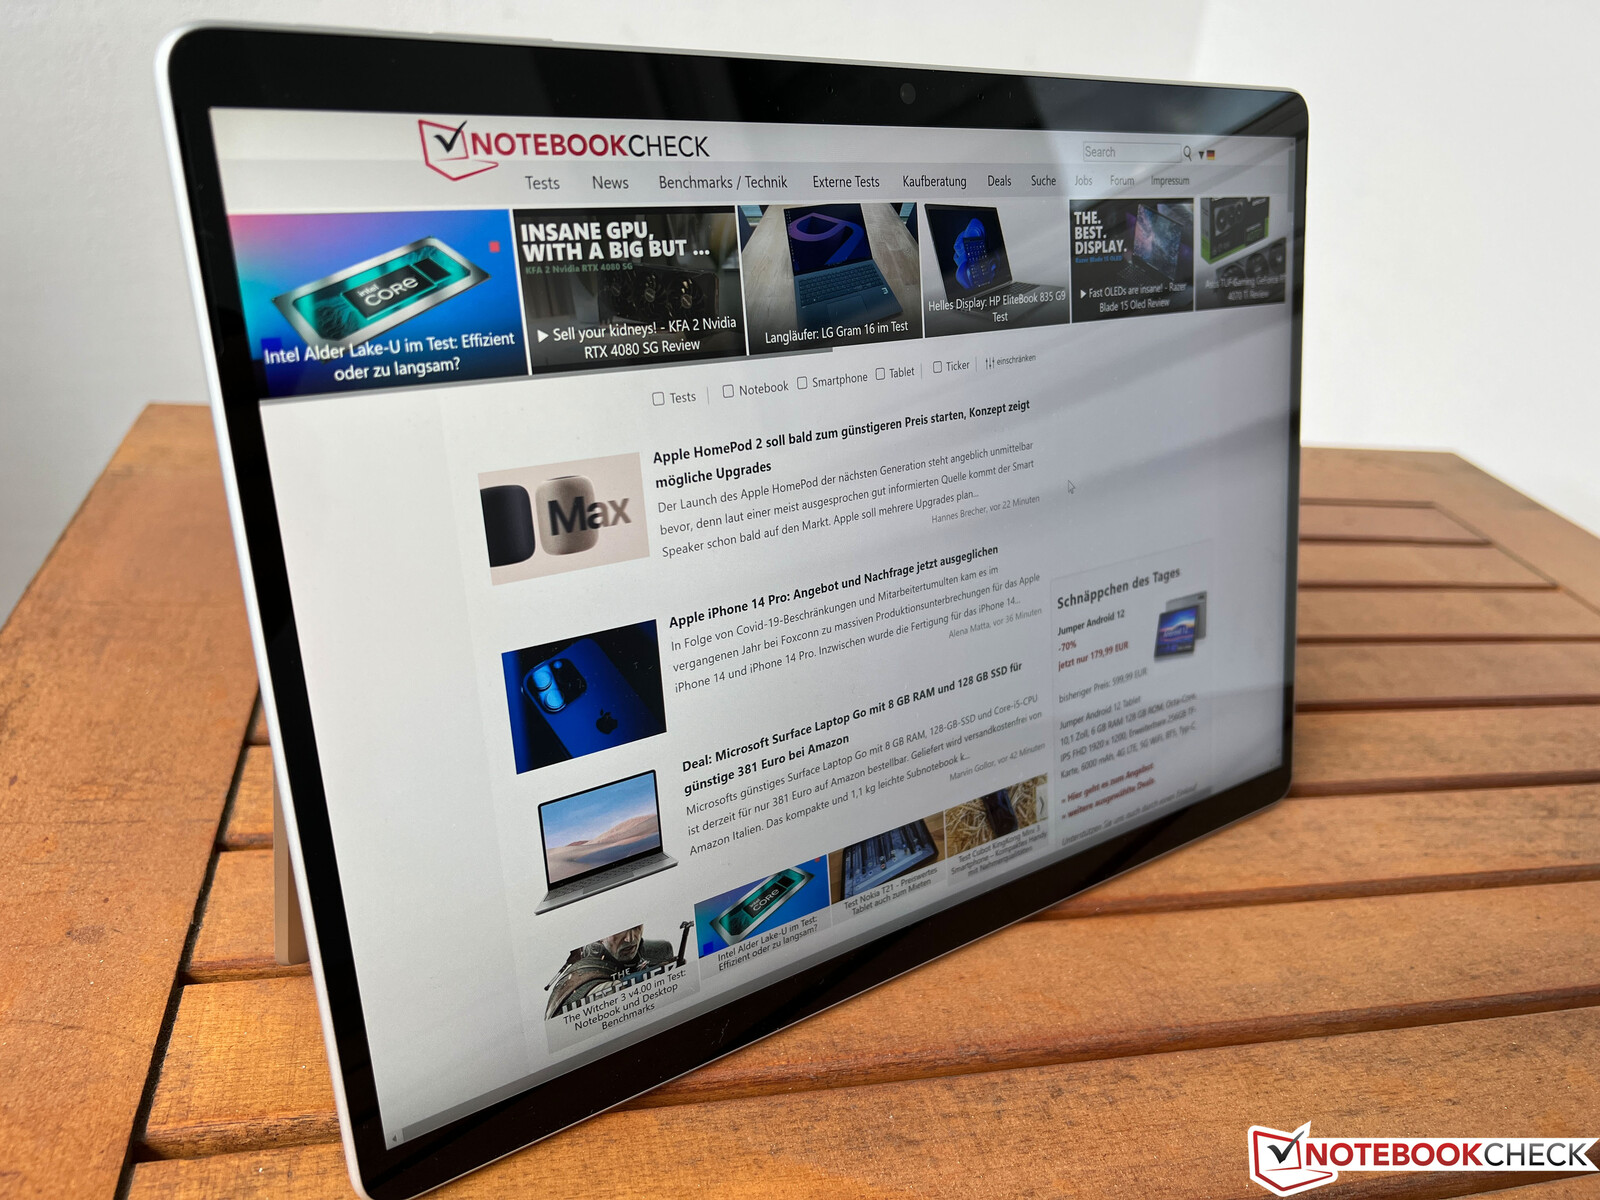
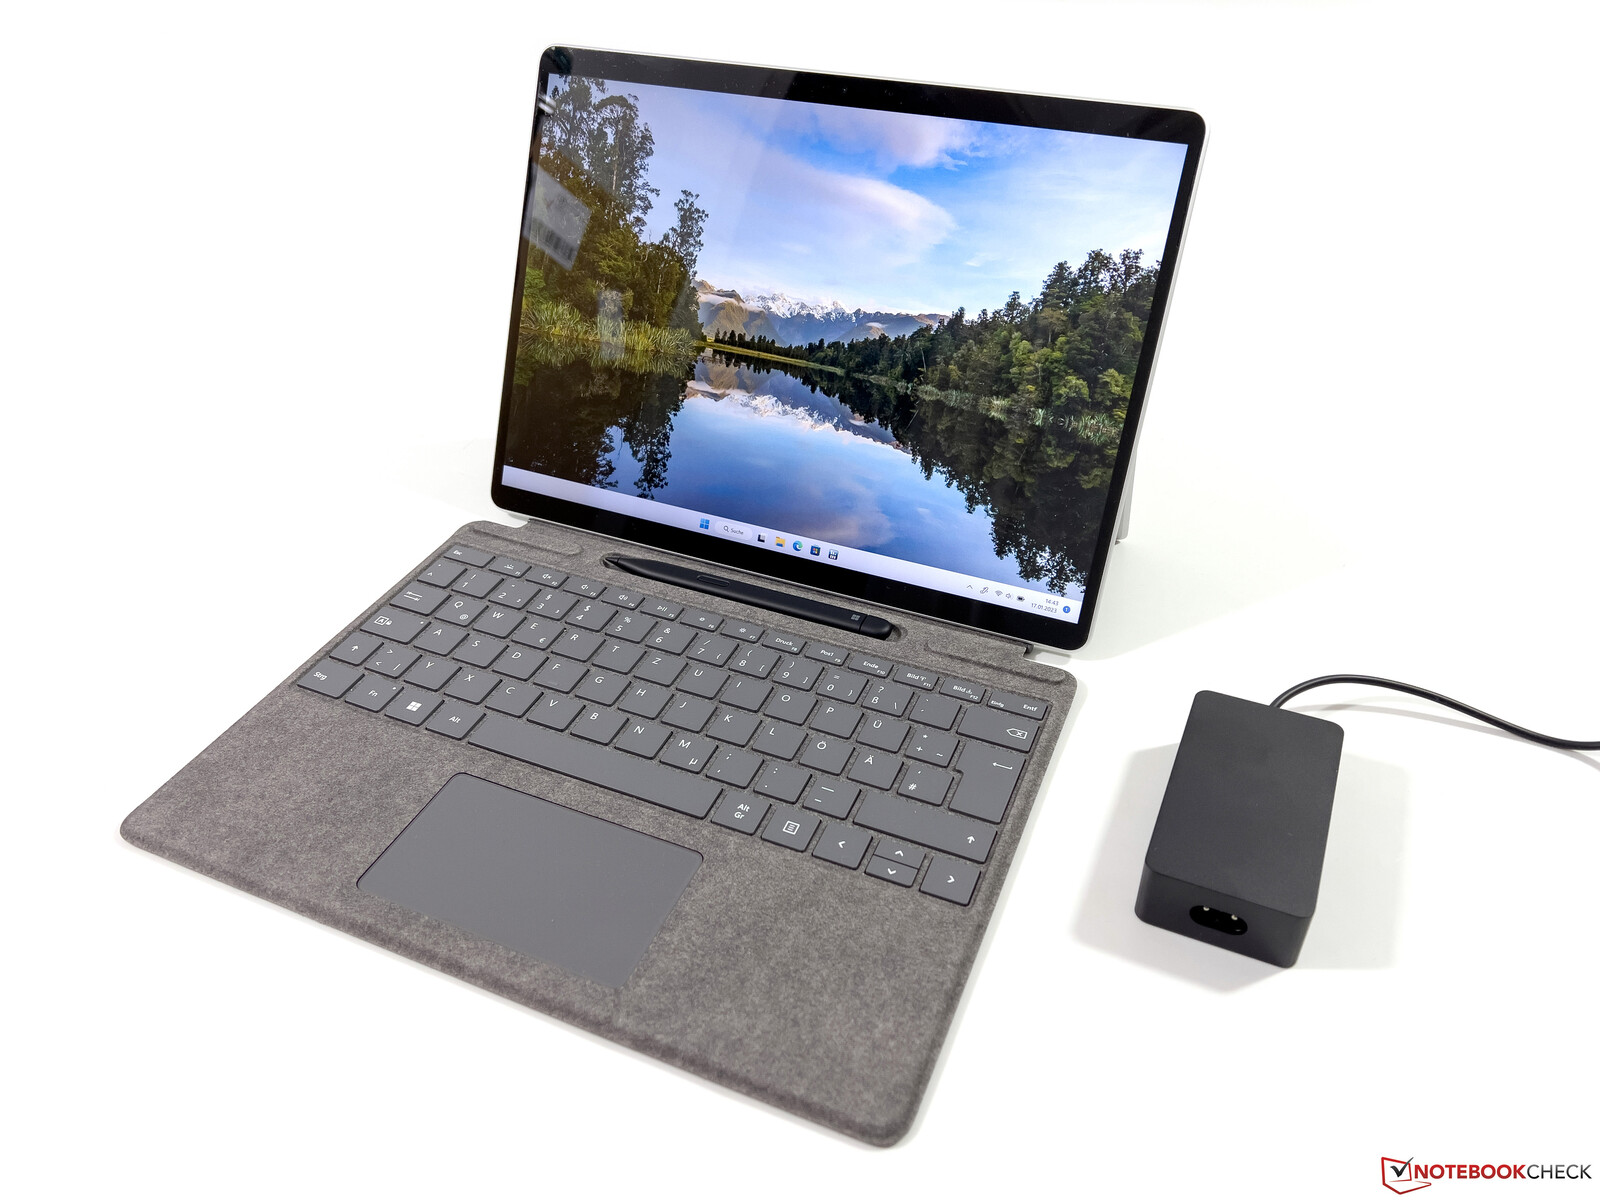
À primeira vista, nada mudou no caso do Surface Pro 9, além do novo arranjo dos portos. O peso difere ligeiramente, portanto é provável que também tenha havido pequenas mudanças no layout interno. A Microsoft oferece o conversível em quatro cores diferentes, desde o prateado (platina) de nosso dispositivo de revisão, azul safira, verde floresta até o grafite (cinza escuro). Ao contrário, o modelo ARM está disponível apenas em platina.
Como antes, a qualidade de construção é soberba como antes e a caixa de alumínio é extremamente robusta. Não há ruídos de rangidos ou distorções de imagem, embora o suporte integrado continue a ser um ponto fraco. O estojo é muito fino, portanto as bordas pressionam rapidamente na pele quando você coloca o Surface Pro 9 em suas coxas, por exemplo. O suporte também é muito flexível e as dobradiças sempre fazem bem o seu trabalho.
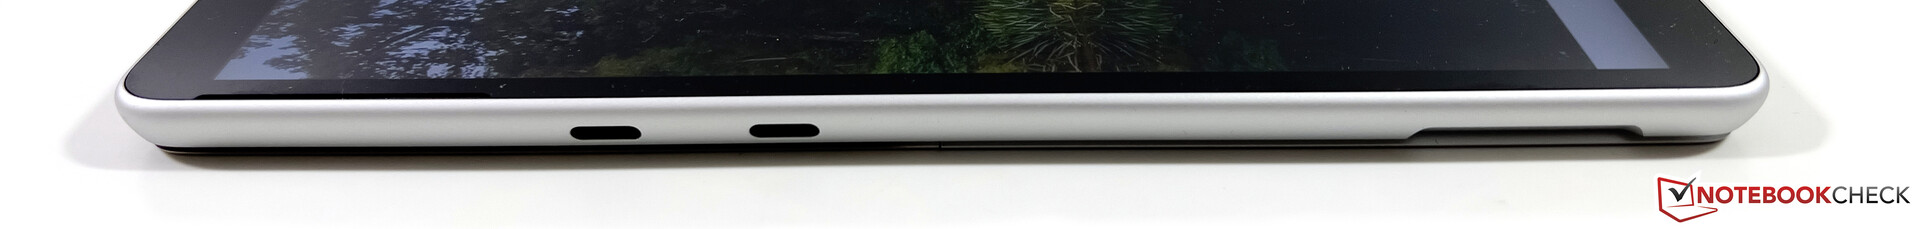
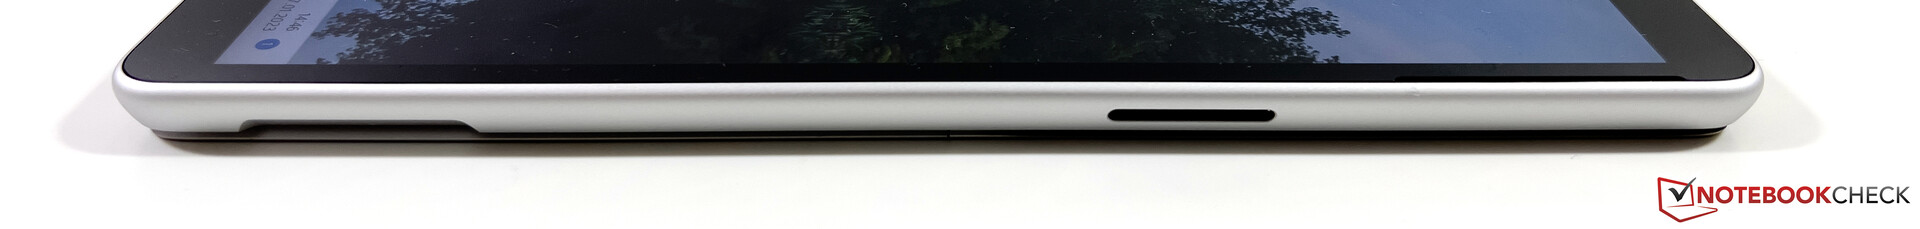
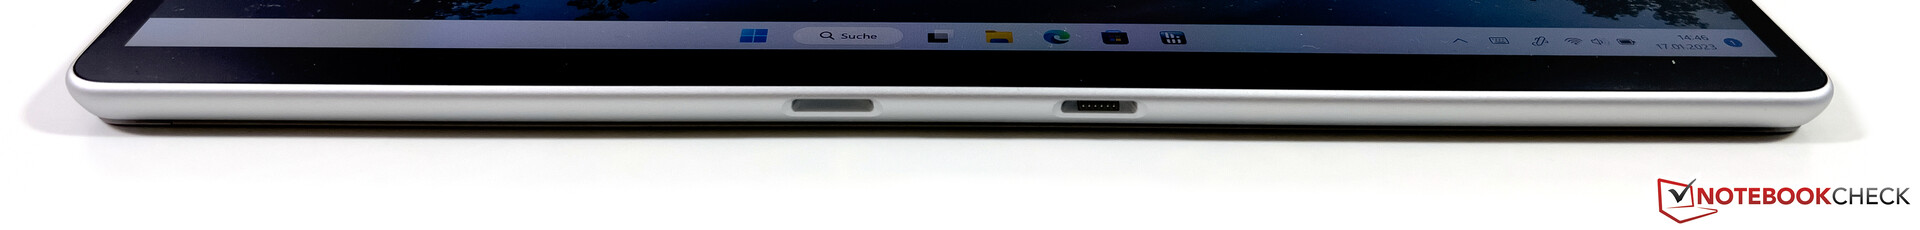
Equipamentos - Superfície Pro com Thunderbolt 4
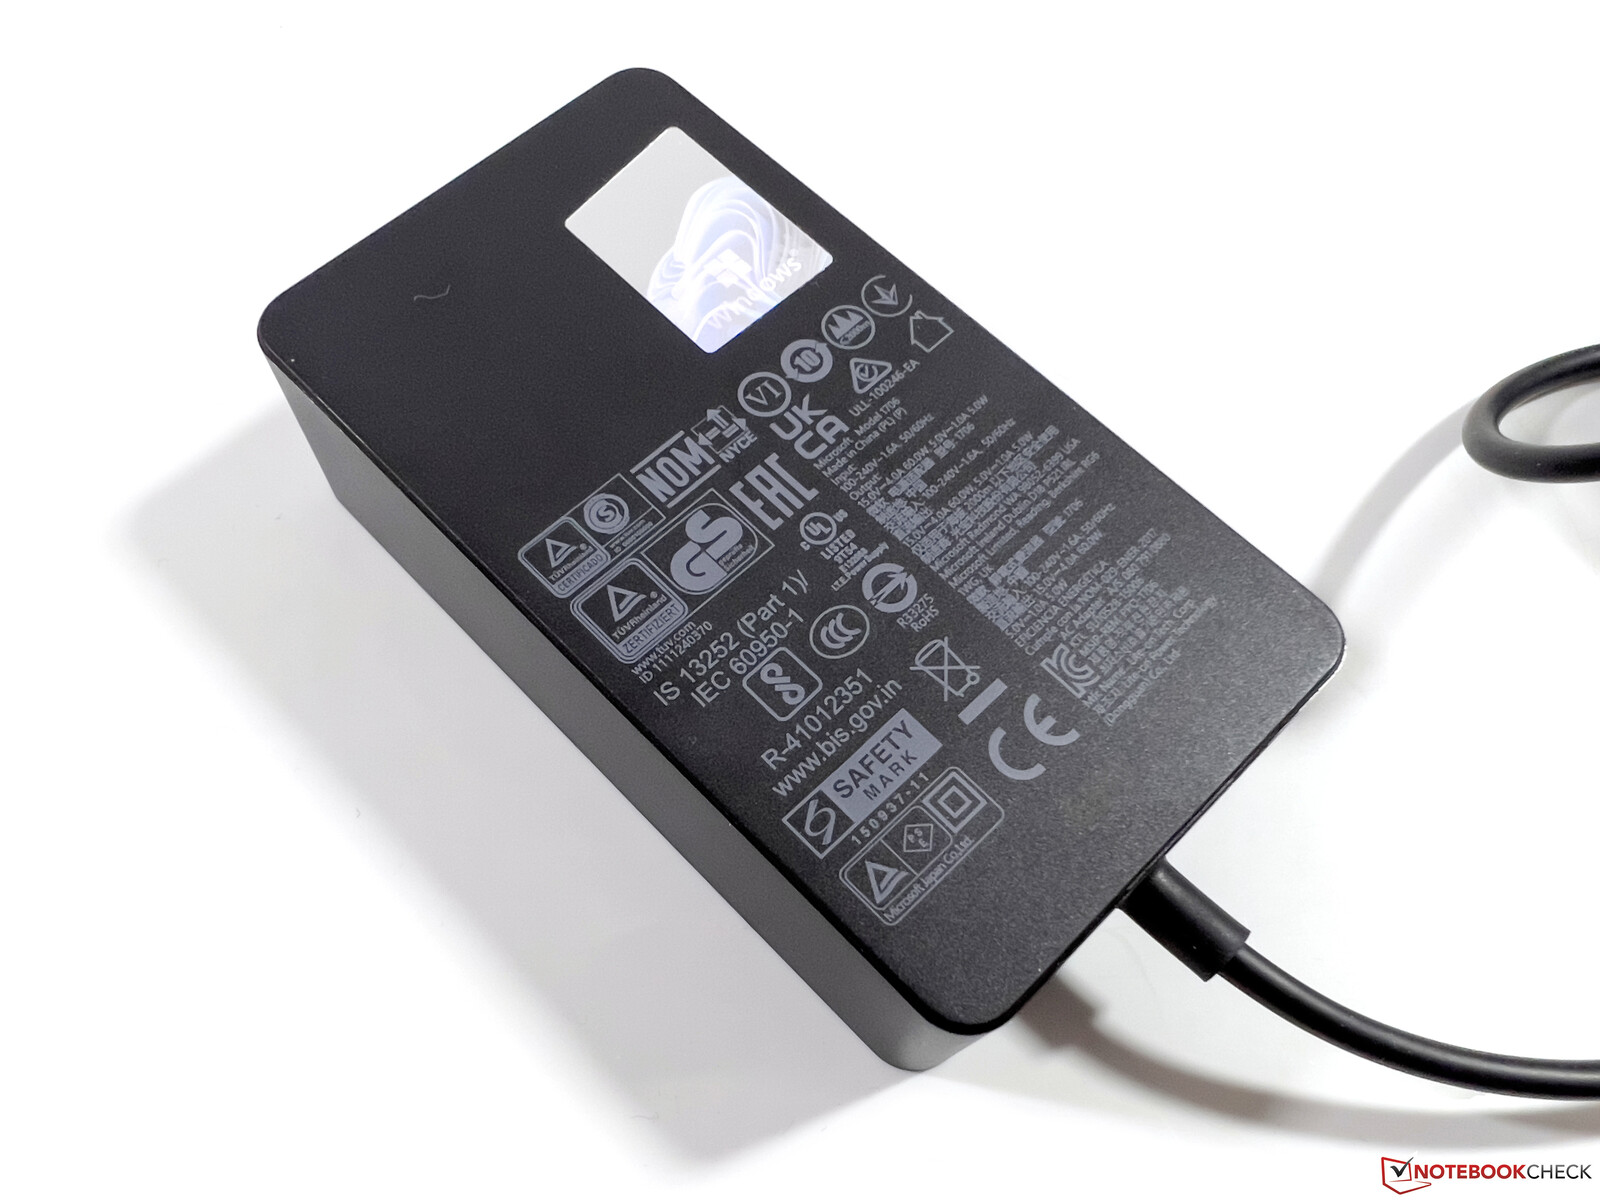
As portas foram reposicionadas e as 2x portas USB-C (incluindo Thunderbolt 4), bem como a porta proprietária Surface Connect ainda permanecem, mas a Microsoft removeu o conector de 3,5 mm. O adaptador de energia que o acompanha utiliza a porta Surface Connect, mas o conversível também pode ser recarregado via USB-C. Um pouco decepcionante é a contínua falta de um leitor de cartões, que havia sido substituído pelo slot opcional Nano SIM no último modelo. Como o modelo Intel agora não vem mais com um módulo WWAN, a Microsoft poderia ter instalado mais uma vez facilmente um leitor de cartões micro SD.
Comunicação
Como mencionado anteriormente, apenas a variante ARM do Surface Pro 9 oferece internet móvel, enquanto que a versão Intel não oferece. Pelo menos o módulo WLAN foi atualizado e o moderno padrão WiFi 6E é agora suportado graças ao módulo AX211 da Intel. Conseguimos nos conectar à rede 6 GHZ de nosso roteador de referência Asus sem problemas, com taxas de transferência provando ser muito altas e estáveis.
| Networking | |
| Microsoft Surface Pro 9, i7-1255U | |
| iperf3 receive AXE11000 6GHz | |
| iperf3 transmit AXE11000 6GHz | |
| Dell XPS 13 9315 2-in-1 Core i5-1230U | |
| iperf3 receive AXE11000 6GHz | |
| iperf3 transmit AXE11000 6GHz | |
| Lenovo ThinkPad X12 20UVS03G00 | |
| iperf3 transmit AX12 | |
| iperf3 receive AX12 | |
| HP Elite Dragonfly Folio 13.5 G3 | |
| iperf3 receive AXE11000 6GHz | |
| iperf3 receive AXE11000 | |
| iperf3 transmit AXE11000 6GHz | |
| iperf3 transmit AXE11000 | |
| Apple iPad Pro 12.9 2022 | |
| iperf3 receive AXE11000 6GHz | |
| iperf3 receive AXE11000 | |
| iperf3 transmit AXE11000 6GHz | |
| iperf3 transmit AXE11000 | |
| Asus ROG Flow Z13 GZ301ZE | |
| iperf3 transmit AX12 | |
| iperf3 receive AX12 | |
| Microsoft Surface Pro 8, i7-1185G7 | |
| iperf3 transmit AX12 | |
| iperf3 receive AX12 | |
Webcam
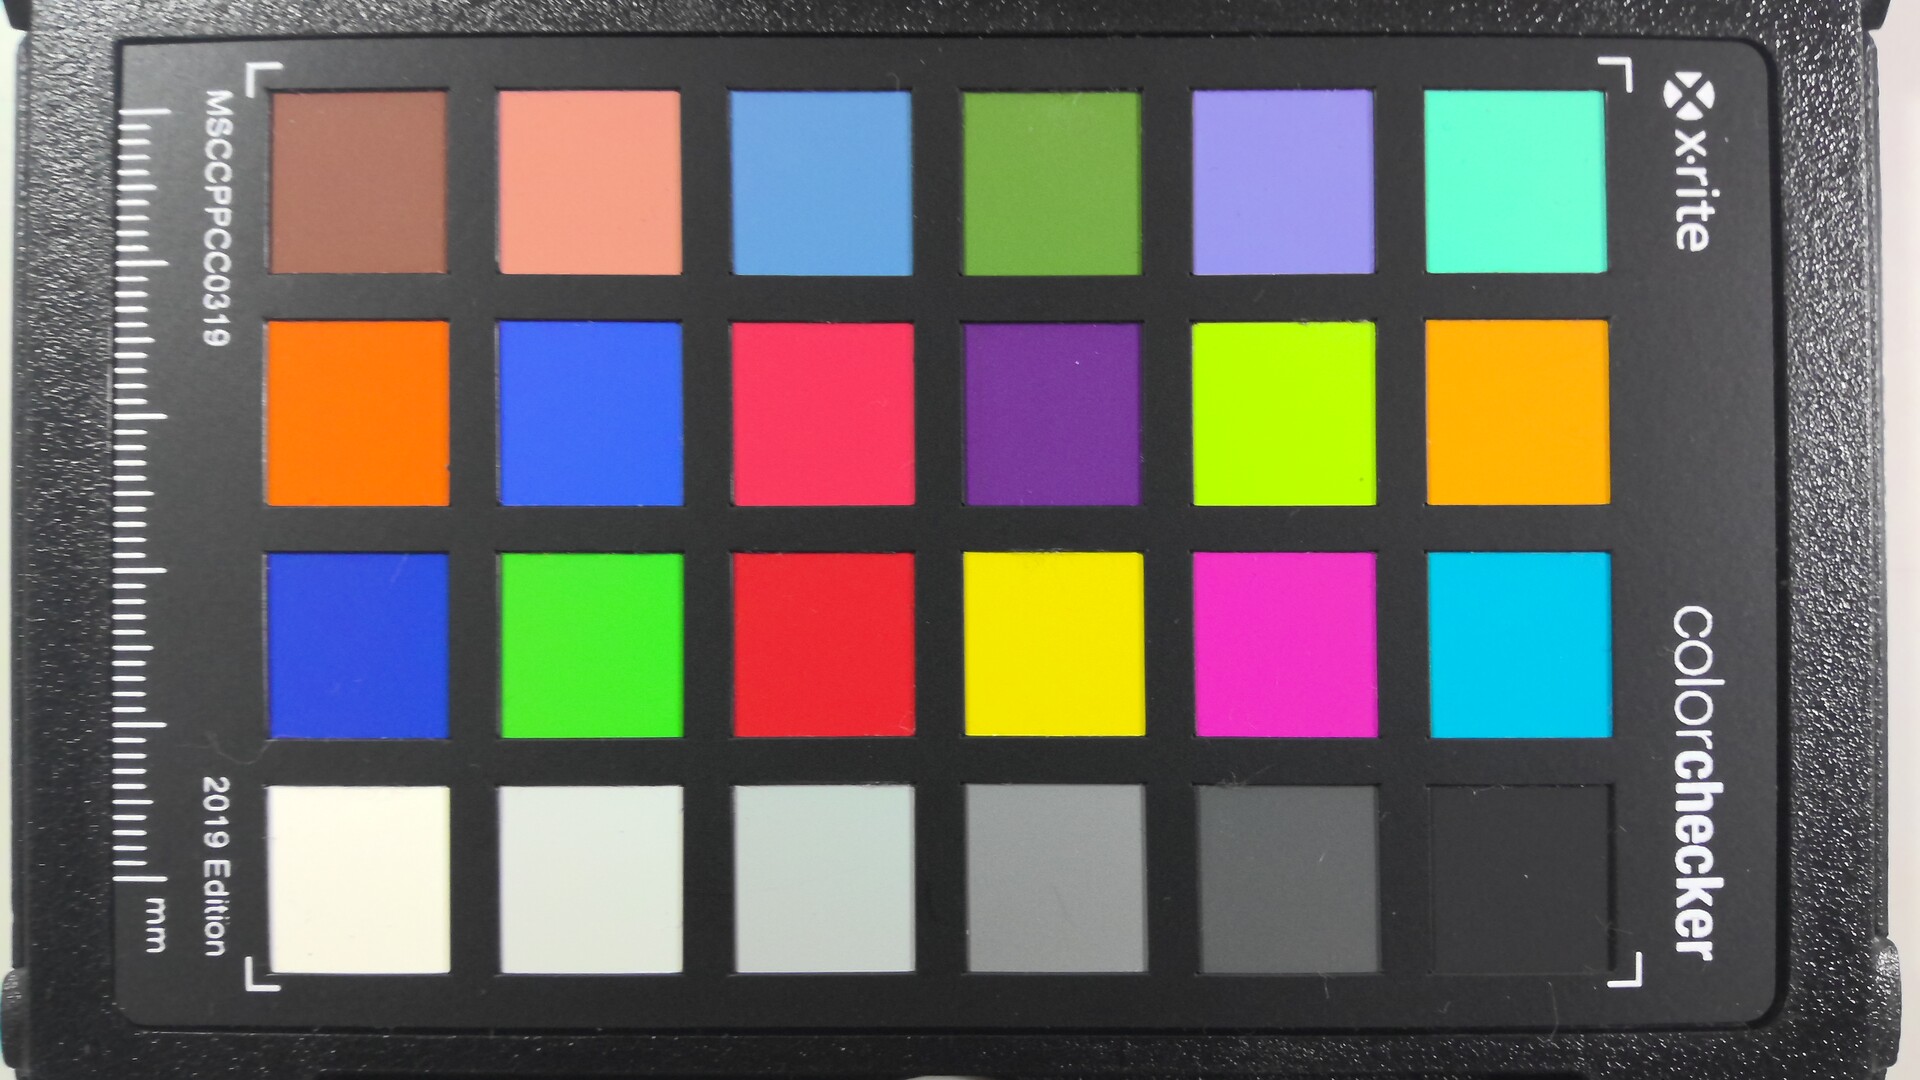
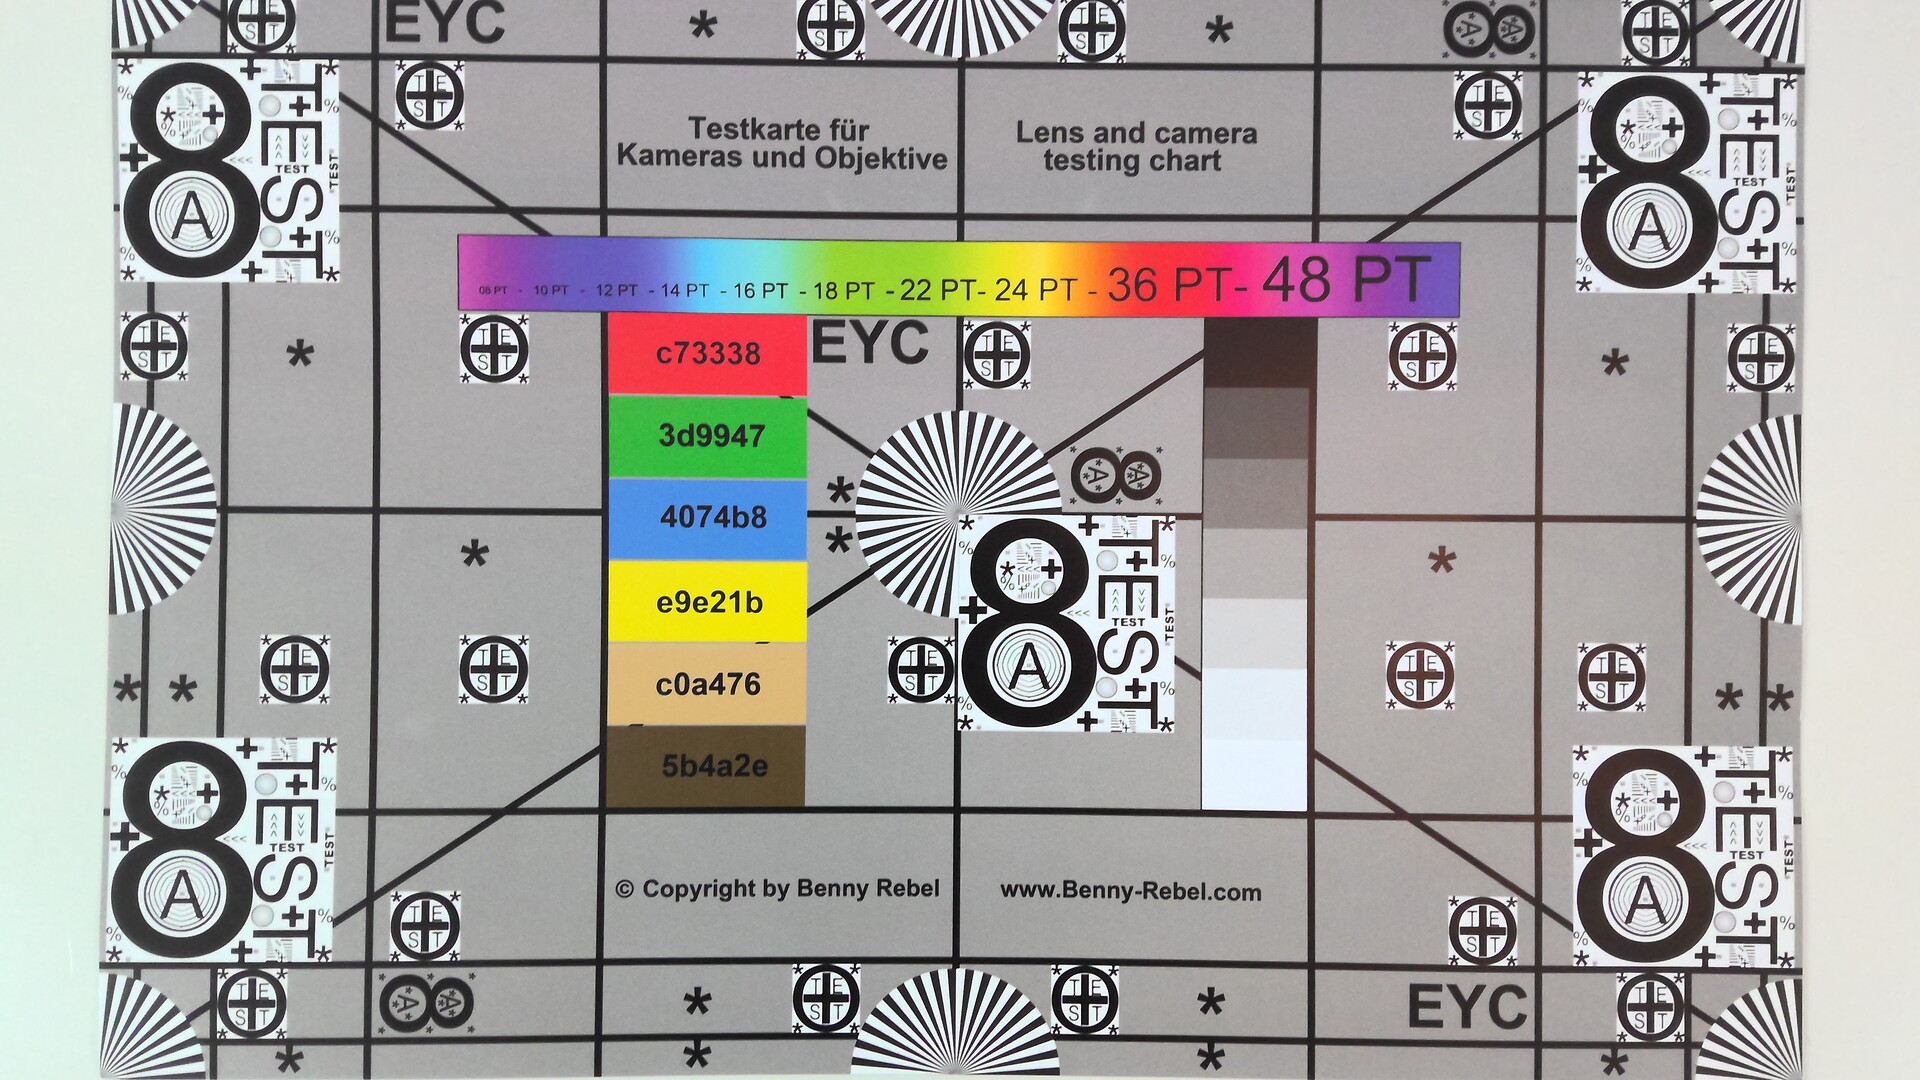
Nenhuma alteração foi feita na configuração da webcam, com uma câmera de 5 MP na frente e uma câmera de 10 MP na parte de trás. A Surface Pro 9 permanece assim entre os melhores dispositivos Windows em termos de desempenho de câmera. Ainda mais funções de câmera são oferecidas na variante ARM da Surface Pro 9, tais como foco suave (ou efeito bokeh) para o fundo, contato visual automático ou corte automático de imagem.


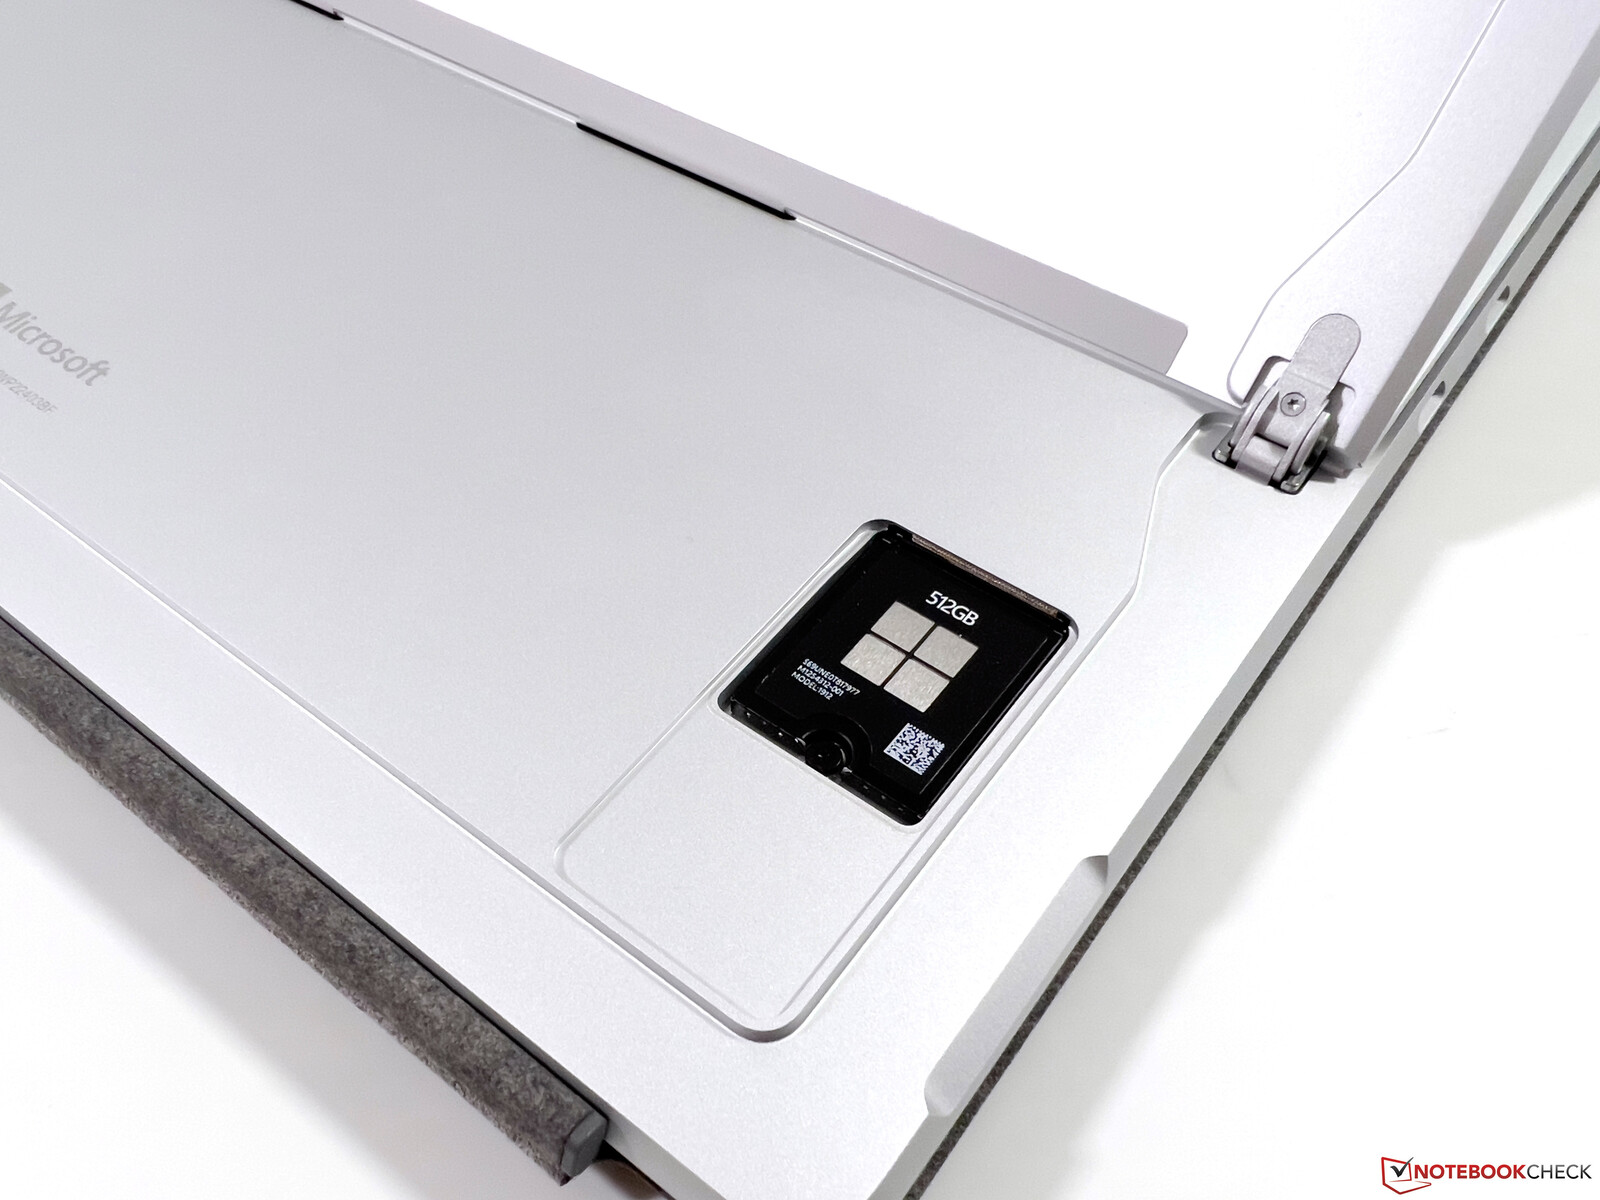
Manutenção
Como antes, o Surface Pro 9 ainda oferece aos usuários a possibilidade de substituir o compacto M.2-2230 SSD e a Microsoft tornou este processo ainda mais fácil, já que as ferramentas SIM não são mais necessárias para abrir a tampa. Em vez disso, há um pequeno recesso no qual se empurra o dedo, que abre o lado oposto (mantido no lugar magneticamente) e permite que a tampa seja facilmente removida. Entretanto, os demais componentes internos não são acessíveis.
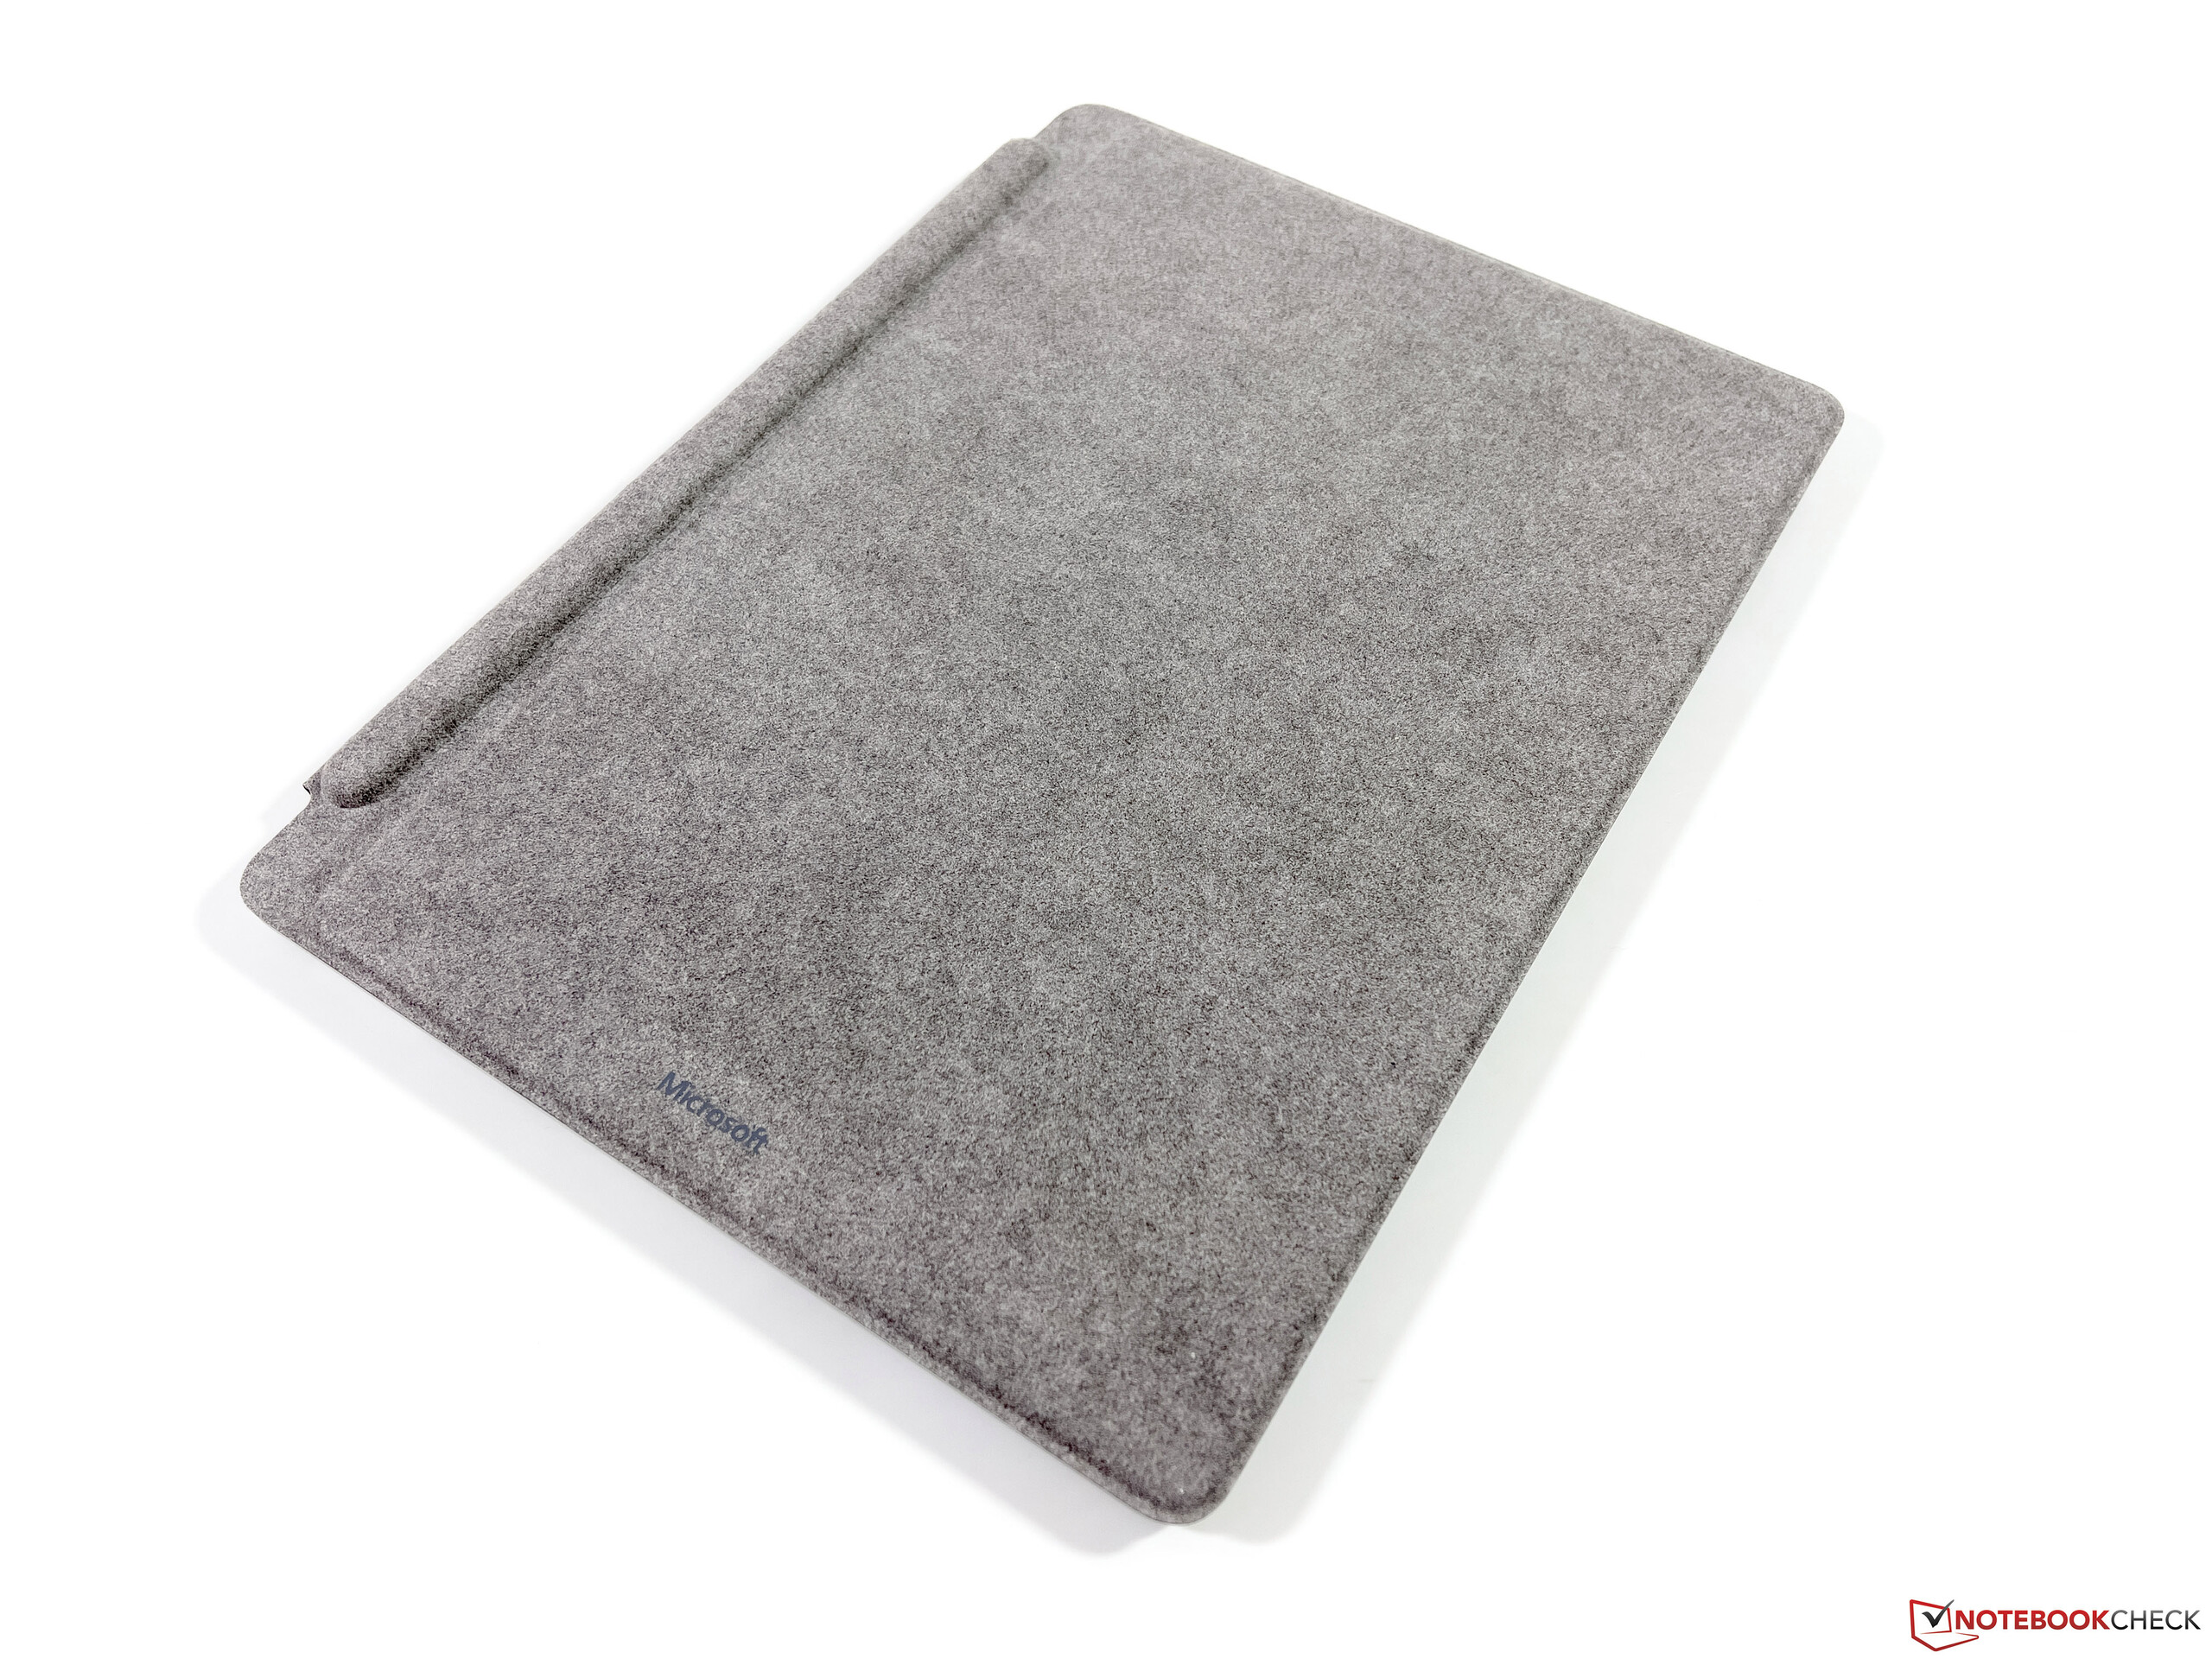
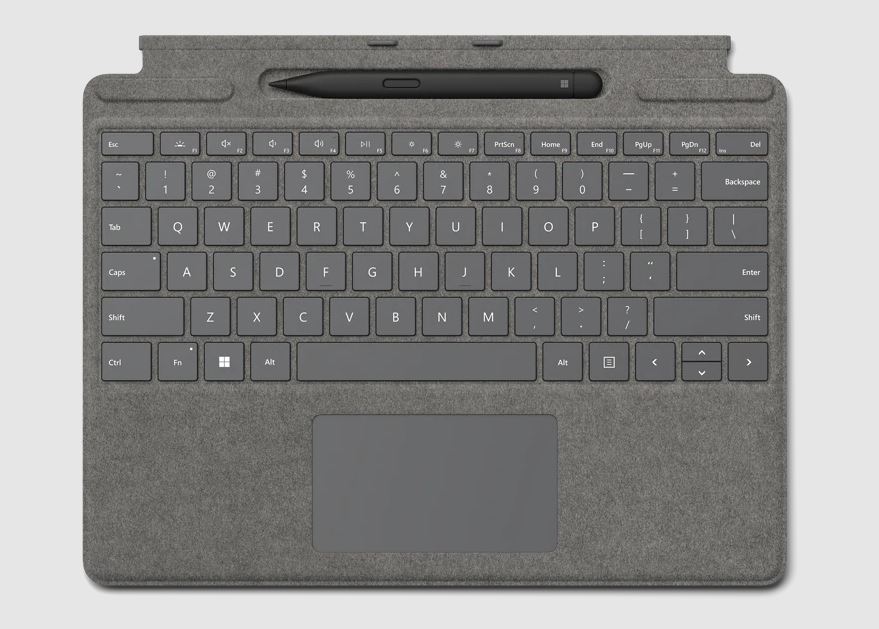
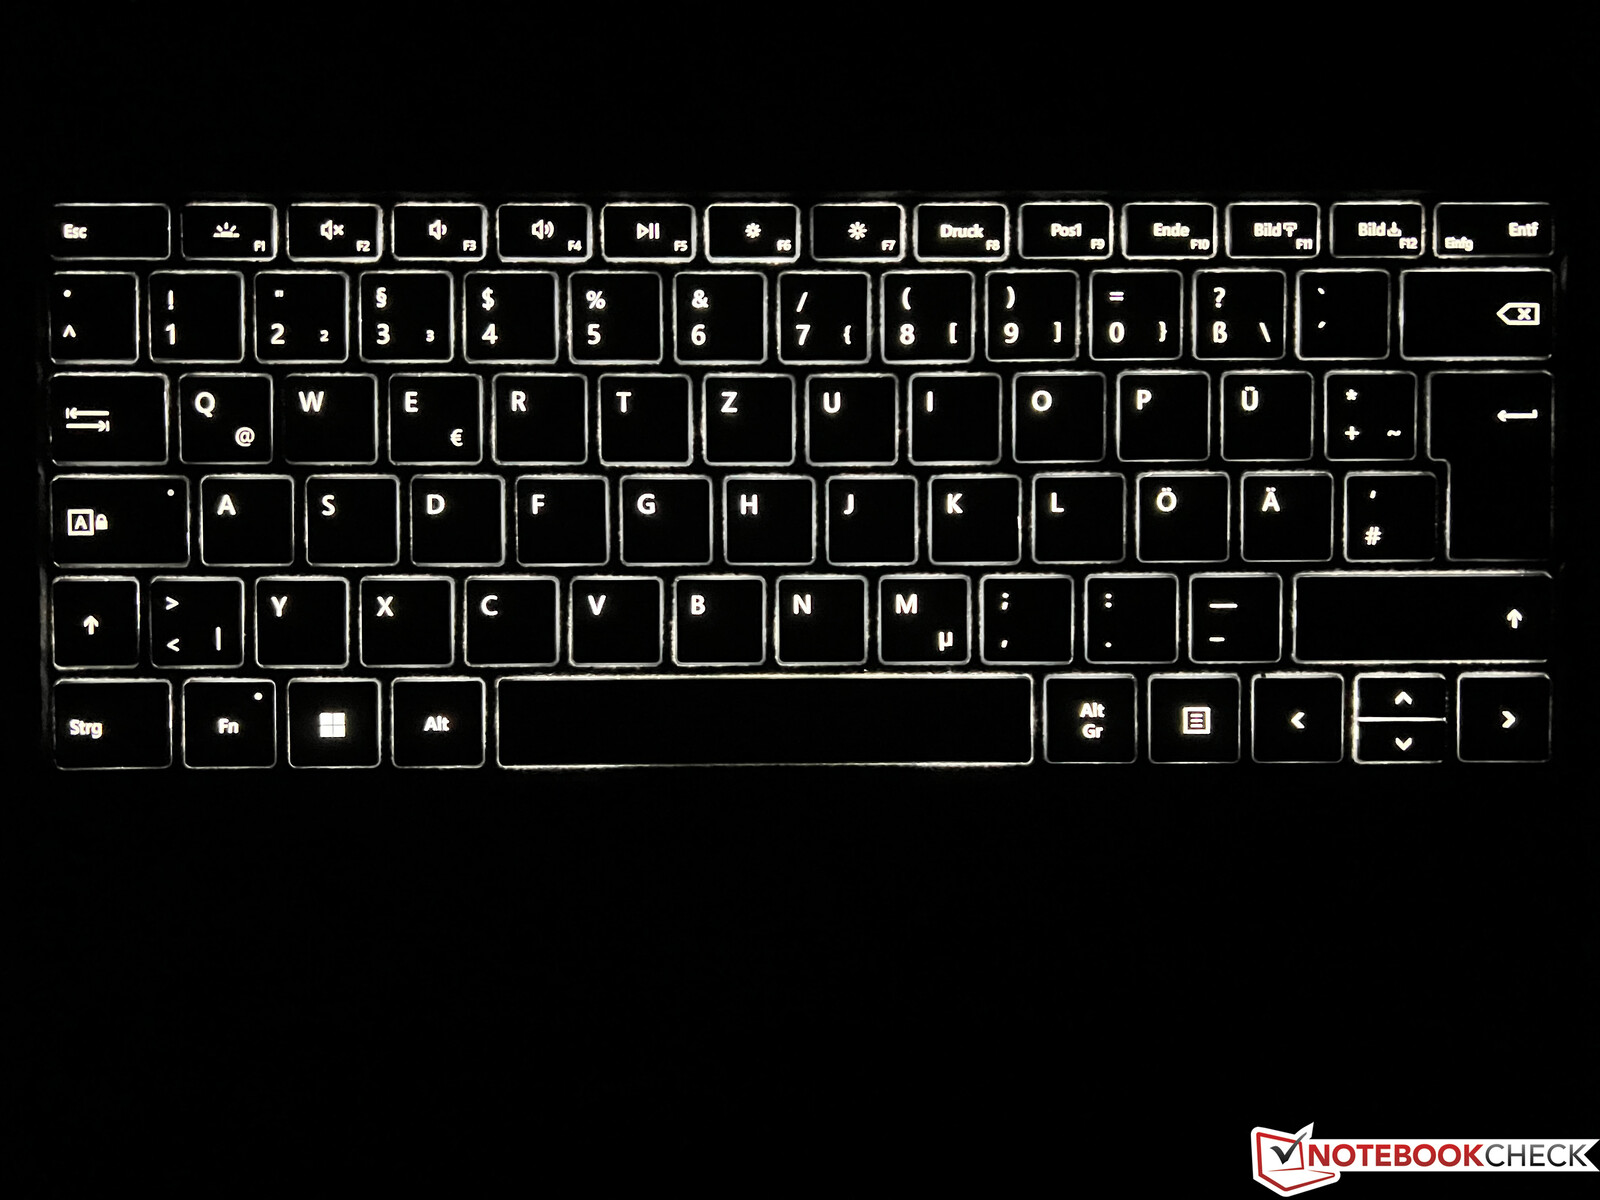
Dispositivos de Entrada - Teclado de Assinatura permanece inalterado
Como as dimensões do Surface Pro não mudaram, a Microsoft continua a oferecer duas capas de teclado diferentes. Como o último modelo, temos novamente o Signature Keyboard e a Slim Pen 2, que podem ser guardadas e recarregadas dentro da tampa do teclado. A caneta stylus continua a funcionar muito bem e há também suporte para feedback táctil. No entanto, o manuseio da caneta não é mais tão ergonômico devido à sua forma achatada.
O teclado em si oferece uma sensação de digitação decente e também é retroiluminado. Além disso, o teclado pode ser colocado em um leve ângulo (graças aos ímãs), mas a estabilidade torna-se então limitada. Quando em movimento em particular, o conforto da digitação não é tão bom quanto em um laptop normal, e a superfície requer uma grande área de ajuste em geral devido às dobradiças embutidas (mas isto também se aplica à maioria dos conversíveis com uma tampa de teclado).
Visor - 3:2 IPS a 120 Hz
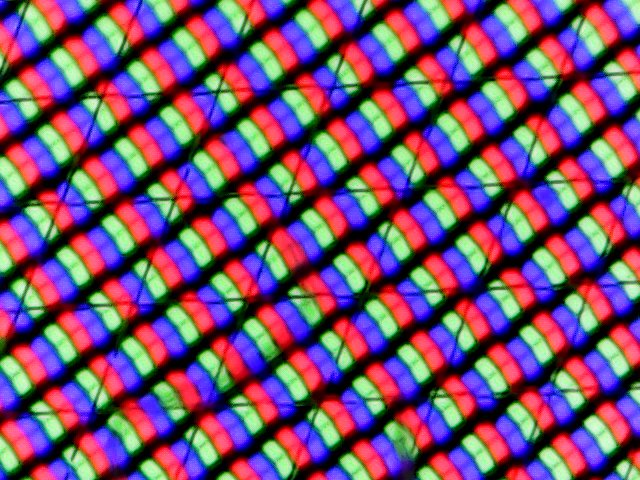
Nada mudou nas características fundamentais da tela, que continua sendo uma tela tátil IPS no formato 3:2, oferece uma resolução de 2880 x 1920 (267 PPI) e uma taxa de atualização de até 120 Hz. 60 Hz é predefinido como a taxa padrão, portanto 120 Hz tem que ser selecionado manualmente nas configurações. Nossa impressão subjetiva da tela brilhante ainda é muito boa. Graças aos sensores, o brilho e a temperatura da cor são ajustados automaticamente e isto também funciona bem.
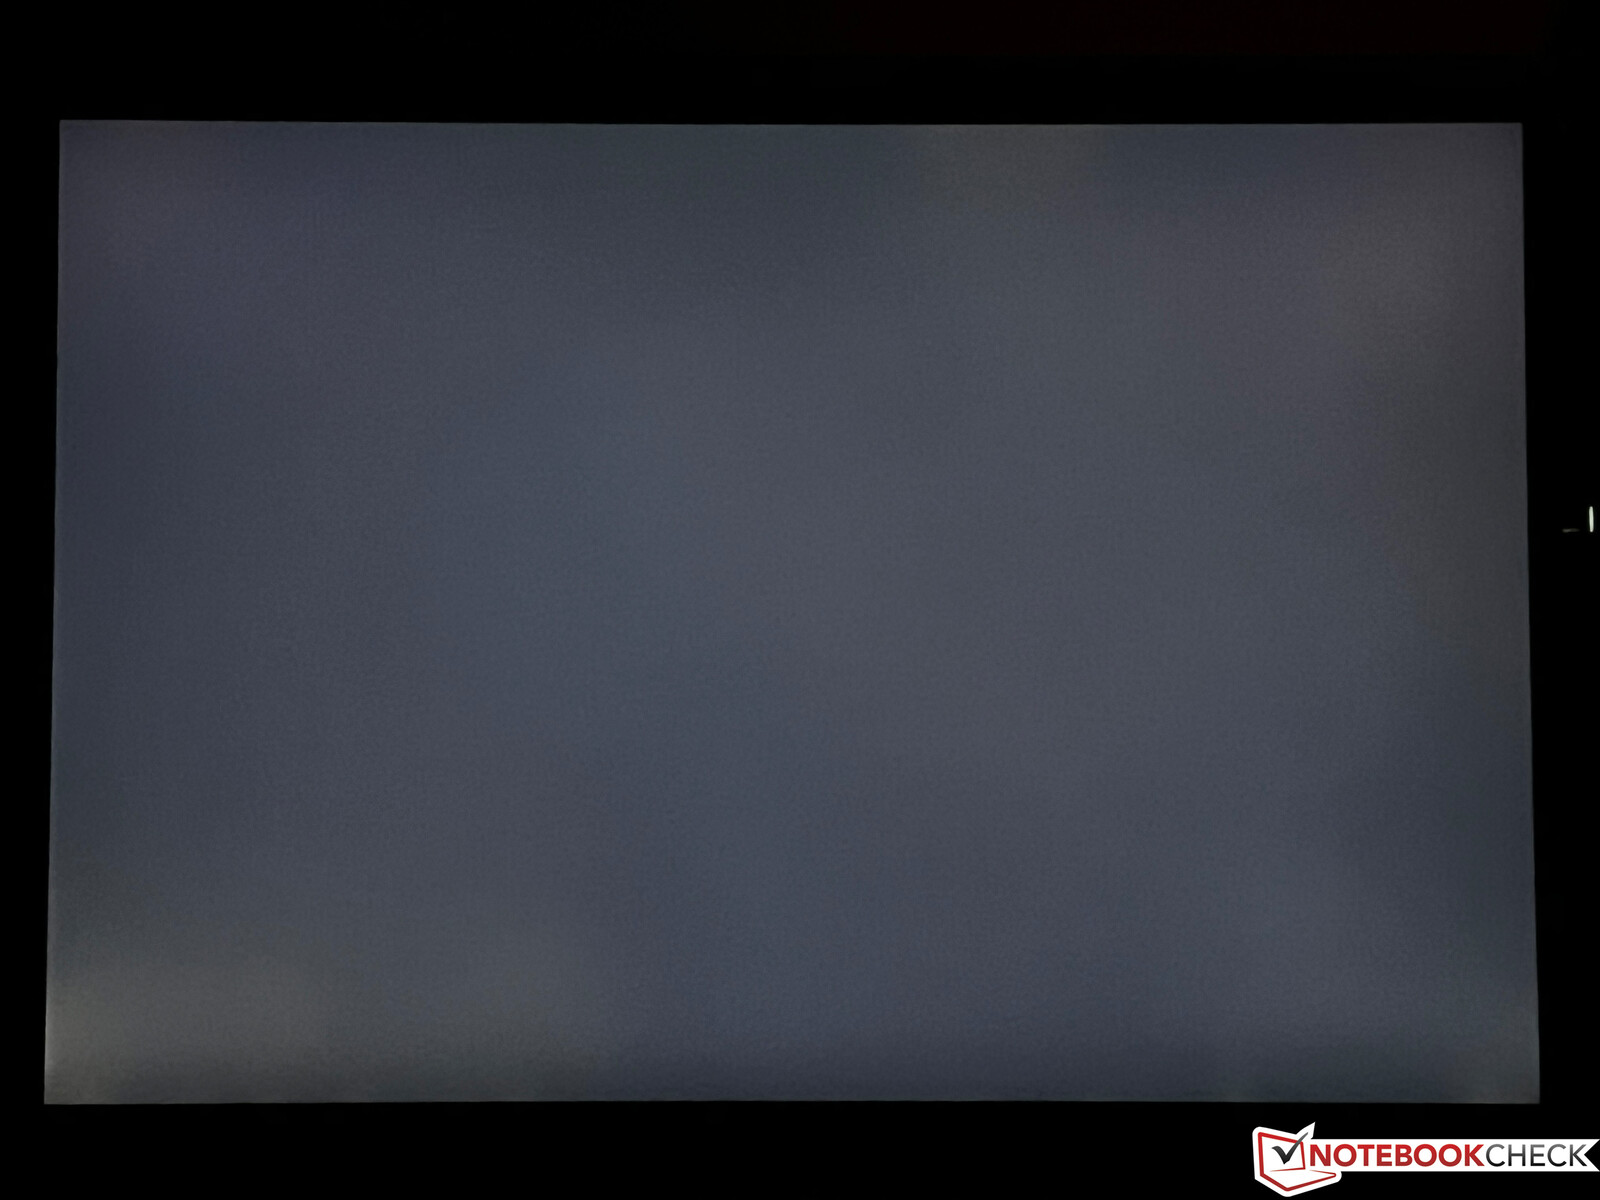
O painel novamente vem da LG Philips, mas o ID do painel mudou. Fundamentalmente, os valores são comparáveis, já que o brilho máximo paira novamente em torno de 450 cd/m². O nível de preto é ligeiramente melhor, e é também por isso que a relação de contraste, de quase 1.200:1, parece ligeiramente melhor. Mas os dispositivos concorrentes são melhores aqui, particularmente em termos de contraste, como o Mini-LED-Display do iPad Pro.
Nenhum PWM clássico cintilante está presente, mas mais uma vez registramos cintilação a ~30 KHz a um brilho de 55% ou inferior. Mas isto não deve ser um problema devido à alta freqüência. Isto também se aplica aos halos, pois somente no brilho total notamos um ponto ligeiramente mais brilhante na parte inferior esquerda de uma tela escura.
| |||||||||||||||||||||||||
iluminação: 94 %
iluminação com acumulador: 454 cd/m²
Contraste: 1197:1 (Preto: 0.38 cd/m²)
ΔE ColorChecker Calman: 1.7 | ∀{0.5-29.43 Ø4.71}
calibrated: 1.5
ΔE Greyscale Calman: 1.5 | ∀{0.09-98 Ø4.96}
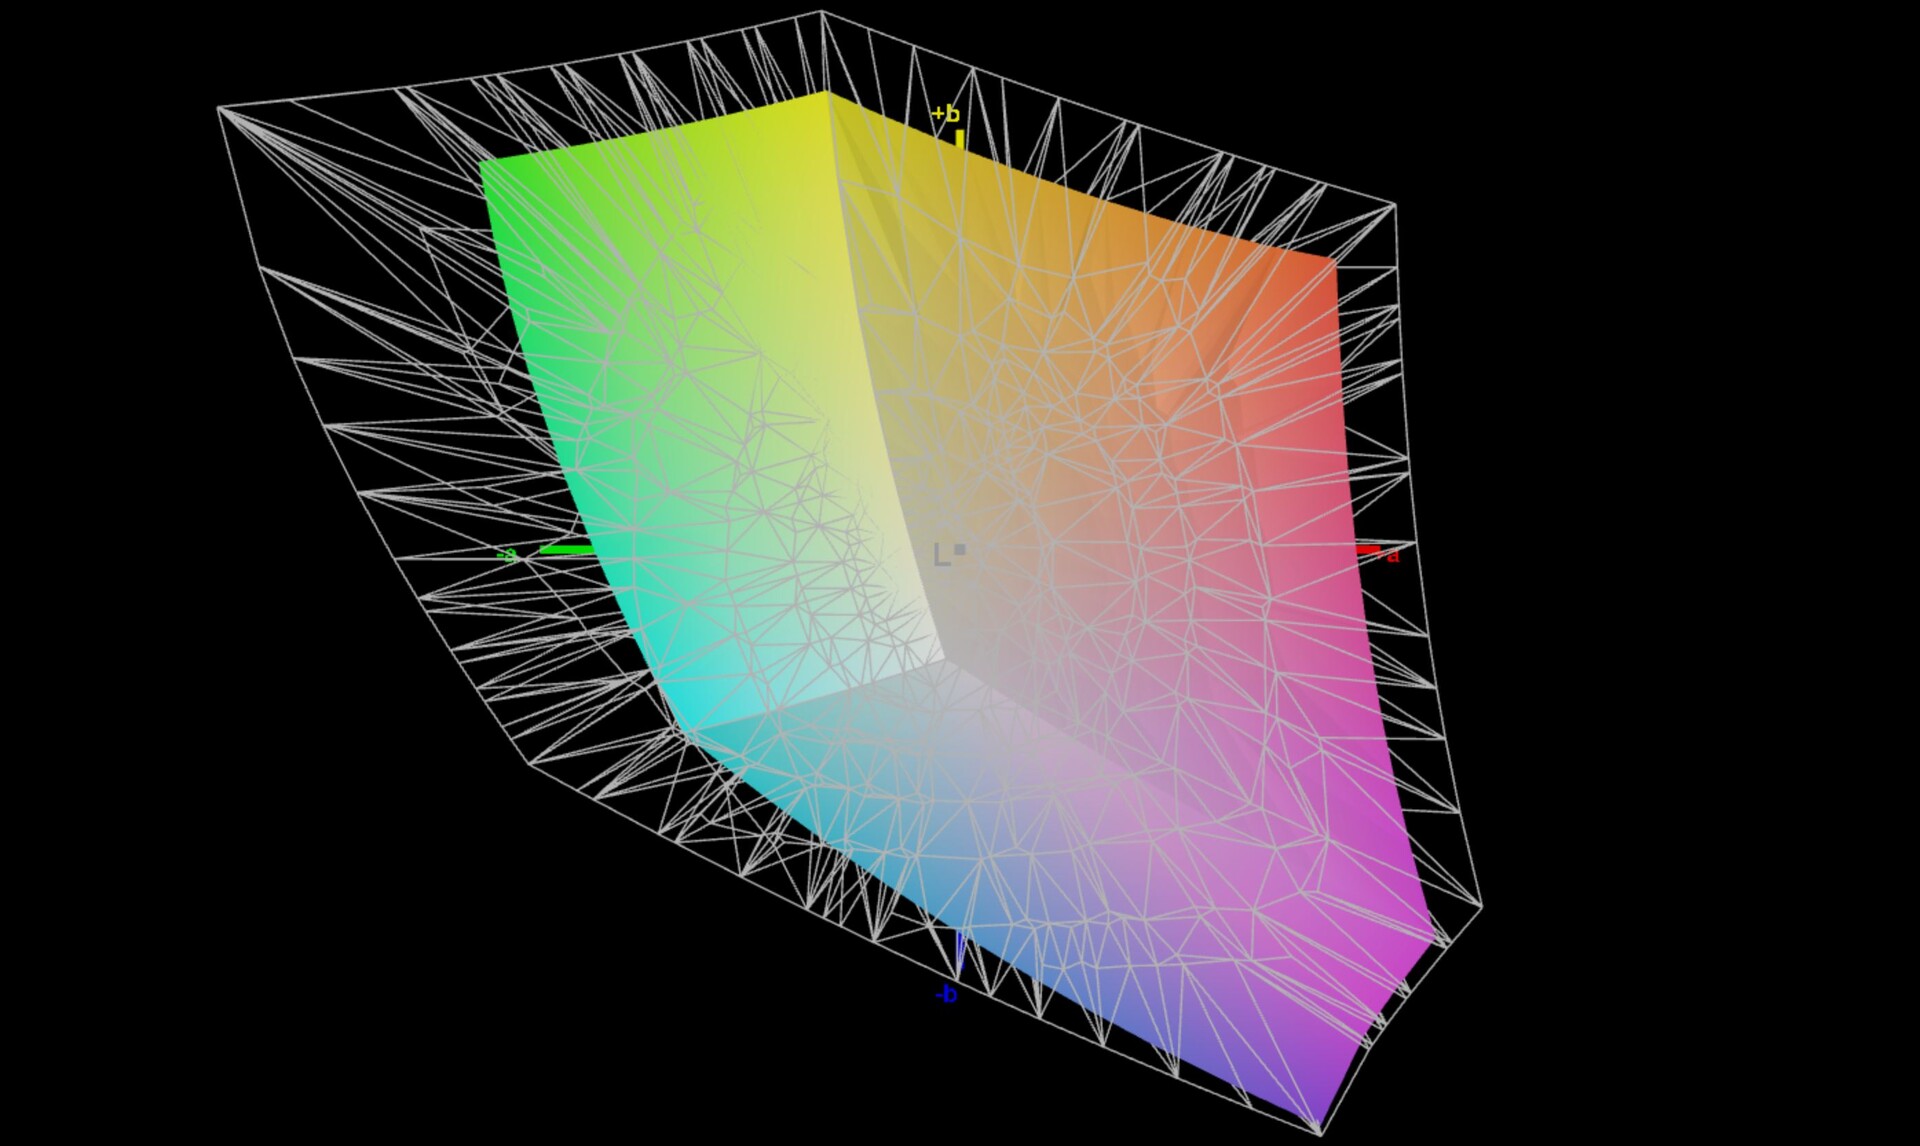
67.7% AdobeRGB 1998 (Argyll 3D)
97.7% sRGB (Argyll 3D)
65.6% Display P3 (Argyll 3D)
Gamma: 2.17
CCT: 6761 K
| Microsoft Surface Pro 9, i7-1255U LP129WT2-SPA6, IPS, 2880x1920, 13" | Dell XPS 13 9315 2-in-1 Core i5-1230U BOE NE13A1M, IPS, 2880x1920, 13" | Lenovo ThinkPad X12 20UVS03G00 N123NCA-GS1, a-Si IPS LED, 1920x1280, 12.3" | HP Elite Dragonfly Folio 13.5 G3 Chi Mei CMN13C0, IPS, 1920x1280, 13.5" | Apple iPad Pro 12.9 2022 Liquid Retina XDR Display, Mini-LED, 2732x2048, 12.9" | Asus ROG Flow Z13 GZ301ZE LQ134N1JW54, IPS, 1920x1200, 13.4" | Microsoft Surface Pro 8, i7-1185G7 LP129WT212166, IPS, 2880x1920, 13" | |
|---|---|---|---|---|---|---|---|
| Display | 6% | 2% | 3% | 1% | 12% | ||
| Display P3 Coverage (%) | 65.6 | 70.7 8% | 67 2% | 68.3 4% | 67.5 3% | 78.2 19% | |
| sRGB Coverage (%) | 97.7 | 99.8 2% | 99.2 2% | 98.6 1% | 97.1 -1% | 100 2% | |
| AdobeRGB 1998 Coverage (%) | 67.7 | 72.6 7% | 68.8 2% | 70.2 4% | 69.3 2% | 77.6 15% | |
| Response Times | -133% | -236% | -272% | -133% | -115% | -139% | |
| Response Time Grey 50% / Grey 80% * (ms) | 13 ? | 44 ? -238% | 63.2 ? -386% | 66.8 ? -414% | 35.3 ? -172% | 44 ? -238% | 46.4 ? -257% |
| Response Time Black / White * (ms) | 19.4 ? | 24.8 ? -28% | 36 ? -86% | 44.4 ? -129% | 37.53 ? -93% | 17.6 ? 9% | 23.2 ? -20% |
| PWM Frequency (Hz) | 29896 ? | 6401 ? | 29760 ? | ||||
| Screen | 8% | 24% | -9% | 7% | -0% | -7% | |
| Brightness middle (cd/m²) | 455 | 507 11% | 419 -8% | 369.5 -19% | 611 34% | 515 13% | 444 -2% |
| Brightness (cd/m²) | 453 | 486 7% | 406 -10% | 350 -23% | 605 34% | 476 5% | 451 0% |
| Brightness Distribution (%) | 94 | 87 -7% | 94 0% | 87 -7% | 92 -2% | 87 -7% | 91 -3% |
| Black Level * (cd/m²) | 0.38 | 0.34 11% | 0.23 39% | 0.24 37% | 0.35 8% | 0.43 -13% | |
| Contrast (:1) | 1197 | 1491 25% | 1822 52% | 1540 29% | 1471 23% | 1033 -14% | |
| Colorchecker dE 2000 * | 1.7 | 2.04 -20% | 1.1 35% | 2.3 -35% | 1.4 18% | 1.6 6% | 2 -18% |
| Colorchecker dE 2000 max. * | 3.8 | 3.1 18% | 2.2 42% | 4.34 -14% | 3.3 13% | 4 -5% | 3.2 16% |
| Colorchecker dE 2000 calibrated * | 1.5 | 0.86 43% | 0.5 67% | 0.6 60% | 1.2 20% | 1.7 -13% | |
| Greyscale dE 2000 * | 1.5 | 1.8 -20% | 1.5 -0% | 3.1 -107% | 2.3 -53% | 2.5 -67% | 1.8 -20% |
| Gamma | 2.17 101% | 2.12 104% | 2.06 107% | 2.1 105% | 2.22 99% | 2.2 100% | 2.11 104% |
| CCT | 6761 96% | 6561 99% | 6524 100% | 6248 104% | 6930 94% | 6939 94% | 6417 101% |
| Color Space (Percent of AdobeRGB 1998) (%) | 62.8 | ||||||
| Color Space (Percent of sRGB) (%) | 99.2 | ||||||
| Média Total (Programa/Configurações) | -40% /
-13% | -70% /
-18% | -93% /
-44% | -63% /
-28% | -38% /
-16% | -45% /
-22% |
* ... menor é melhor
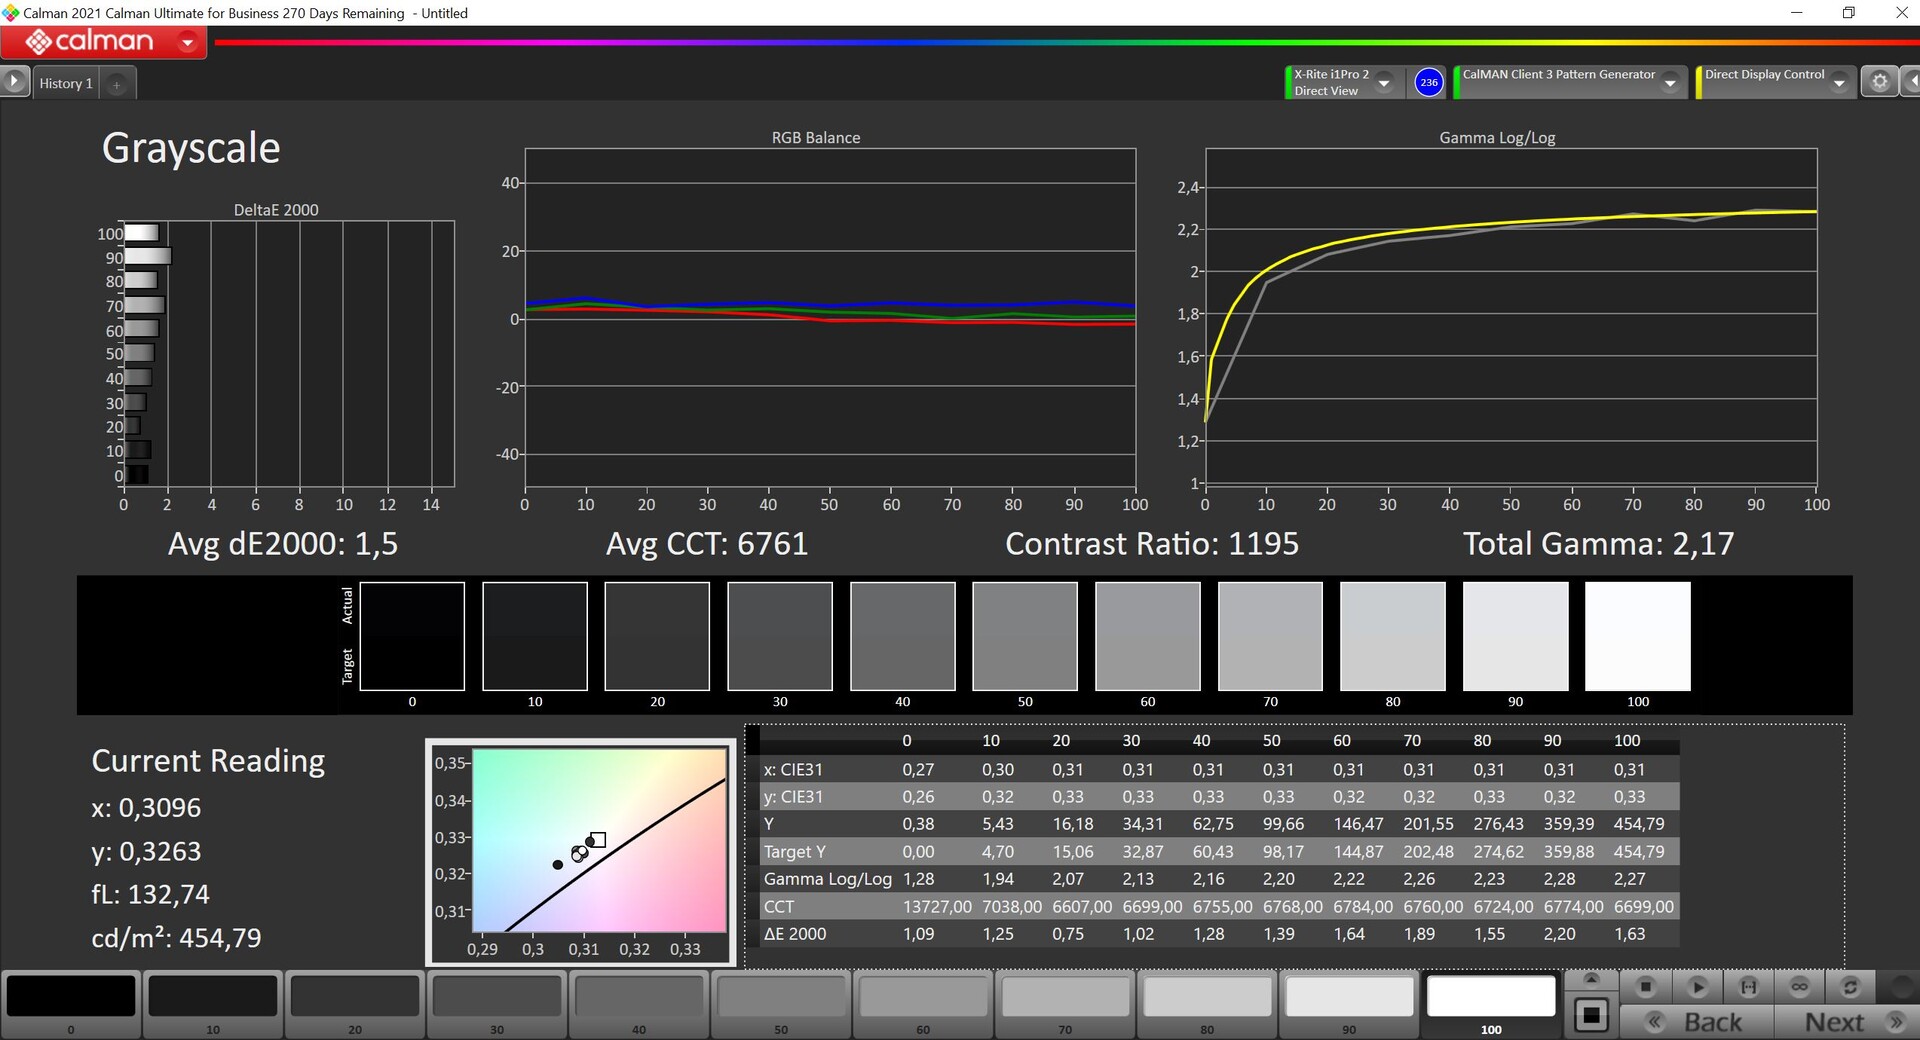
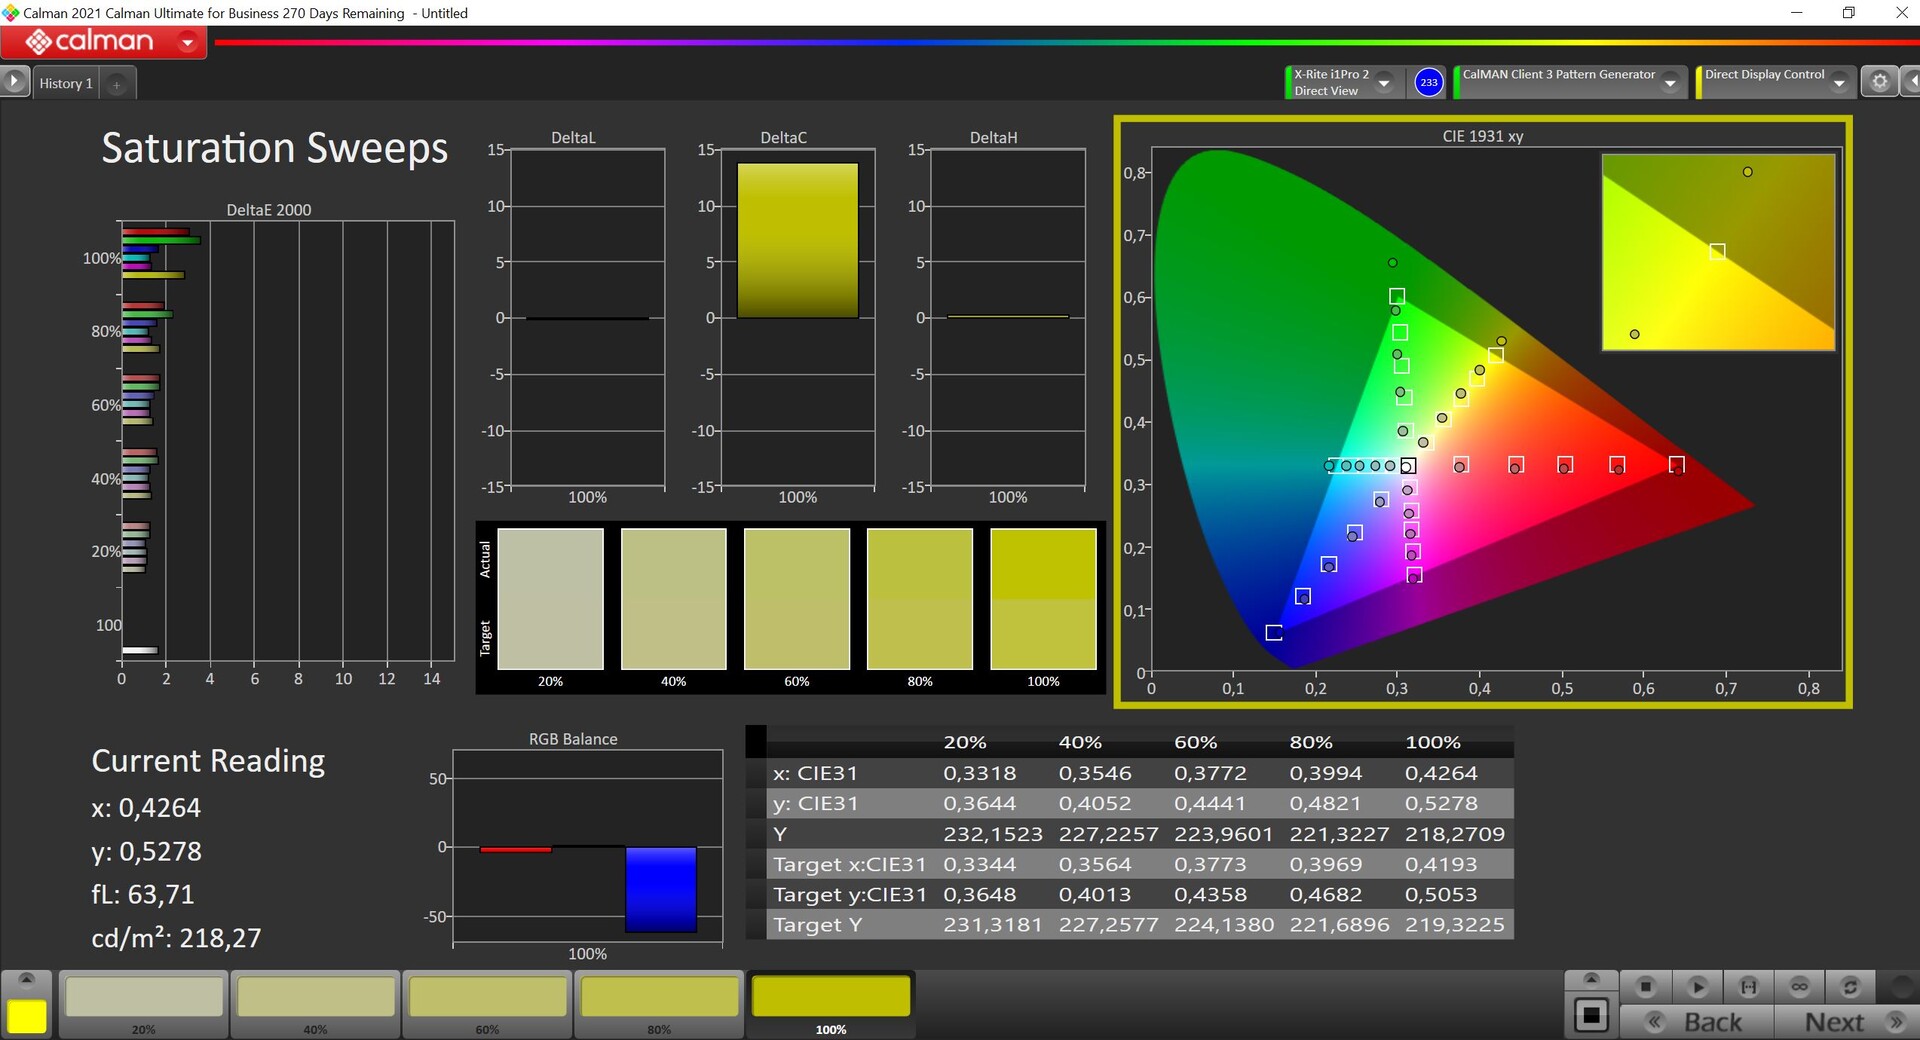
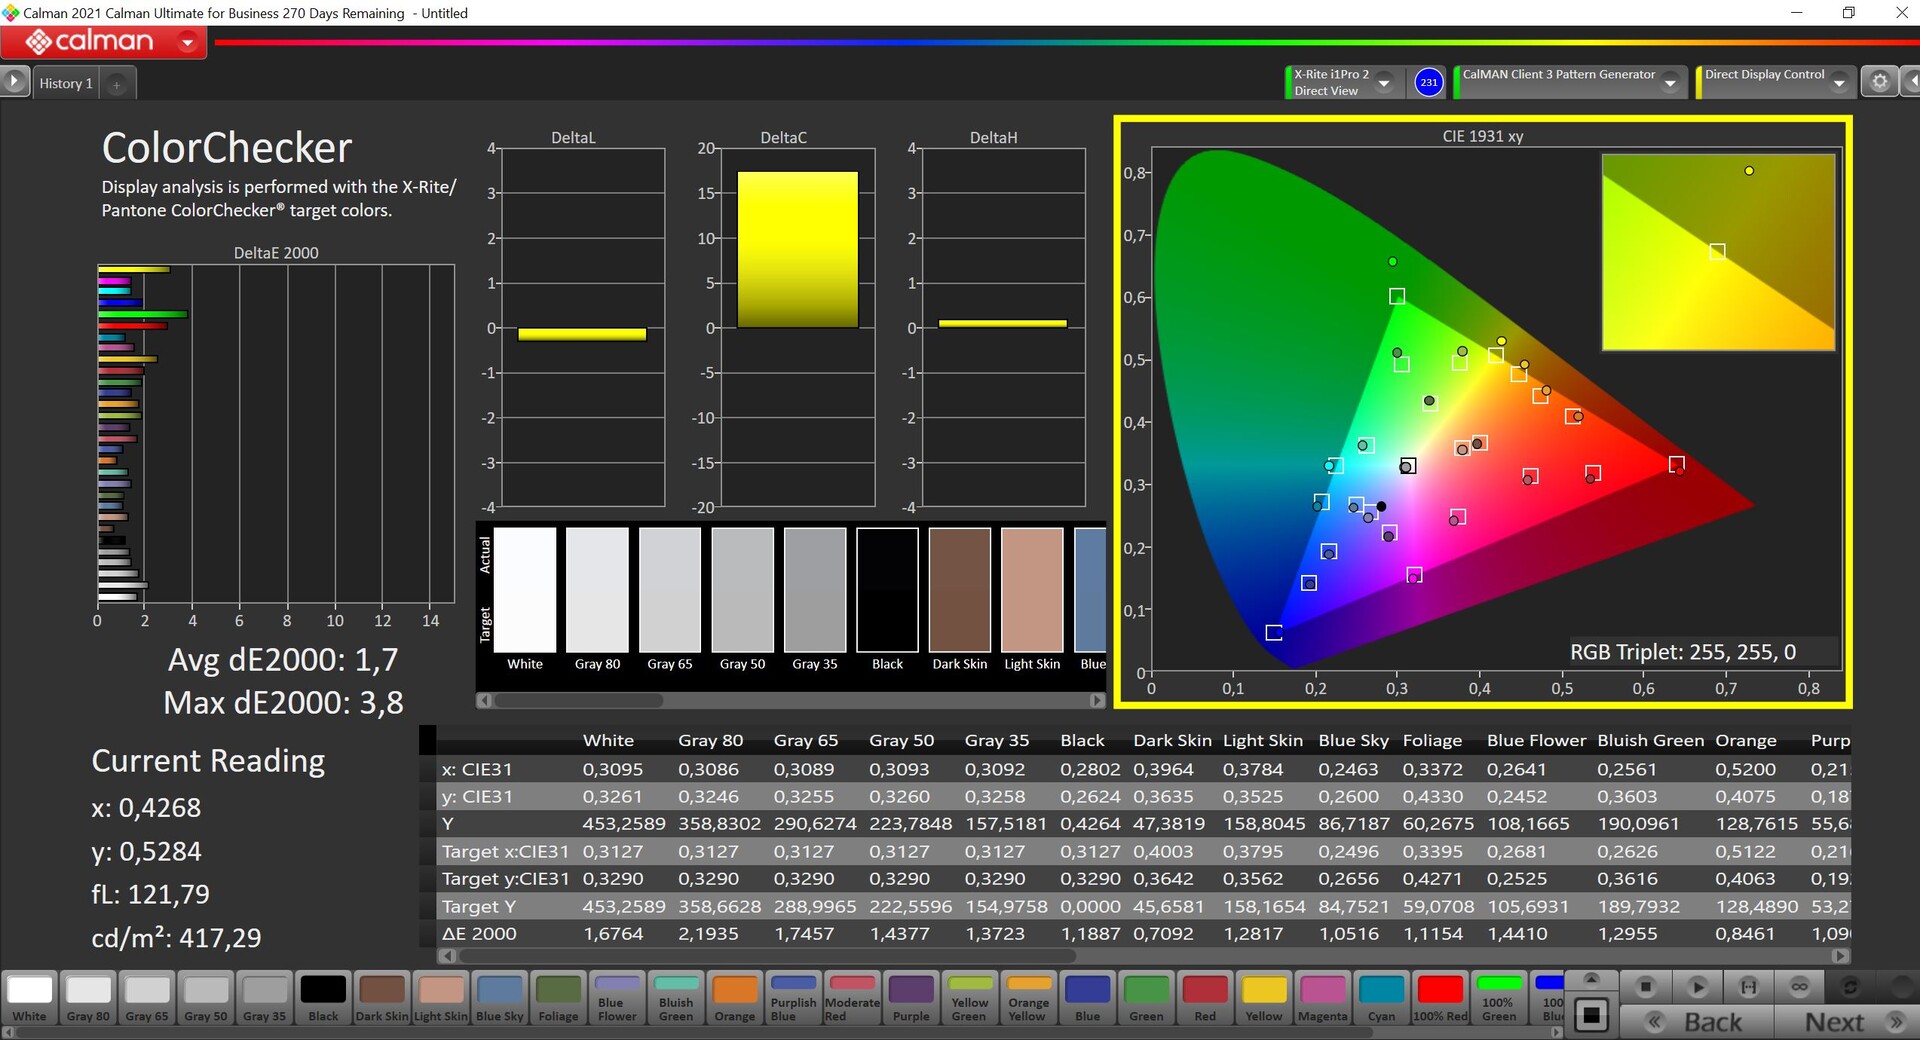
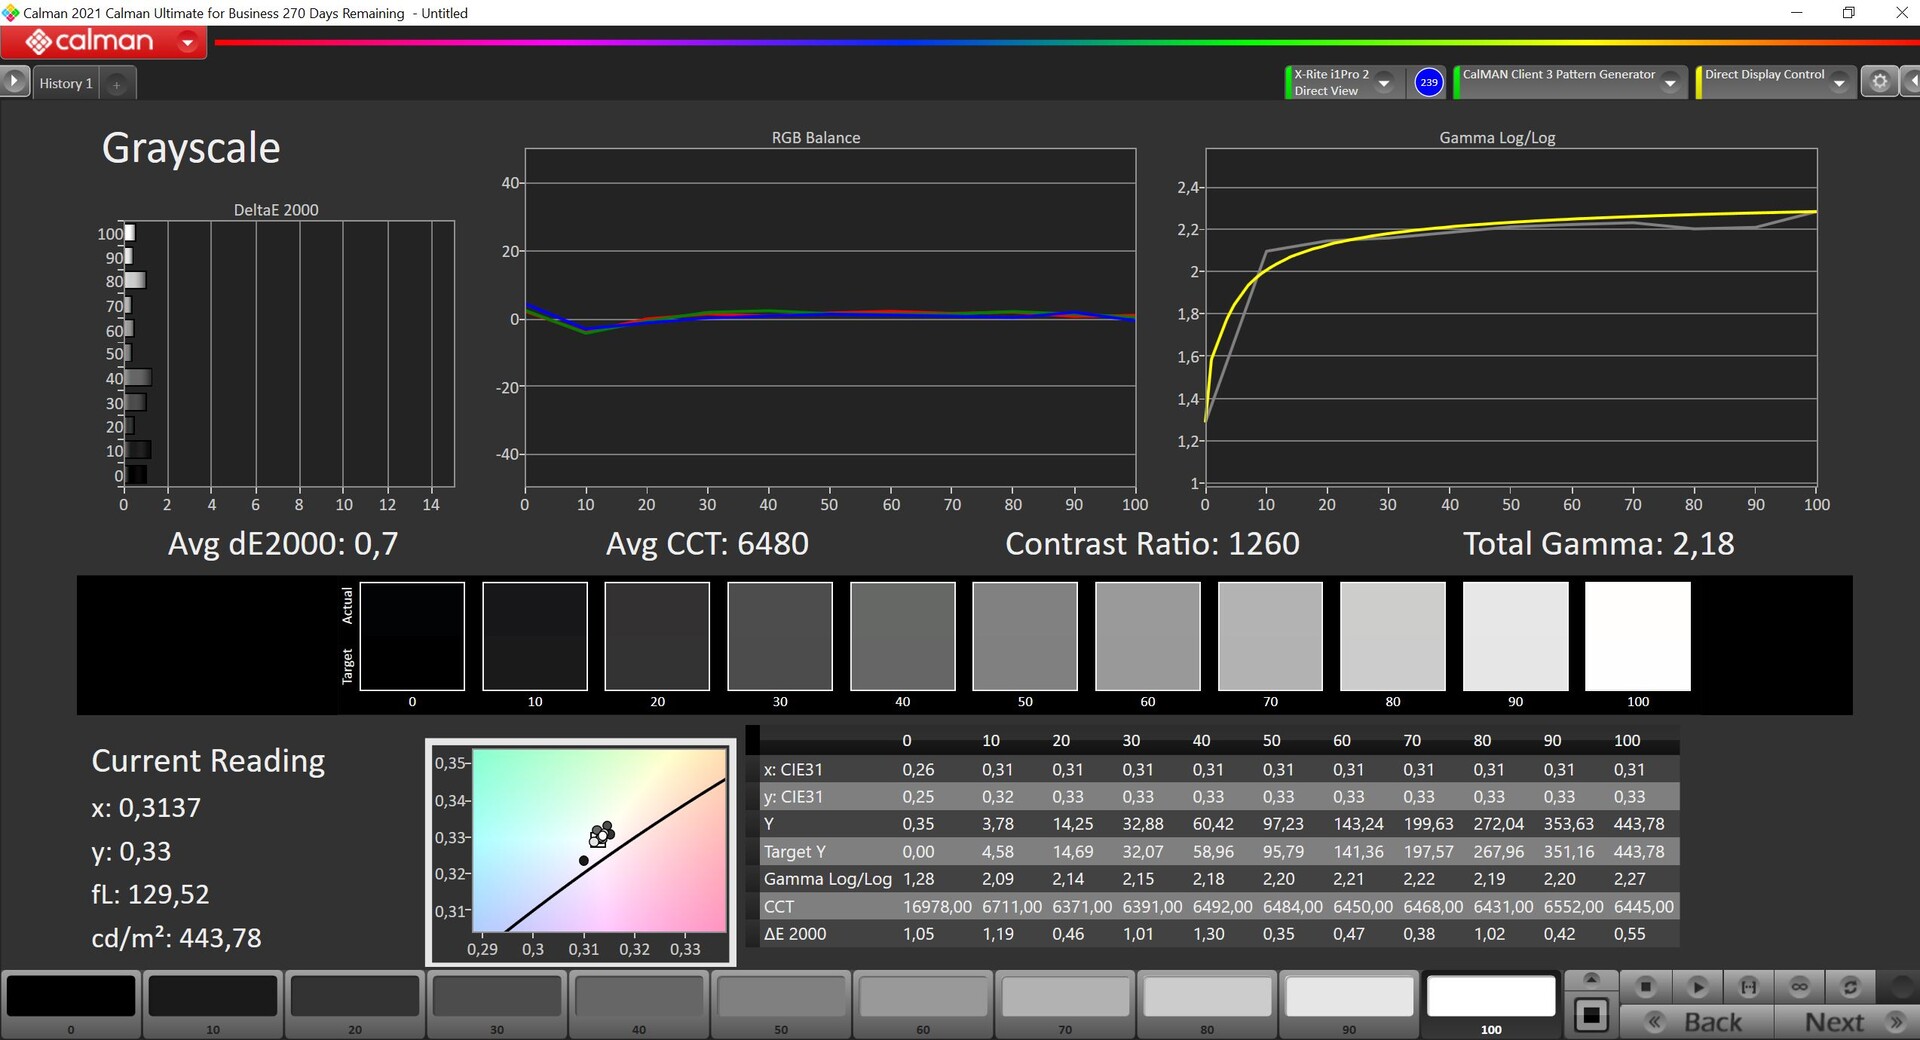
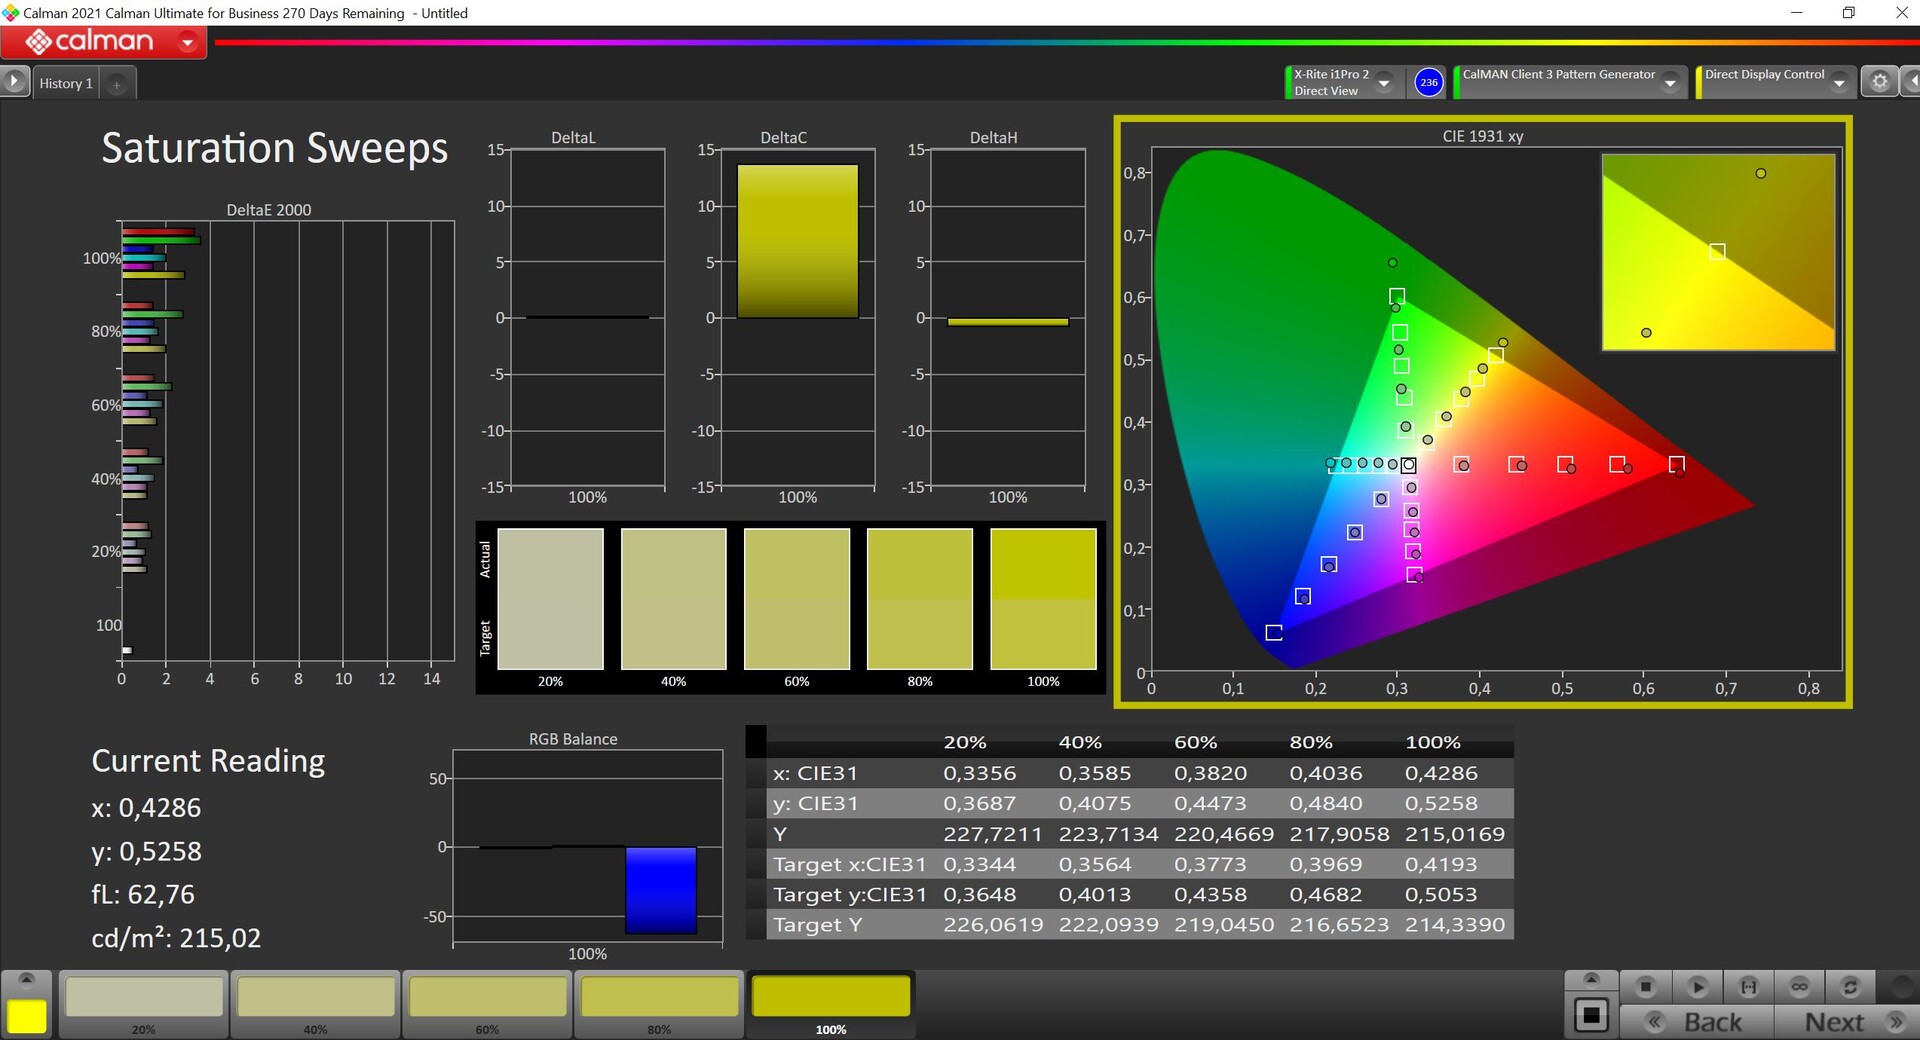
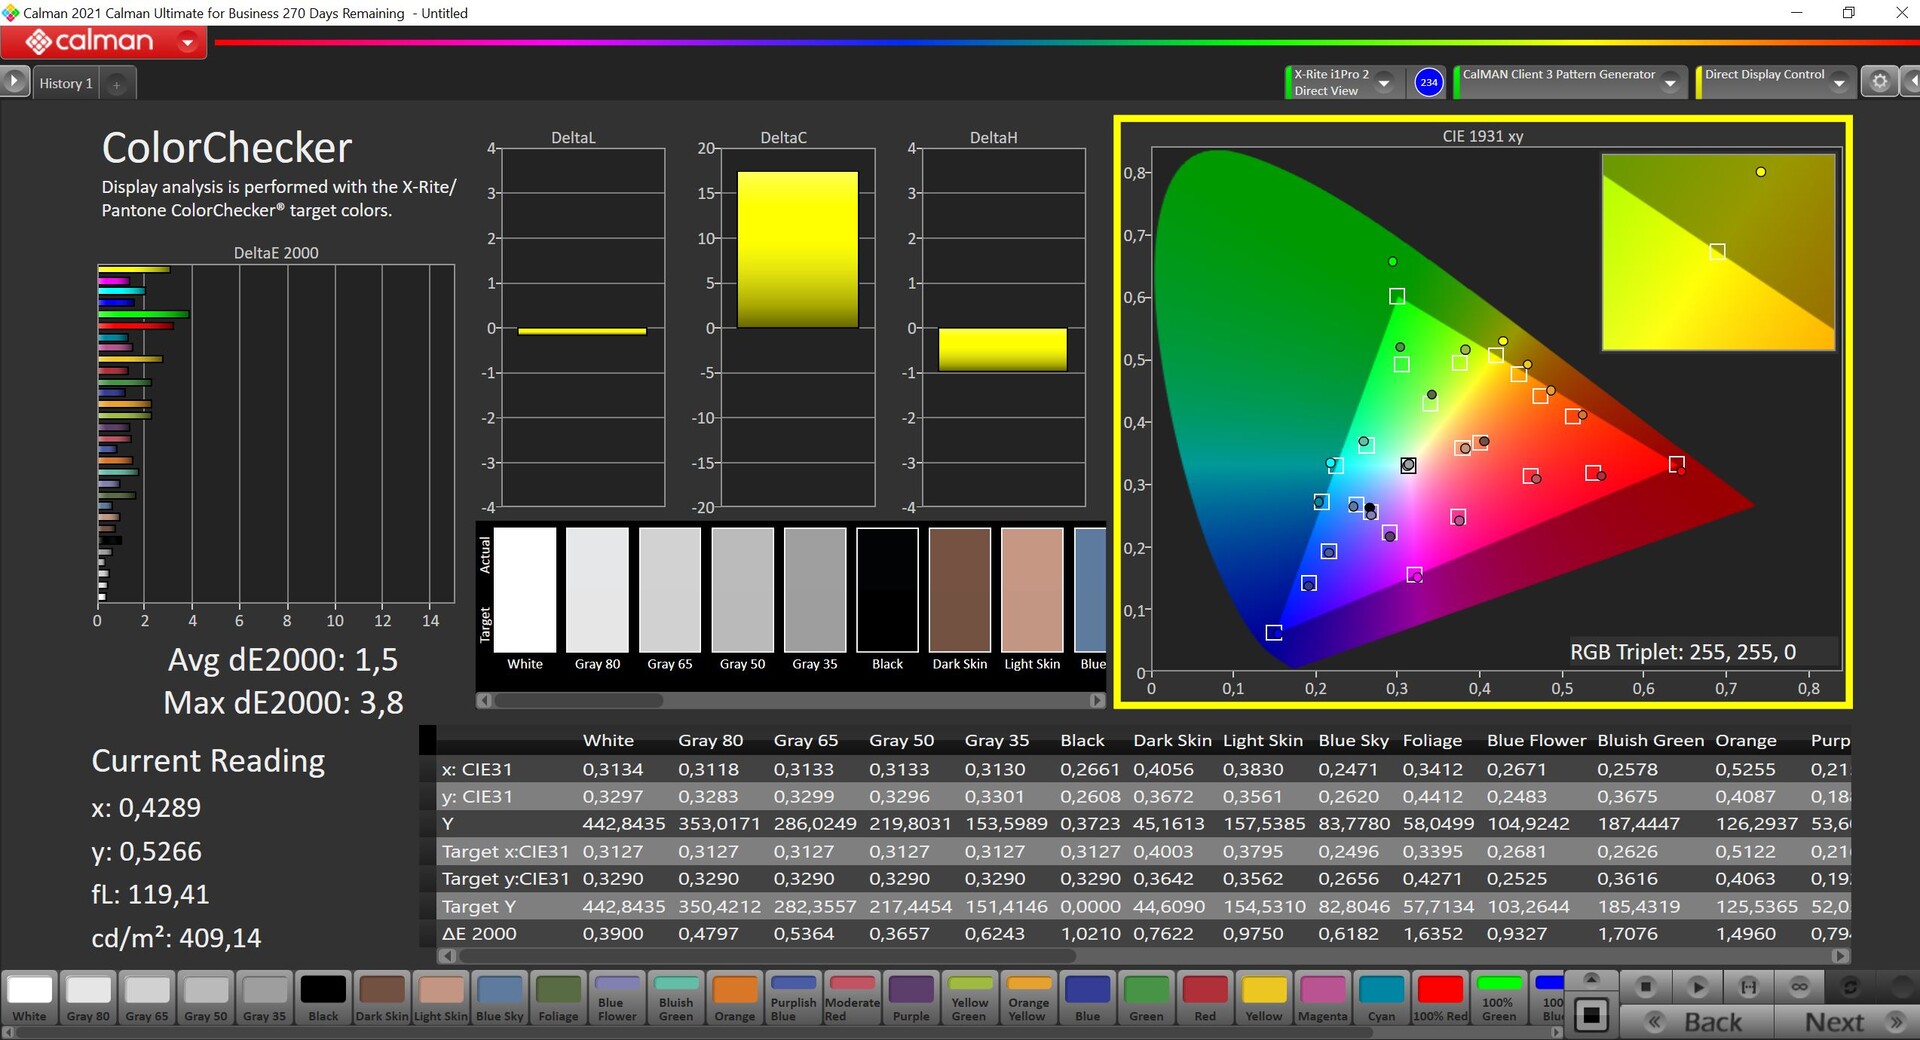
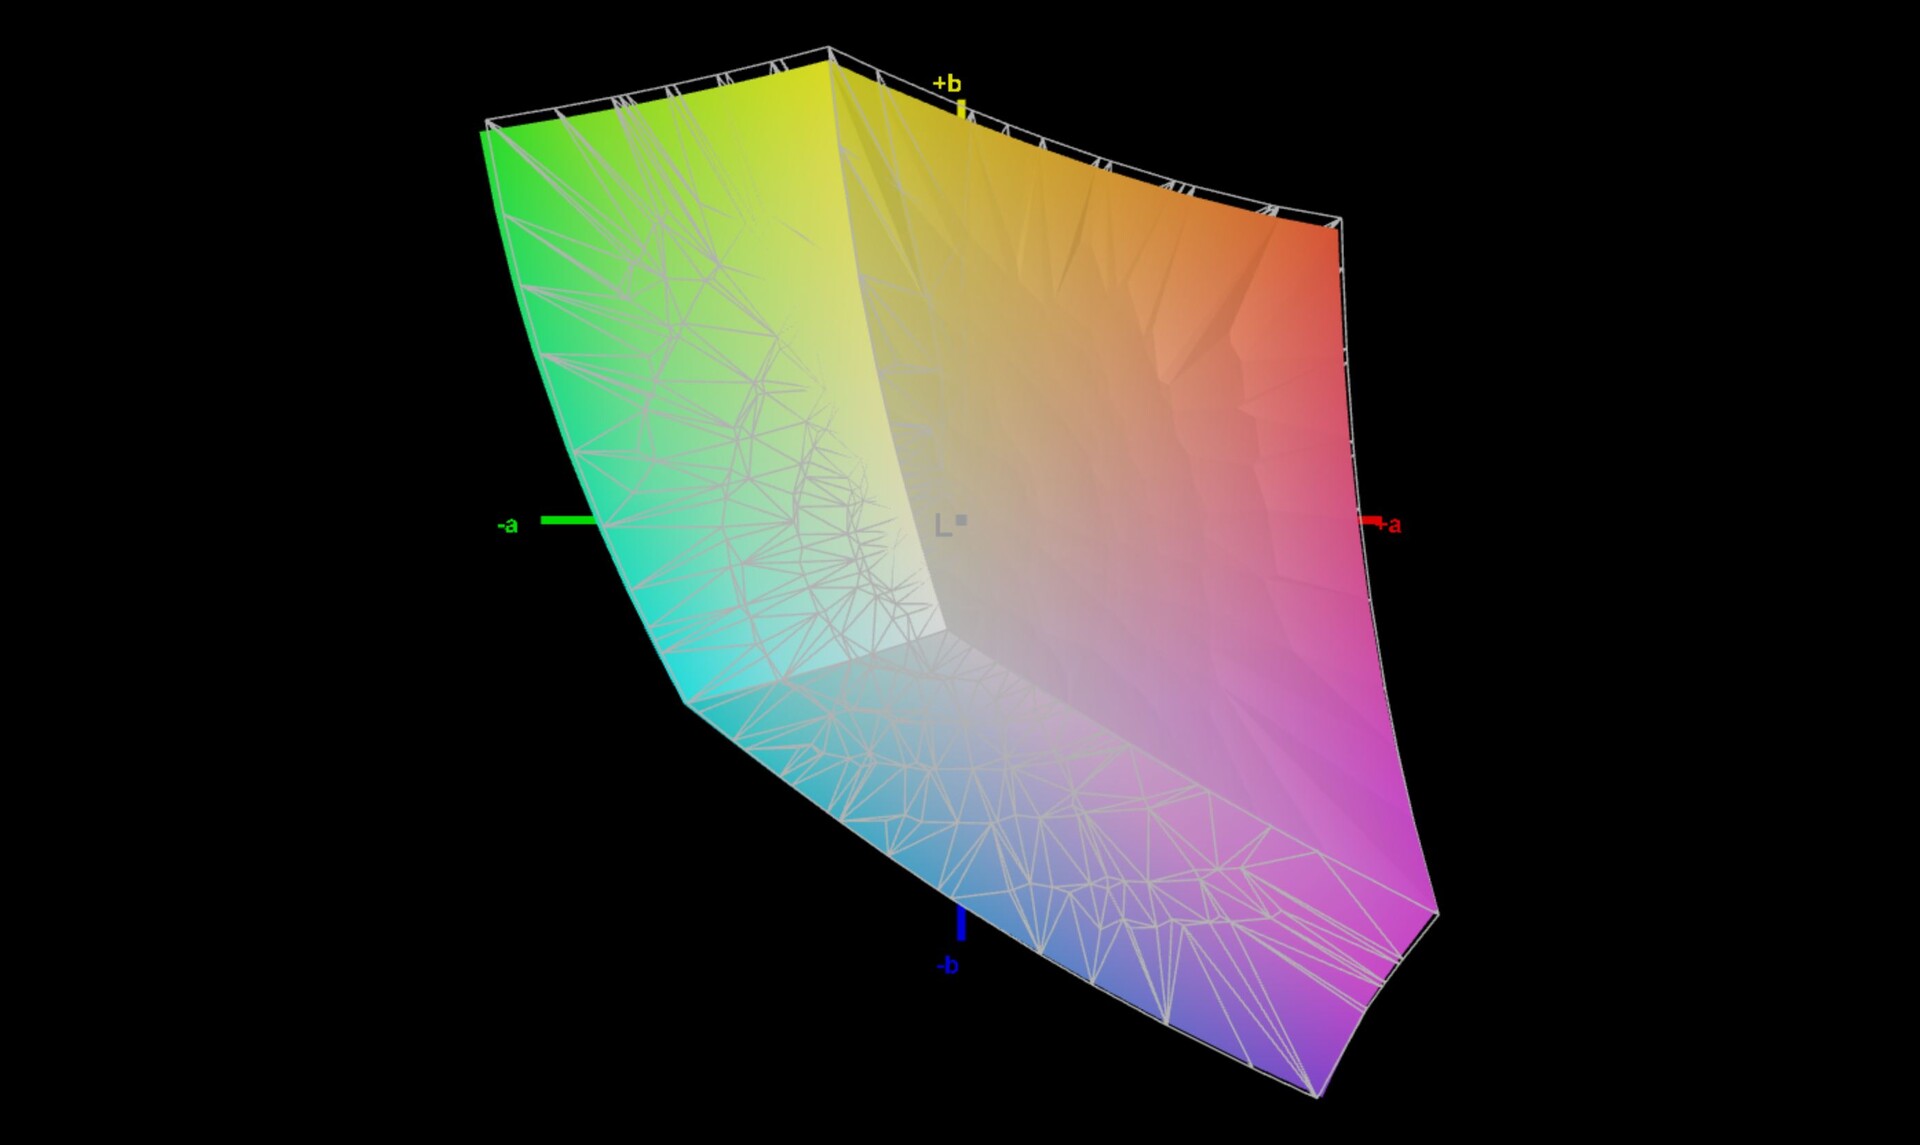
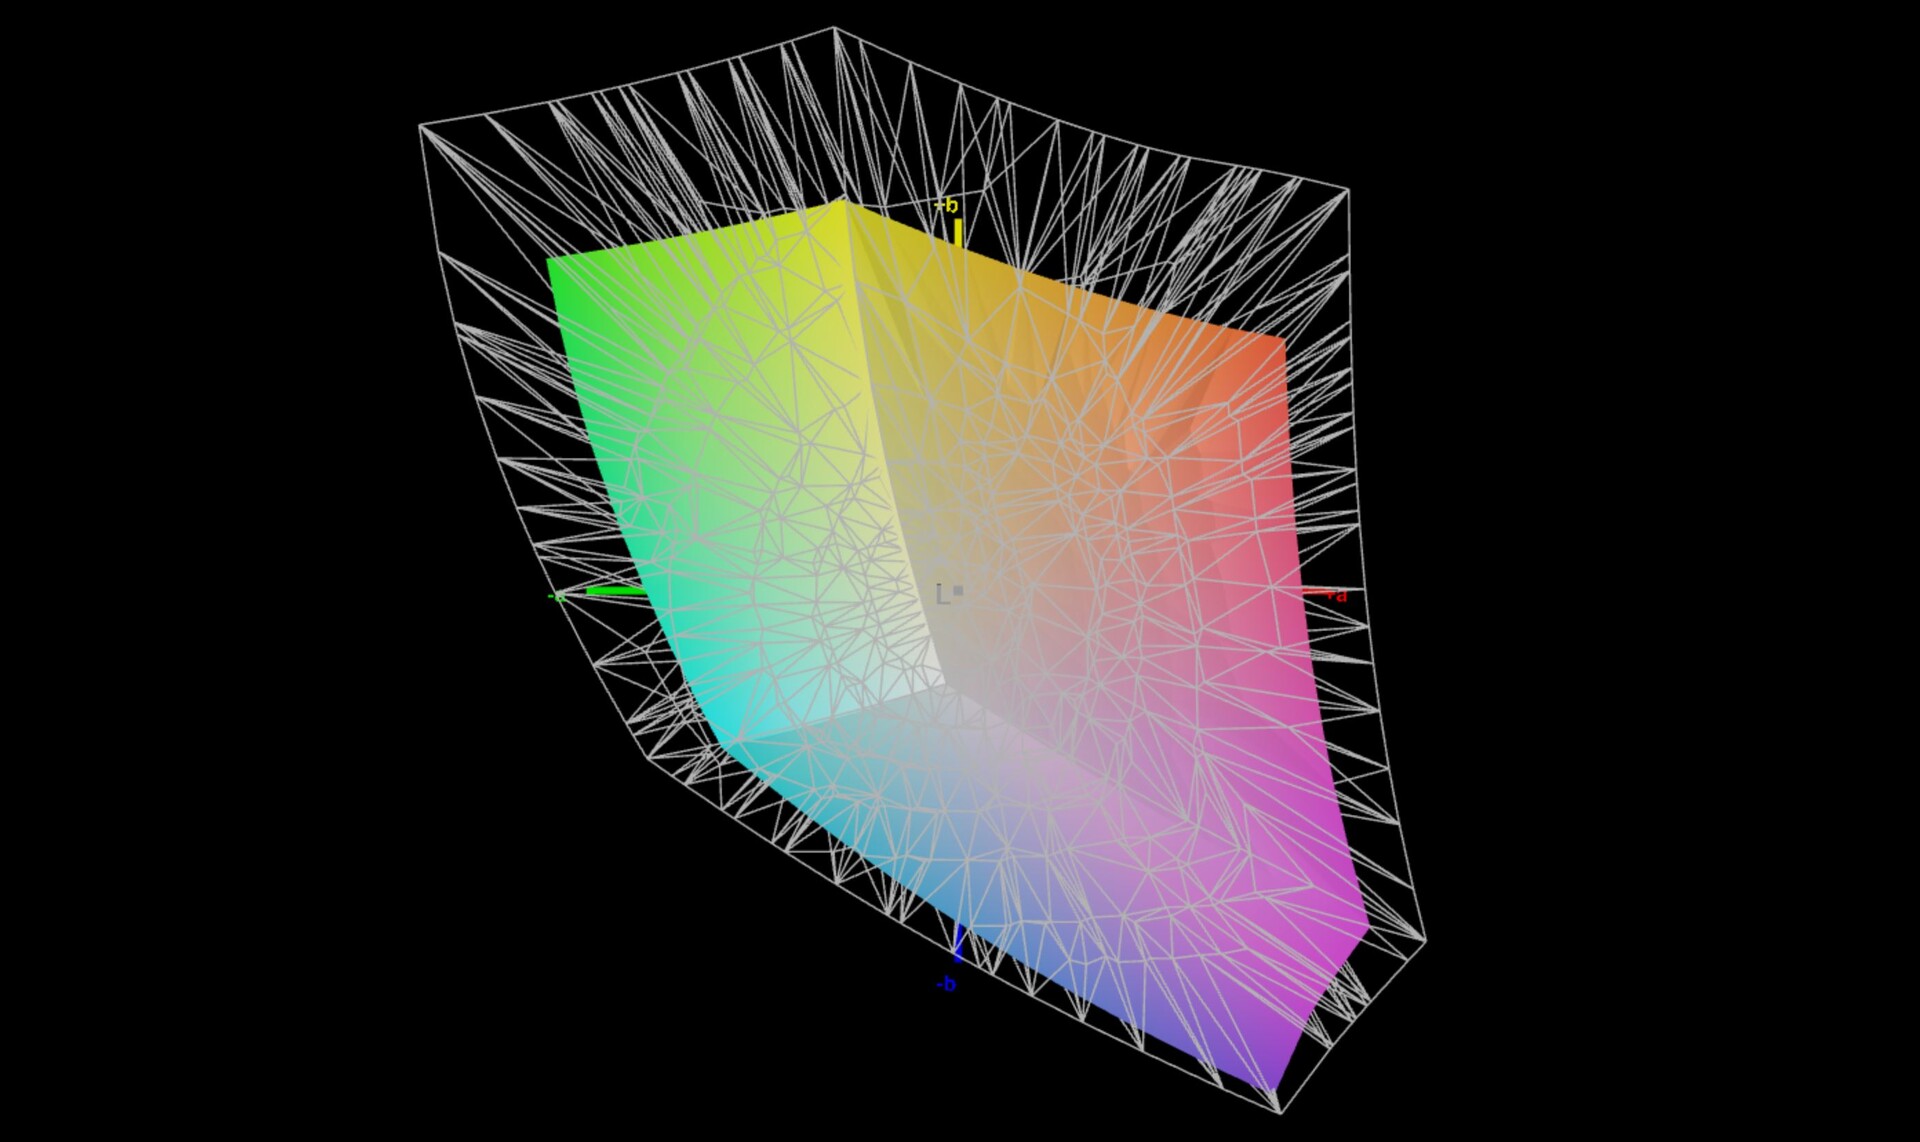
Testamos o painel utilizando o software profissional CalMAN (X-Rite i1 Pro 2): seu desempenho em estado de entrega já é muito bom, embora não pudéssemos detectar nenhuma diferença entre os perfis sRGB e Vivid. A escala de cinza mostra um leve elenco de cores, mas isto não é perceptível na prática. Os desvios de cor estão no alvo; apenas as cores 100% mostram desvios ligeiramente maiores (onde apenas o verde está acima do valor alvo de 3). Conseguimos melhorar ainda mais estes valores através de nossa própria calibração (perfil disponível acima para download gratuito), mas isto não é realmente necessário. Em termos de cobertura do espaço de cores, no entanto, o novo painel é um pouco pior, pois o sRGB atinge apenas 97,7% de cobertura (anteriormente 100%) e tanto o P3 como o AdobeRGB também são um pouco mais baixos do que antes.
Exibir tempos de resposta
| ↔ Tempo de resposta preto para branco | ||
|---|---|---|
| 19.4 ms ... ascensão ↗ e queda ↘ combinadas | ↗ 6.8 ms ascensão | 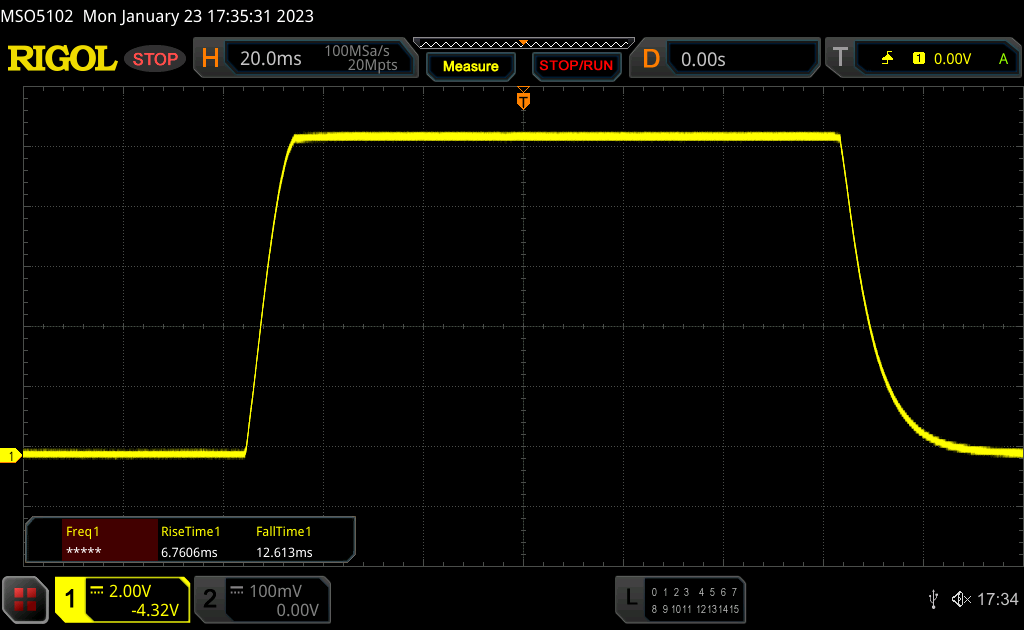 |
| ↘ 12.6 ms queda | ||
| A tela mostra boas taxas de resposta em nossos testes, mas pode ser muito lenta para jogadores competitivos. Em comparação, todos os dispositivos testados variam de 0.1 (mínimo) a 240 (máximo) ms. » 43 % de todos os dispositivos são melhores. Isso significa que o tempo de resposta medido é semelhante à média de todos os dispositivos testados (19.8 ms). | ||
| ↔ Tempo de resposta 50% cinza a 80% cinza | ||
| 13 ms ... ascensão ↗ e queda ↘ combinadas | ↗ 6 ms ascensão | 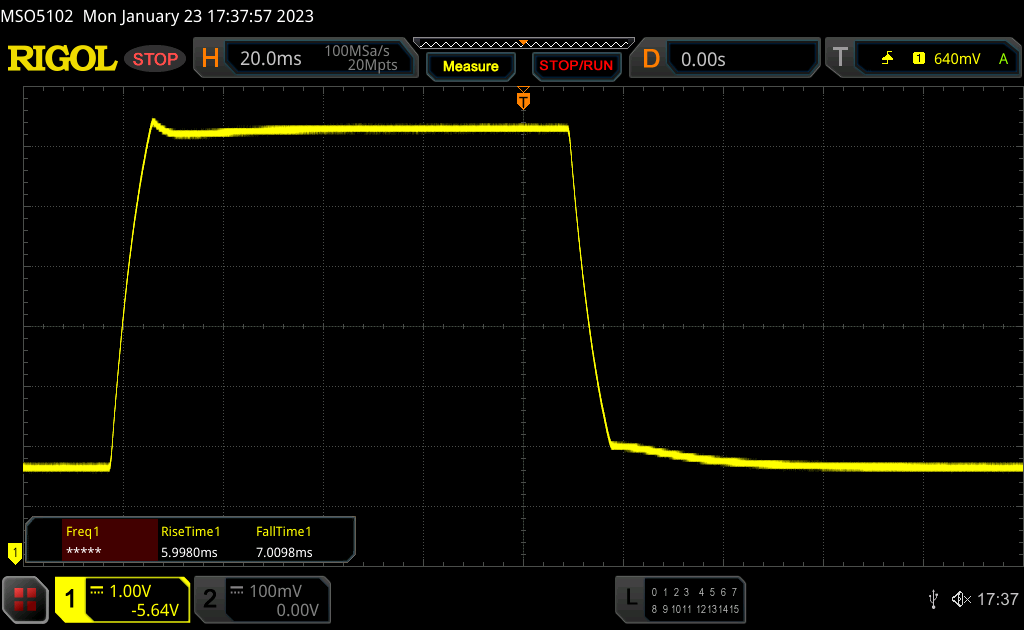 |
| ↘ 7 ms queda | ||
| A tela mostra boas taxas de resposta em nossos testes, mas pode ser muito lenta para jogadores competitivos. Em comparação, todos os dispositivos testados variam de 0.165 (mínimo) a 636 (máximo) ms. » 27 % de todos os dispositivos são melhores. Isso significa que o tempo de resposta medido é melhor que a média de todos os dispositivos testados (31 ms). | ||
Cintilação da tela / PWM (modulação por largura de pulso)
| Tela tremeluzindo/PWM detectado | 29896 Hz | ≤ 55 % configuração de brilho | 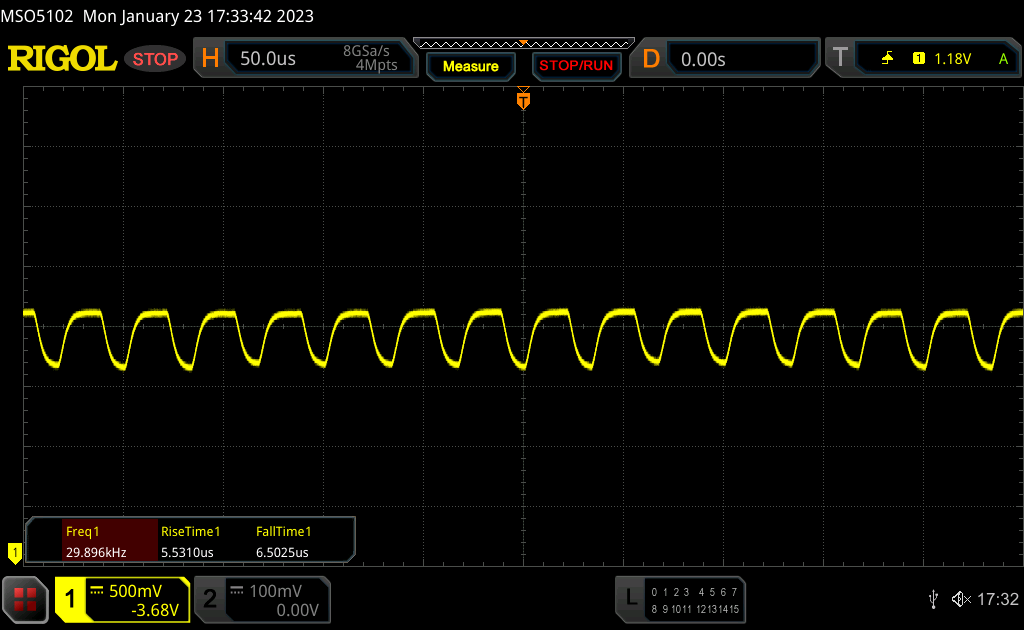 |
A luz de fundo da tela pisca em 29896 Hz (pior caso, por exemplo, utilizando PWM) Cintilação detectada em uma configuração de brilho de 55 % e abaixo. Não deve haver cintilação ou PWM acima desta configuração de brilho. A frequência de 29896 Hz é bastante alta, então a maioria dos usuários sensíveis ao PWM não deve notar nenhuma oscilação. [pwm_comparison] Em comparação: 52 % de todos os dispositivos testados não usam PWM para escurecer a tela. Se PWM foi detectado, uma média de 7757 (mínimo: 5 - máximo: 343500) Hz foi medida. | |||
Uma superfície de tela brilhante não é ideal para uso ao ar livre, portanto, basicamente é preciso evitar reflexos de fontes de luz sempre que possível. Somente então o nível máximo de brilho é suficiente para a visualização confortável do conteúdo da tela. A estabilidade do ângulo de visão não deixa espaço para críticas.

Desempenho - Alder Lake-U fornece significativamente mais potência
As variantes Intel do novo Surface Pro 9 só estão disponíveis com processadores Alder Lake na classe de 15 watts, seja o Núcleo i5 1235Uou o Core i7 1255U. Aqueles que requerem 16 GB de RAM ou 256 GB de armazenamento terão que optar pela variante i7. É possível um máximo de 32 GB de RAM e um SDD de 1 TB (US$2499,99).
Condições de teste
A Microsoft utiliza apenas as configurações de potência do Windows, que são ligeiramente diferentes no nome de outros dispositivos Windows(Recomendado, Melhor Desempenho e Melhor Desempenho). Usamos o Melhor Desempenho para os benchmarks e o modo padrão 60 Hz foi usado para as medições de energia.
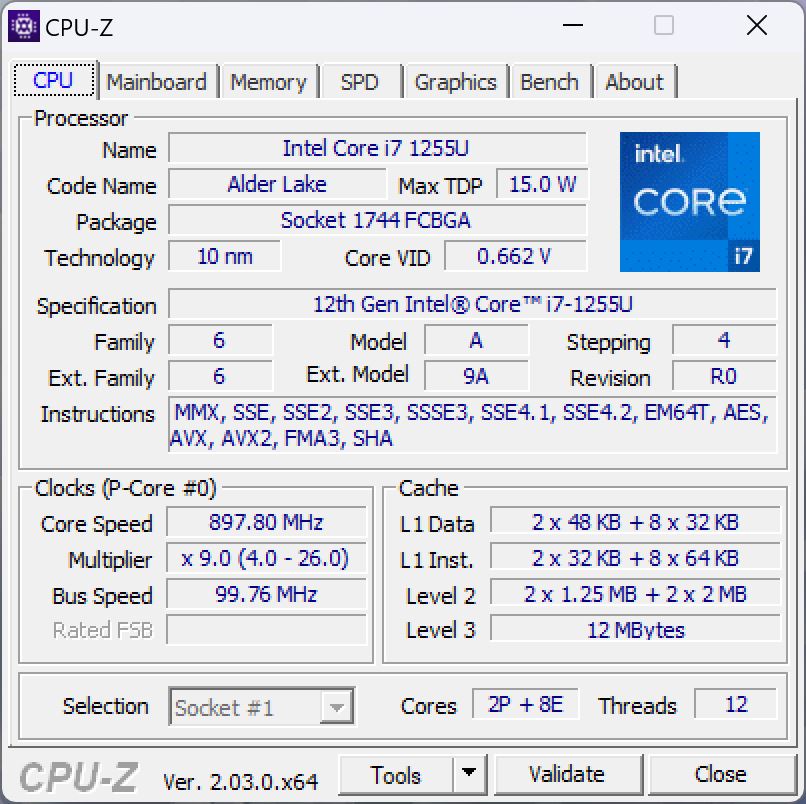
Processador - Core i7-1255U
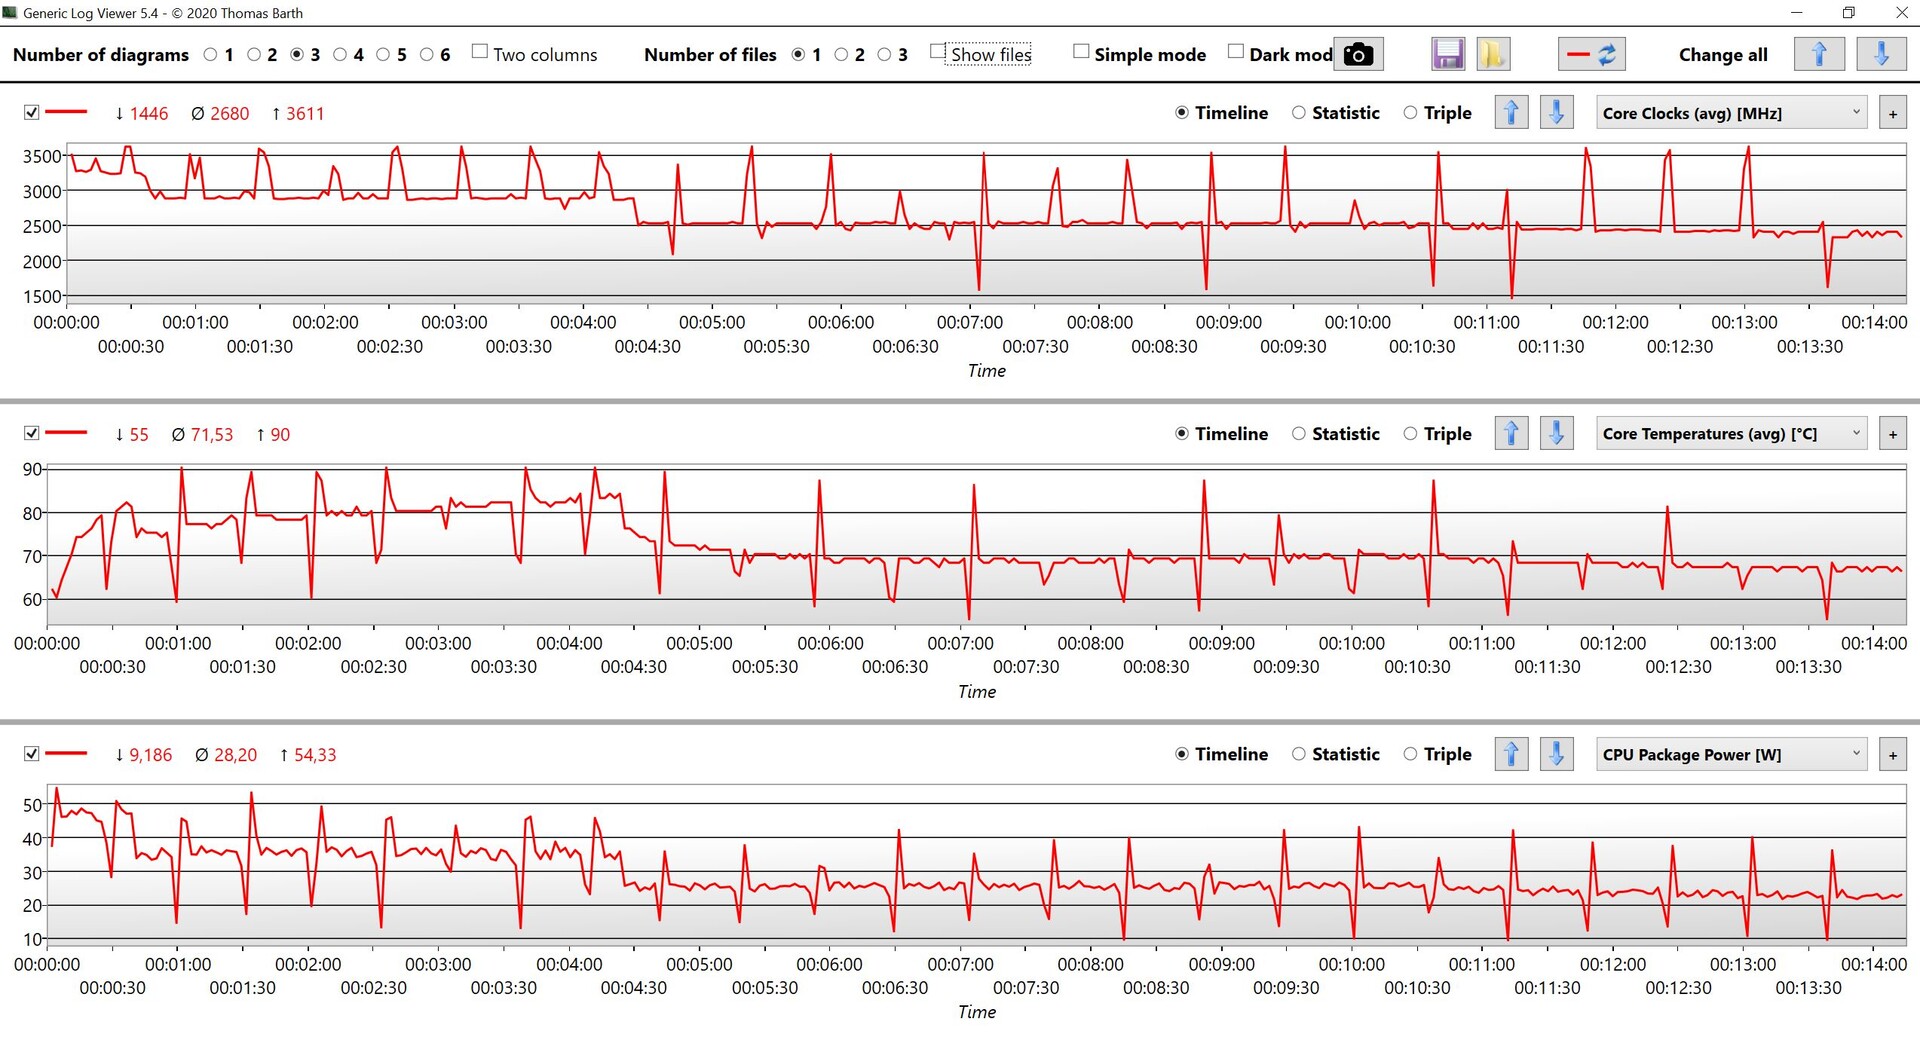
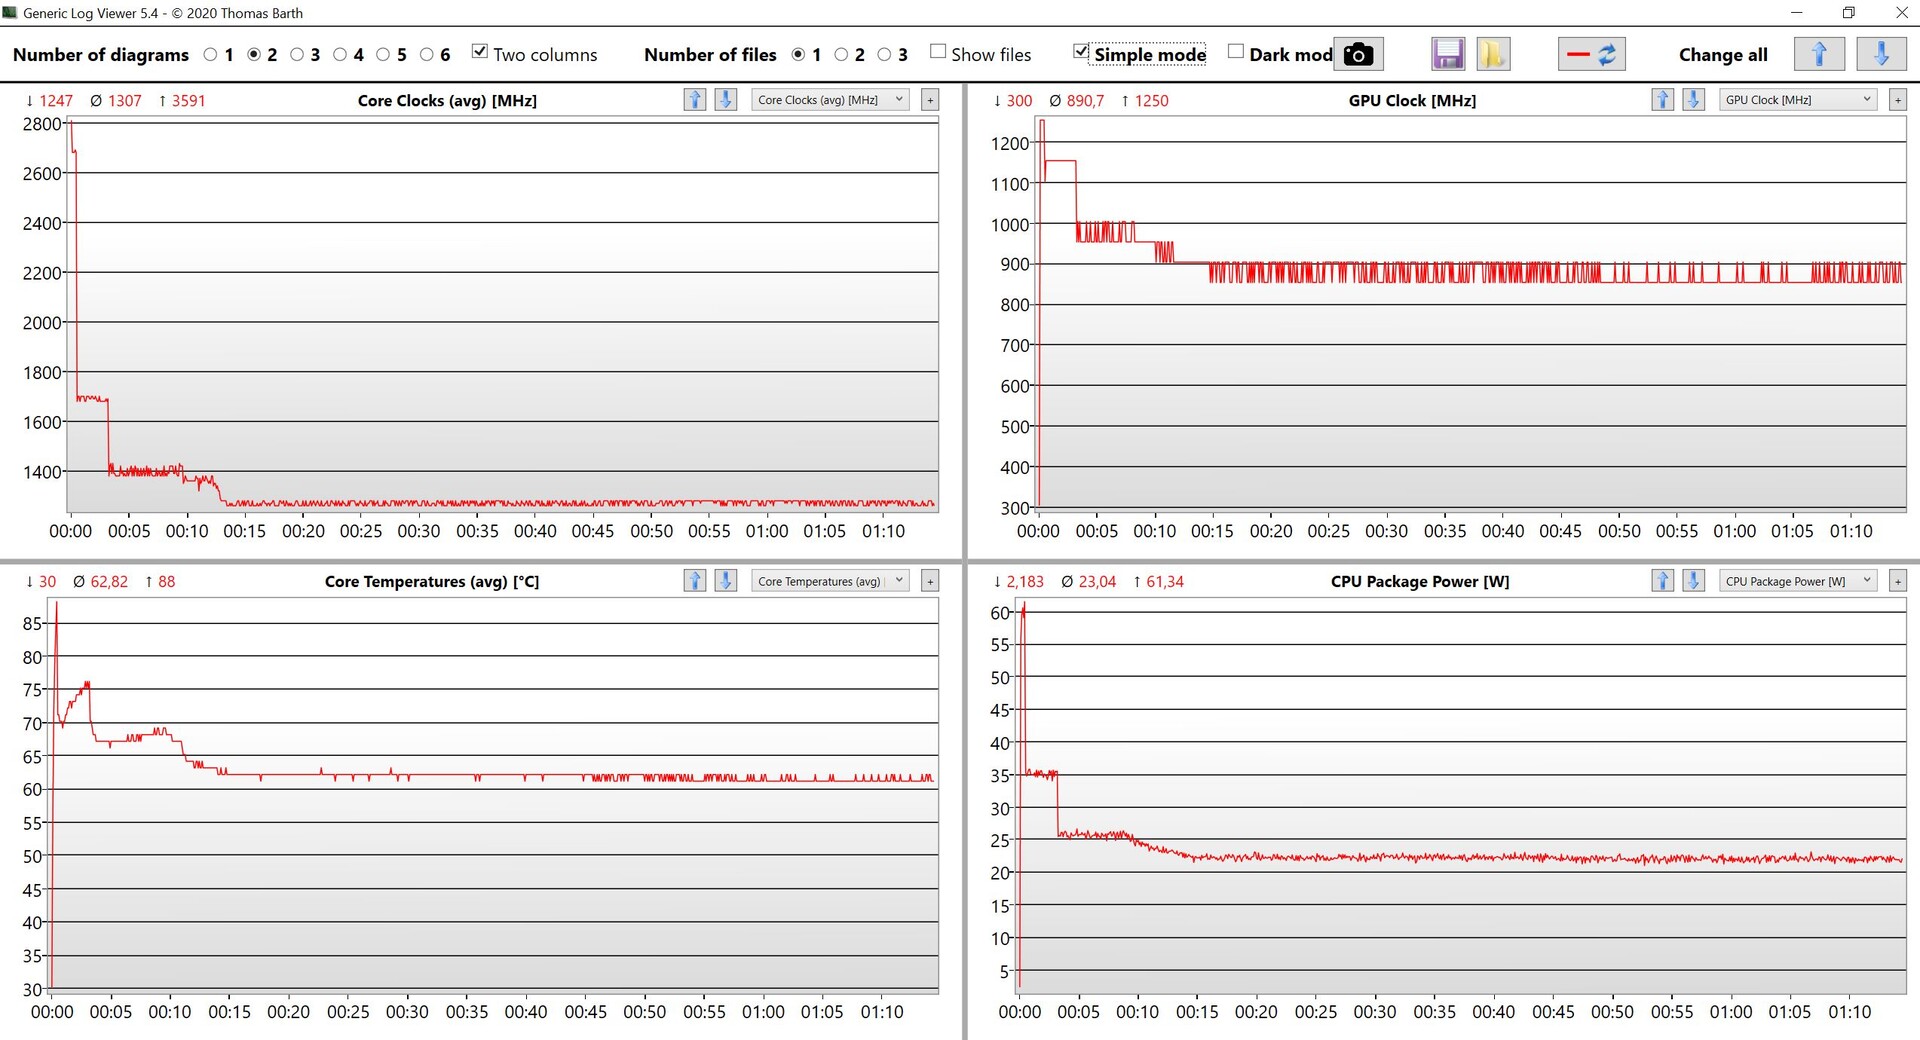
O Core i7 1255Upertence à atual geração Alder Lake da Intel e combina dois núcleos de desempenho rápido com 8 núcleos de eficiência. É basicamente uma CPU de 15 watts, mas a Microsoft dá rédea solta ao processador aqui e observamos um consumo máximo de cerca de 20 watts sob carga de um núcleo e até 54 watts sob carga de vários núcleos, o que também está próximo do limite máximo dos processadores Alder Lake-U, conforme especificado pela Intel. É claro que estes valores são mantidos apenas por um tempo muito curto, mas o Surface Pro 9 pode manter 35 watts sob carga constante por cerca de 4,5 minutos antes de descer para cerca de 25 watts e ainda mais para 22 watts. Se estes valores altos fazem sentido é, naturalmente, outra questão, pois nossa recente análise das CPUs Alder Lake-U revelou que um chip Alder Lake-P (por exemplo, o Núcleo i7 1260P) com dois núcleos adicionais oferece mais desempenho a tais valores.
Cinebench R15 Multi Sustained Load
Nos testes da CPU, o Surface Pro 9 é batido apenas peloAsus ROG Flow Z13conversível para jogos, que também está equipado com o Núcleo i9 12900H.tanto o desempenho de um núcleo quanto o de vários núcleos são significativamente melhores do que no antigo Superfície Pro 8 com seu Núcleo i7 1185G7. Para comparação com o Processador M2 no iPad Pro, incluímos os resultados do MacBook Airuma vez que nem todos os benchmarks são suportados no iPad. O Apple M2 não é tão rápido, mas é muito mais eficiente (~5 watts de um núcleo e ~20 watts de múltiplos núcleos).
No modo de bateria, o desempenho da CPU é ligeiramente pior porque os limites de potência são reduzidos para 45/30 watts. No teste Cinebench R23 multi-core, isto leva a uma redução de desempenho de pouco menos de 5%, mas o desempenho de um só núcleo não é pior. Mais referências de CPU estão disponíveisaqui.
Cinebench R23: Multi Core | Single Core
Cinebench R20: CPU (Multi Core) | CPU (Single Core)
Cinebench R15: CPU Multi 64Bit | CPU Single 64Bit
Blender: v2.79 BMW27 CPU
7-Zip 18.03: 7z b 4 | 7z b 4 -mmt1
Geekbench 5.5: Multi-Core | Single-Core
HWBOT x265 Benchmark v2.2: 4k Preset
LibreOffice : 20 Documents To PDF
R Benchmark 2.5: Overall mean
| CPU Performance rating | |
| Asus ROG Flow Z13 GZ301ZE | |
| Média da turma Convertible | |
| Microsoft Surface Pro 9, i7-1255U | |
| Apple MacBook Air M2 10C GPU -5! | |
| HP Elite Dragonfly Folio 13.5 G3 | |
| Média Intel Core i7-1255U | |
| Dell XPS 13 9315 2-in-1 Core i5-1230U | |
| Microsoft Surface Pro 8, i7-1185G7 | |
| Lenovo ThinkPad X12 20UVS03G00 -1! | |
| Cinebench R23 / Multi Core | |
| Asus ROG Flow Z13 GZ301ZE | |
| Média da turma Convertible (1317 - 30959, n=48, últimos 2 anos) | |
| Microsoft Surface Pro 9, i7-1255U | |
| Apple MacBook Air M2 10C GPU | |
| Média Intel Core i7-1255U (5269 - 9628, n=11) | |
| HP Elite Dragonfly Folio 13.5 G3 | |
| Dell XPS 13 9315 2-in-1 Core i5-1230U | |
| Microsoft Surface Pro 8, i7-1185G7 | |
| Lenovo ThinkPad X12 20UVS03G00 | |
| Cinebench R23 / Single Core | |
| Asus ROG Flow Z13 GZ301ZE | |
| Média da turma Convertible (740 - 2188, n=48, últimos 2 anos) | |
| HP Elite Dragonfly Folio 13.5 G3 | |
| Microsoft Surface Pro 9, i7-1255U | |
| Média Intel Core i7-1255U (1408 - 1775, n=11) | |
| Apple MacBook Air M2 10C GPU | |
| Microsoft Surface Pro 8, i7-1185G7 | |
| Dell XPS 13 9315 2-in-1 Core i5-1230U | |
| Lenovo ThinkPad X12 20UVS03G00 | |
| Cinebench R20 / CPU (Multi Core) | |
| Asus ROG Flow Z13 GZ301ZE | |
| Média da turma Convertible (595 - 12102, n=48, últimos 2 anos) | |
| Microsoft Surface Pro 9, i7-1255U | |
| Média Intel Core i7-1255U (2095 - 3702, n=11) | |
| HP Elite Dragonfly Folio 13.5 G3 | |
| Dell XPS 13 9315 2-in-1 Core i5-1230U | |
| Apple MacBook Air M2 10C GPU | |
| Microsoft Surface Pro 8, i7-1185G7 | |
| Lenovo ThinkPad X12 20UVS03G00 | |
| Cinebench R20 / CPU (Single Core) | |
| Asus ROG Flow Z13 GZ301ZE | |
| Média da turma Convertible (273 - 834, n=48, últimos 2 anos) | |
| HP Elite Dragonfly Folio 13.5 G3 | |
| Microsoft Surface Pro 9, i7-1255U | |
| Média Intel Core i7-1255U (550 - 682, n=11) | |
| Dell XPS 13 9315 2-in-1 Core i5-1230U | |
| Microsoft Surface Pro 8, i7-1185G7 | |
| Lenovo ThinkPad X12 20UVS03G00 | |
| Apple MacBook Air M2 10C GPU | |
| Cinebench R15 / CPU Multi 64Bit | |
| Asus ROG Flow Z13 GZ301ZE | |
| Média da turma Convertible (478 - 4940, n=47, últimos 2 anos) | |
| Microsoft Surface Pro 9, i7-1255U | |
| HP Elite Dragonfly Folio 13.5 G3 | |
| Média Intel Core i7-1255U (919 - 1577, n=11) | |
| Dell XPS 13 9315 2-in-1 Core i5-1230U | |
| Apple MacBook Air M2 10C GPU | |
| Microsoft Surface Pro 8, i7-1185G7 | |
| Lenovo ThinkPad X12 20UVS03G00 | |
| Cinebench R15 / CPU Single 64Bit | |
| Asus ROG Flow Z13 GZ301ZE | |
| Média da turma Convertible (149.8 - 317, n=47, últimos 2 anos) | |
| HP Elite Dragonfly Folio 13.5 G3 | |
| Média Intel Core i7-1255U (161 - 251, n=12) | |
| Microsoft Surface Pro 8, i7-1185G7 | |
| Apple MacBook Air M2 10C GPU | |
| Microsoft Surface Pro 9, i7-1255U | |
| Dell XPS 13 9315 2-in-1 Core i5-1230U | |
| Lenovo ThinkPad X12 20UVS03G00 | |
| Blender / v2.79 BMW27 CPU | |
| Lenovo ThinkPad X12 20UVS03G00 | |
| Apple MacBook Air M2 10C GPU | |
| Microsoft Surface Pro 8, i7-1185G7 | |
| Dell XPS 13 9315 2-in-1 Core i5-1230U | |
| Média Intel Core i7-1255U (372 - 601, n=11) | |
| HP Elite Dragonfly Folio 13.5 G3 | |
| Microsoft Surface Pro 9, i7-1255U | |
| Média da turma Convertible (105 - 1051, n=47, últimos 2 anos) | |
| Asus ROG Flow Z13 GZ301ZE | |
| 7-Zip 18.03 / 7z b 4 | |
| Asus ROG Flow Z13 GZ301ZE | |
| Média da turma Convertible (12977 - 121368, n=47, últimos 2 anos) | |
| Microsoft Surface Pro 9, i7-1255U | |
| Dell XPS 13 9315 2-in-1 Core i5-1230U | |
| HP Elite Dragonfly Folio 13.5 G3 | |
| Média Intel Core i7-1255U (24126 - 37365, n=11) | |
| Microsoft Surface Pro 8, i7-1185G7 | |
| Lenovo ThinkPad X12 20UVS03G00 | |
| 7-Zip 18.03 / 7z b 4 -mmt1 | |
| Asus ROG Flow Z13 GZ301ZE | |
| Média da turma Convertible (3672 - 6655, n=47, últimos 2 anos) | |
| Média Intel Core i7-1255U (5059 - 5529, n=11) | |
| HP Elite Dragonfly Folio 13.5 G3 | |
| Microsoft Surface Pro 8, i7-1185G7 | |
| Microsoft Surface Pro 9, i7-1255U | |
| Dell XPS 13 9315 2-in-1 Core i5-1230U | |
| Geekbench 5.5 / Multi-Core | |
| Asus ROG Flow Z13 GZ301ZE | |
| Média da turma Convertible (1608 - 22023, n=48, últimos 2 anos) | |
| Apple MacBook Air M2 10C GPU | |
| Microsoft Surface Pro 9, i7-1255U | |
| HP Elite Dragonfly Folio 13.5 G3 | |
| Média Intel Core i7-1255U (4463 - 8821, n=12) | |
| Dell XPS 13 9315 2-in-1 Core i5-1230U | |
| Microsoft Surface Pro 8, i7-1185G7 | |
| Lenovo ThinkPad X12 20UVS03G00 | |
| Geekbench 5.5 / Single-Core | |
| Apple MacBook Air M2 10C GPU | |
| Asus ROG Flow Z13 GZ301ZE | |
| Média da turma Convertible (806 - 2275, n=48, últimos 2 anos) | |
| Microsoft Surface Pro 9, i7-1255U | |
| HP Elite Dragonfly Folio 13.5 G3 | |
| Média Intel Core i7-1255U (1560 - 1712, n=12) | |
| Microsoft Surface Pro 8, i7-1185G7 | |
| Dell XPS 13 9315 2-in-1 Core i5-1230U | |
| Lenovo ThinkPad X12 20UVS03G00 | |
| HWBOT x265 Benchmark v2.2 / 4k Preset | |
| Asus ROG Flow Z13 GZ301ZE | |
| Média da turma Convertible (3.43 - 36.2, n=47, últimos 2 anos) | |
| Microsoft Surface Pro 9, i7-1255U | |
| HP Elite Dragonfly Folio 13.5 G3 | |
| Média Intel Core i7-1255U (6.31 - 10.1, n=11) | |
| Dell XPS 13 9315 2-in-1 Core i5-1230U | |
| Microsoft Surface Pro 8, i7-1185G7 | |
| Lenovo ThinkPad X12 20UVS03G00 | |
| LibreOffice / 20 Documents To PDF | |
| Lenovo ThinkPad X12 20UVS03G00 | |
| Média da turma Convertible (42.5 - 84.3, n=47, últimos 2 anos) | |
| Microsoft Surface Pro 9, i7-1255U | |
| Dell XPS 13 9315 2-in-1 Core i5-1230U | |
| Microsoft Surface Pro 8, i7-1185G7 | |
| HP Elite Dragonfly Folio 13.5 G3 | |
| Média Intel Core i7-1255U (35.6 - 52.5, n=11) | |
| Asus ROG Flow Z13 GZ301ZE | |
| R Benchmark 2.5 / Overall mean | |
| Lenovo ThinkPad X12 20UVS03G00 | |
| Microsoft Surface Pro 8, i7-1185G7 | |
| Dell XPS 13 9315 2-in-1 Core i5-1230U | |
| Microsoft Surface Pro 9, i7-1255U | |
| Média Intel Core i7-1255U (0.4688 - 0.558, n=11) | |
| Média da turma Convertible (0.3915 - 0.84, n=47, últimos 2 anos) | |
| HP Elite Dragonfly Folio 13.5 G3 | |
| Asus ROG Flow Z13 GZ301ZE | |
* ... menor é melhor
AIDA64: FP32 Ray-Trace | FPU Julia | CPU SHA3 | CPU Queen | FPU SinJulia | FPU Mandel | CPU AES | CPU ZLib | FP64 Ray-Trace | CPU PhotoWorxx
| Performance rating | |
| Média da turma Convertible | |
| Asus ROG Flow Z13 GZ301ZE | |
| Microsoft Surface Pro 9, i7-1255U | |
| HP Elite Dragonfly Folio 13.5 G3 | |
| Média Intel Core i7-1255U | |
| Microsoft Surface Pro 8, i7-1185G7 | |
| Dell XPS 13 9315 2-in-1 Core i5-1230U | |
| Lenovo ThinkPad X12 20UVS03G00 | |
| AIDA64 / FP32 Ray-Trace | |
| Média da turma Convertible (1480 - 64158, n=47, últimos 2 anos) | |
| Microsoft Surface Pro 9, i7-1255U | |
| Asus ROG Flow Z13 GZ301ZE | |
| Microsoft Surface Pro 8, i7-1185G7 | |
| Média Intel Core i7-1255U (4313 - 8127, n=11) | |
| HP Elite Dragonfly Folio 13.5 G3 | |
| Dell XPS 13 9315 2-in-1 Core i5-1230U | |
| Lenovo ThinkPad X12 20UVS03G00 | |
| AIDA64 / FPU Julia | |
| Média da turma Convertible (11392 - 184800, n=47, últimos 2 anos) | |
| Microsoft Surface Pro 9, i7-1255U | |
| Asus ROG Flow Z13 GZ301ZE | |
| HP Elite Dragonfly Folio 13.5 G3 | |
| Média Intel Core i7-1255U (19813 - 41353, n=11) | |
| Dell XPS 13 9315 2-in-1 Core i5-1230U | |
| Microsoft Surface Pro 8, i7-1185G7 | |
| Lenovo ThinkPad X12 20UVS03G00 | |
| AIDA64 / CPU SHA3 | |
| Média da turma Convertible (797 - 8291, n=47, últimos 2 anos) | |
| Asus ROG Flow Z13 GZ301ZE | |
| Microsoft Surface Pro 9, i7-1255U | |
| Microsoft Surface Pro 8, i7-1185G7 | |
| Média Intel Core i7-1255U (1325 - 2135, n=11) | |
| HP Elite Dragonfly Folio 13.5 G3 | |
| Dell XPS 13 9315 2-in-1 Core i5-1230U | |
| Lenovo ThinkPad X12 20UVS03G00 | |
| AIDA64 / CPU Queen | |
| Asus ROG Flow Z13 GZ301ZE | |
| Microsoft Surface Pro 9, i7-1255U | |
| HP Elite Dragonfly Folio 13.5 G3 | |
| Média Intel Core i7-1255U (61375 - 65892, n=11) | |
| Média da turma Convertible (14686 - 148874, n=38, últimos 2 anos) | |
| Dell XPS 13 9315 2-in-1 Core i5-1230U | |
| Microsoft Surface Pro 8, i7-1185G7 | |
| Lenovo ThinkPad X12 20UVS03G00 | |
| AIDA64 / FPU SinJulia | |
| Asus ROG Flow Z13 GZ301ZE | |
| Média da turma Convertible (1120 - 29155, n=47, últimos 2 anos) | |
| Microsoft Surface Pro 9, i7-1255U | |
| Microsoft Surface Pro 8, i7-1185G7 | |
| Média Intel Core i7-1255U (3577 - 5095, n=11) | |
| HP Elite Dragonfly Folio 13.5 G3 | |
| Dell XPS 13 9315 2-in-1 Core i5-1230U | |
| Lenovo ThinkPad X12 20UVS03G00 | |
| AIDA64 / FPU Mandel | |
| Média da turma Convertible (4929 - 97193, n=47, últimos 2 anos) | |
| Asus ROG Flow Z13 GZ301ZE | |
| Microsoft Surface Pro 9, i7-1255U | |
| Microsoft Surface Pro 8, i7-1185G7 | |
| HP Elite Dragonfly Folio 13.5 G3 | |
| Média Intel Core i7-1255U (11759 - 20187, n=11) | |
| Dell XPS 13 9315 2-in-1 Core i5-1230U | |
| Lenovo ThinkPad X12 20UVS03G00 | |
| AIDA64 / CPU AES | |
| Asus ROG Flow Z13 GZ301ZE | |
| Lenovo ThinkPad X12 20UVS03G00 | |
| Média da turma Convertible (5271 - 190280, n=47, últimos 2 anos) | |
| Microsoft Surface Pro 9, i7-1255U | |
| Microsoft Surface Pro 8, i7-1185G7 | |
| Média Intel Core i7-1255U (27900 - 67458, n=11) | |
| HP Elite Dragonfly Folio 13.5 G3 | |
| Dell XPS 13 9315 2-in-1 Core i5-1230U | |
| AIDA64 / CPU ZLib | |
| Asus ROG Flow Z13 GZ301ZE | |
| Média da turma Convertible (218 - 2017, n=47, últimos 2 anos) | |
| Microsoft Surface Pro 9, i7-1255U | |
| Média Intel Core i7-1255U (393 - 640, n=11) | |
| HP Elite Dragonfly Folio 13.5 G3 | |
| Dell XPS 13 9315 2-in-1 Core i5-1230U | |
| Microsoft Surface Pro 8, i7-1185G7 | |
| Lenovo ThinkPad X12 20UVS03G00 | |
| AIDA64 / FP64 Ray-Trace | |
| Média da turma Convertible (1169 - 34297, n=47, últimos 2 anos) | |
| Asus ROG Flow Z13 GZ301ZE | |
| Microsoft Surface Pro 9, i7-1255U | |
| Microsoft Surface Pro 8, i7-1185G7 | |
| HP Elite Dragonfly Folio 13.5 G3 | |
| Média Intel Core i7-1255U (2474 - 4400, n=11) | |
| Dell XPS 13 9315 2-in-1 Core i5-1230U | |
| Lenovo ThinkPad X12 20UVS03G00 | |
| AIDA64 / CPU PhotoWorxx | |
| Média da turma Convertible (14193 - 85327, n=47, últimos 2 anos) | |
| Microsoft Surface Pro 9, i7-1255U | |
| Asus ROG Flow Z13 GZ301ZE | |
| HP Elite Dragonfly Folio 13.5 G3 | |
| Microsoft Surface Pro 8, i7-1185G7 | |
| Lenovo ThinkPad X12 20UVS03G00 | |
| Dell XPS 13 9315 2-in-1 Core i5-1230U | |
| Média Intel Core i7-1255U (13899 - 44054, n=11) | |
Desempenho do sistema
O desempenho subjetivo do Surface Pro 9 é muito bom e todas as entradas são implementadas sem atrasos ou pendências. A SSD PCIe é sem dúvida responsável por isso. O desempenho nos benchmarks sintéticos também é muito bom.
CrossMark: Overall | Productivity | Creativity | Responsiveness
Jetstream 2: 2.0 Total
Speedometer 2.0: Result 2.0
WebXPRT 3: Overall
WebXPRT 4: Overall
| PCMark 10 / Score | |
| Média da turma Convertible (3229 - 10123, n=45, últimos 2 anos) | |
| Asus ROG Flow Z13 GZ301ZE | |
| HP Elite Dragonfly Folio 13.5 G3 | |
| Média Intel Core i7-1255U, Intel Iris Xe Graphics G7 96EUs (4676 - 5523, n=9) | |
| Microsoft Surface Pro 9, i7-1255U | |
| Microsoft Surface Pro 8, i7-1185G7 | |
| Dell XPS 13 9315 2-in-1 Core i5-1230U | |
| Lenovo ThinkPad X12 20UVS03G00 | |
| PCMark 10 / Essentials | |
| HP Elite Dragonfly Folio 13.5 G3 | |
| Asus ROG Flow Z13 GZ301ZE | |
| Média da turma Convertible (7233 - 12222, n=45, últimos 2 anos) | |
| Média Intel Core i7-1255U, Intel Iris Xe Graphics G7 96EUs (9381 - 11654, n=9) | |
| Dell XPS 13 9315 2-in-1 Core i5-1230U | |
| Microsoft Surface Pro 9, i7-1255U | |
| Lenovo ThinkPad X12 20UVS03G00 | |
| Microsoft Surface Pro 8, i7-1185G7 | |
| PCMark 10 / Productivity | |
| Média da turma Convertible (5062 - 17914, n=45, últimos 2 anos) | |
| Asus ROG Flow Z13 GZ301ZE | |
| HP Elite Dragonfly Folio 13.5 G3 | |
| Média Intel Core i7-1255U, Intel Iris Xe Graphics G7 96EUs (6530 - 7418, n=9) | |
| Dell XPS 13 9315 2-in-1 Core i5-1230U | |
| Microsoft Surface Pro 9, i7-1255U | |
| Microsoft Surface Pro 8, i7-1185G7 | |
| Lenovo ThinkPad X12 20UVS03G00 | |
| PCMark 10 / Digital Content Creation | |
| Média da turma Convertible (2496 - 16551, n=45, últimos 2 anos) | |
| Asus ROG Flow Z13 GZ301ZE | |
| HP Elite Dragonfly Folio 13.5 G3 | |
| Microsoft Surface Pro 9, i7-1255U | |
| Média Intel Core i7-1255U, Intel Iris Xe Graphics G7 96EUs (4498 - 6203, n=9) | |
| Microsoft Surface Pro 8, i7-1185G7 | |
| Dell XPS 13 9315 2-in-1 Core i5-1230U | |
| Lenovo ThinkPad X12 20UVS03G00 | |
| CrossMark / Overall | |
| Asus ROG Flow Z13 GZ301ZE | |
| HP Elite Dragonfly Folio 13.5 G3 | |
| Média da turma Convertible (524 - 2274, n=48, últimos 2 anos) | |
| Apple iPad Pro 12.9 2022 | |
| Microsoft Surface Pro 9, i7-1255U | |
| Média Intel Core i7-1255U, Intel Iris Xe Graphics G7 96EUs (1329 - 1573, n=9) | |
| Microsoft Surface Pro 8, i7-1185G7 | |
| Dell XPS 13 9315 2-in-1 Core i5-1230U | |
| CrossMark / Productivity | |
| Asus ROG Flow Z13 GZ301ZE | |
| HP Elite Dragonfly Folio 13.5 G3 | |
| Média da turma Convertible (554 - 1942, n=48, últimos 2 anos) | |
| Microsoft Surface Pro 9, i7-1255U | |
| Média Intel Core i7-1255U, Intel Iris Xe Graphics G7 96EUs (1364 - 1554, n=9) | |
| Apple iPad Pro 12.9 2022 | |
| Microsoft Surface Pro 8, i7-1185G7 | |
| Dell XPS 13 9315 2-in-1 Core i5-1230U | |
| CrossMark / Creativity | |
| Asus ROG Flow Z13 GZ301ZE | |
| Apple iPad Pro 12.9 2022 | |
| Média da turma Convertible (550 - 2949, n=48, últimos 2 anos) | |
| HP Elite Dragonfly Folio 13.5 G3 | |
| Microsoft Surface Pro 9, i7-1255U | |
| Média Intel Core i7-1255U, Intel Iris Xe Graphics G7 96EUs (1372 - 1660, n=9) | |
| Microsoft Surface Pro 8, i7-1185G7 | |
| Dell XPS 13 9315 2-in-1 Core i5-1230U | |
| CrossMark / Responsiveness | |
| Asus ROG Flow Z13 GZ301ZE | |
| HP Elite Dragonfly Folio 13.5 G3 | |
| Média da turma Convertible (381 - 1719, n=48, últimos 2 anos) | |
| Microsoft Surface Pro 9, i7-1255U | |
| Média Intel Core i7-1255U, Intel Iris Xe Graphics G7 96EUs (1117 - 1434, n=9) | |
| Dell XPS 13 9315 2-in-1 Core i5-1230U | |
| Apple iPad Pro 12.9 2022 | |
| Microsoft Surface Pro 8, i7-1185G7 | |
| Jetstream 2 / 2.0 Total | |
| Média da turma Convertible (127.2 - 454, n=15, últimos 2 anos) | |
| Microsoft Surface Pro 9, i7-1255U | |
| Média Intel Core i7-1255U, Intel Iris Xe Graphics G7 96EUs (206 - 249, n=7) | |
| Dell XPS 13 9315 2-in-1 Core i5-1230U | |
| Apple iPad Pro 12.9 2022 | |
| Asus ROG Flow Z13 GZ301ZE | |
| Microsoft Surface Pro 8, i7-1185G7 | |
| Lenovo ThinkPad X12 20UVS03G00 | |
| Speedometer 2.0 / Result 2.0 | |
| Média da turma Convertible (168.2 - 644, n=12, últimos 2 anos) | |
| Apple iPad Pro 12.9 2022 | |
| Média Intel Core i7-1255U, Intel Iris Xe Graphics G7 96EUs (222 - 299, n=5) | |
| Microsoft Surface Pro 9, i7-1255U | |
| Microsoft Surface Pro 8, i7-1185G7 | |
| Asus ROG Flow Z13 GZ301ZE | |
| WebXPRT 3 / Overall | |
| Apple iPad Pro 12.9 2022 | |
| Asus ROG Flow Z13 GZ301ZE | |
| Média da turma Convertible (171 - 426, n=48, últimos 2 anos) | |
| HP Elite Dragonfly Folio 13.5 G3 | |
| Média Intel Core i7-1255U, Intel Iris Xe Graphics G7 96EUs (200 - 366, n=9) | |
| Microsoft Surface Pro 9, i7-1255U | |
| Microsoft Surface Pro 8, i7-1185G7 | |
| Dell XPS 13 9315 2-in-1 Core i5-1230U | |
| Lenovo ThinkPad X12 20UVS03G00 | |
| WebXPRT 4 / Overall | |
| Média da turma Convertible (91.2 - 317, n=47, últimos 2 anos) | |
| HP Elite Dragonfly Folio 13.5 G3 | |
| Média Intel Core i7-1255U, Intel Iris Xe Graphics G7 96EUs (183.4 - 249, n=9) | |
| Microsoft Surface Pro 9, i7-1255U | |
| Apple iPad Pro 12.9 2022 | |
| Dell XPS 13 9315 2-in-1 Core i5-1230U | |
| PCMark 10 Score | 5257 pontos | |
Ajuda | ||
| AIDA64 / Memory Copy | |
| Média da turma Convertible (23880 - 161475, n=47, últimos 2 anos) | |
| Asus ROG Flow Z13 GZ301ZE | |
| Microsoft Surface Pro 9, i7-1255U | |
| HP Elite Dragonfly Folio 13.5 G3 | |
| Dell XPS 13 9315 2-in-1 Core i5-1230U | |
| Microsoft Surface Pro 8, i7-1185G7 | |
| Lenovo ThinkPad X12 20UVS03G00 | |
| Média Intel Core i7-1255U (22846 - 67017, n=11) | |
| AIDA64 / Memory Read | |
| Média da turma Convertible (19931 - 131960, n=47, últimos 2 anos) | |
| Asus ROG Flow Z13 GZ301ZE | |
| HP Elite Dragonfly Folio 13.5 G3 | |
| Microsoft Surface Pro 9, i7-1255U | |
| Microsoft Surface Pro 8, i7-1185G7 | |
| Lenovo ThinkPad X12 20UVS03G00 | |
| Dell XPS 13 9315 2-in-1 Core i5-1230U | |
| Média Intel Core i7-1255U (22877 - 67398, n=11) | |
| AIDA64 / Memory Write | |
| Média da turma Convertible (17473 - 216896, n=47, últimos 2 anos) | |
| HP Elite Dragonfly Folio 13.5 G3 | |
| Dell XPS 13 9315 2-in-1 Core i5-1230U | |
| Asus ROG Flow Z13 GZ301ZE | |
| Microsoft Surface Pro 9, i7-1255U | |
| Lenovo ThinkPad X12 20UVS03G00 | |
| Microsoft Surface Pro 8, i7-1185G7 | |
| Média Intel Core i7-1255U (22883 - 65839, n=11) | |
| AIDA64 / Memory Latency | |
| Média da turma Convertible (6.9 - 536, n=47, últimos 2 anos) | |
| HP Elite Dragonfly Folio 13.5 G3 | |
| Asus ROG Flow Z13 GZ301ZE | |
| Dell XPS 13 9315 2-in-1 Core i5-1230U | |
| Microsoft Surface Pro 9, i7-1255U | |
| Microsoft Surface Pro 8, i7-1185G7 | |
| Lenovo ThinkPad X12 20UVS03G00 | |
| Média Intel Core i7-1255U (76 - 163.2, n=11) | |
* ... menor é melhor
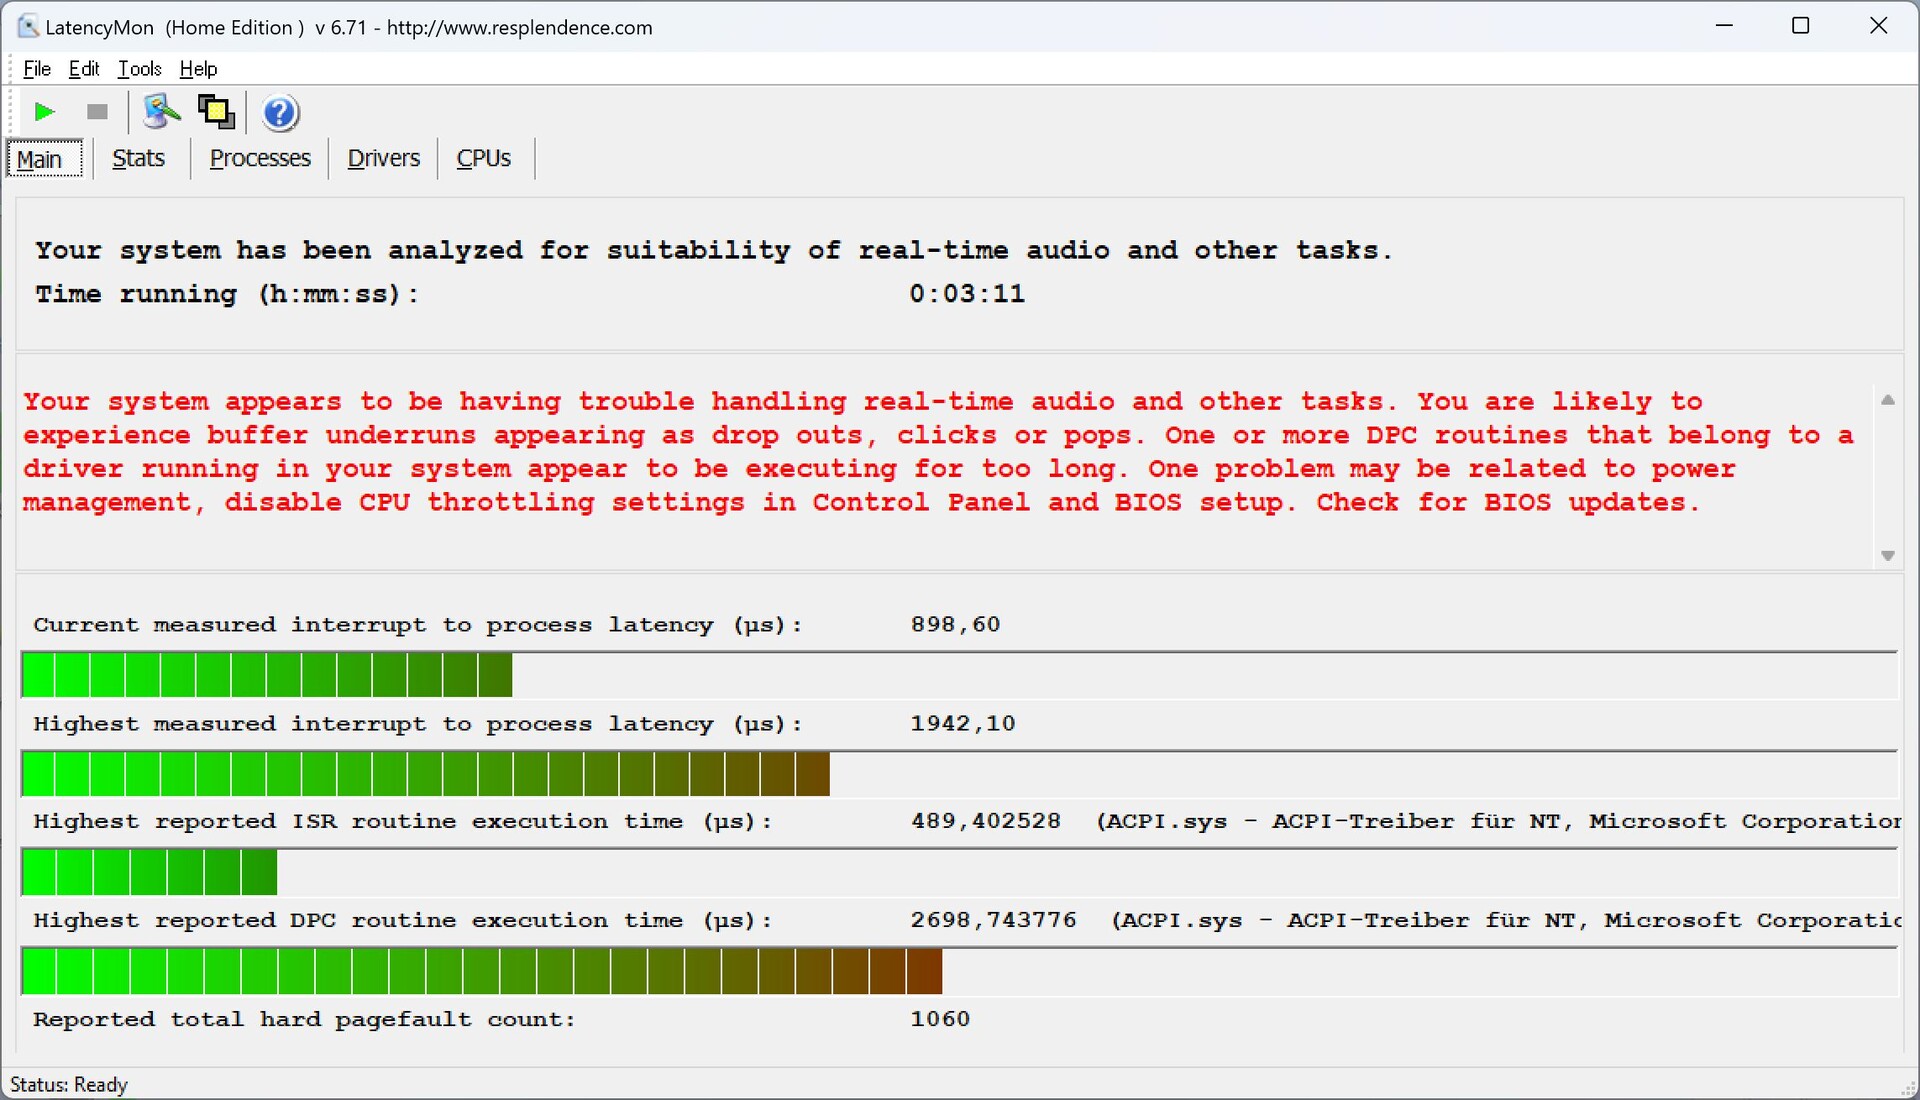
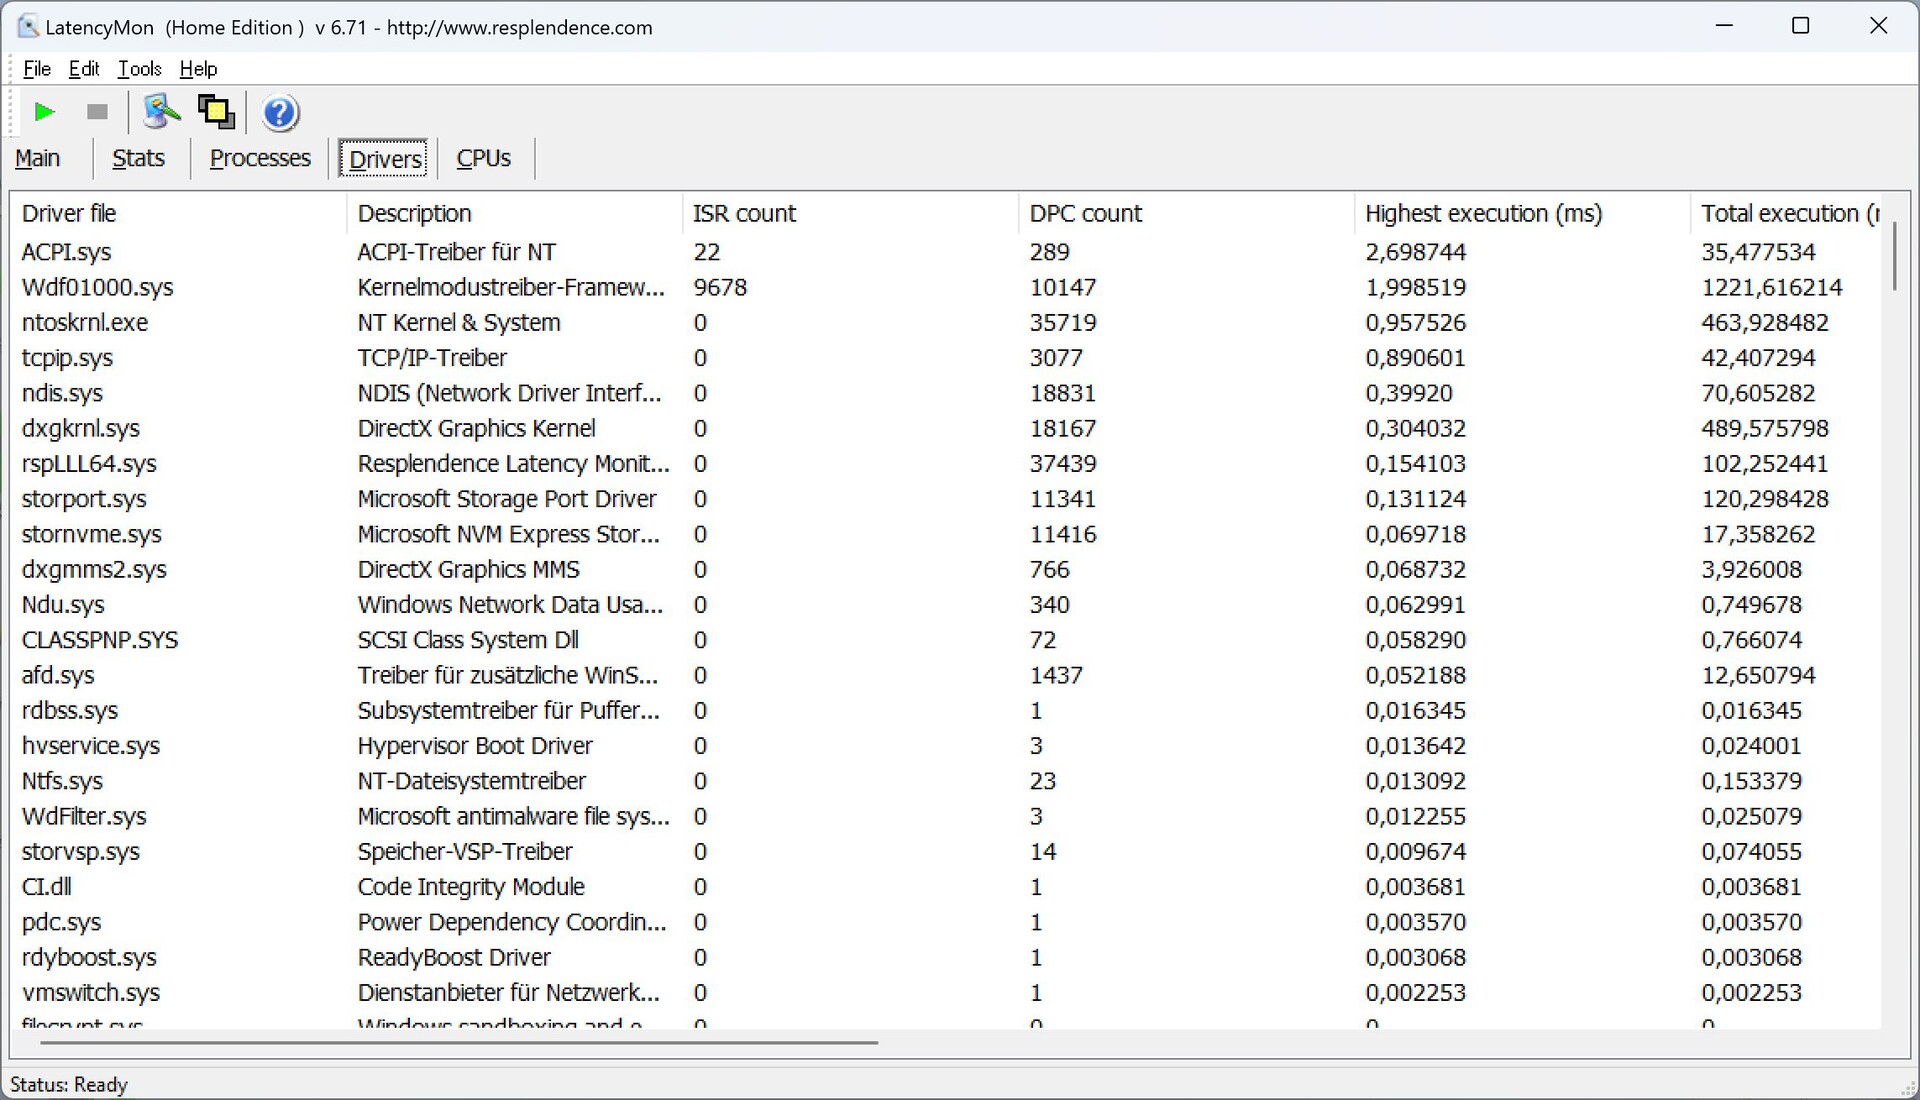
Latência do DPC
Em nosso teste de latência padronizado (navegação na web, reprodução YouTube 4K, carga de CPU), o novo Surface Pro 9 com sua versão atual da BIOS tem um desempenho pior que seupredecessore, portanto, só é condicionalmente adequado para aplicações de áudio em tempo real.
| DPC Latencies / LatencyMon - interrupt to process latency (max), Web, Youtube, Prime95 | |
| HP Elite Dragonfly Folio 13.5 G3 | |
| Dell XPS 13 9315 2-in-1 Core i5-1230U | |
| Microsoft Surface Pro 9, i7-1255U | |
| Asus ROG Flow Z13 GZ301ZE | |
| Microsoft Surface Pro 8, i7-1185G7 | |
| Lenovo ThinkPad X12 20UVS03G00 | |
* ... menor é melhor
Dispositivos de armazenamento
A Microsoft ainda usa SSDs M.2-2230 compactos e os dispositivos também podem ser substituídos pelo usuário. Um drive de 512 GB da Samsung é usado em nossa amostra de revisão, que, segundo a Microsoft Tools, parece estar conectado via PCIe 4.0. Entretanto, as taxas máximas de transferência são limitadas a cerca de 3,4 GB/s e não sabemos exatamente se o SSD ou o Surface Pro é a causa aqui. Então, novamente, isto não desempenha um papel importante no uso diário e a velocidade é perfeitamente suficiente. Dos 512 GB, 429 GB ainda estão disponíveis após a instalação do sistema operacional. Mais referências de SSD estão listadas emnossa seção técnica.

* ... menor é melhor
Dauerleistung Lesen: DiskSpd Read Loop, Queue Depth 8
Placa Gráfica
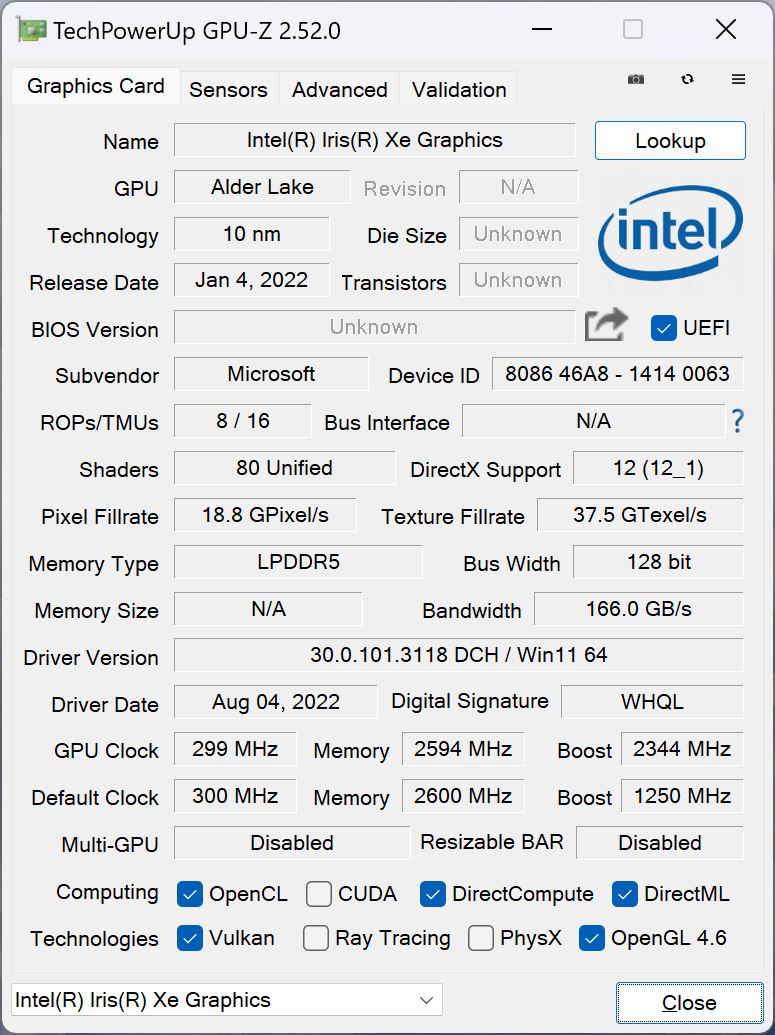
As CPUs Alder Lake da Intel ainda estão equipadas com as conhecidasG7 Iris Xe Graphics. Em conjunto com o Core i5 1235U, é utilizado o chip com 80 unidades de execução; em nossa amostra de revisão com o Core i7, temos o chip mais rápido com 96 EUs. Em termos de desempenho, não há diferenças em relação ao modelo antigo e as GPUs integradas da AMD e Apple são significativamente mais rápidas (embora não existam praticamente conversíveis/computadores comparáveis com o hardware da AMD no momento).
O desempenho é perfeitamente suficiente para o uso diário e vídeos de alta resolução também rodam sem problemas, mas os jogos são normalmente limitados a detalhes mínimos ou médios e resoluções reduzidas. Aqueles que gostam de jogos podem conectar uma GPU externa ou devem dar uma olhada noFluxo ROG Z13que oferece mais desempenho em jogos com seu RTX 3050.
Pelo menos o desempenho da GPU permanece estável durante longas sessões de jogo. Com a bateria, no entanto, a performance cai em cerca de 75%. Mais pontos de referência de GPU estão disponíveisaqui.
| 3DMark 11 Performance | 6903 pontos | |
| 3DMark Fire Strike Score | 4873 pontos | |
| 3DMark Time Spy Score | 1821 pontos | |
Ajuda | ||
* ... menor é melhor
| The Witcher 3 - 1920x1080 Ultra Graphics & Postprocessing (HBAO+) | |
| Média da turma Convertible (13.4 - 101, n=3, últimos 2 anos) | |
| Asus ROG Flow Z13 GZ301ZE | |
| Microsoft Surface Pro 8, i7-1185G7 | |
| HP Elite Dragonfly Folio 13.5 G3 | |
| Microsoft Surface Pro 9, i7-1255U | |
| Dell XPS 13 9315 2-in-1 Core i5-1230U | |
| Final Fantasy XV Benchmark - 1920x1080 High Quality | |
| Asus ROG Flow Z13 GZ301ZE | |
| Média da turma Convertible (4.48 - 86.6, n=44, últimos 2 anos) | |
| Microsoft Surface Pro 8, i7-1185G7 | |
| Microsoft Surface Pro 9, i7-1255U | |
| HP Elite Dragonfly Folio 13.5 G3 | |
| Strange Brigade - 1920x1080 ultra AA:ultra AF:16 | |
| Asus ROG Flow Z13 GZ301ZE | |
| Média da turma Convertible (10.8 - 176.8, n=44, últimos 2 anos) | |
| Microsoft Surface Pro 8, i7-1185G7 | |
| Microsoft Surface Pro 9, i7-1255U | |
| HP Elite Dragonfly Folio 13.5 G3 | |
Witcher 3 FPS Chart
| baixo | média | alto | ultra | |
|---|---|---|---|---|
| GTA V (2015) | 104.3 | 93.1 | 24.7 | 10.6 |
| The Witcher 3 (2015) | 91 | 59 | 33 | 12.8 |
| Dota 2 Reborn (2015) | 104.2 | 82.2 | 64.8 | 57 |
| Final Fantasy XV Benchmark (2018) | 42.9 | 24.2 | 16.8 | |
| X-Plane 11.11 (2018) | 46.3 | 36.6 | 31.6 | |
| Far Cry 5 (2018) | 28 | 24 | 20 | |
| Strange Brigade (2018) | 88.9 | 41.7 | 32.5 | 26.2 |
| F1 2021 (2021) | 107.8 | 51.6 | 40.6 | 27.8 |
| Farming Simulator 22 (2021) | 81 | 37 | 28 | 26 |
| F1 22 (2022) | 47.4 | 43.5 | 30.7 |
Emissões - CPU mais rápida leva a mais atividade dos ventiladores
Ruído
O ventilador do Surface Pro 9 é comparável ao antigo Surface Pro 8 na velocidade máxima e atinge quase 42 dB(A) em carga máxima. O pequeno ventilador é claramente audível, mas mais problemático é o fato de que o ventilador entra em ação com mais freqüência no uso diário devido aos altos limites de potência. Portanto, você deve selecionar um modo de energia mais fraca para tarefas simples, então o conversível permanece silencioso por mais tempo em uso comum. Não foram detectados outros ruídos eletrônicos. Tanto o XPS 13 9315 e o iPad Protêm uma clara vantagem aqui, é claro, pois são resfriados passivamente e assim permanecem em silêncio.
Barulho
| Ocioso |
| 24.3 / 24.3 / 24.3 dB |
| Carga |
| 37.9 / 41.8 dB |
 | ||
30 dB silencioso 40 dB(A) audível 50 dB(A) ruidosamente alto |
||
min: | ||
| Microsoft Surface Pro 9, i7-1255U Iris Xe G7 96EUs, i7-1255U, Samsung MZ9L4512HBLU-00BMV | Dell XPS 13 9315 2-in-1 Core i5-1230U Iris Xe G7 80EUs, i5-1230U | Lenovo ThinkPad X12 20UVS03G00 Iris Xe G7 96EUs, i7-1160G7, Toshiba BG4 KBG40ZNT512G | HP Elite Dragonfly Folio 13.5 G3 Iris Xe G7 96EUs, i7-1265U, Samsung PM9A1 MZVL2512HCJQ | Apple iPad Pro 12.9 2022 M2 10-Core GPU, M2, 128 GB NVMe | Asus ROG Flow Z13 GZ301ZE GeForce RTX 3050 Ti Laptop GPU, i9-12900H, Micron 2450 1TB MTFDKBK1T0TFK | Microsoft Surface Pro 8, i7-1185G7 Iris Xe G7 96EUs, i7-1185G7, Toshiba KBG40ZNS256G NVMe | |
|---|---|---|---|---|---|---|---|
| Noise | 2% | 8% | -2% | -0% | |||
| desligado / ambiente * (dB) | 24.3 | 25.1 -3% | 24.6 -1% | 24.5 -1% | 24.7 -2% | ||
| Idle Minimum * (dB) | 24.3 | 25.1 -3% | 24.6 -1% | 24.5 -1% | 24.7 -2% | ||
| Idle Average * (dB) | 24.3 | 25.1 -3% | 24.6 -1% | 24.5 -1% | 24.7 -2% | ||
| Idle Maximum * (dB) | 24.3 | 26 -7% | 24.6 -1% | 24.5 -1% | 24.7 -2% | ||
| Load Average * (dB) | 37.9 | 34.6 9% | 27.8 27% | 41 -8% | 36.8 3% | ||
| Witcher 3 ultra * (dB) | 39.6 | 34.6 13% | 33.4 16% | 41 -4% | 36.8 7% | ||
| Load Maximum * (dB) | 41.8 | 37 11% | 33.4 20% | 41 2% | 43.8 -5% |
* ... menor é melhor
Temperatura
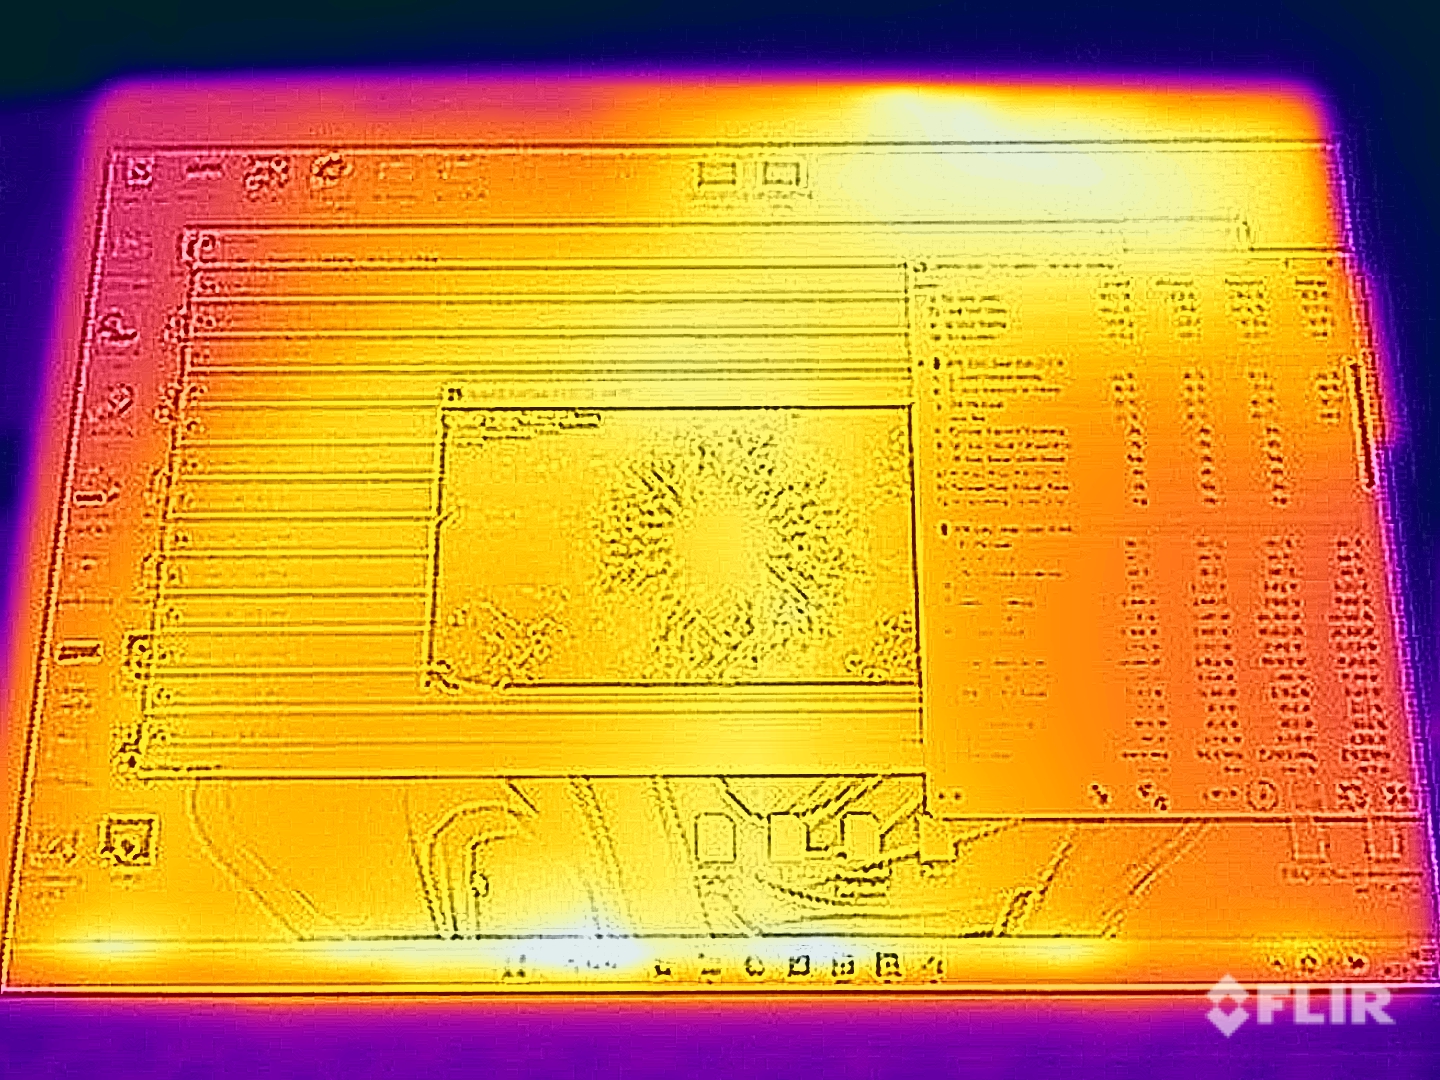
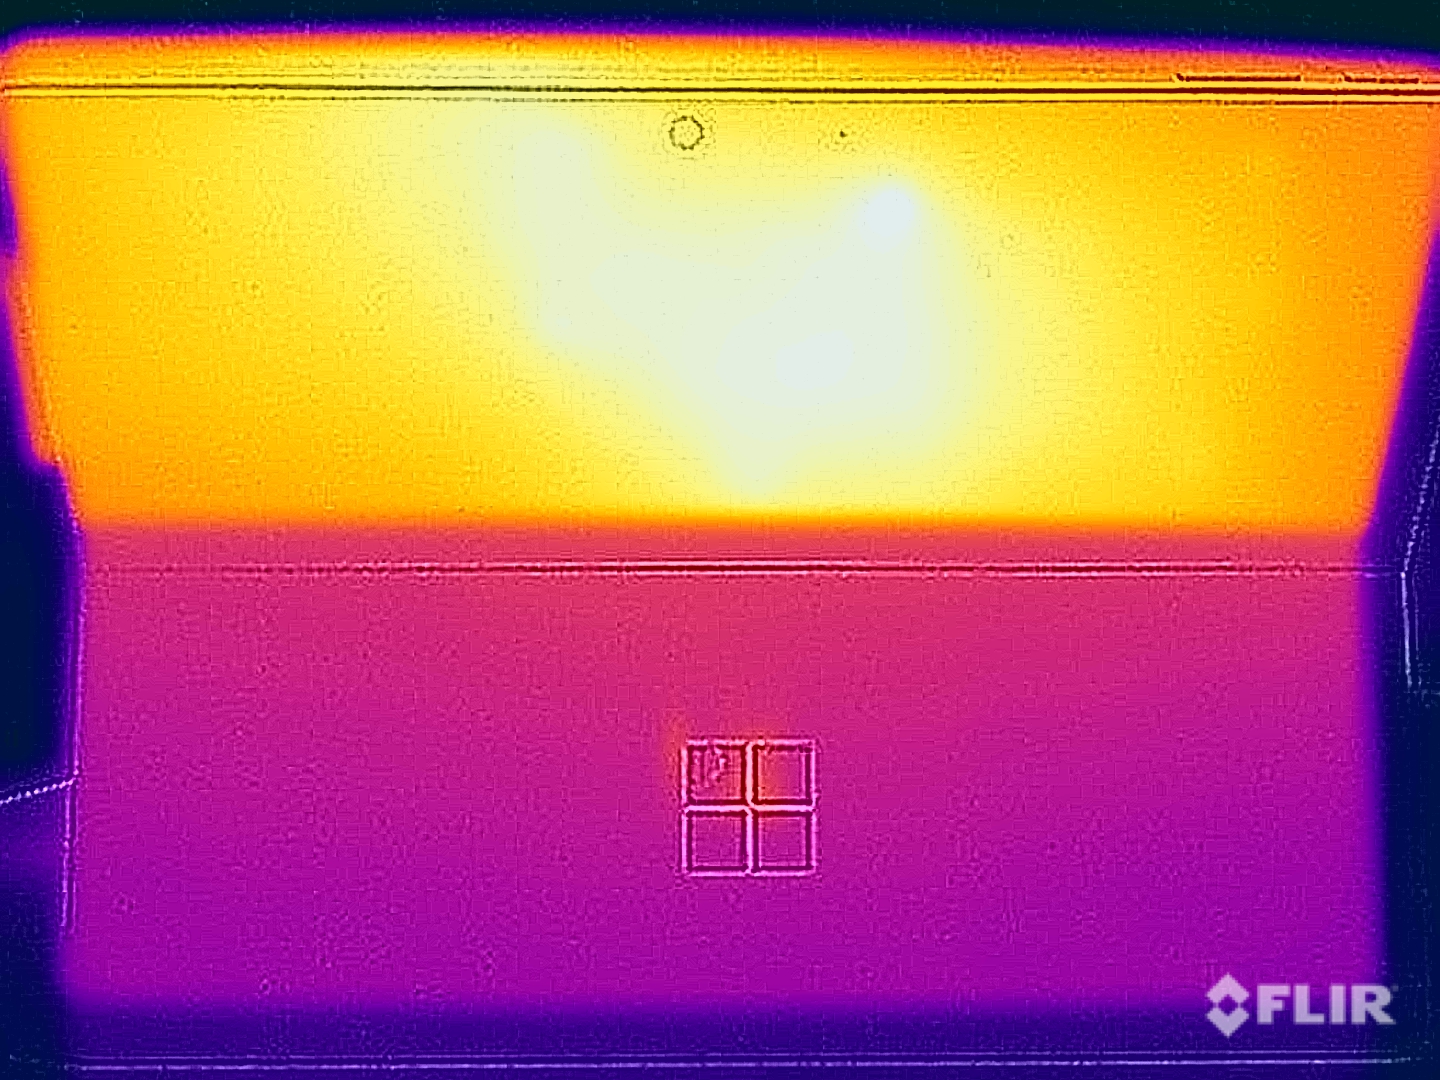
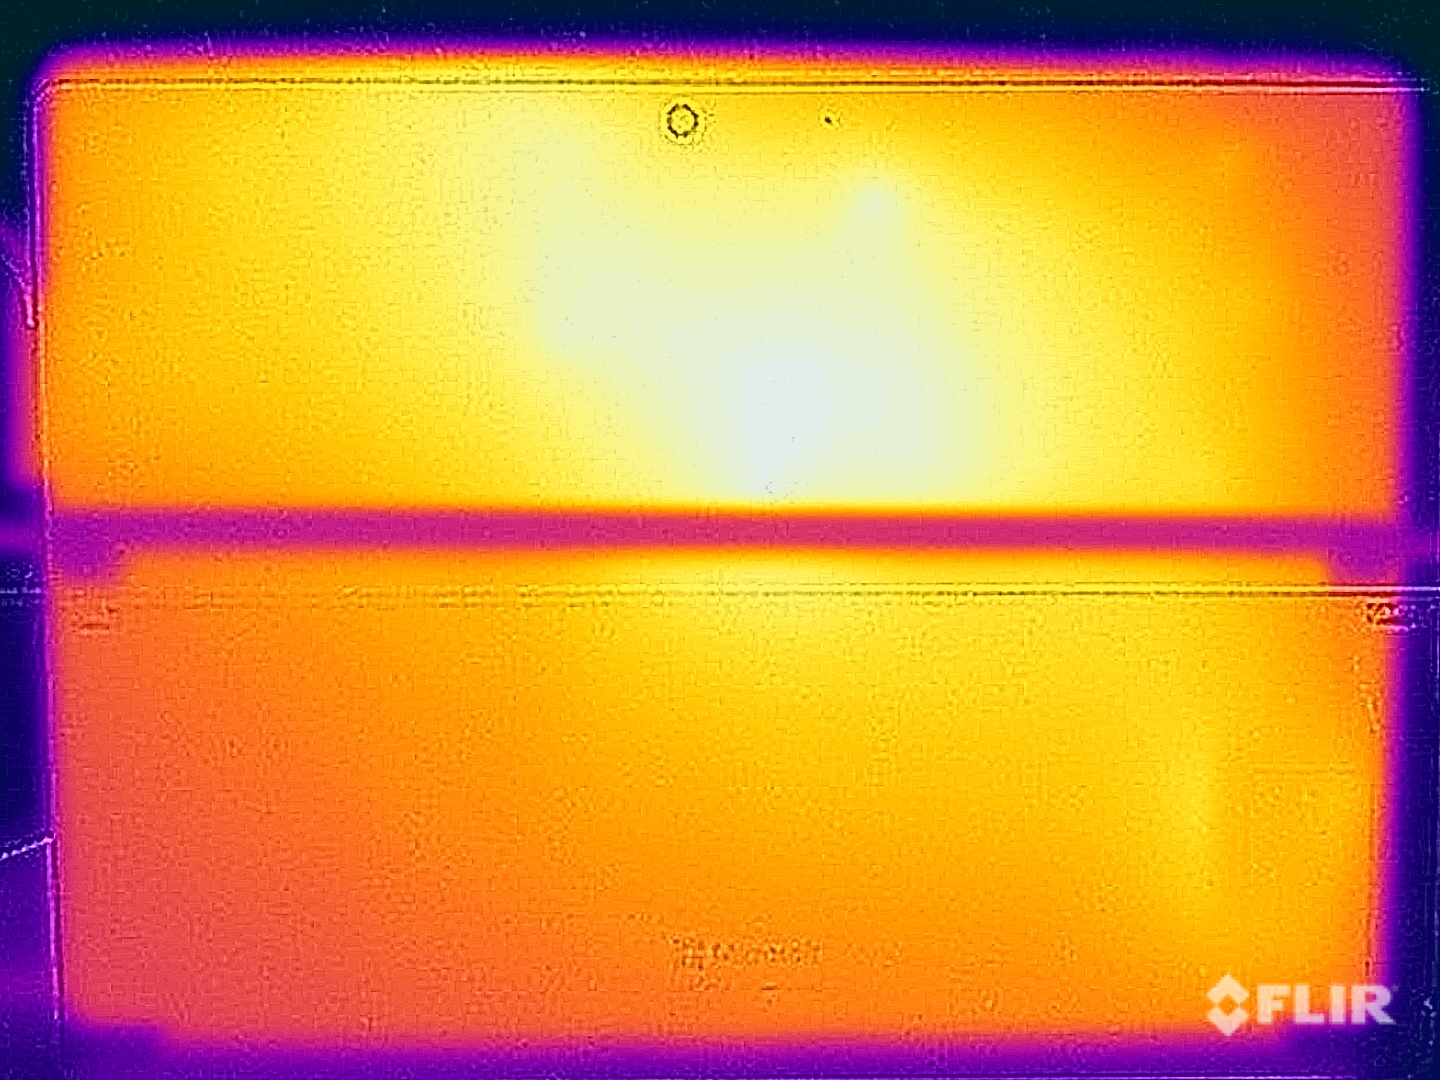
A caixa metálica do Surface Pro 9 quase não aquece no uso diário e durante tarefas leves, mas medimos mais de 45 °C na parte de trás sob carga alta (por exemplo, carga alta de CPU ou quando jogando). Devido à superfície de metal, isto parece desagradável e você não deve segurar o dispositivo em suas mãos em tais situações, mas sim colocá-lo sobre suas coxas ou sobre uma mesa.
O teste de estresse mostra o mesmo comportamento que em carga de CPU pura. Após atingir o pico de 60 watts, o processador permanece a 35 watts por alguns minutos antes de assentar a 22 watts. É interessante notar aqui que a Microsoft até ultrapassa o consumo máximo de 55 watts especificado (pela Intel) para a CPU Alder Lake-U.
(±) A temperatura máxima no lado superior é 44.6 °C / 112 F, em comparação com a média de 35.4 °C / 96 F , variando de 19.6 a 60 °C para a classe Convertible.
(-) A parte inferior aquece até um máximo de 45.9 °C / 115 F, em comparação com a média de 36.9 °C / 98 F
(+) Em uso inativo, a temperatura média para o lado superior é 24.6 °C / 76 F, em comparação com a média do dispositivo de 30.3 °C / ### class_avg_f### F.
(-) Jogando The Witcher 3, a temperatura média para o lado superior é 41.5 °C / 107 F, em comparação com a média do dispositivo de 30.3 °C / ## #class_avg_f### F.
(-) Os apoios para as mãos e o touchpad podem ficar muito quentes ao toque, com um máximo de 42.6 °C / 108.7 F.
(-) A temperatura média da área do apoio para as mãos de dispositivos semelhantes foi 28 °C / 82.4 F (-14.6 °C / -26.3 F).
| Microsoft Surface Pro 9, i7-1255U Intel Core i7-1255U, Intel Iris Xe Graphics G7 96EUs | Dell XPS 13 9315 2-in-1 Core i5-1230U Intel Core i5-1230U, Intel Iris Xe Graphics G7 80EUs | Lenovo ThinkPad X12 20UVS03G00 Intel Core i7-1160G7, Intel Iris Xe Graphics G7 96EUs | HP Elite Dragonfly Folio 13.5 G3 Intel Core i7-1265U, Intel Iris Xe Graphics G7 96EUs | Apple iPad Pro 12.9 2022 Apple M2, Apple M2 10-Core GPU | Asus ROG Flow Z13 GZ301ZE Intel Core i9-12900H, NVIDIA GeForce RTX 3050 Ti Laptop GPU | Microsoft Surface Pro 8, i7-1185G7 Intel Core i7-1185G7, Intel Iris Xe Graphics G7 96EUs | |
|---|---|---|---|---|---|---|---|
| Heat | 1% | 5% | 14% | -3% | -11% | 2% | |
| Maximum Upper Side * (°C) | 44.6 | 41.8 6% | 39 13% | 32.8 26% | 36.9 17% | 45.3 -2% | 45 -1% |
| Maximum Bottom * (°C) | 45.9 | 38.2 17% | 41.7 9% | 33.4 27% | 37.6 18% | 48.3 -5% | 47.2 -3% |
| Idle Upper Side * (°C) | 24.8 | 27.4 -10% | 25.6 -3% | 24.6 1% | 31.9 -29% | 29.2 -18% | 24.1 3% |
| Idle Bottom * (°C) | 25.3 | 27.2 -8% | 25.6 -1% | 24.6 3% | 29.4 -16% | 30 -19% | 23.4 8% |
* ... menor é melhor
Oradores
Os dois alto-falantes estéreo (2 watts) ainda são muito bons e soam bastante volumosos. Entretanto, não se deve esperar muito em termos de graves, o que geralmente é verdade para esta categoria de dispositivos (por exemplo, também para os alto-falantes doiPad Pro).
Microsoft Surface Pro 9, i7-1255U análise de áudio
(±) | o volume do alto-falante é médio, mas bom (###valor### dB)
Graves 100 - 315Hz
(±) | graves reduzidos - em média 11.7% menor que a mediana
(±) | a linearidade dos graves é média (8.8% delta para a frequência anterior)
Médios 400 - 2.000 Hz
(±) | médios mais altos - em média 5.1% maior que a mediana
(+) | médios são lineares (3% delta para frequência anterior)
Altos 2 - 16 kHz
(+) | agudos equilibrados - apenas 4% longe da mediana
(+) | os máximos são lineares (3.4% delta da frequência anterior)
Geral 100 - 16.000 Hz
(+) | o som geral é linear (14.9% diferença em relação à mediana)
Comparado com a mesma classe
» 24% de todos os dispositivos testados nesta classe foram melhores, 5% semelhantes, 72% piores
» O melhor teve um delta de 6%, a média foi 20%, o pior foi 57%
Comparado com todos os dispositivos testados
» 20% de todos os dispositivos testados foram melhores, 4% semelhantes, 76% piores
» O melhor teve um delta de 4%, a média foi 23%, o pior foi 134%
Apple iPad Pro 12.9 2022 análise de áudio
(+) | os alto-falantes podem tocar relativamente alto (###valor### dB)
Graves 100 - 315Hz
(±) | graves reduzidos - em média 9.6% menor que a mediana
(±) | a linearidade dos graves é média (9% delta para a frequência anterior)
Médios 400 - 2.000 Hz
(+) | médios equilibrados - apenas 2.4% longe da mediana
(+) | médios são lineares (3.4% delta para frequência anterior)
Altos 2 - 16 kHz
(+) | agudos equilibrados - apenas 1.5% longe da mediana
(+) | os máximos são lineares (3.2% delta da frequência anterior)
Geral 100 - 16.000 Hz
(+) | o som geral é linear (8.8% diferença em relação à mediana)
Comparado com a mesma classe
» 2% de todos os dispositivos testados nesta classe foram melhores, 2% semelhantes, 96% piores
» O melhor teve um delta de 7%, a média foi 20%, o pior foi 129%
Comparado com todos os dispositivos testados
» 3% de todos os dispositivos testados foram melhores, 1% semelhantes, 97% piores
» O melhor teve um delta de 4%, a média foi 23%, o pior foi 134%
Dell XPS 13 9315 2-in-1 Core i5-1230U análise de áudio
(±) | o volume do alto-falante é médio, mas bom (###valor### dB)
Graves 100 - 315Hz
(±) | graves reduzidos - em média 8.9% menor que a mediana
(+) | o baixo é linear (5.7% delta para a frequência anterior)
Médios 400 - 2.000 Hz
(+) | médios equilibrados - apenas 2.2% longe da mediana
(+) | médios são lineares (5.2% delta para frequência anterior)
Altos 2 - 16 kHz
(±) | máximos mais altos - em média 5.5% maior que a mediana
(+) | os máximos são lineares (6.8% delta da frequência anterior)
Geral 100 - 16.000 Hz
(+) | o som geral é linear (11.9% diferença em relação à mediana)
Comparado com a mesma classe
» 11% de todos os dispositivos testados nesta classe foram melhores, 3% semelhantes, 85% piores
» O melhor teve um delta de 6%, a média foi 20%, o pior foi 57%
Comparado com todos os dispositivos testados
» 9% de todos os dispositivos testados foram melhores, 2% semelhantes, 89% piores
» O melhor teve um delta de 4%, a média foi 23%, o pior foi 134%
Gerenciamento de energia - 120 Hz custa a vida útil da bateria
Consumo de energia
Também realizamos as medições de potência no modo 60 Hz, mas os valores ociosos de 5,1 a 11,3 watts são ligeiramente mais altos do que no modelo antigo. Os valores são semelhantes sob carga, mas os altos limites de potência do processador se tornam perceptíveis sob carga total, pois atingimos o limite de alimentação de 68 watts nos primeiros ~30 segundos. Aqui, o dispositivo tem que bater brevemente na bateria para fornecer a energia necessária. Em seguida, os níveis de consumo desligam-se em valores mais baixos (primeiro ~58 e depois ~46 watts), de modo que a fonte de alimentação de 60 watts ainda é suficiente na prática.
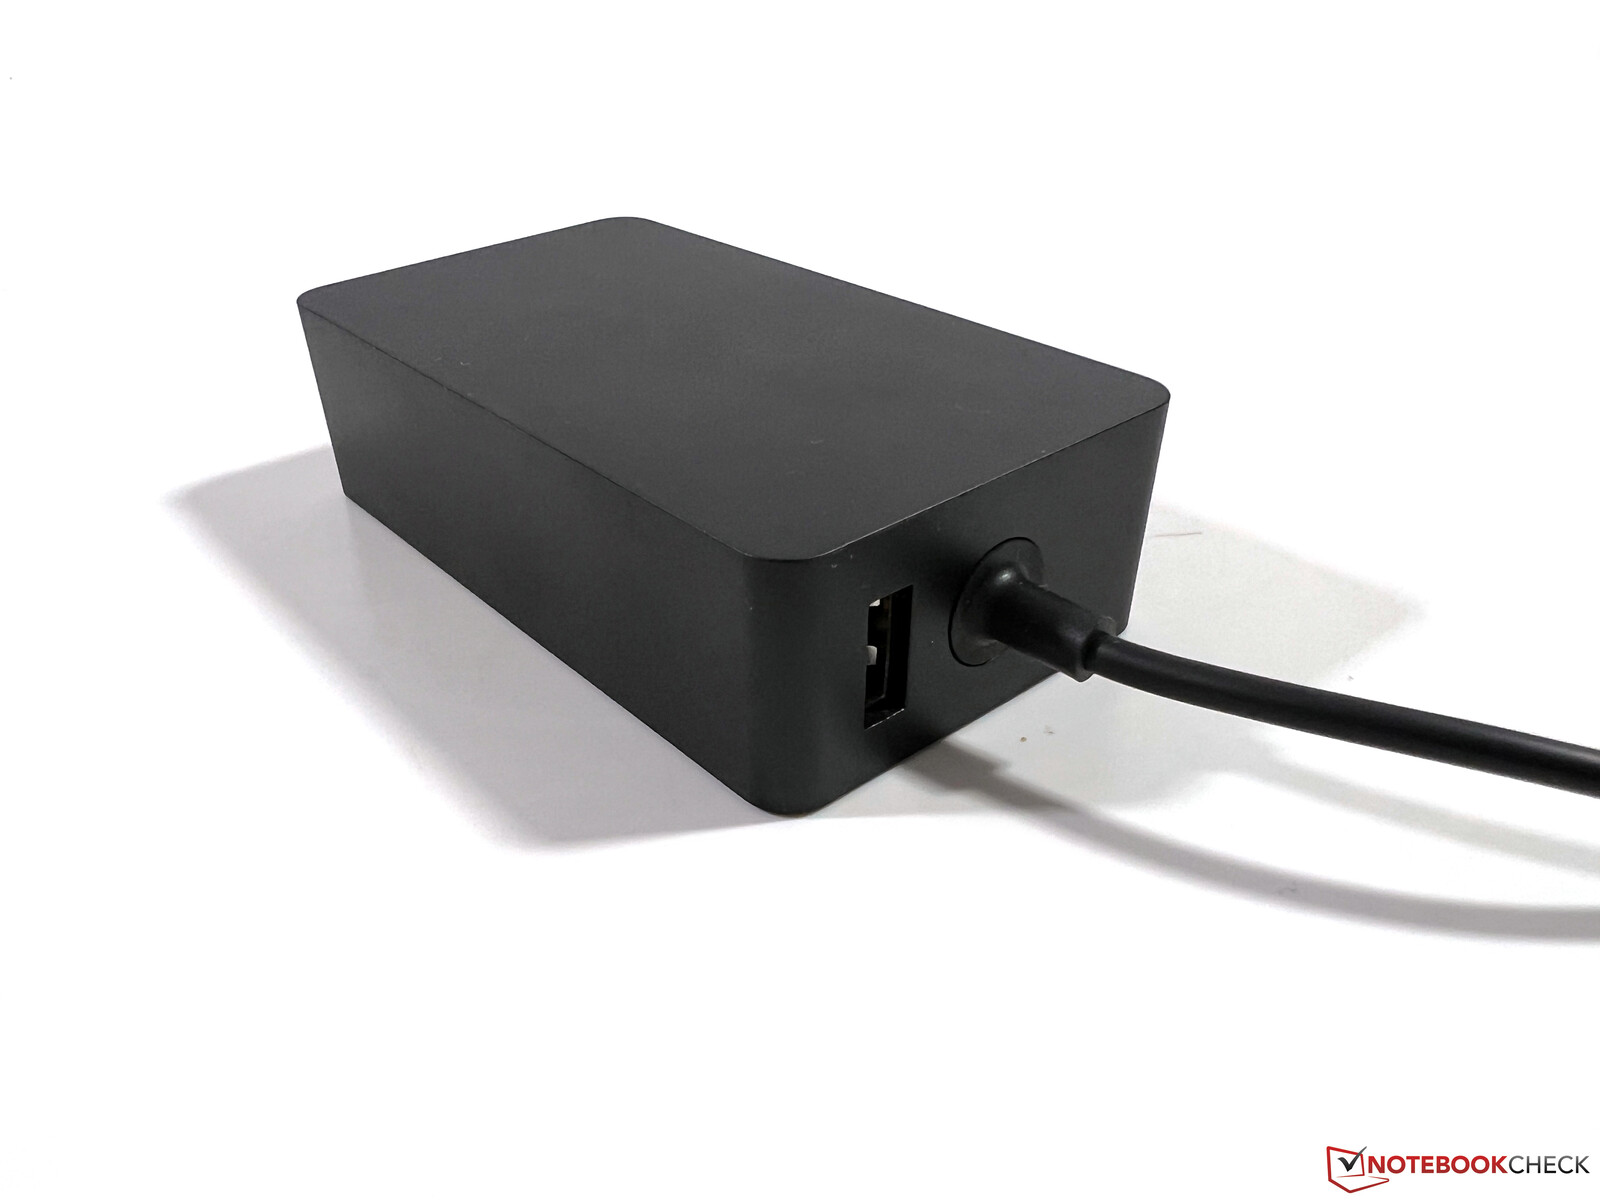
A Microsoft foi capaz de reduzir o consumo de energia quando desligada e em standby. A fonte de alimentação também oferece uma porta USB-A, que pode ser usada para carregar um smartphone, por exemplo (máx. 5 watts).
| desligado | |
| Ocioso | |
| Carga |
|
Key:
min: | |
| Microsoft Surface Pro 9, i7-1255U i7-1255U, Iris Xe G7 96EUs, Samsung MZ9L4512HBLU-00BMV, IPS, 2880x1920, 13" | Dell XPS 13 9315 2-in-1 Core i5-1230U i5-1230U, Iris Xe G7 80EUs, , IPS, 2880x1920, 13" | Lenovo ThinkPad X12 20UVS03G00 i7-1160G7, Iris Xe G7 96EUs, Toshiba BG4 KBG40ZNT512G, a-Si IPS LED, 1920x1280, 12.3" | HP Elite Dragonfly Folio 13.5 G3 i7-1265U, Iris Xe G7 96EUs, Samsung PM9A1 MZVL2512HCJQ, IPS, 1920x1280, 13.5" | Apple iPad Pro 12.9 2022 M2, M2 10-Core GPU, 128 GB NVMe, Mini-LED, 2732x2048, 12.9" | Asus ROG Flow Z13 GZ301ZE i9-12900H, GeForce RTX 3050 Ti Laptop GPU, Micron 2450 1TB MTFDKBK1T0TFK, IPS, 1920x1200, 13.4" | Microsoft Surface Pro 8, i7-1185G7 i7-1185G7, Iris Xe G7 96EUs, Toshiba KBG40ZNS256G NVMe, IPS, 2880x1920, 13" | Média Intel Iris Xe Graphics G7 96EUs | Média da turma Convertible | |
|---|---|---|---|---|---|---|---|---|---|
| Power Consumption | 22% | 26% | 19% | 36% | -54% | 7% | 3% | 16% | |
| Idle Minimum * (Watt) | 5.1 | 5.2 -2% | 4 22% | 3.4 33% | 2.54 50% | 8.8 -73% | 3.9 24% | 5.51 ? -8% | 4.2 ? 18% |
| Idle Average * (Watt) | 9.8 | 7.9 19% | 5.9 40% | 4.9 50% | 11.24 -15% | 12.1 -23% | 8.5 13% | 8.66 ? 12% | 6.89 ? 30% |
| Idle Maximum * (Watt) | 11.3 | 8 29% | 8.3 27% | 9.3 18% | 11.48 -2% | 12.7 -12% | 9.8 13% | 10.9 ? 4% | 8.63 ? 24% |
| Load Average * (Watt) | 47.5 | 31.2 34% | 30.1 37% | 41.9 12% | 12.97 73% | 72.3 -52% | 48 -1% | 45.6 ? 4% | 44.1 ? 7% |
| Witcher 3 ultra * (Watt) | 36 | 28.2 22% | 30.8 14% | 36.4 -1% | 77.3 -115% | 41.5 -15% | |||
| Load Maximum * (Watt) | 68.5 | 47.6 31% | 59 14% | 67.5 1% | 16.6 76% | 103.1 -51% | 63 8% | 67.8 ? 1% | 66.5 ? 3% |
* ... menor é melhor
Power Consumption Witcher 3 / Stress Test
Power Consumption with an External Monitor
Vida útil da bateria
A Microsoft reduziu a capacidade da bateria de 51,5 para 47,7 Wh, mas em geral os tempos de execução são muito similares aos antigos Superfície Pro 8com um brilho de 150 cd/m² (correspondente a 62% do brilho máximo no dispositivo de revisão). No teste de vídeo, foram possíveis quase 9,5 horas, e 7,5 horas para o teste Wi-Fi. Nosso teste Wi-Fi funciona por pouco mais de 5 horas no brilho máximo.
Assim que você muda para o modo 120 Hz, o tempo de execução cai novamente notavelmente. Listamos os valores para os três cenários na tabela abaixo. Portanto, você deve evitar o modo de 120 Hz quando estiver em viagem.
| Teste WLAN brilho máximo | Teste WLAN 150 cd/m² | Teste de vídeo | |
|---|---|---|---|
| 60 Hz | 314 minutos | 451 minutos | 562 minutos |
| 120 Hz | 274 minutos | 369 minutos | 529 minutos |
Em comparação com seus concorrentes, o Surface Pro 9 só está à frente doAsus ROG Flow Z13 conversível para jogos, mas todos os outros concorrentes oferecem mais resistência. Uma carga completa leva cerca de 2 horas com o dispositivo ligado, sendo que 35% está disponível após 21 minutos e 80% após cerca de 63 minutos.
Nota: A vida útil da bateria da Microsoft é significativamente maior com até 15,5 horas de uso típico, mas também inclui tempos em modo de espera.
| Microsoft Surface Pro 9, i7-1255U i7-1255U, Iris Xe G7 96EUs, 47.7 Wh | Dell XPS 13 9315 2-in-1 Core i5-1230U i5-1230U, Iris Xe G7 80EUs, 49.5 Wh | Lenovo ThinkPad X12 20UVS03G00 i7-1160G7, Iris Xe G7 96EUs, 42 Wh | HP Elite Dragonfly Folio 13.5 G3 i7-1265U, Iris Xe G7 96EUs, 53 Wh | Apple iPad Pro 12.9 2022 M2, M2 10-Core GPU, 40.88 Wh | Asus ROG Flow Z13 GZ301ZE i9-12900H, GeForce RTX 3050 Ti Laptop GPU, 56 Wh | Microsoft Surface Pro 8, i7-1185G7 i7-1185G7, Iris Xe G7 96EUs, 51.5 Wh | Média da turma Convertible | |
|---|---|---|---|---|---|---|---|---|
| Duração da bateria | 32% | 19% | 56% | 67% | -25% | -2% | 47% | |
| H.264 (h) | 9.4 | 10 6% | 13.6 45% | 6 -36% | 10.1 7% | 15 ? 60% | ||
| WiFi v1.3 (h) | 7.5 | 9 20% | 8.2 9% | 9.4 25% | 11.2 49% | 5.6 -25% | 7.6 1% | 12 ? 60% |
| Load (h) | 1.4 | 2 43% | 2 43% | 2.6 86% | 2.9 107% | 1.2 -14% | 1.2 -14% | 1.713 ? 22% |
| Witcher 3 ultra (h) | 0.8 |
Pro
Contra
Veredicto: O Surface Pro 9 tem mais poder, mas perde características

De fora, o novo Surface Pro 9 se parece mais com uma pequena atualização com um novo processador. Em detalhes, porém, a Microsoft fez algumas mudanças e nem todas elas são positivas. Primeiro de tudo, devemos mencionar que o desempenho da CPU aumentou significativamente graças ao novo processador Alder Lake-U. Entretanto, algum potencial ainda é desperdiçado aqui porque um chip Alder Lake P com dois núcleos de desempenho adicionais gera mais desempenho nestes valores do TDP, como mostra nosso Análise do Alder Lake-U.
A Microsoft deu ao Surface Pro 9 um módulo WLAN atualizado com suporte para redes de 6 GHz. Ao mesmo tempo, a versão LTE do modelo Intel foi abandonada, já que o antigo Surface Pro X agora também é vendido como o Surface Pro 9. Resta saber se a versão ARM com Windows pode realmente ser uma substituição completa. Teríamos gostado de um modelo opcional da Intel com LTE ou 5G. A este respeito, também temos uma visão crítica da decisão anterior da Microsoft de remover o leitor microSD para o slot opcional SIM. Como o modelo Intel não tem mais um slot SIM, um leitor de cartão poderia ter sido instalado novamente. Por outro lado, o conector omitido de 3,5 mm é muito mais discreto, mas também achamos esta decisão incompreensível.
O novo Microsoft Surface Pro 9 agora oferece mais potência de CPU, mas o modelo opcional WWAN foi descartado e o conector de áudio removido. Além disso, a vida útil da bateria continua sendo um ponto fraco do conversível.
Nas outras áreas, o desempenho é sólido, mas a tela em particular precisa ser atualizada em breve. 120 Hz é muito agradável na prática, mas os dispositivos rivais geralmente oferecem mais em termos de cobertura de espaço de cor e relação de contraste. Além disso, o conversível com o Core i7 é bastante caro e a versão básica com o Core i5, 8 GB de RAM e 256 GB de armazenamento SSD dificilmente cumpre os requisitos de um dispositivo "Pro" em 2023.
Também revisaremos a versão ARM do Surface Pro 9 + 5G em breve e estamos curiosos para ver se o Windows agora funciona melhor com o ARM SoC e se ele representa uma alternativa real para o Apple iPad Pro 12.9. O Dell XPS 13 9315 oferece menos energia de CPU, mas geralmente é suficiente para o uso diário e você também se beneficia do resfriamento passivo.
Preço e Disponibilidade
O Microsoft Surface Pro 9 parece estar amplamente disponível em todas as configurações, seja diretamente através da loja online oficial da Microsoft ou através de fornecedores típicos, como a Amazon. Nossa configuração de revisão (Core i7, 16GB RAM, 512 GB) está listada em US$1.879,99 na Amazon USe em £1.799,00 na Amazon UK. Os compradores interessados na Austrália ou Singapura, por exemplo, podem comprar diretamente da Microsoft, onde os preços começam em AU$1.649,00 e SG$1.608,00respectivamente.
Os exemplos acima não são exaustivos. Os preços são a partir de 25.01.2023 e estão sujeitos a alterações.
Microsoft Surface Pro 9, i7-1255U
- 01/24/2023 v7 (old)
Andreas Osthoff
Transparência
A seleção dos dispositivos a serem analisados é feita pela nossa equipe editorial. A amostra de teste foi fornecida ao autor como empréstimo pelo fabricante ou varejista para fins desta revisão. O credor não teve influência nesta revisão, nem o fabricante recebeu uma cópia desta revisão antes da publicação. Não houve obrigação de publicar esta revisão. Como empresa de mídia independente, a Notebookcheck não está sujeita à autoridade de fabricantes, varejistas ou editores.
É assim que o Notebookcheck está testando
Todos os anos, o Notebookcheck analisa de forma independente centenas de laptops e smartphones usando procedimentos padronizados para garantir que todos os resultados sejam comparáveis. Desenvolvemos continuamente nossos métodos de teste há cerca de 20 anos e definimos padrões da indústria no processo. Em nossos laboratórios de teste, equipamentos de medição de alta qualidade são utilizados por técnicos e editores experientes. Esses testes envolvem um processo de validação em vários estágios. Nosso complexo sistema de classificação é baseado em centenas de medições e benchmarks bem fundamentados, o que mantém a objetividade.Price comparison

