Análise do Asus ROG Strix SCAR 17 X3D - O laptop para jogos mais rápido do mundo
O ROG Strix SCAR 17 pode não ser o PC para jogos mais moderno da Asus, mas certamente é um dos mais rápidos do mercado. Já testamos uma variedade de configurações, principalmente a versão com o processador Zen4 Ryzen 9 7945HX da AMD e o laptop Nvidia GeForce RTX 4090. Com o novo ROG Strix SCAR 17 X3D, a Asus cooperou com a AMD para ser o primeiro fabricante a instalar o novo Ryzen 9 7945HX3D em um laptop que terá seu desempenho em jogos, supostamente já bom, aumentado ainda mais por meio do 3D V-Cache adicional.
Além do processador, o ROG Strix SCAR 17 X3D não oferece nada de novo, o que significa que vamos nos concentrar totalmente em seu desempenho e emissões nesta análise. Para obter mais informações sobre o gabinete, a conectividade, os dispositivos de entrada, a tela e os alto-falantes, consulte nossa análise anterior. Além disso, recomendamos que dê uma olhada em nosso artigo de análise para acompanhar o novo AMD Ryzen 9 7945HX3D, que inclui todas as informações técnicas do processador:
Potentiella konkurrenter i jämförelse
Avaliação | Data | Modelo | Peso | Altura | Size | Resolução | Preço |
|---|---|---|---|---|---|---|---|
| 87.2 % v7 (old) | 08/2023 | Asus ROG Strix Scar 17 G733PYV-LL053X R9 7945HX3D, GeForce RTX 4090 Laptop GPU | 2.9 kg | 28.3 mm | 17.30" | 2560x1440 | |
| 88.3 % v7 (old) | 04/2023 | Asus ROG Strix Scar 17 G733PY-XS96 R9 7945HX, GeForce RTX 4090 Laptop GPU | 2.9 kg | 28.3 mm | 17.30" | 2560x1440 | |
| 90.7 % v7 (old) | 04/2023 | Alienware m18 R1 i9-13980HX, GeForce RTX 4090 Laptop GPU | 3.9 kg | 26.7 mm | 18.00" | 1920x1200 | |
| 86.6 % v7 (old) | 02/2023 | Asus ROG Strix Scar 18 2023 G834JY-N6005W i9-13980HX, GeForce RTX 4090 Laptop GPU | 3.1 kg | 30.8 mm | 18.00" | 2560x1600 | |
| 89 % v7 (old) | 02/2023 | MSI Titan GT77 HX 13VI i9-13950HX, GeForce RTX 4090 Laptop GPU | 3.5 kg | 23 mm | 17.30" | 3840x2160 | |
| 85.5 % v7 (old) | 06/2023 | Schenker Key 17 Pro (Early 23) i9-13900HX, GeForce RTX 4090 Laptop GPU | 3.4 kg | 24.9 mm | 17.30" | 3840x2160 |
Desempenho - O SCAR 17 X3D com o melhor da AMD e da Nvidia
Em comparação com aROG Strix SCAR 17com oRyzen 9 7945HXesta versão apresenta uma mudança importante em relação ao resfriamento do processador. Devido à textura metálica da superfície do novo processador 7945HX3D, não é possível usar metal líquido - em vez disso, o dispositivo conta com pasta térmica comum. Em geral, sua classificação de TDP permanece a mesma, de acordo com a Asus, mas isso afeta o desempenho do laptop.
Condições de teste
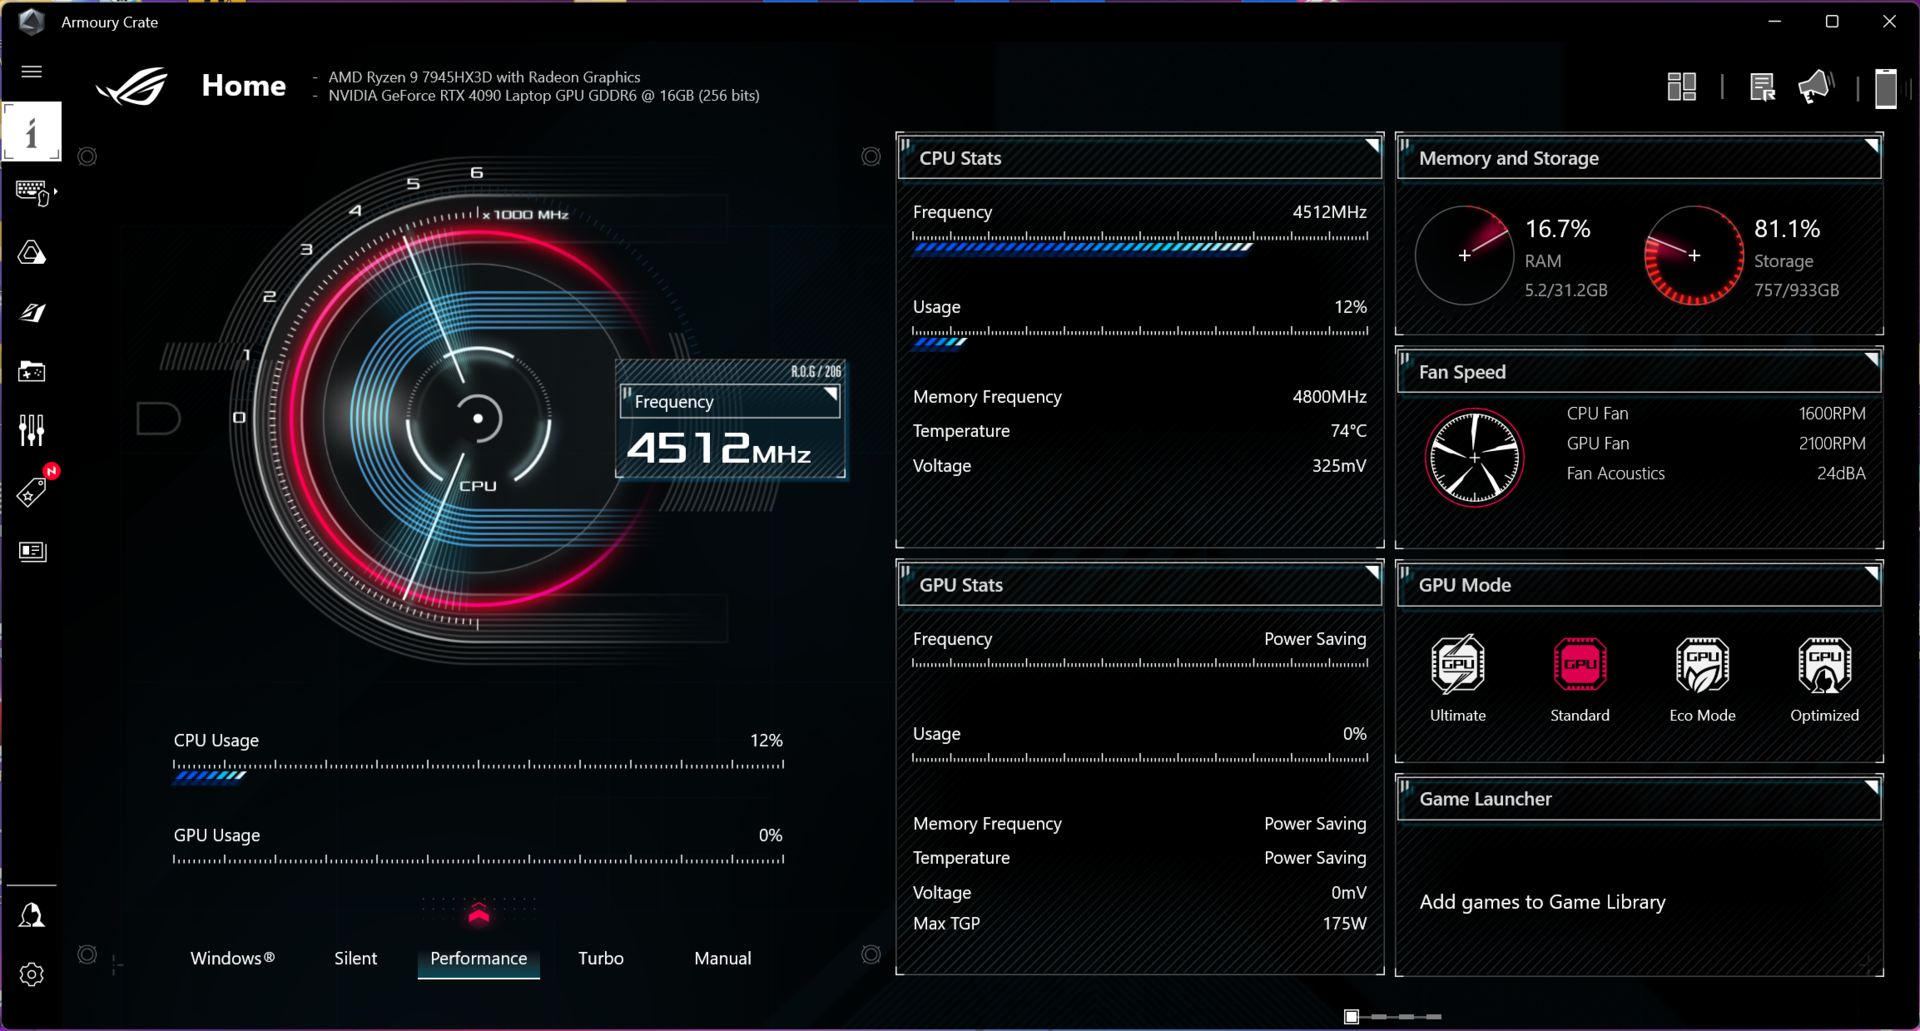
O software Armoury Crate pré-instalado lhe dá acesso aos conhecidos perfis de energia Silent, Performance e Turbo. Além disso, há um modo manual que permite alterar os valores de TDP/TGP para a CPU/GPU. Há também alguns modos de GPU para escolher - em nosso teste, utilizamos o modo Ultimate em coordenação com o perfil de energia Turbo. A tabela a seguir contém os respectivos valores de TDP/TGP nos diferentes perfis de energia. No modo de bateria, o perfil Turbo não está disponível.
| Cenário | Silencioso | Desempenho | Turbo |
|---|---|---|---|
| Carga da CPU | 65/55 watts | 90/85 watts | 125/90 watts |
| Carga da GPU | D-Notify | 140 + 20 watts Dynamic Boost | 150 + 25 watts Dynamic Boost |
| Teste de estresse | CPU: 35 watts GPU: D-Notify |
CPU: 40 watts GPU: 150 watts |
CPU: 50 watts GPU: 175 watts |
Observação: D-Notify é uma função específica da Nvidia. Com a função D-Notify ativada, a GPU aumentará seu consumo de energia com base no aplicativo/carga até que a GPU atinja uma temperatura de 75 °C. Nesse caso, o TGP é limitado a 55 watts.
Processador - Ryzen 9 7945HX3D
O novoAMD Ryzen 9 7945HX3Dsão idênticas às especificações técnicas básicas doRyzen 9 7945HX: 16 núcleos Zen4 (32 threads) com um clock máximo de até 5,4 GHz. No entanto, no novo modelo, o cache de 80 MB (16 MB L2 + 64 MB L3) é aumentado por um cache L3 adicional de 64 MB. Todas as informações técnicas adicionais sobre isso podem ser encontradas em nossa análise do novo Ryzen 9 7945HX3D.
Em contraste com o SCAR 17 com o Ryzen 9 7945HX normal, os benchmarks executados com a nova versão mostraram valores mais baixos de consumo total de energia. Observamos um máximo de até 115 watts, que rapidamente se equilibrou em 100 watts. Aqui, o metal líquido ausente já se faz notar. Os resultados do benchmark ainda são fenomenais no total, embora, quando se trata do desempenho puro da CPU, os modelos 7945HX normais tenham uma pequena vantagem. Novamente, seu desempenho total é comparável ao das CPUs Intel HX, que só se saíram melhor em determinados testes de núcleo único. Ao mesmo tempo, não se deve esquecer que os chips Intel consomem muito mais energia, tanto no uso de um único núcleo quanto, principalmente, quando todos os núcleos estão carregados. Para comparar: O Ryzen 9 7945HX3D com 100 watts foi consideravelmente mais rápido nos testes de vários núcleos em comparação com o Core i9-13980HX com 170 watts.
No uso da bateria, o processador usa um máximo de 85 watts por um curto período de tempo, depois disso ele se equilibra rapidamente em 55 watts. No teste Cinebench R23 Multi, isso foi suficiente para garantir 24.127 pontos, o equivalente a um déficit de 26%. Seu uso de núcleo único não foi limitado. Outros benchmarks de CPU podem ser encontrados em nossa seção
de tecnologiaCinebench R15 Multi continuous test
Cinebench R23: Multi Core | Single Core
Cinebench R20: CPU (Multi Core) | CPU (Single Core)
Cinebench R15: CPU Multi 64Bit | CPU Single 64Bit
Blender: v2.79 BMW27 CPU
7-Zip 18.03: 7z b 4 | 7z b 4 -mmt1
Geekbench 5.5: Multi-Core | Single-Core
HWBOT x265 Benchmark v2.2: 4k Preset
LibreOffice : 20 Documents To PDF
R Benchmark 2.5: Overall mean
| CPU Performance rating | |
| Asus ROG Strix Scar 17 G733PY-XS96 | |
| Asus ROG Strix Scar 17 G733PYV-LL053X | |
| Média AMD Ryzen 9 7945HX3D | |
| Asus ROG Strix Scar 18 2023 G834JY-N6005W | |
| Alienware m18 R1 | |
| MSI Titan GT77 HX 13VI | |
| Lenovo Legion Pro 7 RTX4090 | |
| Schenker Key 17 Pro (Early 23) | |
| Média da turma Gaming | |
| Lenovo Legion Pro 5 16ARX8 | |
| Asus ROG Zephyrus M16 GU604VY-NM042X | |
| Cinebench R23 / Multi Core | |
| Asus ROG Strix Scar 17 G733PY-XS96 | |
| MSI Titan GT77 HX 13VI | |
| Asus ROG Strix Scar 17 G733PYV-LL053X | |
| Média AMD Ryzen 9 7945HX3D (n=1) | |
| Alienware m18 R1 | |
| Asus ROG Strix Scar 18 2023 G834JY-N6005W | |
| Lenovo Legion Pro 7 RTX4090 | |
| Schenker Key 17 Pro (Early 23) | |
| Média da turma Gaming (10488 - 40970, n=110, últimos 2 anos) | |
| Asus ROG Zephyrus M16 GU604VY-NM042X | |
| Lenovo Legion Pro 5 16ARX8 | |
| Cinebench R23 / Single Core | |
| Asus ROG Strix Scar 18 2023 G834JY-N6005W | |
| Alienware m18 R1 | |
| MSI Titan GT77 HX 13VI | |
| Lenovo Legion Pro 7 RTX4090 | |
| Schenker Key 17 Pro (Early 23) | |
| Média da turma Gaming (1166 - 2356, n=110, últimos 2 anos) | |
| Asus ROG Zephyrus M16 GU604VY-NM042X | |
| Asus ROG Strix Scar 17 G733PYV-LL053X | |
| Média AMD Ryzen 9 7945HX3D (n=1) | |
| Asus ROG Strix Scar 17 G733PY-XS96 | |
| Lenovo Legion Pro 5 16ARX8 | |
| Cinebench R20 / CPU (Multi Core) | |
| Asus ROG Strix Scar 17 G733PY-XS96 | |
| Asus ROG Strix Scar 17 G733PYV-LL053X | |
| Média AMD Ryzen 9 7945HX3D (n=1) | |
| MSI Titan GT77 HX 13VI | |
| Alienware m18 R1 | |
| Asus ROG Strix Scar 18 2023 G834JY-N6005W | |
| Lenovo Legion Pro 7 RTX4090 | |
| Schenker Key 17 Pro (Early 23) | |
| Média da turma Gaming (4029 - 16108, n=109, últimos 2 anos) | |
| Asus ROG Zephyrus M16 GU604VY-NM042X | |
| Lenovo Legion Pro 5 16ARX8 | |
| Cinebench R20 / CPU (Single Core) | |
| Asus ROG Strix Scar 18 2023 G834JY-N6005W | |
| Alienware m18 R1 | |
| MSI Titan GT77 HX 13VI | |
| Schenker Key 17 Pro (Early 23) | |
| Lenovo Legion Pro 7 RTX4090 | |
| Média da turma Gaming (442 - 895, n=109, últimos 2 anos) | |
| Asus ROG Strix Scar 17 G733PYV-LL053X | |
| Média AMD Ryzen 9 7945HX3D (n=1) | |
| Asus ROG Zephyrus M16 GU604VY-NM042X | |
| Asus ROG Strix Scar 17 G733PY-XS96 | |
| Lenovo Legion Pro 5 16ARX8 | |
| Cinebench R15 / CPU Multi 64Bit | |
| Asus ROG Strix Scar 17 G733PYV-LL053X | |
| Média AMD Ryzen 9 7945HX3D (n=1) | |
| Asus ROG Strix Scar 17 G733PY-XS96 | |
| MSI Titan GT77 HX 13VI | |
| Alienware m18 R1 | |
| Asus ROG Strix Scar 18 2023 G834JY-N6005W | |
| Lenovo Legion Pro 7 RTX4090 | |
| Schenker Key 17 Pro (Early 23) | |
| Média da turma Gaming (1578 - 6271, n=108, últimos 2 anos) | |
| Asus ROG Zephyrus M16 GU604VY-NM042X | |
| Lenovo Legion Pro 5 16ARX8 | |
| Cinebench R15 / CPU Single 64Bit | |
| Asus ROG Strix Scar 18 2023 G834JY-N6005W | |
| Asus ROG Strix Scar 17 G733PYV-LL053X | |
| Média AMD Ryzen 9 7945HX3D (n=1) | |
| Asus ROG Strix Scar 17 G733PY-XS96 | |
| Alienware m18 R1 | |
| MSI Titan GT77 HX 13VI | |
| Média da turma Gaming (188.8 - 343, n=109, últimos 2 anos) | |
| Lenovo Legion Pro 5 16ARX8 | |
| Asus ROG Zephyrus M16 GU604VY-NM042X | |
| Schenker Key 17 Pro (Early 23) | |
| Lenovo Legion Pro 7 RTX4090 | |
| Blender / v2.79 BMW27 CPU | |
| Lenovo Legion Pro 5 16ARX8 | |
| Asus ROG Zephyrus M16 GU604VY-NM042X | |
| Média da turma Gaming (80 - 330, n=107, últimos 2 anos) | |
| Schenker Key 17 Pro (Early 23) | |
| Lenovo Legion Pro 7 RTX4090 | |
| Asus ROG Strix Scar 18 2023 G834JY-N6005W | |
| MSI Titan GT77 HX 13VI | |
| Alienware m18 R1 | |
| Asus ROG Strix Scar 17 G733PYV-LL053X | |
| Média AMD Ryzen 9 7945HX3D (n=1) | |
| Asus ROG Strix Scar 17 G733PY-XS96 | |
| 7-Zip 18.03 / 7z b 4 -mmt1 | |
| Asus ROG Strix Scar 17 G733PY-XS96 | |
| Asus ROG Strix Scar 17 G733PYV-LL053X | |
| Média AMD Ryzen 9 7945HX3D (n=1) | |
| Lenovo Legion Pro 5 16ARX8 | |
| Asus ROG Strix Scar 18 2023 G834JY-N6005W | |
| Lenovo Legion Pro 7 RTX4090 | |
| MSI Titan GT77 HX 13VI | |
| Alienware m18 R1 | |
| Schenker Key 17 Pro (Early 23) | |
| Média da turma Gaming (4199 - 7436, n=108, últimos 2 anos) | |
| Asus ROG Zephyrus M16 GU604VY-NM042X | |
| Geekbench 5.5 / Multi-Core | |
| Alienware m18 R1 | |
| Asus ROG Strix Scar 18 2023 G834JY-N6005W | |
| MSI Titan GT77 HX 13VI | |
| Lenovo Legion Pro 7 RTX4090 | |
| Asus ROG Strix Scar 17 G733PYV-LL053X | |
| Média AMD Ryzen 9 7945HX3D (n=1) | |
| Schenker Key 17 Pro (Early 23) | |
| Asus ROG Strix Scar 17 G733PY-XS96 | |
| Média da turma Gaming (6460 - 27010, n=108, últimos 2 anos) | |
| Asus ROG Zephyrus M16 GU604VY-NM042X | |
| Lenovo Legion Pro 5 16ARX8 | |
| Geekbench 5.5 / Single-Core | |
| Asus ROG Strix Scar 17 G733PYV-LL053X | |
| Média AMD Ryzen 9 7945HX3D (n=1) | |
| Asus ROG Strix Scar 18 2023 G834JY-N6005W | |
| Alienware m18 R1 | |
| Média da turma Gaming (986 - 2474, n=108, últimos 2 anos) | |
| Asus ROG Strix Scar 17 G733PY-XS96 | |
| MSI Titan GT77 HX 13VI | |
| Lenovo Legion Pro 5 16ARX8 | |
| Lenovo Legion Pro 7 RTX4090 | |
| Asus ROG Zephyrus M16 GU604VY-NM042X | |
| Schenker Key 17 Pro (Early 23) | |
| HWBOT x265 Benchmark v2.2 / 4k Preset | |
| Asus ROG Strix Scar 17 G733PY-XS96 | |
| Asus ROG Strix Scar 17 G733PYV-LL053X | |
| Média AMD Ryzen 9 7945HX3D (n=1) | |
| Asus ROG Strix Scar 18 2023 G834JY-N6005W | |
| Alienware m18 R1 | |
| MSI Titan GT77 HX 13VI | |
| Lenovo Legion Pro 7 RTX4090 | |
| Média da turma Gaming (11.5 - 44.3, n=108, últimos 2 anos) | |
| Schenker Key 17 Pro (Early 23) | |
| Lenovo Legion Pro 5 16ARX8 | |
| Asus ROG Zephyrus M16 GU604VY-NM042X | |
| LibreOffice / 20 Documents To PDF | |
| Asus ROG Zephyrus M16 GU604VY-NM042X | |
| Média da turma Gaming (19 - 88.8, n=108, últimos 2 anos) | |
| Alienware m18 R1 | |
| MSI Titan GT77 HX 13VI | |
| Schenker Key 17 Pro (Early 23) | |
| Lenovo Legion Pro 7 RTX4090 | |
| Asus ROG Strix Scar 17 G733PYV-LL053X | |
| Média AMD Ryzen 9 7945HX3D (n=1) | |
| Lenovo Legion Pro 5 16ARX8 | |
| Asus ROG Strix Scar 17 G733PY-XS96 | |
| Asus ROG Strix Scar 18 2023 G834JY-N6005W | |
| R Benchmark 2.5 / Overall mean | |
| Média da turma Gaming (0.3439 - 0.759, n=109, últimos 2 anos) | |
| Lenovo Legion Pro 5 16ARX8 | |
| Asus ROG Strix Scar 17 G733PYV-LL053X | |
| Média AMD Ryzen 9 7945HX3D (n=1) | |
| Asus ROG Zephyrus M16 GU604VY-NM042X | |
| Asus ROG Strix Scar 17 G733PY-XS96 | |
| MSI Titan GT77 HX 13VI | |
| Lenovo Legion Pro 7 RTX4090 | |
| Schenker Key 17 Pro (Early 23) | |
| Alienware m18 R1 | |
| Asus ROG Strix Scar 18 2023 G834JY-N6005W | |
* ... menor é melhor
AIDA64: FP32 Ray-Trace | FPU Julia | CPU SHA3 | CPU Queen | FPU SinJulia | FPU Mandel | CPU AES | CPU ZLib | FP64 Ray-Trace | CPU PhotoWorxx
| AIDA64 / FP32 Ray-Trace | |
| Asus ROG Strix Scar 17 G733PY-XS96 | |
| Asus ROG Strix Scar 17 G733PYV-LL053X | |
| Média AMD Ryzen 9 7945HX3D (n=1) | |
| Média da turma Gaming (10227 - 85542, n=107, últimos 2 anos) | |
| Lenovo Legion Pro 5 16ARX8 | |
| Alienware m18 R1 | |
| MSI Titan GT77 HX 13VI | |
| Asus ROG Strix Scar 18 2023 G834JY-N6005W | |
| Lenovo Legion Pro 7 RTX4090 | |
| Schenker Key 17 Pro (Early 23) | |
| Asus ROG Zephyrus M16 GU604VY-NM042X | |
| AIDA64 / FP64 Ray-Trace | |
| Asus ROG Strix Scar 17 G733PY-XS96 | |
| Asus ROG Strix Scar 17 G733PYV-LL053X | |
| Média AMD Ryzen 9 7945HX3D (n=1) | |
| Média da turma Gaming (5509 - 45446, n=107, últimos 2 anos) | |
| Alienware m18 R1 | |
| Lenovo Legion Pro 5 16ARX8 | |
| MSI Titan GT77 HX 13VI | |
| Asus ROG Strix Scar 18 2023 G834JY-N6005W | |
| Lenovo Legion Pro 7 RTX4090 | |
| Schenker Key 17 Pro (Early 23) | |
| Asus ROG Zephyrus M16 GU604VY-NM042X | |
| AIDA64 / CPU PhotoWorxx | |
| Alienware m18 R1 | |
| Lenovo Legion Pro 7 RTX4090 | |
| Schenker Key 17 Pro (Early 23) | |
| Asus ROG Zephyrus M16 GU604VY-NM042X | |
| Média da turma Gaming (12271 - 89891, n=107, últimos 2 anos) | |
| Asus ROG Strix Scar 18 2023 G834JY-N6005W | |
| MSI Titan GT77 HX 13VI | |
| Asus ROG Strix Scar 17 G733PYV-LL053X | |
| Média AMD Ryzen 9 7945HX3D (n=1) | |
| Asus ROG Strix Scar 17 G733PY-XS96 | |
| Lenovo Legion Pro 5 16ARX8 | |
Desempenho do sistema
O novo ROG Strix SCAR 17 X3D também se saiu melhor do que a concorrência no teste sintético PCMark 10, embora as diferenças não tenham sido grandes e, no uso diário, todos os dispositivos de comparação sejam extremamente rápidos. O dispositivo de teste da AMD ficou atrás apenas de seus concorrentes mais rápidos da Intel no teste CrossMark de plataforma cruzada.
CrossMark: Overall | Productivity | Creativity | Responsiveness
| PCMark 10 / Score | |
| Asus ROG Strix Scar 17 G733PYV-LL053X | |
| Média AMD Ryzen 9 7945HX3D, NVIDIA GeForce RTX 4090 Laptop GPU (n=1) | |
| Schenker Key 17 Pro (Early 23) | |
| MSI Titan GT77 HX 13VI | |
| Asus ROG Strix Scar 18 2023 G834JY-N6005W | |
| Alienware m18 R1 | |
| Asus ROG Strix Scar 17 G733PY-XS96 | |
| Média da turma Gaming (5828 - 11574, n=95, últimos 2 anos) | |
| Asus ROG Zephyrus M16 GU604VY-NM042X | |
| Lenovo Legion Pro 5 16ARX8 | |
| Lenovo Legion Pro 7 RTX4090 | |
| PCMark 10 / Essentials | |
| MSI Titan GT77 HX 13VI | |
| Asus ROG Zephyrus M16 GU604VY-NM042X | |
| Asus ROG Strix Scar 17 G733PYV-LL053X | |
| Média AMD Ryzen 9 7945HX3D, NVIDIA GeForce RTX 4090 Laptop GPU (n=1) | |
| Schenker Key 17 Pro (Early 23) | |
| Alienware m18 R1 | |
| Asus ROG Strix Scar 17 G733PY-XS96 | |
| Lenovo Legion Pro 7 RTX4090 | |
| Lenovo Legion Pro 5 16ARX8 | |
| Média da turma Gaming (8810 - 12600, n=99, últimos 2 anos) | |
| PCMark 10 / Productivity | |
| Schenker Key 17 Pro (Early 23) | |
| Asus ROG Zephyrus M16 GU604VY-NM042X | |
| Média da turma Gaming (6845 - 21327, n=97, últimos 2 anos) | |
| Asus ROG Strix Scar 17 G733PYV-LL053X | |
| Média AMD Ryzen 9 7945HX3D, NVIDIA GeForce RTX 4090 Laptop GPU (n=1) | |
| Asus ROG Strix Scar 17 G733PY-XS96 | |
| Lenovo Legion Pro 5 16ARX8 | |
| Alienware m18 R1 | |
| MSI Titan GT77 HX 13VI | |
| Lenovo Legion Pro 7 RTX4090 | |
| PCMark 10 / Digital Content Creation | |
| MSI Titan GT77 HX 13VI | |
| Asus ROG Strix Scar 17 G733PYV-LL053X | |
| Média AMD Ryzen 9 7945HX3D, NVIDIA GeForce RTX 4090 Laptop GPU (n=1) | |
| Alienware m18 R1 | |
| Asus ROG Strix Scar 17 G733PY-XS96 | |
| Schenker Key 17 Pro (Early 23) | |
| Lenovo Legion Pro 7 RTX4090 | |
| Média da turma Gaming (7602 - 19657, n=97, últimos 2 anos) | |
| Lenovo Legion Pro 5 16ARX8 | |
| Asus ROG Zephyrus M16 GU604VY-NM042X | |
| CrossMark / Overall | |
| Schenker Key 17 Pro (Early 23) | |
| Alienware m18 R1 | |
| MSI Titan GT77 HX 13VI | |
| Asus ROG Strix Scar 17 G733PYV-LL053X | |
| Média AMD Ryzen 9 7945HX3D, NVIDIA GeForce RTX 4090 Laptop GPU (n=1) | |
| Asus ROG Strix Scar 18 2023 G834JY-N6005W | |
| Lenovo Legion Pro 5 16ARX8 | |
| Asus ROG Strix Scar 17 G733PY-XS96 | |
| Média da turma Gaming (1366 - 2409, n=96, últimos 2 anos) | |
| Asus ROG Zephyrus M16 GU604VY-NM042X | |
| CrossMark / Productivity | |
| Schenker Key 17 Pro (Early 23) | |
| Alienware m18 R1 | |
| MSI Titan GT77 HX 13VI | |
| Asus ROG Strix Scar 17 G733PYV-LL053X | |
| Média AMD Ryzen 9 7945HX3D, NVIDIA GeForce RTX 4090 Laptop GPU (n=1) | |
| Lenovo Legion Pro 5 16ARX8 | |
| Asus ROG Strix Scar 18 2023 G834JY-N6005W | |
| Média da turma Gaming (1386 - 2254, n=96, últimos 2 anos) | |
| Asus ROG Zephyrus M16 GU604VY-NM042X | |
| Asus ROG Strix Scar 17 G733PY-XS96 | |
| CrossMark / Creativity | |
| Alienware m18 R1 | |
| Asus ROG Strix Scar 18 2023 G834JY-N6005W | |
| Schenker Key 17 Pro (Early 23) | |
| MSI Titan GT77 HX 13VI | |
| Asus ROG Strix Scar 17 G733PYV-LL053X | |
| Média AMD Ryzen 9 7945HX3D, NVIDIA GeForce RTX 4090 Laptop GPU (n=1) | |
| Asus ROG Strix Scar 17 G733PY-XS96 | |
| Média da turma Gaming (1343 - 2729, n=96, últimos 2 anos) | |
| Asus ROG Zephyrus M16 GU604VY-NM042X | |
| Lenovo Legion Pro 5 16ARX8 | |
| CrossMark / Responsiveness | |
| Schenker Key 17 Pro (Early 23) | |
| Alienware m18 R1 | |
| MSI Titan GT77 HX 13VI | |
| Lenovo Legion Pro 5 16ARX8 | |
| Média da turma Gaming (1226 - 2334, n=96, últimos 2 anos) | |
| Asus ROG Zephyrus M16 GU604VY-NM042X | |
| Asus ROG Strix Scar 17 G733PYV-LL053X | |
| Média AMD Ryzen 9 7945HX3D, NVIDIA GeForce RTX 4090 Laptop GPU (n=1) | |
| Asus ROG Strix Scar 18 2023 G834JY-N6005W | |
| Asus ROG Strix Scar 17 G733PY-XS96 | |
| PCMark 10 Score | 9117 pontos | |
Ajuda | ||
| AIDA64 / Memory Latency | |
| Média da turma Gaming (75.3 - 259, n=107, últimos 2 anos) | |
| MSI Titan GT77 HX 13VI | |
| Asus ROG Strix Scar 18 2023 G834JY-N6005W | |
| Schenker Key 17 Pro (Early 23) | |
| Asus ROG Strix Scar 17 G733PYV-LL053X | |
| Média AMD Ryzen 9 7945HX3D (n=1) | |
| Asus ROG Zephyrus M16 GU604VY-NM042X | |
| Lenovo Legion Pro 5 16ARX8 | |
| Lenovo Legion Pro 7 RTX4090 | |
| Asus ROG Strix Scar 17 G733PY-XS96 | |
| Alienware m18 R1 | |
* ... menor é melhor
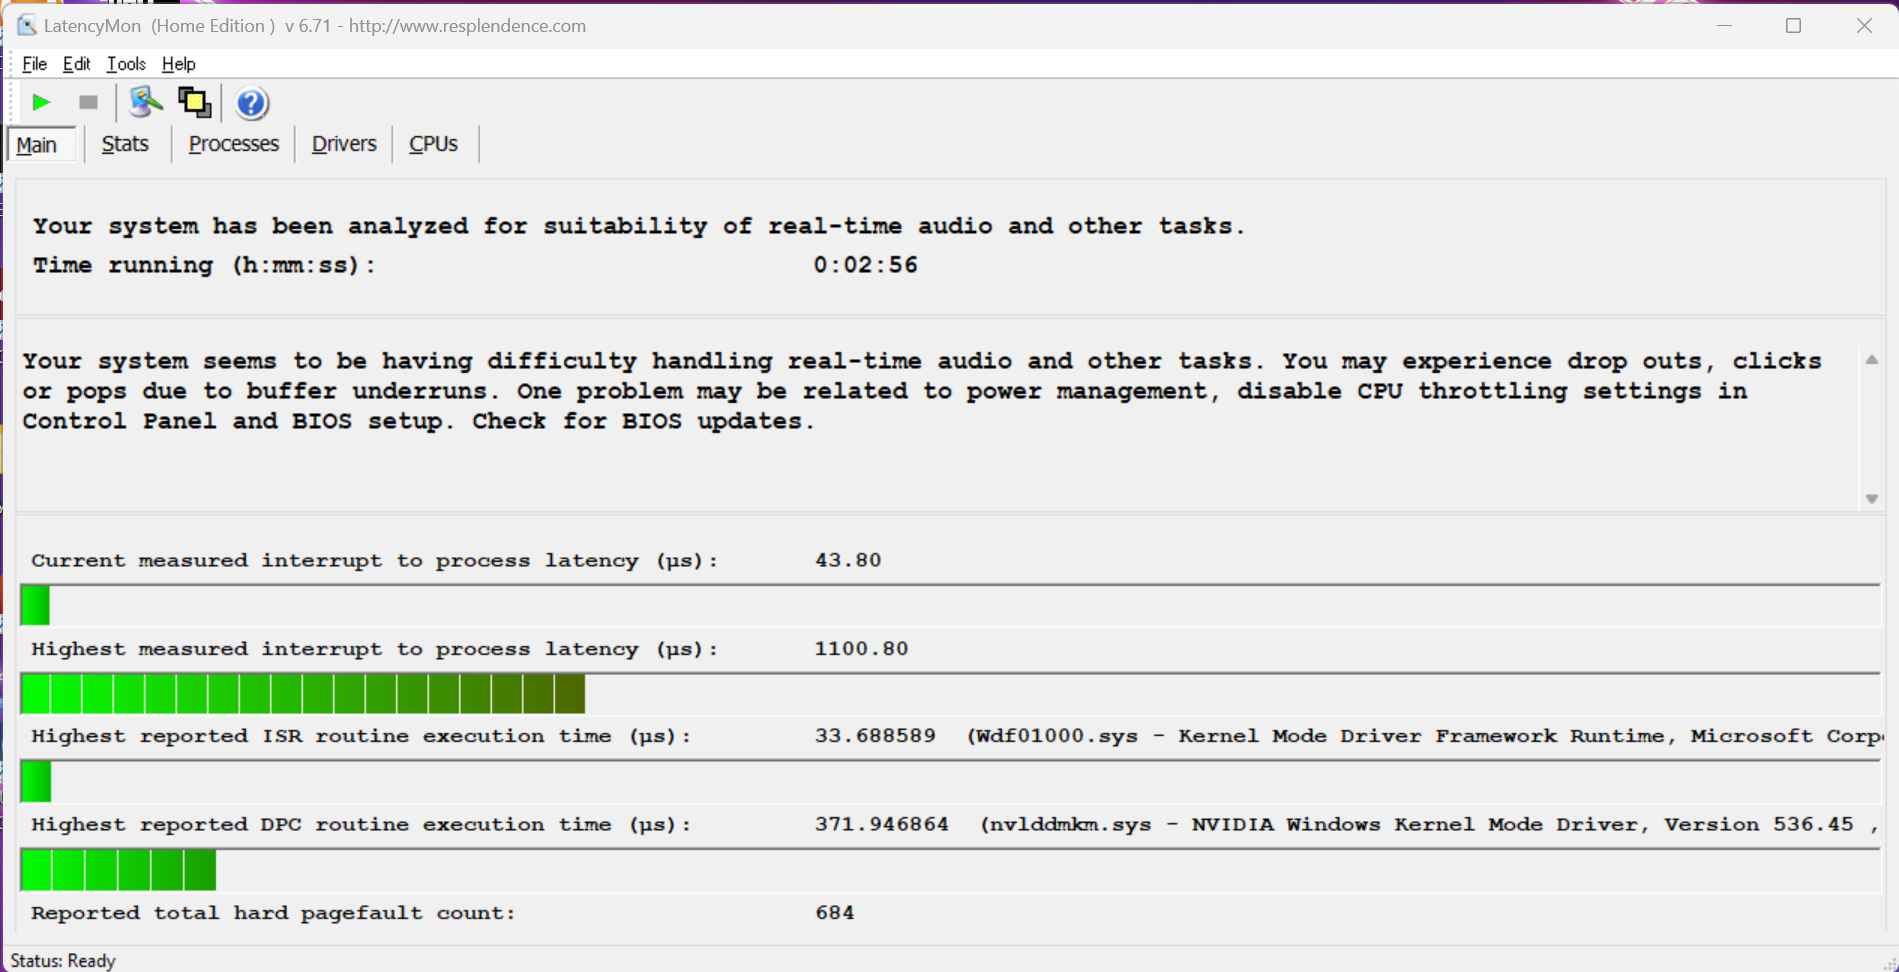
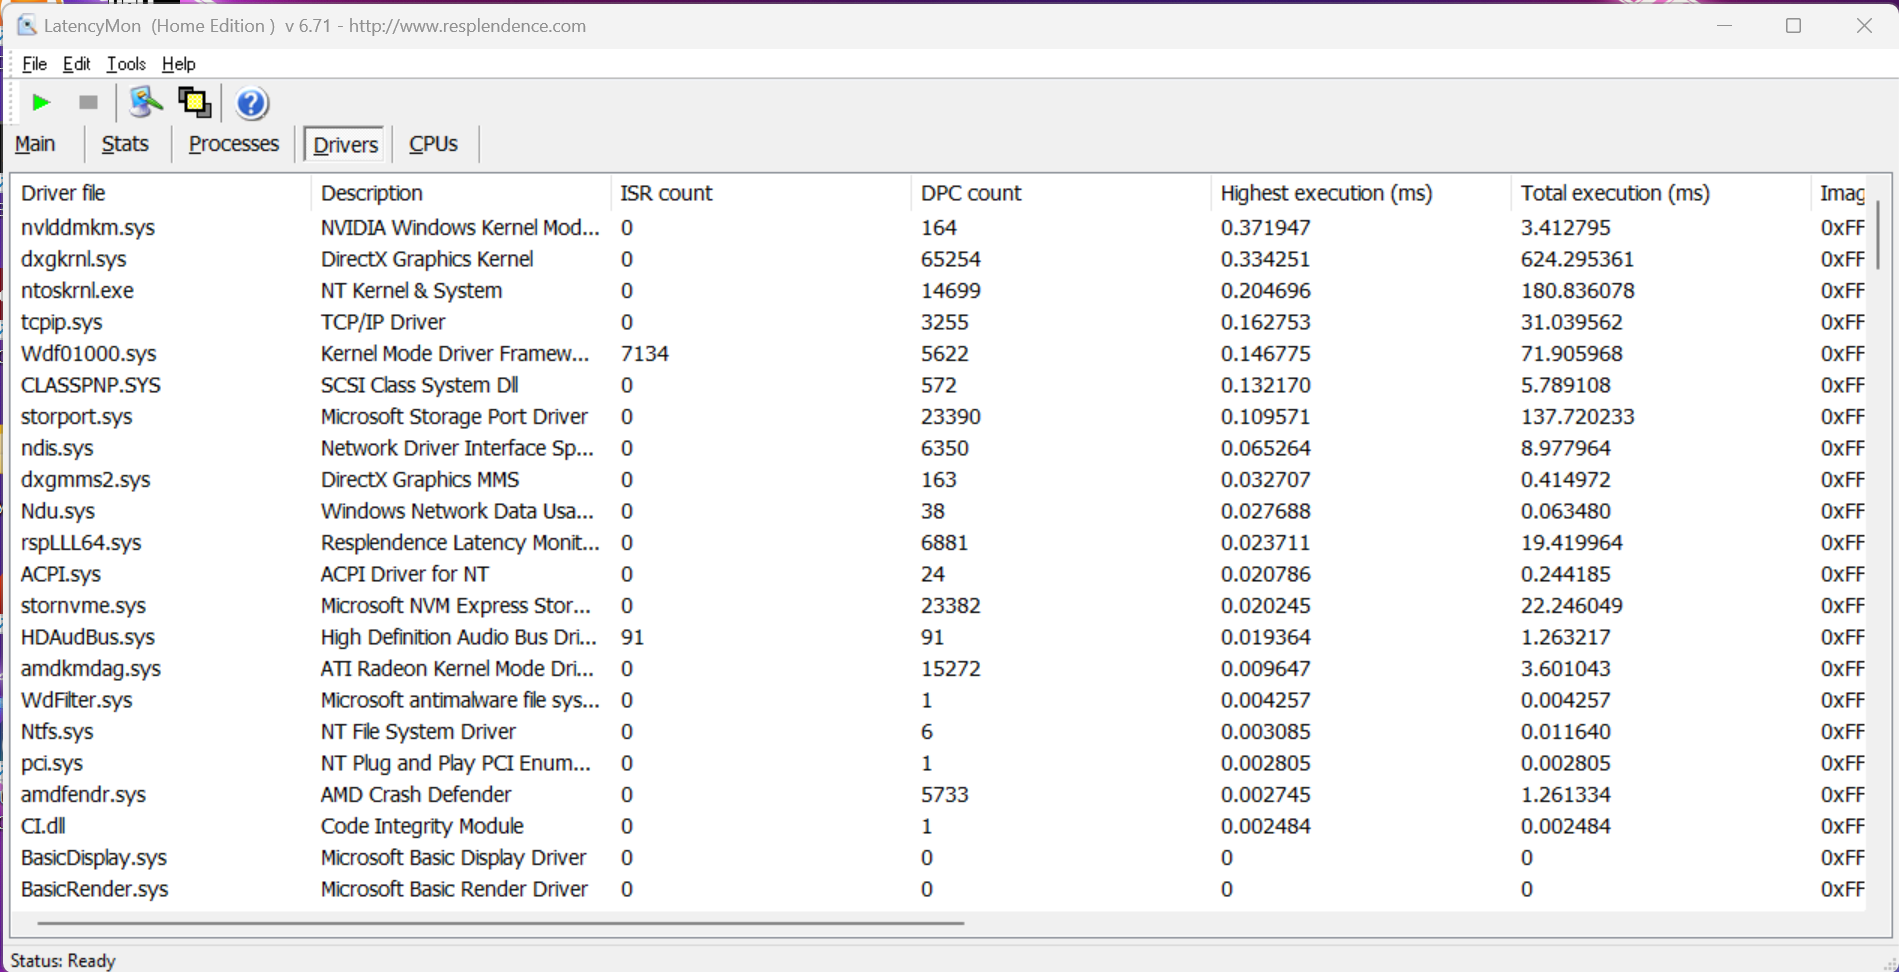
Latência DPC
Em nosso teste de latência padronizado (navegação na Web, reprodução em 4K no YouTube, carga da CPU), nosso dispositivo de teste apresentou pequenas restrições ao usar aplicativos de áudio em tempo real com a versão atual do BIOS.
| DPC Latencies / LatencyMon - interrupt to process latency (max), Web, Youtube, Prime95 | |
| Asus ROG Strix Scar 17 G733PYV-LL053X | |
* ... menor é melhor
Dispositivos de armazenamento
Uma SSD de 1 TB da SK Hynix (PC801) foi instalada no ROG Strix SCAR 17 X3D. A SSD M.2 2280 é conectada por meio da rápida interface PCIe 4.0 e oferece taxas de transferência muito boas. Além disso, seu desempenho permanece estável mesmo sob carga permanente. Após a primeira inicialização, os usuários têm 868 GB disponíveis, mas graças ao segundo slot M.2 (também M.2 2280, PCIe 4.0), o espaço de armazenamento pode ser expandido, se necessário. Mais benchmarks de SSD estão listados aqui.

Reading continuous performance: DiskSpd Read Loop, Queue Depth 8
Placa de vídeo - GeForce Laptop RTX 4090
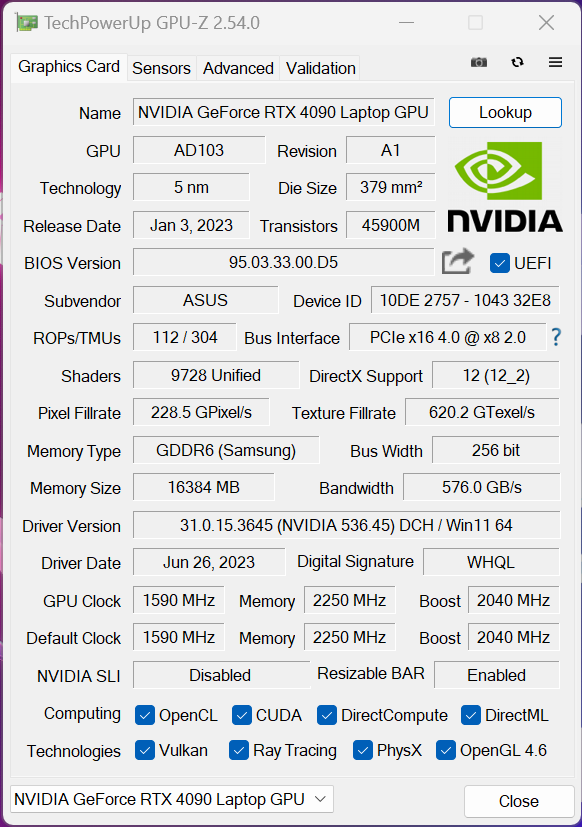
O ROG Strix SCAR 17 X3D suporta a tecnologia Advanced Optimus da Nvidia. Ao realizar tarefas fáceis, a placa de vídeo integrada do processadorRadeon 610Mdo processador cuida do processamento gráfico e, para tarefas mais exigentes (por exemplo, jogos), o laptop alterna automaticamente para o processador dedicadoGeForce Laptop RTX 4090. Graças a um switch MUX integrado, a iGPU pode ser desativada sem que o laptop precise ser completamente reiniciado. Com um consumo máximo de energia de 175 watts (150 watts de TGP + 25 watts de Dynamic Boost), essa é uma das versões mais rápidas do laptop RTX 4090.
Pode ter havido uma ou duas diferenças nos benchmarks, mas, no total, os laptops equipados com o laptop RTX 4090 funcionam praticamente da mesma forma. Em uso de bateria, o notebook GeForce RTX 4090 pode consumir no máximo 55 watts, o que foi suficiente para garantir uma pontuação gráfica de 5.590 pontos em nosso teste Time Spy. Isso corresponde a um déficit impressionante de 75%. Outros benchmarks de GPU podem ser encontrados em aqui.
| 3DMark 11 Performance | 47621 pontos | |
| 3DMark Fire Strike Score | 41279 pontos | |
| 3DMark Time Spy Score | 19832 pontos | |
| 3DMark Steel Nomad Score | 5139 pontos | |
Ajuda | ||
| Blender / v3.3 Classroom OPTIX/RTX | |
| Lenovo Legion Pro 5 16ARX8 | |
| Média da turma Gaming (9 - 32, n=109, últimos 2 anos) | |
| Asus ROG Zephyrus M16 GU604VY-NM042X | |
| Média NVIDIA GeForce RTX 4090 Laptop GPU (9 - 19, n=39) | |
| Lenovo Legion Pro 7 RTX4090 | |
| MSI Titan GT77 HX 13VI | |
| Asus ROG Strix Scar 17 G733PY-XS96 | |
| Schenker Key 17 Pro (Early 23) | |
| Asus ROG Strix Scar 17 G733PYV-LL053X | |
| Asus ROG Strix Scar 18 2023 G834JY-N6005W | |
| Blender / v3.3 Classroom CUDA | |
| Média da turma Gaming (15 - 233, n=110, últimos 2 anos) | |
| Lenovo Legion Pro 5 16ARX8 | |
| Schenker Key 17 Pro (Early 23) | |
| Média NVIDIA GeForce RTX 4090 Laptop GPU (16 - 24, n=39) | |
| Asus ROG Strix Scar 18 2023 G834JY-N6005W | |
| Asus ROG Strix Scar 18 2023 G834JY-N6005W | |
| Asus ROG Zephyrus M16 GU604VY-NM042X | |
| Lenovo Legion Pro 7 RTX4090 | |
| Asus ROG Strix Scar 17 G733PYV-LL053X | |
| MSI Titan GT77 HX 13VI | |
| Alienware m18 R1 | |
| Asus ROG Strix Scar 17 G733PY-XS96 | |
| Blender / v3.3 Classroom CPU | |
| Asus ROG Zephyrus M16 GU604VY-NM042X | |
| Lenovo Legion Pro 5 16ARX8 | |
| Média da turma Gaming (122 - 565, n=105, últimos 2 anos) | |
| Schenker Key 17 Pro (Early 23) | |
| Média NVIDIA GeForce RTX 4090 Laptop GPU (144 - 305, n=39) | |
| Lenovo Legion Pro 7 RTX4090 | |
| Asus ROG Strix Scar 18 2023 G834JY-N6005W | |
| MSI Titan GT77 HX 13VI | |
| Alienware m18 R1 | |
| Asus ROG Strix Scar 17 G733PYV-LL053X | |
| Asus ROG Strix Scar 17 G733PY-XS96 | |
* ... menor é melhor
Desempenho em jogos
Agora é hora de dar uma olhada nos benchmarks de jogos. Primeiramente, daremos uma olhada na resolução Full HD. Aqui, o novoRyzen 9 7945HX3Dpôde mostrar claramente seus pontos fortes em determinados jogos e, com frequência, observamos vantagens percentuais de dois dígitos; em Far Cry 5, chegamos a medir uma vantagem de 36% sobre o Ryzen 9 7945HX normal, bem como sobre as CPUs HX da Intel. No entanto, também não houve vantagem em alguns jogos, como The Witcher 3 ou Call of Duty Modern Warfare 2.
| The Witcher 3 - 1920x1080 Ultra Graphics & Postprocessing (HBAO+) | |
| Alienware m18 R1 | |
| Asus ROG Strix Scar 17 G733PYV-LL053X | |
| Schenker Key 17 Pro (Early 23) | |
| Asus ROG Strix Scar 17 G733PY-XS96 | |
| Lenovo Legion Pro 7 RTX4090 | |
| MSI Titan GT77 HX 13VI | |
| Média da turma Gaming (95 - 240, n=8, últimos 2 anos) | |
| Lenovo Legion Pro 5 16ARX8 | |
| Shadow of the Tomb Raider - 1920x1080 Highest Preset AA:T | |
| Asus ROG Strix Scar 17 G733PYV-LL053X | |
| Asus ROG Strix Scar 17 G733PY-XS96 | |
| MSI Titan GT77 HX 13VI | |
| Lenovo Legion Pro 5 16ARX8 | |
| Asus ROG Strix Scar 18 2023 G834JY-N6005W | |
| Média da turma Gaming (96 - 116, n=2, últimos 2 anos) | |
| Far Cry 6 - 1920x1080 Ultra Graphics Quality + HD Textures AA:T | |
| Asus ROG Strix Scar 17 G733PYV-LL053X | |
| MSI Titan GT77 HX 13VI | |
| Média da turma Gaming (96.3 - 135.7, n=3, últimos 2 anos) | |
| Asus ROG Strix Scar 17 G733PY-XS96 | |
| Lenovo Legion Pro 5 16ARX8 | |
| Call of Duty Modern Warfare 2 2022 - 1920x1080 Extreme Quality Preset AA:T2X Filmic SM | |
| Asus ROG Strix Scar 17 G733PYV-LL053X | |
| Asus ROG Strix Scar 17 G733PY-XS96 | |
| MSI Titan GT77 HX 13VI | |
| Asus ROG Strix Scar 18 2023 G834JY-N6005W | |
| Lenovo Legion Pro 5 16ARX8 | |
| Cyberpunk 2077 1.6 - 1920x1080 Ultra Preset | |
| Asus ROG Strix Scar 17 G733PYV-LL053X | |
| MSI Titan GT77 HX 13VI | |
| Asus ROG Strix Scar 17 G733PY-XS96 | |
| Alienware m18 R1 | |
| Asus ROG Strix Scar 18 2023 G834JY-N6005W | |
| Lenovo Legion Pro 5 16ARX8 | |
Na resolução QHD, o novo processador também mostrou seus benefícios, embora a diferença não tenha sido tão grande quando comparada com as configurações de 1080p. No total, o Ryzen 9 7945HX3D ainda é capaz de oferecer melhor desempenho do que seus concorrentes - às vezes, ainda o suficiente para garantir uma vantagem percentual de dois dígitos.
| Shadow of the Tomb Raider - 2560x1440 Highest Preset AA:T | |
| Asus ROG Strix Scar 17 G733PYV-LL053X | |
| Asus ROG Strix Scar 17 G733PY-XS96 | |
| MSI Titan GT77 HX 13VI | |
| Lenovo Legion Pro 7 RTX4090 | |
| Far Cry 5 - 2560x1440 Ultra Preset AA:T | |
| Asus ROG Strix Scar 17 G733PYV-LL053X | |
| MSI Titan GT77 HX 13VI | |
| Asus ROG Strix Scar 17 G733PY-XS96 | |
| Far Cry 6 - 2560x1440 Ultra Graphics Quality + HD Textures AA:T | |
| Asus ROG Strix Scar 17 G733PYV-LL053X | |
| MSI Titan GT77 HX 13VI | |
| Asus ROG Strix Scar 17 G733PY-XS96 | |
| Final Fantasy XV Benchmark - 2560x1440 High Quality | |
| MSI Titan GT77 HX 13VI | |
| Alienware m18 R1 | |
| Schenker Key 17 Pro (Early 23) | |
| Lenovo Legion Pro 7 RTX4090 | |
| Asus ROG Strix Scar 17 G733PYV-LL053X | |
| Asus ROG Strix Scar 17 G733PY-XS96 | |
| GTA V - 2560x1440 Highest AA:4xMSAA + FX AF:16x | |
| Asus ROG Strix Scar 17 G733PYV-LL053X | |
| Alienware m18 R1 | |
| Schenker Key 17 Pro (Early 23) | |
| MSI Titan GT77 HX 13VI | |
| Lenovo Legion Pro 7 RTX4090 | |
| Asus ROG Strix Scar 17 G733PY-XS96 | |
| F1 22 - 2560x1440 Ultra High Preset AA:T AF:16x | |
| Alienware m18 R1 | |
| Asus ROG Strix Scar 17 G733PY-XS96 | |
| Asus ROG Strix Scar 17 G733PYV-LL053X | |
| MSI Titan GT77 HX 13VI | |
| Lenovo Legion Pro 7 RTX4090 | |
| Call of Duty Modern Warfare 2 2022 - 2560x1440 Extreme Quality Preset AA:T2X Filmic SM | |
| Asus ROG Strix Scar 17 G733PYV-LL053X | |
| MSI Titan GT77 HX 13VI | |
| Asus ROG Strix Scar 17 G733PY-XS96 | |
| Lenovo Legion Pro 7 RTX4090 | |
| Cyberpunk 2077 1.6 - 2560x1440 Ultra Preset | |
| Asus ROG Strix Scar 17 G733PYV-LL053X | |
| Asus ROG Strix Scar 17 G733PY-XS96 | |
| Alienware m18 R1 | |
| Lenovo Legion Pro 7 RTX4090 | |
| MSI Titan GT77 HX 13VI | |
Na resolução 4K, o novo Ryzen 9 7945HX3D não tem nenhuma vantagem sobre o Ryzen 9 7945HX normal ou sobre os processadores HX móveis da Intel, embora todos os modelos estejam em um nível comparável.
| Shadow of the Tomb Raider - 3840x2160 Highest Preset AA:T | |
| Lenovo Legion Pro 7 RTX4090 | |
| Asus ROG Strix Scar 17 G733PY-XS96 | |
| Asus ROG Strix Scar 17 G733PYV-LL053X | |
| MSI Titan GT77 HX 13VI | |
| Far Cry 5 - 3840x2160 Ultra Preset AA:T | |
| MSI Titan GT77 HX 13VI | |
| Asus ROG Strix Scar 17 G733PYV-LL053X | |
| Asus ROG Strix Scar 17 G733PY-XS96 | |
| Far Cry 6 - 3840x2160 Ultra Graphics Quality + HD Textures AA:T | |
| MSI Titan GT77 HX 13VI | |
| Asus ROG Strix Scar 17 G733PYV-LL053X | |
| Asus ROG Strix Scar 17 G733PY-XS96 | |
| Final Fantasy XV Benchmark - 3840x2160 High Quality | |
| MSI Titan GT77 HX 13VI | |
| Asus ROG Strix Scar 17 G733PY-XS96 | |
| Alienware m18 R1 | |
| Schenker Key 17 Pro (Early 23) | |
| Lenovo Legion Pro 7 RTX4090 | |
| Asus ROG Strix Scar 17 G733PYV-LL053X | |
| GTA V - 3840x2160 High/On (Advanced Graphics Off) AA:FX AF:8x | |
| Asus ROG Strix Scar 17 G733PYV-LL053X | |
| Alienware m18 R1 | |
| MSI Titan GT77 HX 13VI | |
| Lenovo Legion Pro 7 RTX4090 | |
| Asus ROG Strix Scar 17 G733PY-XS96 | |
| Schenker Key 17 Pro (Early 23) | |
| F1 22 - 3840x2160 Ultra High Preset AA:T AF:16x | |
| Lenovo Legion Pro 7 RTX4090 | |
| Asus ROG Strix Scar 17 G733PY-XS96 | |
| Alienware m18 R1 | |
| Asus ROG Strix Scar 17 G733PYV-LL053X | |
| MSI Titan GT77 HX 13VI | |
| Call of Duty Modern Warfare 2 2022 - 3840x2160 Extreme Quality Preset AA:T2X Filmic SM | |
| MSI Titan GT77 HX 13VI | |
| Asus ROG Strix Scar 17 G733PYV-LL053X | |
| Asus ROG Strix Scar 17 G733PY-XS96 | |
| Lenovo Legion Pro 7 RTX4090 | |
| Cyberpunk 2077 1.6 - 3840x2160 Ultra Preset | |
| MSI Titan GT77 HX 13VI | |
| Asus ROG Strix Scar 17 G733PYV-LL053X | |
| Lenovo Legion Pro 7 RTX4090 | |
| Alienware m18 R1 | |
| Asus ROG Strix Scar 17 G733PY-XS96 | |
| baixo | média | alto | ultra | QHD DLSS | QHD | 4K DLSS | 4K | |
|---|---|---|---|---|---|---|---|---|
| GTA V (2015) | 187.1 | 167.7 | 160.6 | 182.7 | ||||
| The Witcher 3 (2015) | 414 | 207 | 163 | 155 | ||||
| Dota 2 Reborn (2015) | 288 | 255 | 244 | 220 | 205 | |||
| Final Fantasy XV Benchmark (2018) | 229 | 180 | 151.2 | 85 | ||||
| X-Plane 11.11 (2018) | 196.3 | 190.3 | 166.2 | 139.5 | ||||
| Far Cry 5 (2018) | 248 | 232 | 218 | 194 | 110 | |||
| Strange Brigade (2018) | 460 | 420 | 318 | 161 | ||||
| Shadow of the Tomb Raider (2018) | 293 | 271 | 199 | 104 | ||||
| Assassin´s Creed Valhalla (2020) | 195 | 178 | 138 | 80 | ||||
| F1 2021 (2021) | 685 | 616 | 470 | 271 | 204 | 115.1 | ||
| Far Cry 6 (2021) | 182 | 167 | 146 | 88 | ||||
| Cyberpunk 2077 1.6 (2022) | 205 | 157 | 116 | 51 | ||||
| F1 22 (2022) | 281 | 135.9 | 91.8 | 45 | ||||
| Call of Duty Modern Warfare 2 2022 (2022) | 190 | 182 | 136 | 83 | ||||
| Star Wars Jedi Survivor (2023) | 106 | 103 | 71 | 39 | ||||
| F1 23 (2023) | 374 | 132 | 85.1 | 73.5 | 42.2 | |||
| Baldur's Gate 3 (2023) | 178.8 | 133.3 | 114 | 74.6 | ||||
| Cyberpunk 2077 (2023) | 158 | 99.5 | 44.2 | |||||
| Alan Wake 2 (2023) | 116.1 | 82 | 43.4 | |||||
| F1 24 (2024) | 144.9 | 150.4 | 96.8 | 83.2 | 48.4 | |||
| Call of Duty Black Ops 6 (2024) | 150 | 129 | 119 | 78 | 76 | |||
| Indiana Jones and the Great Circle (2024) | 128.4 | 117.9 | 100.5 | 60.6 | ||||
| Monster Hunter Wilds (2025) | 85.6 | 81.7 | 69.4 | 58.5 | 42.8 | |||
| Assassin's Creed Shadows (2025) | 55 | 56 | 47 | 46 | 34 |
Emissões - O SCAR 17 tem um incômodo ruído de bobina
Emissões de ruído
É claro que você deve esperar ouvir as ventoinhas em um dispositivo tão potente como esse, mas, ainda assim, o laptop apresenta um modo silencioso que desativa completamente as ventoinhas no uso diário. Isso é muito útil se você estiver navegando na Web, escrevendo e-mails ou assistindo a vídeos. Não é possível jogar nesse modo e, nesse caso, observamos valores de emissão de ruído relativamente decentes de cerca de 41 dB(A). No entanto, infelizmente, notamos alguns ruídos irritantes da bobina durante nossos testes de jogos (e nunca durante qualquer outro uso). Os ventiladores são consideravelmente mais altos nos modos Desempenho e Turbo (~48 dB(A) e 54 dB(A)), o que até abafa o ruído da bobina. Independentemente disso, recomendamos o uso de fones de ouvido em qualquer um desses modos. A tabela a seguir mostra as emissões de ruído do ventilador em vários aplicativos e perfis de energia.
| Cenário | Silencioso | Desempenho | Turbo |
|---|---|---|---|
| 3DMark 06 | 30 dB(A) | 35,5 dB(A) | 53,4 dB(A) |
| The Witcher 3 (configurações Ultra) | 40,9 dB(A) | 48,5 dB(A) | 53,4 dB(A) |
| Cyberpunk 2077 (configurações Ultra) | 40,9 dB(A) | 48,5 dB(A) | 53,4 dB(A) |
| Teste de estresse | 40,9 dB(A) | 48,5 dB(A) | 53,4 dB(A) |
Barulho
| Ocioso |
| 23 / 27.7 / 34.7 dB |
| Carga |
| 53.4 / 53.4 dB |
 | ||
30 dB silencioso 40 dB(A) audível 50 dB(A) ruidosamente alto |
||
min: | ||
| Asus ROG Strix Scar 17 G733PYV-LL053X GeForce RTX 4090 Laptop GPU, R9 7945HX3D, SK hynix PC801 HFS001TEJ9X101N | Asus ROG Strix Scar 17 G733PY-XS96 GeForce RTX 4090 Laptop GPU, R9 7945HX, SK hynix PC801 HFS001TEJ9X101N | Alienware m18 R1 GeForce RTX 4090 Laptop GPU, i9-13980HX, SK hynix PC801 HFS001TEJ9X101N | Asus ROG Strix Scar 18 2023 G834JY-N6005W GeForce RTX 4090 Laptop GPU, i9-13980HX, 2x Samsung PM9A1 MZVL21T0HCLR (RAID 0) | MSI Titan GT77 HX 13VI GeForce RTX 4090 Laptop GPU, i9-13950HX, Samsung PM9A1 MZVL22T0HBLB | Schenker Key 17 Pro (Early 23) GeForce RTX 4090 Laptop GPU, i9-13900HX, Samsung 990 Pro 2 TB MZVL72T0HDLB | |
|---|---|---|---|---|---|---|
| Noise | 9% | 12% | 2% | -5% | -17% | |
| desligado / ambiente * (dB) | 23 | 22.7 1% | 22.8 1% | 23.9 -4% | 24.6 -7% | 26 -13% |
| Idle Minimum * (dB) | 23 | 23.5 -2% | 23 -0% | 23.9 -4% | 29.2 -27% | 26 -13% |
| Idle Average * (dB) | 27.7 | 27.7 -0% | 23 17% | 32.6 -18% | 29.2 -5% | 33 -19% |
| Idle Maximum * (dB) | 34.7 | 27.7 20% | 23 34% | 32.6 6% | 29.2 16% | 46 -33% |
| Load Average * (dB) | 53.4 | 30.5 43% | 35.6 33% | 35.9 33% | 50.7 5% | 56 -5% |
| Witcher 3 ultra * (dB) | 53.4 | 51.4 4% | 51.3 4% | 53.3 -0% | 62 -16% | |
| Load Maximum * (dB) | 53.4 | 54.1 -1% | 56.7 -6% | 55.8 -4% | 61 -14% | 64 -20% |
* ... menor é melhor
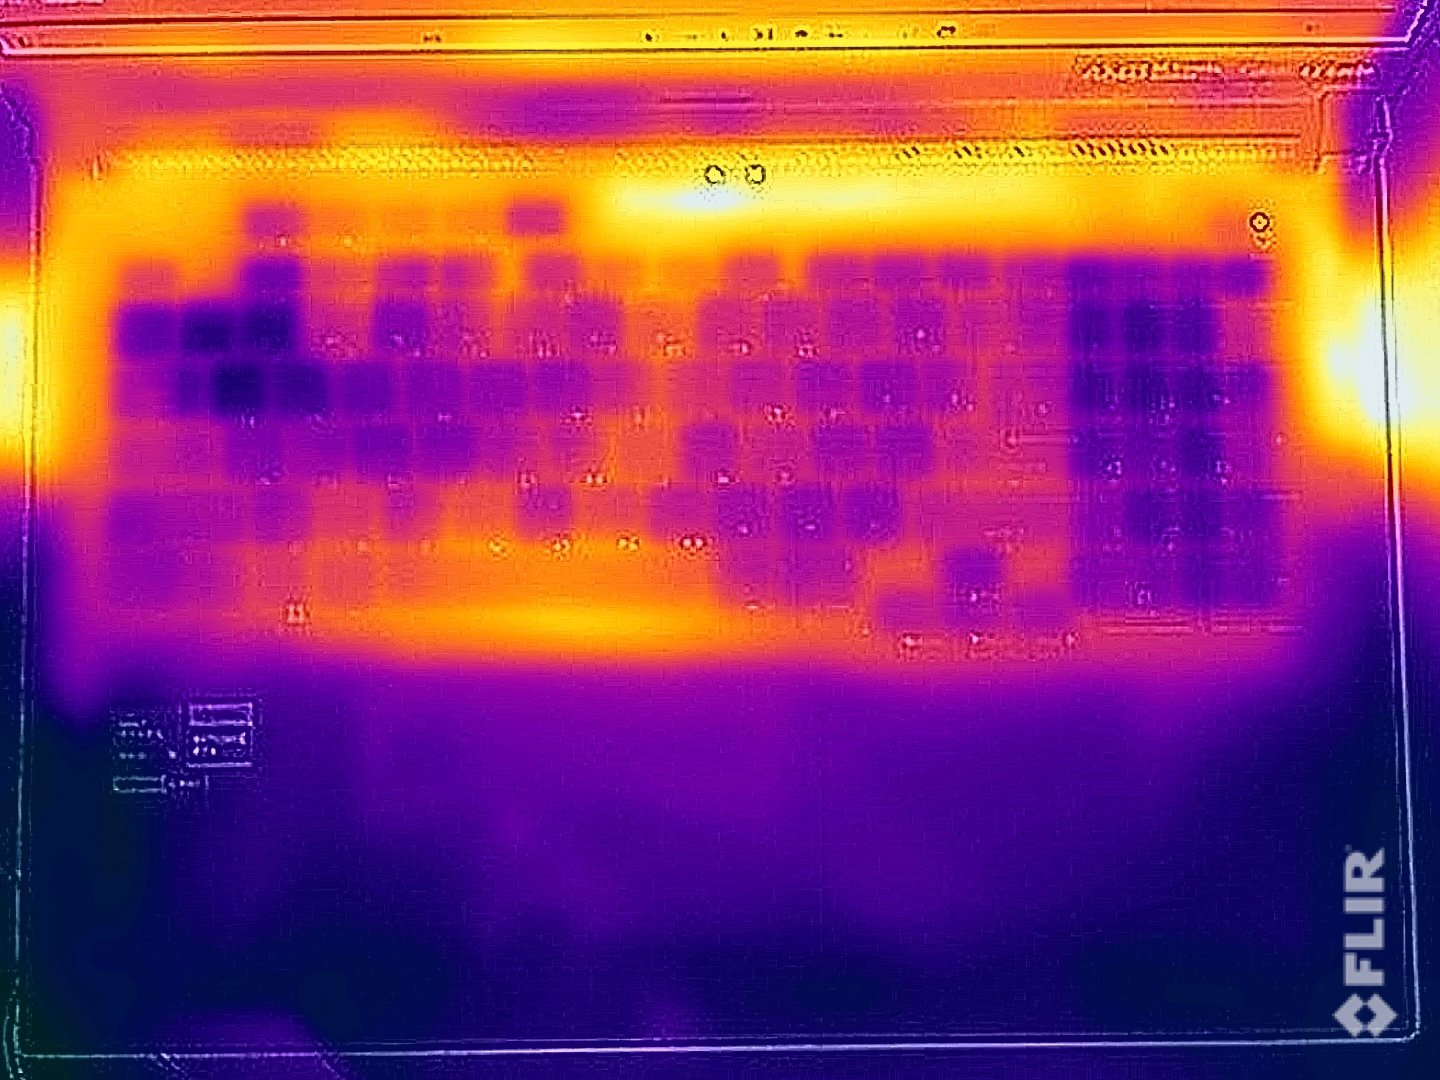
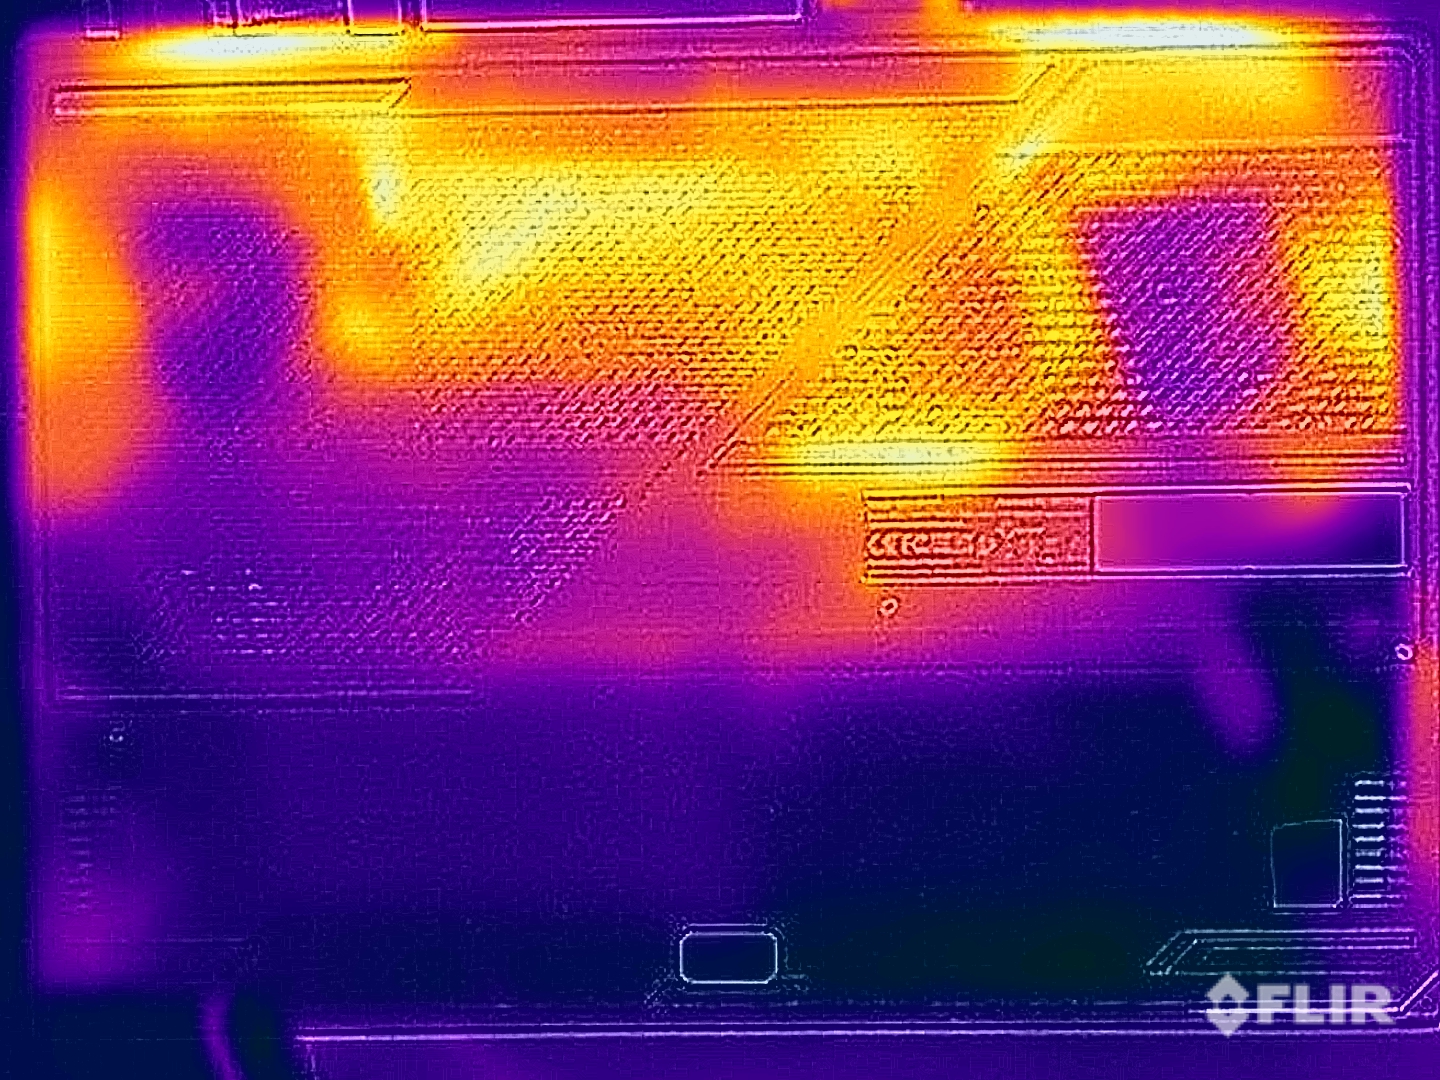
Temperatura
Mesmo sob carga, as temperaturas da superfície do notebook se mostraram totalmente adequadas - você poderia facilmente colocar o SCAR 17 sobre suas coxas enquanto joga sem nenhuma reclamação (embora provavelmente não queira fazer isso devido ao seu tamanho). Durante o teste de estresse, a GPU foi favorecida, o que já estava claro quando se observou as configurações de TDP/TGP. No início do teste, o processador consumia 85 watts e a GPU tinha um consumo de 120 watts - depois de alguns minutos, o processador se equilibrou em 50 watts e a placa de vídeo consumiu 175 watts.
(±) A temperatura máxima no lado superior é 40.1 °C / 104 F, em comparação com a média de 40.4 °C / 105 F , variando de 21.2 a 68.8 °C para a classe Gaming.
(-) A parte inferior aquece até um máximo de 46.7 °C / 116 F, em comparação com a média de 43.2 °C / 110 F
(+) Em uso inativo, a temperatura média para o lado superior é 25.8 °C / 78 F, em comparação com a média do dispositivo de 33.9 °C / ### class_avg_f### F.
(±) Jogando The Witcher 3, a temperatura média para o lado superior é 33.3 °C / 92 F, em comparação com a média do dispositivo de 33.9 °C / ## #class_avg_f### F.
(+) Os apoios para as mãos e o touchpad são mais frios que a temperatura da pele, com um máximo de 25.6 °C / 78.1 F e, portanto, são frios ao toque.
(+) A temperatura média da área do apoio para as mãos de dispositivos semelhantes foi 28.8 °C / 83.8 F (+3.2 °C / 5.7 F).
| Asus ROG Strix Scar 17 G733PYV-LL053X AMD Ryzen 9 7945HX3D, NVIDIA GeForce RTX 4090 Laptop GPU | Asus ROG Strix Scar 17 G733PY-XS96 AMD Ryzen 9 7945HX, NVIDIA GeForce RTX 4090 Laptop GPU | Alienware m18 R1 Intel Core i9-13980HX, NVIDIA GeForce RTX 4090 Laptop GPU | Asus ROG Strix Scar 18 2023 G834JY-N6005W Intel Core i9-13980HX, NVIDIA GeForce RTX 4090 Laptop GPU | MSI Titan GT77 HX 13VI Intel Core i9-13950HX, NVIDIA GeForce RTX 4090 Laptop GPU | Schenker Key 17 Pro (Early 23) Intel Core i9-13900HX, NVIDIA GeForce RTX 4090 Laptop GPU | |
|---|---|---|---|---|---|---|
| Heat | 7% | 4% | -15% | 1% | -29% | |
| Maximum Upper Side * (°C) | 40.1 | 34.6 14% | 39 3% | 54 -35% | 40.6 -1% | 57 -42% |
| Maximum Bottom * (°C) | 46.7 | 35.6 24% | 36.4 22% | 46 1% | 41.1 12% | 60 -28% |
| Idle Upper Side * (°C) | 26.5 | 27.2 -3% | 29.2 -10% | 30 -13% | 26.2 1% | 32 -21% |
| Idle Bottom * (°C) | 27.7 | 30 -8% | 27.8 -0% | 31 -12% | 30.3 -9% | 34 -23% |
* ... menor é melhor
Gerenciamento de energia - Um laptop para jogos com pouca resistência
Consumo de energia
Como era de se esperar, o SCAR 17 X3D consome uma tonelada de energia e, durante o início do teste de estresse, medimos cerca de 328 watts. Depois de um curto período de tempo, esse valor se estabilizou em 300 watts - durante os jogos, ele consumiu entre 260 e 300 watts. Como resultado, a conexão de energia fornecida tem tamanho suficiente.
| desligado | |
| Ocioso | |
| Carga |
|
Key:
min: | |
| Asus ROG Strix Scar 17 G733PYV-LL053X R9 7945HX3D, GeForce RTX 4090 Laptop GPU, SK hynix PC801 HFS001TEJ9X101N, IPS, 2560x1440, 17.3" | Asus ROG Strix Scar 17 G733PY-XS96 R9 7945HX, GeForce RTX 4090 Laptop GPU, SK hynix PC801 HFS001TEJ9X101N, IPS, 2560x1440, 17.3" | Alienware m18 R1 i9-13980HX, GeForce RTX 4090 Laptop GPU, SK hynix PC801 HFS001TEJ9X101N, IPS, 1920x1200, 18" | Asus ROG Strix Scar 18 2023 G834JY-N6005W i9-13980HX, GeForce RTX 4090 Laptop GPU, 2x Samsung PM9A1 MZVL21T0HCLR (RAID 0), IPS, 2560x1600, 18" | MSI Titan GT77 HX 13VI i9-13950HX, GeForce RTX 4090 Laptop GPU, Samsung PM9A1 MZVL22T0HBLB, Mini-LED, 3840x2160, 17.3" | Schenker Key 17 Pro (Early 23) i9-13900HX, GeForce RTX 4090 Laptop GPU, Samsung 990 Pro 2 TB MZVL72T0HDLB, IPS, 3840x2160, 17.3" | Média NVIDIA GeForce RTX 4090 Laptop GPU | Média da turma Gaming | |
|---|---|---|---|---|---|---|---|---|
| Power Consumption | -13% | -46% | -32% | -6% | -10% | -15% | 9% | |
| Idle Minimum * (Watt) | 15.4 | 14.5 6% | 21.6 -40% | 17.3 -12% | 14 9% | 18 -17% | 16.2 ? -5% | 13.1 ? 15% |
| Idle Average * (Watt) | 21.6 | 21.1 2% | 25.2 -17% | 27 -25% | 21.6 -0% | 20 7% | 23.1 ? -7% | 18.8 ? 13% |
| Idle Maximum * (Watt) | 22.2 | 42.8 -93% | 56.7 -155% | 46 -107% | 24.8 -12% | 25 -13% | 34.2 ? -54% | 24.4 ? -10% |
| Load Average * (Watt) | 116.7 | 116.7 -0% | 164.1 -41% | 133 -14% | 122.5 -5% | 136 -17% | 130.5 ? -12% | 108.6 ? 7% |
| Witcher 3 ultra * (Watt) | 262 | 278 -6% | 311 -19% | 265 -1% | 292 -11% | |||
| Cyberpunk 2077 ultra external monitor * (Watt) | 272 | |||||||
| Load Maximum * (Watt) | 327.1 | 279.6 15% | 338.9 -4% | 329 -1% | 418 -28% | 358 -9% | 324 ? 1% | 254 ? 22% |
* ... menor é melhor
Power consumption Witcher 3 / stress test
Power consumption with external monitor
Tempos de execução
Correspondendo ao seu consumo ocioso, a bateria de 90 Wh permitiu tempos de execução entre 4 e 5 horas nos testes de WLAN e vídeo de 60 Hz (dependendo do brilho). Isso não é muito e alguns rivais oferecem mais durabilidade. Embora, em comparação com seu antecessora resistência do laptop tenha pelo menos melhorado um pouco.
| Asus ROG Strix Scar 17 G733PYV-LL053X R9 7945HX3D, GeForce RTX 4090 Laptop GPU, 90 Wh | Asus ROG Strix Scar 17 G733PY-XS96 R9 7945HX, GeForce RTX 4090 Laptop GPU, 90 Wh | Alienware m18 R1 i9-13980HX, GeForce RTX 4090 Laptop GPU, 97 Wh | Asus ROG Strix Scar 18 2023 G834JY-N6005W i9-13980HX, GeForce RTX 4090 Laptop GPU, 90 Wh | MSI Titan GT77 HX 13VI i9-13950HX, GeForce RTX 4090 Laptop GPU, 99.9 Wh | Schenker Key 17 Pro (Early 23) i9-13900HX, GeForce RTX 4090 Laptop GPU, 99 Wh | Média da turma Gaming | |
|---|---|---|---|---|---|---|---|
| Duração da bateria | -15% | -16% | 29% | 29% | 44% | 58% | |
| H.264 (h) | 5 | 7 40% | 6 20% | 8.28 ? 66% | |||
| WiFi v1.3 (h) | 4.8 | 4.1 -15% | 4.3 -10% | 7.1 48% | 5.3 10% | 6.9 44% | 6.96 ? 45% |
| Load (h) | 0.9 | 0.7 -22% | 0.9 0% | 1.4 56% | 1.47 ? 63% | ||
| Witcher 3 ultra (h) | 0.9 |
Pro
Contra
Veredicto - O ROG Strix SCAR 17 X3D agora está ainda mais rápido
Graças ao novoAMD Ryzen 9 9745HX3Do ROG Strix SCAR 17 X3D da Asus agora está ainda mais rápido, o que o torna um dos notebooks para jogos mais rápidos que existem. O novo processador, graças ao 3D V-Cache adicional, é capaz de mostrar aumentos percentuais de desempenho de dois dígitos, especialmente em jogos em 1080p. Em resoluções QHD mais altas, suas vantagens não são tão grandes e, em 4K, realmente não há muita diferença em comparação com o Ryzen 9 7945HX normal.
Como o novo Ryzen 9 7945HX3D não é compatível com metal líquido, seu desempenho máximo de CPU com vários núcleos é, na verdade, um pouco pior do que o Ryzen 9 7945HX normal, como resultado direto de seu resfriamento mais fraco. No final das contas, seus desempenhos são comparáveis no uso diário, e os chips continuam sendo muito mais eficientes do que os processadores HX da Intel.
Graças ao AMD Ryzen 9 7945HX3D, o novo ROG Strix SCAR 17 3DX é ainda mais rápido quando se trata de jogos em resolução Full HD/QHD. Como resultado, ele é promovido a ser o laptop para jogos mais rápido do mercado.
Suas conhecidas falhas permanecem nesse modelo, pois, embora o desempenho seja bom, o design do laptop com seu painel 16:9 parece um pouco desatualizado neste momento. Além disso, gostaríamos de ter visto uma versão mais reservada do ProArt que também pudesse ser usada discretamente como estação de trabalho. O modo silencioso, normalmente prático, mal pode ser usado durante os jogos, pois você ouve constantemente um ruído irritante da bobina e recomendamos definitivamente o uso de fones de ouvido para qualquer outro perfil de energia. O ruído da bobina e a unidade de resfriamento barulhenta também impedem que esse laptop obtenha uma classificação melhor.
Preço e disponibilidade
O novo Asus ROG Strix SCAR 17 X3D estará disponível a partir de 22 de agosto. Assim que tivermos informações oficiais sobre preços, atualizaremos este artigo.
Asus ROG Strix Scar 17 G733PYV-LL053X
- 08/22/2023 v7 (old)
Andreas Osthoff
Transparência
A seleção dos dispositivos a serem analisados é feita pela nossa equipe editorial. A amostra de teste foi fornecida ao autor como empréstimo pelo fabricante ou varejista para fins desta revisão. O credor não teve influência nesta revisão, nem o fabricante recebeu uma cópia desta revisão antes da publicação. Não houve obrigação de publicar esta revisão. Como empresa de mídia independente, a Notebookcheck não está sujeita à autoridade de fabricantes, varejistas ou editores.
É assim que o Notebookcheck está testando
Todos os anos, o Notebookcheck analisa de forma independente centenas de laptops e smartphones usando procedimentos padronizados para garantir que todos os resultados sejam comparáveis. Desenvolvemos continuamente nossos métodos de teste há cerca de 20 anos e definimos padrões da indústria no processo. Em nossos laboratórios de teste, equipamentos de medição de alta qualidade são utilizados por técnicos e editores experientes. Esses testes envolvem um processo de validação em vários estágios. Nosso complexo sistema de classificação é baseado em centenas de medições e benchmarks bem fundamentados, o que mantém a objetividade.Price comparison

