Notebookcheck Logo

Schenker XMG Neo 17 M22 em revisão: Laptop para jogos de alto desempenho com teclas mecânicas Cherry MX

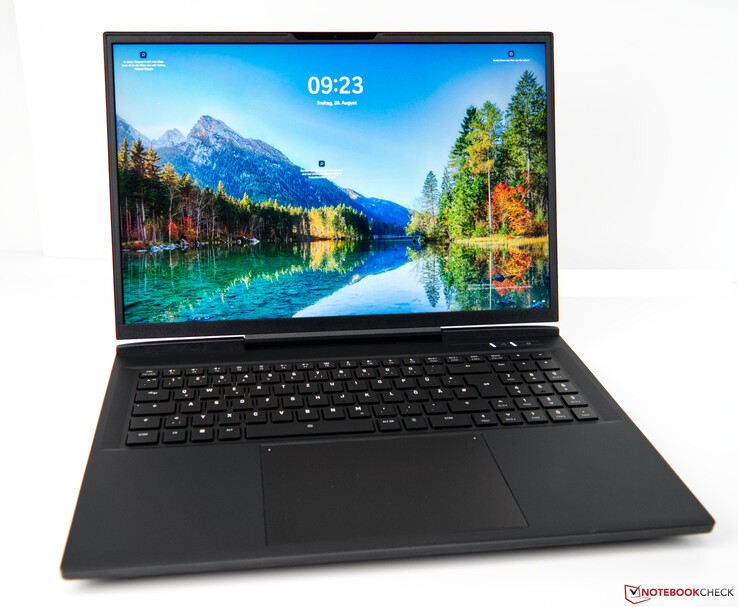
Máximo desempenho! O Schenker XMG Neo 17 quase não se compromete com nada. Com o Ryzen 9 6900HX da AMD e um Nvidia GeForce RTX 3080 Ti Laptop GPU, os gamers têm muito o que se empolgar. Nesta revisão, entraremos em mais detalhes a respeito do desempenho real e das novas características do modelo M22.

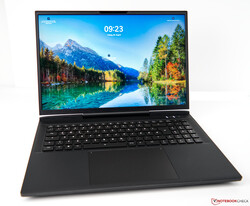
XMG são as três letras que denotam o carro-chefe dos laptops para jogos Schenker. O mais recente Schenker XMG Neo 17, que como o nome sugere, é um laptop de 17 polegadas, também faz parte desta série. Muitos ficarão satisfeitos em descobrir que, ao contrário de muitos outros laptops para jogos, o Schenker usa um display 16:10 que se presta um pouco melhor para tarefas focadas no trabalho. A fim de garantir um nível de desempenho adequado, o fabricante instala o novíssimo Ryzen 9 6900HX em combinação com um Nvidia GeForce RTX 3080 Ti GPU Portátil no chassi moderno. Assim, ele é um dos modelos mais rápidos atualmente disponíveis. Com 32 GB de RAM DDR5 e um SSD de 1-TB, o sistema é bem arredondado. Entretanto, com um preço de cerca de 4200 USD, nossa configuração do Schenker XMG Neo 17 não é exatamente barata.

Os leitores que estão familiarizados com a Schenker saberão quantas opções de configuração o fabricante normalmente oferece. Isto também se aplica a este modelo, para o qual o modelo base começa com a mesma CPU e um GeForce GPU para laptop RTX 3070 Ti a cerca de 2950 USD.

Para fins de comparação, também incluímos dispositivos com especificações similares. A tabela a seguir mostra uma lista desses laptops.

SCHENKER XMG Neo 17 M22 (XMG Neo 17 Serie)
Processador
AMD Ryzen 9 6900HX 8 x 3.3 - 4.9 GHz, 85 W PL2 / Short Burst, 45 W PL1 / Sustained, Rembrandt-H (Zen 3+)
Placa gráfica
NVIDIA GeForce RTX 3080 Ti Laptop GPU - 16 GB VRAM, Análises do: 1590 MHz, Memoría: 2000 MHz, 175 W TDP ( including 25 W Dynamic Boost), Nvidia 516.59, Optimus
Memória
32 GB 
, DDR5-4800, 2 of 2 occupied, up to 64 GB
Pantalha
17.00 polegadas 16:10, 2560 x 1600 pixel 175 PPI, BOE0A99, IPS, Brilhante: não, 240 Hz
placa mãe
AMD Promontory/Bixby FCH
Disco rígido
Samsung SSD 980 Pro 1TB MZ-V8P1T0BW, 1024 GB 
, M.2 SSD, 940 GB livre
Placa de Som
Realtek Audio
Conexões
2 USB 3.0, 2 USB 3.1 Gen2, 1 HDMI, 1 Kensington Lock, Conexões Audio: 2x 3.5mm jack, Card Reader: Card reader (SD/SDHC/SDXC)
Funcionamento em rede
Realtek RTL8125 2.5GBe Family Ethernet Controller (10/100/1000/2500MBit/s), MediaTek RZ608 (a/b/g/n = Wi-Fi 4/ac = Wi-Fi 5/ax = Wi-Fi 6/ Wi-Fi 6E 6 GHz), Bluetooth 5.2
Tamanho
altura x largura x profundidade (em mm): 27 x 381.7 x 272.8
Bateria
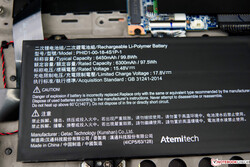
99 Wh Lítio-Polímero
Sistema Operativo
Microsoft Windows 11 Pro
Camera
Webcam: Full HD
Primary Camera: 1 MPix Full HD webcam (Windows Hello supported)
Características adicionais
Alto falantes: Stereo, Teclado: 6-row chiclet with Cherry MX Ultra Low Profile Tactile Switches, Iluminação do Teclado: sim, AC adapter, driver USB thumbdrive, Schenker Control Center, 24 Meses Garantia
peso
2.79 kg, Suprimento de energia: 980 g
Preço
4200 EUR
Note: The manufacturer may use components from different suppliers including display panels, drives or memory sticks with similar specifications.


Possíveis concorrentes em comparação

Rating
Date
Model
Weight
Height
Size
Resolution
Best Price
87.6 %
09/2022
SCHENKER XMG Neo 17 M22
R9 6900HX, GeForce RTX 3080 Ti Laptop GPU
2.8 kg27 mm17.00"2560x1600
88.3 %
08/2022
MSI Titan GT77 12UHS
i9-12900HX, GeForce RTX 3080 Ti Laptop GPU
3.3 kg23 mm17.30"1920x1080
89.9 %
07/2022
Razer Blade 17 Early 2022
i9-12900H, GeForce RTX 3080 Ti Laptop GPU
2.8 kg19.9 mm17.30"3840x2160
87.2 %
06/2022
Acer Predator Triton 500 SE PT516-52s-70KX
i7-12700H, GeForce RTX 3080 Ti Laptop GPU
2.3 kg19.9 mm16.00"2560x1600
88.2 %
05/2022
Asus ROG Zephyrus Duo 16 GX650RX
R9 6900HX, GeForce RTX 3080 Ti Laptop GPU
2.6 kg20.5 mm16.00"3840x2400
86.8 %
07/2022
MSI Raider GE77 HX 12UHS
i9-12900HX, GeForce RTX 3080 Ti Laptop GPU
3.1 kg25.9 mm17.30"3840x2160

Chassi - Base muito robusta

Visualmente, o Schenker XMG Neo 17 é obviamente um laptop Schenker para jogos. Ele parece sutil e omite iluminação RGB brilhante. As superfícies metálicas foscas oferecem uma estética superior, embora as impressões digitais se tornem visíveis nelas após um período de tempo muito curto. O plástico é o material de escolha para as luneiras do display e para a unidade base. Esta última é revestida com uma camada de toque suave. Felizmente, ele é ligeiramente menos suscetível a impressões digitais. Apesar do tamanho, a base é bastante rígida. Sob pressão, o Neo 17 mostra-se robusto e só produz ligeiramente sob uma grande quantidade de pressão. O mesmo vale para a tampa. As dobradiças centralizadas estão à altura da tarefa e evitam bem o excesso de dentes.

Schenker XMG Neo 17
Schenker XMG Neo 17
Schenker XMG Neo 17
Schenker XMG Neo 17
Schenker XMG Neo 17
Schenker XMG Neo 17
Schenker XMG Neo 17
Schenker XMG Neo 17
Schenker XMG Neo 17 M22 (Fonte: Schenker)

Comparação de tamanhos

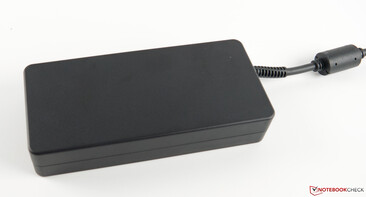
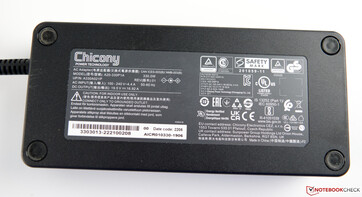
Com 2,8 kg (6,17 lbs), o Schenker XMG Neo 17 cai na faixa do meio em termos de peso. O poderoso adaptador AC de 330 watts pesa quase um quilograma adicional (980 gramas/2,16 lbs).

397 mm 284 mm 25.9 mm 3.1 kg397 mm 330 mm 23 mm 3.3 kg395 mm 260 mm 19.9 mm 2.8 kg381.7 mm 272.8 mm 27 mm 2.8 kg358.5 mm 262.4 mm 19.9 mm 2.3 kg355 mm 266 mm 20.5 mm 2.6 kg297 mm 210 mm 1 mm 5.7 g

Conectividade - Infelizmente sem Thunderbolt 4

O Schenker XMG Neo 17 M22 oferece uma boa variedade de interfaces externas. As três portas USB-A são distribuídas por ambos os lados para uma utilização confortável no dia-a-dia. Enquanto isso, as portas que são usadas com menos freqüência, como HDMI ou LAN, estão localizadas na parte de trás. O adaptador AC também é conectado aqui e, portanto, não interfere com os periféricos enquanto estiver na rede elétrica. Infelizmente, como a tomada do adaptador AC é angular, o uso das portas adjacentes requer mais paciência quando o cabo de força é roteado para o lado direito atrás do dispositivo. Além disso, o plugue do barril pode ser conectado muito facilmente, tornando-o propenso a desconectar acidentalmente.

Esquerda: Kensington Lock, USB-A 3.2 Gen 2, entrada de microfone, saída de fone de ouvido
Certo: Leitor de cartões (SD/SDHC/SDXC), 2x USB-A 3.2 Gen 1
Voltar: Slot para XMG OASIS (com tampa), USB-C 3.2 Gen 2×1 (DisplayPort 1.4a), HDMI 2.1 (compatível com G-SYNC, HDCP 2.3), porta RJ45 2.5 Gb/s (LAN), adaptador AC

Leitor de cartões SD

O Schenker XMG Neo 17 M22 está equipado com um leitor de cartões SD que suporta velocidades USB-3. Com 69 MB/s, seu desempenho ainda está no mesmo nível de dispositivos similares. Tanto o Asus ROG Zephyrus Duo e o Lâmina Razer 17 demonstrar as velocidades das quais nosso cartão de referência (Angelbird AV Pro V60) é capaz com o padrão UHS-II.

SD Card Reader - average JPG Copy Test (av. of 3 runs)
Asus ROG Zephyrus Duo 16 GX650RX
AMD Ryzen 9 6900HX (AV PRO microSD 128 GB V60)
155 MB/s +125%
Razer Blade 17 Early 2022
Intel Core i9-12900H (AV PRO microSD 128 GB V60)
152 MB/s +120%
Average of class Gaming
  (19 - 202, n=100, last 2 years)
98.4 MB/s +43%
MSI Titan GT77 12UHS
Intel Core i9-12900HX (AV PRO microSD 128 GB V60)
69.1 (68.5min - 72.99max) MB/s 0%
SCHENKER XMG Neo 17 M22
AMD Ryzen 9 6900HX (AV PRO microSD 128 GB V60)
69 MB/s
Acer Predator Triton 500 SE PT516-52s-70KX
Intel Core i7-12700H (AV PRO microSD 128 GB V60)
68 MB/s -1%
MSI Raider GE77 HX 12UHS
Intel Core i9-12900HX (AV PRO microSD 128 GB V60)
60 MB/s -13%

Comunicação

Módulo Wi-Fi
Módulo Wi-Fi

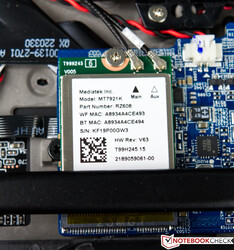
A Schenker utiliza um AMD RZ608 como o módulo Wi-Fi de escolha em nosso dispositivo. A opção base não é capaz de superar seus concorrentes em nossos testes. O Intel Wi-Fi 6 AX200 e o Rivet Networks Killer Wi-Fi 6 AX1650x estão disponíveis como opções alternativas de configuração. Também gostaríamos de ter visto uma opção Wi-Fi 6E. A rede cabeada é possível a até 2,5 Gb/s - uma boa escolha.

Networking
iperf3 transmit AXE11000
Asus ROG Zephyrus Duo 16 GX650RX
MediaTek Wi-Fi 6E MT7922 160MHz Wireless LAN Card
1695 (1556min - 1768max) MBit/s +81%
MSI Titan GT77 12UHS
Killer Wi-Fi 6E AX1675i 160MHz Wireless Network Adapter
1610 (1421min - 1675max) MBit/s +72%
Acer Predator Triton 500 SE PT516-52s-70KX
Intel AX1675s 160MHz (211NGW)
1565 (988min - 1682max) MBit/s +67%
Average of class Gaming
  (469 - 1793, n=153, last 2 years)
1272 MBit/s +36%
SCHENKER XMG Neo 17 M22
MediaTek RZ608
936 (898min - 971max) MBit/s
Average MediaTek RZ608
  (572 - 979, n=19)
855 MBit/s -9%
iperf3 receive AXE11000
Asus ROG Zephyrus Duo 16 GX650RX
MediaTek Wi-Fi 6E MT7922 160MHz Wireless LAN Card
1692 (1567min - 1738max) MBit/s +75%
MSI Titan GT77 12UHS
Killer Wi-Fi 6E AX1675i 160MHz Wireless Network Adapter
1691 (1589min - 1731max) MBit/s +75%
Razer Blade 17 Early 2022
Killer Wi-Fi 6E AX1690i 160MHz
1672 (864min - 1737max) MBit/s +73%
Acer Predator Triton 500 SE PT516-52s-70KX
Intel AX1675s 160MHz (211NGW)
1664 (1649min - 1680max) MBit/s +72%
Average of class Gaming
  (685 - 1890, n=159, last 2 years)
1403 MBit/s +45%
SCHENKER XMG Neo 17 M22
MediaTek RZ608
967 (949min - 978max) MBit/s
Average MediaTek RZ608
  (430 - 975, n=19)
883 MBit/s -9%
0501001502002503003504004505005506006507007508008509009501000105011001150120012501300135014001450150015501600165017001750Tooltip
SCHENKER XMG Neo 17 M22 MediaTek RZ608; iperf3 receive AXE11000; iperf 3.1.3: Ø966 (949-978)
MSI Titan GT77 12UHS Killer Wi-Fi 6E AX1675i 160MHz Wireless Network Adapter; iperf3 receive AXE11000; iperf 3.1.3: Ø1691 (1589-1731)
Razer Blade 17 Early 2022 Killer Wi-Fi 6E AX1690i 160MHz; iperf3 receive AXE11000; iperf 3.1.3: Ø1642 (864-1737)
Acer Predator Triton 500 SE PT516-52s-70KX Intel AX1675s 160MHz (211NGW); iperf3 receive AXE11000; iperf 3.1.3: Ø1663 (1649-1680)
Asus ROG Zephyrus Duo 16 GX650RX MediaTek Wi-Fi 6E MT7922 160MHz Wireless LAN Card; iperf3 receive AXE11000; iperf 3.1.3: Ø1691 (1567-1738)
SCHENKER XMG Neo 17 M22 MediaTek RZ608; iperf3 transmit AXE11000; iperf 3.1.3: Ø936 (898-971)
MSI Titan GT77 12UHS Killer Wi-Fi 6E AX1675i 160MHz Wireless Network Adapter; iperf3 transmit AXE11000; iperf 3.1.3: Ø1610 (1421-1675)
Acer Predator Triton 500 SE PT516-52s-70KX Intel AX1675s 160MHz (211NGW); iperf3 transmit AXE11000; iperf 3.1.3: Ø1565 (988-1682)
Asus ROG Zephyrus Duo 16 GX650RX MediaTek Wi-Fi 6E MT7922 160MHz Wireless LAN Card; iperf3 transmit AXE11000; iperf 3.1.3: Ø1695 (1556-1768)

Webcam

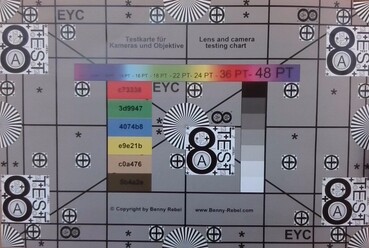
Não há muitos laptops de jogos com boas webcams. Da mesma forma, a webcam do Schenker XMG Neo 17 está faltando tanto em termos de precisão de cores quanto de nitidez, como mostram nossas imagens. Como a câmera integrada suporta "Windows Hello", ela pode ser usada como um método de autenticação.
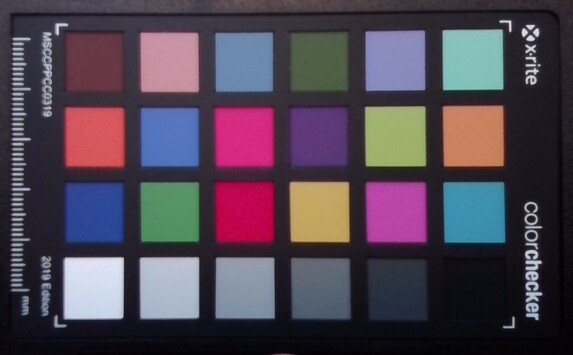
ColorChecker
14 ∆E
15.3 ∆E
5.9 ∆E
5.5 ∆E
4.6 ∆E
6.9 ∆E
26 ∆E
9.9 ∆E
13.9 ∆E
3.8 ∆E
7.8 ∆E
20.5 ∆E
4 ∆E
6.3 ∆E
9.3 ∆E
13.7 ∆E
6.5 ∆E
5.4 ∆E
10.2 ∆E
8.9 ∆E
9.5 ∆E
12.3 ∆E
14.6 ∆E
12 ∆E
ColorChecker SCHENKER XMG Neo 17 M22: 10.28 ∆E min: 3.83 - max: 26 ∆E

Acessórios

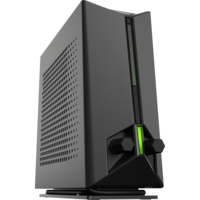
Schenker XMG Oasis (resfriamento de água externo para Neo 15 (E22, Neo 15 (M22) e Neo 17 (M22))
XMG Oasis (Fonte: Schenker)

O escopo da entrega inclui o próprio dispositivo, um adaptador AC de 330 watts, e um thumbdrive USB com drivers. Com o Oasis Schenker, o XMG Neo 17 M22 oferece uma solução de resfriamento de água externa opcional. Ele está disponível separadamente por aproximadamente 200 USD na loja online da Schenker.

Manutenção

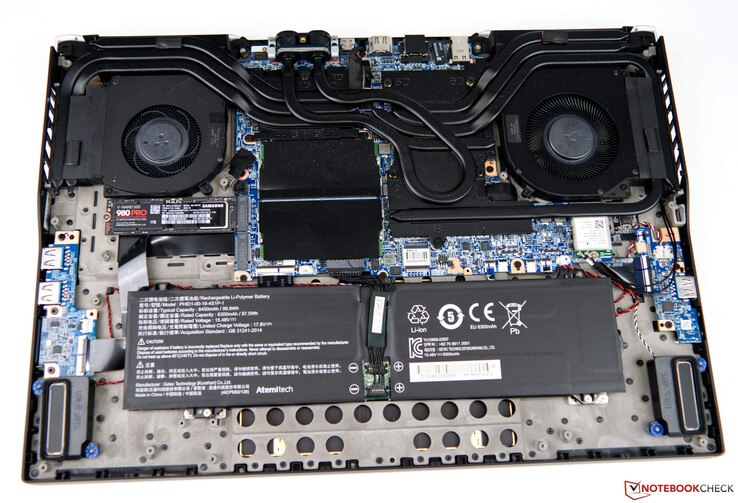
Como não há nenhuma escotilha de manutenção no Schenker XMG Neo 17 para acesso rápido à RAM e SSD, a troca destes componentes é um pouco difícil. Como resultado, a placa inferior tem que ser removida, o que não é uma tarefa simples devido aos muitos grampos plásticos que a prendem ainda mais. Independentemente disso, a tampa inferior pode ser removida com um yank firme de baixo, perto das aberturas de ar.

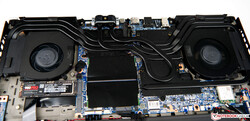
Schenker XMG Neo 17 M22 internos

Garantia

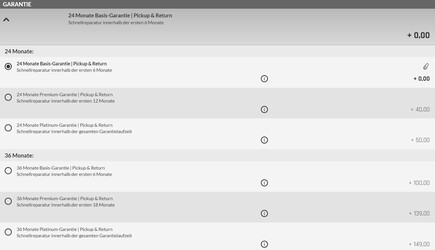
O Schenker XMG Neo 17 vem com uma garantia básica de 24 meses, incluindo 6 meses de reparo rápido com serviço de coleta e devolução. Durante o processo de pedido, há várias outras opções. Por um prêmio de cerca de 150 USD, a garantia pode ser estendida para 36 meses, incluindo o serviço de reparo rápido por toda a duração.

Opções de garantia Schenker XMG Neo 17

Dispositivos de entrada - Chaves MX Cherry - mas não para todas as chaves?

Teclado

Teclado
Teclado
Teclado (iluminado)
Teclado (iluminado)

O laptop de 17 polegadas possui um teclado mecânico baseado em interruptores Cherry MX. Eles são conhecidos por sua robustez e extrema longevidade. Eles oferecem um deslocamento superficial de apenas 1,8 mm e um ponto de atuação distinto para um bom feedback geral. Como as teclas não são umedecidas, não há uma sensação esponjosa durante a digitação. Os teclados mecânicos raramente oferecem um ruído de teclas silencioso. Isto também é válido para o XMG Neo 17. Os usuários devem ter certeza de sua preferência e tolerância a cliques audíveis distintos. Aqueles que preferem teclados silenciosos podem querer procurar em outro lugar.

Há uma explicação plausível para que a Schenker não use interruptores Cherry MX para todas as teclas. Devido a restrições de espaço, as teclas de meia altura da primeira fila não podem usar interruptores mecânicos. Isto deixa o teclado numérico, que também depende de interruptores com cúpula de borracha padrão. De acordo com o fabricante, esta decisão foi tomada para reduzir o peso e os custos. Acústicamente, os interruptores tradicionais são significativamente mais silenciosos e as prensas características das teclas de cúpula de borracha se sentem um pouco atenuadas, embora este comportamento não seja muito pronunciado neste caso.

A luz de fundo do teclado pode ser ajustada através do Centro de Controle. Os usuários são capazes de escolher entre vários efeitos e toda a paleta de cores.

Touchpad

Touchpad / Clickpad
Touchpad / Clickpad

Com 15,5 x 10 centímetros, o touchpad é muito grande e potencialmente até mesmo grande demais para alguns usuários. A fim de neutralizar isto, o lado direito da superfície de entrada pode ser desativado. Neste caso, não há nenhuma pista visual ou táctil que mostre onde o touchpad termina. Os usuários que não precisam do clickpad também podem desabilitá-lo completamente. Isto pode ser feito pressionando duas vezes o ponto branco próximo ao canto superior esquerdo. A superfície de vidro é ligeiramente acetinada para uma experiência um pouco mais confortável para o usuário com os dedos suados. Encontramos um pequeno problema com a capacidade de resposta do clickpad perto das bordas. Embora respondesse de forma mais lenta, seu grande tamanho compensa em grande parte isso. Os dois botões na parte inferior do tapete funcionam bem e oferecem cliques relativamente silenciosos.

Mostrador - 240 Hz e 16:10 Form Factor

Subpixel
Subpixel
Pequena luz de fundo sangrando perto das bordas

O painel IPS de 17 polegadas 240-Hz é fixado no Schenker XMG Neo 17. O formato 16:10 oferece algumas vantagens em relação ao formato 16:9 mais comum, particularmente quando se trata de produtividade.

Embora de acordo com nossas medidas, o painel atinge um bom nível de brilho de 399 lêndeas, alguns concorrentes são capazes de produzir resultados ainda melhores. Em justiça, nosso valor medido excede ligeiramente as especificações do XMG Neo 17 (folha de dados: 380 lêndeas). O contraste sofre um pouco com uma combinação de brilho e valor negro, resultando em uma proporção de apenas 965:1. Isto ainda é significativamente melhor em comparação com os dois concorrentes MSI.

É improvável que os usuários experimentem tensão ocular devido ao PWM com o Schenker XMG Neo 17. No entanto, há um pequeno sangramento de luz de fundo. No entanto, isso só se torna aparente em cenas escuras perto das bordas.

385
cd/m²
373
cd/m²
384
cd/m²
407
cd/m²
415
cd/m²
399
cd/m²
416
cd/m²
408
cd/m²
407
cd/m²
Distribuição do brilho
BOE0A99 tested with X-Rite i1Pro 2
Máximo: 416 cd/m² (Nits) Médio: 399.3 cd/m² Minimum: 20 cd/m²
iluminação: 90 %
iluminação com acumulador: 415 cd/m²
Contraste: 965:1 (Preto: 0.43 cd/m²)
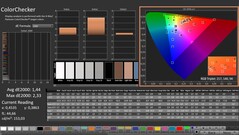
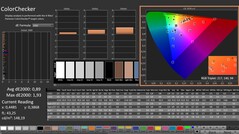
ΔE Color 1.44 | 0.5-29.43 Ø5, calibrated: 0.89
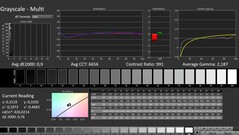
ΔE Greyscale 1.8 | 0.57-98 Ø5.3
69.6% AdobeRGB 1998 (Argyll 2.2.0 3D)
99.8% sRGB (Argyll 2.2.0 3D)
69% Display P3 (Argyll 2.2.0 3D)
Gamma: 2.132
SCHENKER XMG Neo 17 M22
BOE0A99, IPS, 2560x1600, 17.00
MSI Titan GT77 12UHS
Sharp SHP1544 LQ173M1JW08, IPS-Level, 1920x1080, 17.30
Razer Blade 17 Early 2022
AU Optronics B173ZAN06.9, IPS, 3840x2160, 17.30
Acer Predator Triton 500 SE PT516-52s-70KX
NE160QDM-NZ2, IPS LED, 2560x1600, 16.00
Asus ROG Zephyrus Duo 16 GX650RX
BOE NE160QAM-NX1, IPS-Level, 3840x2400, 16.00
MSI Raider GE77 HX 12UHS
AU Optronics B173ZAN06.1, IPS, 3840x2160, 17.30
Display
2%
23%
21%
22%
21%
Display P3 Coverage
69
70.8
3%
99.4
44%
97.3
41%
98
42%
96.6
40%
sRGB Coverage
99.8
98.9
-1%
100
0%
100
0%
99.9
0%
99.8
0%
AdobeRGB 1998 Coverage
69.6
73
5%
87.3
25%
84.9
22%
86.3
24%
85.8
23%
Response Times
43%
20%
-17%
-14%
27%
Response Time Grey 50% / Grey 80% *
10.8 ?(5.1, 5.7)
3.03 ?(1.28, 1.75)
72%
7.5 ?(2.1, 5.4)
31%
13.8 ?(6.3, 7.5)
-28%
14.6 ?(6.7, 7.9)
-35%
5.8 ?(1.6, 4.2)
46%
Response Time Black / White *
6.1 ?(2.5, 3.6)
5.28 ?(2.32, 2.96)
13%
5.6 ?(1.6, 4)
8%
6.4 ?(1.8, 4.6)
-5%
5.6 ?(2, 3.6)
8%
5.6 ?(1.9, 3.7)
8%
PWM Frequency
Screen
-50%
5%
-7%
-58%
-42%
Brightness middle
415
280
-33%
503
21%
498
20%
459
11%
381
-8%
Brightness
399
275
-31%
486
22%
468
17%
434
9%
371
-7%
Brightness Distribution
90
79
-12%
84
-7%
80
-11%
88
-2%
84
-7%
Black Level *
0.43
0.4
7%
0.44
-2%
0.36
16%
0.44
-2%
0.52
-21%
Contrast
965
700
-27%
1143
18%
1383
43%
1043
8%
733
-24%
Colorchecker dE 2000 *
1.44
2.1
-46%
1.08
25%
1.77
-23%
2.97
-106%
Colorchecker dE 2000 max. *
2.33
5.83
-150%
4.54
-95%
5.24
-125%
8.13
-249%
Colorchecker dE 2000 calibrated *
0.89
1.58
-78%
0.6
33%
0.63
29%
1.03
-16%
2.53
-184%
Greyscale dE 2000 *
1.8
3.3
-83%
1.3
28%
2.4
-33%
4.9
-172%
Gamma
2.132 103%
2.13 103%
2.151 102%
2.14 103%
2.235 98%
CCT
6327 103%
7060 92%
6541 99%
7046 92%
6775 96%
Total Average (Program / Settings)
-2% / -26%
16% / 11%
-1% / -3%
-17% / -34%
2% / -12%

* ... smaller is better

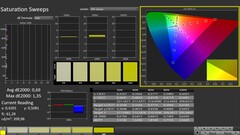
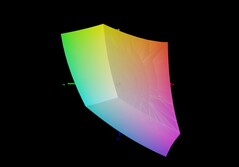
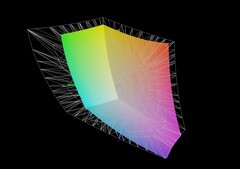
A qualidade de exibição é boa em toda a superfície e não observamos a granulosidade devido à camada de exibição fosca. Além disso, nossas medidas indicam que a Schenker pré-calibra a exibição do Schenker Neo 17. Ex-fábrica, registramos valores de escala de cinza e deltaE-2000 de cor inferior a 3 cada, o que é a faixa ideal. Independentemente disso, conseguimos melhorar ainda mais estes resultados através da calibração manual do display. O Neo 17 atinge a cobertura do espaço de cor sRGB anunciado de 99%. Entretanto, ele cobre apenas 69 por cento dos espaços de cor estendidos AdobeRGB e P3, tornando-o inadequado para qualquer coisa além da edição não-profissional de fotos e vídeos.

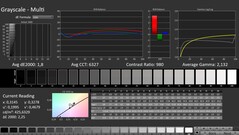
CalMAN: Escala de cinza
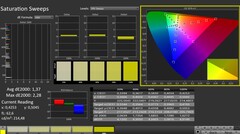
CalMAN: Saturação
CalMAN: Saturação
CalMAN: ColorChecker
CalMAN: Escala de cinza (calibrada)
CalMAN: Saturação (calibrada)
CalMAN: ColorChecker (calibrado)
XMG Neo 17 M22 vs sRGB
XMG Neo 17 M22 vs AdobeRGB
XMG Neo 17 M22 vs P3

Display Response Times

Display response times show how fast the screen is able to change from one color to the next. Slow response times can lead to afterimages and can cause moving objects to appear blurry (ghosting). Gamers of fast-paced 3D titles should pay special attention to fast response times.
       Response Time Black to White
6.1 ms ... rise ↗ and fall ↘ combined↗ 2.5 ms rise
↘ 3.6 ms fall
The screen shows very fast response rates in our tests and should be very well suited for fast-paced gaming.
In comparison, all tested devices range from 0.1 (minimum) to 240 (maximum) ms. » 15 % of all devices are better.
This means that the measured response time is better than the average of all tested devices (21.5 ms).
       Response Time 50% Grey to 80% Grey
10.8 ms ... rise ↗ and fall ↘ combined↗ 5.1 ms rise
↘ 5.7 ms fall
The screen shows good response rates in our tests, but may be too slow for competitive gamers.
In comparison, all tested devices range from 0.2 (minimum) to 636 (maximum) ms. » 19 % of all devices are better.
This means that the measured response time is better than the average of all tested devices (33.7 ms).

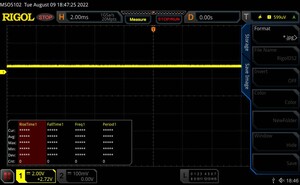
Screen Flickering / PWM (Pulse-Width Modulation)

To dim the screen, some notebooks will simply cycle the backlight on and off in rapid succession - a method called Pulse Width Modulation (PWM) . This cycling frequency should ideally be undetectable to the human eye. If said frequency is too low, users with sensitive eyes may experience strain or headaches or even notice the flickering altogether.
Screen flickering / PWM not detected

In comparison: 53 % of all tested devices do not use PWM to dim the display. If PWM was detected, an average of 17915 (minimum: 5 - maximum: 3846000) Hz was measured.

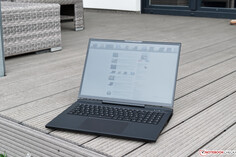
O revestimento da tela fosca é bem adequado para uso externo. Independentemente disso, a legibilidade é limitada fora da sombra. Em particular, os usuários devem evitar o uso da tela sob luz solar direta.

Schenker XMG Neo 17 M22 em um dia nublado
Schenker XMG Neo 17 M22 sob o sol
Schenker XMG Neo 17 M22 sob a sombra

O teste do ângulo de visão mostra um resultado que é característico de um painel IPS. Apenas as imagens de quatro cantos mostram pequenos desvios de cor que não estarão presentes durante o uso normal.

Schenker XMG Neo 17 M22 ângulos de visão

Desempenho - AMD e Nvidia United

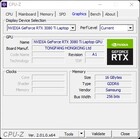
Com oAMD Ryzen 9 6900HX e oNvidia GeForce RTX 3080 Ti GPU laptopnosso dispositivo de teste está pronto para os últimos jogos com o máximo de detalhes em um laptop. A generosa configuração de memória do sistema de 32 GB deixa aos usuários mais do que suficiente espaço de manobra e suporta o novo padrão DDR5. De maneira típica da Schenker, os usuários podem ajustar a configuração de acordo com suas preferências e criar um sistema ideal. A CPU e o painel de 17 polegadas são fixos, no entanto.

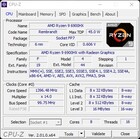
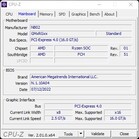
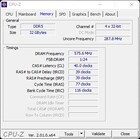
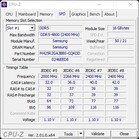
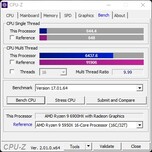
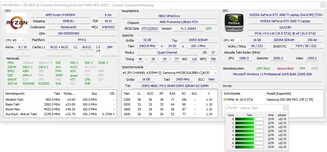
CPU-Z
CPU-Z
CPU-Z
CPU-Z
CPU-Z
CPU-Z
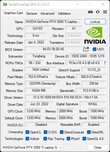
GPU-Z
GPU-Z
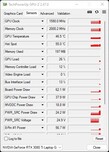
HWiNFO
 

Condições de teste

O próprio Centro de Controle da Schenker inclui perfis de ventiladores pré-definidos, que também afetam o comportamento dos ventiladores a longo prazo. Para alcançar as melhores pontuações, definimos o Schenker XMG Neo 17 M22 como "Overboost" antes de executar qualquer um dos seguintes benchmarks.

Processador

AMD Ryzen 9 6900HX durante o laço Cinebench R15

O AMD Ryzen 9 6900HX é uma CPU octa-core baseada na mais recente arquitetura Zen-3. O SoC tem uma velocidade de relógio de 3,3-4,9 GHz e suporta SMT para um total de 16 roscas. Entretanto, o AMD Ryzen 9 6900HX enfrenta uma dura competição com a Intel 12th Gen, que pode ser significativamente mais rápida em uma comparação direta.

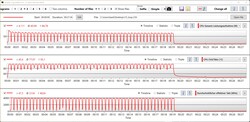
O AMD Ryzen 9 6900HX no Schenker XMG Neo 17 M22 é capaz de manter um nível de desempenho consistente durante nosso teste. Deve-se notar que o desempenho da CPU cai cerca de 10% no modo de bateria.

Mais benchmarks podem ser encontrados em nosso Tabela comparativa de CPU.

Cinebench R15 Multi Loop

018036054072090010801260144016201800198021602340252027002880306032403420Tooltip
SCHENKER XMG Neo 17 M22 AMD Ryzen 9 6900HX: Ø2230 (2203.37-2292.39)
MSI Titan GT77 12UHS Intel Core i9-12900HX: Ø3311 (3259.45-3569.52)
Razer Blade 17 Early 2022 Intel Core i9-12900H: Ø1562 (1542.73-1850.99)
Acer Predator Triton 500 SE PT516-52s-70KX Intel Core i7-12700H: Ø2490 (2422.04-2631.06)
Asus ROG Zephyrus Duo 16 GX650RX AMD Ryzen 9 6900HX: Ø2247 (2222.47-2257.72)
MSI Raider GE77 HX 12UHS Intel Core i9-12900HX: Ø3290 (2874.6-3561.89)
Cinebench R15
Cinebench R15
Cinebench R15 (modo de bateria)
Cinebench R20
Cinebench R20
Cinebench R23
Cinebench R23
CPU Performance Rating: Percent
Cinebench R23: Multi Core | Single Core
Cinebench R20: CPU (Multi Core) | CPU (Single Core)
Cinebench R15: CPU Multi 64Bit | CPU Single 64Bit
Blender: v2.79 BMW27 CPU
7-Zip 18.03: 7z b 4 | 7z b 4 -mmt1
Geekbench 5.5: Multi-Core | Single-Core
HWBOT x265 Benchmark v2.2: 4k Preset
LibreOffice : 20 Documents To PDF
R Benchmark 2.5: Overall mean
CPU Performance Rating
MSI Raider GE77 HX 12UHS
Intel Core i9-12900HX
84.8 pt
MSI Titan GT77 12UHS
Intel Core i9-12900HX
84.7 pt
Average of class Gaming
 
73.6 pt
Acer Predator Triton 500 SE PT516-52s-70KX
Intel Core i7-12700H
66.8 pt
Asus ROG Zephyrus Duo 16 GX650RX
AMD Ryzen 9 6900HX
61.7 pt
SCHENKER XMG Neo 17 M22
AMD Ryzen 9 6900HX
60.5 pt
Average AMD Ryzen 9 6900HX
 
58.7 pt
Razer Blade 17 Early 2022
Intel Core i9-12900H
58.2 pt
Cinebench R23 / Multi Core
MSI Raider GE77 HX 12UHS
Intel Core i9-12900HX
23124 Points +63%
MSI Titan GT77 12UHS
Intel Core i9-12900HX
22982 Points +62%
Average of class Gaming
  (2435 - 34613, n=230, last 2 years)
19470 Points +38%
Acer Predator Triton 500 SE PT516-52s-70KX
Intel Core i7-12700H
16887 Points +19%
SCHENKER XMG Neo 17 M22
AMD Ryzen 9 6900HX
14152 Points
Asus ROG Zephyrus Duo 16 GX650RX
AMD Ryzen 9 6900HX
14085 Points 0%
Average AMD Ryzen 9 6900HX
  (9709 - 15100, n=19)
13307 Points -6%
Razer Blade 17 Early 2022
Intel Core i9-12900H
10522 Points -26%
Cinebench R23 / Single Core
MSI Titan GT77 12UHS
Intel Core i9-12900HX
1913 Points +23%
Razer Blade 17 Early 2022
Intel Core i9-12900H
1908 Points +23%
MSI Raider GE77 HX 12UHS
Intel Core i9-12900HX
1907 Points +22%
Average of class Gaming
  (527 - 2235, n=228, last 2 years)
1811 Points +16%
Acer Predator Triton 500 SE PT516-52s-70KX
Intel Core i7-12700H
1743 Points +12%
Asus ROG Zephyrus Duo 16 GX650RX
AMD Ryzen 9 6900HX
1566 Points +1%
Average AMD Ryzen 9 6900HX
  (1516 - 1616, n=19)
1565 Points +1%
SCHENKER XMG Neo 17 M22
AMD Ryzen 9 6900HX
1557 Points
Cinebench R20 / CPU (Multi Core)
MSI Raider GE77 HX 12UHS
Intel Core i9-12900HX
8828 Points +59%
MSI Titan GT77 12UHS
Intel Core i9-12900HX
8667 Points +56%
Average of class Gaming
  (930 - 13769, n=228, last 2 years)
7402 Points +33%
Acer Predator Triton 500 SE PT516-52s-70KX
Intel Core i7-12700H
6352 Points +14%
SCHENKER XMG Neo 17 M22
AMD Ryzen 9 6900HX
5549 Points
Asus ROG Zephyrus Duo 16 GX650RX
AMD Ryzen 9 6900HX
5489 Points -1%
Average AMD Ryzen 9 6900HX
  (3742 - 5813, n=19)
5162 Points -7%
Razer Blade 17 Early 2022
Intel Core i9-12900H
4069 Points -27%
Cinebench R20 / CPU (Single Core)
MSI Raider GE77 HX 12UHS
Intel Core i9-12900HX
742 Points +23%
MSI Titan GT77 12UHS
Intel Core i9-12900HX
738 Points +22%
Razer Blade 17 Early 2022
Intel Core i9-12900H
699 Points +16%
Average of class Gaming
  (169 - 855, n=228, last 2 years)
697 Points +15%
Acer Predator Triton 500 SE PT516-52s-70KX
Intel Core i7-12700H
640 Points +6%
Average AMD Ryzen 9 6900HX
  (595 - 631, n=19)
610 Points +1%
SCHENKER XMG Neo 17 M22
AMD Ryzen 9 6900HX
605 Points
Asus ROG Zephyrus Duo 16 GX650RX
AMD Ryzen 9 6900HX
595 Points -2%
Cinebench R15 / CPU Multi 64Bit
MSI Titan GT77 12UHS
Intel Core i9-12900HX
3570 (3259.45min - 3569.52max) Points +55%
MSI Raider GE77 HX 12UHS
Intel Core i9-12900HX
3562 Points +55%
Average of class Gaming
  (400 - 5663, n=232, last 2 years)
3082 Points +34%
Acer Predator Triton 500 SE PT516-52s-70KX
Intel Core i7-12700H
2631 (2422.04min - 2631.06max) Points +15%
SCHENKER XMG Neo 17 M22
AMD Ryzen 9 6900HX
2296 Points
Asus ROG Zephyrus Duo 16 GX650RX
AMD Ryzen 9 6900HX
2292 Points 0%
Average AMD Ryzen 9 6900HX
  (1588 - 2411, n=19)
2163 Points -6%
Razer Blade 17 Early 2022
Intel Core i9-12900H
1851 Points -19%
Cinebench R15 / CPU Single 64Bit
MSI Raider GE77 HX 12UHS
Intel Core i9-12900HX
280 Points +13%
MSI Titan GT77 12UHS
Intel Core i9-12900HX
278 Points +12%
Average of class Gaming
  (79.2 - 318, n=231, last 2 years)
268 Points +8%
Razer Blade 17 Early 2022
Intel Core i9-12900H
258 Points +4%
Average AMD Ryzen 9 6900HX
  (241 - 261, n=19)
250 Points +1%
Asus ROG Zephyrus Duo 16 GX650RX
AMD Ryzen 9 6900HX
249 Points 0%
SCHENKER XMG Neo 17 M22
AMD Ryzen 9 6900HX
248 Points
Acer Predator Triton 500 SE PT516-52s-70KX
Intel Core i7-12700H
231 Points -7%
Blender / v2.79 BMW27 CPU
Razer Blade 17 Early 2022
Intel Core i9-12900H
307 Seconds * -42%
Average AMD Ryzen 9 6900HX
  (212 - 357, n=21)
239 Seconds * -11%
Asus ROG Zephyrus Duo 16 GX650RX
AMD Ryzen 9 6900HX
220 Seconds * -2%
SCHENKER XMG Neo 17 M22
AMD Ryzen 9 6900HX
216 Seconds *
Average of class Gaming
  (87 - 1259, n=226, last 2 years)
200 Seconds * +7%
Acer Predator Triton 500 SE PT516-52s-70KX
Intel Core i7-12700H
197.6 Seconds * +9%
MSI Raider GE77 HX 12UHS
Intel Core i9-12900HX
150.5 Seconds * +30%
MSI Titan GT77 12UHS
Intel Core i9-12900HX
147 Seconds * +32%
7-Zip 18.03 / 7z b 4
MSI Raider GE77 HX 12UHS
Intel Core i9-12900HX
86541 MIPS +34%
MSI Titan GT77 12UHS
Intel Core i9-12900HX
86234 MIPS +34%
Average of class Gaming
  (11386 - 140932, n=227, last 2 years)
76838 MIPS +19%
Acer Predator Triton 500 SE PT516-52s-70KX
Intel Core i7-12700H
64864 MIPS +1%
Asus ROG Zephyrus Duo 16 GX650RX
AMD Ryzen 9 6900HX
64457 MIPS 0%
SCHENKER XMG Neo 17 M22
AMD Ryzen 9 6900HX
64439 MIPS
Average AMD Ryzen 9 6900HX
  (49526 - 65336, n=20)
60091 MIPS -7%
Razer Blade 17 Early 2022
Intel Core i9-12900H
47259 MIPS -27%
7-Zip 18.03 / 7z b 4 -mmt1
MSI Raider GE77 HX 12UHS
Intel Core i9-12900HX
6357 MIPS +8%
MSI Titan GT77 12UHS
Intel Core i9-12900HX
6256 MIPS +7%
Average of class Gaming
  (2685 - 7581, n=227, last 2 years)
6119 MIPS +4%
Razer Blade 17 Early 2022
Intel Core i9-12900H
5926 MIPS +1%
SCHENKER XMG Neo 17 M22
AMD Ryzen 9 6900HX
5872 MIPS
Average AMD Ryzen 9 6900HX
  (5090 - 6070, n=20)
5799 MIPS -1%
Asus ROG Zephyrus Duo 16 GX650RX
AMD Ryzen 9 6900HX
5727 MIPS -2%
Acer Predator Triton 500 SE PT516-52s-70KX
Intel Core i7-12700H
5138 MIPS -12%
Geekbench 5.5 / Multi-Core
MSI Raider GE77 HX 12UHS
Intel Core i9-12900HX
16448 Points +62%
MSI Titan GT77 12UHS
Intel Core i9-12900HX
16250 Points +60%
Average of class Gaming
  (1946 - 22200, n=232, last 2 years)
13538 Points +34%
Acer Predator Triton 500 SE PT516-52s-70KX
Intel Core i7-12700H
12463 Points +23%
Asus ROG Zephyrus Duo 16 GX650RX
AMD Ryzen 9 6900HX
10167 Points 0%
SCHENKER XMG Neo 17 M22
AMD Ryzen 9 6900HX
10126 Points
Razer Blade 17 Early 2022
Intel Core i9-12900H
9716 Points -4%
Average AMD Ryzen 9 6900HX
  (8313 - 10490, n=21)
9642 Points -5%
Geekbench 5.5 / Single-Core
MSI Raider GE77 HX 12UHS
Intel Core i9-12900HX
1949 Points +23%
MSI Titan GT77 12UHS
Intel Core i9-12900HX
1923 Points +21%
Average of class Gaming
  (158 - 2210, n=232, last 2 years)
1806 Points +14%
Razer Blade 17 Early 2022
Intel Core i9-12900H
1797 Points +13%
Acer Predator Triton 500 SE PT516-52s-70KX
Intel Core i7-12700H
1746 Points +10%
Asus ROG Zephyrus Duo 16 GX650RX
AMD Ryzen 9 6900HX
1594 Points 0%
SCHENKER XMG Neo 17 M22
AMD Ryzen 9 6900HX
1590 Points
Average AMD Ryzen 9 6900HX
  (1523 - 1652, n=21)
1589 Points 0%
HWBOT x265 Benchmark v2.2 / 4k Preset
MSI Raider GE77 HX 12UHS
Intel Core i9-12900HX
26 fps +49%
MSI Titan GT77 12UHS
Intel Core i9-12900HX
25.6 fps +46%
Average of class Gaming
  (3 - 37.6, n=230, last 2 years)
21.2 fps +21%
Acer Predator Triton 500 SE PT516-52s-70KX
Intel Core i7-12700H
18.5 fps +6%
Asus ROG Zephyrus Duo 16 GX650RX
AMD Ryzen 9 6900HX
18 fps +3%
SCHENKER XMG Neo 17 M22
AMD Ryzen 9 6900HX
17.5 fps
Average AMD Ryzen 9 6900HX
  (12.6 - 18.7, n=20)
16.7 fps -5%
Razer Blade 17 Early 2022
Intel Core i9-12900H
12.7 fps -27%
LibreOffice / 20 Documents To PDF
SCHENKER XMG Neo 17 M22
AMD Ryzen 9 6900HX
56 s *
Average AMD Ryzen 9 6900HX
  (44.8 - 81.7, n=20)
53.1 s * +5%
Average of class Gaming
  (32.8 - 332, n=224, last 2 years)
49.3 s * +12%
Asus ROG Zephyrus Duo 16 GX650RX
AMD Ryzen 9 6900HX
45 s * +20%
MSI Raider GE77 HX 12UHS
Intel Core i9-12900HX
42.4 s * +24%
Acer Predator Triton 500 SE PT516-52s-70KX
Intel Core i7-12700H
41.7 s * +26%
Razer Blade 17 Early 2022
Intel Core i9-12900H
39 s * +30%
MSI Titan GT77 12UHS
Intel Core i9-12900HX
39 s * +30%
R Benchmark 2.5 / Overall mean
Average AMD Ryzen 9 6900HX
  (0.4627 - 0.4974, n=20)
0.483 sec * -0%
SCHENKER XMG Neo 17 M22
AMD Ryzen 9 6900HX
0.4808 sec *
Asus ROG Zephyrus Duo 16 GX650RX
AMD Ryzen 9 6900HX
0.4799 sec * -0%
Average of class Gaming
  (0.3609 - 4.47, n=227, last 2 years)
0.4701 sec * +2%
Acer Predator Triton 500 SE PT516-52s-70KX
Intel Core i7-12700H
0.4671 sec * +3%
Razer Blade 17 Early 2022
Intel Core i9-12900H
0.4463 sec * +7%
MSI Raider GE77 HX 12UHS
Intel Core i9-12900HX
0.4239 sec * +12%
MSI Titan GT77 12UHS
Intel Core i9-12900HX
0.4194 sec * +13%

* ... smaller is better

Cinebench R10 Rendering Single 32Bit
6467
Cinebench R10 Shading 64Bit
18211 Points
Cinebench R10 Rendering Multiple CPUs 64Bit
77450 Points
Cinebench R10 Rendering Single CPUs 64Bit
12294 Points
Cinebench R10 Shading 32Bit
17110
Cinebench R10 Rendering Multiple CPUs 32Bit
42219
Cinebench R11.5 CPU Multi 32Bit
22.72 Points
Cinebench R11.5 OpenGL 32Bit
94.53 fps
Cinebench R11.5 CPU Single 64Bit
2.91 Points
Cinebench R11.5 CPU Multi 64Bit
26.44 Points
Cinebench R11.5 OpenGL 64Bit
101.16 fps
Cinebench R11.5 CPU Single 32Bit
2.49 Points
Cinebench R15 CPU Single 64Bit
248 Points
Cinebench R15 Ref. Match 64Bit
99.6 %
Cinebench R15 OpenGL 64Bit
151.39 fps
Cinebench R15 CPU Multi 64Bit
2296 Points
Ajuda
Performance Rating
MSI Raider GE77 HX 12UHS
Intel Core i9-12900HX, GeForce RTX 3080 Ti Laptop GPU
96.9 pt
MSI Titan GT77 12UHS
Intel Core i9-12900HX, GeForce RTX 3080 Ti Laptop GPU
96.4 pt
Average of class Gaming
 
83.9 pt
Asus ROG Zephyrus Duo 16 GX650RX
AMD Ryzen 9 6900HX, GeForce RTX 3080 Ti Laptop GPU
81.7 pt
SCHENKER XMG Neo 17 M22
AMD Ryzen 9 6900HX, GeForce RTX 3080 Ti Laptop GPU
78.9 pt
Average AMD Ryzen 9 6900HX
 
75.7 pt
Acer Predator Triton 500 SE PT516-52s-70KX
Intel Core i7-12700H, GeForce RTX 3080 Ti Laptop GPU
61.8 pt
Razer Blade 17 Early 2022
Intel Core i9-12900H, GeForce RTX 3080 Ti Laptop GPU
42 pt
AIDA64 / FP32 Ray-Trace
MSI Titan GT77 12UHS
Intel Core i9-12900HX, GeForce RTX 3080 Ti Laptop GPU
21797 KRay/s +35%
MSI Raider GE77 HX 12UHS
Intel Core i9-12900HX, GeForce RTX 3080 Ti Laptop GPU
20004 KRay/s +24%
Average of class Gaming
  (3069 - 60169, n=223, last 2 years)
18549 KRay/s +15%
Asus ROG Zephyrus Duo 16 GX650RX
AMD Ryzen 9 6900HX, GeForce RTX 3080 Ti Laptop GPU
16852 KRay/s +5%
SCHENKER XMG Neo 17 M22
AMD Ryzen 9 6900HX, GeForce RTX 3080 Ti Laptop GPU
16115 KRay/s
Average AMD Ryzen 9 6900HX
  (10950 - 17963, n=20)
15327 KRay/s -5%
Acer Predator Triton 500 SE PT516-52s-70KX
Intel Core i7-12700H, GeForce RTX 3080 Ti Laptop GPU
9316 KRay/s -42%
Razer Blade 17 Early 2022
Intel Core i9-12900H, GeForce RTX 3080 Ti Laptop GPU
5706 KRay/s -65%
AIDA64 / FPU Julia
MSI Raider GE77 HX 12UHS
Intel Core i9-12900HX, GeForce RTX 3080 Ti Laptop GPU
110093 Points +11%
MSI Titan GT77 12UHS
Intel Core i9-12900HX, GeForce RTX 3080 Ti Laptop GPU
107354 Points +9%
Asus ROG Zephyrus Duo 16 GX650RX
AMD Ryzen 9 6900HX, GeForce RTX 3080 Ti Laptop GPU
103794 Points +5%
SCHENKER XMG Neo 17 M22
AMD Ryzen 9 6900HX, GeForce RTX 3080 Ti Laptop GPU
98800 Points
Average AMD Ryzen 9 6900HX
  (71414 - 110797, n=20)
96546 Points -2%
Average of class Gaming
  (18567 - 252486, n=223, last 2 years)
93189 Points -6%
Acer Predator Triton 500 SE PT516-52s-70KX
Intel Core i7-12700H, GeForce RTX 3080 Ti Laptop GPU
41656 Points -58%
Razer Blade 17 Early 2022
Intel Core i9-12900H, GeForce RTX 3080 Ti Laptop GPU
28086 Points -72%
AIDA64 / CPU SHA3
MSI Raider GE77 HX 12UHS
Intel Core i9-12900HX, GeForce RTX 3080 Ti Laptop GPU
5123 MB/s +50%
MSI Titan GT77 12UHS
Intel Core i9-12900HX, GeForce RTX 3080 Ti Laptop GPU
4945 MB/s +45%
Average of class Gaming
  (629 - 10389, n=223, last 2 years)
4307 MB/s +26%
Asus ROG Zephyrus Duo 16 GX650RX
AMD Ryzen 9 6900HX, GeForce RTX 3080 Ti Laptop GPU
3547 MB/s +4%
SCHENKER XMG Neo 17 M22
AMD Ryzen 9 6900HX, GeForce RTX 3080 Ti Laptop GPU
3422 MB/s
Acer Predator Triton 500 SE PT516-52s-70KX
Intel Core i7-12700H, GeForce RTX 3080 Ti Laptop GPU
3378 MB/s -1%
Average AMD Ryzen 9 6900HX
  (2471 - 3804, n=20)
3301 MB/s -4%
Razer Blade 17 Early 2022
Intel Core i9-12900H, GeForce RTX 3080 Ti Laptop GPU
1933 MB/s -44%
AIDA64 / CPU Queen
Average of class Gaming
  (15371 - 200651, n=223, last 2 years)
109016 Points +7%
Asus ROG Zephyrus Duo 16 GX650RX
AMD Ryzen 9 6900HX, GeForce RTX 3080 Ti Laptop GPU
104920 Points +3%
MSI Titan GT77 12UHS
Intel Core i9-12900HX, GeForce RTX 3080 Ti Laptop GPU
103770 Points +2%
SCHENKER XMG Neo 17 M22
AMD Ryzen 9 6900HX, GeForce RTX 3080 Ti Laptop GPU
102167 Points
MSI Raider GE77 HX 12UHS
Intel Core i9-12900HX, GeForce RTX 3080 Ti Laptop GPU
102056 Points 0%
Average AMD Ryzen 9 6900HX
  (84185 - 107544, n=20)
100656 Points -1%
Acer Predator Triton 500 SE PT516-52s-70KX
Intel Core i7-12700H, GeForce RTX 3080 Ti Laptop GPU
98781 Points -3%
Razer Blade 17 Early 2022
Intel Core i9-12900H, GeForce RTX 3080 Ti Laptop GPU
83594 Points -18%
AIDA64 / FPU SinJulia
MSI Titan GT77 12UHS
Intel Core i9-12900HX, GeForce RTX 3080 Ti Laptop GPU
12969 Points +1%
Asus ROG Zephyrus Duo 16 GX650RX
AMD Ryzen 9 6900HX, GeForce RTX 3080 Ti Laptop GPU
12955 Points +1%
MSI Raider GE77 HX 12UHS
Intel Core i9-12900HX, GeForce RTX 3080 Ti Laptop GPU
12924 Points +1%
SCHENKER XMG Neo 17 M22
AMD Ryzen 9 6900HX, GeForce RTX 3080 Ti Laptop GPU
12783 Points
Average AMD Ryzen 9 6900HX
  (10970 - 13205, n=20)
12630 Points -1%
Average of class Gaming
  (2137 - 32988, n=223, last 2 years)
12161 Points -5%
Acer Predator Triton 500 SE PT516-52s-70KX
Intel Core i7-12700H, GeForce RTX 3080 Ti Laptop GPU
9927 Points -22%
Razer Blade 17 Early 2022
Intel Core i9-12900H, GeForce RTX 3080 Ti Laptop GPU
7257 Points -43%
AIDA64 / FPU Mandel
Asus ROG Zephyrus Duo 16 GX650RX
AMD Ryzen 9 6900HX, GeForce RTX 3080 Ti Laptop GPU
57334 Points +6%
SCHENKER XMG Neo 17 M22
AMD Ryzen 9 6900HX, GeForce RTX 3080 Ti Laptop GPU
54060 Points
Average AMD Ryzen 9 6900HX
  (39164 - 61370, n=20)
52842 Points -2%
MSI Titan GT77 12UHS
Intel Core i9-12900HX, GeForce RTX 3080 Ti Laptop GPU
52544 Points -3%
MSI Raider GE77 HX 12UHS
Intel Core i9-12900HX, GeForce RTX 3080 Ti Laptop GPU
52105 Points -4%
Average of class Gaming
  (10291 - 134044, n=223, last 2 years)
47726 Points -12%
Acer Predator Triton 500 SE PT516-52s-70KX
Intel Core i7-12700H, GeForce RTX 3080 Ti Laptop GPU
25547 Points -53%
Razer Blade 17 Early 2022
Intel Core i9-12900H, GeForce RTX 3080 Ti Laptop GPU
15575 Points -71%
AIDA64 / CPU AES
MSI Raider GE77 HX 12UHS
Intel Core i9-12900HX, GeForce RTX 3080 Ti Laptop GPU
183146 MB/s +35%
MSI Titan GT77 12UHS
Intel Core i9-12900HX, GeForce RTX 3080 Ti Laptop GPU
179186 MB/s +32%
Asus ROG Zephyrus Duo 16 GX650RX
AMD Ryzen 9 6900HX, GeForce RTX 3080 Ti Laptop GPU
139407 MB/s +3%
SCHENKER XMG Neo 17 M22
AMD Ryzen 9 6900HX, GeForce RTX 3080 Ti Laptop GPU
135833 MB/s
Average AMD Ryzen 9 6900HX
  (54613 - 142360, n=20)
115891 MB/s -15%
Average of class Gaming
  (19065 - 328679, n=223, last 2 years)
107260 MB/s -21%
Acer Predator Triton 500 SE PT516-52s-70KX
Intel Core i7-12700H, GeForce RTX 3080 Ti Laptop GPU
102111 MB/s -25%
Razer Blade 17 Early 2022
Intel Core i9-12900H, GeForce RTX 3080 Ti Laptop GPU
41612 MB/s -69%
AIDA64 / CPU ZLib
MSI Raider GE77 HX 12UHS
Intel Core i9-12900HX, GeForce RTX 3080 Ti Laptop GPU
1393 MB/s +65%
MSI Titan GT77 12UHS
Intel Core i9-12900HX, GeForce RTX 3080 Ti Laptop GPU
1389 MB/s +64%
Average of class Gaming
  (150.9 - 2409, n=223, last 2 years)
1205 MB/s +43%
Acer Predator Triton 500 SE PT516-52s-70KX
Intel Core i7-12700H, GeForce RTX 3080 Ti Laptop GPU
1143 MB/s +35%
Asus ROG Zephyrus Duo 16 GX650RX
AMD Ryzen 9 6900HX, GeForce RTX 3080 Ti Laptop GPU
890 MB/s +5%
SCHENKER XMG Neo 17 M22
AMD Ryzen 9 6900HX, GeForce RTX 3080 Ti Laptop GPU
845 MB/s
Average AMD Ryzen 9 6900HX
  (578 - 911, n=20)
803 MB/s -5%
Razer Blade 17 Early 2022
Intel Core i9-12900H, GeForce RTX 3080 Ti Laptop GPU
585 MB/s -31%
AIDA64 / FP64 Ray-Trace
MSI Titan GT77 12UHS
Intel Core i9-12900HX, GeForce RTX 3080 Ti Laptop GPU
11612 KRay/s +36%
MSI Raider GE77 HX 12UHS
Intel Core i9-12900HX, GeForce RTX 3080 Ti Laptop GPU
10864 KRay/s +27%
Average of class Gaming
  (1518 - 31796, n=223, last 2 years)
10043 KRay/s +18%
Asus ROG Zephyrus Duo 16 GX650RX
AMD Ryzen 9 6900HX, GeForce RTX 3080 Ti Laptop GPU
9001 KRay/s +6%
SCHENKER XMG Neo 17 M22
AMD Ryzen 9 6900HX, GeForce RTX 3080 Ti Laptop GPU
8529 KRay/s
Average AMD Ryzen 9 6900HX
  (5798 - 9540, n=20)
8175 KRay/s -4%
Acer Predator Triton 500 SE PT516-52s-70KX
Intel Core i7-12700H, GeForce RTX 3080 Ti Laptop GPU
5322 KRay/s -38%
Razer Blade 17 Early 2022
Intel Core i9-12900H, GeForce RTX 3080 Ti Laptop GPU
3181 KRay/s -63%
AIDA64 / CPU PhotoWorxx
MSI Raider GE77 HX 12UHS
Intel Core i9-12900HX, GeForce RTX 3080 Ti Laptop GPU
47710 MPixel/s +58%
MSI Titan GT77 12UHS
Intel Core i9-12900HX, GeForce RTX 3080 Ti Laptop GPU
41007 MPixel/s +36%
Razer Blade 17 Early 2022
Intel Core i9-12900H, GeForce RTX 3080 Ti Laptop GPU
37573 MPixel/s +24%
Average of class Gaming
  (10805 - 60161, n=224, last 2 years)
36606 MPixel/s +21%
Acer Predator Triton 500 SE PT516-52s-70KX
Intel Core i7-12700H, GeForce RTX 3080 Ti Laptop GPU
36231 MPixel/s +20%
SCHENKER XMG Neo 17 M22
AMD Ryzen 9 6900HX, GeForce RTX 3080 Ti Laptop GPU
30226 MPixel/s
Asus ROG Zephyrus Duo 16 GX650RX
AMD Ryzen 9 6900HX, GeForce RTX 3080 Ti Laptop GPU
29705 MPixel/s -2%
Average AMD Ryzen 9 6900HX
  (26873 - 30604, n=20)
29389 MPixel/s -3%

Desempenho do sistema

Nos benchmarks de desempenho do sistema, os resultados do Schenker XMG Neo 17 M22 são similares aos dos benchmarks de CPU pura. O nível de desempenho ainda é bom e cerca de 10% maior em comparação com o Asus ROG Zephyrus Duo. Subjetivamente, o XMG Neo 17 se sente muito rápido e quase não há tempos de carga durante o uso diário.

PCMark 10 / Score
MSI Titan GT77 12UHS
GeForce RTX 3080 Ti Laptop GPU, i9-12900HX, Samsung PM9A1 MZVL21T0HCLR
8203 Points +18%
Average of class Gaming
  (5235 - 9852, n=198, last 2 years)
7573 Points +9%
Acer Predator Triton 500 SE PT516-52s-70KX
GeForce RTX 3080 Ti Laptop GPU, i7-12700H, Micron 3400 1TB MTFDKBA1T0TFH
7539 Points +8%
Razer Blade 17 Early 2022
GeForce RTX 3080 Ti Laptop GPU, i9-12900H, Samsung PM9A1 MZVL21T0HCLR
7139 Points +2%
MSI Raider GE77 HX 12UHS
GeForce RTX 3080 Ti Laptop GPU, i9-12900HX, Samsung PM9A1 MZVL22T0HBLB
6993 Points 0%
SCHENKER XMG Neo 17 M22
GeForce RTX 3080 Ti Laptop GPU, R9 6900HX, Samsung SSD 980 Pro 1TB MZ-V8P1T0BW
6966 Points
Average AMD Ryzen 9 6900HX, NVIDIA GeForce RTX 3080 Ti Laptop GPU
  (6351 - 6966, n=2)
6659 Points -4%
Asus ROG Zephyrus Duo 16 GX650RX
GeForce RTX 3080 Ti Laptop GPU, R9 6900HX, 2x Samsung SSD 980 Pro 2TB MZ-V8P2T0 (RAID 0)
6351 Points -9%
PCMark 10 / Essentials
MSI Titan GT77 12UHS
GeForce RTX 3080 Ti Laptop GPU, i9-12900HX, Samsung PM9A1 MZVL21T0HCLR
11093 Points +14%
Acer Predator Triton 500 SE PT516-52s-70KX
GeForce RTX 3080 Ti Laptop GPU, i7-12700H, Micron 3400 1TB MTFDKBA1T0TFH
10715 Points +10%
Average of class Gaming
  (8300 - 12334, n=197, last 2 years)
10713 Points +10%
Razer Blade 17 Early 2022
GeForce RTX 3080 Ti Laptop GPU, i9-12900H, Samsung PM9A1 MZVL21T0HCLR
10254 Points +5%
MSI Raider GE77 HX 12UHS
GeForce RTX 3080 Ti Laptop GPU, i9-12900HX, Samsung PM9A1 MZVL22T0HBLB
9761 Points 0%
SCHENKER XMG Neo 17 M22
GeForce RTX 3080 Ti Laptop GPU, R9 6900HX, Samsung SSD 980 Pro 1TB MZ-V8P1T0BW
9740 Points
Average AMD Ryzen 9 6900HX, NVIDIA GeForce RTX 3080 Ti Laptop GPU
  (9374 - 9740, n=2)
9557 Points -2%
Asus ROG Zephyrus Duo 16 GX650RX
GeForce RTX 3080 Ti Laptop GPU, R9 6900HX, 2x Samsung SSD 980 Pro 2TB MZ-V8P2T0 (RAID 0)
9374 Points -4%
PCMark 10 / Productivity
MSI Titan GT77 12UHS
GeForce RTX 3080 Ti Laptop GPU, i9-12900HX, Samsung PM9A1 MZVL21T0HCLR
10178 Points +6%
Average of class Gaming
  (6662 - 11833, n=197, last 2 years)
9711 Points +2%
MSI Raider GE77 HX 12UHS
GeForce RTX 3080 Ti Laptop GPU, i9-12900HX, Samsung PM9A1 MZVL22T0HBLB
9682 Points +1%
Acer Predator Triton 500 SE PT516-52s-70KX
GeForce RTX 3080 Ti Laptop GPU, i7-12700H, Micron 3400 1TB MTFDKBA1T0TFH
9613 Points +1%
SCHENKER XMG Neo 17 M22
GeForce RTX 3080 Ti Laptop GPU, R9 6900HX, Samsung SSD 980 Pro 1TB MZ-V8P1T0BW
9564 Points
Razer Blade 17 Early 2022
GeForce RTX 3080 Ti Laptop GPU, i9-12900H, Samsung PM9A1 MZVL21T0HCLR
9102 Points -5%
Average AMD Ryzen 9 6900HX, NVIDIA GeForce RTX 3080 Ti Laptop GPU
  (7704 - 9564, n=2)
8634 Points -10%
Asus ROG Zephyrus Duo 16 GX650RX
GeForce RTX 3080 Ti Laptop GPU, R9 6900HX, 2x Samsung SSD 980 Pro 2TB MZ-V8P2T0 (RAID 0)
7704 Points -19%
PCMark 10 / Digital Content Creation
MSI Titan GT77 12UHS
GeForce RTX 3080 Ti Laptop GPU, i9-12900HX, Samsung PM9A1 MZVL21T0HCLR
13270 Points +35%
Average of class Gaming
  (6462 - 18475, n=197, last 2 years)
11431 Points +16%
Acer Predator Triton 500 SE PT516-52s-70KX
GeForce RTX 3080 Ti Laptop GPU, i7-12700H, Micron 3400 1TB MTFDKBA1T0TFH
11293 Points +15%
Razer Blade 17 Early 2022
GeForce RTX 3080 Ti Laptop GPU, i9-12900H, Samsung PM9A1 MZVL21T0HCLR
10578 Points +7%
SCHENKER XMG Neo 17 M22
GeForce RTX 3080 Ti Laptop GPU, R9 6900HX, Samsung SSD 980 Pro 1TB MZ-V8P1T0BW
9848 Points
MSI Raider GE77 HX 12UHS
GeForce RTX 3080 Ti Laptop GPU, i9-12900HX, Samsung PM9A1 MZVL22T0HBLB
9822 Points 0%
Average AMD Ryzen 9 6900HX, NVIDIA GeForce RTX 3080 Ti Laptop GPU
  (9626 - 9848, n=2)
9737 Points -1%
Asus ROG Zephyrus Duo 16 GX650RX
GeForce RTX 3080 Ti Laptop GPU, R9 6900HX, 2x Samsung SSD 980 Pro 2TB MZ-V8P2T0 (RAID 0)
9626 Points -2%
CrossMark / Overall
MSI Raider GE77 HX 12UHS
GeForce RTX 3080 Ti Laptop GPU, i9-12900HX, Samsung PM9A1 MZVL22T0HBLB
2169 Points +28%
MSI Titan GT77 12UHS
GeForce RTX 3080 Ti Laptop GPU, i9-12900HX, Samsung PM9A1 MZVL21T0HCLR
2108 Points +24%
Average of class Gaming
  (1247 - 2334, n=168, last 2 years)
1877 Points +10%
Acer Predator Triton 500 SE PT516-52s-70KX
GeForce RTX 3080 Ti Laptop GPU, i7-12700H, Micron 3400 1TB MTFDKBA1T0TFH
1861 Points +10%
Razer Blade 17 Early 2022
GeForce RTX 3080 Ti Laptop GPU, i9-12900H, Samsung PM9A1 MZVL21T0HCLR
1792 Points +5%
Asus ROG Zephyrus Duo 16 GX650RX
GeForce RTX 3080 Ti Laptop GPU, R9 6900HX, 2x Samsung SSD 980 Pro 2TB MZ-V8P2T0 (RAID 0)
1711 Points +1%
Average AMD Ryzen 9 6900HX, NVIDIA GeForce RTX 3080 Ti Laptop GPU
  (1699 - 1711, n=2)
1705 Points 0%
SCHENKER XMG Neo 17 M22
GeForce RTX 3080 Ti Laptop GPU, R9 6900HX, Samsung SSD 980 Pro 1TB MZ-V8P1T0BW
1699 Points
CrossMark / Productivity
MSI Raider GE77 HX 12UHS
GeForce RTX 3080 Ti Laptop GPU, i9-12900HX, Samsung PM9A1 MZVL22T0HBLB
2047 Points +24%
MSI Titan GT77 12UHS
GeForce RTX 3080 Ti Laptop GPU, i9-12900HX, Samsung PM9A1 MZVL21T0HCLR
1978 Points +20%
Average of class Gaming
  (1299 - 2204, n=168, last 2 years)
1787 Points +9%
Acer Predator Triton 500 SE PT516-52s-70KX
GeForce RTX 3080 Ti Laptop GPU, i7-12700H, Micron 3400 1TB MTFDKBA1T0TFH
1786 Points +9%
Razer Blade 17 Early 2022
GeForce RTX 3080 Ti Laptop GPU, i9-12900H, Samsung PM9A1 MZVL21T0HCLR
1745 Points +6%
Asus ROG Zephyrus Duo 16 GX650RX
GeForce RTX 3080 Ti Laptop GPU, R9 6900HX, 2x Samsung SSD 980 Pro 2TB MZ-V8P2T0 (RAID 0)
1698 Points +3%
Average AMD Ryzen 9 6900HX, NVIDIA GeForce RTX 3080 Ti Laptop GPU
  (1646 - 1698, n=2)
1672 Points +2%
SCHENKER XMG Neo 17 M22
GeForce RTX 3080 Ti Laptop GPU, R9 6900HX, Samsung SSD 980 Pro 1TB MZ-V8P1T0BW
1646 Points
CrossMark / Creativity
MSI Raider GE77 HX 12UHS
GeForce RTX 3080 Ti Laptop GPU, i9-12900HX, Samsung PM9A1 MZVL22T0HBLB
2328 Points +25%
MSI Titan GT77 12UHS
GeForce RTX 3080 Ti Laptop GPU, i9-12900HX, Samsung PM9A1 MZVL21T0HCLR
2288 Points +23%
Average of class Gaming
  (1275 - 2514, n=168, last 2 years)
2042 Points +9%
Acer Predator Triton 500 SE PT516-52s-70KX
GeForce RTX 3080 Ti Laptop GPU, i7-12700H, Micron 3400 1TB MTFDKBA1T0TFH
1936 Points +4%
Razer Blade 17 Early 2022
GeForce RTX 3080 Ti Laptop GPU, i9-12900H, Samsung PM9A1 MZVL21T0HCLR
1893 Points +1%
SCHENKER XMG Neo 17 M22
GeForce RTX 3080 Ti Laptop GPU, R9 6900HX, Samsung SSD 980 Pro 1TB MZ-V8P1T0BW
1867 Points
Average AMD Ryzen 9 6900HX, NVIDIA GeForce RTX 3080 Ti Laptop GPU
  (1724 - 1867, n=2)
1796 Points -4%
Asus ROG Zephyrus Duo 16 GX650RX
GeForce RTX 3080 Ti Laptop GPU, R9 6900HX, 2x Samsung SSD 980 Pro 2TB MZ-V8P2T0 (RAID 0)
1724 Points -8%
CrossMark / Responsiveness
MSI Raider GE77 HX 12UHS
GeForce RTX 3080 Ti Laptop GPU, i9-12900HX, Samsung PM9A1 MZVL22T0HBLB
2090 Points +49%
MSI Titan GT77 12UHS
GeForce RTX 3080 Ti Laptop GPU, i9-12900HX, Samsung PM9A1 MZVL21T0HCLR
1991 Points +42%
Acer Predator Triton 500 SE PT516-52s-70KX
GeForce RTX 3080 Ti Laptop GPU, i7-12700H, Micron 3400 1TB MTFDKBA1T0TFH
1868 Points +33%
Asus ROG Zephyrus Duo 16 GX650RX
GeForce RTX 3080 Ti Laptop GPU, R9 6900HX, 2x Samsung SSD 980 Pro 2TB MZ-V8P2T0 (RAID 0)
1715 Points +22%
Average of class Gaming
  (1030 - 2330, n=168, last 2 years)
1700 Points +21%
Razer Blade 17 Early 2022
GeForce RTX 3080 Ti Laptop GPU, i9-12900H, Samsung PM9A1 MZVL21T0HCLR
1643 Points +17%
Average AMD Ryzen 9 6900HX, NVIDIA GeForce RTX 3080 Ti Laptop GPU
  (1405 - 1715, n=2)
1560 Points +11%
SCHENKER XMG Neo 17 M22
GeForce RTX 3080 Ti Laptop GPU, R9 6900HX, Samsung SSD 980 Pro 1TB MZ-V8P1T0BW
1405 Points
PCMark 10 Score
6966 pontos
Ajuda
AIDA64 / Memory Copy
MSI Raider GE77 HX 12UHS
Intel Core i9-12900HX, GeForce RTX 3080 Ti Laptop GPU
70863 MB/s +41%
MSI Titan GT77 12UHS
Intel Core i9-12900HX, GeForce RTX 3080 Ti Laptop GPU
64030 MB/s +27%
Acer Predator Triton 500 SE PT516-52s-70KX
Intel Core i7-12700H, GeForce RTX 3080 Ti Laptop GPU
60342 MB/s +20%
Razer Blade 17 Early 2022
Intel Core i9-12900H, GeForce RTX 3080 Ti Laptop GPU
60030 MB/s +20%
Average of class Gaming
  (21842 - 92565, n=223, last 2 years)
59145 MB/s +18%
Asus ROG Zephyrus Duo 16 GX650RX
AMD Ryzen 9 6900HX, GeForce RTX 3080 Ti Laptop GPU
53162 MB/s +6%
Average AMD Ryzen 9 6900HX
  (47938 - 53345, n=20)
50405 MB/s 0%
SCHENKER XMG Neo 17 M22
AMD Ryzen 9 6900HX, GeForce RTX 3080 Ti Laptop GPU
50231 MB/s
AIDA64 / Memory Read
MSI Raider GE77 HX 12UHS
Intel Core i9-12900HX, GeForce RTX 3080 Ti Laptop GPU
72930 MB/s +42%
Acer Predator Triton 500 SE PT516-52s-70KX
Intel Core i7-12700H, GeForce RTX 3080 Ti Laptop GPU
67695 MB/s +32%
Average of class Gaming
  (24879 - 90647, n=223, last 2 years)
63027 MB/s +23%
Razer Blade 17 Early 2022
Intel Core i9-12900H, GeForce RTX 3080 Ti Laptop GPU
62684 MB/s +22%
MSI Titan GT77 12UHS
Intel Core i9-12900HX, GeForce RTX 3080 Ti Laptop GPU
62140 MB/s +21%
Asus ROG Zephyrus Duo 16 GX650RX
AMD Ryzen 9 6900HX, GeForce RTX 3080 Ti Laptop GPU
53321 MB/s +4%
SCHENKER XMG Neo 17 M22
AMD Ryzen 9 6900HX, GeForce RTX 3080 Ti Laptop GPU
51403 MB/s
Average AMD Ryzen 9 6900HX
  (43892 - 53321, n=20)
51062 MB/s -1%
AIDA64 / Memory Write
MSI Raider GE77 HX 12UHS
Intel Core i9-12900HX, GeForce RTX 3080 Ti Laptop GPU
67353 MB/s +22%
Average of class Gaming
  (21619 - 103259, n=223, last 2 years)
61446 MB/s +11%
MSI Titan GT77 12UHS
Intel Core i9-12900HX, GeForce RTX 3080 Ti Laptop GPU
60014 MB/s +9%
Razer Blade 17 Early 2022
Intel Core i9-12900H, GeForce RTX 3080 Ti Laptop GPU
58004 MB/s +5%
Asus ROG Zephyrus Duo 16 GX650RX
AMD Ryzen 9 6900HX, GeForce RTX 3080 Ti Laptop GPU
57180 MB/s +3%
SCHENKER XMG Neo 17 M22
AMD Ryzen 9 6900HX, GeForce RTX 3080 Ti Laptop GPU
55263 MB/s
Average AMD Ryzen 9 6900HX
  (51085 - 57202, n=20)
55188 MB/s 0%
Acer Predator Triton 500 SE PT516-52s-70KX
Intel Core i7-12700H, GeForce RTX 3080 Ti Laptop GPU
51577 MB/s -7%
AIDA64 / Memory Latency
Acer Predator Triton 500 SE PT516-52s-70KX
Intel Core i7-12700H, GeForce RTX 3080 Ti Laptop GPU
120.6 ns * -33%
Asus ROG Zephyrus Duo 16 GX650RX
AMD Ryzen 9 6900HX, GeForce RTX 3080 Ti Laptop GPU
92.3 ns * -2%
SCHENKER XMG Neo 17 M22
AMD Ryzen 9 6900HX, GeForce RTX 3080 Ti Laptop GPU
90.8 ns *
MSI Titan GT77 12UHS
Intel Core i9-12900HX, GeForce RTX 3080 Ti Laptop GPU
88.8 ns * +2%
Average AMD Ryzen 9 6900HX
  (80.7 - 120.6, n=20)
88.7 ns * +2%
Average of class Gaming
  (59.5 - 152.5, n=220, last 2 years)
87.2 ns * +4%
MSI Raider GE77 HX 12UHS
Intel Core i9-12900HX, GeForce RTX 3080 Ti Laptop GPU
83.9 ns * +8%

* ... smaller is better

Latência do DPC

LatencyMon mostra o aumento das latências após abrir várias abas do navegador em Edge. As latências aumentam ligeiramente depois de reproduzir um vídeo 4K no YouTube e inicializar Prime95. Otimizações futuras do driver ou BIOS podem melhorar o problema. A reprodução de nosso vídeo de teste 4K usa cerca de 10% do iGPU da AMD Ryzen 9 6900HX'.

DPC Latencies / LatencyMon - interrupt to process latency (max), Web, Youtube, Prime95
SCHENKER XMG Neo 17 M22
GeForce RTX 3080 Ti Laptop GPU, R9 6900HX, Samsung SSD 980 Pro 1TB MZ-V8P1T0BW
4362 μs *
MSI Titan GT77 12UHS
GeForce RTX 3080 Ti Laptop GPU, i9-12900HX, Samsung PM9A1 MZVL21T0HCLR
2203.2 μs * +49%
MSI Titan GT77 12UHS
GeForce RTX 3080 Ti Laptop GPU, i9-12900HX, Samsung PM9A1 MZVL21T0HCLR
638.25 μs * +85%
Acer Predator Triton 500 SE PT516-52s-70KX
GeForce RTX 3080 Ti Laptop GPU, i7-12700H, Micron 3400 1TB MTFDKBA1T0TFH
2127.9 μs * +51%
MSI Raider GE77 HX 12UHS
GeForce RTX 3080 Ti Laptop GPU, i9-12900HX, Samsung PM9A1 MZVL22T0HBLB
1684.6 μs * +61%
Asus ROG Zephyrus Duo 16 GX650RX
GeForce RTX 3080 Ti Laptop GPU, R9 6900HX, 2x Samsung SSD 980 Pro 2TB MZ-V8P2T0 (RAID 0)
521.5 μs * +88%
Razer Blade 17 Early 2022
GeForce RTX 3080 Ti Laptop GPU, i9-12900H, Samsung PM9A1 MZVL21T0HCLR
388.5 μs * +91%

* ... smaller is better

Solução de armazenamento

Samsung 980 Pro (NVMe SSD)

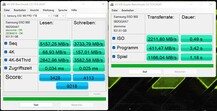
Nossa amostra de teste vem com um Samsung 980 Pro. Entretanto, os usuários podem escolher entre os modelos Seagate, Crucial e Corsair para o XMG Neo 17. Durante a encomenda, os usuários terão que decidir entre os vários modelos. Embora o SSD de nosso dispositivo de teste seja suficientemente grande a 1 TB, desaconselhamos a escolha de uma capacidade menor para evitar o constante esgotamento do espaço de armazenamento. Sob carga, o desempenho seqüencial de leitura e escrita é excelente, compensando o Schenker XMG Neo 17 com um bom resultado geral nesta categoria.

O XMG Neo 17 pode ser equipado com até dois M.2 SSDs.

Mais comparações e benchmarks podem ser encontrados em nosso tabela comparativa.

AS SSD
AS SSD
MDL 3
MDL 3
MDL 5
MDL 5
MDL 6
MDL 6
CDI
CDI
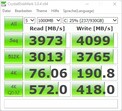
Samsung SSD 980 Pro 1TB MZ-V8P1T0BW
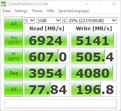
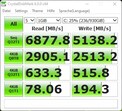
Sequential Read: 3973 MB/s
Sequential Write: 4099 MB/s
512K Read: 3013 MB/s
512K Write: 3765 MB/s
4K Read: 76.06 MB/s
4K Write: 190.8 MB/s
4K QD32 Read: 572 MB/s
4K QD32 Write: 418 MB/s
Drive Performance Rating - Percent
MSI Raider GE77 HX 12UHS
Samsung PM9A1 MZVL22T0HBLB
78.6 pt
Asus ROG Zephyrus Duo 16 GX650RX
2x Samsung SSD 980 Pro 2TB MZ-V8P2T0 (RAID 0)
76.7 pt
SCHENKER XMG Neo 17 M22
Samsung SSD 980 Pro 1TB MZ-V8P1T0BW
76.6 pt
MSI Titan GT77 12UHS
Samsung PM9A1 MZVL21T0HCLR
72.4 pt
Razer Blade 17 Early 2022
Samsung PM9A1 MZVL21T0HCLR
71.7 pt
Acer Predator Triton 500 SE PT516-52s-70KX -1!
Micron 3400 1TB MTFDKBA1T0TFH
67.5 pt
Average Samsung SSD 980 Pro 1TB MZ-V8P1T0BW
 
65.5 pt
Average of class Gaming
 
59.1 pt
DiskSpd
seq read
Asus ROG Zephyrus Duo 16 GX650RX
2x Samsung SSD 980 Pro 2TB MZ-V8P2T0 (RAID 0)
4903 MB/s +27%
Razer Blade 17 Early 2022
Samsung PM9A1 MZVL21T0HCLR
4265 (4201.21min - 4264.91max) MB/s +10%
Average Samsung SSD 980 Pro 1TB MZ-V8P1T0BW
  (2659 - 4315, n=26)
3877 MB/s 0%
SCHENKER XMG Neo 17 M22
Samsung SSD 980 Pro 1TB MZ-V8P1T0BW
3872 (3855.82min - 3871.97max) MB/s
MSI Raider GE77 HX 12UHS
Samsung PM9A1 MZVL22T0HBLB
3713 (3643.38min - 3713.01max) MB/s -4%
Acer Predator Triton 500 SE PT516-52s-70KX
Micron 3400 1TB MTFDKBA1T0TFH
3595 (3264.19min - 3594.73max) MB/s -7%
MSI Titan GT77 12UHS
Samsung PM9A1 MZVL21T0HCLR
3561 (3468.06min - 3560.96max) MB/s -8%
Average of class Gaming
  (1291 - 7045, n=197, last 2 years)
3524 MB/s -9%
seq write
Asus ROG Zephyrus Duo 16 GX650RX
2x Samsung SSD 980 Pro 2TB MZ-V8P2T0 (RAID 0)
7889 (6495.73min - 7888.81max) MB/s +86%
Acer Predator Triton 500 SE PT516-52s-70KX
Micron 3400 1TB MTFDKBA1T0TFH
4599 (4248.83min - 4598.67max) MB/s +8%
SCHENKER XMG Neo 17 M22
Samsung SSD 980 Pro 1TB MZ-V8P1T0BW
4242 (4225.7min - 4241.7max) MB/s
Razer Blade 17 Early 2022
Samsung PM9A1 MZVL21T0HCLR
4173 (4063.65min - 4172.96max) MB/s -2%
MSI Titan GT77 12UHS
Samsung PM9A1 MZVL21T0HCLR
3966 (3885.39min - 3966.13max) MB/s -7%
Average Samsung SSD 980 Pro 1TB MZ-V8P1T0BW
  (2839 - 4493, n=26)
3893 MB/s -8%
Average of class Gaming
  (535 - 9307, n=197, last 2 years)
3810 MB/s -10%
MSI Raider GE77 HX 12UHS
Samsung PM9A1 MZVL22T0HBLB
3706 (3661.84min - 3706.09max) MB/s -13%
seq q8 t1 read
Asus ROG Zephyrus Duo 16 GX650RX
2x Samsung SSD 980 Pro 2TB MZ-V8P2T0 (RAID 0)
10557 (9742.97min - 10557.3max) MB/s +65%
MSI Titan GT77 12UHS
Samsung PM9A1 MZVL21T0HCLR
6722 (987.46min - 6721.79max) MB/s +5%
MSI Raider GE77 HX 12UHS
Samsung PM9A1 MZVL22T0HBLB
6695 (6233.69min - 6694.56max) MB/s +5%
Razer Blade 17 Early 2022
Samsung PM9A1 MZVL21T0HCLR
6661 (6277.2min - 6660.66max) MB/s +4%
Average Samsung SSD 980 Pro 1TB MZ-V8P1T0BW
  (3227 - 6902, n=26)
6544 MB/s +3%
Acer Predator Triton 500 SE PT516-52s-70KX
Micron 3400 1TB MTFDKBA1T0TFH
6499 (5666.71min - 6499.29max) MB/s +2%
SCHENKER XMG Neo 17 M22
Samsung SSD 980 Pro 1TB MZ-V8P1T0BW
6384 (5573.36min - 6384.17max) MB/s
Average of class Gaming
  (1983 - 16089, n=197, last 2 years)
6359 MB/s 0%
seq q8 t1 write
Asus ROG Zephyrus Duo 16 GX650RX
2x Samsung SSD 980 Pro 2TB MZ-V8P2T0 (RAID 0)
9830 (9799.27min - 9829.82max) MB/s +95%
SCHENKER XMG Neo 17 M22
Samsung SSD 980 Pro 1TB MZ-V8P1T0BW
5043 (5032.12min - 5043.21max) MB/s
MSI Titan GT77 12UHS
Samsung PM9A1 MZVL21T0HCLR
5037 (5025min - 5036.73max) MB/s 0%
MSI Raider GE77 HX 12UHS
Samsung PM9A1 MZVL22T0HBLB
4959 (4940min - 4958.51max) MB/s -2%
Razer Blade 17 Early 2022
Samsung PM9A1 MZVL21T0HCLR
4939 (4932.28min - 4939.42max) MB/s -2%
Average Samsung SSD 980 Pro 1TB MZ-V8P1T0BW
  (3184 - 5087, n=26)
4879 MB/s -3%
Average of class Gaming
  (539 - 14571, n=197, last 2 years)
4785 MB/s -5%
Acer Predator Triton 500 SE PT516-52s-70KX
Micron 3400 1TB MTFDKBA1T0TFH
4765 (4460.74min - 4765.06max) MB/s -6%
4k q1 t1 read
Razer Blade 17 Early 2022
Samsung PM9A1 MZVL21T0HCLR
83 (80.56min - 82.99max) MB/s +5%
MSI Raider GE77 HX 12UHS
Samsung PM9A1 MZVL22T0HBLB
83 (80.23min - 83.02max) MB/s +5%
Average Samsung SSD 980 Pro 1TB MZ-V8P1T0BW
  (61.1 - 94.3, n=26)
79.9 MB/s +1%
SCHENKER XMG Neo 17 M22
Samsung SSD 980 Pro 1TB MZ-V8P1T0BW
79.1 (78.08min - 79.08max) MB/s
MSI Titan GT77 12UHS
Samsung PM9A1 MZVL21T0HCLR
77 (74.91min - 76.95max) MB/s -3%
Asus ROG Zephyrus Duo 16 GX650RX
2x Samsung SSD 980 Pro 2TB MZ-V8P2T0 (RAID 0)
73.1 (72.79min - 73.06max) MB/s -8%
Acer Predator Triton 500 SE PT516-52s-70KX
Micron 3400 1TB MTFDKBA1T0TFH
70.3 (69.8min - 70.31max) MB/s -11%
Average of class Gaming
  (30.6 - 95.9, n=197, last 2 years)
67.6 MB/s -15%
4k q1 t1 write
Asus ROG Zephyrus Duo 16 GX650RX
2x Samsung SSD 980 Pro 2TB MZ-V8P2T0 (RAID 0)
359 (324.09min - 358.58max) MB/s +84%
MSI Raider GE77 HX 12UHS
Samsung PM9A1 MZVL22T0HBLB
286 (284.91min - 285.72max) MB/s +47%
MSI Titan GT77 12UHS
Samsung PM9A1 MZVL21T0HCLR
241 MB/s +24%
Average of class Gaming
  (66.6 - 421, n=197, last 2 years)
224 MB/s +15%
Acer Predator Triton 500 SE PT516-52s-70KX
Micron 3400 1TB MTFDKBA1T0TFH
222 (217.59min - 222.42max) MB/s +14%
Razer Blade 17 Early 2022
Samsung PM9A1 MZVL21T0HCLR
222 (221.38min - 221.87max) MB/s +14%
Average Samsung SSD 980 Pro 1TB MZ-V8P1T0BW
  (132.2 - 311, n=26)
217 MB/s +11%
SCHENKER XMG Neo 17 M22
Samsung SSD 980 Pro 1TB MZ-V8P1T0BW
195.1 (194.02min - 195.09max) MB/s
4k q32 t16 read
SCHENKER XMG Neo 17 M22
Samsung SSD 980 Pro 1TB MZ-V8P1T0BW
4483 (4465.42min - 4482.78max) MB/s
MSI Raider GE77 HX 12UHS
Samsung PM9A1 MZVL22T0HBLB
4075 (4059.83min - 4075.02max) MB/s -9%
Razer Blade 17 Early 2022
Samsung PM9A1 MZVL21T0HCLR
3934 (3812.88min - 3933.78max) MB/s -12%
MSI Titan GT77 12UHS
Samsung PM9A1 MZVL21T0HCLR
3797 (3780.09min - 3796.62max) MB/s -15%
Average Samsung SSD 980 Pro 1TB MZ-V8P1T0BW
  (895 - 4483, n=26)
3197 MB/s -29%
Acer Predator Triton 500 SE PT516-52s-70KX
Micron 3400 1TB MTFDKBA1T0TFH
2750 (2675.05min - 2750.14max) MB/s -39%
Average of class Gaming
  (313 - 6172, n=197, last 2 years)
2568 MB/s -43%
Asus ROG Zephyrus Duo 16 GX650RX
2x Samsung SSD 980 Pro 2TB MZ-V8P2T0 (RAID 0)
2390 (2226.95min - 2390.15max) MB/s -47%
4k q32 t16 write
SCHENKER XMG Neo 17 M22
Samsung SSD 980 Pro 1TB MZ-V8P1T0BW
4383 (4358.15min - 4383.06max) MB/s
MSI Titan GT77 12UHS
Samsung PM9A1 MZVL21T0HCLR
3504 (3465.89min - 3503.69max) MB/s -20%
MSI Raider GE77 HX 12UHS
Samsung PM9A1 MZVL22T0HBLB
3503 (3468.77min - 3503.3max) MB/s -20%
Razer Blade 17 Early 2022
Samsung PM9A1 MZVL21T0HCLR
3129 (3011.94min - 3128.85max) MB/s -29%
Acer Predator Triton 500 SE PT516-52s-70KX
Micron 3400 1TB MTFDKBA1T0TFH
2786 (2543.84min - 2785.68max) MB/s -36%
Average Samsung SSD 980 Pro 1TB MZ-V8P1T0BW
  (345 - 4383, n=26)
2341 MB/s -47%
Average of class Gaming
  (162.3 - 4869, n=197, last 2 years)
2140 MB/s -51%
Asus ROG Zephyrus Duo 16 GX650RX
2x Samsung SSD 980 Pro 2TB MZ-V8P2T0 (RAID 0)
1542 (1501.74min - 1541.63max) MB/s -65%
AS SSD
Score Total
SCHENKER XMG Neo 17 M22
Samsung SSD 980 Pro 1TB MZ-V8P1T0BW
9218 Points
MSI Raider GE77 HX 12UHS
Samsung PM9A1 MZVL22T0HBLB
8951 Points -3%
MSI Titan GT77 12UHS
Samsung PM9A1 MZVL21T0HCLR
8492 Points -8%
Razer Blade 17 Early 2022
Samsung PM9A1 MZVL21T0HCLR
7807 Points -15%
Average Samsung SSD 980 Pro 1TB MZ-V8P1T0BW
  (3394 - 9322, n=24)
7334 Points -20%
Acer Predator Triton 500 SE PT516-52s-70KX
Micron 3400 1TB MTFDKBA1T0TFH
7009 Points -24%
Average of class Gaming
  (1923 - 13854, n=185, last 2 years)
6790 Points -26%
Asus ROG Zephyrus Duo 16 GX650RX
2x Samsung SSD 980 Pro 2TB MZ-V8P2T0 (RAID 0)
6635 Points -28%
Score Read
SCHENKER XMG Neo 17 M22
Samsung SSD 980 Pro 1TB MZ-V8P1T0BW
3428 Points
MSI Raider GE77 HX 12UHS
Samsung PM9A1 MZVL22T0HBLB
3399 Points -1%
MSI Titan GT77 12UHS
Samsung PM9A1 MZVL21T0HCLR
3327 Points -3%
Razer Blade 17 Early 2022
Samsung PM9A1 MZVL21T0HCLR
2951 Points -14%
Average Samsung SSD 980 Pro 1TB MZ-V8P1T0BW
  (1501 - 3512, n=24)
2811 Points -18%
Acer Predator Triton 500 SE PT516-52s-70KX
Micron 3400 1TB MTFDKBA1T0TFH
2709 Points -21%
Asus ROG Zephyrus Duo 16 GX650RX
2x Samsung SSD 980 Pro 2TB MZ-V8P2T0 (RAID 0)
2619 Points -24%
Average of class Gaming
  (528 - 4721, n=185, last 2 years)
2487 Points -27%
Score Write
SCHENKER XMG Neo 17 M22
Samsung SSD 980 Pro 1TB MZ-V8P1T0BW
4113 Points
MSI Raider GE77 HX 12UHS
Samsung PM9A1 MZVL22T0HBLB
3882 Points -6%
MSI Titan GT77 12UHS
Samsung PM9A1 MZVL21T0HCLR
3531 Points -14%
Razer Blade 17 Early 2022
Samsung PM9A1 MZVL21T0HCLR
3397 Points -17%
Average Samsung SSD 980 Pro 1TB MZ-V8P1T0BW
  (1130 - 4194, n=24)
3159 Points -23%
Average of class Gaming
  (515 - 7208, n=185, last 2 years)
3099 Points -25%
Acer Predator Triton 500 SE PT516-52s-70KX
Micron 3400 1TB MTFDKBA1T0TFH
2930 Points -29%
Asus ROG Zephyrus Duo 16 GX650RX
2x Samsung SSD 980 Pro 2TB MZ-V8P2T0 (RAID 0)
2556 Points -38%
Seq Read
Asus ROG Zephyrus Duo 16 GX650RX
2x Samsung SSD 980 Pro 2TB MZ-V8P2T0 (RAID 0)
5344.88 MB/s +4%
SCHENKER XMG Neo 17 M22
Samsung SSD 980 Pro 1TB MZ-V8P1T0BW
5157 MB/s
MSI Titan GT77 12UHS
Samsung PM9A1 MZVL21T0HCLR
5061.06 MB/s -2%
MSI Raider GE77 HX 12UHS
Samsung PM9A1 MZVL22T0HBLB
5053.82 MB/s -2%
Average of class Gaming
  (1759 - 12763, n=185, last 2 years)
4938 MB/s -4%
Razer Blade 17 Early 2022
Samsung PM9A1 MZVL21T0HCLR
4923.15 MB/s -5%
Average Samsung SSD 980 Pro 1TB MZ-V8P1T0BW
  (545 - 5692, n=24)
4838 MB/s -6%
Acer Predator Triton 500 SE PT516-52s-70KX
Micron 3400 1TB MTFDKBA1T0TFH
4531.51 MB/s -12%
Seq Write
Asus ROG Zephyrus Duo 16 GX650RX
2x Samsung SSD 980 Pro 2TB MZ-V8P2T0 (RAID 0)
7663.27 MB/s +105%
Acer Predator Triton 500 SE PT516-52s-70KX
Micron 3400 1TB MTFDKBA1T0TFH
4186.78 MB/s +12%
Razer Blade 17 Early 2022
Samsung PM9A1 MZVL21T0HCLR
3797.23 MB/s +2%
MSI Titan GT77 12UHS
Samsung PM9A1 MZVL21T0HCLR
3764.99 MB/s +1%
SCHENKER XMG Neo 17 M22
Samsung SSD 980 Pro 1TB MZ-V8P1T0BW
3733 MB/s
Average of class Gaming
  (495 - 11316, n=185, last 2 years)
3646 MB/s -2%
MSI Raider GE77 HX 12UHS
Samsung PM9A1 MZVL22T0HBLB
3628.78 MB/s -3%
Average Samsung SSD 980 Pro 1TB MZ-V8P1T0BW
  (1613 - 4136, n=24)
3490 MB/s -7%
4K Read
MSI Raider GE77 HX 12UHS
Samsung PM9A1 MZVL22T0HBLB
82.47 MB/s +20%
Razer Blade 17 Early 2022
Samsung PM9A1 MZVL21T0HCLR
77.59 MB/s +13%
Average Samsung SSD 980 Pro 1TB MZ-V8P1T0BW
  (53.5 - 86.8, n=24)
72 MB/s +4%
MSI Titan GT77 12UHS
Samsung PM9A1 MZVL21T0HCLR
69.89 MB/s +1%
Asus ROG Zephyrus Duo 16 GX650RX
2x Samsung SSD 980 Pro 2TB MZ-V8P2T0 (RAID 0)
68.93 MB/s 0%
SCHENKER XMG Neo 17 M22
Samsung SSD 980 Pro 1TB MZ-V8P1T0BW
68.93 MB/s
Average of class Gaming
  (30.4 - 112.1, n=185, last 2 years)
66.7 MB/s -3%
Acer Predator Triton 500 SE PT516-52s-70KX
Micron 3400 1TB MTFDKBA1T0TFH
64.38 MB/s -7%
4K Write
Asus ROG Zephyrus Duo 16 GX650RX
2x Samsung SSD 980 Pro 2TB MZ-V8P2T0 (RAID 0)
328.69 MB/s +109%
MSI Raider GE77 HX 12UHS
Samsung PM9A1 MZVL22T0HBLB
247.61 MB/s +58%
Acer Predator Triton 500 SE PT516-52s-70KX
Micron 3400 1TB MTFDKBA1T0TFH
212.27 MB/s +35%
MSI Titan GT77 12UHS
Samsung PM9A1 MZVL21T0HCLR
211.73 MB/s +35%
Average of class Gaming
  (96.3 - 512, n=185, last 2 years)
210 MB/s +34%
Razer Blade 17 Early 2022
Samsung PM9A1 MZVL21T0HCLR
194.44 MB/s +24%
Average Samsung SSD 980 Pro 1TB MZ-V8P1T0BW
  (134.6 - 254, n=24)
188.8 MB/s +20%
SCHENKER XMG Neo 17 M22
Samsung SSD 980 Pro 1TB MZ-V8P1T0BW
157.01 MB/s
4K-64 Read
SCHENKER XMG Neo 17 M22
Samsung SSD 980 Pro 1TB MZ-V8P1T0BW
2842.96 MB/s
MSI Raider GE77 HX 12UHS
Samsung PM9A1 MZVL22T0HBLB
2811.14 MB/s -1%
MSI Titan GT77 12UHS
Samsung PM9A1 MZVL21T0HCLR
2751.05 MB/s -3%
Razer Blade 17 Early 2022
Samsung PM9A1 MZVL21T0HCLR
2381.4 MB/s -16%
Average Samsung SSD 980 Pro 1TB MZ-V8P1T0BW
  (915 - 2938, n=24)
2234 MB/s -21%
Acer Predator Triton 500 SE PT516-52s-70KX
Micron 3400 1TB MTFDKBA1T0TFH
2191.95 MB/s -23%
Asus ROG Zephyrus Duo 16 GX650RX
2x Samsung SSD 980 Pro 2TB MZ-V8P2T0 (RAID 0)
2015.68 MB/s -29%
Average of class Gaming
  (312 - 3475, n=185, last 2 years)
1921 MB/s -32%
4K-64 Write
SCHENKER XMG Neo 17 M22
Samsung SSD 980 Pro 1TB MZ-V8P1T0BW
3582.58 MB/s
MSI Raider GE77 HX 12UHS
Samsung PM9A1 MZVL22T0HBLB
3271.86 MB/s -9%
MSI Titan GT77 12UHS
Samsung PM9A1 MZVL21T0HCLR
2942.87 MB/s -18%
Razer Blade 17 Early 2022
Samsung PM9A1 MZVL21T0HCLR
2822.91 MB/s -21%
Average Samsung SSD 980 Pro 1TB MZ-V8P1T0BW
  (557 - 3708, n=24)
2622 MB/s -27%
Average of class Gaming
  (277 - 5909, n=185, last 2 years)
2527 MB/s -29%
Acer Predator Triton 500 SE PT516-52s-70KX
Micron 3400 1TB MTFDKBA1T0TFH
2298.82 MB/s -36%
Asus ROG Zephyrus Duo 16 GX650RX
2x Samsung SSD 980 Pro 2TB MZ-V8P2T0 (RAID 0)
1460.96 MB/s -59%
Access Time Read
Average of class Gaming
  (0.016 - 0.379, n=183, last 2 years)
0.05413 ms * -59%
Asus ROG Zephyrus Duo 16 GX650RX
2x Samsung SSD 980 Pro 2TB MZ-V8P2T0 (RAID 0)
0.053 ms * -56%
MSI Titan GT77 12UHS
Samsung PM9A1 MZVL21T0HCLR
0.049 ms * -44%
Razer Blade 17 Early 2022
Samsung PM9A1 MZVL21T0HCLR
0.042 ms * -24%
Average Samsung SSD 980 Pro 1TB MZ-V8P1T0BW
  (0.022 - 0.073, n=24)
0.04075 ms * -20%
SCHENKER XMG Neo 17 M22
Samsung SSD 980 Pro 1TB MZ-V8P1T0BW
0.034 ms *
MSI Raider GE77 HX 12UHS
Samsung PM9A1 MZVL22T0HBLB
0.03 ms * +12%
Access Time Write
Average of class Gaming
  (0.011 - 1.028, n=185, last 2 years)
0.04689 ms * -88%
Average Samsung SSD 980 Pro 1TB MZ-V8P1T0BW
  (0.018 - 0.089, n=24)
0.03363 ms * -35%
SCHENKER XMG Neo 17 M22
Samsung SSD 980 Pro 1TB MZ-V8P1T0BW
0.025 ms *
Acer Predator Triton 500 SE PT516-52s-70KX
Micron 3400 1TB MTFDKBA1T0TFH
0.022 ms * +12%
Razer Blade 17 Early 2022
Samsung PM9A1 MZVL21T0HCLR
0.021 ms * +16%
MSI Titan GT77 12UHS
Samsung PM9A1 MZVL21T0HCLR
0.02 ms * +20%
MSI Raider GE77 HX 12UHS
Samsung PM9A1 MZVL22T0HBLB
0.017 ms * +32%
Asus ROG Zephyrus Duo 16 GX650RX
2x Samsung SSD 980 Pro 2TB MZ-V8P2T0 (RAID 0)
0.013 ms * +48%

* ... smaller is better

Disk Throttling: DiskSpd Read Loop, Queue Depth 8

05301060159021202650318037104240477053005830636068907420795084809010954010070Tooltip
SCHENKER XMG Neo 17 M22 Samsung SSD 980 Pro 1TB MZ-V8P1T0BW: Ø6279 (4891.05-6318.25)
MSI Titan GT77 12UHS Samsung PM9A1 MZVL21T0HCLR: Ø4885 (3287-6413.09)
Razer Blade 17 Early 2022 Samsung PM9A1 MZVL21T0HCLR: Ø6586 (6083.62-6649.44)
Acer Predator Triton 500 SE PT516-52s-70KX Micron 3400 1TB MTFDKBA1T0TFH: Ø6407 (5705.51-6545.21)
Asus ROG Zephyrus Duo 16 GX650RX 2x Samsung SSD 980 Pro 2TB MZ-V8P2T0 (RAID 0): Ø8257 (5868.26-10519.1)
MSI Raider GE77 HX 12UHS Samsung PM9A1 MZVL22T0HBLB: Ø6686 (6257.06-6713.19)

Desempenho da GPU

Com oGeForce GPU para laptop RTX 3080 Tia Ampere mais rápida de Nvidia serve como a placa gráfica. Com 16 GB de VRAM, os usuários não têm nada com que se preocupar e a GPU tem acesso a um orçamento máximo de energia de 175 watts. Nosso modelo funciona muito bem e vem em segundo lugar após a MSI Titan GT77. Além disso, o déficit de 4% é cada vez menor e, apesar das diferentes configurações de CPU dos dispositivos, eles têm um desempenho muito semelhante.

Mais comparações e benchmarks podem ser encontrados em nosso GTabela de comparação PU.

3DMark Performance Rating - Percent
MSI Titan GT77 12UHS
NVIDIA GeForce RTX 3080 Ti Laptop GPU, Intel Core i9-12900HX
100 pt
SCHENKER XMG Neo 17 M22 -1!
NVIDIA GeForce RTX 3080 Ti Laptop GPU, AMD Ryzen 9 6900HX
95.8 pt
MSI Raider GE77 HX 12UHS
NVIDIA GeForce RTX 3080 Ti Laptop GPU, Intel Core i9-12900HX
87.1 pt
Razer Blade 17 Early 2022
NVIDIA GeForce RTX 3080 Ti Laptop GPU, Intel Core i9-12900H
84.9 pt
Average NVIDIA GeForce RTX 3080 Ti Laptop GPU
 
84.8 pt
Average of class Gaming
 
84.2 pt
Acer Predator Triton 500 SE PT516-52s-70KX
NVIDIA GeForce RTX 3080 Ti Laptop GPU, Intel Core i7-12700H
80.9 pt
Asus ROG Zephyrus Duo 16 GX650RX
NVIDIA GeForce RTX 3080 Ti Laptop GPU, AMD Ryzen 9 6900HX
73.8 pt
3DMark 11 - 1280x720 Performance GPU
MSI Titan GT77 12UHS
NVIDIA GeForce RTX 3080 Ti Laptop GPU, Intel Core i9-12900HX
44906 Points +2%
MSI Raider GE77 HX 12UHS
NVIDIA GeForce RTX 3080 Ti Laptop GPU, Intel Core i9-12900HX
44393 Points +1%
SCHENKER XMG Neo 17 M22
NVIDIA GeForce RTX 3080 Ti Laptop GPU, AMD Ryzen 9 6900HX
43823 Points
Razer Blade 17 Early 2022
NVIDIA GeForce RTX 3080 Ti Laptop GPU, Intel Core i9-12900H
43383 Points -1%
Average of class Gaming
  (1029 - 72070, n=231, last 2 years)
40342 Points -8%
Asus ROG Zephyrus Duo 16 GX650RX
NVIDIA GeForce RTX 3080 Ti Laptop GPU, AMD Ryzen 9 6900HX
40257 Points -8%
Average NVIDIA GeForce RTX 3080 Ti Laptop GPU
  (13920 - 45841, n=45)
39402 Points -10%
Acer Predator Triton 500 SE PT516-52s-70KX
NVIDIA GeForce RTX 3080 Ti Laptop GPU, Intel Core i7-12700H
37288 Points -15%
3DMark
1280x720 Cloud Gate Standard Graphics
MSI Titan GT77 12UHS
NVIDIA GeForce RTX 3080 Ti Laptop GPU, Intel Core i9-12900HX
186284 Points
Average NVIDIA GeForce RTX 3080 Ti Laptop GPU
  (73574 - 192520, n=26)
145836 Points
Acer Predator Triton 500 SE PT516-52s-70KX
NVIDIA GeForce RTX 3080 Ti Laptop GPU, Intel Core i7-12700H
144426 Points
Average of class Gaming
  (15902 - 193851, n=143, last 2 years)
135753 Points
MSI Raider GE77 HX 12UHS
NVIDIA GeForce RTX 3080 Ti Laptop GPU, Intel Core i9-12900HX
116343 Points
Razer Blade 17 Early 2022
NVIDIA GeForce RTX 3080 Ti Laptop GPU, Intel Core i9-12900H
114594 Points
Asus ROG Zephyrus Duo 16 GX650RX
NVIDIA GeForce RTX 3080 Ti Laptop GPU, AMD Ryzen 9 6900HX
79498 Points
1920x1080 Fire Strike Graphics
MSI Titan GT77 12UHS
NVIDIA GeForce RTX 3080 Ti Laptop GPU, Intel Core i9-12900HX
34439 Points +4%
SCHENKER XMG Neo 17 M22
NVIDIA GeForce RTX 3080 Ti Laptop GPU, AMD Ryzen 9 6900HX
33120 Points
MSI Raider GE77 HX 12UHS
NVIDIA GeForce RTX 3080 Ti Laptop GPU, Intel Core i9-12900HX
31732 Points -4%
Razer Blade 17 Early 2022
NVIDIA GeForce RTX 3080 Ti Laptop GPU, Intel Core i9-12900H
31033 Points -6%
Average NVIDIA GeForce RTX 3080 Ti Laptop GPU
  (6928 - 34439, n=43)
29496 Points -11%
Average of class Gaming
  (781 - 53059, n=235, last 2 years)
29366 Points -11%
Acer Predator Triton 500 SE PT516-52s-70KX
NVIDIA GeForce RTX 3080 Ti Laptop GPU, Intel Core i7-12700H
28006 Points -15%
Asus ROG Zephyrus Duo 16 GX650RX
NVIDIA GeForce RTX 3080 Ti Laptop GPU, AMD Ryzen 9 6900HX
27562 Points -17%
2560x1440 Time Spy Graphics
MSI Titan GT77 12UHS
NVIDIA GeForce RTX 3080 Ti Laptop GPU, Intel Core i9-12900HX
13554 Points +7%
MSI Raider GE77 HX 12UHS
NVIDIA GeForce RTX 3080 Ti Laptop GPU, Intel Core i9-12900HX
12865 Points +1%
SCHENKER XMG Neo 17 M22
NVIDIA GeForce RTX 3080 Ti Laptop GPU, AMD Ryzen 9 6900HX
12684 Points
Razer Blade 17 Early 2022
NVIDIA GeForce RTX 3080 Ti Laptop GPU, Intel Core i9-12900H
12405 Points -2%
Average of class Gaming
  (224 - 22547, n=233, last 2 years)
12025 Points -5%
Average NVIDIA GeForce RTX 3080 Ti Laptop GPU
  (4921 - 13835, n=43)
11850 Points -7%
Asus ROG Zephyrus Duo 16 GX650RX
NVIDIA GeForce RTX 3080 Ti Laptop GPU, AMD Ryzen 9 6900HX
11227 Points -11%
Acer Predator Triton 500 SE PT516-52s-70KX
NVIDIA GeForce RTX 3080 Ti Laptop GPU, Intel Core i7-12700H
11076 Points -13%
3DMark 11 Performance
33102 pontos
3DMark Fire Strike Score
27946 pontos
3DMark Fire Strike Extreme Score
15762 pontos
3DMark Time Spy Score
12300 pontos
Ajuda

Desempenho nos jogos

O Schenker XMG Neo 17 oferece um desempenho excepcional em jogos. Em poucas palavras, todos os títulos atuais funcionam sem problemas com a resolução nativa e com o máximo de detalhes. As taxas de quadros são consistentemente altas e, graças à grande VRAM, os usuários não terão que se preocupar em atualizar por um bom tempo.

The Witcher 3
1920x1080 High Graphics & Postprocessing (Nvidia HairWorks Off)
MSI Titan GT77 12UHS
Intel Core i9-12900HX, NVIDIA GeForce RTX 3080 Ti Laptop GPU
260 (213min, 216.3P1) fps +10%
MSI Raider GE77 HX 12UHS
Intel Core i9-12900HX, NVIDIA GeForce RTX 3080 Ti Laptop GPU
249 (39.7min, 69.3P0.1, 165.5P1) fps +6%
SCHENKER XMG Neo 17 M22
AMD Ryzen 9 6900HX, NVIDIA GeForce RTX 3080 Ti Laptop GPU
236 (30.3min, 70.5P0.1, 139.4P1) fps
Average NVIDIA GeForce RTX 3080 Ti Laptop GPU
  (144 - 268, n=28)
220 fps -7%
Average of class Gaming
  (17.5 - 449, n=166, last 2 years)
219 fps -7%
Razer Blade 17 Early 2022
Intel Core i9-12900H, NVIDIA GeForce RTX 3080 Ti Laptop GPU
218 (15.9min, 46P0.1, 122.8P1) fps -8%
Asus ROG Zephyrus Duo 16 GX650RX
AMD Ryzen 9 6900HX, NVIDIA GeForce RTX 3080 Ti Laptop GPU
197.9 (47.7min, 61.4P0.1, 127.7P1) fps -16%
Acer Predator Triton 500 SE PT516-52s-70KX
Intel Core i7-12700H, NVIDIA GeForce RTX 3080 Ti Laptop GPU
186.6 (141min) fps -21%
1920x1080 Ultra Graphics & Postprocessing (HBAO+)
MSI Titan GT77 12UHS
Intel Core i9-12900HX, NVIDIA GeForce RTX 3080 Ti Laptop GPU
129.3 (110min, 111.14P1) fps +7%
MSI Raider GE77 HX 12UHS
Intel Core i9-12900HX, NVIDIA GeForce RTX 3080 Ti Laptop GPU
126.7 (29.1min, 45.6P0.1, 97.9P1) fps +5%
SCHENKER XMG Neo 17 M22
AMD Ryzen 9 6900HX, NVIDIA GeForce RTX 3080 Ti Laptop GPU
121 (98min) fps
Razer Blade 17 Early 2022
Intel Core i9-12900H, NVIDIA GeForce RTX 3080 Ti Laptop GPU
119.6 (28.2min, 31P0.1, 74.4P1) fps -1%
Average of class Gaming
  (8.61 - 216, n=226, last 2 years)
116.4 fps -4%
Average NVIDIA GeForce RTX 3080 Ti Laptop GPU
  (30 - 130.6, n=43)
112.1 fps -7%
Asus ROG Zephyrus Duo 16 GX650RX
AMD Ryzen 9 6900HX, NVIDIA GeForce RTX 3080 Ti Laptop GPU
111.1 (30min, 41.5P0.1, 74.7P1) fps -8%
Acer Predator Triton 500 SE PT516-52s-70KX
Intel Core i7-12700H, NVIDIA GeForce RTX 3080 Ti Laptop GPU
102.1 (82min) fps -16%
F1 2021
1920x1080 High Preset AA:T AF:16x
MSI Titan GT77 12UHS
Intel Core i9-12900HX, NVIDIA GeForce RTX 3080 Ti Laptop GPU
302 (224min, 161P1) fps +12%
SCHENKER XMG Neo 17 M22
AMD Ryzen 9 6900HX, NVIDIA GeForce RTX 3080 Ti Laptop GPU
269 (210min, 145P1) fps
Average NVIDIA GeForce RTX 3080 Ti Laptop GPU
  (182.1 - 316, n=17)
247 fps -8%
Acer Predator Triton 500 SE PT516-52s-70KX
Intel Core i7-12700H, NVIDIA GeForce RTX 3080 Ti Laptop GPU
246 (211min, 167P1) fps -9%
Asus ROG Zephyrus Duo 16 GX650RX
AMD Ryzen 9 6900HX, NVIDIA GeForce RTX 3080 Ti Laptop GPU
225 (189min, 124P1) fps -16%
Average of class Gaming
  (20.7 - 470, n=46, last 2 years)
221 fps -18%
Razer Blade 17 Early 2022
Intel Core i9-12900H, NVIDIA GeForce RTX 3080 Ti Laptop GPU
219 (176min, 123P1) fps -19%
MSI Raider GE77 HX 12UHS
Intel Core i9-12900HX, NVIDIA GeForce RTX 3080 Ti Laptop GPU
207 (180min, 131P1) fps -23%
1920x1080 Ultra High Preset + Raytracing AA:T AF:16x
MSI Titan GT77 12UHS
Intel Core i9-12900HX, NVIDIA GeForce RTX 3080 Ti Laptop GPU
158.2 (133min, 130P1) fps +7%
SCHENKER XMG Neo 17 M22
AMD Ryzen 9 6900HX, NVIDIA GeForce RTX 3080 Ti Laptop GPU
148.5 (123min, 117P1) fps
MSI Raider GE77 HX 12UHS
Intel Core i9-12900HX, NVIDIA GeForce RTX 3080 Ti Laptop GPU
133.8 (114min, 91P1) fps -10%
Razer Blade 17 Early 2022
Intel Core i9-12900H, NVIDIA GeForce RTX 3080 Ti Laptop GPU
132.8 (115min, 98P1) fps -11%
Asus ROG Zephyrus Duo 16 GX650RX
AMD Ryzen 9 6900HX, NVIDIA GeForce RTX 3080 Ti Laptop GPU
130.2 (109min, 92P1) fps -12%
Average NVIDIA GeForce RTX 3080 Ti Laptop GPU
  (30.2 - 160.6, n=30)
126.1 fps -15%
Acer Predator Triton 500 SE PT516-52s-70KX
Intel Core i7-12700H, NVIDIA GeForce RTX 3080 Ti Laptop GPU
121.9 (100min, 78P1) fps -18%
Average of class Gaming
  (13.5 - 271, n=63, last 2 years)
118.4 fps -20%
Far Cry 5
1920x1080 High Preset AA:T
MSI Raider GE77 HX 12UHS
Intel Core i9-12900HX, NVIDIA GeForce RTX 3080 Ti Laptop GPU
167 (135min) fps +42%
MSI Titan GT77 12UHS
Intel Core i9-12900HX, NVIDIA GeForce RTX 3080 Ti Laptop GPU
164 (130min) fps +39%
Average NVIDIA GeForce RTX 3080 Ti Laptop GPU
  (118 - 167, n=22)
141.7 fps +20%
Average of class Gaming
  (16 - 232, n=114, last 2 years)
134.7 fps +14%
Razer Blade 17 Early 2022
Intel Core i9-12900H, NVIDIA GeForce RTX 3080 Ti Laptop GPU
122 (86min) fps +3%
Asus ROG Zephyrus Duo 16 GX650RX
AMD Ryzen 9 6900HX, NVIDIA GeForce RTX 3080 Ti Laptop GPU
120 (73min) fps +2%
SCHENKER XMG Neo 17 M22
AMD Ryzen 9 6900HX, NVIDIA GeForce RTX 3080 Ti Laptop GPU
118 (88min) fps
1920x1080 Ultra Preset AA:T
MSI Raider GE77 HX 12UHS
Intel Core i9-12900HX, NVIDIA GeForce RTX 3080 Ti Laptop GPU
156 (122min) fps +38%
MSI Titan GT77 12UHS
Intel Core i9-12900HX, NVIDIA GeForce RTX 3080 Ti Laptop GPU
153 (116min) fps +35%
Average NVIDIA GeForce RTX 3080 Ti Laptop GPU
  (111 - 162, n=24)
133 fps +18%
Average of class Gaming
  (14 - 218, n=124, last 2 years)
126 fps +12%
Razer Blade 17 Early 2022
Intel Core i9-12900H, NVIDIA GeForce RTX 3080 Ti Laptop GPU
116 (89min) fps +3%
SCHENKER XMG Neo 17 M22
AMD Ryzen 9 6900HX, NVIDIA GeForce RTX 3080 Ti Laptop GPU
113 (81min) fps
Asus ROG Zephyrus Duo 16 GX650RX
AMD Ryzen 9 6900HX, NVIDIA GeForce RTX 3080 Ti Laptop GPU
111 (82min) fps -2%
GTA V
1920x1080 High/On (Advanced Graphics Off) AA:2xMSAA + FX AF:8x
MSI Raider GE77 HX 12UHS
Intel Core i9-12900HX, NVIDIA GeForce RTX 3080 Ti Laptop GPU
184.3 (1.907min, 142.9P1) fps +13%
MSI Titan GT77 12UHS
Intel Core i9-12900HX, NVIDIA GeForce RTX 3080 Ti Laptop GPU
182.7 (8.3min, 142.9P1) fps +12%
Acer Predator Triton 500 SE PT516-52s-70KX
Intel Core i7-12700H, NVIDIA GeForce RTX 3080 Ti Laptop GPU
176.1 (2.91min, 111.1P1) fps +8%
Average NVIDIA GeForce RTX 3080 Ti Laptop GPU
  (153.4 - 184.3, n=28)
175.1 fps +7%
Razer Blade 17 Early 2022
Intel Core i9-12900H, NVIDIA GeForce RTX 3080 Ti Laptop GPU
166 (4.33min, 111.1P1) fps +1%
SCHENKER XMG Neo 17 M22
AMD Ryzen 9 6900HX, NVIDIA GeForce RTX 3080 Ti Laptop GPU
163.8 (4.96min, 100P1) fps
Average of class Gaming
  (15.3 - 187.1, n=181, last 2 years)
163.3 fps 0%
Asus ROG Zephyrus Duo 16 GX650RX
AMD Ryzen 9 6900HX, NVIDIA GeForce RTX 3080 Ti Laptop GPU
158.9 (4.88min, 111.1P1) fps -3%
1920x1080 Highest Settings possible AA:4xMSAA + FX AF:16x
MSI Raider GE77 HX 12UHS
Intel Core i9-12900HX, NVIDIA GeForce RTX 3080 Ti Laptop GPU
136 (4.34min, 90.9P1) fps +34%
MSI Titan GT77 12UHS
Intel Core i9-12900HX, NVIDIA GeForce RTX 3080 Ti Laptop GPU
131.8 (6.21min, 90.9P1) fps +29%
Acer Predator Triton 500 SE PT516-52s-70KX
Intel Core i7-12700H, NVIDIA GeForce RTX 3080 Ti Laptop GPU
113 (10.1min, 71.4P1) fps +11%
Average NVIDIA GeForce RTX 3080 Ti Laptop GPU
  (30 - 139.2, n=42)
111 fps +9%
Average of class Gaming
  (6.38 - 167.7, n=216, last 2 years)
106.8 fps +5%
Razer Blade 17 Early 2022
Intel Core i9-12900H, NVIDIA GeForce RTX 3080 Ti Laptop GPU
106 (25.5min, 76.9P1) fps +4%
SCHENKER XMG Neo 17 M22
AMD Ryzen 9 6900HX, NVIDIA GeForce RTX 3080 Ti Laptop GPU
101.8 (18.4min, 71.4P1) fps
Asus ROG Zephyrus Duo 16 GX650RX
AMD Ryzen 9 6900HX, NVIDIA GeForce RTX 3080 Ti Laptop GPU
101.5 (21.1min, 71.4P1) fps 0%

Em nosso teste de estresse, que consiste em rodar o sistema Witcher 3 no Ultra preset, o sistema mostra um desempenho consistente. Não observamos quedas na taxa de quadros até níveis não jogáveis durante o teste ou após jogos prolongados.

Witcher 3 FPS Graph

0102030405060708090100110120Tooltip
SCHENKER XMG Neo 17 M22 R9 6900HX, GeForce RTX 3080 Ti Laptop GPU: Ø119.7 (105-125)
baixo média alto ultraQHD4K
GTA V (2015) 181.2 176.1 163.8 101.8 101.1 121
The Witcher 3 (2015) 386 335 236 121 90.5
Dota 2 Reborn (2015) 146.5 133.9 129.3 121.4 122.7
Final Fantasy XV Benchmark (2018) 190.8 161.5 122.8 96.4 57.9
X-Plane 11.11 (2018) 113.7 102 80.3 86.4
Far Cry 5 (2018) 142 125 118 113 110 70
Strange Brigade (2018) 205 277 229 201 154.4 95
Shadow of the Tomb Raider (2018) 175.2 152.9 152.6 156.5 123.9 72.4
Far Cry New Dawn (2019) 125 112 108 96 93 73
Metro Exodus (2019) 172.4 134.4 108.6 88.1 73.2 47.6
Borderlands 3 (2019) 123.6 106.4 99.8 90.7 78.2 46.1
F1 2020 (2020) 304 271 255 197.9 153.6 88.1
F1 2021 (2021) 354 314 269 148.5 114.2 65.3
New World (2021) 126.4 106.5 97 94.5 85.9 50.3
Far Cry 6 (2021) 118.6 104 95 99.4 86.6 54.2
God of War (2022) 129.9 127.9 111.1 78.9 64.7 46.5
Tiny Tina's Wonderlands (2022) 222 185.4 137.1 110.5 79.3 43.9
F1 22 (2022) 193 184 172 91 62 32

Emissões - Relativamente barulhentas sob carga

Ruído do sistema

Sob carga, a solução de resfriamento tem seu trabalho cortado para si mesma, resultando em um nível máximo de ruído de até 54 dB(A). Uma vez que os outros dispositivos em nossa comparação não são significativamente mais silenciosos, os valores do Schenker XMG Neo 17 não são nada fora do comum. O sistema pode ser conectado a um Oasis XMG para níveis de ruído potencialmente mais silenciosos. No entanto, não somos capazes de verificar isto no momento.

Barulho

Ocioso
26 / 29 / 40 dB
Carga
47 / 54 dB
  red to green bar
 
 
30 dB
silencioso
40 dB(A)
audível
50 dB(A)
ruidosamente alto
 
min: dark, med: mid, max: light   Earthworks M23R, Arta (15 cm de distância)   environment noise: 26 dB(A)
dB(A) 0102030405060708090Deep BassMiddle BassHigh BassLower RangeMidsHigher MidsLower HighsMid HighsUpper HighsSuper Highs2044.738.438.343.3402544.636.536.536.435.23156.546.944.348.548.64042.535.535.733.6355042.341.441.24142.86335.532.636.629.634.18032.130.824.922.931.210027.327.421.72029.712527.625.121.719.831.816031.429.723.722.833.620031.332.227.124.236.125032.831.525.323.336.231534.83025.622.338.940034.329.120.918.439.750034.930.520.517.940.16304131.422.616.343.680036.430.21714.443.1100036.931.216.613.943.812503831.416.112.345.1160034.927.914.411.942.4200033.426.71511.941250034.328.61412.941.8315035.428.113.613.442.8400033.12414.213.241.5500031.222.214.213.441.4630028.418.814.414.139.3800023.515.414.113.935.71000021.314.513.913.233.81250018.414.113.512.928.91600019.115.213.712.125.4SPL46.94029.326.953.8N5.83.41.20.99.6median 33.1median 28.1median 16.1median 13.9median 39.7Delta3.94.53.93.24.4hearing rangehide median Fan NoiseSCHENKER XMG Neo 17 M22
SCHENKER XMG Neo 17 M22
R9 6900HX, GeForce RTX 3080 Ti Laptop GPU
MSI Titan GT77 12UHS
i9-12900HX, GeForce RTX 3080 Ti Laptop GPU
Razer Blade 17 Early 2022
i9-12900H, GeForce RTX 3080 Ti Laptop GPU
Acer Predator Triton 500 SE PT516-52s-70KX
i7-12700H, GeForce RTX 3080 Ti Laptop GPU
Asus ROG Zephyrus Duo 16 GX650RX
R9 6900HX, GeForce RTX 3080 Ti Laptop GPU
MSI Raider GE77 HX 12UHS
i9-12900HX, GeForce RTX 3080 Ti Laptop GPU
Noise
10%
4%
0%
9%
-7%
off / environment *
26
21.9
16%
26
-0%
26
-0%
26
-0%
26
-0%
Idle Minimum *
26
24.53
6%
26
-0%
26
-0%
26
-0%
26
-0%
Idle Average *
29
24.53
15%
27
7%
29
-0%
27
7%
34
-17%
Idle Maximum *
40
24.53
39%
32
20%
34
15%
29
27%
46
-15%
Load Average *
47
46.25
2%
50
-6%
50
-6%
41
13%
50
-6%
Witcher 3 ultra *
52
56.86
-9%
51
2%
53
-2%
48
8%
55
-6%
Load Maximum *
54
54.25
-0%
51
6%
56
-4%
50
7%
57
-6%

* ... smaller is better

Temperatura

Com até 52 °C (125,6 °F), a parte inferior do chassi fica visivelmente quente. No entanto, os outros dispositivos em nossa comparação atingem temperaturas semelhantes. Como também medimos temperaturas similares enquanto jogávamos, desaconselhamos o uso do sistema em sua volta. Não há problemas durante o ociosidade. As temperaturas de pico caem então para 30 °C (86 °F) e 33 °C (91,4 °F), respectivamente.

Teste de estresse
Teste de estresse
Teste de estresse
Teste de estresse
Teste de estresse
Teste de estresse
Witcher 3
Witcher 3
Witcher 3
Witcher 3
Witcher 3
Witcher 3
 49 °C48 °C45 °C 
 47 °C47 °C42 °C 
 38 °C31 °C32 °C 
Máximo: 49 °C
Médio: 42.1 °C
47 °C52 °C46 °C
37 °C49 °C40 °C
34 °C37 °C36 °C
Máximo: 52 °C
Médio: 42 °C
alimentação elétrica  48 °C | Temperatura do quarto 20 °C | Fluke t3000FC (calibrated), Voltcraft IR-900
(-) The average temperature for the upper side under maximal load is 42.1 °C / 108 F, compared to the average of 33.8 °C / 93 F for the devices in the class Gaming.
(-) The maximum temperature on the upper side is 49 °C / 120 F, compared to the average of 40.4 °C / 105 F, ranging from 21.2 to 68.8 °C for the class Gaming.
(-) The bottom heats up to a maximum of 52 °C / 126 F, compared to the average of 43.2 °C / 110 F
(+) In idle usage, the average temperature for the upper side is 29.7 °C / 85 F, compared to the device average of 33.8 °C / 93 F.
(-) Playing The Witcher 3, the average temperature for the upper side is 41.9 °C / 107 F, compared to the device average of 33.8 °C / 93 F.
(±) The palmrests and touchpad can get very hot to the touch with a maximum of 39 °C / 102.2 F.
(-) The average temperature of the palmrest area of similar devices was 28.9 °C / 84 F (-10.1 °C / -18.2 F).
SCHENKER XMG Neo 17 M22
AMD Ryzen 9 6900HX, NVIDIA GeForce RTX 3080 Ti Laptop GPU
MSI Titan GT77 12UHS
Intel Core i9-12900HX, NVIDIA GeForce RTX 3080 Ti Laptop GPU
Razer Blade 17 Early 2022
Intel Core i9-12900H, NVIDIA GeForce RTX 3080 Ti Laptop GPU
Acer Predator Triton 500 SE PT516-52s-70KX
Intel Core i7-12700H, NVIDIA GeForce RTX 3080 Ti Laptop GPU
Asus ROG Zephyrus Duo 16 GX650RX
AMD Ryzen 9 6900HX, NVIDIA GeForce RTX 3080 Ti Laptop GPU
MSI Raider GE77 HX 12UHS
Intel Core i9-12900HX, NVIDIA GeForce RTX 3080 Ti Laptop GPU
Heat
-4%
-11%
3%
1%
-19%
Maximum Upper Side *
49
40.8
17%
50
-2%
47
4%
45
8%
53
-8%
Maximum Bottom *
52
52.4
-1%
56
-8%
49
6%
50
4%
58
-12%
Idle Upper Side *
30
34.6
-15%
36
-20%
31
-3%
33
-10%
38
-27%
Idle Bottom *
33
38.4
-16%
38
-15%
32
3%
33
-0%
43
-30%

* ... smaller is better

Teste de estresse

Solução de resfriamento do XMG Neo 17 M22

Schenker gerencia o calor da CPU e GPU razoavelmente bem, embora oRyzen 9 6900HXa temperatura máxima de quase 95 °C (203 °F) está muito próxima da marca de 100-°C (212 °F). No entanto, o desempenho do SoC é consistente e sem grandes quedas. O SoC atinge um pico de consumo de energia de 80 watts, que depois cai e se estabiliza em 40 watts com o tempo. As temperaturas da GPU parecem significativamente melhores. Apesar de atingir um pico de consumo de até 170 watts, registramos uma temperatura máxima de apenas 77 °C (170,6 °F) durante nosso teste de estresse.

Oradores

Há dois alto-falantes de downfiring abaixo dos descansos da palma da mão. Infelizmente, eles estão faltando em termos de graves, sendo os médios e agudos uma parte significativamente mais dominante do som. Para jogos, os usuários provavelmente optarão por um fone de ouvido de qualquer forma. Um modelo apropriado pode ser conectado ao laptop através da tomada de fone de ouvido de 3,5 mm ou USB.

dB(A) 0102030405060708090Deep BassMiddle BassHigh BassLower RangeMidsHigher MidsLower HighsMid HighsUpper HighsSuper Highs2043.342.92536.438.43148.549.84033.637.9504140.96329.634.48022.931.11002034.912519.840.116022.844.220024.247.225023.35231522.355.640018.460.950017.968.363016.37380014.471.3100013.968.8125012.367160011.968200011.964.2250012.964.4315013.462.7400013.259.9500013.469.8630014.170.2800013.9641000013.264.61250012.960.41600012.147.9SPL26.979.5N0.946.8median 13.9median 64Delta3.28.340.238.840.238373846.64146.629.631.229.628.926.528.932.827.232.832.721.832.743.118.243.153.520.353.556.918.456.961.321.761.369.324.169.370.420.670.469.114.469.17216.57274.715.774.772.413.872.47013.47070.112.770.17213726813.36865.213.465.264.313.564.356.413.356.457.313.657.351.313.851.357.813.457.85712.85752.613.152.649.413.349.480.326.580.347.90.847.9median 64.3median 13.6median 64.38.11.88.1hearing rangehide median Pink NoiseSCHENKER XMG Neo 17 M22Asus ROG Zephyrus Duo 16 GX650RX
Frequency diagram (checkboxes can be checked and unchecked to compare devices)
SCHENKER XMG Neo 17 M22 audio analysis

(±) | speaker loudness is average but good (80 dB)
Bass 100 - 315 Hz
(-) | nearly no bass - on average 18.4% lower than median
(±) | linearity of bass is average (8.2% delta to prev. frequency)
Mids 400 - 2000 Hz
(+) | balanced mids - only 4.4% away from median
(±) | linearity of mids is average (7% delta to prev. frequency)
Highs 2 - 16 kHz
(+) | balanced highs - only 2.6% away from median
(+) | highs are linear (6.2% delta to prev. frequency)
Overall 100 - 16.000 Hz
(±) | linearity of overall sound is average (17.3% difference to median)
Compared to same class
» 44% of all tested devices in this class were better, 12% similar, 44% worse
» The best had a delta of 6%, average was 18%, worst was 132%
Compared to all devices tested
» 27% of all tested devices were better, 8% similar, 65% worse
» The best had a delta of 4%, average was 25%, worst was 134%

Asus ROG Zephyrus Duo 16 GX650RX audio analysis

(±) | speaker loudness is average but good (80 dB)
Bass 100 - 315 Hz
(±) | reduced bass - on average 8.9% lower than median
(±) | linearity of bass is average (12.4% delta to prev. frequency)
Mids 400 - 2000 Hz
(±) | higher mids - on average 6.8% higher than median
(+) | mids are linear (4.3% delta to prev. frequency)
Highs 2 - 16 kHz
(±) | reduced highs - on average 6% lower than median
(±) | linearity of highs is average (7.3% delta to prev. frequency)
Overall 100 - 16.000 Hz
(±) | linearity of overall sound is average (16.5% difference to median)
Compared to same class
» 39% of all tested devices in this class were better, 6% similar, 55% worse
» The best had a delta of 6%, average was 18%, worst was 132%
Compared to all devices tested
» 23% of all tested devices were better, 5% similar, 72% worse
» The best had a delta of 4%, average was 25%, worst was 134%

Gestão de energia - Bons valores de consumo

Consumo de energia

O Schenker XMG Neo 17 tem algumas surpresas em estoque quando se trata do consumo de energia, uma vez que é muito eficiente durante ociosidade e sob baixa carga. Nenhum outro dispositivo é capaz de igualar nosso Schenker neste aspecto. Sob carga máxima, o sistema exige até 306 watts do adaptador AC, o que não é um problema devido à potência nominal de 330 watts do tijolo.

adaptador AC de 330 watts
Consumo de energia
desligadodarklight 0.1 /  Watt
Ociosodarkmidlight 7 / 11 / 17 Watt
Carga midlight 92 / 306 Watt
 color bar
Key: min: dark, med: mid, max: light        Metrahit Energy
Currently we use the Metrahit Energy, a professional single phase power quality and energy measurement digital multimeter, for our measurements. Find out more about it here. All of our test methods can be found here.
SCHENKER XMG Neo 17 M22
R9 6900HX, GeForce RTX 3080 Ti Laptop GPU
MSI Titan GT77 12UHS
i9-12900HX, GeForce RTX 3080 Ti Laptop GPU
Razer Blade 17 Early 2022
i9-12900H, GeForce RTX 3080 Ti Laptop GPU
Acer Predator Triton 500 SE PT516-52s-70KX
i7-12700H, GeForce RTX 3080 Ti Laptop GPU
Asus ROG Zephyrus Duo 16 GX650RX
R9 6900HX, GeForce RTX 3080 Ti Laptop GPU
MSI Raider GE77 HX 12UHS
i9-12900HX, GeForce RTX 3080 Ti Laptop GPU
Average NVIDIA GeForce RTX 3080 Ti Laptop GPU
 
Average of class Gaming
 
Power Consumption
-114%
-61%
-18%
-59%
-52%
-72%
-46%
Idle Minimum *
7
30.21
-332%
17
-143%
7
-0%
19
-171%
13
-86%
17.2 ?(7 - 33.2, n=28)
-146%
Idle Average *
11
32.42
-195%
23
-109%
19
-73%
24
-118%
19
-73%
23.3 ?(11 - 38, n=28)
-112%
Idle Maximum *
17
33.7
-98%
34
-100%
28
-65%
31
-82%
29
-71%
30.8 ?(17 - 60.8, n=28)
-81%
Load Average *
92
125.09
-36%
120
-30%
114
-24%
104
-13%
143
-55%
121.2 ?(92 - 150, n=28)
-32%
Witcher 3 ultra *
221
256
-16%
229
-4%
159
28%
186.5
16%
247
-12%
Load Maximum *
306
321.88
-5%
243
21%
227
26%
256
16%
352
-15%

* ... smaller is better

Consumption Witcher 3 / Stress Test

0153045607590105120135150165180195210225240255Tooltip
SCHENKER XMG Neo 17 M22; Witcher 3 ultra: Ø221 (201-226)
SCHENKER XMG Neo 17 M22; 1280x720 Prime95 28.10 and Furmark 1.25: Ø237 (147.8-260)

Consumption external Monitor

0153045607590105120135150165180195210225Tooltip
SCHENKER XMG Neo 17 M22; Prime95 V2810 Stress (external Monitor): Ø104.9 (90.7-113.4)
SCHENKER XMG Neo 17 M22; Cinebench R15 Multi (external Monitor): Ø107.5 (105.8-112.6)
SCHENKER XMG Neo 17 M22; 1280x720 FurMark 1.19 GPU Stress Test (external Monitor): Ø210 (204-215)
SCHENKER XMG Neo 17 M22; 1920x1080 The Witcher 3 ultra (external Monitor): Ø222 (204-233)

Vida útil da bateria

bateria de 99-Wh
bateria de 99-Wh

A Schenker equipa o XMG Neo 17 com uma grande bateria de 99-Wh, que é capaz de alimentar nossa amostra de teste por quase 9 horas em nosso teste Wi-Fi. Este é um excelente resultado, especialmente comparado com seus concorrentes. O tempo de execução da reprodução do vídeo é ligeiramente menor e o dispositivo tem que ser recarregado após apenas cerca de 6,5 horas. O recarregamento total da grande bateria é surpreendentemente rápido, com apenas 102 minutos.

Deve-se notar que o desempenho da CPU e da GPU são limitados no modo de bateria. Entretanto, este comportamento não é exclusivo do Schenker XMG Neo 17 e está presente em quase todos os laptops de jogos atuais.

Vida útil máxima da bateria
Duração da bateria de carga
Vida útil da bateria Wi-Fi
Vida útil da bateria Wi-Fi (brilho máximo)
Duração da bateria H.264
Tempo de carga
Tempo de carga
Tempo de Execução da Bateria
Ocioso (sem WLAN, min brilho)
12h 02min
WiFi Websurfing (EDGE: 104.0.1293.63)
8h 57min
WiFi Websurfing max. Brightness (EDGE: 104.0.1293.63)
3h 29min
Big Buck Bunny H.264 1080p
6h 38min
Carga (máximo brilho)
1h 49min
SCHENKER XMG Neo 17 M22
R9 6900HX, GeForce RTX 3080 Ti Laptop GPU, 99 Wh
MSI Titan GT77 12UHS
i9-12900HX, GeForce RTX 3080 Ti Laptop GPU, 99.9 Wh
Razer Blade 17 Early 2022
i9-12900H, GeForce RTX 3080 Ti Laptop GPU, 82 Wh
Acer Predator Triton 500 SE PT516-52s-70KX
i7-12700H, GeForce RTX 3080 Ti Laptop GPU, 99.98 Wh
Asus ROG Zephyrus Duo 16 GX650RX
R9 6900HX, GeForce RTX 3080 Ti Laptop GPU, 90 Wh
MSI Raider GE77 HX 12UHS
i9-12900HX, GeForce RTX 3080 Ti Laptop GPU, 99.99 Wh
Average of class Gaming
 
Battery Runtime
-13%
-33%
3%
-3%
-12%
-20%
Reader / Idle
722
428
-41%
749
4%
590
-18%
H.264
398
433
9%
290
-27%
490
23%
559
40%
389
-2%
WiFi v1.3
537
412.1
-23%
229
-57%
344
-36%
469
-13%
324
-40%
Load
109
82
-25%
103
-6%
133
22%
62
-43%
122
12%
Witcher 3 ultra
90

Pro

+ chassi metálico robusto
+ display 16:10 colorido com 240 Hz
+ touchpad muito grande
+ chaves mecânicas com chaves Cherry MX
+ 2,5-Gb/s Ethernet
+ CPU e GPU têm um desempenho consistente sob carga
+ boa duração da bateria
+ valores aceitáveis de consumo de energia
+ grande variedade de opções de configuração disponíveis
+ XMG Oásis pronto (resfriamento líquido)

Contra

- latências problemáticas do DPC
- sem opções 4K

Veredicto - Caderno de Jogo Rápido com Refrigeração de Água Opcional

Em revisão: XMG Neo 17 M22, cortesia da Schenker Alemanha

Uma caixa robusta e elegante, desempenho quase ilimitado durante o uso diário, e a GPU para laptop mais rápida da Nvidia, combinada com a possibilidade de resfriamento líquido do dispositivo fazem do Schenker XMG Neo 17 uma oferta convincente em papel. O fabricante praticamente não se compromete com nada e permite que o hardware libere todo o seu potencial, o que na maioria das vezes resulta em excelentes resultados de referência.

O AMD Ryzen 9 6900HX em nosso Neo 17 tem um bom desempenho e é capaz de manter seu desempenho por períodos prolongados de tempo. O mesmo vale para o Nvidia GeForce RTX 3080 Ti. Estas são nossas observações sem o opcional XMG Oasis, uma vez que a solução de resfriamento integrado já facilita o desempenho estável. Para os usuários que preferem um sistema mais silencioso, o refrigerador de água opcional pode valer a pena considerar. Estamos satisfeitos em ver um display com o fator de forma 16:10. Sua única desvantagem é a cobertura um pouco estreita do espaço de cores AdobeRGB e P3, que não é suficientemente boa para a edição profissional de fotos e vídeos. Dito isto, este não é um problema se você estiver usando o XMG Neo 17 como um laptop para jogos.

O Schenker XMG Neo 17 é um notebook de jogo rápido que não precisa acelerar artificialmente o seu desempenho. Graças ao acessório opcional XMG Oasis, o laptop suporta até mesmo resfriamento líquido.

No geral, o Schenker XMG Neo 17 é um notebook sólido para jogos que oferece muito em termos de desempenho. Também não encontramos grandes inconvenientes. O Neo 17 também se sai bem quando se trata da duração da bateria. Se criticássemos alguma coisa, seria o teclado, que vem com um teclado numérico que infelizmente não usa interruptores Cherry MX. Além disso, a tomada do adaptador AC em ângulo é subótima, já que uma tomada reta não obstruiria desnecessariamente as portas próximas. Há espaço para melhorias em termos de desempenho Wi-Fi. Pelo menos, os usuários podem optar por um módulo Wi-Fi mais moderno/rápido durante o processo de configuração. Por falar nisso - este último é caracteristicamente Schenker e bem organizado. O dispositivo pode ser personalizado de acordo com suas preferências e há uma ampla gama de opções. Além da unidade base, tanto a CPU quanto a tela são fixas e não podem ser alteradas.

O Schenker XMG Neo 17 tem muita concorrência. Como mencionado anteriormente, alguns Laptops alimentados pela Intel Alder Lake podem oferecer um desempenho ainda mais rápido. O MSI Titan GT77 12UHS é um exemplo de um desses dispositivos, embora seja (mesmo) mais caro do que nossa configuração do Neo 17, que custa cerca de 4200 USD.

Preço e Disponibilidade

O Schenker XMG Neo 17 está disponível diretamente na loja online do fabricante https://www.awin1.com/cread.php?awinmid=16273&awinaffid=343879&ued=https%3A%2F%2Fbestware.com%2Fen%2Fxmg-neo-17-amd-m22.html com muitas opções de configuração diferentes. O modelo básico custa cerca de 2950 USD, enquanto que nossa configuração de varejo custa cerca de 4200 USD.

SCHENKER XMG Neo 17 M22 - 08/31/2022 v7
Sebastian Bade
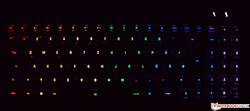
Acabamento
83 / 98 → 84%
Teclado
89%
Mouse
86%
Conectividade
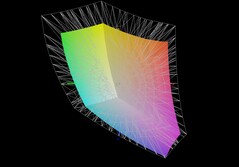
60 / 80 → 75%
Peso
58 / 10-66 → 86%
Bateria
76 / 95 → 80%
Pantalha
92%
Desempenho do jogos
99%
Desempenho da aplicação
97%
Temperatura
80 / 95 → 85%
Ruído
66 / 90 → 74%
Audio
78%
Camera
42 / 85 → 49%
Médio
78%
88%
Gaming - Médio equilibrado

Pricecompare

Please share our article, every link counts!
> Análises e revisões de portáteis e celulares > Análises > Análises > Schenker XMG Neo 17 M22 em revisão: Laptop para jogos de alto desempenho com teclas mecânicas Cherry MX
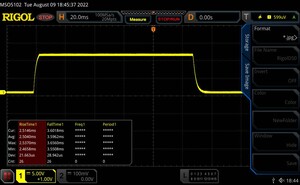
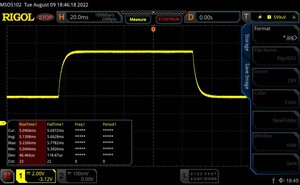
Sebastian Bade, 2022-09- 1 (Update: 2022-09- 1)