MSI Titan GT77 12UHS Revisão de Laptop: Alder Lake-HX poster criança com desempenho de classe desktop sem impedimentos
A MSI Titan tem sido o carro-chefe da empresa até a 10ª geração da Intel Titan GT76 série em 2020. No 11º gênero, a MSI optou por limitar sua oferta principal ao GE76 Raider 11UH. O Raider GE76 recebe uma atualização do Alder Lake em 2022 também com o GE76 Raider 12U. Entretanto, a introdução pela Intel da plataforma Alder Lake-HX significou que a MSI agora tem um incentivo para reviver a icônica classe Titan de laptops
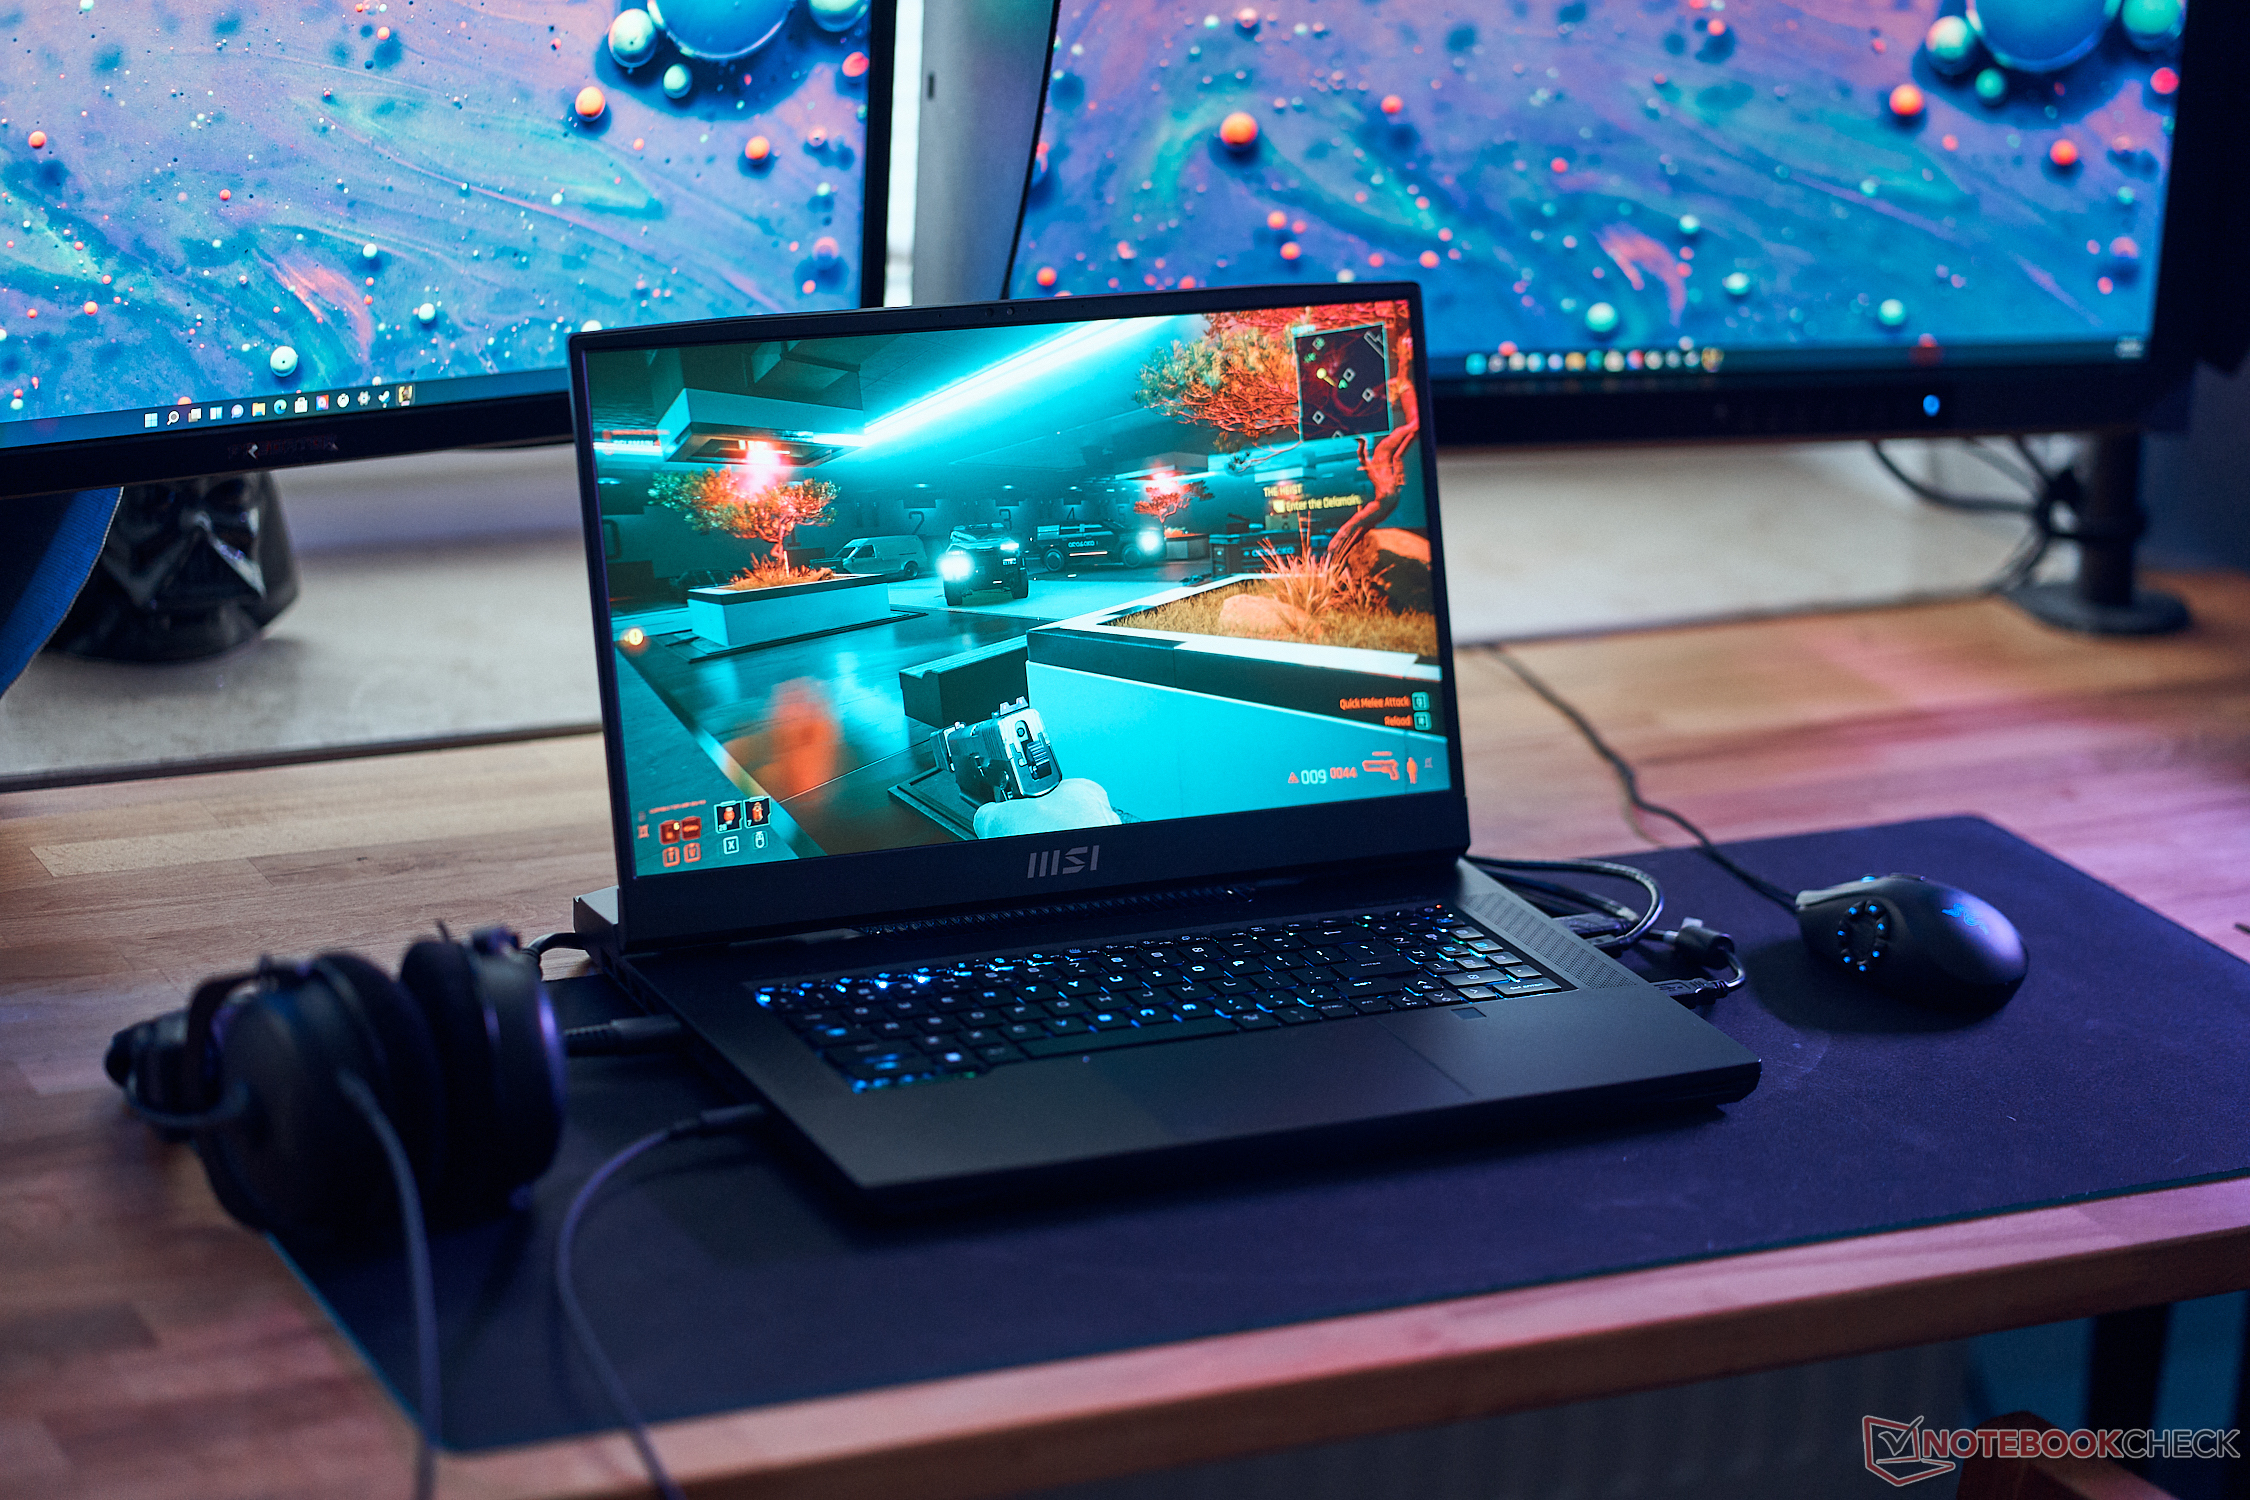
A série MSI Titan GT77 12U deste ano procura ser um pacote holístico que oferece quase tudo o que um entusiasta do jogo desejaria. CPU de classe desktop? Confira. Memória maximizada? Confira. A GPU mais rápida possível? Verifique. Todo o armazenamento que você pode encher? Verifique. Um teclado mecânico Cherry MX? Confira. Um display de alta taxa de atualização? Cheque e dupla checagem.
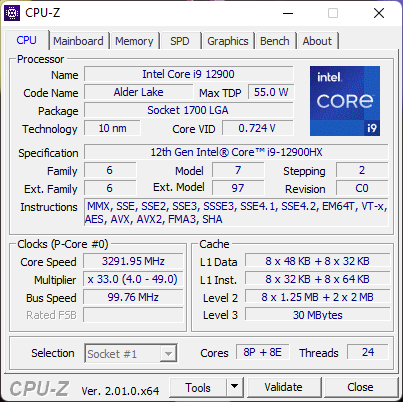
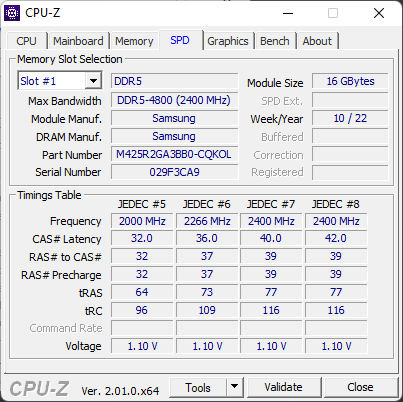
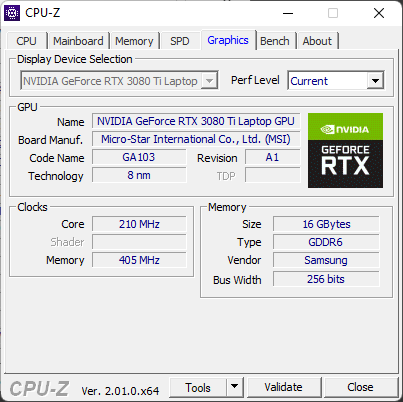
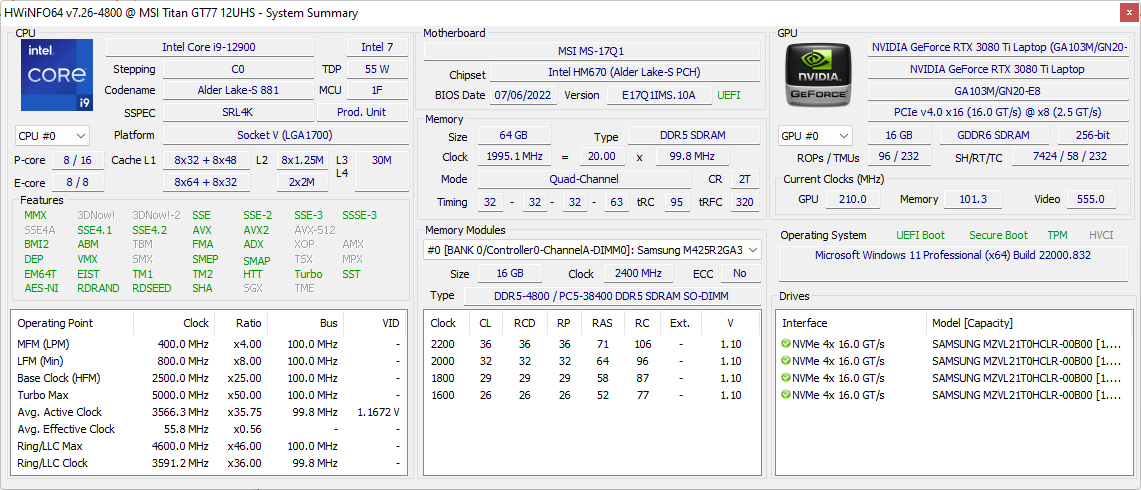
Embora a MSI tenha revelado oficialmente a linha HX na Índia, estes laptops ainda não foram disponibilizados no varejo no país no momento em que foram escritos. Nossa amostra de revisão MSI Titan GT77 12UHS foi fornecida pela Intel Índia e é alimentada pela Núcleo i9-12900HX64 GB DDR5-4800 RAM, uma RAM de 175 W GPU para laptop RTX 3080 Ti, 4x 1 TB Samsung PM9A1 NVMe SSDs, um painel de 17,3 polegadas 360 Hz FHD, e uma bateria de 99,9 WHr. De acordo com a Intel, esta configuração irá atrasá-lo em cerca de US$ 4.999 (convertido em aprox. ₹3,96.617).
Há também um modelo mais acessível do Titan GT77 com um Núcleo i7-12800HX e um GPU para notebook RTX 3070 Ti por cerca de US$3.100. Nosso modelo FHD 360 Hz ainda não está disponível on-line no MSI ou na Amazon e todas as configurações atualmente disponíveis fazem uso de uma tela UHD de 120 Hz, cuja revisão será feita em breve.
Nesta revisão, nós começamos a avaliar o MSI Titan GT77 e ver como os novos processadores Alder Lake-HX de classe desktop da Intel auxiliam no reavivamento do icônico Titan e na experiência de usar o que é potencialmente o laptop de jogos mais poderoso do mercado.
Possíveis concorrentes em comparação
Avaliação | Data | Modelo | Peso | Altura | Size | Resolução | Preço |
|---|---|---|---|---|---|---|---|
| 88.3 % v7 (old) | 08/2022 | MSI Titan GT77 12UHS i9-12900HX, GeForce RTX 3080 Ti Laptop GPU | 3.3 kg | 23 mm | 17.30" | 1920x1080 | |
| 83.7 % v7 (old) | 08/2022 | Aorus 17X XES i9-12900HX, GeForce RTX 3070 Ti Laptop GPU | 2.7 kg | 30 mm | 17.30" | 1920x1080 | |
| 86.8 % v7 (old) | 07/2022 | MSI Raider GE77 HX 12UHS i9-12900HX, GeForce RTX 3080 Ti Laptop GPU | 3.1 kg | 25.9 mm | 17.30" | 3840x2160 | |
| 87.7 % v7 (old) | 07/2022 | MSI GE67 HX 12UGS i7-12800HX, GeForce RTX 3070 Ti Laptop GPU | 2.5 kg | 23.4 mm | 15.60" | 1920x1080 | |
| 88.2 % v7 (old) | 05/2022 | Asus ROG Zephyrus Duo 16 GX650RX R9 6900HX, GeForce RTX 3080 Ti Laptop GPU | 2.6 kg | 20.5 mm | 16.00" | 3840x2400 | |
| 89.2 % v7 (old) | 05/2022 | Alienware x17 R2 P48E i9-12900HK, GeForce RTX 3080 Ti Laptop GPU | 3.1 kg | 20.9 mm | 17.30" | 1920x1080 | |
| 84.7 % v7 (old) | 03/2022 | Gigabyte Aero 16 YE5 i9-12900HK, GeForce RTX 3080 Ti Laptop GPU | 2.3 kg | 22.4 mm | 16.00" | 3840x2400 | |
| 87.5 % v7 (old) | 01/2022 | MSI GE76 Raider i9-12900HK, GeForce RTX 3080 Ti Laptop GPU | 3 kg | 26 mm | 17.30" | 1920x1080 |
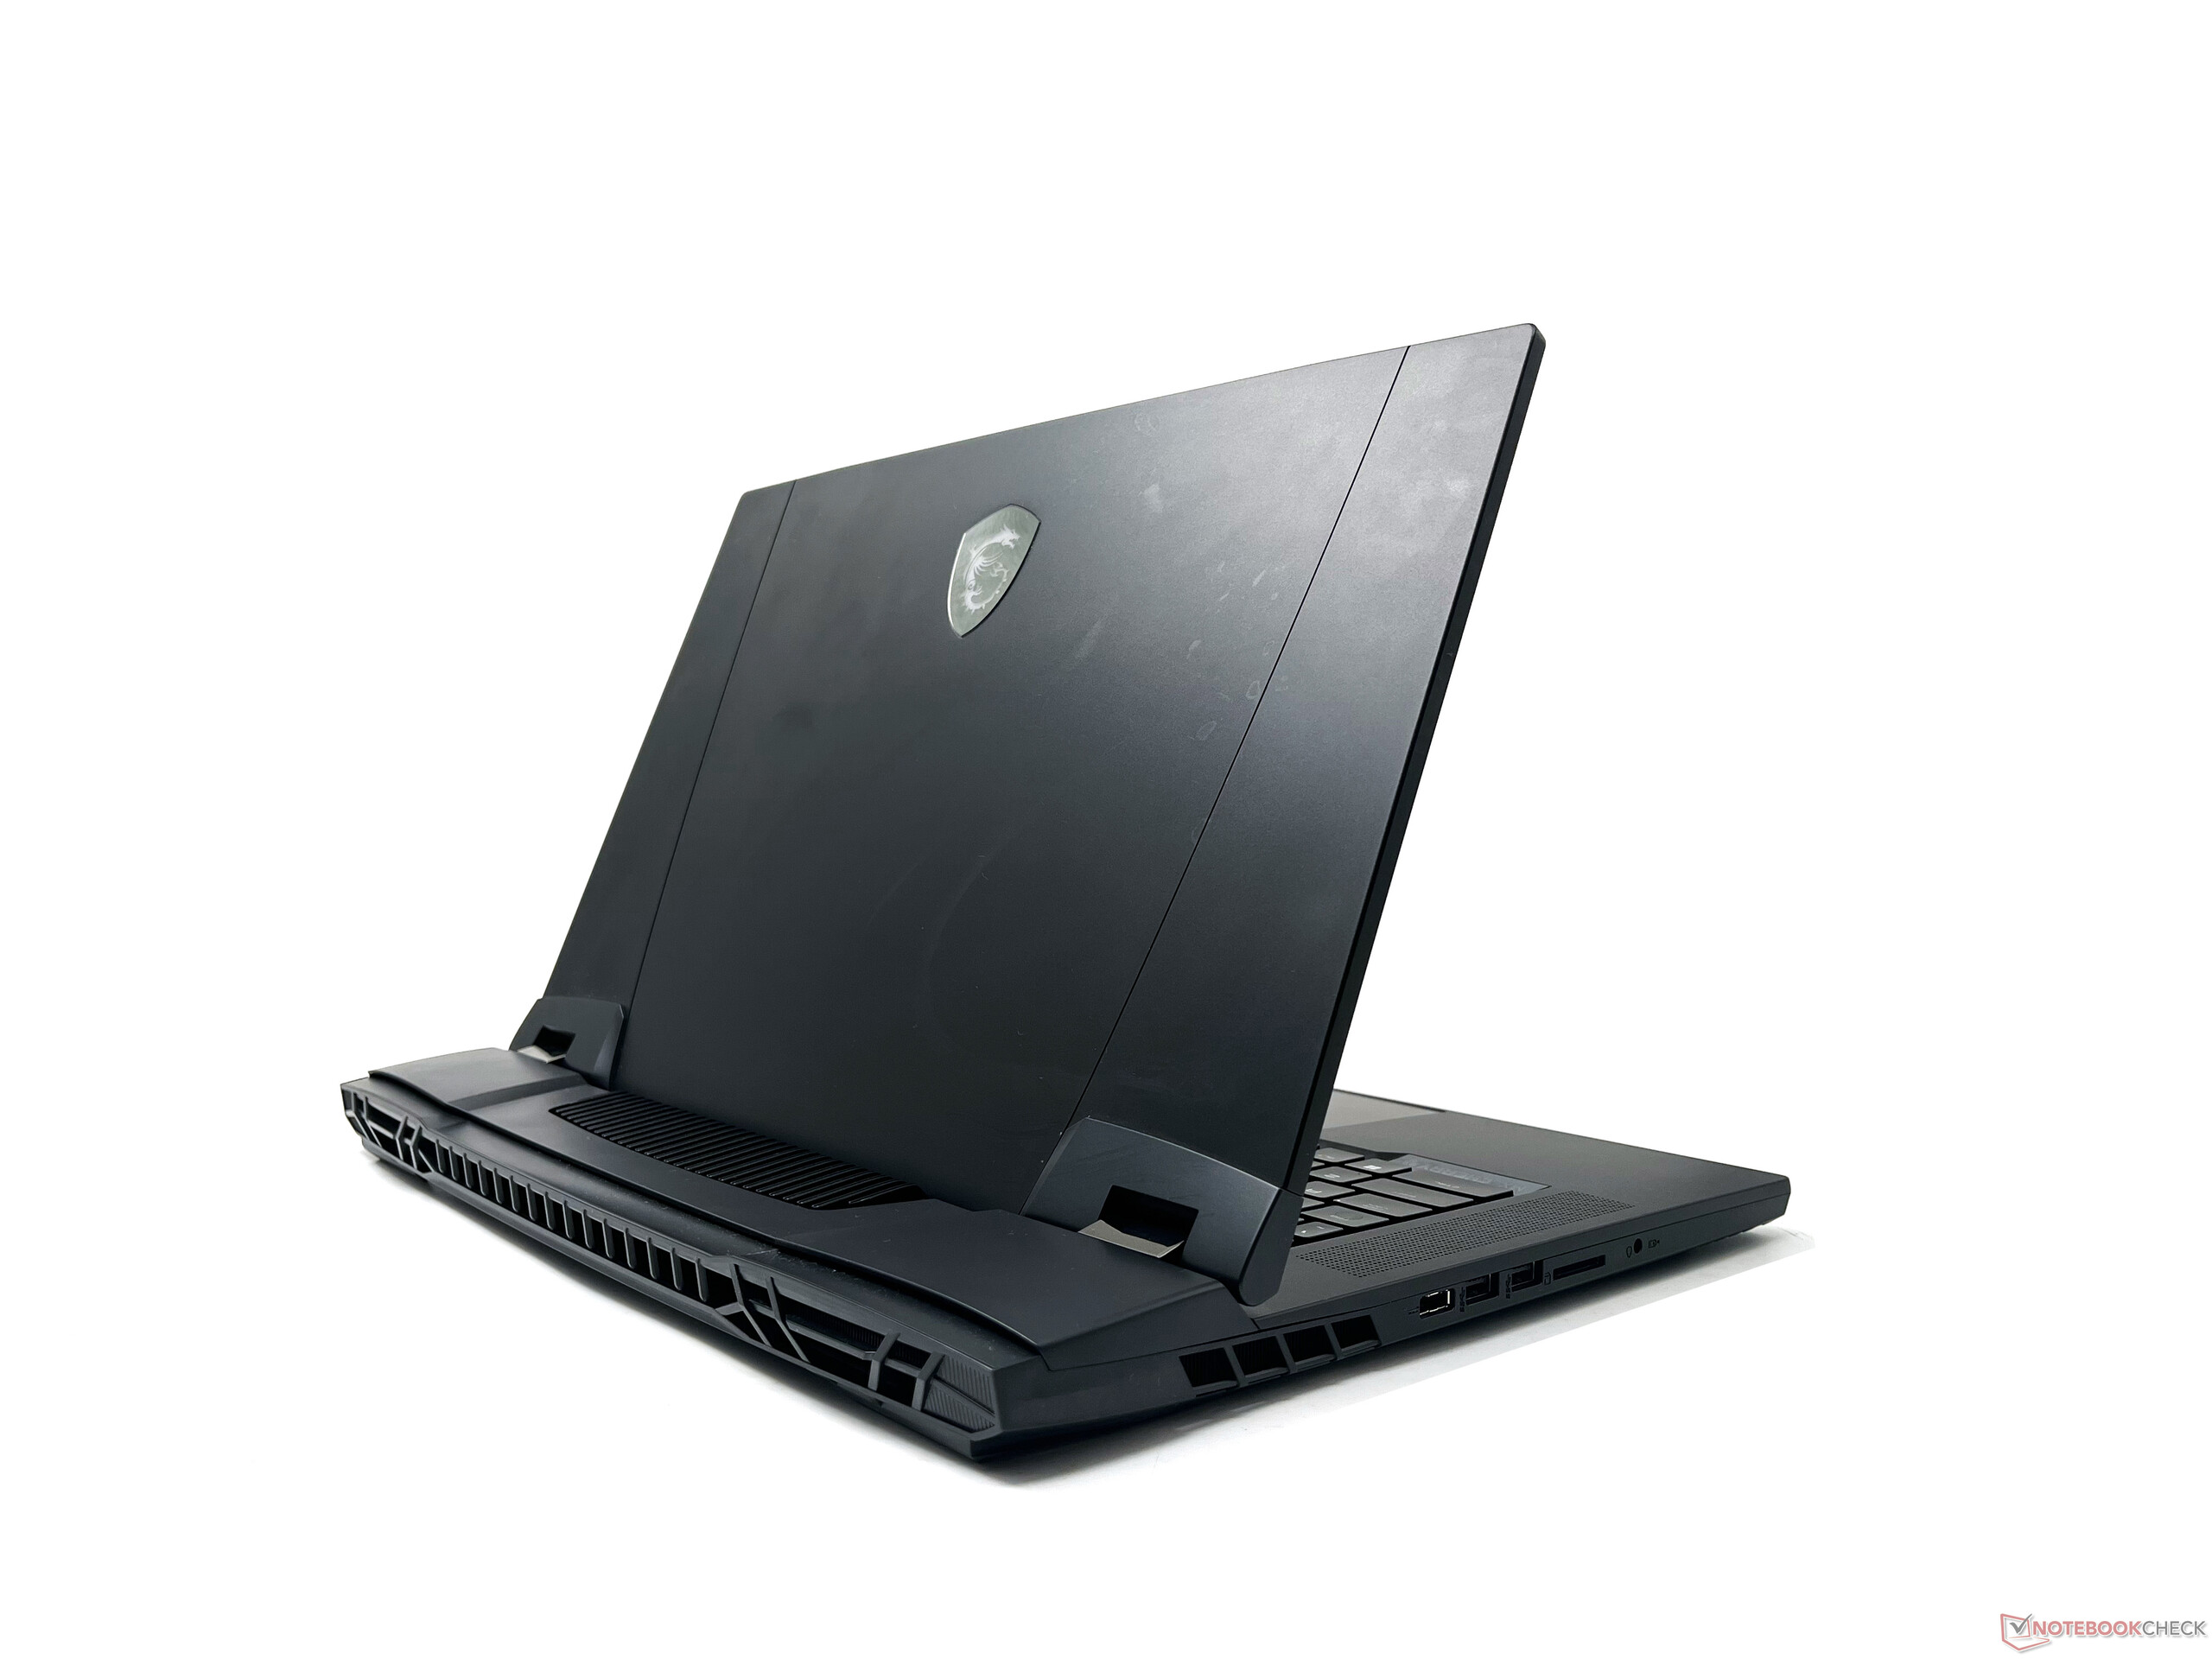
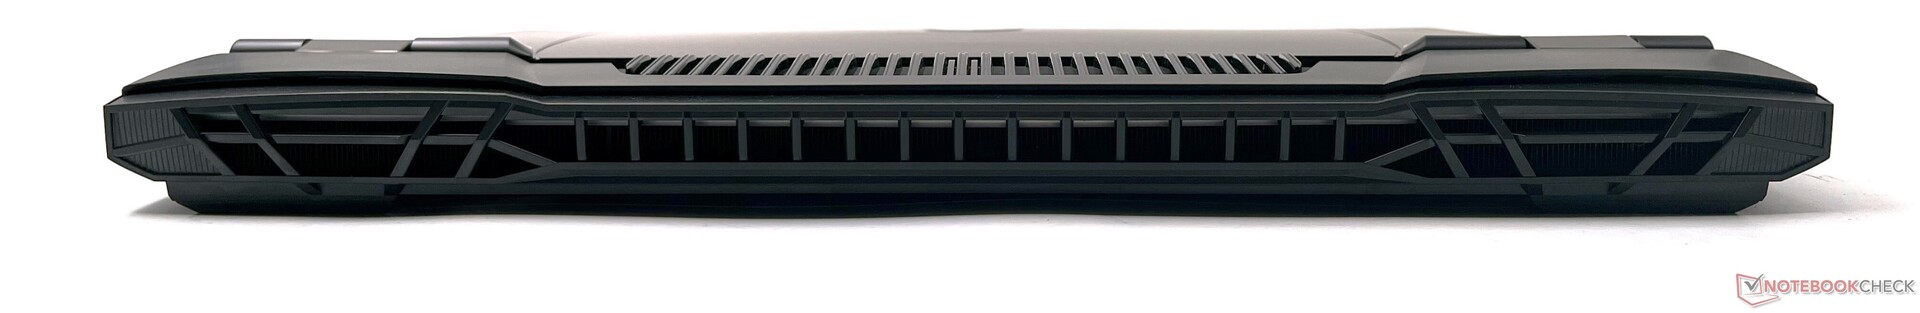
Estojo: Significativamente mais fino que o Titan GT76
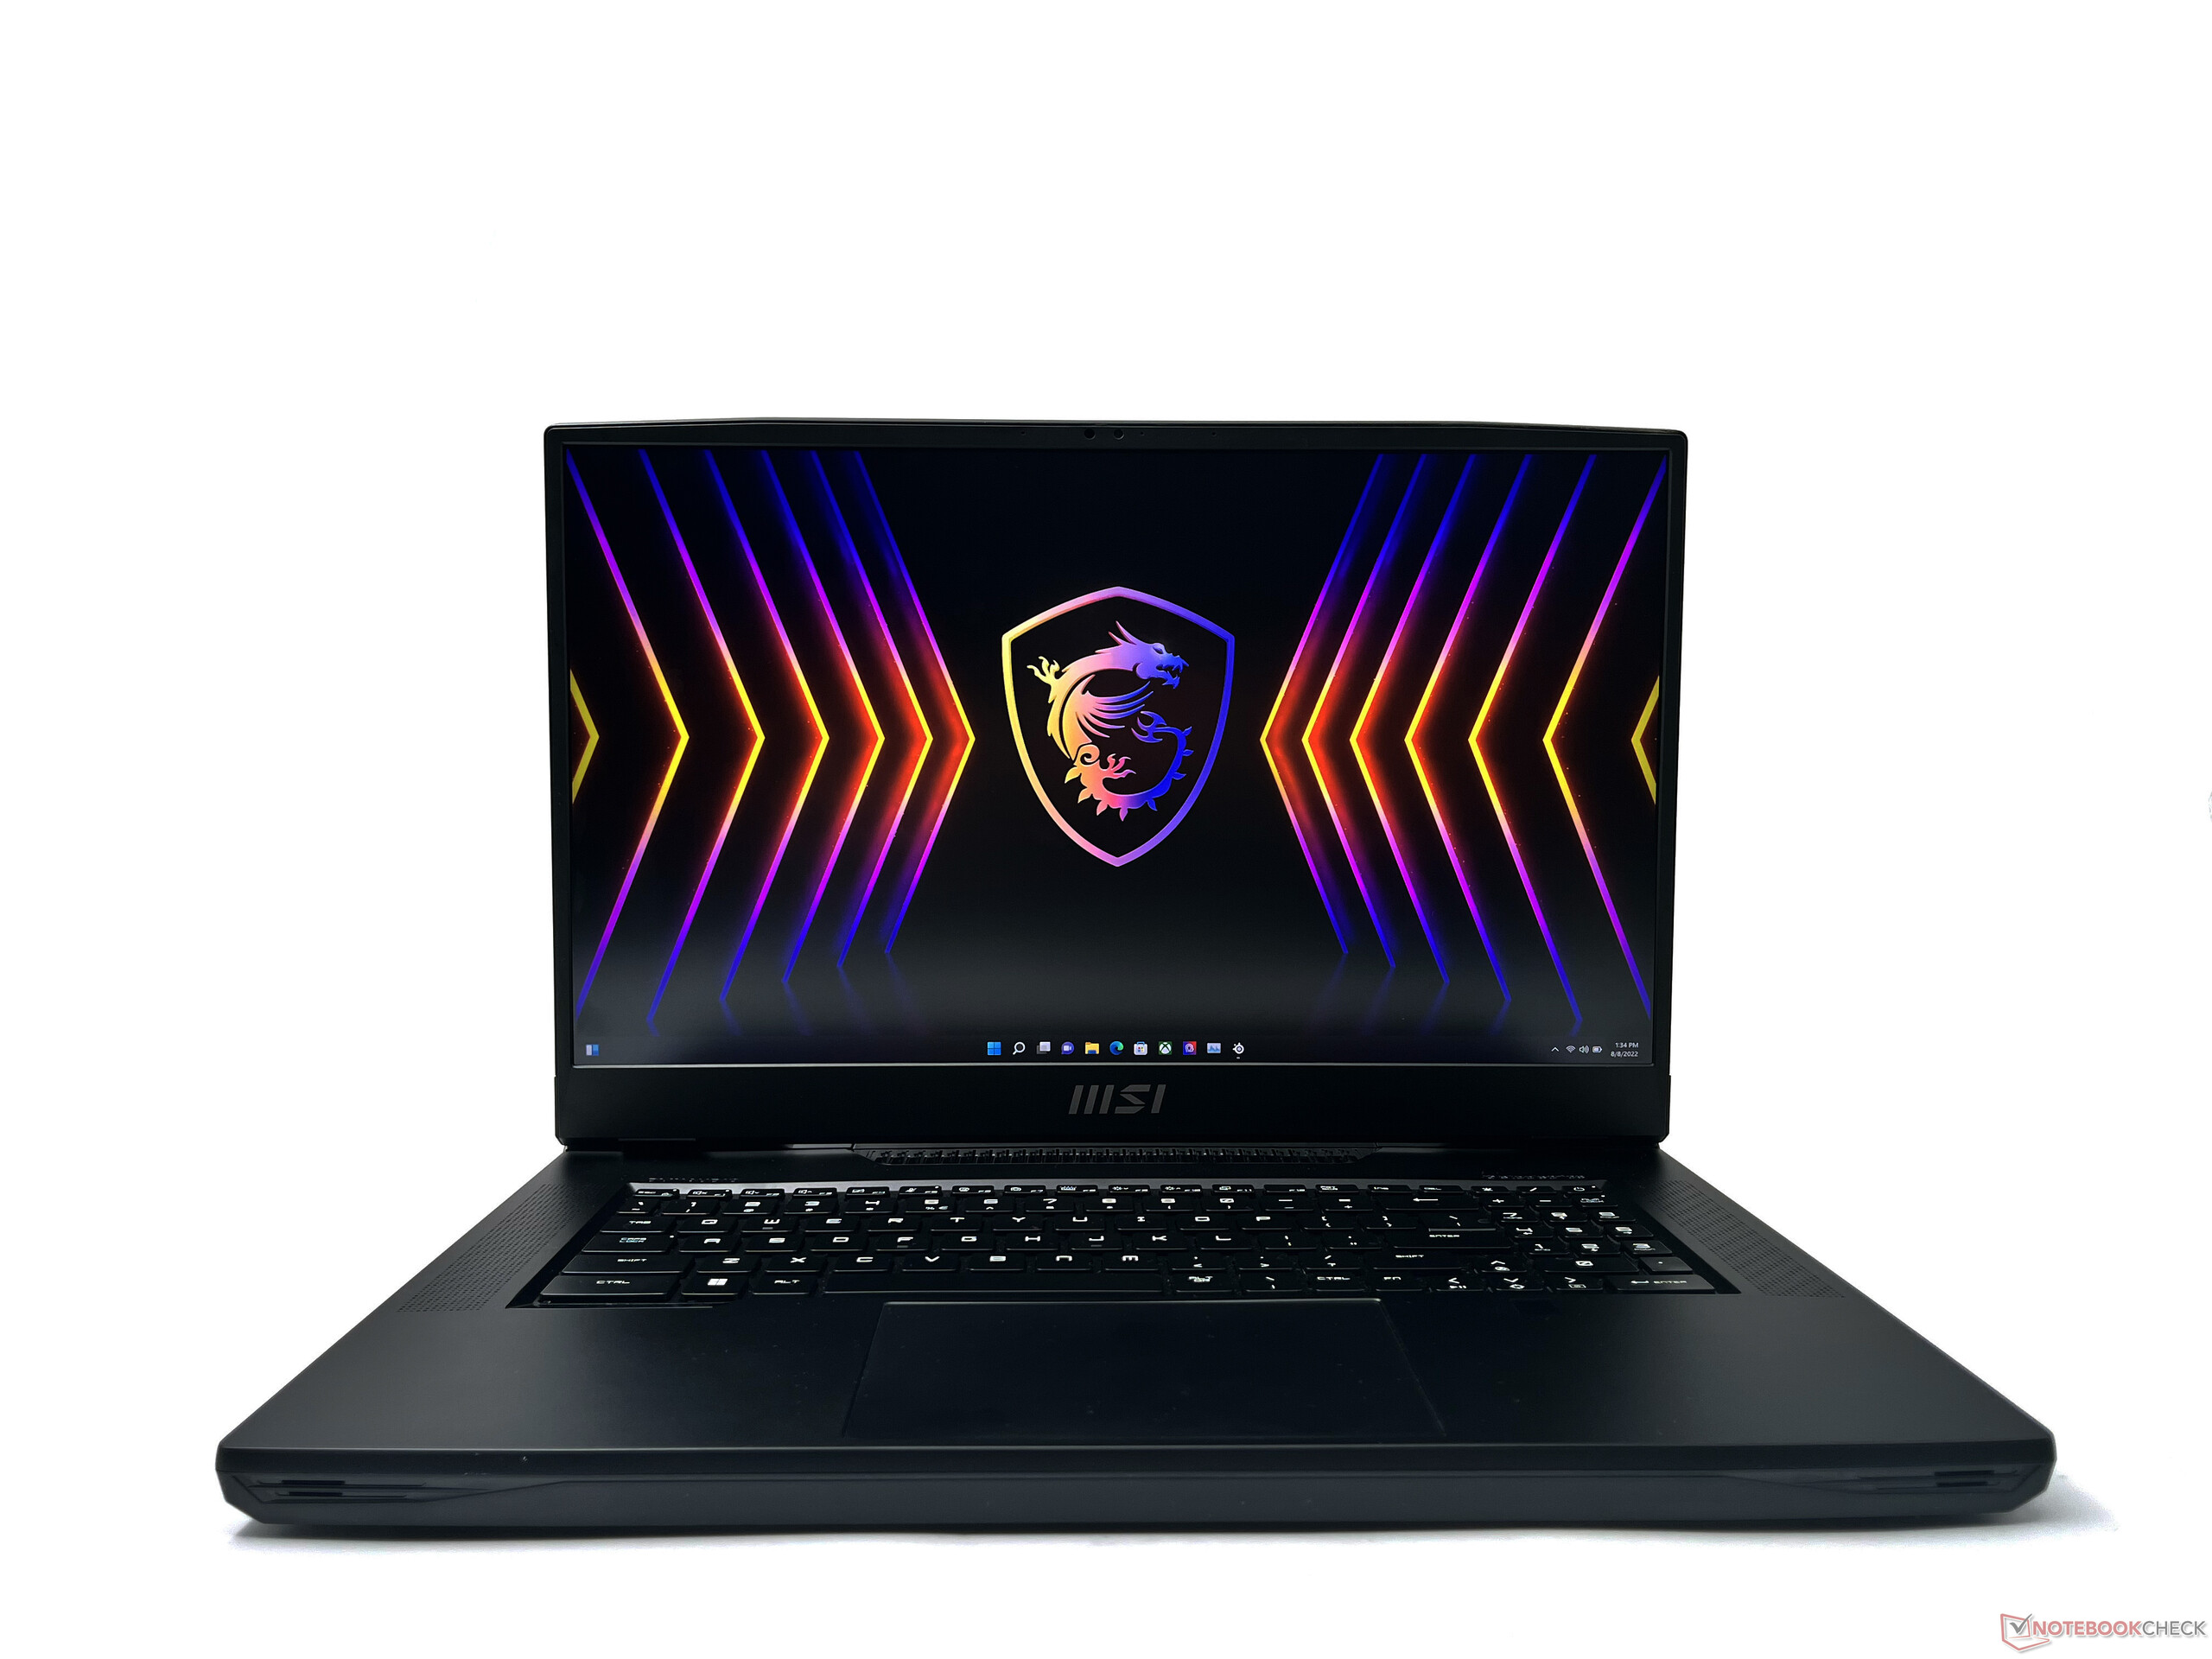
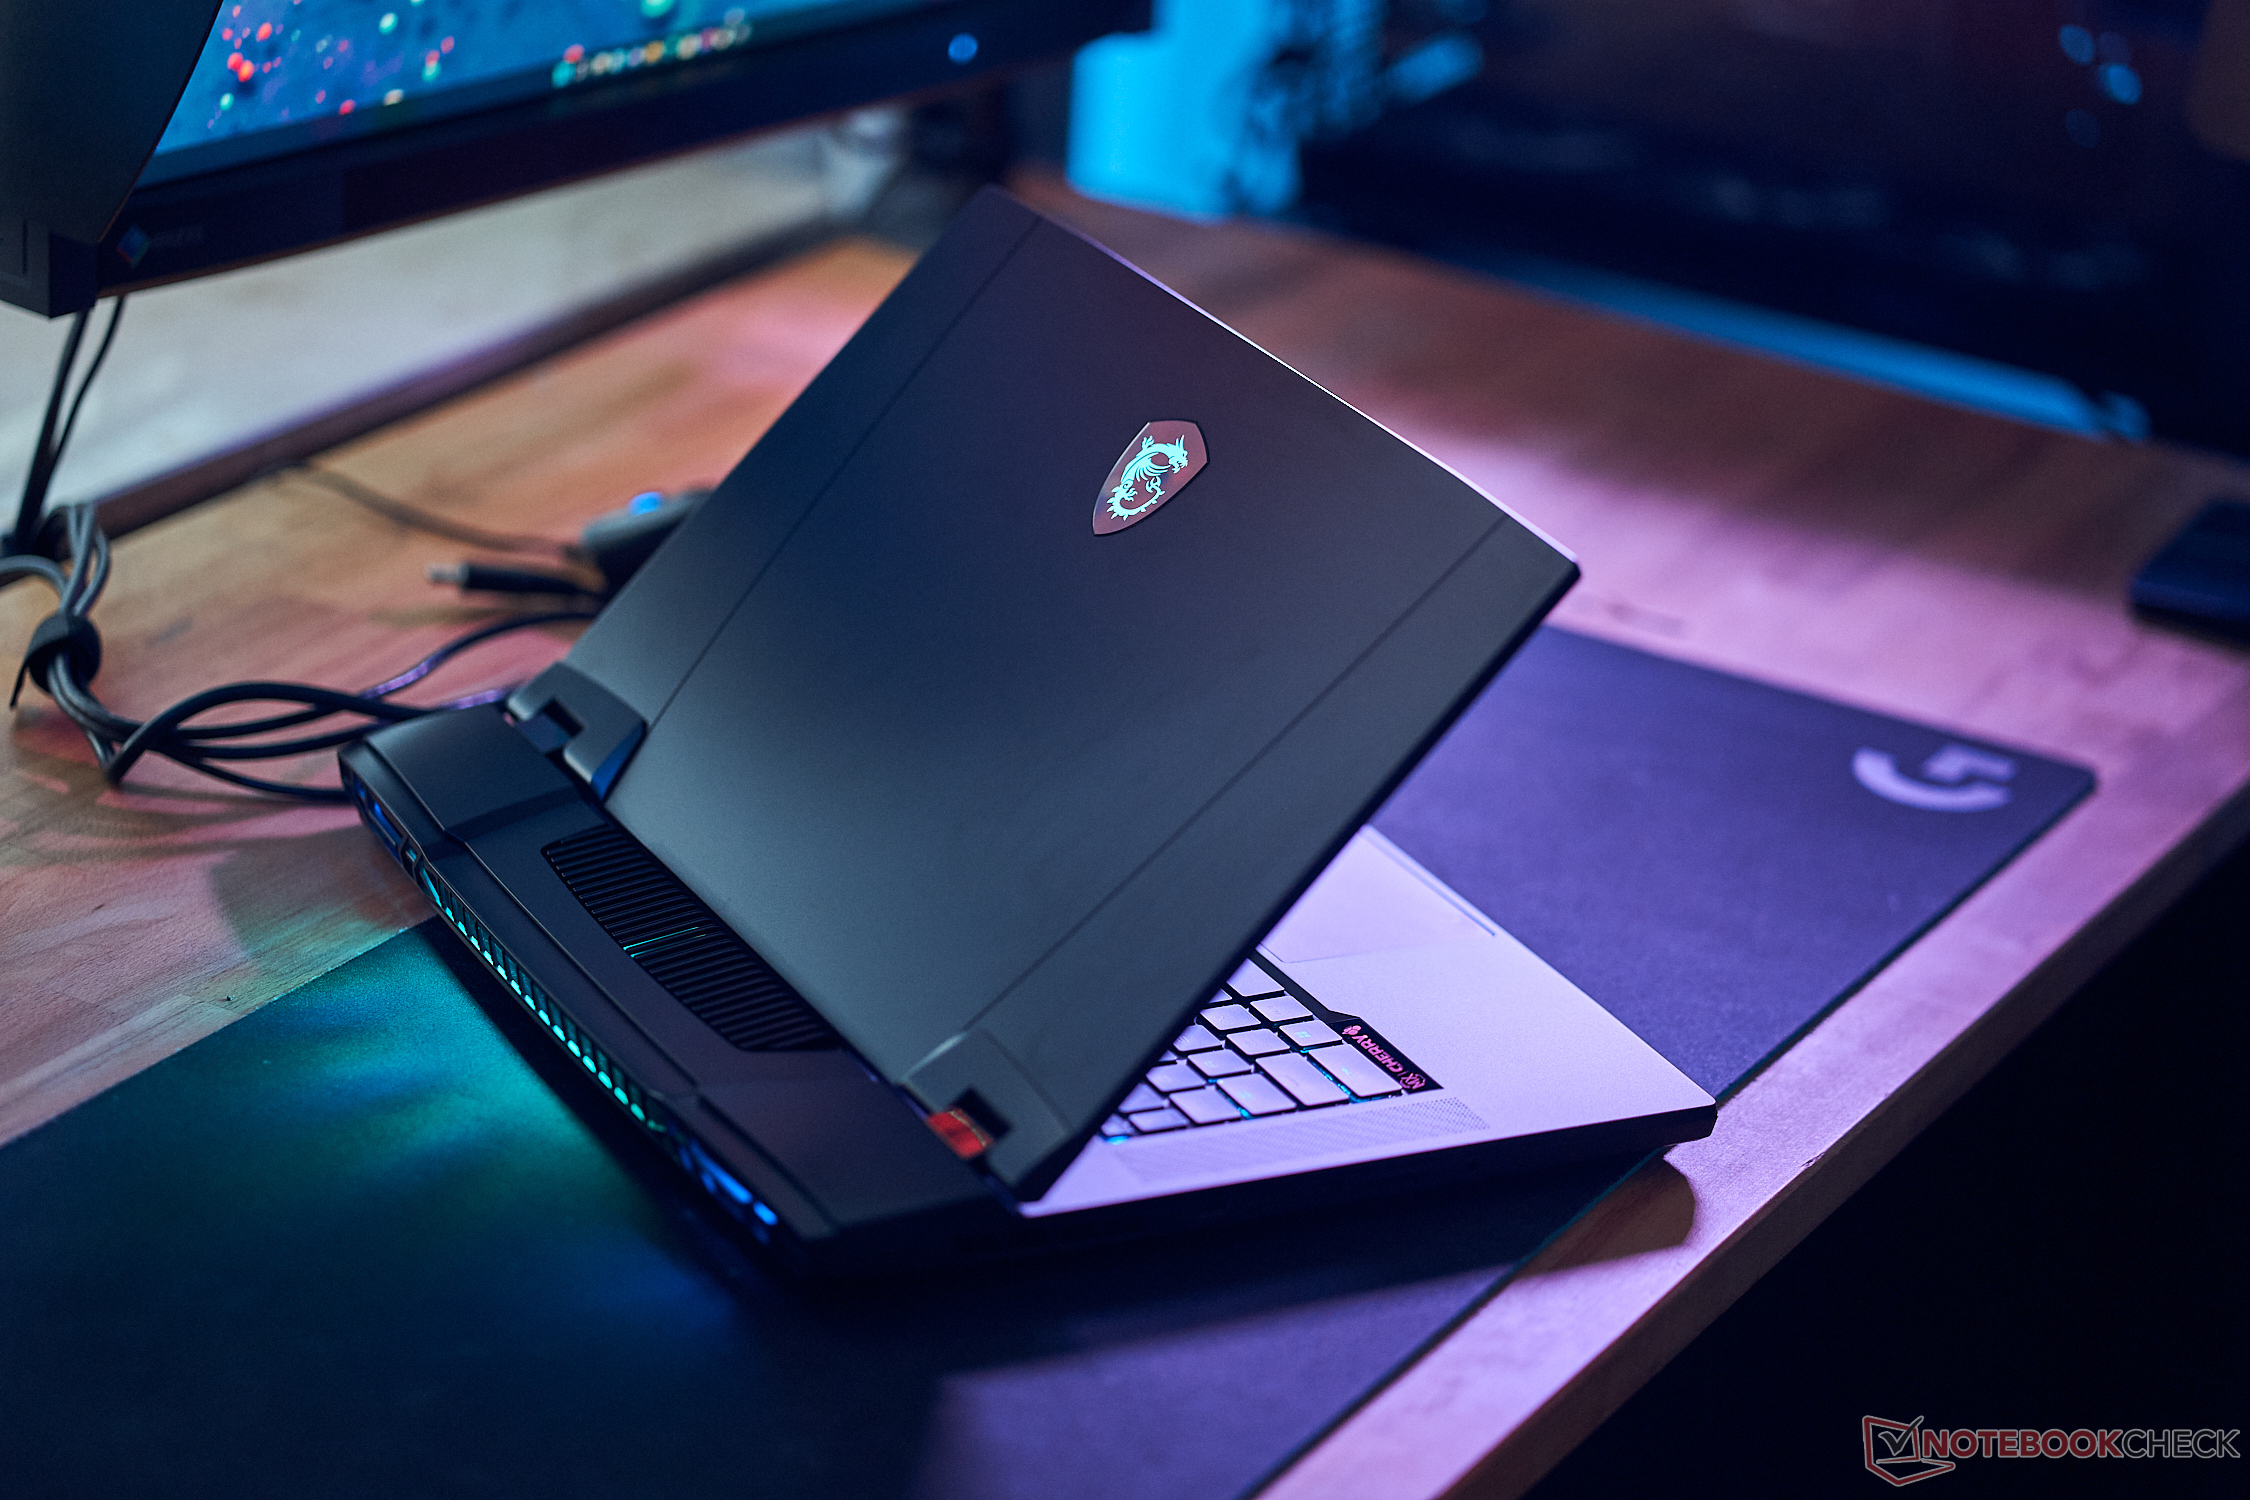
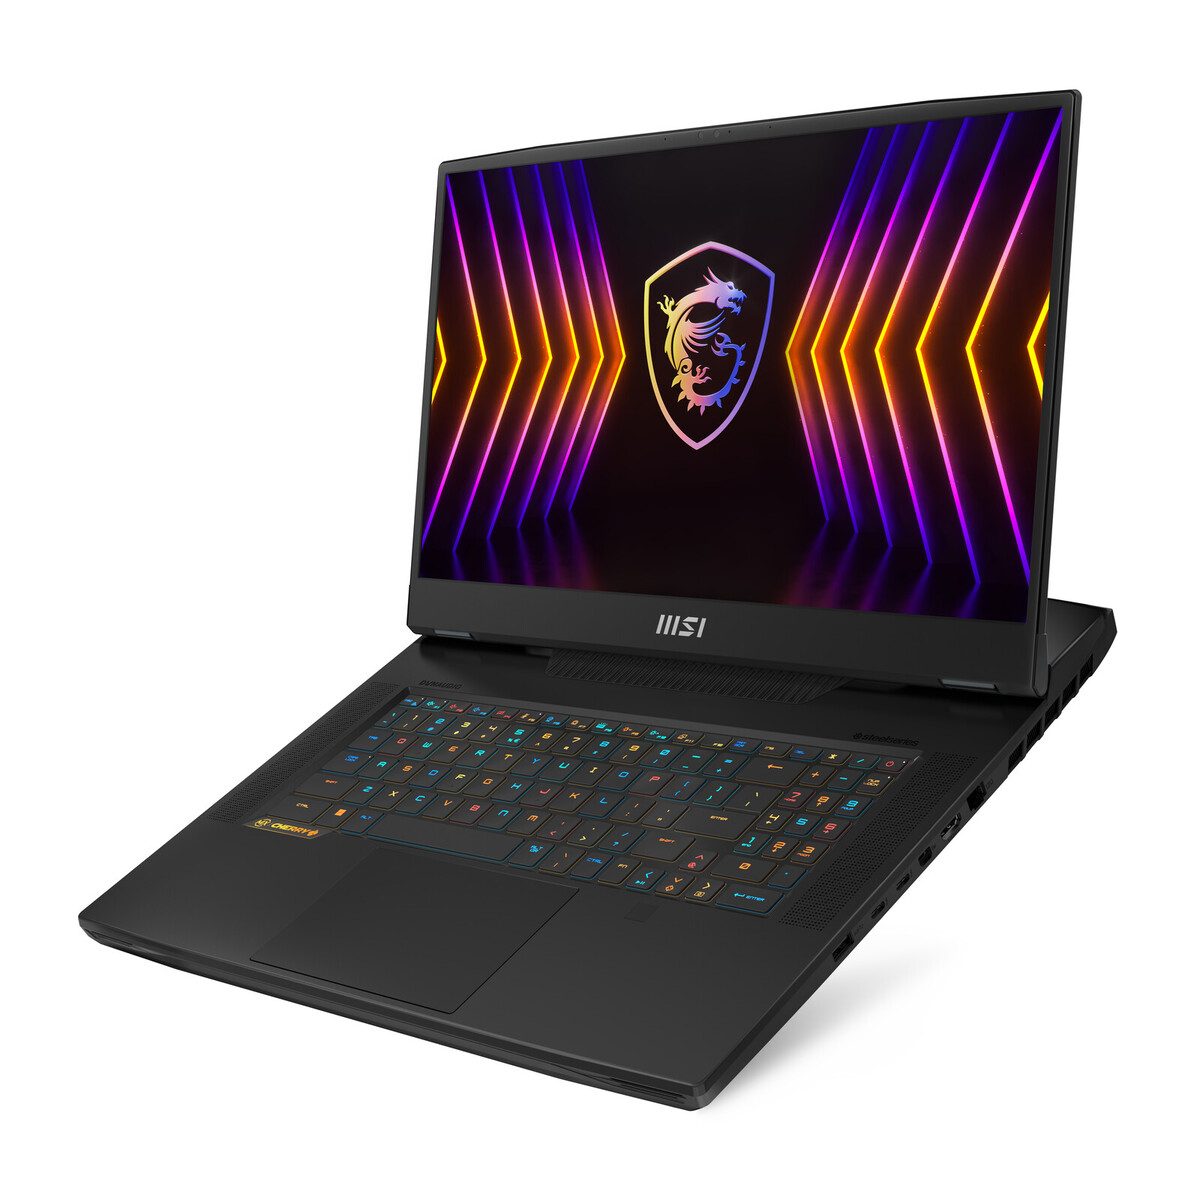
O Titan GT77 transporta elementos da antiga linguagem de projeto do Titan GT76, mas com algumas mudanças notáveis. O laptop ostenta um design totalmente preto que tem apenas 23 mm de espessura em comparação com os 42 mm de espessura do Titan GT76. A MSI empacota a maior parte do processamento e refrigeração em direção à protuberância traseira do chassi, o que dá alguma margem para que o fabricante reduza a espessura total.
O chassi é principalmente de plástico, mas se sente premium - suficiente e ajuda a manter o peso do dispositivo sob controle. A estética é bastante agradável para um entusiasta de jogos laptop sem muita excentricidade de jogador à primeira vista. Mas esteja preparado para limpar suas impressões digitais com freqüência.
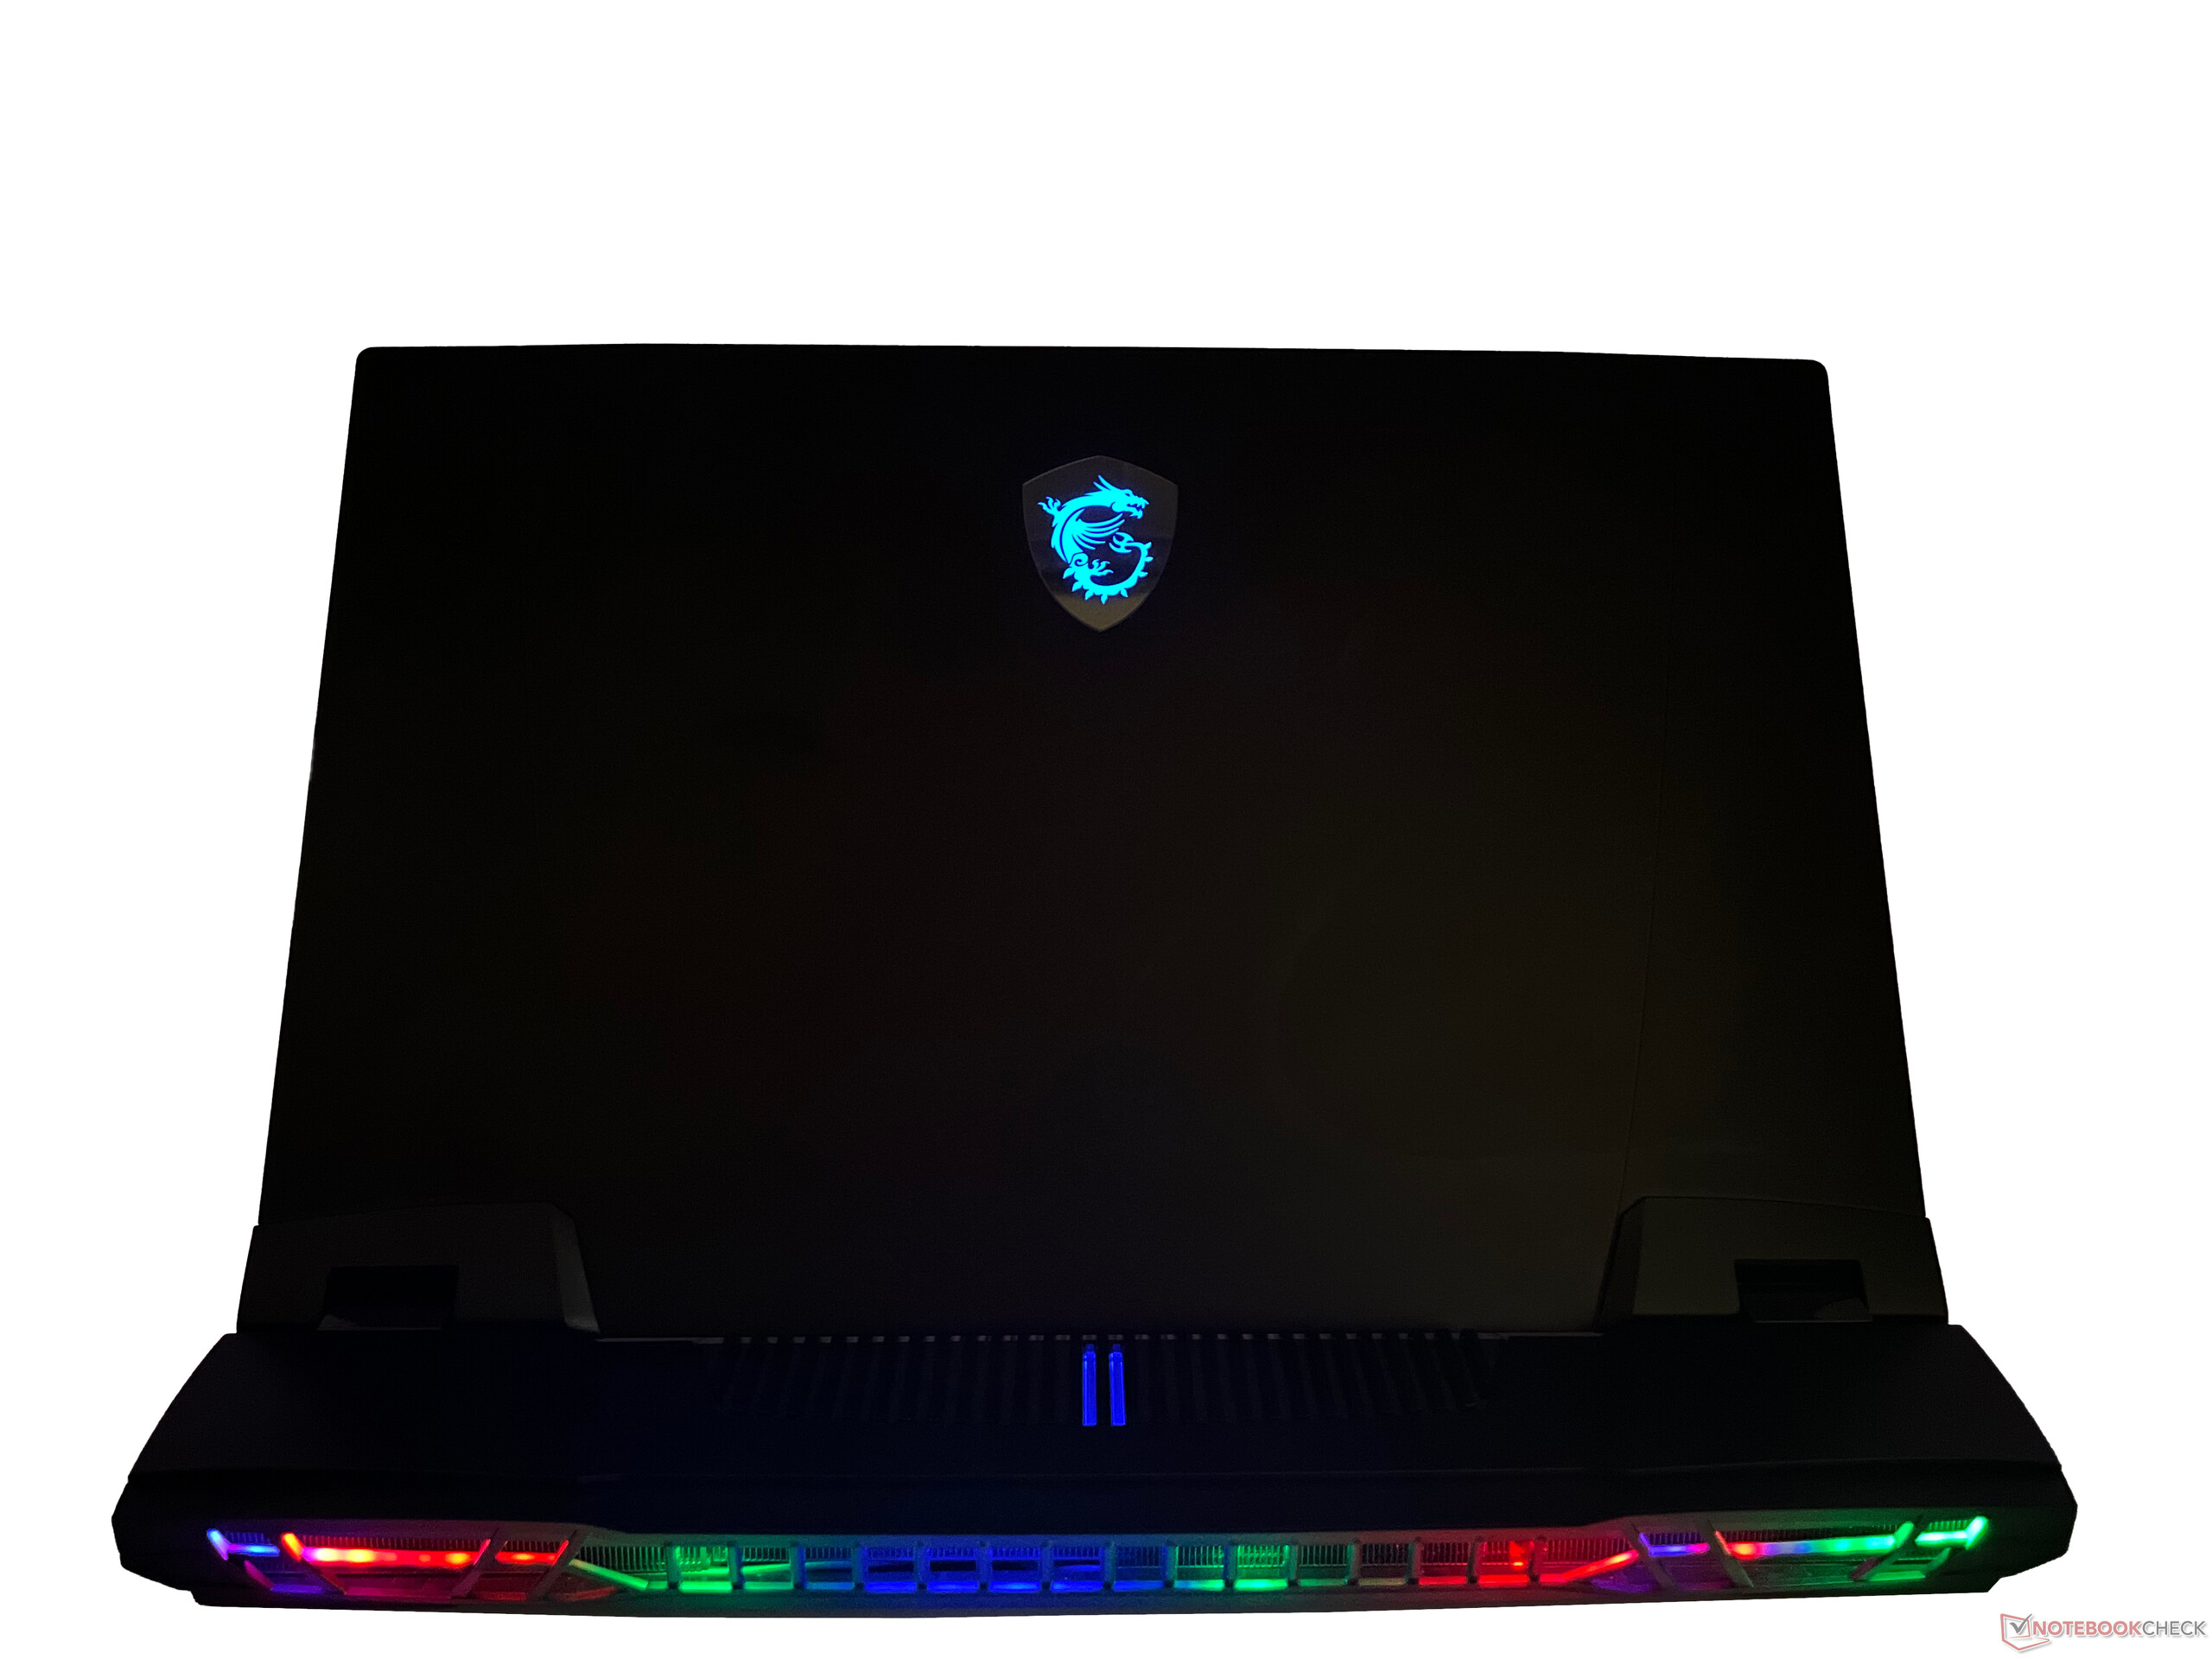
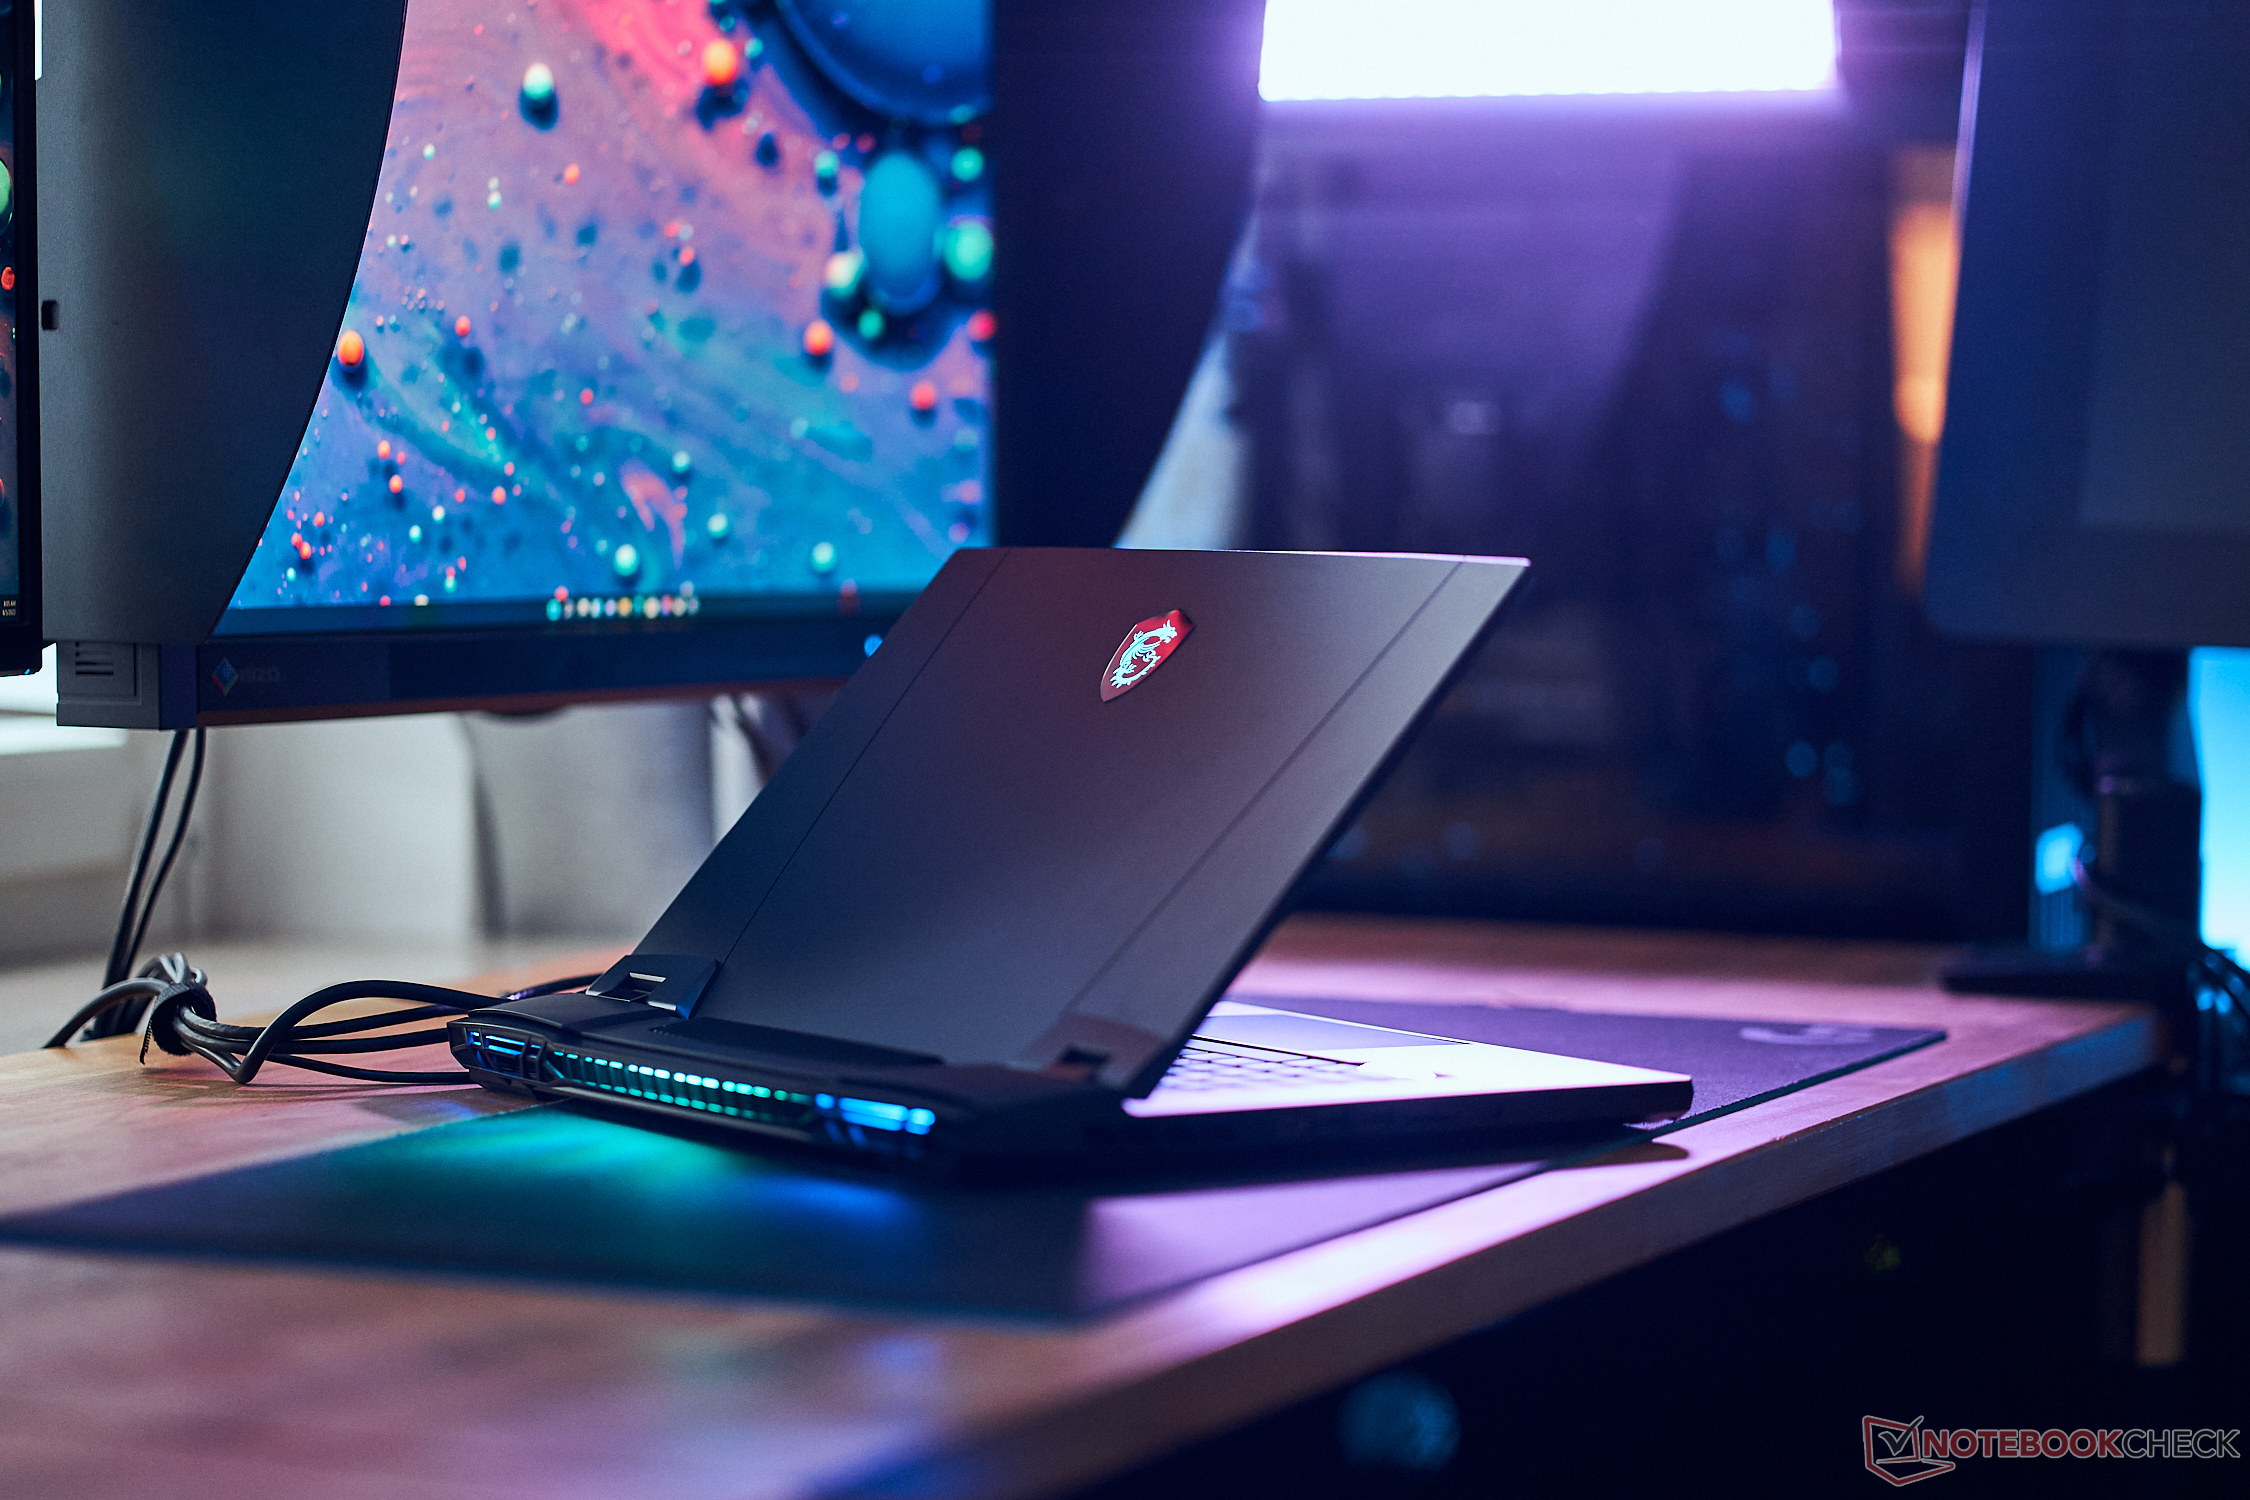
A tampa da tampa da tela recebe um acabamento em alumínio e agora tem um logotipo MSI que brilha em RGB glorioso. A tampa pode ser aberta com um dedo sem que o dispositivo deslize. Há alguma flexibilidade observada tanto com a tampa quanto com o teclado, mas não é aparente no uso regular
Ao contrário do Raider GE76, não há nenhuma barra de luz RGB na frente. Ao invés disso, a MSI instalou cerca de 27 LEDs RGB nas aberturas de exaustão traseiras. Há também uma pequena faixa RGB paralela nas aberturas de entrada traseira logo atrás do visor. Mais dois exaustores estão presentes, cada um em um dos lados do laptop.
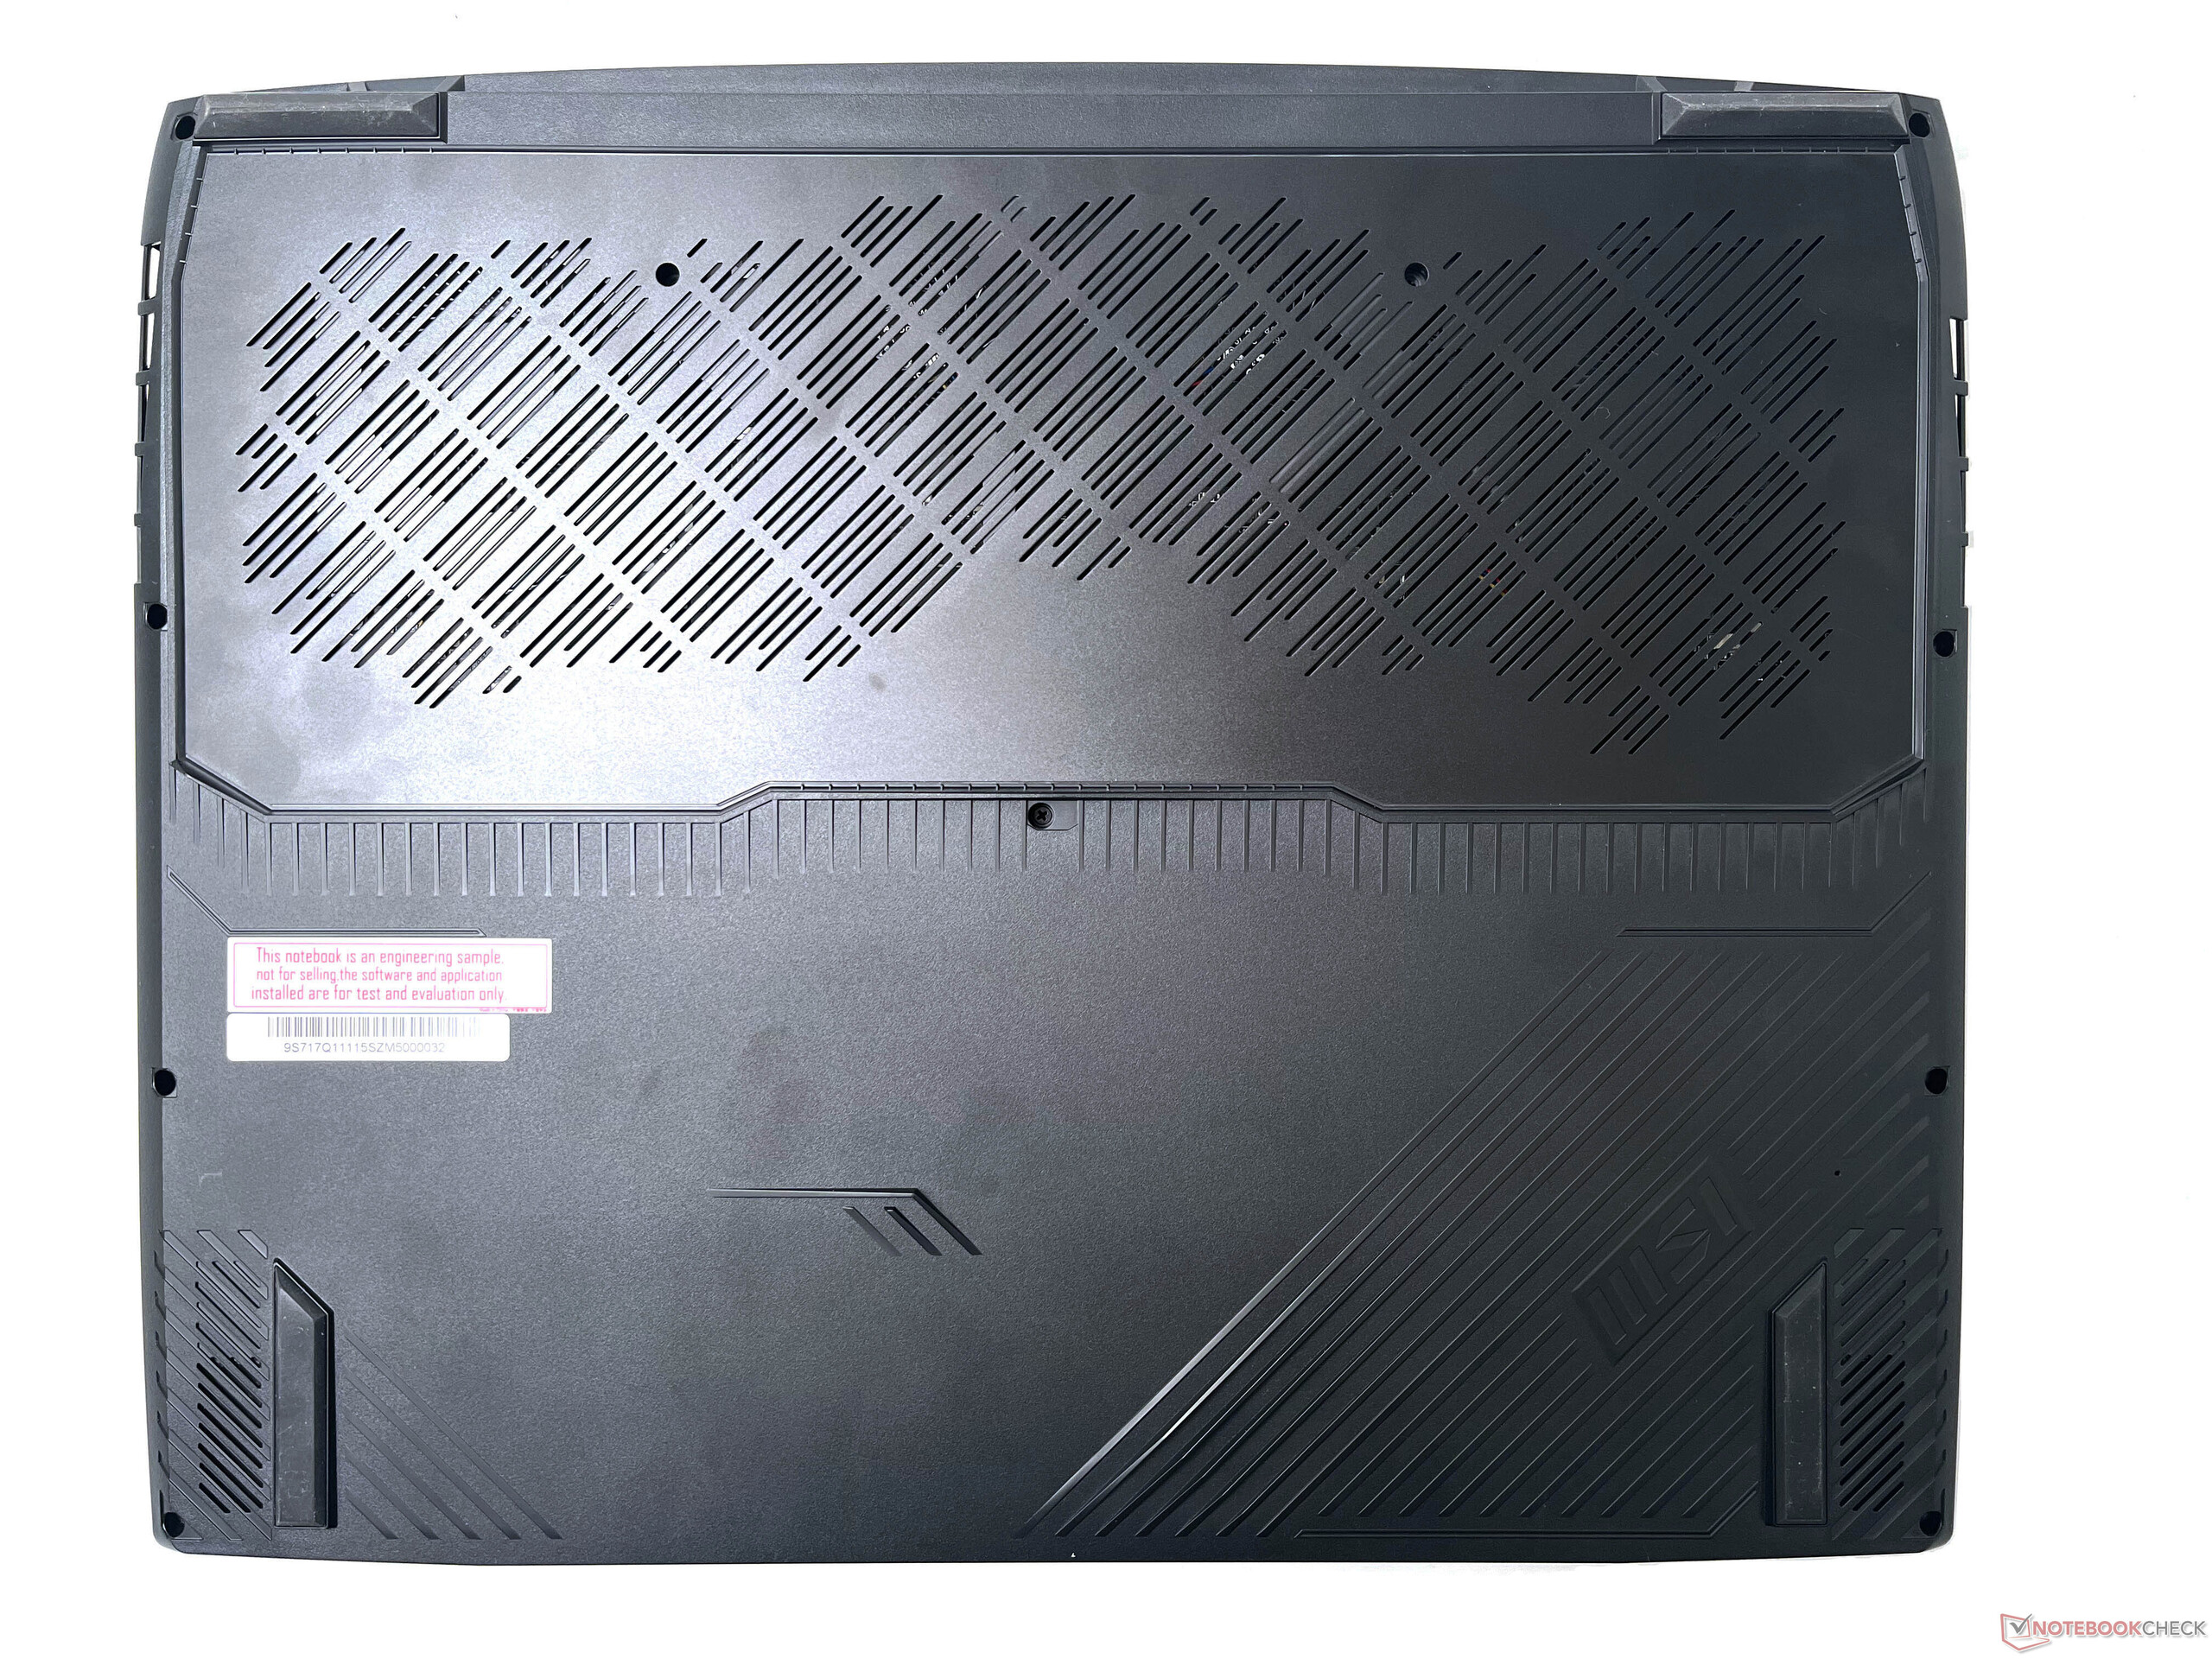
O painel inferior é provavelmente a parte mais fraca do chassi e sua construção parece ser inferior ao restante do invólucro. Isto provavelmente pode ser ignorado considerando que você não estará interagindo com a tampa inferior com a mesma freqüência. No entanto, ela oferece um bom número de aberturas de entrada de ar.
Em geral, o MSI Titan GT77 tem uma construção sólida com melhorias de portabilidade bem-vindas em comparação com os Titãs anteriores.
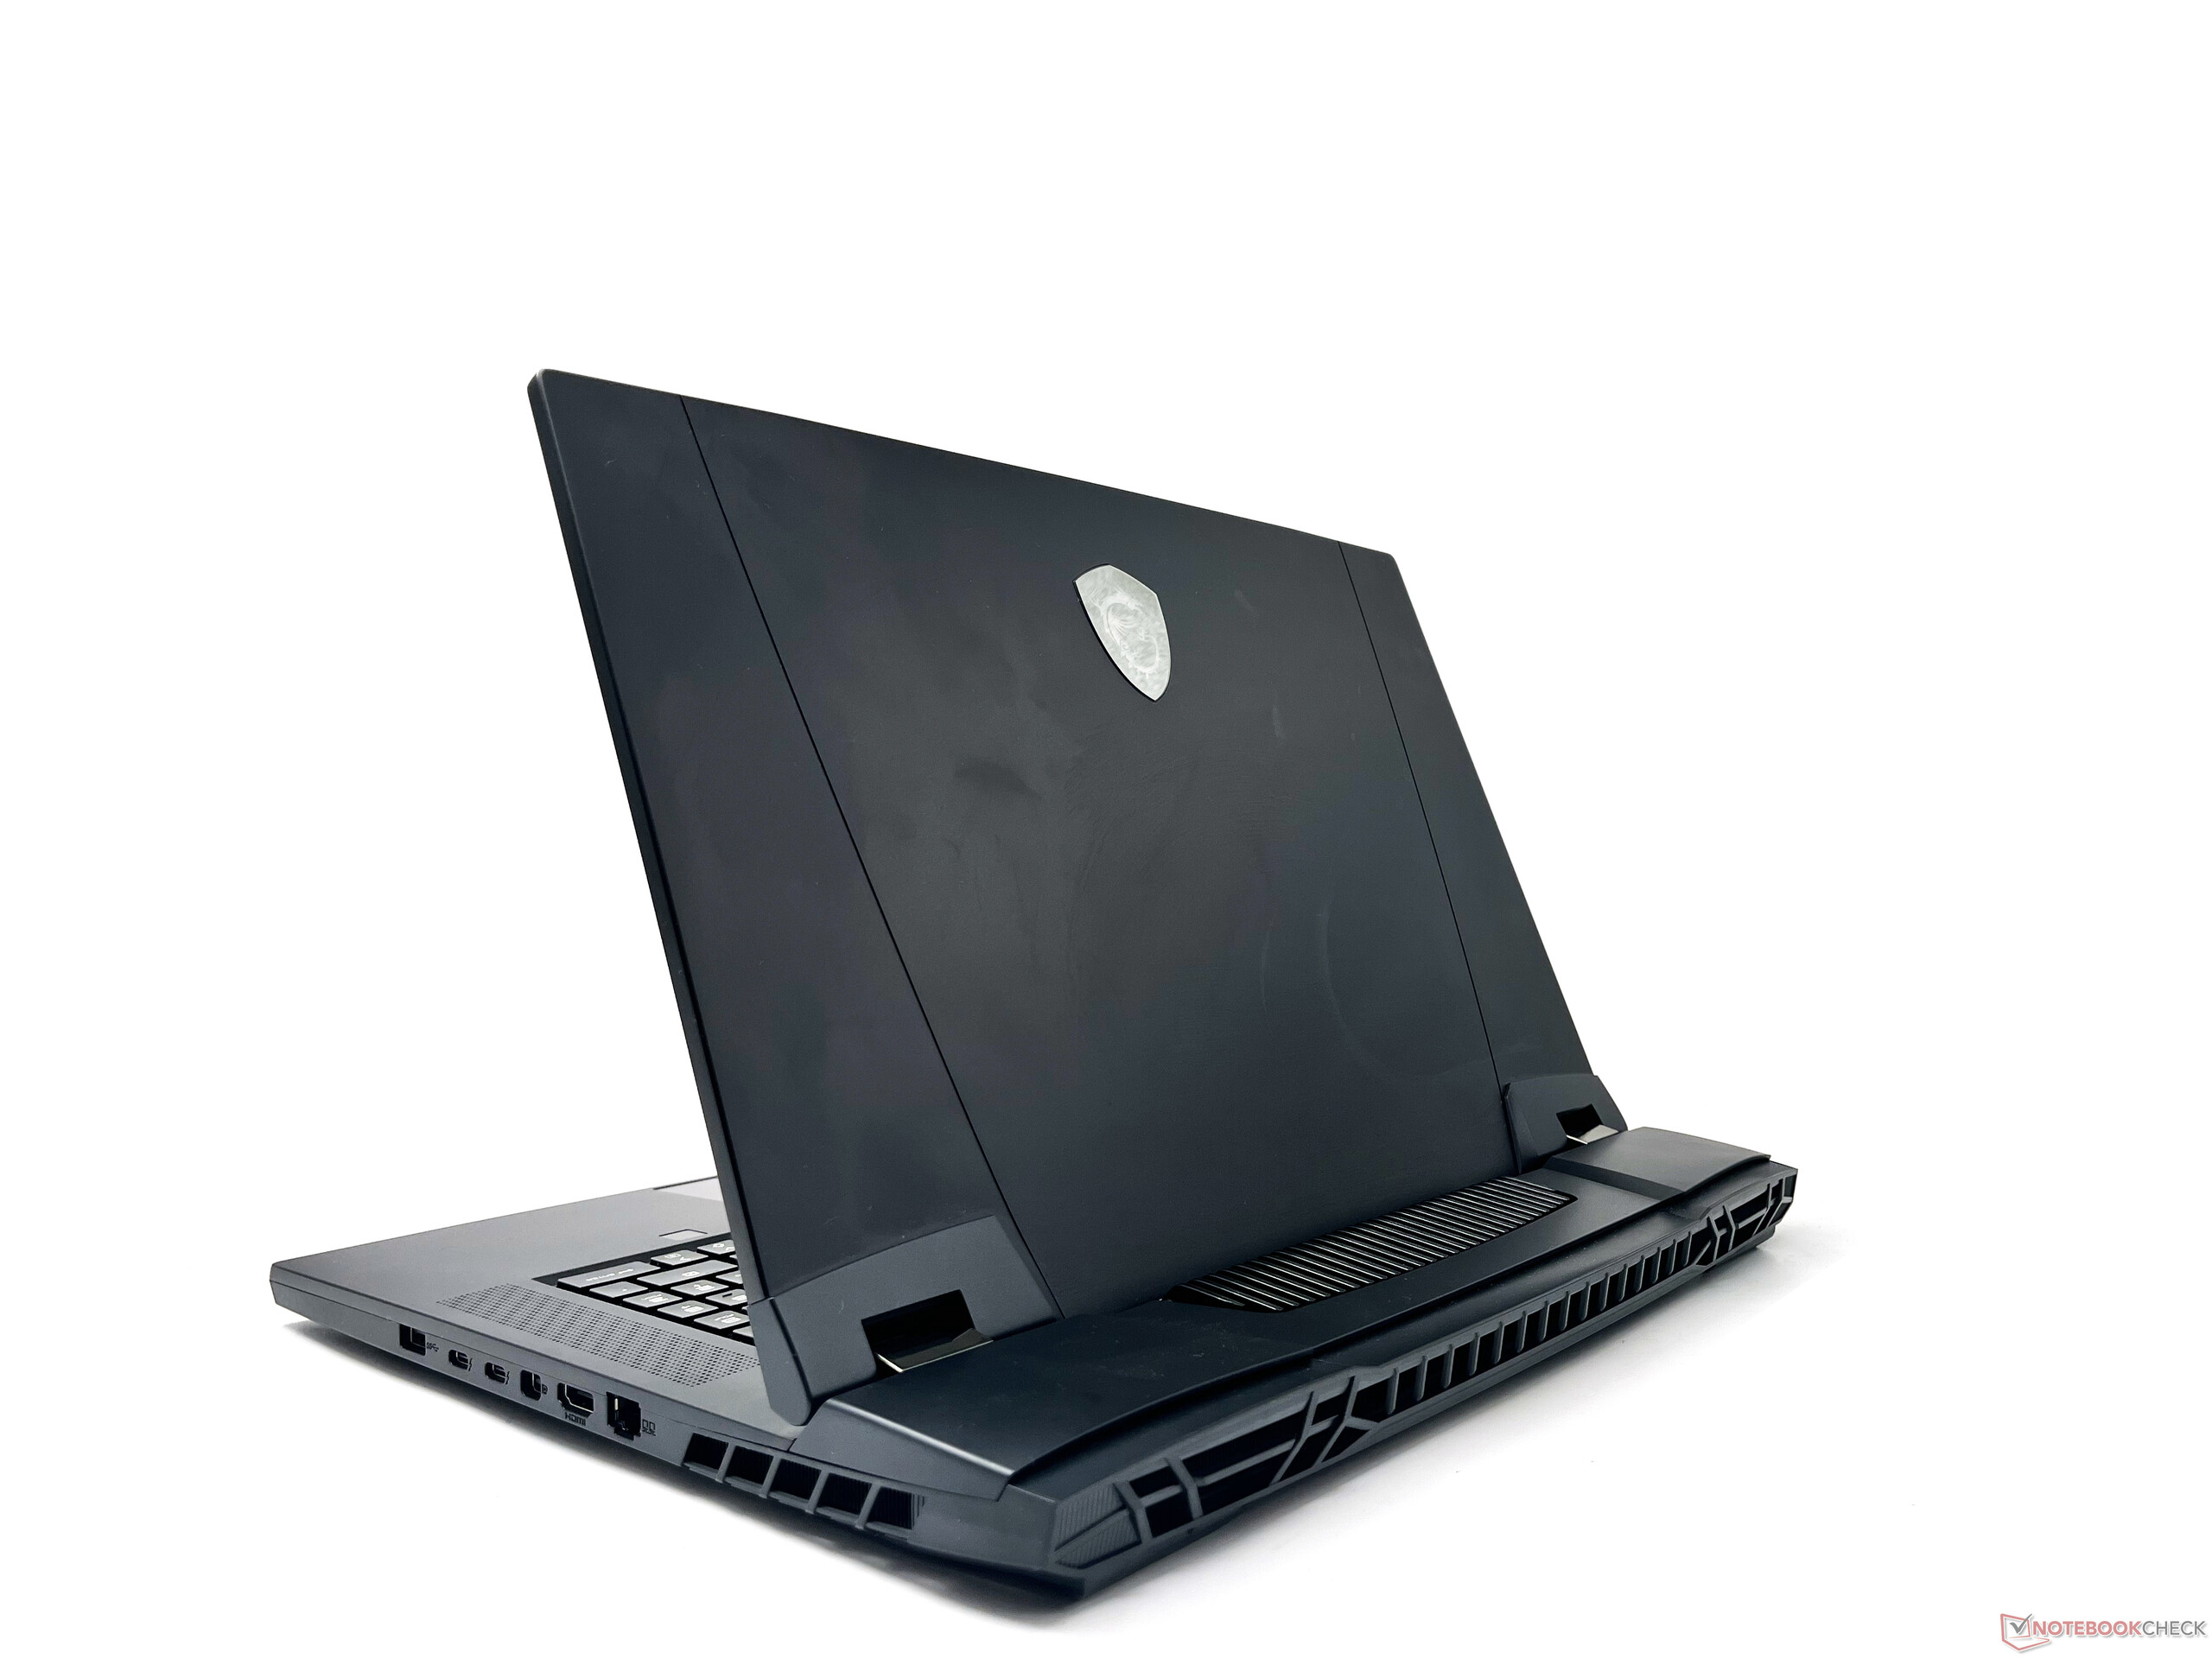
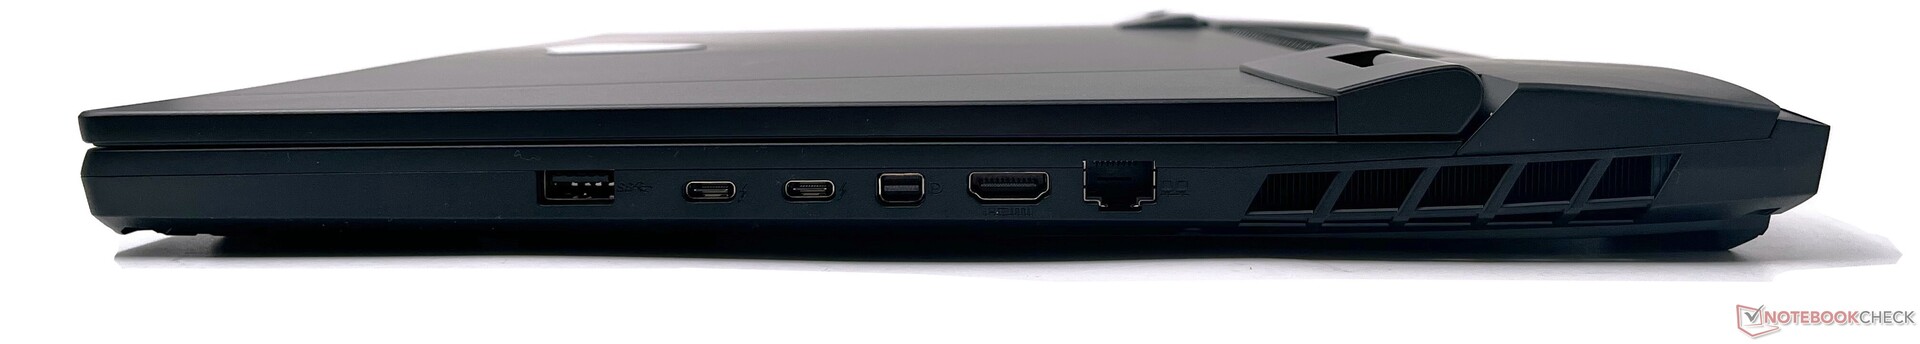
Conectividade: Seleção adequada de portas com leitor de cartões SD de tamanho completo e Wi-Fi 6E
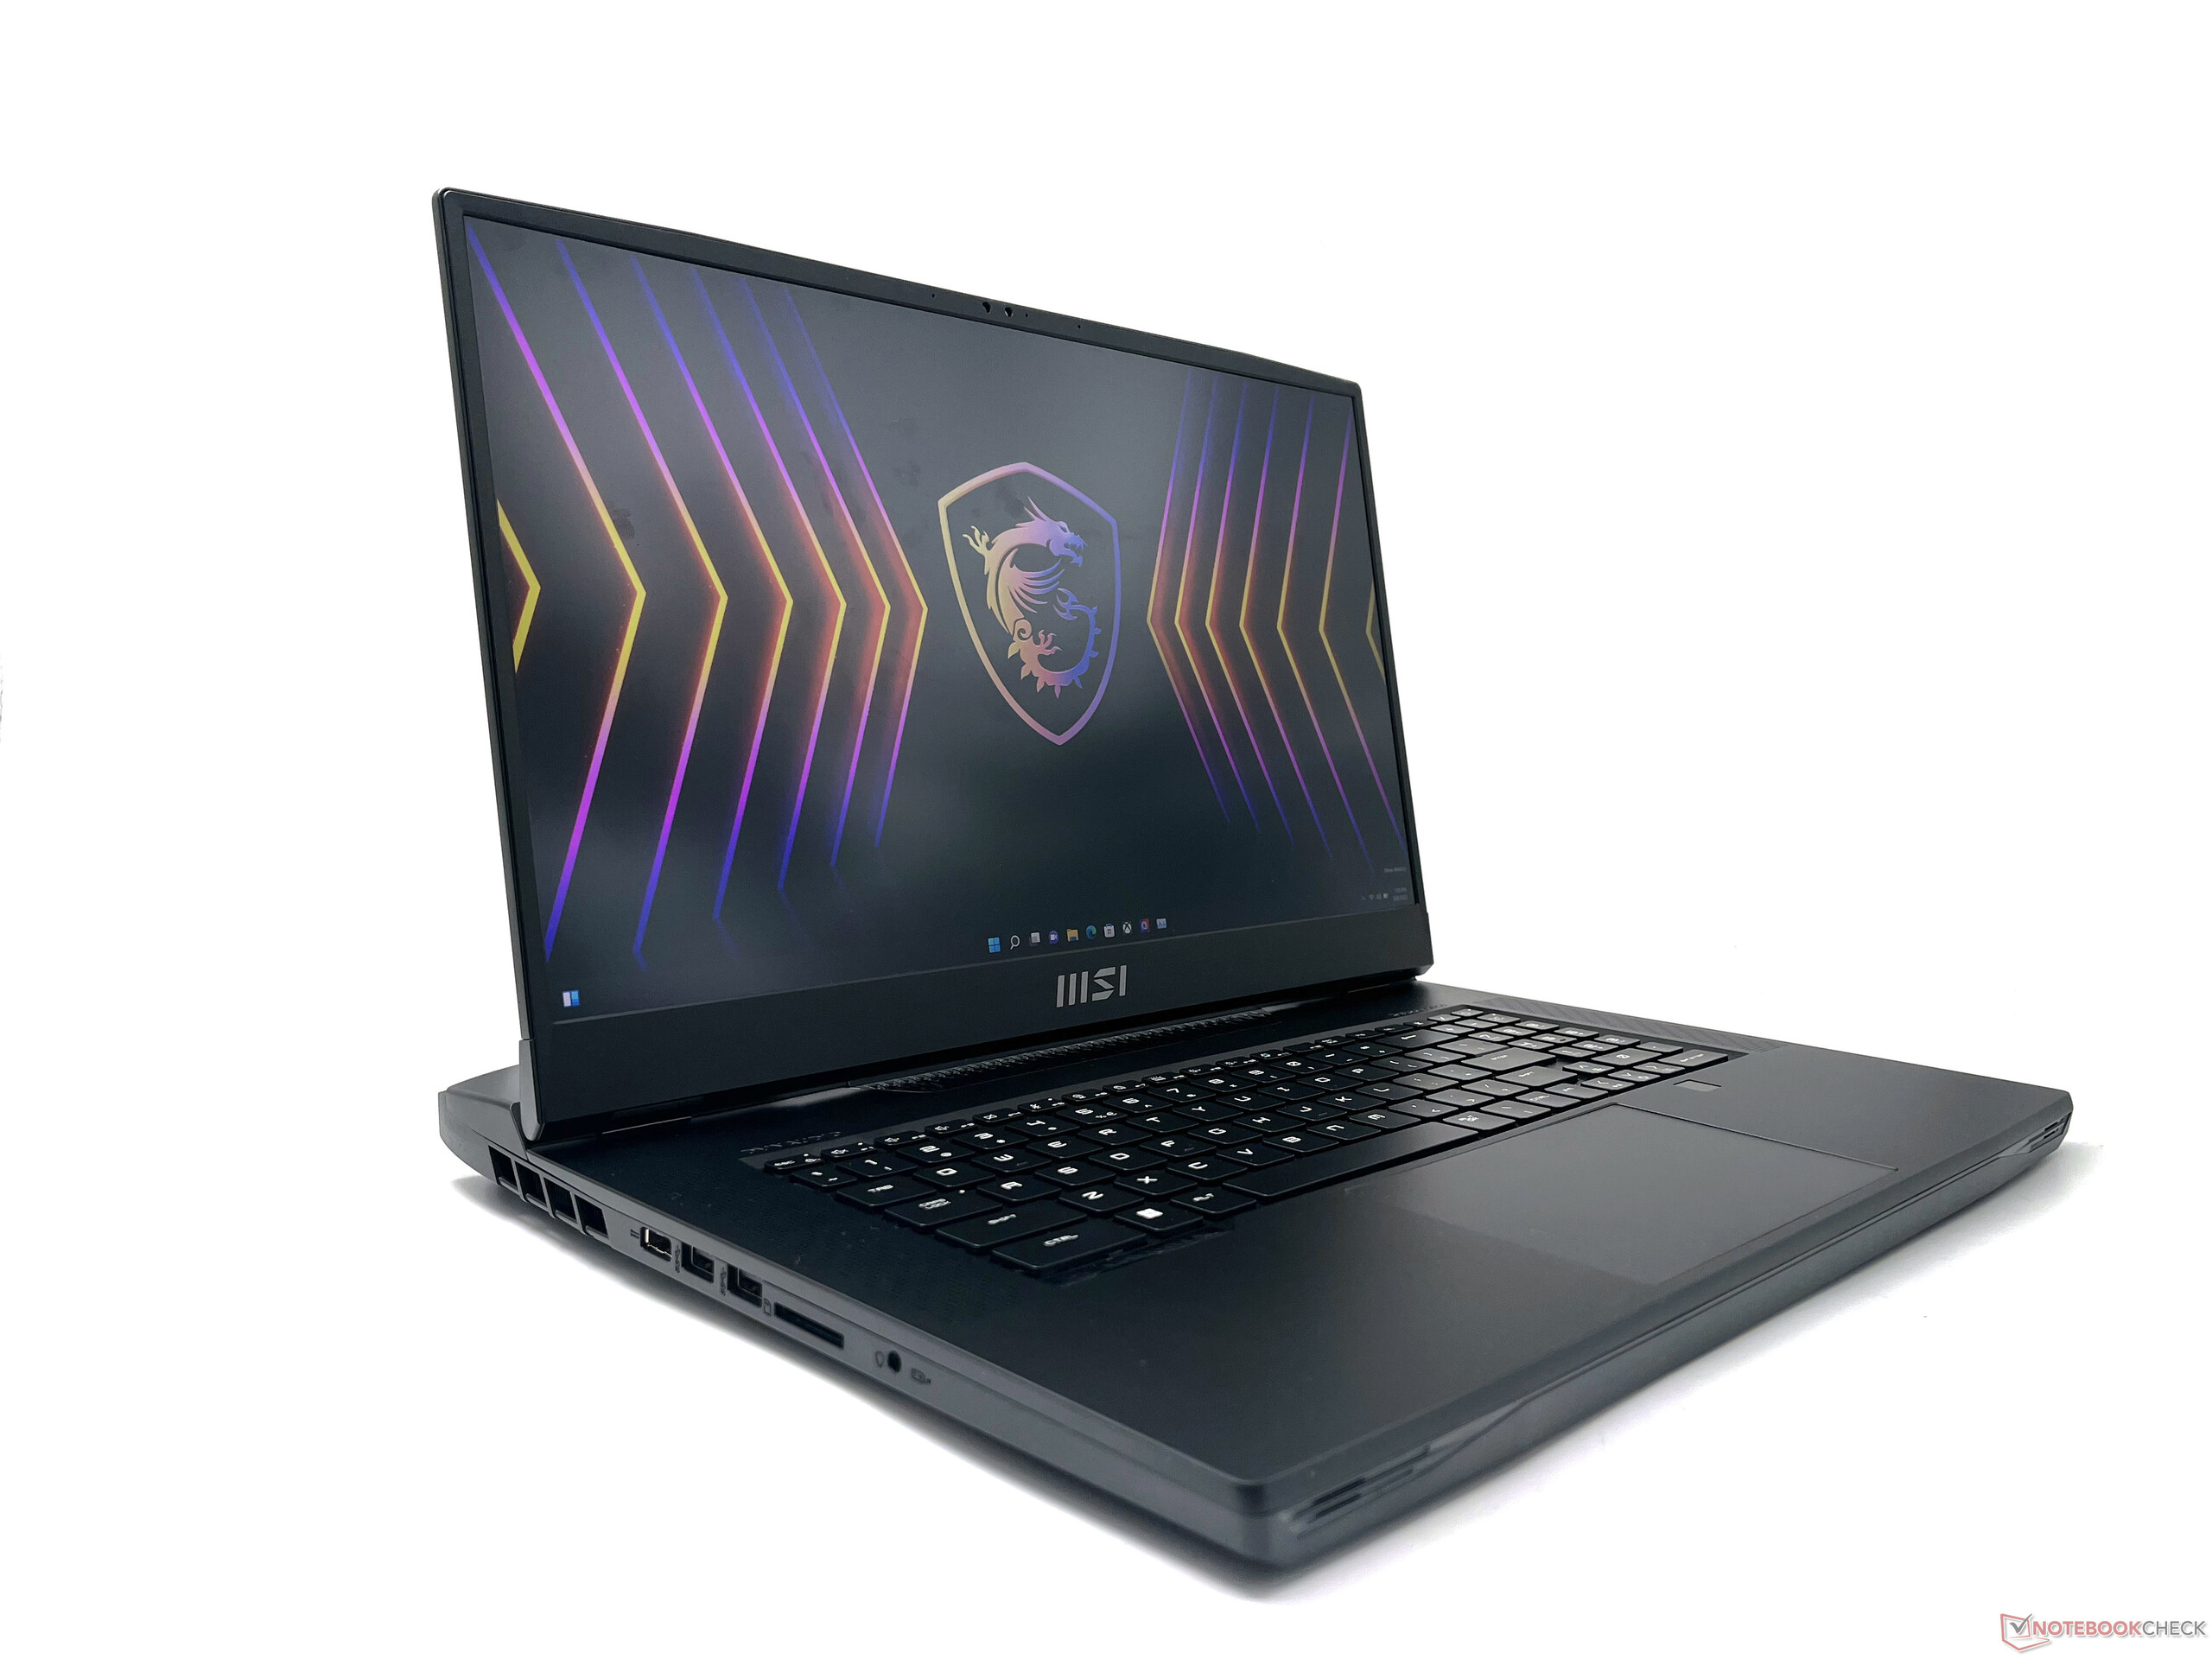
O Titan GT77 oferece uma seleção de portos ligeiramente diferente, mas adequada, em comparação com o Titan GT76. Além disso, ele implementa os mais recentes padrões de conectividade que você esperaria encontrar em um computador portátil para jogos entusiasmado em 2022.
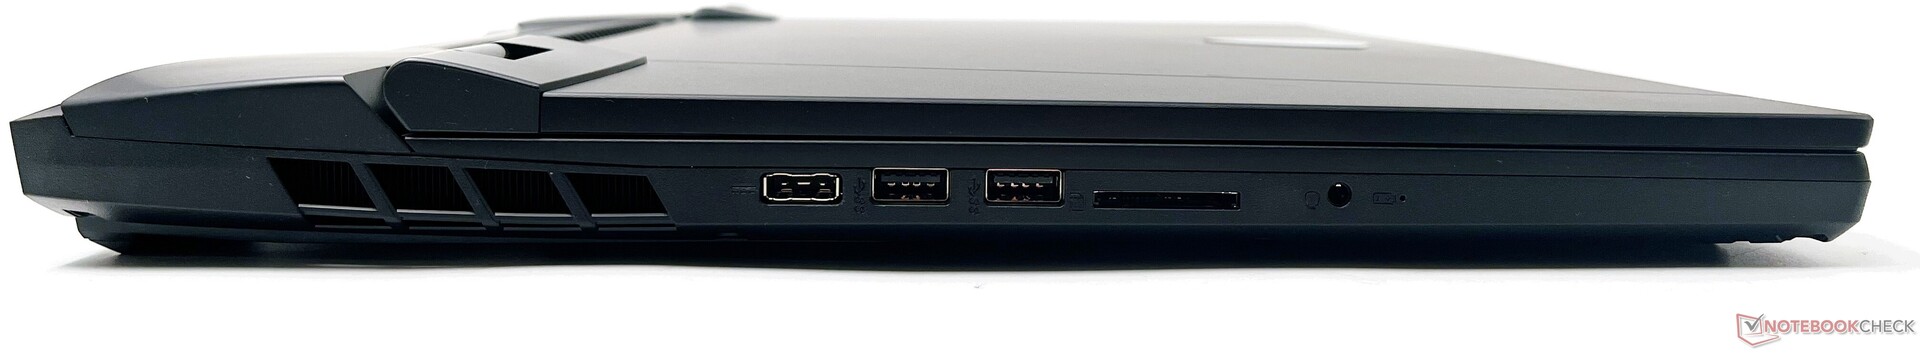
À esquerda, temos a porta DC-in proprietária da MSI, 2 portas USB 3.2 Gen2 Tipo A, um leitor de cartão UHS-III SD Express de tamanho completo, e uma tomada de áudio combinada. Desta vez, não há porta separada para microfones. À direita, temos outra porta USB 3.2 Gen2 Tipo A, 2x portas Thunderbolt 4, um mini-DisplayPort-out, saída HDMI que suporta até 4K 120 Hz ou 8K 60 Hz, e uma porta 2.5 GbE RJ-45.
As portas são convenientemente colocadas e não impedem a conectividade periférica. Não há nenhum slot de trava Kensington disponível.
Leitor de cartões SD
O Titan GT77 finalmente oferece um slot de cartão SD em tamanho real, o que é um desenvolvimento bem-vindo. O leitor de cartões é visivelmente mais rápido do que o da Raider GE77 HX 12UHS mas segue atrás dos outros na competição.
| SD Card Reader | |
| average JPG Copy Test (av. of 3 runs) | |
| Alienware x17 R2 P48E (AV Pro V60) | |
| Asus ROG Zephyrus Duo 16 GX650RX (AV PRO microSD 128 GB V60) | |
| Média da turma Gaming (20.9 - 210, n=54, últimos 2 anos) | |
| MSI GE67 HX 12UGS (Toshiba Exceria Pro SDXC 64 GB UHS-II) | |
| MSI GE76 Raider (AV PRO microSD 128 GB V60) | |
| MSI Titan GT77 12UHS (AV PRO microSD 128 GB V60) | |
| MSI Raider GE77 HX 12UHS (AV PRO microSD 128 GB V60) | |
| maximum AS SSD Seq Read Test (1GB) | |
| Alienware x17 R2 P48E (AV Pro V60) | |
| Asus ROG Zephyrus Duo 16 GX650RX (AV PRO microSD 128 GB V60) | |
| Média da turma Gaming (25.5 - 261, n=51, últimos 2 anos) | |
| MSI Titan GT77 12UHS (AV PRO microSD 128 GB V60) | |
| MSI GE67 HX 12UGS (Toshiba Exceria Pro SDXC 64 GB UHS-II) | |
Comunicação
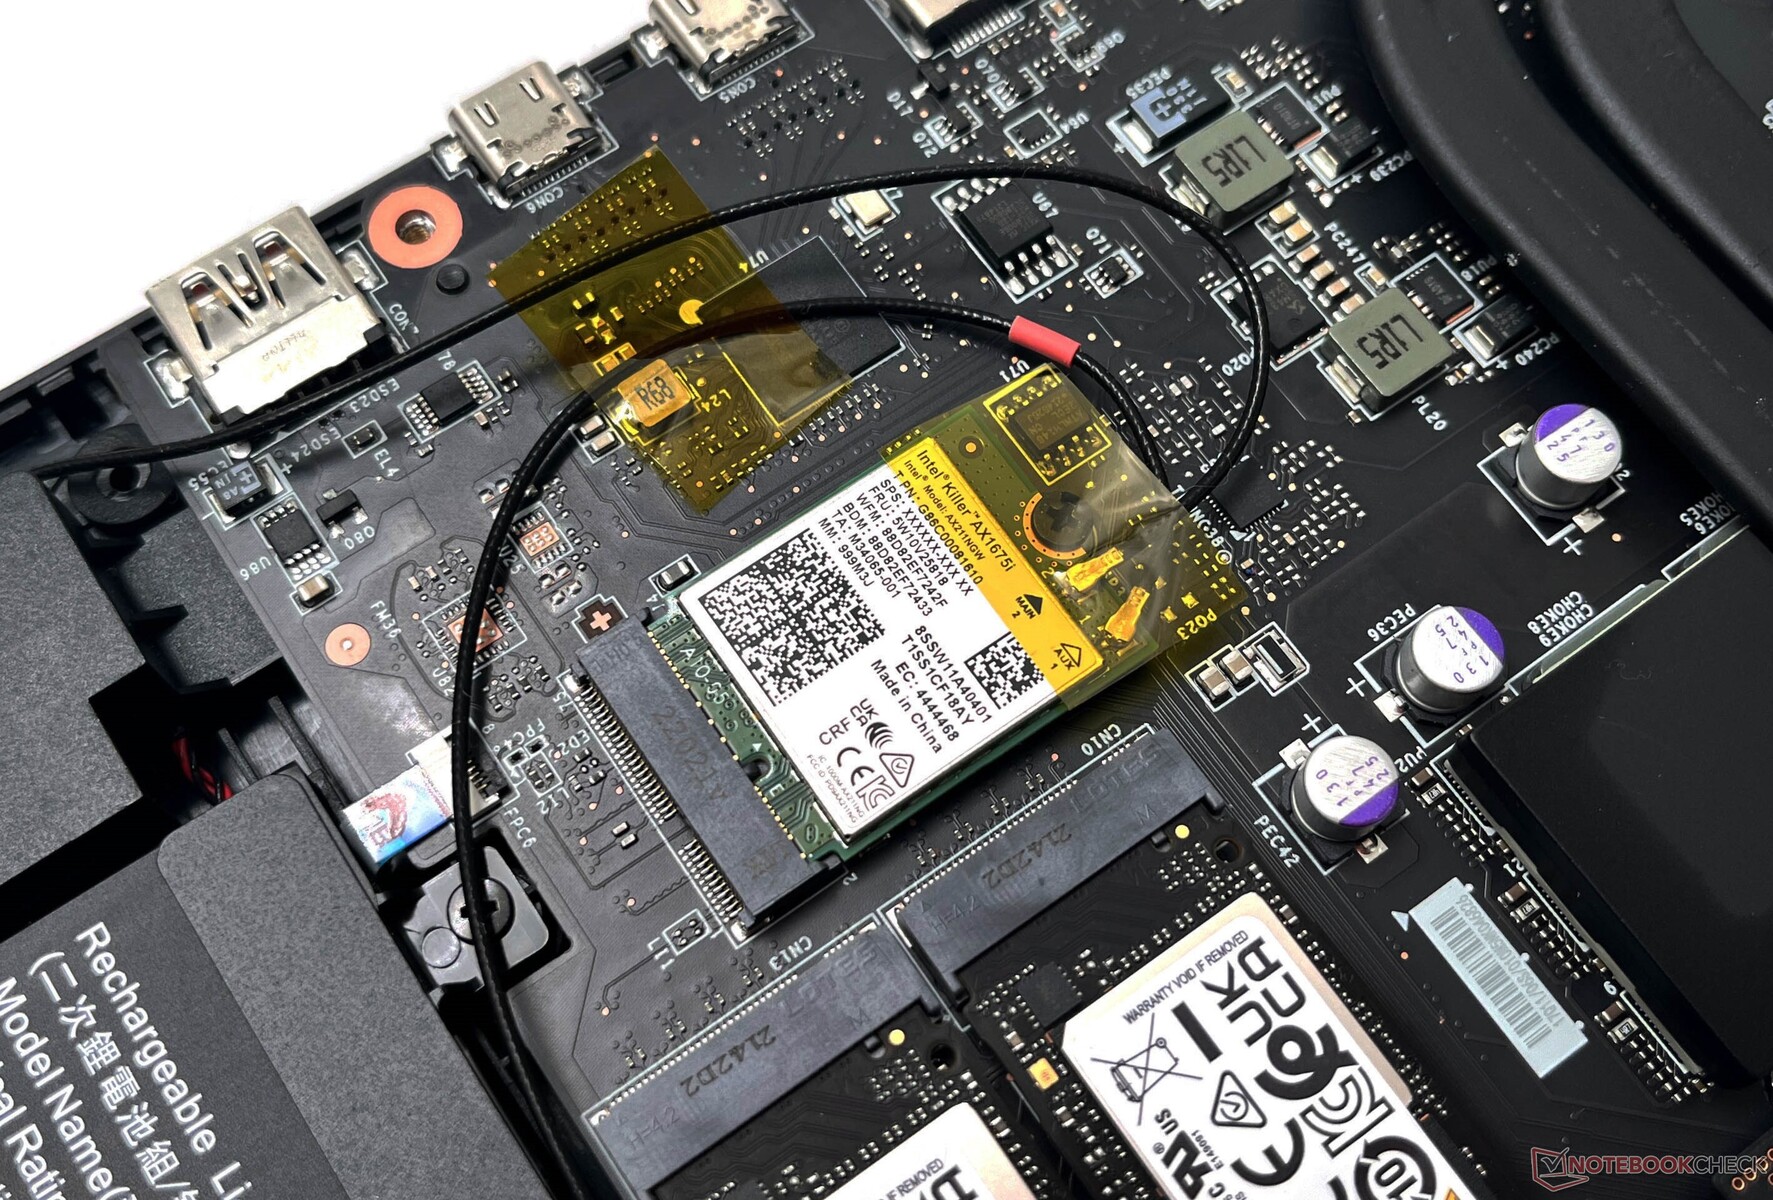
Nossa unidade Titan GT77 veio equipada com um cartão Killer Wi-Fi 6E AX1675i WLAN. O desempenho Wi-Fi está geralmente acima da média da classe nas bandas de 5 GHz e 6 GHz com o mínimo de queda na taxa de transferência quando testado com nosso roteador de referência Asus ROG Rapture GT-AXE11000
Observamos que o desempenho de 6 GHz do AX1675i não parece oferecer nenhum benefício tangível acima de 5 GHz em termos de taxa de transferência média. Entretanto, se você tiver um roteador com capacidade 6E, o uso desta faixa pode ajudar no aumento das taxas de pico de produção.
Webcam
Não é incomum encontrar webcams abismais em laptops de jogos, mas o atirador de 720p do Titan GT77 tem um desempenho bastante ruim para um dispositivo de 2022. Uma webcam FHD muito melhorada está disponível no GE76 Raider 12U.
Como é evidente em nosso Passaporte ColorChecker e nas imagens da tabela de teste abaixo, a precisão das cores é bastante pobre, com muito ruído e uma falta geral de nitidez mesmo sob luz ambiente brilhante. Não há obturador de privacidade física disponível, mas a webcam pode ser ligada/desligada usando um atalho de teclado ou via MSI Center.


Segurança
O Titan GT77 oferece câmera IR e biometria baseada em impressões digitais compatível com Windows Olá, que é uma raridade em laptops para jogos. Ambas as formas de biometria são fáceis de registrar e são bastante rápidas e ágeis.
Além disso, um módulo TPM 2.0 também está presente.
Acessórios
Como esta é uma unidade personalizada semeada pela Intel, não encontramos nenhum acessório adicional na caixa, além do enorme tijolo de 330 W de potência.
Manutenção
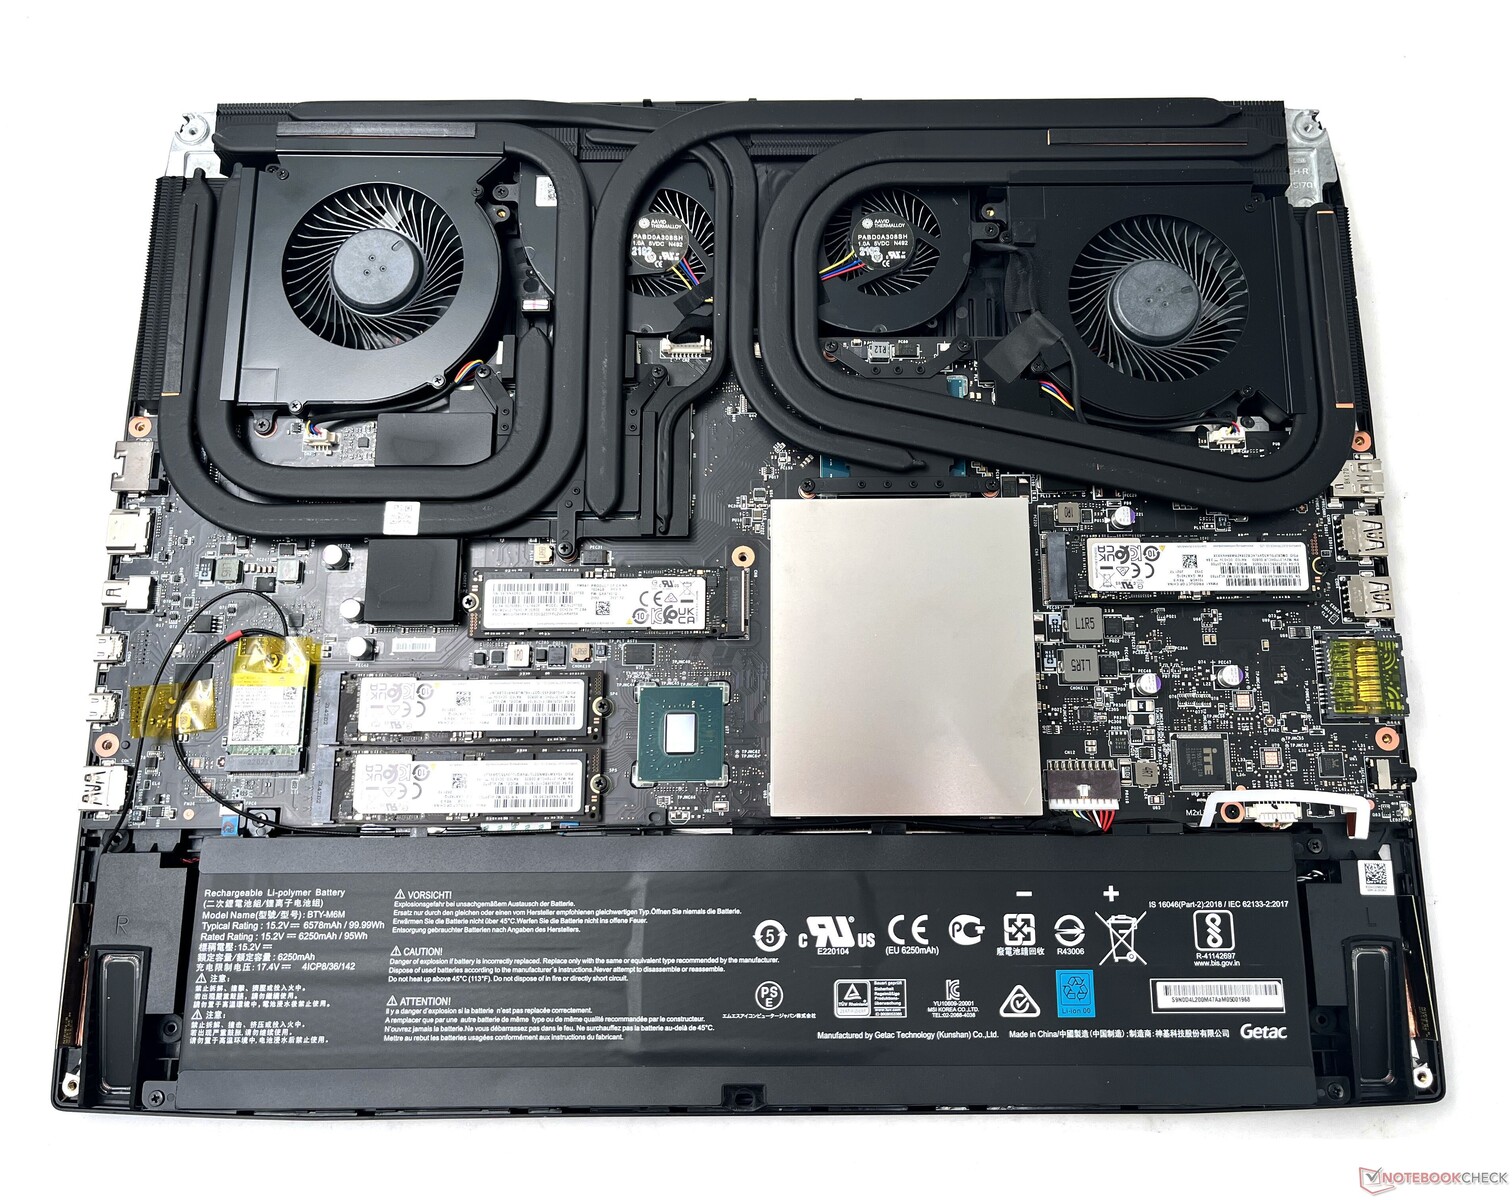
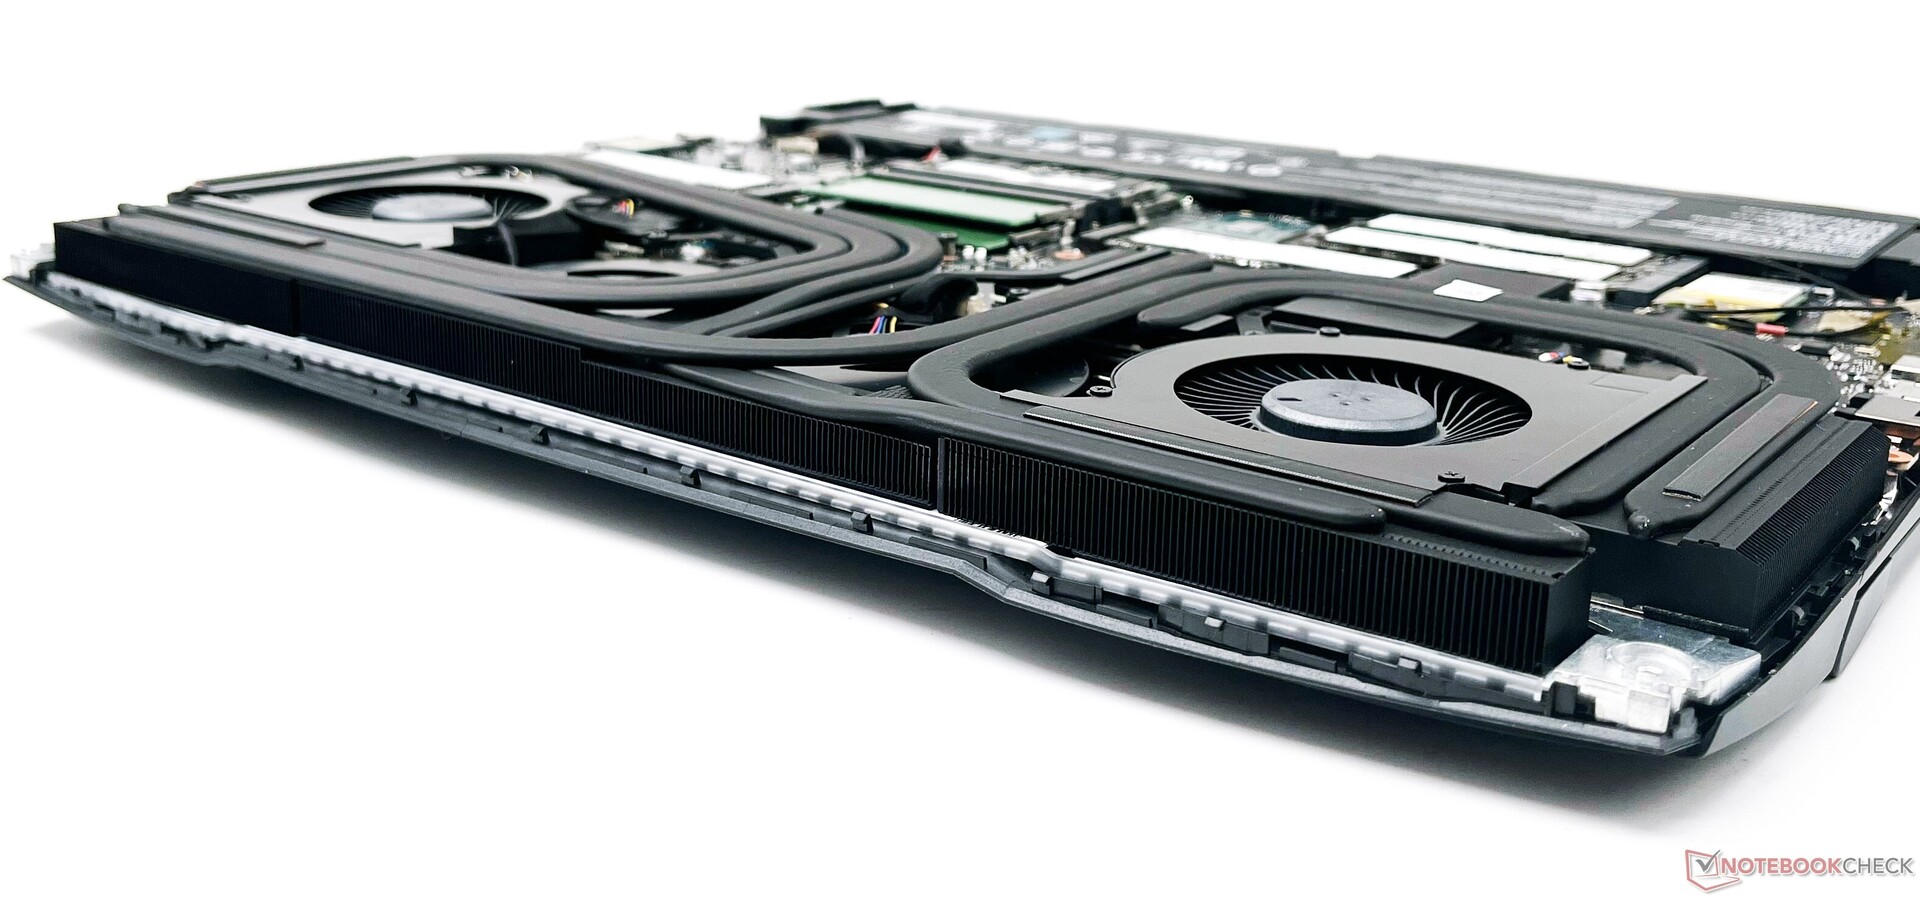
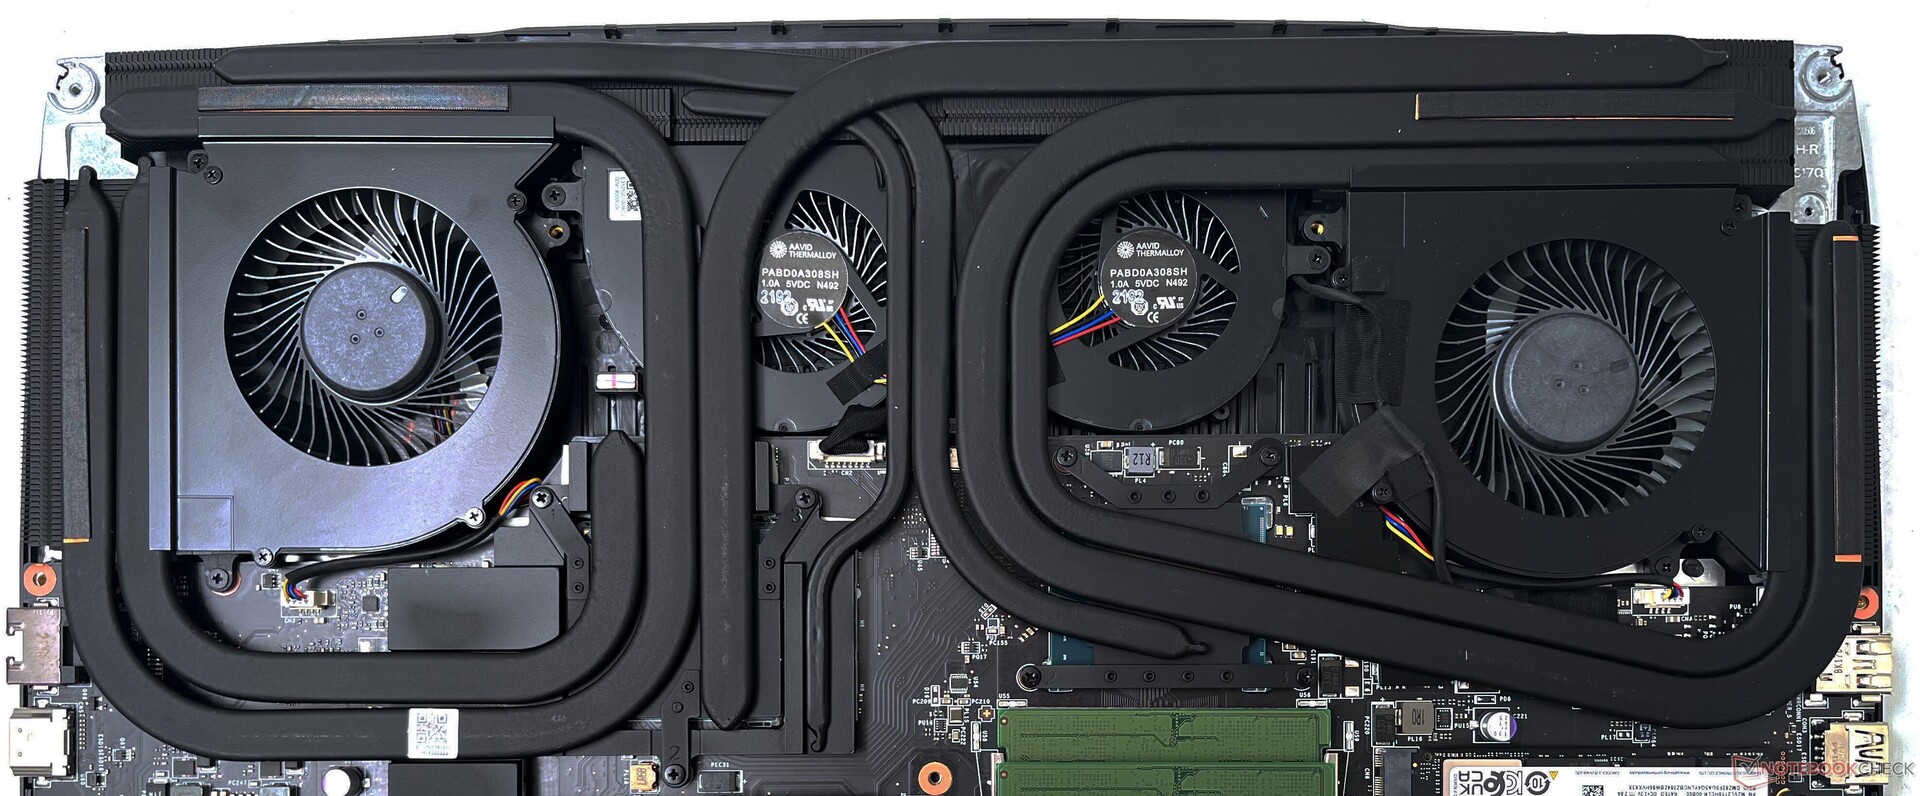
Não há nenhuma escotilha de manutenção fornecida. O painel inferior pode ser aberto após a remoção de 11 parafusos PH1, mas é necessário algum esforço para abri-lo completamente do restante do chassi.
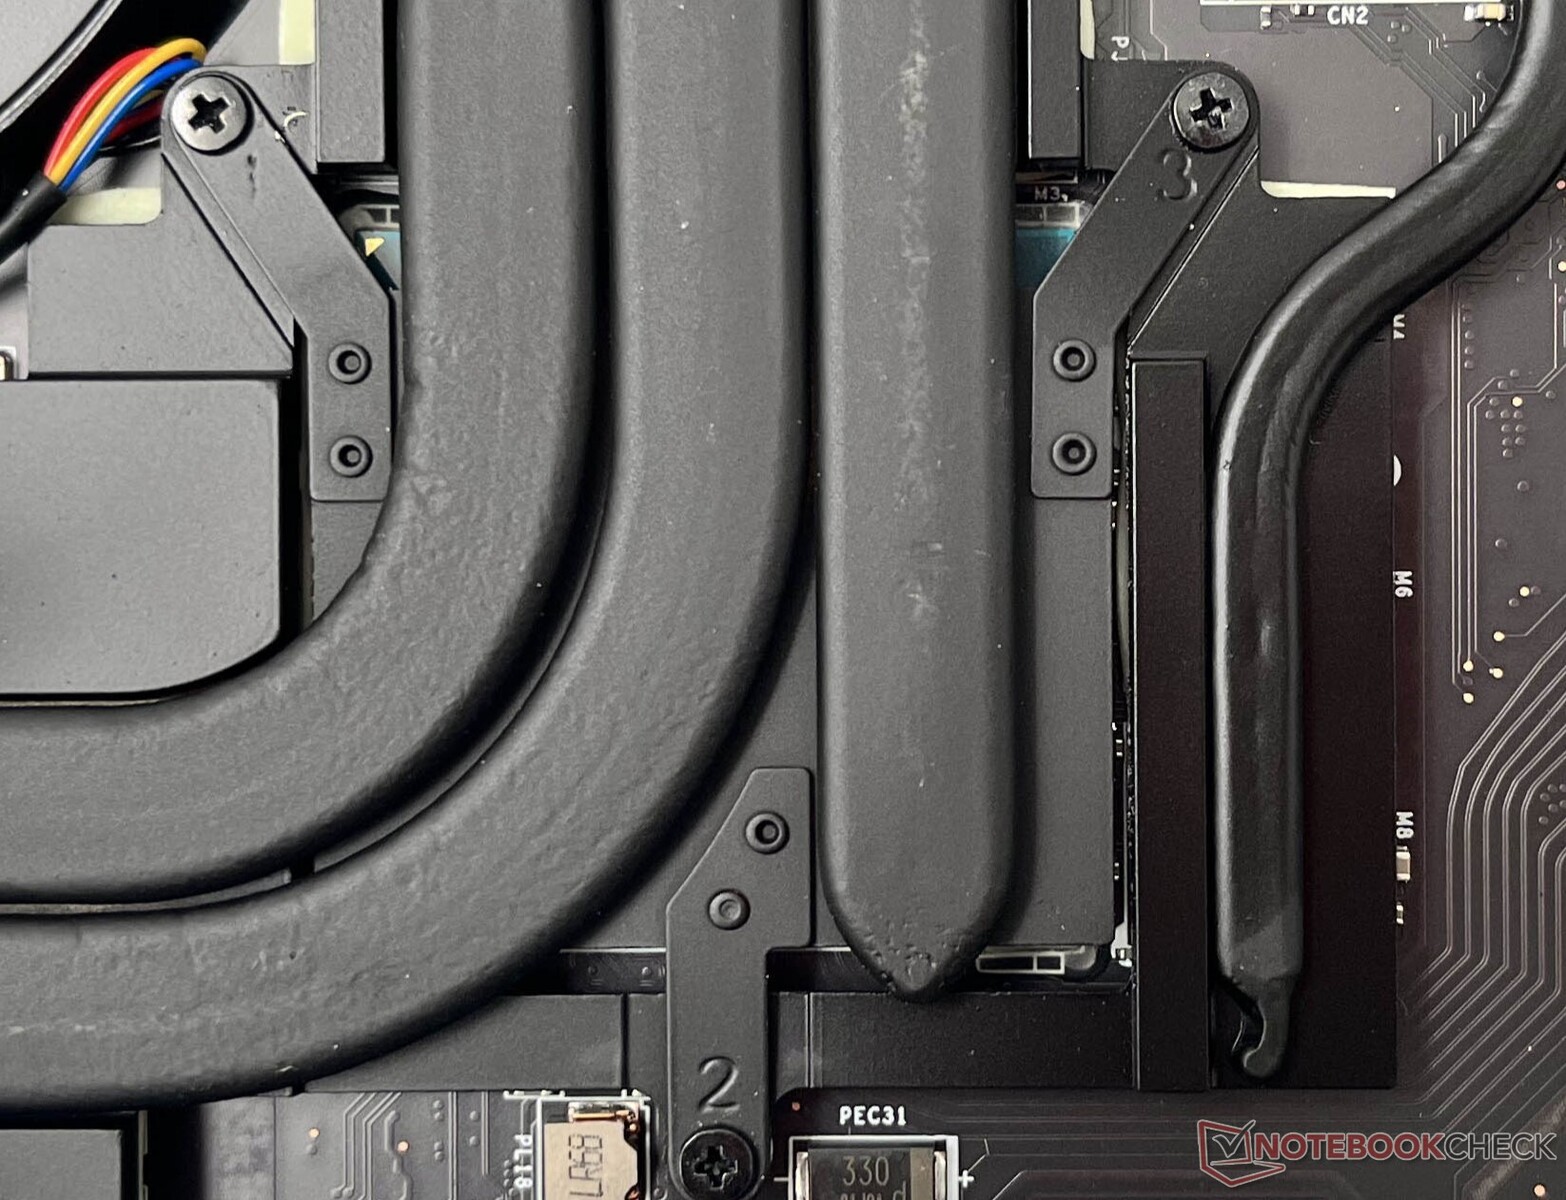
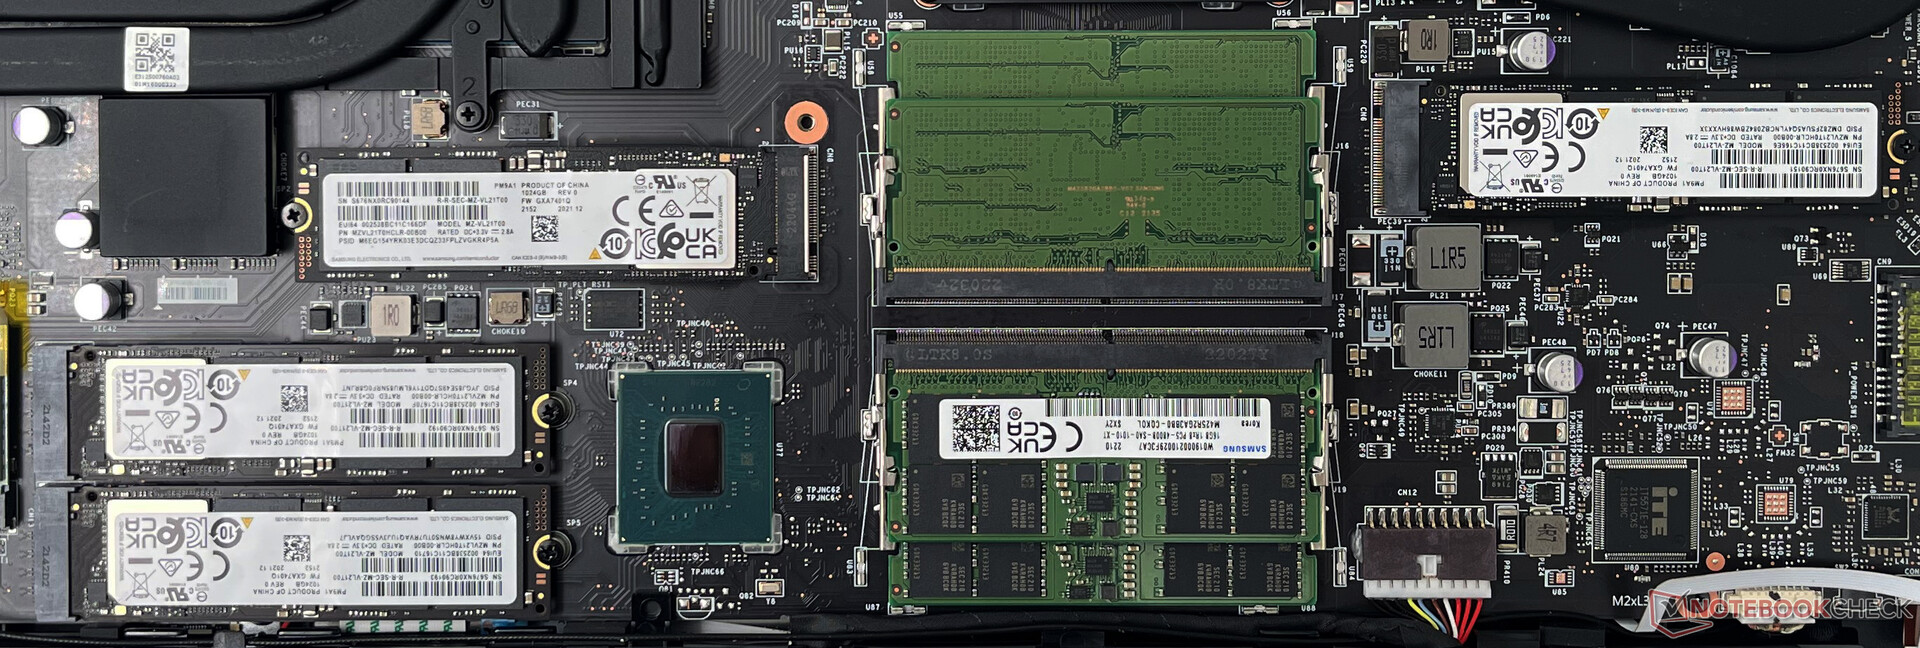
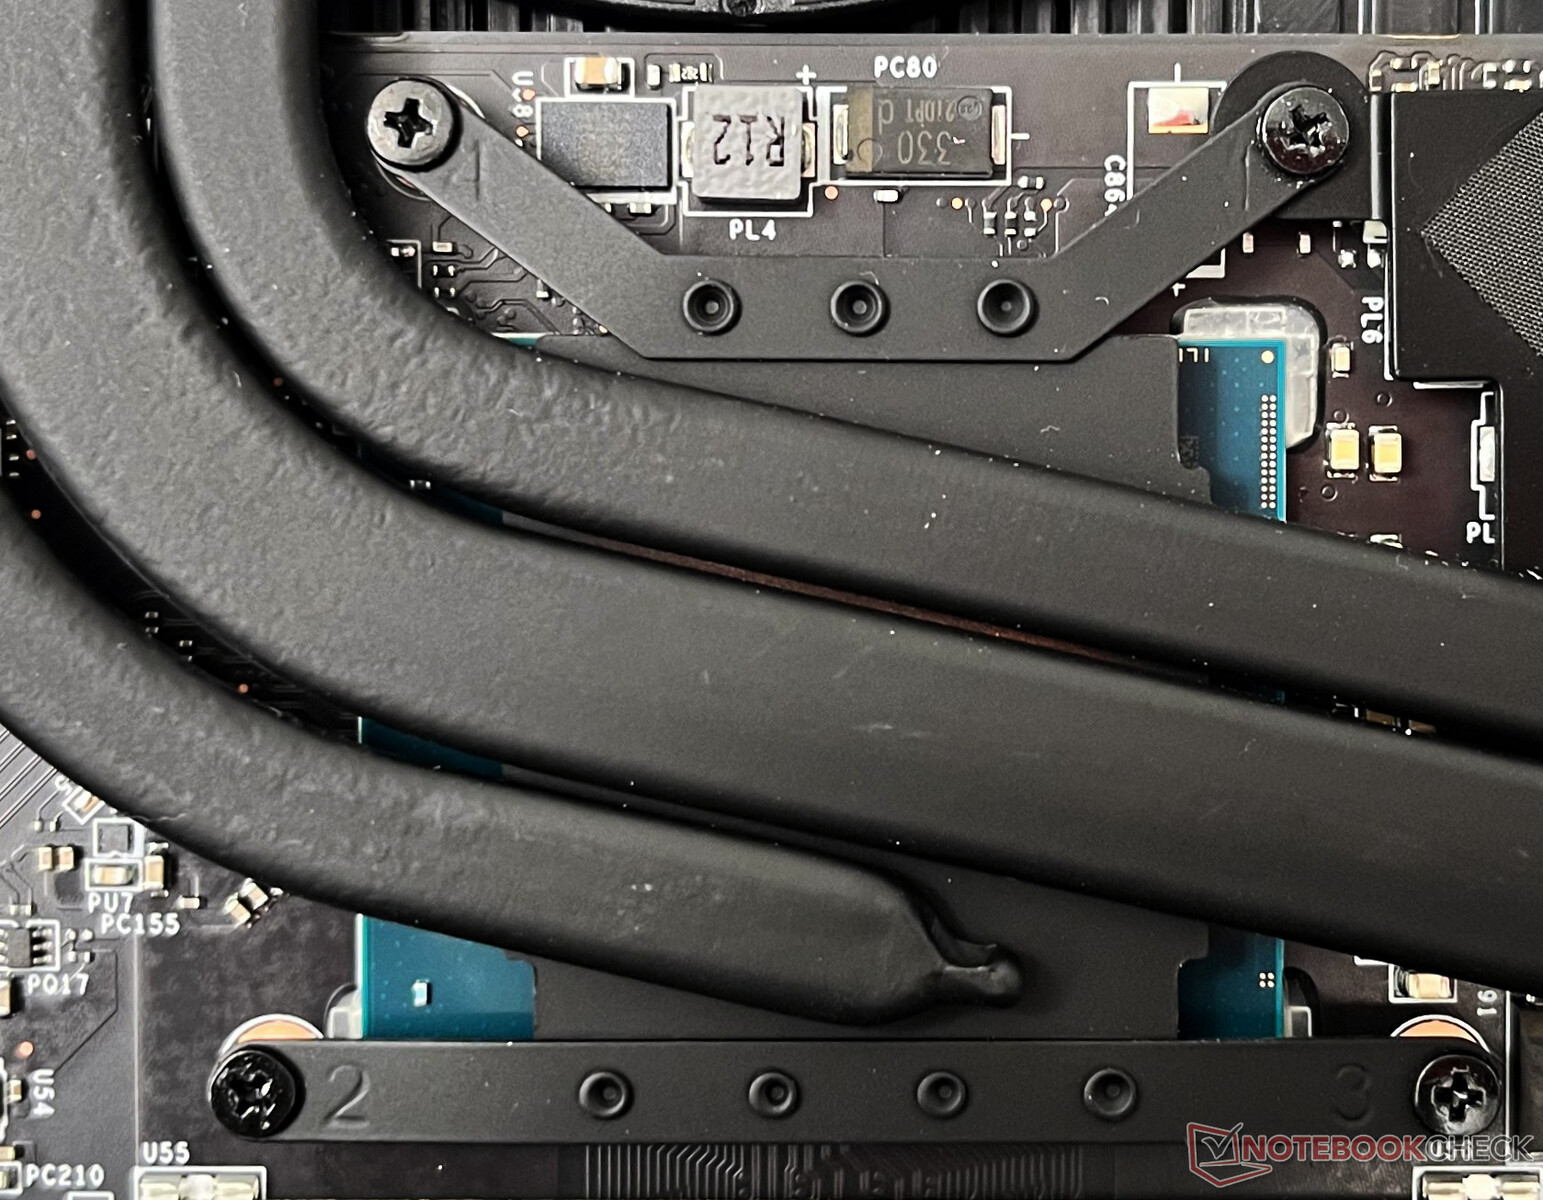
No interior, encontramos um arranjo bastante ocupado de peças. No verdadeiro estilo Titan, o sistema de refrigeração é maciço, com quatro ventiladores, sete tubos de calor e seis exaustores.
Todos os quatro slots SSD em nossa unidade vieram ocupados com 1 TB PCIe Gen4 NVMe drives. Quatro bastões de 16 GB de memória DDR5-4800 cada um estão presentes abaixo da tampa de alumínio - você pode encher até 128 GB de memória DDR5-4800 aqui
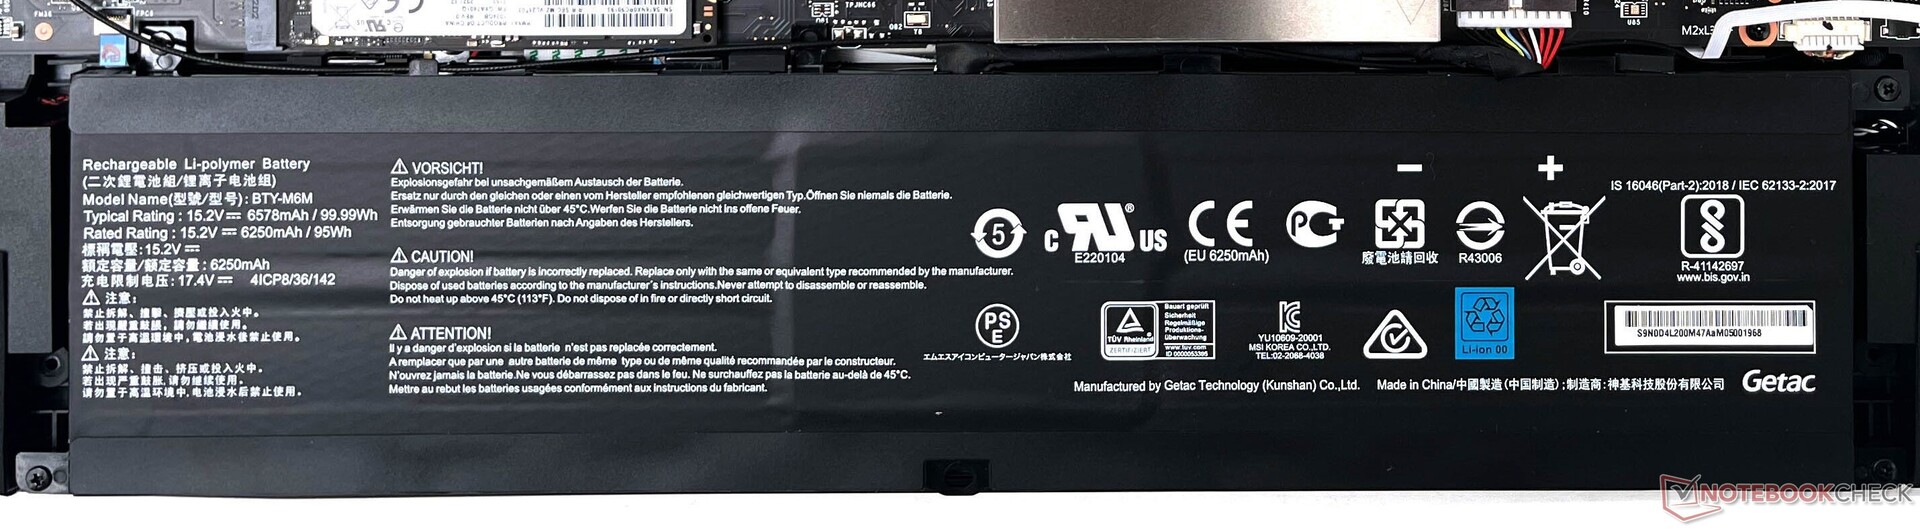
A bateria de 99,9 WHr pode ser removida para substituição. O cartão Killer AX1675i WLAN, NVMe SSDs e a memória DDR5 podem ser todos atualizados.
Garantia
Dependendo da região, a MSI oferece uma garantia padrão de um ano ou dois anos para seus laptops para jogos junto com um seguro de viagem global. Como a nossa é uma unidade personalizada, ela não veio com nenhuma informação de garantia.
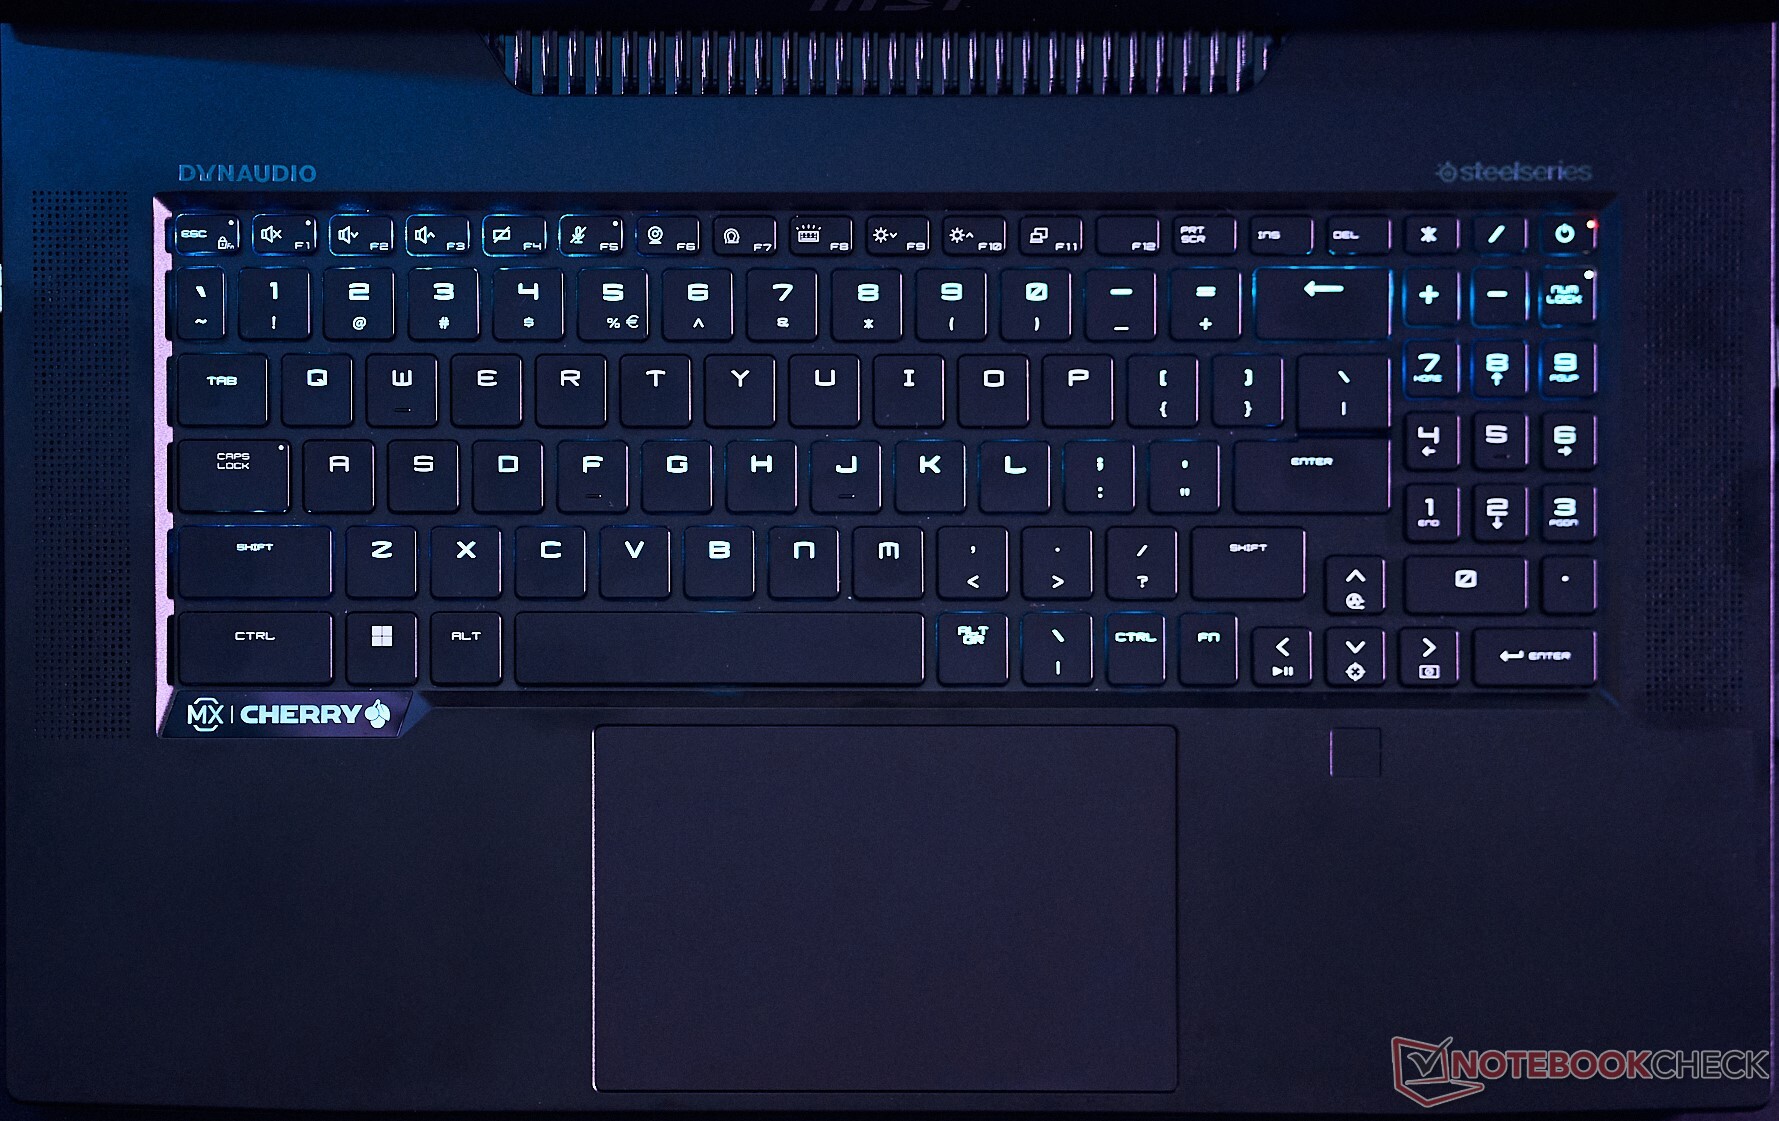
Dispositivos de entrada: Delicioso teclado Cherry MX e grande touchpad
Teclado
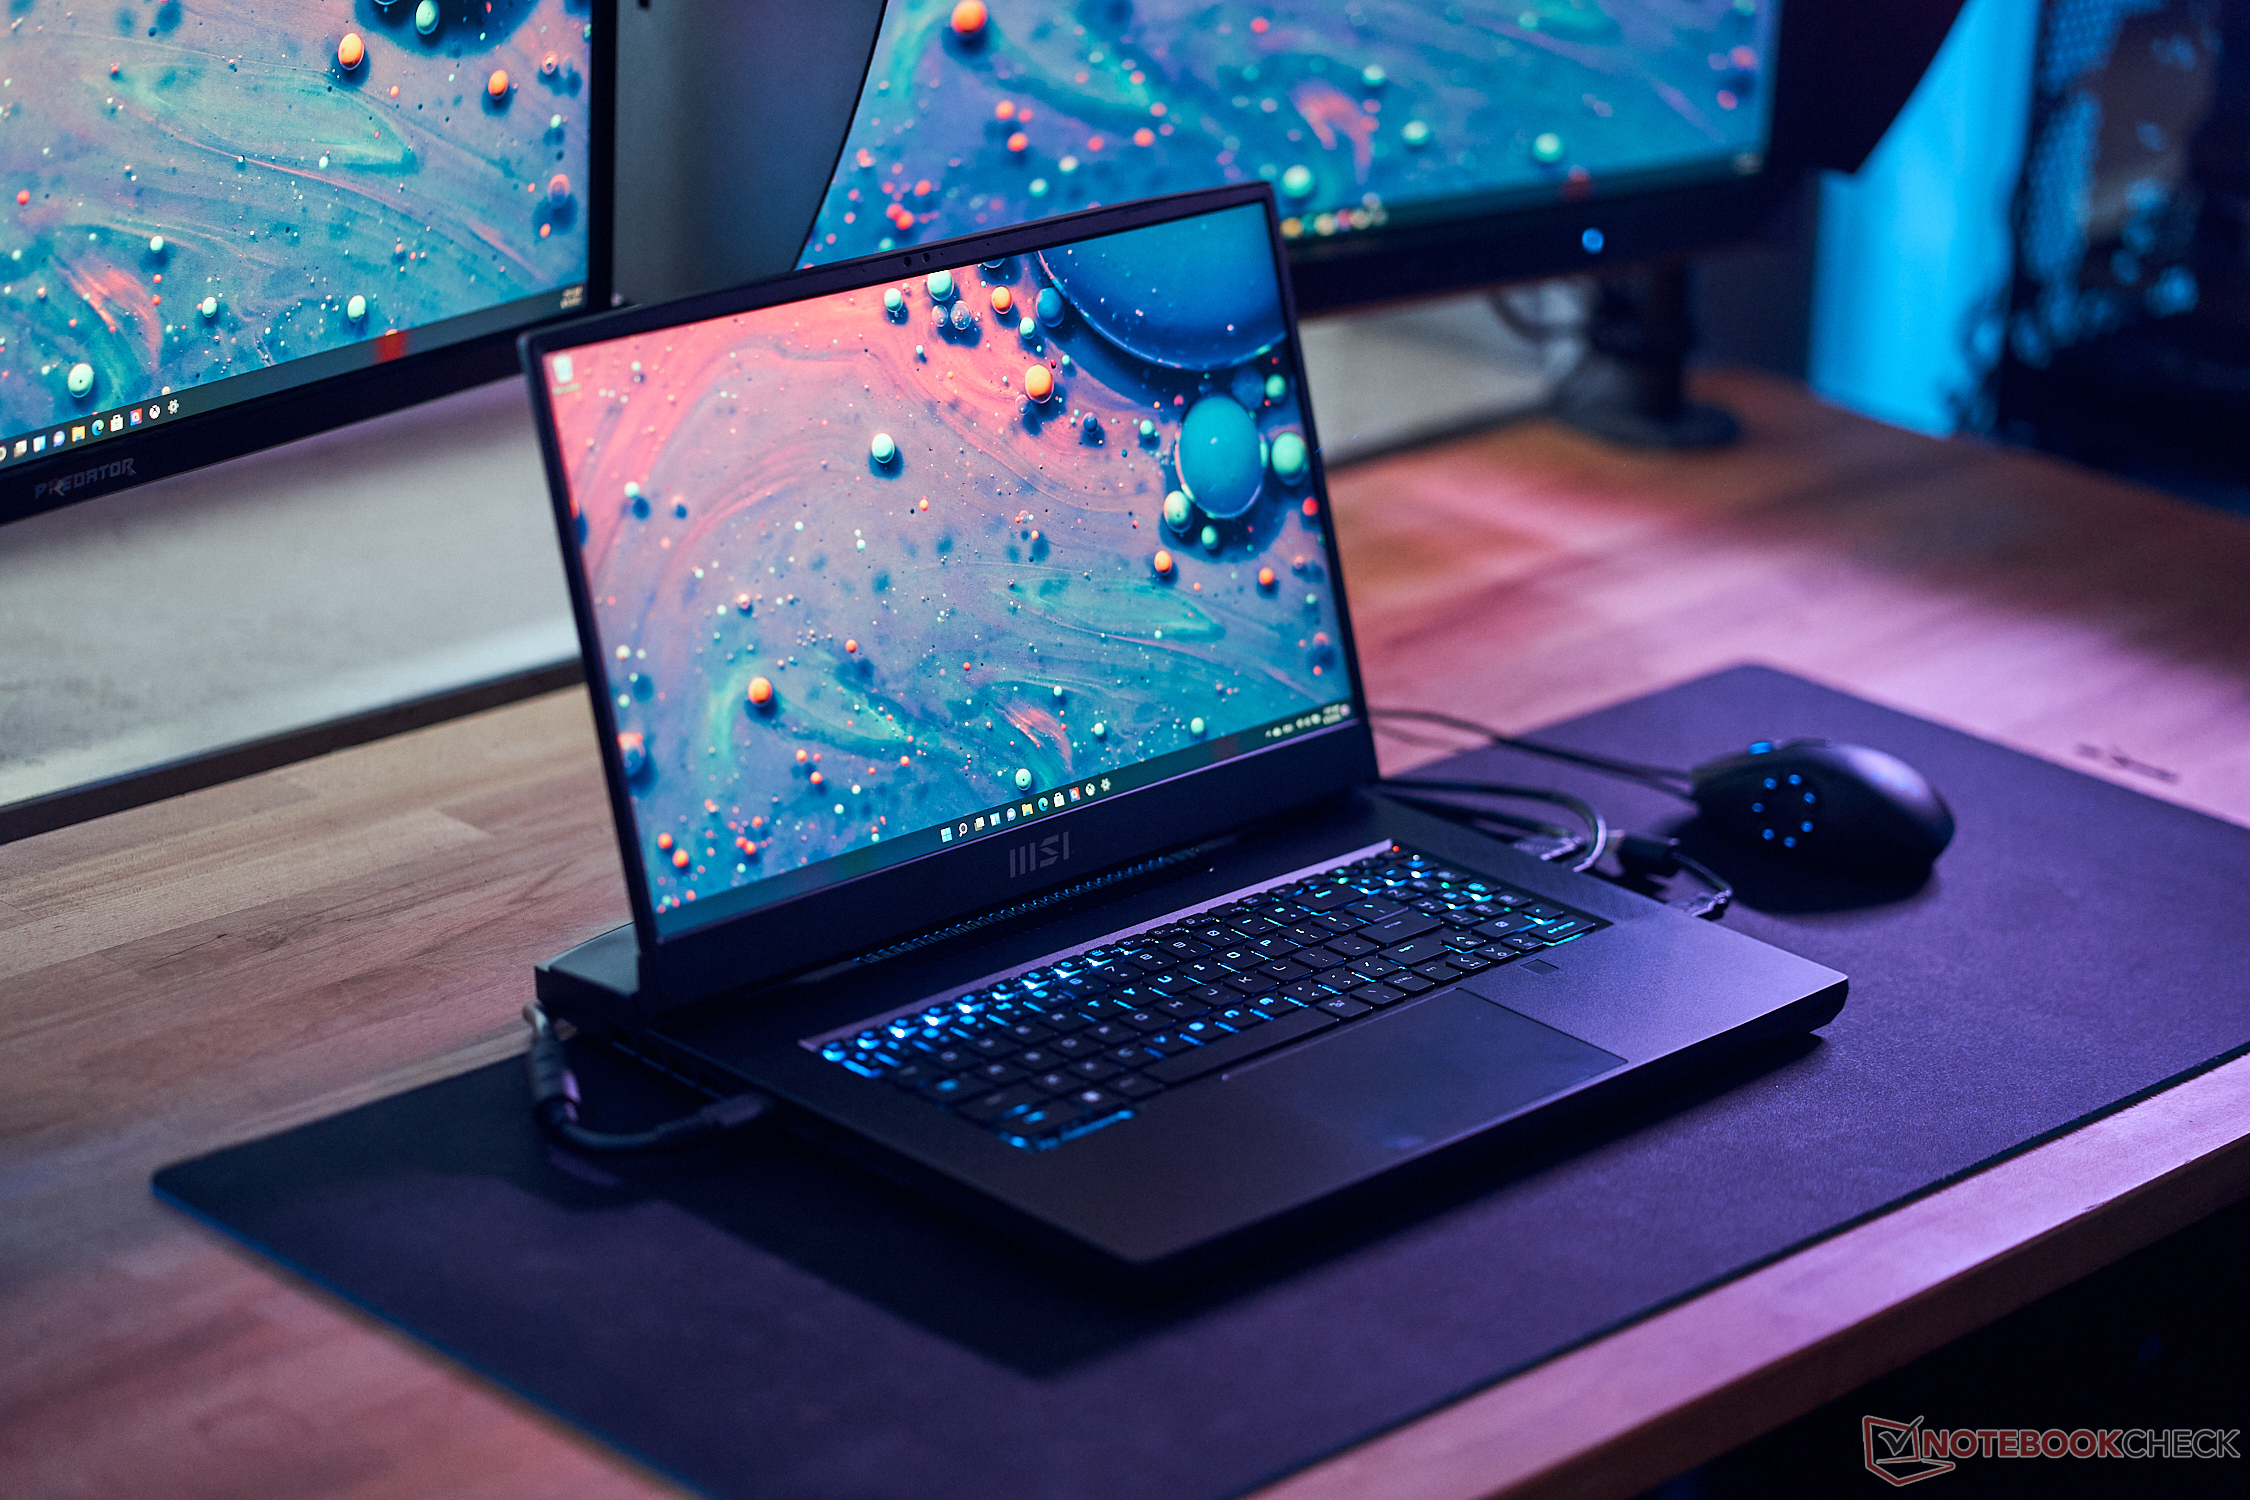
O teclado SteelSeries com interruptores mecânicos Cherry MX Ultra Low Profile apresenta uma ótima experiência de digitação com excelente feedback tátil, resposta rápida e um som de digitação nítido. Todas as teclas podem ser iluminadas individualmente e o software SteelSeries GG permite configurar todos os tipos de efeitos de iluminação RGB e macro atalhos
Entretanto, somente a área principal de digitação utiliza chaves mecânicas Cherry MX. As teclas de função, as teclas de seta e o teclado numérico parecem se contentar com interruptores de membrana convencionais. A localização da tecla Fn pode levar algum tempo para se acostumar se você for novo nos laptops MSI. Pressionar a tecla Fn acende as funções adicionais somente nas teclas F1-F12, o que ajuda na legibilidade fácil em ambientes escuros.
As teclas Home, End, Page Up e Page Down estão disponíveis apenas no teclado numérico e requerem a desativação do Num Lock caso você deseje usá-las. As teclas de setas são de tamanho decente, mas a falta de teclas mecânicas aqui é uma chatice se você estiver interessado em jogos de corrida. É importante que a área do teclado seja mantida relativamente limpa, pois o pó ou partículas de alimentos podem facilmente se alojar sob as teclas e causar problemas com o acionamento.
Touchpad
O touchpad é um passo à frente do que tínhamos visto no Titan GT76. Ele agora tem um design sem botões e mede 13 x 8,2 cm, permitindo assim um deslizamento sem esforço.
O touchpad clica relativamente sem esforço e suporta gestos do Windows Precision.
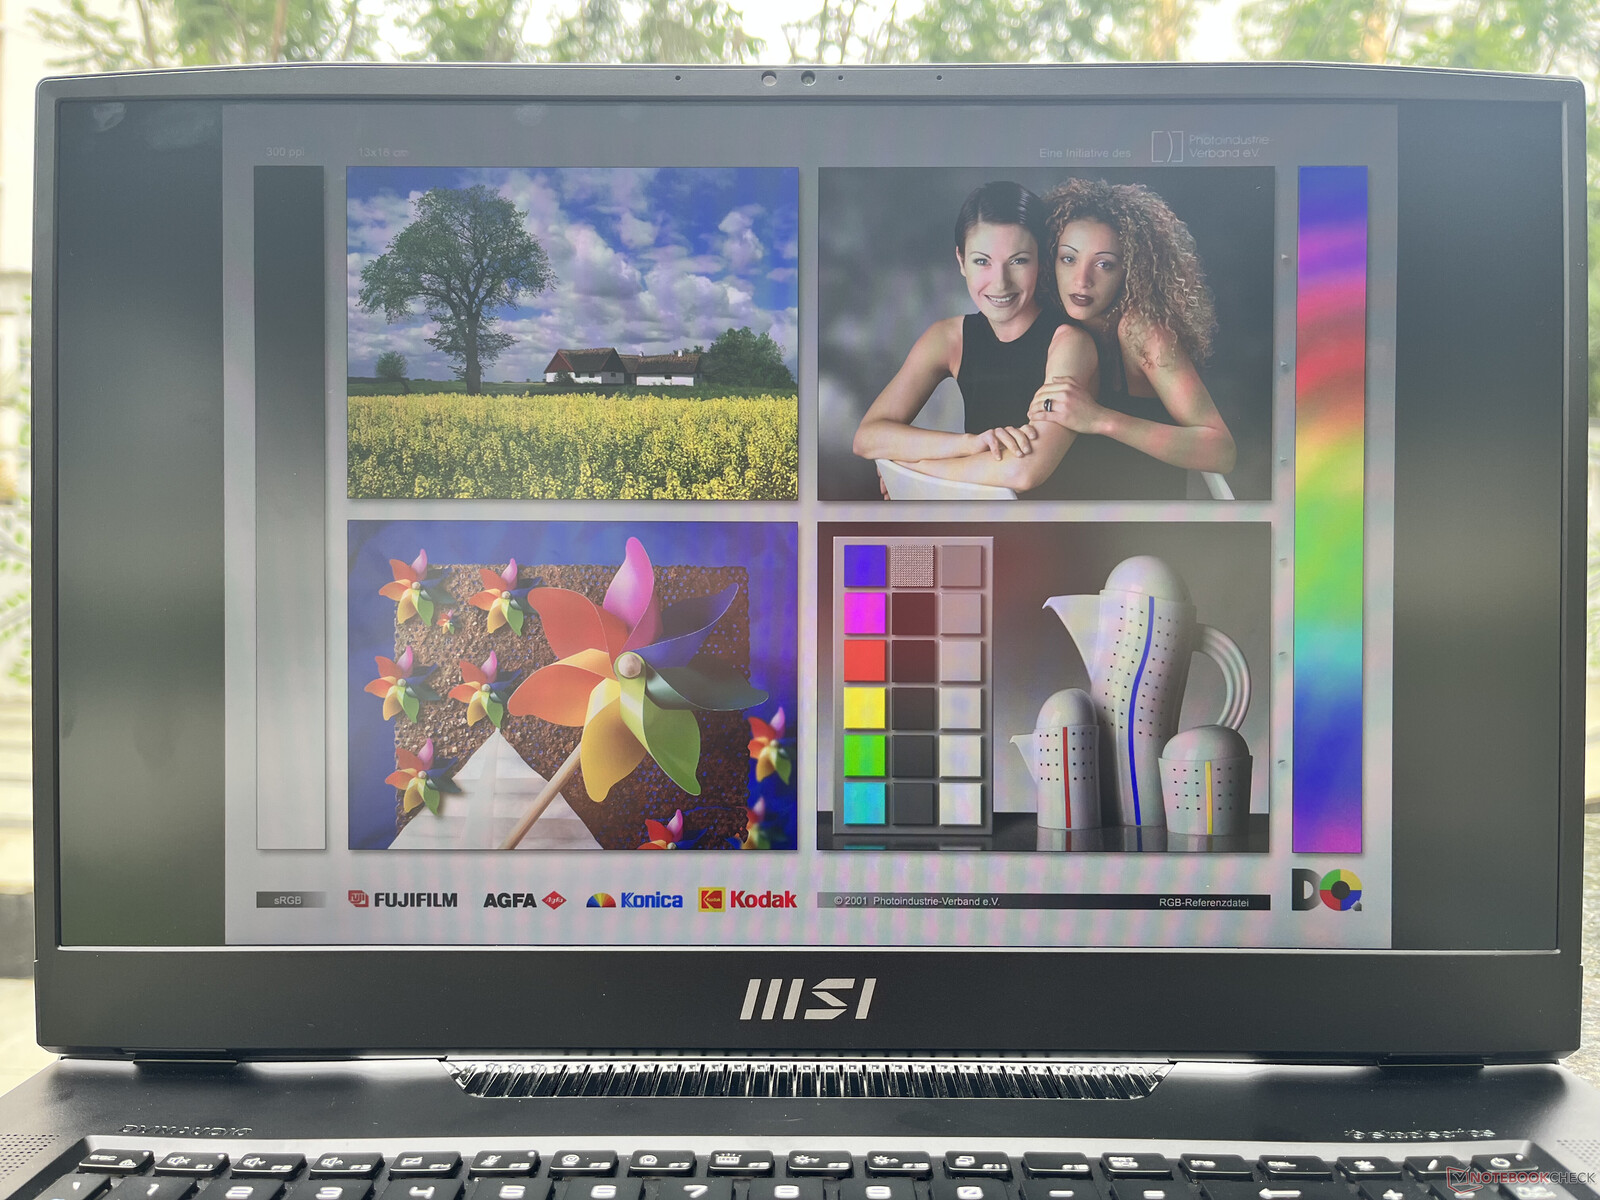
Mostrar: painel FHD 360 Hz com baixo tempo de resposta e software de cor buggy
Nossa unidade Titan GT77 veio equipada com um painel de 360 Hz FHD. O Titan GT77 atualmente só pode ser configurado com um painel UHD de 120 Hz, mas é provável que a empresa também ofereça uma opção FHD de 360 Hz ao longo da linha.
Esta tela não oferece nenhuma forma de suporte HDR ou G-Sync. No momento do teste, o True Color só suportava sRGB e alguns outros ajustes de redução de luz azul. Agora, a MSI tem atualizou o aplicativo para incluir também os espaços de cor AdobeRGB e Display P3.
Dito isto, o uso do True Color neste laptop pode ser um pouco incômodo. Há um bug no aplicativo que não permite que ele jogue bem com os últimos drivers iGPU da Intel. A atualização dos drivers gráficos Intel branqueia todas as cores e faz com que toda a tela fique extremamente desagradável. Felizmente, a MSI reconhece o problema e direciona você para um link para remediação. Basicamente, tudo que você precisa fazer é rebaixar os drivers iGPU da Intel para uma versão mais antiga. Em nossos testes, encontramos a versão 30.0.101.1994 para funcionar muito bem. A mudança do MSHybrid para o modo gráfico discreto é outra alternativa.
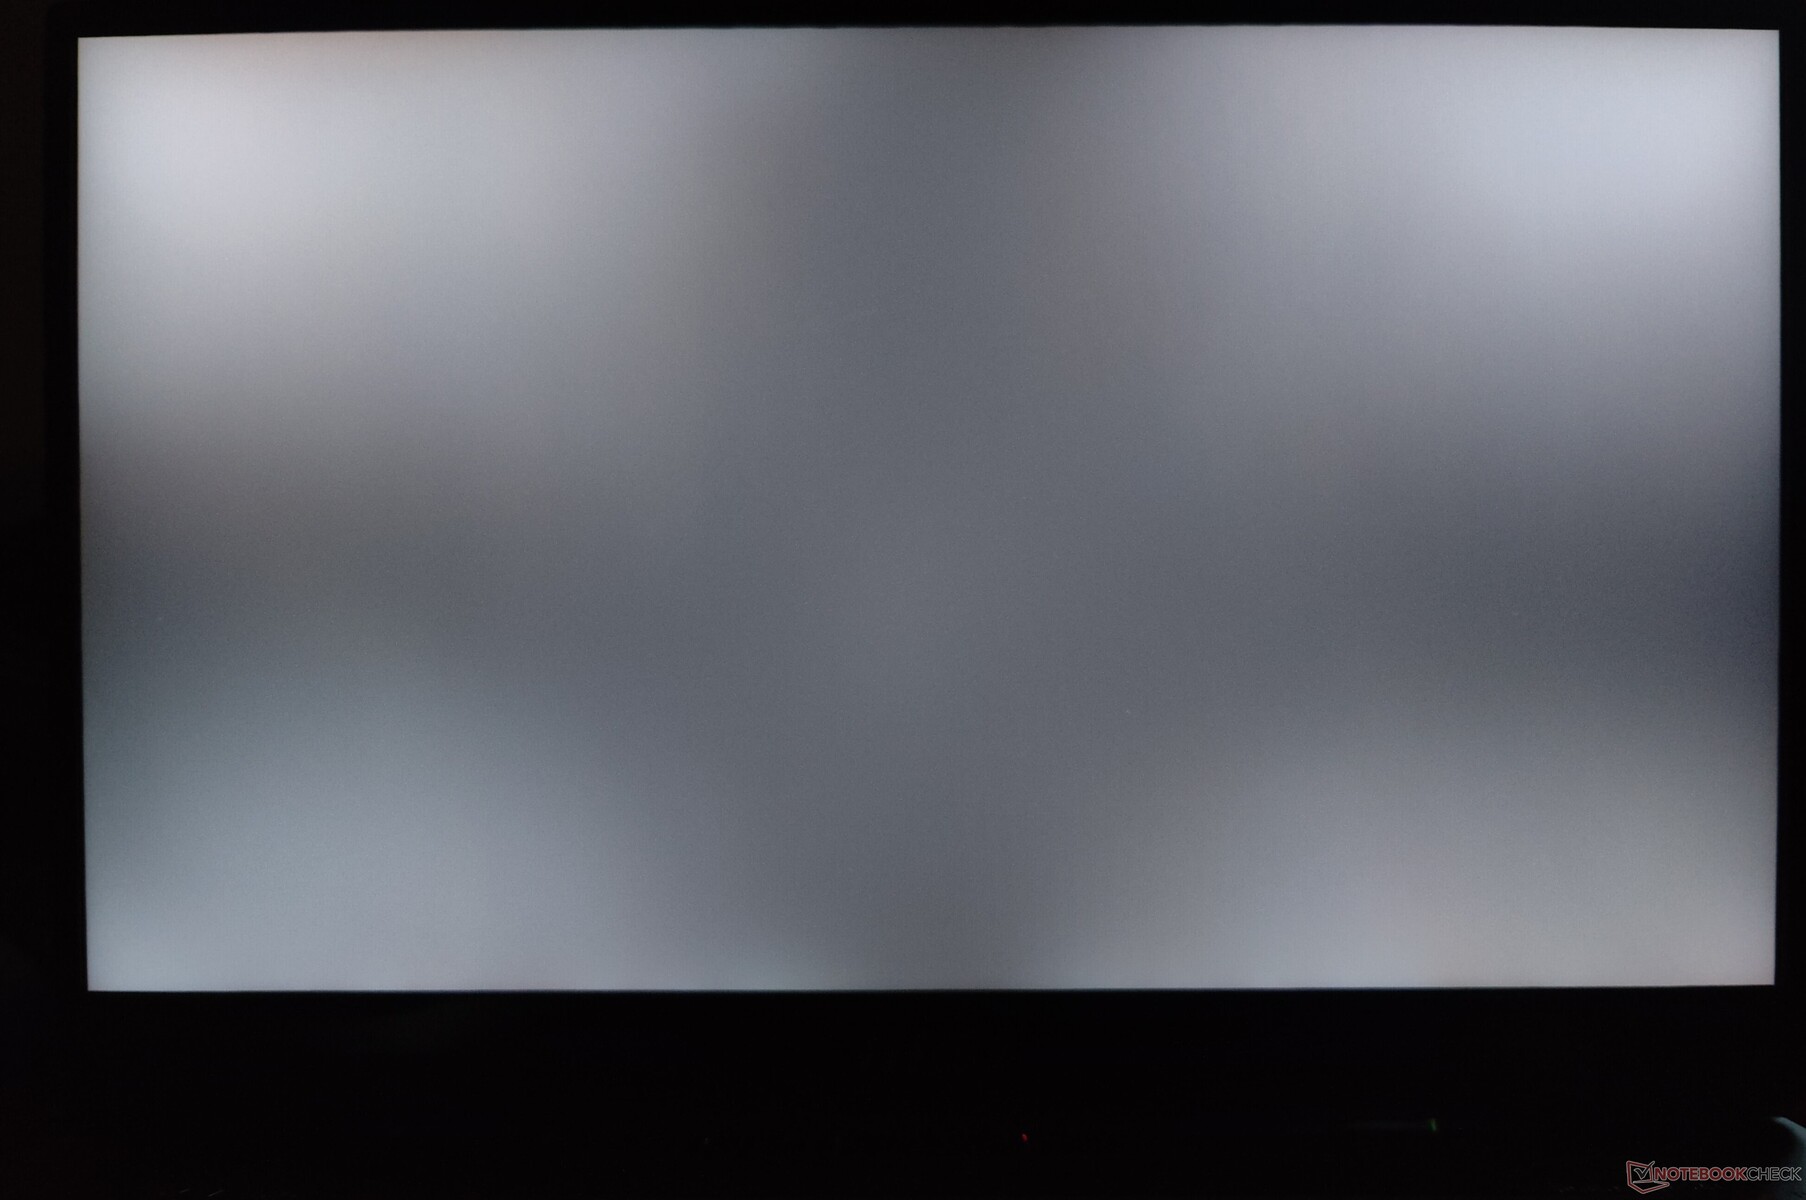
Os tamanhos de pixels individuais parecem bastante grandes, dado que este é apenas um display de 127 PPI. Observamos um sangramento leve nos cantos sob longa exposição.
A distribuição de brilho é decente a 79%, mas a relação de contraste de 700:1 é apenas cerca de média. Subjetivamente, a tela do Titan GT77 oferece uma experiência de visualização decente se seu caso de uso principal for jogos.

| |||||||||||||||||||||||||
iluminação: 79 %
iluminação com acumulador: 280 cd/m²
Contraste: 700:1 (Preto: 0.4 cd/m²)
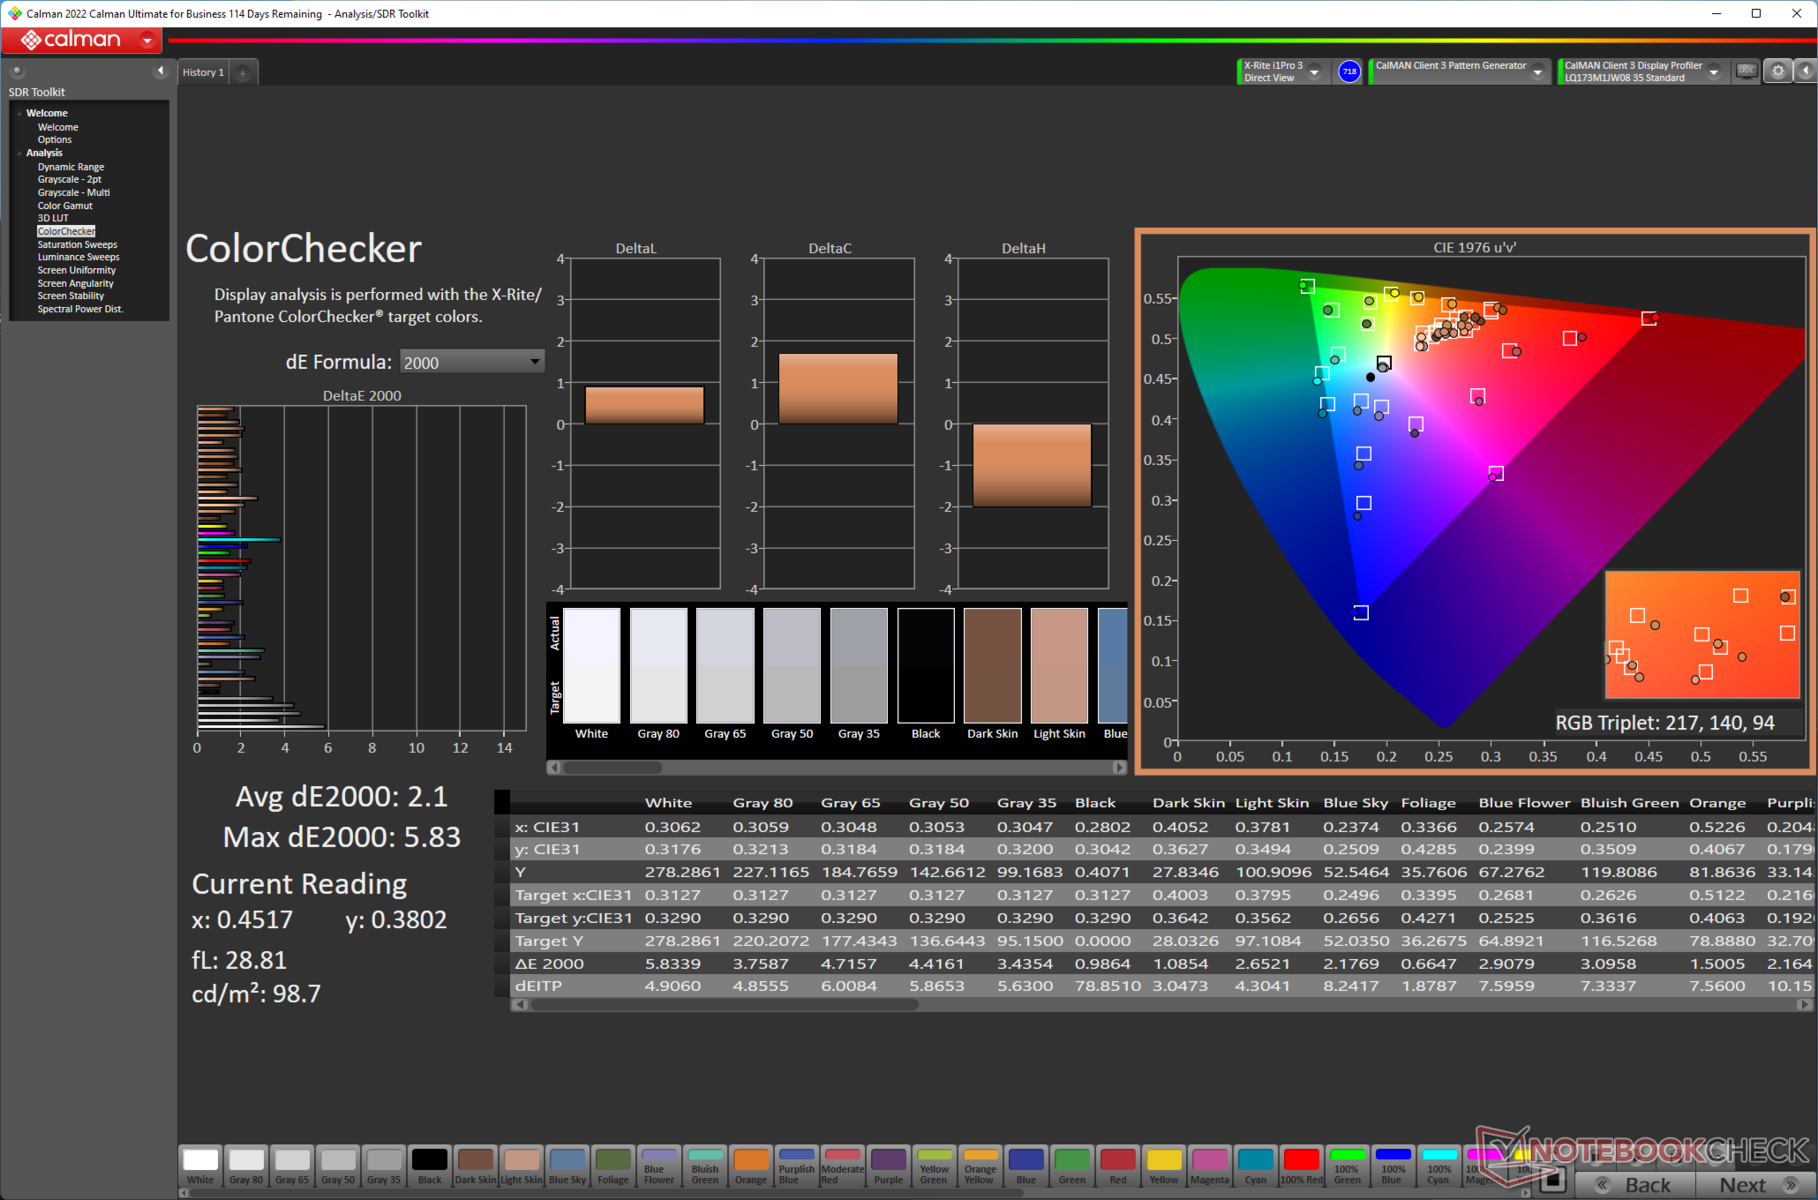
ΔE ColorChecker Calman: 2.1 | ∀{0.5-29.43 Ø4.71}
calibrated: 1.58
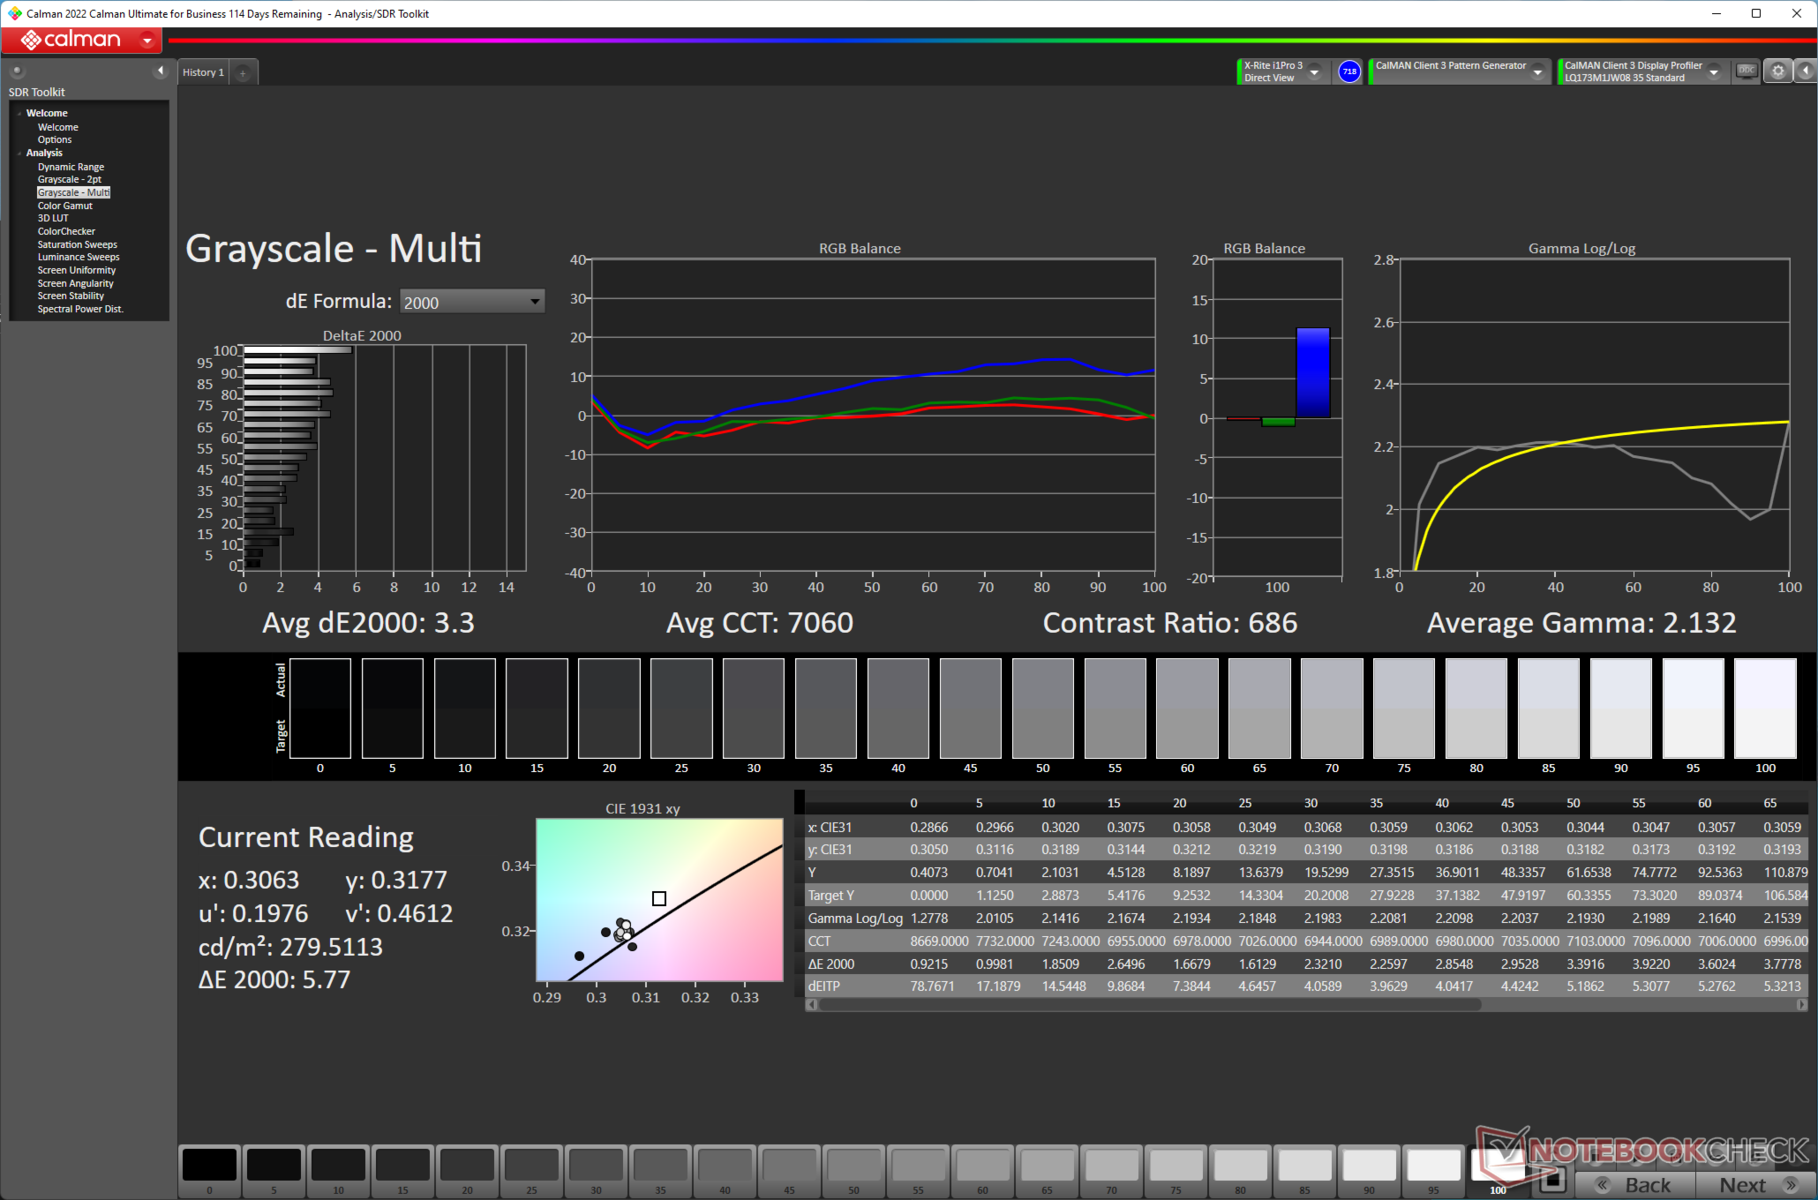
ΔE Greyscale Calman: 3.3 | ∀{0.09-98 Ø4.96}
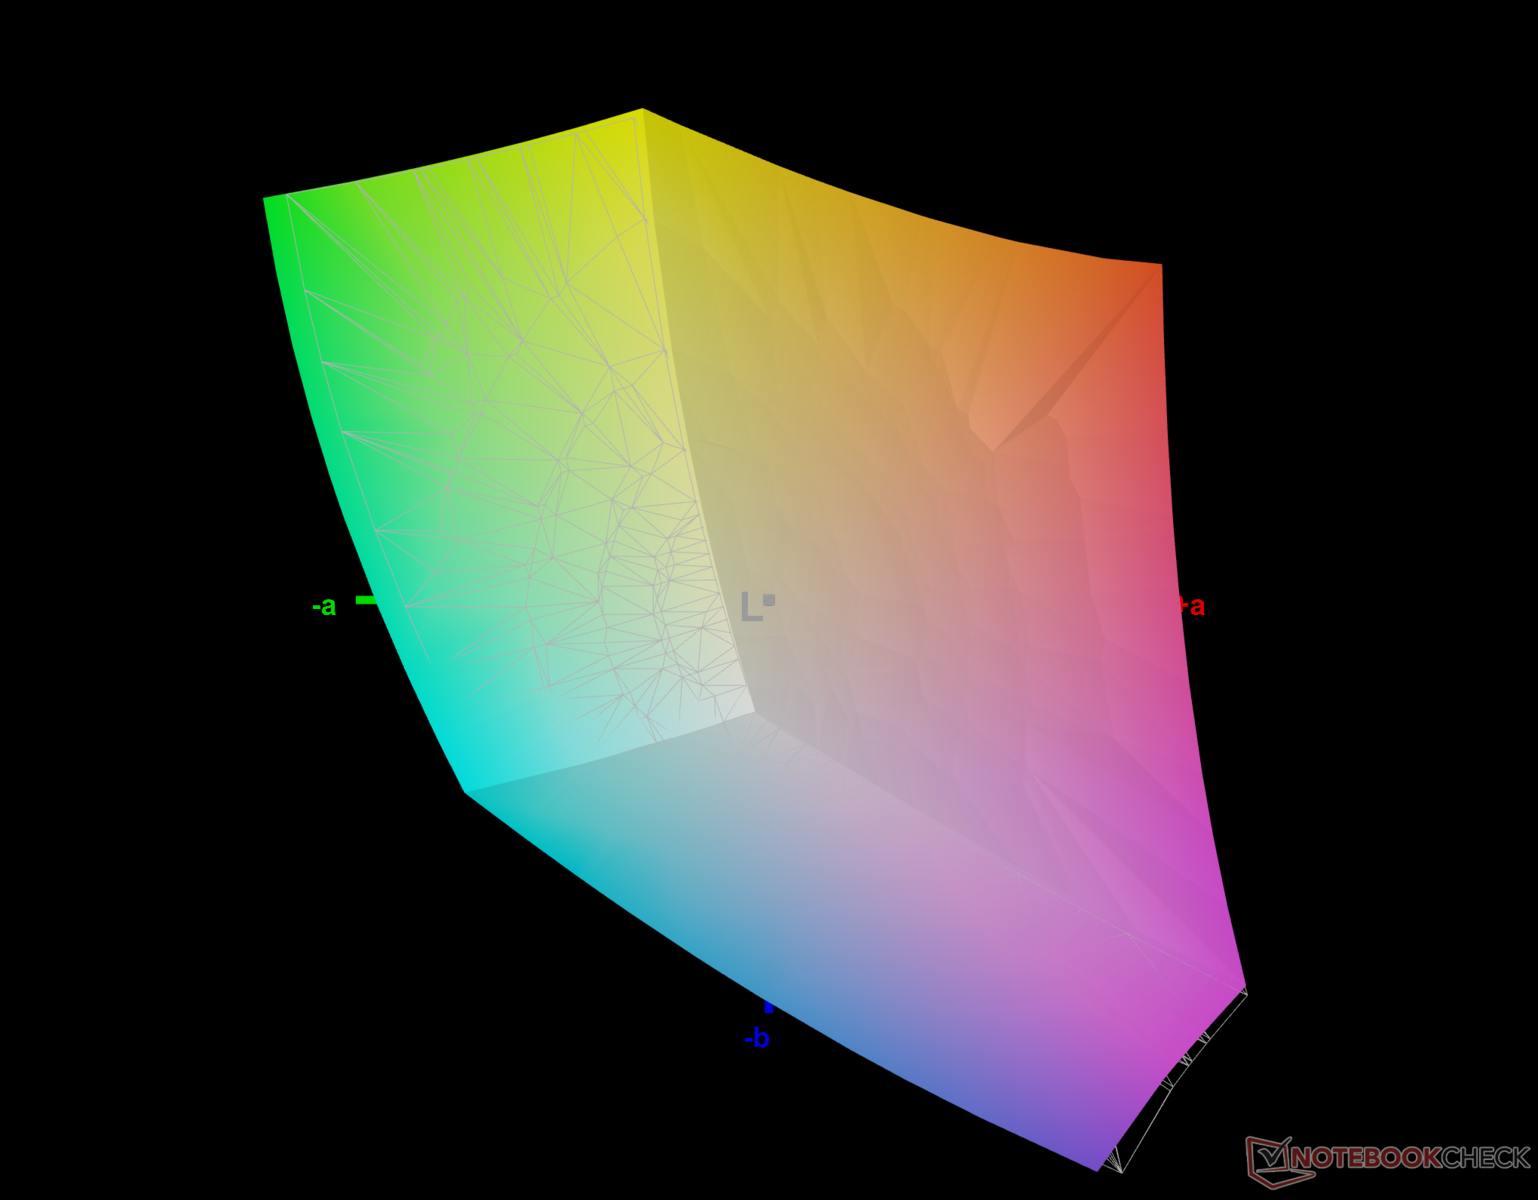
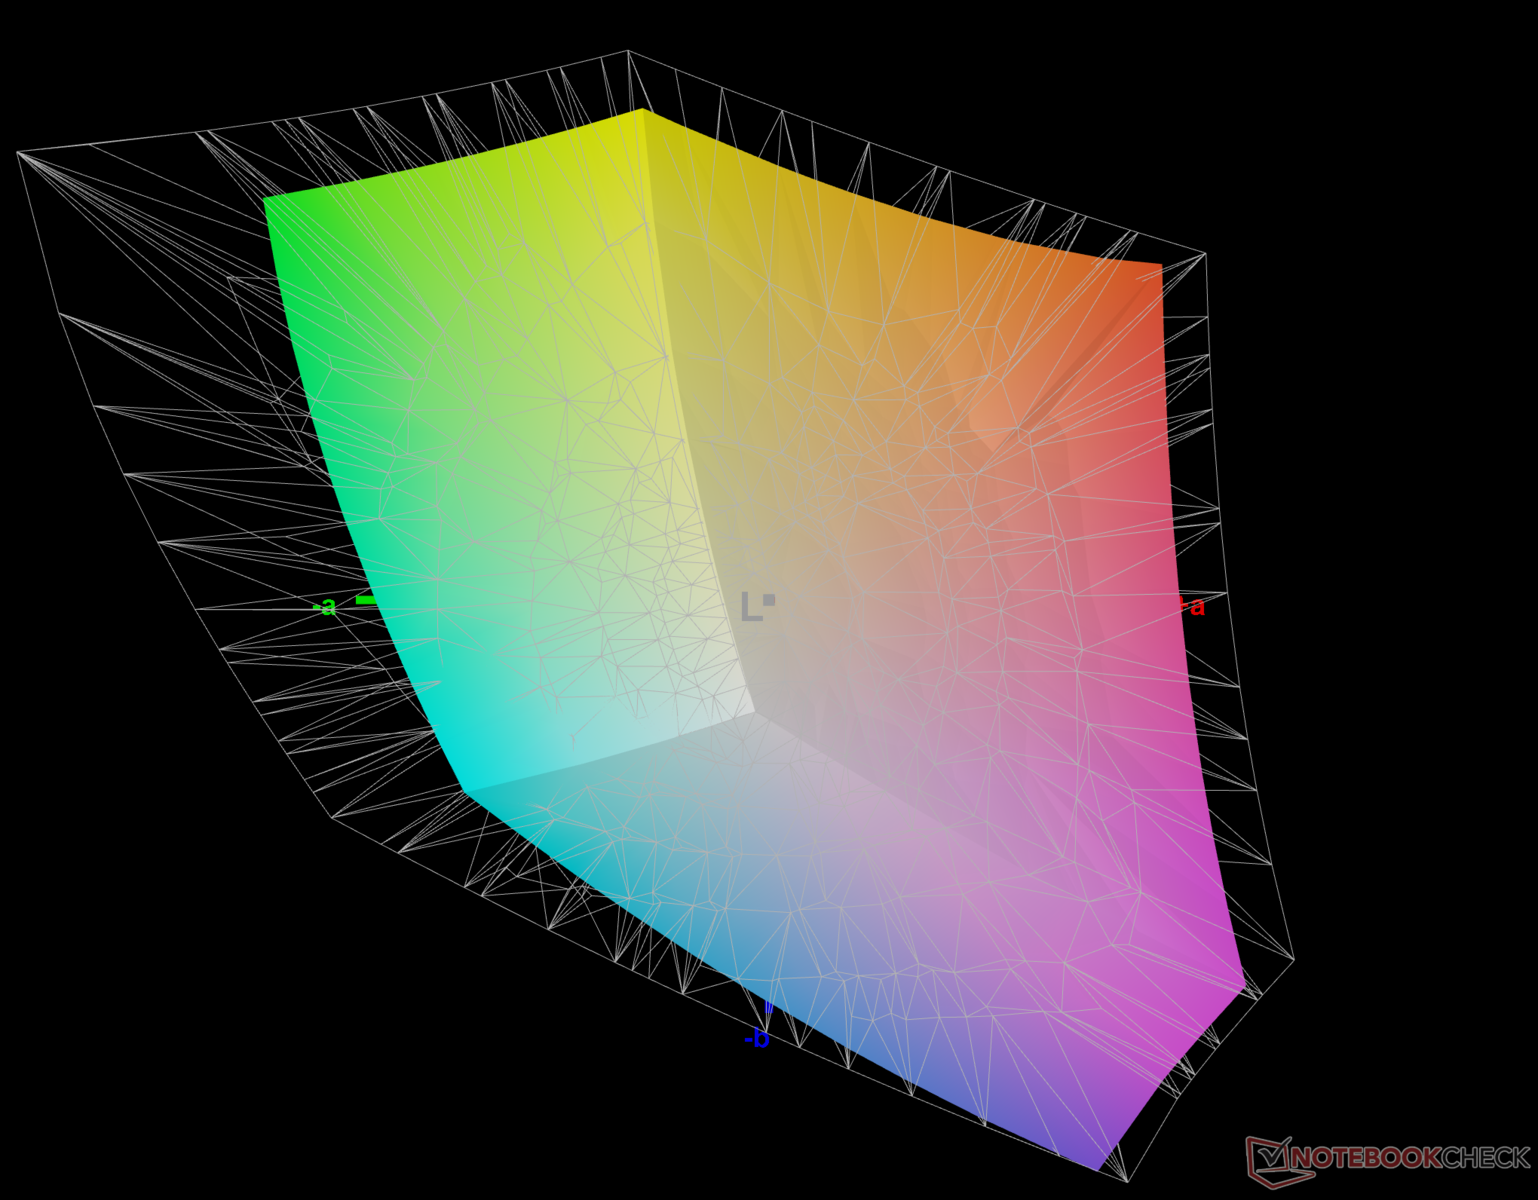
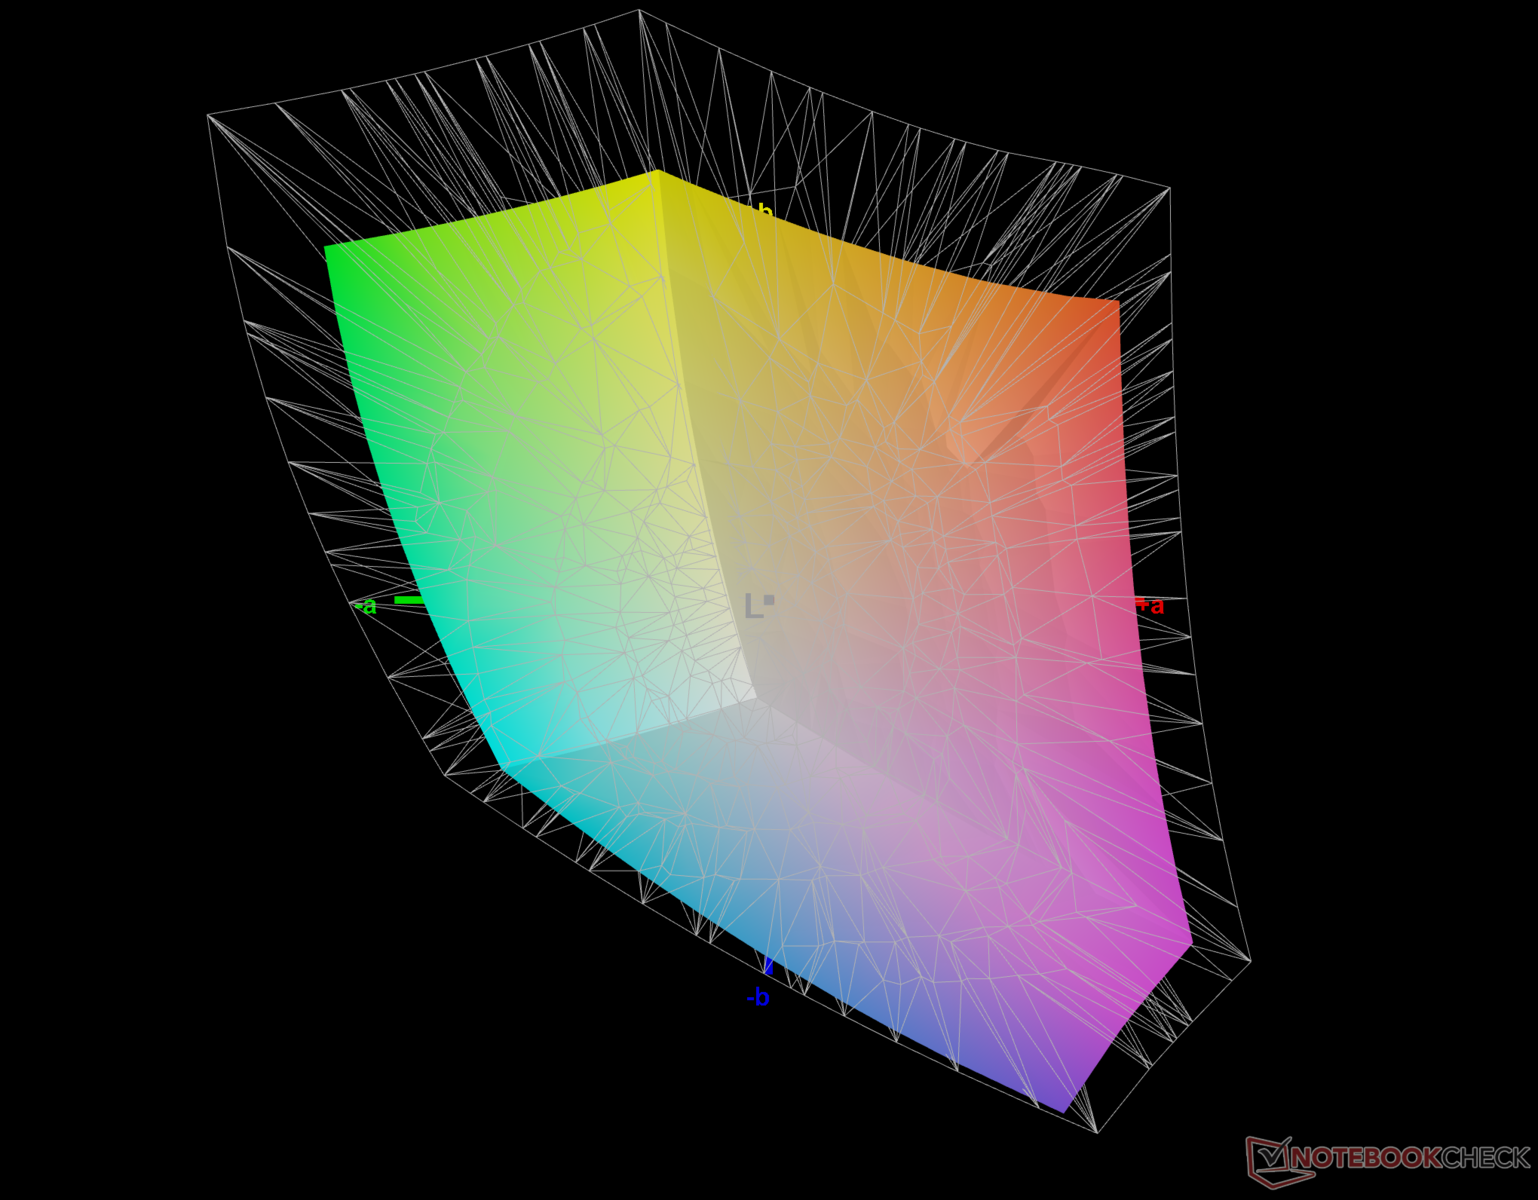
73% AdobeRGB 1998 (Argyll 3D)
98.9% sRGB (Argyll 3D)
70.8% Display P3 (Argyll 3D)
Gamma: 2.13
CCT: 7060 K
| MSI Titan GT77 12UHS Sharp SHP1544 LQ173M1JW08, IPS-Level, 1920x1080, 17.3" | MSI Titan GT77 12UHS AU Optronics B173ZAN06.1, IPS, 3840x2160, 17.3" | Aorus 17X XES Sharp SHP1563, IPS, 1920x1080, 17.3" | MSI Raider GE77 HX 12UHS AU Optronics B173ZAN06.1, IPS, 3840x2160, 17.3" | MSI GE67 HX 12UGS Samsung ATNA562P02-0, OLED, 1920x1080, 15.6" | Asus ROG Zephyrus Duo 16 GX650RX BOE NE160QAM-NX1, IPS-Level, 3840x2400, 16" | Alienware x17 R2 P48E AU Optronics B173HAN, IPS, 1920x1080, 17.3" | MSI GE76 Raider AU Optronics B173HAN05.4 (AUOE295), IPS-Level, 1920x1080, 17.3" | |
|---|---|---|---|---|---|---|---|---|
| Display | 19% | -1% | 18% | -2% | 19% | 7% | -9% | |
| Display P3 Coverage (%) | 70.8 | 97 37% | 70.1 -1% | 96.6 36% | 71.7 1% | 98 38% | 79.2 12% | 63.1 -11% |
| sRGB Coverage (%) | 98.9 | 99.8 1% | 99.9 1% | 99.8 1% | 89.7 -9% | 99.9 1% | 99.8 1% | 94 -5% |
| AdobeRGB 1998 Coverage (%) | 73 | 86.2 18% | 71.9 -2% | 85.8 18% | 75.2 3% | 86.3 18% | 79.6 9% | 65.2 -11% |
| Response Times | -35% | -11% | -49% | 92% | -194% | -192% | -84% | |
| Response Time Grey 50% / Grey 80% * (ms) | 3.03 ? | 5.2 ? -72% | 3.4 ? -12% | 5.8 ? -91% | 0.25 ? 92% | 14.6 ? -382% | 12.4 ? -309% | 5.6 ? -85% |
| Response Time Black / White * (ms) | 5.28 ? | 5.1 ? 3% | 5.8 ? -10% | 5.6 ? -6% | 0.4 ? 92% | 5.6 ? -6% | 9.2 ? -74% | 9.6 ? -82% |
| PWM Frequency (Hz) | 480.4 ? | |||||||
| Screen | 10% | -18% | -1% | -13% | 9% | 11% | 33% | |
| Brightness middle (cd/m²) | 280 | 418 49% | 278 -1% | 381 36% | 356.1 27% | 459 64% | 365.4 31% | 290 4% |
| Brightness (cd/m²) | 275 | 401 46% | 273 -1% | 371 35% | 358 30% | 434 58% | 344 25% | 290 5% |
| Brightness Distribution (%) | 79 | 91 15% | 79 0% | 84 6% | 99 25% | 88 11% | 85 8% | 96 22% |
| Black Level * (cd/m²) | 0.4 | 0.48 -20% | 0.26 35% | 0.52 -30% | 0.44 -10% | 0.29 28% | 0.23 43% | |
| Contrast (:1) | 700 | 871 24% | 1069 53% | 733 5% | 1043 49% | 1260 80% | 1261 80% | |
| Colorchecker dE 2000 * | 2.1 | 2.47 -18% | 3.96 -89% | 4.83 -130% | 2.97 -41% | 3.17 -51% | 1.59 24% | |
| Colorchecker dE 2000 max. * | 5.83 | 7.81 -34% | 10.78 -85% | 7.94 -36% | 8.13 -39% | 7.69 -32% | 3.17 46% | |
| Colorchecker dE 2000 calibrated * | 1.58 | 0.66 58% | 1.07 32% | 2.53 -60% | 1.03 35% | 0.51 68% | 0.87 45% | |
| Greyscale dE 2000 * | 3.3 | 4.4 -33% | 6.8 -106% | 3.1 6% | 4.9 -48% | 5.3 -61% | 2.5 24% | |
| Gamma | 2.13 103% | 2.129 103% | 2.224 99% | 2.2 100% | 2.235 98% | 2.18 101% | 2.253 98% | |
| CCT | 7060 92% | 7197 90% | 7651 85% | 5938 109% | 6775 96% | 5879 111% | 6640 98% | |
| Média Total (Programa/Configurações) | -2% /
5% | -10% /
-13% | -11% /
-5% | 26% /
9% | -55% /
-18% | -58% /
-19% | -20% /
7% |
* ... menor é melhor
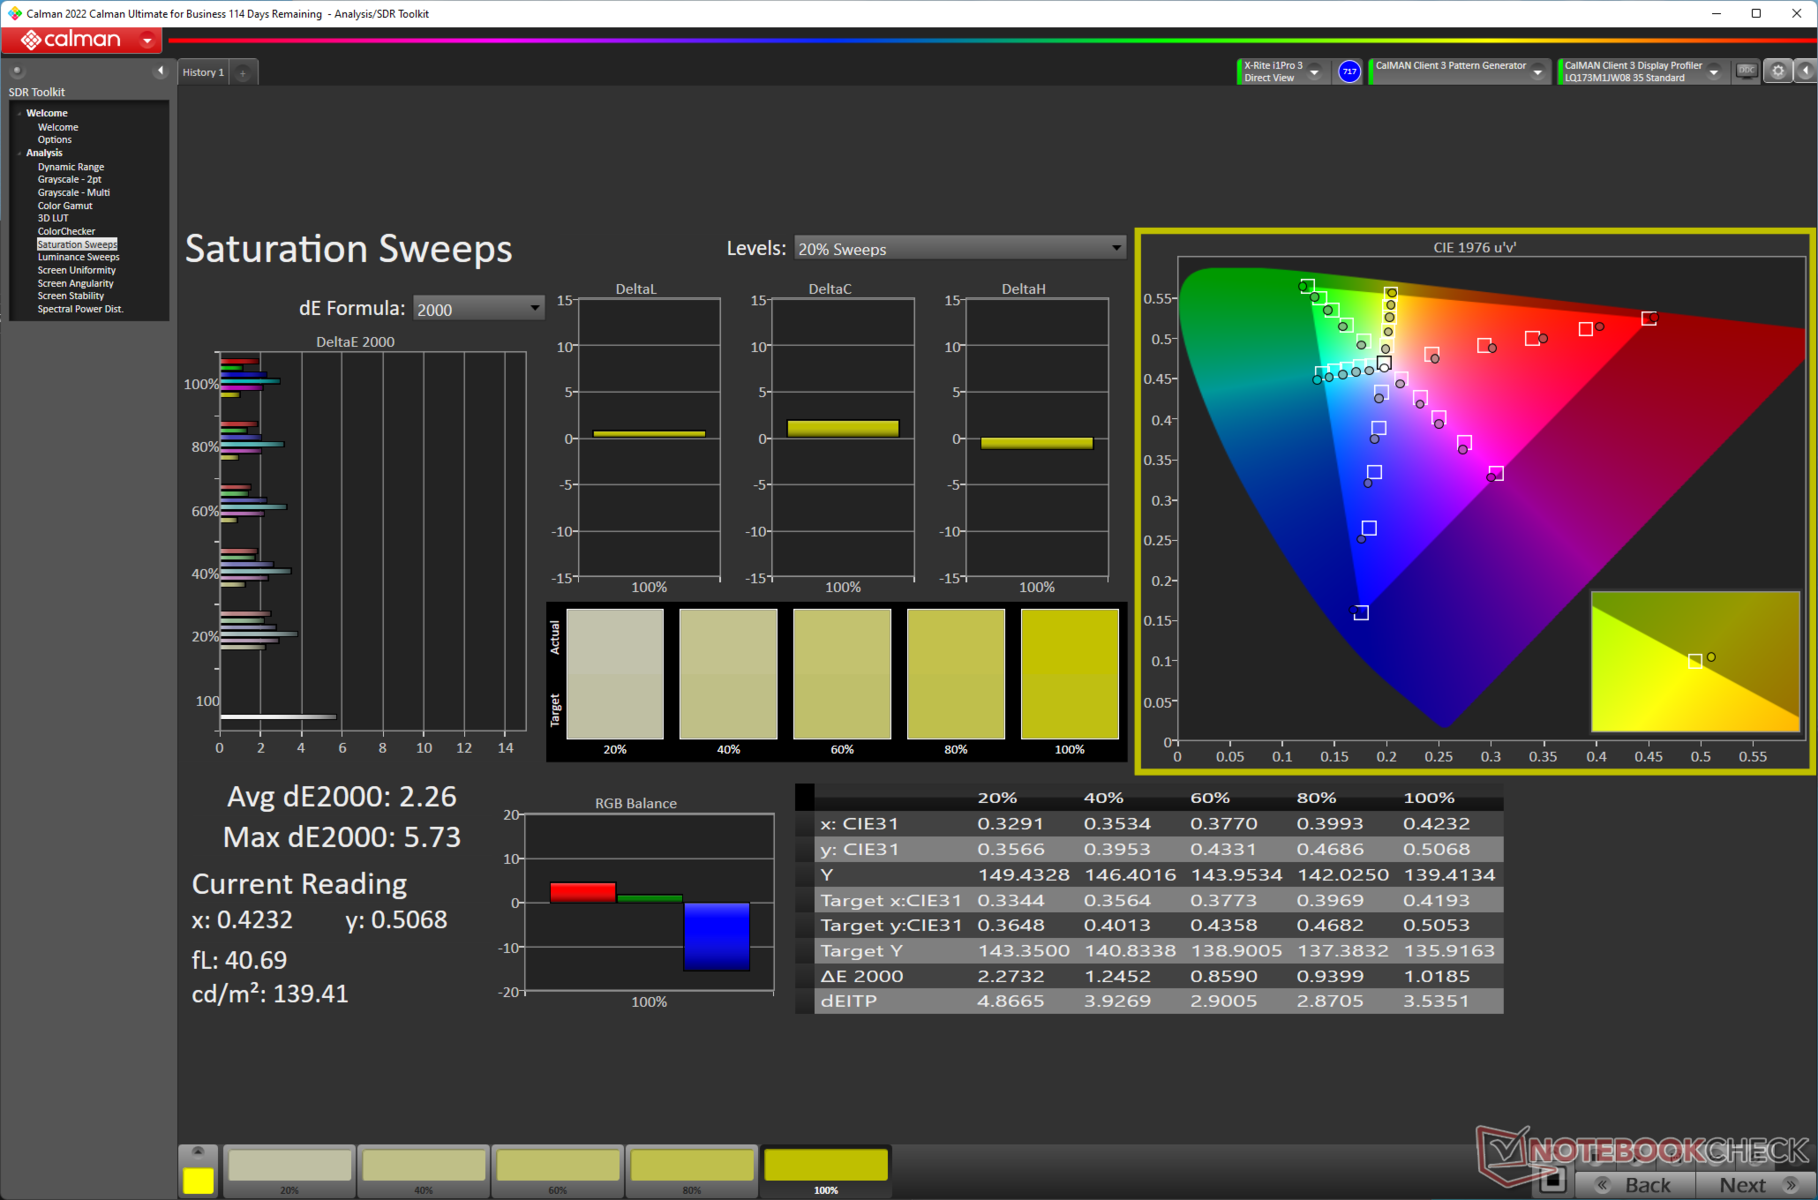
Uma vez que o Titan GT77 é destinado principalmente aos jogadores entusiastas, a cobertura do espaço de cores não provoca realmente nenhuma exuberância. A cobertura gama sRGB de 98,9% é boa e 73% do AdobeRGB ainda deve ser um bom presságio para a criação de conteúdo não-profissional. A SKU com um painel UHD oferece coberturas AdobeRGB e Display P3 muito melhoradas.
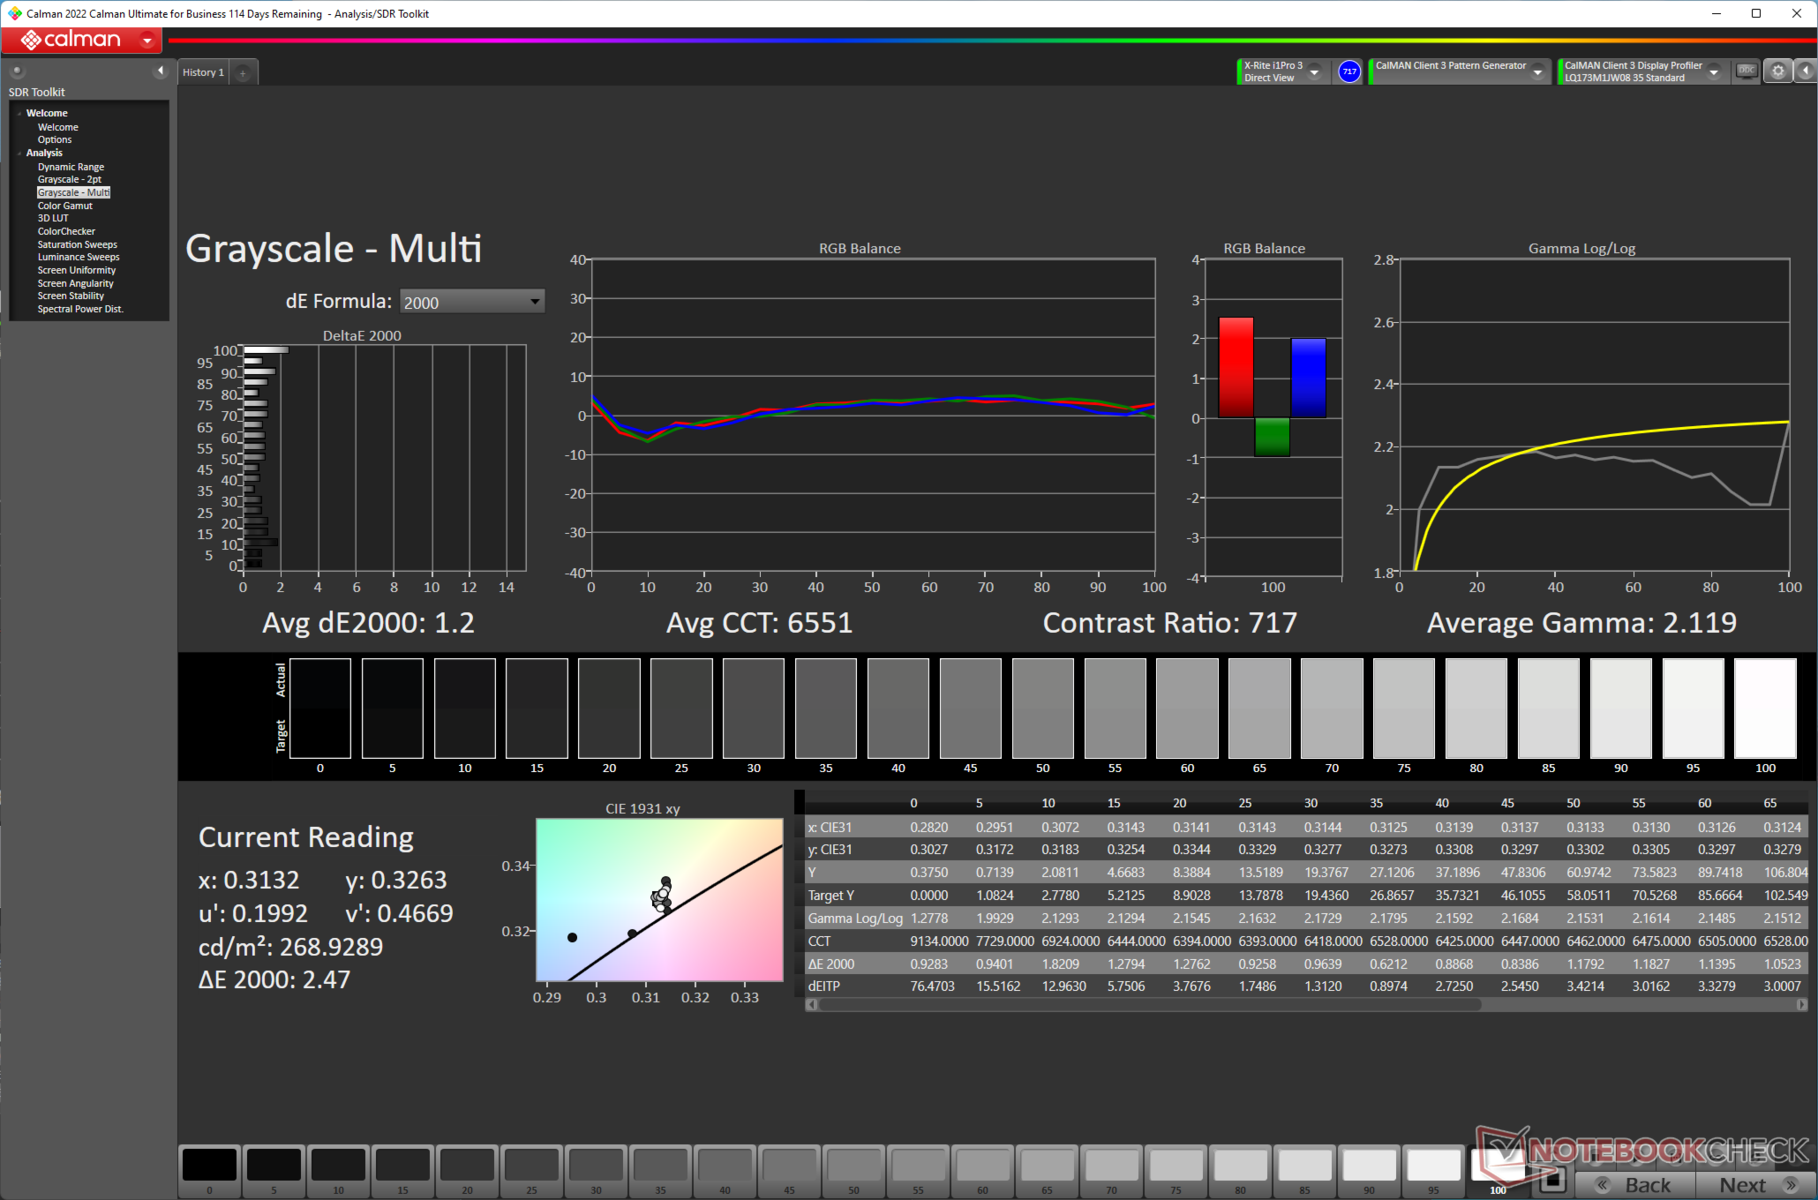
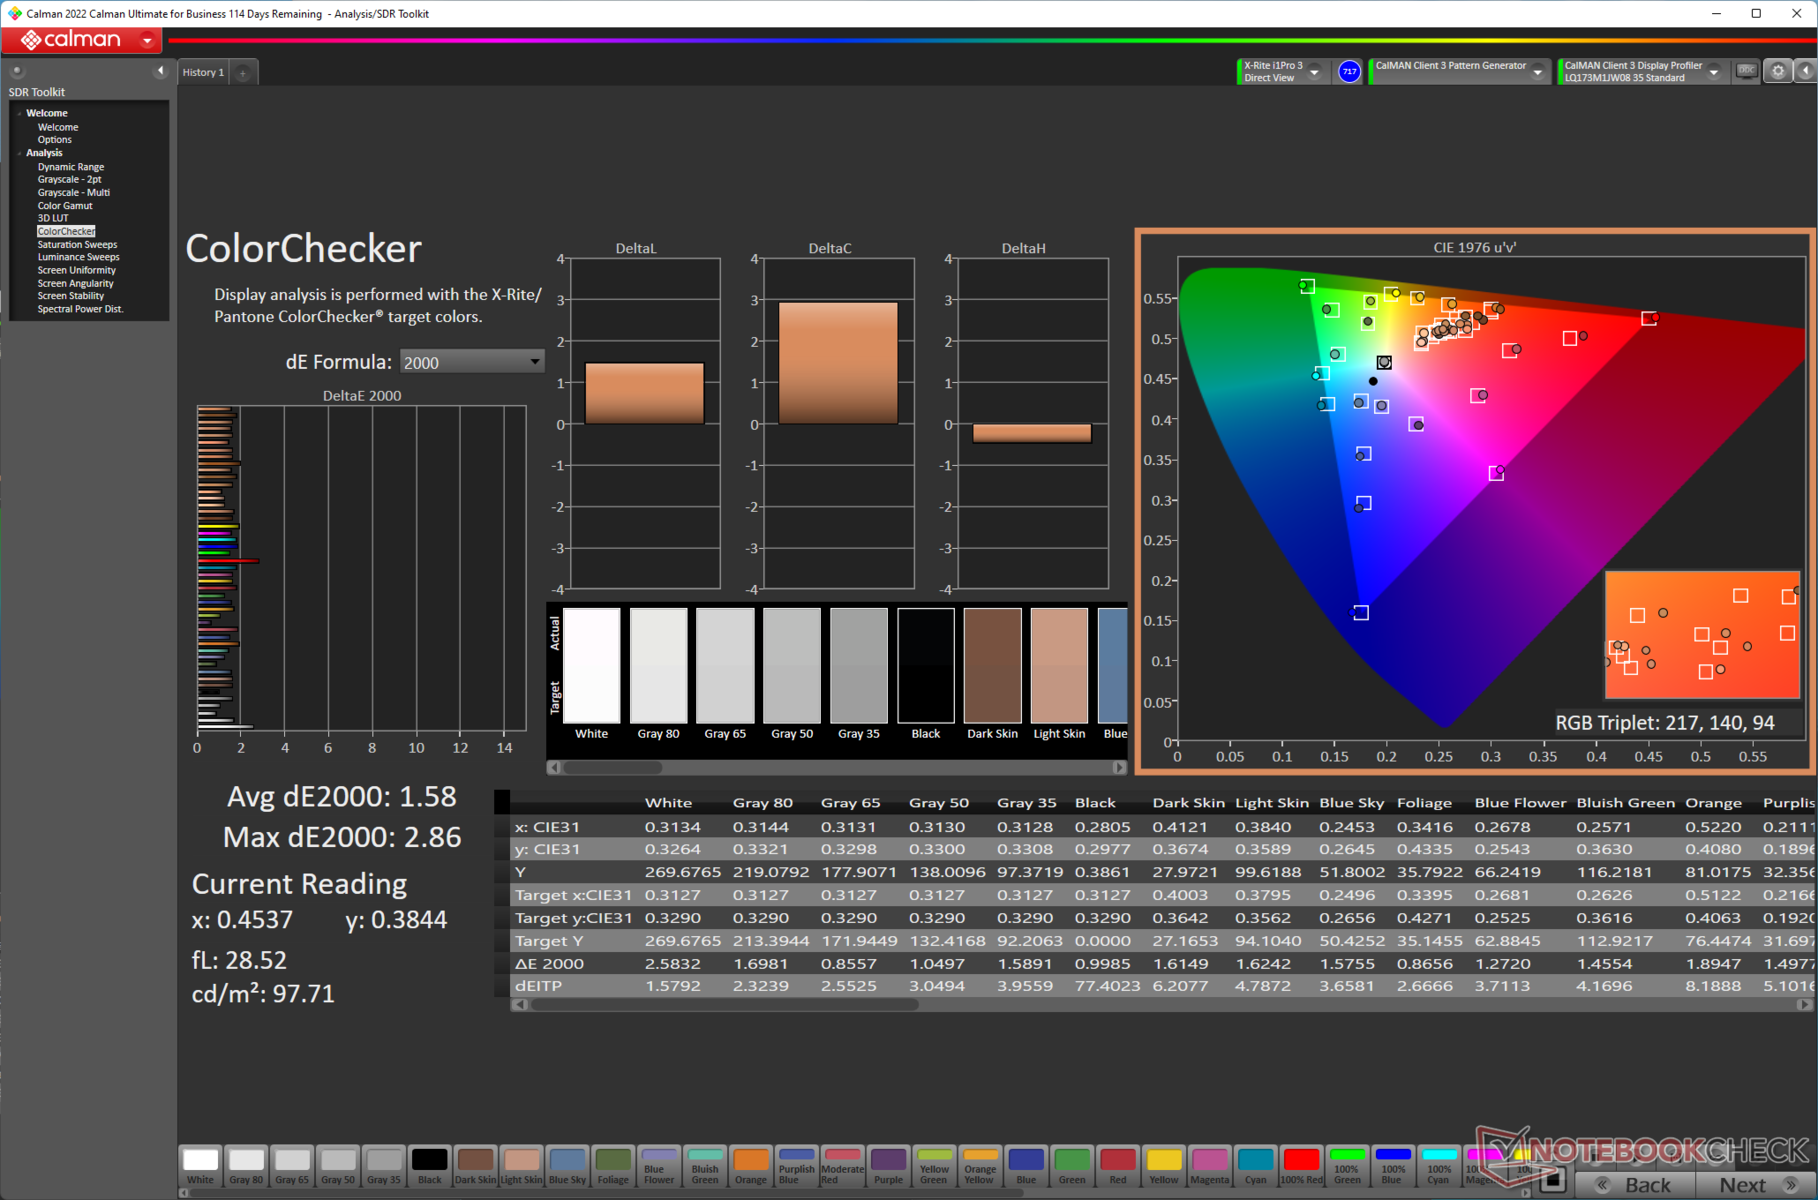
A precisão das cores não é muito má, com um Delta E de escala de cinza médio de 3,3 e um Delta E ColorChecker médio de 2,1. Poderíamos apertar ainda mais o Delta E médio em escala de cinza até 1,2 e o ColorChecker Delta E médio até 1,58 com nossa rotina padronizada de calibração de cores usando o espectrofotômetro X-rite i1Basic Pro 3 e o software de calibração Calman da Portrait Displays.
Nosso arquivo ICC calibrado pode ser baixado a partir do link acima.

O painel Sharp SHP1544 do Titan GT77 oferece tempos de resposta muito bons. Obviamente não pode igualar os tempos de resposta ultra-baixas oferecidos pelo Raider GE67 HX 12UGS's painel OLED da Samsung, mas está no mesmo nível da concorrência.
Exibir tempos de resposta
| ↔ Tempo de resposta preto para branco | ||
|---|---|---|
| 5.28 ms ... ascensão ↗ e queda ↘ combinadas | ↗ 2.32 ms ascensão | 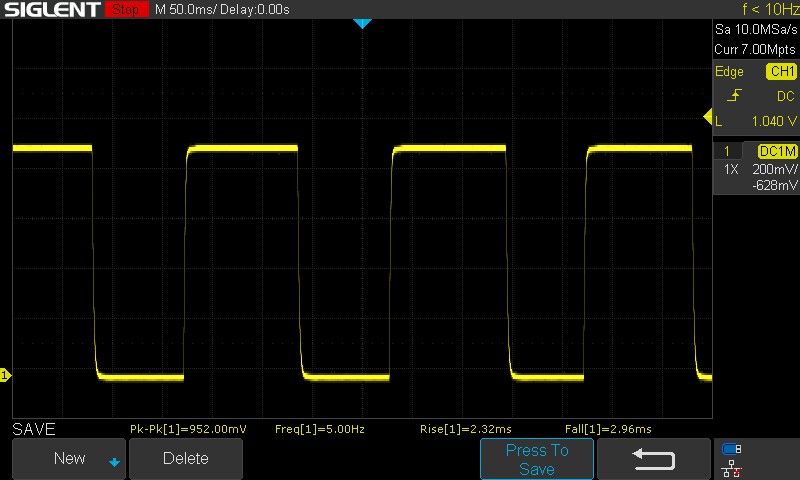 |
| ↘ 2.96 ms queda | ||
| A tela mostra taxas de resposta muito rápidas em nossos testes e deve ser muito adequada para jogos em ritmo acelerado. Em comparação, todos os dispositivos testados variam de 0.1 (mínimo) a 240 (máximo) ms. » 18 % de todos os dispositivos são melhores. Isso significa que o tempo de resposta medido é melhor que a média de todos os dispositivos testados (19.8 ms). | ||
| ↔ Tempo de resposta 50% cinza a 80% cinza | ||
| 3.03 ms ... ascensão ↗ e queda ↘ combinadas | ↗ 1.28 ms ascensão | 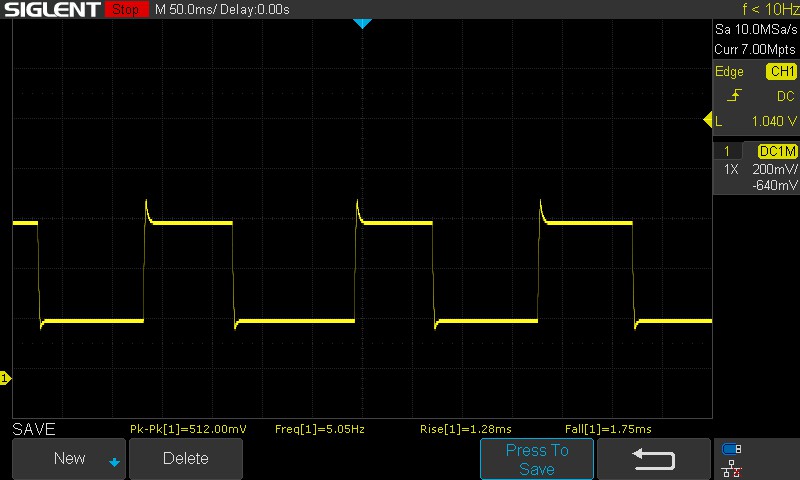 |
| ↘ 1.75 ms queda | ||
| A tela mostra taxas de resposta muito rápidas em nossos testes e deve ser muito adequada para jogos em ritmo acelerado. Em comparação, todos os dispositivos testados variam de 0.165 (mínimo) a 636 (máximo) ms. » 13 % de todos os dispositivos são melhores. Isso significa que o tempo de resposta medido é melhor que a média de todos os dispositivos testados (30.9 ms). | ||
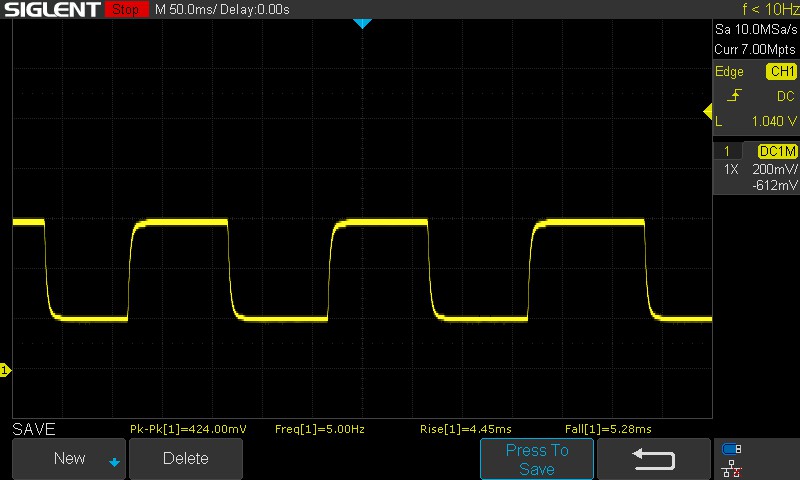
Observamos uma combinação de 5,28 ms enquanto passamos de 100% preto para 100% branco. O painel usa overdrive por padrão, como é evidente pela "buzina" no padrão do osciloscópio. Isto resulta em um tempo de resposta rápido de 3,03 ms 50% cinza a 80% cinza
Observamos que este valor pode subir até 9,73 ms com o overdrive desligado.
Cintilação da tela / PWM (modulação por largura de pulso)
| Tela tremeluzindo / PWM não detectado | ≤ 100 % configuração de brilho | 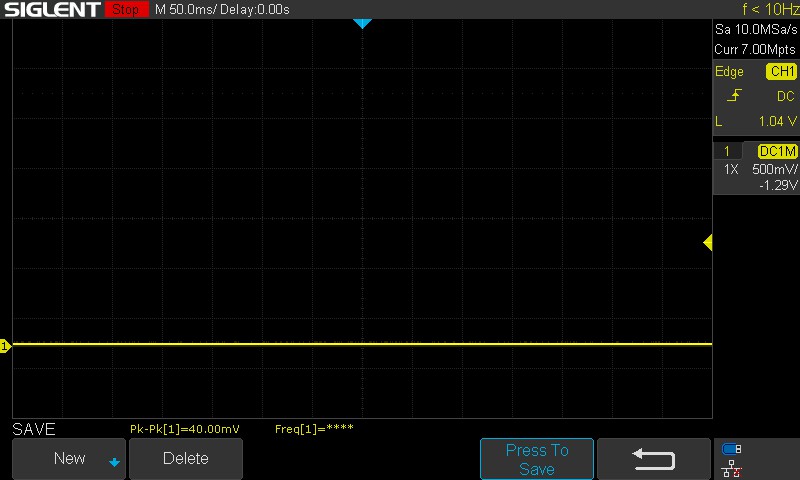 | |
[pwm_comparison] Em comparação: 52 % de todos os dispositivos testados não usam PWM para escurecer a tela. Se PWM foi detectado, uma média de 7741 (mínimo: 5 - máximo: 343500) Hz foi medida. | |||
Não observamos nenhuma cintilação de PWM em todos os níveis de brilho testados, portanto, essas longas maratonas de jogo não devem causar muita tensão ocular.
Para mais informações, consulte o nosso artigo "Por que a Modulação da Largura de Pulso (PWM) é uma dor de cabeça tão grande?", e confira também nossoTabela de classificação da PWMpara comparação de freqüência PWM em todos os dispositivos revisados.
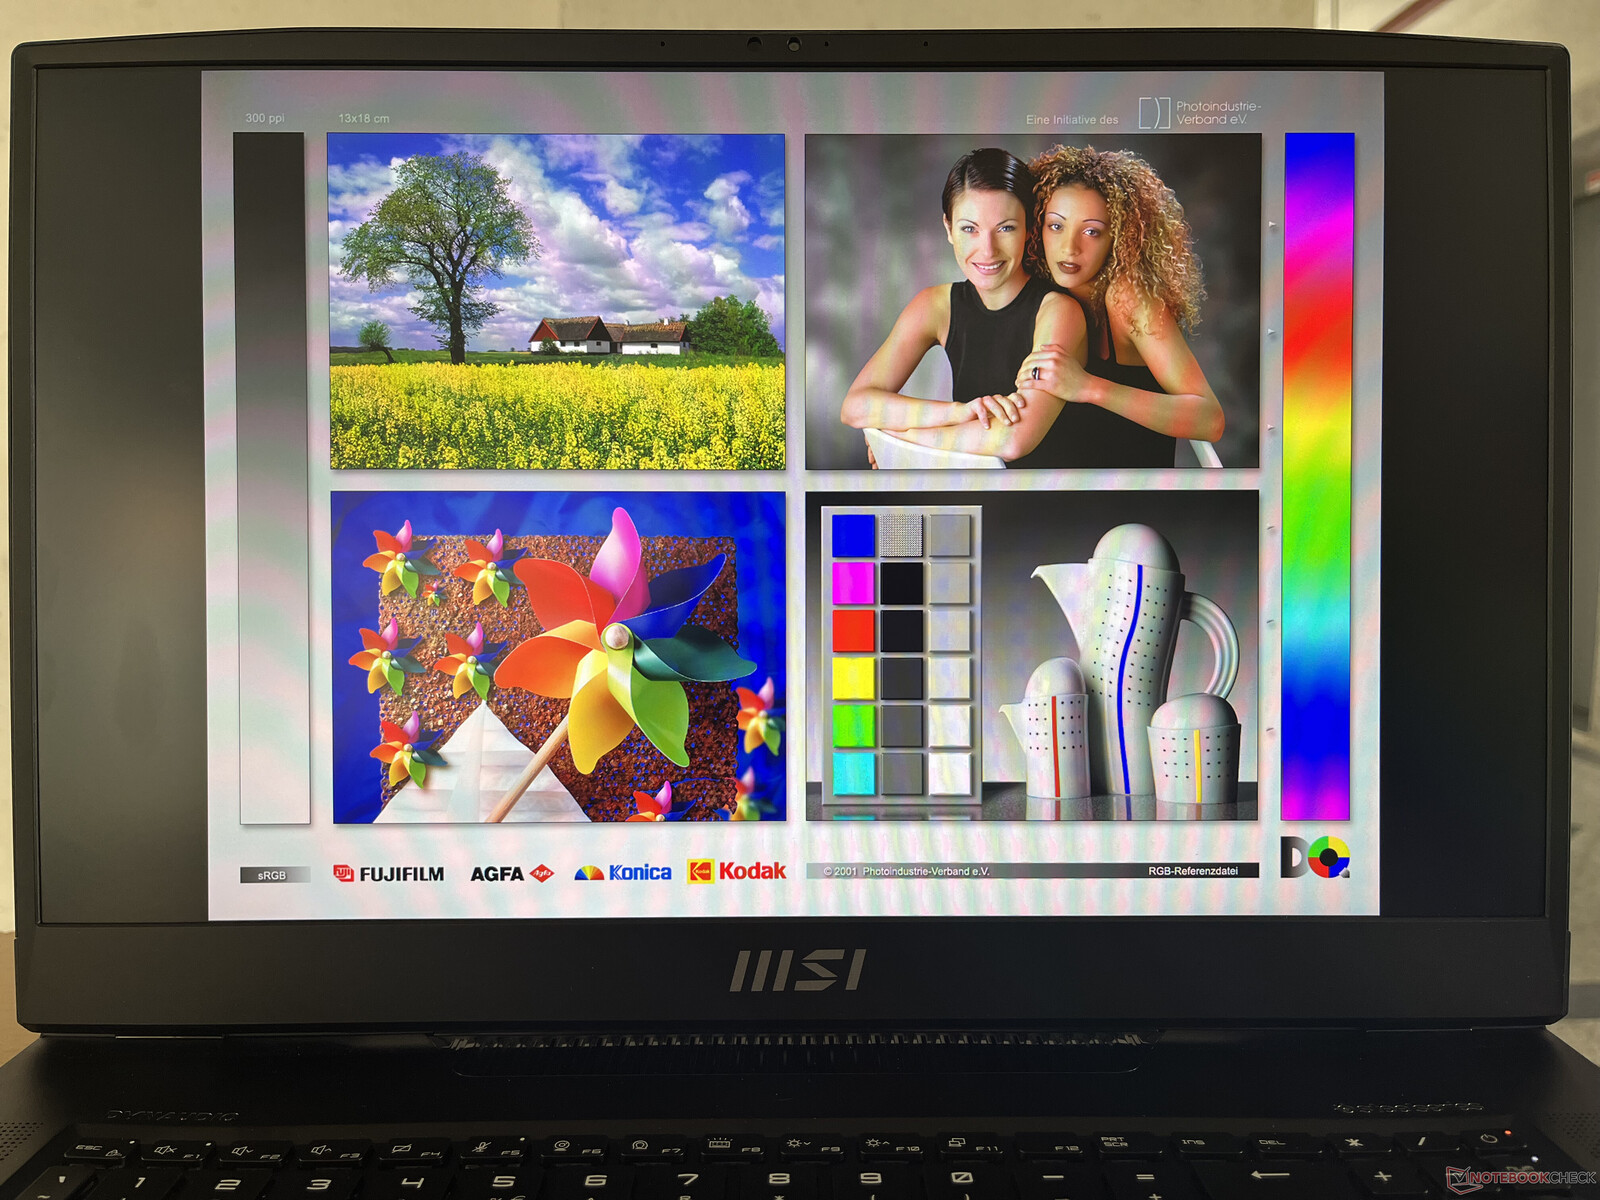
A visualização ao ar livre é administrável desde que não haja muita luz solar caindo diretamente sobre a tela. Observamos perda de brilho e de informações de cor em ângulos extremos de visualização.

Desempenho: Combinação de i9-12900HX e RTX 3080 Ti
Nossa unidade de teste Titan GT77 12UHS é alimentada pelo Intel Core i9-12900HX e um processador de 175 w Nvidia GeForce RTX 3080 Ti GPU Portátil. Há também um Titan GT77 12UGS SKU alimentado pelo Core i9-12900HX mas com uma potência de 150 W GPU para notebook RTX 3070 Ti. A MSI também está oferecendo um Titan GT77 alimentado pelo Núcleo i7-12800HX e a GPU para notebook RTX 3070 Ti.
Condições de teste
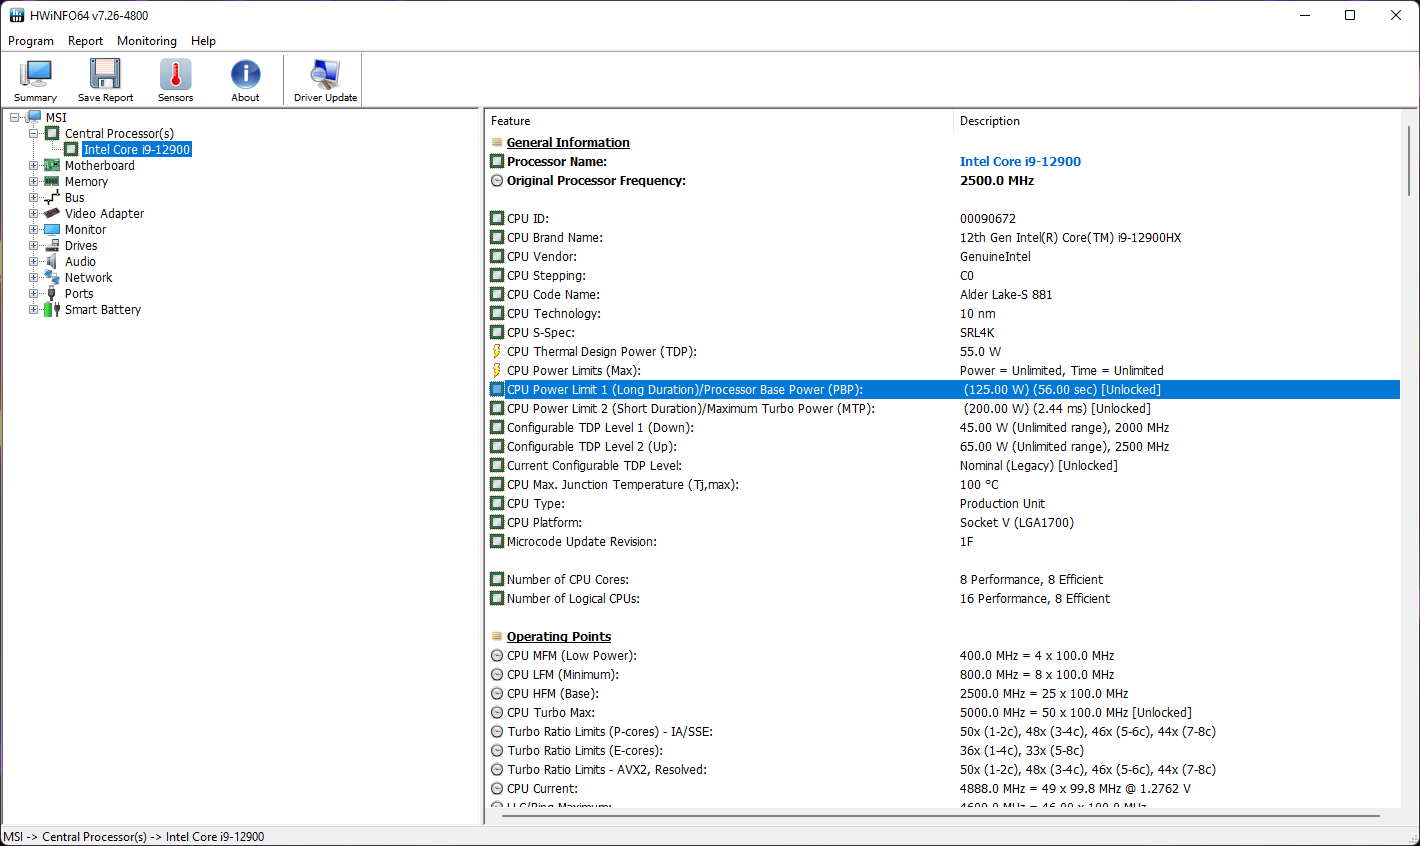
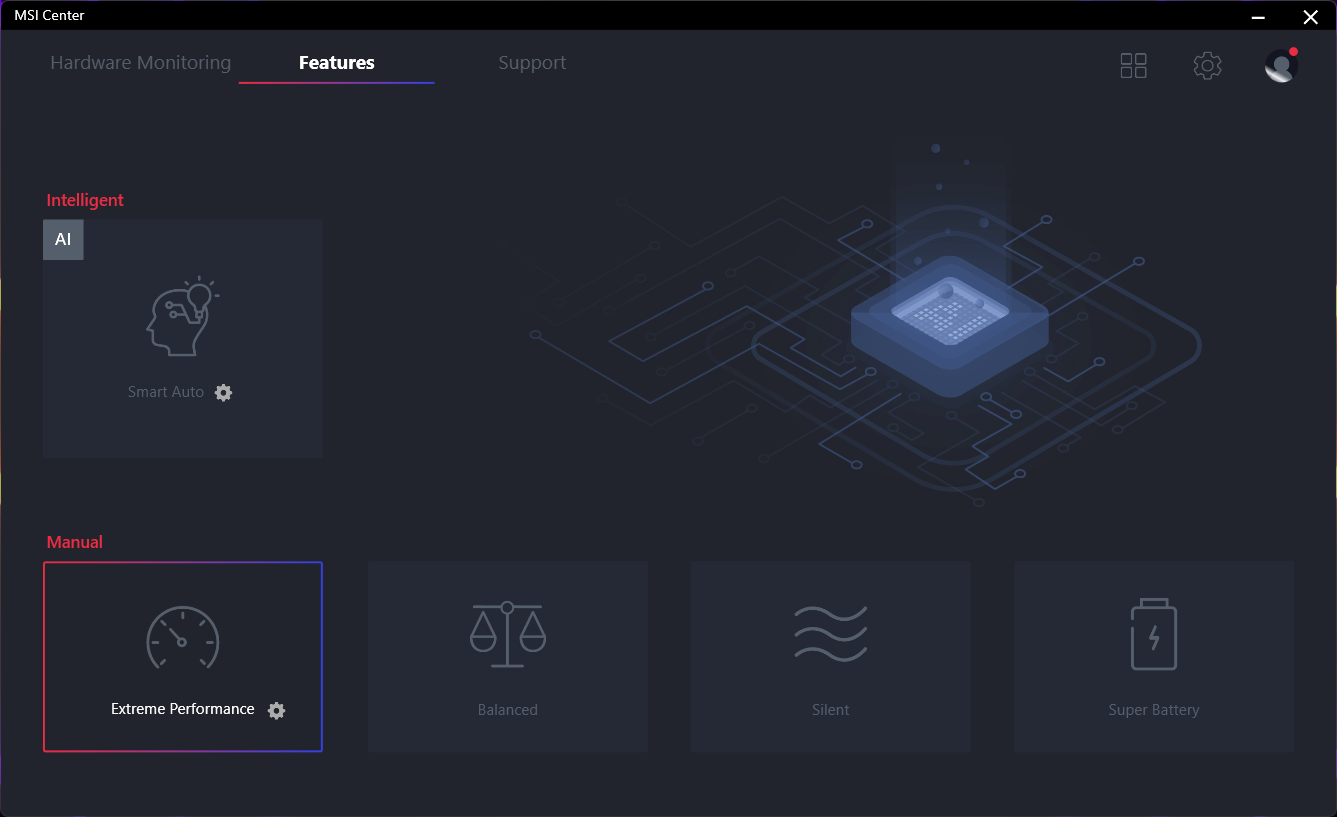
Como é padrão para laptops MSI, o aplicativo MSI Center é o local ideal para todos os tipos de ajustes de desempenho. Dada a natureza da besta, optamos pelo perfil de desempenho extremo que permite que o Core i9-12900HX funcione com um PL1 (potência base do processador) de 125 W e um PL2 (potência turbo máxima) de 200 W
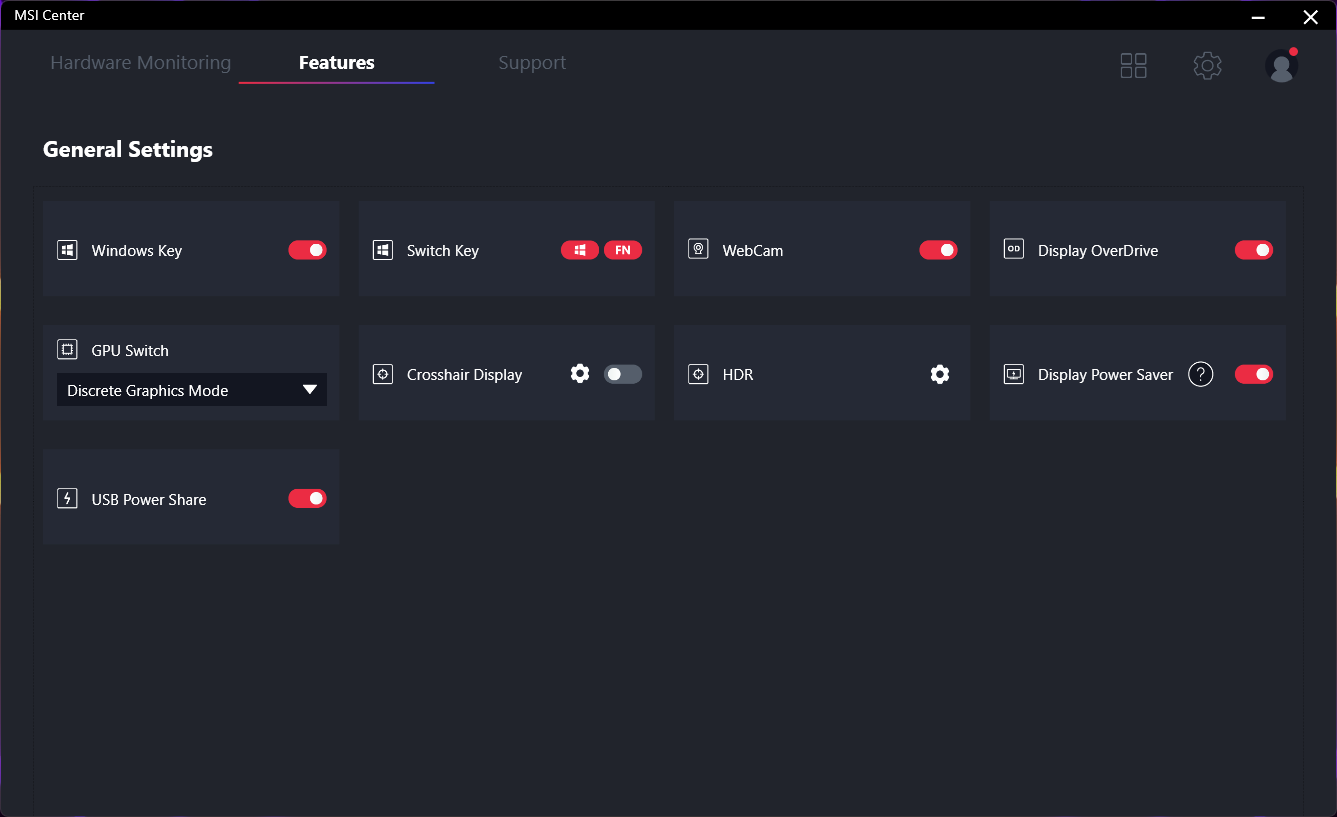
O MSI Center permite a comutação do MUX entre os modos MSHybrid e GPU discreto. Nós escolhemos a opção GPU discreta para permitir que o RTX 3080 Ti possa flexionar totalmente seus músculos. Não há nenhum Optimus Avançado disponível, então você terá que reiniciar o laptop cada vez que o MUX for trocado manualmente.
A escolha dos modos de desempenho tem um impacto significativo nos níveis de ruído, como veremos em breve.
A tabela abaixo ilustra como o PL1 (potência base do processador) e o PL2 (potência turbo máxima) variam em diferentes modos de desempenho. Os modos de desempenho equilibrado e extremo são semelhantes na maioria das vezes, embora este último permita um PL1 mais alto.
Embora o perfil Equilibrado deva ser suficiente para a maioria das tarefas, incluindo jogos, recomendamos optar pelo modo de Desempenho Extremo para extrair o máximo suco possível do processador.
| Performance Mode | PL1 (PBP) / Tau | PL2 (MTP) / Tau |
|---|---|---|
| Silencioso | 30 W / 56 s | 30 W / 2,44 ms |
| Equilibrado | 100 W / 56 s | 200 W / 2,44 ms |
| Desempenho Extremo | 125 W / 56 s | 200 W / 2,44 ms |
Processador
O Core i9-12900HX é um núcleo de 16 núcleos com 24 fios Alder Lake-HX parte com núcleos 8P e núcleos 8E. O Alder Lake-HX é essencialmente uma versão móvel do Alder Lake-S de mesa em um soquete BGA. Esta é também a primeira plataforma móvel a oferecer suporte PCIe Gen5
O Core i9-12900HX vem desbloqueado e você pode realmente entrar nos controles BIOS ocultos da MSI (pressione Right Shift + Right Ctrl + Left Alt + F2) para sub ou overclock da CPU. Entretanto, os ajustes de potência em estoque já maximizam a altura térmica disponível, como evidenciado pelos testes de estresse abaixo
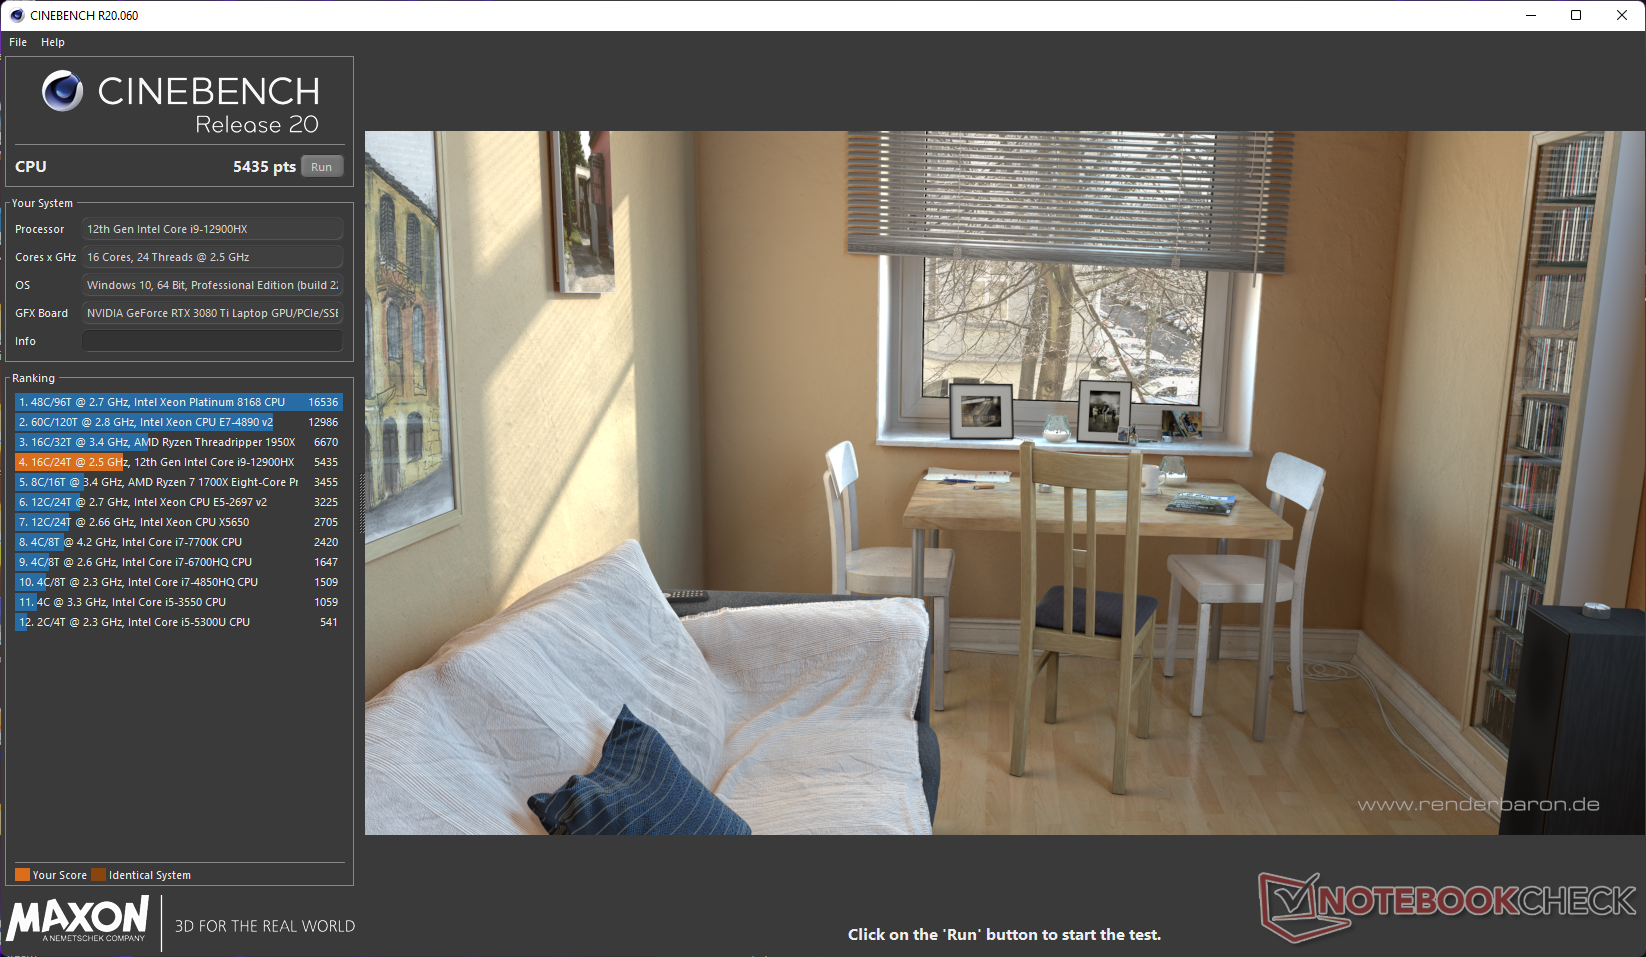
Em termos de desempenho geral da CPU, o Titan GT77 encabeça o gráfico correspondendo apenas ao Raider GE77 HX 12 UHS. Verificamos que o Core i9-12900HX não está muito atrás do desktop médio Core i9-12900K na maioria dos testes de CPU
.O Cooler Boost Titan da MSI é capaz de garantir que o Core i9-12900HX não estrangule sob carga, como evidenciado pelo desempenho consistente no teste de loop multi-core Cinebench R15.
Cinebench R15 Multi Loop
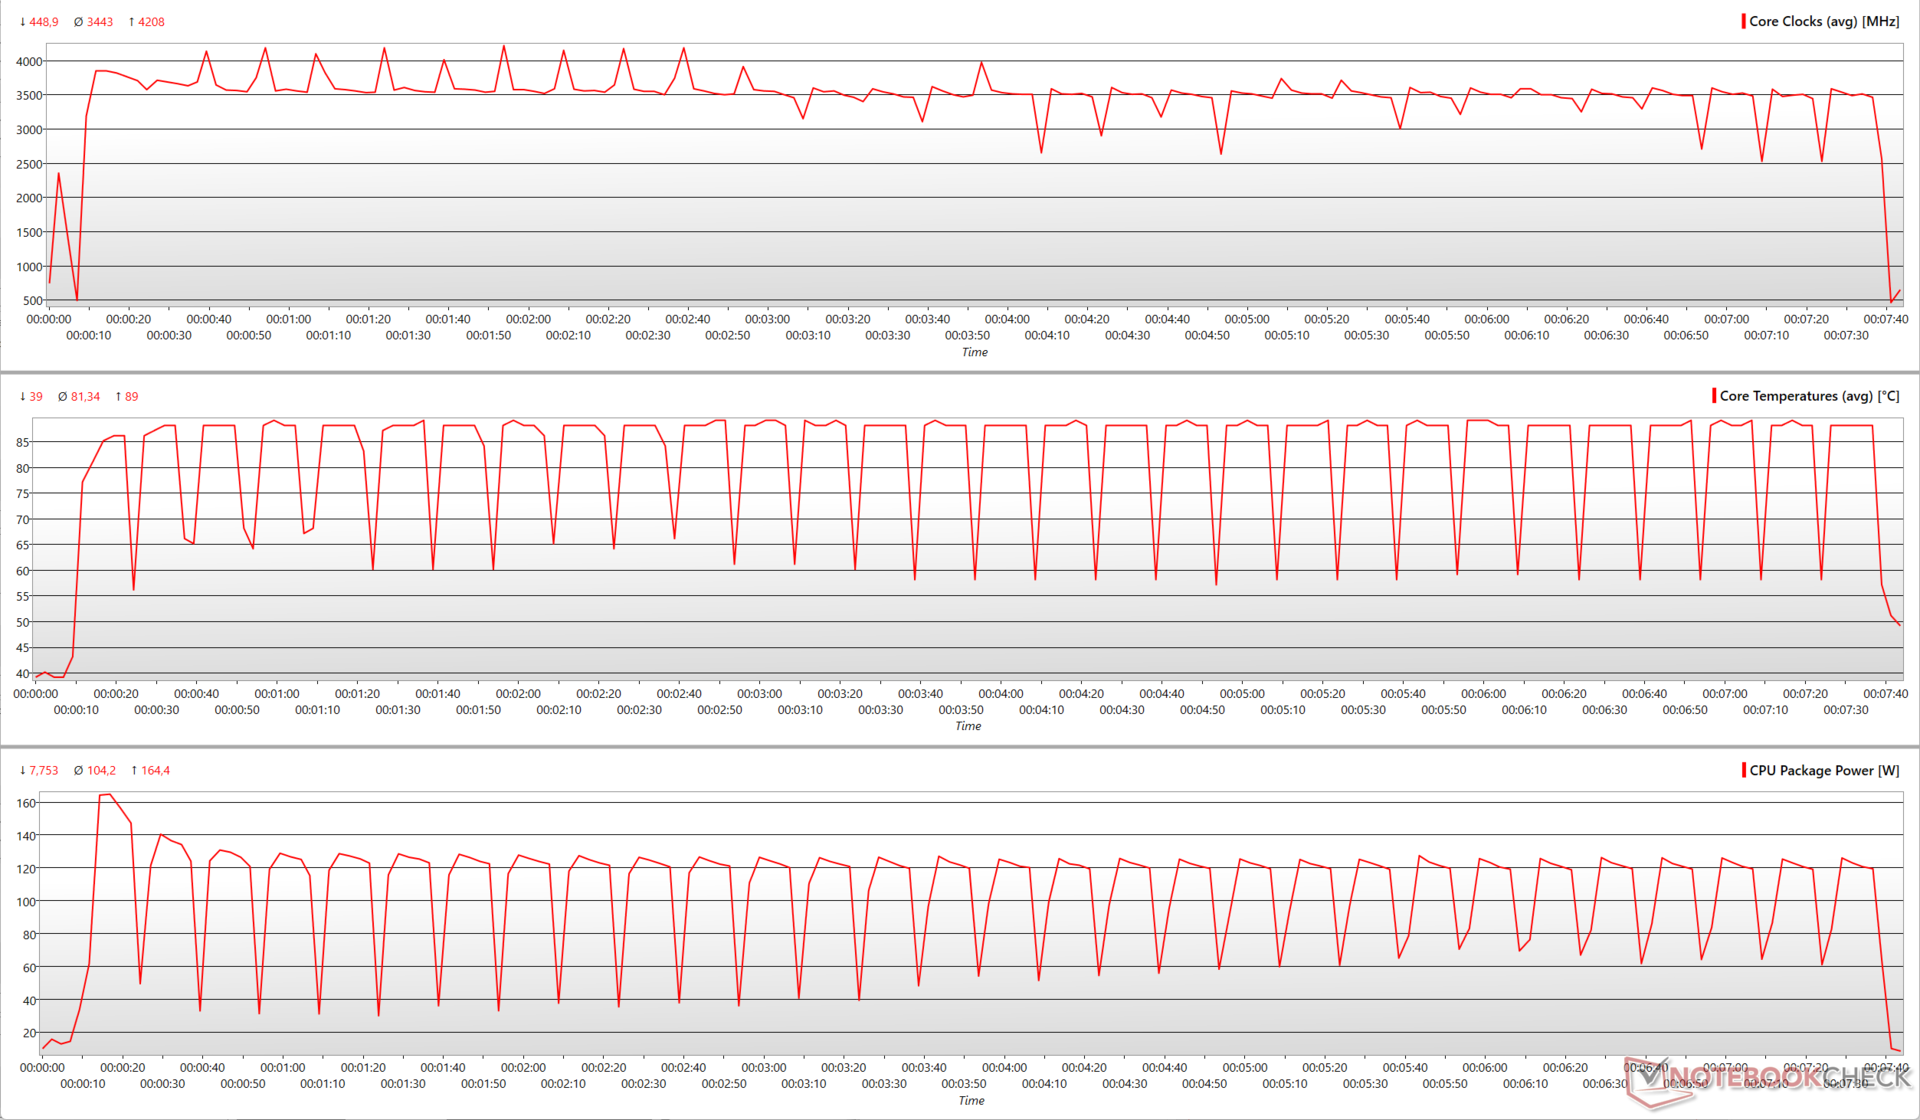
O gráfico a seguir ilustra como os parâmetros importantes da CPU variam durante um teste de loop multi-core Cinebench R15. Embora o Core i9-12900HX do Titan GT77 esteja configurado para operar a até 200 W PL2, descobrimos que o valor de pico é de cerca de 165 W. Os núcleos P podem impulsionar até 4,8 GHz enquanto os núcleos E operam na marca de 3,5 GHz.
Notamos um bug no aplicativo MSI Center que sempre reverte o perfil para Desempenho Extremo sempre que um benchmark vinculado à CPU, como o Cinebench, é lançado. Isto limitou nossa capacidade de executar o mesmo loop em outros perfis de desempenho, tais como Balanced, Silent, ou Super Battery. Esperamos que a MSI possa corrigir isso em uma futura atualização de software.
O Core i9-12900HX no Aorus 17X XES se associa ao do Titan GT77 em testes de um só núcleo, mas fica atrás em testes de vários núcleos. Isto é provavelmente devido aos limites de potência mais baixos no notebook Aorus. O Core i7-12800HX no Raider GE67 HX 12UGS está bem nos saltos do Core i9-12900HX com apenas deltas de desempenho percentual de um dígito na maioria dos testes de CPU.
O Core i7-12800HX, com o SKU Titan GT77, pode, portanto, ser um investimento sábio se você estiver procurando economizar algum dinheiro com um sacrifício insignificante de desempenho.
O desempenho multi-core cai cerca de 37,2% na bateria.
Cinebench R23: Multi Core | Single Core
Cinebench R20: CPU (Multi Core) | CPU (Single Core)
Cinebench R15: CPU Multi 64Bit | CPU Single 64Bit
Blender: v2.79 BMW27 CPU
7-Zip 18.03: 7z b 4 | 7z b 4 -mmt1
Geekbench 5.5: Multi-Core | Single-Core
HWBOT x265 Benchmark v2.2: 4k Preset
LibreOffice : 20 Documents To PDF
R Benchmark 2.5: Overall mean
| CPU Performance rating | |
| Média Intel Core i9-12900K | |
| Média da turma Gaming | |
| MSI Titan GT77 12UHS | |
| MSI Raider GE77 HX 12UHS | |
| Média Intel Core i9-12900HX | |
| MSI GE67 HX 12UGS | |
| Aorus 17X XES | |
| MSI GE76 Raider | |
| Alienware x17 R2 P48E | |
| Gigabyte Aero 16 YE5 | |
| Asus ROG Zephyrus Duo 16 GX650RX | |
| Cinebench R23 / Multi Core | |
| Média da turma Gaming (10488 - 42661, n=104, últimos 2 anos) | |
| Média Intel Core i9-12900K (25245 - 27005, n=2) | |
| MSI Raider GE77 HX 12UHS | |
| MSI Titan GT77 12UHS | |
| Média Intel Core i9-12900HX (18337 - 23482, n=8) | |
| MSI GE67 HX 12UGS | |
| Alienware x17 R2 P48E | |
| Aorus 17X XES | |
| MSI GE76 Raider | |
| Gigabyte Aero 16 YE5 | |
| Asus ROG Zephyrus Duo 16 GX650RX | |
| Cinebench R23 / Single Core | |
| Média da turma Gaming (1601 - 2415, n=104, últimos 2 anos) | |
| Média Intel Core i9-12900K (1998 - 2011, n=2) | |
| Gigabyte Aero 16 YE5 | |
| Aorus 17X XES | |
| Média Intel Core i9-12900HX (1897 - 1936, n=8) | |
| MSI Titan GT77 12UHS | |
| MSI GE76 Raider | |
| MSI Raider GE77 HX 12UHS | |
| Alienware x17 R2 P48E | |
| MSI GE67 HX 12UGS | |
| Asus ROG Zephyrus Duo 16 GX650RX | |
| Cinebench R20 / CPU (Multi Core) | |
| Média da turma Gaming (4029 - 16433, n=103, últimos 2 anos) | |
| Média Intel Core i9-12900K (9630 - 10240, n=2) | |
| MSI Raider GE77 HX 12UHS | |
| MSI Titan GT77 12UHS | |
| Média Intel Core i9-12900HX (7037 - 9042, n=8) | |
| MSI GE67 HX 12UGS | |
| Alienware x17 R2 P48E | |
| Aorus 17X XES | |
| Gigabyte Aero 16 YE5 | |
| MSI GE76 Raider | |
| Asus ROG Zephyrus Duo 16 GX650RX | |
| Cinebench R20 / CPU (Single Core) | |
| Média da turma Gaming (622 - 913, n=103, últimos 2 anos) | |
| Média Intel Core i9-12900K (766 - 777, n=2) | |
| MSI Raider GE77 HX 12UHS | |
| Aorus 17X XES | |
| MSI Titan GT77 12UHS | |
| Média Intel Core i9-12900HX (728 - 745, n=8) | |
| MSI GE76 Raider | |
| Alienware x17 R2 P48E | |
| Gigabyte Aero 16 YE5 | |
| MSI GE67 HX 12UGS | |
| Asus ROG Zephyrus Duo 16 GX650RX | |
| Cinebench R15 / CPU Multi 64Bit | |
| Média da turma Gaming (1578 - 6330, n=102, últimos 2 anos) | |
| Média Intel Core i9-12900K (3473 - 4102, n=3) | |
| MSI Titan GT77 12UHS | |
| MSI Raider GE77 HX 12UHS | |
| Média Intel Core i9-12900HX (2830 - 3652, n=8) | |
| MSI GE67 HX 12UGS | |
| Alienware x17 R2 P48E | |
| MSI GE76 Raider | |
| Aorus 17X XES | |
| Gigabyte Aero 16 YE5 | |
| Asus ROG Zephyrus Duo 16 GX650RX | |
| Cinebench R15 / CPU Single 64Bit | |
| Média da turma Gaming (188.8 - 350, n=103, últimos 2 anos) | |
| Média Intel Core i9-12900K (286 - 292, n=3) | |
| MSI Raider GE77 HX 12UHS | |
| Gigabyte Aero 16 YE5 | |
| MSI Titan GT77 12UHS | |
| Média Intel Core i9-12900HX (274 - 282, n=8) | |
| Aorus 17X XES | |
| MSI GE76 Raider | |
| Alienware x17 R2 P48E | |
| MSI GE67 HX 12UGS | |
| Asus ROG Zephyrus Duo 16 GX650RX | |
| Blender / v2.79 BMW27 CPU | |
| Asus ROG Zephyrus Duo 16 GX650RX | |
| Aorus 17X XES | |
| Gigabyte Aero 16 YE5 | |
| MSI GE76 Raider | |
| Alienware x17 R2 P48E | |
| Média Intel Core i9-12900HX (144 - 201, n=8) | |
| MSI GE67 HX 12UGS | |
| MSI Raider GE77 HX 12UHS | |
| Média da turma Gaming (79 - 330, n=101, últimos 2 anos) | |
| MSI Titan GT77 12UHS | |
| Média Intel Core i9-12900K (121.1 - 128.3, n=2) | |
| 7-Zip 18.03 / 7z b 4 | |
| Média Intel Core i9-12900K (96960 - 97671, n=2) | |
| Média da turma Gaming (33491 - 148086, n=102, últimos 2 anos) | |
| MSI Raider GE77 HX 12UHS | |
| MSI Titan GT77 12UHS | |
| Média Intel Core i9-12900HX (69778 - 88128, n=7) | |
| MSI GE67 HX 12UGS | |
| MSI GE76 Raider | |
| Aorus 17X XES | |
| Alienware x17 R2 P48E | |
| Gigabyte Aero 16 YE5 | |
| Asus ROG Zephyrus Duo 16 GX650RX | |
| 7-Zip 18.03 / 7z b 4 -mmt1 | |
| Média Intel Core i9-12900K (6571 - 6580, n=2) | |
| Média da turma Gaming (4824 - 7436, n=102, últimos 2 anos) | |
| MSI Raider GE77 HX 12UHS | |
| Aorus 17X XES | |
| Média Intel Core i9-12900HX (6165 - 6358, n=7) | |
| MSI Titan GT77 12UHS | |
| Gigabyte Aero 16 YE5 | |
| MSI GE76 Raider | |
| Alienware x17 R2 P48E | |
| Asus ROG Zephyrus Duo 16 GX650RX | |
| MSI GE67 HX 12UGS | |
| Geekbench 5.5 / Multi-Core | |
| Média Intel Core i9-12900K (17698 - 17854, n=2) | |
| Média da turma Gaming (6460 - 28263, n=102, últimos 2 anos) | |
| MSI Raider GE77 HX 12UHS | |
| MSI Titan GT77 12UHS | |
| Média Intel Core i9-12900HX (15116 - 16925, n=8) | |
| Aorus 17X XES | |
| MSI GE67 HX 12UGS | |
| Gigabyte Aero 16 YE5 | |
| Alienware x17 R2 P48E | |
| MSI GE76 Raider | |
| Asus ROG Zephyrus Duo 16 GX650RX | |
| Geekbench 5.5 / Single-Core | |
| Média da turma Gaming (1403 - 2474, n=102, últimos 2 anos) | |
| Média Intel Core i9-12900K (1969 - 2042, n=2) | |
| MSI Raider GE77 HX 12UHS | |
| MSI Titan GT77 12UHS | |
| MSI GE76 Raider | |
| Média Intel Core i9-12900HX (1874 - 1949, n=8) | |
| Aorus 17X XES | |
| Alienware x17 R2 P48E | |
| Gigabyte Aero 16 YE5 | |
| MSI GE67 HX 12UGS | |
| Asus ROG Zephyrus Duo 16 GX650RX | |
| HWBOT x265 Benchmark v2.2 / 4k Preset | |
| Média Intel Core i9-12900K (29 - 30, n=2) | |
| Média da turma Gaming (11.5 - 44.4, n=102, últimos 2 anos) | |
| MSI Raider GE77 HX 12UHS | |
| MSI Titan GT77 12UHS | |
| Média Intel Core i9-12900HX (19.6 - 26.6, n=7) | |
| MSI GE67 HX 12UGS | |
| Alienware x17 R2 P48E | |
| MSI GE76 Raider | |
| Aorus 17X XES | |
| Gigabyte Aero 16 YE5 | |
| Asus ROG Zephyrus Duo 16 GX650RX | |
| LibreOffice / 20 Documents To PDF | |
| Média da turma Gaming (33.2 - 88.8, n=102, últimos 2 anos) | |
| Asus ROG Zephyrus Duo 16 GX650RX | |
| MSI Raider GE77 HX 12UHS | |
| MSI GE67 HX 12UGS | |
| Alienware x17 R2 P48E | |
| Média Intel Core i9-12900K (38.1 - 40.6, n=2) | |
| Gigabyte Aero 16 YE5 | |
| MSI Titan GT77 12UHS | |
| MSI GE76 Raider | |
| Aorus 17X XES | |
| Média Intel Core i9-12900HX (33.6 - 42.4, n=7) | |
| R Benchmark 2.5 / Overall mean | |
| Asus ROG Zephyrus Duo 16 GX650RX | |
| MSI GE67 HX 12UGS | |
| Alienware x17 R2 P48E | |
| MSI GE76 Raider | |
| MSI Raider GE77 HX 12UHS | |
| Média da turma Gaming (0.3439 - 0.59, n=102, últimos 2 anos) | |
| Média Intel Core i9-12900HX (0.4159 - 0.4242, n=7) | |
| MSI Titan GT77 12UHS | |
| Aorus 17X XES | |
| Gigabyte Aero 16 YE5 | |
| Média Intel Core i9-12900K (0.3946 - 0.4216, n=2) | |
* ... menor é melhor
AIDA64: FP32 Ray-Trace | FPU Julia | CPU SHA3 | CPU Queen | FPU SinJulia | FPU Mandel | CPU AES | CPU ZLib | FP64 Ray-Trace | CPU PhotoWorxx
| Performance rating | |
| Média da turma Gaming | |
| MSI Raider GE77 HX 12UHS | |
| MSI Titan GT77 12UHS | |
| Média Intel Core i9-12900HX | |
| Média Intel Core i9-12900K | |
| Asus ROG Zephyrus Duo 16 GX650RX | |
| Aorus 17X XES | |
| MSI GE67 HX 12UGS | |
| Alienware x17 R2 P48E | |
| MSI GE76 Raider | |
| Gigabyte Aero 16 YE5 | |
| AIDA64 / FP32 Ray-Trace | |
| Média da turma Gaming (10227 - 85542, n=102, últimos 2 anos) | |
| MSI Titan GT77 12UHS | |
| MSI Raider GE77 HX 12UHS | |
| Média Intel Core i9-12900HX (11535 - 22183, n=7) | |
| Asus ROG Zephyrus Duo 16 GX650RX | |
| Aorus 17X XES | |
| Média Intel Core i9-12900K (12739 - 13345, n=3) | |
| MSI GE67 HX 12UGS | |
| Alienware x17 R2 P48E | |
| MSI GE76 Raider | |
| Gigabyte Aero 16 YE5 | |
| AIDA64 / FPU Julia | |
| Média da turma Gaming (51376 - 372155, n=102, últimos 2 anos) | |
| MSI Raider GE77 HX 12UHS | |
| MSI Titan GT77 12UHS | |
| Asus ROG Zephyrus Duo 16 GX650RX | |
| Média Intel Core i9-12900HX (52916 - 110093, n=7) | |
| Aorus 17X XES | |
| Média Intel Core i9-12900K (58406 - 59419, n=3) | |
| MSI GE67 HX 12UGS | |
| Alienware x17 R2 P48E | |
| MSI GE76 Raider | |
| Gigabyte Aero 16 YE5 | |
| AIDA64 / CPU SHA3 | |
| Média da turma Gaming (2180 - 10115, n=102, últimos 2 anos) | |
| MSI Raider GE77 HX 12UHS | |
| Média Intel Core i9-12900K (4796 - 5127, n=3) | |
| MSI Titan GT77 12UHS | |
| Média Intel Core i9-12900HX (3559 - 5123, n=7) | |
| MSI GE67 HX 12UGS | |
| Aorus 17X XES | |
| Asus ROG Zephyrus Duo 16 GX650RX | |
| Alienware x17 R2 P48E | |
| MSI GE76 Raider | |
| Gigabyte Aero 16 YE5 | |
| AIDA64 / CPU Queen | |
| Média da turma Gaming (49785 - 173351, n=86, últimos 2 anos) | |
| Média Intel Core i9-12900K (112066 - 112694, n=3) | |
| Alienware x17 R2 P48E | |
| Gigabyte Aero 16 YE5 | |
| MSI GE76 Raider | |
| Asus ROG Zephyrus Duo 16 GX650RX | |
| Aorus 17X XES | |
| MSI Titan GT77 12UHS | |
| Média Intel Core i9-12900HX (101029 - 104457, n=7) | |
| MSI Raider GE77 HX 12UHS | |
| MSI GE67 HX 12UGS | |
| AIDA64 / FPU SinJulia | |
| Média da turma Gaming (4424 - 33636, n=102, últimos 2 anos) | |
| Média Intel Core i9-12900K (14590 - 14664, n=3) | |
| MSI Titan GT77 12UHS | |
| Asus ROG Zephyrus Duo 16 GX650RX | |
| MSI Raider GE77 HX 12UHS | |
| Média Intel Core i9-12900HX (10475 - 13062, n=7) | |
| MSI GE67 HX 12UGS | |
| Aorus 17X XES | |
| Alienware x17 R2 P48E | |
| MSI GE76 Raider | |
| Gigabyte Aero 16 YE5 | |
| AIDA64 / FPU Mandel | |
| Média da turma Gaming (25115 - 196829, n=102, últimos 2 anos) | |
| Asus ROG Zephyrus Duo 16 GX650RX | |
| MSI Titan GT77 12UHS | |
| MSI Raider GE77 HX 12UHS | |
| Média Intel Core i9-12900HX (31779 - 53628, n=7) | |
| Aorus 17X XES | |
| Média Intel Core i9-12900K (35801 - 39323, n=3) | |
| MSI GE67 HX 12UGS | |
| Alienware x17 R2 P48E | |
| MSI GE76 Raider | |
| Gigabyte Aero 16 YE5 | |
| AIDA64 / CPU AES | |
| MSI Raider GE77 HX 12UHS | |
| MSI Titan GT77 12UHS | |
| Média Intel Core i9-12900HX (125268 - 183146, n=7) | |
| Asus ROG Zephyrus Duo 16 GX650RX | |
| Aorus 17X XES | |
| Média Intel Core i9-12900K (94062 - 140055, n=3) | |
| MSI GE67 HX 12UGS | |
| Média da turma Gaming (39258 - 247074, n=102, últimos 2 anos) | |
| Alienware x17 R2 P48E | |
| MSI GE76 Raider | |
| Gigabyte Aero 16 YE5 | |
| AIDA64 / CPU ZLib | |
| Média da turma Gaming (574 - 2531, n=102, últimos 2 anos) | |
| Média Intel Core i9-12900K (1537 - 1608, n=3) | |
| MSI Raider GE77 HX 12UHS | |
| MSI Titan GT77 12UHS | |
| MSI GE67 HX 12UGS | |
| Média Intel Core i9-12900HX (990 - 1408, n=7) | |
| Alienware x17 R2 P48E | |
| MSI GE76 Raider | |
| Aorus 17X XES | |
| Gigabyte Aero 16 YE5 | |
| Asus ROG Zephyrus Duo 16 GX650RX | |
| AIDA64 / FP64 Ray-Trace | |
| Média da turma Gaming (5509 - 45446, n=102, últimos 2 anos) | |
| MSI Titan GT77 12UHS | |
| MSI Raider GE77 HX 12UHS | |
| Média Intel Core i9-12900HX (6663 - 11913, n=7) | |
| Asus ROG Zephyrus Duo 16 GX650RX | |
| Aorus 17X XES | |
| Média Intel Core i9-12900K (7586 - 8283, n=3) | |
| MSI GE67 HX 12UGS | |
| Alienware x17 R2 P48E | |
| MSI GE76 Raider | |
| Gigabyte Aero 16 YE5 | |
| AIDA64 / CPU PhotoWorxx | |
| MSI Raider GE77 HX 12UHS | |
| Média da turma Gaming (12271 - 89891, n=102, últimos 2 anos) | |
| Média Intel Core i9-12900K (33311 - 49236, n=3) | |
| Média Intel Core i9-12900HX (40239 - 47710, n=7) | |
| MSI Titan GT77 12UHS | |
| Aorus 17X XES | |
| MSI GE76 Raider | |
| Gigabyte Aero 16 YE5 | |
| Alienware x17 R2 P48E | |
| MSI GE67 HX 12UGS | |
| Asus ROG Zephyrus Duo 16 GX650RX | |
Confira nossos dedicados Intel Core i9-12900HX para mais informações e comparações de benchmark.
Desempenho do sistema
O desempenho geral do sistema está nas linhas esperadas para um laptop com tanta coragem. As velocidades de leitura/gravação da memória, no entanto, parecem ter sido atingidas em comparação com a Raider GE77 HX 12UHS. Caso contrário, não notamos nenhum problema na produtividade diária ou nas tarefas de navegação na web.
CrossMark: Overall | Productivity | Creativity | Responsiveness
| PCMark 10 / Score | |
| Média da turma Gaming (5828 - 12414, n=93, últimos 2 anos) | |
| MSI Titan GT77 12UHS | |
| Alienware x17 R2 P48E | |
| MSI GE67 HX 12UGS | |
| MSI GE76 Raider | |
| Média Intel Core i9-12900HX, NVIDIA GeForce RTX 3080 Ti Laptop GPU (6812 - 8636, n=6) | |
| Aorus 17X XES | |
| Gigabyte Aero 16 YE5 | |
| MSI Raider GE77 HX 12UHS | |
| Asus ROG Zephyrus Duo 16 GX650RX | |
| PCMark 10 / Essentials | |
| Alienware x17 R2 P48E | |
| MSI Titan GT77 12UHS | |
| Gigabyte Aero 16 YE5 | |
| MSI GE67 HX 12UGS | |
| MSI GE76 Raider | |
| Média da turma Gaming (8810 - 11935, n=97, últimos 2 anos) | |
| Média Intel Core i9-12900HX, NVIDIA GeForce RTX 3080 Ti Laptop GPU (9598 - 11192, n=6) | |
| Aorus 17X XES | |
| MSI Raider GE77 HX 12UHS | |
| Asus ROG Zephyrus Duo 16 GX650RX | |
| PCMark 10 / Productivity | |
| Média da turma Gaming (6845 - 25323, n=95, últimos 2 anos) | |
| Média Intel Core i9-12900HX, NVIDIA GeForce RTX 3080 Ti Laptop GPU (9365 - 10932, n=6) | |
| Aorus 17X XES | |
| MSI Titan GT77 12UHS | |
| Alienware x17 R2 P48E | |
| MSI GE76 Raider | |
| Gigabyte Aero 16 YE5 | |
| MSI GE67 HX 12UGS | |
| MSI Raider GE77 HX 12UHS | |
| Asus ROG Zephyrus Duo 16 GX650RX | |
| PCMark 10 / Digital Content Creation | |
| Média da turma Gaming (7602 - 19954, n=95, últimos 2 anos) | |
| MSI Titan GT77 12UHS | |
| Alienware x17 R2 P48E | |
| MSI GE76 Raider | |
| MSI GE67 HX 12UGS | |
| Média Intel Core i9-12900HX, NVIDIA GeForce RTX 3080 Ti Laptop GPU (9543 - 14291, n=6) | |
| Aorus 17X XES | |
| Gigabyte Aero 16 YE5 | |
| MSI Raider GE77 HX 12UHS | |
| Asus ROG Zephyrus Duo 16 GX650RX | |
| CrossMark / Overall | |
| MSI Raider GE77 HX 12UHS | |
| Aorus 17X XES | |
| Média Intel Core i9-12900HX, NVIDIA GeForce RTX 3080 Ti Laptop GPU (2108 - 2170, n=5) | |
| Gigabyte Aero 16 YE5 | |
| MSI Titan GT77 12UHS | |
| Média da turma Gaming (1366 - 2409, n=94, últimos 2 anos) | |
| MSI GE67 HX 12UGS | |
| Alienware x17 R2 P48E | |
| Asus ROG Zephyrus Duo 16 GX650RX | |
| CrossMark / Productivity | |
| MSI Raider GE77 HX 12UHS | |
| Gigabyte Aero 16 YE5 | |
| Aorus 17X XES | |
| Média Intel Core i9-12900HX, NVIDIA GeForce RTX 3080 Ti Laptop GPU (1978 - 2047, n=5) | |
| MSI Titan GT77 12UHS | |
| MSI GE67 HX 12UGS | |
| Média da turma Gaming (1386 - 2254, n=94, últimos 2 anos) | |
| Alienware x17 R2 P48E | |
| Asus ROG Zephyrus Duo 16 GX650RX | |
| CrossMark / Creativity | |
| MSI Raider GE77 HX 12UHS | |
| Média Intel Core i9-12900HX, NVIDIA GeForce RTX 3080 Ti Laptop GPU (2288 - 2366, n=5) | |
| Aorus 17X XES | |
| MSI Titan GT77 12UHS | |
| Média da turma Gaming (1343 - 2786, n=94, últimos 2 anos) | |
| Gigabyte Aero 16 YE5 | |
| Alienware x17 R2 P48E | |
| MSI GE67 HX 12UGS | |
| Asus ROG Zephyrus Duo 16 GX650RX | |
| CrossMark / Responsiveness | |
| Gigabyte Aero 16 YE5 | |
| Aorus 17X XES | |
| MSI Raider GE77 HX 12UHS | |
| Média Intel Core i9-12900HX, NVIDIA GeForce RTX 3080 Ti Laptop GPU (1991 - 2090, n=5) | |
| MSI Titan GT77 12UHS | |
| MSI GE67 HX 12UGS | |
| Asus ROG Zephyrus Duo 16 GX650RX | |
| Média da turma Gaming (1226 - 2334, n=94, últimos 2 anos) | |
| Alienware x17 R2 P48E | |
| PCMark 8 Home Score Accelerated v2 | 6253 pontos | |
| PCMark 8 Creative Score Accelerated v2 | 10390 pontos | |
| PCMark 8 Work Score Accelerated v2 | 7085 pontos | |
| PCMark 10 Score | 8203 pontos | |
Ajuda | ||
| AIDA64 / Memory Copy | |
| Média da turma Gaming (21750 - 129946, n=102, últimos 2 anos) | |
| MSI Raider GE77 HX 12UHS | |
| Média Intel Core i9-12900HX (62852 - 70863, n=7) | |
| MSI Titan GT77 12UHS | |
| Aorus 17X XES | |
| MSI GE76 Raider | |
| Gigabyte Aero 16 YE5 | |
| Alienware x17 R2 P48E | |
| Asus ROG Zephyrus Duo 16 GX650RX | |
| MSI GE67 HX 12UGS | |
| AIDA64 / Memory Read | |
| Média da turma Gaming (22956 - 118858, n=102, últimos 2 anos) | |
| MSI Raider GE77 HX 12UHS | |
| Aorus 17X XES | |
| Média Intel Core i9-12900HX (62140 - 72930, n=7) | |
| Gigabyte Aero 16 YE5 | |
| MSI GE76 Raider | |
| MSI Titan GT77 12UHS | |
| MSI GE67 HX 12UGS | |
| Alienware x17 R2 P48E | |
| Asus ROG Zephyrus Duo 16 GX650RX | |
| AIDA64 / Memory Write | |
| Média da turma Gaming (22297 - 135096, n=102, últimos 2 anos) | |
| MSI Raider GE77 HX 12UHS | |
| MSI GE76 Raider | |
| Média Intel Core i9-12900HX (60001 - 68782, n=7) | |
| Gigabyte Aero 16 YE5 | |
| MSI Titan GT77 12UHS | |
| Aorus 17X XES | |
| MSI GE67 HX 12UGS | |
| Asus ROG Zephyrus Duo 16 GX650RX | |
| Alienware x17 R2 P48E | |
| AIDA64 / Memory Latency | |
| Média da turma Gaming (75.3 - 165.4, n=102, últimos 2 anos) | |
| Alienware x17 R2 P48E | |
| MSI GE67 HX 12UGS | |
| MSI GE76 Raider | |
| Asus ROG Zephyrus Duo 16 GX650RX | |
| Gigabyte Aero 16 YE5 | |
| MSI Titan GT77 12UHS | |
| Média Intel Core i9-12900HX (83.9 - 93.4, n=7) | |
| Aorus 17X XES | |
| MSI Raider GE77 HX 12UHS | |
* ... menor é melhor
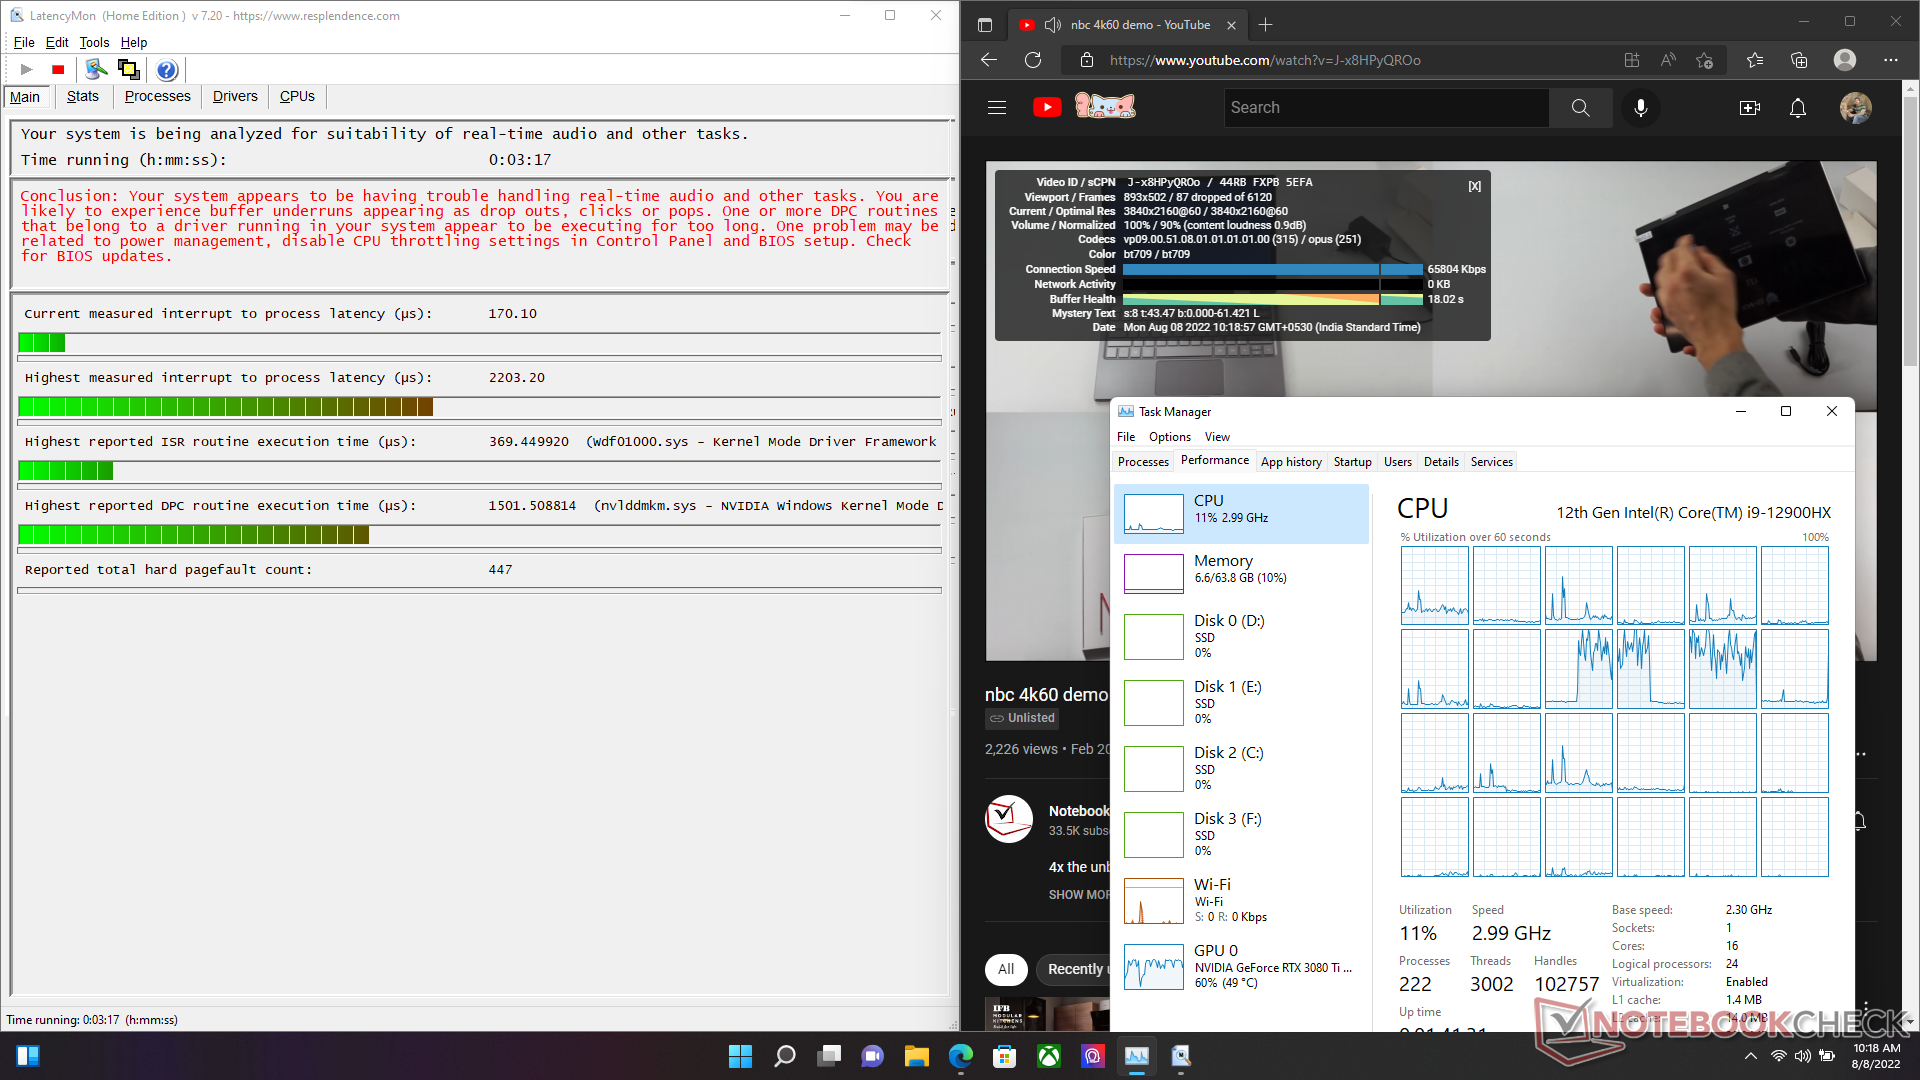
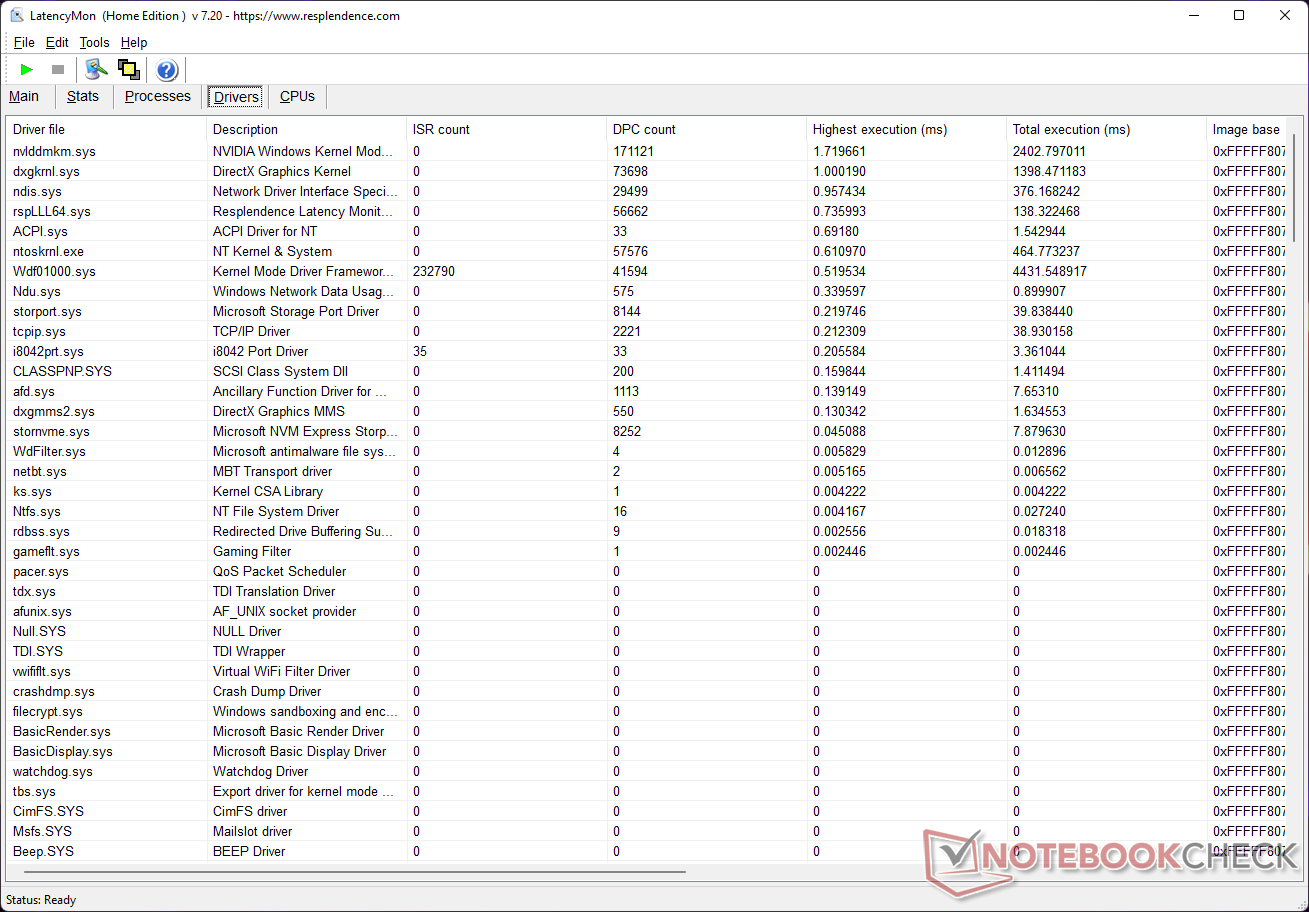
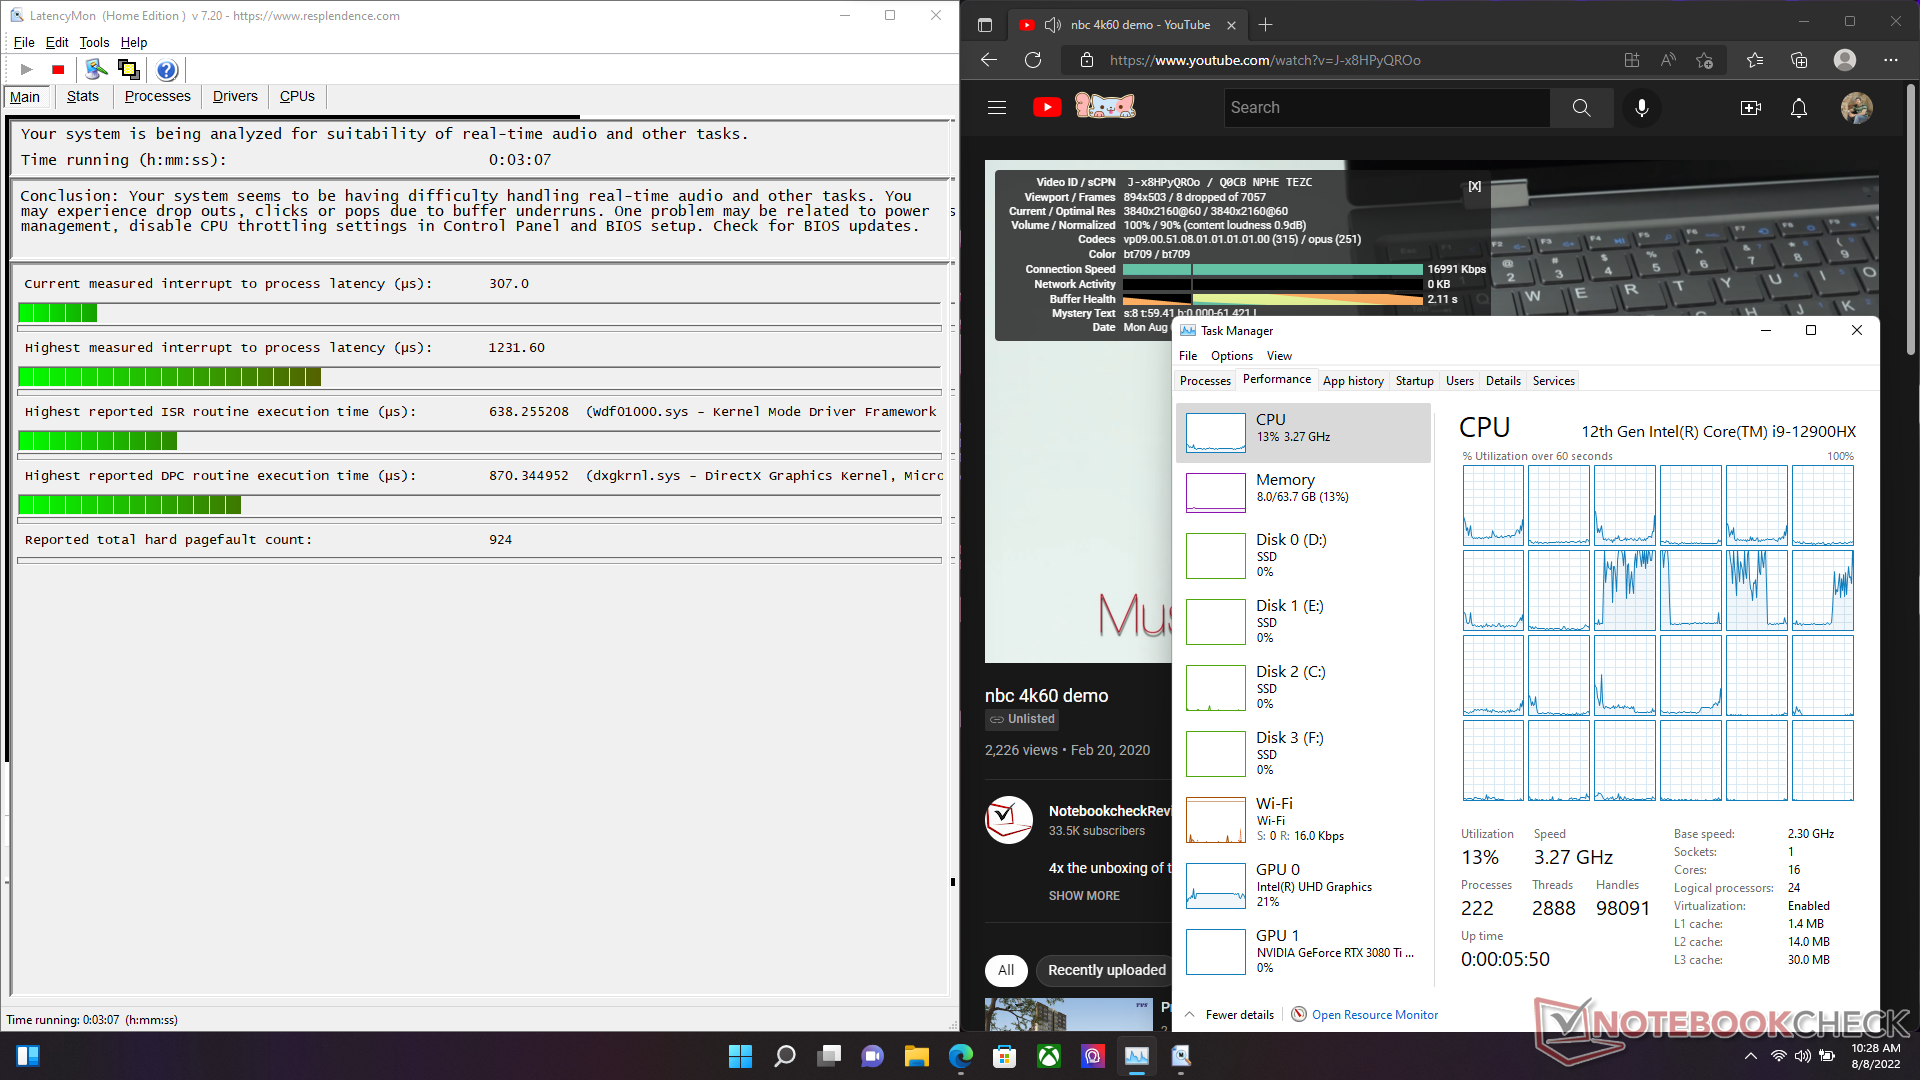
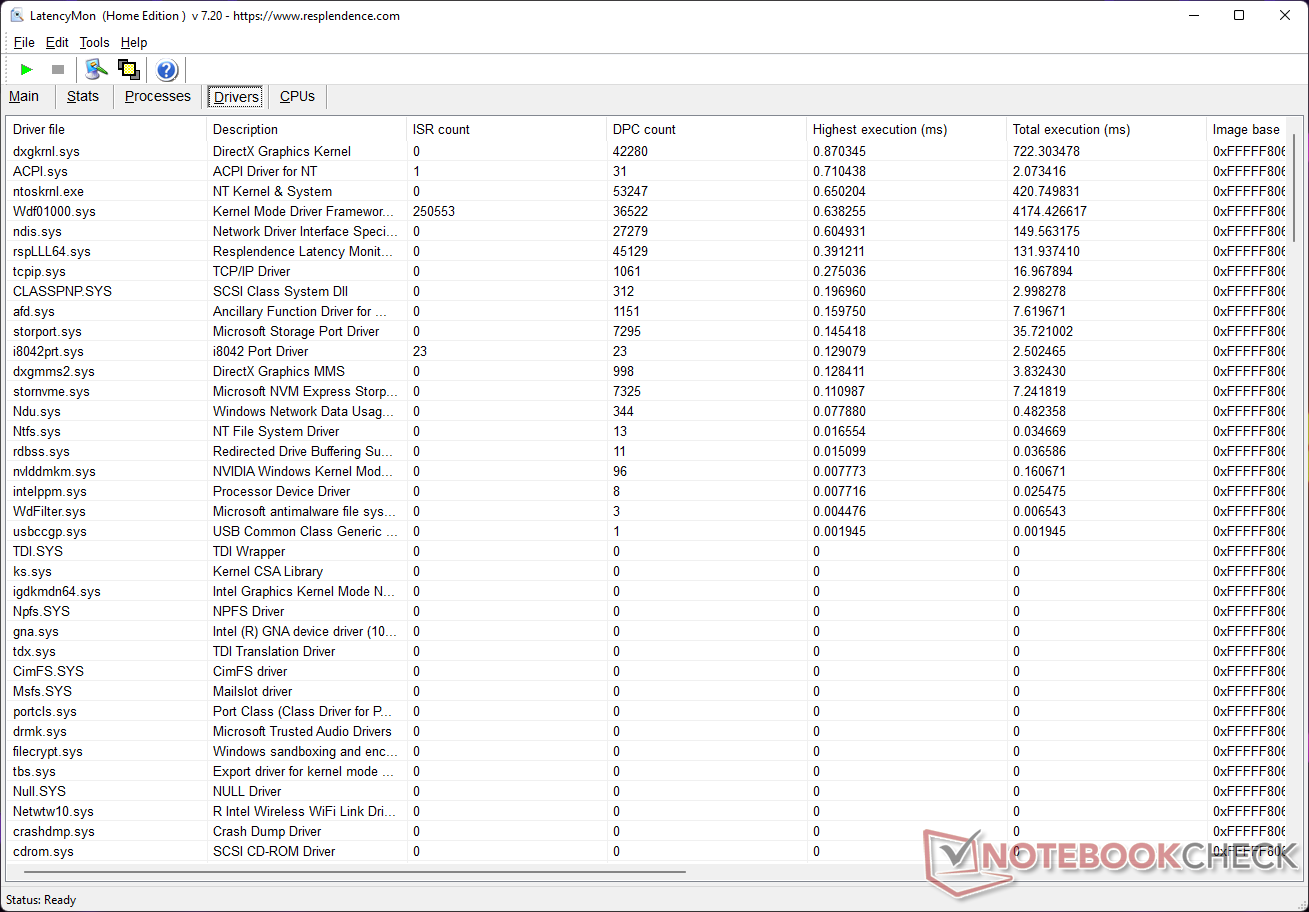
Latência do DPC
O MSI Titan GT77 sofre de problemas de alta latência DPC quando executado em modo dGPU devido aos altos tempos de execução do driver Nvidia. A mudança para o modo MSHybrid melhora consideravelmente a latência do DPC, embora você ainda possa querer afinar algumas das configurações de desempenho se você estiver em fluxos de trabalho de áudio/vídeo em tempo real.
| DPC Latencies / LatencyMon - interrupt to process latency (max), Web, Youtube, Prime95 | |
| MSI Titan GT77 12UHS (dGPU) | |
| MSI Titan GT77 12UHS (MSHybrid) | |
| MSI GE67 HX 12UGS (Edge 103.0.1264.37) | |
| MSI Raider GE77 HX 12UHS | |
| MSI GE76 Raider | |
| Aorus 17X XES | |
| Alienware x17 R2 P48E (Edge 101.0.1210.32) | |
| Gigabyte Aero 16 YE5 | |
| Asus ROG Zephyrus Duo 16 GX650RX | |
* ... menor é melhor
Nosso Ranking de Latência DPC fornece mais comparações de latência entre os dispositivos revisados.
Dispositivos de armazenamento
O subsistema de armazenamento é uma área que a MSI poderia ter feito melhor. Ele utiliza os SSDs PM9A1 NVMe de alta qualidade da Samsung - temos quatro deles em nossa unidade - mas a falta de qualquer tipo de solução térmica nestes drives impede seriamente seu desempenho.
Nas séries iniciais de referência, observamos um desempenho de leitura/gravação sequencial deficiente em todos os drives, exceto no drive D:. Foi somente nas execuções subseqüentes que pudemos obter alguma paridade no desempenho de todos os acionamentos instalados.
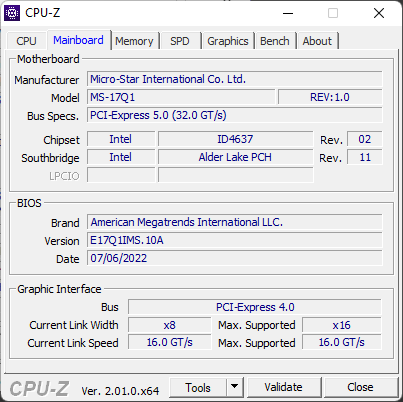
O primeiro slot M.2 é compatível com PCIe Gen5, o que é uma boa coisa se você planeja fazer a transição para a próxima geração de armazenamento abaixo da linha. Este e o segundo slot M.2, que é o PCIe Gen4, conectam-se diretamente à CPU. Há dois outros slots M.2 PCIe Gen4 disponíveis e estes se conectam ao chipset
Não há espaço para instalar unidades SATA adicionais de 2,5 polegadas.

* ... menor é melhor
Devido à falta de uma solução térmica eficaz, seja no acionamento ou no painel inferior, muitas vezes sofremos severas quedas de desempenho em leitura/gravação de benchmarks. O Samsung PM9A1 é incapaz de manter boas velocidades de leitura sustentadas como visto em nosso teste DiskSpd Read Loop a uma profundidade de 8 filas.
Disk Throttling: DiskSpd Read Loop, Queue Depth 8
Confira nossos dedicados SSD e HDD Benchmarks para mais comparações de dispositivos de armazenamento.
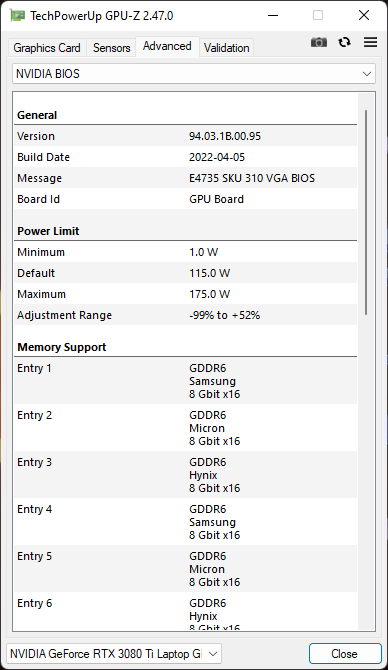
Desempenho da GPU
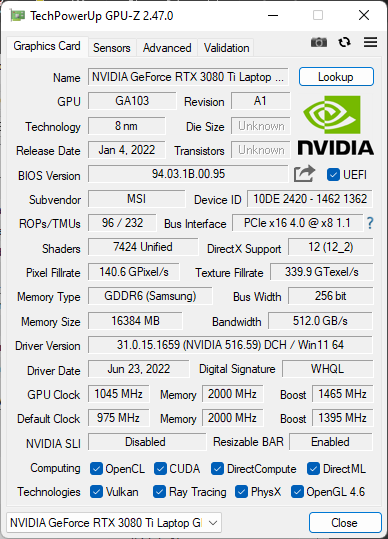
Nossa unidade de teste Titan GT77 apresenta um GPU portátil RTX 3080 Ti de 175 W. A MSI ou Intel não especificam explicitamente o Dynamic Boost para esta GPU, mas assumimos que seria de 15 W
A performance geral do 3DMark está relacionada com outros notebooks RTX 3080 Ti na comparação. O RTX 3080 Ti no Gigabyte Aero 16 YE5 é cerca de 26% mais lento em geral no 3DMark devido ao baixo TGP de 105 W.
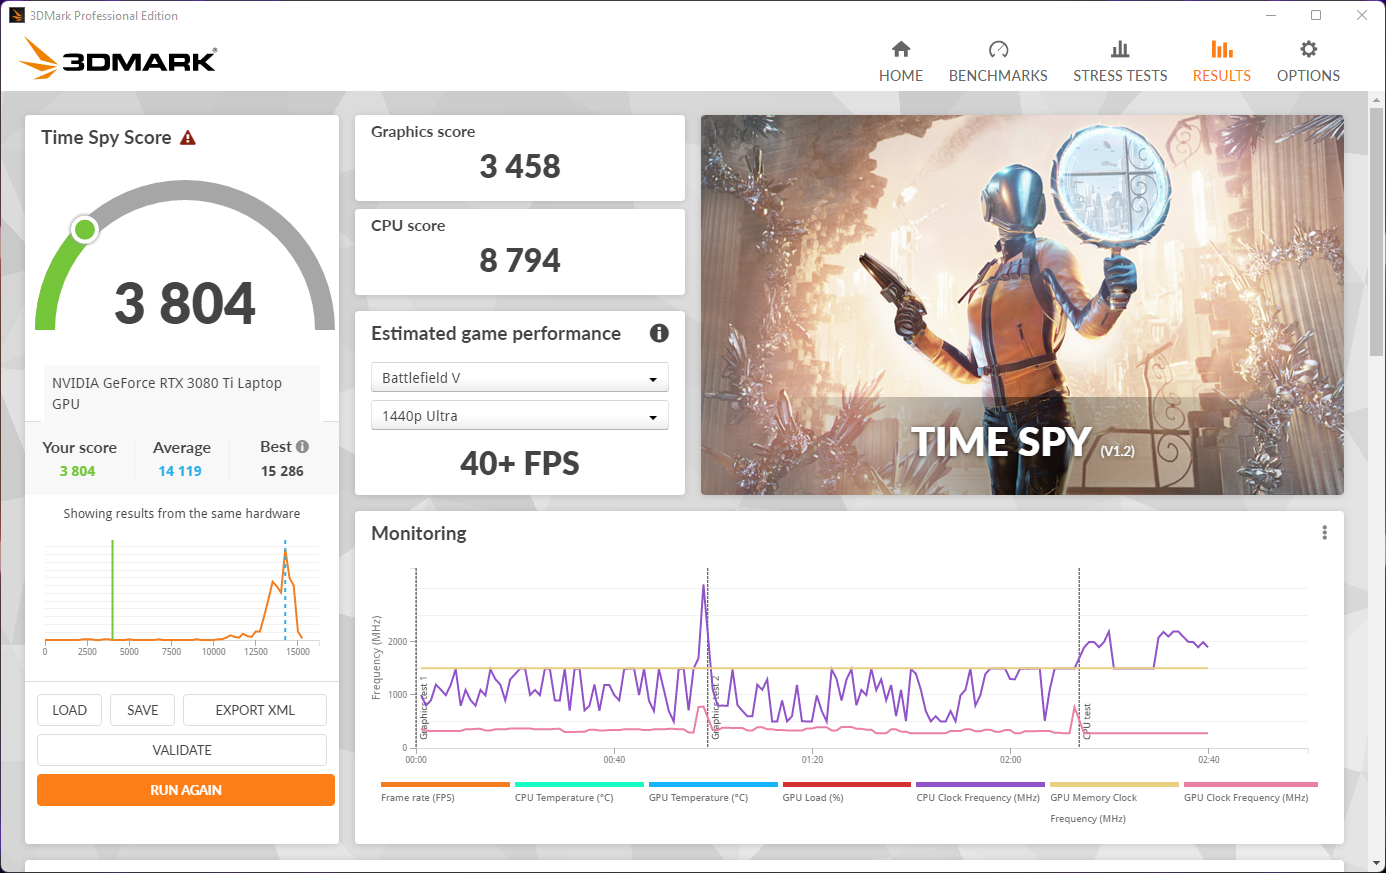
O desempenho da GPU faz um mergulho no nariz da bateria com uma perda de desempenho de até 75% em Time Spy Graphics. De acordo com o 3DMark, a pontuação reduzida ainda corresponde a cerca de 40+ fps em Battlefield V a 1440p Ultra.
A desconexão da rede elétrica também reduz a taxa de atualização do visor de 360 Hz para 60 Hz.
| 3DMark 11 Performance | 36141 pontos | |
| 3DMark Ice Storm Standard Score | 290945 pontos | |
| 3DMark Cloud Gate Standard Score | 65134 pontos | |
| 3DMark Fire Strike Score | 30196 pontos | |
| 3DMark Fire Strike Extreme Score | 16347 pontos | |
| 3DMark Time Spy Score | 13618 pontos | |
Ajuda | ||
Desempenho nos jogos
O Titan GT77 encabeça as tabelas na maioria dos jogos que testamos e geralmente se associa ao Raider GE77 HX 12UHS. O RTX 3080 Ti é capaz de executar um bom número de títulos modernos a 4K Ultra com taxas de quadros muitas vezes superiores a 60 fps. O desempenho do Ray Tracing é decente, mas você vai querer habilitar o DLSS para taxas de quadros mais altas.
| F1 2021 | |
| 1920x1080 Medium Preset AA:T AF:16x | |
| MSI Titan GT77 12UHS | |
| MSI GE76 Raider | |
| Média NVIDIA GeForce RTX 3080 Ti Laptop GPU (207 - 401, n=17) | |
| Asus ROG Zephyrus Duo 16 GX650RX | |
| MSI Raider GE77 HX 12UHS | |
| Gigabyte Aero 16 YE5 | |
| 1920x1080 High Preset AA:T AF:16x | |
| MSI Titan GT77 12UHS | |
| MSI GE76 Raider | |
| Média NVIDIA GeForce RTX 3080 Ti Laptop GPU (182.1 - 316, n=17) | |
| Asus ROG Zephyrus Duo 16 GX650RX | |
| MSI Raider GE77 HX 12UHS | |
| Gigabyte Aero 16 YE5 | |
| 1920x1080 Ultra High Preset + Raytracing AA:T AF:16x | |
| MSI Titan GT77 12UHS | |
| MSI GE76 Raider | |
| MSI Raider GE77 HX 12UHS | |
| Asus ROG Zephyrus Duo 16 GX650RX | |
| Média NVIDIA GeForce RTX 3080 Ti Laptop GPU (30.2 - 160.6, n=30) | |
| Gigabyte Aero 16 YE5 | |
O gráfico FPS Witcher 3
As taxas de quadros em O Witcher 3 a 1080p Ultra com o caráter permanecendo parado durante a duração do teste são bastante consistentes e não mostram sinais perceptíveis de estrangulamento.
| baixo | média | alto | ultra | |
|---|---|---|---|---|
| GTA V (2015) | 187.1 | 186.8 | 182.7 | 131.8 |
| The Witcher 3 (2015) | 543 | 411 | 260 | 129.3 |
| Dota 2 Reborn (2015) | 204.5 | 184.5 | 179.8 | 170.5 |
| Final Fantasy XV Benchmark (2018) | 222 | 189.3 | 137.6 | |
| X-Plane 11.11 (2018) | 184 | 160.4 | 123.8 | |
| Far Cry 5 (2018) | 192 | 173 | 164 | 153 |
| Strange Brigade (2018) | 535 | 313 | 248 | 219 |
| Watch Dogs Legion (2020) | 141.4 | 134.1 | 121.4 | 84 |
| F1 2021 (2021) | 404 | 383 | 302 | 158.2 |
| Cyberpunk 2077 1.6 (2022) | 169.8 | 150.3 | 120.5 | 99.4 |
| F1 22 (2022) | 226 | 227 | 196.5 | 79.8 |
Consulte nossa seção dedicada Nvidia GeForce RTX 3080 Ti GPU Portátil e referência do jogo páginas para mais informações e comparações de jogos.
Emissões: Com grande potência vem grande ruído e calor
Ruído do sistema
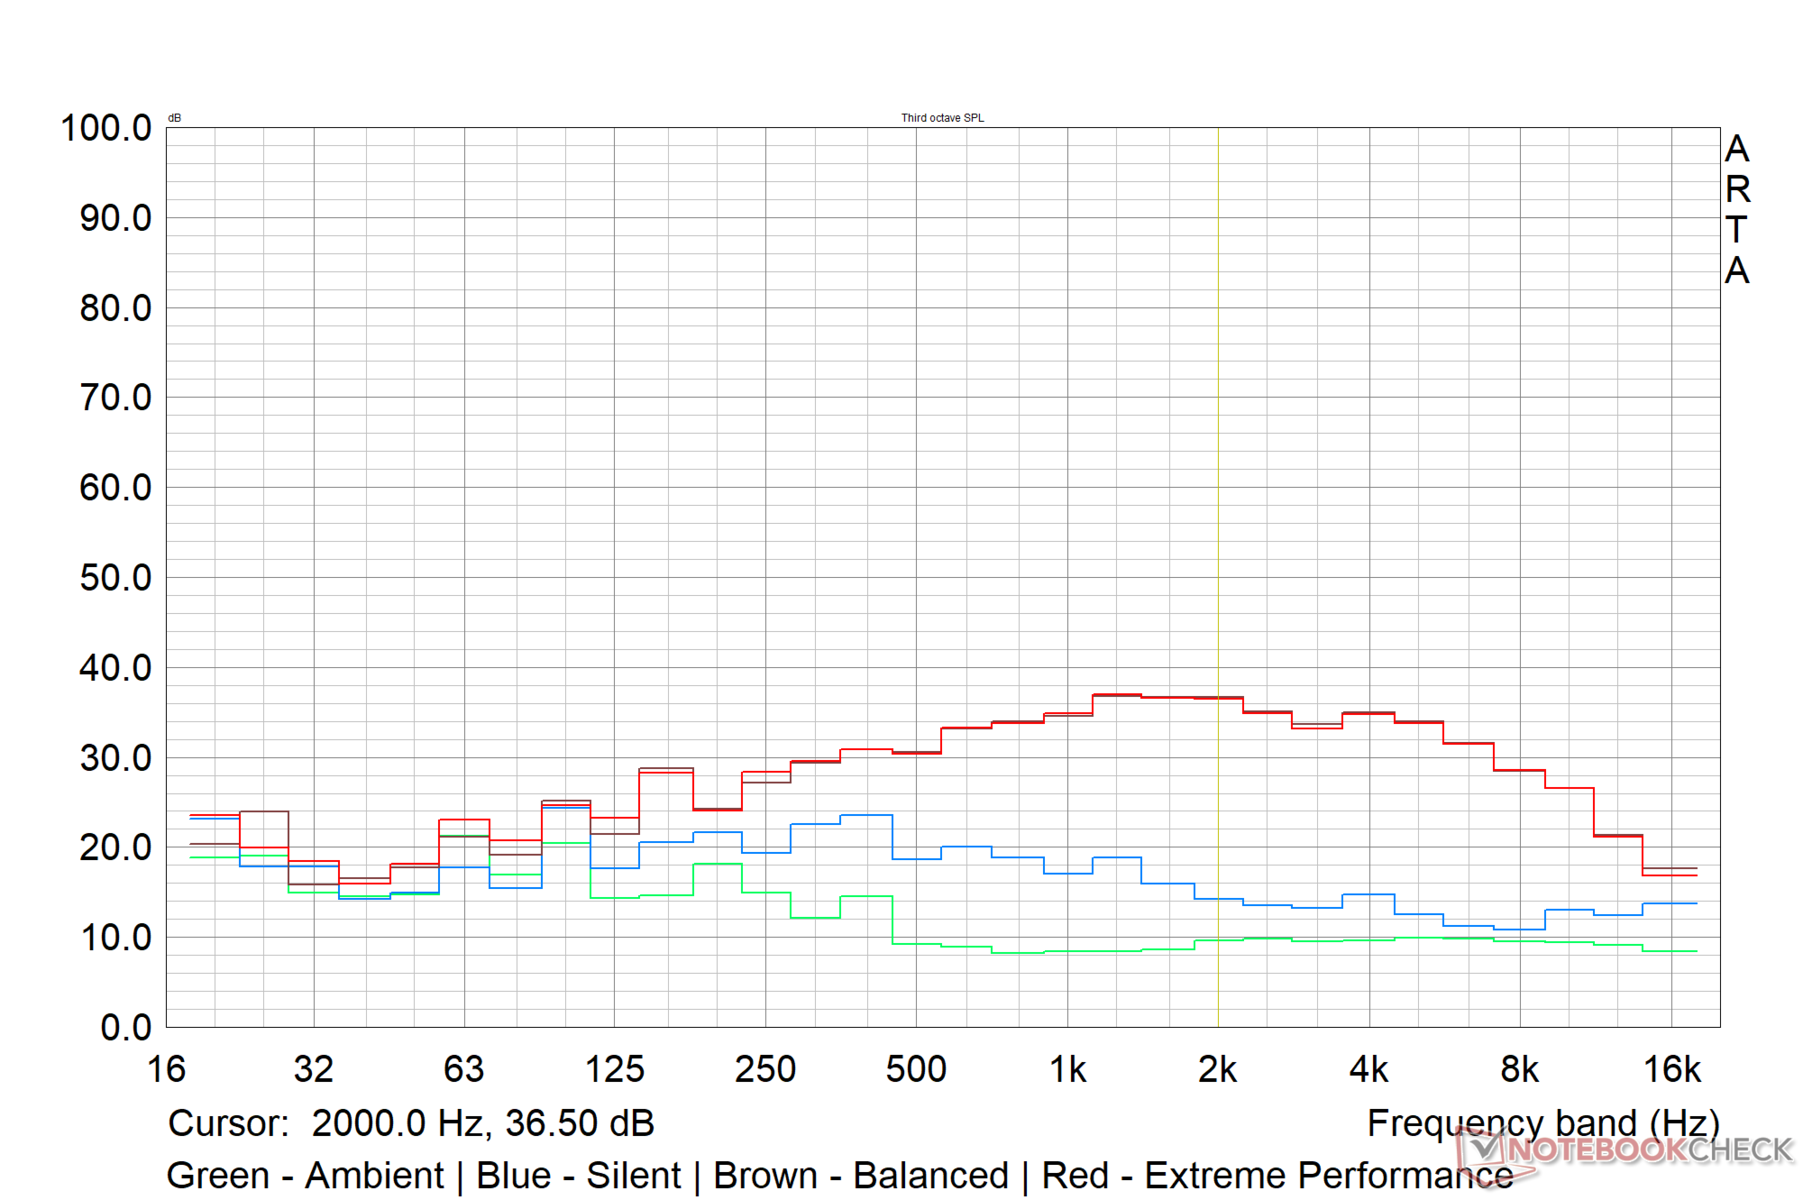
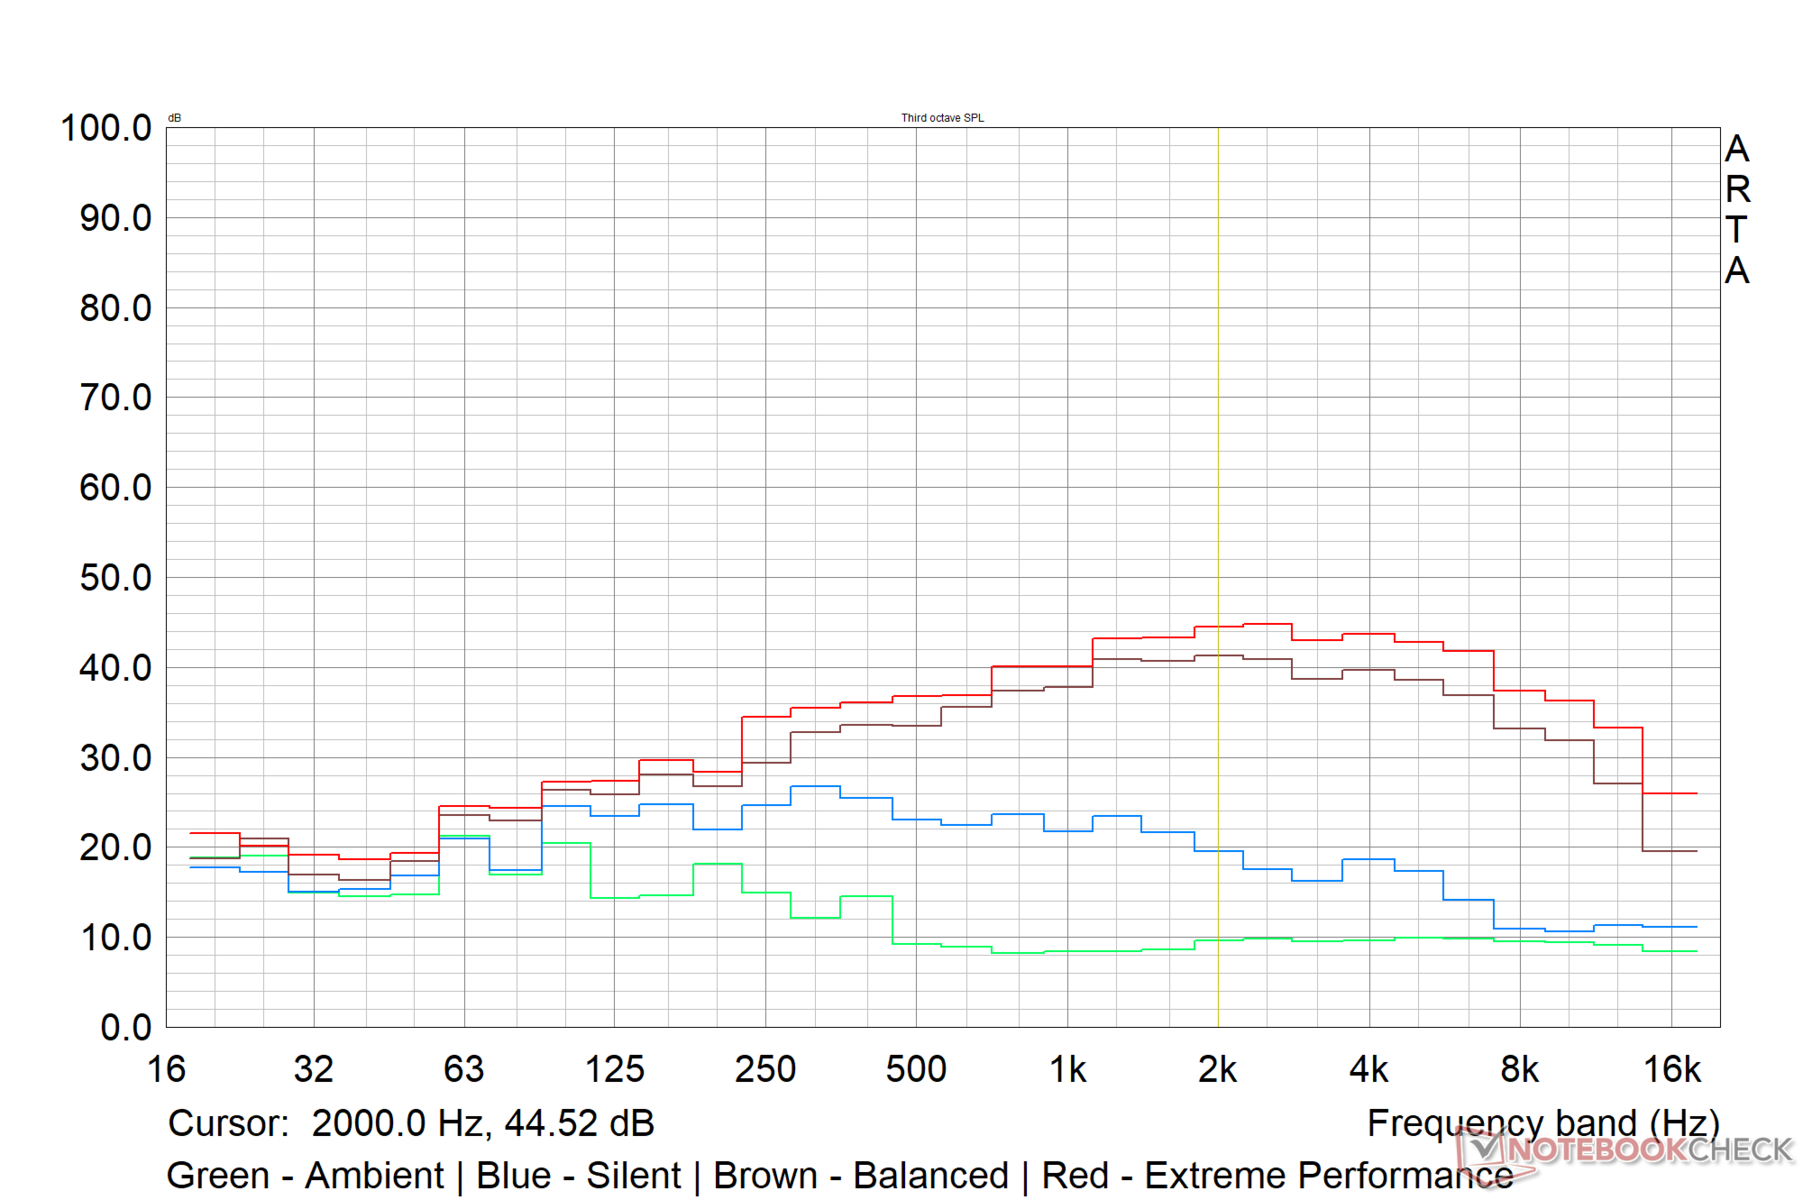
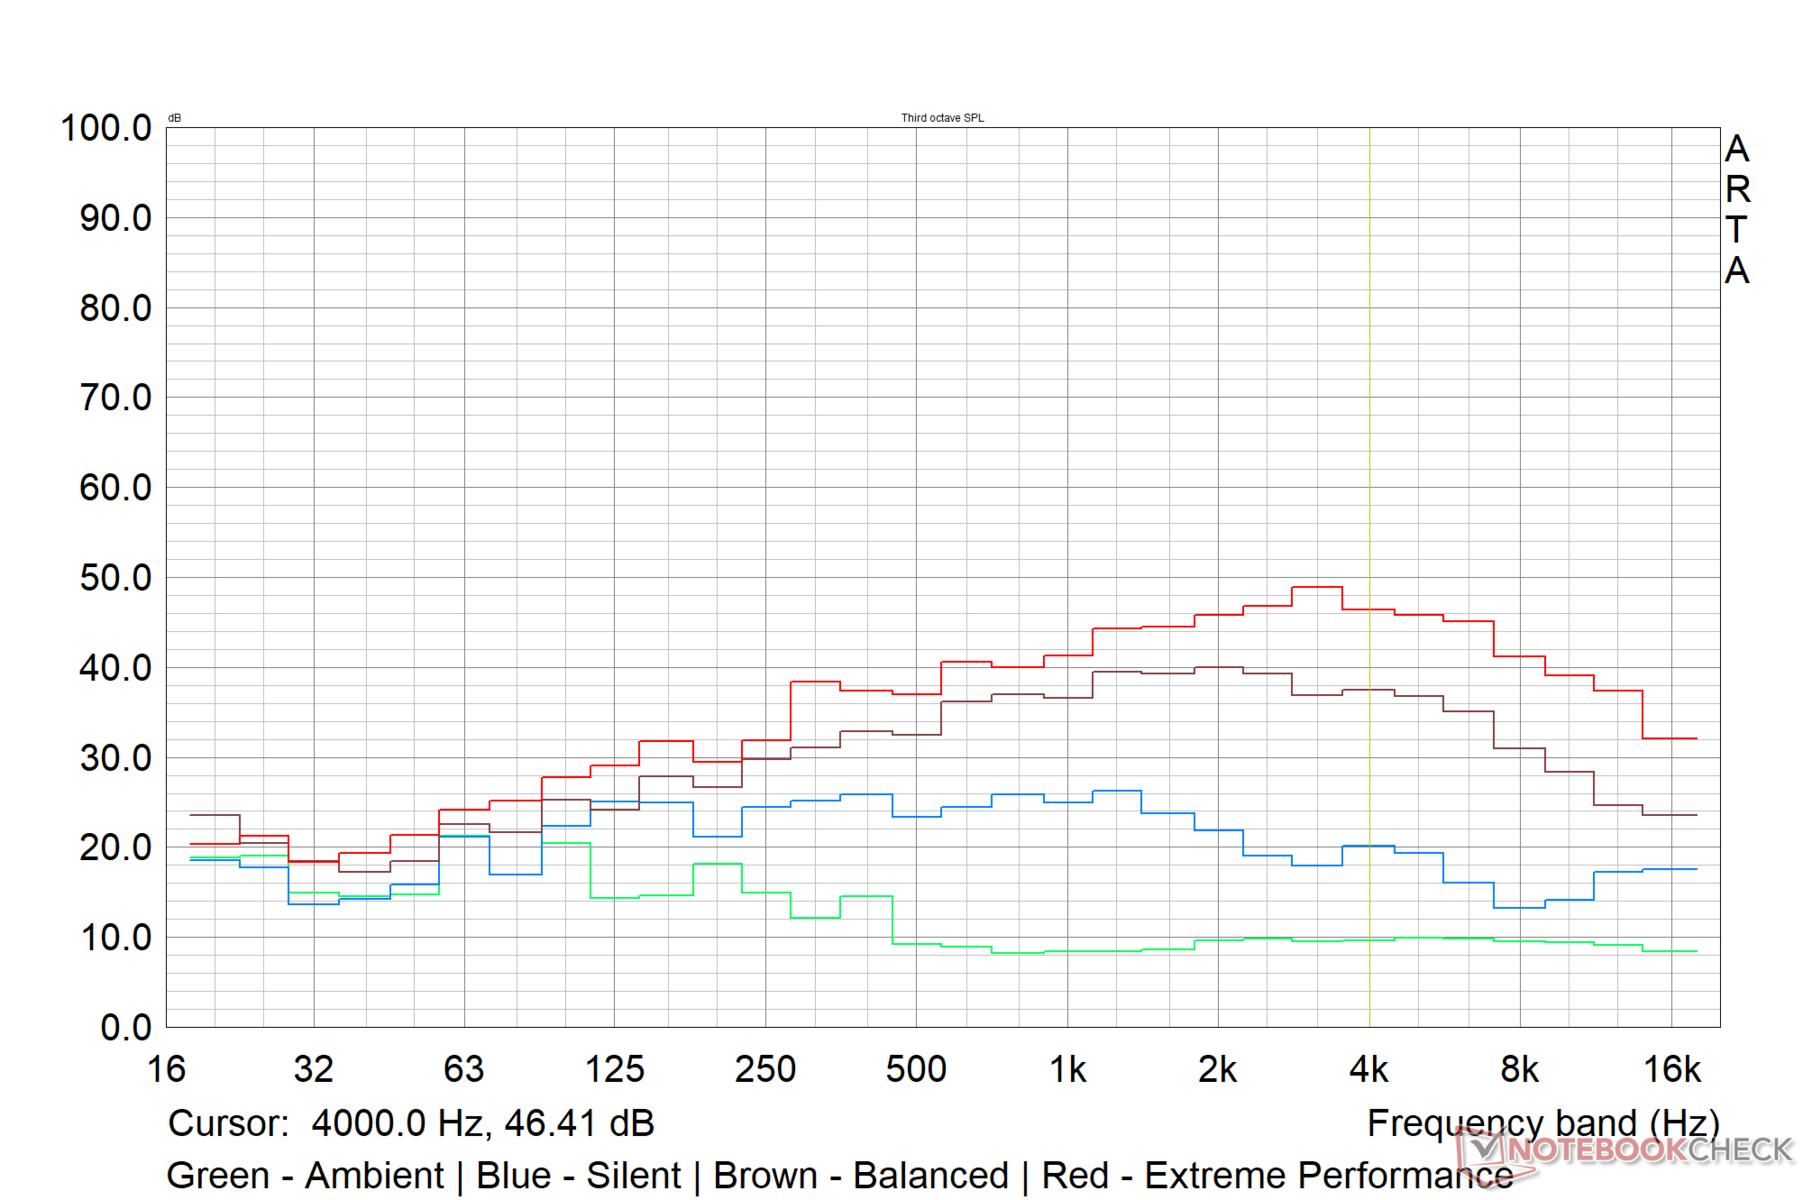
Os internos de primeira linha combinados com o sistema de resfriamento maciço significam que o Titan GT77 pode fazer a reversão de seus motores como nenhum outro, especialmente no modo Extreme Performance. Dito isto, o laptop é relativamente silencioso em modo inativo em todos os modos de desempenho testados.
Os modos de desempenho equilibrado e extremo são bastante similares, exceto por um PL1 de 25 W menor no primeiro. Portanto, observamos que o perfil de ruído sob várias cargas nestes dois modos de desempenho é mais ou menos semelhante. Entretanto, a MSI parece ter limitado a emissão de ruído no perfil Balanceado em cerca de 50 dB(A) enquanto os ventiladores podem ficar um pouco mais altos até 57 dB(A) no perfil de Desempenho Extremo.
Se você preferir um perfil de operação mais silencioso para tarefas menos exigentes, considere o uso do perfil Silencioso, no qual o ruído do ventilador está um pouco abaixo da marca de 35 dB(A).
Barulho
| Ocioso |
| 24.53 / 24.53 / 24.53 dB |
| Carga |
| 46.25 / 54.25 dB |
 | ||
30 dB silencioso 40 dB(A) audível 50 dB(A) ruidosamente alto |
||
min: | ||
| MSI Titan GT77 12UHS Intel Core i9-12900HX, NVIDIA GeForce RTX 3080 Ti Laptop GPU | Aorus 17X XES Intel Core i9-12900HX, NVIDIA GeForce RTX 3070 Ti Laptop GPU | MSI Raider GE77 HX 12UHS Intel Core i9-12900HX, NVIDIA GeForce RTX 3080 Ti Laptop GPU | MSI GE67 HX 12UGS Intel Core i7-12800HX, NVIDIA GeForce RTX 3070 Ti Laptop GPU | Alienware x17 R2 P48E Intel Core i9-12900HK, NVIDIA GeForce RTX 3080 Ti Laptop GPU | |
|---|---|---|---|---|---|
| Noise | -18% | -23% | 2% | 8% | |
| desligado / ambiente * (dB) | 21.9 | 26 -19% | 26 -19% | 22.7 -4% | 22.7 -4% |
| Idle Minimum * (dB) | 24.53 | 28 -14% | 26 -6% | 22.9 7% | 23.1 6% |
| Idle Average * (dB) | 24.53 | 32 -30% | 34 -39% | 22.9 7% | 23.1 6% |
| Idle Maximum * (dB) | 24.53 | 38 -55% | 46 -88% | 22.9 7% | 23.1 6% |
| Load Average * (dB) | 46.25 | 53 -15% | 50 -8% | 44.4 4% | 31.9 31% |
| Witcher 3 ultra * (dB) | 56.86 | 54 5% | 55 3% | 55.7 2% | 52.5 8% |
| Load Maximum * (dB) | 54.25 | 55 -1% | 57 -5% | 57.4 -6% | 52.5 3% |
* ... menor é melhor
Temperatura
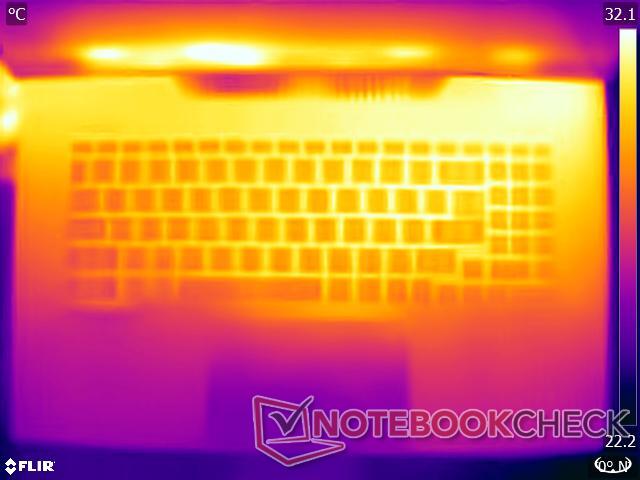
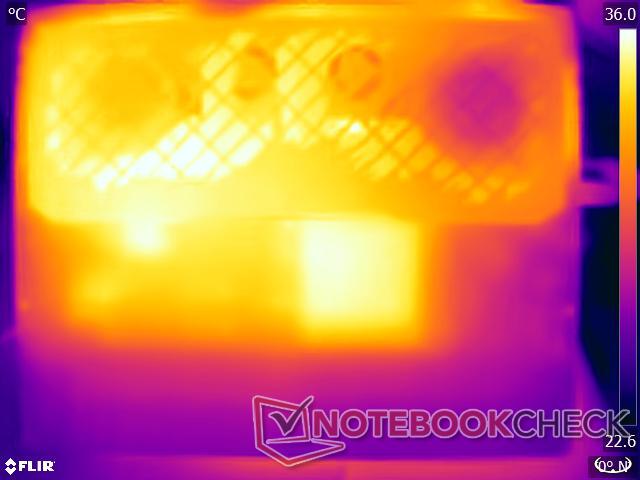
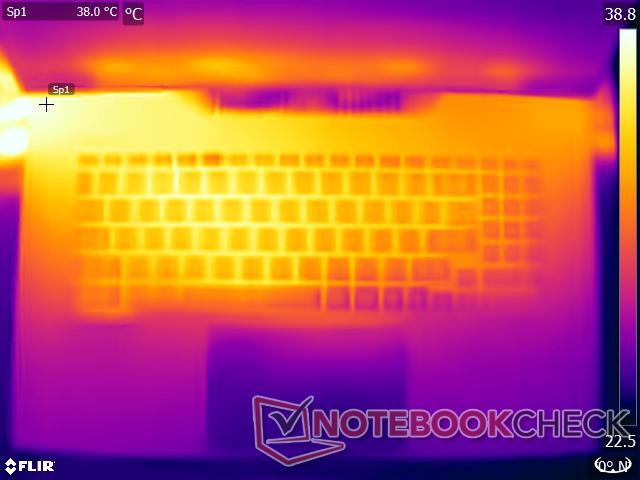
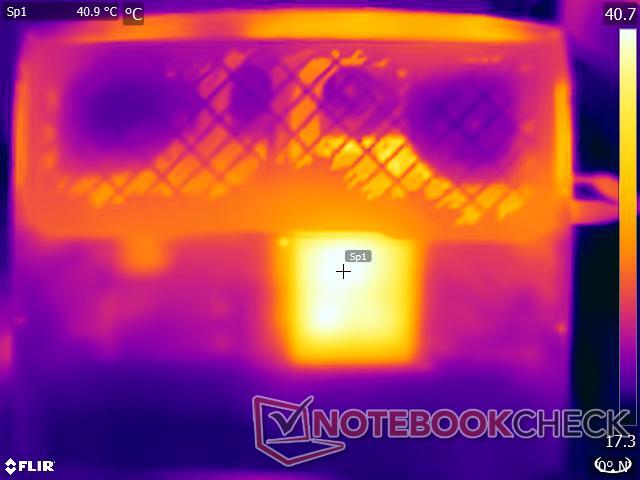
As temperaturas superficiais estão definitivamente no lado mais alto, apesar do robusto sistema de resfriamento. Registramos um máximo de 40,8 °C no lado superior e 52,4 °C no lado inferior sob carga máxima de Prime95 e FurMark rodando juntos
O estresse com o The Witcher 3 a 1080p Ultra resulta em pontos quentes de temperatura de 47 °C e 47,6 °C na parte superior e inferior, respectivamente. As áreas de apoio de palmas e touchpad permanecem relativamente frias mesmo sob estresse.
(±) A temperatura máxima no lado superior é 40.8 °C / 105 F, em comparação com a média de 40.4 °C / 105 F , variando de 21.2 a 68.8 °C para a classe Gaming.
(-) A parte inferior aquece até um máximo de 52.4 °C / 126 F, em comparação com a média de 43.2 °C / 110 F
(±) Em uso inativo, a temperatura média para o lado superior é 32 °C / 90 F, em comparação com a média do dispositivo de 33.9 °C / ### class_avg_f### F.
(-) Jogando The Witcher 3, a temperatura média para o lado superior é 40.4 °C / 105 F, em comparação com a média do dispositivo de 33.9 °C / ## #class_avg_f### F.
(+) Os apoios para as mãos e o touchpad estão atingindo a temperatura máxima da pele (33.4 °C / 92.1 F) e, portanto, não estão quentes.
(-) A temperatura média da área do apoio para as mãos de dispositivos semelhantes foi 28.8 °C / 83.8 F (-4.6 °C / -8.3 F).
Dado seu peso, o Titan GT77 não é algo que você usaria em uma volta. Embora nossos testes de estresse representem cenários extremos, ainda assim recomendamos o uso dos modos de desempenho Silencioso ou Equilibrado para garantir que as temperaturas de superfície estejam dentro dos limites toleráveis.


| MSI Titan GT77 12UHS Intel Core i9-12900HX, NVIDIA GeForce RTX 3080 Ti Laptop GPU | Aorus 17X XES Intel Core i9-12900HX, NVIDIA GeForce RTX 3070 Ti Laptop GPU | MSI Raider GE77 HX 12UHS Intel Core i9-12900HX, NVIDIA GeForce RTX 3080 Ti Laptop GPU | MSI GE67 HX 12UGS Intel Core i7-12800HX, NVIDIA GeForce RTX 3070 Ti Laptop GPU | Alienware x17 R2 P48E Intel Core i9-12900HK, NVIDIA GeForce RTX 3080 Ti Laptop GPU | |
|---|---|---|---|---|---|
| Heat | -13% | -16% | 20% | 8% | |
| Maximum Upper Side * (°C) | 40.8 | 54 -32% | 53 -30% | 34.4 16% | 49.6 -22% |
| Maximum Bottom * (°C) | 52.4 | 58 -11% | 58 -11% | 42 20% | 42.4 19% |
| Idle Upper Side * (°C) | 34.6 | 37 -7% | 38 -10% | 24 31% | 29.2 16% |
| Idle Bottom * (°C) | 38.4 | 39 -2% | 43 -12% | 33.2 14% | 32 17% |
* ... menor é melhor
Teste de estresse
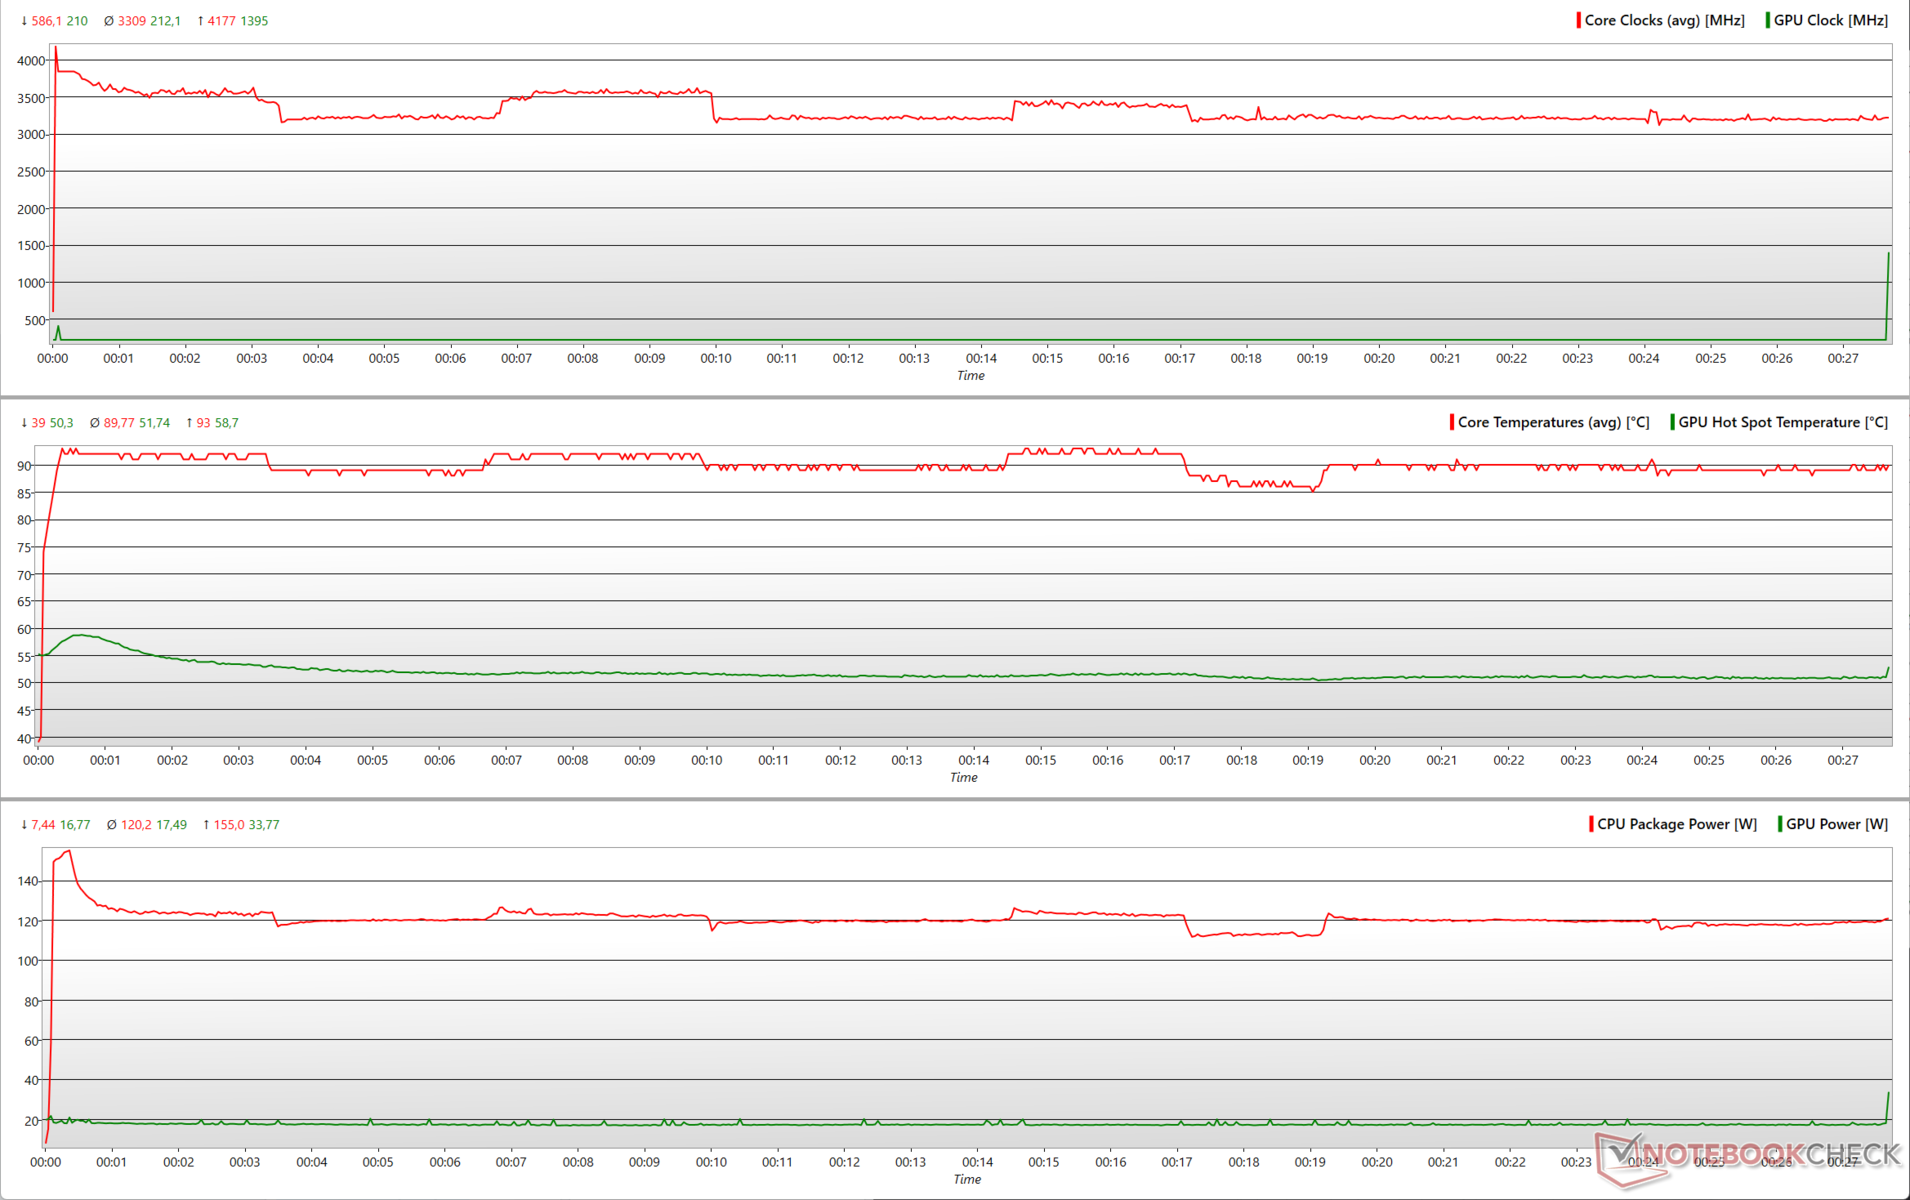
Enfatizando o Titan GT77 com o Prime95 funcionando em FFTs no local, vemos o Core i9-12900HX aumentando até 4,1 GHz a cerca de 155 W, mas observamos os relógios assentando entre 3 GHz e 3,5 GHz a 120 W, cerca de quatro minutos depois do teste.
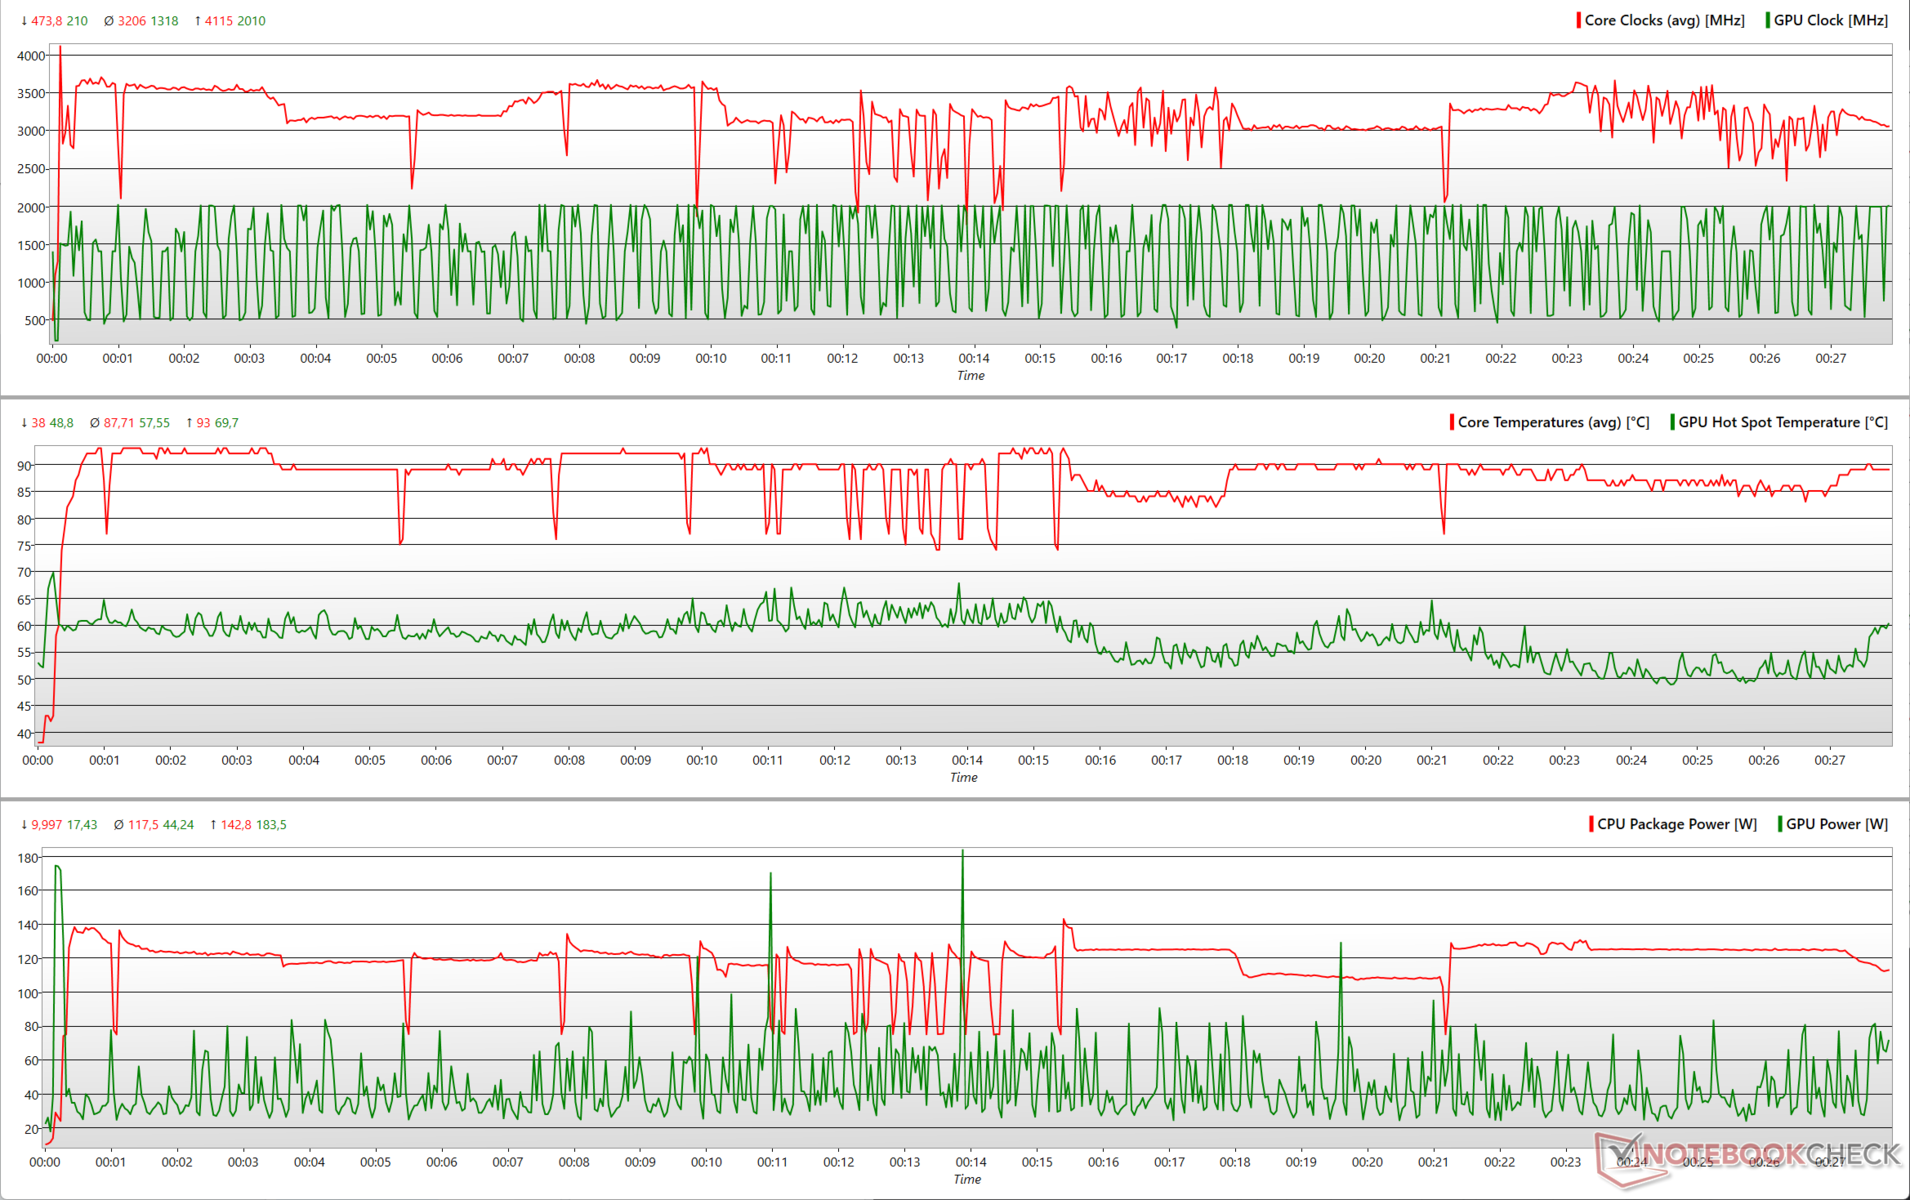
De acordo com a MSI, o Titan GT77 usa o MSI OverBoost para uma carga combinada de 250 W (75 W CPU + 175 W GPU) tanto da CPU quanto da GPU, dependendo do cenário. A adição do FurMark ao Prime95 vê o relógio da CPU atingir um pico inicial de 4,1 GHz a cerca de 140 W e depois oscilar entre 3 GHz e 3,5 GHz a 120 W. A GPU RTX 3080 Ti Laptop mostra relógios inconsistentes nesta carga de trabalho coincidindo com a flutuação de energia.
Vemos a GPU chegando perto de 175 W TGP no início da corrida, mas é capaz de usar apenas cerca de 80-90 W durante a maior duração do teste. Às vezes, vemos picos de até 185 W, mas isso faz com que o TDP da CPU caia para 75 W. Os relógios da GPU durante o Prime95 e FurMark combinados não são estáveis e continuam oscilando entre a base e os relógios de impulso regularmente, a fim de acomodar os requisitos de energia da CPU.
Running The Witcher 3 a 1080p Ultra apresenta um cenário de estresse mais real com um desempenho muito mais previsível. Embora os relógios da CPU sejam relativamente instáveis, encontramos o RTX 3080 Ti para relógio consistente de 1,8 GHz a 165 W após uma alta inicial de 2 GHz. O TDP da CPU não vai além de 35 W durante este teste, resultando em uma carga combinada de 200 W.
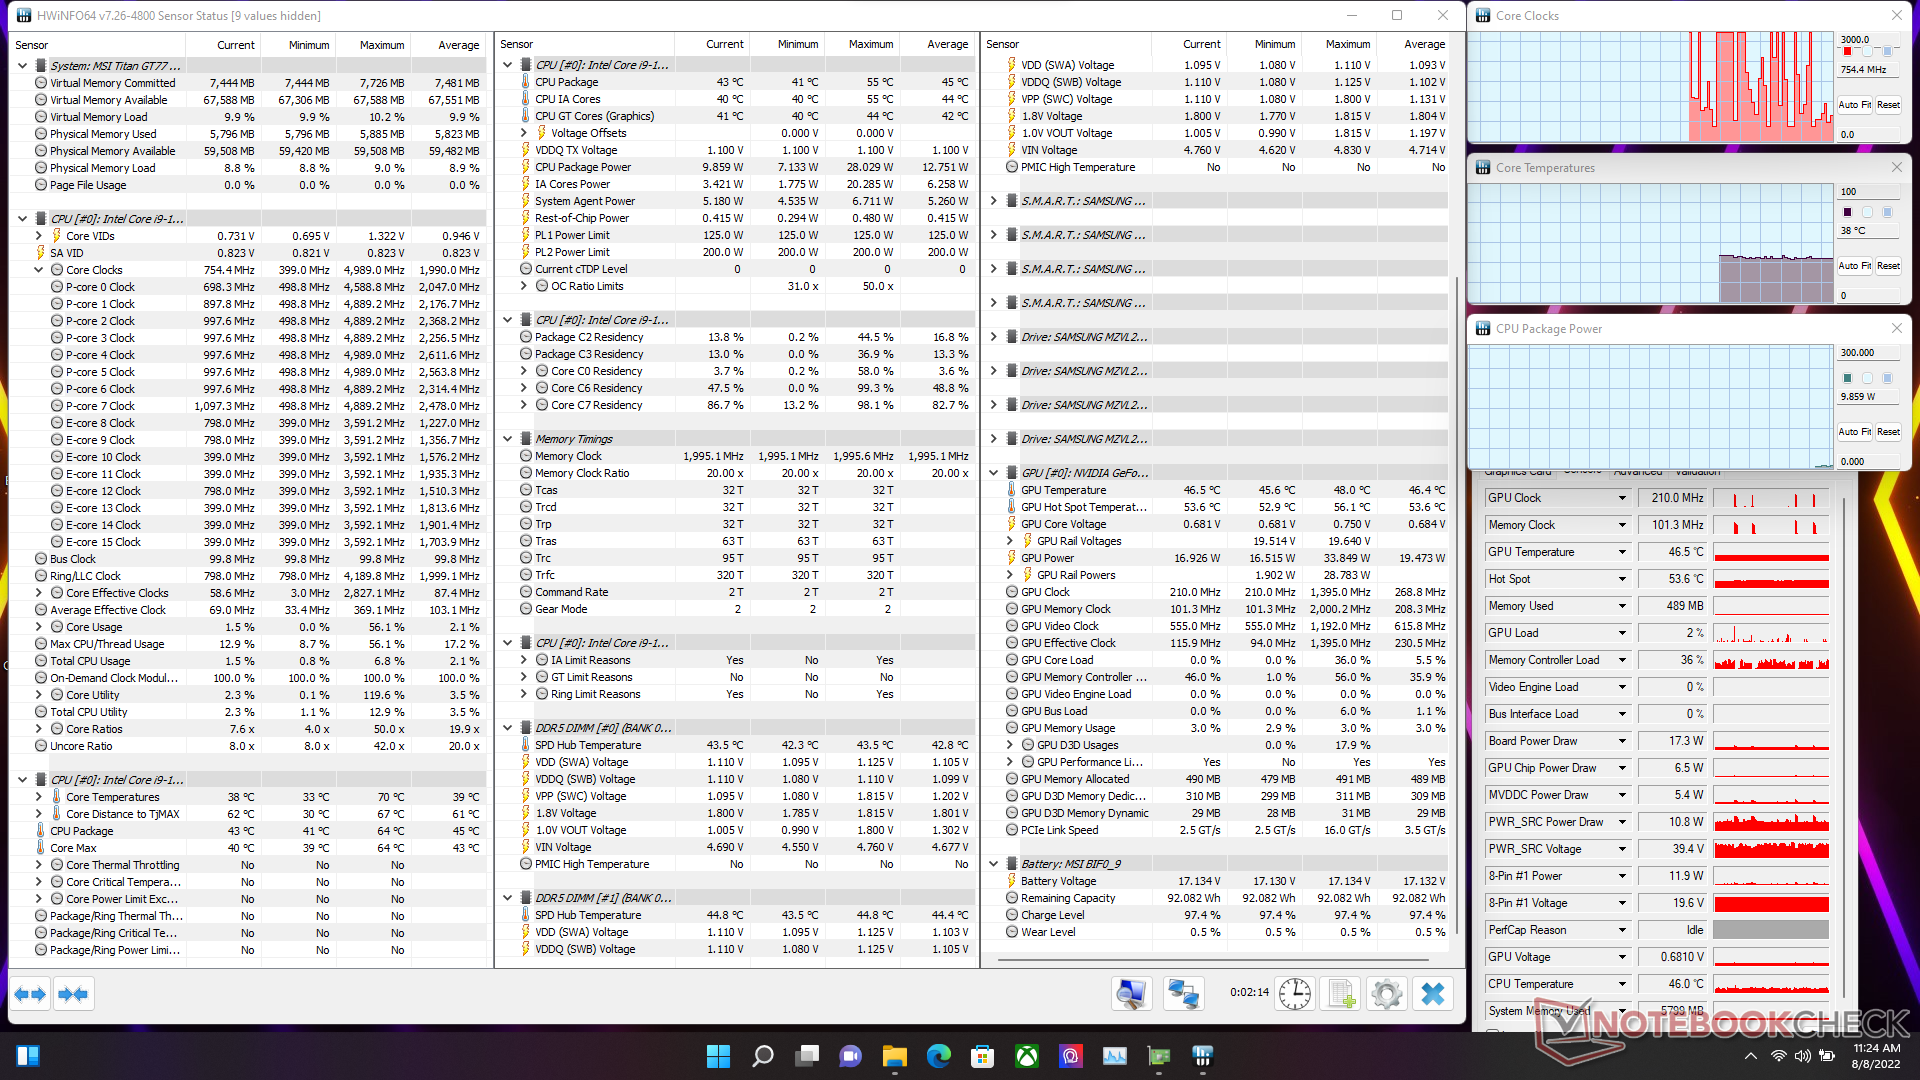
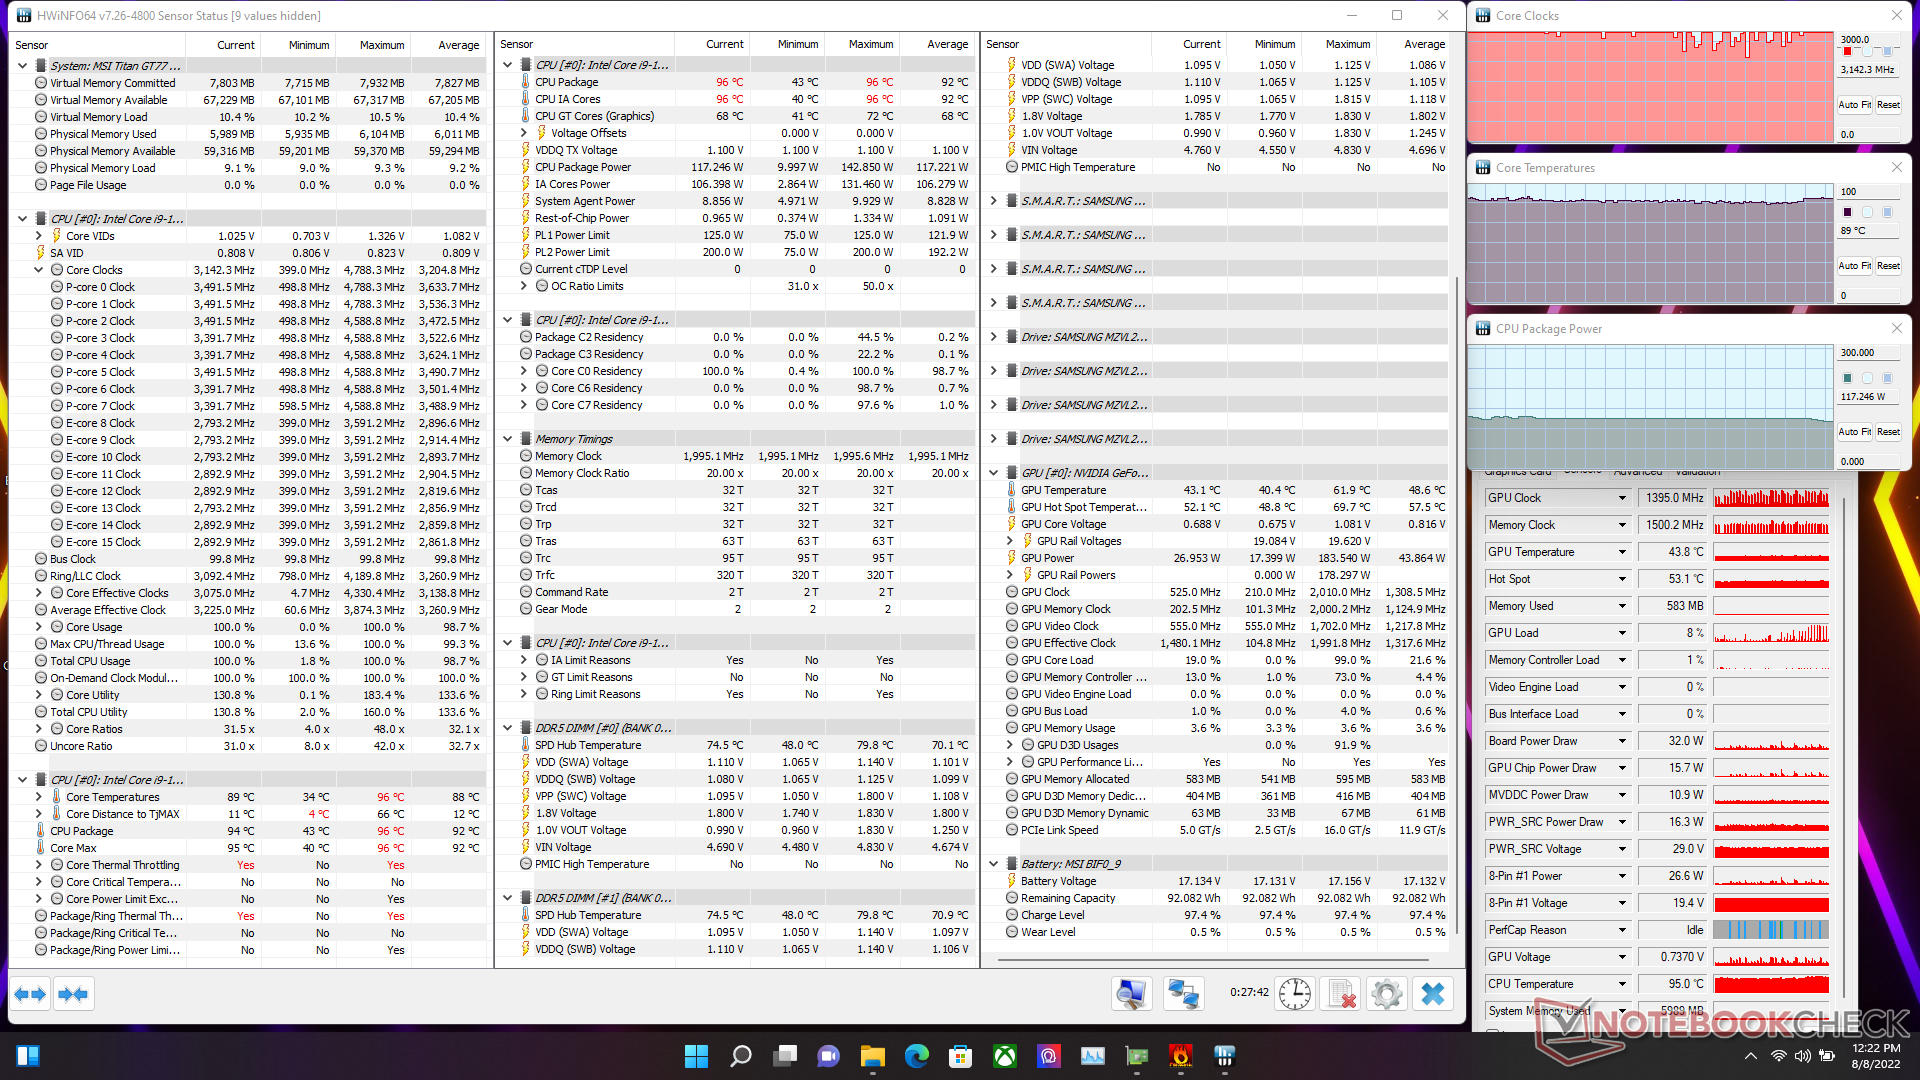
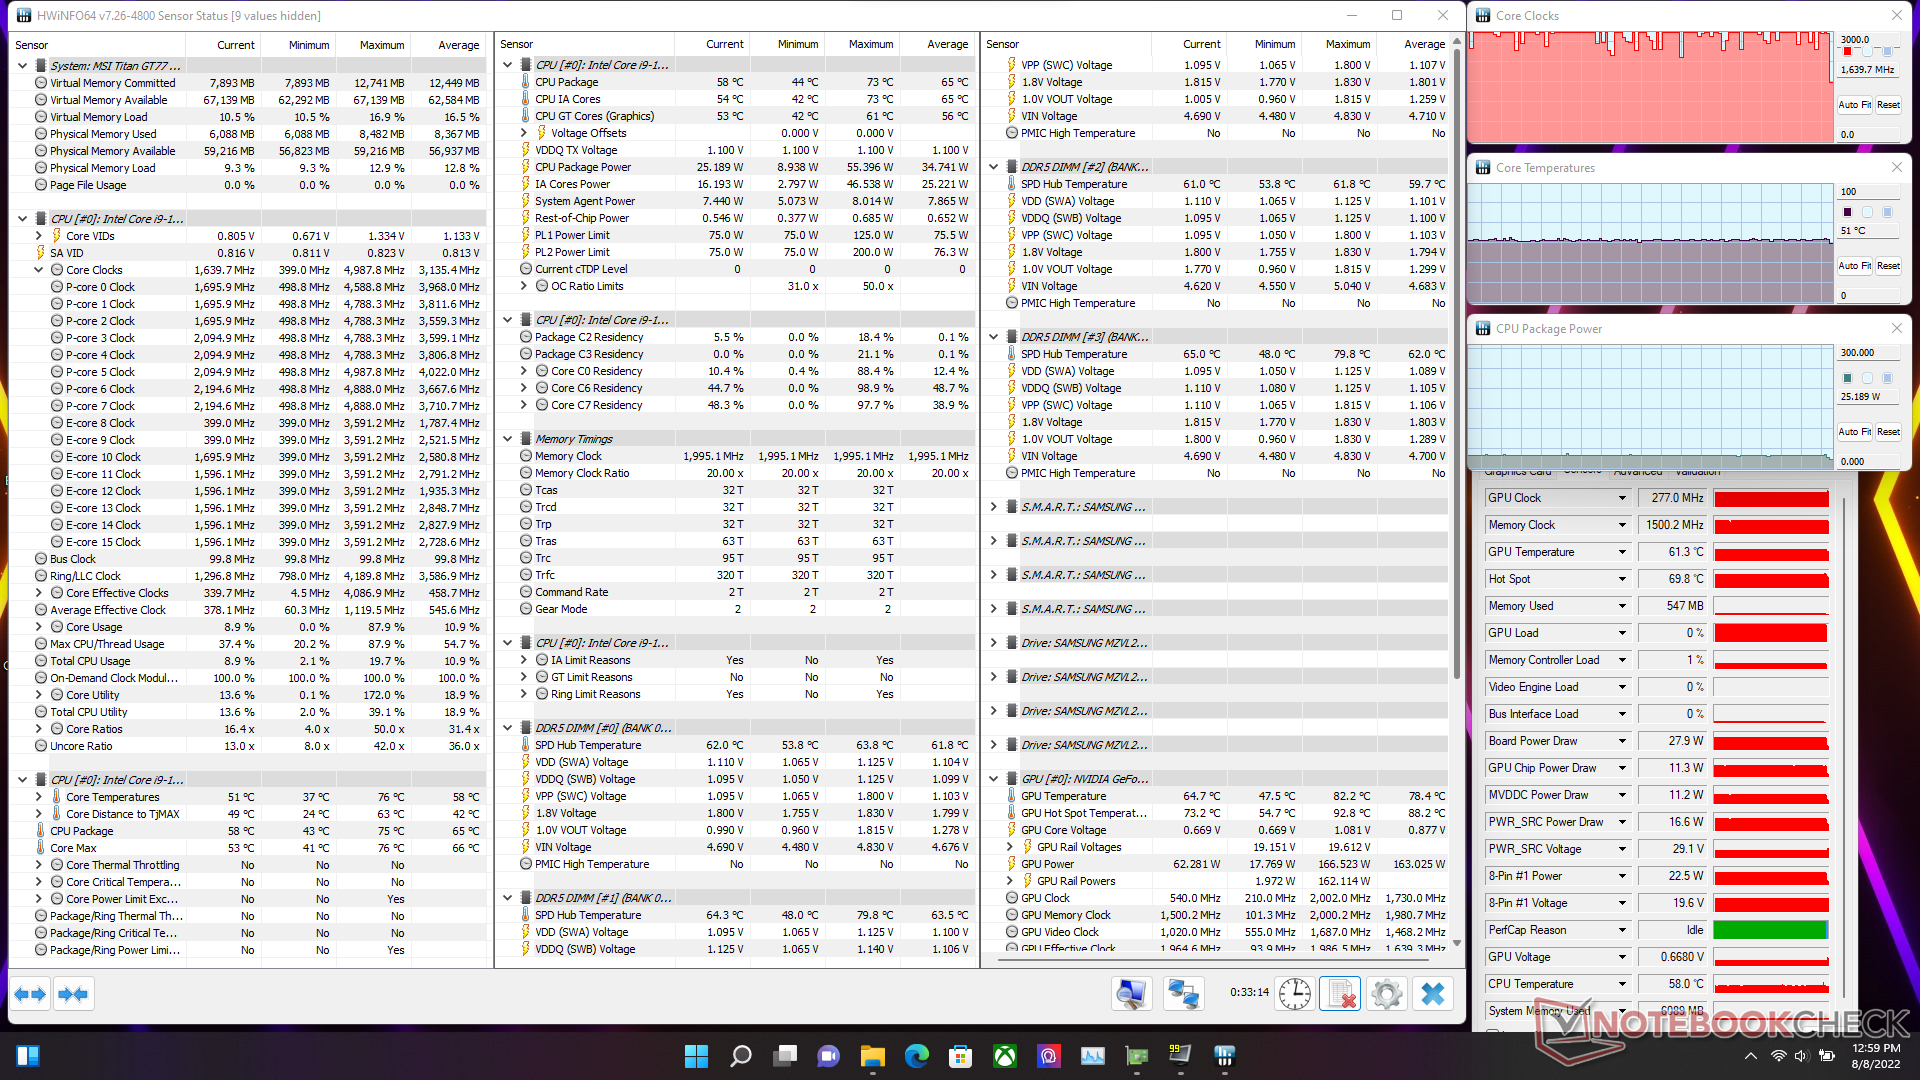
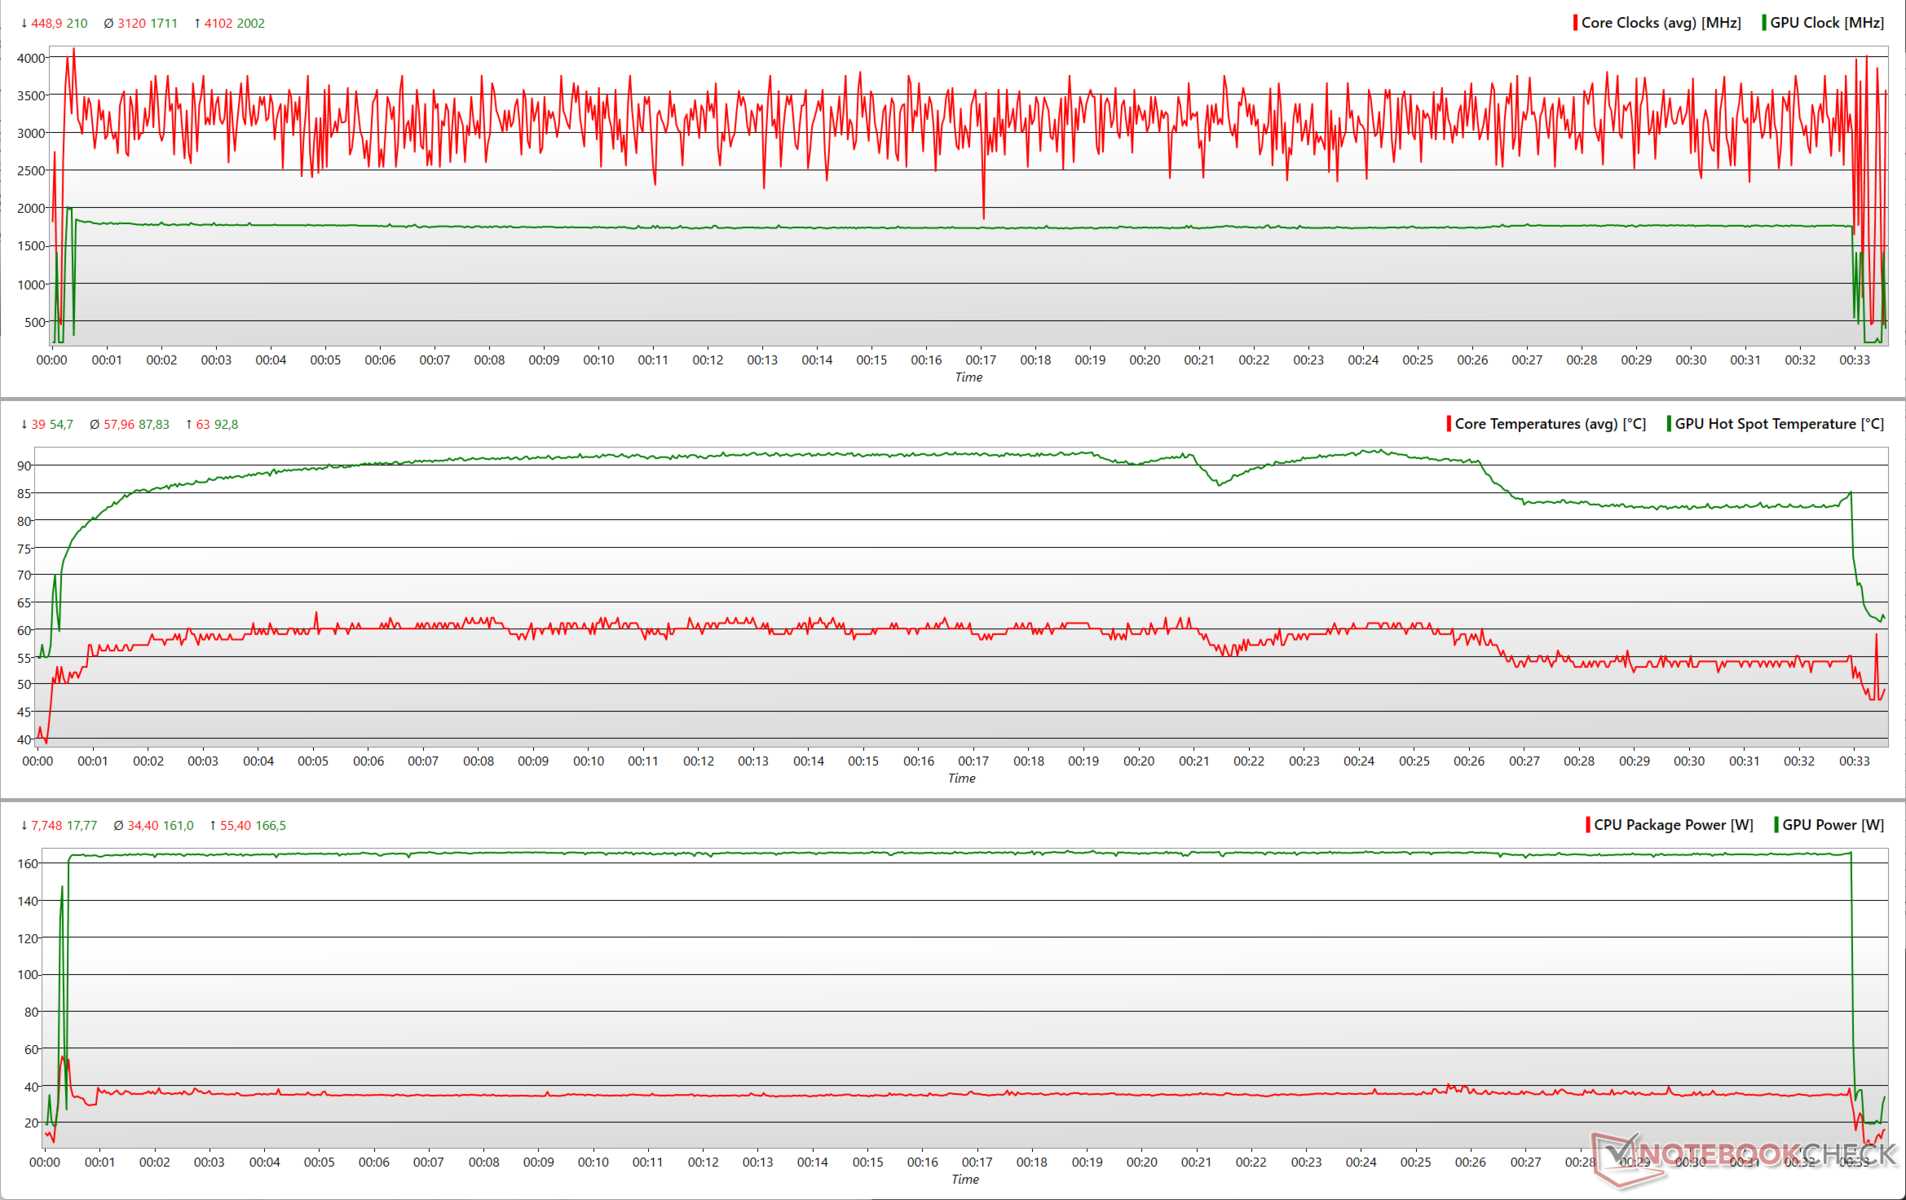
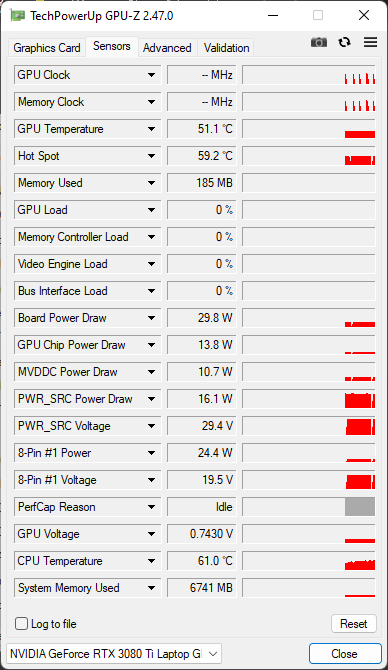
| Teste de estresse | Relógio da CPU (GHz) | Relógio da GPU (MHz) | Temperatura média da CPU (°C) | Temperatura média da GPU (°C) |
| Sistema ocioso | 0.75 | 210 | 39 | 46.4 |
| Prime95 | 3.2 | 210 | 85 | 42.1 |
| Prime95 + FurMark | 3.1 | 1.395 | 88 | 48.6 |
| O Witcher 3 | 1.6 | 1.964.6 | 58 | 78.4 |
Oradores

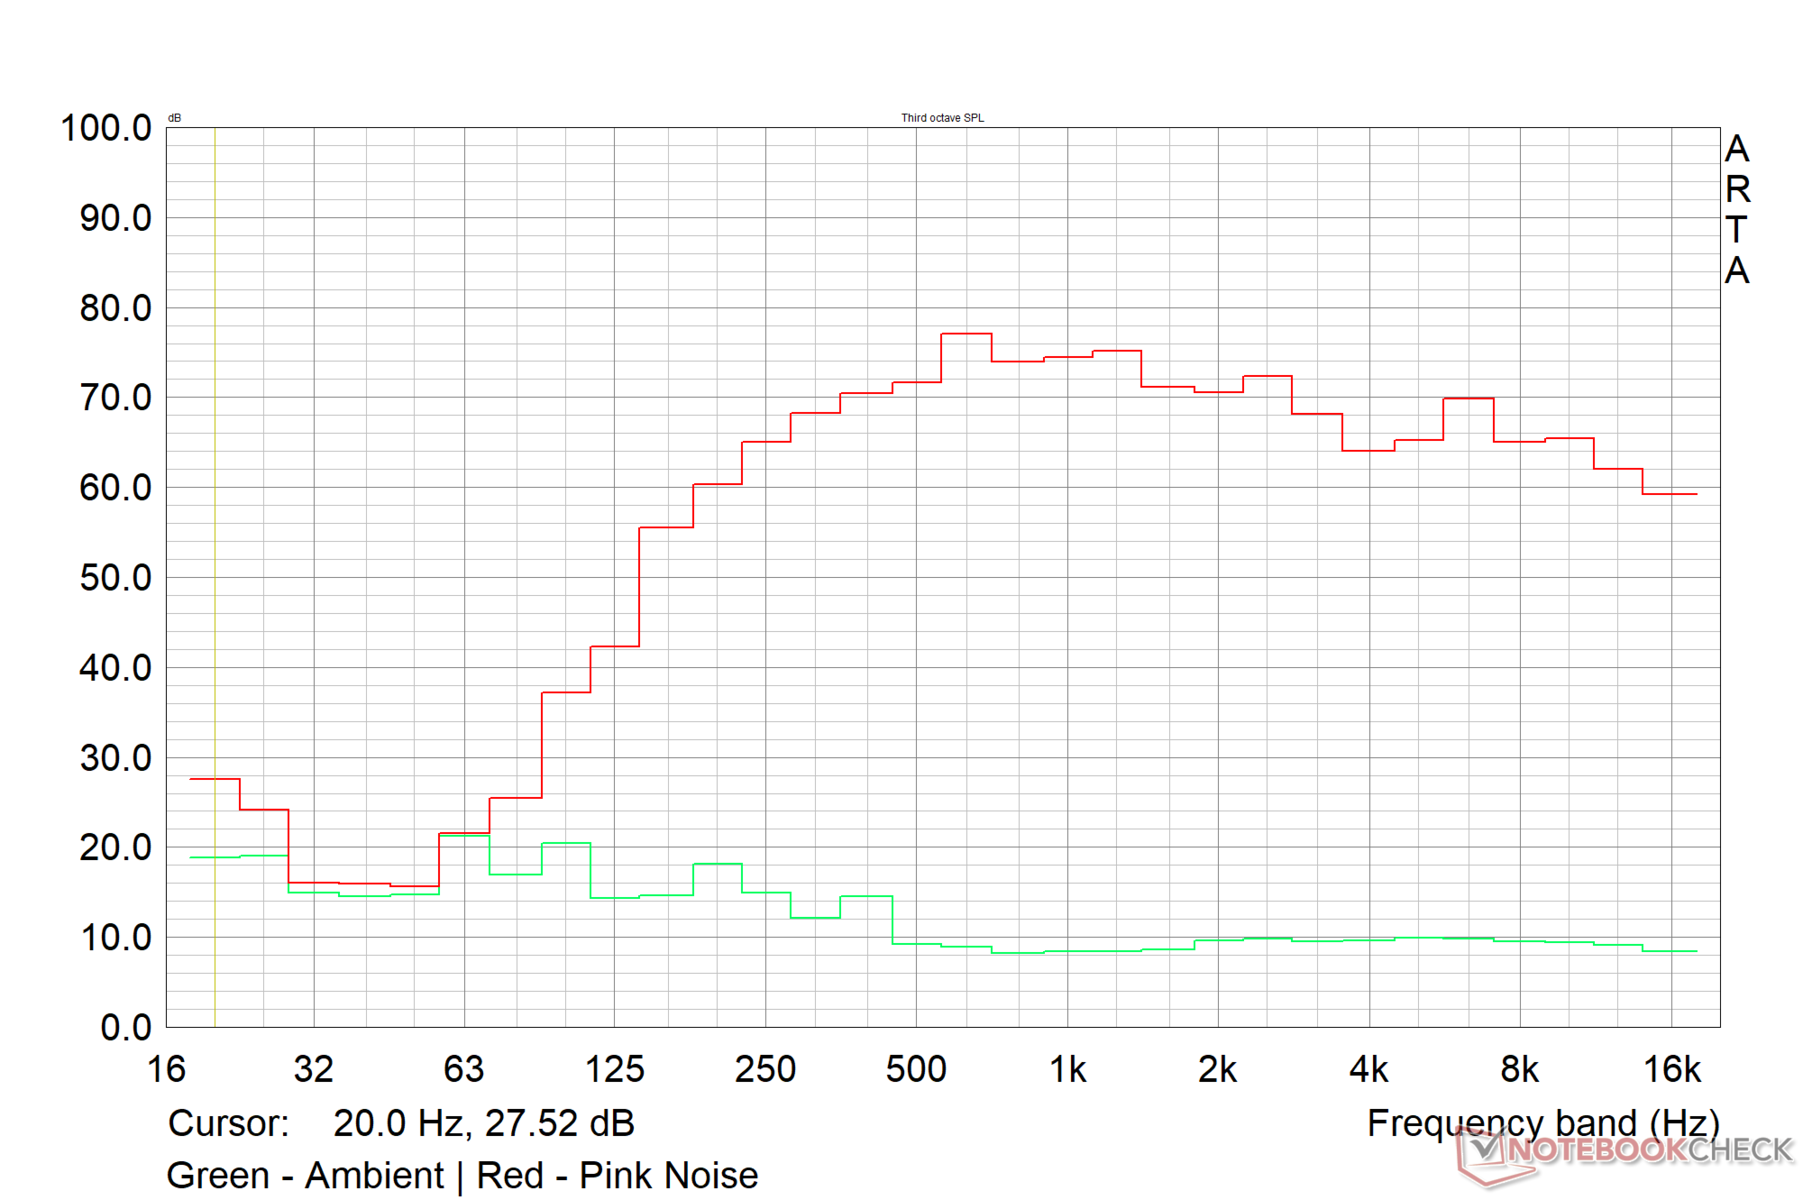
O Titan GT77 vem com uma configuração de quatro colunas com dois woofers de 2 W e dois alto-falantes de 2 W. A qualidade do som é alta a 83,4 dB(A) e é suficiente para preencher uma sala de tamanho médio sem muita distorção em volumes altos.
O chassi relativamente grande garante que os radiadores passivos tenham espaço suficiente para produzir uma resposta de graves decente. O Titan GT77 brilha ao reproduzir bem os médios e os altos. Subjetivamente, a qualidade de áudio é mais do que passível de passagem para a maioria dos casos de uso.
Os jogadores poderão obter o máximo do hardware de áudio disponível com um bom par de fones de ouvido. Entretanto, os audiófilos acharão um pouco decepcionante a falta de um conector mic/line-in dedicado.
A MSI não oferece certificação Dolby Atmos para o Titan GT77, mas o aplicativo Nahimic incluído oferece muitas opções de customização.
MSI Titan GT77 12UHS análise de áudio
(+) | os alto-falantes podem tocar relativamente alto (###valor### dB)
Graves 100 - 315Hz
(-) | quase nenhum baixo - em média 71.8% menor que a mediana
(+) | o baixo é linear (0% delta para a frequência anterior)
Médios 400 - 2.000 Hz
(-) | quase nenhum médio - em média 71.8% menor que a mediana
(+) | médios são lineares (0% delta para frequência anterior)
Altos 2 - 16 kHz
(-) | quase nenhum máximo - em média 71.8% menor que a mediana
(+) | os máximos são lineares (0% delta da frequência anterior)
Geral 100 - 16.000 Hz
(-) | o som geral não é linear (107.7% diferença em relação à mediana)
Comparado com a mesma classe
» 100% de todos os dispositivos testados nesta classe foram melhores, 0% semelhantes, 0% piores
» O melhor teve um delta de 6%, a média foi 18%, o pior foi 132%
Comparado com todos os dispositivos testados
» 96% de todos os dispositivos testados foram melhores, 0% semelhantes, 4% piores
» O melhor teve um delta de 4%, a média foi 23%, o pior foi 134%
Apple MacBook Pro 16 2021 M1 Pro análise de áudio
(+) | os alto-falantes podem tocar relativamente alto (###valor### dB)
Graves 100 - 315Hz
(+) | bons graves - apenas 3.8% longe da mediana
(+) | o baixo é linear (5.2% delta para a frequência anterior)
Médios 400 - 2.000 Hz
(+) | médios equilibrados - apenas 1.3% longe da mediana
(+) | médios são lineares (2.1% delta para frequência anterior)
Altos 2 - 16 kHz
(+) | agudos equilibrados - apenas 1.9% longe da mediana
(+) | os máximos são lineares (2.7% delta da frequência anterior)
Geral 100 - 16.000 Hz
(+) | o som geral é linear (4.6% diferença em relação à mediana)
Comparado com a mesma classe
» 0% de todos os dispositivos testados nesta classe foram melhores, 0% semelhantes, 100% piores
» O melhor teve um delta de 5%, a média foi 17%, o pior foi 45%
Comparado com todos os dispositivos testados
» 0% de todos os dispositivos testados foram melhores, 0% semelhantes, 100% piores
» O melhor teve um delta de 4%, a média foi 23%, o pior foi 134%
Gestão de energia: Consumo incoerente de energia na carga máxima
Consumo de energia
O adaptador de 330 W fornecido é suficiente para alimentar o Titan GT77 através de cargas de trabalho exigentes. O consumo de energia ociosa e de carga está no lado mais alto, o que não é surpreendente, dados os interiores carnudos. O consumo de energia sob carga é comparável com o do Raider GE77 HX 12UHS.
Uma carga combinada de Prime95 e Furmark mostra um poder de tração altamente oscilante, consistente com nossas observações anteriores durante o teste de estresse.
O Alienware x17 R2 com um Core i9-12900HK é cerca de 8% menos eficiente em termos de energia em geral.
| desligado | |
| Ocioso | |
| Carga |
|
Key:
min: | |
| MSI Titan GT77 12UHS i9-12900HX, GeForce RTX 3080 Ti Laptop GPU, 1920x1080, | Aorus 17X XES i9-12900HX, GeForce RTX 3070 Ti Laptop GPU, 1920x1080, | MSI Raider GE77 HX 12UHS i9-12900HX, GeForce RTX 3080 Ti Laptop GPU, 3840x2160, | MSI GE67 HX 12UGS i7-12800HX, GeForce RTX 3070 Ti Laptop GPU, 1920x1080, | Asus ROG Zephyrus Duo 16 GX650RX R9 6900HX, GeForce RTX 3080 Ti Laptop GPU, 3840x2400, | Alienware x17 R2 P48E i9-12900HK, GeForce RTX 3080 Ti Laptop GPU, 1920x1080, | Média NVIDIA GeForce RTX 3080 Ti Laptop GPU | Média da turma Gaming | |
|---|---|---|---|---|---|---|---|---|
| Power Consumption | 8% | 16% | 23% | 23% | -8% | 19% | 31% | |
| Idle Minimum * (Watt) | 30.21 | 18 40% | 13 57% | 16.1 47% | 19 37% | 24.1 20% | 17.2 ? 43% | 13.1 ? 57% |
| Idle Average * (Watt) | 32.42 | 28 14% | 19 41% | 17.1 47% | 24 26% | 28.5 12% | 23.3 ? 28% | 19 ? 41% |
| Idle Maximum * (Watt) | 33.7 | 36 -7% | 29 14% | 26.6 21% | 31 8% | 60 -78% | 30.8 ? 9% | 24.6 ? 27% |
| Load Average * (Watt) | 125.09 | 153 -22% | 143 -14% | 116.3 7% | 104 17% | 128.7 -3% | 121.2 ? 3% | 111.3 ? 11% |
| Witcher 3 ultra * (Watt) | 256 | 221 14% | 247 4% | 237 7% | 186.5 27% | 254 1% | ||
| Load Maximum * (Watt) | 321.88 | 290 10% | 352 -9% | 291.1 10% | 256 20% | 323 -0% | 276 ? 14% | 260 ? 19% |
* ... menor é melhor
Power Consumption - The Witcher 3 / Stress test
Power Consumption - External monitor
Vida útil da bateria
Como era de se esperar, os tempos de fuga da parede são de aproximadamente uma média, mesmo com a bateria máxima de 4 células 99,9 WHr.
Nós cronometrámos cerca de 7 horas e 13 minutos durante o teste de loop de vídeo H.264 1080p e quase 7 horas com nosso roteiro de navegação Wi-Fi padronizado, ambos com 150 cd/m2 de brilho. Portanto, o uso prudente no brilho inferior da tela rodando em modo Silencioso ou Super Bateria e com os efeitos RGB do chassi desligados pode fazer com que os tempos de execução se aproximem de um típico dia de trabalho.
É possível jogar com bateria por apenas cerca de 1,5 horas, mesmo com brilho reduzido da tela. Todos os testes de tempo de funcionamento da bateria foram realizados no modo MSHybrid a uma taxa de atualização de 60 Hz.
| MSI Titan GT77 12UHS i9-12900HX, GeForce RTX 3080 Ti Laptop GPU, 99.9 Wh | Aorus 17X XES i9-12900HX, GeForce RTX 3070 Ti Laptop GPU, 99 Wh | MSI Raider GE77 HX 12UHS i9-12900HX, GeForce RTX 3080 Ti Laptop GPU, 99.99 Wh | MSI GE67 HX 12UGS i7-12800HX, GeForce RTX 3070 Ti Laptop GPU, 99.9 Wh | Asus ROG Zephyrus Duo 16 GX650RX R9 6900HX, GeForce RTX 3080 Ti Laptop GPU, 90 Wh | Alienware x17 R2 P48E i9-12900HK, GeForce RTX 3080 Ti Laptop GPU, 87 Wh | Média da turma Gaming | |
|---|---|---|---|---|---|---|---|
| Duração da bateria | -28% | 4% | 16% | 4% | -57% | 8% | |
| H.264 (h) | 7.2 | 3.8 -47% | 6.5 -10% | 9.3 29% | 8.27 ? 15% | ||
| WiFi v1.3 (h) | 6.9 | 4.4 -36% | 5.4 -22% | 5.6 -19% | 7.8 13% | 2 -71% | 7.08 ? 3% |
| Witcher 3 ultra (h) | 1.5 | ||||||
| Load (h) | 1.4 | 1.4 0% | 2 43% | 2.1 50% | 1 -29% | 0.8 -43% | 1.496 ? 7% |
| Reader / Idle (h) | 9.8 | 8.4 | 12.5 | 3.9 | 7.84 ? |
Pro
Contra
Veredicto: Uma grande vitrine de 5.000 dólares para o Alder Lake-HX
A MSI reviveu sua icônica linha Titan após um hiato de dois anos, e o Titan GT77 faz tudo o que pode para estar à altura do nome. O chassi redesenhado é agora mais fino e oferece uma estética melhor do que a geração anterior Titans. Embora feito principalmente de plástico, o Titan GT77 ainda consegue se sentir premium e bem construído.
Os recursos de conectividade estão ao mesmo nível do curso de um laptop de 2022. A webcam 720p é inapropriada para o preço pedido. O teclado mecânico Cherry MX e o espaçoso touchpad são adições bem-vindas no Titan GT77.
O painel FHD em nossa unidade, que atualmente não está disponível no varejo, era na melhor das hipóteses médio com distribuição de brilho e relação de contraste medíocres. Entretanto, ele oferece uma taxa de atualização de 360 Hz e tempos de resposta baixos que devem agradar aos jogadores competitivos. Para todos os outros fins, recomendamos optar por SKUs com um painel UHD.
O Core i9-12900HX e a combinação RTX 3080 Ti Laptop GPU de 175 W oferece potência de processamento para praticamente qualquer carga de trabalho, desde que você não se importe com as altas emissões de calor e ruído.
Não há muitos laptops Alder Lake-HX na natureza no momento. Mas se você tem bolsos profundos e precisa de um desempenho absolutamente sem obstáculos, de alto nível e com aparência a condizer, há muito poucos laptops de jogos que podem segurar uma vela para o MSI Titan GT77.
No entanto, o Titan GT77 não está sem algumas falhas gritantes. A MSI tem algum trabalho cortado na frente do subsistema de armazenamento - o leitor de cartões SD certamente pode usar um choque de velocidade e as unidades NVMe definitivamente merecem uma solução térmica capaz. O desempenho do Wi-Fi 6E também precisa ser examinado. O conjunto de software da MSI também precisa de alguma correção de erros, particularmente o MSI True Color. A funcionalidade OverDrive da MSI também pode usar alguns ajustes para garantir uma partilha de energia mais equitativa entre a CPU e a GPU para relógios consistentes e consumo de energia.
Você deve sair e pegar o Titan GT77 imediatamente? Esta é uma pergunta discutível se você estiver preparado para obter cinco mil dólares. No entanto, o Titan GT77 tem alguma competição capaz que pode lhe poupar um pouco de massa. O Raider GE67 HX 12UGS com o Core i9-12800HX e RTX 3070 Ti, por exemplo, muitas vezes se aproxima bastante do Titan GT77 de primeira categoria por metade do preço (US$ 2.500)
.Se um display de 360 Hz é o que você procura, o Alienware x17 R2 oferece desempenho comparável, embora apresente o Core i9-12900HK por US$3.900. O Aorus 17X XES fica atrás do Titan GT77 no desempenho geral da CPU e GPU, mas seu preço de US$ 2.999 merece uma consideração. Se características como o teclado mecânico e uma infinidade de slots NVMe forem mais importantes, você ainda pode obter o Titan GT77 com um Core i7-12800HX e um RTX 3070 Ti por cerca de US$3.100.
Preço e Disponibilidade
Nosso teste MSI Titan GT77 é uma unidade personalizada semeada diretamente pela Intel, portanto não há informações oficiais sobre preços disponíveis. No entanto, a Intel nos disse que esta configuração chega perto de US$ 5.000.
As unidades de varejo do Titan GT77 estão aos poucos se tornando mundialmente conhecidas. Atualmente, o Titan GT77 com o Core i9-12900HX, RTX 3080 Ti, 64 GB DDR5-4800 RAM, 2 TB NVMe SSD, e um display UHD de 120 Hz está disponível por cerca de US$5.361 na loja oficial da MSI na Malásia https://mystore.msi.com/product/msi-titan-gt77-12uhs-034/
Aqueles nos EUA, podem encomendar um Titan GT77 12UHS-007 com Core i7-12800HX e RTX 3080 Ti por US$3.899. Há também um Titan GT77 12UHS-009 disponível com um Core i7-12800HX e RTX 3070 Ti por US$3.053.
MSI Titan GT77 12UHS
- 08/28/2022 v7 (old)
Vaidyanathan Subramaniam
Price comparison

