Análise da GPU Nvidia Ada RTX 40 Laptop: GPU portátil RTX 4090 de 175 W supera uma RTX 3090 de 350 W em desempenho e eficiência energética
As GPUs para notebooks são tradicionalmente retidas por limitações de potência e freqüência em comparação com suas contrapartes de mesa.
Embora ainda não estejamos no estágio em que a física pode ser descontada, as GPUs de hoje evoluíram para oferecer mais desempenho por watt do que nunca.
No ano passado, Nvidia anunciou a arquitetura Ada Lovelace para desktops de consumo, marcada pelo advento da série GeForce RTX 40. Em nossos testes, a RTX 4090, RTX 4080e oRTX 4070 Ti os cartões de mesa ofereciam um desempenho significativo e um aumento de eficiência em comparação com seus equivalentes Turing.
Hoje, é a vez das variantes móveis da Ada repetirem a façanha.
Portáteis com GPUs móveis Ada, tais como o RTX 4090 e RTX 4080 As GPUs para notebooks estão agora disponíveis em todo o mundo. Os dispositivos com cartões Ada de médio alcance serão lançados no final deste mês.
Arquitetura móvel Ada: RTX 40 móvel em comparação com outras GPUs Nvidia
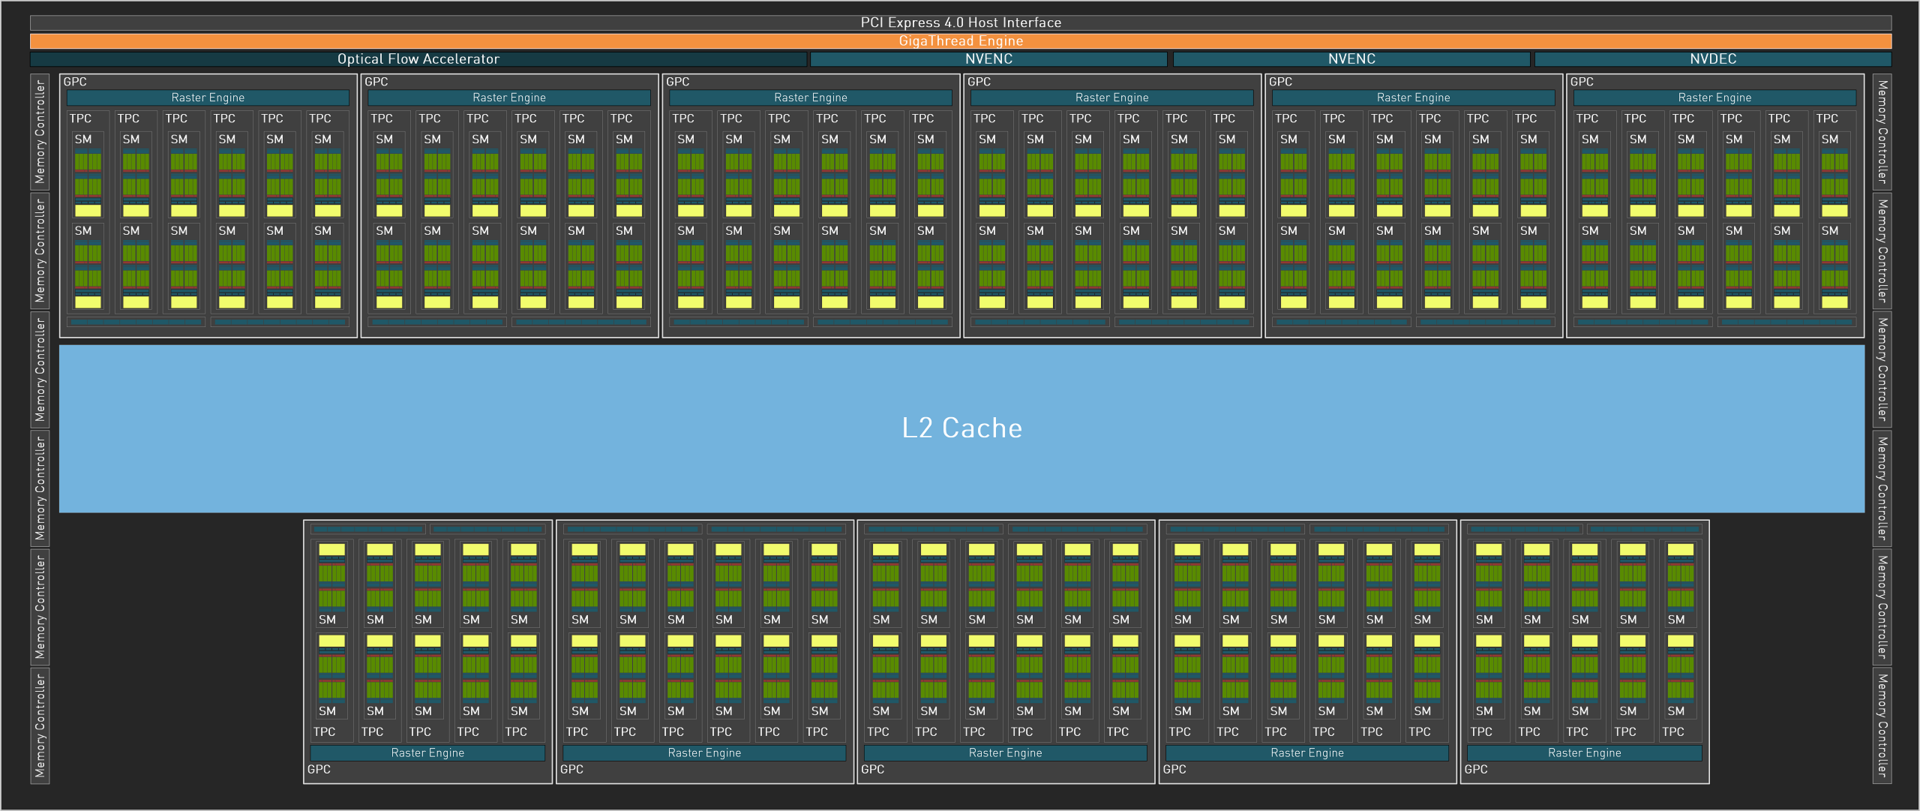
Não é possível carregar uma gordura AD102 completa em um chassi de laptop sem comprometer seriamente a vida útil da bateria e o gerenciamento térmico. Portanto, a linha móvel RTX 40 começa a partir da GPU AD103, que é feita de novo para as GPUs convencionais como a RTX 4080 e abaixo e, portanto, não é uma parte AD102 cortada.
Portanto, a GPU para laptop RTX 4090 é essencialmente a mesma que a RTX 4080 de mesa com nomenclatura enganosa. No entanto, é aí que terminam as semelhanças entre estas placas.
A GPU portátil RTX 4090 pode ser configurada em uma faixa TDP entre 80 W e 150 W, o que resulta em relógios de impulso que variam de 1.455 MHz a 2.040 MHz.
Aprendendo com o Ampere fiascoa partir de agora, os OEMs estão indicando proativamente a potência da GPU nas especificações, o que deve dar aos compradores uma melhor perspectiva de desempenho em relação à configuração e ao chassi do laptop.
Entretanto, observe que nem todos os OEMs publicam valores de Dynamic Boost.
A GPU para laptop RTX 4090 usa o mesmo barramento de memória de 256 bits da RTX 4080, mas sofre de uma redução de ~20% na largura de banda de memória, embora seja ligeiramente mais rápida do que a GPU para laptop RTX 3080 Ti.
A natureza faminta de poder do GDDR6X significa que ele não pode ser usado em um fator de forma de laptop. Nvidia disse que o GDDR6 VRAM em Ada mobile foi projetado para ser altamente eficiente com melhor abertura do relógio, baixa voltagem e estados de memória de menor potência.
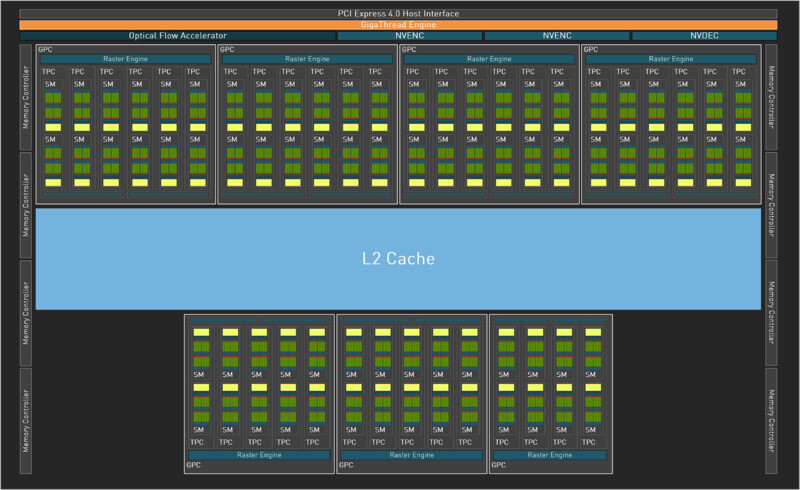
A GPU para notebook RTX 4080 utiliza a matriz AD104 da RTX 4070 Ti de mesa com uma ligeira redução nas contagens de núcleo CUDA que coincide com o que tínhamos visto antes na GPU para notebook RTX 3080 Ti.
Embora a GPU portátil RTX 3080 Ti pareça melhor no papel, pelo menos em termos de características VRAM, o móvel RTX 4080 compensa esta deficiência com melhorias arquitetônicas no Ada.
| Especificação | RTX 4090 FE | RTX 4080 FE | RTX 4070 Ti | RTX 4090 GPU Portátil | RTX 4080 GPU Portátil | RTX 3090 Ti FE | RTX 3090 FE | RTX 3080 Ti FE | RTX 3080 FE | RTX 3080 Ti GPU Portátil |
| Chip | AD102 | AD103 | AD104 | AD103 | AD104 | GA102 | GA102 | GA102 | GA102 | GA103 |
| Processo FinFET | Personalizado 4N | Personalizado 4N | Personalizado 4N | Personalizado 4N | Personalizado 4N | 8 nm | 8 nm | 8 nm | 8 nm | 8 nm |
| CUDA Cores | 16,384 | 9,728 | 7,680 | 9,728 | 7,424 | 10,752 | 10,496 | 10,240 | 8,704 | 7,424 |
| Unidades de Textura | 512 | 304 | 240 | 304 | 232 | 336 | 328 | 320 | 272 | 232 |
| Tensor Cores | 512 4º G. | 304 4º G. | 240 4º G. | 3044º G. | 2324º G. | 336 3º G. | 328 3º G. | 320 3º G. | 272 3º G. | 232 3º G. |
| RT Cores | 128 3ª G. | 76 3ª G. | 60 3ª G. | 76 3ª G. | 58 3ª G. | 84 2ª G. | 82 2ª G. | 80 2ª G. | 68 2ª G. | 58 2ª G. |
| Relógio de Base GPU | 2.235 MHz | 2.205 MHz | 2.310 MHz | 1.590 MHz | 1.530 MHz | 1.560 MHz | 1.395 MHz | 1.365 MHz | 1.440 MHz | 1.230 MHz |
| Relógio de impulso GPU | 2.520 MHz | 2.505 MHz | 2.760 MHz | 2.040 MHz | 1.995 MHz | 1.860 MHz | 1.695 MHz | 1.665 MHz | 1.710 MHz | 1.590 MHz |
| Barramento de memória | 384-bit | 256-bit | 192-bit | 256-bit | 192-bit | 384-bit | 384-bit | 384-bit | 384-bit 320-bit | 256-bit |
| Largura de banda de memória | 1.008 GB/s | 716,8 GB/s | 504 GB/s | 576GB/s | 432GB/s | 1.008 GB/s | 936 GB/s | 912 GB/s | 760 GB/s | 512 GB/s |
| Memória de vídeo | 24 GB GDDR6X | 16 GB GDDR6X | 12 GB GDDR6X | 16 GB GDDR6 | 12 GB GDDR6 | 24 GB GDDR6X | 24 GB GDDR6X | 12 GB GDDR6X | 10 GB GDDR6X | 16 GB GDDR6 |
| Consumo de energia | 450 W | 320 W | 285 W | 150 W (+25 W DB) | 150 W (+25 W DB) | 450 W | 350 W | 350 W | 350 W 320 W | 150 W (+25 W DB) |
A geração Ada também traz consigo algumas mudanças notáveis na implementação do Max-Q da Nvidia. Quando o Max-Q estreou com a Turing, o foco estava mais voltado apenas para a classificação do TDP. Os cartões em si foram nitidamente rotulados como Max-Q, o que tornou a seleção mais fácil.
Entretanto, da Ampere, Nvidia optou por colocar tanto a imprensa quanto os usuários finais em um enigma, removendo a marca Max-Q e, em vez disso, usando-a como um termo guarda-chuva para tecnologias como o Whisper Mode, Resizeable BAR, Dynamic Boost, Advanced Optimus, e similares.
Os OEMs agora têm a opção de usar qualquer subconjunto de tecnologias Max-Q que eles considerem adequado, e também caber em uma GPU grande em um chassi fino para direitos de gabarito enquanto configuram seu TDP próximo aos valores base.
Com a Ada, Nvidia está introduzindo o que chama de 5ª geração Max-Q, na qual a memória DLSS 3 e GDDR6 de baixa potência desempenham um papel integral.
Novos dutos DLSS 3 e ray tracing pipelines
Abordamos brevemente o DLSS 3 e as novas funções de traçado de raio em Ada em nossa revisão do Edição dos fundadores da RTX 4090. Essencialmente, o DLSS 3 usa o novo Acelerador de Fluxo Óptico Standalone (OFA) da Ada para inserir estruturas na mosca. A geração de armações acontece na GPU e não no jogo.
Mais precisamente, o DLSS 3 é uma combinação da Super Resolução DLSS 2 existente e geração de quadros. De acordo com Nvidia, o DLSS 3 reconstrói 7/8º da imagem - 3/4º do primeiro quadro é reconstruído com DLSS 2 Super Resolution enquanto o segundo quadro completo é criado com geração de quadros.
Como a geração de quadros acontece na GPU, o DLSS 3 pode ajudar a aumentar os quadros em títulos vinculados à CPU ou pesados à física, como Microsoft Flight Simulator 2020.
Note que o DLSS 3 requer uma GPU RTX 40, título suportado, e permitindo agendamento acelerado de GPU por hardware e Nvidia Reflex.
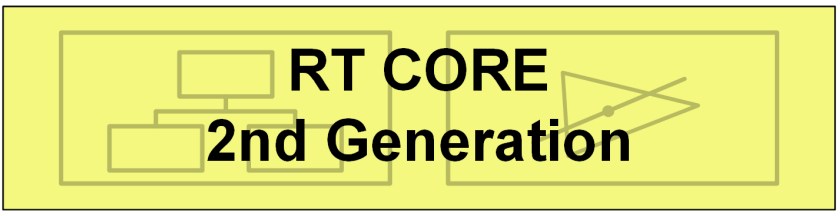
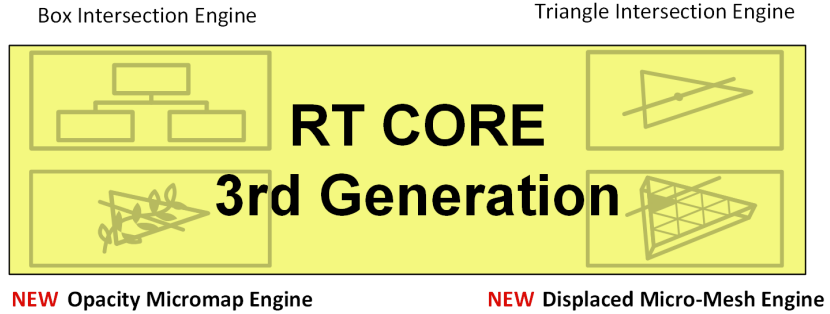
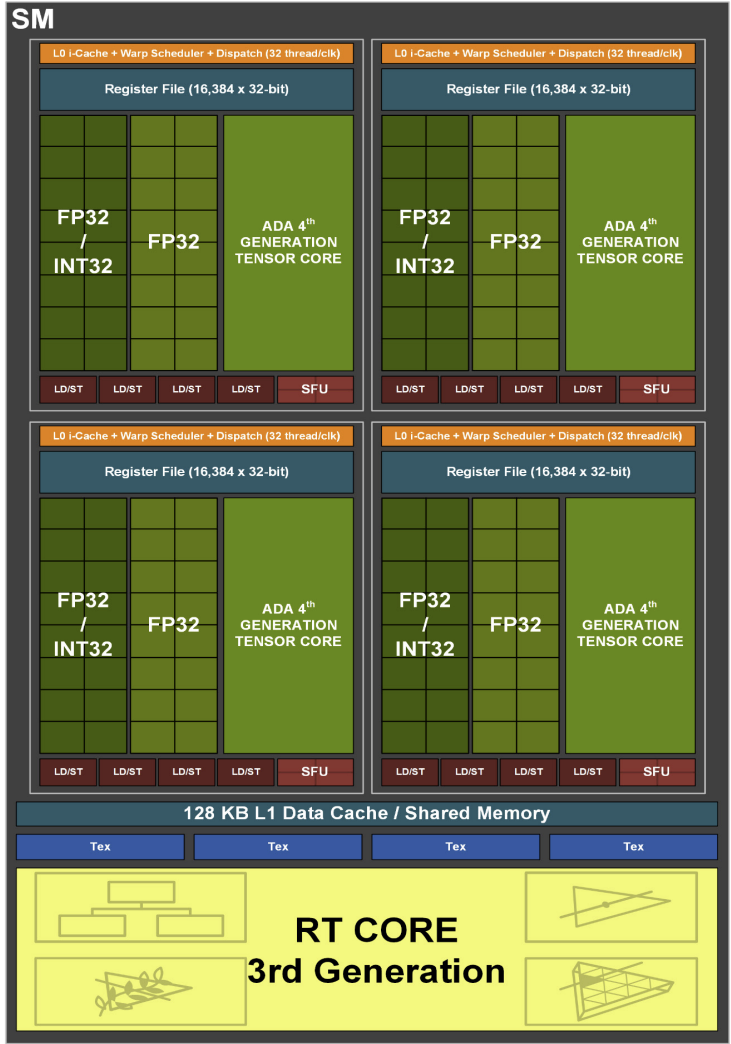
A Ada apresenta núcleos de traçado de raio de terceira geração (RT) com duas novas funções - o motor de micromapa de opacidade e o motor de micro-malha deslocado. Isto se soma ao motor de interseção de caixa e ao motor de interseção triangular já presente em Ampere.
Há também um novo Shader Execution Reordering (SER) pipeline, que funciona como um agendador eficiente para os fios de raios secundários. Enquanto SER pode potencialmente acelerar cálculos intensivos de RT como traçado de traçado, requer o apoio do desenvolvedor do jogo.
De acordo com Nvidia, a implementação da SER deve ser bastante simples. Os desenvolvedores serão capazes de obter feedback sobre o desempenho da SER através da Nvidia NSight. A empresa disse que está trabalhando com a Microsoft e outros para adicionar suporte SER a APIs gráficas, como DirectX.
Dispositivos de teste: Creme da safra
Temos os seguintes dispositivos de teste em nossos laboratórios:
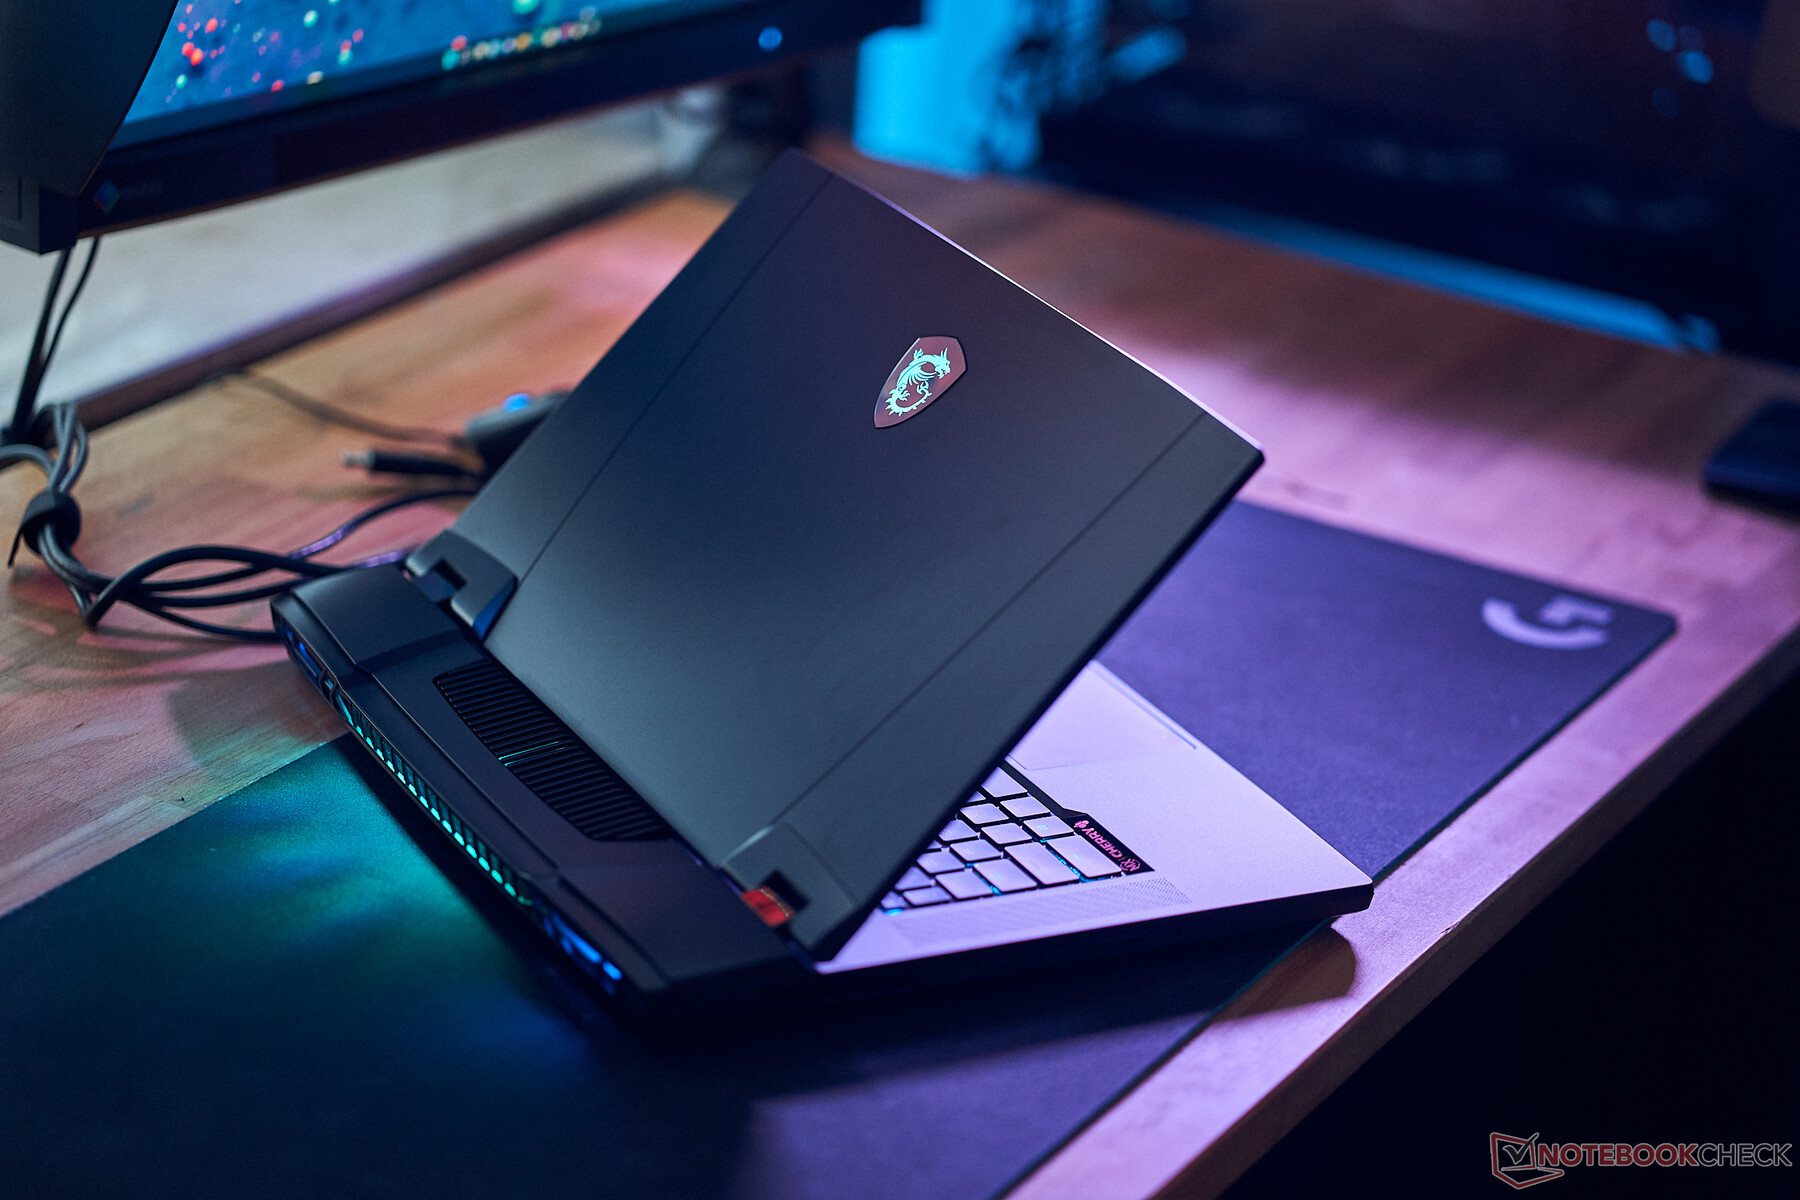
- MSI Titan GT77 HX 13V (Núcleo i9-13950HX + GPU portátil RTX 4090)
- Schenker XMG Neo 16 (Núcleo i9-13900HX + GPU portátil RTX 4090)
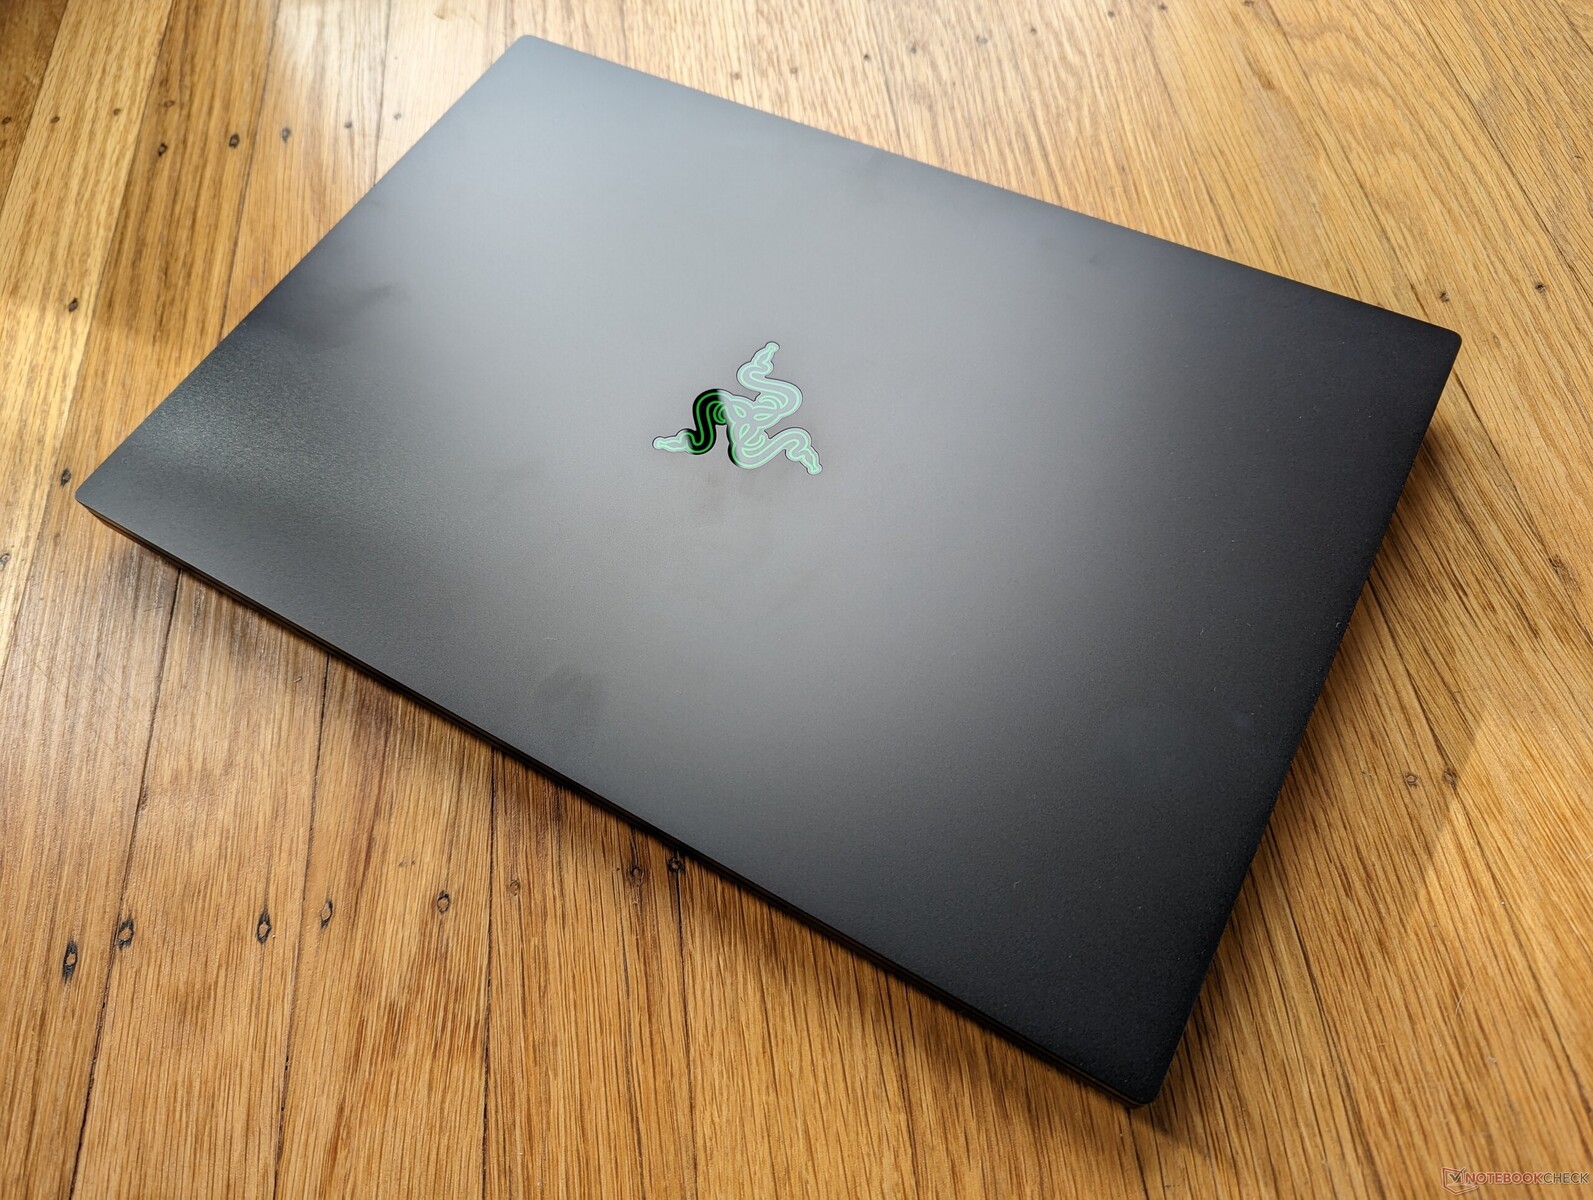
- Lâmina Razer 16 Início de 2023 (Core i9-13950HX + RTX 4080 GPU laptop)
Todos os dispositivos testados foram executados em seus modos de desempenho máximo com comutação do MUX para o dGPU. Isto permitiu que o RTX 4090 e RTX 4090 utilizassem o TGP completo de 175 W incluindo o Dynamic Boost.

Nota: Somos os primeiros a receber uma variante antecipada do Schenker XMG Neo 16. Como este é um modelo de pré-produção, as pontuações podem não refletir o desempenho real do dispositivo em nossa revisão oficial com uma amostra de varejo.
Desempenho sintético: Móvel RTX 4090 bem nos calcanhares de uma mesa RTX 4070 Ti
O desempenho cumulativo do 3DMark vê a GPU do laptop RTX 4090 tanto no Titan GT77 HX quanto no XMG Neo 16 funcionando em linhas similares, indicando que não há nenhum engarrafamento potencial em outros pontos da tubulação.
A GPU Razer Blade 16 RTX 4080 da Razer Blade rastreia em 19% em comparação com a GPU RTX 4090, que é semelhante ao delta percentual entre as variantes de desktop destas GPUs.
Dito isto, a GPU para notebook RTX 4090 é até 35% mais lenta que a placa de mesa RTX 4090 Founders Edition, enquanto que a Radeon RX 7900 XTX é inferior em até 26% em comparação com a Radeon. Entretanto, seu desempenho é comparável ao da RTX 4070 Ti de mesa.
Apesar de apresentar um número similar de núcleos CUDA, as limitações do TDP significam que a Edição 320 W RTX 4080 Founders é 20% mais rápida em comparação com uma GPU de 175 W RTX 4090 em desempenho geral 3DMark.
Em comparação com a geração anterior de GPUs móveis, a geração Ada parece oferecer elevações significativas de desempenho. A GPU portátil RTX 4090 é 76% mais rápida em todos os testes 3DMark considerados em conjunto do que a média da GPU portátil RTX 3080 Ti.
Bons 43% de ganhos também são observados com a GPU para laptop RTX 4080 em comparação com a média da GPU RTX 3080 Ti móvel.
Desempenho no jogo: GPU laptop RTX 4090 no mesmo nível do RTX 4070 Ti a 4K
Uma tendência semelhante é observada também nos jogos, onde a GPU do laptop RTX 4090 no XMG Neo 16 está a uma distância impressionante do desktop RTX 4070 Ti no desempenho acumulado dos jogos.
Vemos que a GPU para notebook RTX 4080 segue a variante móvel RTX 4090 em até 17%, o que é semelhante aos deltas que vemos entre as versões desktop do RTX 4090 e do RTX 4080.
As melhorias na arquitetura parecem conferir ao laptop RTX 4080 uma vantagem de 33% sobre o GPU do laptop RTX 3080 Ti no desempenho geral dos jogos, mas o RTX 4090 oferece um ganho de 61% sobre o carro-chefe móvel da Ampere.
Assim como suas contrapartes de mesa, as GPUs móveis RTX 40 também parecem ser facilmente obstruídas pela CPU com resoluções mais baixas. O Metro Exodus (não-Ampliado), por exemplo, vê a GPU do laptop RTX 4090 atrás do desktop RTX 4070 Ti em até 19% a 1080p Ultra. Entretanto, a 4K Ultra, a principal GPU móvel da Ada tem o mesmo desempenho da RTX 4070 Ti.
Também vemos deltas crescentes entre a GPU do laptop RTX 4090 e a placa de mesa RTX 4090 a 4K Ultra em comparação com 1080p ou QHD Ultra por este motivo - a Ada simplesmente adora ser tributada a 4K.
Curiosamente, a distância entre a GPU do laptop RTX 4080 e a GPU do laptop RTX 4090 também aumenta a 4K.
Os jogos vinculados à CPU como Mafia : Edição Definitiva mostram diferenças perceptíveis entre a GPU para laptop RTX 4070 Ti e RTX 4090 apenas a 1080p. À medida que a resolução aumenta, a GPU do laptop RTX 4090 é capaz de fechar a lacuna ou mesmo vencer o RTX 4070 Ti por um whisker neste jogo.
Ray tracing performance
Apesar de ostentar o mesmo número de núcleos RT que o desktop RTX 4080, a GPU do laptop RTX 4090 pode ser até 25% mais lenta no desempenho geral de traçado de raio. No entanto, vemos excelentes ganhos de até 58% em comparação com a GPU para notebook RTX 3080 Ti.
Enquanto vemos números de fps muito bons em 1080p nativos, o traçado de raio nativo de 4K a taxas de quadros jogáveis ainda não está dentro do reino das possibilidades, como visto nos resultados do Cyberpunk 2077. Nvidia está empurrando o DLSS 3 como o único meio viável de jogar em resoluções mais altas com RT habilitado.
Desempenho DLSS 3
A tabela a seguir ilustra os benefícios do DLSS 3 nos títulos suportados com o GPU para laptop RTX 4090 no MSI Titan GT77 HX 13V.
Em comparação com o nativo 4K, o DLSS 3 em modo balanceado mostra vantagens de desempenho fenomenais em configurações 4K Ultra. O Cyberpunk 2077 tem sido o cartaz infantil da Nvidia para traçado de raio e desempenho DLSS há algum tempo, e, portanto, vemos um ganho estupendo de 331% em média de fps após habilitar o DLSS 3 em comparação com o nativo 4K em configurações Ultra.
| Jogo | Colocando | DLSS off | DLSS on (Equilibrado) | Diferença |
|---|---|---|---|---|
| Homem-Aranha Miles Morales | 4K Ultra | 83 FPS | 132 FPS | +59 % |
| O Witcher 3 4.00 | 4K RT Ultra | 27 FPS | 50 FPS | +85 % |
| Cyberpunk 2077 1.5 | 4K RT Ultra | 22 FPS | 95 FPS | +331 % |
| Deus da Guerra | 4K Ultra | 80 FPS | 111 FPS | +38 % |
| Horizon Zero Dawn | 4K Ultra | 95 FPS | 143 FPS | +51 % |
MSI Titan GT77 HX 13VI
| baixo | média | alto | ultra | QHD | 4K DLSS | 4K | |
|---|---|---|---|---|---|---|---|
| GTA V (2015) | 184.1 | 182.6 | 140.9 | 138.5 | 175.7 | ||
| The Witcher 3 (2015) | 619 | 546 | 422 | 198.9 | 160 | ||
| Dota 2 Reborn (2015) | 225 | 206 | 194.1 | 185.9 | 178.9 | ||
| Final Fantasy XV Benchmark (2018) | 230 | 221 | 187.4 | 162.9 | 94.7 | ||
| X-Plane 11.11 (2018) | 203 | 177.5 | 134.1 | 114.3 | |||
| Far Cry 5 (2018) | 186 | 173 | 160 | 159 | 113 | ||
| Strange Brigade (2018) | 490 | 396 | 391 | 373 | 309 | 159.3 | |
| Shadow of the Tomb Raider (2018) | 245 | 227 | 219 | 214 | 187 | 103 | |
| Metro Exodus (2019) | 204 | 183 | 153 | 132 | 116 | 81 | |
| Control (2019) | 240 | 232 | 187 | 122 | 63 | ||
| Borderlands 3 (2019) | 201 | 176 | 162 | 151 | 130 | 76 | |
| Horizon Zero Dawn (2020) | 209 | 189 | 174 | 163 | 154 | 131 | 95 |
| Mafia Definitive Edition (2020) | 219 | 189 | 179 | 161 | 93 | ||
| Watch Dogs Legion (2020) | 152 | 144 | 131 | 120 | 109 | 69 | |
| F1 2021 (2021) | 501 | 449 | 417 | 209 | 192.4 | 114.4 | |
| Far Cry 6 (2021) | 167 | 147 | 144 | 135 | 89 | ||
| Forza Horizon 5 (2021) | 220 | 181 | 174 | 124 | 113 | 95 | |
| God of War (2022) | 201 | 200 | 180 | 133 | 115 | 80 | |
| Rainbow Six Extraction (2022) | 378 | 347 | 346 | 314 | 219 | 112 | |
| Dying Light 2 (2022) | 240 | 206 | 174 | 121 | 62 | ||
| GRID Legends (2022) | 254 | 230 | 210 | 199 | 190 | 132 | |
| Cyberpunk 2077 1.6 (2022) | 156 | 144 | 138 | 135 | 98 | 56 | |
| Ghostwire Tokyo (2022) | 237 | 236 | 234 | 231 | 206 | 100 | |
| Tiny Tina's Wonderlands (2022) | 339 | 289 | 224 | 182 | 131 | 70 | |
| F1 22 (2022) | 316 | 294 | 283 | 138.2 | 90.1 | 44.9 | |
| Call of Duty Modern Warfare 2 2022 (2022) | 230 | 215 | 183 | 176 | 135 | 126 | 85 |
| Spider-Man Miles Morales (2022) | 134 | 131 | 118 | 116 | 113 | 83 | |
| The Callisto Protocol (2022) | 195 | 181 | 145 | 144 | 114 | 68 | |
| The Witcher 3 v4 (2023) | 240 | 189 | 173 | 150 | 104 | 50 | |
| Dead Space Remake (2023) | 147 | 141 | 130 | 129 | 100 | 53 |
Razer Blade 16 Early 2023
| baixo | média | alto | ultra | QHD DLSS | QHD FSR | QHD | 4K DLSS | 4K FSR | 4K | |
|---|---|---|---|---|---|---|---|---|---|---|
| GTA V (2015) | 186.6 | 185.2 | 183.4 | 140.7 | 125.2 | 143.7 | ||||
| The Witcher 3 (2015) | 609.6 | 462.7 | 353.5 | 176.8 | 120.6 | |||||
| Dota 2 Reborn (2015) | 218 | 204 | 196 | 194.7 | 176.7 | |||||
| Final Fantasy XV Benchmark (2018) | 195.8 | 184.1 | 157.8 | 120.1 | 74.1 | |||||
| X-Plane 11.11 (2018) | 201 | 177.7 | 137 | 117.5 | ||||||
| Strange Brigade (2018) | 438 | 365 | 351 | 323 | 237 | 122.3 | ||||
| Shadow of the Tomb Raider (2018) | 228 | 201 | 196 | 176 | 154 | 84 | ||||
| Metro Exodus (2019) | 197 | 170.4 | 145 | 121.7 | 102 | 67 | ||||
| Control (2019) | 239.1 | 204.7 | 157 | 102 | 50.1 | |||||
| Borderlands 3 (2019) | 207.7 | 176.6 | 158.1 | 133.5 | 108.7 | 59.8 | ||||
| Valorant (2020) | 336 | |||||||||
| Horizon Zero Dawn (2020) | 128 | 112 | ||||||||
| Mafia Definitive Edition (2020) | 280.3 | 184 | 171.3 | 121.6 | 70.4 | |||||
| Watch Dogs Legion (2020) | 140 | 129 | 121 | 110 | 93 | 56 | ||||
| Far Cry 6 (2021) | 181 | 149 | 134 | 125 | 115 | 71 | ||||
| Dying Light 2 (2022) | 184.1 | 160.4 | 140.9 | 97.8 | 48.6 | |||||
| Cyberpunk 2077 1.6 (2022) | 121.1 | 118.1 | 113.8 | 106.2 | 81.2 | 40 | ||||
| Ghostwire Tokyo (2022) | 198.7 | 159.6 | 154 | 145 | 135.9 | 73.1 | ||||
| The Callisto Protocol (2022) | 177.8 | 159.8 | 119.9 | 120.4 | 93.1 | 55.3 | ||||
| Baldur's Gate 3 (2023) | 168.3 | 160 | 121.9 | 120.5 | 66.7 | |||||
| Cyberpunk 2077 (2023) | 110 | 93.6 | 80.6 | 44.4 | 36.2 | 35 | ||||
| Alan Wake 2 (2023) | 66.9 | 37 | ||||||||
| Skull & Bones (2024) | 50 | |||||||||
| Horizon Forbidden West (2024) | 56.1 | 54.8 | 39.5 | |||||||
| F1 24 (2024) | 226 | 236 | 251 | 117.7 | 118.8 | 92.5 | 76.3 | 65 | 38.8 | |
| Black Myth: Wukong (2024) | 110 | 89 | 71 | 42 | 47 | 31 | 33 | 18 | ||
| Star Wars Outlaws (2024) | 84.3 | 81.5 | 74.1 | 64.4 | 59.1 | 47.7 | 35.8 | 20.5 | ||
| Call of Duty Black Ops 6 (2024) | 107 | 100 | 65 | 62 | ||||||
| Stalker 2 (2024) | 63.1 | 50.3 | 30.9 | |||||||
| Marvel Rivals (2024) | 145 | 120 | 88 | 74 | 56 | |||||
| Indiana Jones and the Great Circle (2024) | 96.4 | 80.3 | 51 | |||||||
| Kingdom Come Deliverance 2 (2025) | 92.3 | 92.3 | 71.2 | |||||||
| Monster Hunter Wilds (2025) | 63.3 | 62 | 54.8 | 48 | 34.4 | |||||
| Civilization 7 (2025) | 155.1 | 117.3 | 105.8 | 50.2 | ||||||
| Assassin's Creed Shadows (2025) | 69 | 50 | 52 | 44 | 41 | 32 | ||||
| Doom: The Dark Ages (2025) | 112.5 | 102.8 | 94.6 | 93.8 | 86.6 | 65.4 | 51.9 | 53.1 | 34.7 | |
| F1 25 (2025) | 172.5 | 171.9 | 44.2 | 46.1 | 26.5 | 24.2 | 12.2 | |||
| Borderlands 4 (2025) | 58.5 | 30.5 | 46.1 | 26.2 | ||||||
| Battlefield 6 (2025) | 128.9 | 121.9 | 115.1 | 103.8 | 113.8 | 75.5 | 70.1 | 53.7 | ||
| The Outer Worlds 2 (2025) | 83.7 | 79.7 | 73.6 | 61.1 | 31.1 | 43.4 | ||||
| ARC Raiders (2025) | 88.4 | 89.4 | 68.1 | |||||||
| Anno 117: Pax Romana (2025) | 79.8 | 48.2 | 35.2 | |||||||
| Call of Duty Black Ops 7 (2025) | 58 | 56 | 38 | |||||||
| Resident Evil Requiem (2026) | 66.6 | 46.1 | 21.6 | |||||||
| Death Stranding 2 (2026) | 72.1 | 80 | 60.3 | 37.9 | ||||||
| Crimson Desert (2026) | 104.2 | 88.7 | 76.2 | 69 | 68.1 | 59.3 | 48 | 35.9 | ||
| Pragmata (2026) | 114 | 97.9 | 81 | 64.8 | 44.2 | |||||
| War Thunder (2026) | 304 | 127 | 88.6 | 37.9 | ||||||
| Forza Horizon 6 (2026) | 91 | 78 | 59 | 58 | 44 | 37 | 27 | |||
| 007 First Light (2026) | 78.6 | 69.6 | 55.9 | 51.8 | 28.3 |
Schenker XMG Neo 16
| baixo | média | alto | ultra | QHD | 4K | |
|---|---|---|---|---|---|---|
| GTA V (2015) | 137.5 | 137.7 | 88.9 | |||
| The Witcher 3 (2015) | 216.4 | 137.1 | ||||
| Dota 2 Reborn (2015) | 227 | 202 | 191.2 | 177.3 | 179.4 | |
| Final Fantasy XV Benchmark (2018) | 180.7 | 158 | 91.5 | |||
| X-Plane 11.11 (2018) | 204 | 179.7 | 135.5 | 124.2 | ||
| Strange Brigade (2018) | 482 | 396 | 372 | 350 | 311 | 160.3 |
| Shadow of the Tomb Raider (2018) | 207 | 168 | 103 | |||
| Metro Exodus (2019) | 131.51 | 117.44 | 83.98 | |||
| Control (2019) | 183.7 | 121.9 | 63.5 | |||
| Borderlands 3 (2019) | 176 | 132.34 | 70.5 | |||
| Mafia Definitive Edition (2020) | 187.9 | 168.1 | 91.8 | |||
| Watch Dogs Legion (2020) | 127 | 113 | 71 | |||
| Assassin´s Creed Valhalla (2020) | 161 | 130 | 78 | |||
| Far Cry 6 (2021) | 139 | 134 | 92 | |||
| Dying Light 2 (2022) | 171.8 | 118.4 | 61.7 | |||
| Cyberpunk 2077 1.6 (2022) | 122.8 | 94.26 | 49.15 | |||
| Ghostwire Tokyo (2022) | 230.1 | 196.8 | 97.7 | |||
| Tiny Tina's Wonderlands (2022) | 189.4 | 135.8 | 73.7 | |||
| F1 22 (2022) | 137.4 | 90.5 | 45.3 | |||
| Call of Duty Modern Warfare 2 2022 (2022) | 181 | 137 | 86 | |||
| Spider-Man Miles Morales (2022) | 121.4 | 115.7 | 84.2 | |||
| The Callisto Protocol (2022) | 143.5 | 116.5 | 69.8 | |||
| The Witcher 3 v4 (2023) | 141.8 | 102.9 | 52.8 |
Teste de estresse
Os modelos de laptop testados não mostraram nenhuma inconsistência significativa devido ao estrangulamento térmico quando estressados com O Witcher 3 a 1080p Ultra.
O Titan GT77 HX 13V RTX 4090 do Titan GT77 HX 13V parece ter tido alguns problemas para manter o quadro inicial, mas consegue se recuperar após algum tempo. A implementação do XMG Neo 16 RTX 4090 da XMG é um pouco melhor neste aspecto.
O Razer Blade 16's RTX 4080, por outro lado, é capaz de lidar bem com este teste de estresse.
Consumo de energia: RTX 4090 móvel 53% mais eficiente em termos de consumo de energia do que a GPU portátil RTX 3080 Ti
O consumo de energia da parede no caso de GPUs de laptop não é realmente comparável ao que observamos com as peças de mesa. De fato, somente a placa RTX 4090 Founders Edition pode puxar mais de 700 W sob carga quando configurada para usar um alvo de potência maior.
O que é interessante aqui é que agora você está obtendo muito mais desempenho por Watt em comparação com qualquer outra GPU móvel da Nvidia até hoje.
Por exemplo, o MSI Titan GT77 12UHS apresentando o RTX 3080 Ti tem um consumo total de energia do sistema similar ao do Titan GT77 HX 13V a cerca de 248 W no The Witcher 3 a 1080p ultra e cerca de 11% maior 241 W no FurMark (1280 x 720, sem AA). Entretanto, o Titan GT77 HX 13V é um impressionante 53% mais eficiente em termos de potência no The Witcher 3 em comparação com seu predecessor do 12º gênero.
A Lâmina 16 da Razer com sua GPU para laptop RTX 4080 bebe 7% mais potência (236 W) do que a Lâmina 17 com uma GPU para laptop RTX 3080 Ti (220 W) no The Witcher 3. Apesar do consumo geral de energia ligeiramente maior, a nova Lâmina 16 com a GPU para laptop RTX 4080 é 32% mais eficiente em termos de potência no jogo em comparação com a Lâmina 17, apesar da última Lâmina RTX 3080 Ti estar configurada a 165 W.
Isto também se alinha bem com a forma como a Nvidia projetou o Ada para ser muito mais eficiente em termos de consumo de energia do que o Ampere. Além dos benefícios do processo personalizado 4N, a GPU Ada primeiro tenta atingir os limites máximos de relógios e voltagem antes de aumentar a potência, resultando em maior desempenho e maior eficiência no mesmo valor de potência em comparação com o Ampere.
Power consumption: External monitor
| Power Consumption / The Witcher 3 ultra (external Monitor) | |
| NVIDIA GeForce RTX 4090 Founders Edition (133% PT OC, Idle: 81.25 W) | |
| NVIDIA GeForce RTX 4090 Founders Edition (100% PT, Idle: 81.25 W) | |
| AMD Radeon RX 7900 XTX (Idle: 86.5 W) | |
| Média NVIDIA GeForce RTX 3090 (Idle: 464 - 597, n=18 W) | |
| NVIDIA GeForce RTX 4080 Founders Edition (110% PT, Idle: 78.45 W) | |
| NVIDIA GeForce RTX 4080 Founders Edition (100% PT, Idle: 78.45 W) | |
| AMD Radeon RX 7900 XT (Idle: 84.6 W) | |
| Asus TUF Gaming GeForce RTX 4070 Ti (Perf BIOS / 110% PT, Idle: 75.4 W) | |
| Asus TUF Gaming GeForce RTX 4070 Ti (Perf BIOS / 100% PT, Idle: 75.4 W) | |
| Asus TUF Gaming GeForce RTX 4070 Ti (Quiet BIOS / 100% PT, Idle: 75.4 W) | |
| MSI Titan GT77 HX 13VI | |
| MSI Titan GT77 12UHS | |
| Razer Blade 16 Early 2023 | |
| Razer Blade 17 Early 2022 | |
| Média NVIDIA GeForce RTX 3080 Ti Laptop GPU (Idle: 144 - 287, n=27 W) | |
| Média AMD Radeon RX 6800M (Idle: n=1 W) | |
| Média NVIDIA GeForce RTX 3080 Laptop GPU (Idle: 124 - 244, n=26 W) | |
| Média AMD Radeon RX 6700M (Idle: n=1 W) | |
| Média NVIDIA GeForce RTX 3070 Ti Laptop GPU (Idle: 115 - 234, n=25 W) | |
| Média AMD Radeon RX 6600M (Idle: 124 - 191, n=6 W) | |
| Média NVIDIA GeForce RTX 3060 Laptop GPU (Idle: 107.5 - 191, n=38 W) | |
| Power Consumption / FurMark 1.19 GPU Stress Test (external Monitor) | |
| NVIDIA GeForce RTX 4090 Founders Edition (133% PT OC, Idle: 81.25 W) | |
| NVIDIA GeForce RTX 4090 Founders Edition (100% PT, Idle: 81.25 W) | |
| AMD Radeon RX 7900 XTX (Idle: 86.5 W) | |
| AMD Radeon RX 7900 XT (Idle: 84.6 W) | |
| Média NVIDIA GeForce RTX 3090 (Idle: 281 - 551, n=9 W) | |
| NVIDIA GeForce RTX 4080 Founders Edition (110% PT, Idle: 78.45 W) | |
| NVIDIA GeForce RTX 4080 Founders Edition (100% PT, Idle: 78.45 W) | |
| Asus TUF Gaming GeForce RTX 4070 Ti (Perf BIOS / 110% PT, Idle: 75.4 W) | |
| Asus TUF Gaming GeForce RTX 4070 Ti (Quiet BIOS / 100% PT, Idle: 75.4 W) | |
| Asus TUF Gaming GeForce RTX 4070 Ti (Perf BIOS / 100% PT, Idle: 75.4 W) | |
| Razer Blade 16 Early 2023 | |
| MSI Titan GT77 12UHS | |
| Razer Blade 17 Early 2022 | |
| MSI Titan GT77 HX 13VI | |
| Média NVIDIA GeForce RTX 3080 Ti Laptop GPU (Idle: 139.2 - 288, n=28 W) | |
| Média AMD Radeon RX 6800M (Idle: n=1 W) | |
| Média NVIDIA GeForce RTX 3070 Ti Laptop GPU (Idle: 123.6 - 211, n=27 W) | |
| Média NVIDIA GeForce RTX 3080 Laptop GPU (Idle: 122 - 254, n=27 W) | |
| Média AMD Radeon RX 6600M (Idle: 113 - 187, n=6 W) | |
| Média AMD Radeon RX 6700M (Idle: n=1 W) | |
| Média NVIDIA GeForce RTX 3060 Laptop GPU (Idle: 94.1 - 202, n=38 W) | |
| Power Consumption / Witcher 3 ultra Efficiency (external Monitor) | |
| MSI Titan GT77 HX 13VI | |
| Razer Blade 16 Early 2023 | |
| Média NVIDIA GeForce RTX 3080 Laptop GPU (0.4696 - 0.736, n=24) | |
| Média NVIDIA GeForce RTX 3070 Ti Laptop GPU (0.4399 - 0.97, n=24) | |
| AMD Radeon RX 7900 XT | |
| Média NVIDIA GeForce RTX 3080 Ti Laptop GPU (0.4432 - 0.69, n=26) | |
| AMD Radeon RX 7900 XTX | |
| NVIDIA GeForce RTX 4080 Founders Edition | |
| Asus TUF Gaming GeForce RTX 4070 Ti | |
| Razer Blade 17 Early 2022 | |
| NVIDIA GeForce RTX 4090 Founders Edition | |
| Média NVIDIA GeForce RTX 3060 Laptop GPU (0.4181 - 0.651, n=33) | |
| Média AMD Radeon RX 6700M (n=1) | |
| MSI Titan GT77 12UHS | |
| Média AMD Radeon RX 6600M (0.4398 - 0.608, n=6) | |
| Média NVIDIA GeForce RTX 3090 (0.268 - 0.3954, n=15) | |
* ... menor é melhor
Veredicto: Desempenho da classe RTX 3090 de mesa a 175 W
A geração Ampere de Nvidia tinha muito a seu favor em termos de desempenho em comparação com Turing, mas seu lançamento aconteceu em um momento em que a ordem global estava se tornando difícil.
Como resultado, os cartões não foram estocados e tiveram um preço exagerado, o que levou a todo tipo de escalpelização. Juntamente com uma inconstante e efêmera explosão de criptografia, muitos gamers sentiram que fazia sentido economicamente optar por laptops com Ampere-powered em vez de cartões de mesa.
Avançar rapidamente até 2023, e a maioria dessas experiências angustiantes está agora atrás de nós. As últimas GPUs Ada da Nvidia estabeleceram para si mesmas padrões muito altos em termos de desempenho e eficiência energética que parecem ser um verdadeiro salto geracional.
Ficamos muito impressionados com o desempenho da Ada no desktop e estamos felizes em testemunhar a maioria desses benefícios sendo traduzidos para o lado laptop das coisas também.
As GPUs Nvidia RTX 4080 e RTX 4090 para notebooks mostram habilmente o desempenho e a eficiência da Ada, com a primeira tendo um desempenho mais ou menos semelhante a uma RTX 3090 de 350 W de mesa. No entanto, estes benefícios são vistos apenas com o desenho de especificação mais alto de 175 W.
No entanto, nem tudo é hunky-dory com a Ada mobile. Os dispositivos que testamos permitiram que o RTX 4080 e RTX 4090 flexionassem totalmente seus músculos a 150 W com um adicional de 25 W de Dynamic Boost. Nem todos os laptops na natureza permitirão que estas GPUs funcionem nestes TDPs.
E aqueles que o fazem também não são exatamente portáteis - só a fonte de alimentação do Titan GT77 pesa 1,4 kg e seus níveis de ruído sob pico de carga podem dar a impressão de estar sentado no cockpit de um F16.
O outro problema é a marca enganosa da Nvidia. O cliente médio geralmente se relaciona melhor com a marca numérica do que a especificação real da GPU, então alguém da Santa Clara achou que fazia perfeito sentido em termos de marketing batizar o cachorro de topo como a GPU de laptop RTX 4090 só porque ela tem um desempenho melhor do que uma GPU de mesa RTX 3090!
Mas aqueles que procuram os computadores portáteis RTX 4090 não são seu consumidor médio típico. E não vamos nem mesmo entrar em todos os tipos de gotchas de desempenho que podem ser esperadas na faixa de 80 W a 150 W do TDP.
O preço é outro fator importante a ser considerado. Os laptops que usamos nesta comparação têm o potencial de fazer um grande furo em seus bolsos. Tanto assim que comprar um carro usado pode parecer um investimento melhor. Mas, então, essa é a natureza dos dispositivos emblemáticos em geral.
Tudo dito e feito, a Ada mobile é um passo bem-vindo na direção certa. Os benefícios que vemos com as configurações topo-de-gama são certamente reduzidos até as ofertas de nível médio e básico, e recursos como o DLSS 3 certamente ajudarão a acelerar a adoção da Ada entre os gamers móveis.
Vamos obter uma imagem mais holística das melhorias de eficiência da Ada mobile à medida que testarmos mais computadores portáteis RTX 40 configurados em vários TDPs nos próximos meses.
Esperamos que os dispositivos AMD RDNA 3 também estejam eventualmente disponíveis em números significativos e concorram bem para o benefício de todos nós.
Price comparison

