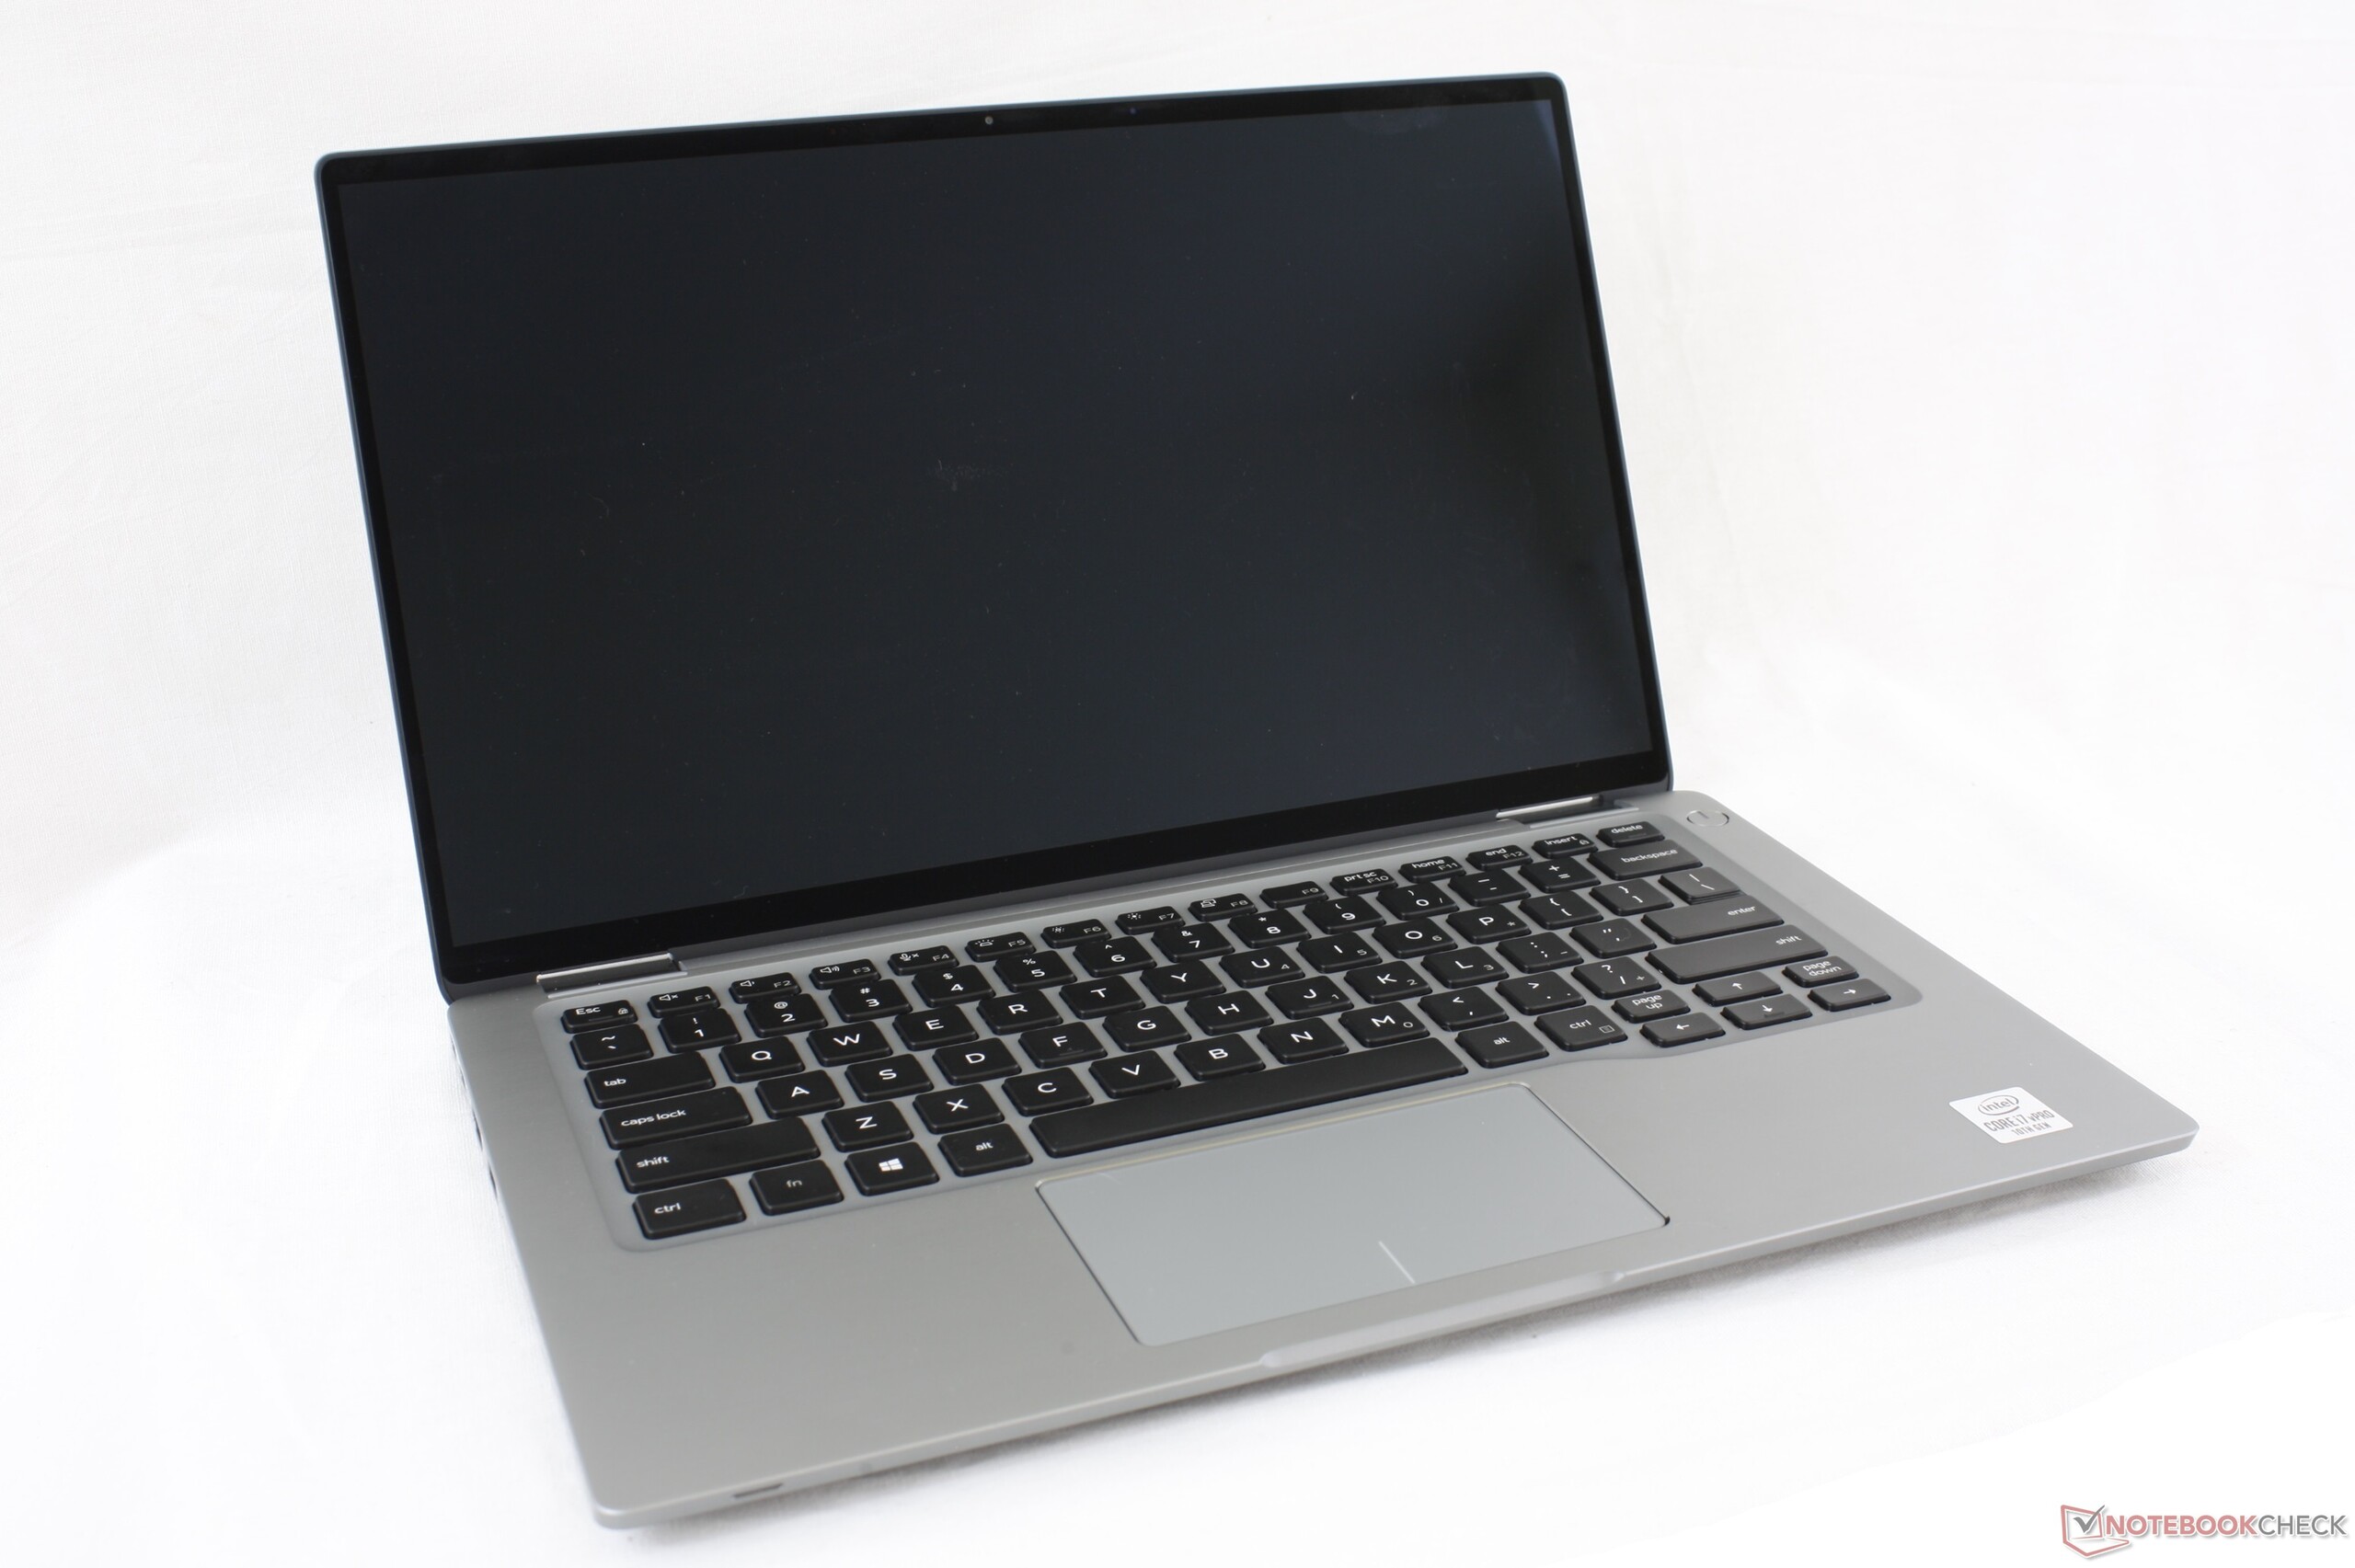
Breve Análise do Conversível Dell Latitude 14 9410 2-em-1: Um Latitude 7400 de coração
Avaliação | Data | Modelo | Peso | Altura | Size | Resolução | Preço |
|---|---|---|---|---|---|---|---|
| 88.7 % v7 (old) | 09/2020 | Dell Latitude 14 9410 2-in-1 P110G i7-10610U, UHD Graphics 620 | 1.5 kg | 14.89 mm | 14.00" | 1920x1080 | |
| 88.2 % v7 (old) | 10/2019 | Lenovo Yoga C940-14IIL i7-1065G7, Iris Plus Graphics G7 (Ice Lake 64 EU) | 1.4 kg | 14.95 mm | 14.00" | 1920x1080 | |
| 81.2 % v7 (old) | 04/2020 | LG Gram 14T90N i7-10510U, UHD Graphics 620 | 1.2 kg | 18 mm | 14.00" | 1920x1080 | |
| 90.5 % v7 (old) | 02/2019 | HP Elitebook x360 1040 G5 i7-8650U, UHD Graphics 620 | 1.4 kg | 16.9 mm | 14.00" | 1920x1080 | |
| 87.8 % v7 (old) | 06/2019 | Dell Latitude 7400 2-in-1 i7-8665U, UHD Graphics 620 | 1.5 kg | 15 mm | 14.00" | 1920x1080 | |
| 85 % v7 (old) | Asus ZenBook Flip 14 UX463FA-AI039T i5-10210U, UHD Graphics 620 | 1.4 kg | 18 mm | 14.00" | 1920x1080 |
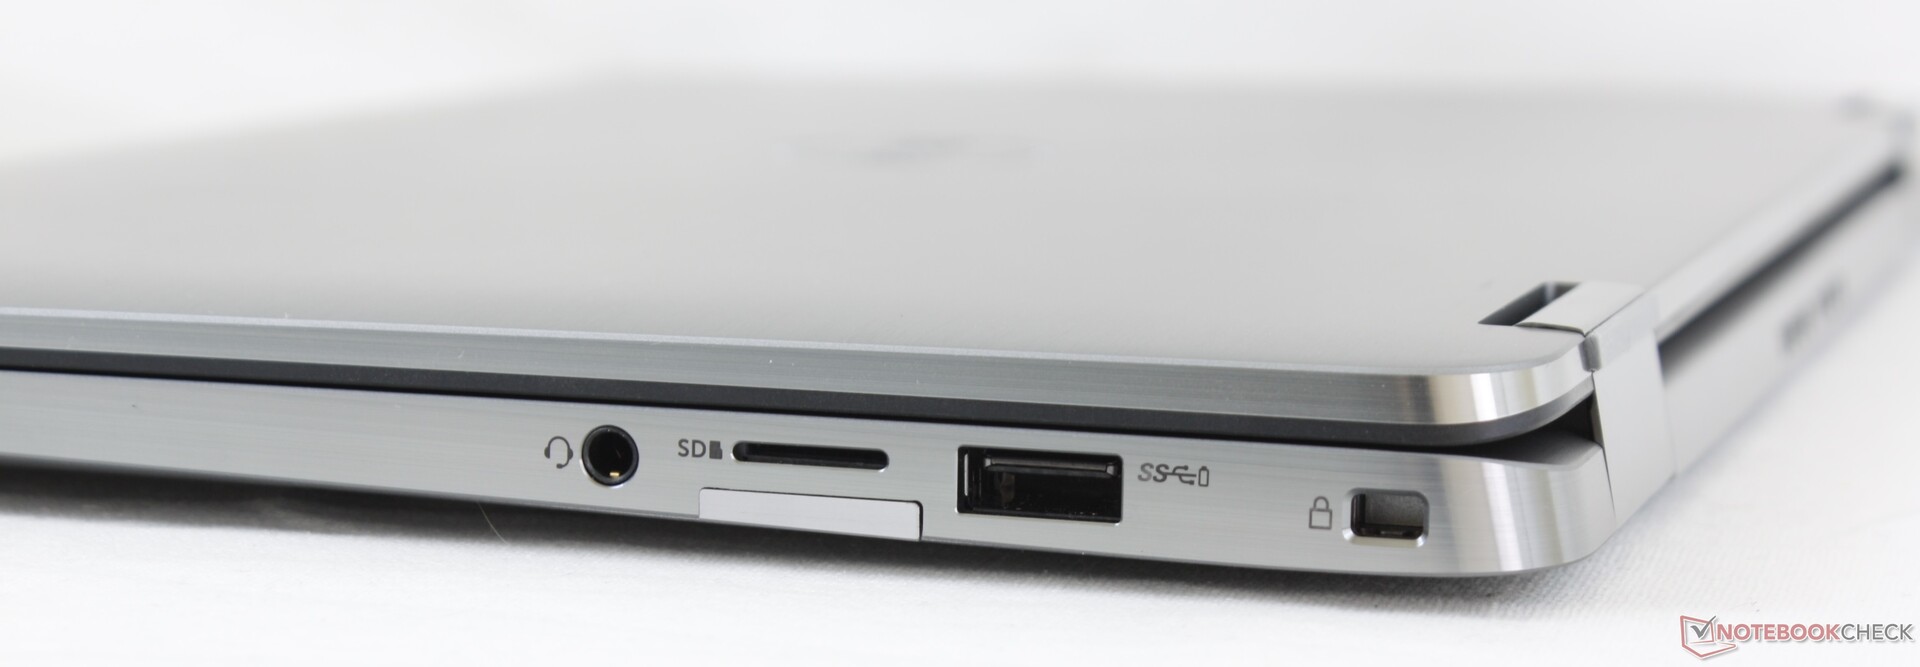
| SD Card Reader | |
| average JPG Copy Test (av. of 3 runs) | |
| Dell Latitude 14 9410 2-in-1 P110G (Toshiba Exceria Pro M501 64 GB UHS-II) | |
| Dell Latitude 7400 2-in-1 (Toshiba Exceria Pro M501 UHS-II) | |
| LG Gram 14T90N (Toshiba Exceria Pro M501 64 GB UHS-II) | |
| Asus ZenBook Flip 14 UX463FA-AI039T (Toshiba Exceria Pro M501 microSDXC 64GB) | |
| maximum AS SSD Seq Read Test (1GB) | |
| Dell Latitude 7400 2-in-1 (Toshiba Exceria Pro M501 UHS-II) | |
| Dell Latitude 14 9410 2-in-1 P110G (Toshiba Exceria Pro M501 64 GB UHS-II) | |
| LG Gram 14T90N (Toshiba Exceria Pro M501 64 GB UHS-II) | |
| Asus ZenBook Flip 14 UX463FA-AI039T (Toshiba Exceria Pro M501 microSDXC 64GB) | |


| |||||||||||||||||||||||||
iluminação: 92 %
iluminação com acumulador: 293.4 cd/m²
Contraste: 1544:1 (Preto: 0.19 cd/m²)
ΔE ColorChecker Calman: 1.29 | ∀{0.5-29.43 Ø4.71}
calibrated: 0.88
ΔE Greyscale Calman: 1.7 | ∀{0.09-98 Ø4.96}
99.1% sRGB (Argyll 1.6.3 3D)
63.8% AdobeRGB 1998 (Argyll 1.6.3 3D)
69.4% AdobeRGB 1998 (Argyll 3D)
99.2% sRGB (Argyll 3D)
68.1% Display P3 (Argyll 3D)
Gamma: 2.18
CCT: 6394 K
| Dell Latitude 14 9410 2-in-1 P110G Sharp LQ140M1, IPS, 14", 1920x1080 | Lenovo Yoga C940-14IIL LP140WF9-SPE2, IPS LED, 14", 1920x1080 | LG Gram 14T90N LG Philips LP140WFA-SPY1, IPS, 14", 1920x1080 | HP Elitebook x360 1040 G5 AU Optronics AUO533D, IPS, 14", 1920x1080 | Dell Latitude 7400 2-in-1 SHP14A2, IPS, 14", 1920x1080 | Asus ZenBook Flip 14 UX463FA-AI039T AU AUO323D, IPS, 14", 1920x1080 | |
|---|---|---|---|---|---|---|
| Display | -2% | -4% | -6% | 1% | -13% | |
| Display P3 Coverage (%) | 68.1 | 66 -3% | 65 -5% | 64.3 -6% | 68.6 1% | 60.1 -12% |
| sRGB Coverage (%) | 99.2 | 97.9 -1% | 95.7 -4% | 94.1 -5% | 99.6 0% | 85.5 -14% |
| AdobeRGB 1998 Coverage (%) | 69.4 | 67.3 -3% | 66.7 -4% | 65.5 -6% | 70 1% | 61.1 -12% |
| Response Times | 17% | 10% | -7% | 1% | 32% | |
| Response Time Grey 50% / Grey 80% * (ms) | 58.4 ? | 49.6 ? 15% | 54 ? 8% | 70.8 ? -21% | 56 ? 4% | 36 ? 38% |
| Response Time Black / White * (ms) | 37.2 ? | 30 ? 19% | 32.8 ? 12% | 34.4 ? 8% | 38 ? -2% | 28 ? 25% |
| PWM Frequency (Hz) | 1667 ? | 735 ? | 1667 ? | |||
| Screen | -27% | -45% | -32% | -26% | -69% | |
| Brightness middle (cd/m²) | 293.4 | 384 31% | 322.2 10% | 416.3 42% | 277.2 -6% | 280 -5% |
| Brightness (cd/m²) | 290 | 363 25% | 301 4% | 400 38% | 263 -9% | 286 -1% |
| Brightness Distribution (%) | 92 | 90 -2% | 86 -7% | 89 -3% | 83 -10% | 78 -15% |
| Black Level * (cd/m²) | 0.19 | 0.17 11% | 0.25 -32% | 0.29 -53% | 0.2 -5% | 0.208 -9% |
| Contrast (:1) | 1544 | 2259 46% | 1289 -17% | 1436 -7% | 1386 -10% | 1346 -13% |
| Colorchecker dE 2000 * | 1.29 | 3.5 -171% | 3.62 -181% | 2.69 -109% | 2.1 -63% | 3.97 -208% |
| Colorchecker dE 2000 max. * | 3.61 | 5.5 -52% | 6.9 -91% | 4.95 -37% | 5.91 -64% | 8.29 -130% |
| Colorchecker dE 2000 calibrated * | 0.88 | 1 -14% | 1.22 -39% | 2.13 -142% | 1.03 -17% | 3.42 -289% |
| Greyscale dE 2000 * | 1.7 | 4.6 -171% | 3.9 -129% | 2.9 -71% | 3.4 -100% | 2.83 -66% |
| Gamma | 2.18 101% | 2.32 95% | 2.43 91% | 2.4 92% | 2.241 98% | 2.34 94% |
| CCT | 6394 102% | 6884 94% | 6344 102% | 6623 98% | 6030 108% | 6556 99% |
| Color Space (Percent of AdobeRGB 1998) (%) | 63.8 | 62 -3% | 61.3 -4% | 60.1 -6% | 64 0% | 56 -12% |
| Color Space (Percent of sRGB) (%) | 99.1 | 97.7 -1% | 95.6 -4% | 94.5 -5% | 100 1% | 85 -14% |
| Média Total (Programa/Configurações) | -4% /
-17% | -13% /
-30% | -15% /
-24% | -8% /
-17% | -17% /
-46% |
* ... menor é melhor
Exibir tempos de resposta
| ↔ Tempo de resposta preto para branco | ||
|---|---|---|
| 37.2 ms ... ascensão ↗ e queda ↘ combinadas | ↗ 18.4 ms ascensão | 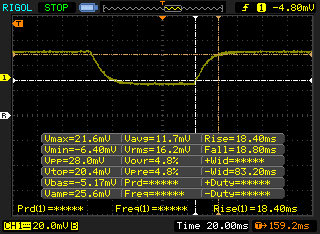 |
| ↘ 18.8 ms queda | ||
| A tela mostra taxas de resposta lentas em nossos testes e será insatisfatória para os jogadores. Em comparação, todos os dispositivos testados variam de 0.1 (mínimo) a 240 (máximo) ms. » 95 % de todos os dispositivos são melhores. Isso significa que o tempo de resposta medido é pior que a média de todos os dispositivos testados (19.8 ms). | ||
| ↔ Tempo de resposta 50% cinza a 80% cinza | ||
| 58.4 ms ... ascensão ↗ e queda ↘ combinadas | ↗ 26 ms ascensão | 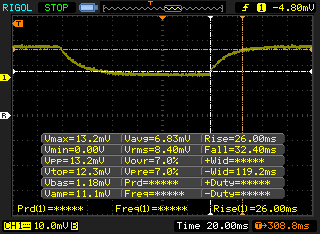 |
| ↘ 32.4 ms queda | ||
| A tela mostra taxas de resposta lentas em nossos testes e será insatisfatória para os jogadores. Em comparação, todos os dispositivos testados variam de 0.165 (mínimo) a 636 (máximo) ms. » 95 % de todos os dispositivos são melhores. Isso significa que o tempo de resposta medido é pior que a média de todos os dispositivos testados (31 ms). | ||
Cintilação da tela / PWM (modulação por largura de pulso)
| Tela tremeluzindo/PWM detectado | 1667 Hz | ≤ 44 % configuração de brilho | 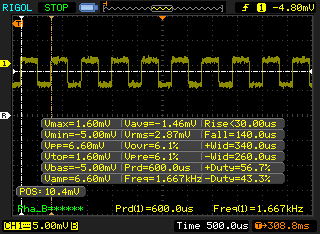 |
A luz de fundo da tela pisca em 1667 Hz (pior caso, por exemplo, utilizando PWM) Cintilação detectada em uma configuração de brilho de 44 % e abaixo. Não deve haver cintilação ou PWM acima desta configuração de brilho. A frequência de 1667 Hz é bastante alta, então a maioria dos usuários sensíveis ao PWM não deve notar nenhuma oscilação. [pwm_comparison] Em comparação: 52 % de todos os dispositivos testados não usam PWM para escurecer a tela. Se PWM foi detectado, uma média de 7754 (mínimo: 5 - máximo: 343500) Hz foi medida. | |||
Cinebench R15: CPU Multi 64Bit | CPU Single 64Bit
Blender: v2.79 BMW27 CPU
7-Zip 18.03: 7z b 4 -mmt1 | 7z b 4
Geekbench 5.5: Single-Core | Multi-Core
HWBOT x265 Benchmark v2.2: 4k Preset
LibreOffice : 20 Documents To PDF
R Benchmark 2.5: Overall mean
| Cinebench R15 / CPU Multi 64Bit | |
| Dell XPS 13 7390 Core i7-10710U | |
| Asus VivoBook Flip 14 TM420IA | |
| Lenovo ThinkPad E14 Gen2-20T7S00W00 | |
| Lenovo Yoga C940-14IIL 81Q9 | |
| Lenovo Yoga C940-14IIL | |
| Lenovo Yoga C940-14IIL | |
| Acer TravelMate P6 P614-51T-G2-72ZU | |
| Asus ZenBook Flip 14 UX463FA-AI039T | |
| Lenovo ThinkPad T490-20N3S02L00 | |
| Dell Latitude 14 9410 2-in-1 P110G | |
| Média Intel Core i7-10610U (548 - 738, n=6) | |
| Lenovo ThinkPad T14s-20T00044GE | |
| Dell Latitude 7400 2-in-1 | |
| HP Elitebook x360 1040 G5 | |
| LG Gram 14T90N | |
| Cinebench R15 / CPU Single 64Bit | |
| Acer TravelMate P6 P614-51T-G2-72ZU | |
| Asus VivoBook Flip 14 TM420IA | |
| Lenovo Yoga C940-14IIL 81Q9 | |
| Lenovo ThinkPad T490-20N3S02L00 | |
| Dell XPS 13 7390 Core i7-10710U | |
| Lenovo Yoga C940-14IIL | |
| Lenovo ThinkPad E14 Gen2-20T7S00W00 | |
| Dell Latitude 7400 2-in-1 | |
| Média Intel Core i7-10610U (133 - 200, n=6) | |
| Dell Latitude 14 9410 2-in-1 P110G | |
| HP Elitebook x360 1040 G5 | |
| Asus ZenBook Flip 14 UX463FA-AI039T | |
| Lenovo ThinkPad T14s-20T00044GE | |
| LG Gram 14T90N | |
| Geekbench 5.5 / Single-Core | |
| LG Gram 14T90N | |
| Média Intel Core i7-10610U (1155 - 1261, n=6) | |
| Acer TravelMate P6 P614-51T-G2-72ZU | |
| Dell Latitude 14 9410 2-in-1 P110G | |
| Asus VivoBook Flip 14 TM420IA | |
| Lenovo ThinkPad E14 Gen2-20T7S00W00 | |
| Lenovo ThinkPad T14s-20T00044GE | |
| Geekbench 5.5 / Multi-Core | |
| Asus VivoBook Flip 14 TM420IA | |
| Lenovo ThinkPad E14 Gen2-20T7S00W00 | |
| Acer TravelMate P6 P614-51T-G2-72ZU | |
| Média Intel Core i7-10610U (3731 - 4622, n=6) | |
| Dell Latitude 14 9410 2-in-1 P110G | |
| Lenovo ThinkPad T14s-20T00044GE | |
| LG Gram 14T90N | |
| LibreOffice / 20 Documents To PDF | |
| Dell Latitude 14 9410 2-in-1 P110G | |
| Média Intel Core i7-10610U (56.1 - 106, n=6) | |
| Lenovo ThinkPad E14 Gen2-20T7S00W00 | |
| LG Gram 14T90N | |
| Asus VivoBook Flip 14 TM420IA | |
| Acer TravelMate P6 P614-51T-G2-72ZU | |
| Lenovo ThinkPad T14s-20T00044GE | |
| R Benchmark 2.5 / Overall mean | |
| Dell Latitude 14 9410 2-in-1 P110G | |
| Lenovo ThinkPad T14s-20T00044GE | |
| Média Intel Core i7-10610U (0.637 - 0.855, n=6) | |
| LG Gram 14T90N | |
| Acer TravelMate P6 P614-51T-G2-72ZU | |
| Lenovo ThinkPad E14 Gen2-20T7S00W00 | |
| Asus VivoBook Flip 14 TM420IA | |
Cinebench R15: CPU Multi 64Bit | CPU Single 64Bit
Blender: v2.79 BMW27 CPU
7-Zip 18.03: 7z b 4 -mmt1 | 7z b 4
Geekbench 5.5: Single-Core | Multi-Core
HWBOT x265 Benchmark v2.2: 4k Preset
LibreOffice : 20 Documents To PDF
R Benchmark 2.5: Overall mean
* ... menor é melhor
| PCMark 10 | |
| Score | |
| Lenovo Yoga C940-14IIL | |
| Dell Latitude 14 9410 2-in-1 P110G | |
| LG Gram 14T90N | |
| HP Elitebook x360 1040 G5 | |
| Dell Latitude 7400 2-in-1 | |
| Asus ZenBook Flip 14 UX463FA-AI039T | |
| Essentials | |
| Lenovo Yoga C940-14IIL | |
| Dell Latitude 14 9410 2-in-1 P110G | |
| LG Gram 14T90N | |
| HP Elitebook x360 1040 G5 | |
| Dell Latitude 7400 2-in-1 | |
| Asus ZenBook Flip 14 UX463FA-AI039T | |
| Productivity | |
| Dell Latitude 14 9410 2-in-1 P110G | |
| LG Gram 14T90N | |
| Dell Latitude 7400 2-in-1 | |
| Lenovo Yoga C940-14IIL | |
| HP Elitebook x360 1040 G5 | |
| Asus ZenBook Flip 14 UX463FA-AI039T | |
| Digital Content Creation | |
| Lenovo Yoga C940-14IIL | |
| Dell Latitude 14 9410 2-in-1 P110G | |
| Asus ZenBook Flip 14 UX463FA-AI039T | |
| HP Elitebook x360 1040 G5 | |
| LG Gram 14T90N | |
| Dell Latitude 7400 2-in-1 | |
| PCMark 8 | |
| Home Score Accelerated v2 | |
| Lenovo Yoga C940-14IIL | |
| Dell Latitude 14 9410 2-in-1 P110G | |
| LG Gram 14T90N | |
| Dell Latitude 7400 2-in-1 | |
| HP Elitebook x360 1040 G5 | |
| Work Score Accelerated v2 | |
| Lenovo Yoga C940-14IIL | |
| LG Gram 14T90N | |
| Dell Latitude 14 9410 2-in-1 P110G | |
| Dell Latitude 7400 2-in-1 | |
| HP Elitebook x360 1040 G5 | |
| PCMark 8 Home Score Accelerated v2 | 3725 pontos | |
| PCMark 8 Work Score Accelerated v2 | 5071 pontos | |
| PCMark 10 Score | 4410 pontos | |
Ajuda | ||
| DPC Latencies / LatencyMon - interrupt to process latency (max), Web, Youtube, Prime95 | |
| Acer TravelMate P6 P614-51T-G2-72ZU | |
| Lenovo ThinkPad T14s-20T00044GE | |
| LG Gram 14T90N | |
| Dell Latitude 14 9410 2-in-1 P110G | |
| Lenovo ThinkPad E14 Gen2-20T7S00W00 | |
| Asus VivoBook Flip 14 TM420IA | |
| Asus ZenBook Flip 14 UX463FA-AI039T | |
* ... menor é melhor
| Dell Latitude 14 9410 2-in-1 P110G Micron 2200S 512GB | Lenovo Yoga C940-14IIL Samsung SSD PM981 MZVLB512HAJQ | LG Gram 14T90N Samsung SSD PM981a MZVLB512HBJQ | HP Elitebook x360 1040 G5 Samsung SSD PM981 MZVLB512HAJQ | Dell Latitude 7400 2-in-1 Toshiba XG6 KXG60ZNV512G | Asus ZenBook Flip 14 UX463FA-AI039T Kingston RBUSNS8154P3512GJ1 | |
|---|---|---|---|---|---|---|
| AS SSD | 48% | 60% | 38% | -24% | -16% | |
| Seq Read (MB/s) | 1117 | 2525 126% | 1829 64% | 1816 63% | 2289 105% | 1336 20% |
| Seq Write (MB/s) | 969 | 1253 29% | 2048 111% | 1270 31% | 1163 20% | 653 -33% |
| 4K Read (MB/s) | 41.93 | 59.1 41% | 54.2 29% | 46.25 10% | 22.29 -47% | 26.65 -36% |
| 4K Write (MB/s) | 76.4 | 134.1 76% | 120.5 58% | 104.1 36% | 28.92 -62% | 52.7 -31% |
| 4K-64 Read (MB/s) | 827 | 1010 22% | 1512 83% | 1342 62% | 415.6 -50% | 644 -22% |
| 4K-64 Write (MB/s) | 792 | 1461 84% | 1573 99% | 1209 53% | 199.5 -75% | 482.9 -39% |
| Access Time Read * (ms) | 0.055 | 0.052 5% | 0.046 16% | 0.043 22% | 0.122 -122% | 0.074 -35% |
| Access Time Write * (ms) | 0.366 | 0.029 92% | 0.091 75% | 0.035 90% | 0.143 61% | 0.072 80% |
| Score Read (Points) | 981 | 1322 35% | 1749 78% | 1569 60% | 667 -32% | 804 -18% |
| Score Write (Points) | 966 | 1721 78% | 1899 97% | 1440 49% | 345 -64% | 601 -38% |
| Score Total (Points) | 2450 | 3670 50% | 4560 86% | 3790 55% | 1300 -47% | 1786 -27% |
| Copy ISO MB/s (MB/s) | 1290 | 2016 56% | 1891 47% | 2034 58% | 1767 37% | |
| Copy Program MB/s (MB/s) | 661 | 542 -18% | 569 -14% | 450.3 -32% | 379.4 -43% | |
| Copy Game MB/s (MB/s) | 1271 | 1278 1% | 1425 12% | 1024 -19% | 1055 -17% | |
| CrystalDiskMark 5.2 / 6 | 30% | 42% | 20% | -29% | -32% | |
| Write 4K (MB/s) | 81.2 | 128.4 58% | 181.4 123% | 122.7 51% | 35.06 -57% | 54.6 -33% |
| Read 4K (MB/s) | 45.41 | 46.37 2% | 52.5 16% | 46.57 3% | 23.64 -48% | 28.19 -38% |
| Write Seq (MB/s) | 1190 | 1863 57% | 1592 34% | 1725 45% | 1537 29% | 840 -29% |
| Read Seq (MB/s) | 1766 | 2340 33% | 1617 -8% | 2392 35% | 1782 1% | 905 -49% |
| Write 4K Q32T1 (MB/s) | 436 | 451.1 3% | 556 28% | 470.6 8% | 100.3 -77% | 409.5 -6% |
| Read 4K Q32T1 (MB/s) | 374.4 | 415.3 11% | 539 44% | 313.2 -16% | 62.7 -83% | 292.4 -22% |
| Write Seq Q32T1 (MB/s) | 1582 | 2985 89% | 2955 87% | 1869 18% | 2698 71% | 1038 -34% |
| Read Seq Q32T1 (MB/s) | 3017 | 2565 -15% | 3270 8% | 3380 12% | 1073 -64% | 1607 -47% |
| Write 4K Q8T8 (MB/s) | 451.4 | |||||
| Read 4K Q8T8 (MB/s) | 1004 | |||||
| Média Total (Programa/Configurações) | 39% /
42% | 51% /
53% | 29% /
32% | -27% /
-26% | -24% /
-23% |
* ... menor é melhor

Disk Throttling: DiskSpd Read Loop, Queue Depth 8
| 3DMark 11 Performance | 2206 pontos | |
| 3DMark Cloud Gate Standard Score | 9933 pontos | |
| 3DMark Fire Strike Score | 1218 pontos | |
| 3DMark Time Spy Score | 486 pontos | |
Ajuda | ||
| baixo | média | alto | ultra | |
|---|---|---|---|---|
| Dota 2 Reborn (2015) | 59.1 | 48.4 | 20.5 | 18.7 |
| X-Plane 11.11 (2018) | 12 | 10.9 | 10.5 |
| Dell Latitude 14 9410 2-in-1 P110G UHD Graphics 620, i7-10610U, Micron 2200S 512GB | Lenovo Yoga C940-14IIL Iris Plus Graphics G7 (Ice Lake 64 EU), i7-1065G7, Samsung SSD PM981 MZVLB512HAJQ | LG Gram 14T90N UHD Graphics 620, i7-10510U, Samsung SSD PM981a MZVLB512HBJQ | HP Elitebook x360 1040 G5 UHD Graphics 620, i7-8650U, Samsung SSD PM981 MZVLB512HAJQ | Dell Latitude 7400 2-in-1 UHD Graphics 620, i7-8665U, Toshiba XG6 KXG60ZNV512G | Asus ZenBook Flip 14 UX463FA-AI039T UHD Graphics 620, i5-10210U, Kingston RBUSNS8154P3512GJ1 | |
|---|---|---|---|---|---|---|
| Noise | -1% | -5% | 1% | 6% | -1% | |
| desligado / ambiente * (dB) | 26.1 | 29.3 -12% | 29 -11% | 28.3 -8% | 28.2 -8% | 30.1 -15% |
| Idle Minimum * (dB) | 26.1 | 29.3 -12% | 30 -15% | 28.3 -8% | 28.2 -8% | 30.1 -15% |
| Idle Average * (dB) | 26.1 | 29.3 -12% | 30 -15% | 28.3 -8% | 28.2 -8% | 30.1 -15% |
| Idle Maximum * (dB) | 26.1 | 29.3 -12% | 30 -15% | 28.3 -8% | 28.3 -8% | 30.1 -15% |
| Load Average * (dB) | 39.9 | 33.3 17% | 35.2 12% | 32.6 18% | 28.2 29% | 30.1 25% |
| Load Maximum * (dB) | 44.7 | 33.3 26% | 37 17% | 36.6 18% | 28.8 36% | 32.02 28% |
* ... menor é melhor
Barulho
| Ocioso |
| 26.1 / 26.1 / 26.1 dB |
| Carga |
| 39.9 / 44.7 dB |
 | ||
30 dB silencioso 40 dB(A) audível 50 dB(A) ruidosamente alto |
||
min: | ||
(-) A temperatura máxima no lado superior é 48.4 °C / 119 F, em comparação com a média de 35.4 °C / 96 F , variando de 19.6 a 60 °C para a classe Convertible.
(-) A parte inferior aquece até um máximo de 55.2 °C / 131 F, em comparação com a média de 36.9 °C / 98 F
(+) Em uso inativo, a temperatura média para o lado superior é 23.8 °C / 75 F, em comparação com a média do dispositivo de 30.3 °C / ### class_avg_f### F.
(+) Os apoios para as mãos e o touchpad estão atingindo a temperatura máxima da pele (32.2 °C / 90 F) e, portanto, não estão quentes.
(-) A temperatura média da área do apoio para as mãos de dispositivos semelhantes foi 28 °C / 82.4 F (-4.2 °C / -7.6 F).
Dell Latitude 14 9410 2-in-1 P110G análise de áudio
(±) | o volume do alto-falante é médio, mas bom (###valor### dB)
Graves 100 - 315Hz
(±) | graves reduzidos - em média 14.6% menor que a mediana
(±) | a linearidade dos graves é média (12.9% delta para a frequência anterior)
Médios 400 - 2.000 Hz
(+) | médios equilibrados - apenas 4.1% longe da mediana
(+) | médios são lineares (4% delta para frequência anterior)
Altos 2 - 16 kHz
(±) | máximos mais altos - em média 5.3% maior que a mediana
(+) | os máximos são lineares (6.6% delta da frequência anterior)
Geral 100 - 16.000 Hz
(±) | a linearidade do som geral é média (16.3% diferença em relação à mediana)
Comparado com a mesma classe
» 30% de todos os dispositivos testados nesta classe foram melhores, 3% semelhantes, 67% piores
» O melhor teve um delta de 6%, a média foi 20%, o pior foi 57%
Comparado com todos os dispositivos testados
» 27% de todos os dispositivos testados foram melhores, 6% semelhantes, 68% piores
» O melhor teve um delta de 4%, a média foi 23%, o pior foi 134%
Apple MacBook 12 (Early 2016) 1.1 GHz análise de áudio
(+) | os alto-falantes podem tocar relativamente alto (###valor### dB)
Graves 100 - 315Hz
(±) | graves reduzidos - em média 11.3% menor que a mediana
(±) | a linearidade dos graves é média (14.2% delta para a frequência anterior)
Médios 400 - 2.000 Hz
(+) | médios equilibrados - apenas 2.4% longe da mediana
(+) | médios são lineares (5.5% delta para frequência anterior)
Altos 2 - 16 kHz
(+) | agudos equilibrados - apenas 2% longe da mediana
(+) | os máximos são lineares (4.5% delta da frequência anterior)
Geral 100 - 16.000 Hz
(+) | o som geral é linear (10.2% diferença em relação à mediana)
Comparado com a mesma classe
» 7% de todos os dispositivos testados nesta classe foram melhores, 2% semelhantes, 90% piores
» O melhor teve um delta de 5%, a média foi 18%, o pior foi 53%
Comparado com todos os dispositivos testados
» 5% de todos os dispositivos testados foram melhores, 1% semelhantes, 94% piores
» O melhor teve um delta de 4%, a média foi 23%, o pior foi 134%
| desligado | |
| Ocioso | |
| Carga |
|
Key:
min: | |
| Dell Latitude 14 9410 2-in-1 P110G i7-10610U, UHD Graphics 620, Micron 2200S 512GB, IPS, 1920x1080, 14" | Lenovo Yoga C940-14IIL i7-1065G7, Iris Plus Graphics G7 (Ice Lake 64 EU), Samsung SSD PM981 MZVLB512HAJQ, IPS LED, 1920x1080, 14" | LG Gram 14T90N i7-10510U, UHD Graphics 620, Samsung SSD PM981a MZVLB512HBJQ, IPS, 1920x1080, 14" | HP Elitebook x360 1040 G5 i7-8650U, UHD Graphics 620, Samsung SSD PM981 MZVLB512HAJQ, IPS, 1920x1080, 14" | Dell Latitude 7400 2-in-1 i7-8665U, UHD Graphics 620, Toshiba XG6 KXG60ZNV512G, IPS, 1920x1080, 14" | Asus ZenBook Flip 14 UX463FA-AI039T i5-10210U, UHD Graphics 620, Kingston RBUSNS8154P3512GJ1, IPS, 1920x1080, 14" | |
|---|---|---|---|---|---|---|
| Power Consumption | -40% | -9% | -37% | -3% | -42% | |
| Idle Minimum * (Watt) | 2.6 | 3.2 -23% | 2.9 -12% | 2.7 -4% | 2.6 -0% | 3.6 -38% |
| Idle Average * (Watt) | 3.9 | 7 -79% | 5.8 -49% | 6.5 -67% | 4.3 -10% | 7.5 -92% |
| Idle Maximum * (Watt) | 4.6 | 8.9 -93% | 6.2 -35% | 11.5 -150% | 5.5 -20% | 9.4 -104% |
| Load Average * (Watt) | 38.9 | 47.6 -22% | 32.9 15% | 38.7 1% | 32 18% | 42 -8% |
| Load Maximum * (Watt) | 76.2 | 63.1 17% | 48.5 36% | 50.5 34% | 78.8 -3% | 51 33% |
* ... menor é melhor
| Dell Latitude 14 9410 2-in-1 P110G i7-10610U, UHD Graphics 620, 78 Wh | Lenovo Yoga C940-14IIL i7-1065G7, Iris Plus Graphics G7 (Ice Lake 64 EU), 60 Wh | LG Gram 14T90N i7-10510U, UHD Graphics 620, 72 Wh | HP Elitebook x360 1040 G5 i7-8650U, UHD Graphics 620, 56 Wh | Dell Latitude 7400 2-in-1 i7-8665U, UHD Graphics 620, 78 Wh | Asus ZenBook Flip 14 UX463FA-AI039T i5-10210U, UHD Graphics 620, 50 Wh | |
|---|---|---|---|---|---|---|
| Duração da bateria | -56% | -30% | -32% | -36% | -59% | |
| Reader / Idle (h) | 48.2 | 32.8 -32% | 27.9 -42% | |||
| WiFi v1.3 (h) | 19 | 10.6 -44% | 12.5 -34% | 10.4 -45% | 12.2 -36% | 7.7 -59% |
| Load (h) | 3.4 | 1.1 -68% | 2.6 -24% | 3.1 -9% |
Pro
Contra
A boa notícia é que o 2-em-1 Latitude 9410 não é tão diferente do já excelente 2-em-1 Latitude 7400. A Dell não mexeu com nada bom e, em vez disso, simplesmente atualizou alguns componentes como a CPU e WLAN para permanecer competitivo contra o HP EliteBook x360 e a série conversível Lenovo Yoga.
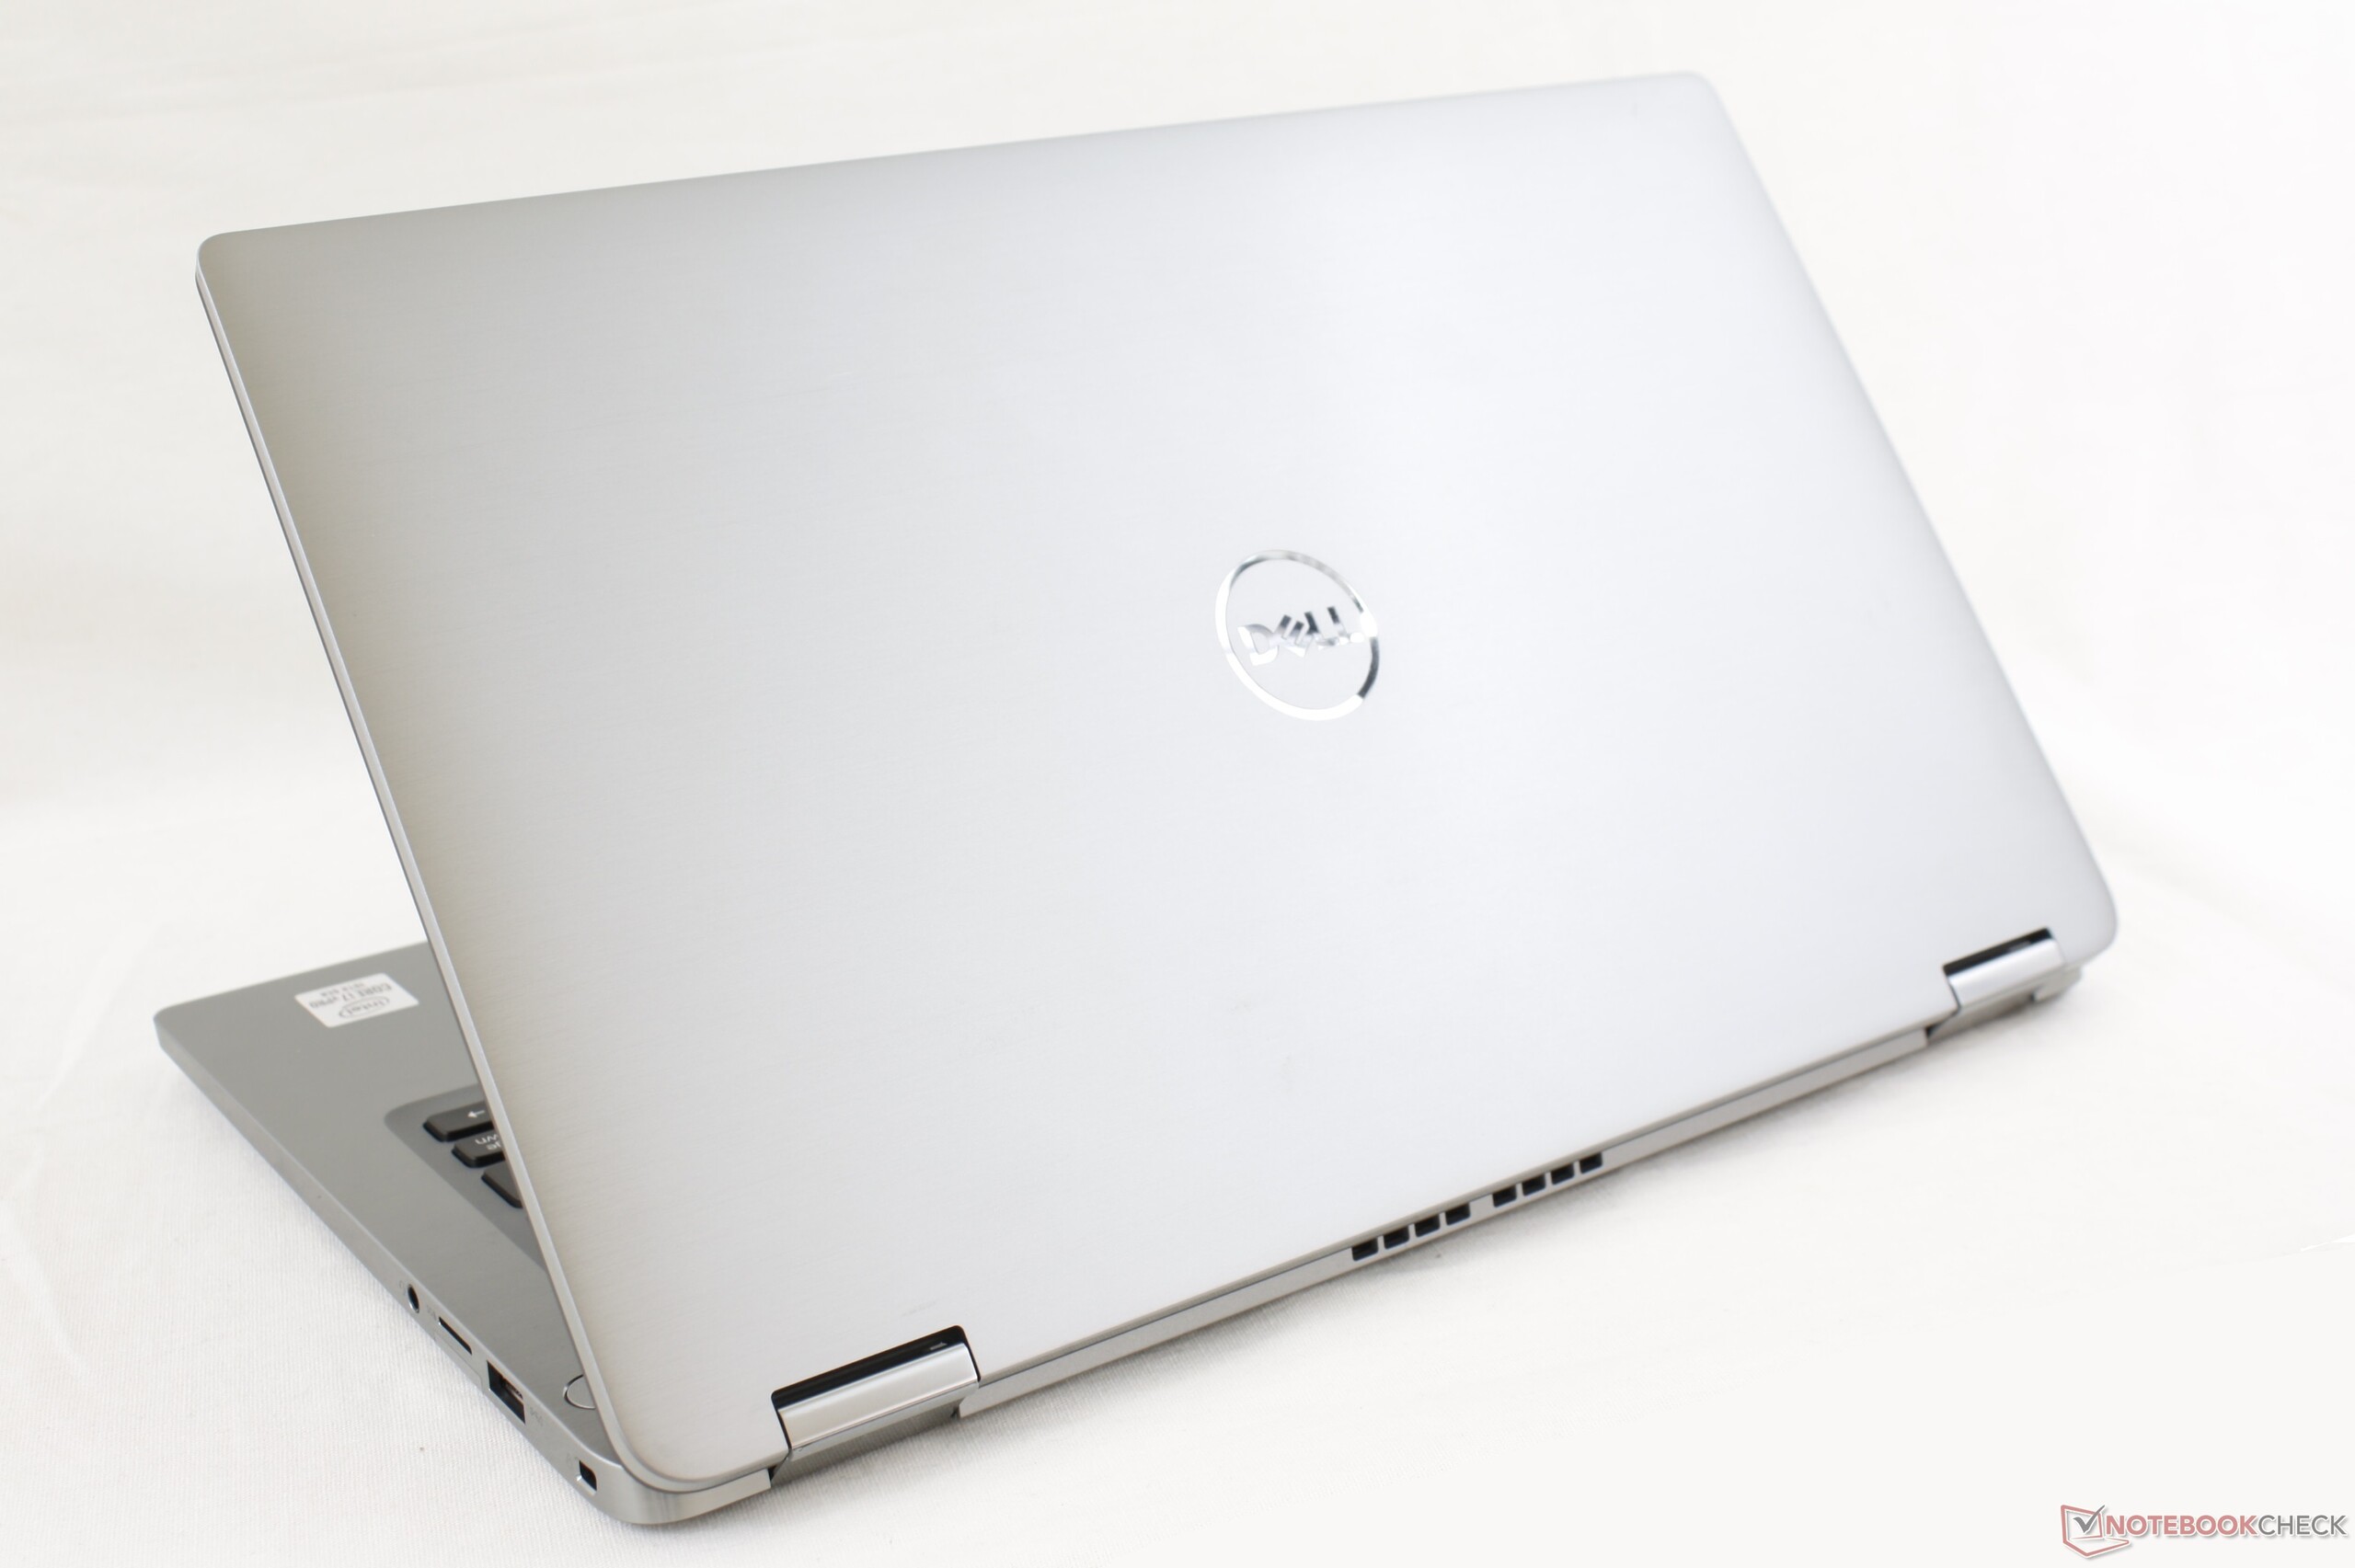
Por outro lado, a má notícia é que o 2-em-1 Latitude 9410 não é tão diferente do já excelente 2-em-1 Latitude 7400. É uma faca de dois gumes porque os usuários podem comprar o 2-em-1 7400 do ano passado para obter essencialmente a mesma experiência e desempenho do 2-em-1 Latitude 9410, mais caro. Pequenas desvantagens como a falta de uma webcam adequada ou opções de tela mais brilhantes não foram abordadas e as opções de GPU ainda são inexistentes, mas elas não prejudicam um design de chassi excelente que mal tem um ano de idade.
Não se deixe enganar pelo novo nome, porque o 2-em-1 Latitude 9410 é apenas uma pequena atualização do já excelente Latitude 7400. Ainda é um dos melhores conversíveis empresariais de 14 polegadas que você pode comprar atualmente, embora possa não ter a tela mais brilhante que existe.
Dell Latitude 14 9410 2-in-1 P110G
- 08/31/2020 v7 (old)
Allen Ngo
Price comparison
