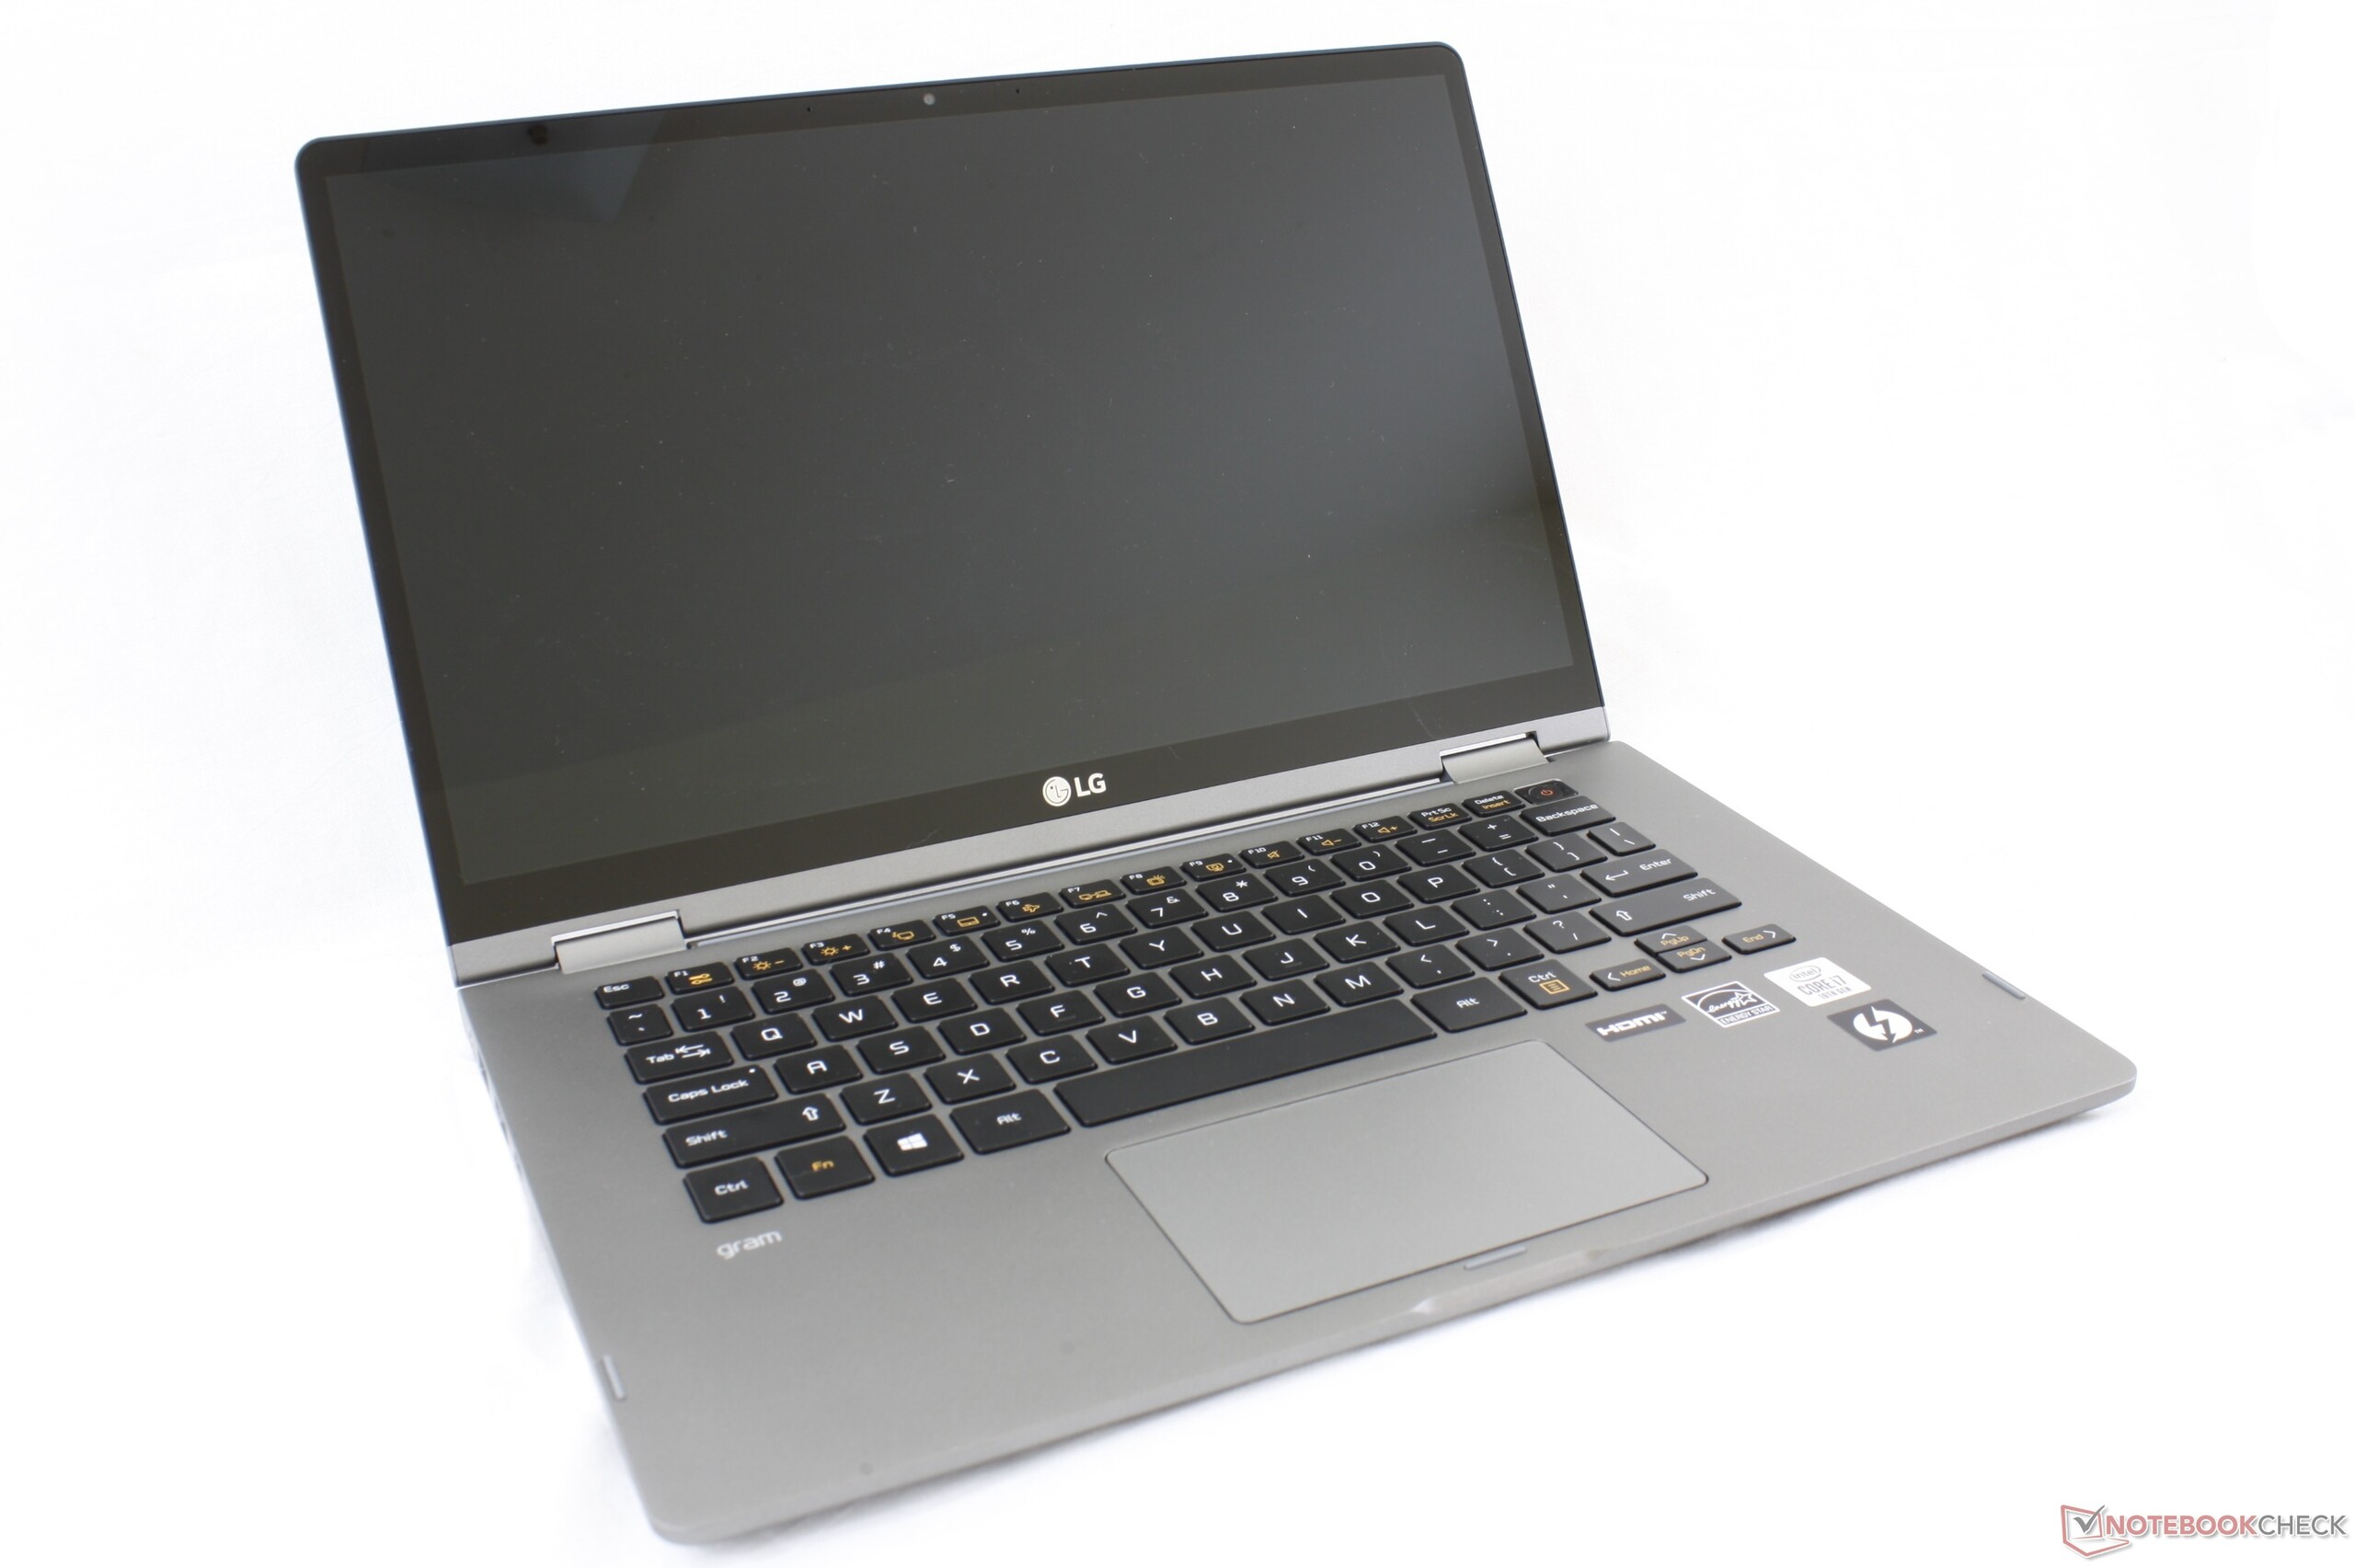
Breve Análise do Conversível LG Gram 14T90N: Um downgrade da CPU
Avaliação | Data | Modelo | Peso | Altura | Size | Resolução | Preço |
|---|---|---|---|---|---|---|---|
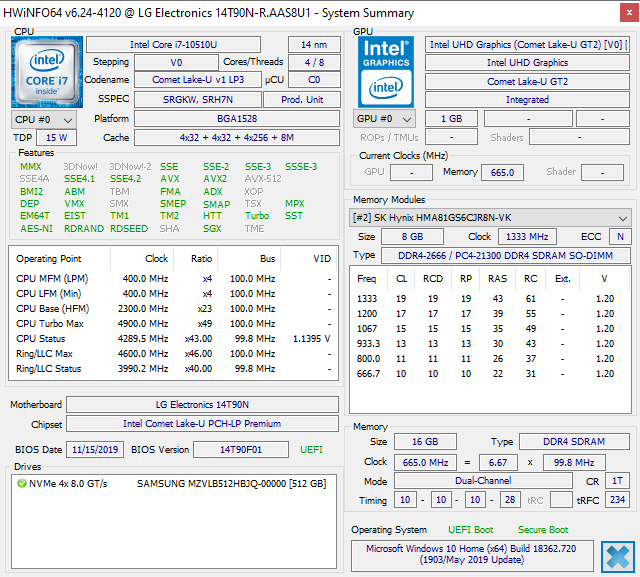
| 81.2 % v7 (old) | 04/2020 | LG Gram 14T90N i7-10510U, UHD Graphics 620 | 1.2 kg | 18 mm | 14.00" | 1920x1080 | |
| 81.2 % v7 (old) | 02/2020 | Asus ZenBook 14 UM431DA-AM020T R7 3700U, Vega 10 | 1.4 kg | 16 mm | 14.00" | 1920x1080 | |
| 86.3 % v7 (old) | 10/2019 | Dell XPS 13 7390 2-in-1 Core i7 i7-1065G7, Iris Plus Graphics G7 (Ice Lake 64 EU) | 1.3 kg | 13 mm | 13.40" | 1920x1200 | |
| 88.5 % v7 (old) | 03/2020 | Lenovo ThinkPad X1 Carbon G7 20R1-000YUS i7-10510U, UHD Graphics 620 | 1.2 kg | 15.4 mm | 14.00" | 3840x2160 | |
| 85.9 % v7 (old) | 11/2019 | Dell XPS 13 7390 Core i7-10710U i7-10710U, UHD Graphics 620 | 1.2 kg | 11.6 mm | 13.30" | 3840x2160 |
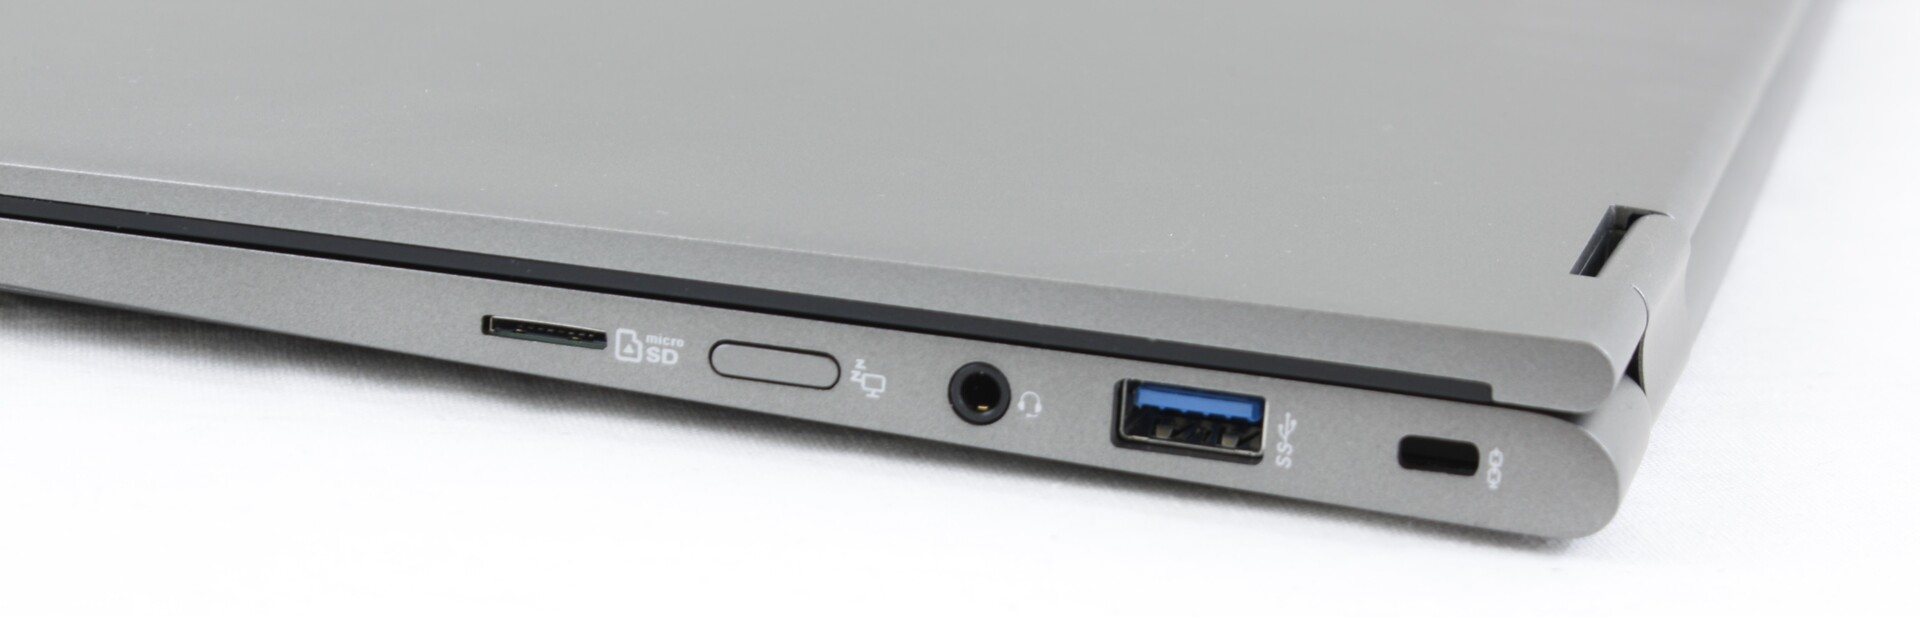
| SD Card Reader | |
| average JPG Copy Test (av. of 3 runs) | |
| Dell XPS 13 7390 2-in-1 Core i7 (Toshiba Exceria Pro M501 64 GB UHS-II) | |
| LG Gram 14T90N (Toshiba Exceria Pro M501 64 GB UHS-II) | |
| LG Gram 14Z980-U.AAW5U1 (Toshiba Exceria Pro M501 microSDXC 64GB) | |
| Asus ZenBook 14 UM431DA-AM020T (Toshiba Exceria Pro SDXC 64 GB UHS-II) | |
| maximum AS SSD Seq Read Test (1GB) | |
| Dell XPS 13 7390 2-in-1 Core i7 (Toshiba Exceria Pro M501 64 GB UHS-II) | |
| LG Gram 14Z980-U.AAW5U1 (Toshiba Exceria Pro M501 microSDXC 64GB) | |
| LG Gram 14T90N (Toshiba Exceria Pro M501 64 GB UHS-II) | |
| Asus ZenBook 14 UM431DA-AM020T (Toshiba Exceria Pro SDXC 64 GB UHS-II) | |

| |||||||||||||||||||||||||
iluminação: 86 %
iluminação com acumulador: 322.2 cd/m²
Contraste: 1289:1 (Preto: 0.25 cd/m²)
ΔE ColorChecker Calman: 3.62 | ∀{0.5-29.43 Ø4.71}
calibrated: 1.22
ΔE Greyscale Calman: 3.9 | ∀{0.09-98 Ø4.96}
95.6% sRGB (Argyll 1.6.3 3D)
61.3% AdobeRGB 1998 (Argyll 1.6.3 3D)
66.7% AdobeRGB 1998 (Argyll 3D)
95.7% sRGB (Argyll 3D)
65% Display P3 (Argyll 3D)
Gamma: 2.43
CCT: 6344 K
| LG Gram 14T90N LG Philips LP140WFA-SPY1, IPS, 14", 1920x1080 | LG Gram 14Z980-U.AAW5U1 LG Philips LP140WF7-SPG1, IPS, 14", 1920x1080 | Asus ZenBook 14 UM431DA-AM020T CEC PA LM140LF-3L03, IPS, 14", 1920x1080 | Dell XPS 13 7390 2-in-1 Core i7 Sharp LQ134N1, IPS, 13.4", 1920x1200 | Huawei Matebook X Pro i5 Tianma XM, IPS, 13.9", 3000x2000 | Lenovo ThinkPad X1 Carbon G7 20R1-000YUS BOE NV140QUM-N53, IPS, 14", 3840x2160 | |
|---|---|---|---|---|---|---|
| Display | -1% | 0% | 6% | 0% | 19% | |
| Display P3 Coverage (%) | 65 | 64.7 0% | 66.7 3% | 69.9 8% | 65.9 1% | 83 28% |
| sRGB Coverage (%) | 95.7 | 94.3 -1% | 92.3 -4% | 99.2 4% | 95.2 -1% | 99.7 4% |
| AdobeRGB 1998 Coverage (%) | 66.7 | 66 -1% | 67.5 1% | 71.5 7% | 67.6 1% | 83.1 25% |
| Response Times | 21% | 27% | 12% | 24% | 6% | |
| Response Time Grey 50% / Grey 80% * (ms) | 54 ? | 36.8 ? 32% | 36 ? 33% | 47.6 ? 12% | 40.4 ? 25% | 49.2 ? 9% |
| Response Time Black / White * (ms) | 32.8 ? | 30 ? 9% | 26 ? 21% | 29.2 ? 11% | 25.6 ? 22% | 32.2 ? 2% |
| PWM Frequency (Hz) | 44 ? | 2500 ? | 201.6 ? | |||
| Screen | -17% | -49% | 20% | -4% | -32% | |
| Brightness middle (cd/m²) | 322.2 | 333.8 4% | 253 -21% | 549.8 71% | 442.7 37% | 532 65% |
| Brightness (cd/m²) | 301 | 307 2% | 245 -19% | 520 73% | 428 42% | 513 70% |
| Brightness Distribution (%) | 86 | 83 -3% | 78 -9% | 86 0% | 84 -2% | 90 5% |
| Black Level * (cd/m²) | 0.25 | 0.4 -60% | 0.225 10% | 0.39 -56% | 0.31 -24% | 0.41 -64% |
| Contrast (:1) | 1289 | 835 -35% | 1124 -13% | 1410 9% | 1428 11% | 1298 1% |
| Colorchecker dE 2000 * | 3.62 | 3.54 2% | 8.89 -146% | 2.12 41% | 2.24 38% | 6.88 -90% |
| Colorchecker dE 2000 max. * | 6.9 | 5.8 16% | 4.56 34% | 3.66 47% | 7.19 -4% | 12.65 -83% |
| Colorchecker dE 2000 calibrated * | 1.22 | 2.36 -93% | 4.9 -302% | 1.37 -12% | 1.11 9% | 2.52 -107% |
| Greyscale dE 2000 * | 3.9 | 4.7 -21% | 6.33 -62% | 2.6 33% | 9.7 -149% | 10.5 -169% |
| Gamma | 2.43 91% | 2.14 103% | 2.52 87% | 2.3 96% | 1.42 155% | 1.98 111% |
| CCT | 6344 102% | 6261 104% | 6745 96% | 6884 94% | 6227 104% | 7394 88% |
| Color Space (Percent of AdobeRGB 1998) (%) | 61.3 | 61.2 0% | 60 -2% | 65.4 7% | 61.6 0% | 74.1 21% |
| Color Space (Percent of sRGB) (%) | 95.6 | 94.7 -1% | 91 -5% | 99.7 4% | 95 -1% | 99.7 4% |
| Média Total (Programa/Configurações) | 1% /
-9% | -7% /
-30% | 13% /
16% | 7% /
0% | -2% /
-17% |
* ... menor é melhor
Exibir tempos de resposta
| ↔ Tempo de resposta preto para branco | ||
|---|---|---|
| 32.8 ms ... ascensão ↗ e queda ↘ combinadas | ↗ 19.6 ms ascensão | 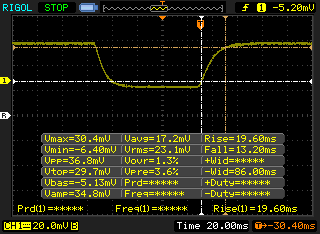 |
| ↘ 13.2 ms queda | ||
| A tela mostra taxas de resposta lentas em nossos testes e será insatisfatória para os jogadores. Em comparação, todos os dispositivos testados variam de 0.1 (mínimo) a 240 (máximo) ms. » 88 % de todos os dispositivos são melhores. Isso significa que o tempo de resposta medido é pior que a média de todos os dispositivos testados (19.8 ms). | ||
| ↔ Tempo de resposta 50% cinza a 80% cinza | ||
| 54 ms ... ascensão ↗ e queda ↘ combinadas | ↗ 28.8 ms ascensão | 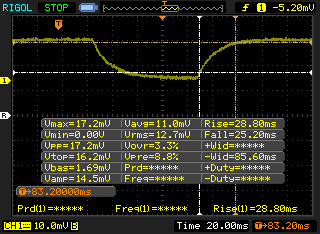 |
| ↘ 25.2 ms queda | ||
| A tela mostra taxas de resposta lentas em nossos testes e será insatisfatória para os jogadores. Em comparação, todos os dispositivos testados variam de 0.165 (mínimo) a 636 (máximo) ms. » 91 % de todos os dispositivos são melhores. Isso significa que o tempo de resposta medido é pior que a média de todos os dispositivos testados (31 ms). | ||
Cintilação da tela / PWM (modulação por largura de pulso)
| Tela tremeluzindo / PWM não detectado | 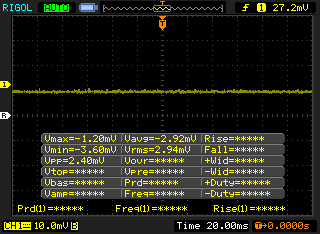 | ||
[pwm_comparison] Em comparação: 52 % de todos os dispositivos testados não usam PWM para escurecer a tela. Se PWM foi detectado, uma média de 7757 (mínimo: 5 - máximo: 343500) Hz foi medida. | |||
| wPrime 2.10 - 1024m | |
| Microsoft Surface Laptop 3 13 Core i5-1035G7 | |
| Dell XPS 13 7390 2-in-1 Core i7 | |
| Dell XPS 13 7390 Core i7-10710U | |
* ... menor é melhor
| PCMark 8 Home Score Accelerated v2 | 3646 pontos | |
| PCMark 8 Work Score Accelerated v2 | 5153 pontos | |
| PCMark 10 Score | 4167 pontos | |
Ajuda | ||
| LG Gram 14T90N Samsung SSD PM981a MZVLB512HBJQ | LG Gram 14Z980-U.AAW5U1 SK Hynix SC313 HFS256G39TNF | Asus ZenBook 14 UM431DA-AM020T SK hynix BC501 HFM512GDHTNG-8310A | Dell XPS 13 7390 2-in-1 Core i7 Toshiba BG4 KBG40ZPZ512G | Lenovo ThinkPad X1 Carbon G7 20R1-000YUS WDC PC SN730 SDBPNTY-512G | |
|---|---|---|---|---|---|
| AS SSD | -63% | -32% | -76% | -21% | |
| Seq Read (MB/s) | 1829 | 476.1 -74% | 1417 -23% | 1801 -2% | 1786 -2% |
| Seq Write (MB/s) | 2048 | 487.4 -76% | 781 -62% | 1125 -45% | 1259 -39% |
| 4K Read (MB/s) | 54.2 | 30.57 -44% | 37.03 -32% | 39.7 -27% | 45.86 -15% |
| 4K Write (MB/s) | 120.5 | 66.1 -45% | 80.1 -34% | 67 -44% | 147.9 23% |
| 4K-64 Read (MB/s) | 1512 | 352.9 -77% | 740 -51% | 1253 -17% | 885 -41% |
| 4K-64 Write (MB/s) | 1573 | 263.1 -83% | 748 -52% | 209 -87% | 950 -40% |
| Access Time Read * (ms) | 0.046 | 0.092 -100% | 0.047 -2% | 0.069 -50% | 0.058 -26% |
| Access Time Write * (ms) | 0.091 | 0.055 40% | 0.045 51% | 0.625 -587% | 0.074 19% |
| Score Read (Points) | 1749 | 431 -75% | 918 -48% | 1472 -16% | 1110 -37% |
| Score Write (Points) | 1899 | 378 -80% | 906 -52% | 388 -80% | 1224 -36% |
| Score Total (Points) | 4560 | 1040 -77% | 2270 -50% | 2583 -43% | 2885 -37% |
| Copy ISO MB/s (MB/s) | 1891 | 514 -73% | 1293 -32% | 1384 -27% | |
| Copy Program MB/s (MB/s) | 569 | 259.3 -54% | 560 -2% | 525 -8% | |
| Copy Game MB/s (MB/s) | 1425 | 521 -63% | 927 -35% | 1008 -29% | |
| CrystalDiskMark 5.2 / 6 | -69% | -45% | -23% | -3% | |
| Write 4K (MB/s) | 181.4 | 74.7 -59% | 118.8 -35% | 106.7 -41% | 151.5 -16% |
| Read 4K (MB/s) | 52.5 | 14.89 -72% | 41.62 -21% | 49.94 -5% | 45.83 -13% |
| Write Seq (MB/s) | 1592 | 502 -68% | 796 -50% | 1223 -23% | 2060 29% |
| Read Seq (MB/s) | 1617 | 498.6 -69% | 1101 -32% | 1801 11% | 1973 22% |
| Write 4K Q32T1 (MB/s) | 556 | 214.3 -61% | 234.7 -58% | 325.3 -41% | 489.8 -12% |
| Read 4K Q32T1 (MB/s) | 539 | 225.5 -58% | 313.8 -42% | 551 2% | 386.2 -28% |
| Write Seq Q32T1 (MB/s) | 2955 | 505 -83% | 842 -72% | 1224 -59% | 2703 -9% |
| Read Seq Q32T1 (MB/s) | 3270 | 560 -83% | 1645 -50% | 2350 -28% | 3376 3% |
| Média Total (Programa/Configurações) | -66% /
-65% | -39% /
-38% | -50% /
-57% | -12% /
-15% |
* ... menor é melhor

| 3DMark 11 Performance | 1923 pontos | |
| 3DMark Ice Storm Standard Score | 14669 pontos | |
| 3DMark Cloud Gate Standard Score | 6582 pontos | |
| 3DMark Fire Strike Score | 1056 pontos | |
| 3DMark Time Spy Score | 429 pontos | |
Ajuda | ||
| baixo | média | alto | ultra | |
|---|---|---|---|---|
| BioShock Infinite (2013) | 59.8 | 38.4 | 32 | 10.2 |
| Dota 2 Reborn (2015) | 57.6 | 39.1 | 19 | 17 |
| X-Plane 11.11 (2018) | 20.5 | 13.2 | 12 |
| LG Gram 14T90N UHD Graphics 620, i7-10510U, Samsung SSD PM981a MZVLB512HBJQ | LG Gram 14Z980-U.AAW5U1 UHD Graphics 620, i5-8250U, SK Hynix SC313 HFS256G39TNF | Asus ZenBook 14 UM431DA-AM020T Vega 10, R7 3700U, SK hynix BC501 HFM512GDHTNG-8310A | Dell XPS 13 7390 2-in-1 Core i7 Iris Plus Graphics G7 (Ice Lake 64 EU), i7-1065G7, Toshiba BG4 KBG40ZPZ512G | Huawei Matebook X Pro i5 GeForce MX150, i5-8250U, Samsung PM961 MZVLW256HEHP | Lenovo Yoga C940-14IIL 81Q9 Iris Plus Graphics G7 (Ice Lake 64 EU), i7-1065G7, Samsung PM981a MZVLB1T0HBLR | |
|---|---|---|---|---|---|---|
| Noise | 4% | 1% | 2% | 0% | 2% | |
| desligado / ambiente * (dB) | 29 | 28.2 3% | 29.8 -3% | 28.1 3% | 27.9 4% | 28.5 2% |
| Idle Minimum * (dB) | 30 | 28.4 5% | 28 7% | 28.1 6% | 27.9 7% | 28.5 5% |
| Idle Average * (dB) | 30 | 28.4 5% | 28 7% | 28.1 6% | 27.9 7% | 28.5 5% |
| Idle Maximum * (dB) | 30 | 28.4 5% | 28 7% | 28.1 6% | 27.9 7% | 29 3% |
| Load Average * (dB) | 35.2 | 35.7 -1% | 36.8 -5% | 31.7 10% | 36.2 -3% | 33 6% |
| Load Maximum * (dB) | 37 | 34.2 8% | 39 -5% | 43.4 -17% | 45.2 -22% | 39.5 -7% |
| Witcher 3 ultra * (dB) | 43.4 | 45 | 40.7 |
* ... menor é melhor
Barulho
| Ocioso |
| 30 / 30 / 30 dB |
| Carga |
| 35.2 / 37 dB |
 | ||
30 dB silencioso 40 dB(A) audível 50 dB(A) ruidosamente alto |
||
min: | ||
(±) A temperatura máxima no lado superior é 43.2 °C / 110 F, em comparação com a média de 35.4 °C / 96 F , variando de 19.6 a 60 °C para a classe Convertible.
(±) A parte inferior aquece até um máximo de 41.6 °C / 107 F, em comparação com a média de 36.9 °C / 98 F
(+) Em uso inativo, a temperatura média para o lado superior é 26.7 °C / 80 F, em comparação com a média do dispositivo de 30.3 °C / ### class_avg_f### F.
(+) Os apoios para as mãos e o touchpad são mais frios que a temperatura da pele, com um máximo de 30 °C / 86 F e, portanto, são frios ao toque.
(±) A temperatura média da área do apoio para as mãos de dispositivos semelhantes foi 28 °C / 82.4 F (-2 °C / -3.6 F).
| desligado | |
| Ocioso | |
| Carga |
|
Key:
min: | |
| LG Gram 14T90N i7-10510U, UHD Graphics 620, Samsung SSD PM981a MZVLB512HBJQ, IPS, 1920x1080, 14" | LG Gram 14Z980-U.AAW5U1 i5-8250U, UHD Graphics 620, SK Hynix SC313 HFS256G39TNF, IPS, 1920x1080, 14" | Asus ZenBook 14 UM431DA-AM020T R7 3700U, Vega 10, SK hynix BC501 HFM512GDHTNG-8310A, IPS, 1920x1080, 14" | Dell XPS 13 7390 2-in-1 Core i7 i7-1065G7, Iris Plus Graphics G7 (Ice Lake 64 EU), Toshiba BG4 KBG40ZPZ512G, IPS, 1920x1200, 13.4" | Huawei Matebook X Pro i5 i5-8250U, GeForce MX150, Samsung PM961 MZVLW256HEHP, IPS, 3000x2000, 13.9" | Lenovo Yoga C940-14IIL 81Q9 i7-1065G7, Iris Plus Graphics G7 (Ice Lake 64 EU), Samsung PM981a MZVLB1T0HBLR, IPS, 3840x2160, 14" | |
|---|---|---|---|---|---|---|
| Power Consumption | 5% | -26% | -5% | -49% | -73% | |
| Idle Minimum * (Watt) | 2.9 | 2.7 7% | 3.6 -24% | 2.6 10% | 3.5 -21% | 5.6 -93% |
| Idle Average * (Watt) | 5.8 | 6 -3% | 7.2 -24% | 5.3 9% | 8.9 -53% | 10.5 -81% |
| Idle Maximum * (Watt) | 6.2 | 6.5 -5% | 10.8 -74% | 7 -13% | 12.3 -98% | 12 -94% |
| Load Average * (Watt) | 32.9 | 32.5 1% | 38 -16% | 43.1 -31% | 54.2 -65% | 53.3 -62% |
| Load Maximum * (Watt) | 48.5 | 35.5 27% | 45.2 7% | 49 -1% | 52.1 -7% | 64.6 -33% |
| Witcher 3 ultra * (Watt) | 43.1 | 42.4 | 46.9 |
* ... menor é melhor
| LG Gram 14T90N i7-10510U, UHD Graphics 620, 72 Wh | LG Gram 14Z980-U.AAW5U1 i5-8250U, UHD Graphics 620, 72 Wh | Asus ZenBook 14 UM431DA-AM020T R7 3700U, Vega 10, 47 Wh | Dell XPS 13 7390 2-in-1 Core i7 i7-1065G7, Iris Plus Graphics G7 (Ice Lake 64 EU), 51 Wh | Huawei Matebook X Pro i5 i5-8250U, GeForce MX150, 57.4 Wh | Lenovo ThinkPad X1 Carbon G7 20R1-000YUS i7-10510U, UHD Graphics 620, 51 Wh | |
|---|---|---|---|---|---|---|
| Duração da bateria | 5% | -37% | -28% | -26% | -20% | |
| Reader / Idle (h) | 32.8 | 37.3 14% | 17.8 -46% | 20.7 -37% | ||
| WiFi v1.3 (h) | 12.5 | 12 -4% | 6.7 -46% | 9 -28% | 9.3 -26% | 10 -20% |
| Load (h) | 2.6 | 2.7 4% | 2.1 -19% | 2.2 -15% |
Pro
Contra
A diferença entre o LG Gram14T990 mais antigo e o LG Gram 14T90N mais recente é marginal, na melhor das hipóteses. A atualização do processador é quase imperceptível, o que deixa o Thunderbolt 3 como o principal fator de distinção entre os dois modelos. Se você planeja utilizar dispositivos baseados no Thunderbolt 3, como estações docking e monitores externos, encontrará valor no Gram 14T90N. Caso contrário, economize algumas centenas de dólares e opte pelo Gram14T990.
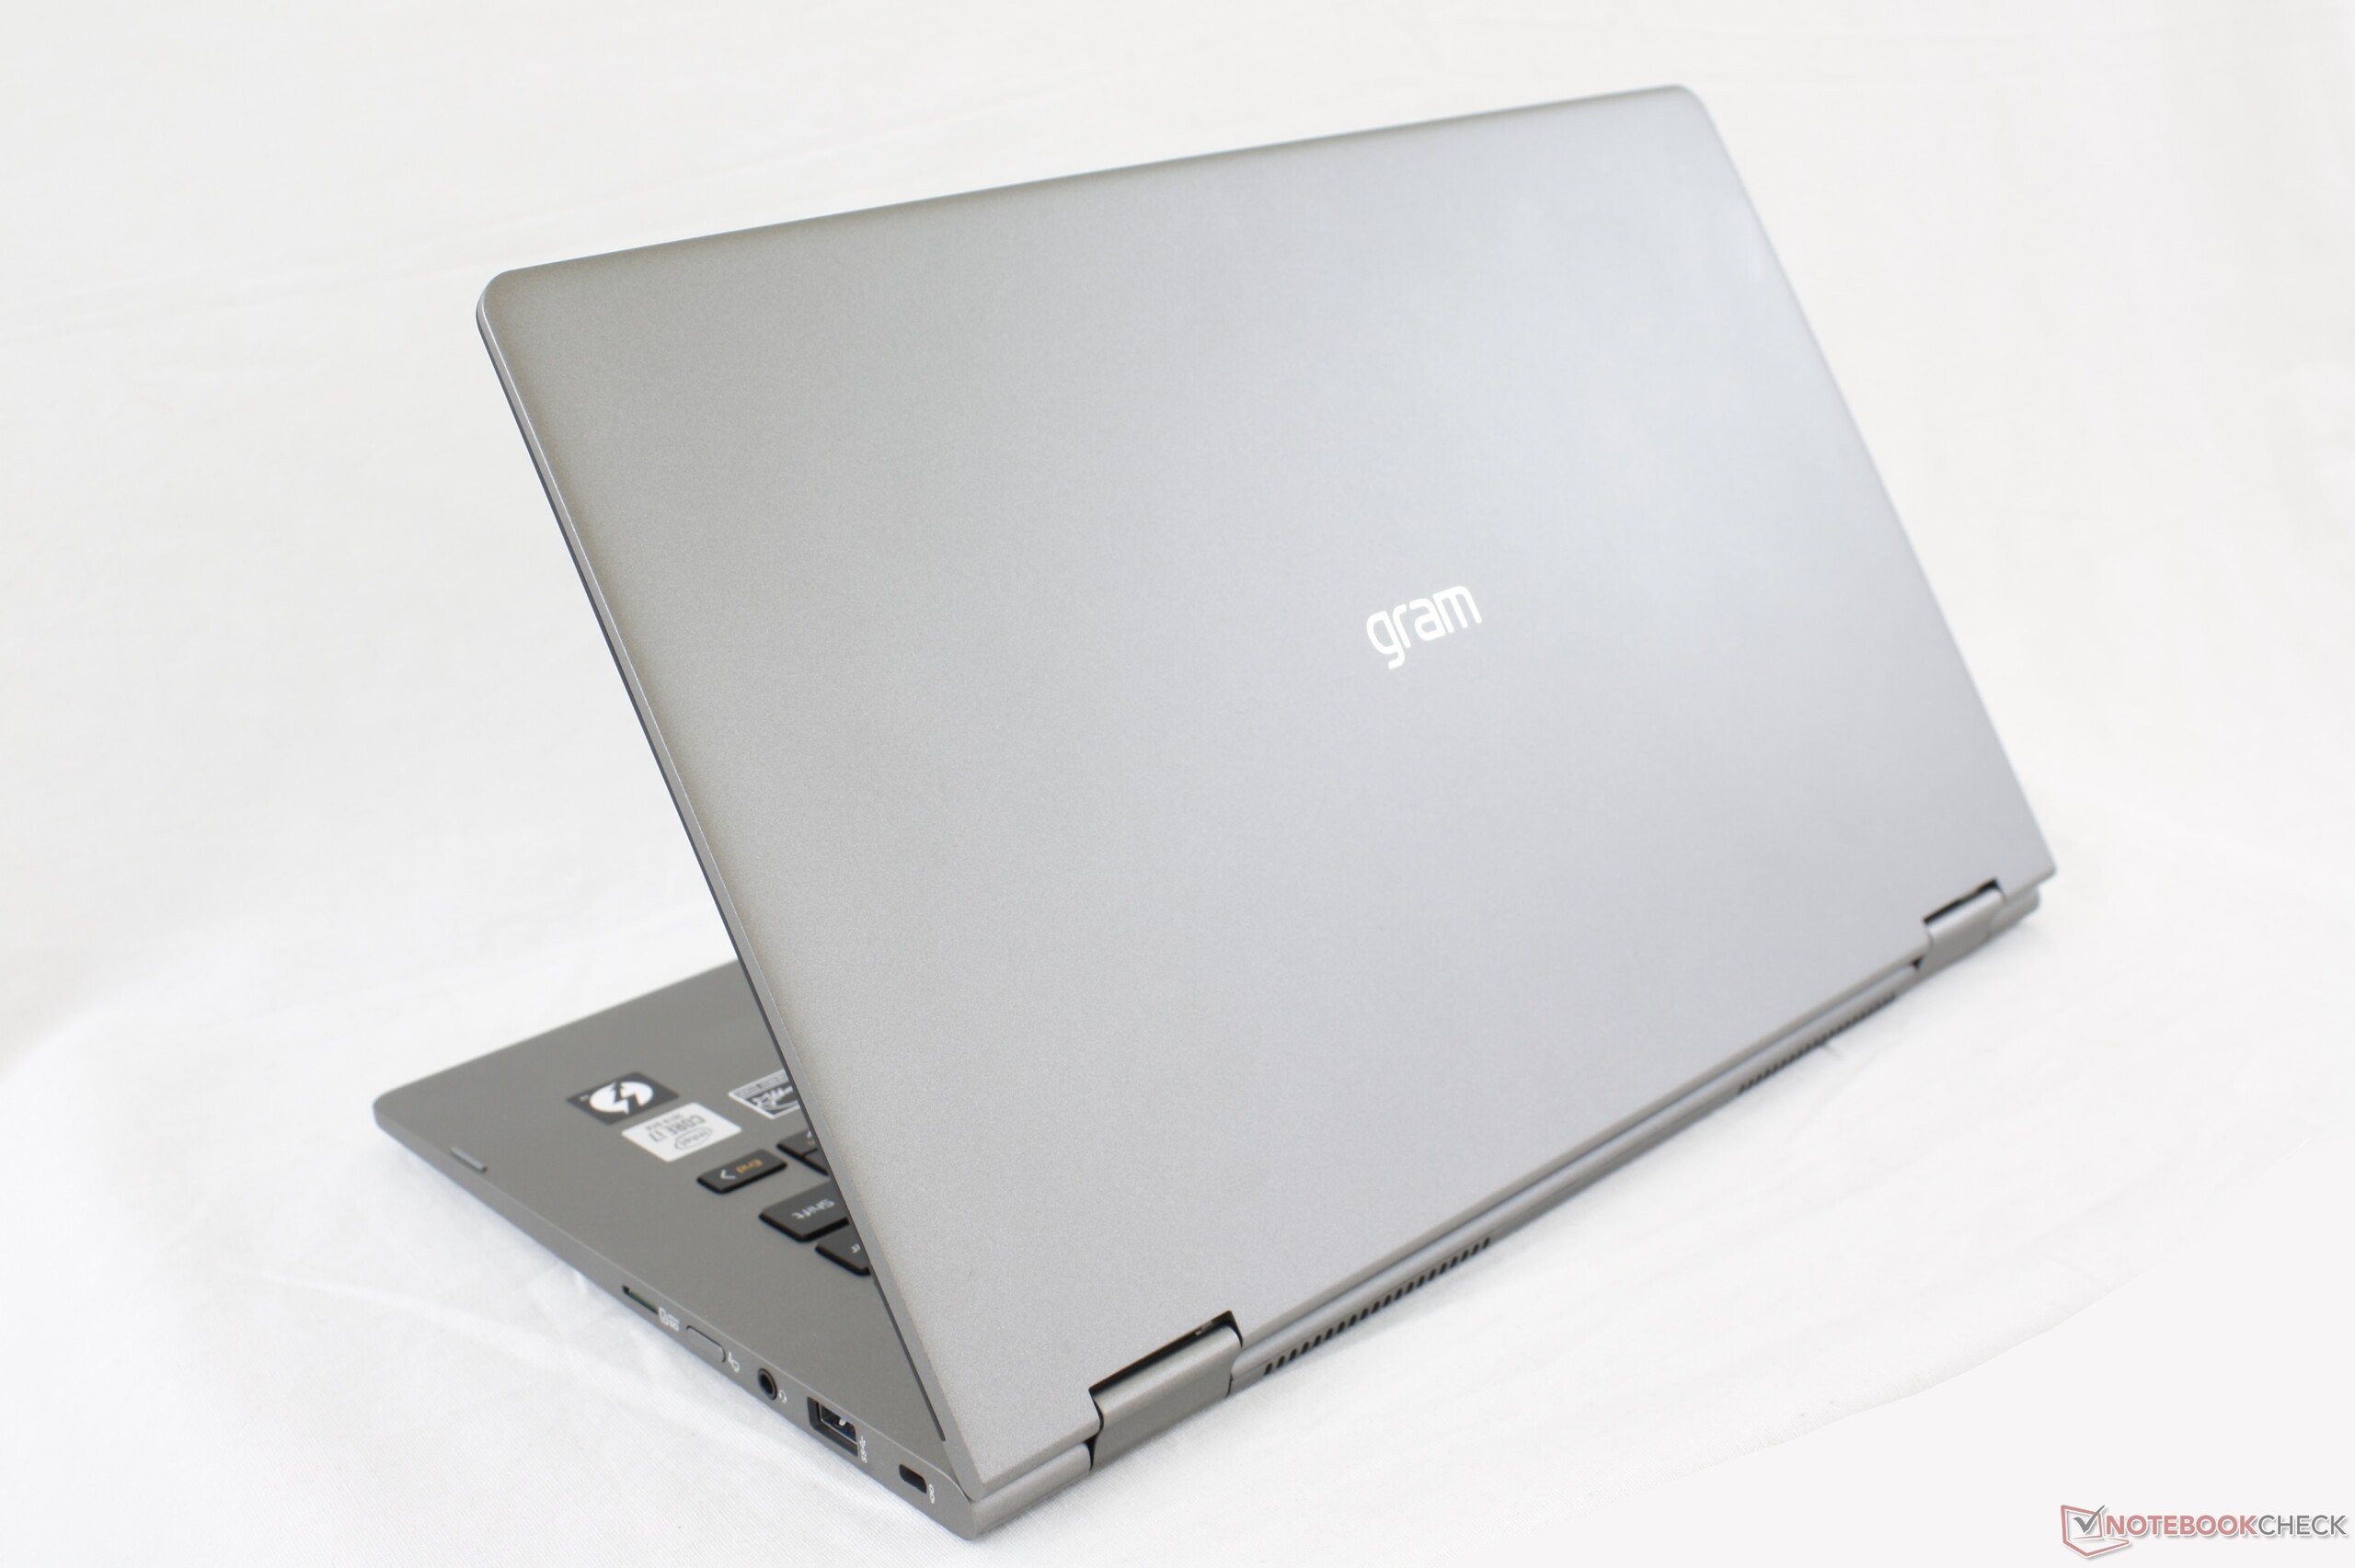
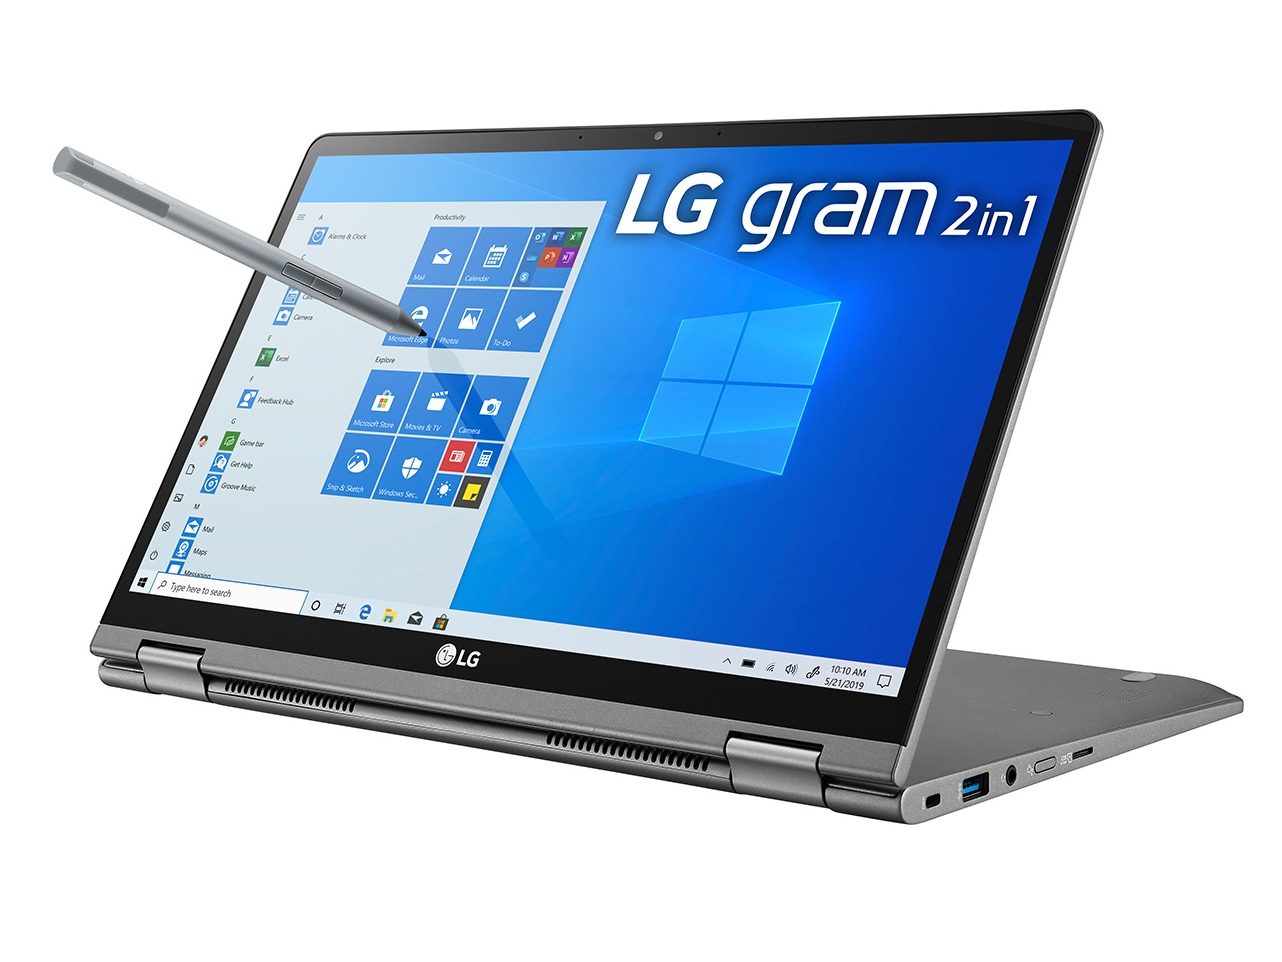
Existem algumas vantagens notáveis que o conversível da LG tem sobre os concorrentes. O baixo peso torna mais fácil o uso no modo tablet do que o ZenBook 14 Flip e as duas baias de armazenamento interno são uma raridade, considerando a categoria. Mesmo assim, o sistema se sente com pouca energia para o preço, especialmente em termos de potencial gráfico, enquanto recursos de privacidade comuns, como um obturador de webcam ou câmera IR, não estão presentes. Talvez uma CPU Core i7 Ice Lake funcionasse melhor considerando o público-alvo. A tela também poderia ter sido mais brilhante para maior visibilidade ao ar livre.
O Gram 14T90N é um conversível de US$ 1400 com uma CPU de baixo desempenho e nada mais. Você precisará usar seu peso leve, bateria de longa duração e a porta Thunderbolt 3 para aproveitar ao máximo o sistema.
LG Gram 14T90N
- 04/06/2020 v7 (old)
Allen Ngo
Price comparison
