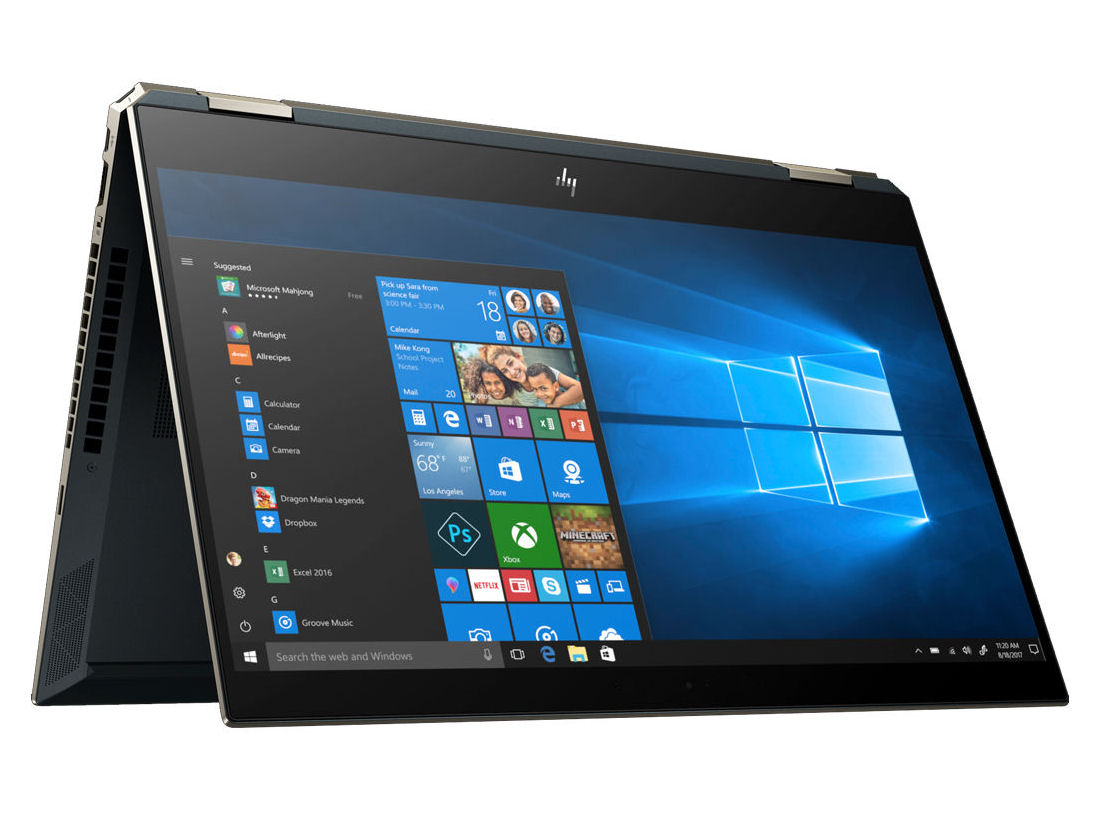
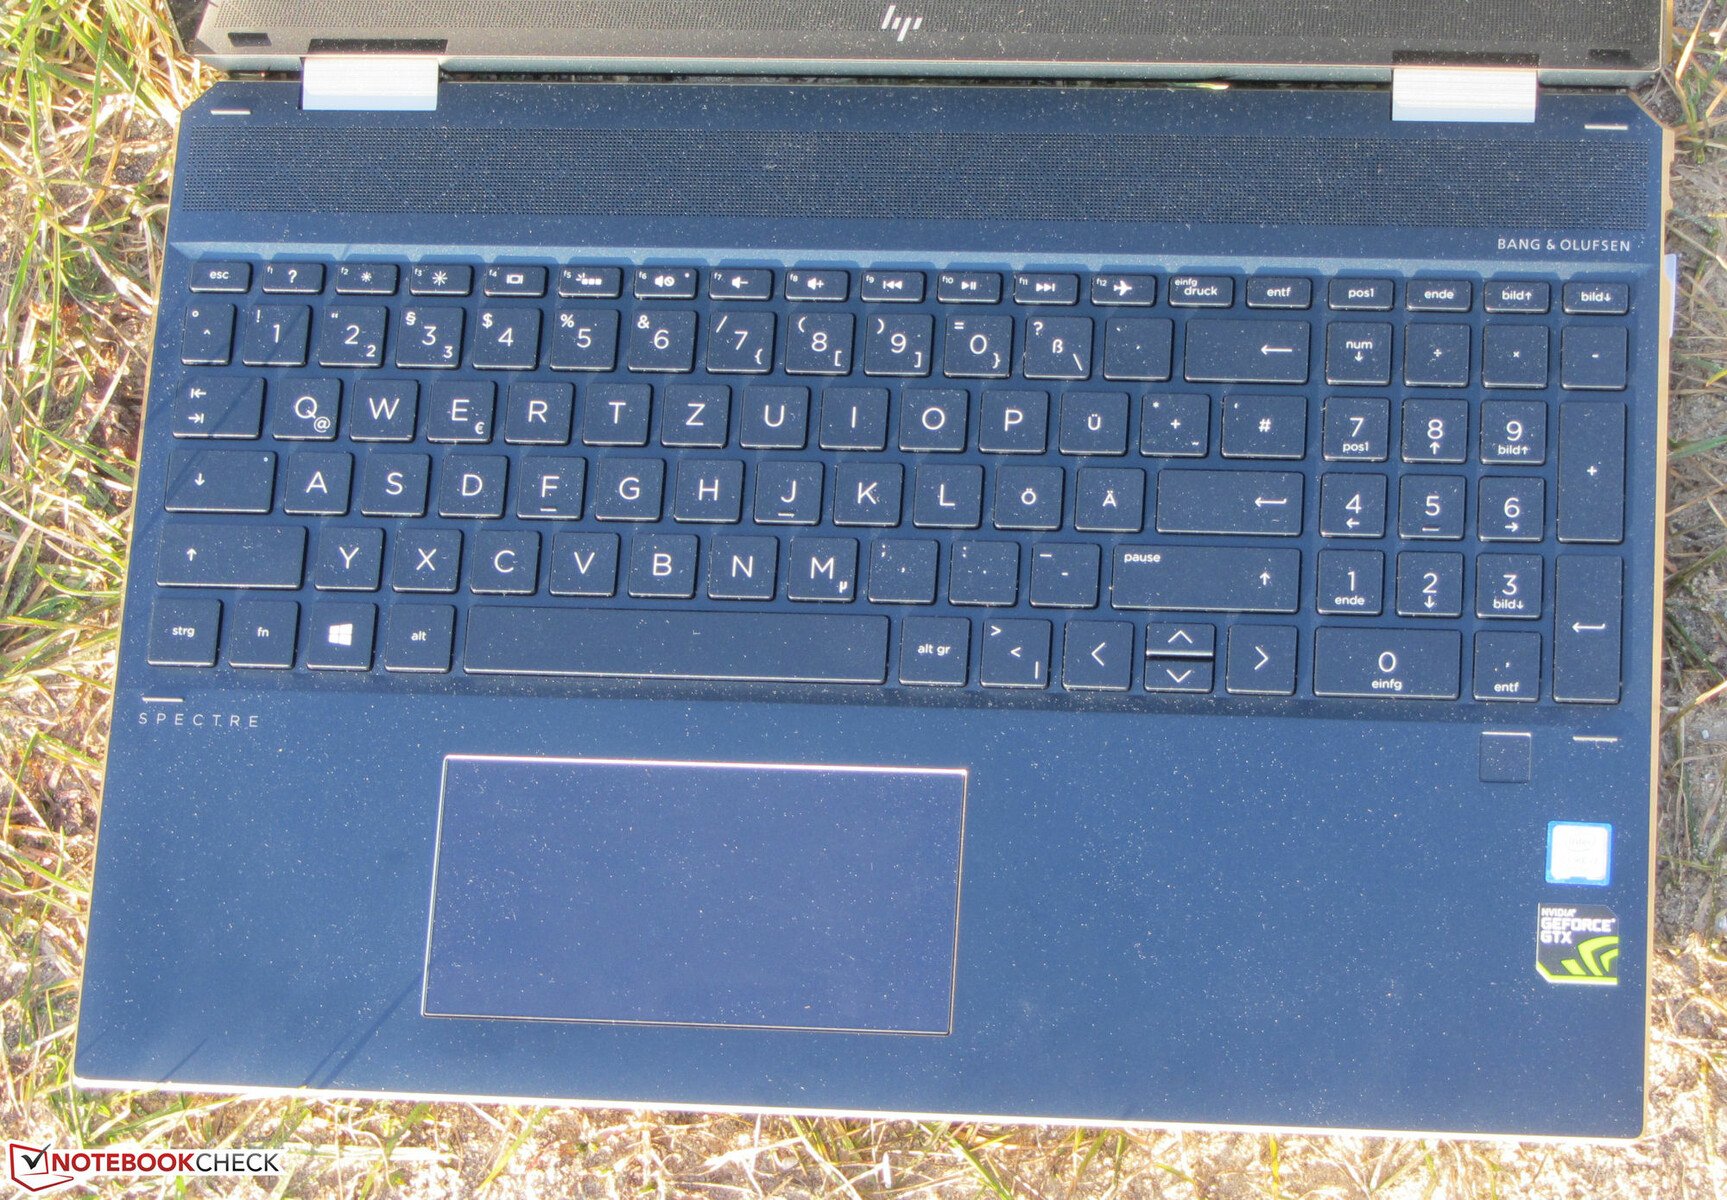
Breve Análise do Conversível HP Spectre x360 15 (Core i7-8750H, GTX 1050 Ti Max-Q, 2 TB SSD, 4K)
| SD Card Reader | |
| average JPG Copy Test (av. of 3 runs) | |
| HP Spectre x360 15-ch000 (Toshiba Exceria Pro SDXC 64 GB UHS-II) | |
| Dell XPS 15 9570 i7 UHD (Toshiba Exceria Pro SDXC 64 GB UHS-II) | |
| HP Spectre x360 15-ch011nr (Toshiba Exceria Pro SDXC 64 GB UHS-II) | |
| HP Spectre x360 15-df0126ng (Toshiba Exceria Pro M501 microSDXC 64GB) | |
| Média da turma Multimedia (23 - 531, n=36, últimos 2 anos) | |
| Asus ZenBook Flip 15 UX561UD (Toshiba Exceria Pro SDXC 64 GB UHS-II) | |
| Acer Spin 5 SP515-51GN-80A3 (Toshiba Exceria Pro SDXC 64 GB UHS-II) | |
| maximum AS SSD Seq Read Test (1GB) | |
| HP Spectre x360 15-ch011nr (Toshiba Exceria Pro SDXC 64 GB UHS-II) | |
| HP Spectre x360 15-ch000 (Toshiba Exceria Pro SDXC 64 GB UHS-II) | |
| Média da turma Multimedia (37.3 - 1455, n=35, últimos 2 anos) | |
| HP Spectre x360 15-df0126ng (Toshiba Exceria Pro M501 microSDXC 64GB) | |
| Dell XPS 15 9570 i7 UHD (Toshiba Exceria Pro SDXC 64 GB UHS-II) | |
| Asus ZenBook Flip 15 UX561UD (Toshiba Exceria Pro SDXC 64 GB UHS-II) | |
| Acer Spin 5 SP515-51GN-80A3 (Toshiba Exceria Pro SDXC 64 GB UHS-II) | |
| |||||||||||||||||||||||||
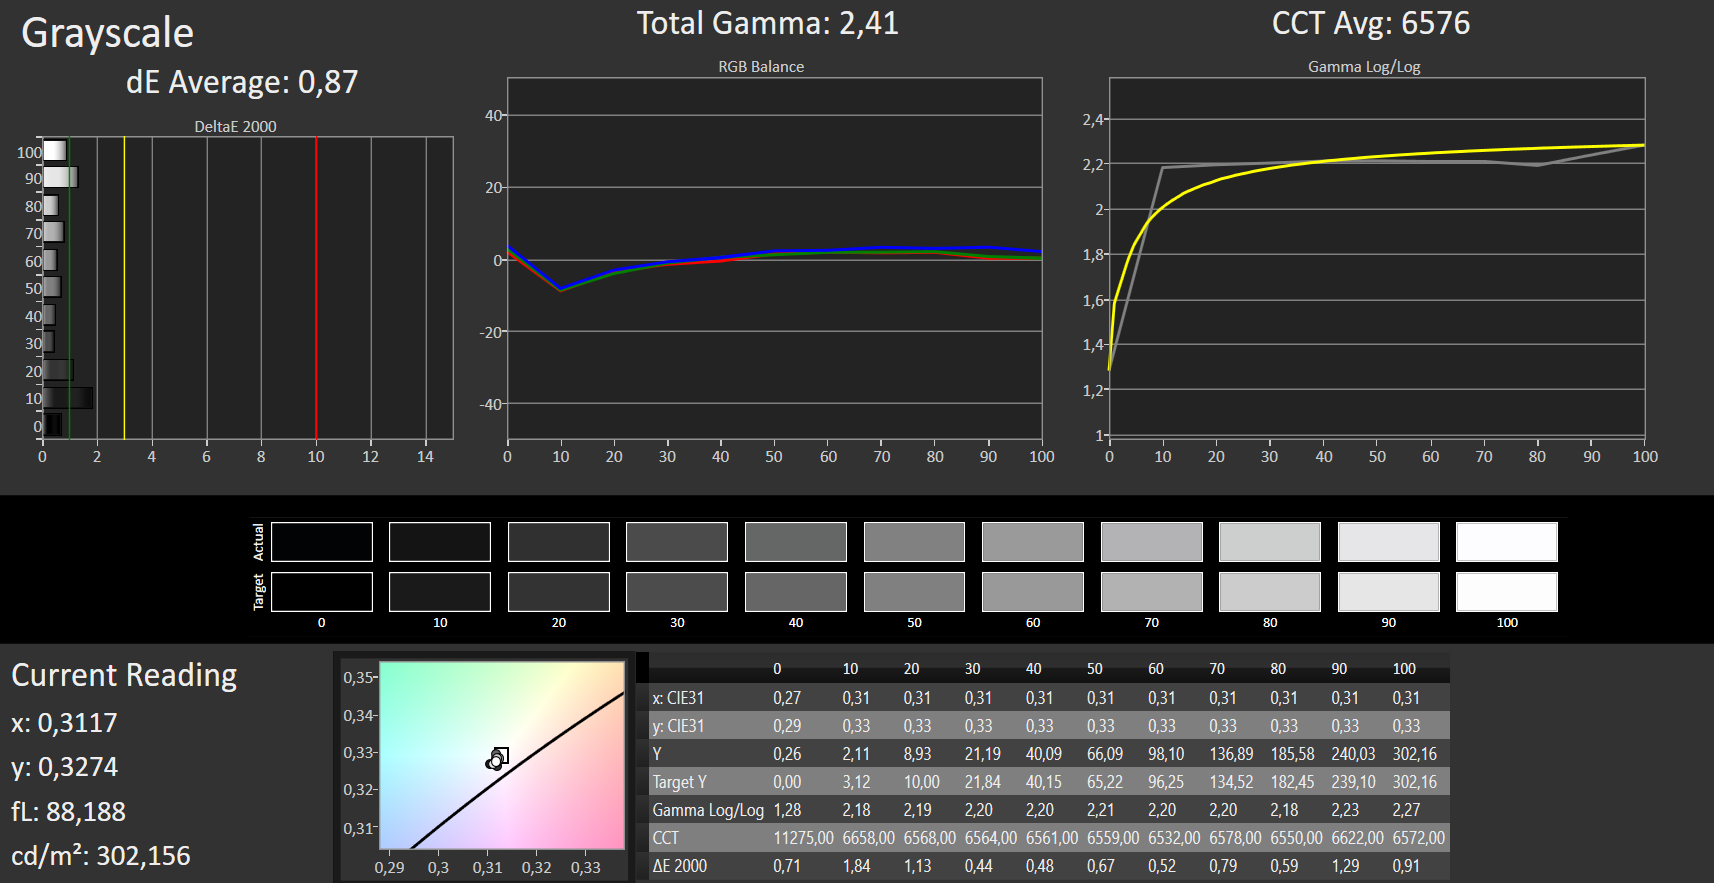
iluminação: 87 %
iluminação com acumulador: 282 cd/m²
Contraste: 892:1 (Preto: 0.37 cd/m²)
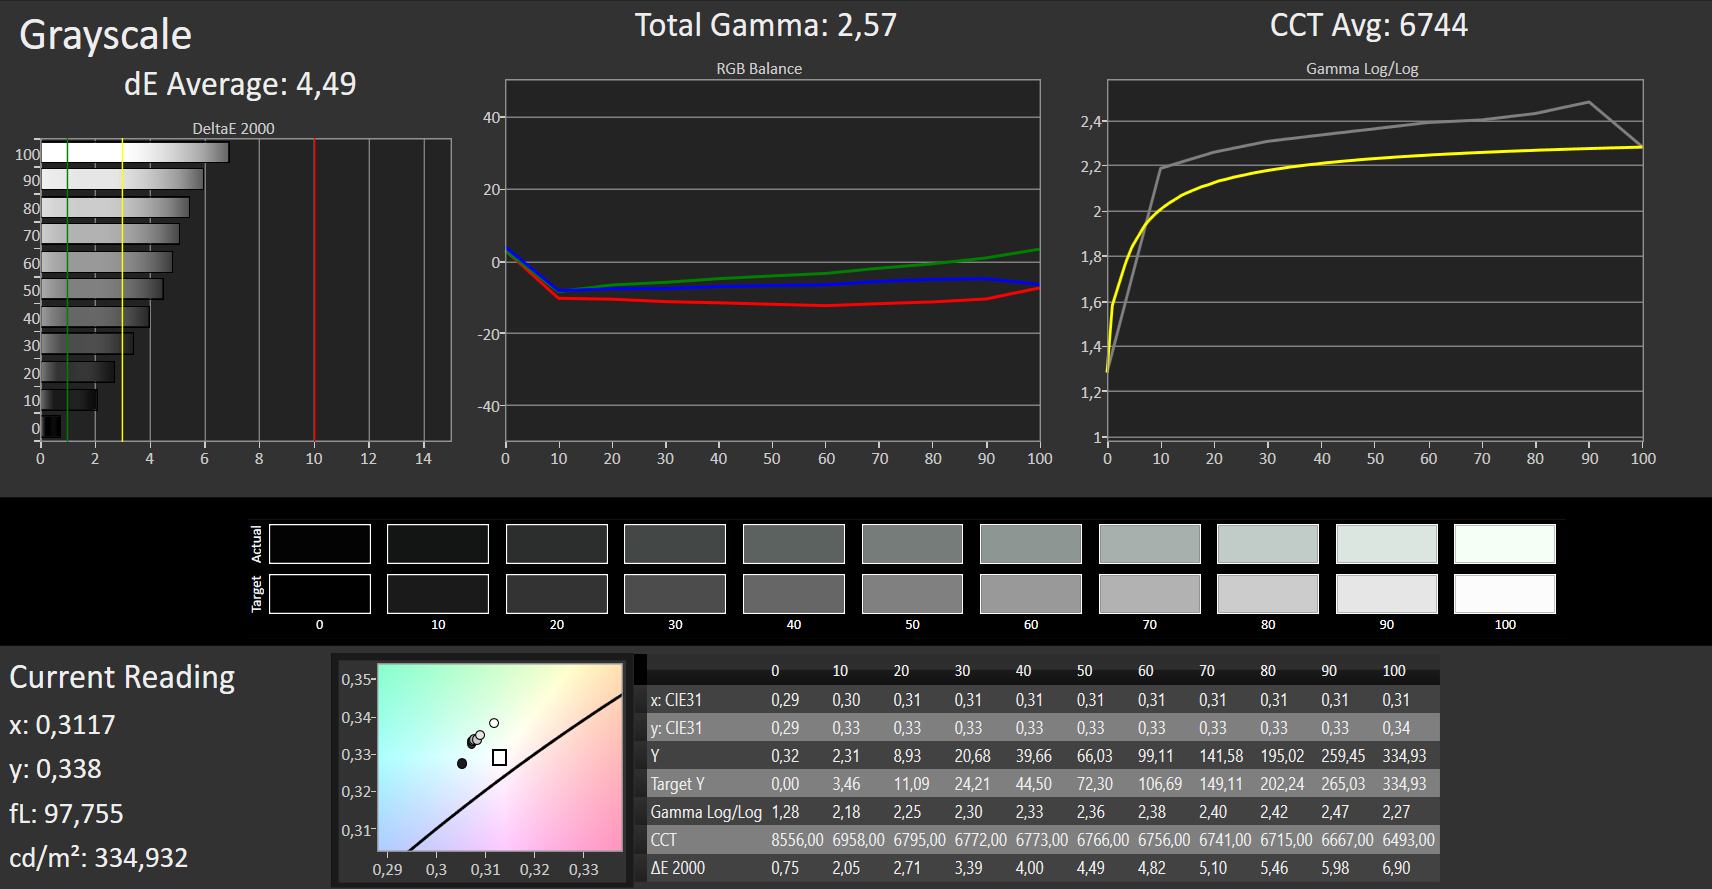
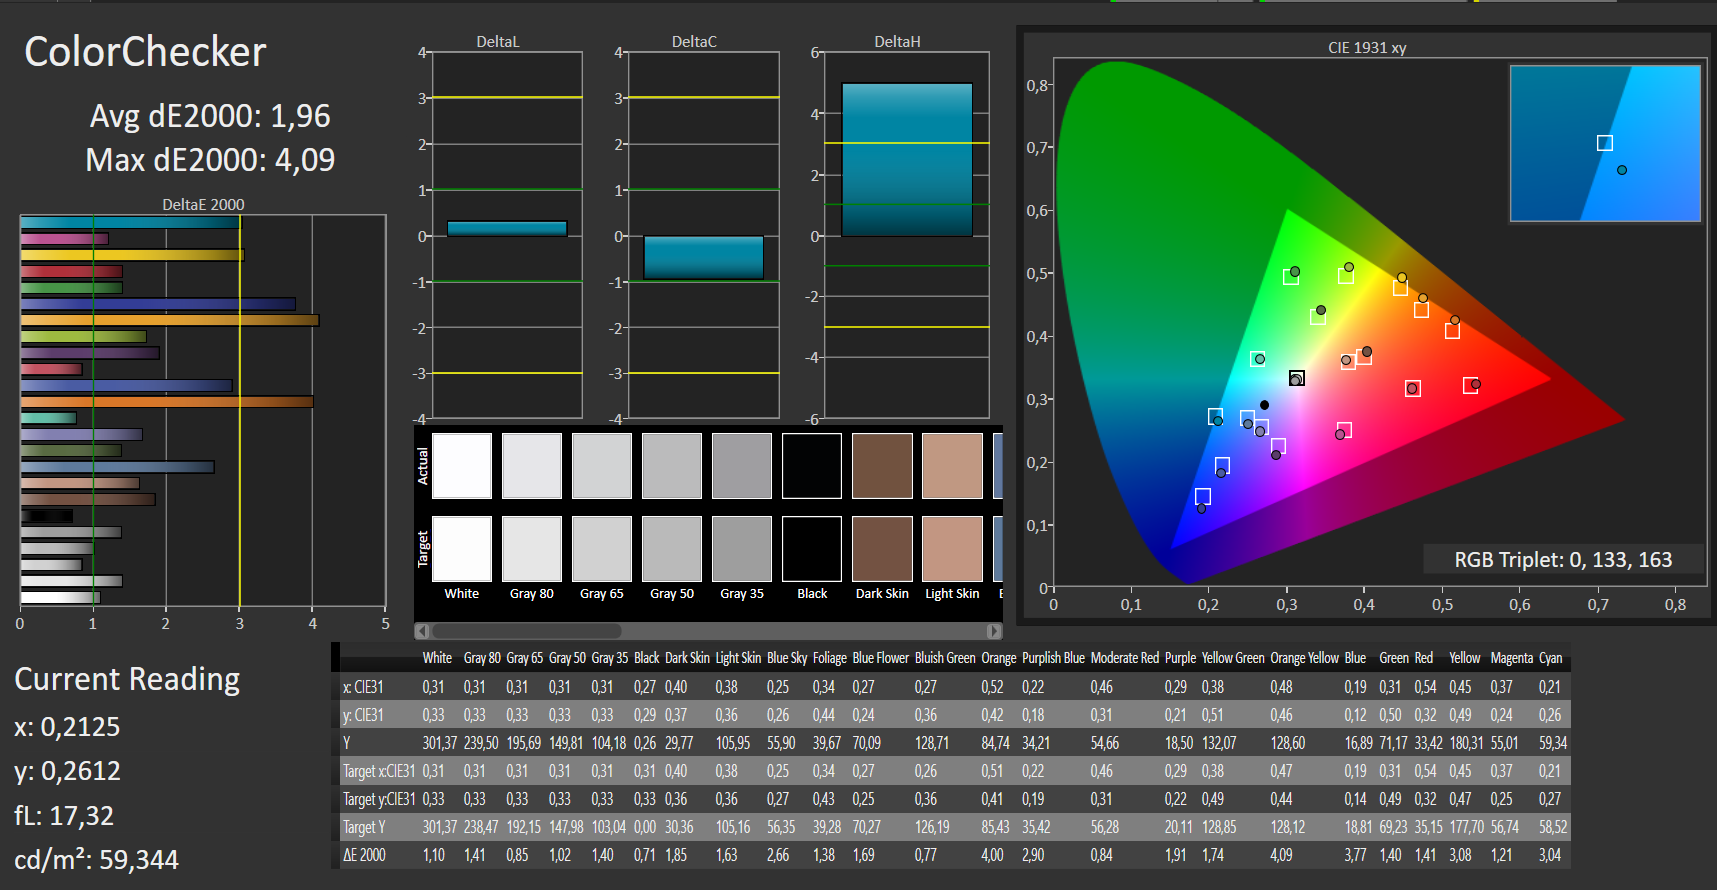
ΔE ColorChecker Calman: 4.03 | ∀{0.5-29.43 Ø4.71}
calibrated: 1.96
ΔE Greyscale Calman: 4.49 | ∀{0.09-98 Ø4.96}
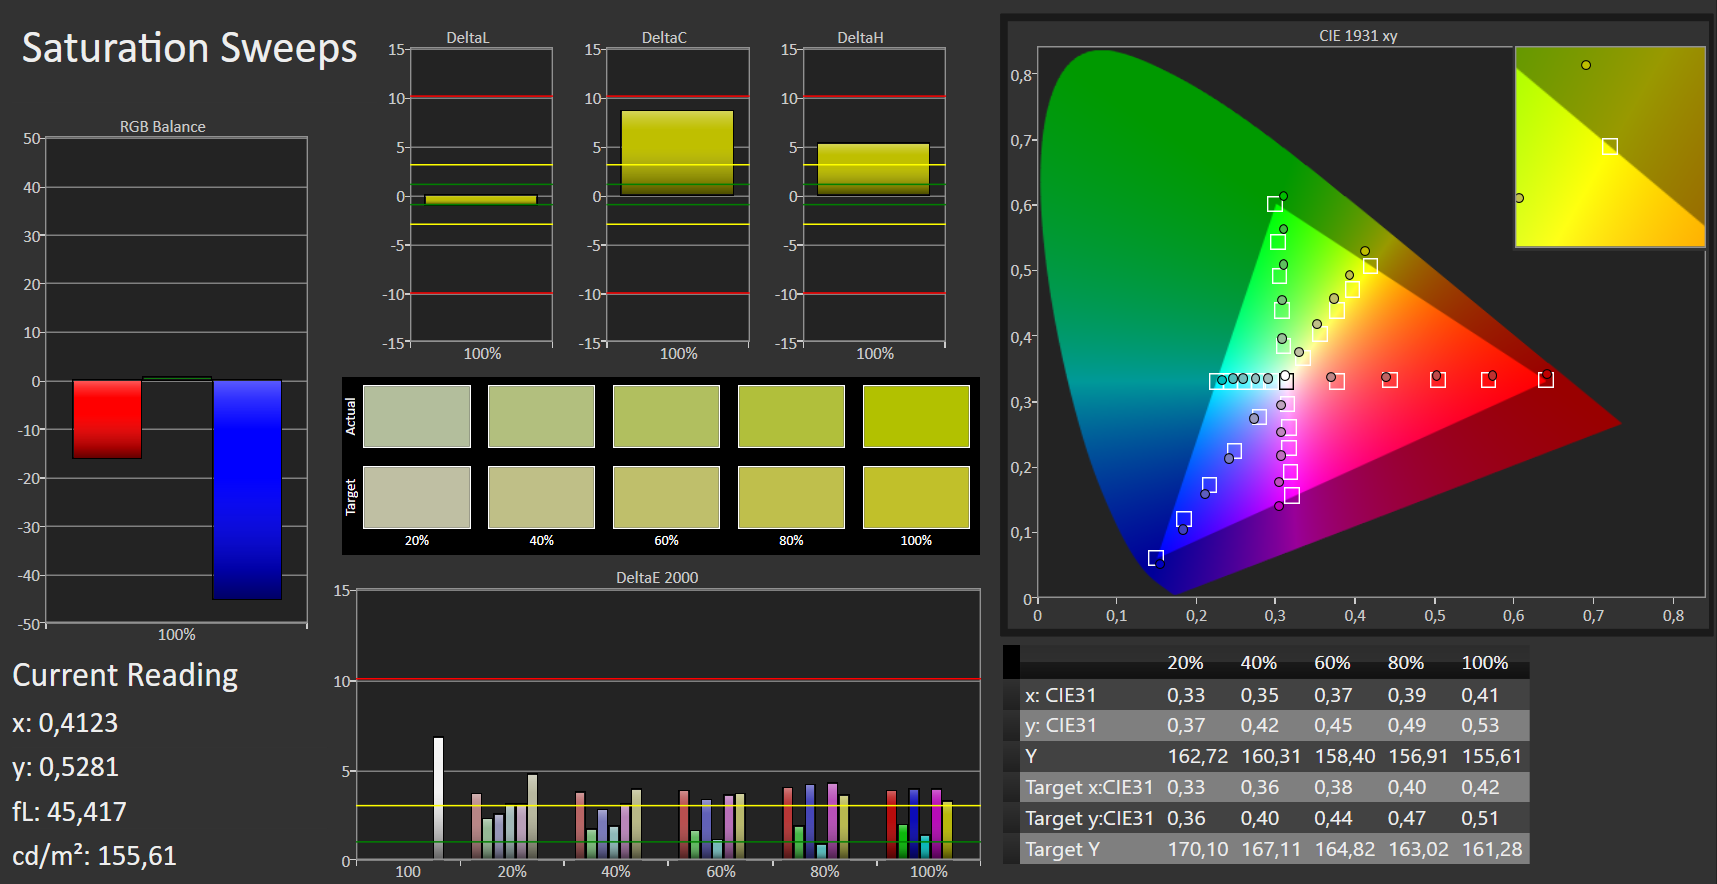
94% sRGB (Argyll 1.6.3 3D)
61% AdobeRGB 1998 (Argyll 1.6.3 3D)
68.4% AdobeRGB 1998 (Argyll 3D)
94.2% sRGB (Argyll 3D)
68.1% Display P3 (Argyll 3D)
Gamma: 2.57
CCT: 6744 K
| HP Spectre x360 15-df0126ng IPS, 3840x2160, 15.6" | HP Spectre x360 15-ch000 IPS, 3840x2160, 15.6" | HP Spectre x360 15-ch011nr IPS, 3840x2160, 15.6" | Lenovo Yoga 730-15IKB IPS, 3840x2160, 15.6" | Asus ZenBook Flip 15 UX561UD IPS, 3840x2160, 15.6" | Acer Spin 5 SP515-51GN-80A3 a-Si TFT-LCD, LCM, IPS, 1920x1080, 15.6" | Dell XPS 15 9570 i7 UHD IPS, 3840x2160, 15.6" | |
|---|---|---|---|---|---|---|---|
| Display | -5% | -2% | -2% | 26% | -41% | 12% | |
| Display P3 Coverage (%) | 68.1 | 66.7 -2% | 68.5 1% | 68.7 1% | 86.6 27% | 38.73 -43% | 79.1 16% |
| sRGB Coverage (%) | 94.2 | 87.4 -7% | 90.7 -4% | 90 -4% | 100 6% | 58.3 -38% | 98.8 5% |
| AdobeRGB 1998 Coverage (%) | 68.4 | 63.8 -7% | 66.3 -3% | 65.8 -4% | 99.5 45% | 40.02 -41% | 79.2 16% |
| Response Times | 31% | 22% | 30% | 8% | 16% | 8% | |
| Response Time Grey 50% / Grey 80% * (ms) | 57 ? | 36 ? 37% | 38 ? 33% | 34 ? 40% | 52 ? 9% | 42 ? 26% | 46.4 ? 19% |
| Response Time Black / White * (ms) | 31 ? | 23.6 ? 24% | 27.6 ? 11% | 25 ? 19% | 29 ? 6% | 29 ? 6% | 32 ? -3% |
| PWM Frequency (Hz) | 943 ? | 943 ? | 961 ? | 980 ? | |||
| Screen | -6% | -20% | -2% | 16% | 7% | 4% | |
| Brightness middle (cd/m²) | 330 | 349.5 6% | 329.3 0% | 309 -6% | 380 15% | 221 -33% | 494 50% |
| Brightness (cd/m²) | 310 | 330 6% | 316 2% | 299 -4% | 371 20% | 224 -28% | 457 47% |
| Brightness Distribution (%) | 87 | 90 3% | 84 -3% | 84 -3% | 87 0% | 89 2% | 88 1% |
| Black Level * (cd/m²) | 0.37 | 0.29 22% | 0.31 16% | 0.29 22% | 0.28 24% | 0.12 68% | 0.34 8% |
| Contrast (:1) | 892 | 1205 35% | 1062 19% | 1066 20% | 1357 52% | 1842 107% | 1453 63% |
| Colorchecker dE 2000 * | 4.03 | 4.06 -1% | 4.78 -19% | 3.9 3% | 4.38 -9% | 4.12 -2% | 5.2 -29% |
| Colorchecker dE 2000 max. * | 6.74 | 7.68 -14% | 11.75 -74% | 7.5 -11% | 7.59 -13% | 6.41 5% | 17.5 -160% |
| Colorchecker dE 2000 calibrated * | 1.96 | 4.22 -115% | 3.51 -79% | ||||
| Greyscale dE 2000 * | 4.49 | 4.4 2% | 7.9 -76% | 4.58 -2% | 3.6 20% | 3.4 24% | 2.7 40% |
| Gamma | 2.57 86% | 2.11 104% | 2.24 98% | 2.43 91% | 2.32 95% | 2.54 87% | 2.1 105% |
| CCT | 6744 96% | 7422 88% | 8323 78% | 7344 89% | 6860 95% | 6893 94% | 7038 92% |
| Color Space (Percent of AdobeRGB 1998) (%) | 61 | 56.5 -7% | 58.8 -4% | 39 -36% | 88 44% | 37 -39% | 71.2 17% |
| Color Space (Percent of sRGB) (%) | 94 | 86.9 -8% | 90.4 -4% | 90 -4% | 100 6% | 58 -38% | 98.8 5% |
| Média Total (Programa/Configurações) | 7% /
-2% | 0% /
-12% | 9% /
2% | 17% /
17% | -6% /
-2% | 8% /
6% |
* ... menor é melhor


Exibir tempos de resposta
| ↔ Tempo de resposta preto para branco | ||
|---|---|---|
| 31 ms ... ascensão ↗ e queda ↘ combinadas | ↗ 16 ms ascensão | 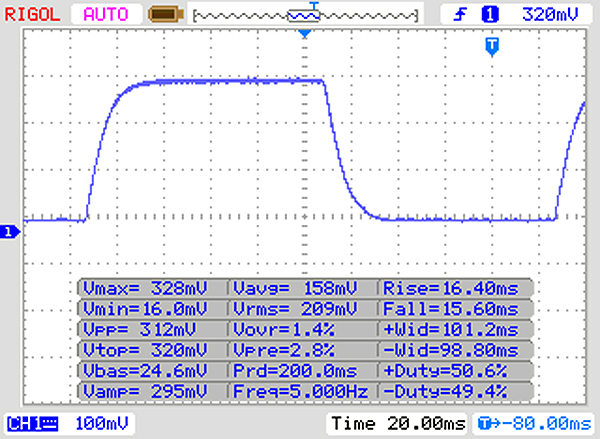 |
| ↘ 15 ms queda | ||
| A tela mostra taxas de resposta lentas em nossos testes e será insatisfatória para os jogadores. Em comparação, todos os dispositivos testados variam de 0.1 (mínimo) a 240 (máximo) ms. » 84 % de todos os dispositivos são melhores. Isso significa que o tempo de resposta medido é pior que a média de todos os dispositivos testados (19.8 ms). | ||
| ↔ Tempo de resposta 50% cinza a 80% cinza | ||
| 57 ms ... ascensão ↗ e queda ↘ combinadas | ↗ 26 ms ascensão | 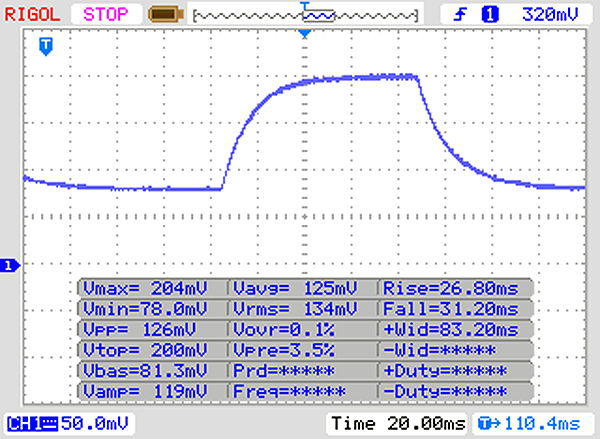 |
| ↘ 31 ms queda | ||
| A tela mostra taxas de resposta lentas em nossos testes e será insatisfatória para os jogadores. Em comparação, todos os dispositivos testados variam de 0.165 (mínimo) a 636 (máximo) ms. » 94 % de todos os dispositivos são melhores. Isso significa que o tempo de resposta medido é pior que a média de todos os dispositivos testados (30.9 ms). | ||
Cintilação da tela / PWM (modulação por largura de pulso)
| Tela tremeluzindo / PWM não detectado | 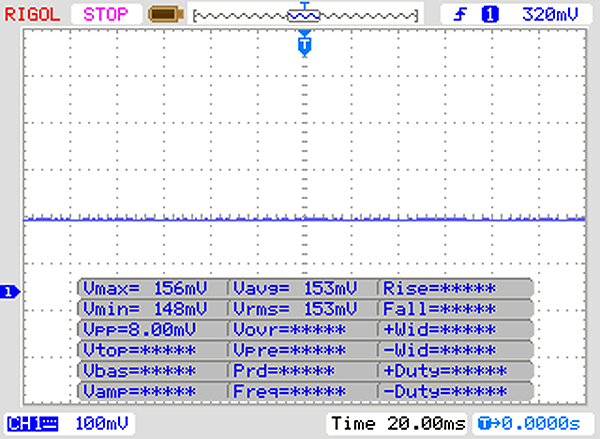 | ||
[pwm_comparison] Em comparação: 52 % de todos os dispositivos testados não usam PWM para escurecer a tela. Se PWM foi detectado, uma média de 7741 (mínimo: 5 - máximo: 343500) Hz foi medida. | |||
| Geekbench 3 | |
| 32 Bit Multi-Core Score | |
| Média Intel Core i7-8750H (20725 - 22665, n=13) | |
| HP Spectre x360 15-df0126ng | |
| Lenovo Yoga 730-15IKB | |
| 32 Bit Single-Core Score | |
| HP Spectre x360 15-df0126ng | |
| Média Intel Core i7-8750H (3734 - 4163, n=13) | |
| Lenovo Yoga 730-15IKB | |
| Geekbench 4.4 | |
| 64 Bit Multi-Core Score | |
| Média da turma Multimedia (n=1últimos 2 anos) | |
| Média Intel Core i7-8750H (17709 - 23313, n=17) | |
| Lenovo Yoga 730-15IKB | |
| 64 Bit Single-Core Score | |
| Média da turma Multimedia (n=1últimos 2 anos) | |
| Média Intel Core i7-8750H (4669 - 5146, n=17) | |
| Lenovo Yoga 730-15IKB | |
| Mozilla Kraken 1.1 - Total | |
| Dell XPS 15 9570 i7 UHD (Edge 42.17134.1.0) | |
| HP Spectre x360 15-ch000 (Edge 42.17134.1.0) | |
| Lenovo Yoga 730-15IKB (Edge 42) | |
| HP Spectre x360 15-df0126ng (Edge 44) | |
| Média Intel Core i7-8750H (695 - 1272, n=50) | |
| Asus ZenBook Flip 15 UX561UD | |
| HP Spectre x360 15-ch011nr (Edge 41.16299.15.0) | |
| Acer Spin 5 SP515-51GN-80A3 (Edge 41.16299.15.0) | |
| Média da turma Multimedia (228 - 835, n=65, últimos 2 anos) | |
| Octane V2 - Total Score | |
| Média da turma Multimedia (79641 - 153175, n=29, últimos 2 anos) | |
| Acer Spin 5 SP515-51GN-80A3 (Edge 41.16299.15.0) | |
| Asus ZenBook Flip 15 UX561UD | |
| HP Spectre x360 15-df0126ng (Edge 44) | |
| Dell XPS 15 9570 i7 UHD (Edge 42.17134.1.0) | |
| Média Intel Core i7-8750H (27460 - 44549, n=47) | |
| Lenovo Yoga 730-15IKB (Edge 42) | |
| HP Spectre x360 15-ch011nr (Edge 41.16299.15.0) | |
| HP Spectre x360 15-ch000 (Edge 42.17134.1.0) | |
| JetStream 1.1 - 1.1 Total | |
| Média da turma Multimedia (n=1últimos 2 anos) | |
| Acer Spin 5 SP515-51GN-80A3 (Edge 41.16299.15.0) | |
| Dell XPS 15 9570 i7 UHD (Edge 42.17134.1.0) | |
| Asus ZenBook Flip 15 UX561UD | |
| Média Intel Core i7-8750H (205 - 299, n=49) | |
| HP Spectre x360 15-df0126ng (Edge 44) | |
| Lenovo Yoga 730-15IKB (Edge 42) | |
| HP Spectre x360 15-ch011nr (Edge 41.16299.15.0) | |
| HP Spectre x360 15-ch000 (Edge 42.17134.1.0) | |
* ... menor é melhor
| PCMark 7 Score | 6350 pontos | |
| PCMark 8 Home Score Accelerated v2 | 3494 pontos | |
| PCMark 8 Creative Score Accelerated v2 | 4685 pontos | |
| PCMark 8 Work Score Accelerated v2 | 4316 pontos | |
| PCMark 10 Score | 4636 pontos | |
Ajuda | ||

| HP Spectre x360 15-df0126ng Toshiba XG5-P KXG50PNV2T04 | HP Spectre x360 15-ch000 Toshiba XG5-P KXG50PNV2T04 | HP Spectre x360 15-ch011nr SK hynix PC401 NVMe 500 GB | Lenovo Yoga 730-15IKB SK Hynix PC401 512GB M.2 (HFS512GD9TNG) | Asus ZenBook Flip 15 UX561UD Micron 1100 MTFDDAV256TBN | Acer Spin 5 SP515-51GN-80A3 Intel SSD 600p SSDPEKKW256G7 | Dell XPS 15 9570 i7 UHD Toshiba XG5 KXG50ZNV512G | Média Toshiba XG5-P KXG50PNV2T04 | |
|---|---|---|---|---|---|---|---|---|
| CrystalDiskMark 5.2 / 6 | 30% | 8% | 48% | -35% | -10% | 7% | 10% | |
| Write 4K (MB/s) | 84.7 | 127.3 50% | 108.5 28% | 164.9 95% | 112.6 33% | 132.3 56% | 79.1 -7% | 105.8 ? 25% |
| Read 4K (MB/s) | 24.32 | 16.29 -33% | 37.67 55% | 50.5 108% | 29.67 22% | 35.38 45% | 37.89 56% | 23.7 ? -3% |
| Write Seq (MB/s) | 1033 | 288.2 -72% | 1120 8% | 1262 22% | 432.1 -58% | 592 -43% | 1119 8% | 845 ? -18% |
| Read Seq (MB/s) | 1664 | 344 -79% | 1300 -22% | 2054 23% | 479.9 -71% | 1186 -29% | 1852 11% | 1322 ? -21% |
| Write 4K Q32T1 (MB/s) | 433 | 1037 139% | 243.9 -44% | 477.6 10% | 191 -56% | 323 -25% | 361.1 -17% | 531 ? 23% |
| Read 4K Q32T1 (MB/s) | 269.5 | 894 232% | 311.6 16% | 550 104% | 246.5 -9% | 289.2 7% | 257.9 -4% | 474 ? 76% |
| Write Seq Q32T1 (MB/s) | 1036 | 1046 1% | 1395 35% | 1400 35% | 450.3 -57% | 593 -43% | 1131 9% | 1034 ? 0% |
| Read Seq Q32T1 (MB/s) | 3062 | 3040 -1% | 2667 -13% | 2672 -13% | 522 -83% | 1569 -49% | 3096 1% | 3072 ? 0% |
| 3DMark 06 Standard Score | 30798 pontos | |
| 3DMark 11 Performance | 9106 pontos | |
| 3DMark Ice Storm Standard Score | 58769 pontos | |
| 3DMark Cloud Gate Standard Score | 24021 pontos | |
| 3DMark Fire Strike Score | 6700 pontos | |
| 3DMark Time Spy Score | 2485 pontos | |
Ajuda | ||
| baixo | média | alto | ultra | 4K | |
|---|---|---|---|---|---|
| StarCraft 2 (2010) | 433.4 | 200.4 | 186.7 | 126.7 | |
| Diablo III (2012) | 228.2 | 202.6 | 202.1 | 170.1 | |
| BioShock Infinite (2013) | 299 | 209.3 | 183.5 | 72.2 | |
| GTA V (2015) | 150.4 | 143.3 | 78.9 | 34.5 | |
| The Witcher 3 (2015) | 131.3 | 76.6 | 44.2 | 25.4 | 15.9 |
| Dota 2 Reborn (2015) | 111.9 | 104.2 | 98.1 | 93.5 | 46 |
| World of Warships (2015) | 168.6 | 143.9 | 112.7 | 101 | 34.4 |
| Ashes of the Singularity (2016) | 63 | 41.3 | 35.8 | 15.7 | |
| Overwatch (2016) | 285.4 | 233.9 | 117.7 | 70.5 | 37 |
| Prey (2017) | 142.4 | 85.6 | 68.3 | 58.9 | 21.7 |
| Rocket League (2017) | 249.1 | 169.1 | 112.5 | 42.3 | |
| Team Fortress 2 (2017) | 129.8 | 123.6 | 115.7 | 112.6 | 65.2 |
| Middle-earth: Shadow of War (2017) | 105 | 55 | 41 | 31 | 13 |
| Destiny 2 (2017) | 119.5 | 69.4 | 64.3 | 57.9 | 18.9 |
| Final Fantasy XV Benchmark (2018) | 61.5 | 36.6 | 23.3 | 9.2 | |
| X-Plane 11.11 (2018) | 92.7 | 80.3 | 69.4 | 39.5 | |
| Far Cry 5 (2018) | 76 | 45 | 41 | 38 | 14 |
| Monster Hunter World (2018) | 100.3 | 39.2 | 34.9 | 26.8 | 8.3 |
| Forza Horizon 4 (2018) | 122 | 67 | 61 | 47 | 20 |
| Assassin´s Creed Odyssey (2018) | 67 | 43 | 34 | 18 | 7 |
| Call of Duty Black Ops 4 (2018) | 118.7 | 46.3 | 45 | 37.5 | 10.1 |
| Hitman 2 (2018) | 64.8 | 41 | 37.5 | 35.9 | 11.3 |
| Battlefield V (2018) | 100.1 | 57.3 | 47.9 | 44.8 | 17.3 |
| Farming Simulator 19 (2018) | 193.6 | 128.7 | 80.5 | 61 | 22 |
| Darksiders III (2018) | 134.5 | 87.4 | 73.7 | 65 | 13.2 |
| Just Cause 4 (2018) | 73.2 | 47.9 | 36.1 | 35.3 | 12.9 |
| Far Cry New Dawn (2019) | 83 | 47 | 43 | 40 | 14 |
| Metro Exodus (2019) | 55.5 | 49.8 | 36.5 | 28.3 | 4.7 |
| Anthem (2019) | 67.1 | 40.5 | 34 | 30.4 | 9 |
| Dirt Rally 2.0 (2019) | 133.2 | 56.7 | 44.3 | 27.2 | 11.3 |
| The Witcher 3 - 1920x1080 High Graphics & Postprocessing (Nvidia HairWorks Off) | |
| Média da turma Multimedia (22 - 157, n=5, últimos 2 anos) | |
| Dell XPS 15 9570 i7 UHD | |
| Média NVIDIA GeForce GTX 1050 Ti Max-Q (42.6 - 60, n=6) | |
| Lenovo ThinkPad X1 Extreme-20MF000XGE | |
| HP Spectre x360 15-df0126ng | |
| HP Spectre x360 15-ch000 | |
| Rocket League - 1920x1080 High Quality AA:High FX | |
| HP Spectre x360 15-df0126ng | |
| Média NVIDIA GeForce GTX 1050 Ti Max-Q (n=1) | |
| Lenovo Yoga 730-15IKB | |
| Middle-earth: Shadow of War - 1920x1080 Medium Preset AA:T | |
| HP Spectre x360 15-df0126ng | |
| Média NVIDIA GeForce GTX 1050 Ti Max-Q (n=1) | |
| Lenovo Yoga 730-15IKB | |
Barulho
| Ocioso |
| 30.4 / 30.4 / 31.6 dB |
| Carga |
| 43.2 / 38.3 dB |
 | ||
30 dB silencioso 40 dB(A) audível 50 dB(A) ruidosamente alto |
||
min: | ||
| HP Spectre x360 15-df0126ng i7-8750H, GeForce GTX 1050 Ti Max-Q | HP Spectre x360 15-ch000 i7-8705G, Vega M GL / 870 | HP Spectre x360 15-ch011nr i5-8550U, GeForce MX150 | Lenovo Yoga 730-15IKB i5-8550U, GeForce GTX 1050 Mobile | Asus ZenBook Flip 15 UX561UD i5-8550U, GeForce GTX 1050 Mobile | Acer Spin 5 SP515-51GN-80A3 i5-8550U, GeForce GTX 1050 Mobile | Dell XPS 15 9570 i7 UHD i7-8750H, GeForce GTX 1050 Ti Max-Q | Média NVIDIA GeForce GTX 1050 Ti Max-Q | Média da turma Multimedia | |
|---|---|---|---|---|---|---|---|---|---|
| Noise | 3% | 6% | 3% | 2% | -2% | 4% | 3% | 12% | |
| desligado / ambiente * (dB) | 30.4 | 28.1 8% | 28.6 6% | 30.5 -0% | 30.4 -0% | 30.2 1% | 29.9 2% | 29.6 ? 3% | 24.1 ? 21% |
| Idle Minimum * (dB) | 30.4 | 30.8 -1% | 29.2 4% | 30.5 -0% | 31.3 -3% | 30.2 1% | 29.9 2% | 29.8 ? 2% | 24.3 ? 20% |
| Idle Average * (dB) | 30.4 | 30.9 -2% | 29.2 4% | 30.5 -0% | 31.3 -3% | 30.2 1% | 29.9 2% | 29.8 ? 2% | 24.6 ? 19% |
| Idle Maximum * (dB) | 31.6 | 30.9 2% | 29.2 8% | 30.5 3% | 31.3 1% | 30.9 2% | 30.3 4% | 30.7 ? 3% | 26.2 ? 17% |
| Load Average * (dB) | 43.2 | 31.8 26% | 29.2 32% | 37.5 13% | 36.4 16% | 42.4 2% | 36.5 16% | 37.4 ? 13% | 37.3 ? 14% |
| Load Maximum * (dB) | 38.3 | 44.2 -15% | 45.7 -19% | 37.5 2% | 37.1 3% | 44.8 -17% | 40.4 -5% | 40.7 ? -6% | 46 ? -20% |
| Witcher 3 ultra * (dB) | 48.1 | 38.4 | 40.4 |
* ... menor é melhor
(±) A temperatura máxima no lado superior é 44.8 °C / 113 F, em comparação com a média de 36.8 °C / 98 F , variando de 21 a 71 °C para a classe Multimedia.
(-) A parte inferior aquece até um máximo de 49 °C / 120 F, em comparação com a média de 39.1 °C / 102 F
(+) Em uso inativo, a temperatura média para o lado superior é 26 °C / 79 F, em comparação com a média do dispositivo de 31.3 °C / ### class_avg_f### F.
(+) Os apoios para as mãos e o touchpad estão atingindo a temperatura máxima da pele (33.3 °C / 91.9 F) e, portanto, não estão quentes.
(-) A temperatura média da área do apoio para as mãos de dispositivos semelhantes foi 28.7 °C / 83.7 F (-4.6 °C / -8.2 F).
| HP Spectre x360 15-df0126ng i7-8750H, GeForce GTX 1050 Ti Max-Q | HP Spectre x360 15-ch000 i7-8705G, Vega M GL / 870 | HP Spectre x360 15-ch011nr i5-8550U, GeForce MX150 | Lenovo Yoga 730-15IKB i5-8550U, GeForce GTX 1050 Mobile | Asus ZenBook Flip 15 UX561UD i5-8550U, GeForce GTX 1050 Mobile | Acer Spin 5 SP515-51GN-80A3 i5-8550U, GeForce GTX 1050 Mobile | Dell XPS 15 9570 i7 UHD i7-8750H, GeForce GTX 1050 Ti Max-Q | Média NVIDIA GeForce GTX 1050 Ti Max-Q | Média da turma Multimedia | |
|---|---|---|---|---|---|---|---|---|---|
| Heat | -11% | -13% | 4% | 6% | -1% | -2% | -3% | 3% | |
| Maximum Upper Side * (°C) | 44.8 | 46.4 -4% | 46.4 -4% | 40.9 9% | 41.9 6% | 50.9 -14% | 55.7 -24% | 48.8 ? -9% | 41 ? 8% |
| Maximum Bottom * (°C) | 49 | 49.2 -0% | 49 -0% | 43 12% | 40.6 17% | 44.2 10% | 48.5 1% | 49.9 ? -2% | 43.4 ? 11% |
| Idle Upper Side * (°C) | 26.6 | 31 -17% | 32 -20% | 27.3 -3% | 26.6 -0% | 26.3 1% | 24.4 8% | 26.2 ? 2% | 26.9 ? -1% |
| Idle Bottom * (°C) | 26.6 | 33 -24% | 34.2 -29% | 27.4 -3% | 26 2% | 27.1 -2% | 24.8 7% | 26.9 ? -1% | 27.8 ? -5% |
* ... menor é melhor
HP Spectre x360 15-df0126ng análise de áudio
(-) | alto-falantes não muito altos (###valor### dB)
Graves 100 - 315Hz
(±) | graves reduzidos - em média 14.9% menor que a mediana
(±) | a linearidade dos graves é média (13.3% delta para a frequência anterior)
Médios 400 - 2.000 Hz
(+) | médios equilibrados - apenas 3.4% longe da mediana
(±) | a linearidade dos médios é média (9.3% delta para frequência anterior)
Altos 2 - 16 kHz
(+) | agudos equilibrados - apenas 1.4% longe da mediana
(+) | os máximos são lineares (5.5% delta da frequência anterior)
Geral 100 - 16.000 Hz
(±) | a linearidade do som geral é média (15.8% diferença em relação à mediana)
Comparado com a mesma classe
» 40% de todos os dispositivos testados nesta classe foram melhores, 5% semelhantes, 55% piores
» O melhor teve um delta de 5%, a média foi 17%, o pior foi 45%
Comparado com todos os dispositivos testados
» 24% de todos os dispositivos testados foram melhores, 5% semelhantes, 70% piores
» O melhor teve um delta de 4%, a média foi 23%, o pior foi 134%
HP Spectre x360 15t-bl100 análise de áudio
(-) | alto-falantes não muito altos (###valor### dB)
Graves 100 - 315Hz
(±) | graves reduzidos - em média 14% menor que a mediana
(±) | a linearidade dos graves é média (14.7% delta para a frequência anterior)
Médios 400 - 2.000 Hz
(+) | médios equilibrados - apenas 3.7% longe da mediana
(+) | médios são lineares (4.5% delta para frequência anterior)
Altos 2 - 16 kHz
(+) | agudos equilibrados - apenas 2.8% longe da mediana
(±) | a linearidade dos máximos é média (7% delta para frequência anterior)
Geral 100 - 16.000 Hz
(±) | a linearidade do som geral é média (19.5% diferença em relação à mediana)
Comparado com a mesma classe
» 63% de todos os dispositivos testados nesta classe foram melhores, 7% semelhantes, 29% piores
» O melhor teve um delta de 5%, a média foi 17%, o pior foi 45%
Comparado com todos os dispositivos testados
» 49% de todos os dispositivos testados foram melhores, 7% semelhantes, 44% piores
» O melhor teve um delta de 4%, a média foi 23%, o pior foi 134%
Lenovo Yoga 730-15IKB análise de áudio
(±) | o volume do alto-falante é médio, mas bom (###valor### dB)
Graves 100 - 315Hz
(-) | quase nenhum baixo - em média 16.9% menor que a mediana
(±) | a linearidade dos graves é média (12.2% delta para a frequência anterior)
Médios 400 - 2.000 Hz
(+) | médios equilibrados - apenas 4% longe da mediana
(±) | a linearidade dos médios é média (7.7% delta para frequência anterior)
Altos 2 - 16 kHz
(+) | agudos equilibrados - apenas 2.6% longe da mediana
(+) | os máximos são lineares (6.1% delta da frequência anterior)
Geral 100 - 16.000 Hz
(±) | a linearidade do som geral é média (16.6% diferença em relação à mediana)
Comparado com a mesma classe
» 31% de todos os dispositivos testados nesta classe foram melhores, 4% semelhantes, 65% piores
» O melhor teve um delta de 6%, a média foi 20%, o pior foi 57%
Comparado com todos os dispositivos testados
» 29% de todos os dispositivos testados foram melhores, 6% semelhantes, 65% piores
» O melhor teve um delta de 4%, a média foi 23%, o pior foi 134%
| desligado | |
| Ocioso | |
| Carga |
|
Key:
min: | |
| HP Spectre x360 15-df0126ng i7-8750H, GeForce GTX 1050 Ti Max-Q | HP Spectre x360 15-ch000 i7-8705G, Vega M GL / 870 | HP Spectre x360 15-ch011nr i5-8550U, GeForce MX150 | Lenovo Yoga 730-15IKB i5-8550U, GeForce GTX 1050 Mobile | Asus ZenBook Flip 15 UX561UD i5-8550U, GeForce GTX 1050 Mobile | Acer Spin 5 SP515-51GN-80A3 i5-8550U, GeForce GTX 1050 Mobile | Dell XPS 15 9570 i7 UHD i7-8750H, GeForce GTX 1050 Ti Max-Q | Média NVIDIA GeForce GTX 1050 Ti Max-Q | Média da turma Multimedia | |
|---|---|---|---|---|---|---|---|---|---|
| Power Consumption | -130% | -33% | -21% | -50% | -3% | -112% | -53% | -40% | |
| Idle Minimum * (Watt) | 2.1 | 11.7 -457% | 5.3 -152% | 4.8 -129% | 5.4 -157% | 3.9 -86% | 9.48 -351% | 5.8 ? -176% | 5.62 ? -168% |
| Idle Average * (Watt) | 6.7 | 16.8 -151% | 9.8 -46% | 10.1 -51% | 10.8 -61% | 6.7 -0% | 16.1 -140% | 11.2 ? -67% | 10.2 ? -52% |
| Idle Maximum * (Watt) | 11.4 | 18.9 -66% | 12.6 -11% | 10.7 6% | 13.9 -22% | 8.7 24% | 16.9 -48% | 13.5 ? -18% | 12.5 ? -10% |
| Load Average * (Watt) | 77.7 | 82.3 -6% | 73 6% | 44 43% | 94 -21% | 74 5% | 90.8 -17% | 86.9 ? -12% | 65 ? 16% |
| Load Maximum * (Watt) | 131.5 | 94.9 28% | 80 39% | 94.7 28% | 116.6 11% | 79 40% | 134.4 -2% | 122.4 ? 7% | 111.9 ? 15% |
| Witcher 3 ultra * (Watt) | 87.2 | 67.6 |
* ... menor é melhor
| HP Spectre x360 15-df0126ng i7-8750H, GeForce GTX 1050 Ti Max-Q, 84 Wh | HP Spectre x360 15-ch000 i7-8705G, Vega M GL / 870, 84 Wh | HP Spectre x360 15-ch011nr i5-8550U, GeForce MX150, 84 Wh | Lenovo Yoga 730-15IKB i5-8550U, GeForce GTX 1050 Mobile, 51.5 Wh | Asus ZenBook Flip 15 UX561UD i5-8550U, GeForce GTX 1050 Mobile, 52 Wh | Acer Spin 5 SP515-51GN-80A3 i5-8550U, GeForce GTX 1050 Mobile, 48 Wh | Dell XPS 15 9570 i7 UHD i7-8750H, GeForce GTX 1050 Ti Max-Q, 97 Wh | Média da turma Multimedia | |
|---|---|---|---|---|---|---|---|---|
| Duração da bateria | -46% | 0% | -41% | -44% | -32% | 9% | 41% | |
| Reader / Idle (h) | 18.8 | 9 -52% | 15.5 -18% | 11.6 -38% | 9.3 -51% | 12.7 -32% | 24.9 ? 32% | |
| H.264 (h) | 7.7 | 5.4 -30% | 4.4 -43% | 5.5 -29% | 12.3 60% | 16.8 ? 118% | ||
| WiFi v1.3 (h) | 8.8 | 5.7 -35% | 10.4 18% | 6.2 -30% | 5.2 -41% | 6.2 -30% | 9.6 9% | 12.3 ? 40% |
| Load (h) | 2.3 | 1.1 -52% | 2.3 0% | 0.8 -65% | 1.4 -39% | 1.5 -35% | 1.3 -43% | 1.645 ? -28% |
| Witcher 3 ultra (h) | 1 |
Pro
Contra
O HP Spectre x360 15-df0126ng é um excelente conversível de 15 polegadas e um upgrade que vale muito a pena em relação ao seu antecessor. O CPU hexa-core é um avanço em relação ao chip da série U no dispositivo do ano passado, assim como a GPU consideravelmente mais potente. O sistema não se limita termicamente, apesar de sua carcaça fina, o que é excelente.
O HP Spectre x360 15-df0126ng é um conversível multimídia bem equipado de 15,6 polegadas que satisfaz em quase todas as áreas.
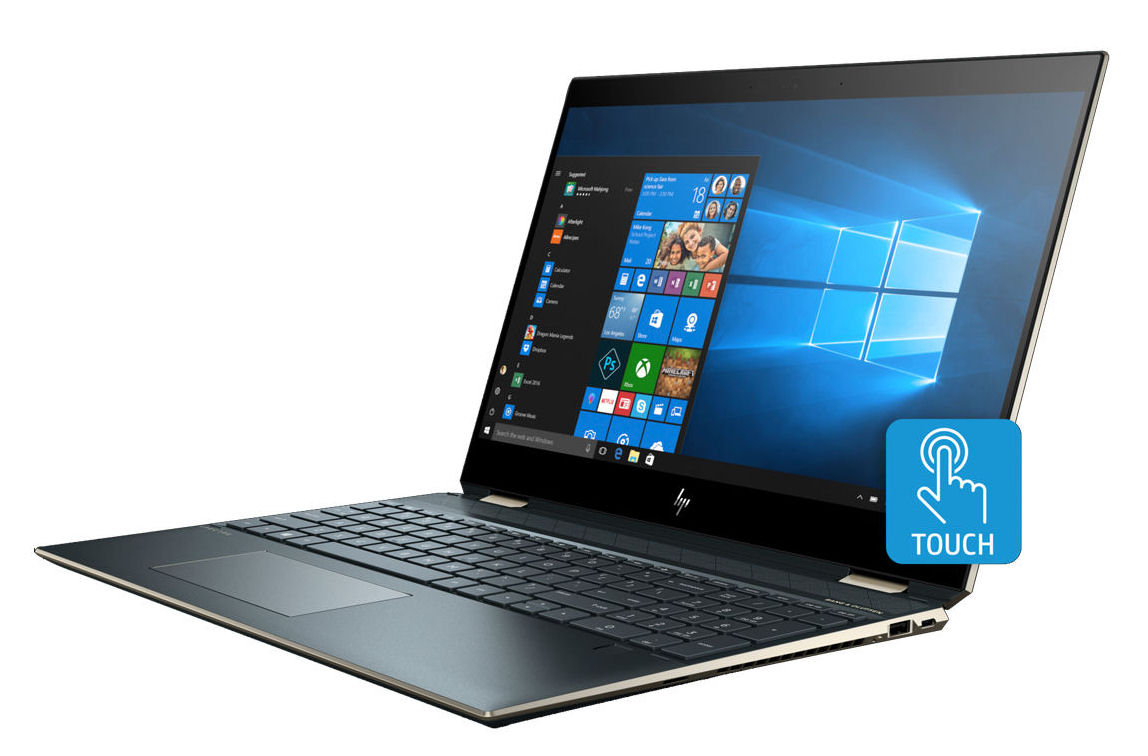
O conversível é poderoso o suficiente para a maioria das tarefas e pode até mesmo lidar com jogos modernos em 1080p. Você também pode conectar uma GPU externa se precisar de mais potência gráfica.
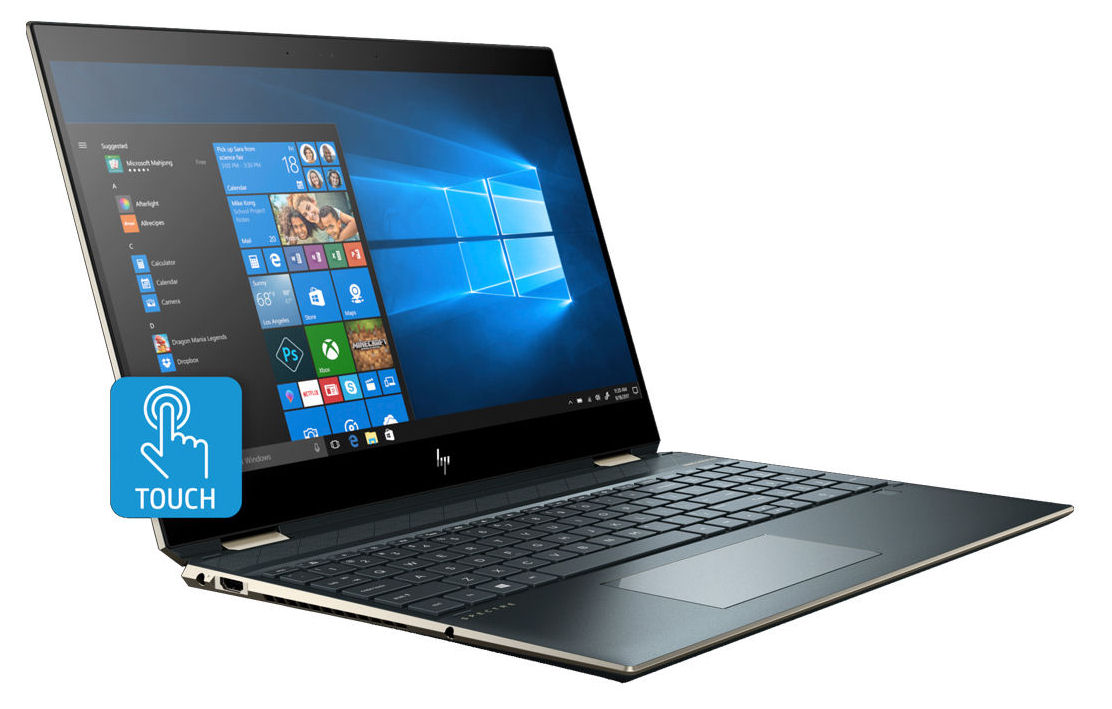
O SSD é adequadamente rápido e duvidamos que a maioria das pessoas use seus 2 TB de armazenamento. No entanto, trocar a unidade é mais complicado do que deveria, já que a HP aparentemente fez o máximo para impedir que as pessoas abram o dispositivo. O teclado retro iluminado e a tela táctil são decentes, mas é bastante miserável por parte da HP não incluir o seu Tilt Pen na caixa.
A tela é em grande parte boa com seus ângulos de visão estáveis e precisão de cor, mas é diminuída pelo seu brilho máximo escasso e relação de contraste abaixo do esperado. Esperaríamos um painel mais brilhante e mais vívido em um dispositivo tão caro.
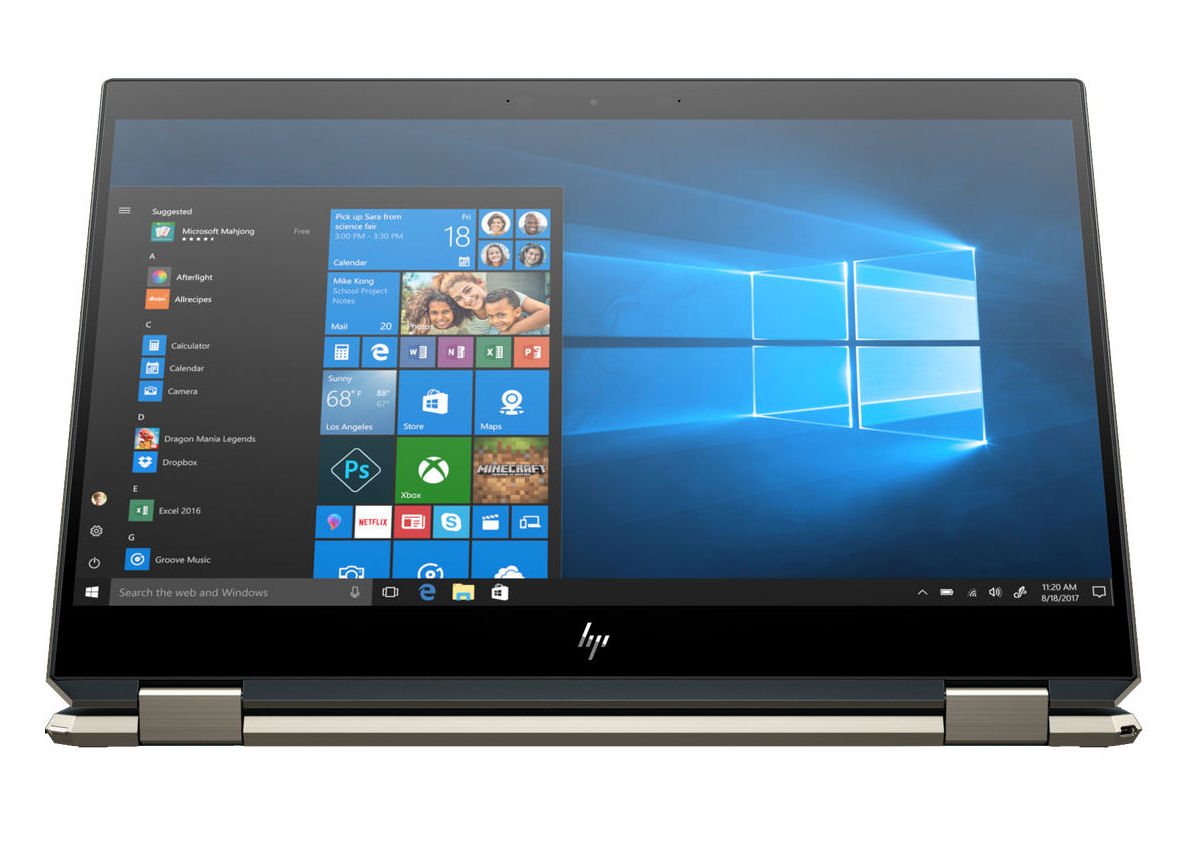
No geral, o Spectre x360 15-df0126ng é um impressionante modelo conversível grande, mas seus irmãos de nível de entrada são equipados com o significativamente menos potente processador Core i7-8565U e GPU GeForce MX150, portanto esteja atento quando estiver escolhendo qual modelo comprar.
HP Spectre x360 15-df0126ng
- 10/25/2019 v7 (old)
Sascha Mölck
Price comparison
