Breve Análise do Portátil ASUS ROG Strix Scar II GL704GW (Core i7-8750H, RTX 2070)
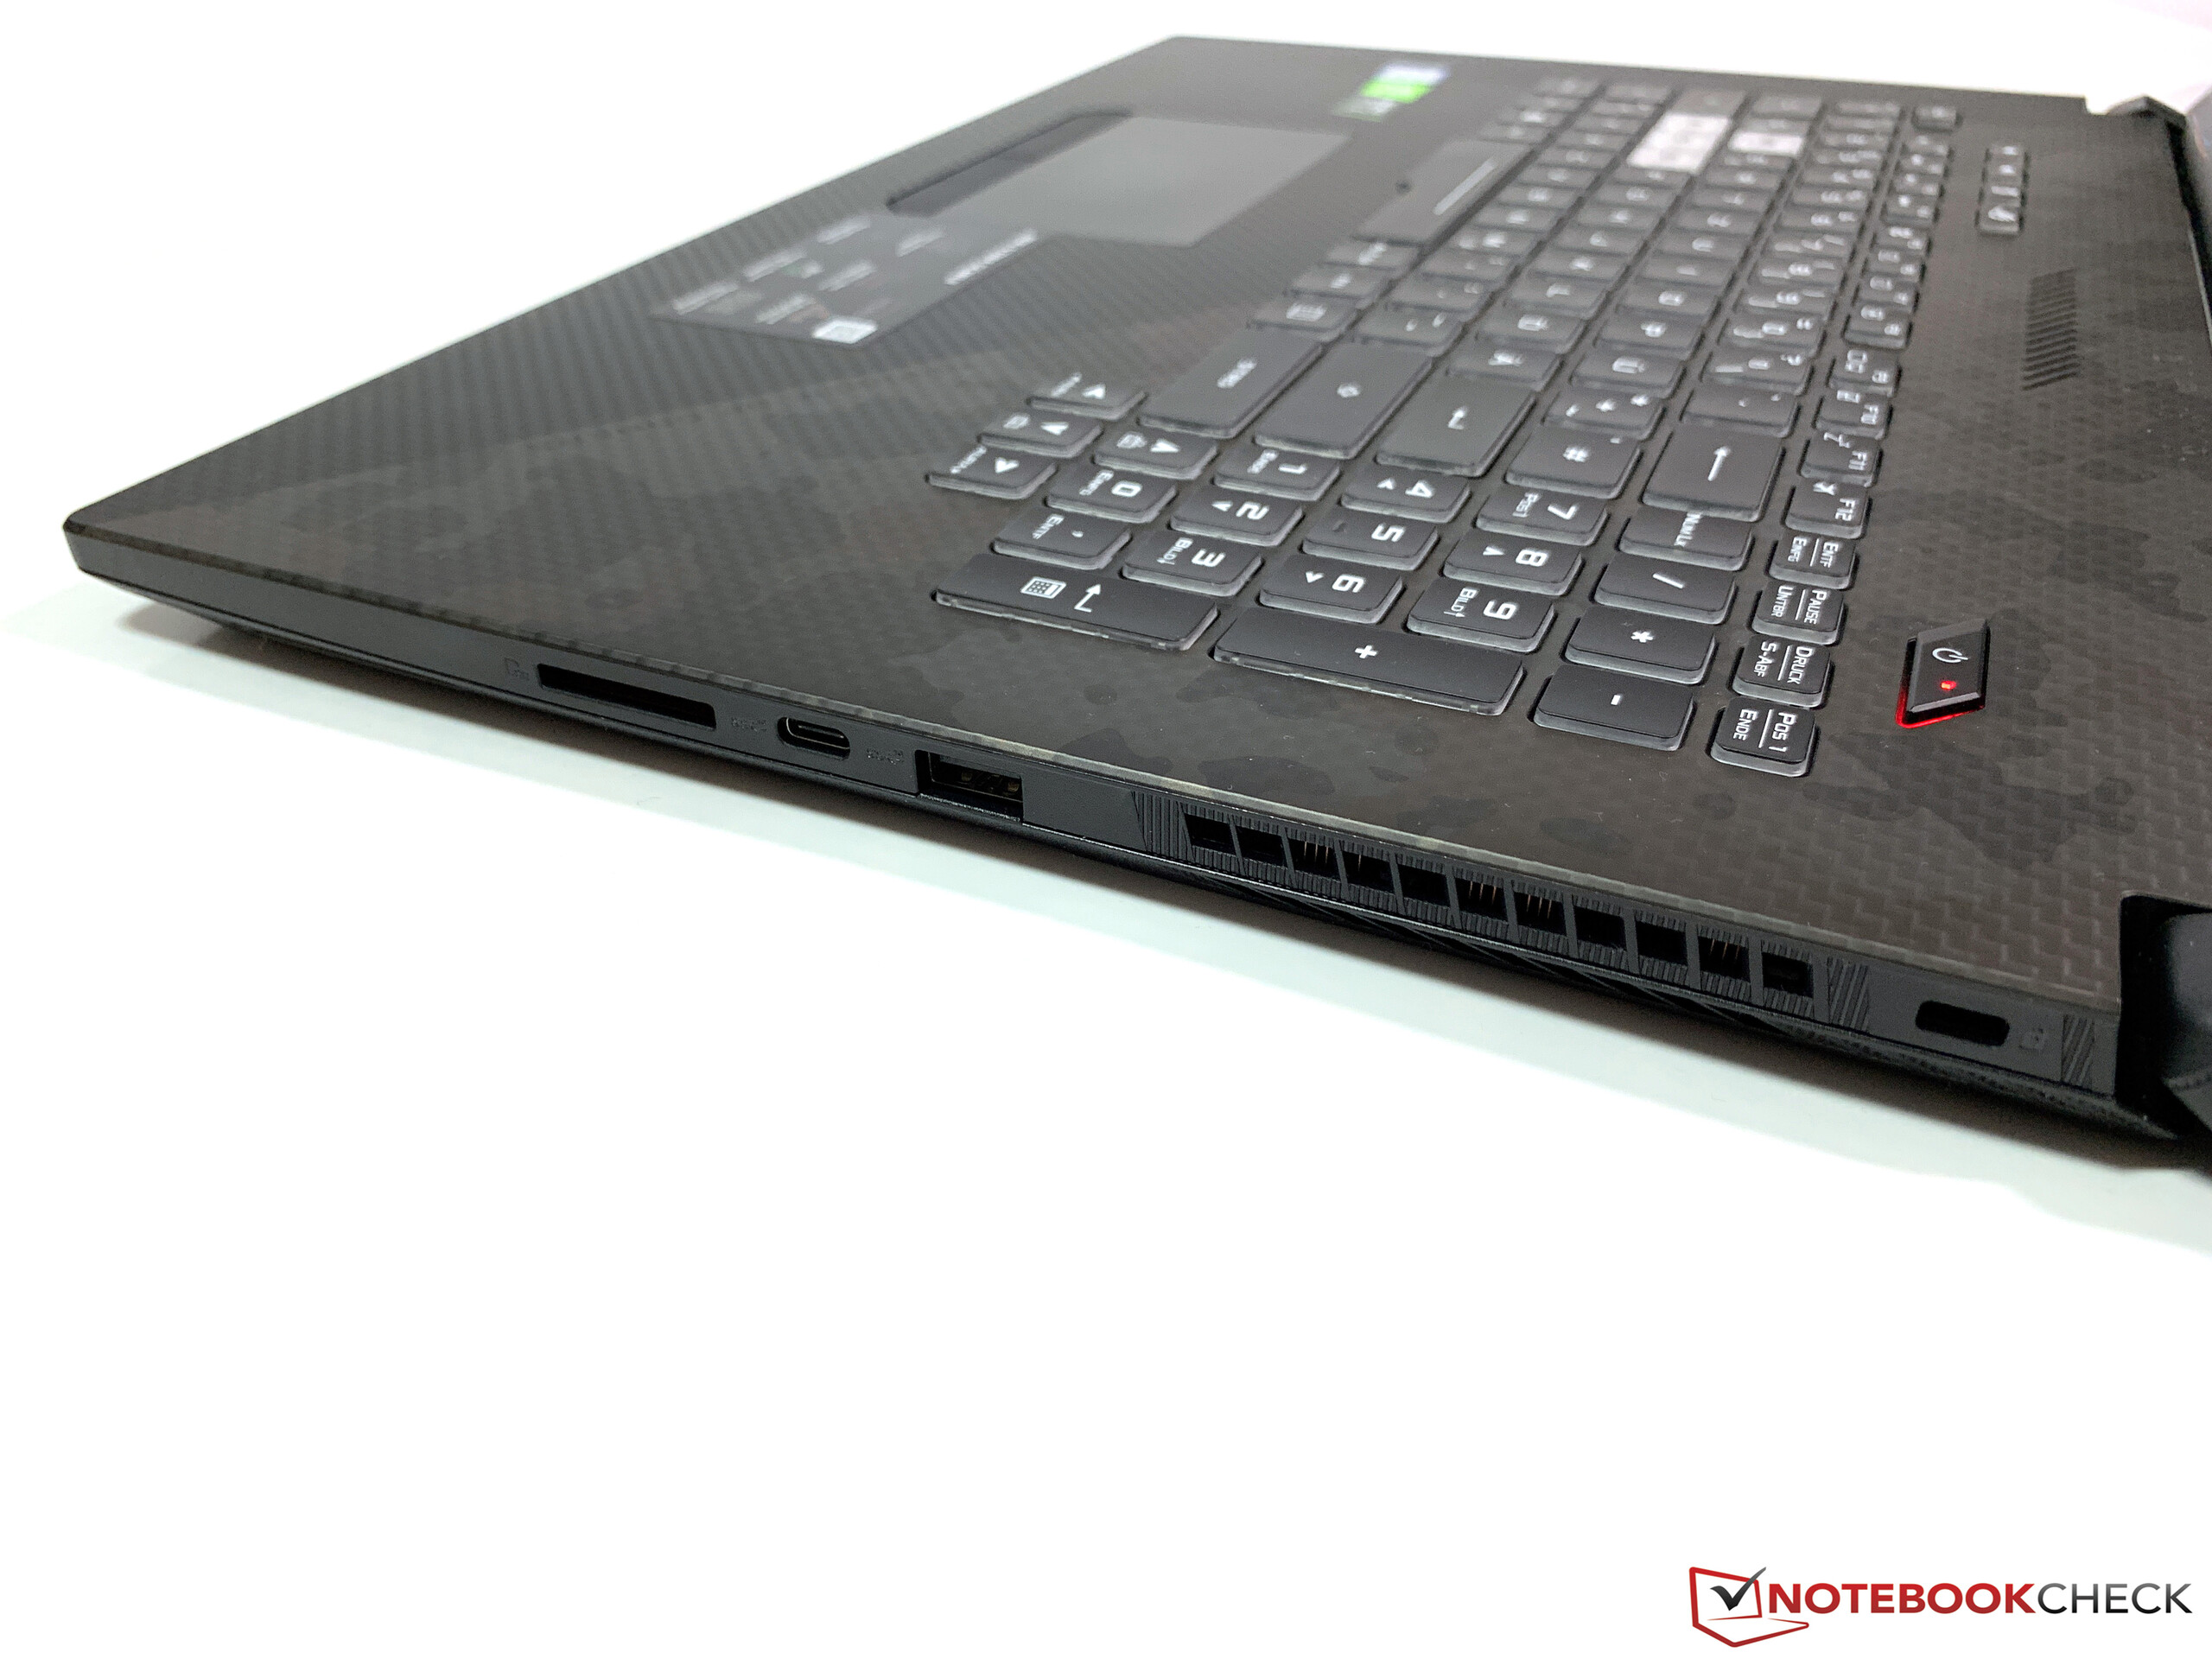
| SD Card Reader | |
| average JPG Copy Test (av. of 3 runs) | |
| MSI GS73VR 7RG (Toshiba Exceria Pro SDXC 64 GB UHS-II) | |
| Média da turma Gaming (20.9 - 210, n=54, últimos 2 anos) | |
| HP Omen 17t-3AW55AV_1 (Toshiba Exceria Pro SDXC 64 GB UHS-II) | |
| Asus ROG Strix Scar II GL704GW (Toshiba Exceria Pro SDXC 64 GB UHS-II) | |
| Asus GL704GM-DH74 (Toshiba Exceria Pro SDXC 64 GB UHS-II) | |
| Gigabyte Sabre 17-W8 (Toshiba Exceria Pro SDXC 64 GB UHS-II) | |
| MSI GL73 8SE-010US (Toshiba Exceria Pro SDXC 64 GB UHS-II) | |
| maximum AS SSD Seq Read Test (1GB) | |
| MSI GS73VR 7RG (Toshiba Exceria Pro SDXC 64 GB UHS-II) | |
| Média da turma Gaming (25.5 - 261, n=51, últimos 2 anos) | |
| HP Omen 17t-3AW55AV_1 (Toshiba Exceria Pro SDXC 64 GB UHS-II) | |
| Asus ROG Strix Scar II GL704GW (Toshiba Exceria Pro SDXC 64 GB UHS-II) | |
| Gigabyte Sabre 17-W8 (Toshiba Exceria Pro SDXC 64 GB UHS-II) | |
| Asus GL704GM-DH74 (Toshiba Exceria Pro SDXC 64 GB UHS-II) | |
| MSI GL73 8SE-010US (Toshiba Exceria Pro SDXC 64 GB UHS-II) | |
| |||||||||||||||||||||||||
iluminação: 96 %
Contraste: 1229:1 (Preto: 0.24 cd/m²)
ΔE ColorChecker Calman: 3.2 | ∀{0.5-29.43 Ø4.71}
calibrated: 2.52
ΔE Greyscale Calman: 2.16 | ∀{0.09-98 Ø4.96}
87% sRGB (Argyll 1.6.3 3D)
57% AdobeRGB 1998 (Argyll 1.6.3 3D)
63.7% AdobeRGB 1998 (Argyll 3D)
87.1% sRGB (Argyll 3D)
62.9% Display P3 (Argyll 3D)
Gamma: 2.46
CCT: 6872 K
| Asus ROG Strix Scar II GL704GW B173HAN04.0 (AUO409D), AHVA, 1920x1080 | Asus GL704GM-DH74 AU Optronics B173HAN04.0, IPS, 1920x1080 | MSI GS73VR 7RG ID: CMN1747, Name: Chi Mei N173HHE-G32, TN LED, 1920x1080 | Gigabyte Sabre 17-W8 Chi Mei CMN1747, TN, 1920x1080 | HP Omen 17t-3AW55AV_1 AU Optronics AUO309D, IPS, 1920x1080 | MSI GL73 8SE-010US CMN1747, TN LED, 1920x1080 | |
|---|---|---|---|---|---|---|
| Display | 0% | 31% | 31% | 3% | 31% | |
| Display P3 Coverage (%) | 62.9 | 62 -1% | 89.6 42% | 89.9 43% | 65.4 4% | 91.1 45% |
| sRGB Coverage (%) | 87.1 | 89.2 2% | 100 15% | 100 15% | 90 3% | 100 15% |
| AdobeRGB 1998 Coverage (%) | 63.7 | 63.3 -1% | 86.9 36% | 85.1 34% | 65.8 3% | 85.4 34% |
| Response Times | 31% | -5% | 39% | 6% | 27% | |
| Response Time Grey 50% / Grey 80% * (ms) | 17.6 ? | 6.8 ? 61% | 23.6 ? -34% | 9 ? 49% | 17.6 ? -0% | 12.8 ? 27% |
| Response Time Black / White * (ms) | 11.2 ? | 11.2 ? -0% | 8.4 ? 25% | 8 ? 29% | 10 ? 11% | 8.2 ? 27% |
| PWM Frequency (Hz) | 26040 ? | 25000 ? | 25770 ? | |||
| Screen | -18% | -67% | -62% | -13% | -57% | |
| Brightness middle (cd/m²) | 295 | 324.4 10% | 350.9 19% | 326 11% | 343.6 16% | 326.4 11% |
| Brightness (cd/m²) | 291 | 314 8% | 311 7% | 309 6% | 320 10% | 317 9% |
| Brightness Distribution (%) | 96 | 92 -4% | 79 -18% | 82 -15% | 87 -9% | 90 -6% |
| Black Level * (cd/m²) | 0.24 | 0.35 -46% | 0.33 -38% | 0.27 -13% | 0.34 -42% | 0.28 -17% |
| Contrast (:1) | 1229 | 927 -25% | 1063 -14% | 1207 -2% | 1011 -18% | 1166 -5% |
| Colorchecker dE 2000 * | 3.2 | 3.82 -19% | 7.7 -141% | 9.11 -185% | 3.74 -17% | 7.83 -145% |
| Colorchecker dE 2000 max. * | 6.64 | 6.4 4% | 14.4 -117% | 14.14 -113% | 5.33 20% | 13.36 -101% |
| Colorchecker dE 2000 calibrated * | 2.52 | 3.32 -32% | 2.62 -4% | 3.49 -38% | 2.83 -12% | |
| Greyscale dE 2000 * | 2.16 | 4.3 -99% | 11.1 -414% | 11.17 -417% | 3.7 -71% | 10.9 -405% |
| Gamma | 2.46 89% | 2.2 100% | 2.11 104% | 2.28 96% | 2.36 93% | 1.97 112% |
| CCT | 6872 95% | 7366 88% | 11813 55% | 12475 52% | 6388 102% | 11056 59% |
| Color Space (Percent of AdobeRGB 1998) (%) | 57 | 57.5 1% | 77.74 36% | 76 33% | 58 2% | 75.8 33% |
| Color Space (Percent of sRGB) (%) | 87 | 88.8 2% | 100 15% | 100 15% | 90 3% | 100 15% |
| Média Total (Programa/Configurações) | 4% /
-9% | -14% /
-39% | 3% /
-32% | -1% /
-8% | 0% /
-30% |
* ... menor é melhor
Exibir tempos de resposta
| ↔ Tempo de resposta preto para branco | ||
|---|---|---|
| 11.2 ms ... ascensão ↗ e queda ↘ combinadas | ↗ 6.8 ms ascensão | 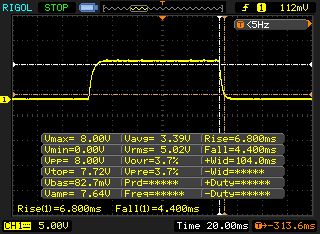 |
| ↘ 4.4 ms queda | ||
| A tela mostra boas taxas de resposta em nossos testes, mas pode ser muito lenta para jogadores competitivos. Em comparação, todos os dispositivos testados variam de 0.1 (mínimo) a 240 (máximo) ms. » 30 % de todos os dispositivos são melhores. Isso significa que o tempo de resposta medido é melhor que a média de todos os dispositivos testados (19.8 ms). | ||
| ↔ Tempo de resposta 50% cinza a 80% cinza | ||
| 17.6 ms ... ascensão ↗ e queda ↘ combinadas | ↗ 8.4 ms ascensão | 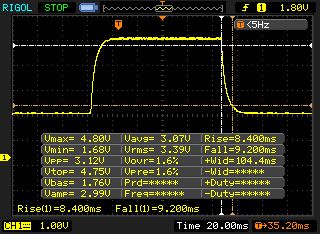 |
| ↘ 9.2 ms queda | ||
| A tela mostra boas taxas de resposta em nossos testes, mas pode ser muito lenta para jogadores competitivos. Em comparação, todos os dispositivos testados variam de 0.165 (mínimo) a 636 (máximo) ms. » 32 % de todos os dispositivos são melhores. Isso significa que o tempo de resposta medido é melhor que a média de todos os dispositivos testados (30.9 ms). | ||
Cintilação da tela / PWM (modulação por largura de pulso)
| Tela tremeluzindo / PWM não detectado |  | ||
[pwm_comparison] Em comparação: 52 % de todos os dispositivos testados não usam PWM para escurecer a tela. Se PWM foi detectado, uma média de 7744 (mínimo: 5 - máximo: 343500) Hz foi medida. | |||


| PCMark 10 - Score | |
| Média da turma Gaming (5828 - 12414, n=93, últimos 2 anos) | |
| HP Omen 17t-3AW55AV_1 | |
| Asus ROG Strix Scar II GL704GW | |
| MSI GL73 8SE-010US | |
| Asus GL704GM-DH74 | |
| Gigabyte Sabre 17-W8 | |
| MSI GS73VR 7RG | |
| PCMark 8 Home Score Accelerated v2 | 4861 pontos | |
| PCMark 8 Creative Score Accelerated v2 | 7941 pontos | |
| PCMark 8 Work Score Accelerated v2 | 5663 pontos | |
| PCMark 10 Score | 5555 pontos | |
Ajuda | ||
| Asus ROG Strix Scar II GL704GW Intel SSD 660p SSDPEKNW512G8 | Asus GL704GM-DH74 WDC PC SN520 SDAPNUW-256G | MSI GS73VR 7RG Samsung SSD PM871 MZNLN512HMJP | Gigabyte Sabre 17-W8 Toshiba NVMe THNSN5256GPU7 | HP Omen 17t-3AW55AV_1 Samsung SSD PM981 MZVLB512HAJQ | MSI GL73 8SE-010US Kingston RBUSNS8154P3128GJ | |
|---|---|---|---|---|---|---|
| CrystalDiskMark 5.2 / 6 | -1% | -19% | 1% | 29% | -43% | |
| Write 4K (MB/s) | 99.6 | 96.8 -3% | 141.3 42% | 104.7 5% | 110.7 11% | 71.2 -29% |
| Read 4K (MB/s) | 48.99 | 39.82 -19% | 41.02 -16% | 37.39 -24% | 35.49 -28% | 32.7 -33% |
| Write Seq (MB/s) | 972 | 1197 23% | 507 -48% | 866 -11% | 1665 71% | 404.5 -58% |
| Read Seq (MB/s) | 1515 | 1166 -23% | 539 -64% | 944 -38% | 1284 -15% | 8.3 -99% |
| Write 4K Q32T1 (MB/s) | 280.6 | 247.3 -12% | 362.8 29% | 293.3 5% | 340.2 21% | 204 -27% |
| Read 4K Q32T1 (MB/s) | 327.8 | 314.3 -4% | 402.8 23% | 374.3 14% | 407.5 24% | 303.2 -8% |
| Write Seq Q32T1 (MB/s) | 970 | 1302 34% | 524 -46% | 1064 10% | 2038 110% | 386.5 -60% |
| Read Seq Q32T1 (MB/s) | 1757 | 1688 -4% | 553 -69% | 2616 49% | 2367 35% | 1214 -31% |
| AS SSD | 6% | -23% | 14% | 83% | -53% | |
| Seq Read (MB/s) | 1315 | 1102 -16% | 497.9 -62% | 2120 61% | 1473 12% | 794 -40% |
| Seq Write (MB/s) | 927 | 1204 30% | 465.1 -50% | 871 -6% | 1962 112% | 427.6 -54% |
| 4K Read (MB/s) | 52.4 | 28.76 -45% | 33.69 -36% | 20.59 -61% | 31.66 -40% | 21.91 -58% |
| 4K Write (MB/s) | 122.8 | 92.9 -24% | 96.8 -21% | 88.4 -28% | 84.4 -31% | 56.6 -54% |
| 4K-64 Read (MB/s) | 326.5 | 649 99% | 337.7 3% | 848 160% | 1125 245% | 354.3 9% |
| 4K-64 Write (MB/s) | 727 | 593 -18% | 273.6 -62% | 591 -19% | 1866 157% | 285.7 -61% |
| Access Time Read * (ms) | 0.11 | 0.141 -28% | 0.051 54% | 0.191 -74% | 0.071 35% | 0.237 -115% |
| Access Time Write * (ms) | 0.045 | 0.04 11% | 0.032 29% | 0.047 -4% | 0.047 -4% | 0.09 -100% |
| Score Read (Points) | 510 | 788 55% | 421 -17% | 1080 112% | 1304 156% | 456 -11% |
| Score Write (Points) | 942 | 806 -14% | 417 -56% | 767 -19% | 2147 128% | 385 -59% |
| Score Total (Points) | 1715 | 2008 17% | 1064 -38% | 2335 36% | 4142 142% | 1061 -38% |
| Média Total (Programa/Configurações) | 3% /
3% | -21% /
-21% | 8% /
9% | 56% /
60% | -48% /
-49% |
* ... menor é melhor

| 3DMark 11 - 1280x720 Performance GPU | |
| Média da turma Gaming (21841 - 80022, n=103, últimos 2 anos) | |
| Asus ROG Strix Scar II GL704GW (Turbo Mode) | |
| Asus ROG Strix Scar II GL704GW | |
| Razer Blade 15 RTX 2070 Max-Q | |
| HP Omen 17t-3AW55AV_1 | |
| MSI GL73 8SE-010US | |
| MSI GS73VR 7RG | |
| Asus GL704GM-DH74 | |
| Gigabyte Sabre 17-W8 | |
| 3DMark 11 Performance | 19085 pontos | |
| 3DMark Fire Strike Score | 16810 pontos | |
| 3DMark Fire Strike Extreme Score | 8788 pontos | |
| 3DMark Time Spy Score | 7182 pontos | |
Ajuda | ||
| The Witcher 3 | |
| 1920x1080 High Graphics & Postprocessing (Nvidia HairWorks Off) | |
| Média da turma Gaming (341 - 404, n=2, últimos 2 anos) | |
| Asus ROG G703GX | |
| Asus ROG Strix Scar II GL704GW | |
| MSI GL73 8SE-010US | |
| MSI GS73VR 7RG | |
| HP Omen 17t-3AW55AV_1 | |
| Asus GL704GM-DH74 | |
| Gigabyte Sabre 17-W8 | |
| 1920x1080 Ultra Graphics & Postprocessing (HBAO+) | |
| Média da turma Gaming (104.7 - 240, n=7, últimos 2 anos) | |
| Asus ROG G703GX | |
| MSI GS75 8SG Stealth | |
| Asus ROG Strix Scar II GL704GW | |
| Schenker XMG Ultra 17 Coffee Lake Refresh | |
| HP Omen 17t-3AW55AV_1 | |
| MSI GL73 8SE-010US | |
| MSI GS73VR 7RG | |
| Asus GL704GM-DH74 | |
| Gigabyte Sabre 17-W8 | |
| Shadow of the Tomb Raider | |
| 1920x1080 Highest Preset AA:T | |
| Asus ROG G703GX | |
| Média da turma Gaming (96 - 116, n=2, últimos 2 anos) | |
| Asus ROG Strix Scar II GL704GW | |
| Schenker XMG Ultra 17 Coffee Lake Refresh | |
| MSI GS75 8SG Stealth | |
| MSI GL73 8SE-010US | |
| 1920x1080 High Preset AA:SM | |
| Média da turma Gaming (107 - 127, n=2, últimos 2 anos) | |
| Asus ROG G703GX | |
| Asus ROG Strix Scar II GL704GW | |
| MSI GL73 8SE-010US | |
| Rise of the Tomb Raider | |
| 1920x1080 High Preset AA:FX AF:4x | |
| Asus ROG Strix Scar II GL704GW | |
| HP Omen 17t-3AW55AV_1 | |
| MSI GS73VR 7RG | |
| Asus GL704GM-DH74 | |
| Gigabyte Sabre 17-W8 | |
| 1920x1080 Very High Preset AA:FX AF:16x | |
| Asus ROG Strix Scar II GL704GW | |
| HP Omen 17t-3AW55AV_1 | |
| MSI GS73VR 7RG | |
| Asus GL704GM-DH74 | |
| Gigabyte Sabre 17-W8 | |
| Battlefield V | |
| 1920x1080 Ultra Preset | |
| Asus ROG G703GX | |
| MSI GS75 8SG Stealth | |
| Asus ROG Strix Scar II GL704GW | |
| 1920x1080 High Preset | |
| Asus ROG G703GX | |
| Asus ROG Strix Scar II GL704GW | |
| Darksiders III | |
| 1920x1080 Epic | |
| Asus ROG G703GX | |
| Asus ROG Strix Scar II GL704GW | |
| 1920x1080 High | |
| Asus ROG G703GX | |
| Asus ROG Strix Scar II GL704GW | |
| baixo | média | alto | ultra | |
|---|---|---|---|---|
| GTA V (2015) | 163.4 | 155.7 | 126.6 | 71.4 |
| Dirt Rally (2015) | 254.5 | 160.6 | 199.7 | 113.6 |
| The Witcher 3 (2015) | 255.3 | 204.1 | 133.6 | 71.8 |
| Dota 2 Reborn (2015) | 129.7 | 120.7 | 115 | 109.2 |
| Rise of the Tomb Raider (2016) | 210.5 | 158.6 | 130.7 | 109 |
| Battlefield 1 (2016) | 165.4 | 141.5 | 120.6 | 113.3 |
| Assassin´s Creed Origins (2017) | 84 | 72 | 71 | 64 |
| Shadow of the Tomb Raider (2018) | 119 | 95 | 92 | 91 |
| Forza Horizon 4 (2018) | 137 | 113 | 112 | 94 |
| Battlefield V (2018) | 111.6 | 86 | 77.7 | 73 |
| Darksiders III (2018) | 169.2 | 102.4 | 98.5 | 94.7 |
| Just Cause 4 (2018) | 169.5 | 129.3 | 96.1 | 91.3 |
Barulho
| Ocioso |
| 29 / 32 / 40 dB |
| HDD |
| 32 dB |
| Carga |
| 46 / 52 dB |
 | ||
30 dB silencioso 40 dB(A) audível 50 dB(A) ruidosamente alto |
||
min: | ||
| Asus ROG Strix Scar II GL704GW GeForce RTX 2070 Mobile, i7-8750H | Asus GL704GM-DH74 GeForce GTX 1060 Mobile, i7-8750H | MSI GS73VR 7RG GeForce GTX 1070 Max-Q, i7-7700HQ | Gigabyte Sabre 17-W8 GeForce GTX 1060 Mobile, i7-8750H | HP Omen 17t-3AW55AV_1 GeForce GTX 1070 Mobile, i7-8750H | MSI GL73 8SE-010US GeForce RTX 2060 Mobile, i7-8750H | |
|---|---|---|---|---|---|---|
| Noise | -3% | 7% | 3% | 6% | 3% | |
| desligado / ambiente * (dB) | 29 | 28.2 3% | 28 3% | 30.5 -5% | 27.8 4% | 28.6 1% |
| Idle Minimum * (dB) | 29 | 30 -3% | 29.4 -1% | 32.1 -11% | 31.1 -7% | 33.8 -17% |
| Idle Average * (dB) | 32 | 31.8 1% | 30.7 4% | 32.1 -0% | 31.1 3% | 34 -6% |
| Idle Maximum * (dB) | 40 | 34.6 13% | 34 15% | 32.3 19% | 35 12% | 34.1 15% |
| Load Average * (dB) | 46 | 56 -22% | 42 9% | 42.9 7% | 42 9% | 36.5 21% |
| Witcher 3 ultra * (dB) | 51 | 54.2 -6% | 45.8 10% | 44.5 13% | 47.8 6% | |
| Load Maximum * (dB) | 52 | 56.7 -9% | 45.8 12% | 48.8 6% | 46.5 11% | 52.2 -0% |
* ... menor é melhor
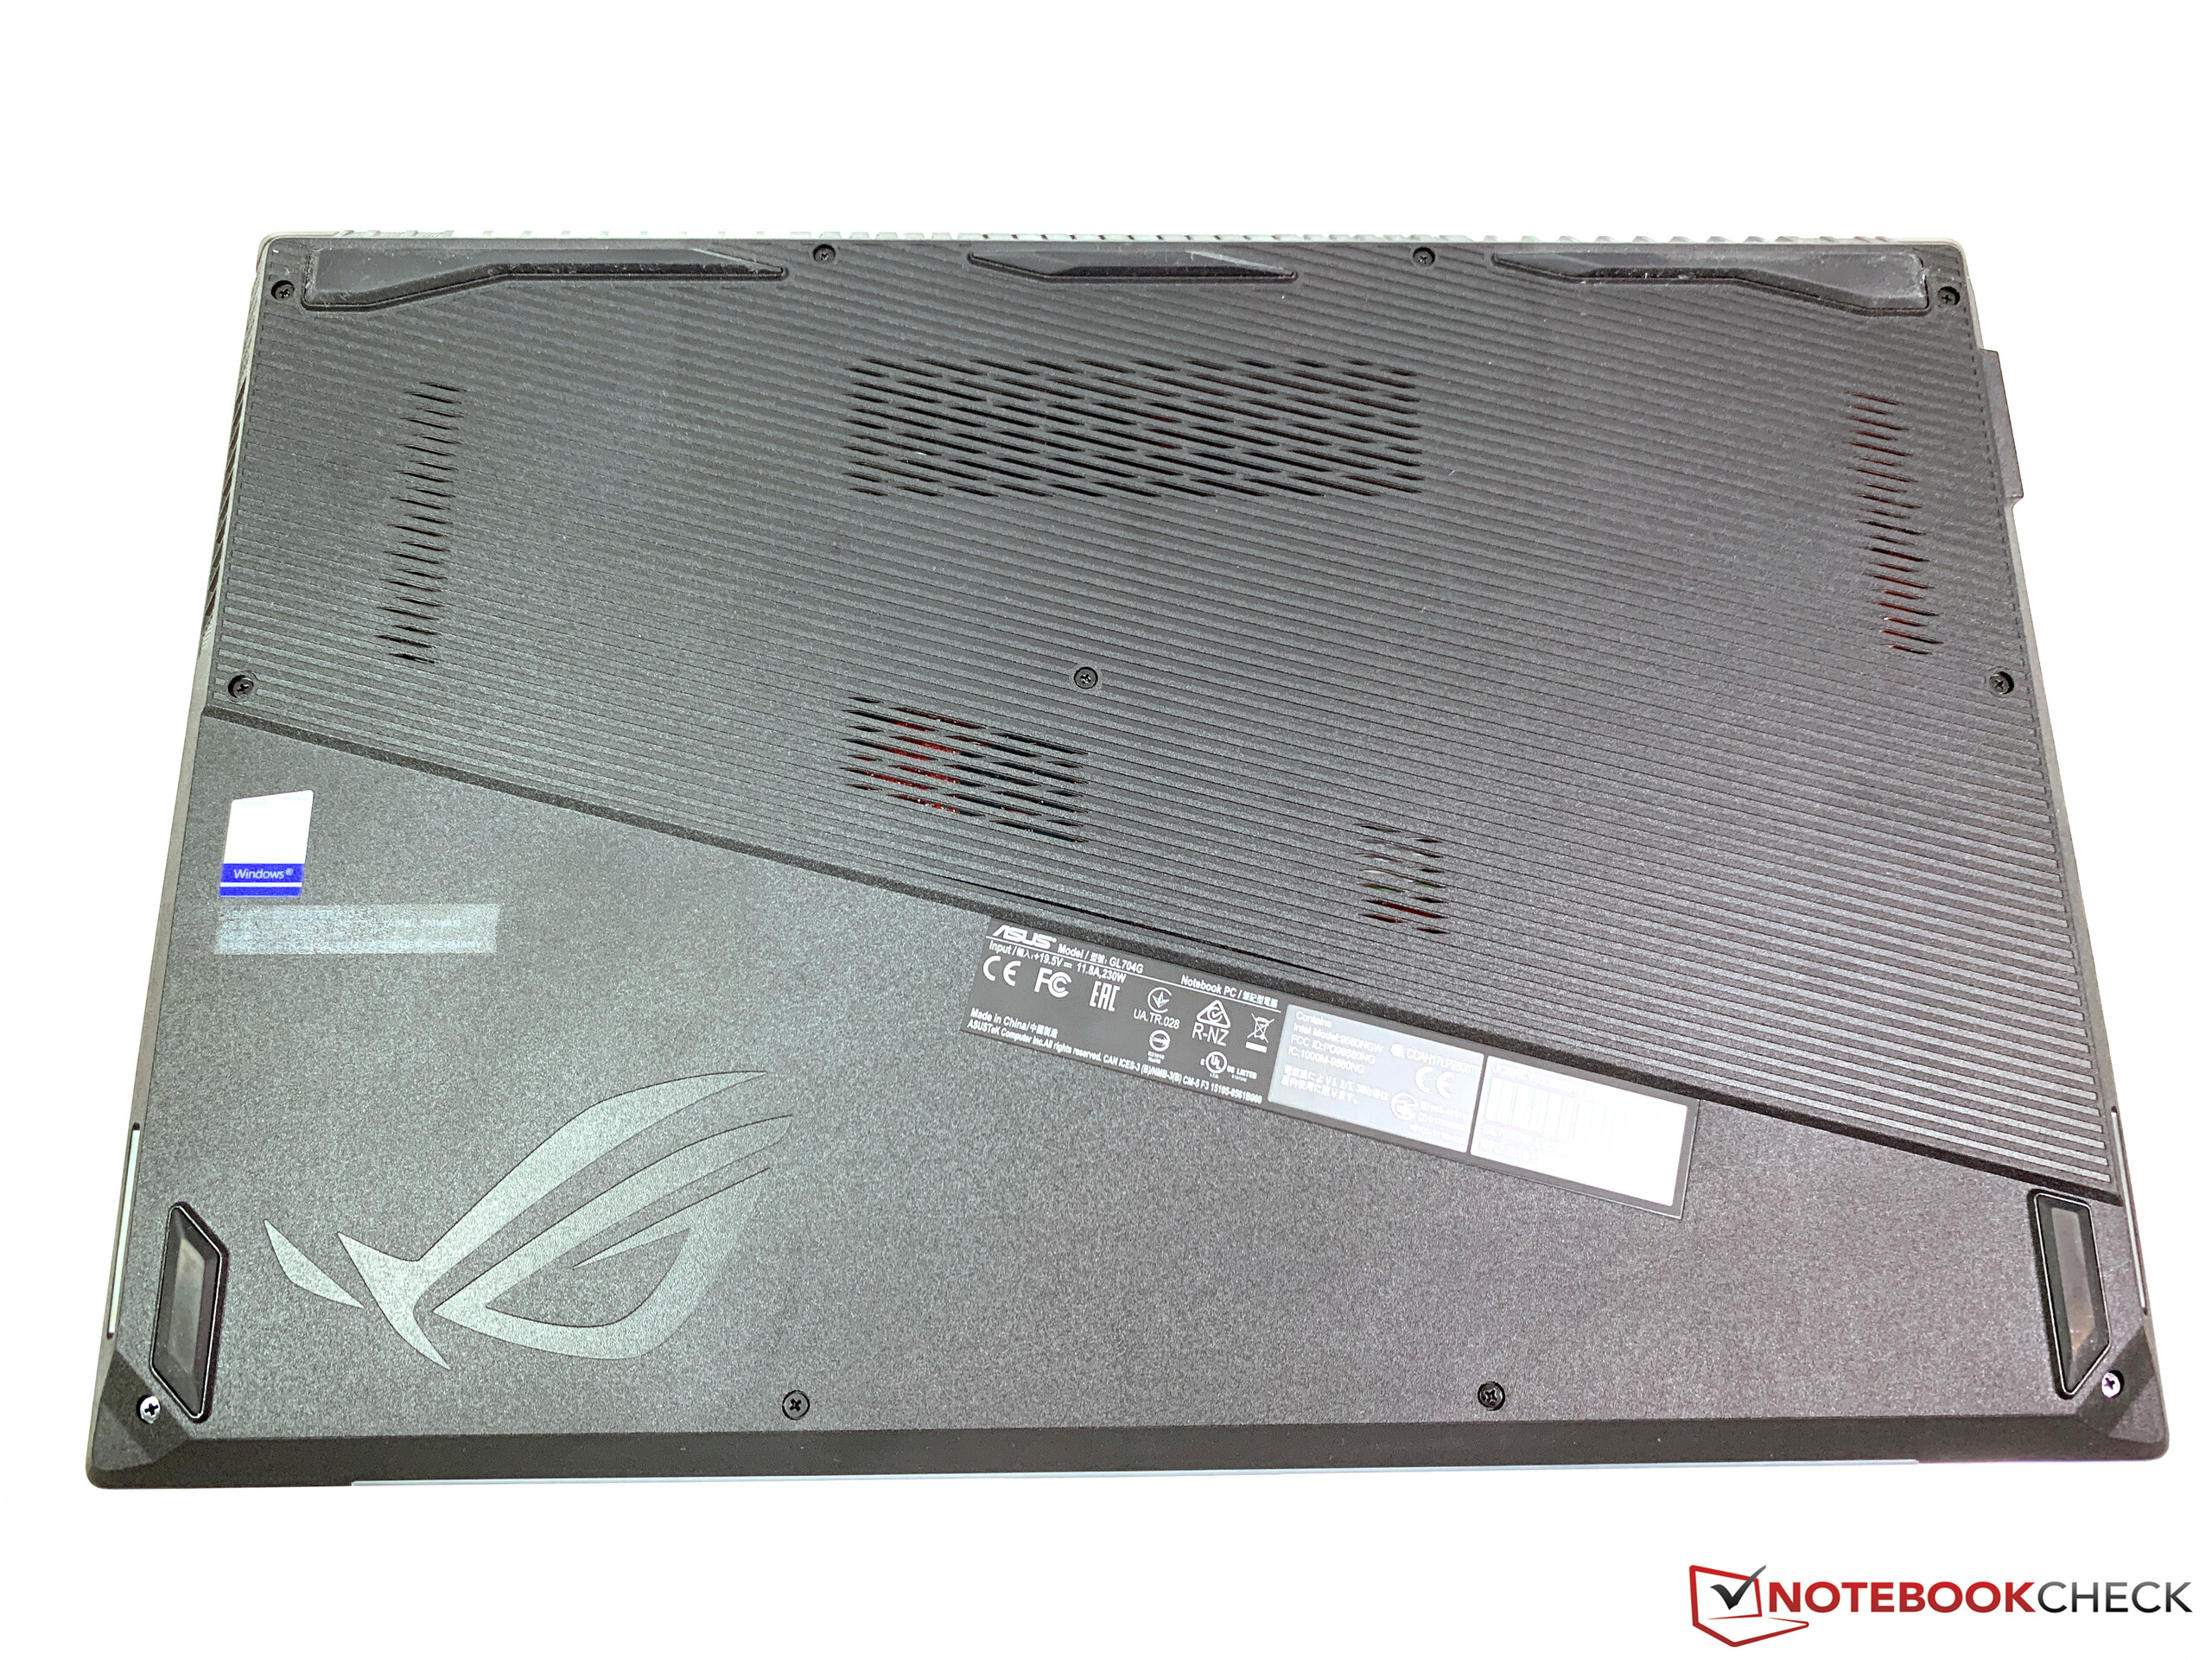
(-) A temperatura máxima no lado superior é 59 °C / 138 F, em comparação com a média de 40.4 °C / 105 F , variando de 21.2 a 68.8 °C para a classe Gaming.
(-) A parte inferior aquece até um máximo de 54 °C / 129 F, em comparação com a média de 43.2 °C / 110 F
(+) Em uso inativo, a temperatura média para o lado superior é 30.7 °C / 87 F, em comparação com a média do dispositivo de 33.9 °C / ### class_avg_f### F.
(-) Jogando The Witcher 3, a temperatura média para o lado superior é 40.4 °C / 105 F, em comparação com a média do dispositivo de 33.9 °C / ## #class_avg_f### F.
(+) Os apoios para as mãos e o touchpad são mais frios que a temperatura da pele, com um máximo de 29 °C / 84.2 F e, portanto, são frios ao toque.
(±) A temperatura média da área do apoio para as mãos de dispositivos semelhantes foi 28.8 °C / 83.8 F (-0.2 °C / -0.4 F).
Asus ROG Strix Scar II GL704GW análise de áudio
(±) | o volume do alto-falante é médio, mas bom (###valor### dB)
Graves 100 - 315Hz
(±) | graves reduzidos - em média 6.1% menor que a mediana
(±) | a linearidade dos graves é média (10.4% delta para a frequência anterior)
Médios 400 - 2.000 Hz
(+) | médios equilibrados - apenas 2.2% longe da mediana
(+) | médios são lineares (2.4% delta para frequência anterior)
Altos 2 - 16 kHz
(+) | agudos equilibrados - apenas 3.1% longe da mediana
(+) | os máximos são lineares (4% delta da frequência anterior)
Geral 100 - 16.000 Hz
(+) | o som geral é linear (12.3% diferença em relação à mediana)
Comparado com a mesma classe
» 13% de todos os dispositivos testados nesta classe foram melhores, 5% semelhantes, 82% piores
» O melhor teve um delta de 6%, a média foi 18%, o pior foi 132%
Comparado com todos os dispositivos testados
» 10% de todos os dispositivos testados foram melhores, 3% semelhantes, 87% piores
» O melhor teve um delta de 4%, a média foi 23%, o pior foi 134%
Asus GL704GM-DH74 análise de áudio
(-) | alto-falantes não muito altos (###valor### dB)
Graves 100 - 315Hz
(±) | graves reduzidos - em média 7.7% menor que a mediana
(±) | a linearidade dos graves é média (14.4% delta para a frequência anterior)
Médios 400 - 2.000 Hz
(+) | médios equilibrados - apenas 3% longe da mediana
(+) | médios são lineares (5.7% delta para frequência anterior)
Altos 2 - 16 kHz
(+) | agudos equilibrados - apenas 2.9% longe da mediana
(±) | a linearidade dos máximos é média (9% delta para frequência anterior)
Geral 100 - 16.000 Hz
(±) | a linearidade do som geral é média (17% diferença em relação à mediana)
Comparado com a mesma classe
» 45% de todos os dispositivos testados nesta classe foram melhores, 12% semelhantes, 43% piores
» O melhor teve um delta de 6%, a média foi 18%, o pior foi 132%
Comparado com todos os dispositivos testados
» 31% de todos os dispositivos testados foram melhores, 8% semelhantes, 61% piores
» O melhor teve um delta de 4%, a média foi 23%, o pior foi 134%
| desligado | |
| Ocioso | |
| Carga |
|
Key:
min: | |
| Asus ROG Strix Scar II GL704GW GeForce RTX 2070 Mobile, i7-8750H | Asus GL704GM-DH74 GeForce GTX 1060 Mobile, i7-8750H | MSI GL73 8SE-010US GeForce RTX 2060 Mobile, i7-8750H | MSI GS73VR 7RG GeForce GTX 1070 Max-Q, i7-7700HQ | Gigabyte Sabre 17-W8 GeForce GTX 1060 Mobile, i7-8750H | HP Omen 17t-3AW55AV_1 GeForce GTX 1070 Mobile, i7-8750H | Média da turma Gaming | |
|---|---|---|---|---|---|---|---|
| Power Consumption | 14% | 29% | 28% | 33% | 3% | 8% | |
| Idle Minimum * (Watt) | 19 | 15.2 20% | 8.8 54% | 10.1 47% | 9.3 51% | 17.8 6% | 13.1 ? 31% |
| Idle Average * (Watt) | 22 | 20.4 7% | 16.2 26% | 18.3 17% | 14.8 33% | 24.7 -12% | 19 ? 14% |
| Idle Maximum * (Watt) | 29 | 27.3 6% | 18.3 37% | 19.6 32% | 22 24% | 29.6 -2% | 24.6 ? 15% |
| Load Average * (Watt) | 102 | 92.9 9% | 86.1 16% | 87.6 14% | 63 38% | 110 -8% | 111.3 ? -9% |
| Witcher 3 ultra * (Watt) | 190 | 143 25% | 146.7 23% | 136.3 28% | 167.8 12% | ||
| Load Maximum * (Watt) | 231 | 190.6 17% | 186.4 19% | 160.7 30% | 187 19% | 178.6 23% | 260 ? -13% |
* ... menor é melhor
| Asus ROG Strix Scar II GL704GW GeForce RTX 2070 Mobile, i7-8750H, 66 Wh | Asus GL704GM-DH74 GeForce GTX 1060 Mobile, i7-8750H, 66 Wh | MSI GS73VR 7RG GeForce GTX 1070 Max-Q, i7-7700HQ, 51 Wh | Gigabyte Sabre 17-W8 GeForce GTX 1060 Mobile, i7-8750H, 62 Wh | HP Omen 17t-3AW55AV_1 GeForce GTX 1070 Mobile, i7-8750H, 86 Wh | MSI GL73 8SE-010US GeForce RTX 2060 Mobile, i7-8750H, 41 Wh | Média da turma Gaming | |
|---|---|---|---|---|---|---|---|
| Duração da bateria | 8% | -11% | 25% | 9% | -23% | 48% | |
| Reader / Idle (h) | 6.2 | 7.1 15% | 5.8 -6% | 6.9 11% | 4.5 -27% | 6.5 5% | 7.84 ? 26% |
| WiFi v1.3 (h) | 3.9 | 4.3 10% | 3.2 -18% | 5.4 38% | 4.2 8% | 2.8 -28% | 7.08 ? 82% |
| Witcher 3 ultra (h) | 0.9 | ||||||
| Load (h) | 1.1 | 1.1 0% | 1 -9% | 1.4 27% | 1.6 45% | 0.6 -45% | 1.496 ? 36% |
| H.264 (h) | 5.3 | 8.27 ? |
Pro
Contra
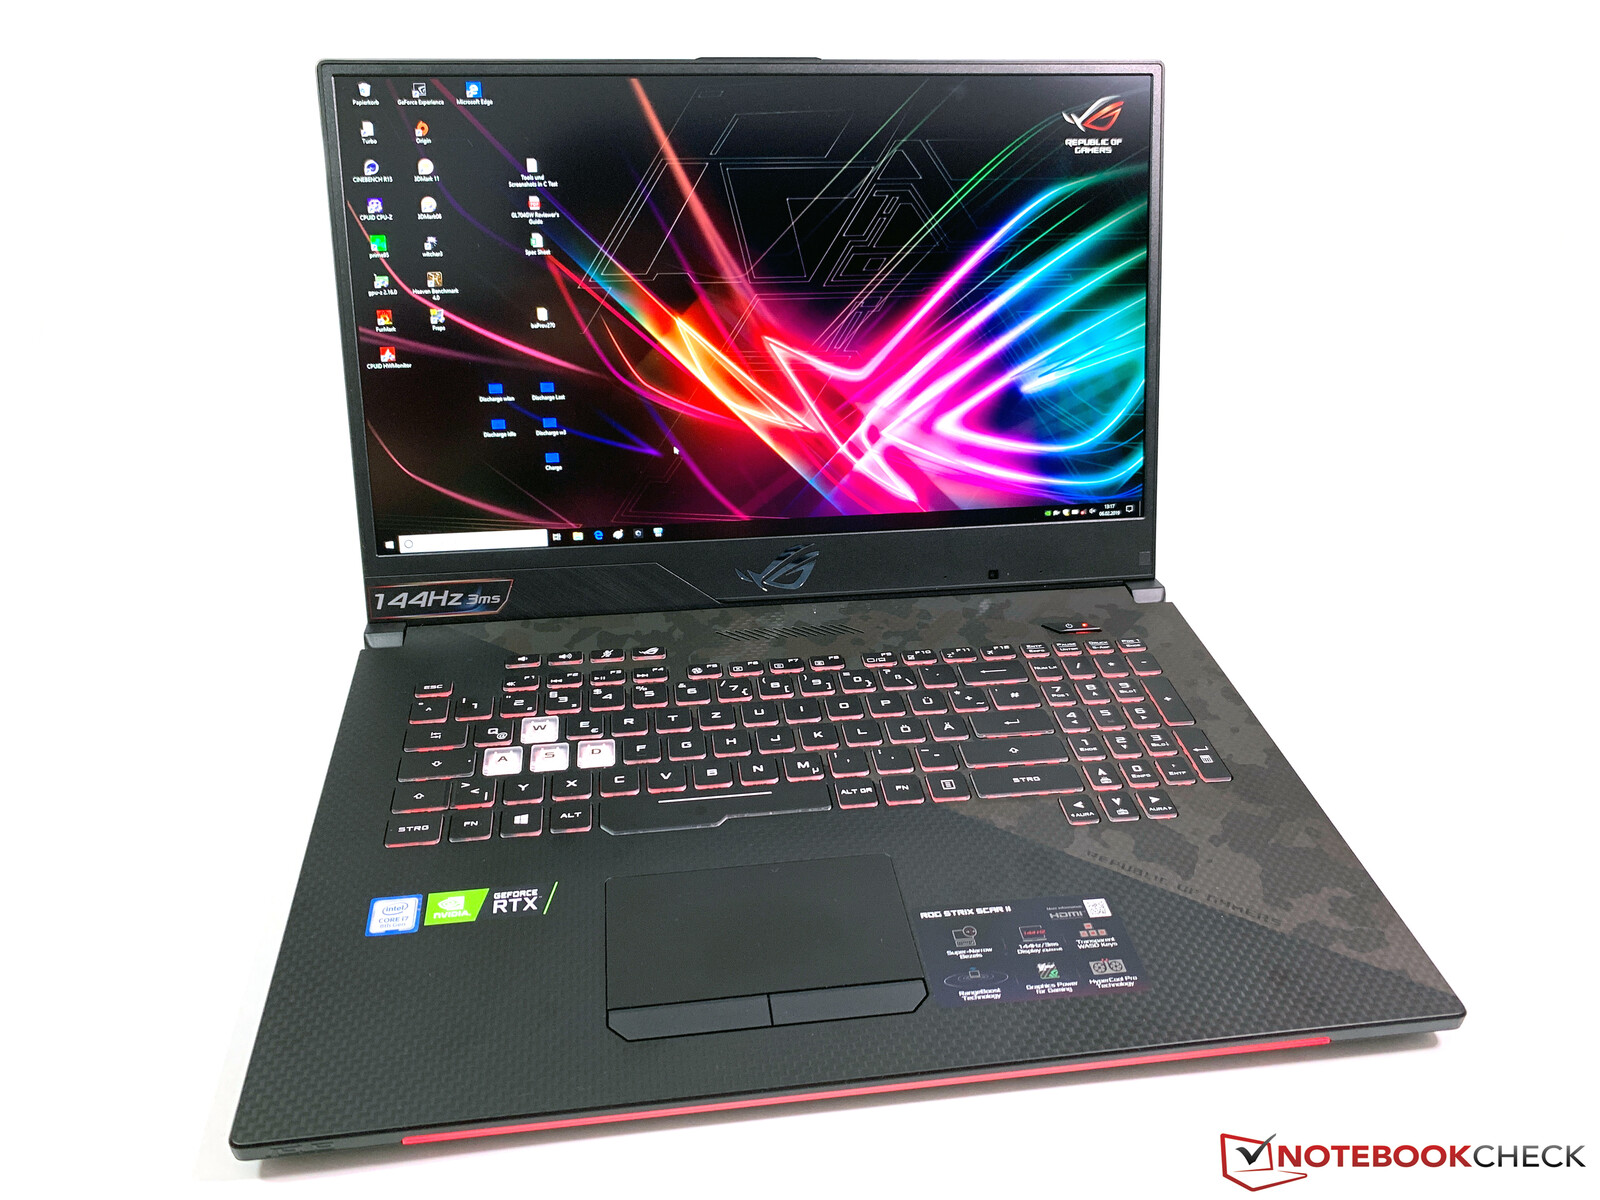
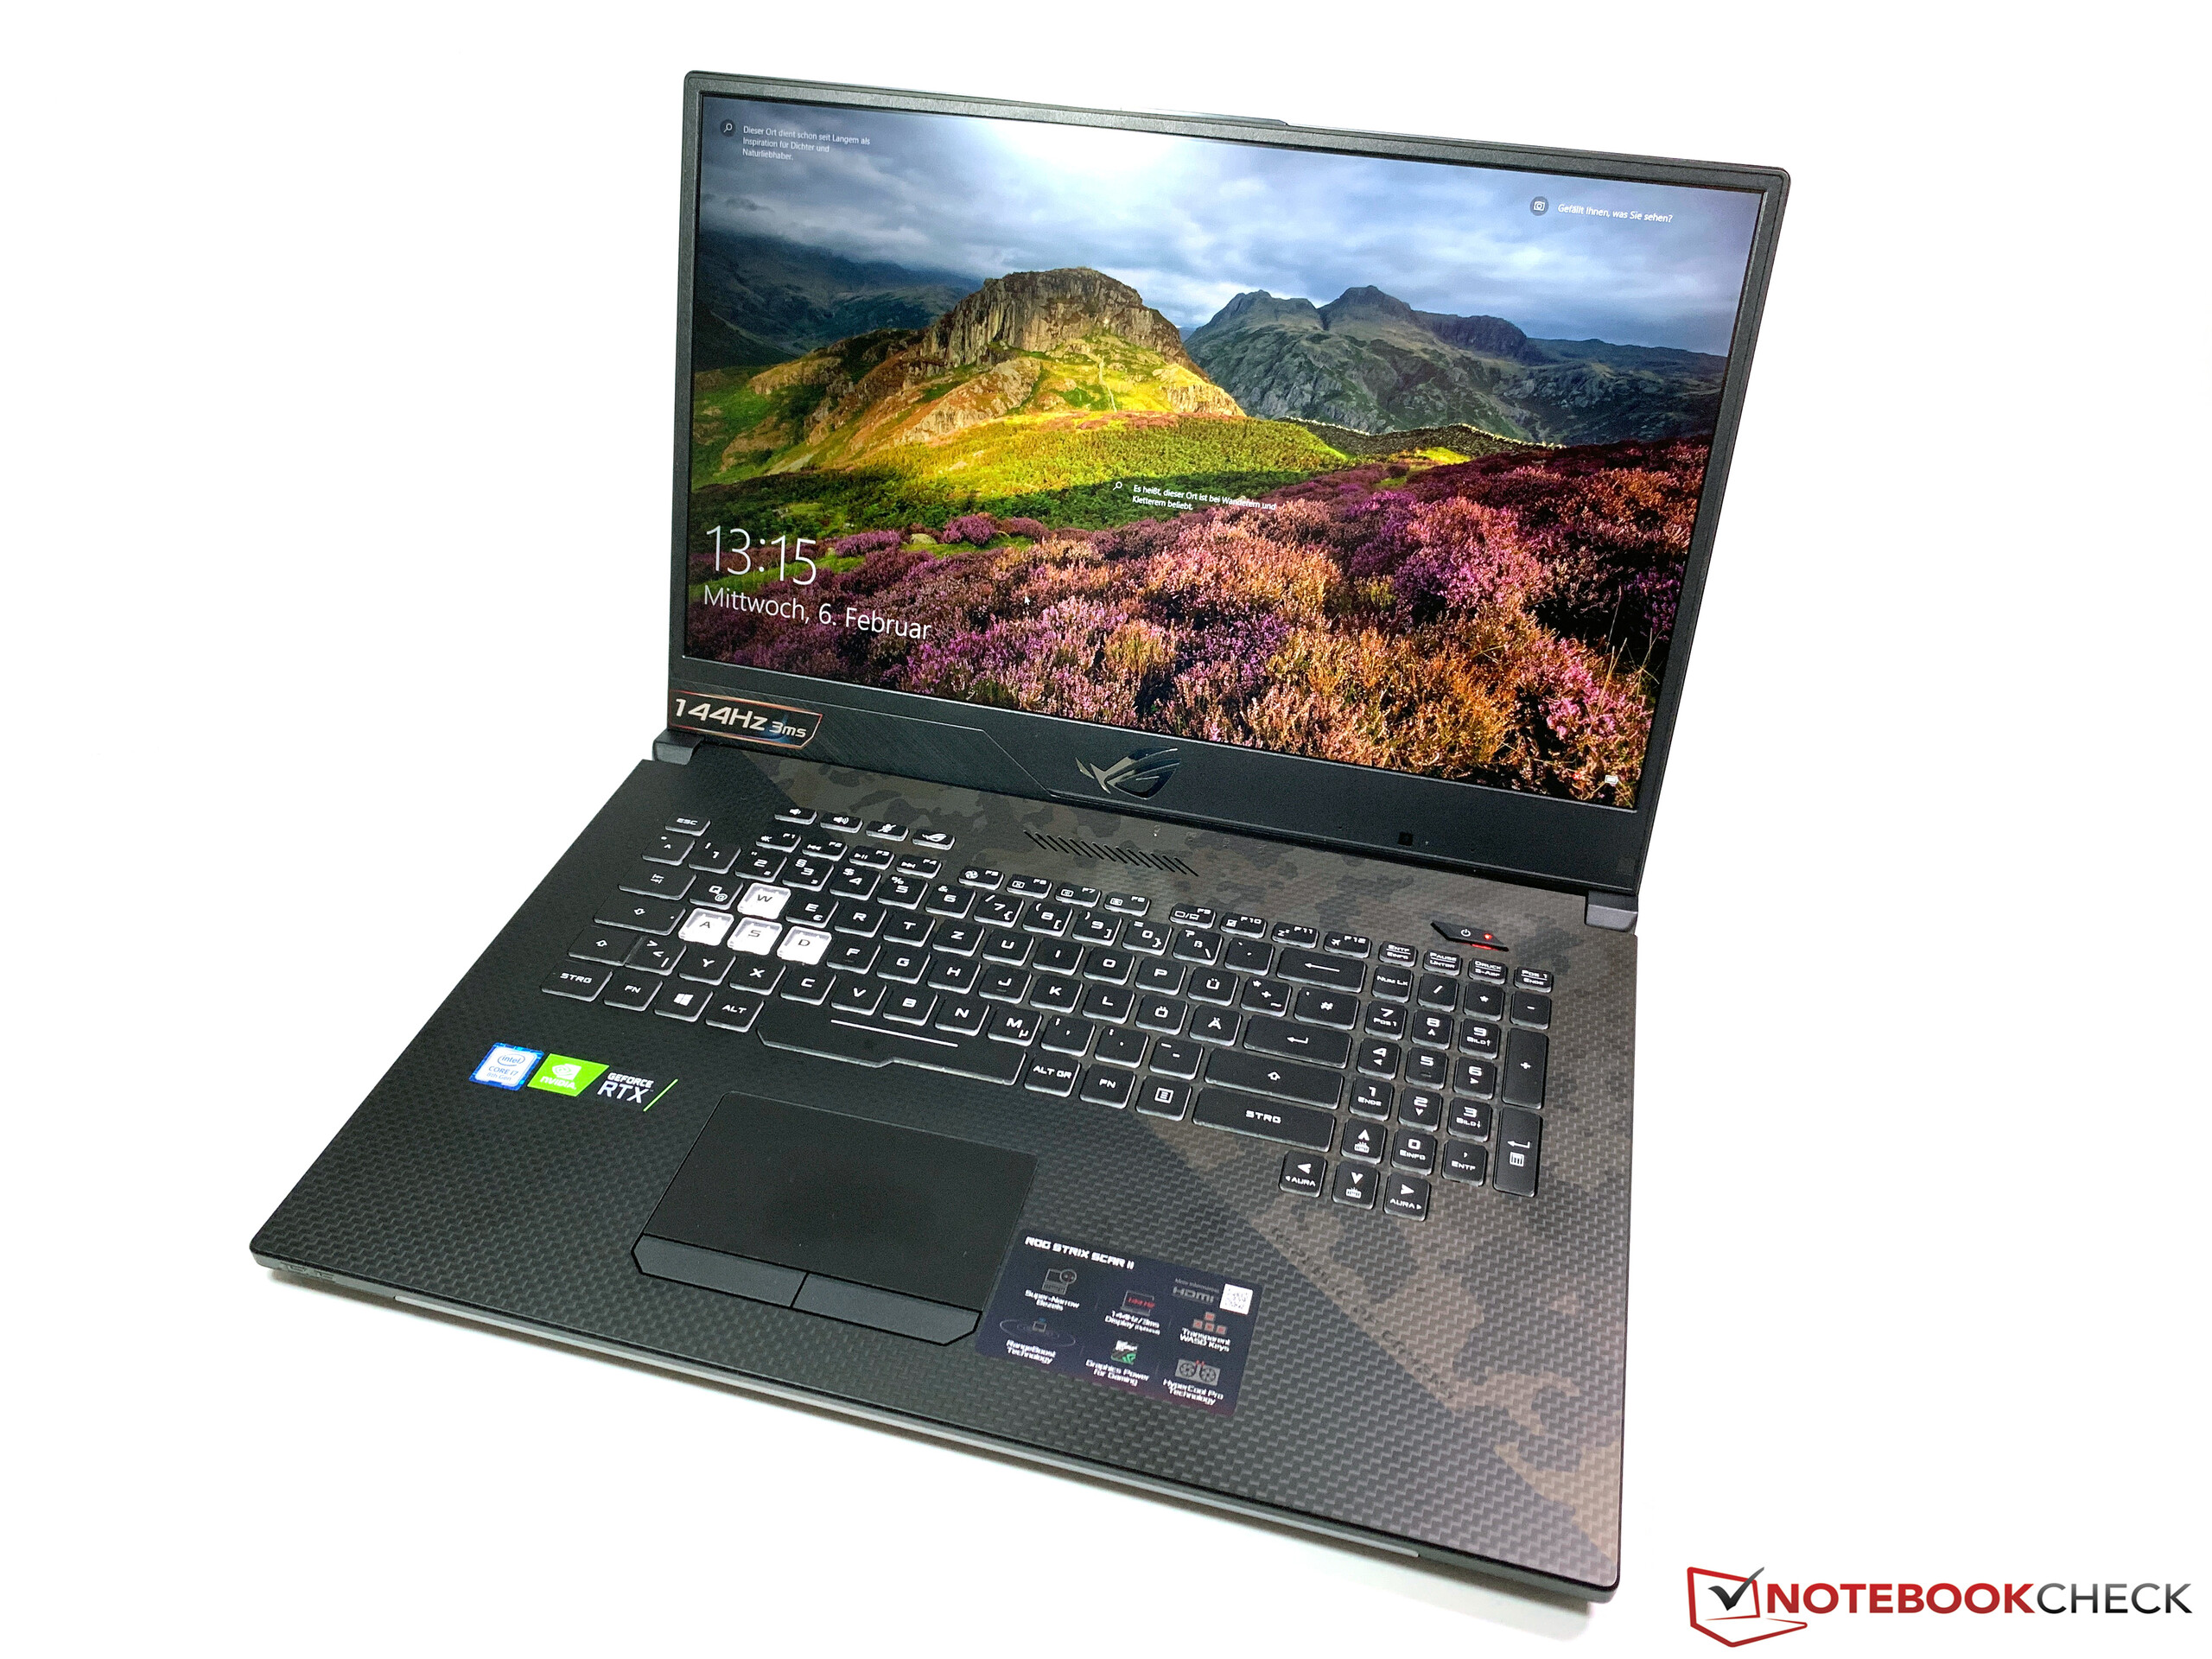
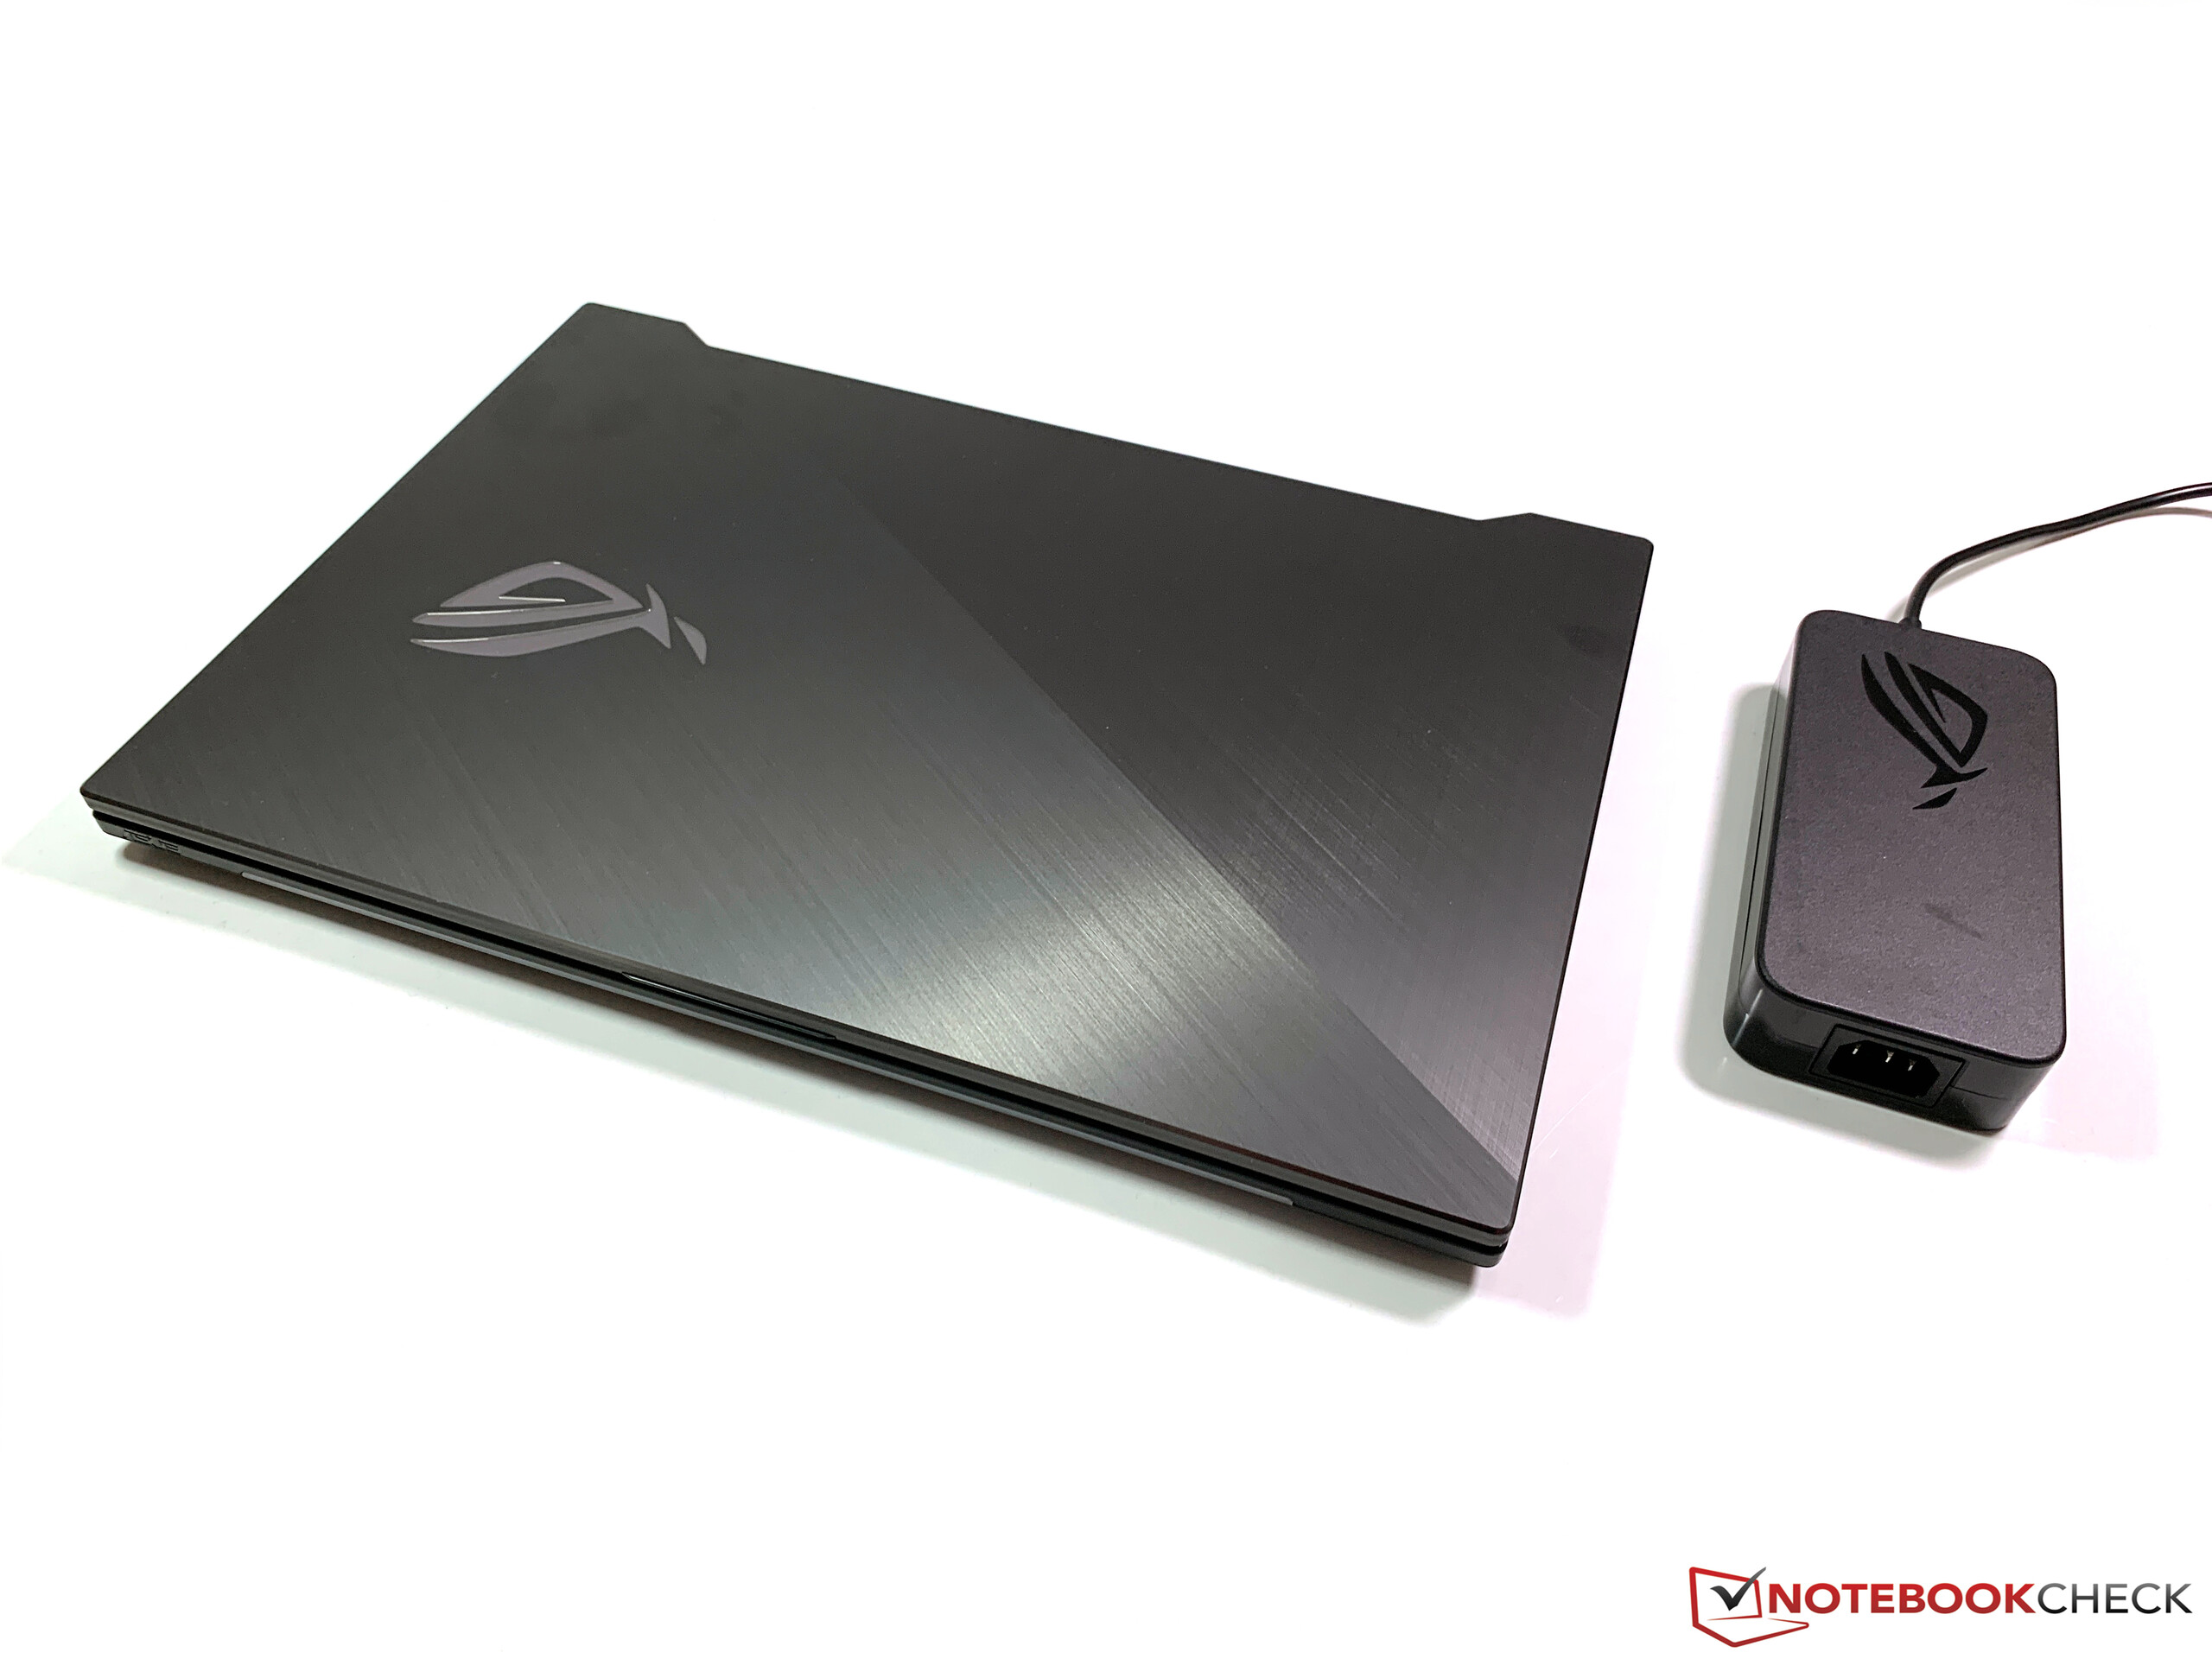
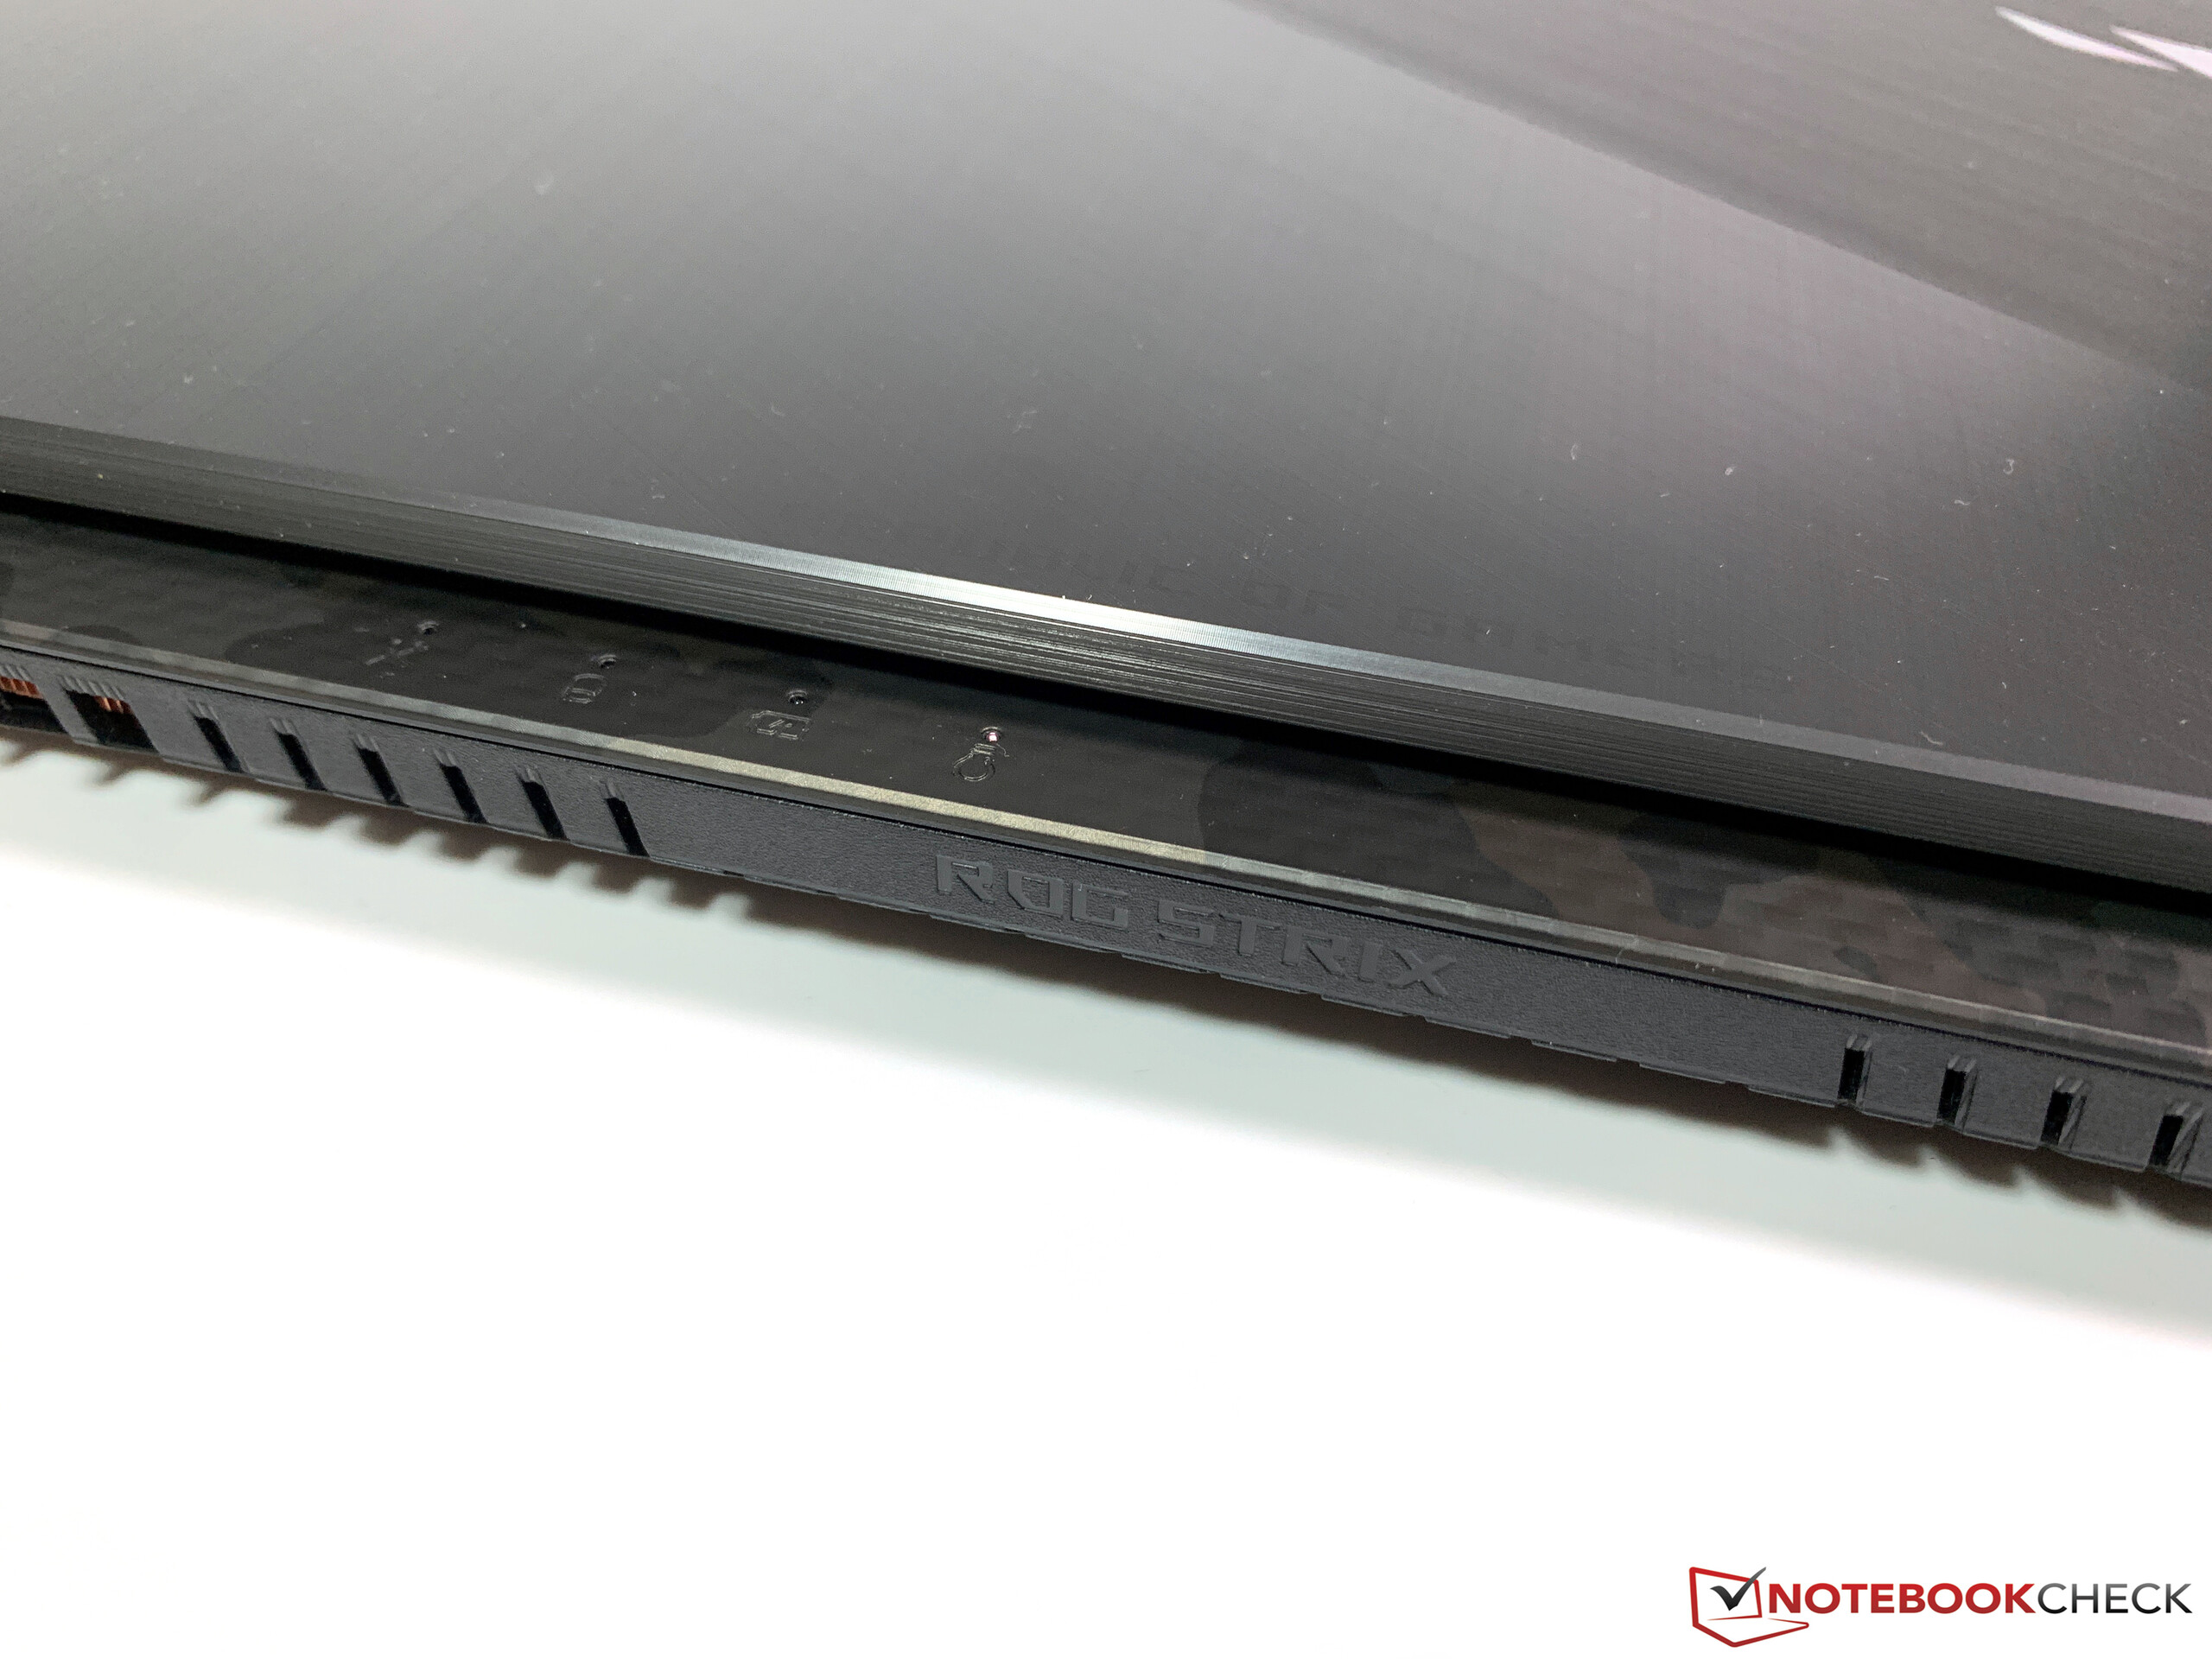
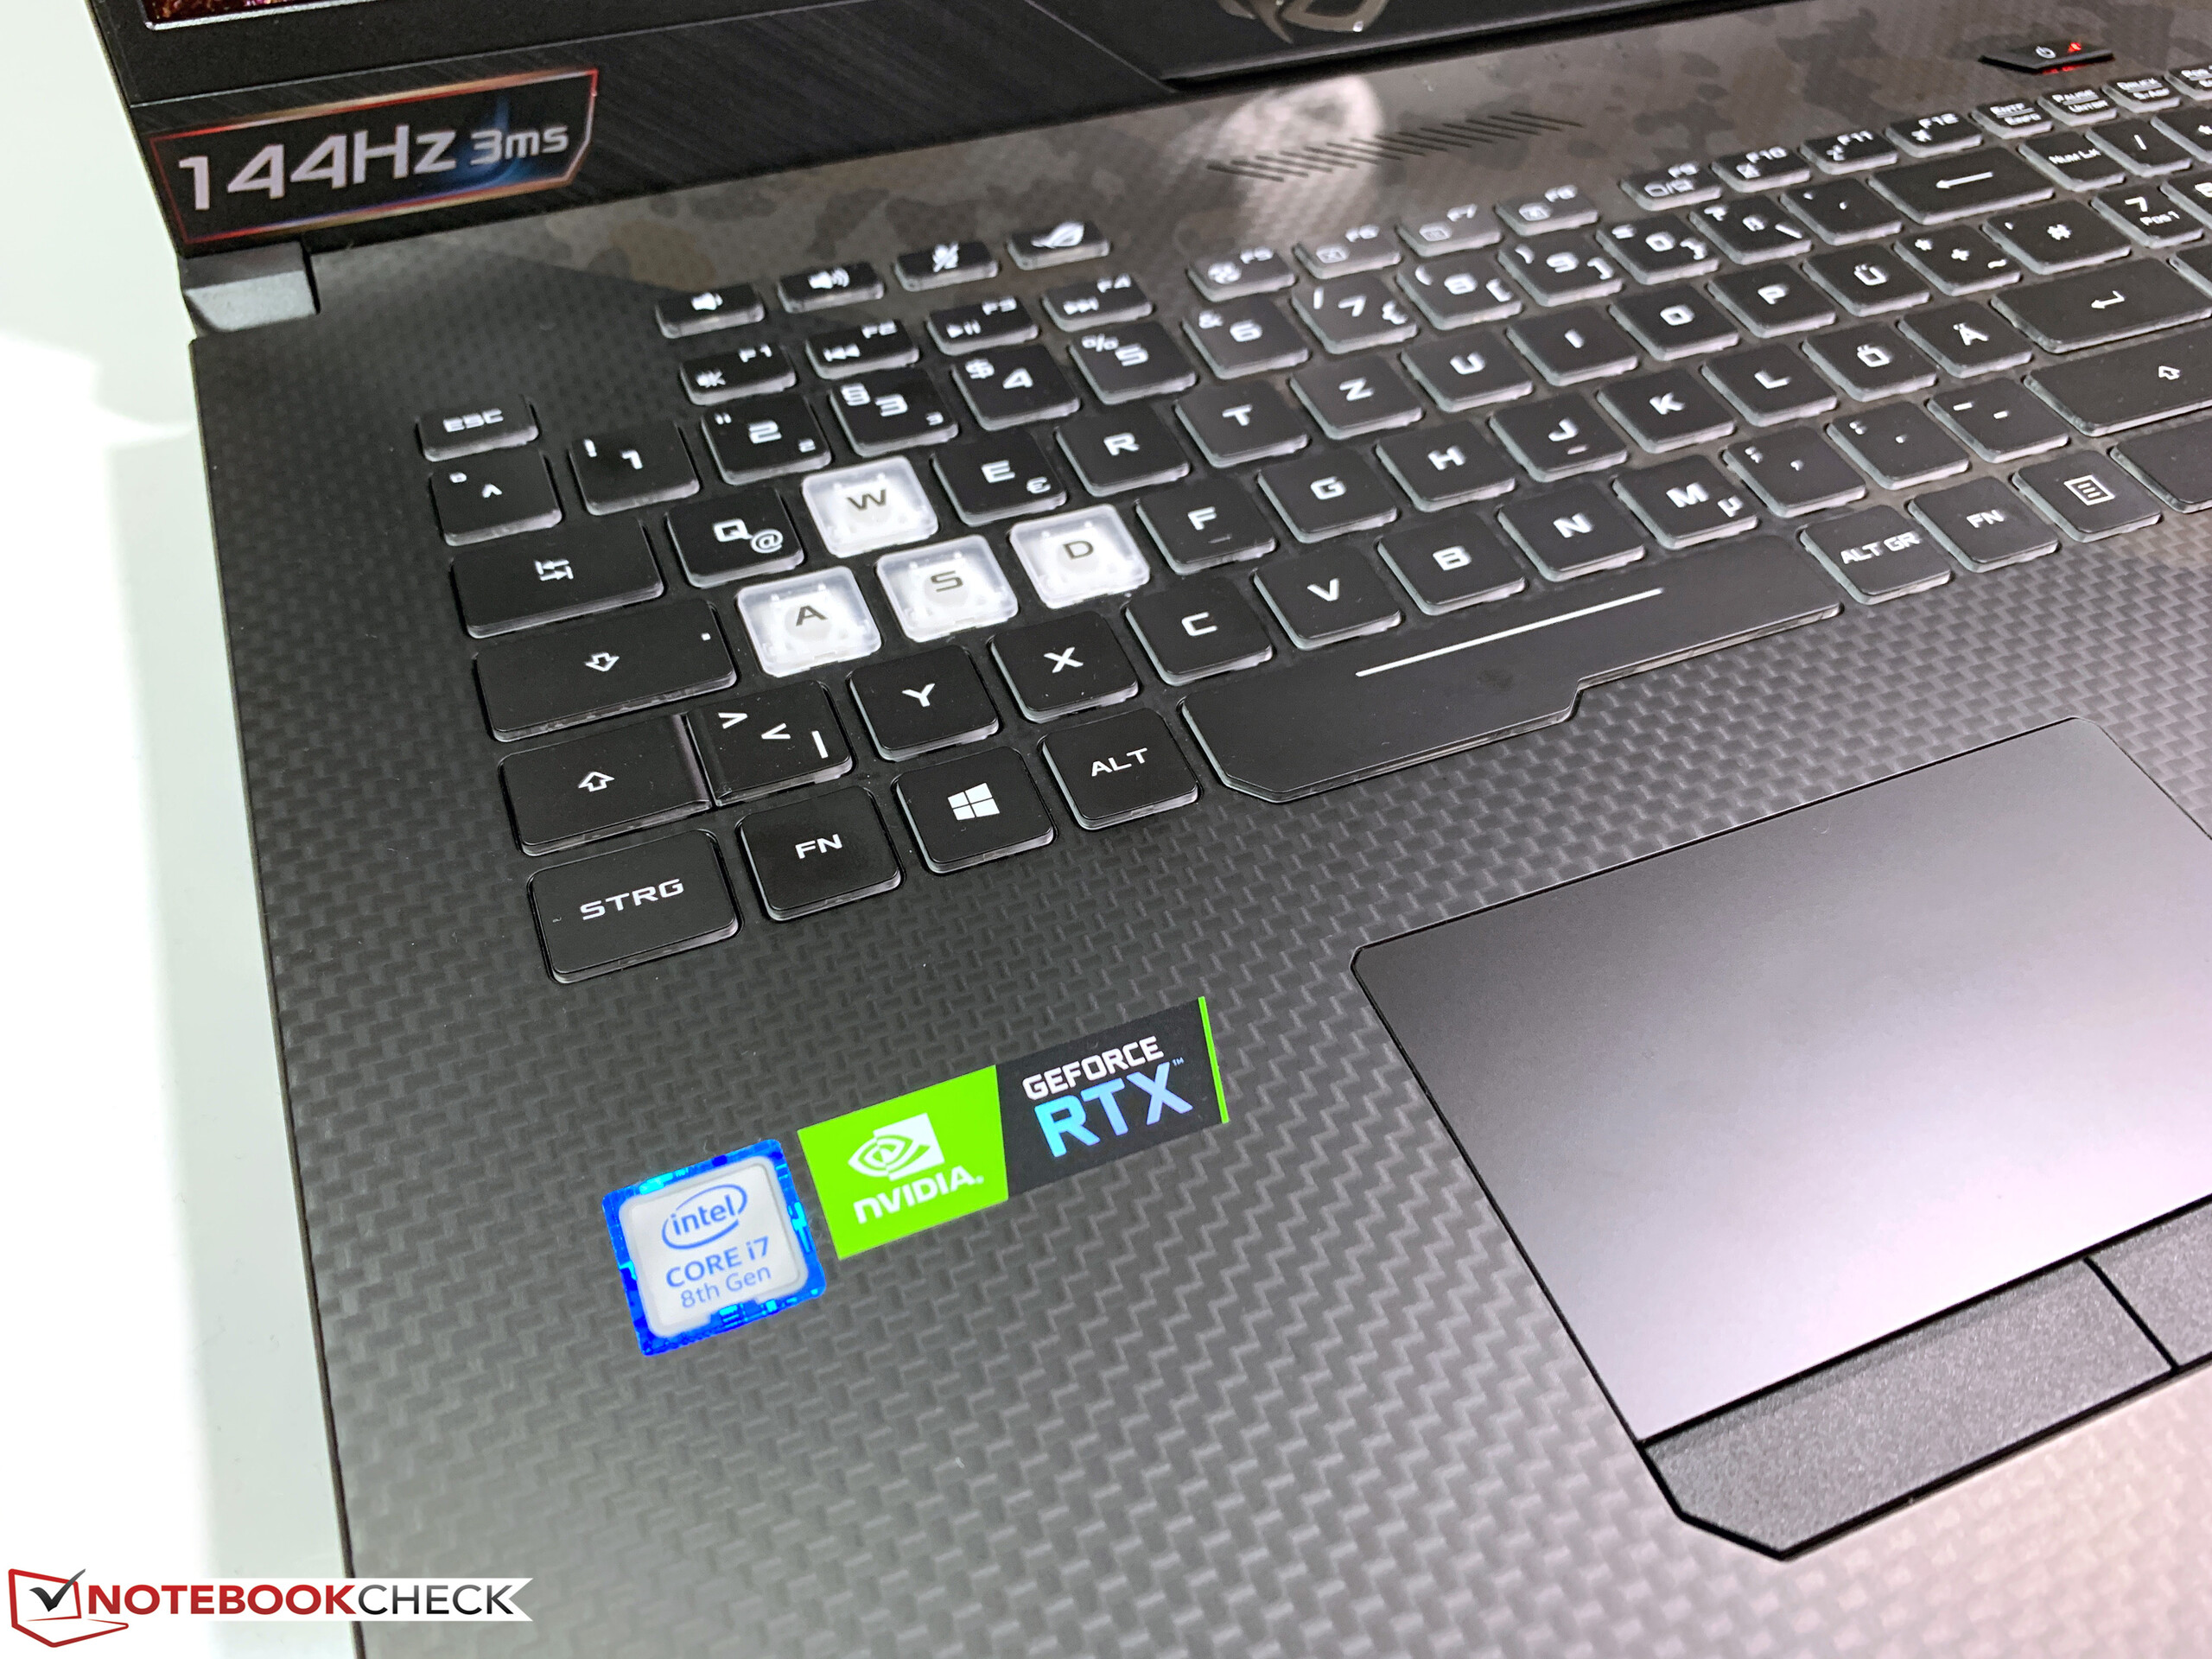
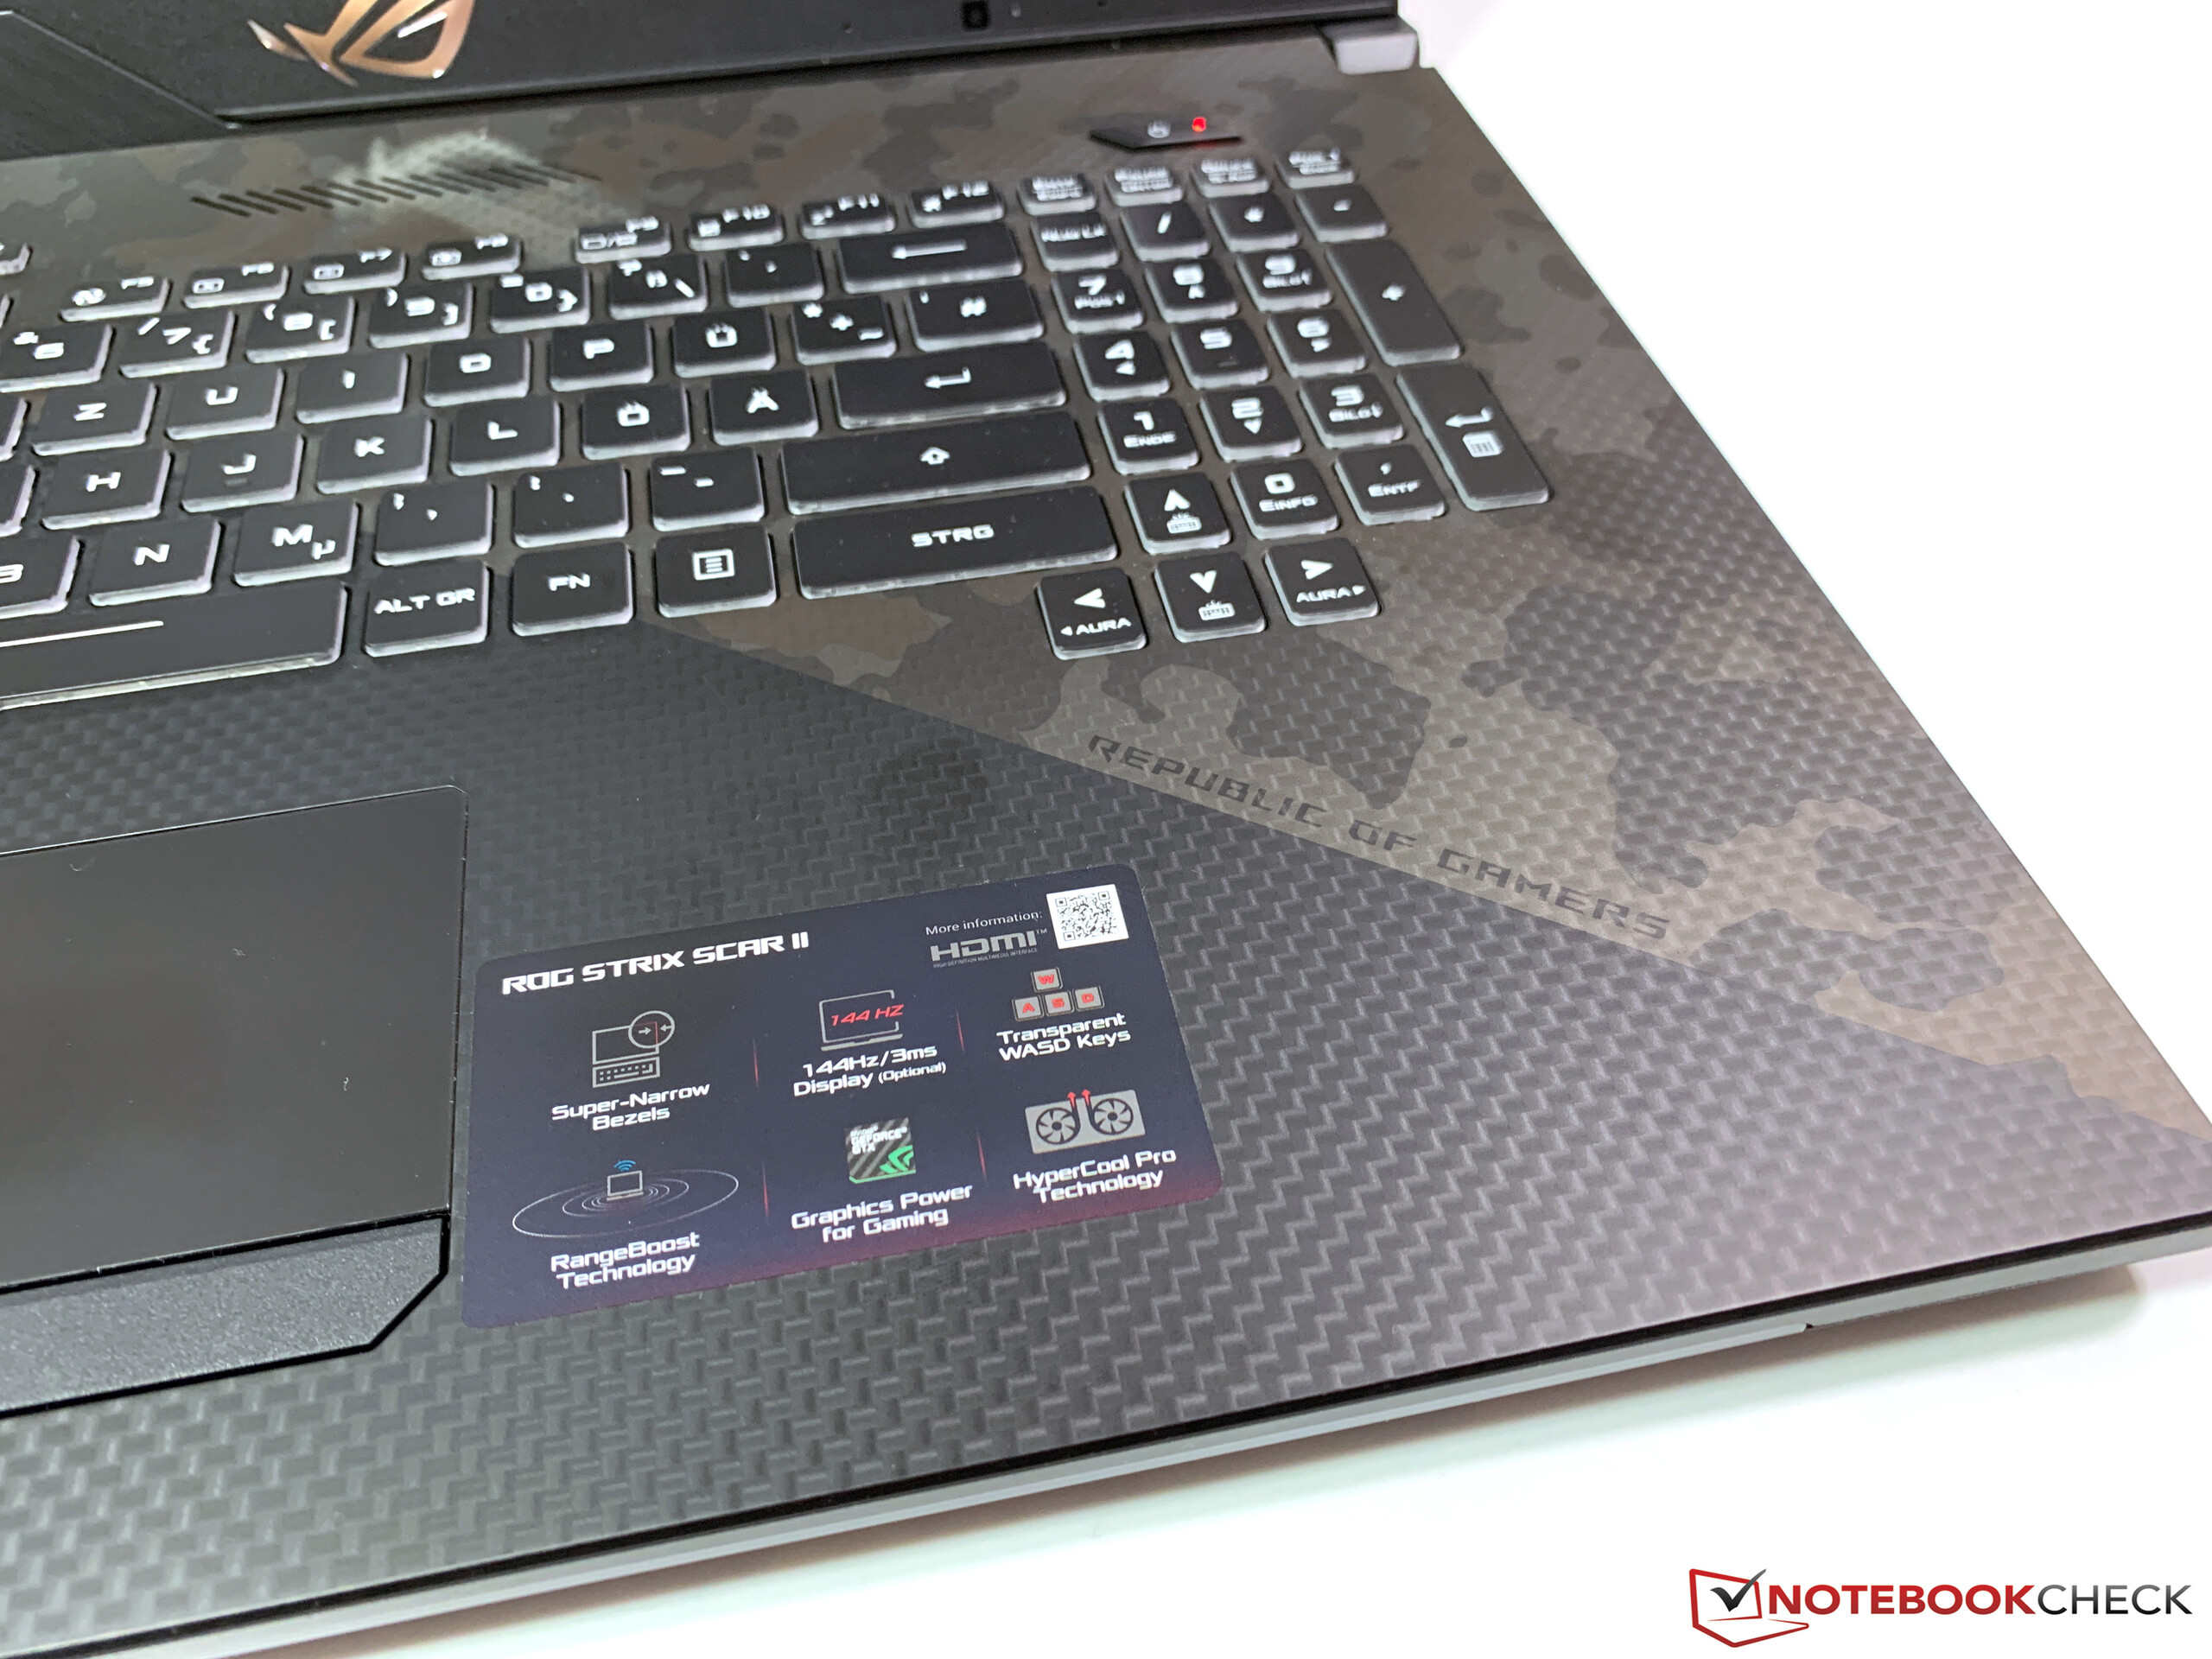
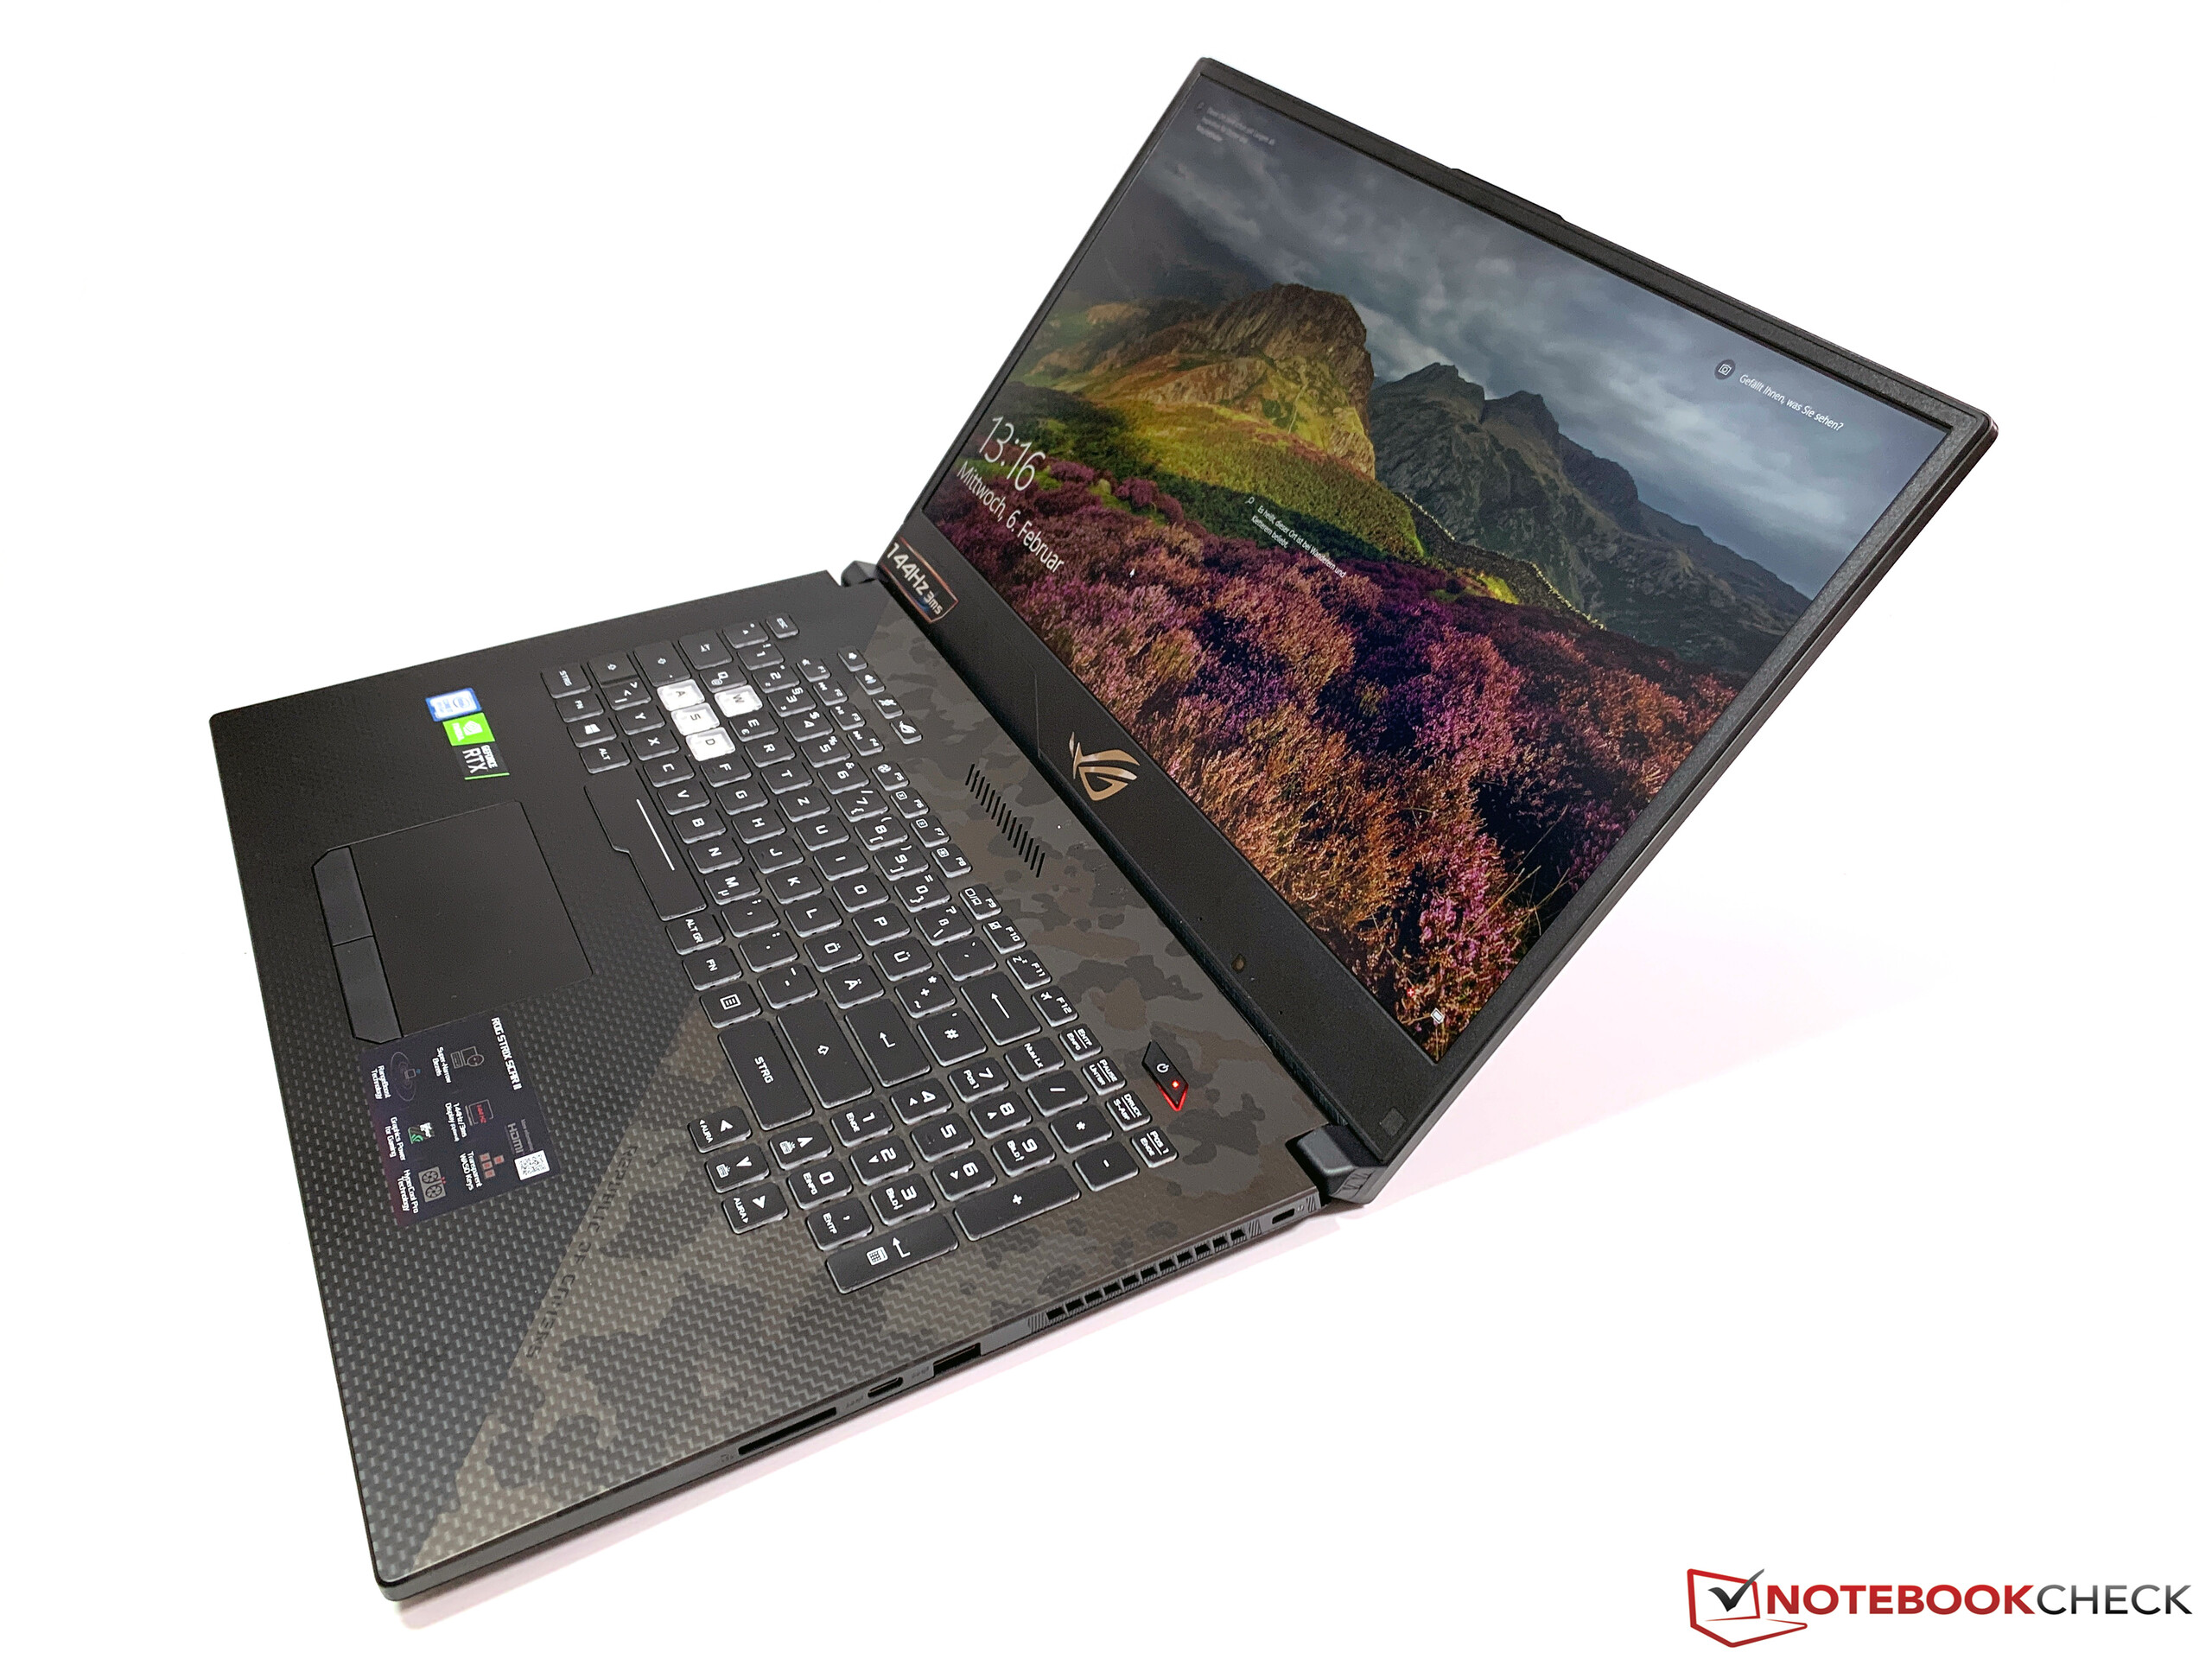
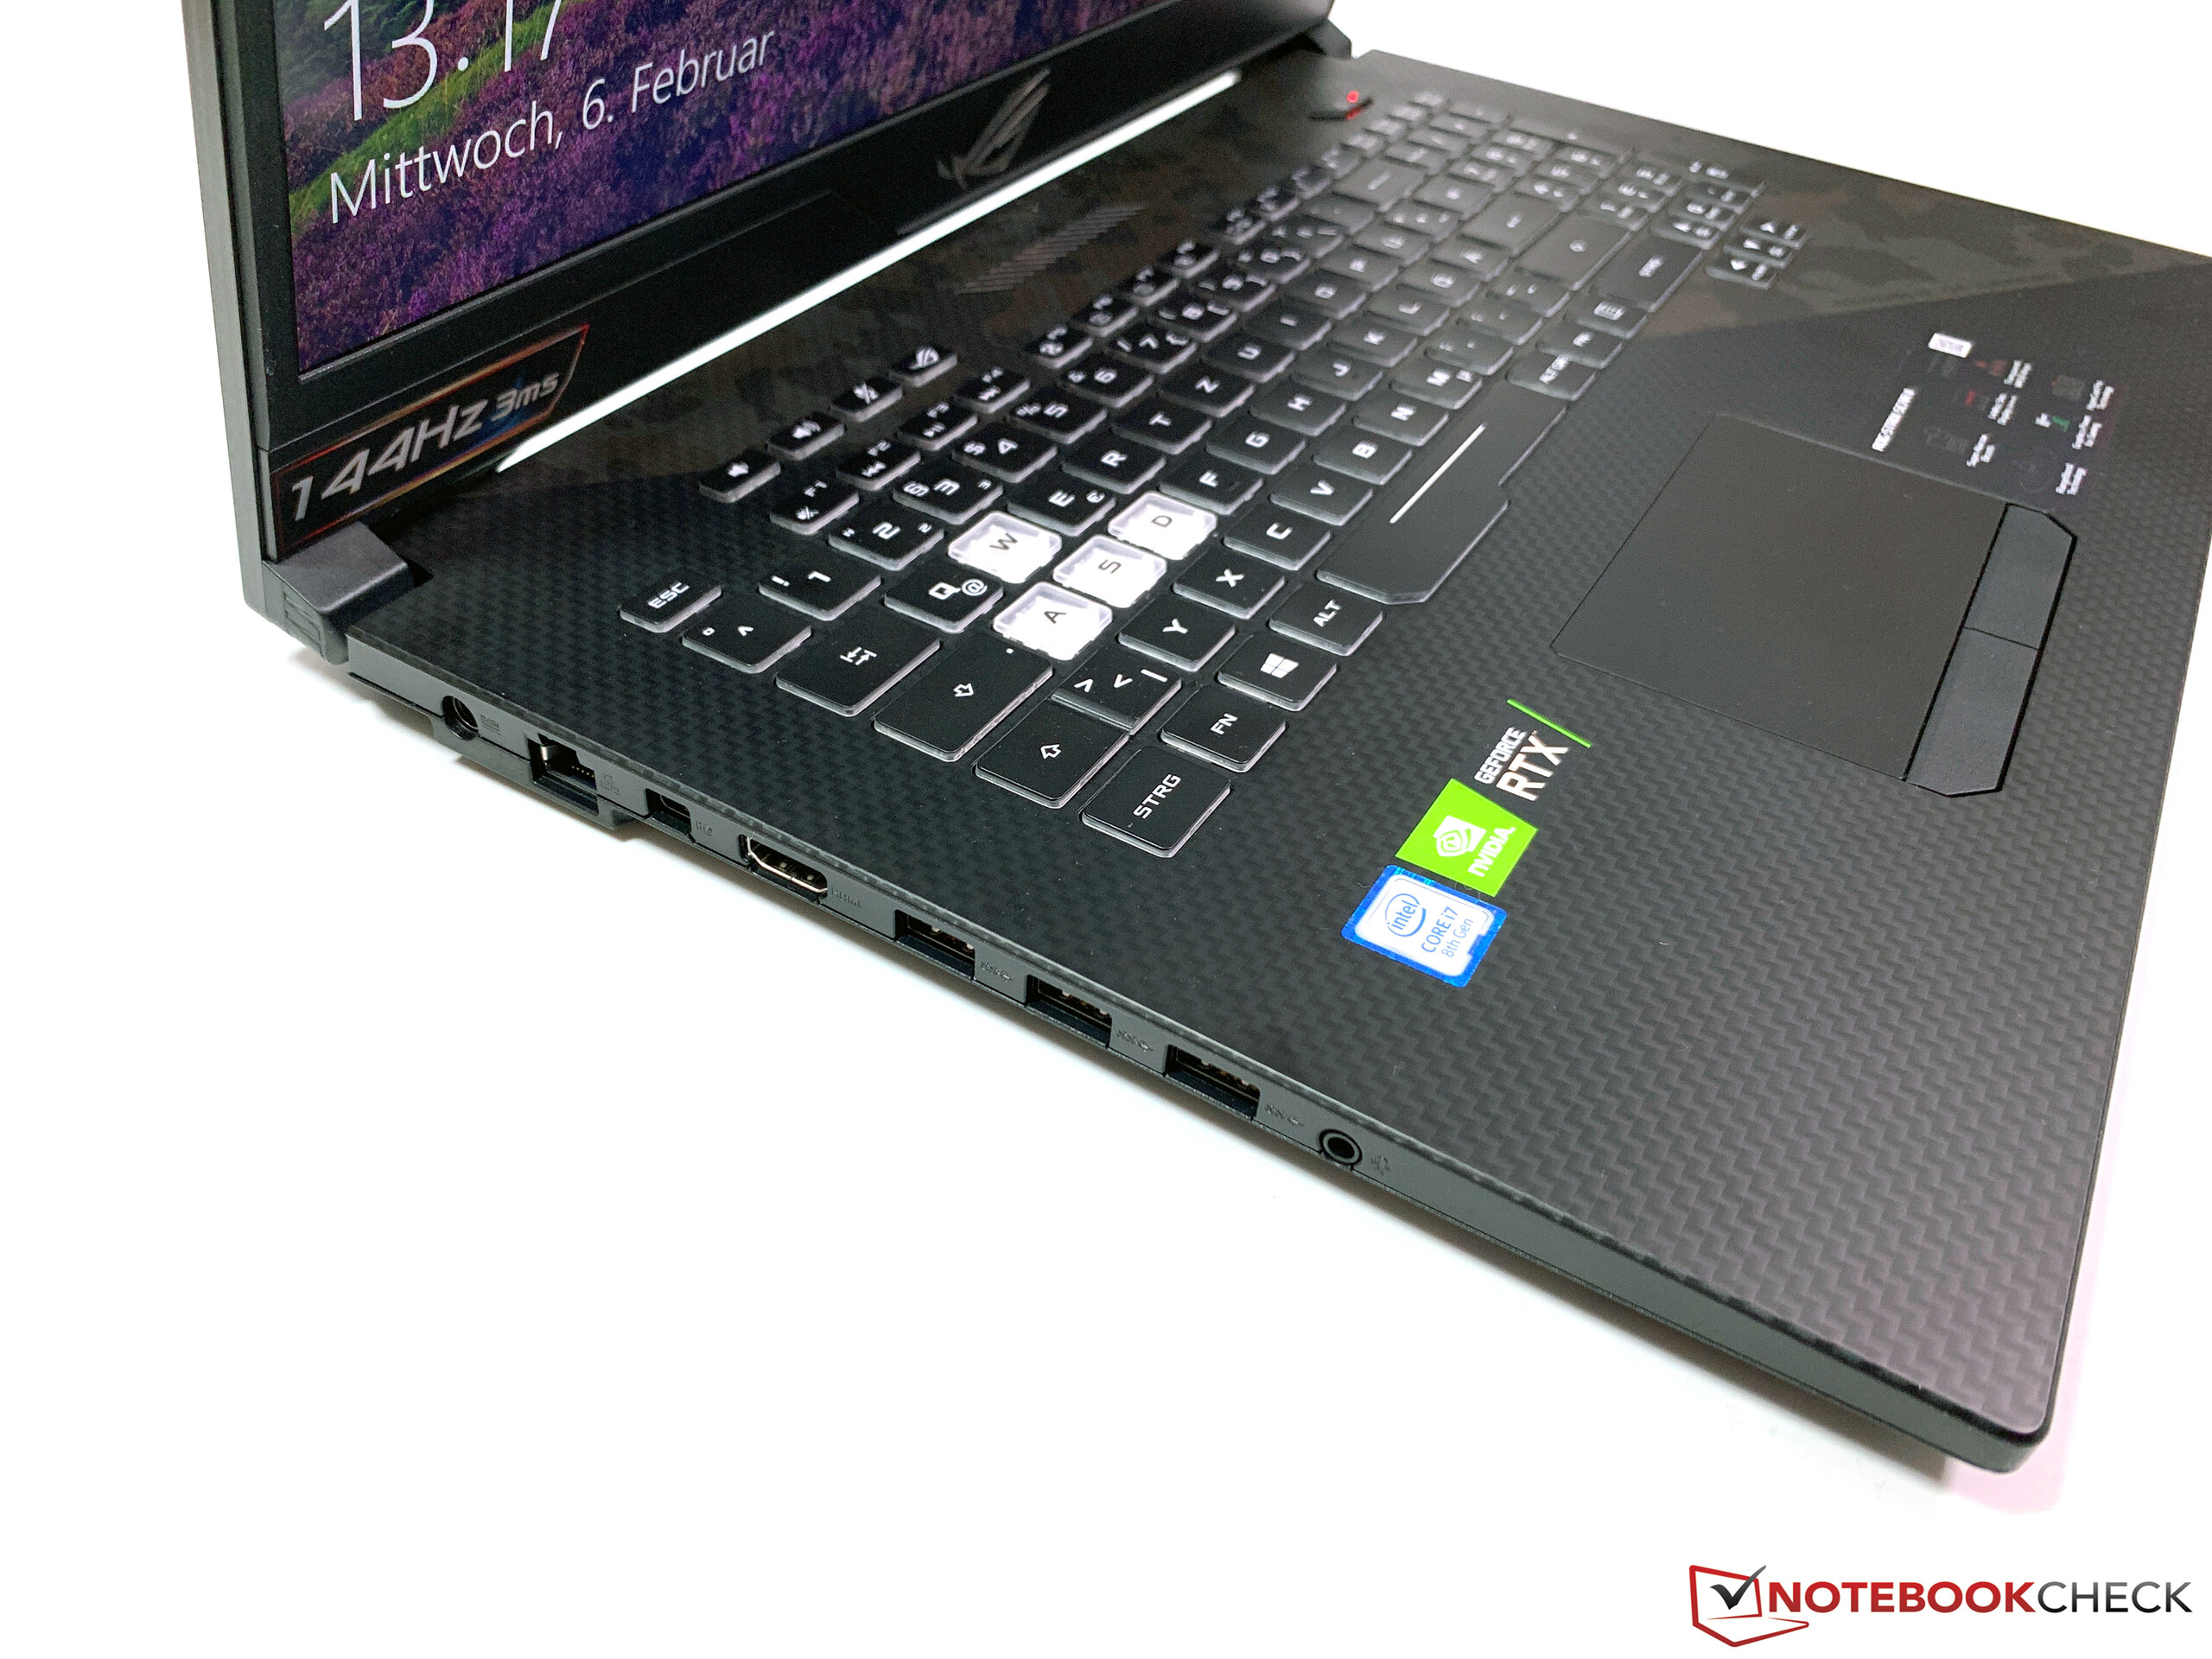
O ASUS ROG Strix Scar II GL704GW é um portátil extraordinariamente compacto e potente. Seu formato é apenas um pouco maior do que a maioria dos portáteis de jogos de 15,6 polegadas, e é notavelmente menor do que todos, exceto o MSI GS73VR 7RG de nossos dispositivos de comparação. É ainda mais impressionante que a ASUS também tenha inserido uma GPU GeForce RTX 2070 e não a versão Max-Q.
Nossa unidade de teste obteve excelentes resultados em nossos testes e consegue rodar todos os jogos triple-A modernos em 1080p com gráficos máximos. As únicas desvantagens são que o dispositivo funciona quente e barulhento, tanto que os ventiladores abafam os alto-falantes durante os jogos. O GL704GW também limita drasticamente a bateria, mas isso é uma queixa menor, já que a bateria dura apenas cerca de uma hora sob carga contínua. É uma pena que os ventiladores sejam tão barulhentos, dado que a ASUS equipou o GL704GW com alto-falantes decentes.
As vezes menos é mais. O ASUS ROG Strix Cicatriz II GL704GW é um impressionante portátil para jogos de 17,3 polegadas, mas a versão RTX 2070 funciona tão quente e barulhento que você pode estar melhor com o modelo RTX 2060.
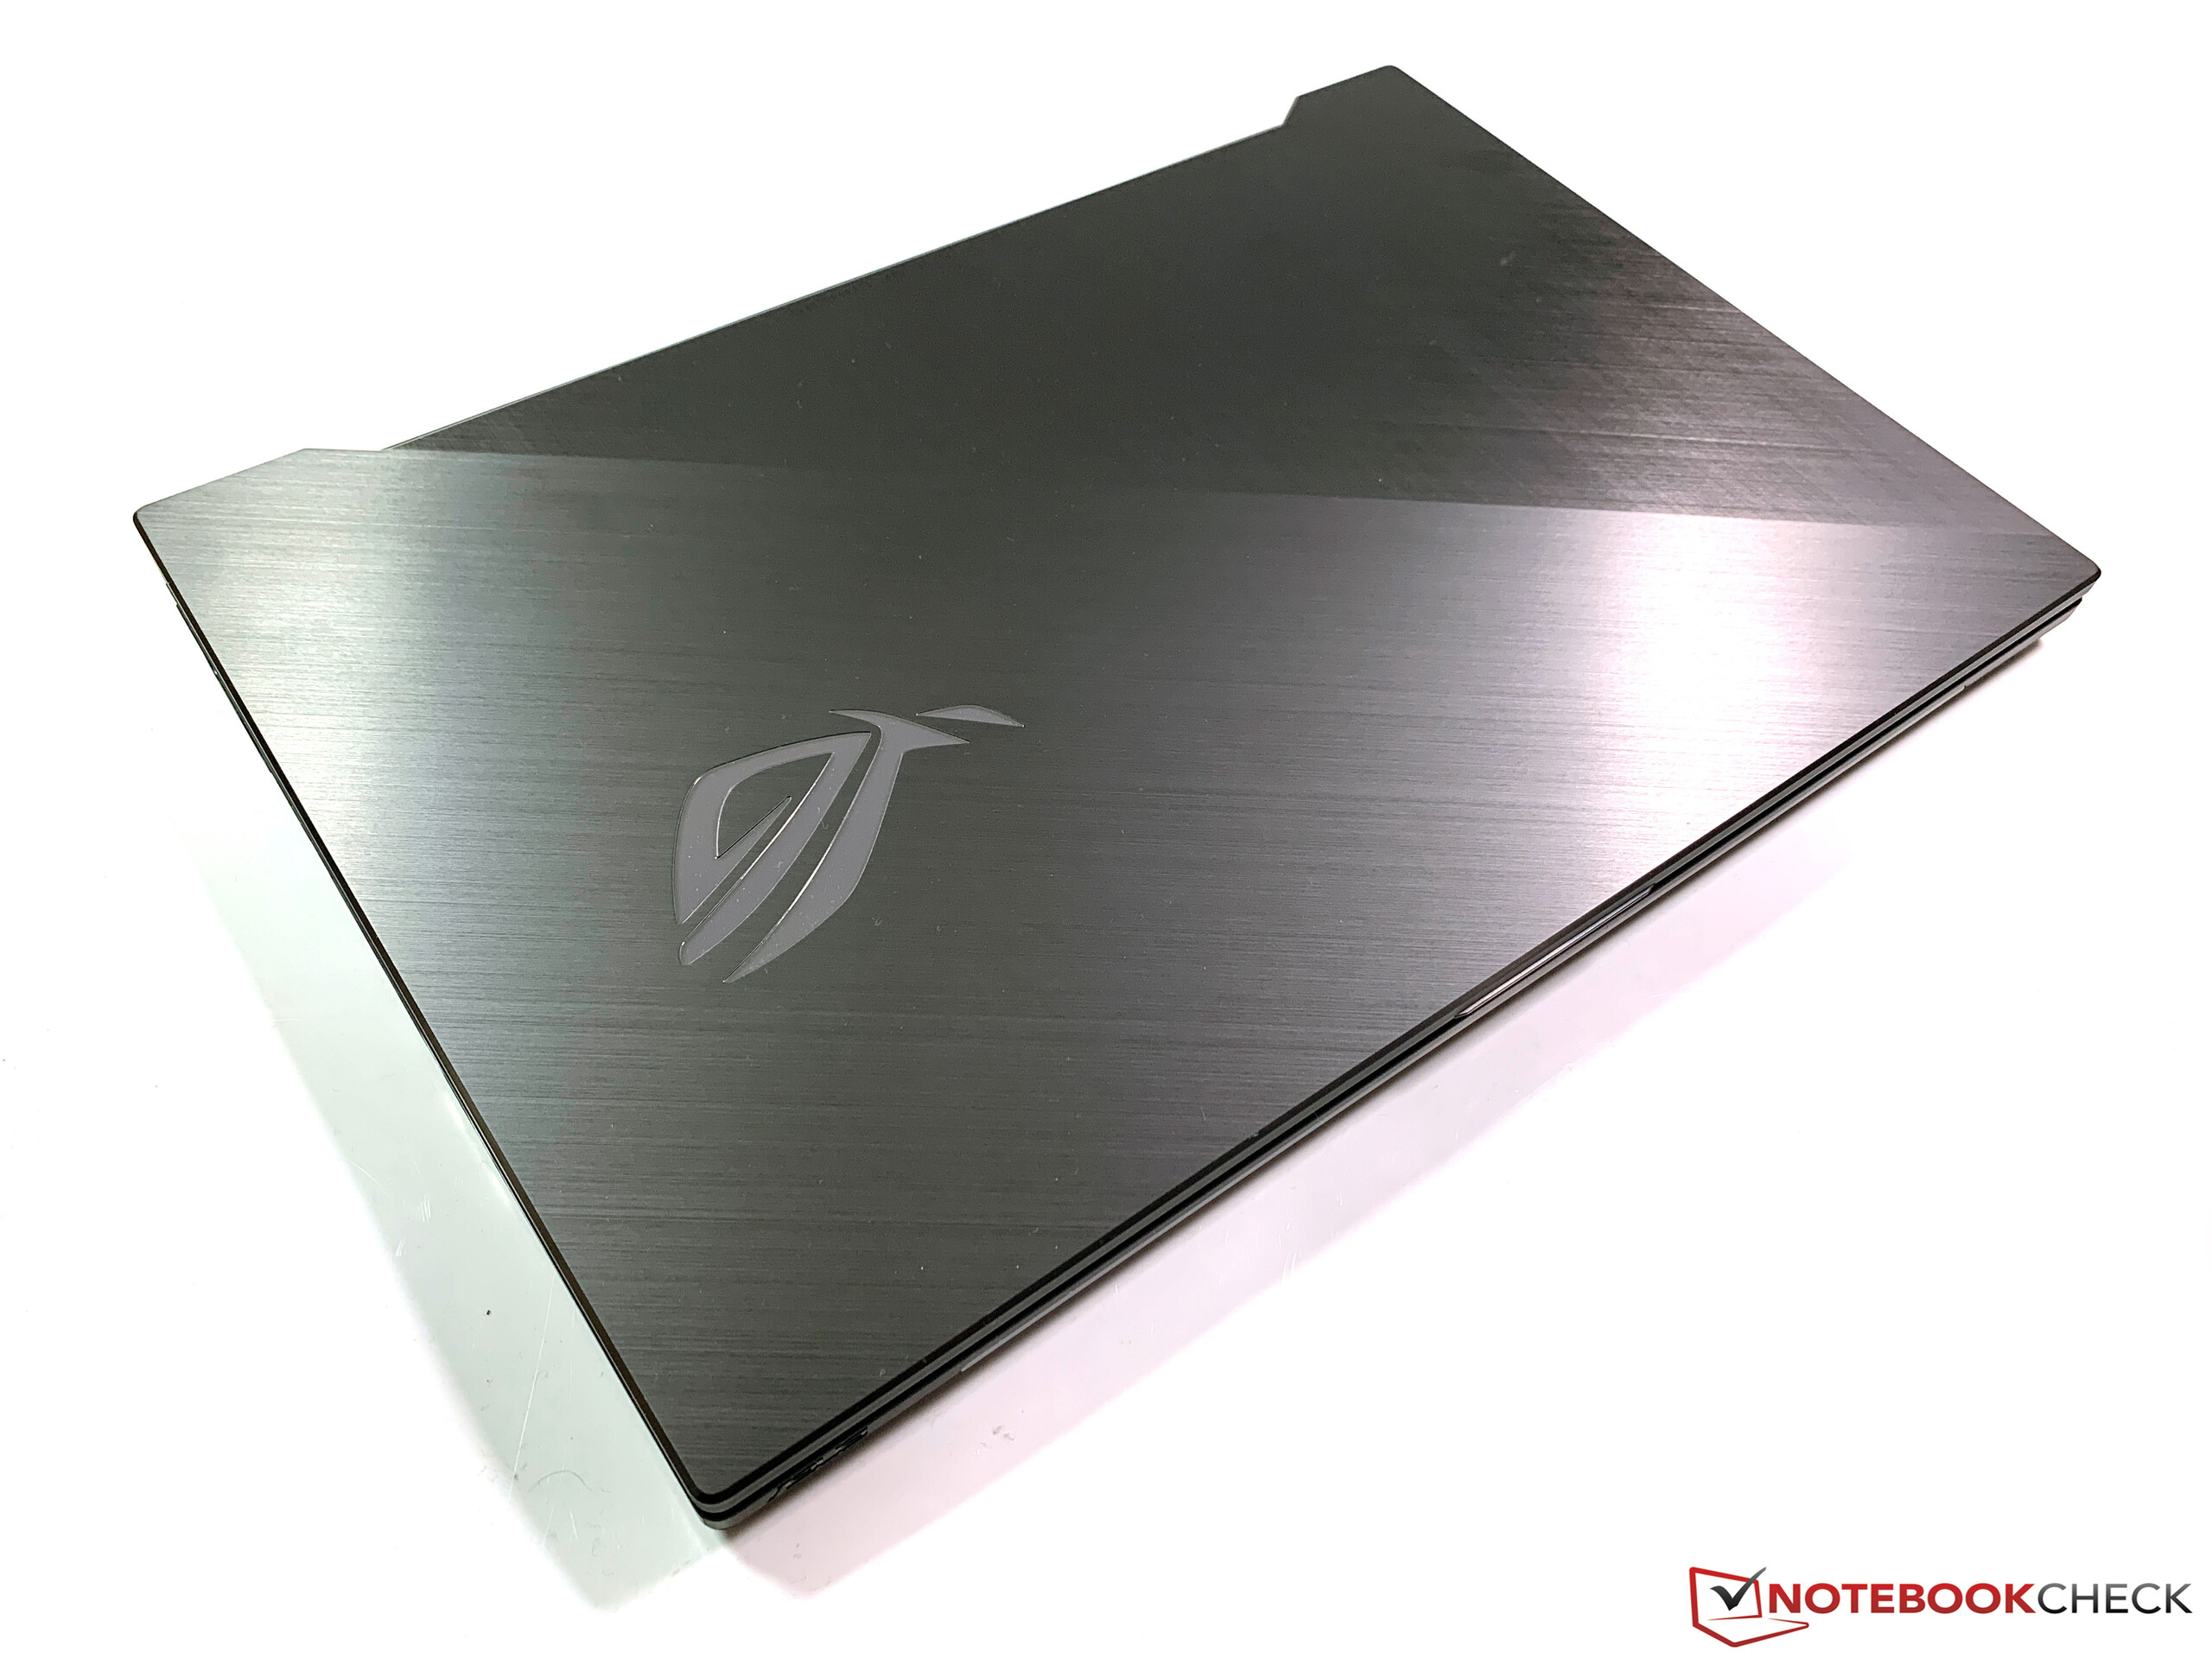
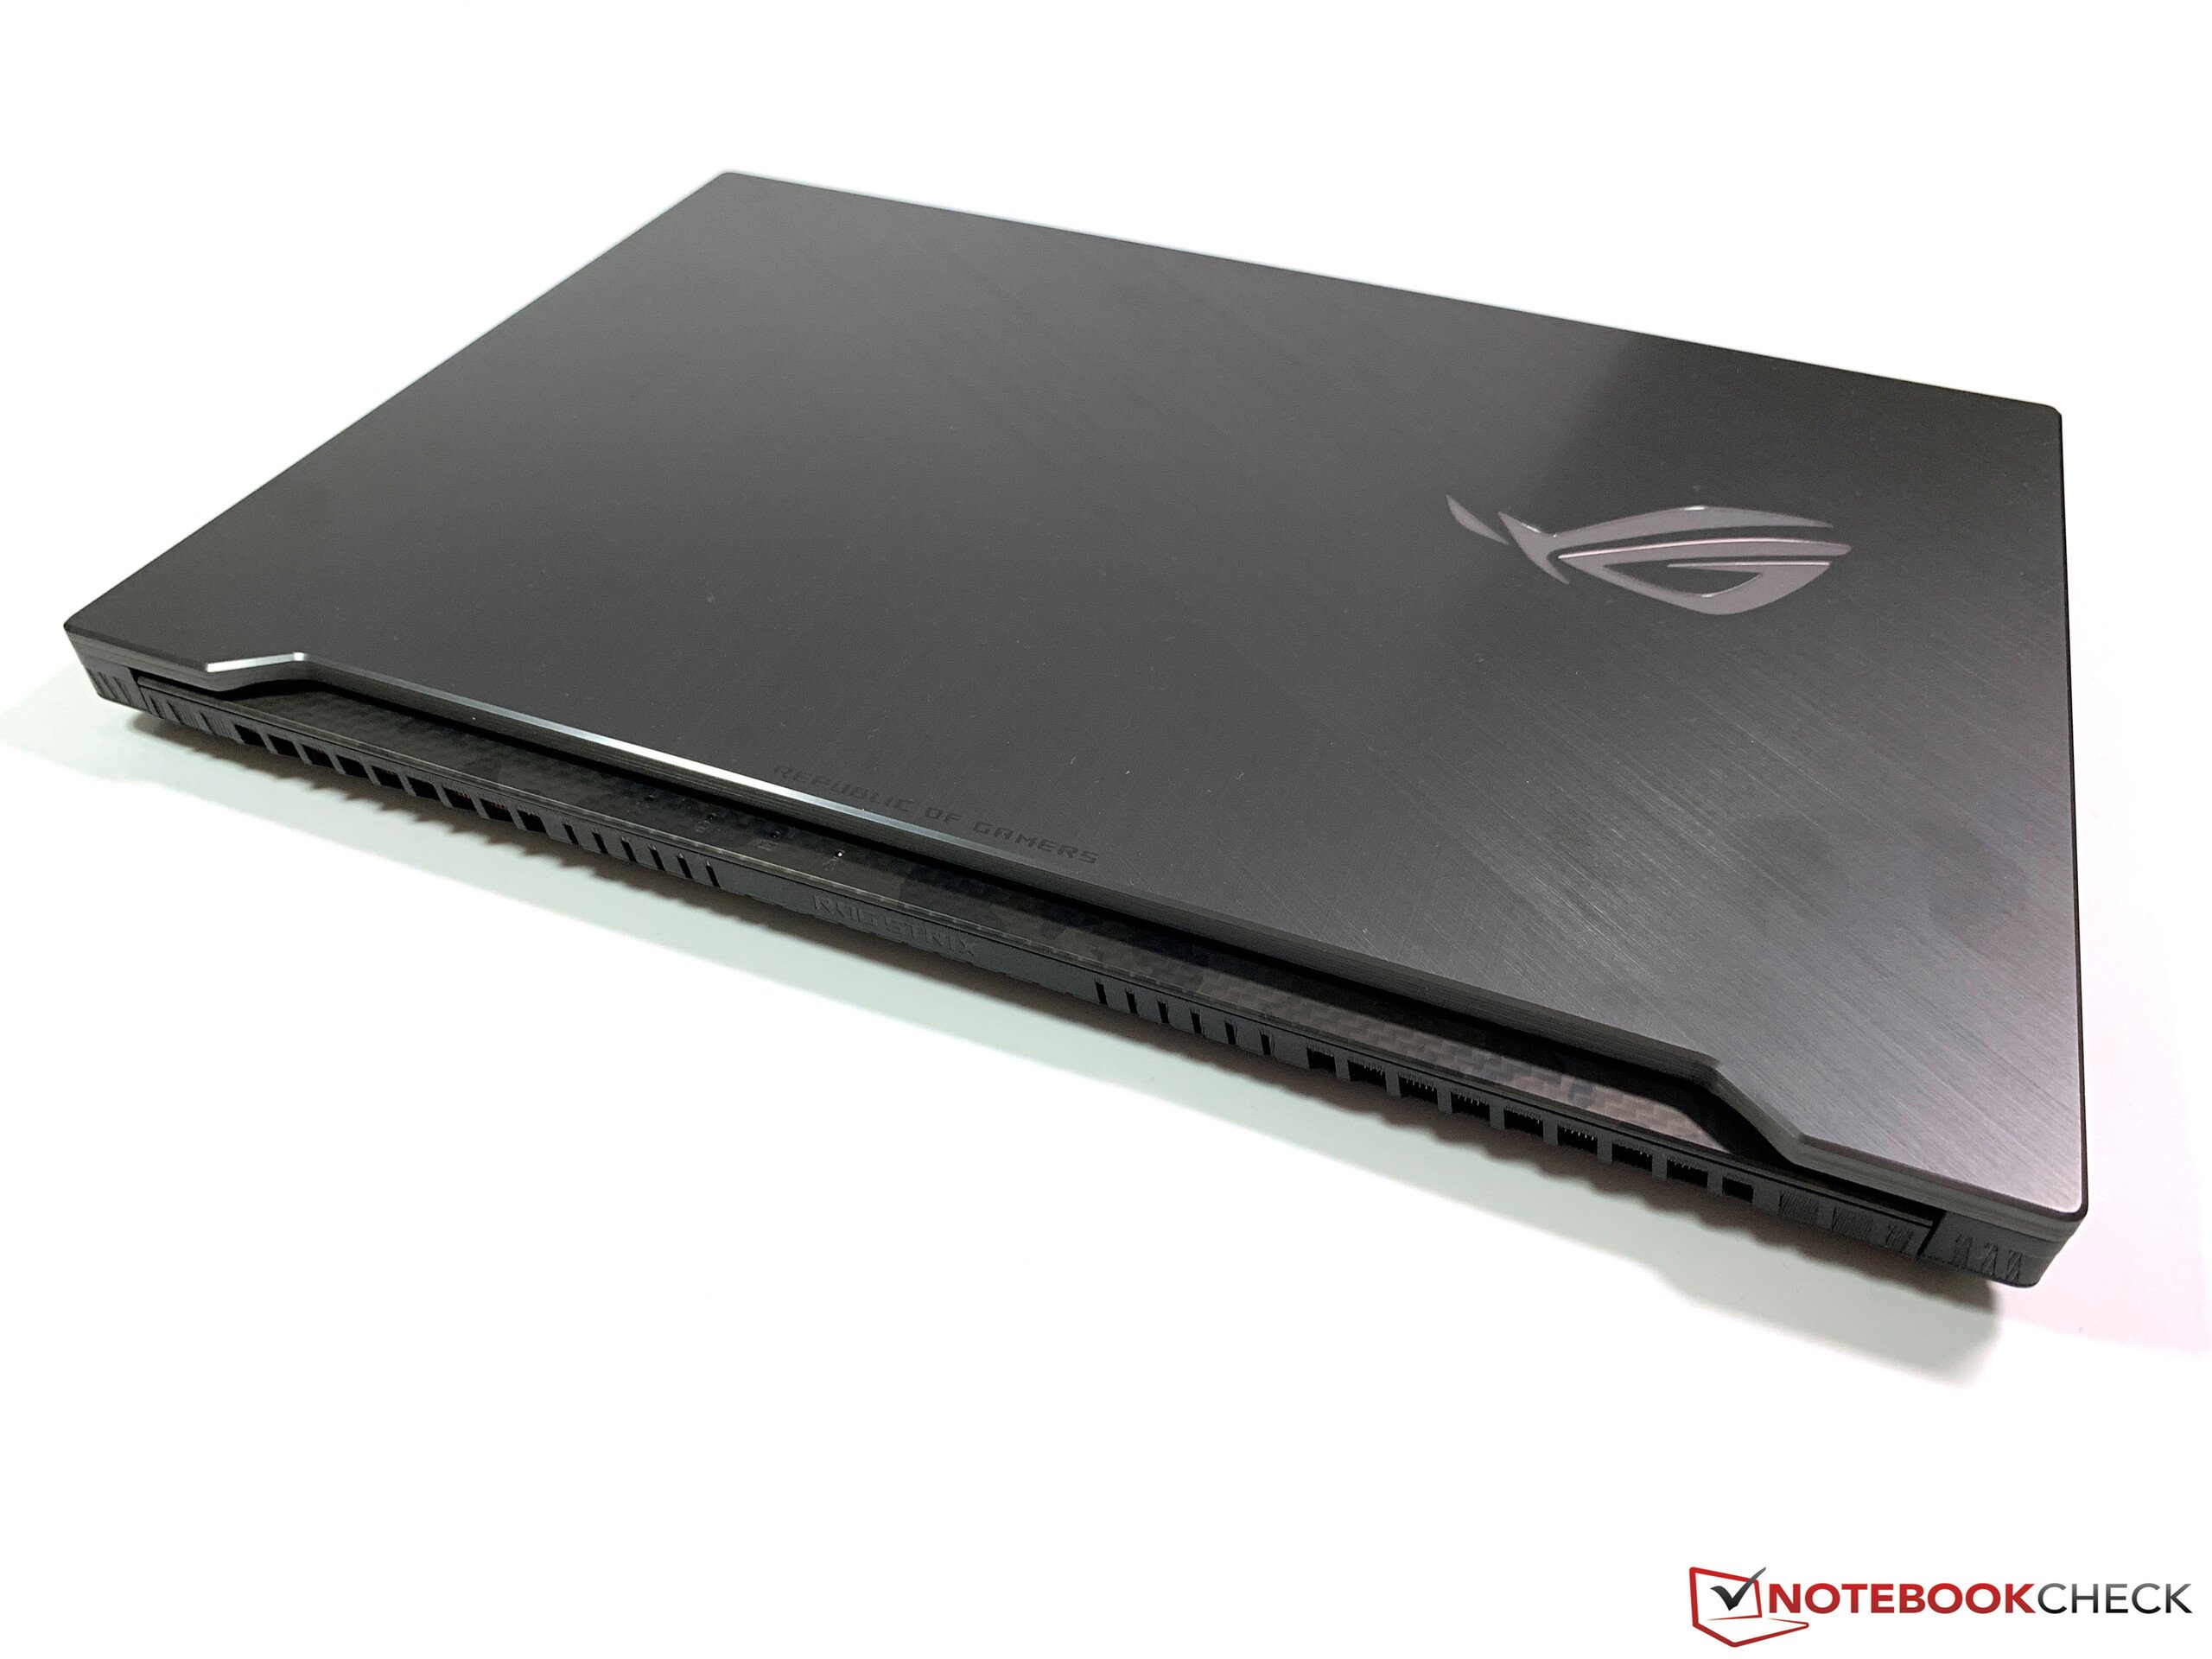
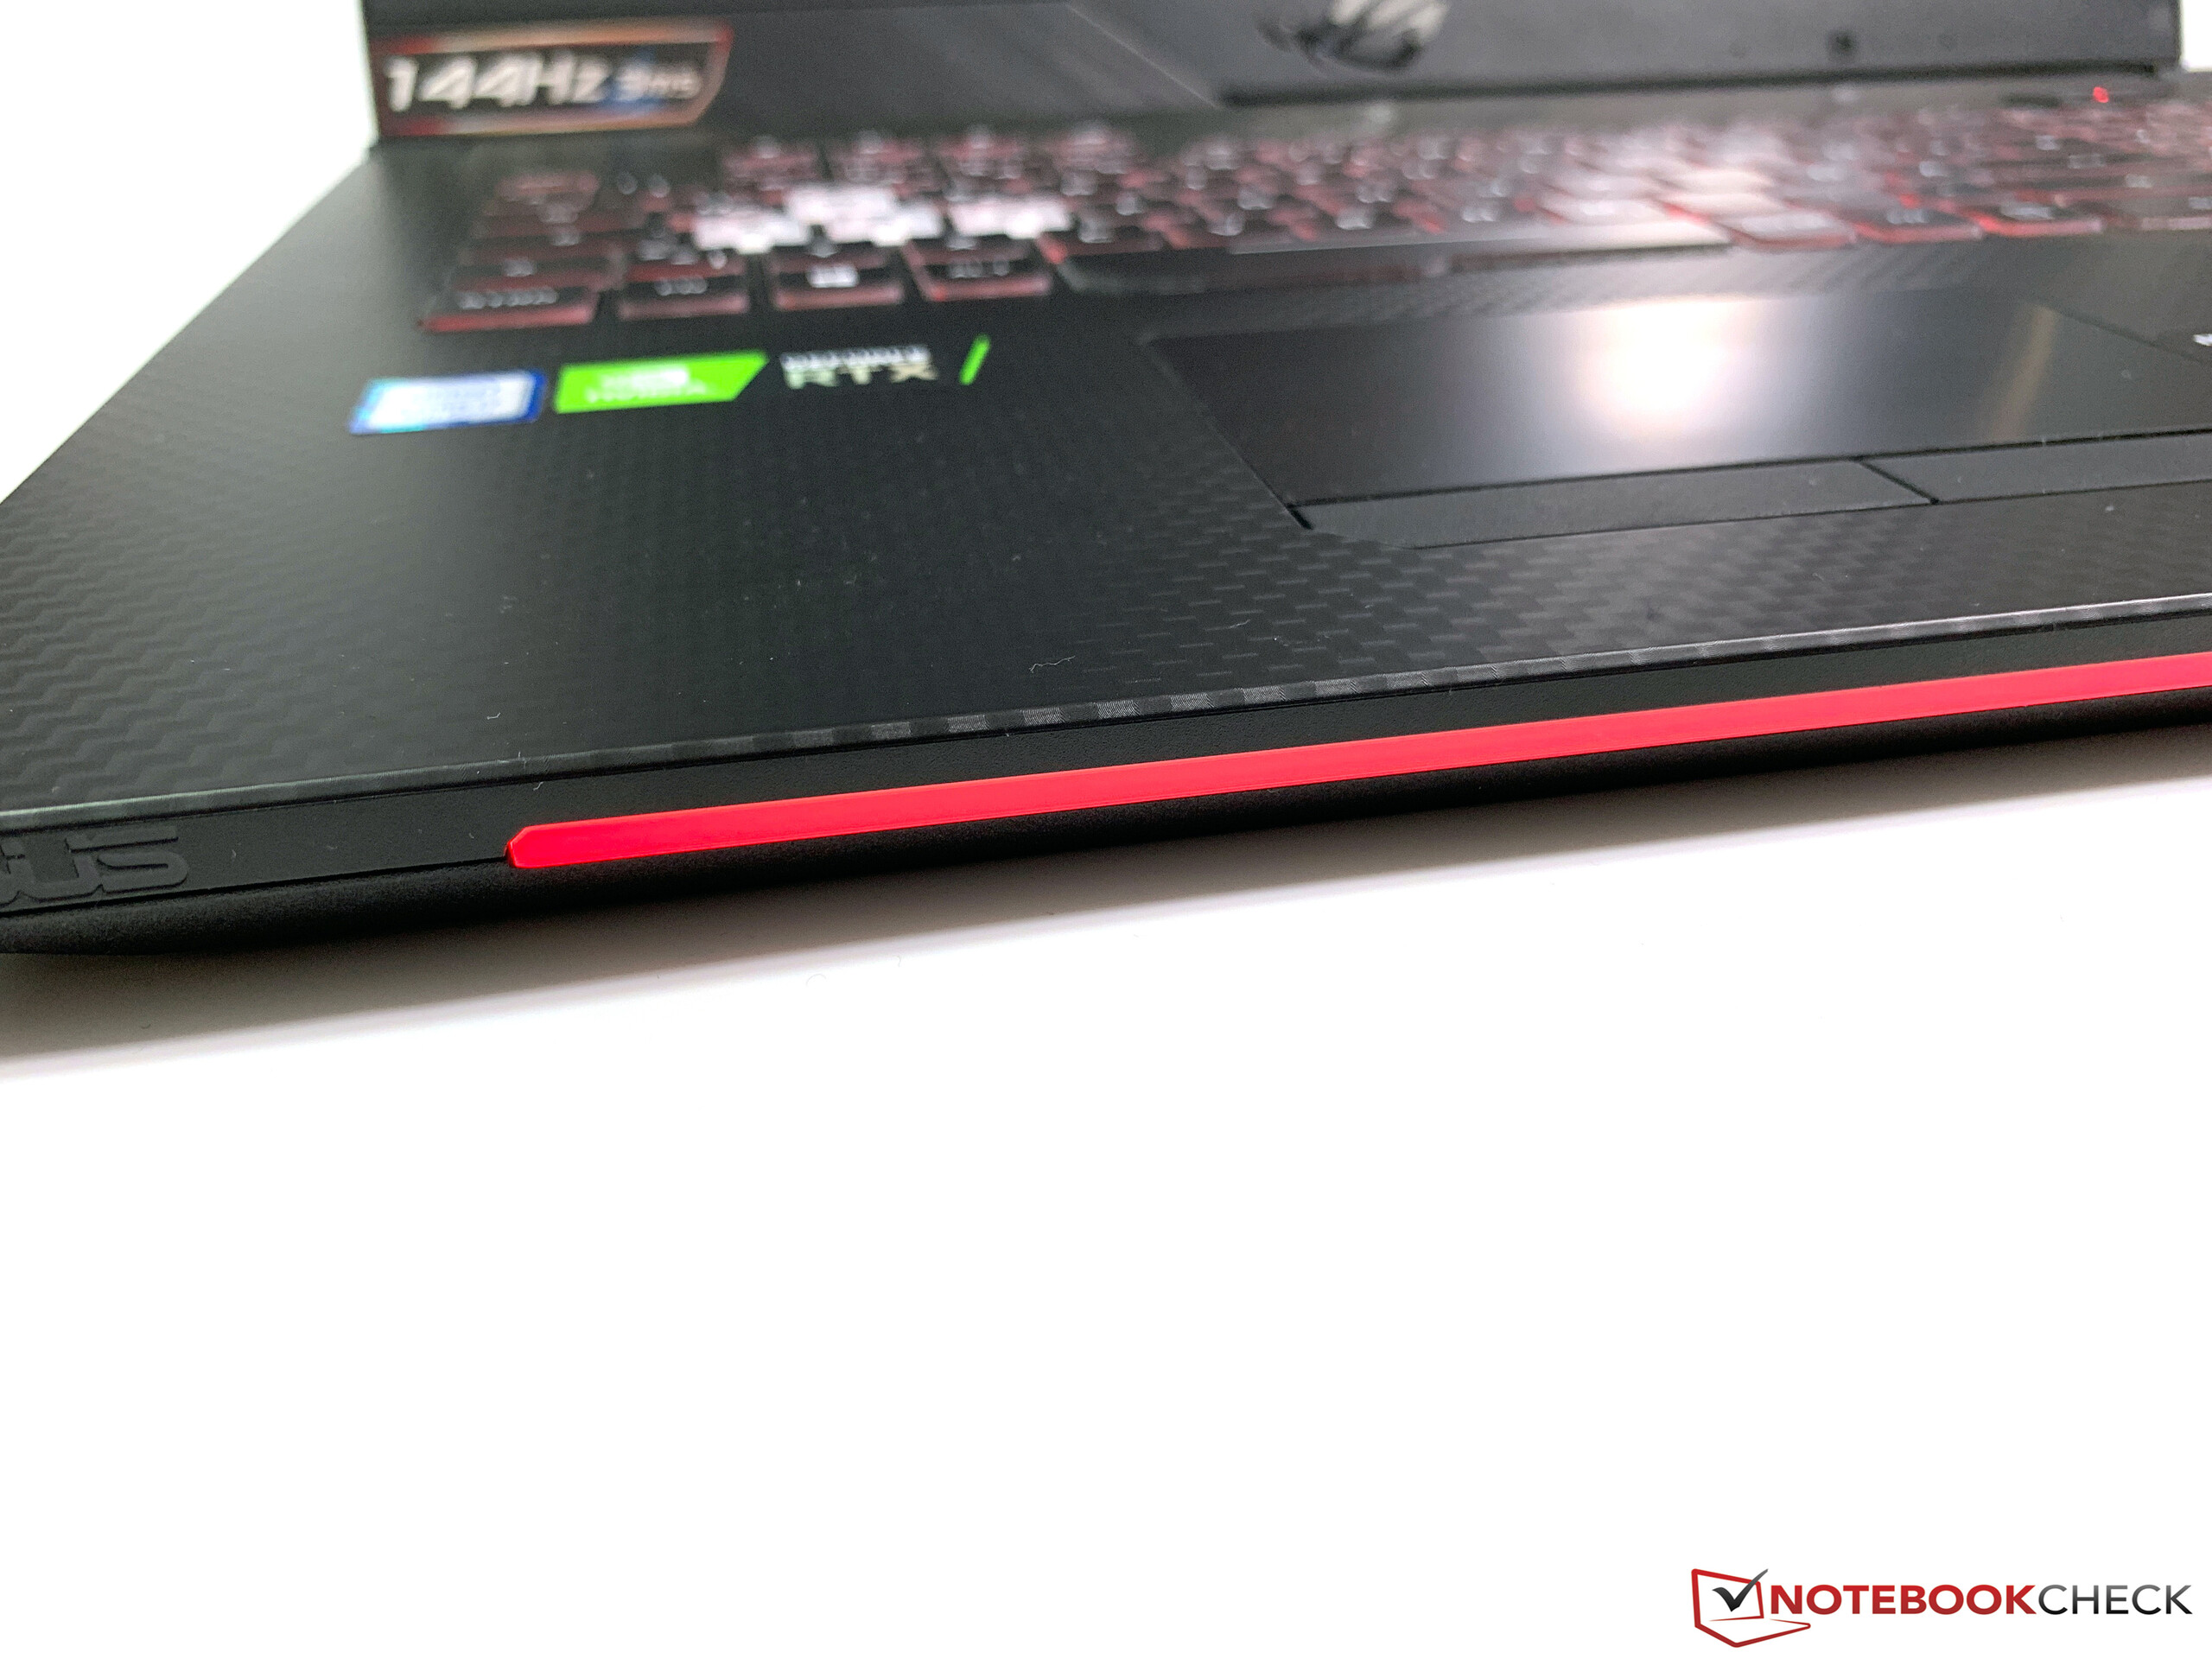
A ASUS equipou o GL704GW com a mesma tela de 144 Hz que ela usou no GL704GM, que continua a nos impressionar com seus baixos tempos de resposta e sua excelente precisão de cor. O design agressivo e industrial da carcaça não será para todos, mas você seria duramente pressionado para encontrar um portátil de jogos de 17 polegadas mais compacto que oferece o mesmo desempenho do GL704GW. Resumindo, o ASUS ROG Strix Scar II GL704GW é um excelente portátil para jogos, com poucos inconvenientes, além de ventiladores barulhentos e altas temperaturas.
Asus ROG Strix Scar II GL704GW
- 02/18/2019 v6 (old)
Andreas Osthoff