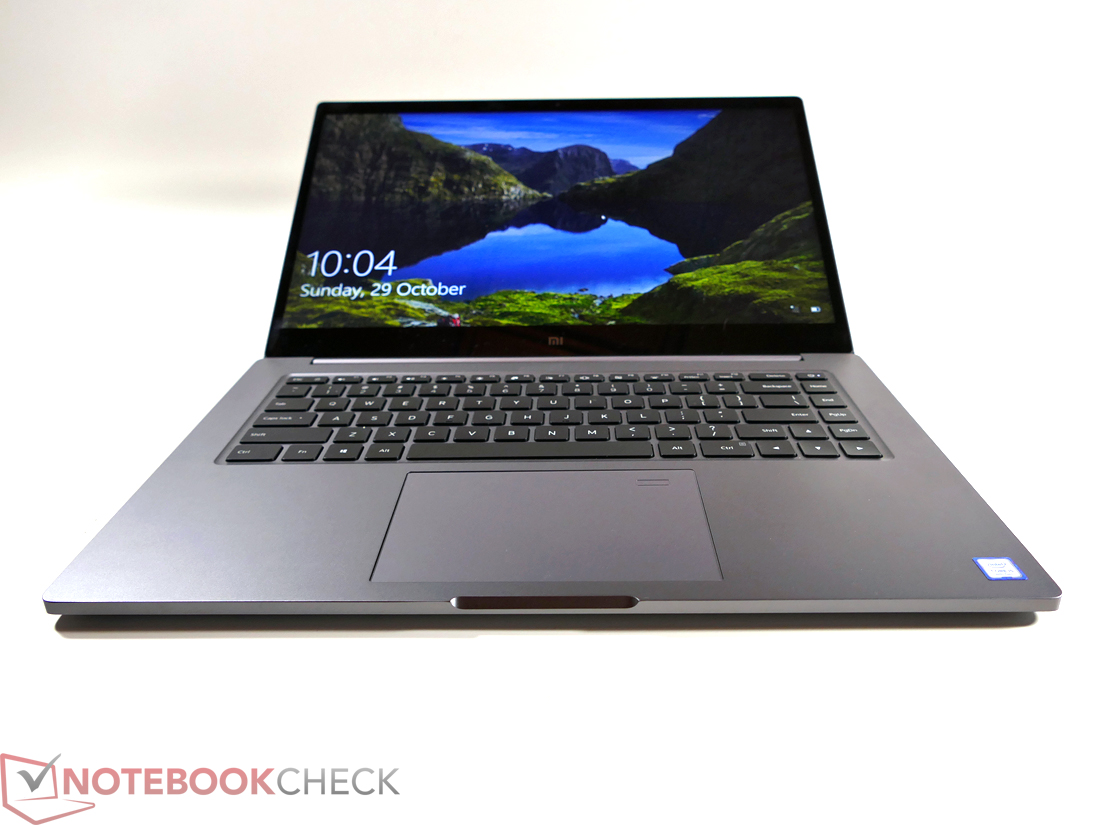
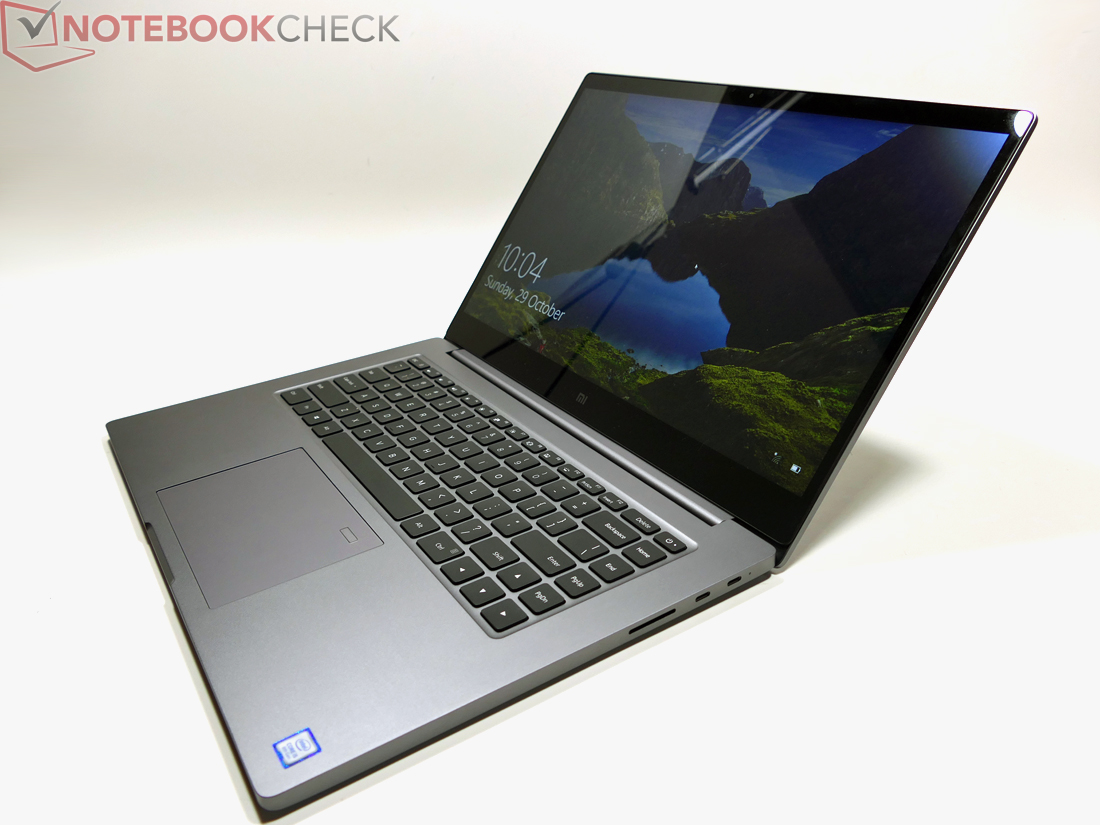
Vista Prévia do Portátil Xiaomi Mi Notebook Pro i5
| SD Card Reader | |
| average JPG Copy Test (av. of 3 runs) | |
| Dell XPS 15 9560 (i7-7700HQ, UHD) (Toshiba Exceria Pro SDXC 64 GB UHS-II) | |
| Asus ZenBook Pro UX550VD (Toshiba Exceria Pro M501) | |
| Xiaomi Mi Notebook Pro i5 | |
| maximum AS SSD Seq Read Test (1GB) | |
| Dell XPS 15 9560 (i7-7700HQ, UHD) (Toshiba Exceria Pro SDXC 64 GB UHS-II) | |
| Xiaomi Mi Notebook Pro i5 | |
| |||||||||||||||||||||||||
iluminação: 89 %
iluminação com acumulador: 277 cd/m²
Contraste: 925:1 (Preto: 0.32 cd/m²)
ΔE ColorChecker Calman: 4.3 | ∀{0.5-29.43 Ø4.71}
ΔE Greyscale Calman: 3 | ∀{0.09-98 Ø4.96}
86.86% sRGB (Argyll 1.6.3 3D)
56.83% AdobeRGB 1998 (Argyll 1.6.3 3D)
63.5% AdobeRGB 1998 (Argyll 3D)
86.9% sRGB (Argyll 3D)
66.5% Display P3 (Argyll 3D)
Gamma: 2.1
CCT: 7100 K
| Xiaomi Mi Notebook Pro i5 BOE0747 NV156FHM-N61, , 1920x1080, 15.6" | Apple MacBook Pro 15 2017 (2.8 GHz, 555) APPA031, , 2880x1800, 15.4" | Asus ZenBook Pro UX550VD CMN15E8 (N156HCE-EN1), , 1920x1080, 15.6" | Dell XPS 15 9560 (i7-7700HQ, UHD) 3840x2160, 15.6" | Apple MacBook 12 (Early 2016) 1.1 GHz APPA027, , 2304x1440, 12" | Asus VivoBook Pro 15 N580VD-DM028T INNOLUX N156HGA-EAB, , 1920x1080, 15.6" | Huawei MateBook X Chi Mei CMN8201 / P130ZDZ-EF1, , 2160x1440, 13.3" | |
|---|---|---|---|---|---|---|---|
| Display | 32% | 2% | 36% | 6% | -35% | 5% | |
| Display P3 Coverage (%) | 66.5 | 97.9 47% | 65.7 -1% | 89.7 35% | 66.8 0% | 39.92 -40% | 65.8 -1% |
| sRGB Coverage (%) | 86.9 | 99.9 15% | 90.3 4% | 100 15% | 95.4 10% | 59.8 -31% | 96.2 11% |
| AdobeRGB 1998 Coverage (%) | 63.5 | 85.9 35% | 65.9 4% | 100 57% | 68 7% | 41.27 -35% | 66.8 5% |
| Response Times | 0% | 19% | -18% | 12% | 35% | 30% | |
| Response Time Grey 50% / Grey 80% * (ms) | 47.9 ? | 48 ? -0% | 38.8 ? 19% | 57.2 ? -19% | 41.2 ? 14% | 44 ? 8% | 33 ? 31% |
| Response Time Black / White * (ms) | 33.7 ? | 33.8 ? -0% | 27.2 ? 19% | 39.2 ? -16% | 30.4 ? 10% | 13 ? 61% | 24 ? 29% |
| PWM Frequency (Hz) | 21800 ? | 119000 ? | 25910 ? | 962 | 25000 ? | ||
| Screen | 39% | -2% | 2% | 18% | -29% | 22% | |
| Brightness middle (cd/m²) | 296 | 545 84% | 335 13% | 370.1 25% | 387 31% | 247 -17% | 408 38% |
| Brightness (cd/m²) | 288 | 523 82% | 313 9% | 356 24% | 358 24% | 224 -22% | 395 37% |
| Brightness Distribution (%) | 89 | 86 -3% | 83 -7% | 87 -2% | 88 -1% | 85 -4% | 88 -1% |
| Black Level * (cd/m²) | 0.32 | 0.44 -38% | 0.27 16% | 0.37 -16% | 0.47 -47% | 0.48 -50% | 0.45 -41% |
| Contrast (:1) | 925 | 1239 34% | 1241 34% | 1000 8% | 823 -11% | 515 -44% | 907 -2% |
| Colorchecker dE 2000 * | 4.3 | 1.6 63% | 4.7 -9% | 5.3 -23% | 1.6 63% | 5.39 -25% | 1.55 64% |
| Colorchecker dE 2000 max. * | 8.7 | 3.8 56% | 8.1 7% | 9.9 -14% | 4 54% | 7.98 8% | 2.19 75% |
| Greyscale dE 2000 * | 3 | 1.9 37% | 5.8 -93% | 4.6 -53% | 1 67% | 5.25 -75% | 1.91 36% |
| Gamma | 2.1 105% | 2.26 97% | 2.06 107% | 2.31 95% | 2.26 97% | 2.48 89% | 2.34 94% |
| CCT | 7100 92% | 6834 95% | 6518 100% | 6284 103% | 6680 97% | 7609 85% | 6491 100% |
| Color Space (Percent of AdobeRGB 1998) (%) | 56.83 | 58.7 3% | 88.3 55% | 61.6 8% | 38 -33% | 61 7% | |
| Color Space (Percent of sRGB) (%) | 86.86 | 90.1 4% | 100 15% | 82.2 -5% | 60 -31% | 96 11% | |
| Média Total (Programa/Configurações) | 24% /
32% | 6% /
1% | 7% /
6% | 12% /
15% | -10% /
-22% | 19% /
20% |
* ... menor é melhor
Exibir tempos de resposta
| ↔ Tempo de resposta preto para branco | ||
|---|---|---|
| 33.7 ms ... ascensão ↗ e queda ↘ combinadas | ↗ 19.2 ms ascensão | 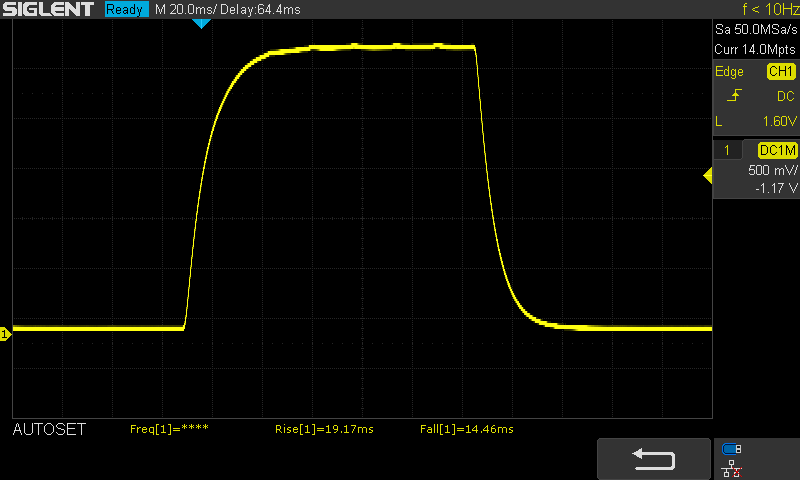 |
| ↘ 14.5 ms queda | ||
| A tela mostra taxas de resposta lentas em nossos testes e será insatisfatória para os jogadores. Em comparação, todos os dispositivos testados variam de 0.1 (mínimo) a 240 (máximo) ms. » 90 % de todos os dispositivos são melhores. Isso significa que o tempo de resposta medido é pior que a média de todos os dispositivos testados (19.8 ms). | ||
| ↔ Tempo de resposta 50% cinza a 80% cinza | ||
| 47.9 ms ... ascensão ↗ e queda ↘ combinadas | ↗ 22.4 ms ascensão | 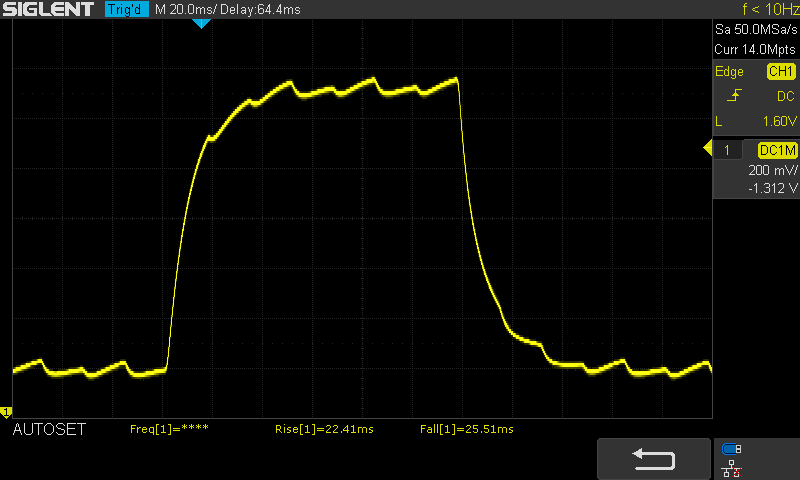 |
| ↘ 25.5 ms queda | ||
| A tela mostra taxas de resposta lentas em nossos testes e será insatisfatória para os jogadores. Em comparação, todos os dispositivos testados variam de 0.165 (mínimo) a 636 (máximo) ms. » 82 % de todos os dispositivos são melhores. Isso significa que o tempo de resposta medido é pior que a média de todos os dispositivos testados (31 ms). | ||
Cintilação da tela / PWM (modulação por largura de pulso)
| Tela tremeluzindo/PWM detectado | 21800 Hz | ≤ 99 % configuração de brilho | 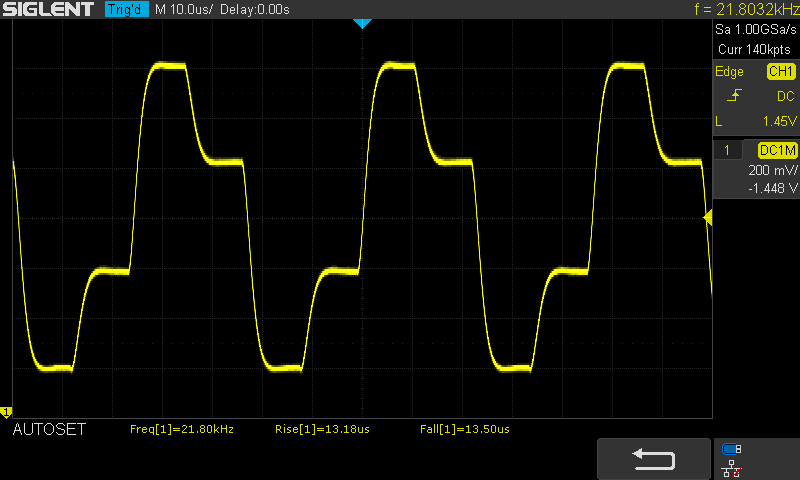 |
A luz de fundo da tela pisca em 21800 Hz (pior caso, por exemplo, utilizando PWM) Cintilação detectada em uma configuração de brilho de 99 % e abaixo. Não deve haver cintilação ou PWM acima desta configuração de brilho. A frequência de 21800 Hz é bastante alta, então a maioria dos usuários sensíveis ao PWM não deve notar nenhuma oscilação. [pwm_comparison] Em comparação: 52 % de todos os dispositivos testados não usam PWM para escurecer a tela. Se PWM foi detectado, uma média de 7757 (mínimo: 5 - máximo: 343500) Hz foi medida. | |||
| PCMark 8 Home Score Accelerated v2 | 3766 pontos | |
| PCMark 8 Creative Score Accelerated v2 | 5354 pontos | |
| PCMark 8 Work Score Accelerated v2 | 4746 pontos | |
| PCMark 10 Score | 3686 pontos | |
Ajuda | ||
| Xiaomi Mi Notebook Pro i5 Samsung PM961 MZVLW256HEHP | Apple MacBook Pro 15 2017 (2.8 GHz, 555) Apple SSD SM0256L | Asus ZenBook Pro UX550VD Samsung PM961 NVMe MZVLW512HMJP | Asus VivoBook Pro 15 N580VD-DM028T Micron 1100 MTFDDAV256TBN | Lenovo Yoga 920-13IKB-80Y7 Samsung PM961 MZVLW256HEHP | |
|---|---|---|---|---|---|
| CrystalDiskMark 5.2 / 6 | 16% | 40% | -53% | 32% | |
| Read Seq (MB/s) | 1074 | 1572 46% | 1878 75% | 493.8 -54% | 1884 75% |
| Write Seq (MB/s) | 1057 | 1473 39% | 1378 30% | 413.3 -61% | 1112 5% |
| Read Seq Q32T1 (MB/s) | 1838 | 2993 63% | 3267 78% | 525 -71% | 3400 85% |
| Write Seq Q32T1 (MB/s) | 1283 | 1546 20% | 1587 24% | 430.7 -66% | 1255 -2% |
| Read 4K Q32T1 (MB/s) | 441 | 573 30% | 583 32% | 213.5 -52% | 446.8 1% |
| Write 4K Q32T1 (MB/s) | 429 | 470.5 10% | 516 20% | 245.1 -43% | 747 74% |
| Read 4K (MB/s) | 36 | 23.33 -35% | 48.96 36% | 25.89 -28% | 44.19 23% |
| Write 4K (MB/s) | 150 | 86.7 -42% | 187 25% | 82.8 -45% | 142.1 -5% |

| 3DMark 11 Performance | 4521 pontos | |
| 3DMark Cloud Gate Standard Score | 13662 pontos | |
| 3DMark Fire Strike Score | 2954 pontos | |
| 3DMark Time Spy Score | 1084 pontos | |
Ajuda | ||
Barulho
| Ocioso |
| 31 / 31 / 32.6 dB |
| Carga |
| 41.6 / 44.7 dB |
 | ||
30 dB silencioso 40 dB(A) audível 50 dB(A) ruidosamente alto |
||
min: | ||
(±) A temperatura máxima no lado superior é 43.8 °C / 111 F, em comparação com a média de 36.8 °C / 98 F , variando de 21 a 71 °C para a classe Multimedia.
(±) A parte inferior aquece até um máximo de 44.9 °C / 113 F, em comparação com a média de 39.1 °C / 102 F
(+) Em uso inativo, a temperatura média para o lado superior é 25.1 °C / 77 F, em comparação com a média do dispositivo de 31.3 °C / ### class_avg_f### F.
(±) Jogando The Witcher 3, a temperatura média para o lado superior é 33.9 °C / 93 F, em comparação com a média do dispositivo de 31.3 °C / ## #class_avg_f### F.
(+) Os apoios para as mãos e o touchpad são mais frios que a temperatura da pele, com um máximo de 29.2 °C / 84.6 F e, portanto, são frios ao toque.
(±) A temperatura média da área do apoio para as mãos de dispositivos semelhantes foi 28.7 °C / 83.7 F (-0.5 °C / -0.9 F).
Xiaomi Mi Notebook Pro i5 análise de áudio
(±) | o volume do alto-falante é médio, mas bom (###valor### dB)
Graves 100 - 315Hz
(±) | graves reduzidos - em média 7.8% menor que a mediana
(±) | a linearidade dos graves é média (10.2% delta para a frequência anterior)
Médios 400 - 2.000 Hz
(+) | médios equilibrados - apenas 3.3% longe da mediana
(±) | a linearidade dos médios é média (7.2% delta para frequência anterior)
Altos 2 - 16 kHz
(±) | máximos reduzidos - em média 5.4% menor que a mediana
(±) | a linearidade dos máximos é média (7.5% delta para frequência anterior)
Geral 100 - 16.000 Hz
(+) | o som geral é linear (11.2% diferença em relação à mediana)
Comparado com a mesma classe
» 17% de todos os dispositivos testados nesta classe foram melhores, 4% semelhantes, 80% piores
» O melhor teve um delta de 5%, a média foi 17%, o pior foi 45%
Comparado com todos os dispositivos testados
» 7% de todos os dispositivos testados foram melhores, 2% semelhantes, 91% piores
» O melhor teve um delta de 4%, a média foi 23%, o pior foi 134%
Apple MacBook Pro 15 2017 (2.8 GHz, 555) análise de áudio
(+) | os alto-falantes podem tocar relativamente alto (###valor### dB)
Graves 100 - 315Hz
(±) | graves reduzidos - em média 8.7% menor que a mediana
(±) | a linearidade dos graves é média (11.1% delta para a frequência anterior)
Médios 400 - 2.000 Hz
(+) | médios equilibrados - apenas 2.5% longe da mediana
(±) | a linearidade dos médios é média (7.5% delta para frequência anterior)
Altos 2 - 16 kHz
(+) | agudos equilibrados - apenas 1.7% longe da mediana
(+) | os máximos são lineares (5% delta da frequência anterior)
Geral 100 - 16.000 Hz
(+) | o som geral é linear (7.9% diferença em relação à mediana)
Comparado com a mesma classe
» 7% de todos os dispositivos testados nesta classe foram melhores, 2% semelhantes, 91% piores
» O melhor teve um delta de 5%, a média foi 17%, o pior foi 45%
Comparado com todos os dispositivos testados
» 2% de todos os dispositivos testados foram melhores, 1% semelhantes, 98% piores
» O melhor teve um delta de 4%, a média foi 23%, o pior foi 134%
| desligado | |
| Ocioso | |
| Carga |
|
Key:
min: | |
| Xiaomi Mi Notebook Pro i5 i5-8250U, GeForce MX150, Samsung PM961 MZVLW256HEHP, IPS LED, 1920x1080, 15.6" | Apple MacBook Pro 15 2017 (2.8 GHz, 555) i7-7700HQ, Radeon Pro 555, Apple SSD SM0256L, IPS, 2880x1800, 15.4" | Asus ZenBook Pro UX550VD i7-7700HQ, GeForce GTX 1050 Mobile, Samsung PM961 NVMe MZVLW512HMJP, IPS, 1920x1080, 15.6" | Dell XPS 15 9560 (i7-7700HQ, UHD) i7-7700HQ, GeForce GTX 1050 Mobile, Lite-On CX2-8B512-Q11, IGZO IPS, 3840x2160, 15.6" | Asus VivoBook Pro 15 N580VD-DM028T i7-7700HQ, GeForce GTX 1050 Mobile, Micron 1100 MTFDDAV256TBN, TN, 1920x1080, 15.6" | Dell Inspiron 15 7570 i5-8550U, GeForce 940MX, Samsung PM961 NVMe MZVLW512HMJP, IPS, 1920x1080, 15.6" | |
|---|---|---|---|---|---|---|
| Power Consumption | -53% | -61% | -131% | -61% | -5% | |
| Idle Minimum * (Watt) | 3.7 | 3.4 8% | 5.05 -36% | 11.9 -222% | 4.7 -27% | 3.6 3% |
| Idle Average * (Watt) | 7.5 | 13.9 -85% | 8.2 -9% | 17.1 -128% | 7.7 -3% | 6.7 11% |
| Idle Maximum * (Watt) | 8 | 17.6 -120% | 12.2 -53% | 17.3 -116% | 10.9 -36% | 9.2 -15% |
| Load Average * (Watt) | 49 | 71.1 -45% | 82 -67% | 94.7 -93% | 82 -67% | 59 -20% |
| Witcher 3 ultra * (Watt) | 50.6 | 57.9 -14% | 93.1 -84% | 104.8 -107% | 109 -115% | |
| Load Maximum * (Watt) | 55.2 | 88.5 -60% | 120 -117% | 122 -121% | 120 -117% | 58 -5% |
* ... menor é melhor
| Xiaomi Mi Notebook Pro i5 i5-8250U, GeForce MX150, 60 Wh | Apple MacBook Pro 15 2017 (2.8 GHz, 555) i7-7700HQ, Radeon Pro 555, 76 Wh | Asus ZenBook Pro UX550VD i7-7700HQ, GeForce GTX 1050 Mobile, 73 Wh | Dell XPS 15 9560 (i7-7700HQ, UHD) i7-7700HQ, GeForce GTX 1050 Mobile, 97 Wh | Asus VivoBook Pro 15 N580VD-DM028T i7-7700HQ, GeForce GTX 1050 Mobile, 47 Wh | Apple MacBook Pro 13 2017 i5-7360U, Iris Plus Graphics 640, 54.5 Wh | |
|---|---|---|---|---|---|---|
| Duração da bateria | -14% | -25% | -22% | -36% | -4% | |
| H.264 (h) | 10.5 | 8.5 -19% | 7.8 -26% | 5.9 -44% | 11.4 9% | |
| WiFi v1.3 (h) | 10 | 10.7 7% | 8.9 -11% | 7.2 -28% | 6.5 -35% | 11.4 14% |
| Witcher 3 ultra (h) | 1.4 | 1.5 7% | 1.1 -21% | |||
| Load (h) | 2 | 1 -50% | 1.2 -40% | 1.7 -15% | 1.4 -30% | 1.3 -35% |
| Reader / Idle (h) | 17.7 | 13.9 | 10.2 |
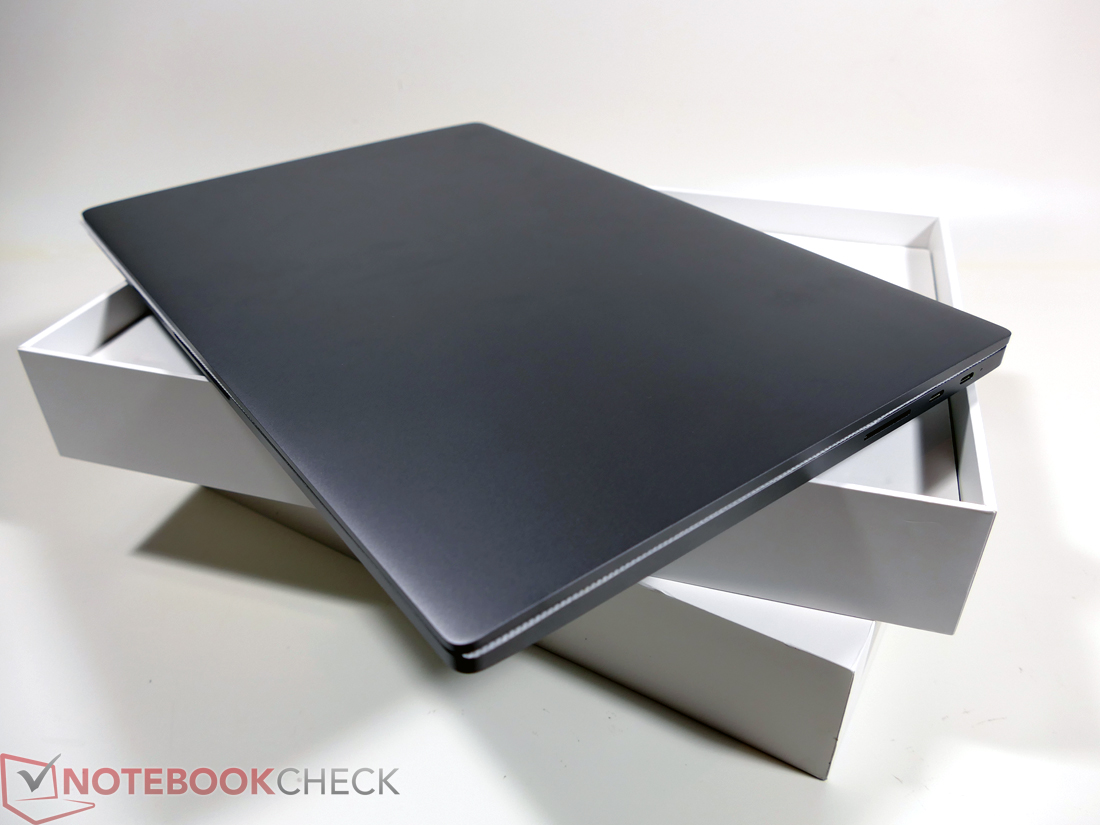
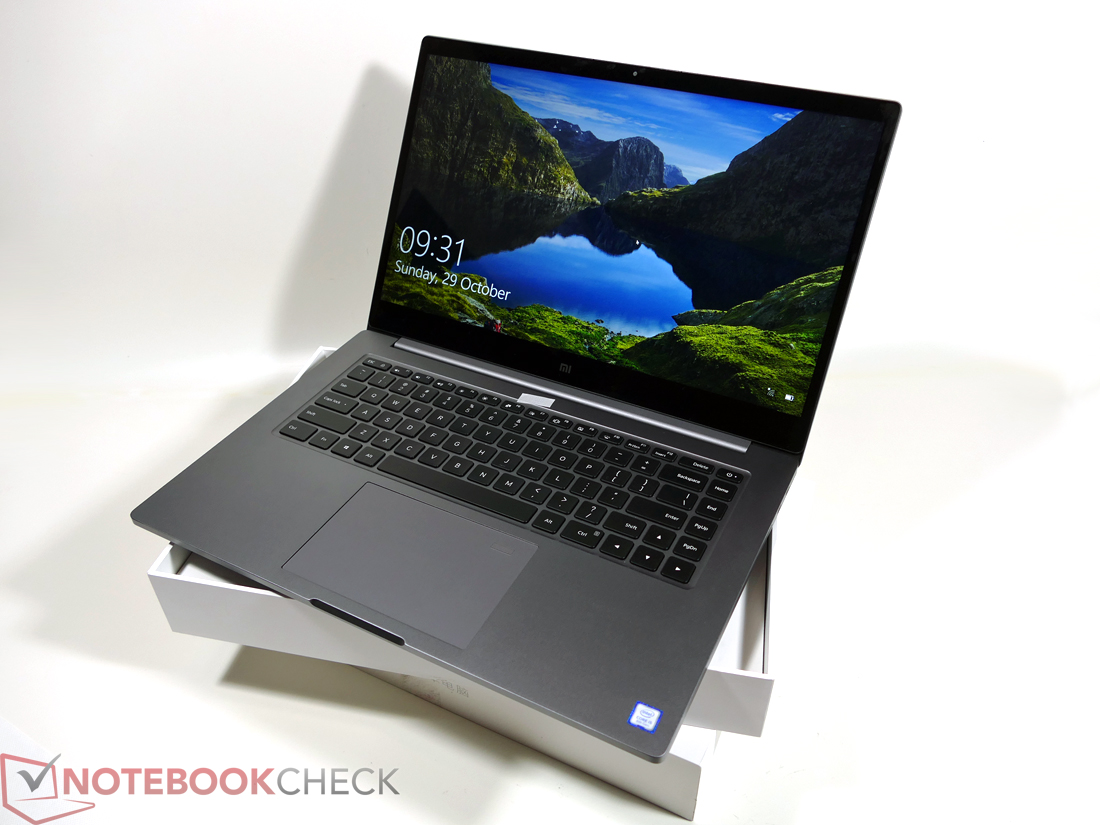
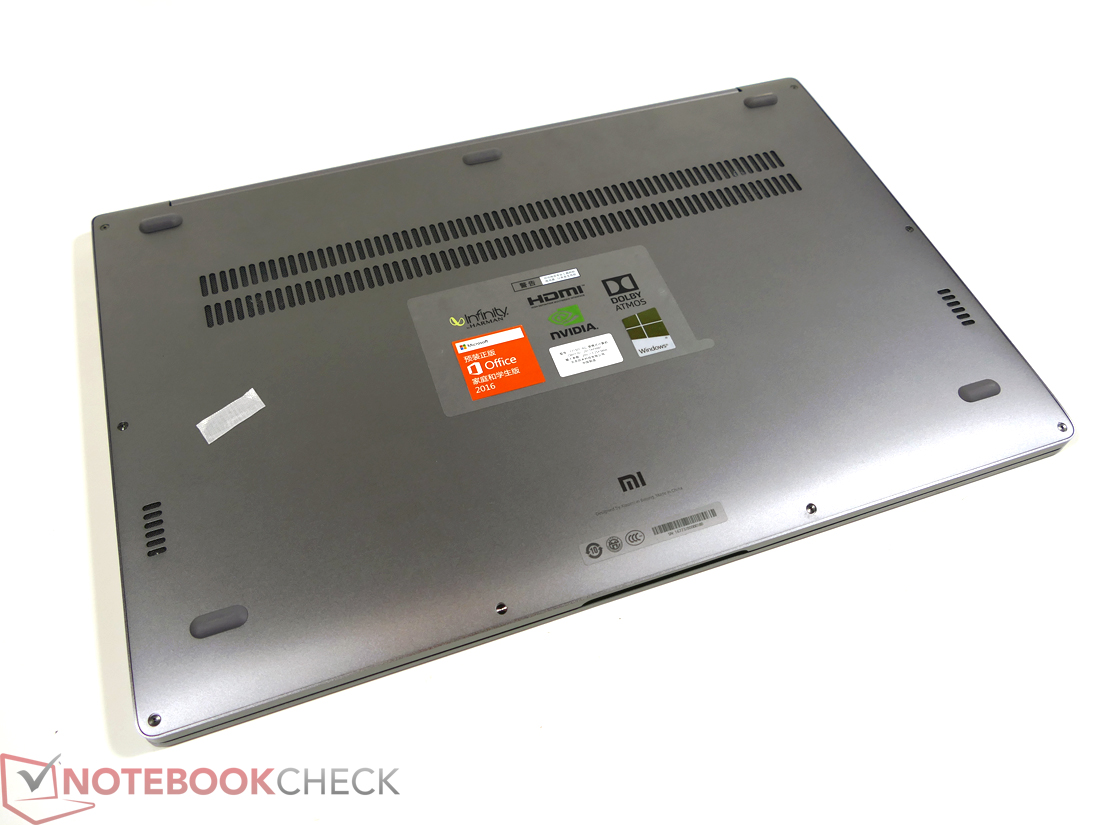
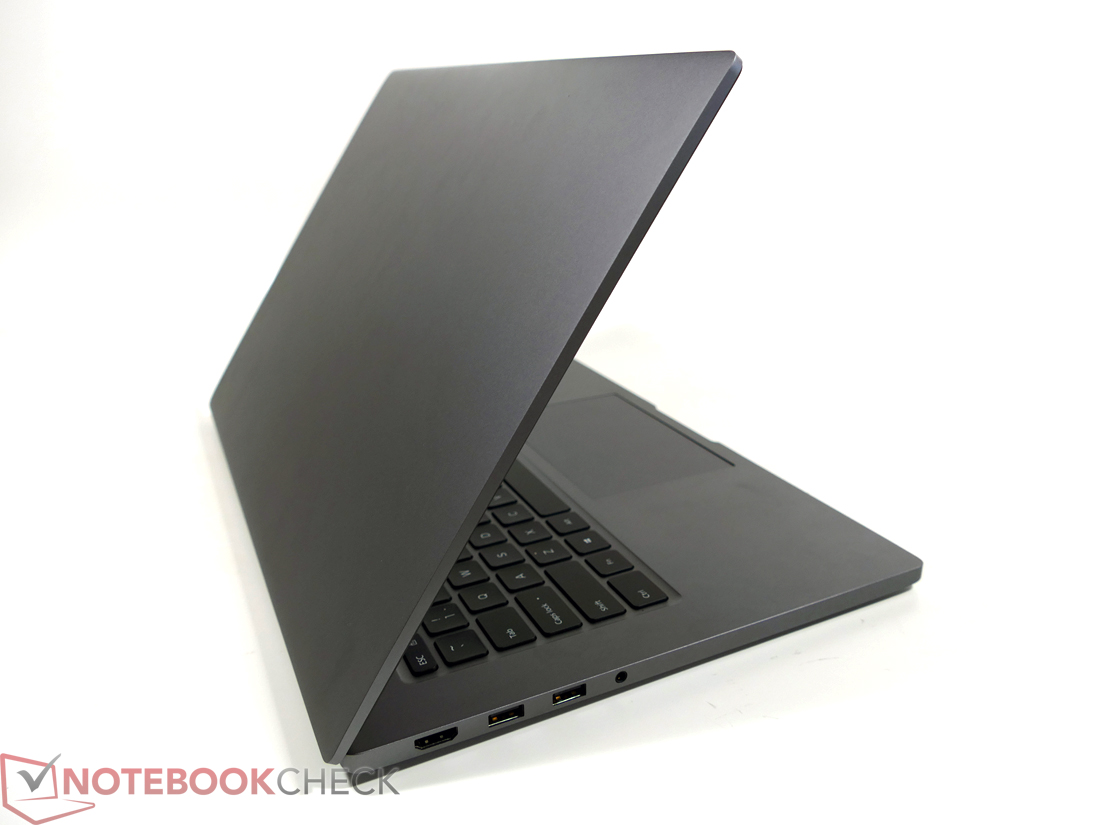
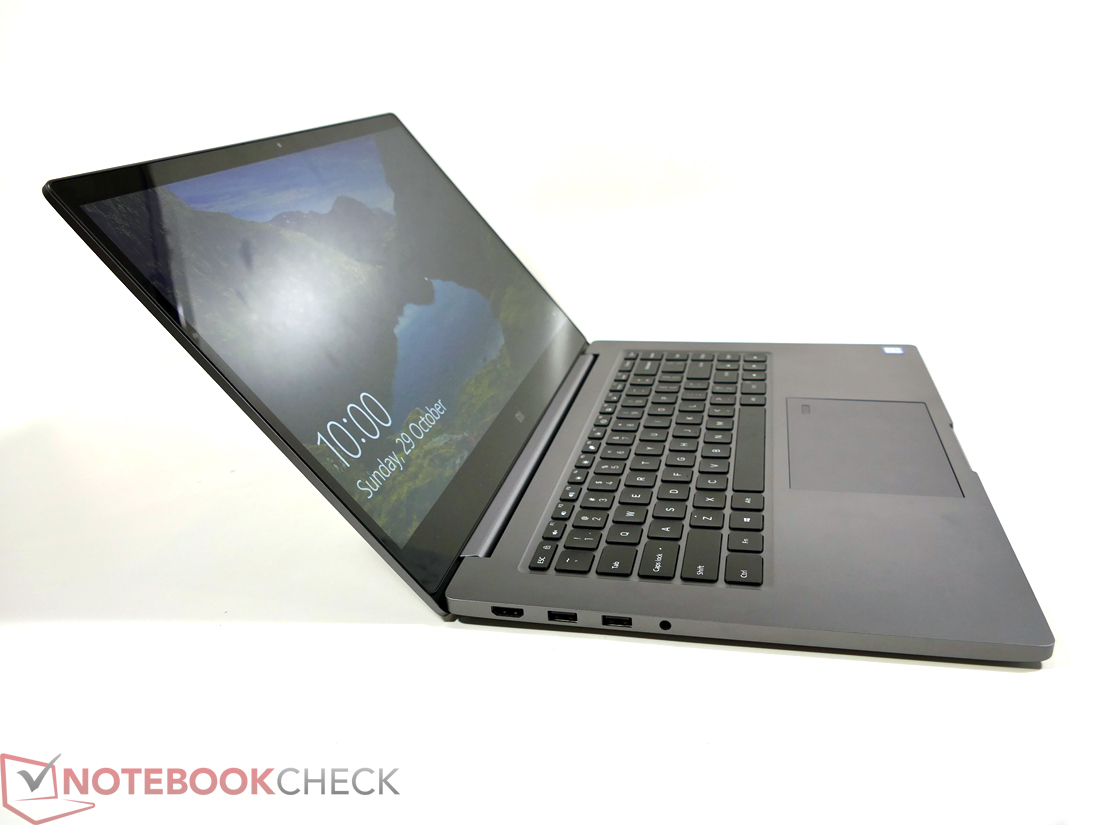
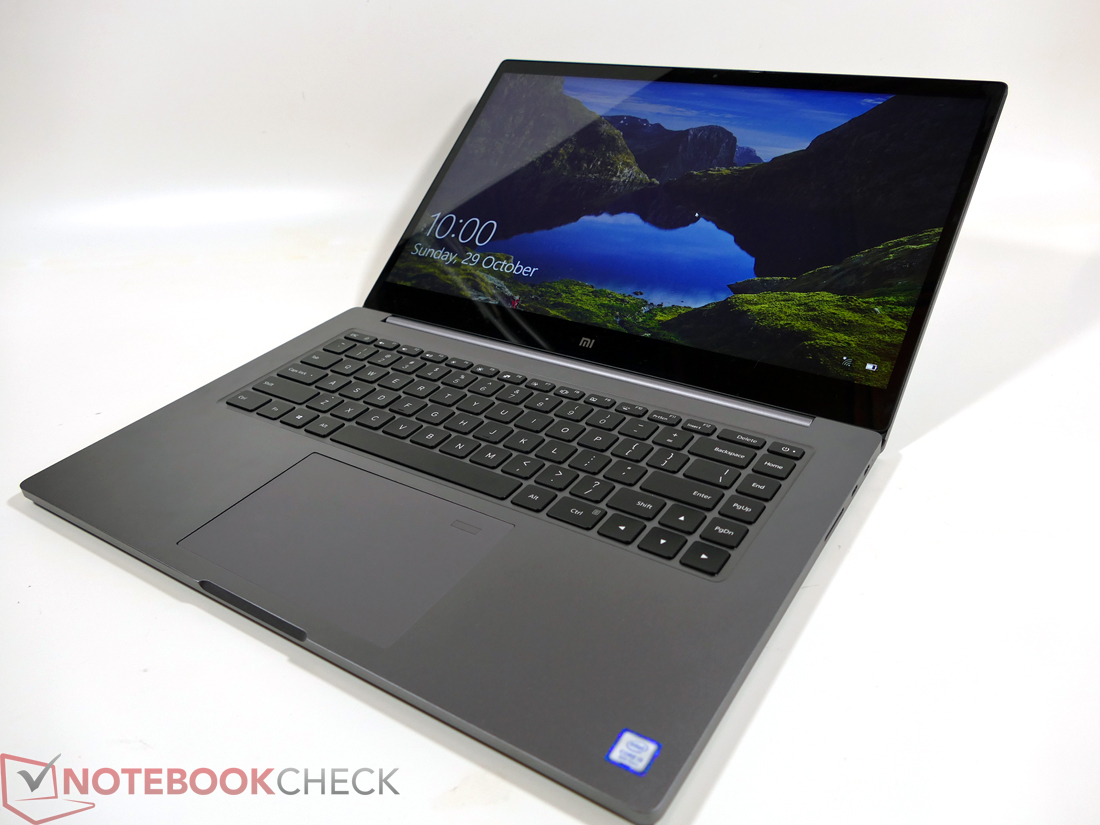
O que vimos do Xiaomi Mi Notebook Pro até agora, deixa uma impressão muito positiva. O design e a qualidade da carcaça estão em um nível alto, existem bons dispositivos de entrada, uma tela boa, desempenho no nível esperado, emissões que não são problemáticas e, como a cereja em cima do sorvete, oferece uma boa duração da bateria. Mas como diz o dito, ainda é muito cedo para tirar conclusões.
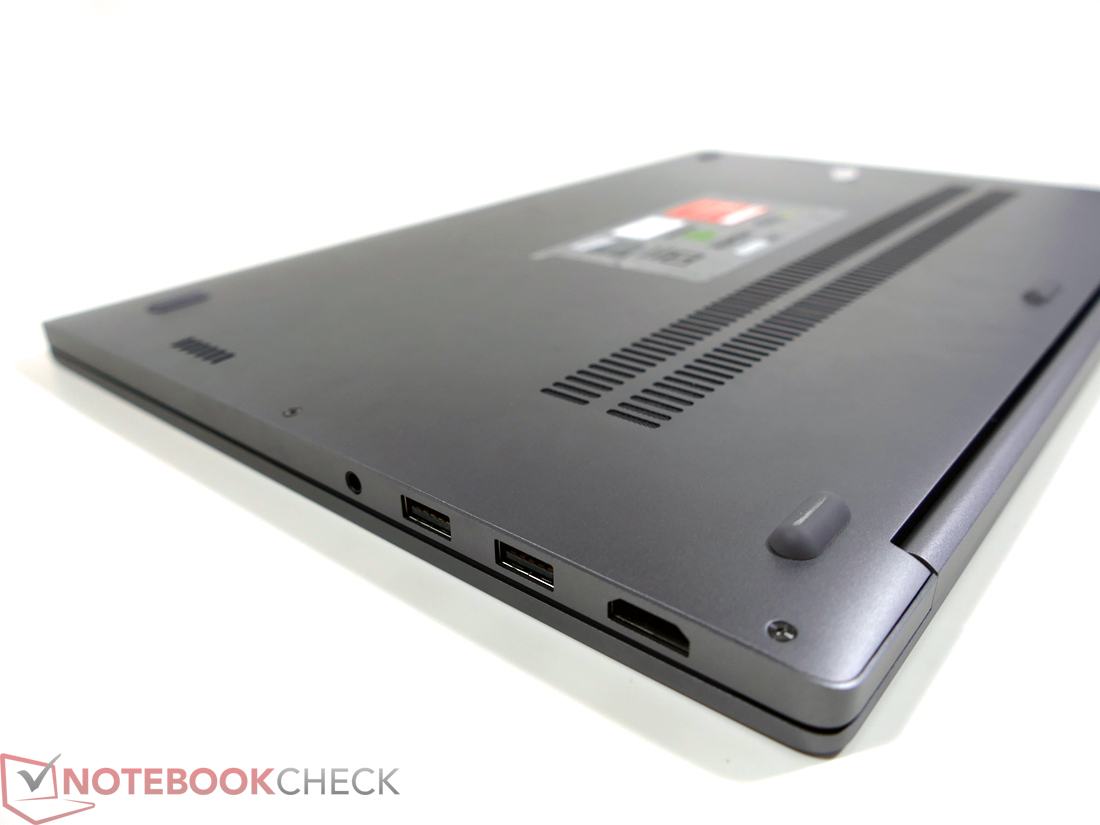
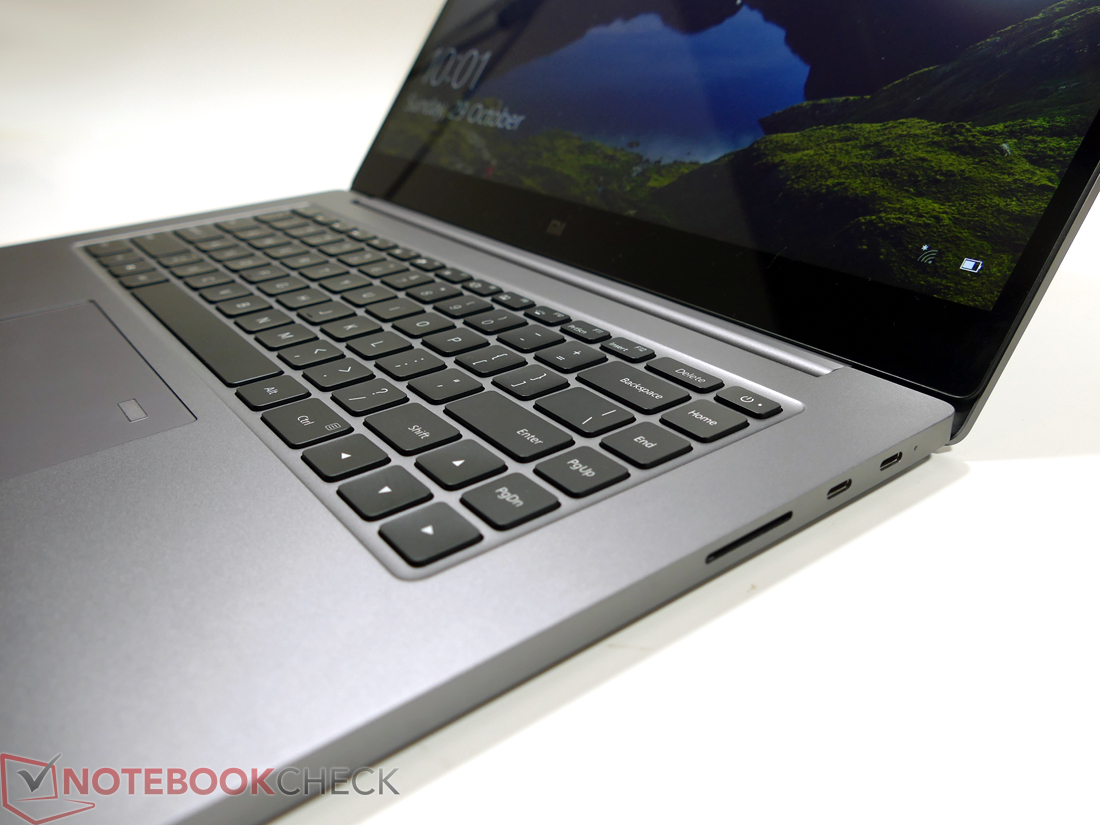
Nos dias seguintes, continuaremos nossos testes e procuraremos quaisquer áreas problemáticas no portátil chinês. Até agora, não houve muitos: há apenas uma porta Tipo-C de carregamento e o desempenho do leitor de cartões SD é inferior. Estamos particularmente curiosos como a CPU ULV quad-core em combinação com a GPU Geforce MX150 se sairá durante os jogos.