Breve Análise do Portátil MSI GE75 8SG Raider (i7-8750H, RTX 2080)
| SD Card Reader | |
| average JPG Copy Test (av. of 3 runs) | |
| MSI GS73 Stealth 8RF-011 (Toshiba Exceria Pro SDXC 64 GB UHS-II) | |
| Média da turma Gaming (20.9 - 210, n=55, últimos 2 anos) | |
| Asus ROG Strix Scar II GL704GW (Toshiba Exceria Pro SDXC 64 GB UHS-II) | |
| MSI GE75 8SG Raider (Toshiba Exceria Pro SDXC 64 GB UHS-II) | |
| maximum AS SSD Seq Read Test (1GB) | |
| MSI GS73 Stealth 8RF-011 (Toshiba Exceria Pro SDXC 64 GB UHS-II) | |
| Média da turma Gaming (25.5 - 261, n=52, últimos 2 anos) | |
| Asus ROG Strix Scar II GL704GW (Toshiba Exceria Pro SDXC 64 GB UHS-II) | |
| MSI GE75 8SG Raider (Toshiba Exceria Pro SDXC 64 GB UHS-II) | |
| Networking | |
| iperf3 transmit AX12 | |
| MSI GE75 8SG Raider | |
| Asus Zephyrus S GX701GX | |
| Lenovo Legion Y740-17ICH | |
| Asus ROG Strix Scar II GL704GW | |
| MSI GS73 Stealth 8RF-011 | |
| iperf3 receive AX12 | |
| Asus Zephyrus S GX701GX | |
| MSI GE75 8SG Raider | |
| Lenovo Legion Y740-17ICH | |
| Asus ROG Strix Scar II GL704GW | |
| MSI GS73 Stealth 8RF-011 | |
| |||||||||||||||||||||||||
iluminação: 86 %
iluminação com acumulador: 363 cd/m²
Contraste: 1344:1 (Preto: 0.27 cd/m²)
ΔE ColorChecker Calman: 2.29 | ∀{0.5-29.43 Ø4.71}
calibrated: 2.45
ΔE Greyscale Calman: 3.02 | ∀{0.09-98 Ø4.96}
91% sRGB (Argyll 1.6.3 3D)
58% AdobeRGB 1998 (Argyll 1.6.3 3D)
62.6% AdobeRGB 1998 (Argyll 3D)
91.2% sRGB (Argyll 3D)
60.6% Display P3 (Argyll 3D)
Gamma: 2.38
CCT: 7048 K
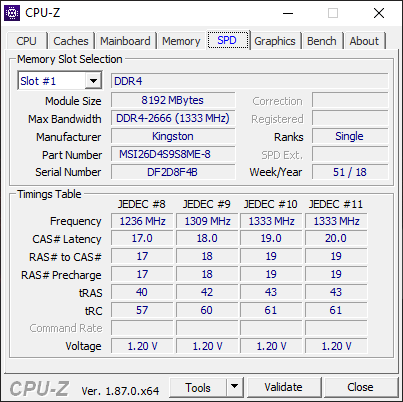
| MSI GE75 8SG Raider CMN N173HCE-G33 (CMN175C), , 1920x1080, 17.3" | Asus Zephyrus S GX701GX B173HAN04.0 (AUO409D), , 1920x1080, 17.3" | Lenovo Legion Y740-17ICH AU Optronics B173HAN03.2, , 1920x1080, 17.3" | Asus ROG Strix Scar II GL704GW B173HAN04.0 (AUO409D), , 1920x1080, 17.3" | MSI GS73 Stealth 8RF-011 CMN N173HHE-G32 (CMN1747), , 1920x1080, 17.3" | MSI GE75 8SF Chi Mei N173HCE-G33, , 1920x1080, 17.3" | |
|---|---|---|---|---|---|---|
| Display | 1% | 3% | 1% | 32% | 4% | |
| Display P3 Coverage (%) | 60.6 | 62.9 4% | 64 6% | 62.9 4% | 90.8 50% | 63.1 4% |
| sRGB Coverage (%) | 91.2 | 87.8 -4% | 90.4 -1% | 87.1 -4% | 99.9 10% | 94.4 4% |
| AdobeRGB 1998 Coverage (%) | 62.6 | 63.9 2% | 64.8 4% | 63.7 2% | 85.8 37% | 65.2 4% |
| Response Times | 3% | -67% | -71% | 18% | -17% | |
| Response Time Grey 50% / Grey 80% * (ms) | 8 ? | 7.2 ? 10% | 15.6 ? -95% | 17.6 ? -120% | 7.8 ? 2% | 9.6 ? -20% |
| Response Time Black / White * (ms) | 9.2 ? | 9.6 ? -4% | 12.8 ? -39% | 11.2 ? -22% | 6.2 ? 33% | 10.4 ? -13% |
| PWM Frequency (Hz) | 26040 ? | 25510 ? | 25770 ? | |||
| Screen | 3% | -43% | -8% | -9% | 17% | |
| Brightness middle (cd/m²) | 363 | 288 -21% | 299.1 -18% | 295 -19% | 262 -28% | 370.4 2% |
| Brightness (cd/m²) | 342 | 287 -16% | 273 -20% | 291 -15% | 261 -24% | 348 2% |
| Brightness Distribution (%) | 86 | 91 6% | 81 -6% | 96 12% | 94 9% | 89 3% |
| Black Level * (cd/m²) | 0.27 | 0.2 26% | 0.27 -0% | 0.24 11% | 0.2 26% | 0.29 -7% |
| Contrast (:1) | 1344 | 1440 7% | 1108 -18% | 1229 -9% | 1310 -3% | 1277 -5% |
| Colorchecker dE 2000 * | 2.29 | 2.33 -2% | 5.07 -121% | 3.2 -40% | 3.96 -73% | 1.26 45% |
| Colorchecker dE 2000 max. * | 4.54 | 5.34 -18% | 10.55 -132% | 6.64 -46% | 7.29 -61% | 3.02 33% |
| Colorchecker dE 2000 calibrated * | 2.45 | 2.47 -1% | 3.31 -35% | 2.52 -3% | 2.18 11% | 1.21 51% |
| Greyscale dE 2000 * | 3.02 | 1.19 61% | 6.8 -125% | 2.16 28% | 3.09 -2% | 1.4 54% |
| Gamma | 2.38 92% | 2.41 91% | 2.46 89% | 2.46 89% | 2.48 89% | 2.2 100% |
| CCT | 7048 92% | 6710 97% | 7805 83% | 6872 95% | 6977 93% | 6747 96% |
| Color Space (Percent of AdobeRGB 1998) (%) | 58 | 57 -2% | 58.5 1% | 57 -2% | 76 31% | 59.7 3% |
| Color Space (Percent of sRGB) (%) | 91 | 88 -3% | 89.9 -1% | 87 -4% | 100 10% | 94.4 4% |
| Média Total (Programa/Configurações) | 2% /
3% | -36% /
-38% | -26% /
-14% | 14% /
2% | 1% /
10% |
* ... menor é melhor
Exibir tempos de resposta
| ↔ Tempo de resposta preto para branco | ||
|---|---|---|
| 9.2 ms ... ascensão ↗ e queda ↘ combinadas | ↗ 4.8 ms ascensão | 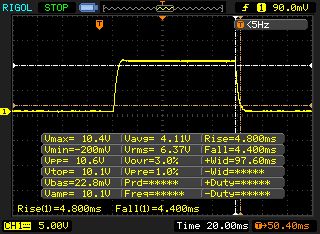 |
| ↘ 4.4 ms queda | ||
| A tela mostra taxas de resposta rápidas em nossos testes e deve ser adequada para jogos. Em comparação, todos os dispositivos testados variam de 0.1 (mínimo) a 240 (máximo) ms. » 26 % de todos os dispositivos são melhores. Isso significa que o tempo de resposta medido é melhor que a média de todos os dispositivos testados (19.8 ms). | ||
| ↔ Tempo de resposta 50% cinza a 80% cinza | ||
| 8 ms ... ascensão ↗ e queda ↘ combinadas | ↗ 4 ms ascensão | 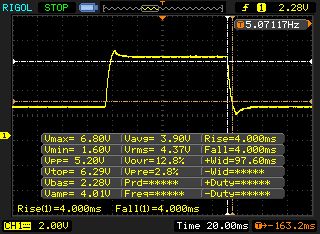 |
| ↘ 4 ms queda | ||
| A tela mostra taxas de resposta rápidas em nossos testes e deve ser adequada para jogos. Em comparação, todos os dispositivos testados variam de 0.165 (mínimo) a 636 (máximo) ms. » 21 % de todos os dispositivos são melhores. Isso significa que o tempo de resposta medido é melhor que a média de todos os dispositivos testados (30.9 ms). | ||
Cintilação da tela / PWM (modulação por largura de pulso)
| Tela tremeluzindo/PWM detectado | 26040 Hz | ≤ 17 % configuração de brilho | 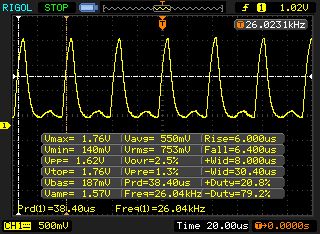 |
A luz de fundo da tela pisca em 26040 Hz (pior caso, por exemplo, utilizando PWM) Cintilação detectada em uma configuração de brilho de 17 % e abaixo. Não deve haver cintilação ou PWM acima desta configuração de brilho. A frequência de 26040 Hz é bastante alta, então a maioria dos usuários sensíveis ao PWM não deve notar nenhuma oscilação. [pwm_comparison] Em comparação: 52 % de todos os dispositivos testados não usam PWM para escurecer a tela. Se PWM foi detectado, uma média de 7748 (mínimo: 5 - máximo: 343500) Hz foi medida. | |||
| PCMark 8 | |
| Home Score Accelerated v2 | |
| Média da turma Gaming (n=1últimos 2 anos) | |
| Lenovo Legion Y740-17ICH | |
| MSI GE75 8SG Raider | |
| Asus ROG Strix Scar II GL704GW | |
| Média Intel Core i7-8750H, NVIDIA GeForce RTX 2080 Mobile (4124 - 4918, n=3) | |
| MSI GS73 Stealth 8RF-011 | |
| MSI GE75 8SF | |
| Work Score Accelerated v2 | |
| Lenovo Legion Y740-17ICH | |
| Asus ROG Strix Scar II GL704GW | |
| Média Intel Core i7-8750H, NVIDIA GeForce RTX 2080 Mobile (5574 - 5697, n=3) | |
| MSI GE75 8SG Raider | |
| MSI GE75 8SF | |
| MSI GS73 Stealth 8RF-011 | |
| Média da turma Gaming (n=1últimos 2 anos) | |
| PCMark 8 Home Score Accelerated v2 | 4918 pontos | |
| PCMark 8 Creative Score Accelerated v2 | 8493 pontos | |
| PCMark 8 Work Score Accelerated v2 | 5574 pontos | |
| PCMark 10 Score | 5816 pontos | |
Ajuda | ||
| MSI GE75 8SG Raider Kingston RBUSNS8154P3512GJ | Asus Zephyrus S GX701GX Samsung SSD PM981 MZVLB1T0HALR | Lenovo Legion Y740-17ICH Samsung SSD PM981 MZVLB256HAHQ | Asus ROG Strix Scar II GL704GW Intel SSD 660p SSDPEKNW512G8 | MSI GS73 Stealth 8RF-011 Samsung PM961 MZVLW256HEHP | MSI GE75 8SF Kingston RBUSNS8154P3256GJ1 | Média Kingston RBUSNS8154P3512GJ | |
|---|---|---|---|---|---|---|---|
| AS SSD | 88% | 31% | 11% | 38% | -12% | 1% | |
| Seq Read (MB/s) | 888 | 911 3% | 1153 30% | 1315 48% | 1749 97% | 949 7% | 1215 ? 37% |
| Seq Write (MB/s) | 906 | 2347 159% | 1328 47% | 927 2% | 1173 29% | 823 -9% | 897 ? -1% |
| 4K Read (MB/s) | 22.26 | 53 138% | 35.05 57% | 52.4 135% | 42.81 92% | 25.36 14% | 32.4 ? 46% |
| 4K Write (MB/s) | 83 | 122.5 48% | 96 16% | 122.8 48% | 98.4 19% | 67.1 -19% | 87.7 ? 6% |
| 4K-64 Read (MB/s) | 861 | 1577 83% | 727 -16% | 326.5 -62% | 1238 44% | 748 -13% | 796 ? -8% |
| 4K-64 Write (MB/s) | 697 | 1734 149% | 1212 74% | 727 4% | 691 -1% | 650 -7% | 672 ? -4% |
| Access Time Read * (ms) | 0.117 | 0.08 32% | 0.063 46% | 0.11 6% | 0.077 34% | 0.173 -48% | 0.115 ? 2% |
| Access Time Write * (ms) | 0.046 | 0.031 33% | 0.04 13% | 0.045 2% | 0.038 17% | 0.059 -28% | 0.07544 ? -64% |
| Score Read (Points) | 972 | 1721 77% | 878 -10% | 510 -48% | 1456 50% | 869 -11% | 950 ? -2% |
| Score Write (Points) | 870 | 2091 140% | 1441 66% | 942 8% | 906 4% | 799 -8% | 849 ? -2% |
| Score Total (Points) | 2340 | 4771 104% | 2784 19% | 1715 -27% | 3083 32% | 2109 -10% | 2274 ? -3% |
* ... menor é melhor

| 3DMark 11 Performance | 22658 pontos | |
| 3DMark Cloud Gate Standard Score | 35054 pontos | |
| 3DMark Fire Strike Score | 19661 pontos | |
| 3DMark Time Spy Score | 9018 pontos | |
Ajuda | ||
| baixo | média | alto | ultra | |
|---|---|---|---|---|
| The Witcher 3 (2015) | 276 | 230 | 162 | 92.1 |
| Dota 2 Reborn (2015) | 134.8 | 125.5 | 109 | 103.9 |
| Rise of the Tomb Raider (2016) | 236 | 174 | 155 | 145 |
| X-Plane 11.11 (2018) | 102 | 89 | 75 | |
| Shadow of the Tomb Raider (2018) | 126 | 111 | 106 | 99 |
| Assassin´s Creed Odyssey (2018) | 86 | 75 | 73 | 65 |
| Battlefield V (2018) | 144 | 132 | 117 | 111 |
| Darksiders III (2018) | 195 | 129 | 126 | 121 |
| Just Cause 4 (2018) | 181 | 161 | 118 | 116 |
| Far Cry New Dawn (2019) | 109 | 94 | 90 | 82 |
| Dirt Rally 2.0 (2019) | 216 | 159 | 144 | 96 |
Barulho
| Ocioso |
| 30 / 34 / 37 dB |
| HDD |
| 33 dB |
| Carga |
| 52 / 54 dB |
 | ||
30 dB silencioso 40 dB(A) audível 50 dB(A) ruidosamente alto |
||
min: | ||
| MSI GE75 8SG Raider GeForce RTX 2080 Mobile, i7-8750H, Kingston RBUSNS8154P3512GJ | Asus Zephyrus S GX701GX GeForce RTX 2080 Max-Q, i7-8750H, Samsung SSD PM981 MZVLB1T0HALR | Lenovo Legion Y740-17ICH GeForce RTX 2080 Max-Q, i7-8750H, Samsung SSD PM981 MZVLB256HAHQ | Asus ROG Strix Scar II GL704GW GeForce RTX 2070 Mobile, i7-8750H, Intel SSD 660p SSDPEKNW512G8 | MSI GS73 Stealth 8RF-011 GeForce GTX 1070 Max-Q, i7-8750H, Samsung PM961 MZVLW256HEHP | MSI GE75 8SF GeForce RTX 2070 Mobile, i7-8750H, Kingston RBUSNS8154P3256GJ1 | |
|---|---|---|---|---|---|---|
| Noise | 7% | 14% | 3% | 7% | 4% | |
| desligado / ambiente * (dB) | 30 | 29 3% | 28.3 6% | 29 3% | 30 -0% | 28.3 6% |
| Idle Minimum * (dB) | 30 | 29 3% | 31.5 -5% | 29 3% | 30 -0% | 33.5 -12% |
| Idle Average * (dB) | 34 | 32 6% | 31.6 7% | 32 6% | 34 -0% | 33.6 1% |
| Idle Maximum * (dB) | 37 | 33 11% | 31.6 15% | 40 -8% | 36 3% | 35 5% |
| Load Average * (dB) | 52 | 47 10% | 32.3 38% | 46 12% | 43 17% | 38 27% |
| Witcher 3 ultra * (dB) | 53 | 49 8% | 43 19% | 51 4% | 45 15% | 50 6% |
| Load Maximum * (dB) | 54 | 51 6% | 45.5 16% | 52 4% | 45 17% | 56.9 -5% |
* ... menor é melhor
(-) A temperatura máxima no lado superior é 46 °C / 115 F, em comparação com a média de 40.4 °C / 105 F , variando de 21.2 a 68.8 °C para a classe Gaming.
(±) A parte inferior aquece até um máximo de 45 °C / 113 F, em comparação com a média de 43.2 °C / 110 F
(+) Em uso inativo, a temperatura média para o lado superior é 25.8 °C / 78 F, em comparação com a média do dispositivo de 33.9 °C / ### class_avg_f### F.
(-) Jogando The Witcher 3, a temperatura média para o lado superior é 42 °C / 108 F, em comparação com a média do dispositivo de 33.9 °C / ## #class_avg_f### F.
(-) Os apoios para as mãos e o touchpad podem ficar muito quentes ao toque, com um máximo de 40 °C / 104 F.
(-) A temperatura média da área do apoio para as mãos de dispositivos semelhantes foi 28.8 °C / 83.8 F (-11.2 °C / -20.2 F).
MSI GE75 8SG Raider análise de áudio
(+) | os alto-falantes podem tocar relativamente alto (###valor### dB)
Graves 100 - 315Hz
(-) | quase nenhum baixo - em média 15.7% menor que a mediana
(±) | a linearidade dos graves é média (12.1% delta para a frequência anterior)
Médios 400 - 2.000 Hz
(±) | médios reduzidos - em média 5.1% menor que a mediana
(+) | médios são lineares (5.8% delta para frequência anterior)
Altos 2 - 16 kHz
(+) | agudos equilibrados - apenas 2.7% longe da mediana
(+) | os máximos são lineares (3.2% delta da frequência anterior)
Geral 100 - 16.000 Hz
(+) | o som geral é linear (12.8% diferença em relação à mediana)
Comparado com a mesma classe
» 16% de todos os dispositivos testados nesta classe foram melhores, 4% semelhantes, 80% piores
» O melhor teve um delta de 6%, a média foi 18%, o pior foi 132%
Comparado com todos os dispositivos testados
» 12% de todos os dispositivos testados foram melhores, 3% semelhantes, 85% piores
» O melhor teve um delta de 4%, a média foi 23%, o pior foi 134%
MSI GS73 Stealth 8RF-011 análise de áudio
(+) | os alto-falantes podem tocar relativamente alto (###valor### dB)
Graves 100 - 315Hz
(-) | quase nenhum baixo - em média 21.6% menor que a mediana
(±) | a linearidade dos graves é média (9% delta para a frequência anterior)
Médios 400 - 2.000 Hz
(±) | médios mais altos - em média 6.4% maior que a mediana
(+) | médios são lineares (6.7% delta para frequência anterior)
Altos 2 - 16 kHz
(±) | máximos reduzidos - em média 5% menor que a mediana
(±) | a linearidade dos máximos é média (8.1% delta para frequência anterior)
Geral 100 - 16.000 Hz
(±) | a linearidade do som geral é média (19.3% diferença em relação à mediana)
Comparado com a mesma classe
» 65% de todos os dispositivos testados nesta classe foram melhores, 8% semelhantes, 27% piores
» O melhor teve um delta de 6%, a média foi 18%, o pior foi 132%
Comparado com todos os dispositivos testados
» 47% de todos os dispositivos testados foram melhores, 8% semelhantes, 46% piores
» O melhor teve um delta de 4%, a média foi 23%, o pior foi 134%
| desligado | |
| Ocioso | |
| Carga |
|
Key:
min: | |
| MSI GE75 8SG Raider i7-8750H, GeForce RTX 2080 Mobile, Kingston RBUSNS8154P3512GJ, AHVA, 1920x1080, 17.3" | Asus Zephyrus S GX701GX i7-8750H, GeForce RTX 2080 Max-Q, Samsung SSD PM981 MZVLB1T0HALR, IPS, 1920x1080, 17.3" | Lenovo Legion Y740-17ICH i7-8750H, GeForce RTX 2080 Max-Q, Samsung SSD PM981 MZVLB256HAHQ, IPS, 1920x1080, 17.3" | Asus ROG Strix Scar II GL704GW i7-8750H, GeForce RTX 2070 Mobile, Intel SSD 660p SSDPEKNW512G8, AHVA, 1920x1080, 17.3" | MSI GS73 Stealth 8RF-011 i7-8750H, GeForce GTX 1070 Max-Q, Samsung PM961 MZVLW256HEHP, TN, 1920x1080, 17.3" | MSI GE75 8SF i7-8750H, GeForce RTX 2070 Mobile, Kingston RBUSNS8154P3256GJ1, IPS, 1920x1080, 17.3" | Média NVIDIA GeForce RTX 2080 Mobile | Média da turma Gaming | |
|---|---|---|---|---|---|---|---|---|
| Power Consumption | -38% | -40% | -41% | 6% | -30% | -101% | -29% | |
| Idle Minimum * (Watt) | 7 | 19 -171% | 20.2 -189% | 19 -171% | 8 -14% | 16.4 -134% | 24.6 ? -251% | 13 ? -86% |
| Idle Average * (Watt) | 15 | 22 -47% | 27.2 -81% | 22 -47% | 14 7% | 21.9 -46% | 31.4 ? -109% | 19 ? -27% |
| Idle Maximum * (Watt) | 22 | 30 -36% | 28.7 -30% | 29 -32% | 22 -0% | 25.4 -15% | 41.8 ? -90% | 24.5 ? -11% |
| Load Average * (Watt) | 92 | 104 -13% | 90.8 1% | 102 -11% | 92 -0% | 90.7 1% | 112 ? -22% | 111.1 ? -21% |
| Witcher 3 ultra * (Watt) | 207 | 167 19% | 152.1 27% | 190 8% | 154 26% | 203.3 2% | ||
| Load Maximum * (Watt) | 254 | 203 20% | 165.4 35% | 231 9% | 207 19% | 222.9 12% | 344 ? -35% | 260 ? -2% |
* ... menor é melhor
| MSI GE75 8SG Raider i7-8750H, GeForce RTX 2080 Mobile, 65 Wh | Asus Zephyrus S GX701GX i7-8750H, GeForce RTX 2080 Max-Q, 76 Wh | Lenovo Legion Y740-17ICH i7-8750H, GeForce RTX 2080 Max-Q, 76 Wh | Asus ROG Strix Scar II GL704GW i7-8750H, GeForce RTX 2070 Mobile, 66 Wh | MSI GS73 Stealth 8RF-011 i7-8750H, GeForce GTX 1070 Max-Q, 51 Wh | MSI GE75 8SF i7-8750H, GeForce RTX 2070 Mobile, 65 Wh | Média da turma Gaming | |
|---|---|---|---|---|---|---|---|
| Duração da bateria | -18% | -32% | -1% | -15% | -26% | 41% | |
| Reader / Idle (h) | 7.8 | 5 -36% | 6.2 -21% | 5.8 -26% | 8.27 ? 6% | ||
| WiFi v1.3 (h) | 4.7 | 3.8 -19% | 3.2 -32% | 3.9 -17% | 3.3 -30% | 3.5 -26% | 7.11 ? 51% |
| Witcher 3 ultra (h) | 0.8 | 0.9 13% | |||||
| Load (h) | 0.9 | 0.9 0% | 1.1 22% | 1 11% | 1.502 ? 67% |
Pro
Contra
Verdict – The upgrade is a good investment
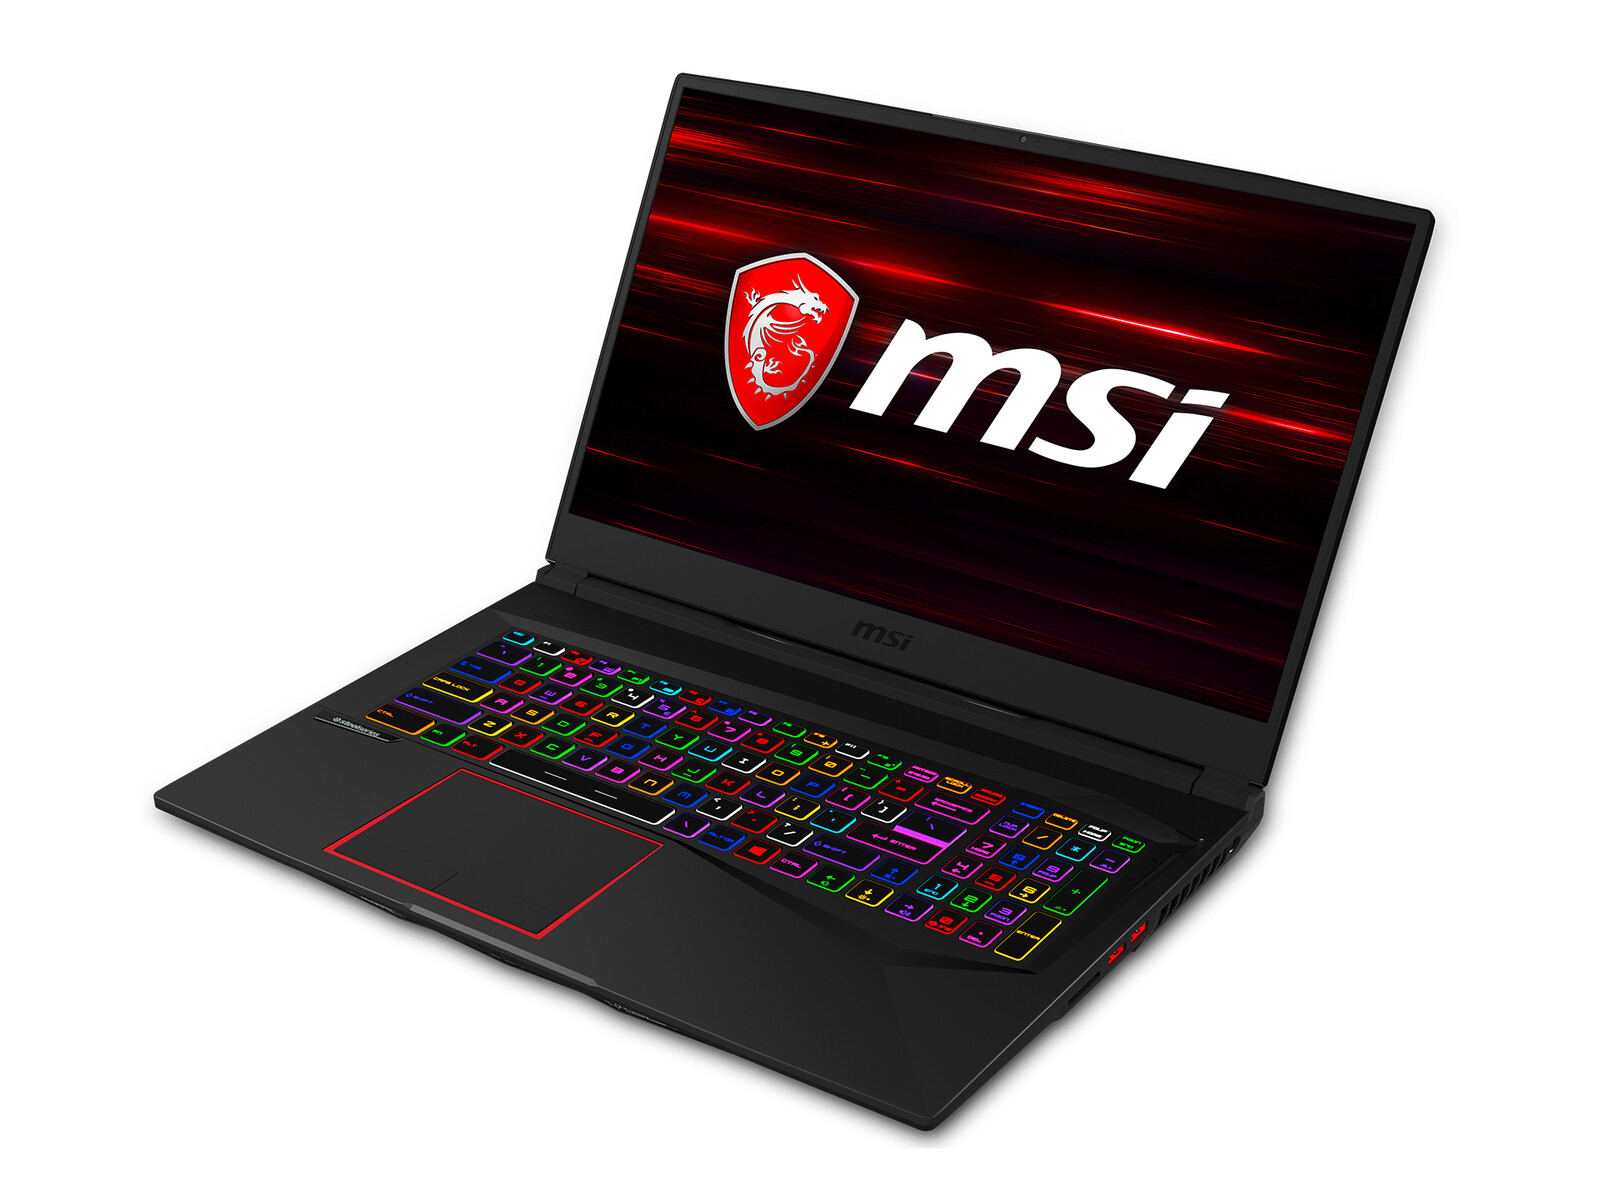
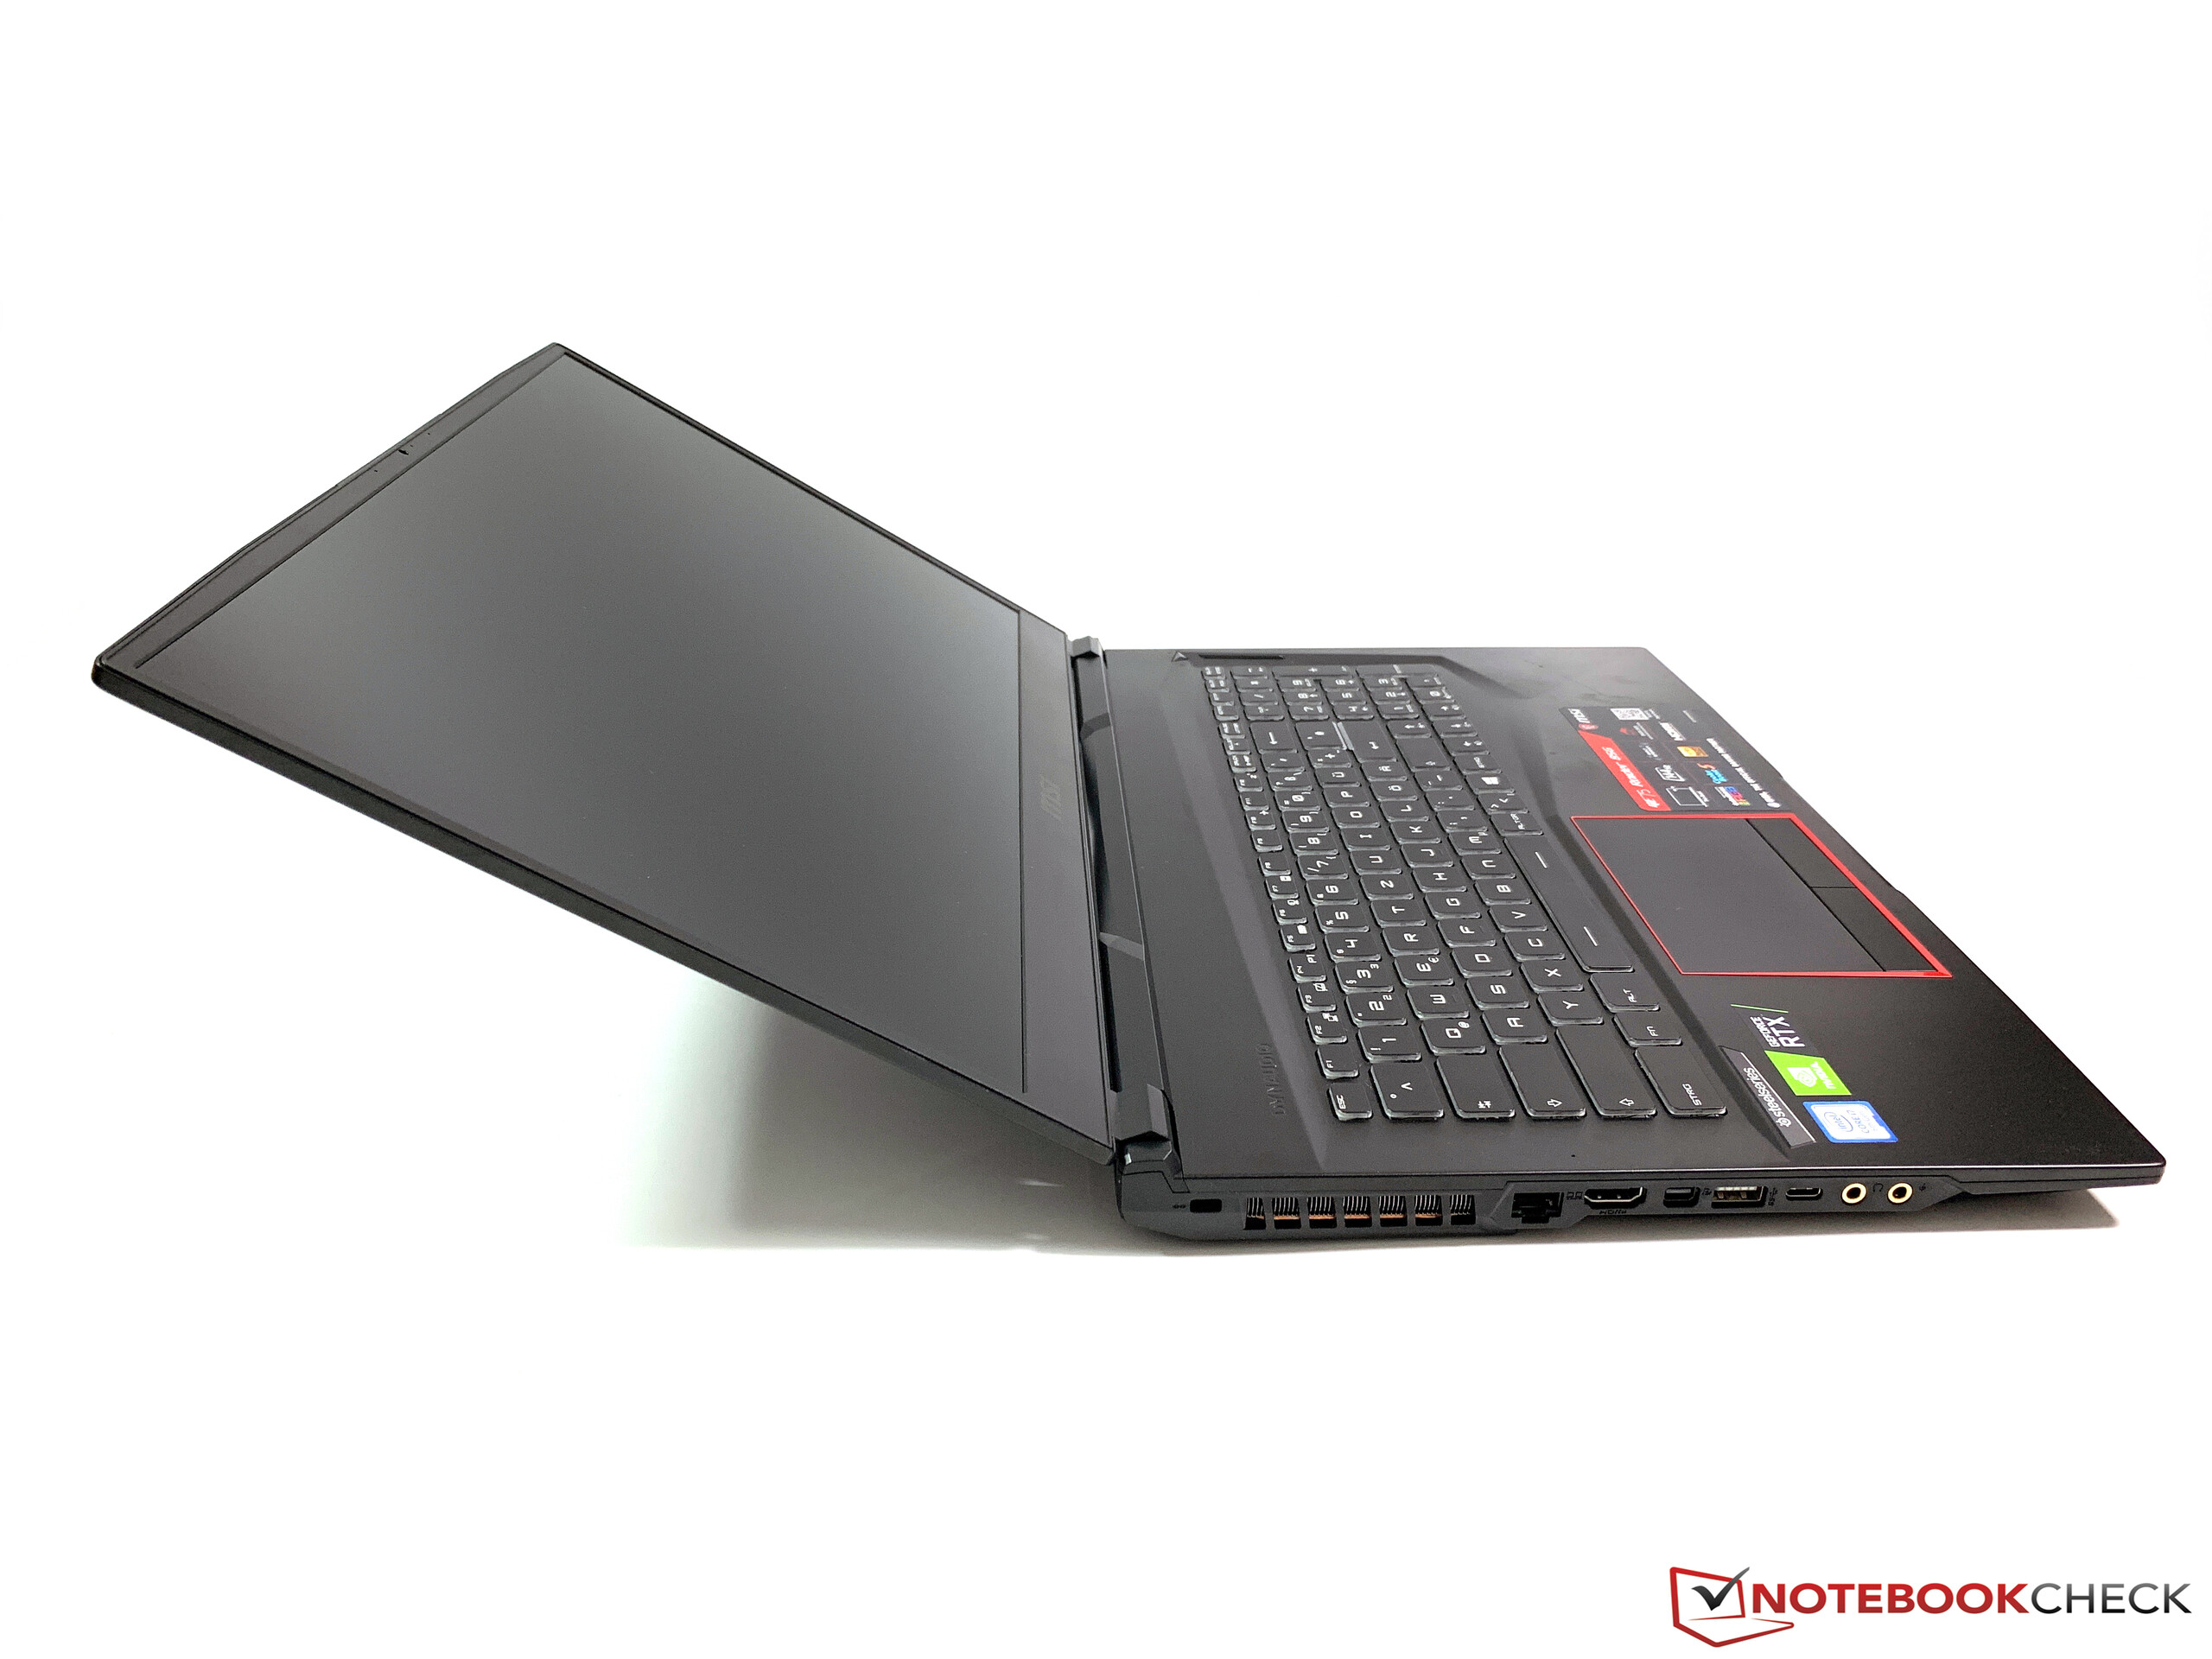
O novo MSI GE75 Raider é visivelmente mais compacto comparado ao seu antecessor, mas agora possui uma GPU muito mais potente. Se você estiver disposto a pagar o alto preço pela RTX 2080, não desperdiçará seu dinheiro graças à boa utilização do desempenho em comparação aos SKUs mais baratos com o RTX 2070 ou RTX 2060. O desempenho da CPU certamente pode ser um pouco melhor, mas atualmente não há limitações nos jogos.
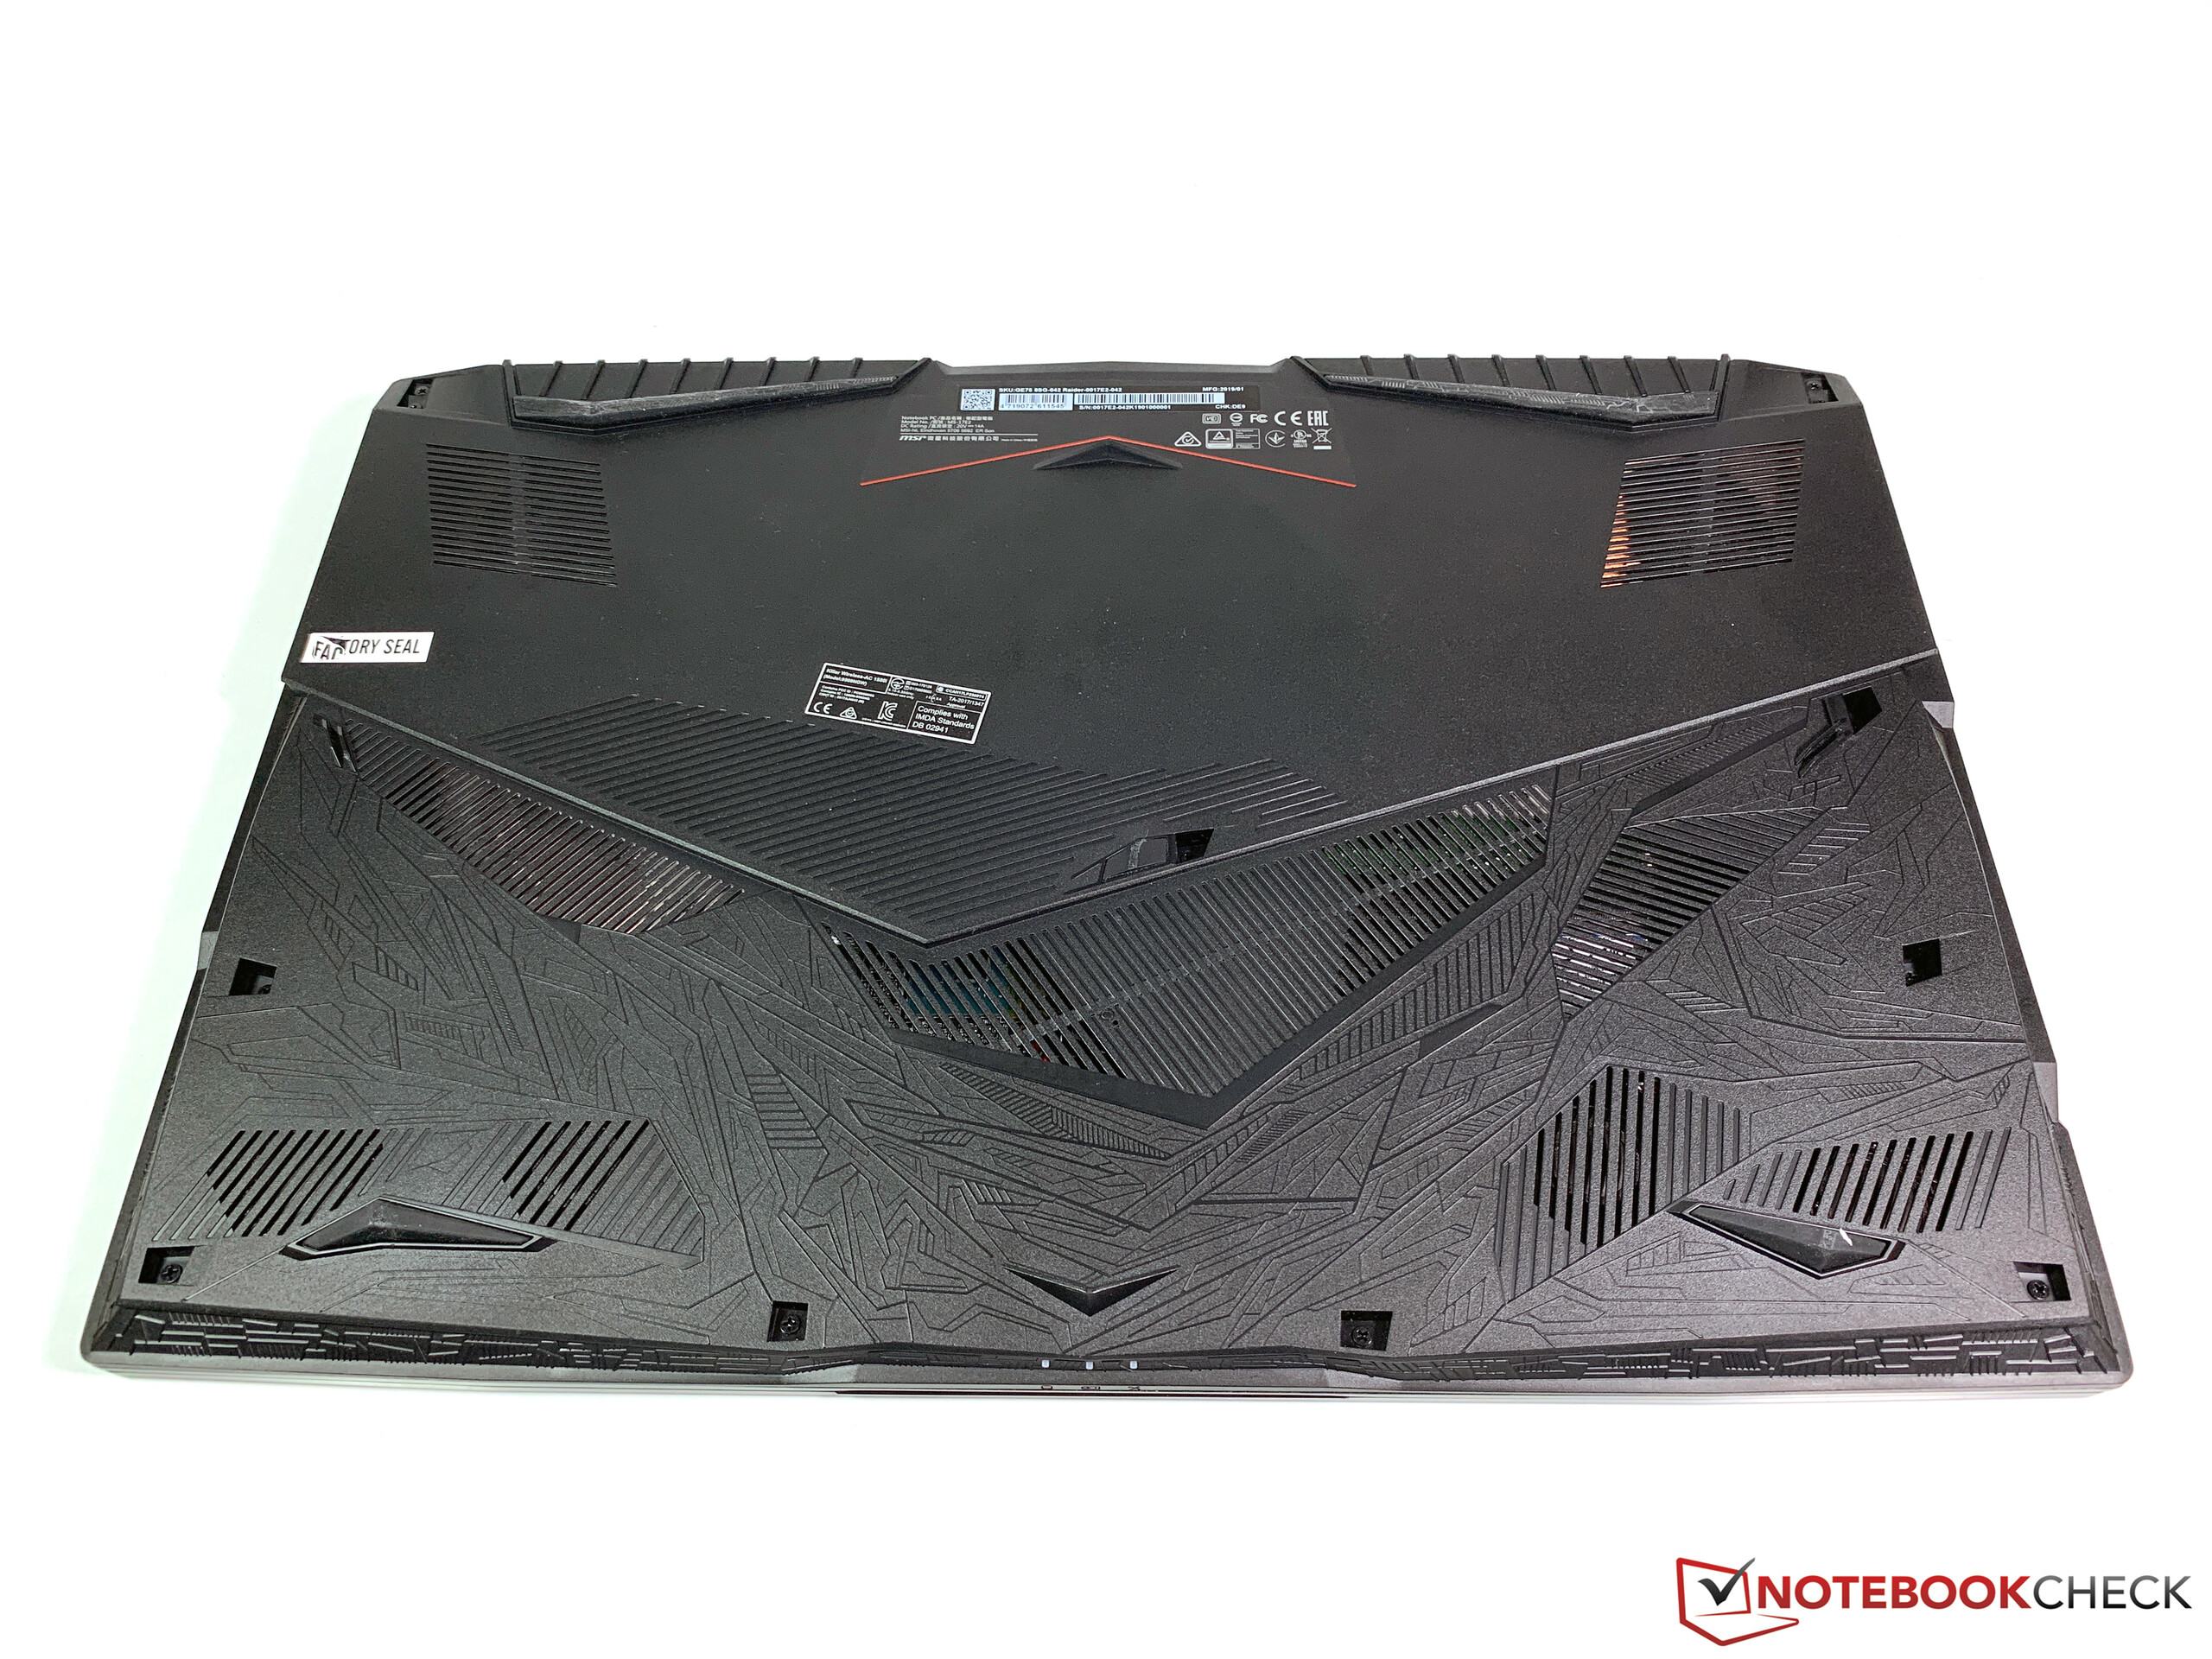
Menor, mais fino, mais rápido - esse é um grande desafio para a solução de resfriamento. A MSI gerencia uma dissipação eficaz do calor sem grandes penalidades sobre o desempenho. A desvantagem é o barulho do ventilador, e você também ouve o murmúrio da rápida unidade de 7200 rpm enquanto está no modo inativo.
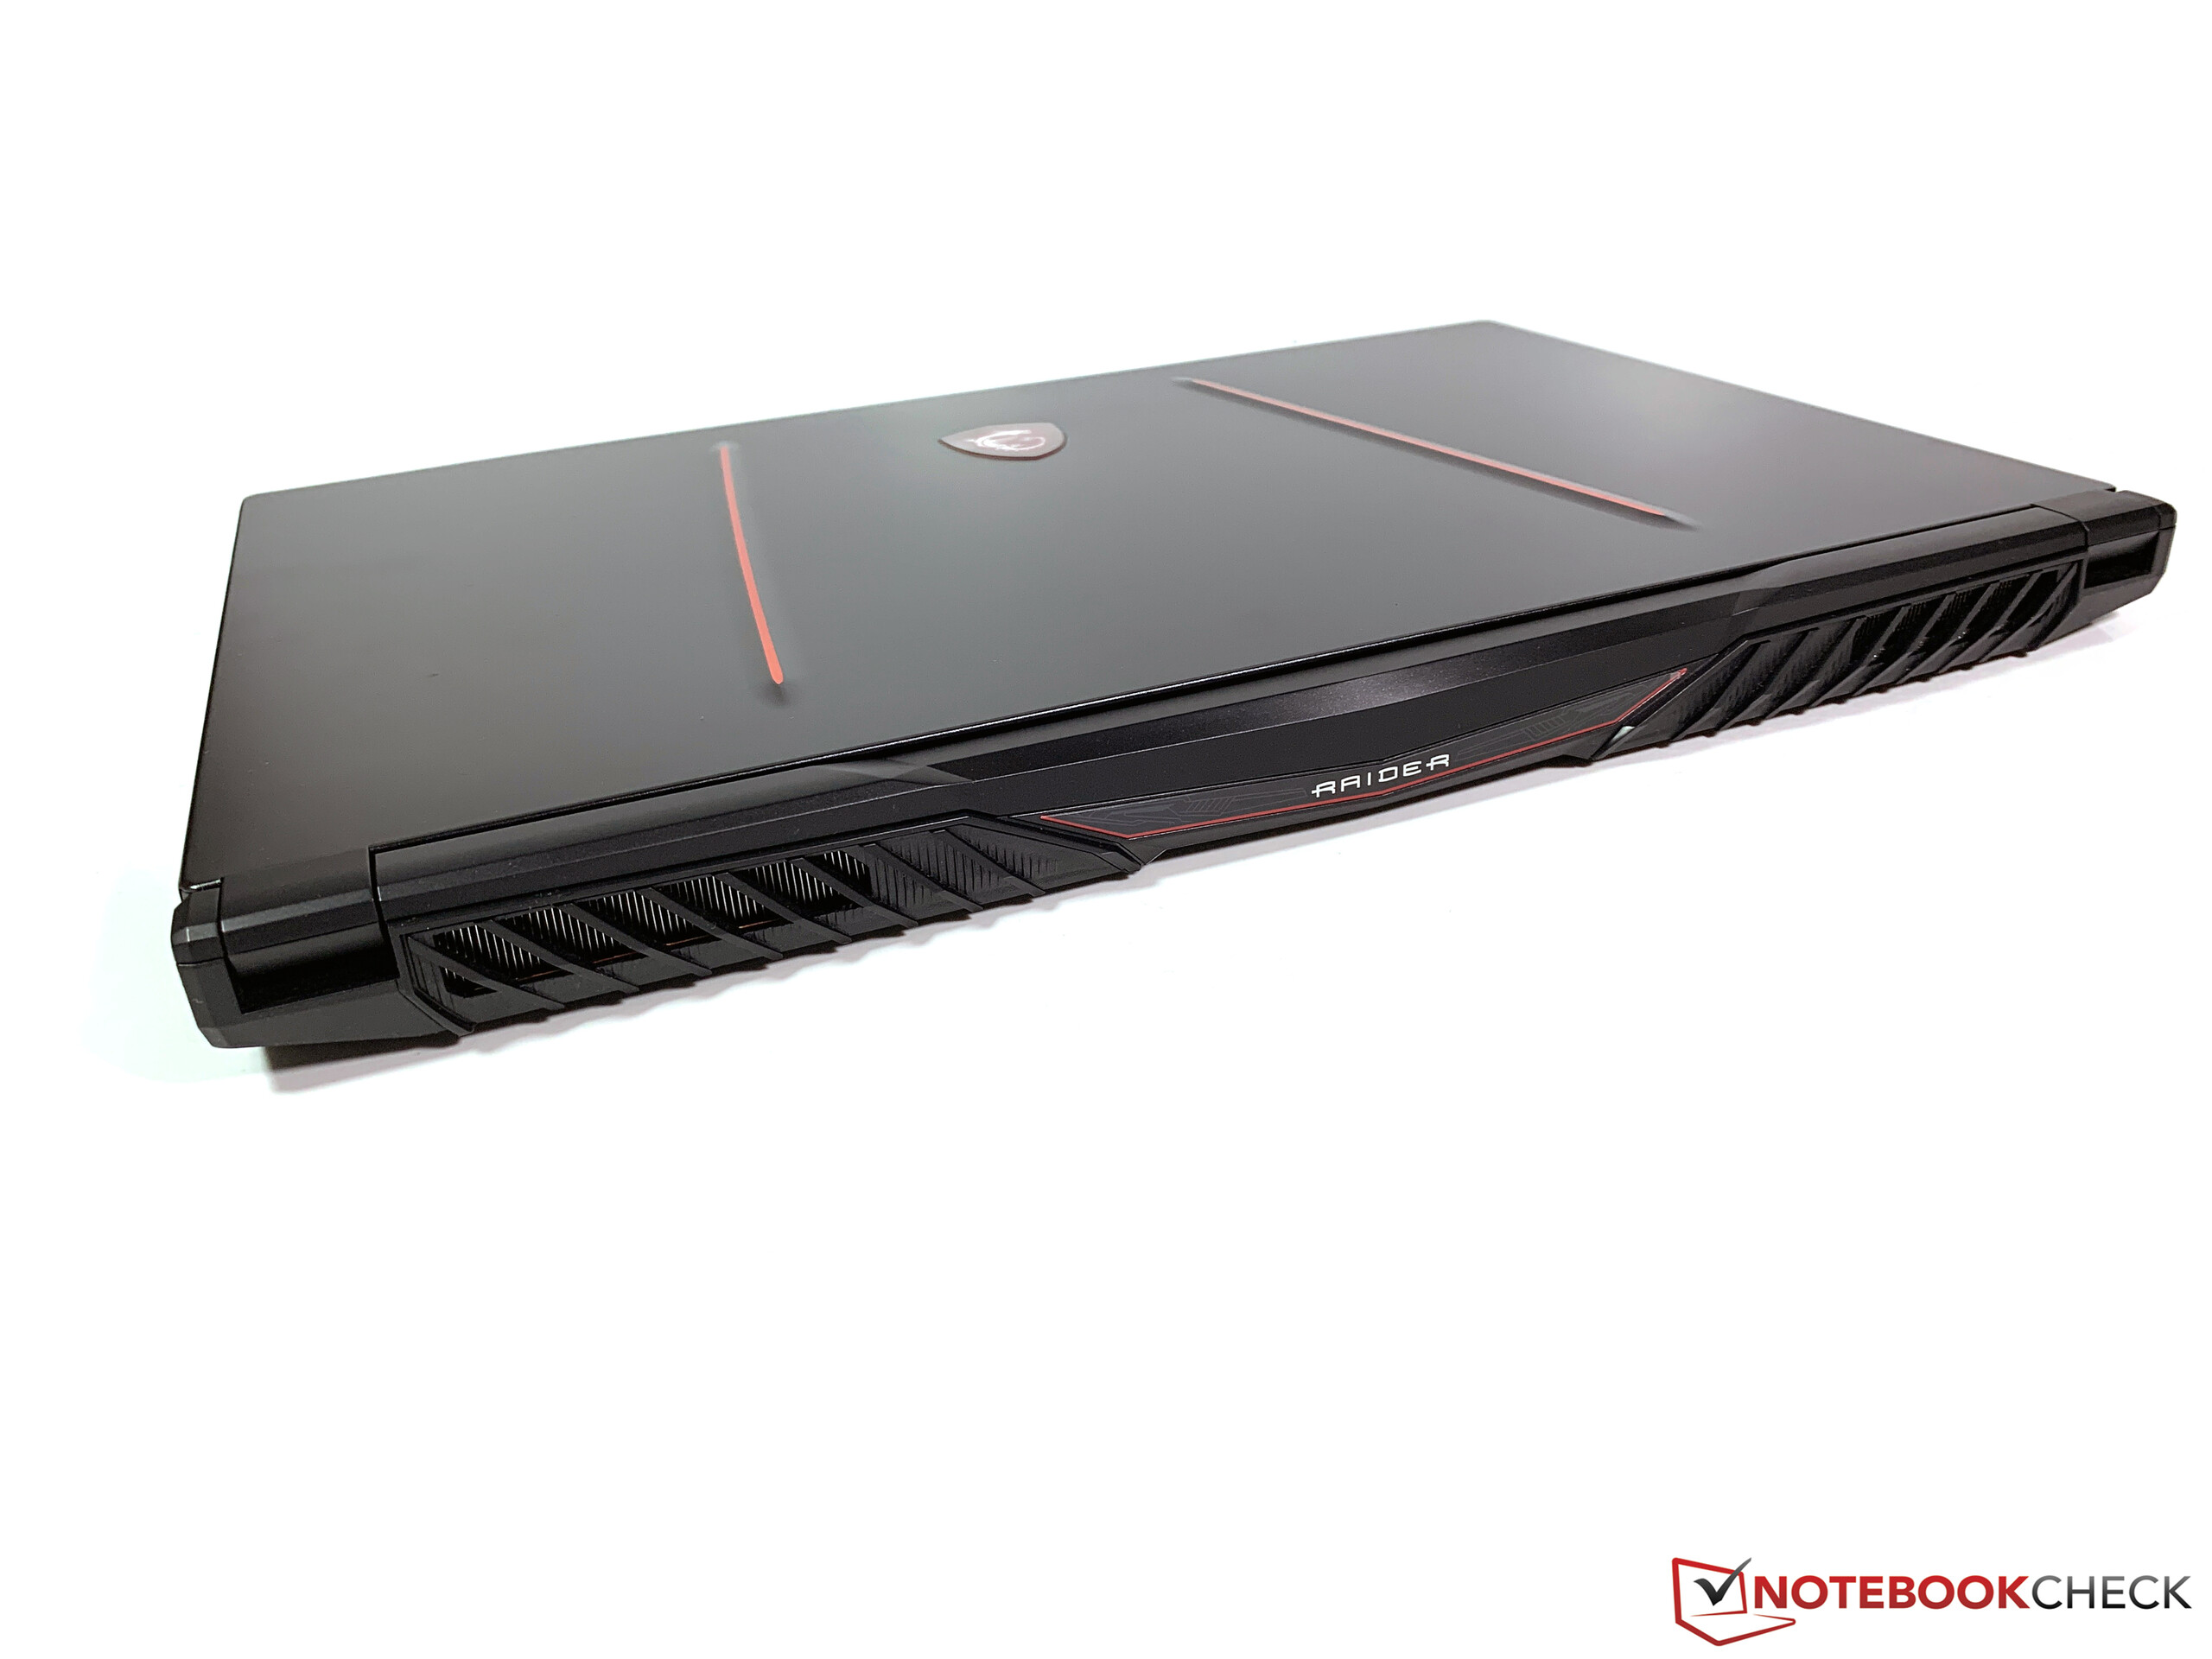
Outras desvantagens incluem as superfícies, que rapidamente atraem sujeira e digitais e precisam ser limpas regularmente. Um portátil por 3000 Euros também deve contar com o Thunderbolt 3. Não temos certeza sobre a falta do G-Sync. O portátil é relativamente compacto para um dispositivo de 17 polegadas, mas a mobilidade certamente não é o aspecto mais importante para os compradores em potencial.
A atualização da GPU para o MSI GE75 Raider é um bom investimento e você pode realmente usar o desempenho adicional, apesar do chassi fino. Existem algumas falhas em termos de conectividade, mas não podemos encontrar problemas importantes que afetem a experiência de jogo.
MSI GE75 8SG Raider
- 03/25/2019 v6 (old)
Andreas Osthoff
Price comparison
