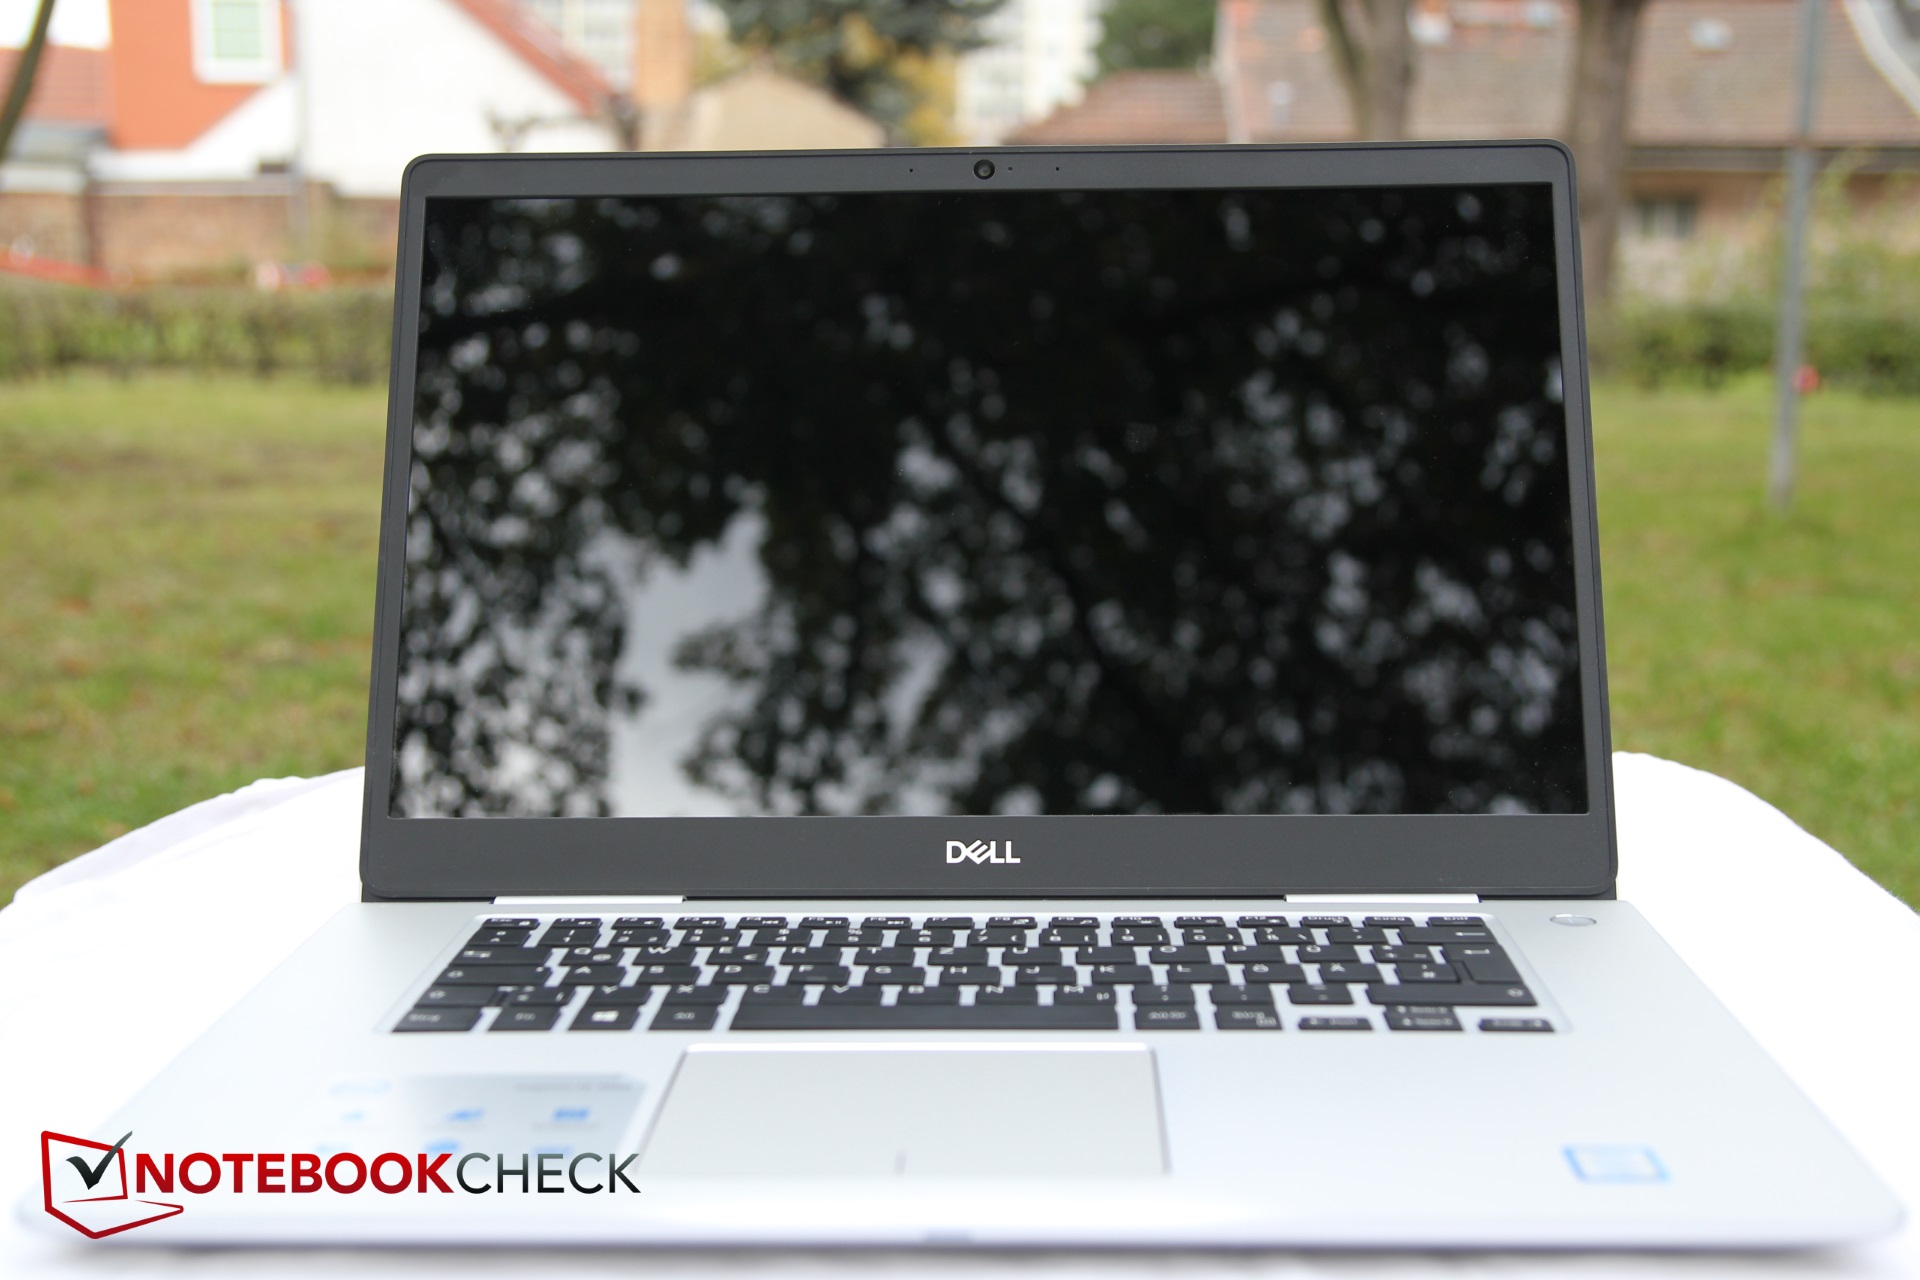
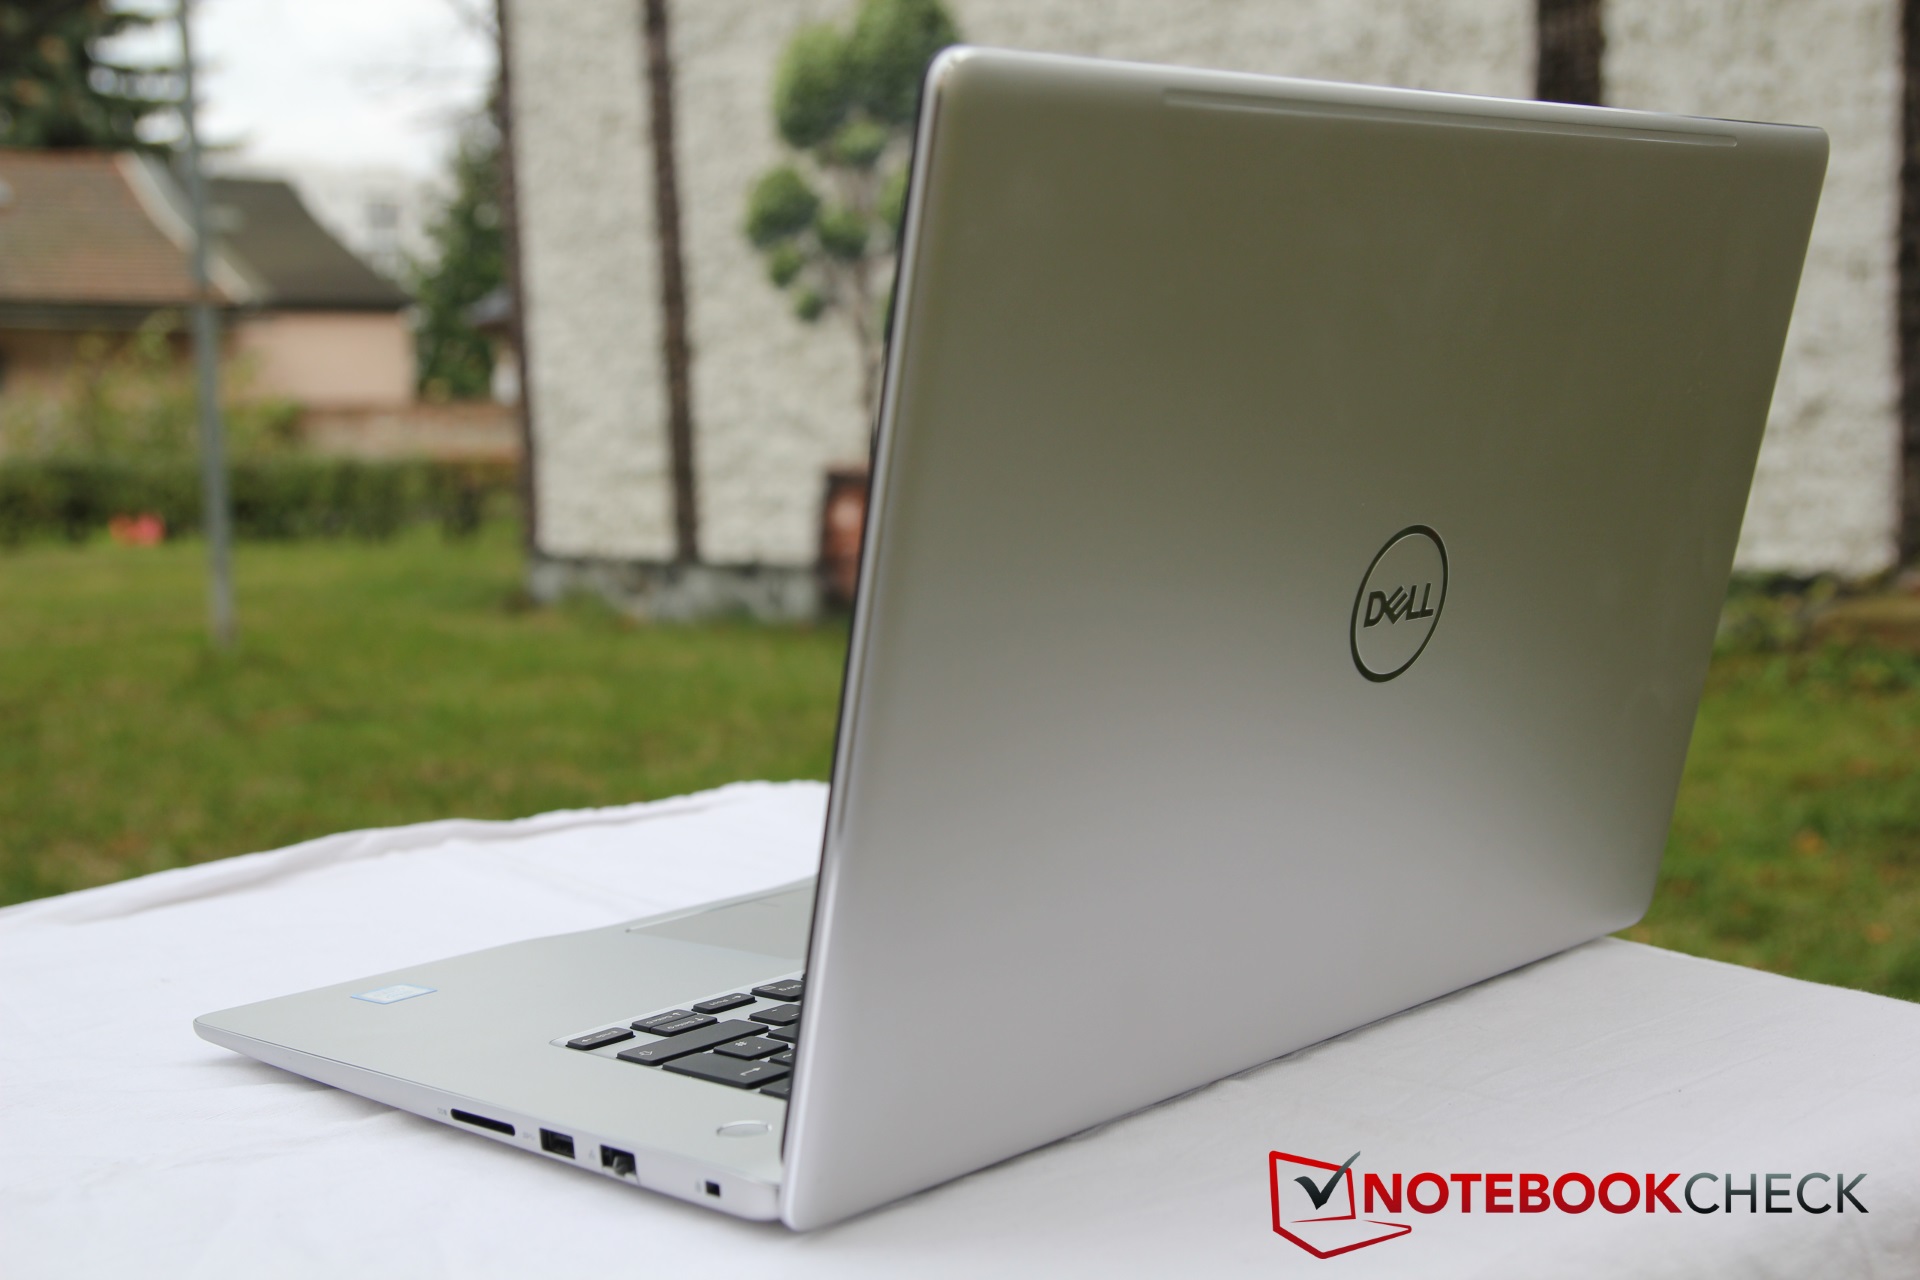
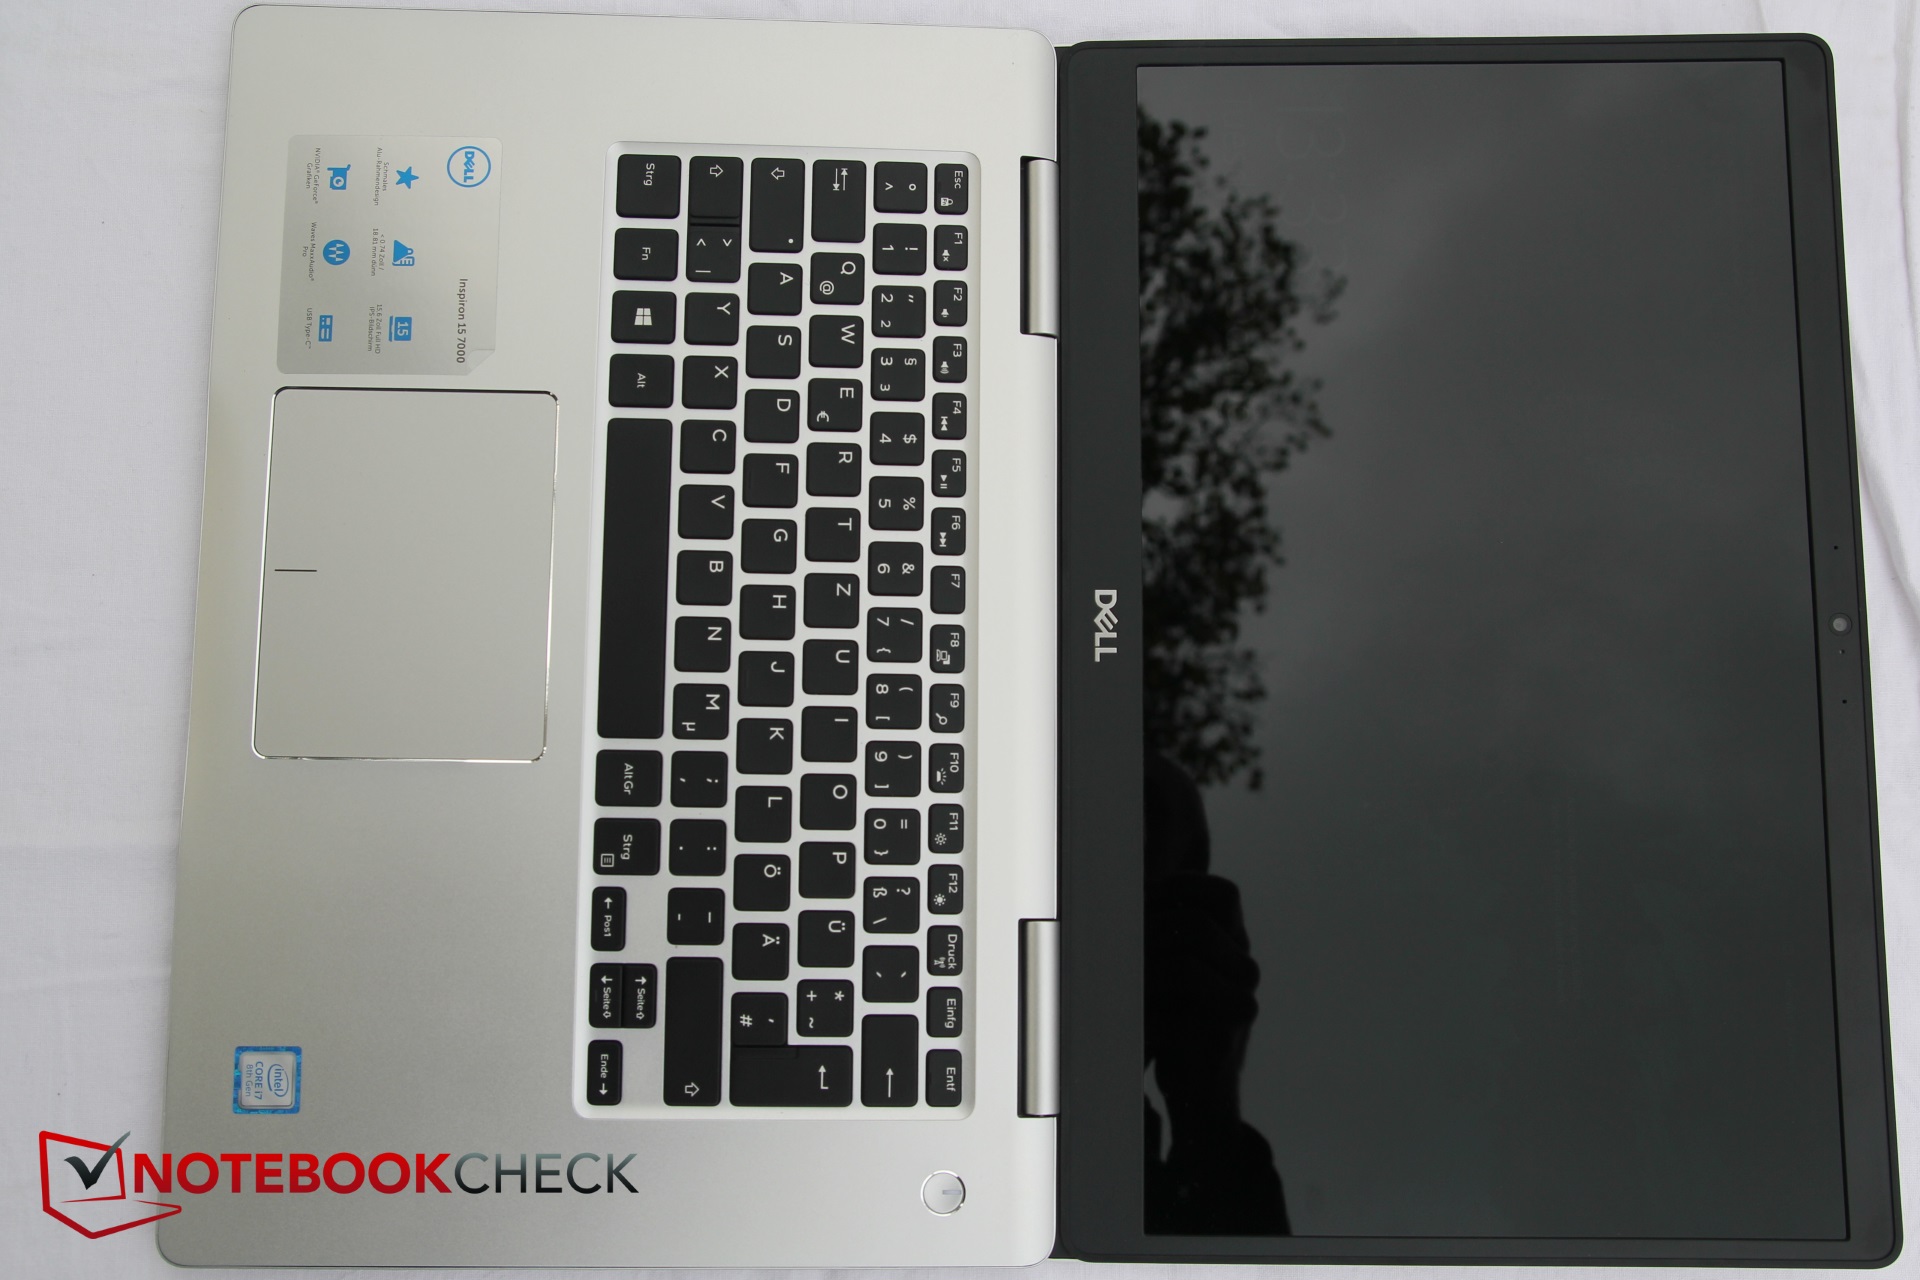
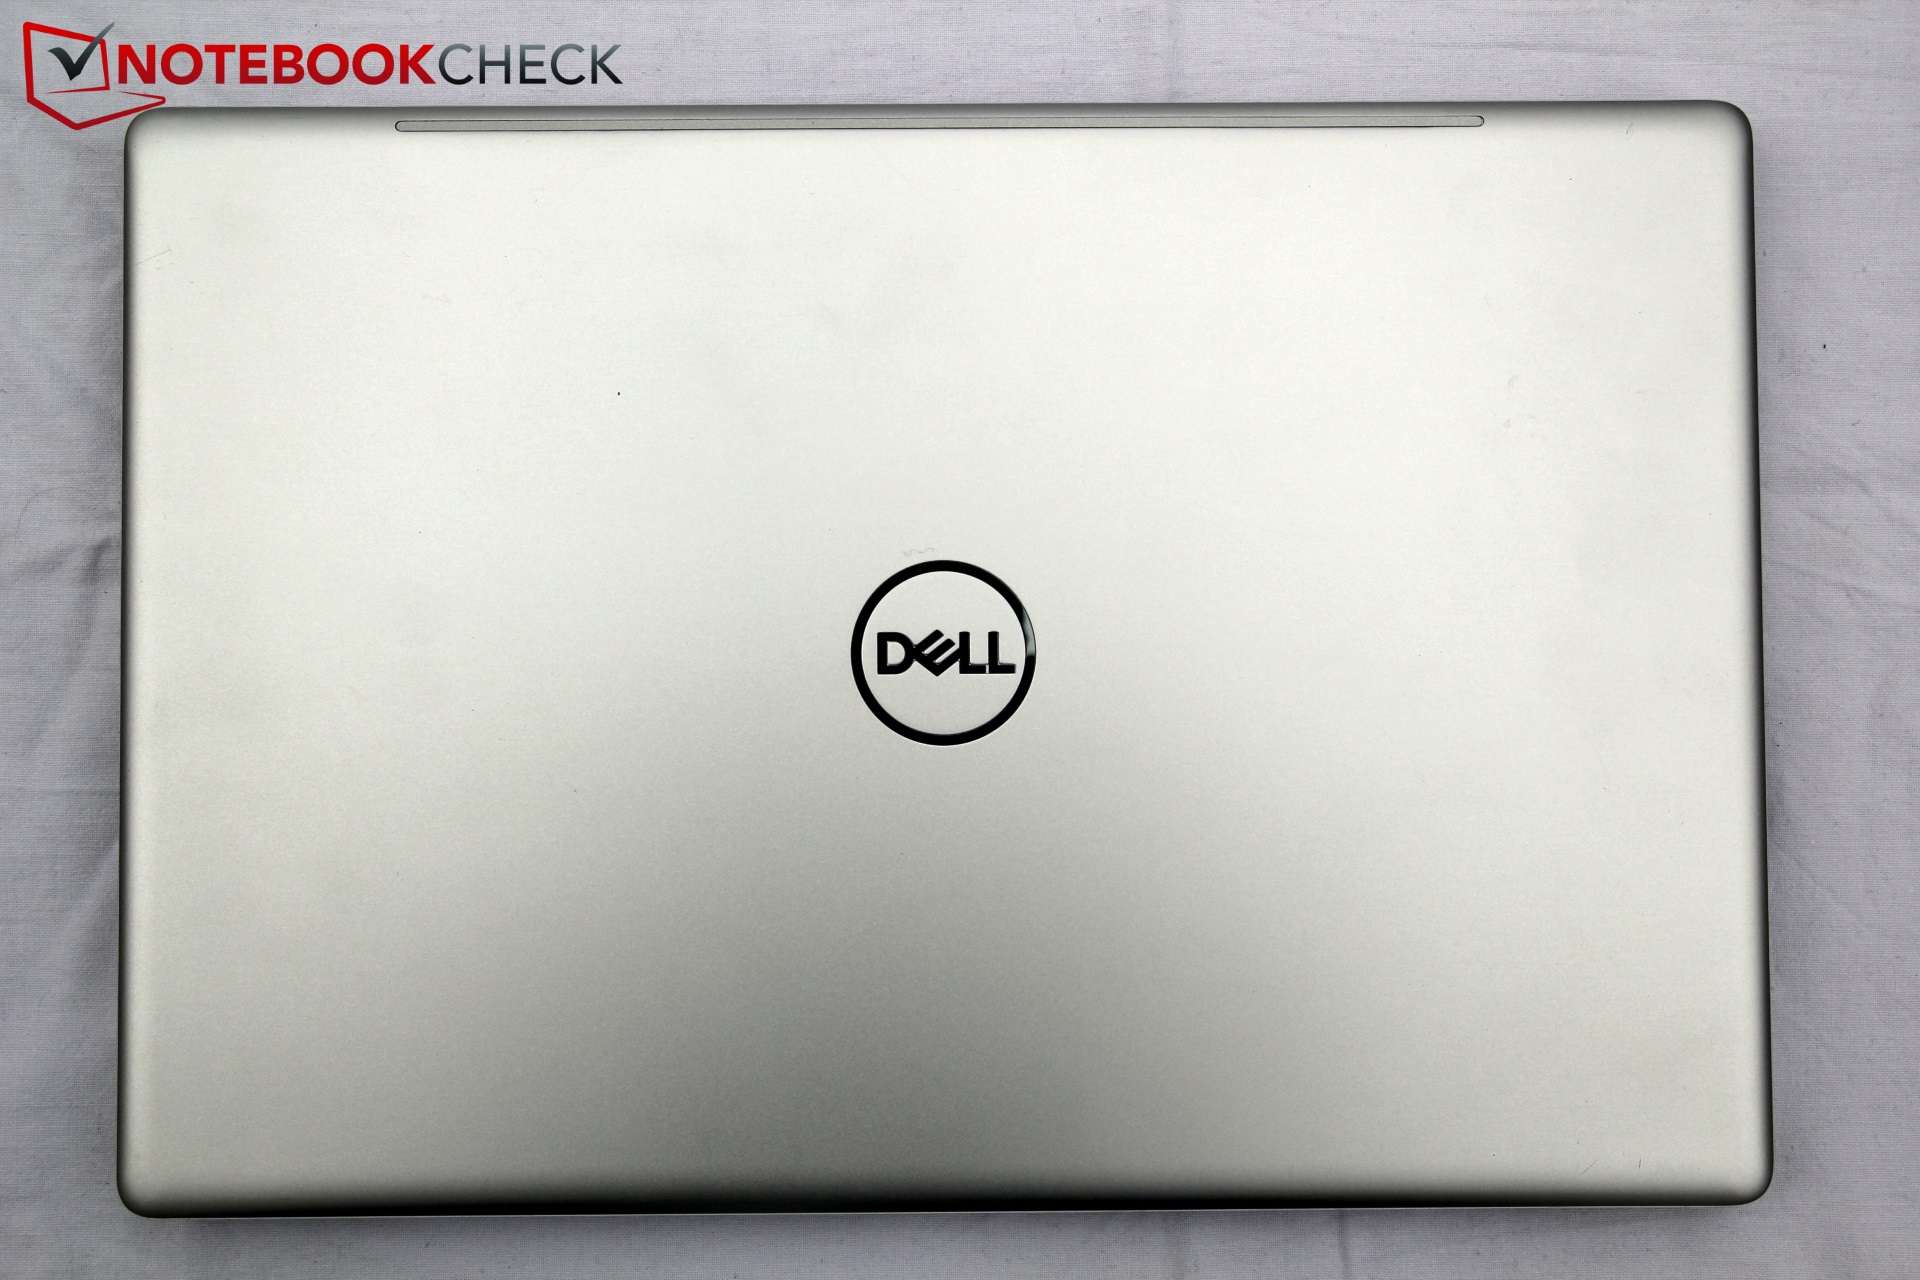
Breve Análise do Portátil Dell Inspiron 15 7570 (i7-8550U, 940MX)
| SD Card Reader | |
| average JPG Copy Test (av. of 3 runs) | |
| Acer TravelMate P658-G2-MG-7327 (Toshiba Exceria Pro SDXC 64 GB UHS-II) | |
| Lenovo IdeaPad 510-15IKB 80SV0087GE (Toshiba Exceria Pro SDXC 64 GB UHS-II) | |
| Asus Vivobook S15 S510UQ-BQ189T (Toshiba Exceria Pro SDXC 64 GB UHS-II) | |
| Dell Inspiron 15 7570 (Toshiba Exceria Pro SDXC 64 GB UHS-II) | |
| Dell Inspiron 15 5000 5567-1753 (Toshiba Exceria Pro SDXC 64 GB UHS-II) | |
| maximum AS SSD Seq Read Test (1GB) | |
| Acer TravelMate P658-G2-MG-7327 (Toshiba Exceria Pro SDXC 64 GB UHS-II) | |
| Asus Vivobook S15 S510UQ-BQ189T (Toshiba Exceria Pro SDXC 64 GB UHS-II) | |
| Dell Inspiron 15 7570 (Toshiba Exceria Pro SDXC 64 GB UHS-II) | |
| Dell Inspiron 15 5000 5567-1753 (Toshiba Exceria Pro SDXC 64 GB UHS-II) | |
| Lenovo IdeaPad 510-15IKB 80SV0087GE (Toshiba Exceria Pro SDXC 64 GB UHS-II) | |
| Networking | |
| iperf3 transmit AX12 | |
| Asus Vivobook S15 S510UQ-BQ189T | |
| Dell Inspiron 15 7570 | |
| Huawei MateBook D 15, i7-7500U 940MX | |
| Dell Inspiron 15 5000 5567-1753 | |
| Acer TravelMate P658-G2-MG-7327 | |
| iperf3 receive AX12 | |
| Huawei MateBook D 15, i7-7500U 940MX | |
| Dell Inspiron 15 7570 | |
| Asus Vivobook S15 S510UQ-BQ189T | |
| Acer TravelMate P658-G2-MG-7327 | |
| Dell Inspiron 15 5000 5567-1753 | |
| |||||||||||||||||||||||||
iluminação: 91 %
iluminação com acumulador: 255 cd/m²
Contraste: 1594:1 (Preto: 0.16 cd/m²)
ΔE ColorChecker Calman: 4.74 | ∀{0.5-29.43 Ø4.71}
ΔE Greyscale Calman: 3.44 | ∀{0.09-98 Ø4.96}
60% sRGB (Argyll 1.6.3 3D)
38% AdobeRGB 1998 (Argyll 1.6.3 3D)
41.77% AdobeRGB 1998 (Argyll 3D)
60% sRGB (Argyll 3D)
40.43% Display P3 (Argyll 3D)
Gamma: 2.43
CCT: 7064 K
| Dell Inspiron 15 7570 BOE06B4, , 1920x1080, 15.6" | Asus Vivobook S15 S510UQ-BQ189T AU Optronics B156W02 / AUO B156HAN02.1, , 1920x1080, 15.6" | Acer TravelMate P658-G2-MG-7327 LG Philips LP156WF6-SPP1, , 1920x1080, 15.6" | Lenovo IdeaPad 510-15IKB 80SV0087GE BOE HF NV156FHM-N42, , 1920x1080, 15.6" | Huawei MateBook D 15, i7-7500U 940MX BOE070C, , 1920x1080, 15.6" | Dell Inspiron 15 5000 5567-1753 BOE NT15N41, , 1920x1080, 15.6" | |
|---|---|---|---|---|---|---|
| Display | -3% | 51% | 6% | 3% | -10% | |
| Display P3 Coverage (%) | 40.43 | 38.94 -4% | 64.9 61% | 42.66 6% | 41.79 3% | 36.24 -10% |
| sRGB Coverage (%) | 60 | 58.5 -2% | 85.9 43% | 64.1 7% | 61.5 2% | 54.6 -9% |
| AdobeRGB 1998 Coverage (%) | 41.77 | 40.23 -4% | 62.8 50% | 44.08 6% | 43.17 3% | 37.44 -10% |
| Response Times | 6% | 16% | -14% | -8% | 31% | |
| Response Time Grey 50% / Grey 80% * (ms) | 45 ? | 47 ? -4% | 38 ? 16% | 51 ? -13% | 46.4 ? -3% | 43 ? 4% |
| Response Time Black / White * (ms) | 33 ? | 28 ? 15% | 28 ? 15% | 38 ? -15% | 36.8 ? -12% | 14 ? 58% |
| PWM Frequency (Hz) | 996 ? | 21000 ? | 50 ? | 21190 | ||
| Screen | -1% | -3% | -6% | -45% | -86% | |
| Brightness middle (cd/m²) | 255 | 293 15% | 284 11% | 291 14% | 268 5% | 145 -43% |
| Brightness (cd/m²) | 240 | 275 15% | 276 15% | 265 10% | 258 8% | 144 -40% |
| Brightness Distribution (%) | 91 | 86 -5% | 82 -10% | 86 -5% | 92 1% | 90 -1% |
| Black Level * (cd/m²) | 0.16 | 0.25 -56% | 0.295 -84% | 0.23 -44% | 0.47 -194% | 0.49 -206% |
| Contrast (:1) | 1594 | 1172 -26% | 963 -40% | 1265 -21% | 570 -64% | 296 -81% |
| Colorchecker dE 2000 * | 4.74 | 3.81 20% | 4.07 14% | 4.78 -1% | 5.7 -20% | 9.27 -96% |
| Colorchecker dE 2000 max. * | 7.68 | 6.64 14% | 10.52 -37% | 9.51 -24% | 21.7 -183% | 16.9 -120% |
| Greyscale dE 2000 * | 3.44 | 2.66 23% | 3.13 9% | 3.49 -1% | 4.2 -22% | 12.28 -257% |
| Gamma | 2.43 91% | 2.54 87% | 2.41 91% | 2.58 85% | 2.3 96% | 2.03 108% |
| CCT | 7064 92% | 6541 99% | 7082 92% | 6013 108% | 6820 95% | 10732 61% |
| Color Space (Percent of AdobeRGB 1998) (%) | 38 | 37 -3% | 56 47% | 40 5% | 43.2 14% | 35 -8% |
| Color Space (Percent of sRGB) (%) | 60 | 58 -3% | 86 43% | 64 7% | 61.5 2% | 55 -8% |
| Média Total (Programa/Configurações) | 1% /
-0% | 21% /
10% | -5% /
-5% | -17% /
-31% | -22% /
-55% |
* ... menor é melhor
Exibir tempos de resposta
| ↔ Tempo de resposta preto para branco | ||
|---|---|---|
| 33 ms ... ascensão ↗ e queda ↘ combinadas | ↗ 18 ms ascensão | 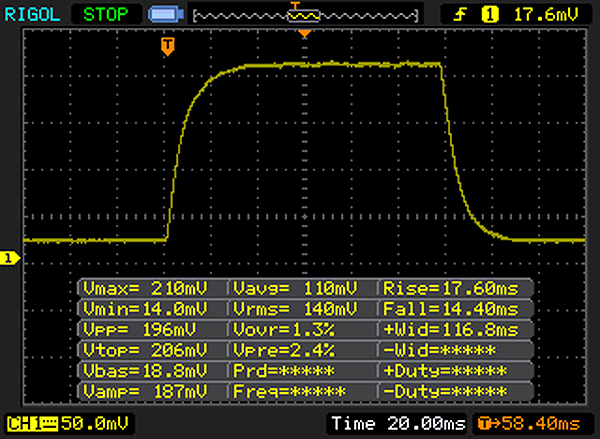 |
| ↘ 15 ms queda | ||
| A tela mostra taxas de resposta lentas em nossos testes e será insatisfatória para os jogadores. Em comparação, todos os dispositivos testados variam de 0.1 (mínimo) a 240 (máximo) ms. » 89 % de todos os dispositivos são melhores. Isso significa que o tempo de resposta medido é pior que a média de todos os dispositivos testados (19.8 ms). | ||
| ↔ Tempo de resposta 50% cinza a 80% cinza | ||
| 45 ms ... ascensão ↗ e queda ↘ combinadas | ↗ 23 ms ascensão | 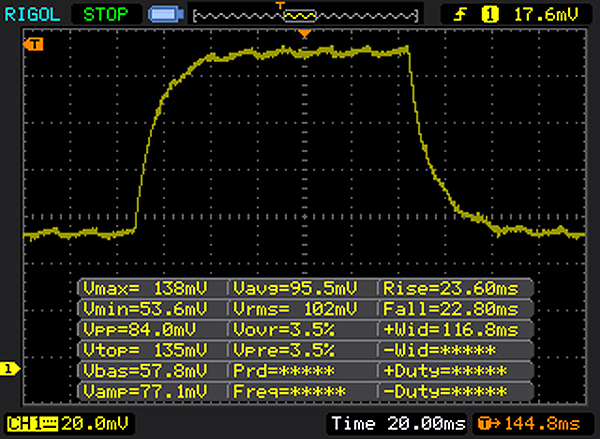 |
| ↘ 22 ms queda | ||
| A tela mostra taxas de resposta lentas em nossos testes e será insatisfatória para os jogadores. Em comparação, todos os dispositivos testados variam de 0.165 (mínimo) a 636 (máximo) ms. » 77 % de todos os dispositivos são melhores. Isso significa que o tempo de resposta medido é pior que a média de todos os dispositivos testados (31 ms). | ||
Cintilação da tela / PWM (modulação por largura de pulso)
| Tela tremeluzindo/PWM detectado | 996 Hz | ≤ 90 % configuração de brilho | 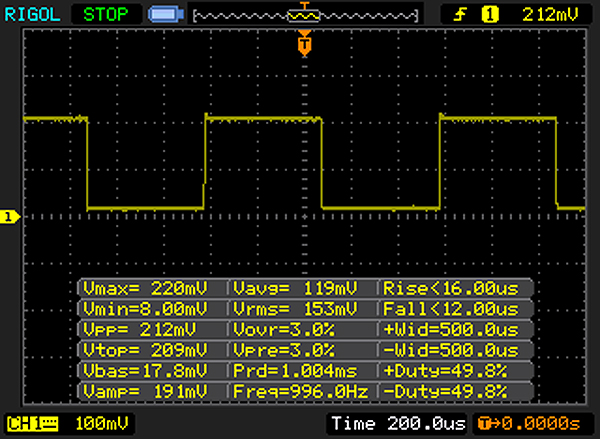 |
A luz de fundo da tela pisca em 996 Hz (pior caso, por exemplo, utilizando PWM) Cintilação detectada em uma configuração de brilho de 90 % e abaixo. Não deve haver cintilação ou PWM acima desta configuração de brilho. A frequência de 996 Hz é bastante alta, então a maioria dos usuários sensíveis ao PWM não deve notar nenhuma oscilação. [pwm_comparison] Em comparação: 52 % de todos os dispositivos testados não usam PWM para escurecer a tela. Se PWM foi detectado, uma média de 7754 (mínimo: 5 - máximo: 343500) Hz foi medida. | |||
| Cinebench R15 | |
| CPU Single 64Bit | |
| Acer Aspire 5 A517-51G-80L | |
| Dell Inspiron 15 7570 | |
| Acer Swift 3 SF314-52G-89SL | |
| Huawei MateBook D 15, i7-7500U 940MX | |
| Lenovo IdeaPad 510-15IKB 80SV0087GE | |
| Acer TravelMate P658-G2-MG-7327 | |
| CPU Multi 64Bit | |
| Acer Aspire 5 A517-51G-80L | |
| Dell Inspiron 15 7570 | |
| Acer Swift 3 SF314-52G-89SL | |
| Acer TravelMate P658-G2-MG-7327 | |
| Huawei MateBook D 15, i7-7500U 940MX | |
| Lenovo IdeaPad 510-15IKB 80SV0087GE | |
| Cinebench R11.5 | |
| CPU Single 64Bit | |
| Acer Aspire 5 A517-51G-80L | |
| Dell Inspiron 15 7570 | |
| Huawei MateBook D 15, i7-7500U 940MX | |
| CPU Multi 64Bit | |
| Dell Inspiron 15 7570 | |
| Acer Aspire 5 A517-51G-80L | |
| Huawei MateBook D 15, i7-7500U 940MX | |
| Cinebench R10 | |
| Rendering Single CPUs 64Bit | |
| Acer Aspire 5 A517-51G-80L | |
| Dell Inspiron 15 7570 | |
| Rendering Multiple CPUs 64Bit | |
| Dell Inspiron 15 7570 | |
| Acer Aspire 5 A517-51G-80L | |
| PCMark 8 | |
| Home Score Accelerated v2 | |
| Acer Swift 3 SF314-52G-89SL | |
| Acer Aspire 5 A517-51G-80L | |
| Lenovo IdeaPad 510-15IKB 80SV0087GE | |
| Dell Inspiron 15 7570 | |
| Huawei MateBook D 15, i7-7500U 940MX | |
| Asus Vivobook S15 S510UQ-BQ189T | |
| Work Score Accelerated v2 | |
| Acer Aspire 5 A517-51G-80L | |
| Dell Inspiron 15 7570 | |
| Huawei MateBook D 15, i7-7500U 940MX | |
| Asus Vivobook S15 S510UQ-BQ189T | |
| PCMark 8 Home Score Accelerated v2 | 3778 pontos | |
| PCMark 8 Work Score Accelerated v2 | 4987 pontos | |
| PCMark 10 Score | 3701 pontos | |
Ajuda | ||
| Dell Inspiron 15 7570 Samsung PM961 NVMe MZVLW512HMJP | Asus Vivobook S15 S510UQ-BQ189T Toshiba SG5 THNSNK128GVN8 | Acer TravelMate P658-G2-MG-7327 Liteonit CV3-8D512 | Lenovo IdeaPad 510-15IKB 80SV0087GE Liteonit CV3-DE256 | Huawei MateBook D 15, i7-7500U 940MX SanDisk SD8SN8U128G1027 | Dell Inspiron 15 5000 5567-1753 SanDisk X400 SED 256GB, SATA (SD8TB8U-256G) | |
|---|---|---|---|---|---|---|
| CrystalDiskMark 3.0 | -66% | -58% | -54% | -56% | -55% | |
| Read Seq (MB/s) | 2013 | 437.6 -78% | 526 -74% | 469.2 -77% | 478.4 -76% | 502 -75% |
| Write Seq (MB/s) | 1015 | 138.6 -86% | 256.9 -75% | 431.5 -57% | 314.9 -69% | 458.1 -55% |
| Read 512 (MB/s) | 1076 | 368.6 -66% | 227.1 -79% | 338.3 -69% | 331.2 -69% | 382.8 -64% |
| Write 512 (MB/s) | 1038 | 138.2 -87% | 246.3 -76% | 297.9 -71% | 181.4 -83% | 385.7 -63% |
| Read 4k (MB/s) | 52.1 | 16.05 -69% | 25.74 -51% | 28.68 -45% | 36.84 -29% | 29.25 -44% |
| Write 4k (MB/s) | 135 | 86.2 -36% | 68.8 -49% | 66.8 -51% | 82.7 -39% | 55.9 -59% |
| Read 4k QD32 (MB/s) | 404.2 | 279.1 -31% | 354.8 -12% | 364.7 -10% | 368.5 -9% | 285.2 -29% |
| Write 4k QD32 (MB/s) | 510 | 121.8 -76% | 248.8 -51% | 245.9 -52% | 123.2 -76% | 239.6 -53% |

| 3DMark 11 - 1280x720 Performance GPU | |
| Huawei MateBook D 15, i7-7500U 940MX | |
| Dell Inspiron 15 7570 | |
| Asus Vivobook S15 S510UQ-BQ189T | |
| Acer TravelMate P658-G2-MG-7327 | |
| Lenovo IdeaPad 510-15IKB 80SV0087GE | |
| Dell Inspiron 15 5000 5567-1753 | |
| 3DMark | |
| 1280x720 Cloud Gate Standard Graphics | |
| Huawei MateBook D 15, i7-7500U 940MX | |
| Asus Vivobook S15 S510UQ-BQ189T | |
| Dell Inspiron 15 7570 | |
| Dell Inspiron 15 5000 5567-1753 | |
| 1920x1080 Fire Strike Graphics | |
| Huawei MateBook D 15, i7-7500U 940MX | |
| Asus Vivobook S15 S510UQ-BQ189T | |
| Dell Inspiron 15 7570 | |
| Dell Inspiron 15 5000 5567-1753 | |
| 3DMark 11 Performance | 3065 pontos | |
| 3DMark Cloud Gate Standard Score | 10661 pontos | |
| 3DMark Fire Strike Score | 1898 pontos | |
Ajuda | ||
| The Witcher 3 | |
| 1024x768 Low Graphics & Postprocessing | |
| Asus Vivobook S15 S510UQ-BQ189T | |
| Huawei MateBook D 15, i7-7500U 940MX | |
| Dell Inspiron 15 5000 5567-1753 | |
| Dell Inspiron 15 7570 | |
| 1366x768 Medium Graphics & Postprocessing | |
| Asus Vivobook S15 S510UQ-BQ189T | |
| Huawei MateBook D 15, i7-7500U 940MX | |
| Dell Inspiron 15 7570 | |
| Dell Inspiron 15 5000 5567-1753 | |
| 1920x1080 High Graphics & Postprocessing (Nvidia HairWorks Off) | |
| Huawei MateBook D 15, i7-7500U 940MX | |
| Dell Inspiron 15 7570 | |
| Dell Inspiron 15 5000 5567-1753 | |
| 1920x1080 Ultra Graphics & Postprocessing (HBAO+) | |
| Dell Inspiron 15 7570 | |
| Huawei MateBook D 15, i7-7500U 940MX | |
| Dell Inspiron 15 5000 5567-1753 | |
| Rise of the Tomb Raider | |
| 1024x768 Lowest Preset | |
| Asus Vivobook S15 S510UQ-BQ189T | |
| Dell Inspiron 15 7570 | |
| Dell Inspiron 15 5000 5567-1753 | |
| Huawei MateBook D 15, i7-7500U 940MX | |
| 1366x768 Medium Preset AF:2x | |
| Asus Vivobook S15 S510UQ-BQ189T | |
| Huawei MateBook D 15, i7-7500U 940MX | |
| Dell Inspiron 15 5000 5567-1753 | |
| Dell Inspiron 15 7570 | |
| 1920x1080 High Preset AA:FX AF:4x | |
| Huawei MateBook D 15, i7-7500U 940MX | |
| Dell Inspiron 15 7570 | |
| Dell Inspiron 15 5000 5567-1753 | |
| 1920x1080 Very High Preset AA:FX AF:16x | |
| Huawei MateBook D 15, i7-7500U 940MX | |
| Dell Inspiron 15 7570 | |
| Dell Inspiron 15 5000 5567-1753 | |
| Doom | |
| 1280x720 Low Preset | |
| Dell Inspiron 15 5000 5567-1753 | |
| Dell Inspiron 15 7570 | |
| 1366x768 Medium Preset | |
| Dell Inspiron 15 5000 5567-1753 | |
| Dell Inspiron 15 7570 | |
| 1920x1080 High Preset AA:FX | |
| Dell Inspiron 15 5000 5567-1753 | |
| Dell Inspiron 15 7570 | |
| baixo | média | alto | ultra | |
|---|---|---|---|---|
| The Witcher 3 (2015) | 26.34 | 22.22 | 10.64 | 7.12 |
| Rise of the Tomb Raider (2016) | 35.9 | 13.39 | 10.39 | 8.55 |
| Doom (2016) | 13.78 | 11.32 | 6.76 |
| Dell Inspiron 15 7570 GeForce 940MX, i5-8550U, Samsung PM961 NVMe MZVLW512HMJP | Asus Vivobook S15 S510UQ-BQ189T GeForce 940MX, i5-7200U, Toshiba SG5 THNSNK128GVN8 | Acer TravelMate P658-G2-MG-7327 GeForce 940MX, i7-7500U, Liteonit CV3-8D512 | Lenovo IdeaPad 510-15IKB 80SV0087GE GeForce 940MX, i7-7500U, Liteonit CV3-DE256 | Huawei MateBook D 15, i7-7500U 940MX GeForce 940MX, i7-7500U, SanDisk SD8SN8U128G1027 | Dell Inspiron 15 5000 5567-1753 Radeon R7 M445, i7-7500U, SanDisk X400 SED 256GB, SATA (SD8TB8U-256G) | |
|---|---|---|---|---|---|---|
| Noise | -2% | 5% | 0% | 4% | 0% | |
| desligado / ambiente * (dB) | 30.3 | 30.6 -1% | 30 1% | 31.6 -4% | 28.8 5% | 30.6 -1% |
| Idle Minimum * (dB) | 30.3 | 31.2 -3% | 30 1% | 32.6 -8% | 30 1% | 30.6 -1% |
| Idle Average * (dB) | 30.3 | 31.2 -3% | 30 1% | 32.6 -8% | 30.2 -0% | 30.6 -1% |
| Idle Maximum * (dB) | 30.3 | 31.2 -3% | 30 1% | 32.6 -8% | 30.2 -0% | 30.6 -1% |
| Load Average * (dB) | 42.6 | 43.3 -2% | 37.3 12% | 35.3 17% | 39 8% | 41.9 2% |
| Load Maximum * (dB) | 42.5 | 43.3 -2% | 38 11% | 37.1 13% | 39 8% | 41.8 2% |
| Witcher 3 ultra * (dB) | 38.7 |
* ... menor é melhor
Barulho
| Ocioso |
| 30.3 / 30.3 / 30.3 dB |
| Carga |
| 42.6 / 42.5 dB |
 | ||
30 dB silencioso 40 dB(A) audível 50 dB(A) ruidosamente alto |
||
min: | ||
| Dell Inspiron 15 7570 GeForce 940MX, i5-8550U, Samsung PM961 NVMe MZVLW512HMJP | Asus Vivobook S15 S510UQ-BQ189T GeForce 940MX, i5-7200U, Toshiba SG5 THNSNK128GVN8 | Acer TravelMate P658-G2-MG-7327 GeForce 940MX, i7-7500U, Liteonit CV3-8D512 | Lenovo IdeaPad 510-15IKB 80SV0087GE GeForce 940MX, i7-7500U, Liteonit CV3-DE256 | Huawei MateBook D 15, i7-7500U 940MX GeForce 940MX, i7-7500U, SanDisk SD8SN8U128G1027 | Dell Inspiron 15 5000 5567-1753 Radeon R7 M445, i7-7500U, SanDisk X400 SED 256GB, SATA (SD8TB8U-256G) | |
|---|---|---|---|---|---|---|
| Heat | 3% | -5% | 10% | -11% | -11% | |
| Maximum Upper Side * (°C) | 42.8 | 38.2 11% | 46.4 -8% | 38.3 11% | 44.8 -5% | 41.6 3% |
| Maximum Bottom * (°C) | 43 | 49 -14% | 51.3 -19% | 36 16% | 50.4 -17% | 51.3 -19% |
| Idle Upper Side * (°C) | 27.8 | 24.7 11% | 26 6% | 24.9 10% | 29.4 -6% | 29.4 -6% |
| Idle Bottom * (°C) | 26.6 | 25.8 3% | 25.7 3% | 25.6 4% | 31 -17% | 32.4 -22% |
* ... menor é melhor
(±) A temperatura máxima no lado superior é 42.8 °C / 109 F, em comparação com a média de 34.3 °C / 94 F , variando de 21.2 a 62.5 °C para a classe Office.
(±) A parte inferior aquece até um máximo de 43 °C / 109 F, em comparação com a média de 36.8 °C / 98 F
(+) Em uso inativo, a temperatura média para o lado superior é 25.5 °C / 78 F, em comparação com a média do dispositivo de 29.5 °C / ### class_avg_f### F.
(+) Os apoios para as mãos e o touchpad são mais frios que a temperatura da pele, com um máximo de 29.5 °C / 85.1 F e, portanto, são frios ao toque.
(±) A temperatura média da área do apoio para as mãos de dispositivos semelhantes foi 27.5 °C / 81.5 F (-2 °C / -3.6 F).
Dell Inspiron 15 7570 análise de áudio
(-) | alto-falantes não muito altos (###valor### dB)
Graves 100 - 315Hz
(-) | quase nenhum baixo - em média 18.2% menor que a mediana
(±) | a linearidade dos graves é média (13.1% delta para a frequência anterior)
Médios 400 - 2.000 Hz
(+) | médios equilibrados - apenas 3.5% longe da mediana
(±) | a linearidade dos médios é média (8.1% delta para frequência anterior)
Altos 2 - 16 kHz
(+) | agudos equilibrados - apenas 2.3% longe da mediana
(±) | a linearidade dos máximos é média (9.9% delta para frequência anterior)
Geral 100 - 16.000 Hz
(±) | a linearidade do som geral é média (20.8% diferença em relação à mediana)
Comparado com a mesma classe
» 49% de todos os dispositivos testados nesta classe foram melhores, 9% semelhantes, 42% piores
» O melhor teve um delta de 7%, a média foi 21%, o pior foi 53%
Comparado com todos os dispositivos testados
» 56% de todos os dispositivos testados foram melhores, 8% semelhantes, 36% piores
» O melhor teve um delta de 4%, a média foi 23%, o pior foi 134%
Apple MacBook 12 (Early 2016) 1.1 GHz análise de áudio
(+) | os alto-falantes podem tocar relativamente alto (###valor### dB)
Graves 100 - 315Hz
(±) | graves reduzidos - em média 11.3% menor que a mediana
(±) | a linearidade dos graves é média (14.2% delta para a frequência anterior)
Médios 400 - 2.000 Hz
(+) | médios equilibrados - apenas 2.4% longe da mediana
(+) | médios são lineares (5.5% delta para frequência anterior)
Altos 2 - 16 kHz
(+) | agudos equilibrados - apenas 2% longe da mediana
(+) | os máximos são lineares (4.5% delta da frequência anterior)
Geral 100 - 16.000 Hz
(+) | o som geral é linear (10.2% diferença em relação à mediana)
Comparado com a mesma classe
» 7% de todos os dispositivos testados nesta classe foram melhores, 2% semelhantes, 90% piores
» O melhor teve um delta de 5%, a média foi 18%, o pior foi 53%
Comparado com todos os dispositivos testados
» 5% de todos os dispositivos testados foram melhores, 1% semelhantes, 94% piores
» O melhor teve um delta de 4%, a média foi 23%, o pior foi 134%
| desligado | |
| Ocioso | |
| Carga |
|
Key:
min: | |
| Dell Inspiron 15 7570 i5-8550U, GeForce 940MX, Samsung PM961 NVMe MZVLW512HMJP, IPS, 1920x1080, 15.6" | Asus Vivobook S15 S510UQ-BQ189T i5-7200U, GeForce 940MX, Toshiba SG5 THNSNK128GVN8, IPS, 1920x1080, 15.6" | Acer TravelMate P658-G2-MG-7327 i7-7500U, GeForce 940MX, Liteonit CV3-8D512, IPS, 1920x1080, 15.6" | Lenovo IdeaPad 510-15IKB 80SV0087GE i7-7500U, GeForce 940MX, Liteonit CV3-DE256, IPS, 1920x1080, 15.6" | Huawei MateBook D 15, i7-7500U 940MX i7-7500U, GeForce 940MX, SanDisk SD8SN8U128G1027, IPS, 1920x1080, 15.6" | Dell Inspiron 15 5000 5567-1753 i7-7500U, Radeon R7 M445, SanDisk X400 SED 256GB, SATA (SD8TB8U-256G), TN LED, 1920x1080, 15.6" | |
|---|---|---|---|---|---|---|
| Power Consumption | 2% | -7% | 5% | -6% | 6% | |
| Idle Minimum * (Watt) | 3.6 | 3.6 -0% | 3.9 -8% | 3.9 -8% | 5.14 -43% | 4 -11% |
| Idle Average * (Watt) | 6.7 | 6.8 -1% | 7.9 -18% | 7.4 -10% | 9.07 -35% | 5.4 19% |
| Idle Maximum * (Watt) | 9.2 | 9.5 -3% | 11.3 -23% | 9.5 -3% | 9.33 -1% | 8.3 10% |
| Load Average * (Watt) | 59 | 51.6 13% | 47 20% | 41 31% | 46.76 21% | 54 8% |
| Load Maximum * (Watt) | 58 | 56 3% | 62 -7% | 48 17% | 42.59 27% | 55.4 4% |
| Witcher 3 ultra * (Watt) | 40.18 |
* ... menor é melhor
| Dell Inspiron 15 7570 i5-8550U, GeForce 940MX, 42 Wh | Asus Vivobook S15 S510UQ-BQ189T i5-7200U, GeForce 940MX, 42 Wh | Acer TravelMate P658-G2-MG-7327 i7-7500U, GeForce 940MX, 55 Wh | Lenovo IdeaPad 510-15IKB 80SV0087GE i7-7500U, GeForce 940MX, 30 Wh | Huawei MateBook D 15, i7-7500U 940MX i7-7500U, GeForce 940MX, 43.3 Wh | Dell Inspiron 15 5000 5567-1753 i7-7500U, Radeon R7 M445, 42 Wh | |
|---|---|---|---|---|---|---|
| Duração da bateria | 61% | 367% | 156% | 191% | 103% | |
| Reader / Idle (h) | 4.7 | 7.1 51% | 15.9 238% | 7.8 66% | ||
| H.264 (h) | 4 | 5.3 33% | ||||
| WiFi v1.3 (h) | 1.8 | 4.3 139% | 8.4 367% | 4.6 156% | 7.4 311% | 7 289% |
| Load (h) | 1.3 | 1.2 -8% | 1.6 23% | 1.6 23% |
Pro
Contra
O Inspiron 15 7000 (7570-9726) é um caso difícil. Por um lado, gostamos do design e do acabamento da robusta carcaça de alumínio. Apesar da superfície reflexiva, a tela também atinge uma figura muito boa em algumas partes, e pelo menos no papel, o hardware convence com bons valores, particularmente o excelente SSD. Além disso, o dispositivo sempre permanece confortavelmente frio.
Por outro lado, o Dell Inspiron tem alguns pontos fracos, alguns dos quais não podem ser explicados. Os piores são a duração da bateria muito fraca, bem como as latências e as quedas inesperadas. Aparentemente, o dispositivo luta com alguns problemas de controladores, dado que o desempenho gráfico também é afogado fortemente. No sistema e particularmente no desempenho gráfico, o dispositivo não atinge o nível dos concorrentes e não pode fazer pleno uso do potencial prometido pelo bom hardware. Mas somente isso não seria tão ruim, se pelo menos a mobilidade tivesse sido melhor com uma boa duração da bateria. Afinal, o dispositivo é um modelo completo para empresas. Infelizmente ocorre o oposto.
Enquanto o Dell Inspiron tem bons pré-requisitos em termos de componentes fortes, infelizmente, tendo fraquezas surpreendentes, confunde suas promessas justificadas de alto valor.
Atualmente, o dispositivo pode ser comprado por um preço de cerca de 1150 Euros (~$1324, começando em $750 nos EUA). Para os usuários que o desempenho gráfico for menos importante e que procuram um bom portátil para sua casa, ainda estão bem atendidos pelo Dell Inspiron. Talvez a Dell possa resolver alguns dos piores pontos fracos através de atualizações. Desejamos isso, pois o dispositivo também seria adequado para tarefas de uso mais móvel.
Dell Inspiron 15 7570
- 11/08/2017 v6 (old)
Christian Hintze