Dell Inspiron 15 7000 7506 2 em 1 Black Edition vs. Silver Edition: Qual é a diferença?
Normalmente, quando um laptop vem em múltiplas opções de cores, tudo mais sobre o hardware permaneceria idêntico. No caso do Inspiron 15 7506 2 em 1 Silver Edition e do Inspiron 15 7506 2 em 1 Black Edition, no entanto, a Dell fez dois laptops com várias diferenças importantes entre eles, tanto interna quanto externamente. Na verdade, as diferenças podem ser tão consideráveis que a Black Edition atualmente vende no varejo por pelo menos US$ 500 a mais do que a Silver Edition. Esta revisão vai mergulhar no que torna a Black Edition tão especial para justificar seu preço mais alto.
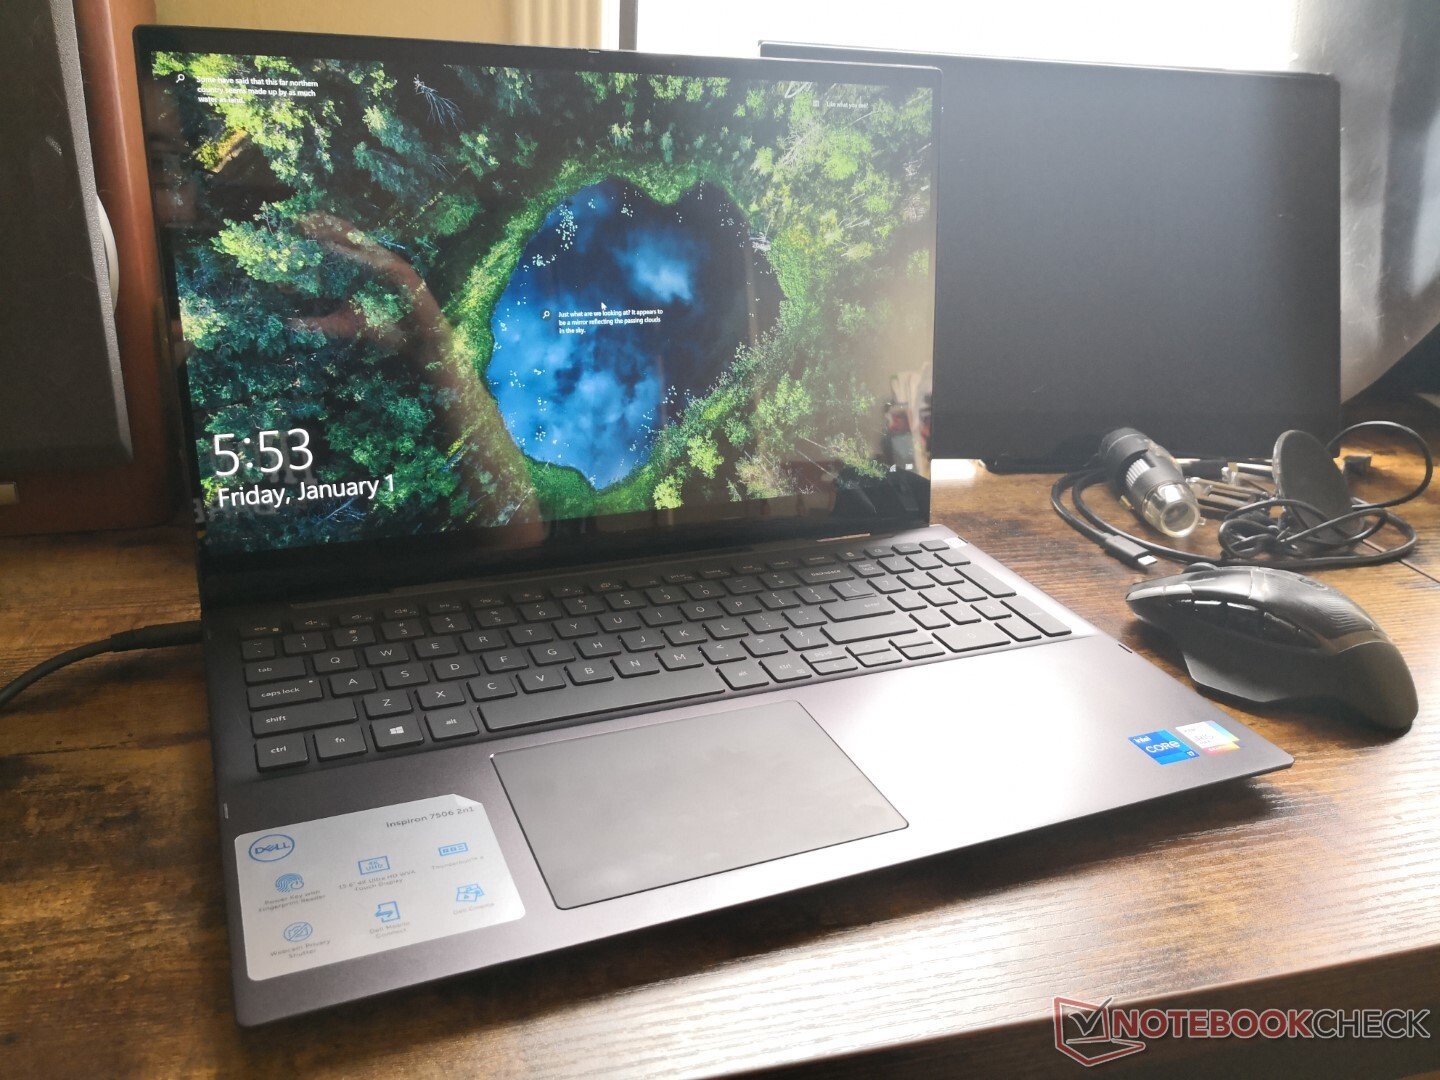
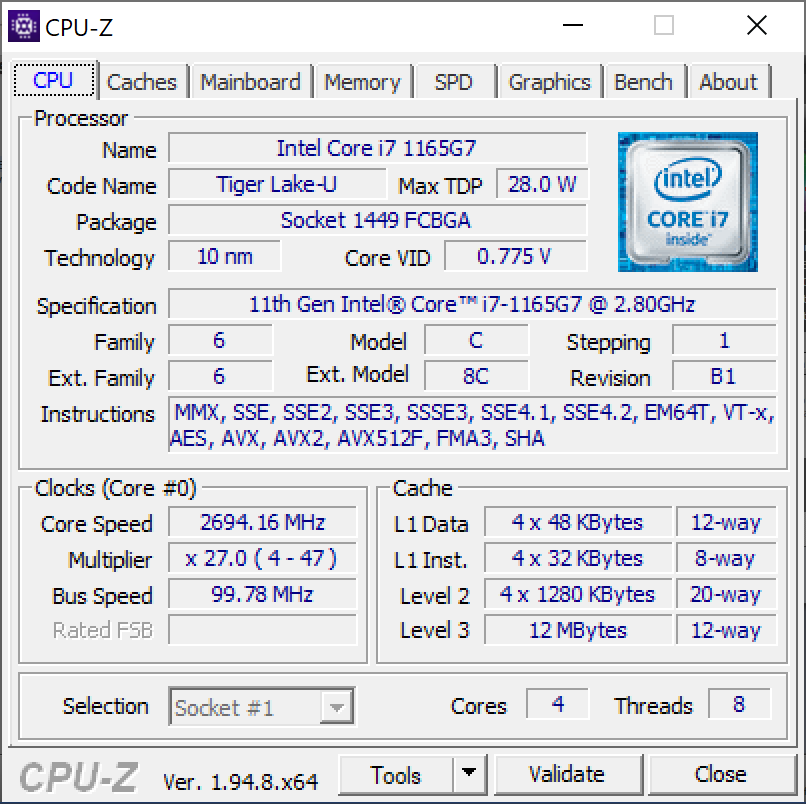
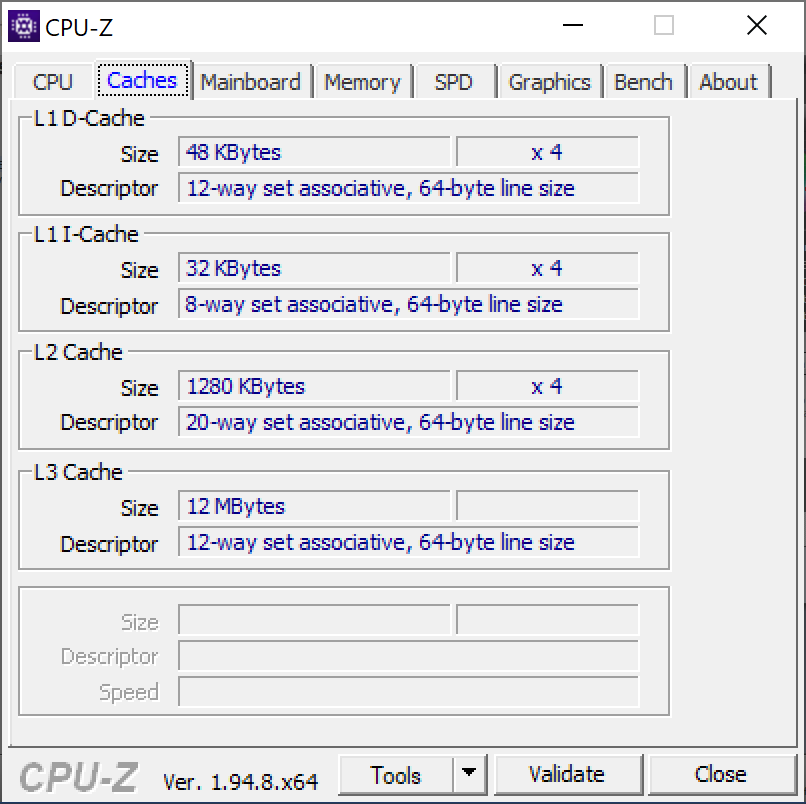
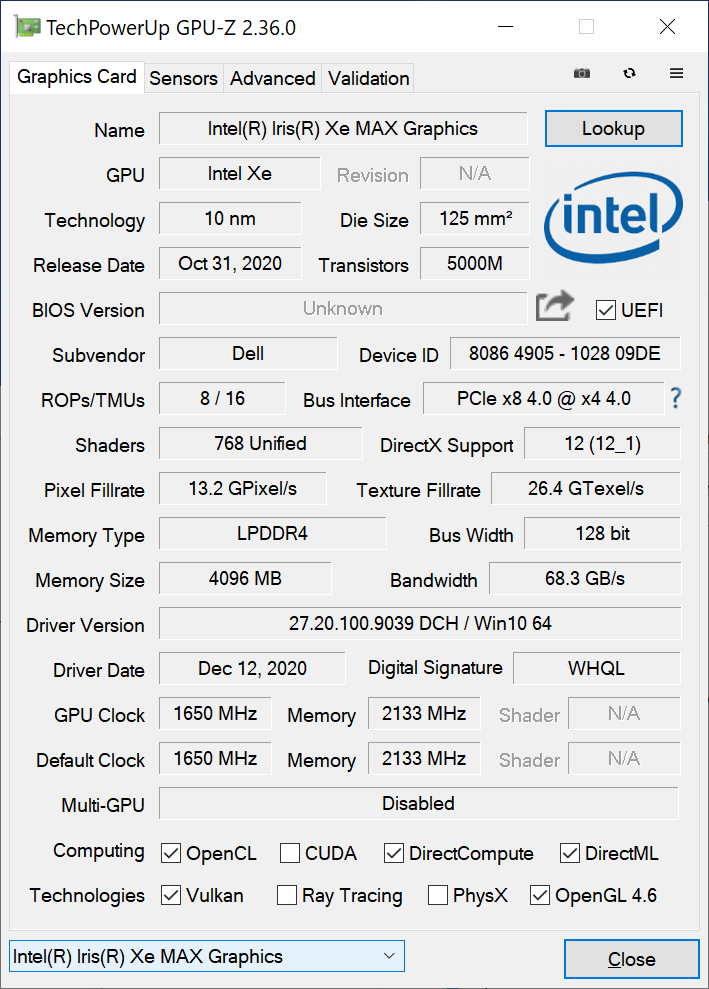
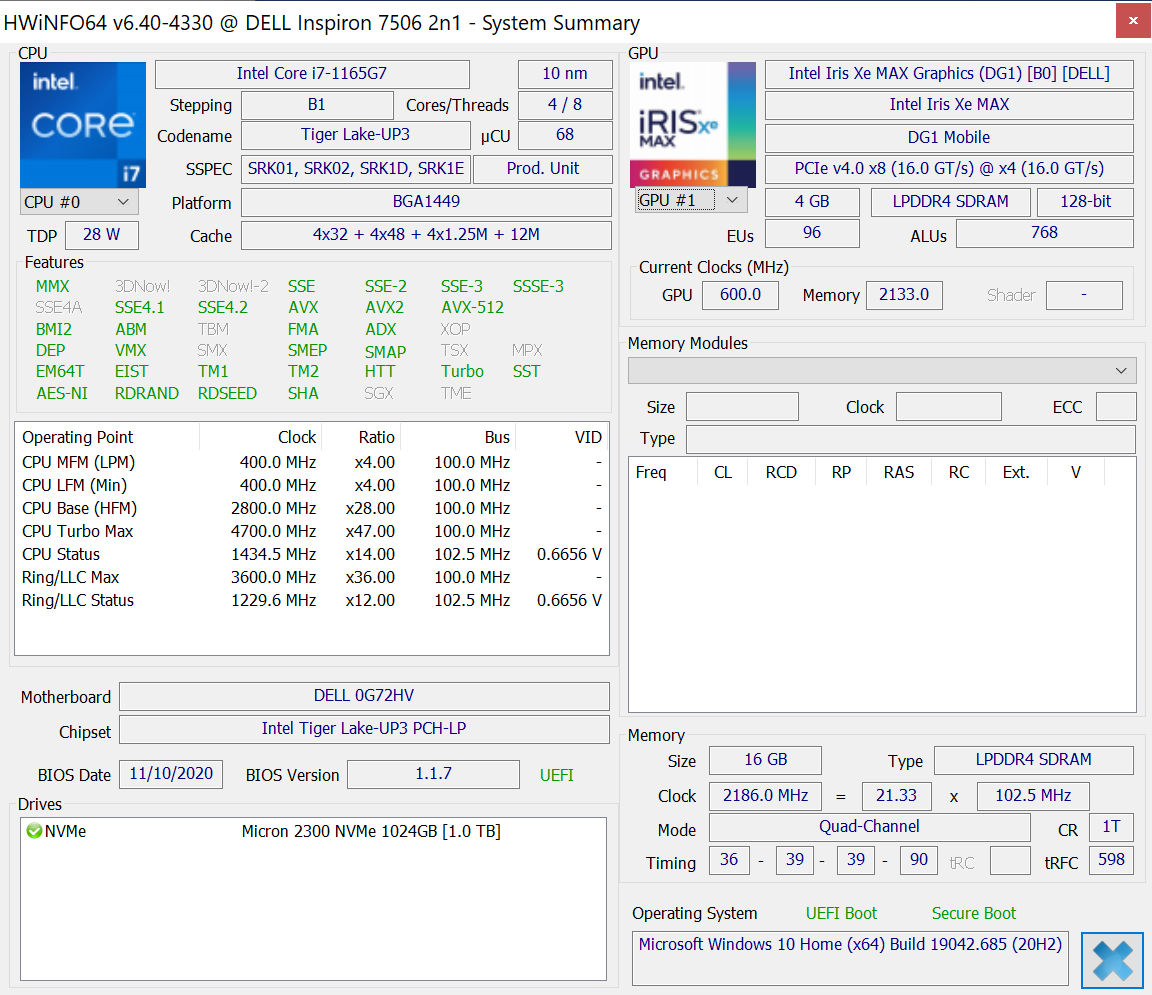
Nossa unidade de teste vem configurada com a CPU Core i7-1165G7, 16 GB de RAM soldada, 1 TB NVMe SSD, tela tátil UHD 4K, e Intel Iris Xe Max gráficos discretos. Recomendamos verificar nossa revisão no Inspiron 15 7506 2 em 1 Silver Edition primeiro, já que a Black Edition compartilha muitas das mesmas características físicas.
Mais resenhas da Dell:
potential competitors in comparison
Avaliação | Data | Modelo | Peso | Altura | Size | Resolução | Preço |
|---|---|---|---|---|---|---|---|
| 82.4 % v7 (old) | 01/2021 | Dell Inspiron 15 7000 7506 2-in-1 Black Edition i7-1165G7, Xe MAX | 1.9 kg | 17.94 mm | 15.60" | 3840x2160 | |
| 87.3 % v7 (old) | 11/2020 | Samsung Galaxy Book Flex 15-NP950 i7-1065G7, GeForce MX250 | 1.6 kg | 14.9 mm | 15.60" | 1920x1080 | |
| 82.8 % v7 (old) | 09/2022 | HP Envy x360 15-ee0257ng R5 4500U, Vega 6 | 2 kg | 18.9 mm | 15.60" | 1920x1080 | |
| 88.3 % v7 (old) | 06/2020 | Microsoft Surface Book 3 15 i7-1065G7, GeForce GTX 1660 Ti Max-Q | 1.9 kg | 23 mm | 15.00" | 3240x2160 | |
| 86.5 % v7 (old) | 03/2020 | Asus ZenBook Flip 15 UX563FD-A1027T i7-10510U, GeForce GTX 1050 Max-Q | 1.9 kg | 19.9 mm | 15.60" | 3840x2160 | |
| 84.8 % v7 (old) | 01/2020 | Lenovo Yoga C740-15IML i7-10510U, UHD Graphics 620 | 1.9 kg | 17.25 mm | 15.60" | 1920x1080 | |
| 81.2 % v7 (old) | 12/2020 | Dell Inspiron 15 7506 2-in-1 P97F i5-1135G7, Iris Xe G7 80EUs | 1.8 kg | 17.94 mm | 15.60" | 1920x1080 |
Caso
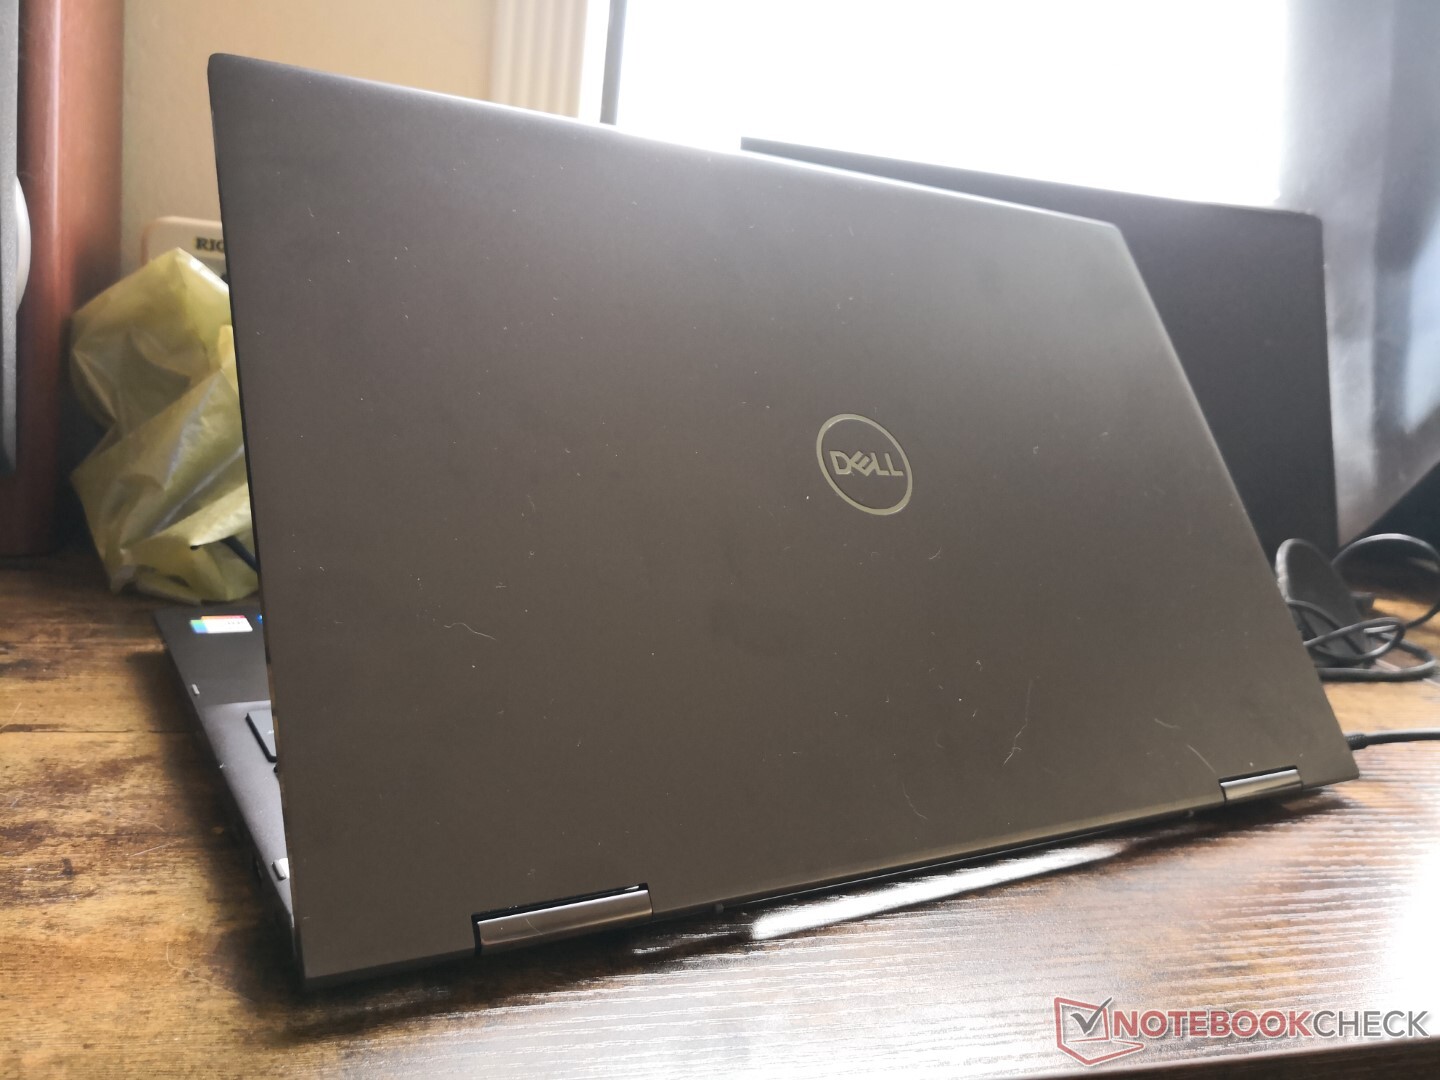
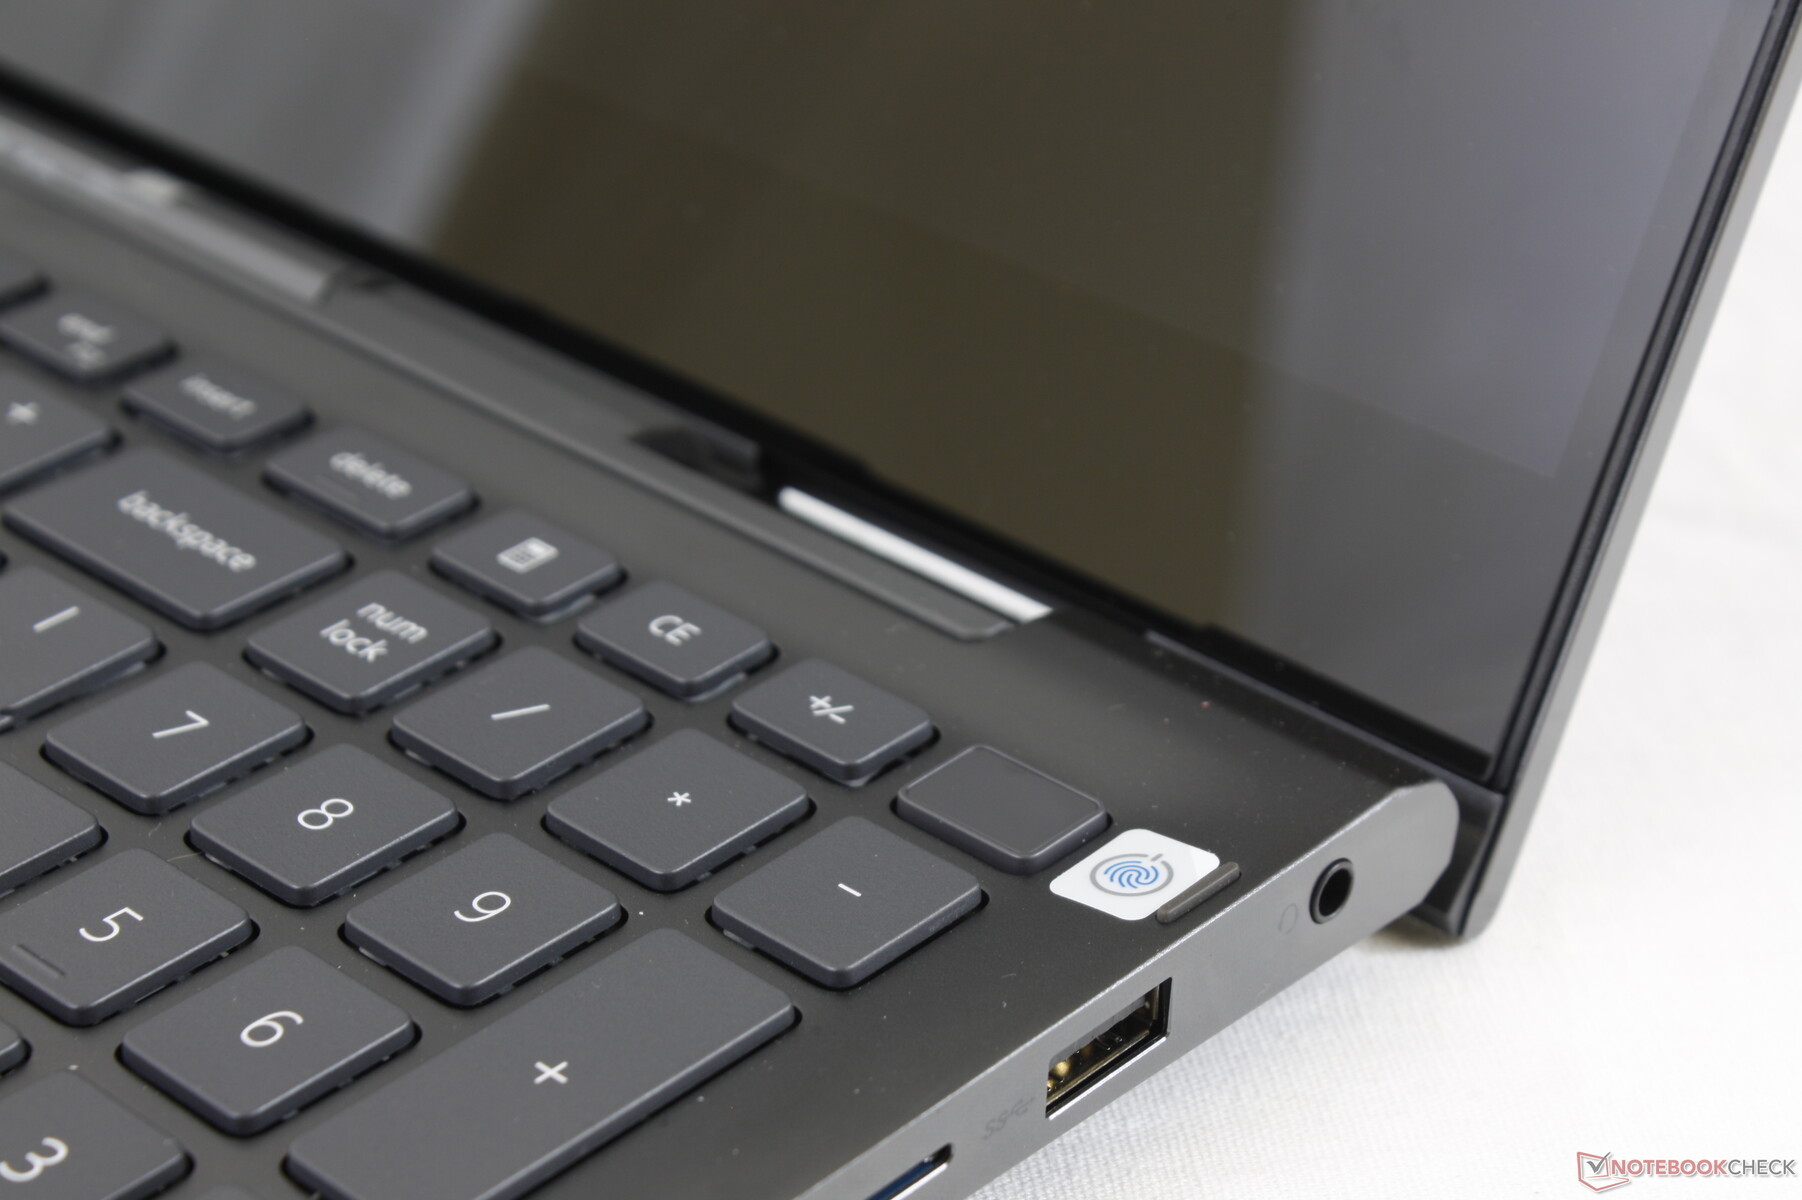
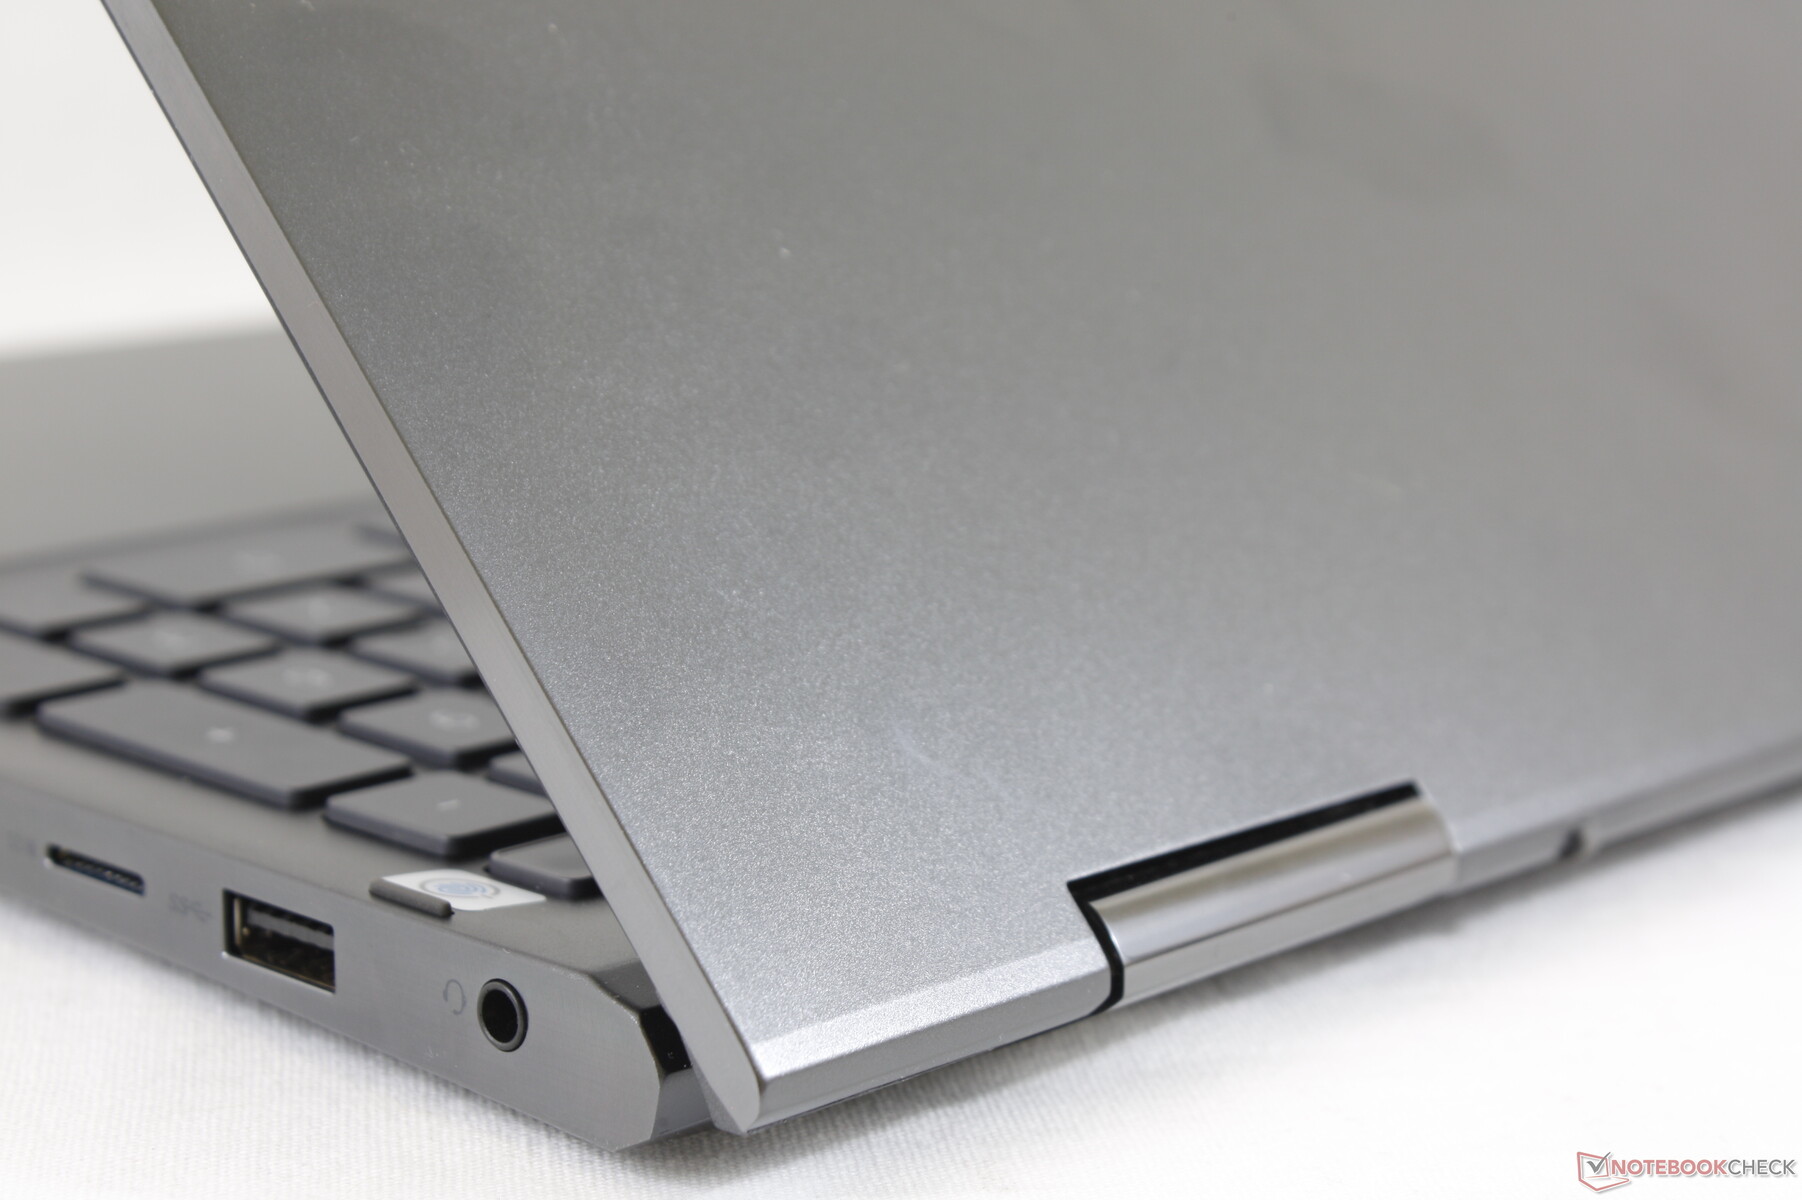
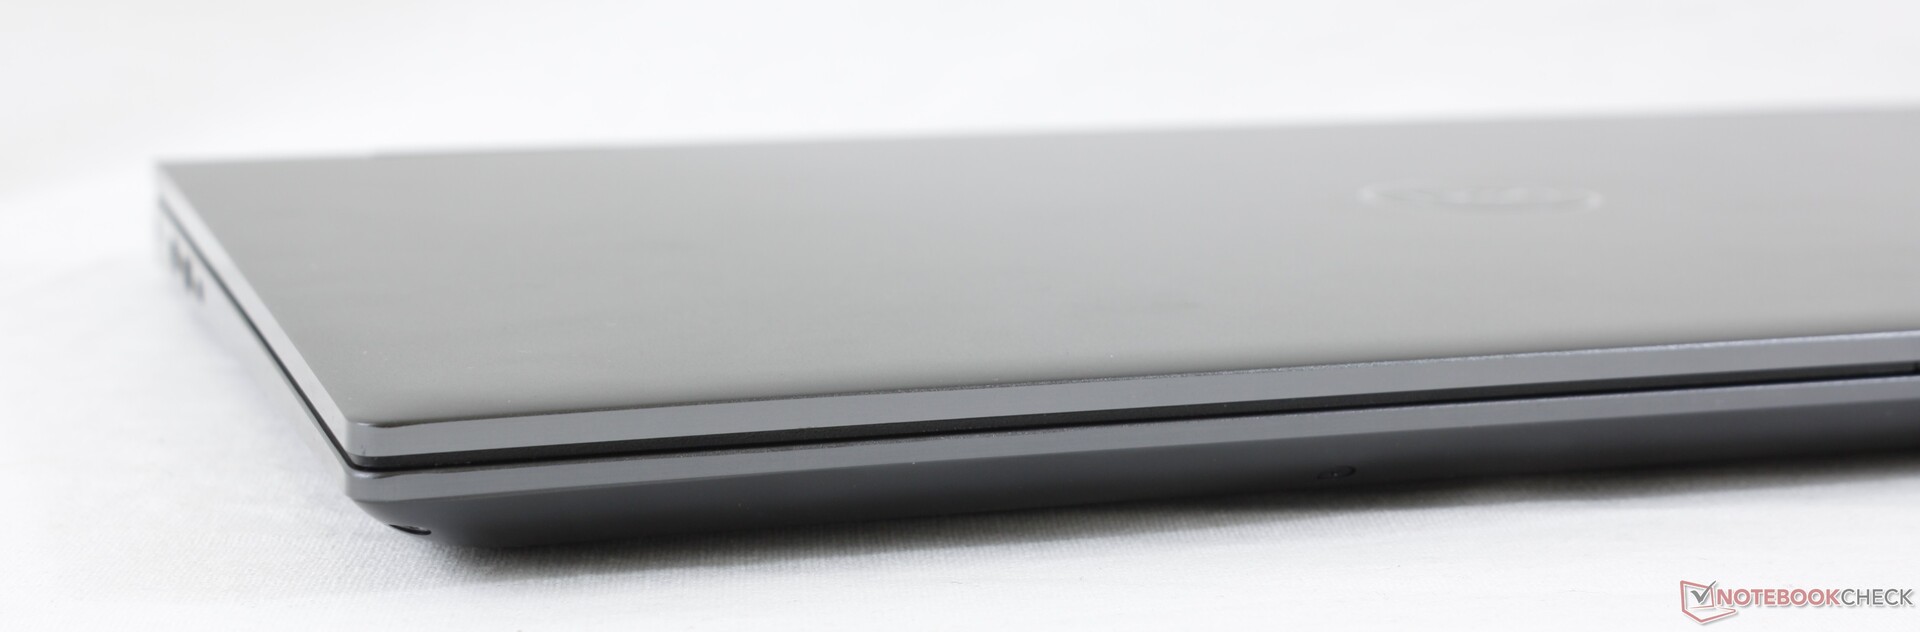
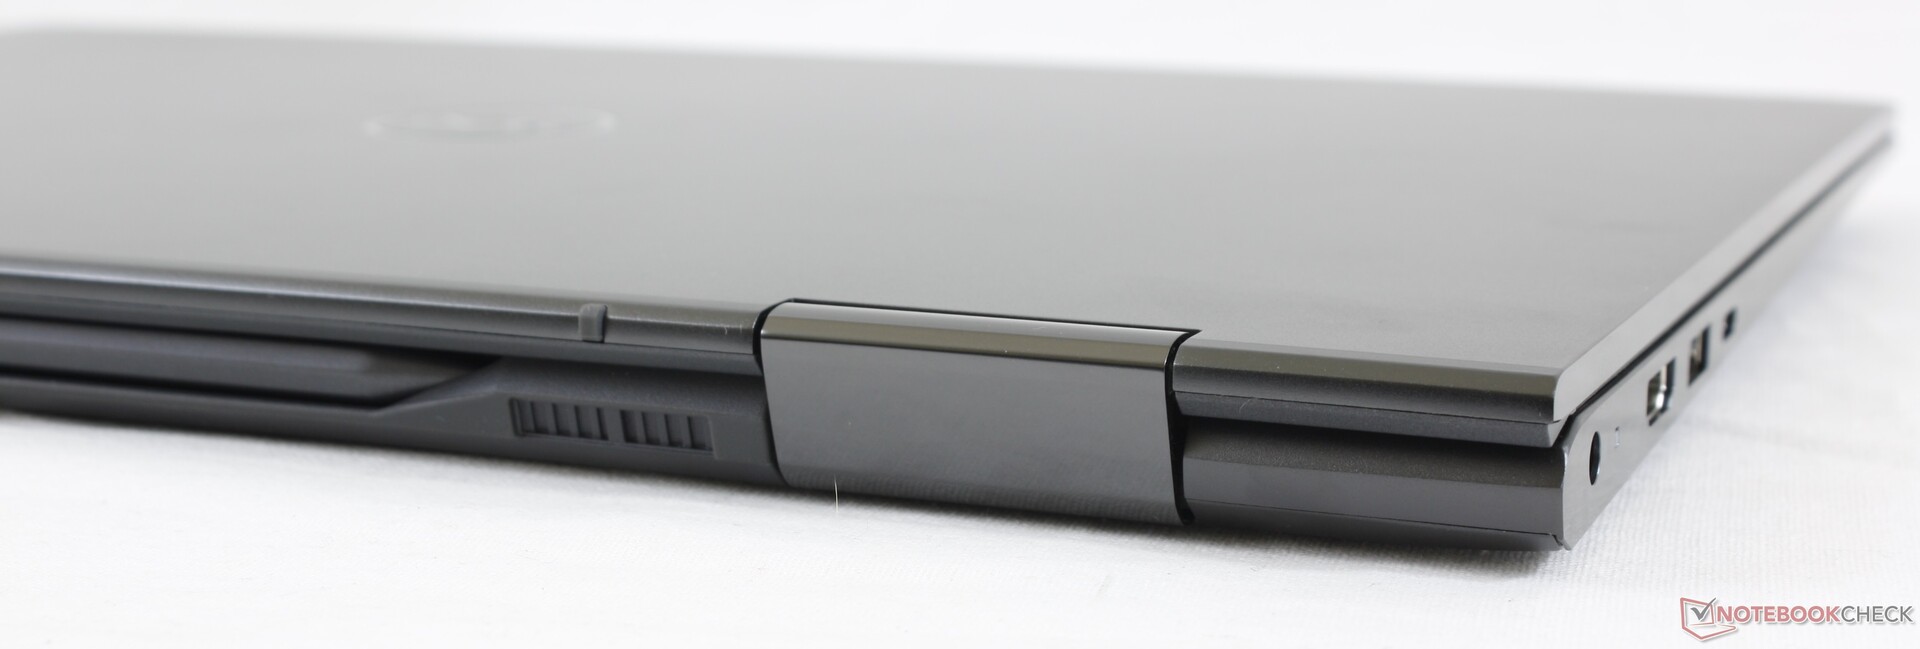
O chassi de alumínio é idêntico ao Inspiron 15 7506 2 em 1 Silver Edition, mas com um punhado de pequenas diferenças visuais. Algumas características só são encontradas em certos modelos, o que significa que os usuários devem escolher cuidadosamente, pois são mais do que simples escolhas de cores. Além disso, ambos os laptops utilizam os mesmos materiais, teclado, clickpad e outras características físicas para primeiras impressões semelhantes entre eles.
As principais diferenças entre as Edições Inspiron 15 7506 2 em 1 Silver e Black são as seguintes:
| Edição Prata | Edição em preto | |
|---|---|---|
| CPU | Até o Core i5-1135G7 | Até o Core i7-1165G7 |
| GPU | Até GeForce GeForce MX330 c/ 2 GB GDDR5 VRAM | Até Iris Xe Max c/ 4 GB LPDDR4X VRAM |
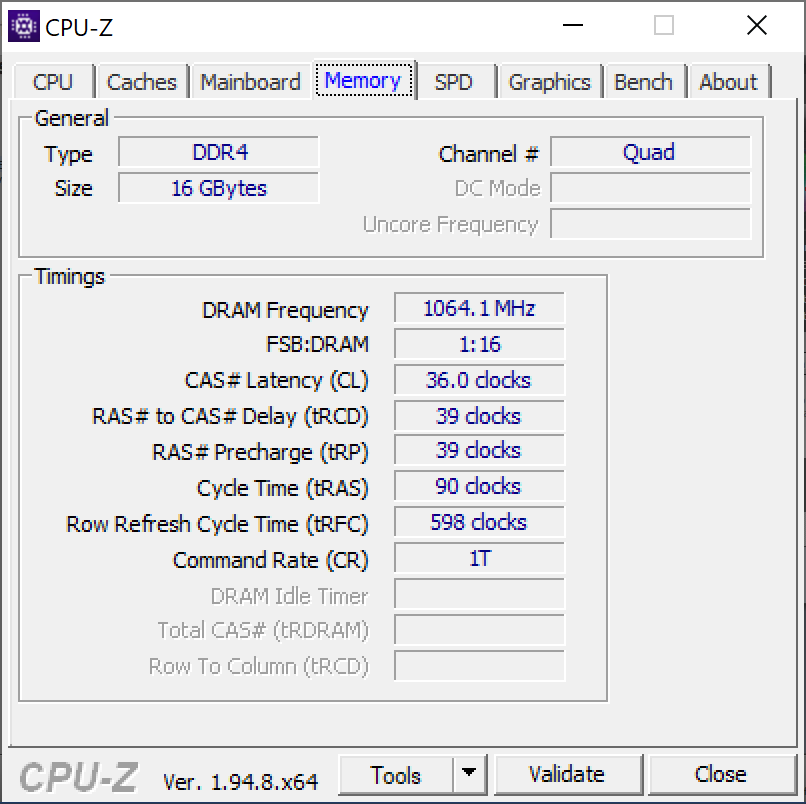
| RAM | Até 16 GB 3200 MHz (2x SODIMM) | Até 16 GB 4267 MHz (Soldado) |
| Mostrar | Tela sensível ao toque de 1080p | Tela 4K UHD touchscreen |
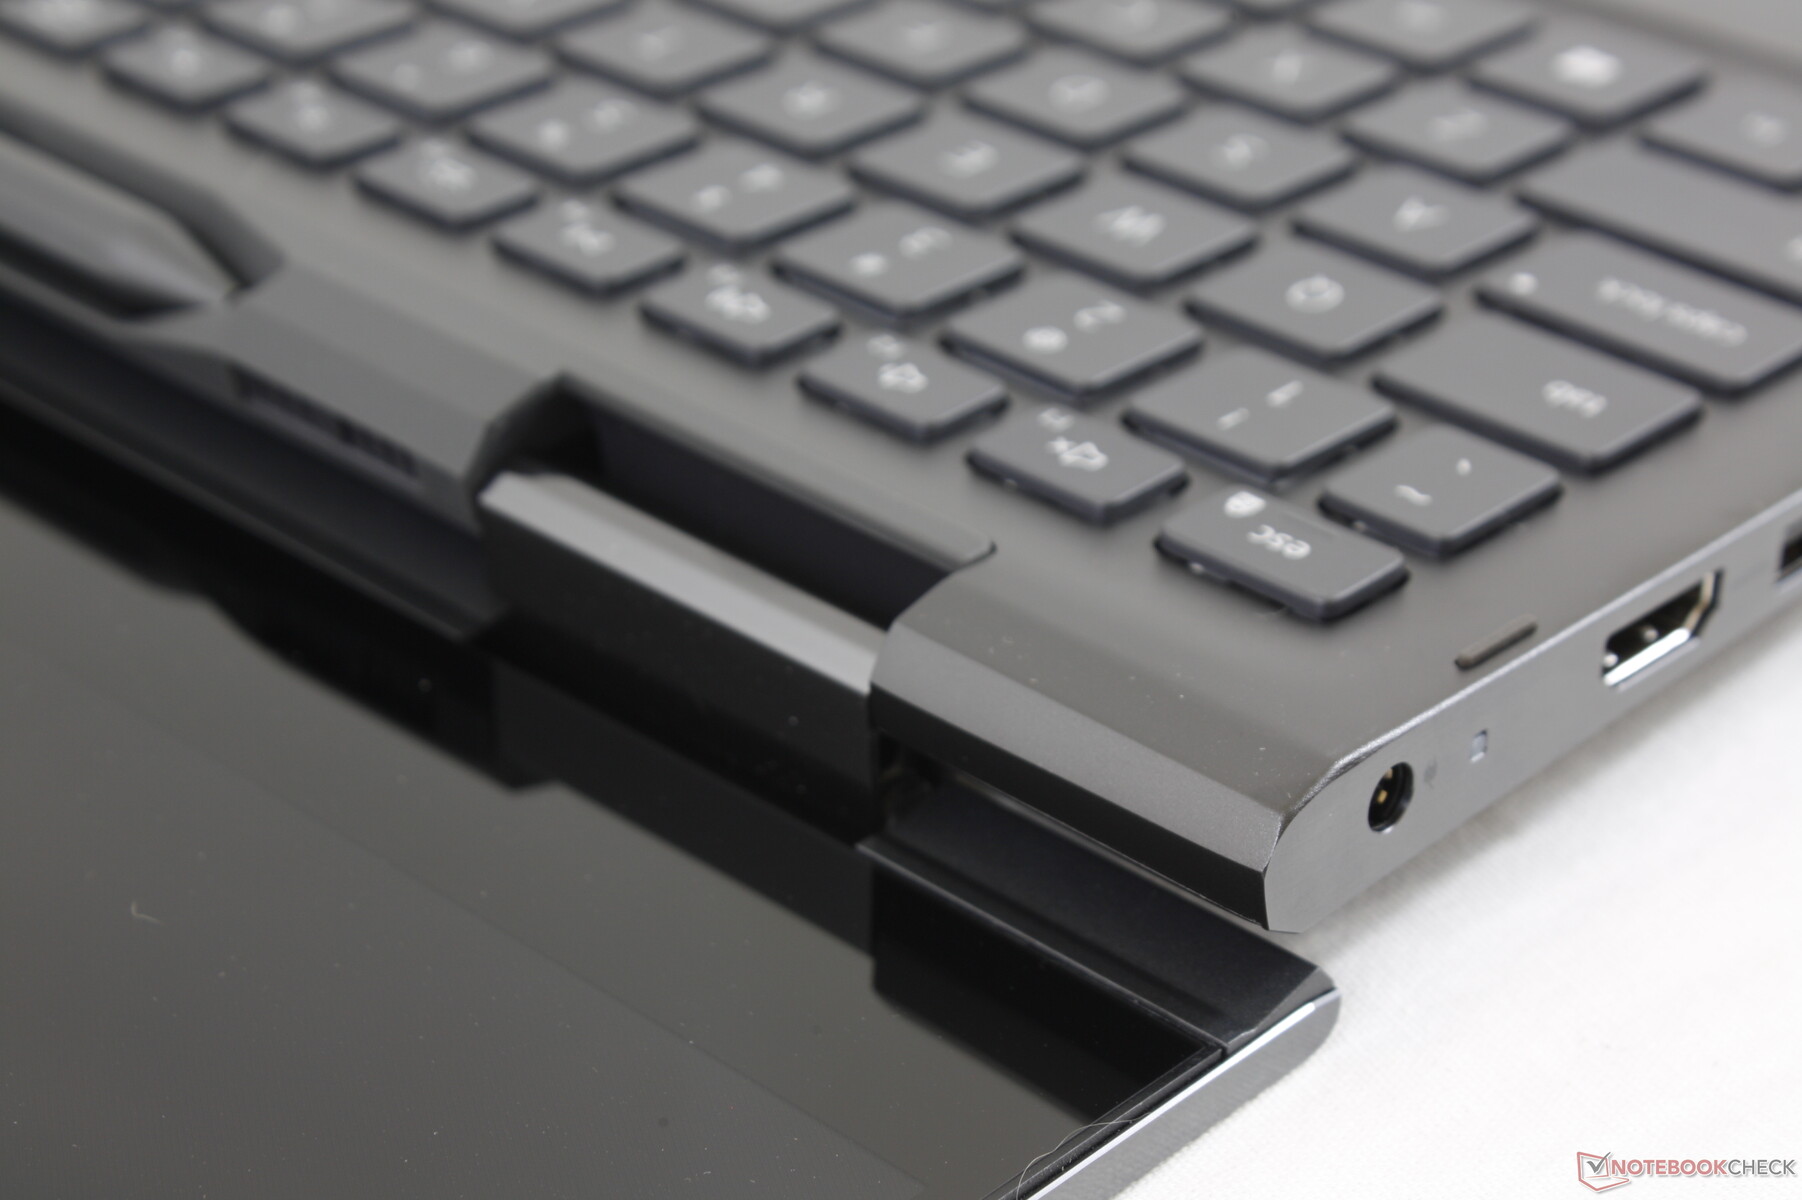
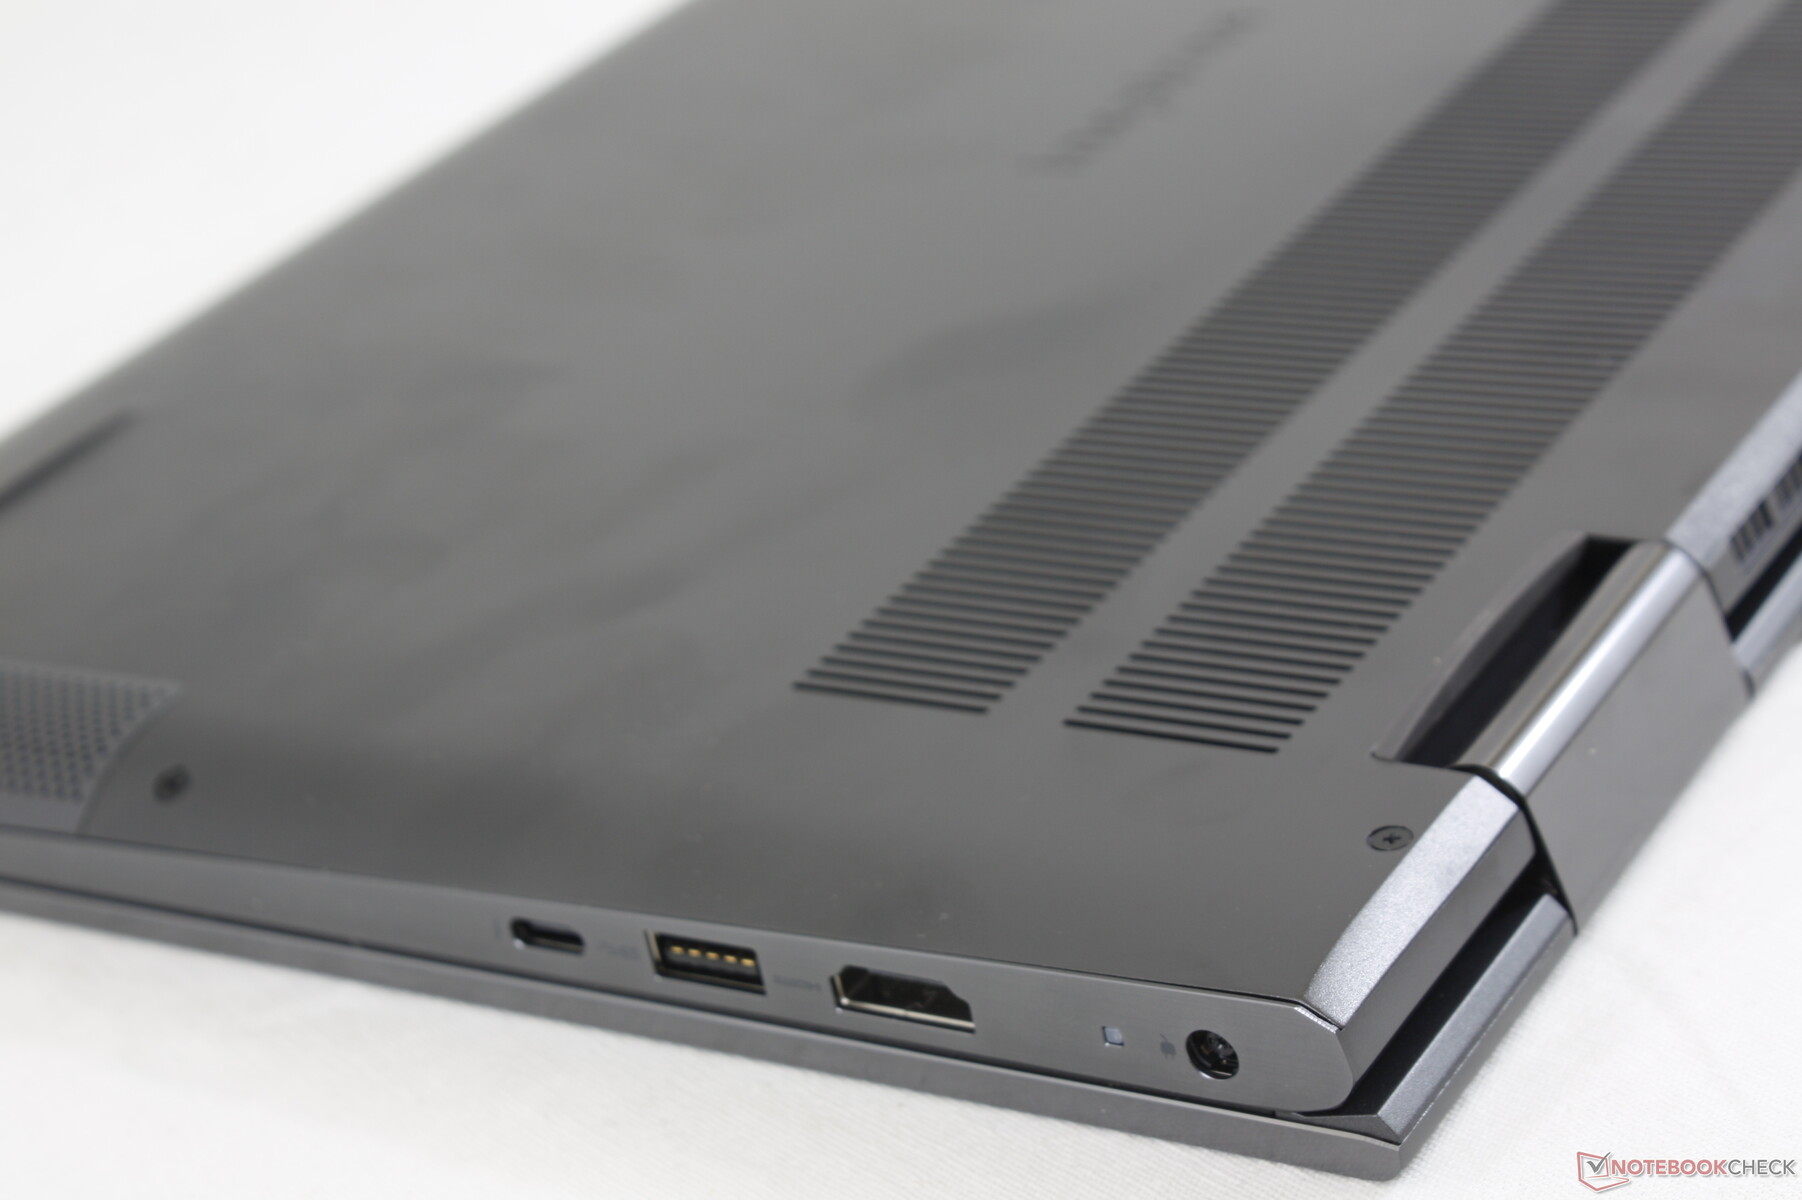
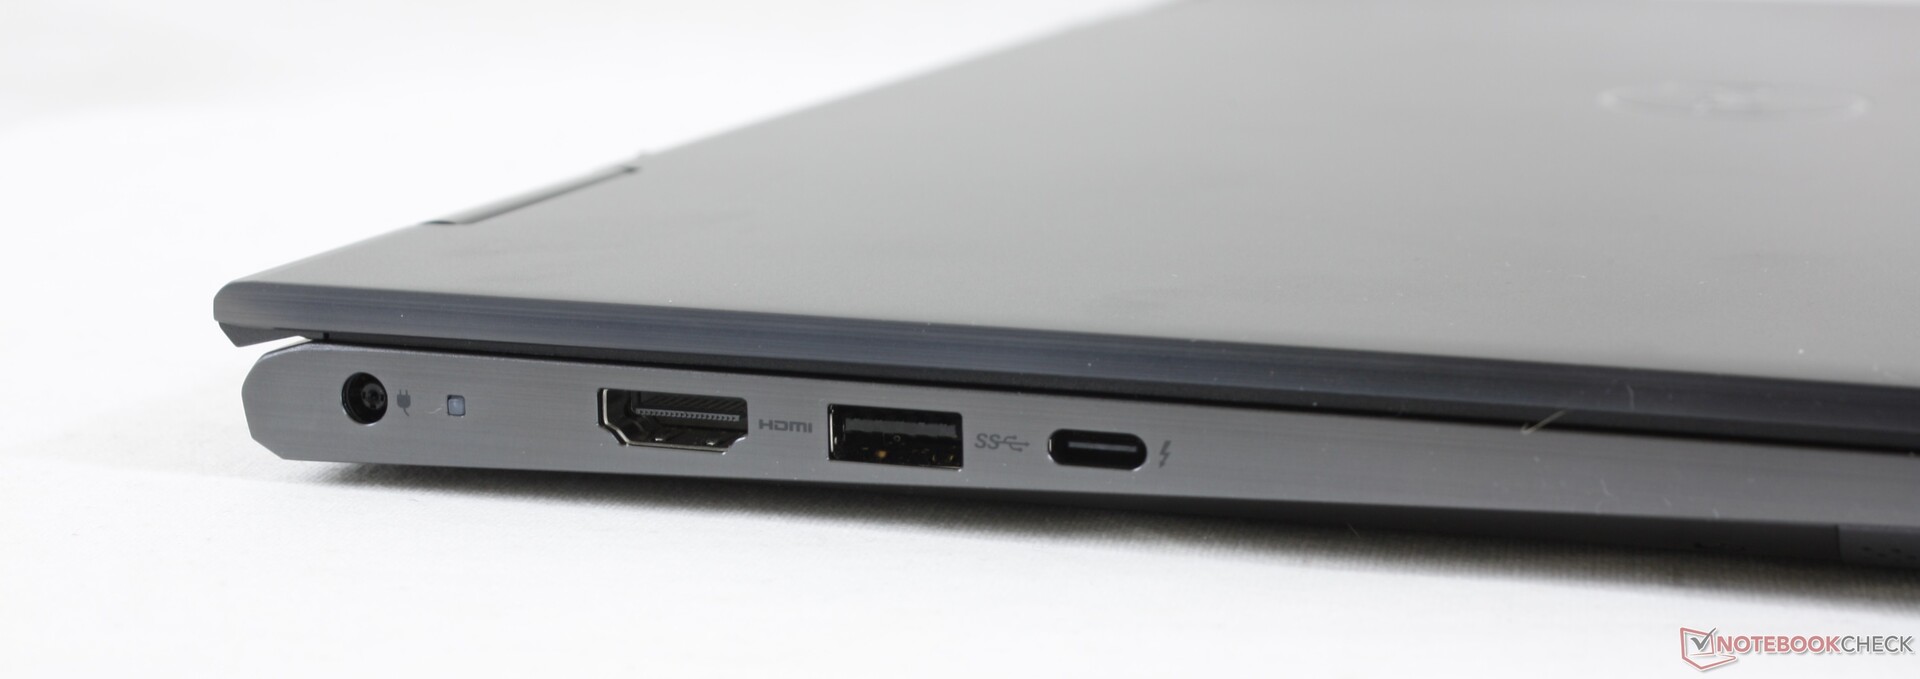
| Portos | HDMI 1. 4Leitor de cartões SDde tamanho normal | Leitor de cartõesHDMI 2.0MicroSD |
| WLAN | Intel AX201 (removível) | Intel AX201 (soldado) |
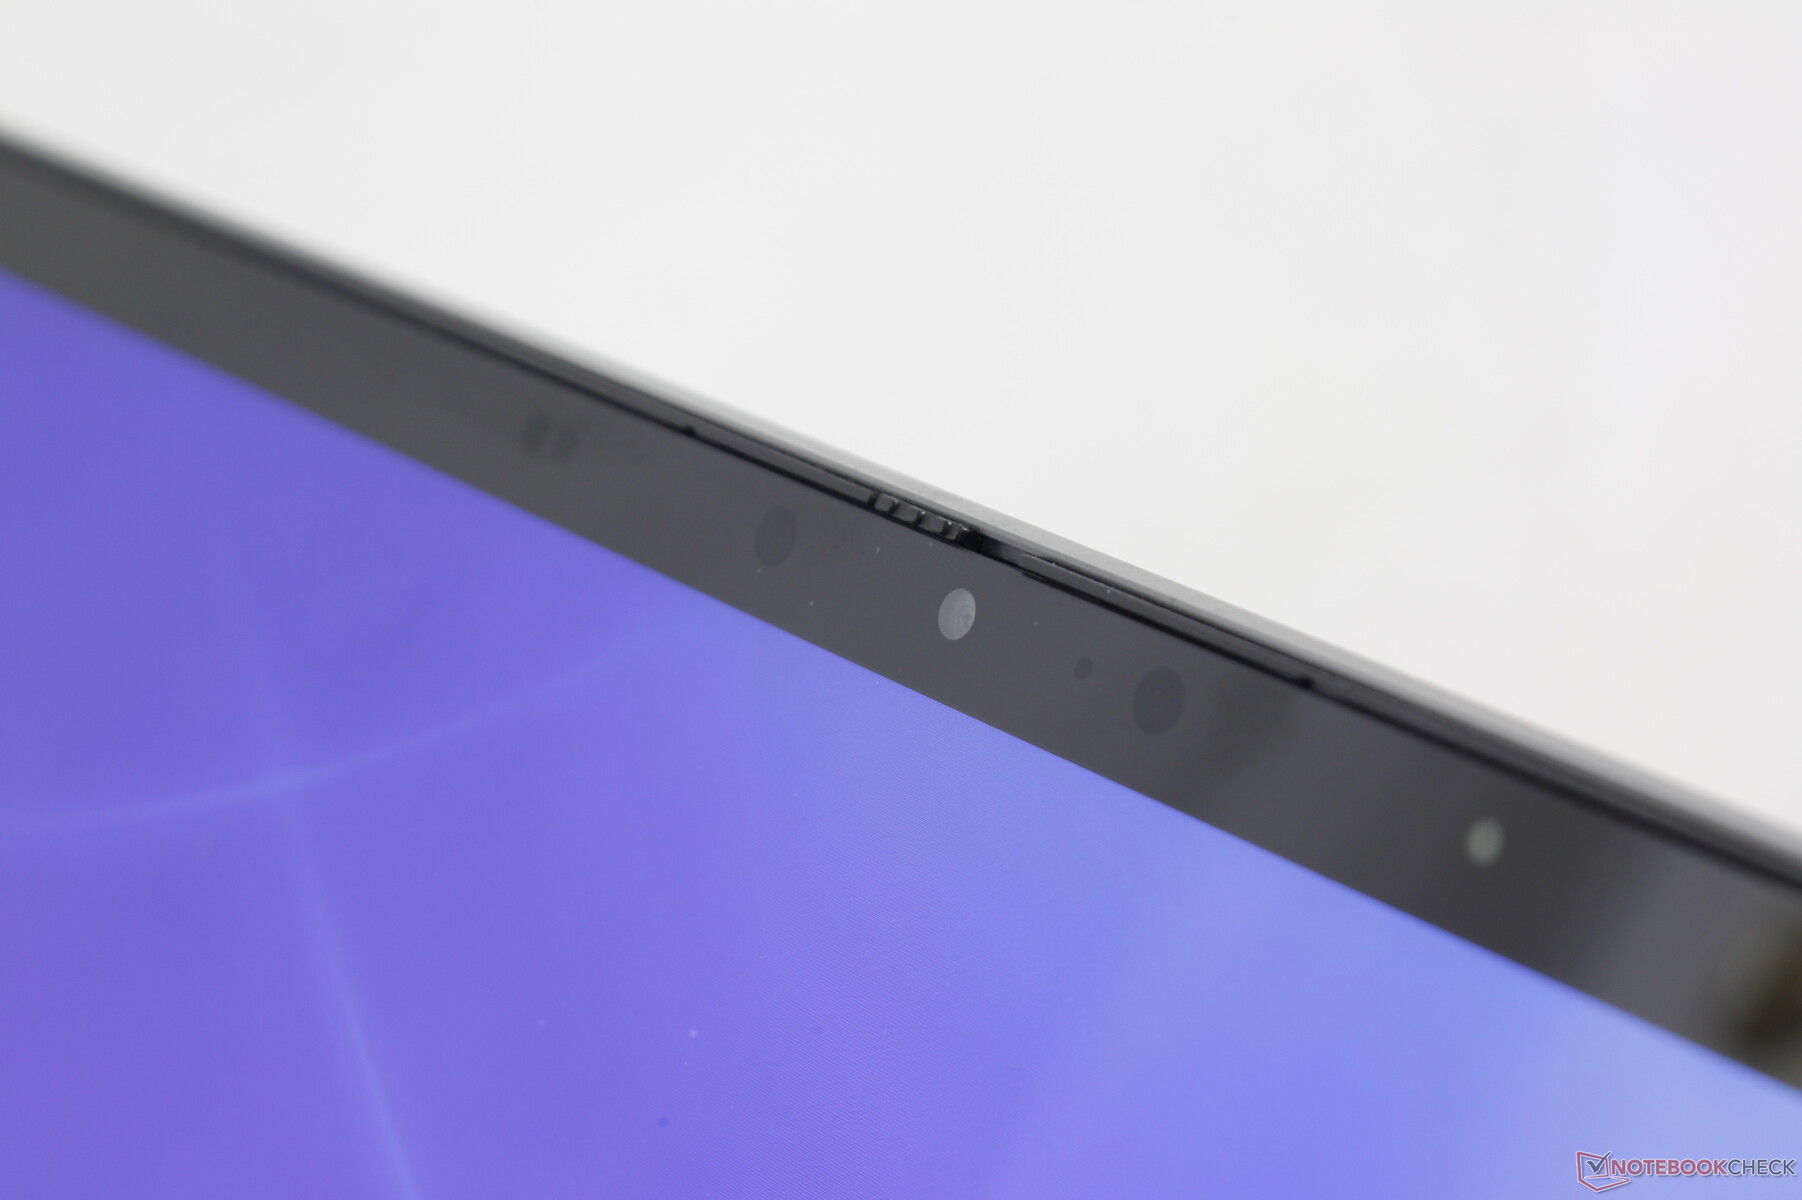
| Câmera IR | Não | Sim |
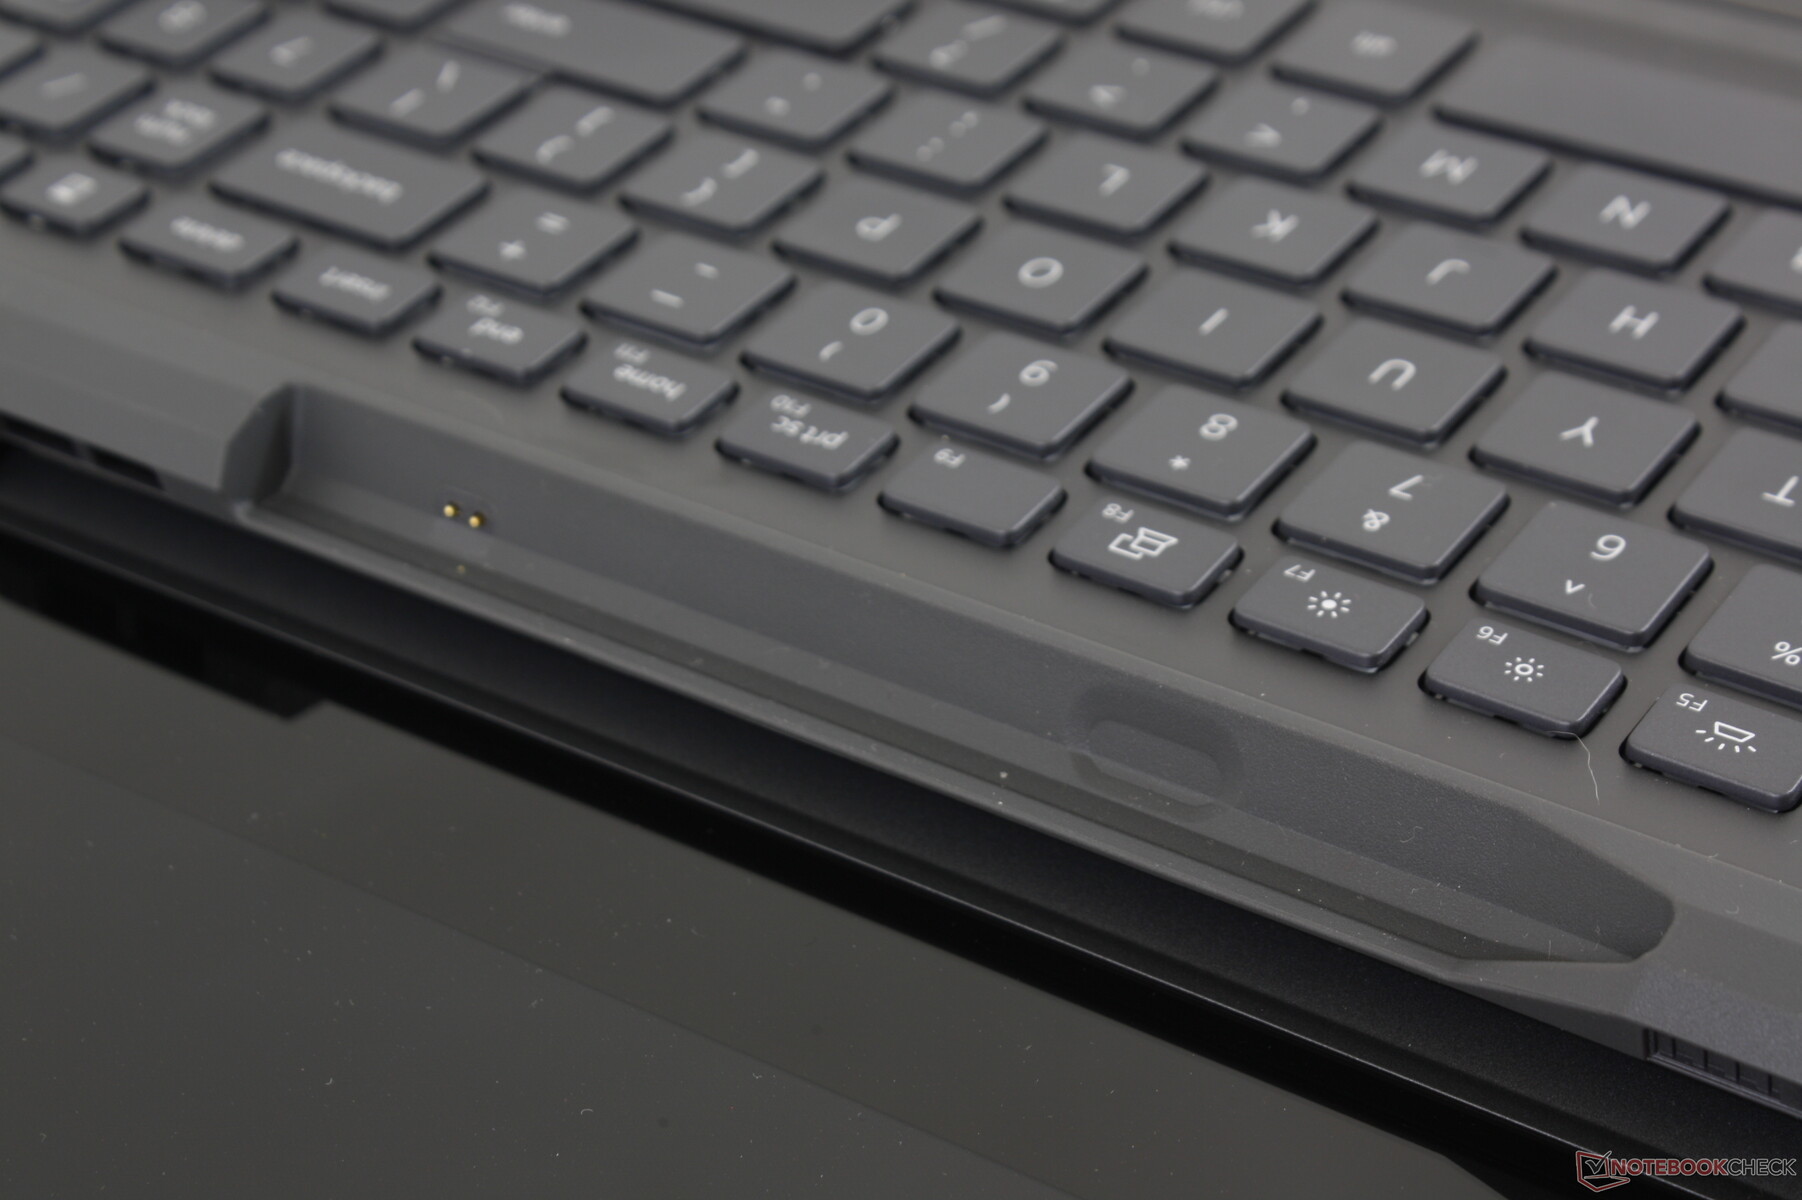
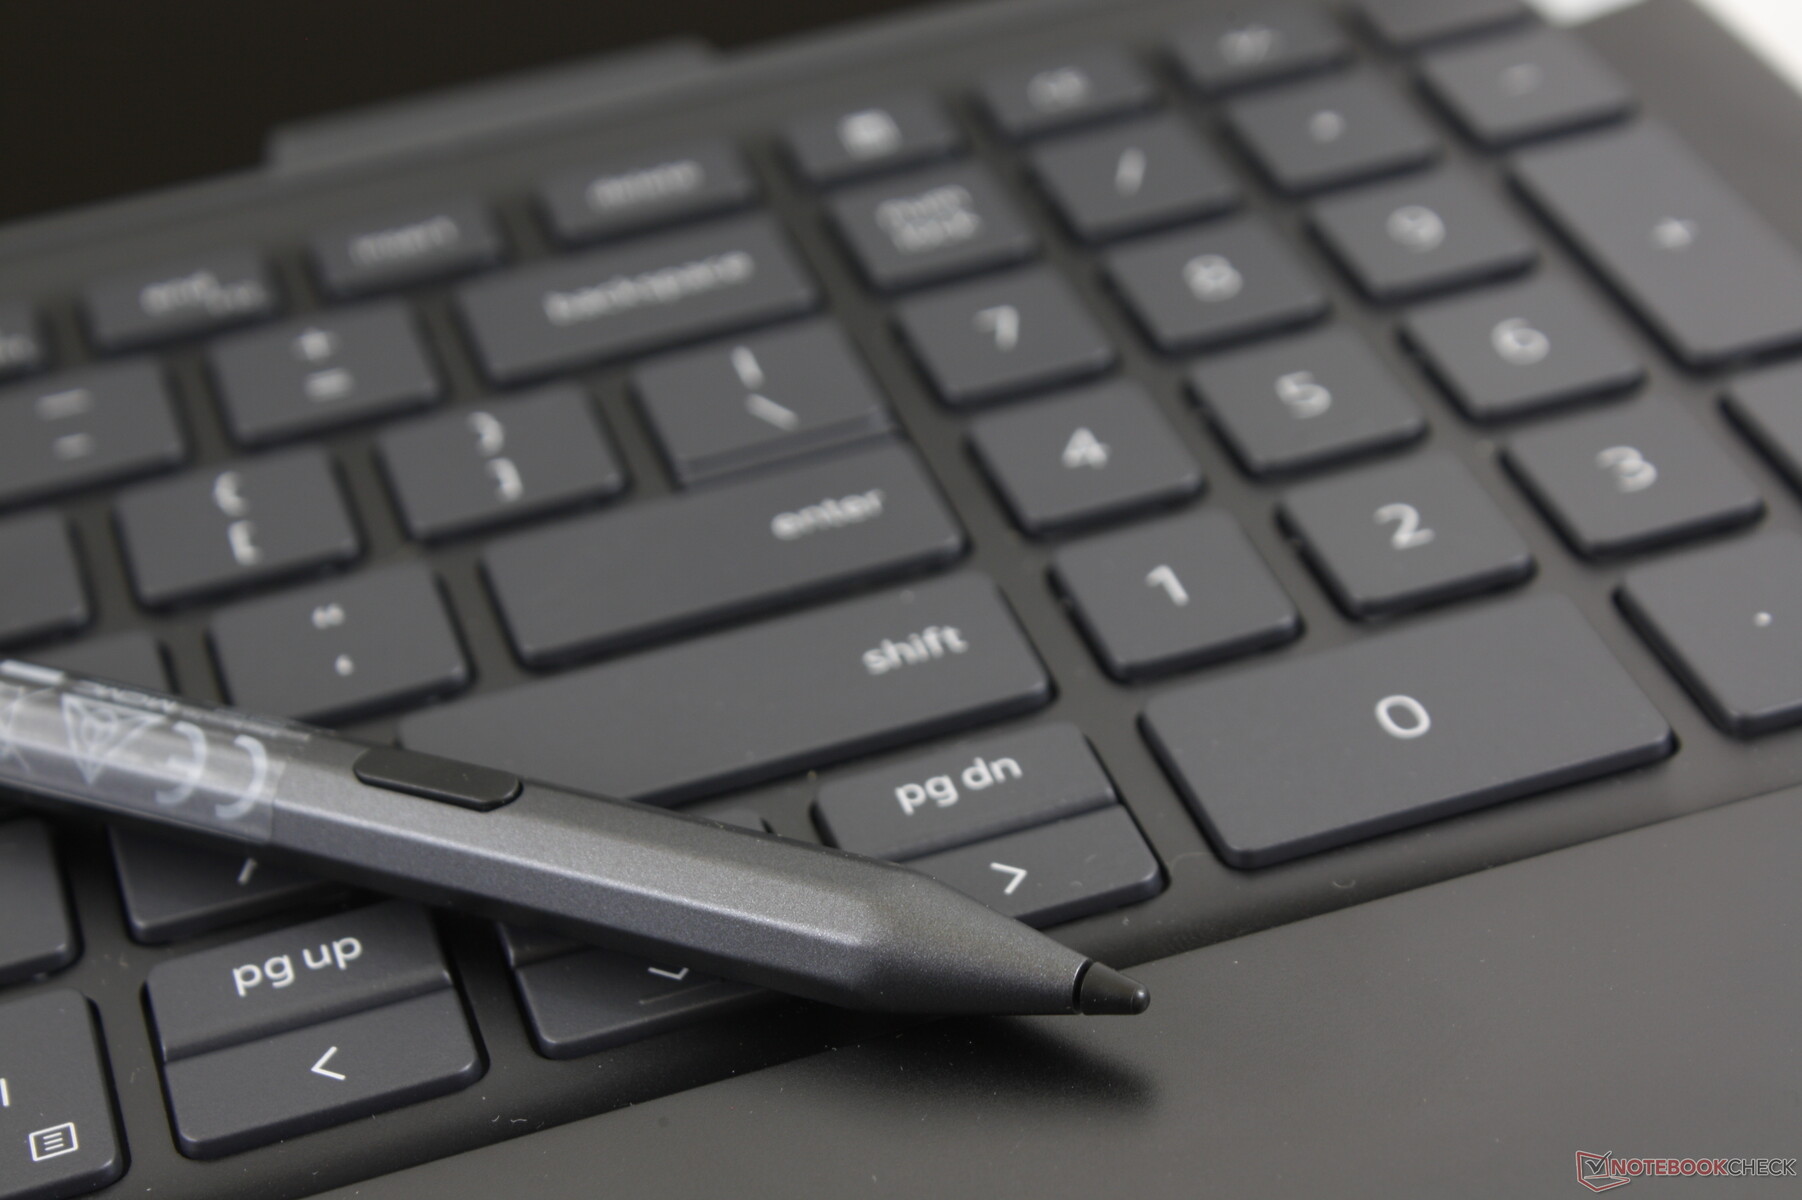
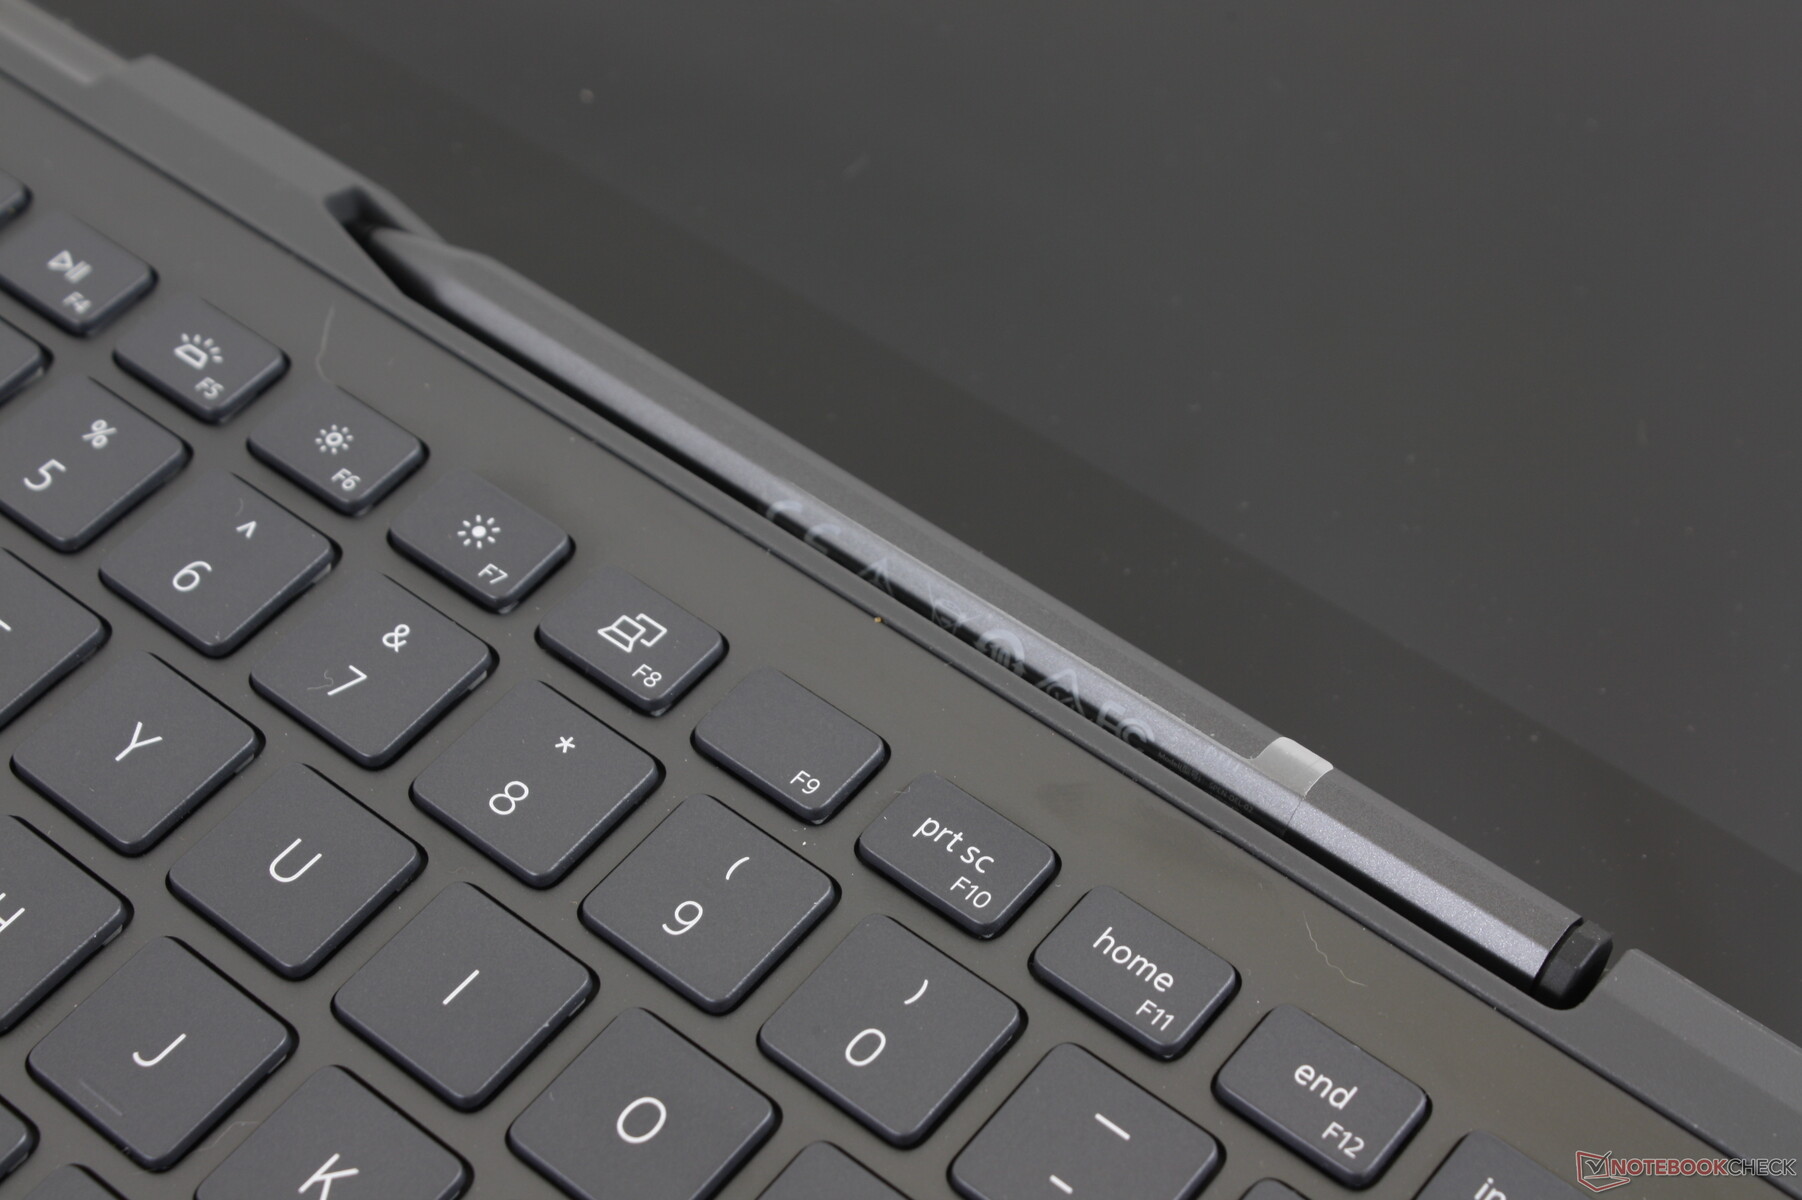
| Garagem da caneta | Não | Sim |
| Caneta ativa Dell | PN350M, vendido separadamente | PN771M, incluído na caixa |
| Bateria, Energia | 53 WhSmaller adaptador CA de 65 W | 68 WhLarger adaptador AC de 90 W |
| Peso | >1,78 kg | >1,91 kg |
| Preço | >$700 USD | >$1500 USD |
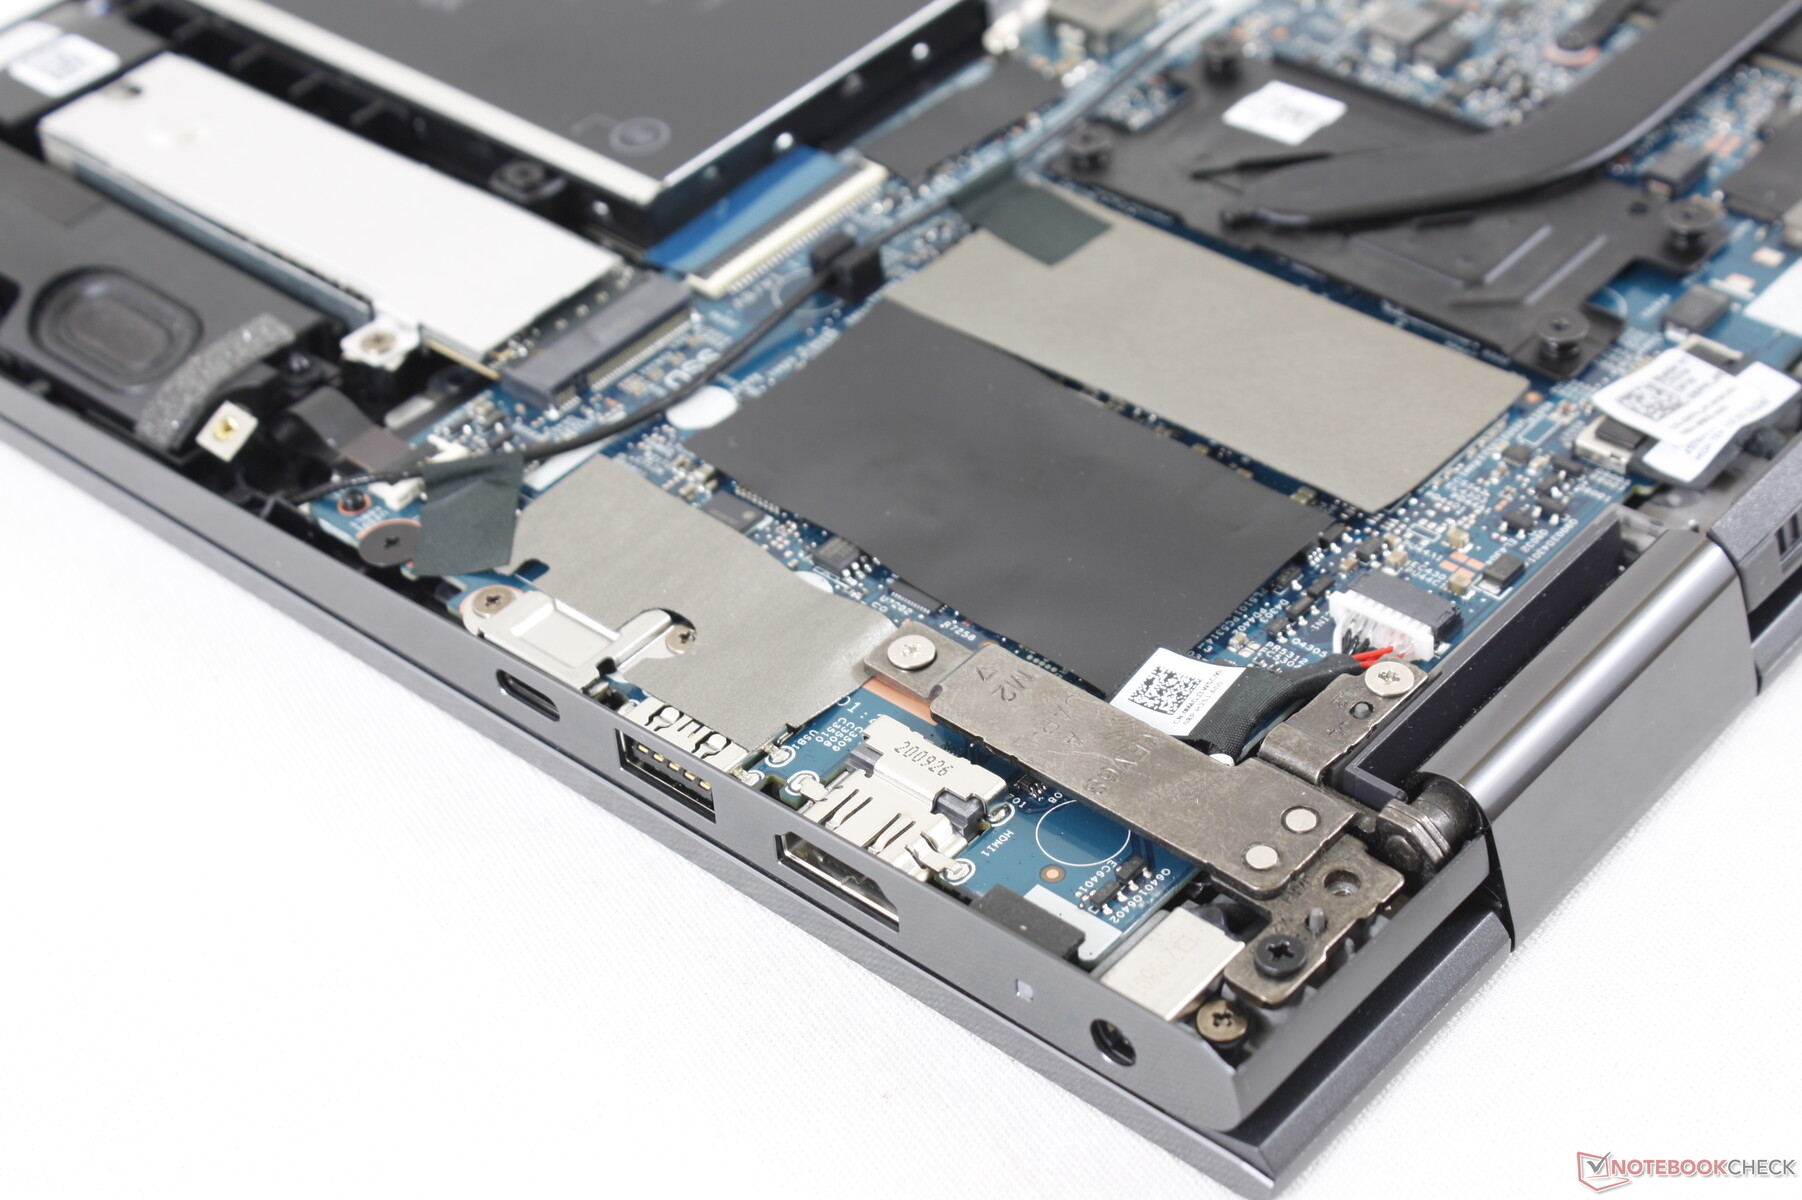
Conectividade
A Black Edition troca o leitor SD de tamanho completo na Silver Edition por um menor MicroSD. É uma mudança inconveniente, uma vez que os adaptadores microSD para SD de tamanho completo são bastante comuns.
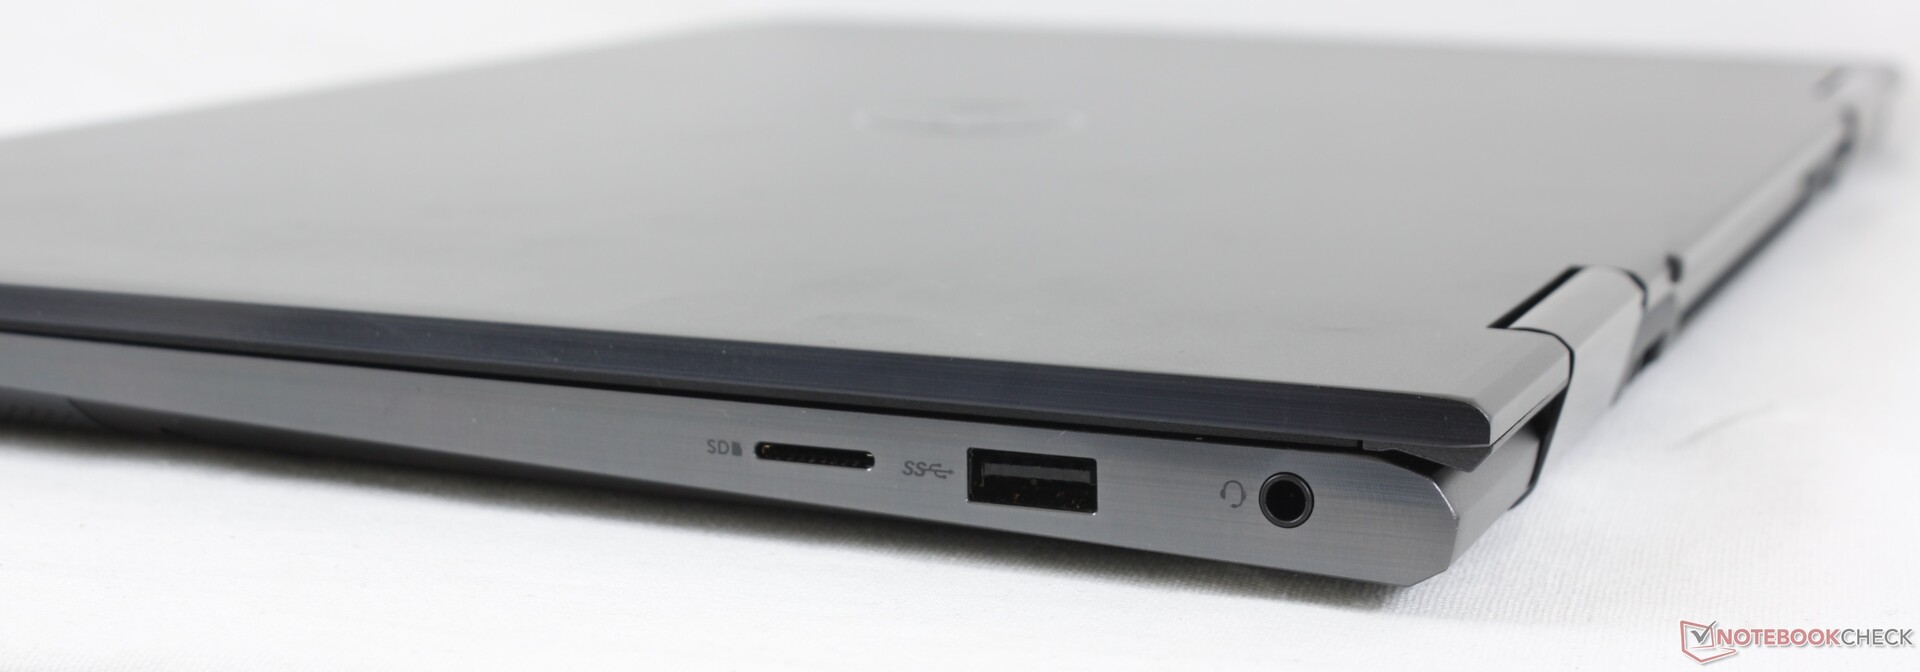
Leitor de cartões SD
As taxas de transferência do leitor de cartões SD são tão lentas quanto na Edição Prata. A transferência de 1 GB de fotos de nosso cartão UHS-II para a área de trabalho leva cerca de 50 segundos.
| SD Card Reader | |
| average JPG Copy Test (av. of 3 runs) | |
| Microsoft Surface Book 3 15 (Toshiba Exceria Pro M501 microSDXC 64GB) | |
| Samsung Galaxy Book Flex 15-NP950 (Toshiba Exceria Pro M501 microSDXC 64GB) | |
| HP Envy x360 15-ee0257ng (Toshiba Exceria Pro SDXC 64 GB UHS-II) | |
| Asus ZenBook Flip 15 UX563FD-A1027T (Toshiba Exceria Pro SDXC 64 GB UHS-II) | |
| Dell Inspiron 15 7506 2-in-1 P97F (Toshiba Exceria Pro SDXC 64 GB UHS-II) | |
| Dell Inspiron 15 7000 7506 2-in-1 Black Edition (Toshiba Exceria Pro M501 microSDXC 32GB) | |
| maximum AS SSD Seq Read Test (1GB) | |
| Microsoft Surface Book 3 15 (Toshiba Exceria Pro M501 microSDXC 64GB) | |
| Samsung Galaxy Book Flex 15-NP950 (Toshiba Exceria Pro M501 microSDXC 64GB) | |
| HP Envy x360 15-ee0257ng (Toshiba Exceria Pro SDXC 64 GB UHS-II) | |
| Dell Inspiron 15 7506 2-in-1 P97F (Toshiba Exceria Pro SDXC 64 GB UHS-II) | |
| Dell Inspiron 15 7000 7506 2-in-1 Black Edition (Toshiba Exceria Pro M501 microSDXC 32GB) | |
Comunicação
Não tivemos nenhum problema de conectividade quando acoplados ao nosso roteador Netgear RAX200. No entanto, as taxas de transferência são mais lentas do que as que registramos no modelo Silver Edition.
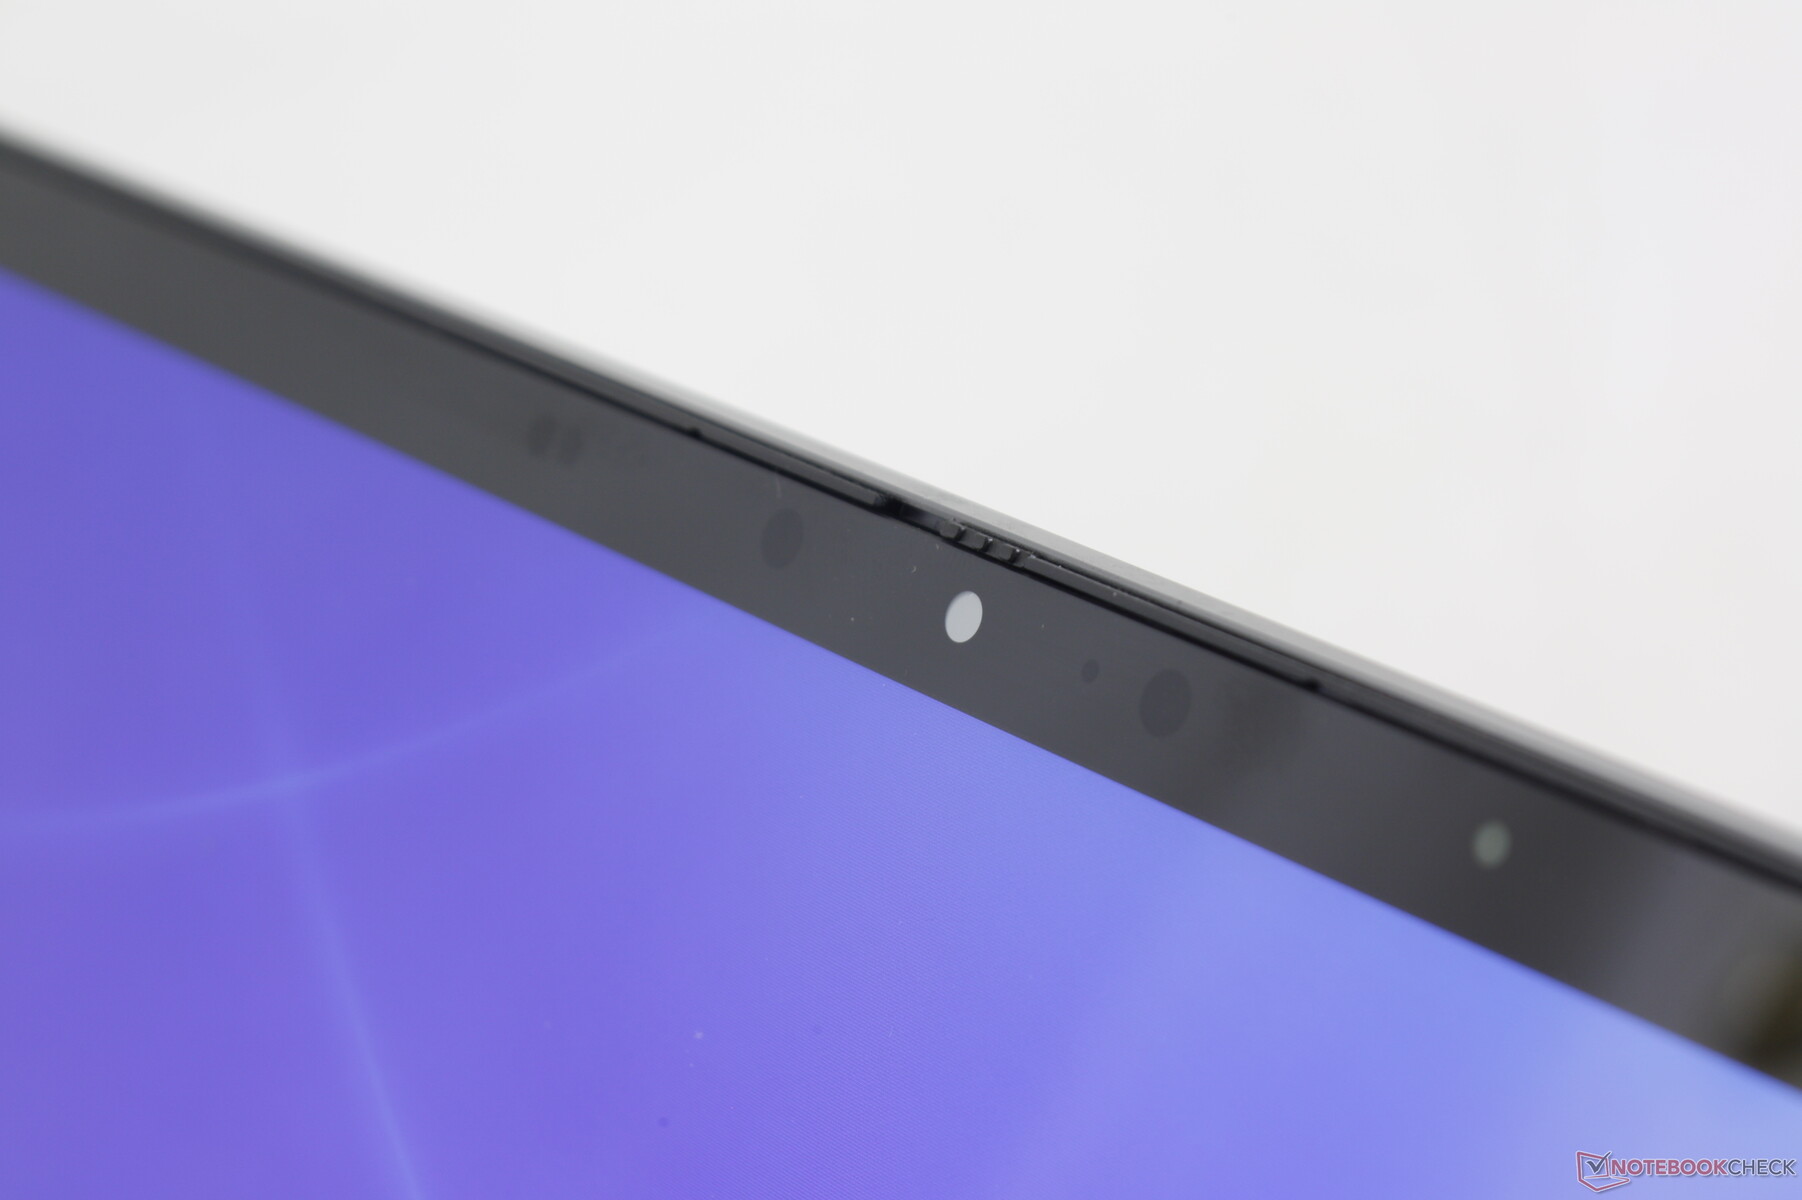
Webcam


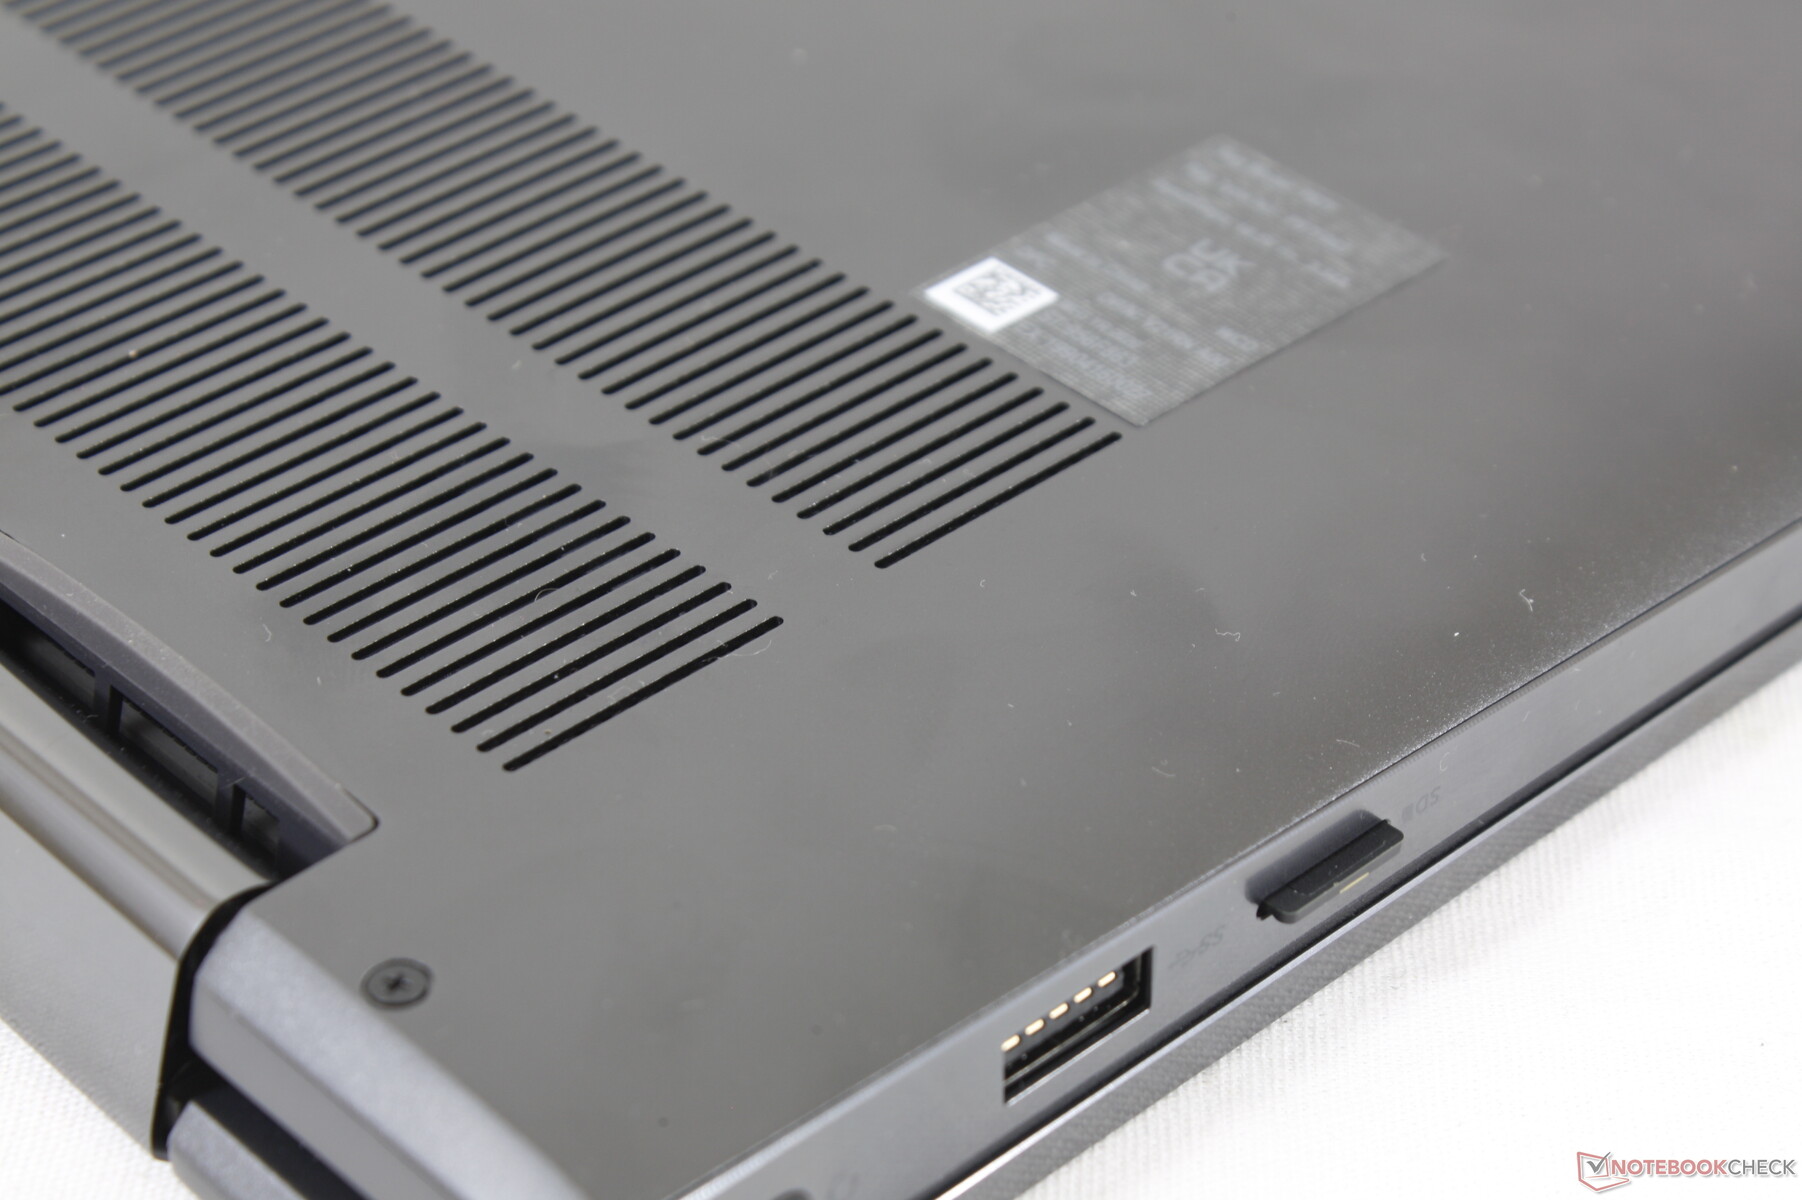
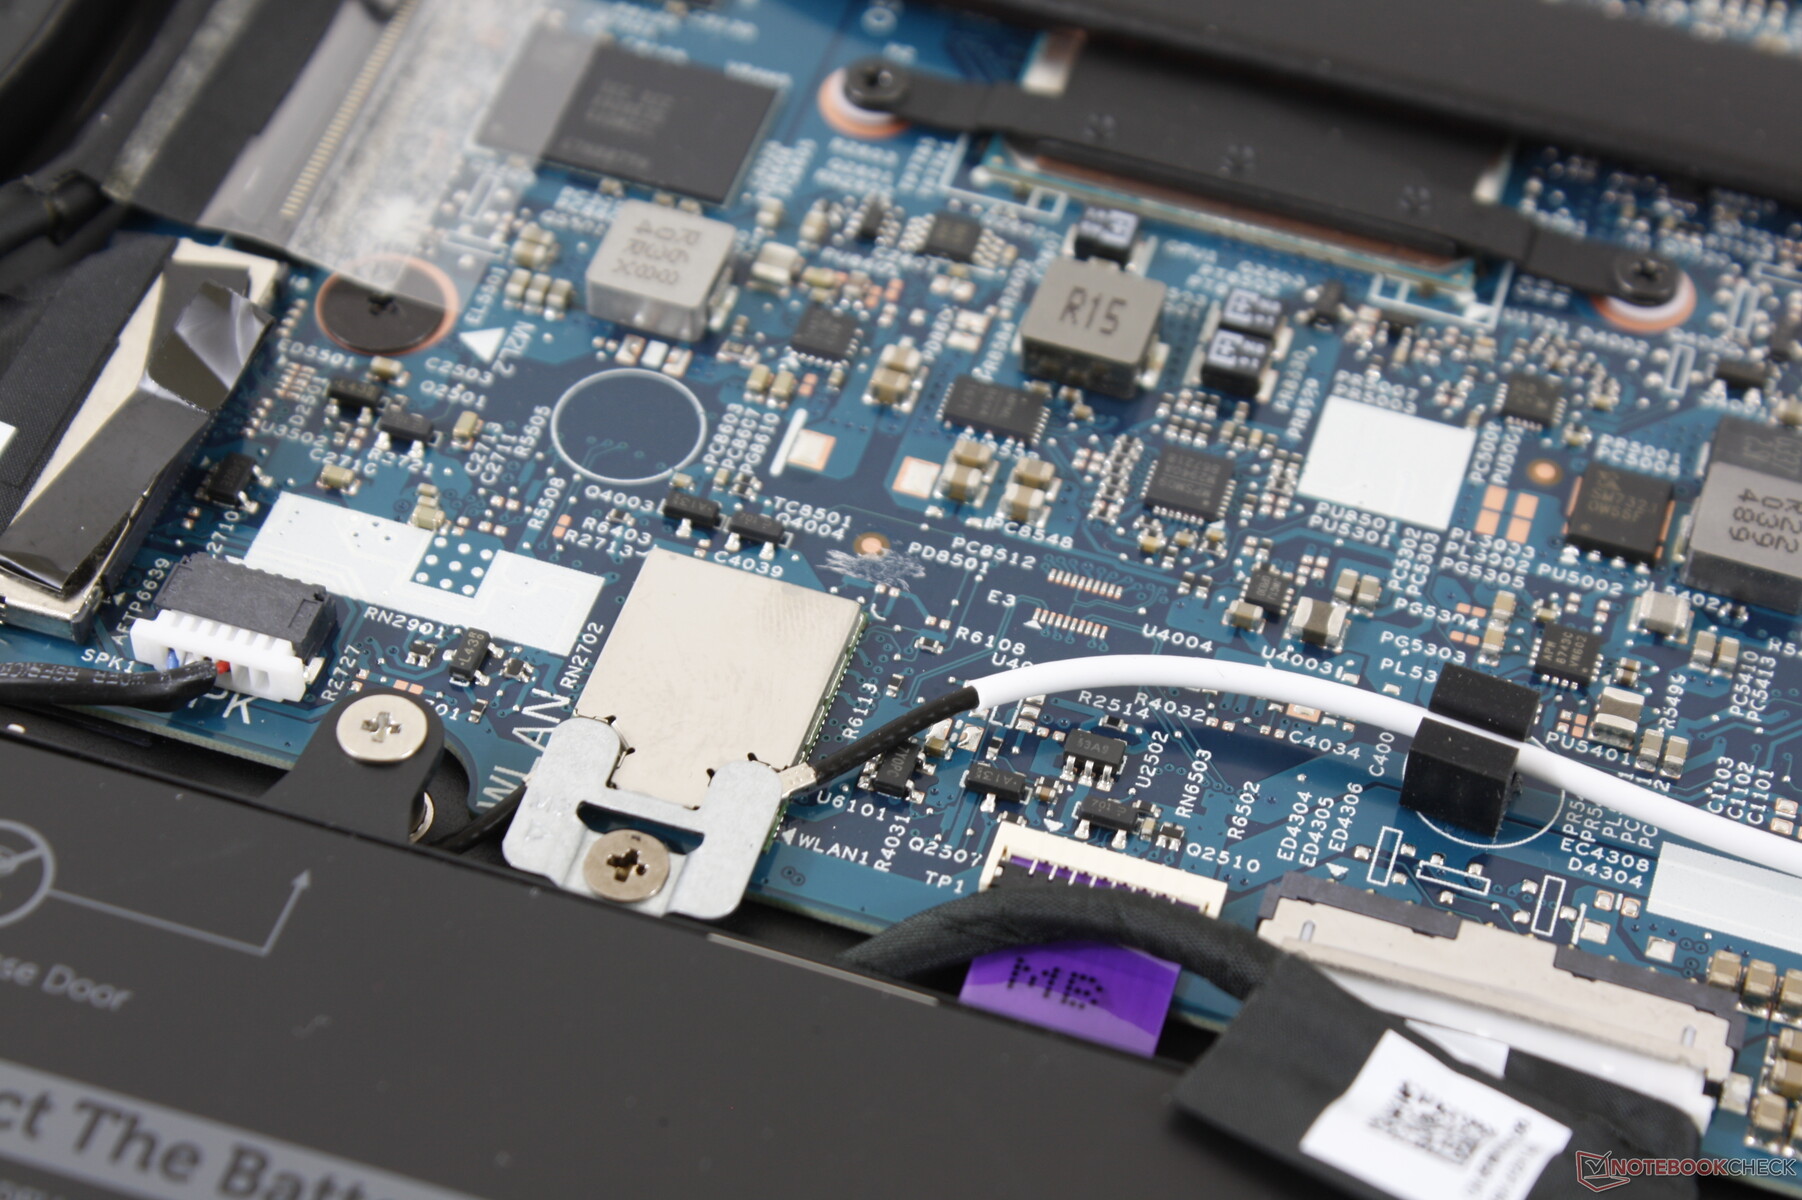
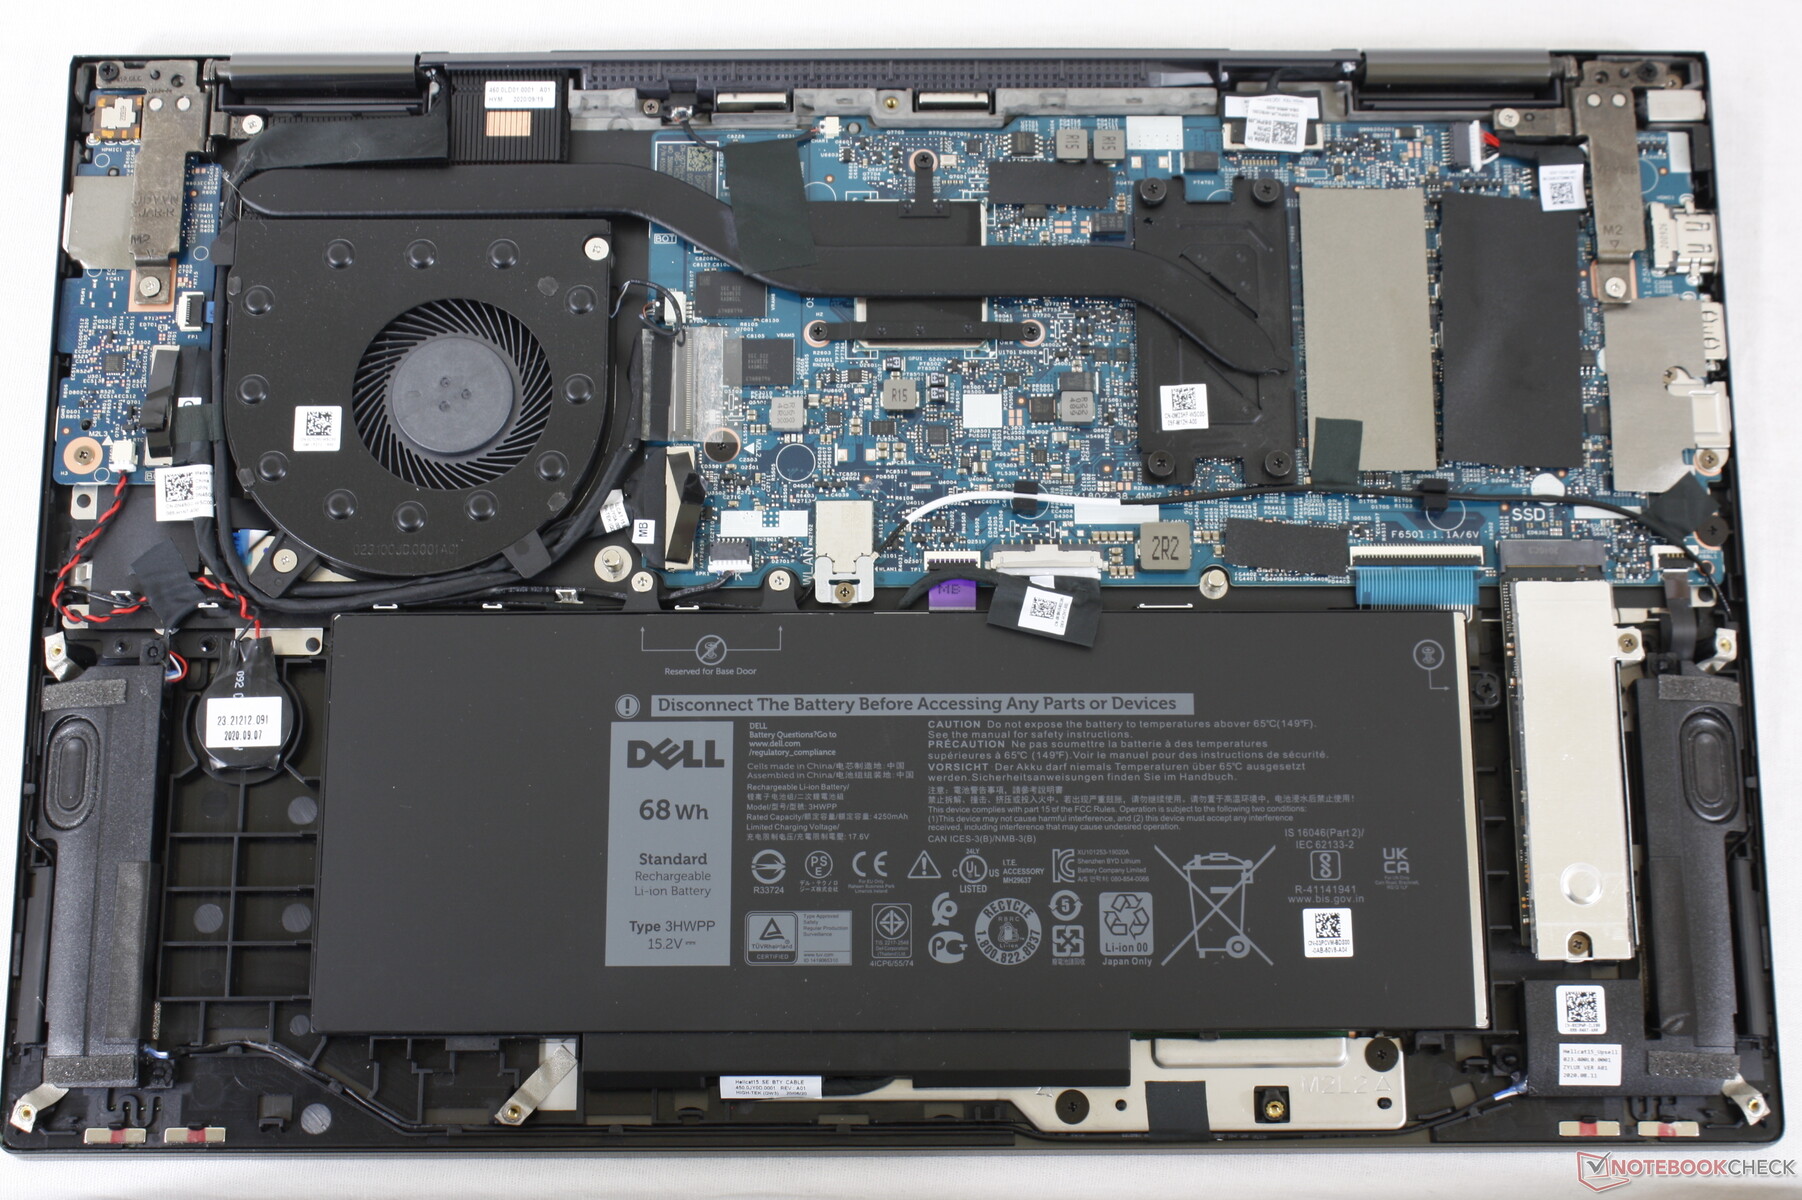
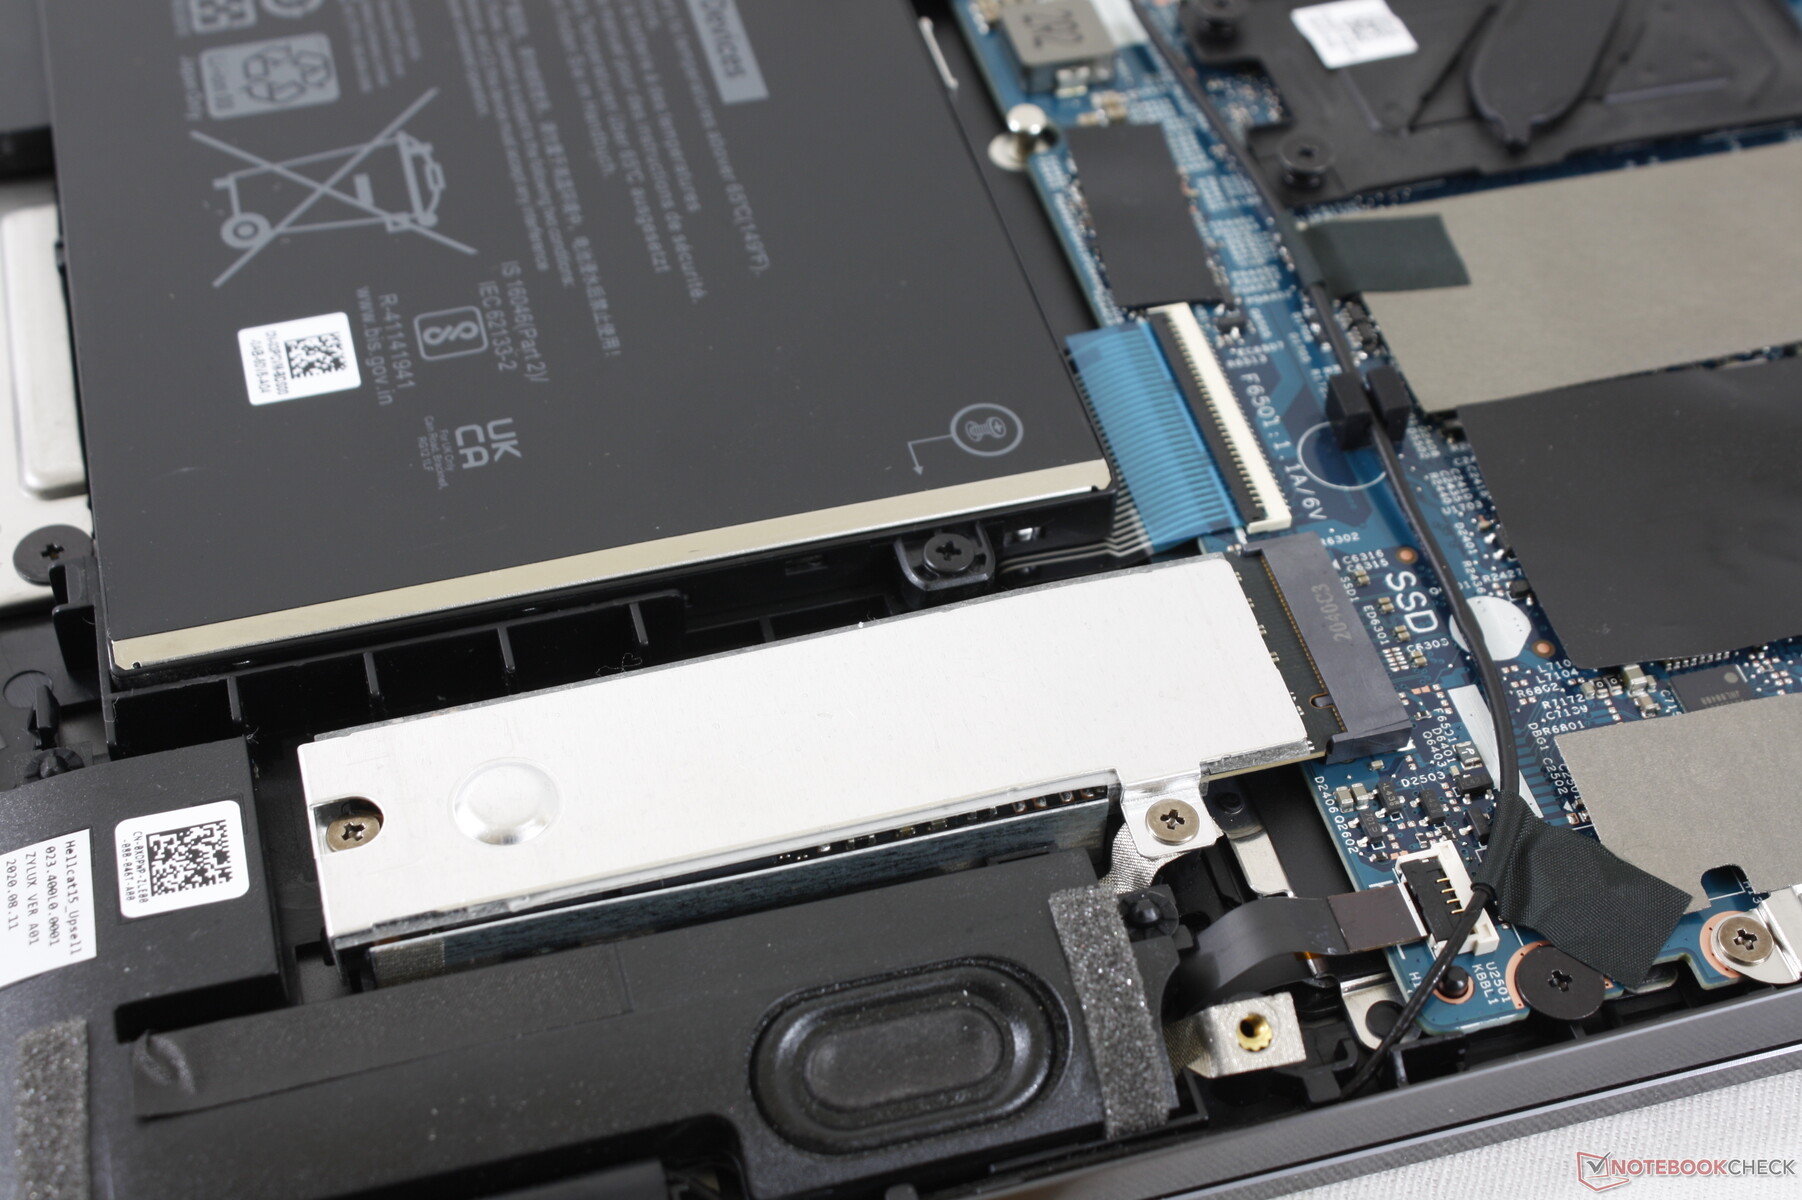
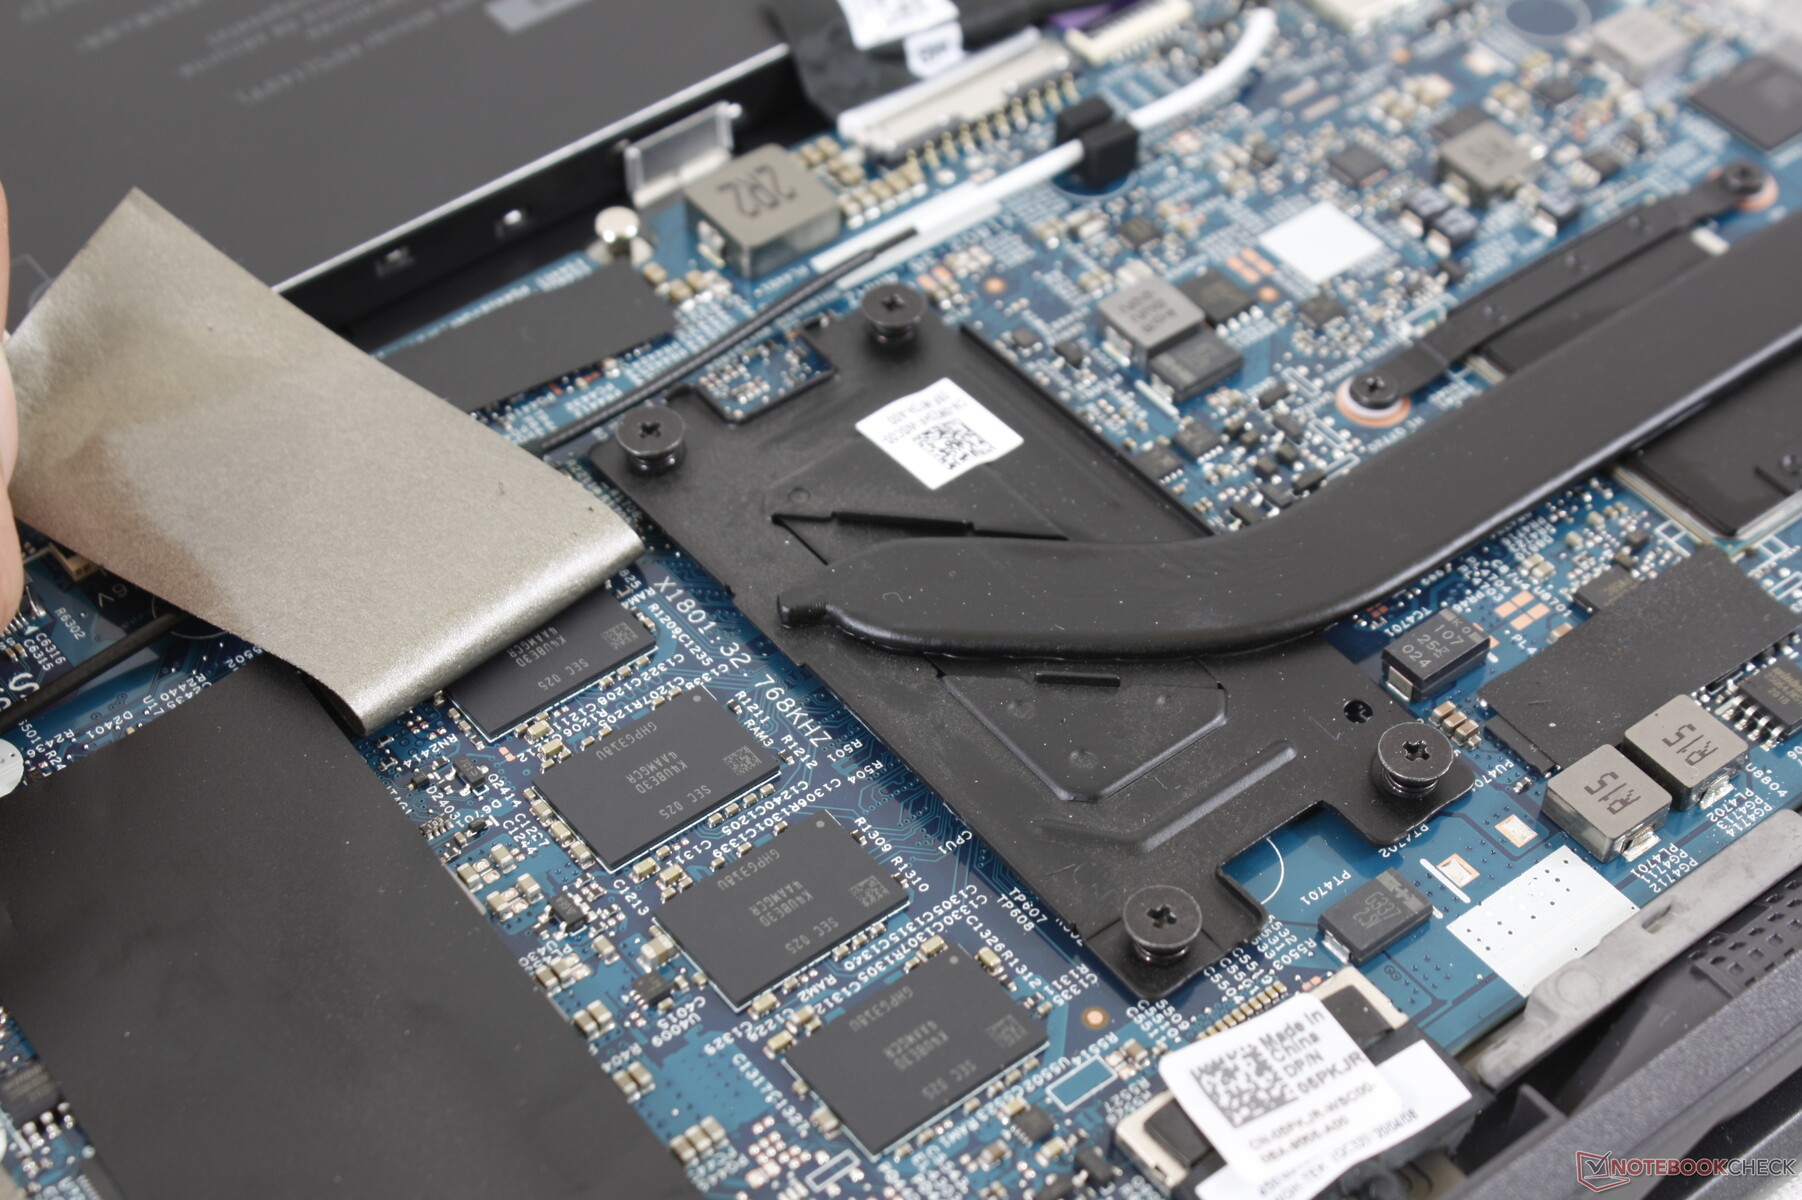
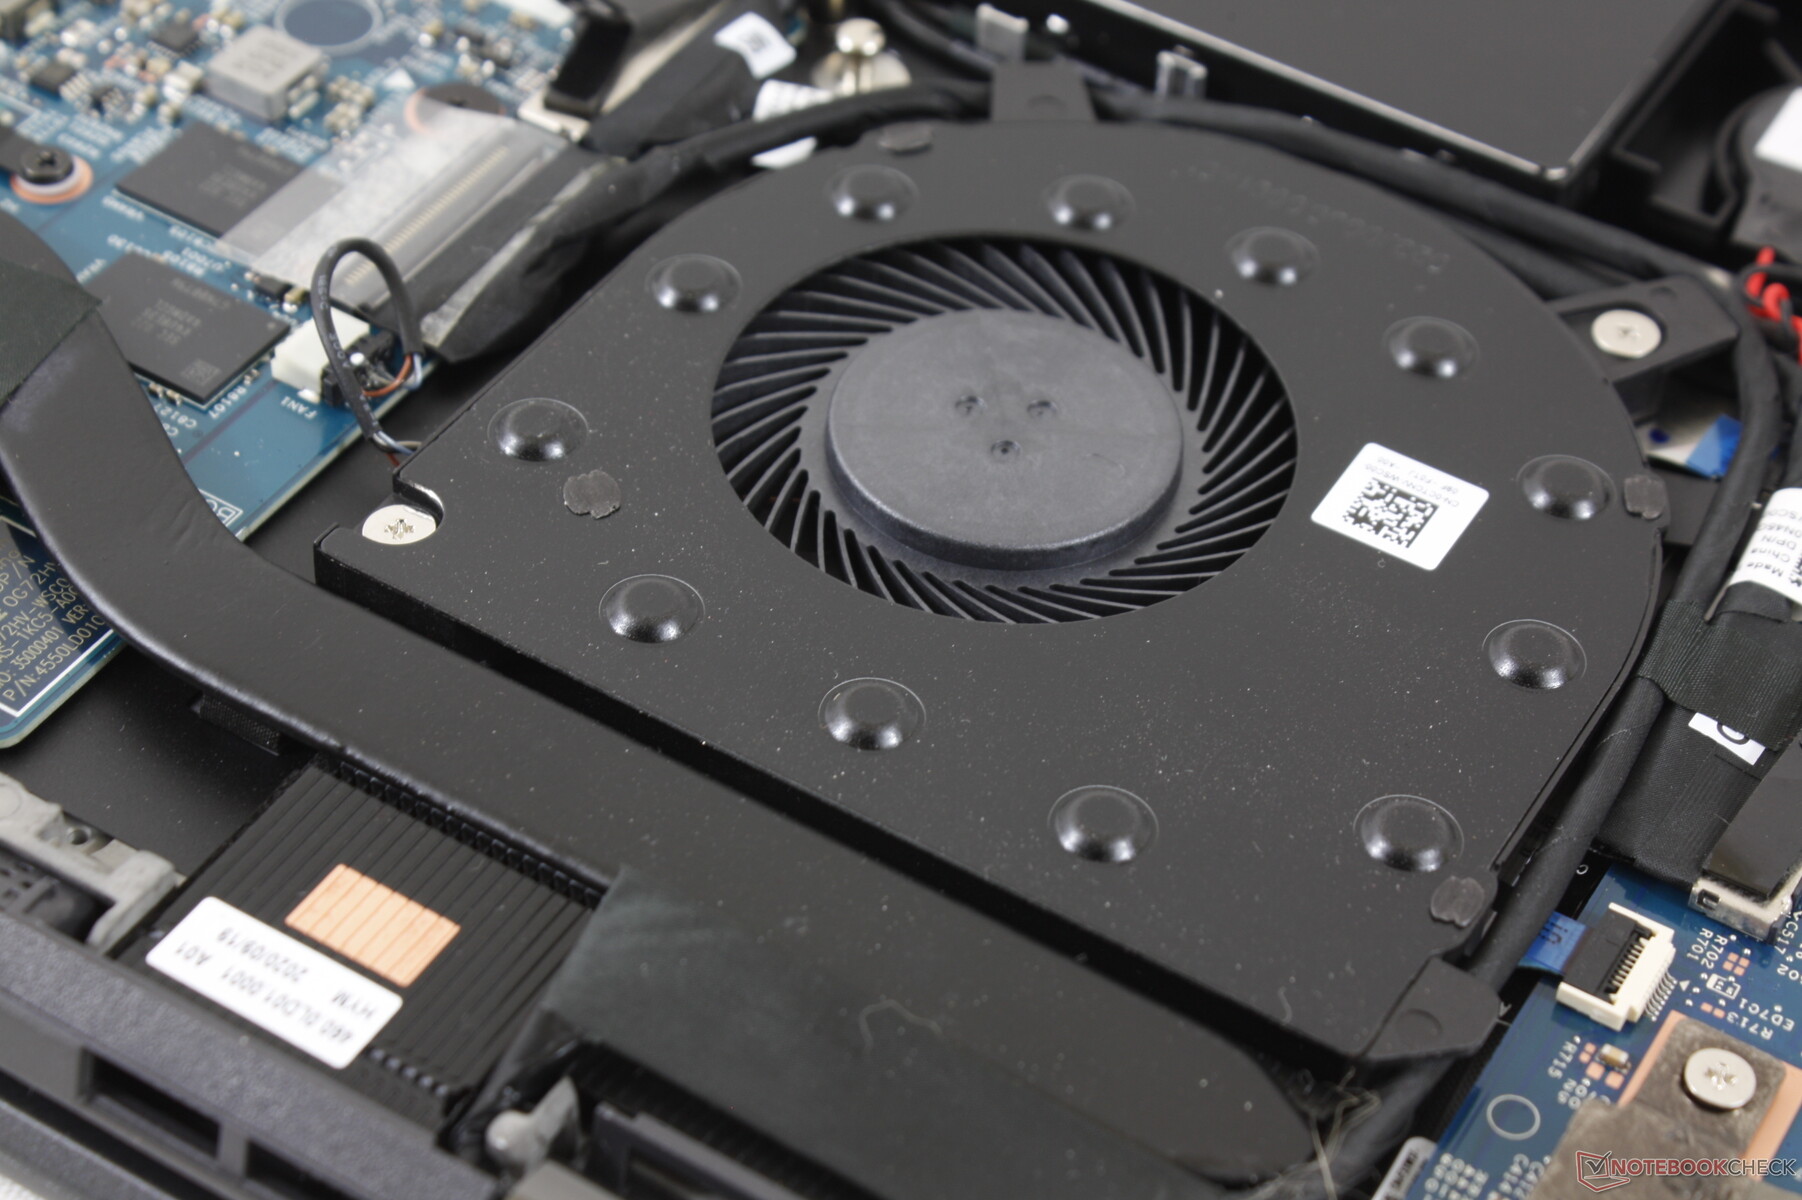
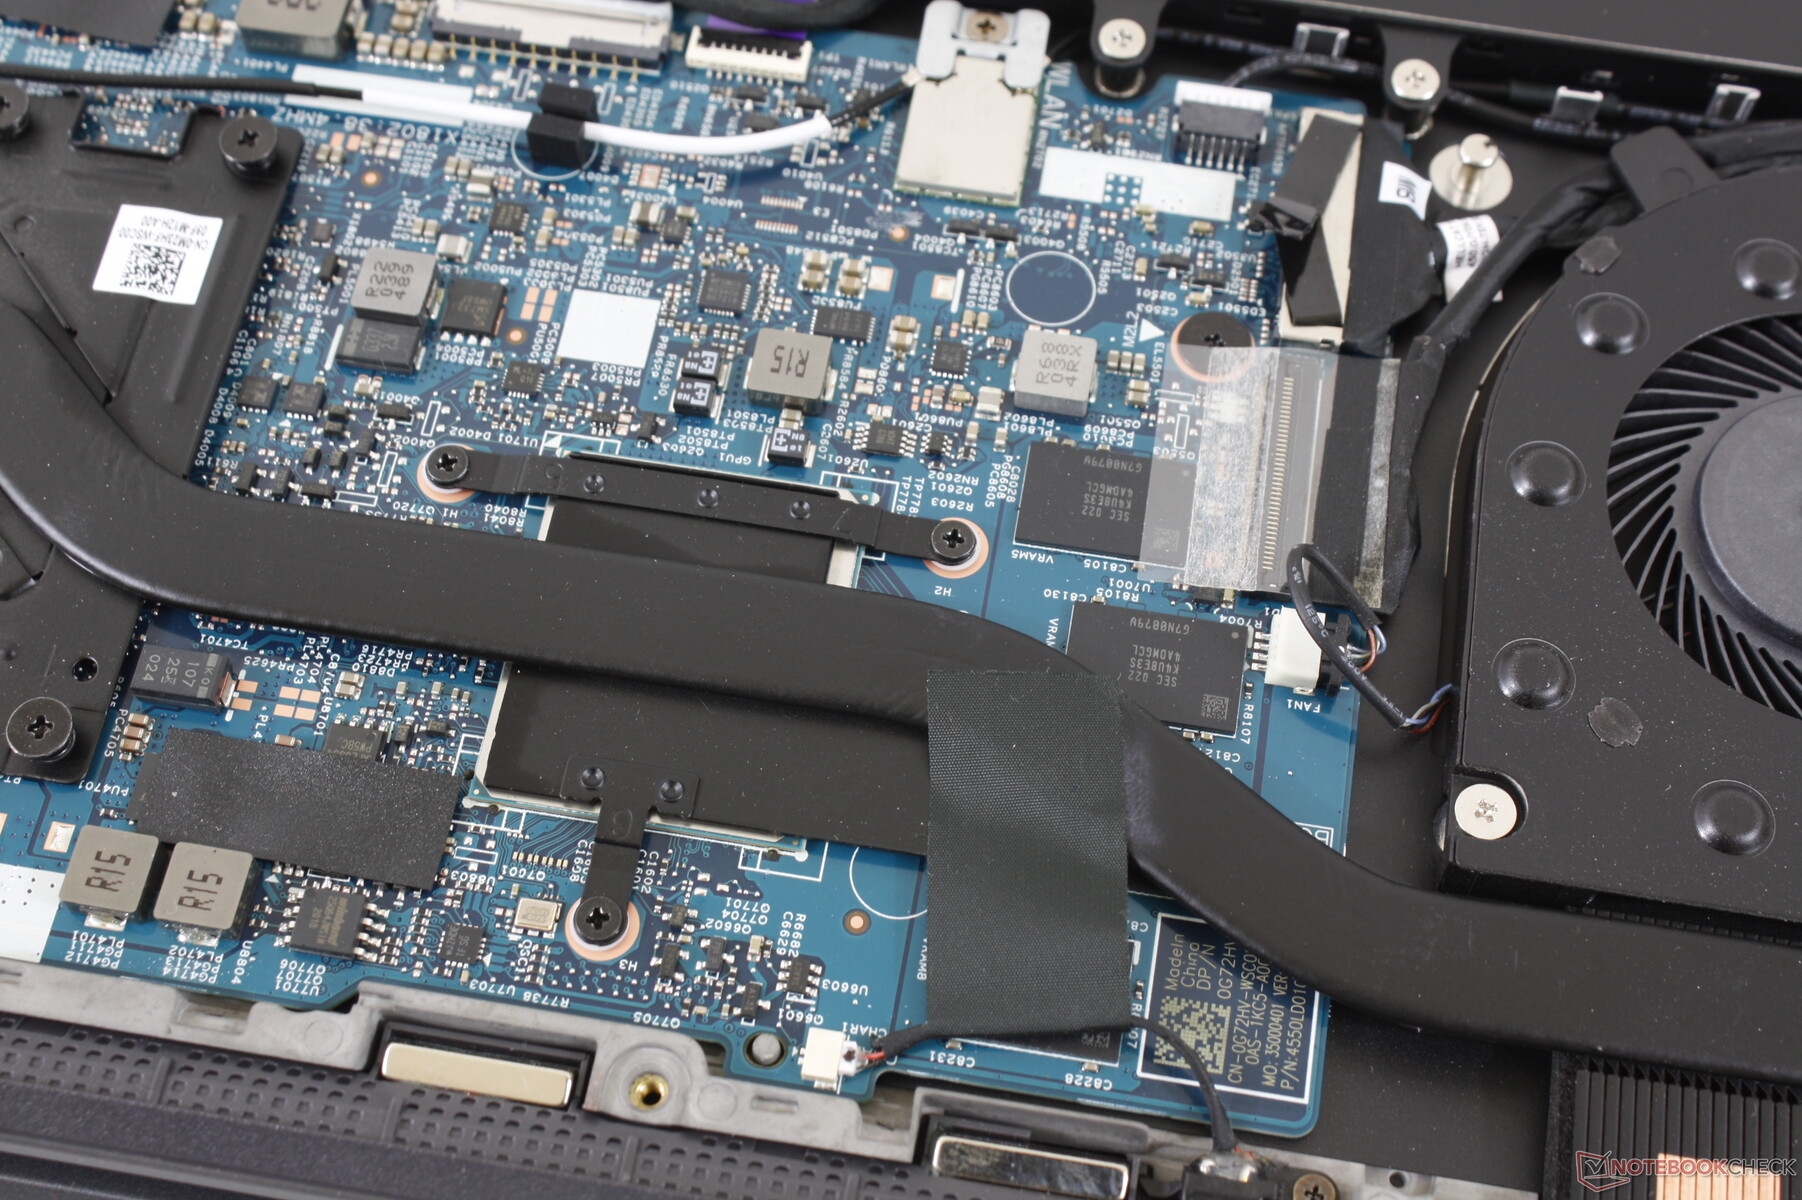
Manutenção
O painel inferior é muito fácil de remover e de manutenção. No entanto, tenha em mente que tanto a RAM quanto a WLAN são soldadas aqui, ao contrário da Edição Prata.
Acessórios e Garantia
A caixa inclui a caneta ativa Dell PN771M. Achamos a caneta mais ergonômica do que a caneta Lenovo na Yoga C940 porque a Dell é mais grossa e mais fácil de agarrar
A garantia limitada padrão de um ano aplica-se com muitas opções de extensões se comprada da Dell.
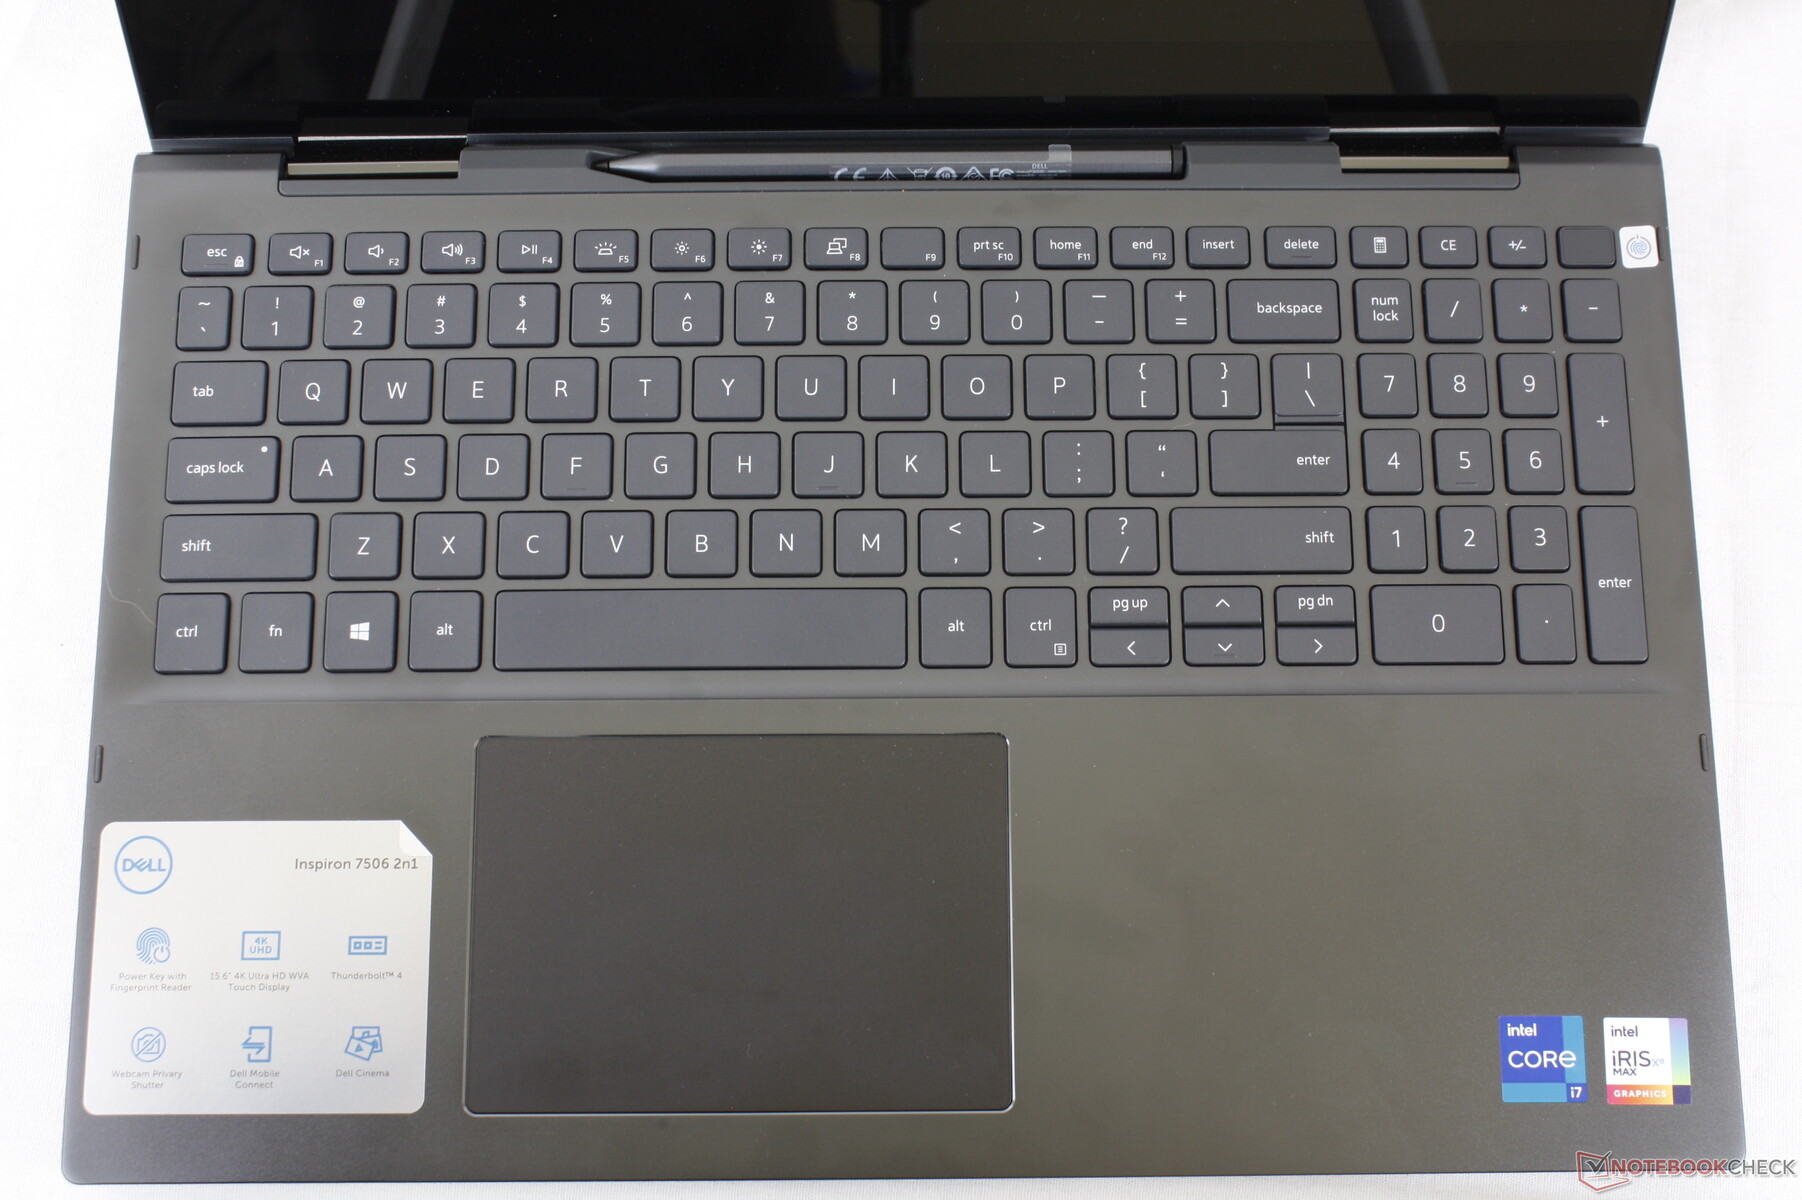
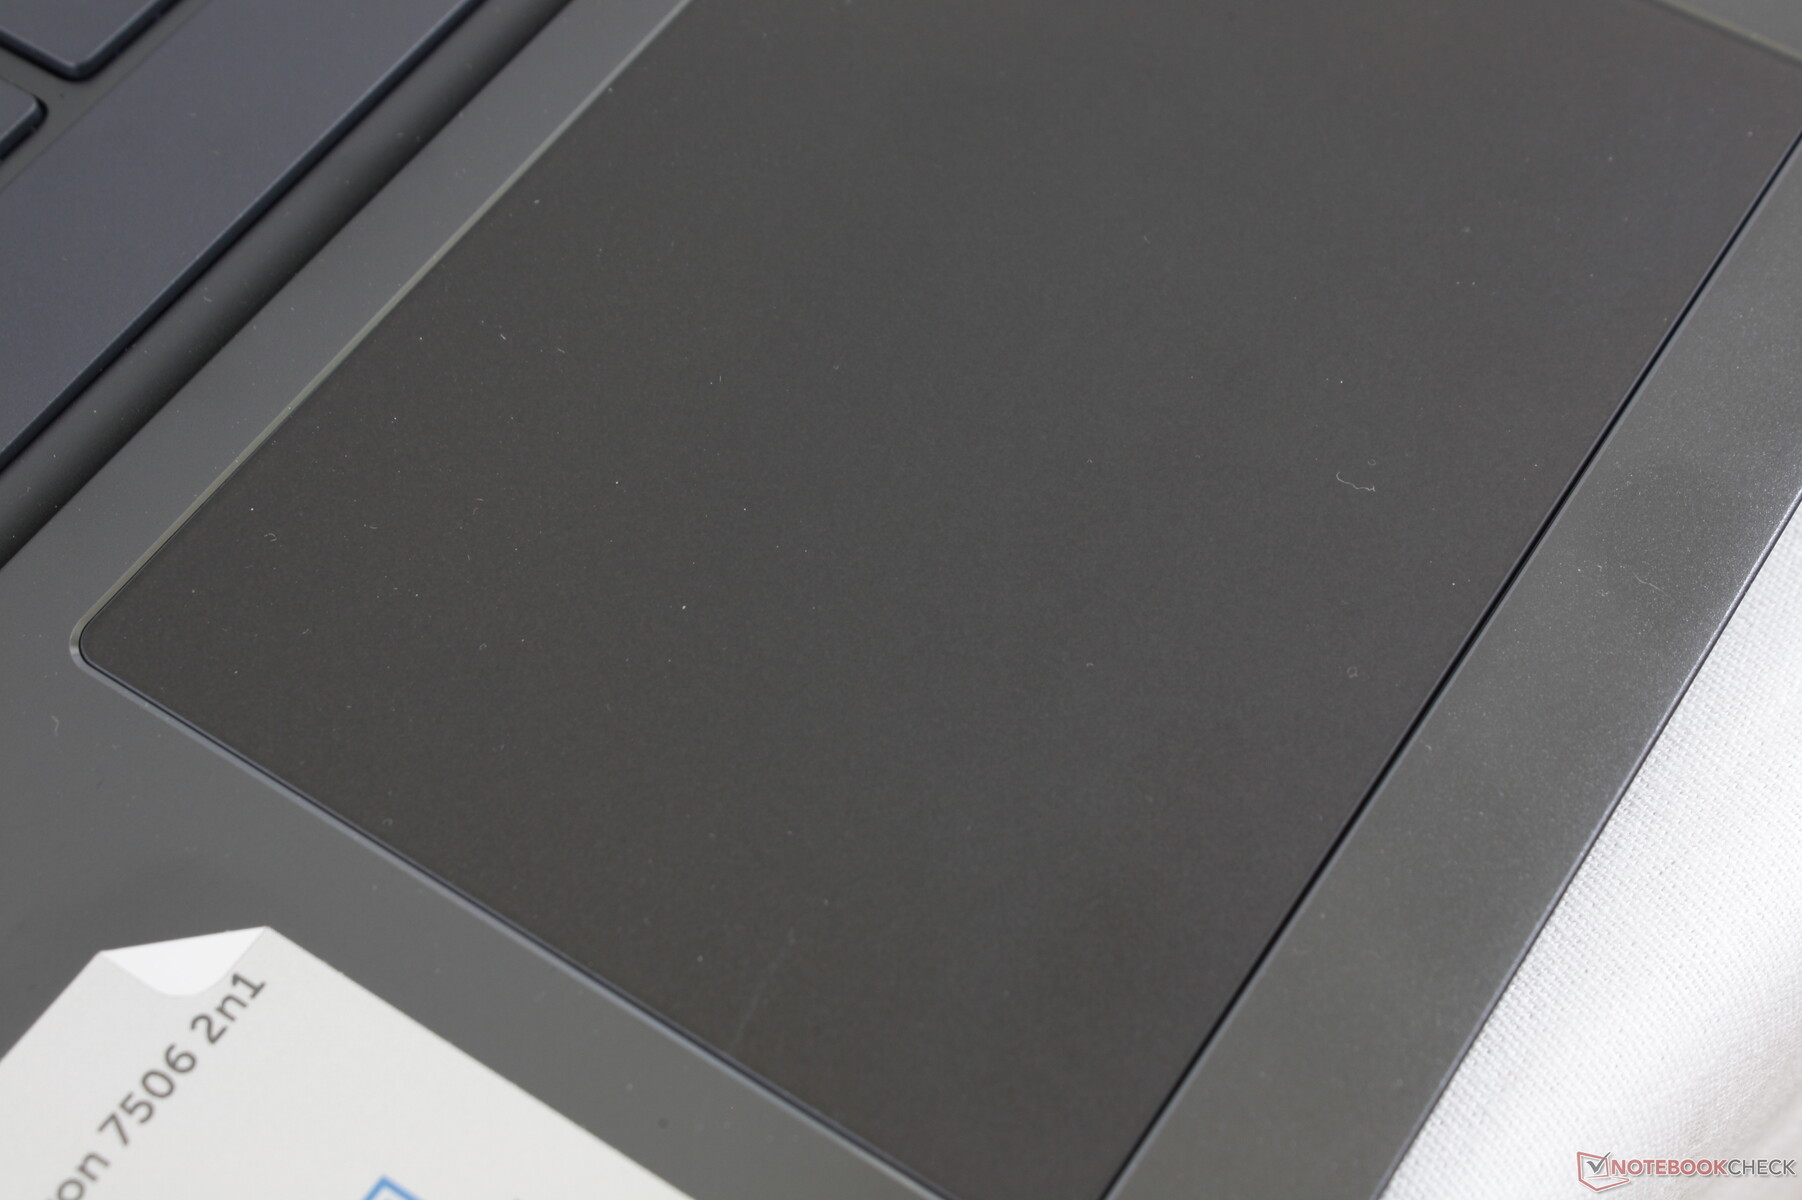
Dispositivos de entrada
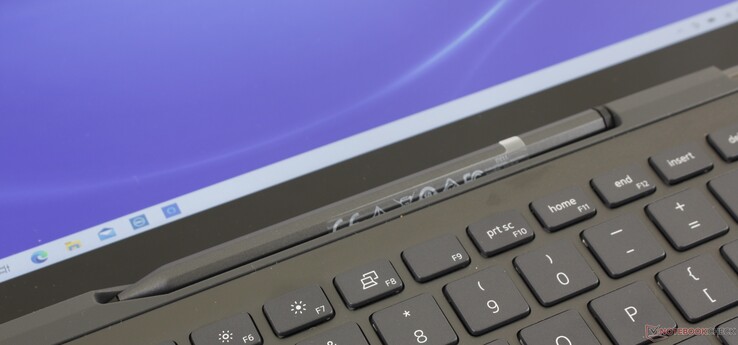
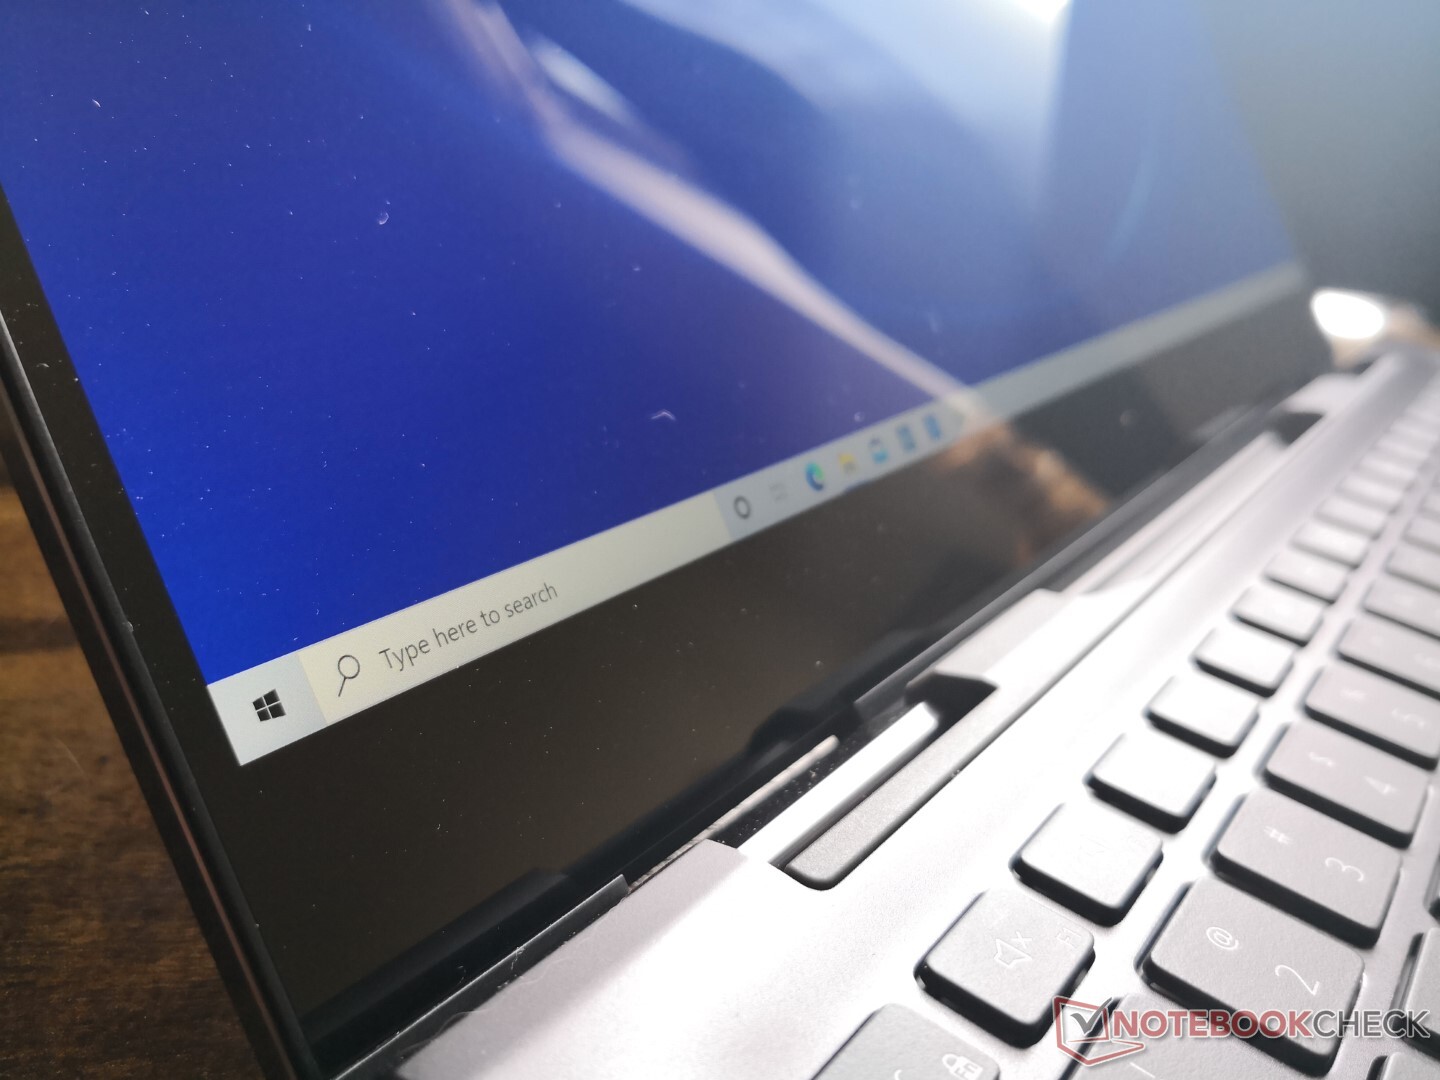
Embora a Black Edition compartilhe o mesmo teclado e clickpad que a Silver Edition, os símbolos em cada tecla são na verdade muito mais fáceis de ver, já que a fonte branca contrasta melhor com as teclas pretas quando comparada com a fonte cinza e as teclas prateadas da Silver Edition.
Mostrar
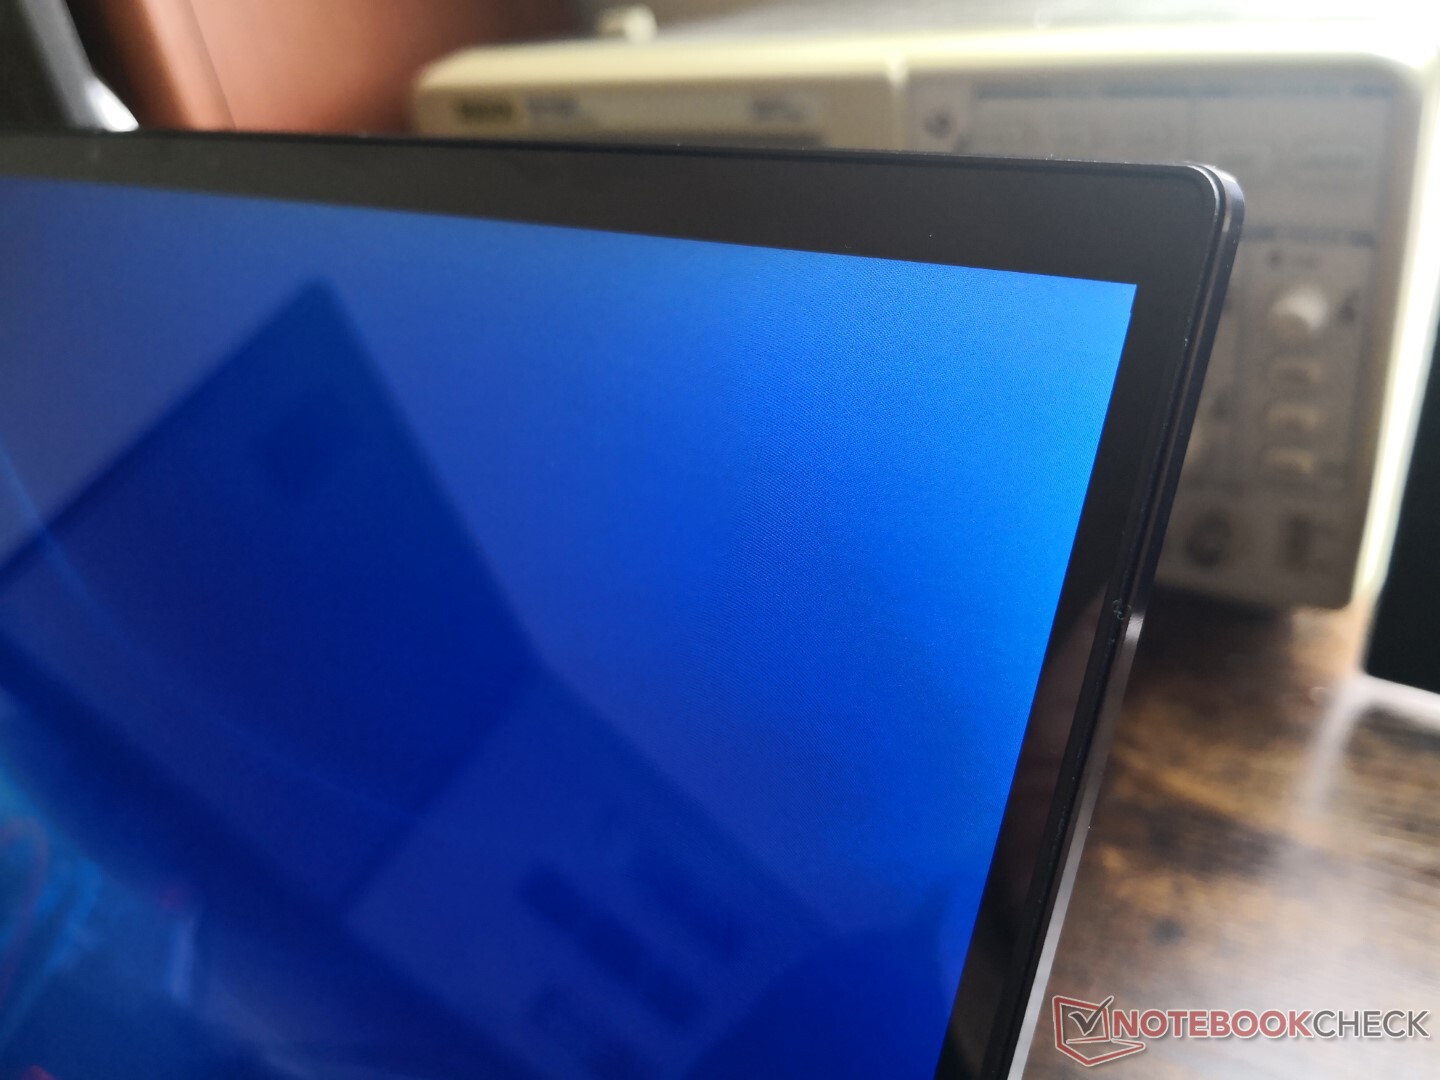
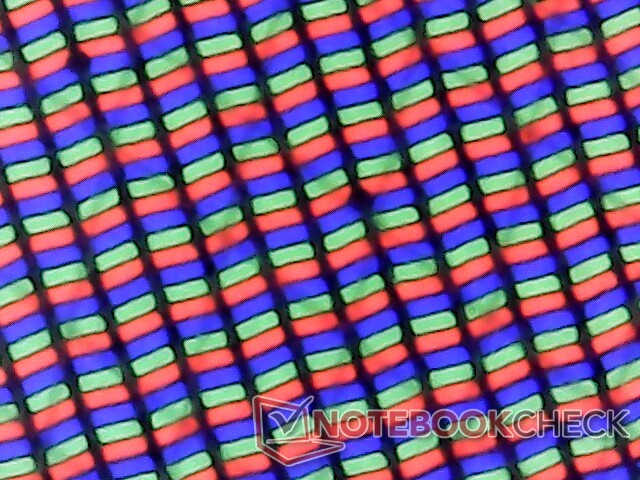
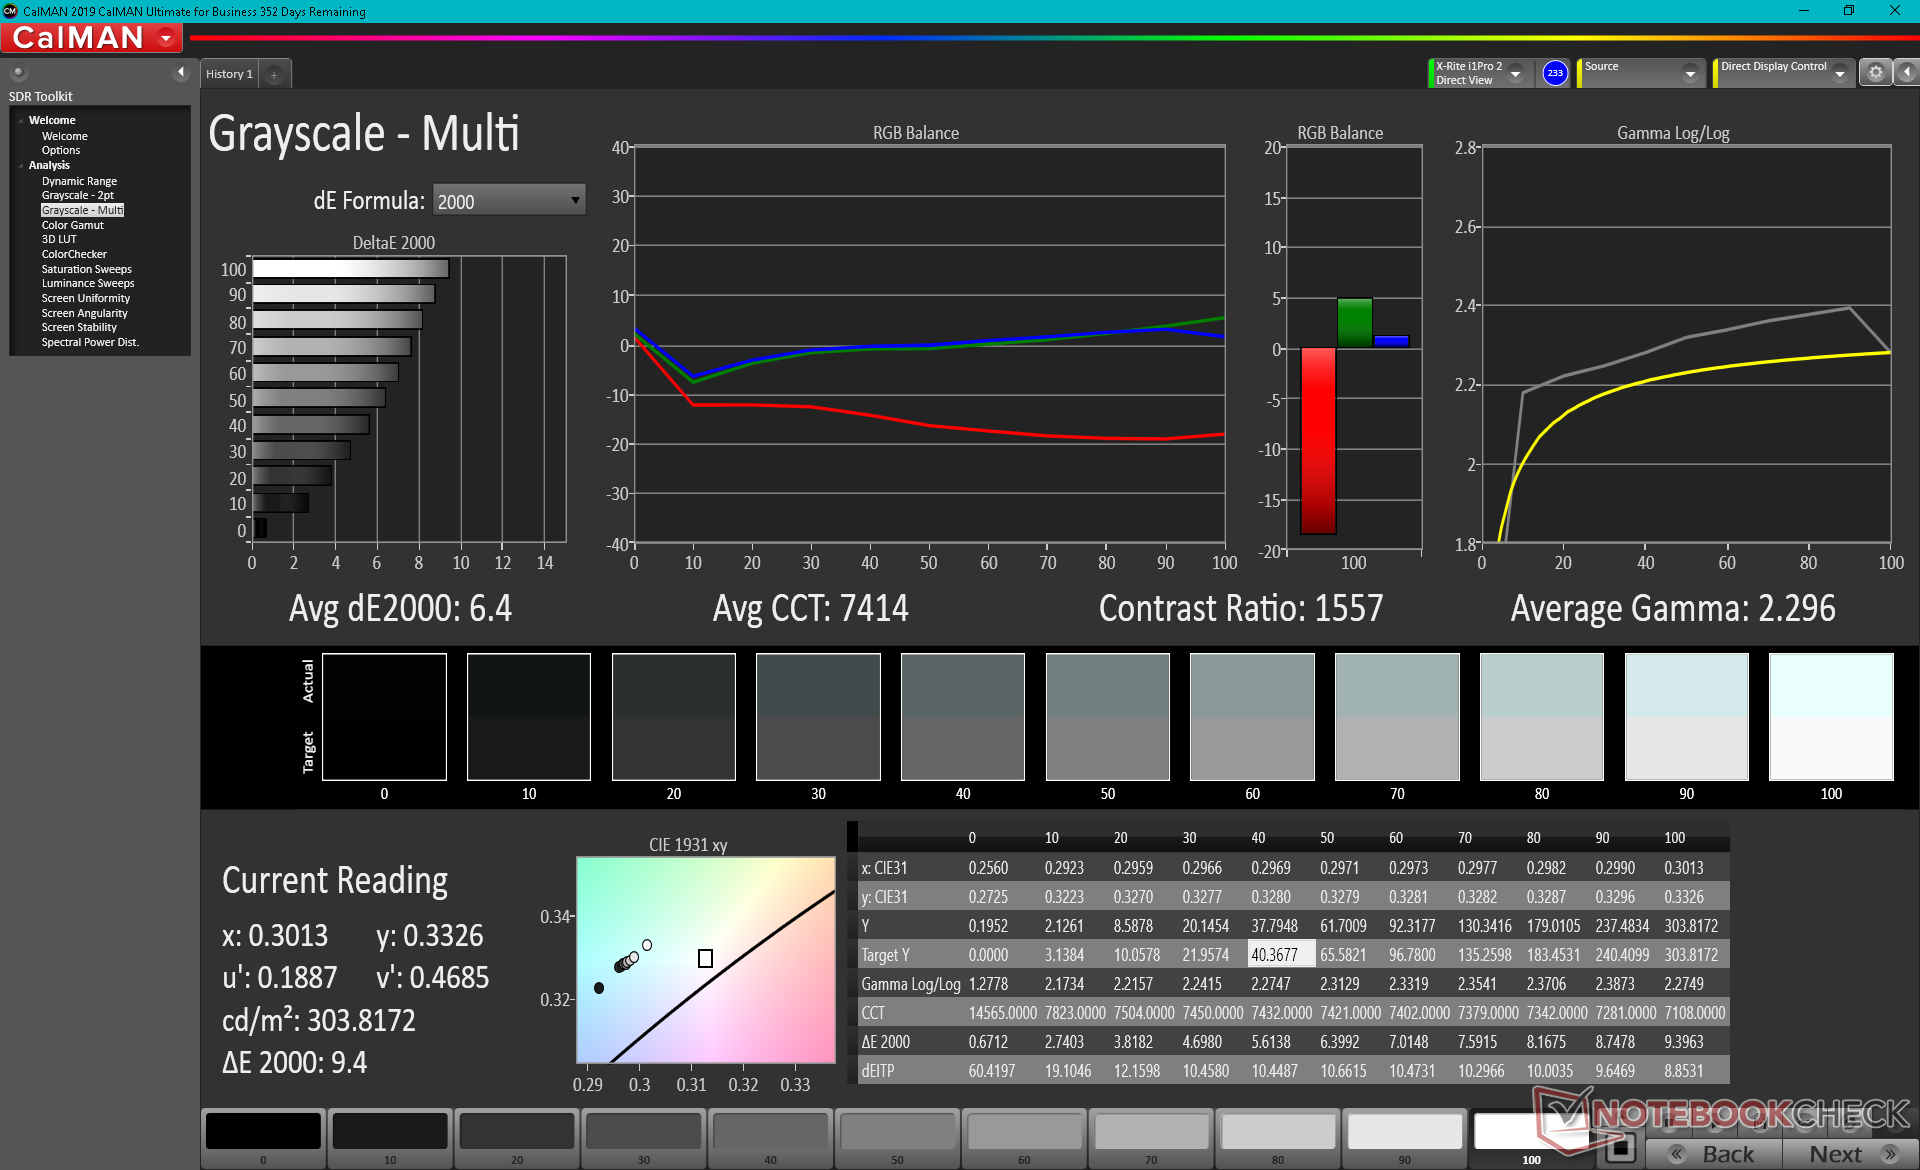
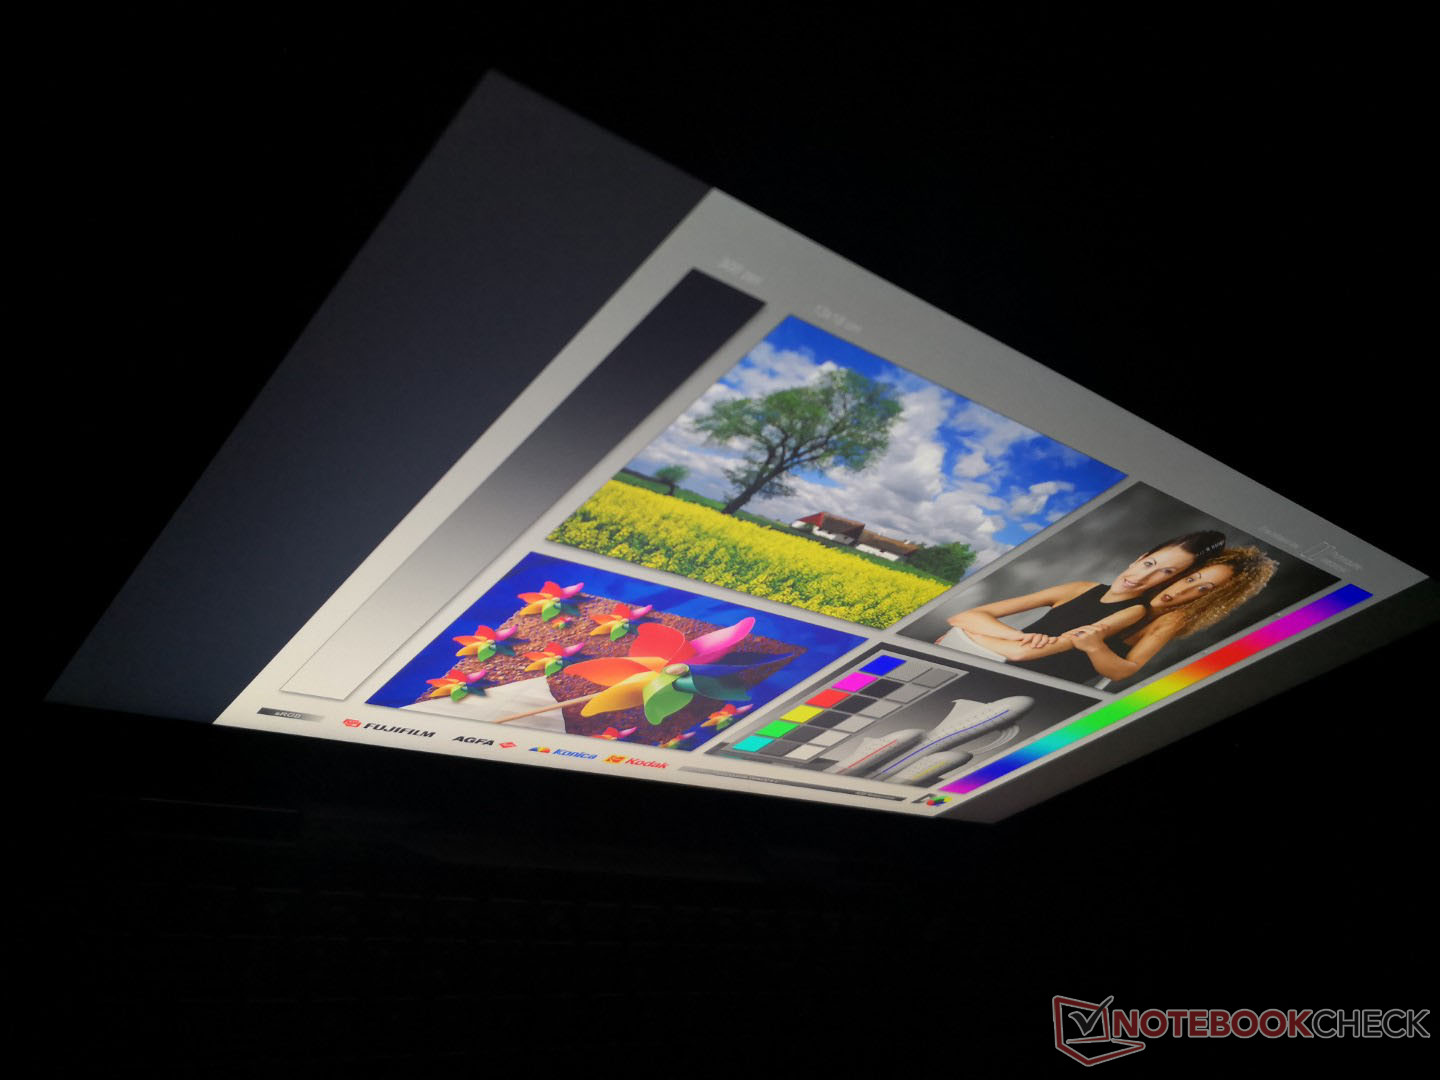
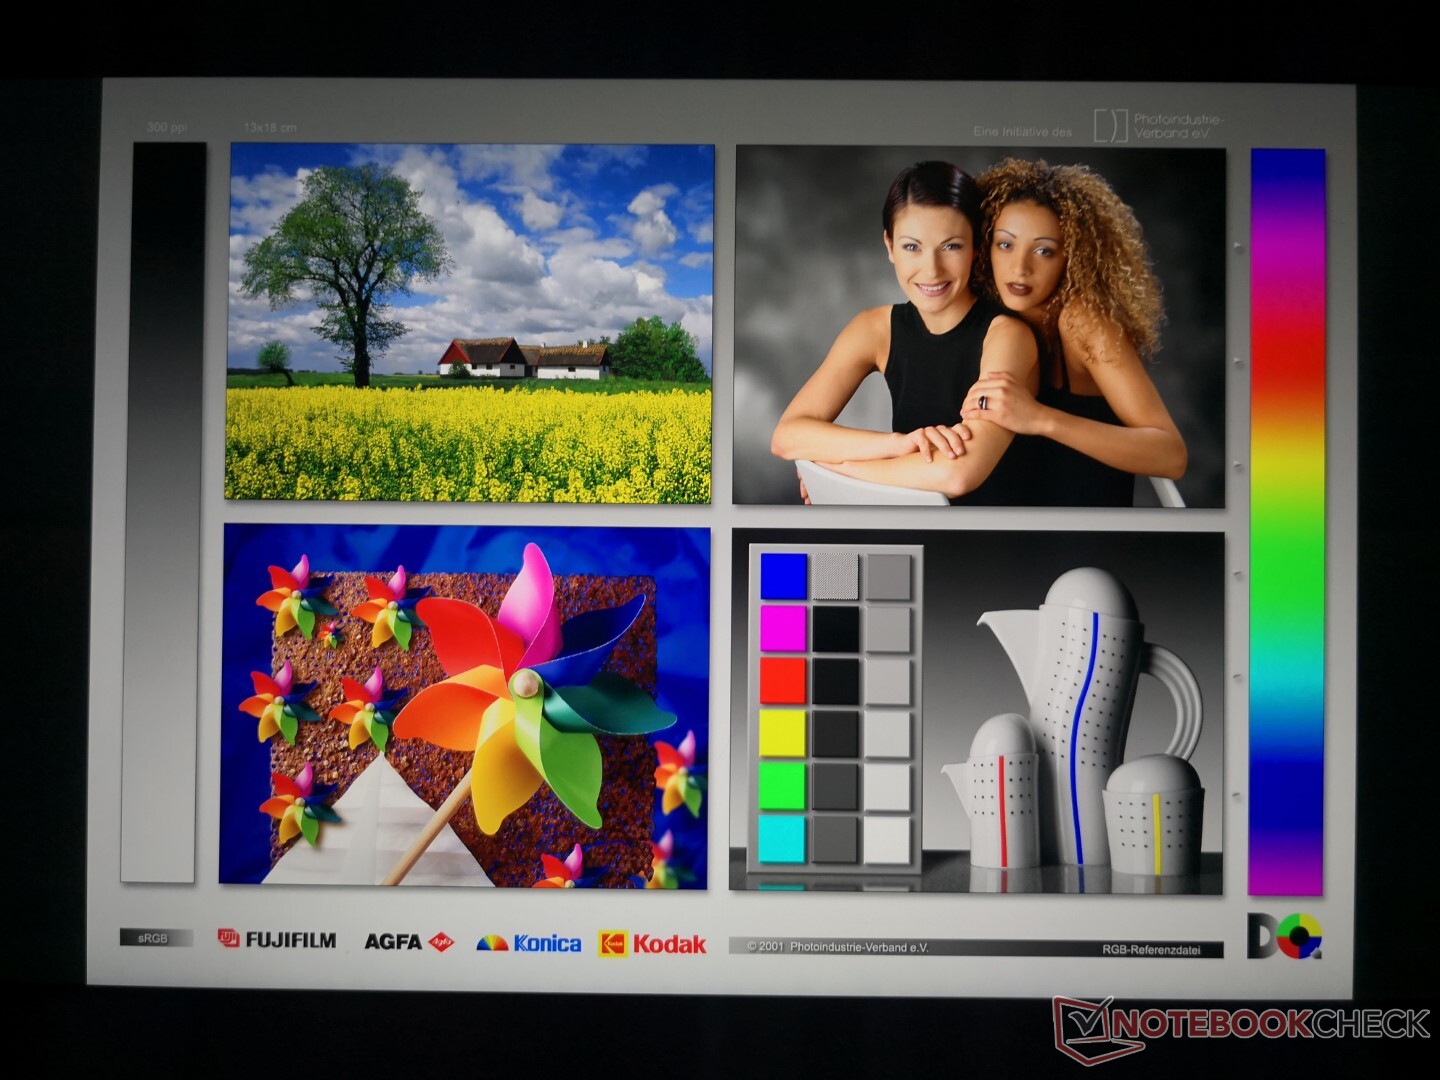
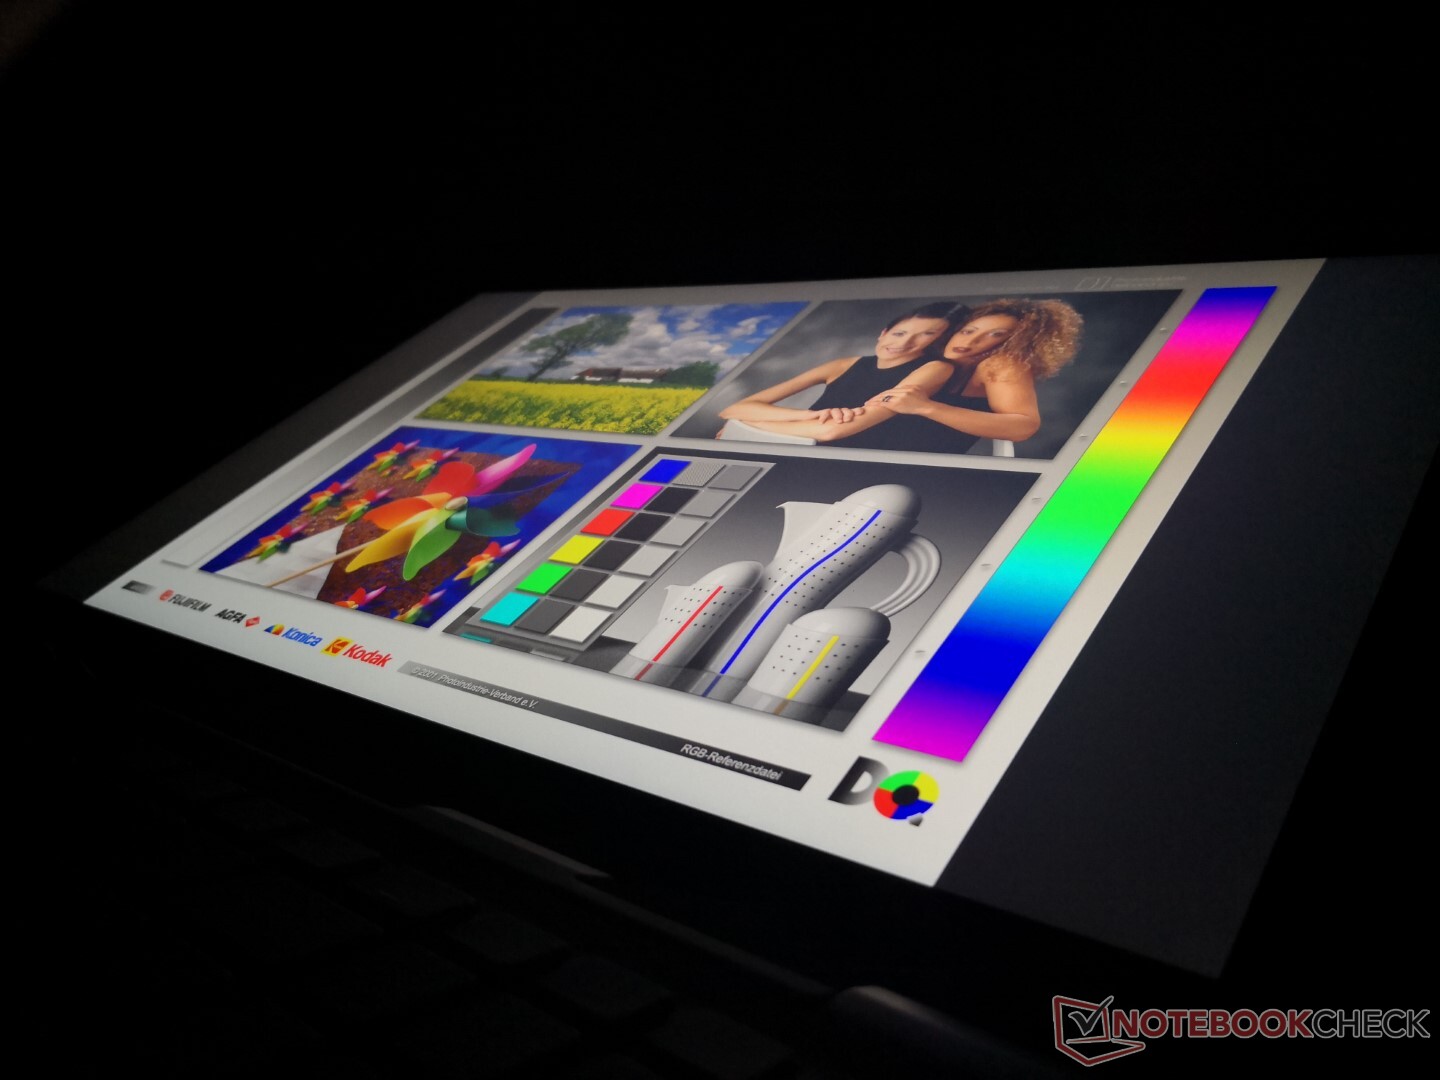
Versões do painel IPS AU Optronics B156ZAN em nosso Inspiron Black Edition também podem ser encontradas no Inspiron 15 7577 e 4K 4K Precision 7550. Curiosamente, no entanto, a cobertura colorida é mais parecida com o Inspiron 7577, sendo mais estreita do que no Precision 7550. A relação de contraste é alta a mais de 1000:1, mas os tempos lentos de resposta preto-branco e cinza-cinza levam a fantasmas perceptíveis. Ao considerar estes atributos como um todo, o painel 4K aqui é uma oferta de gama média que não alcança as mesmas cores ou níveis de brilho de um XPS 15, mas ainda é melhor do que as opções de base 1080p na maioria dos outros laptops.
| |||||||||||||||||||||||||
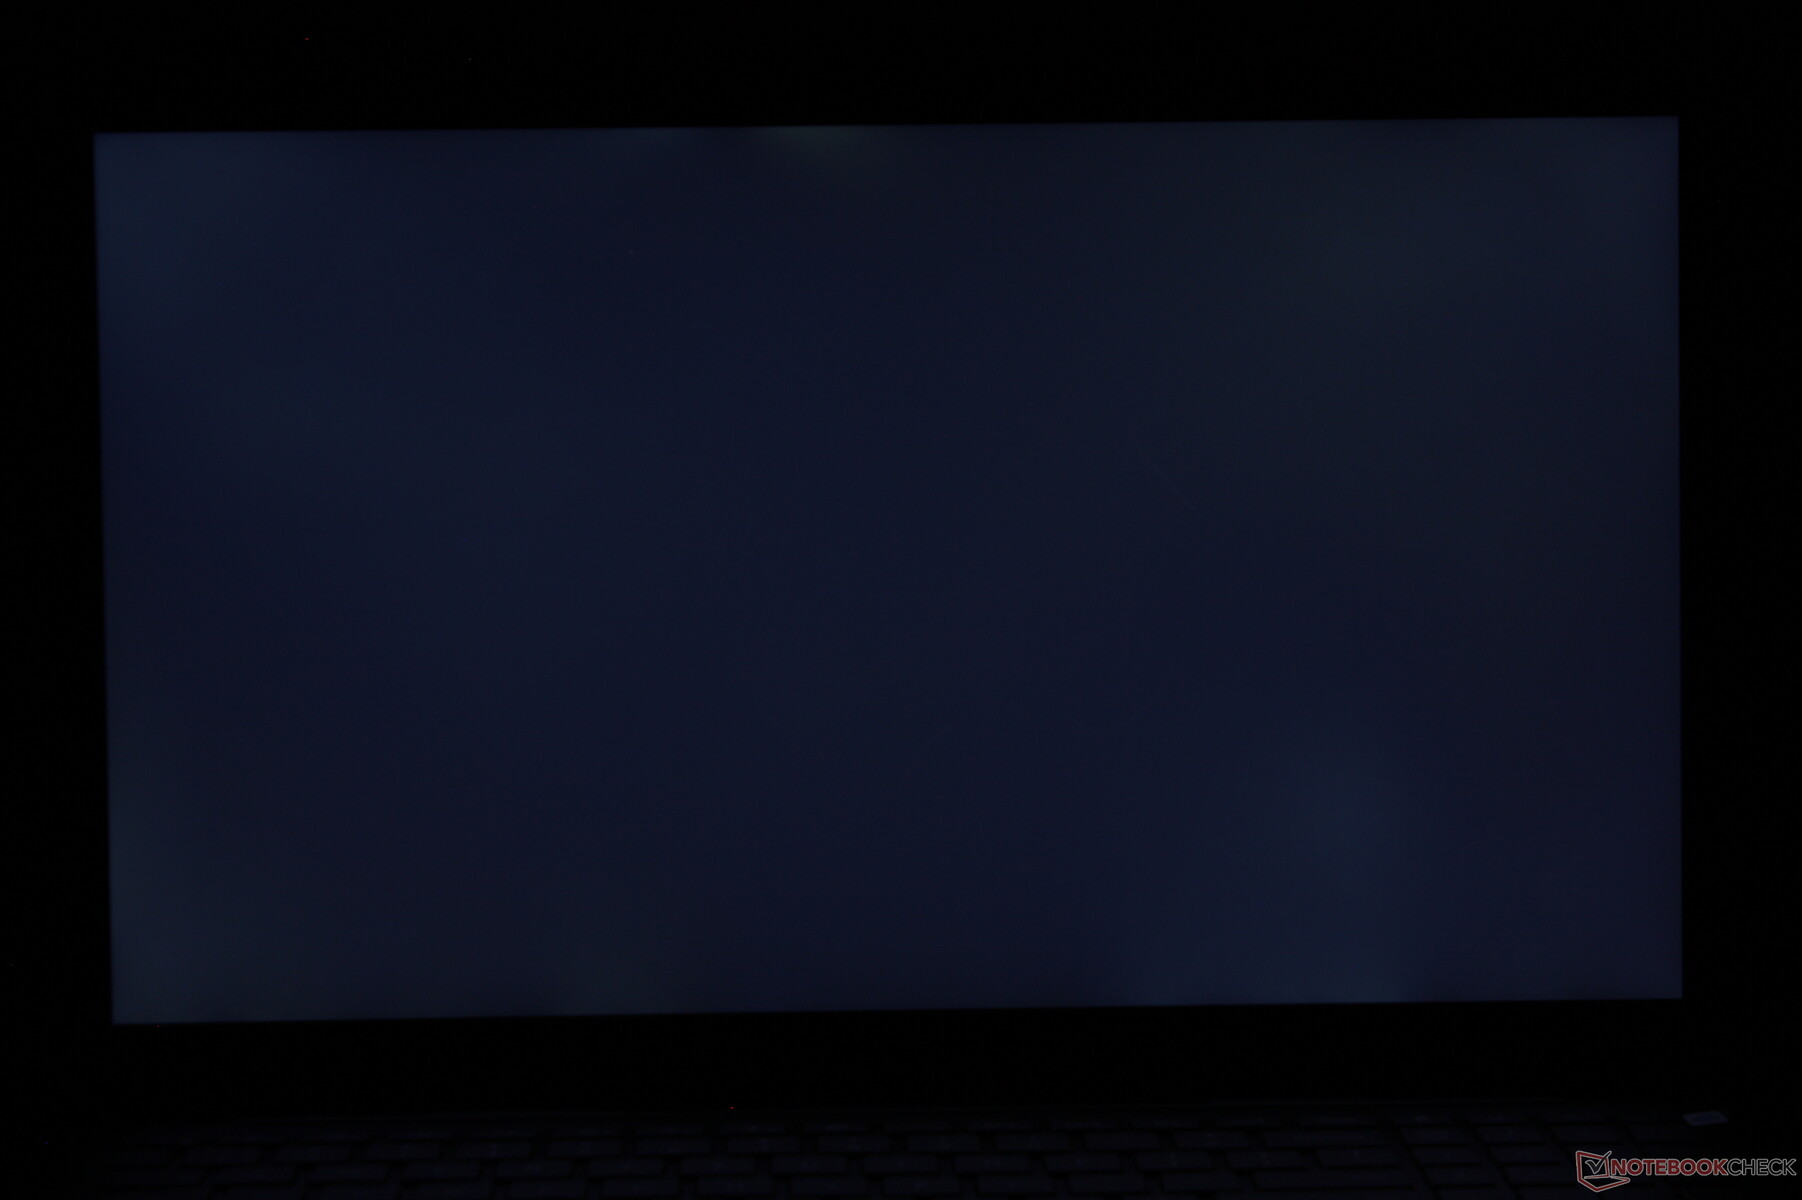
iluminação: 93 %
iluminação com acumulador: 303.8 cd/m²
Contraste: 1266:1 (Preto: 0.24 cd/m²)
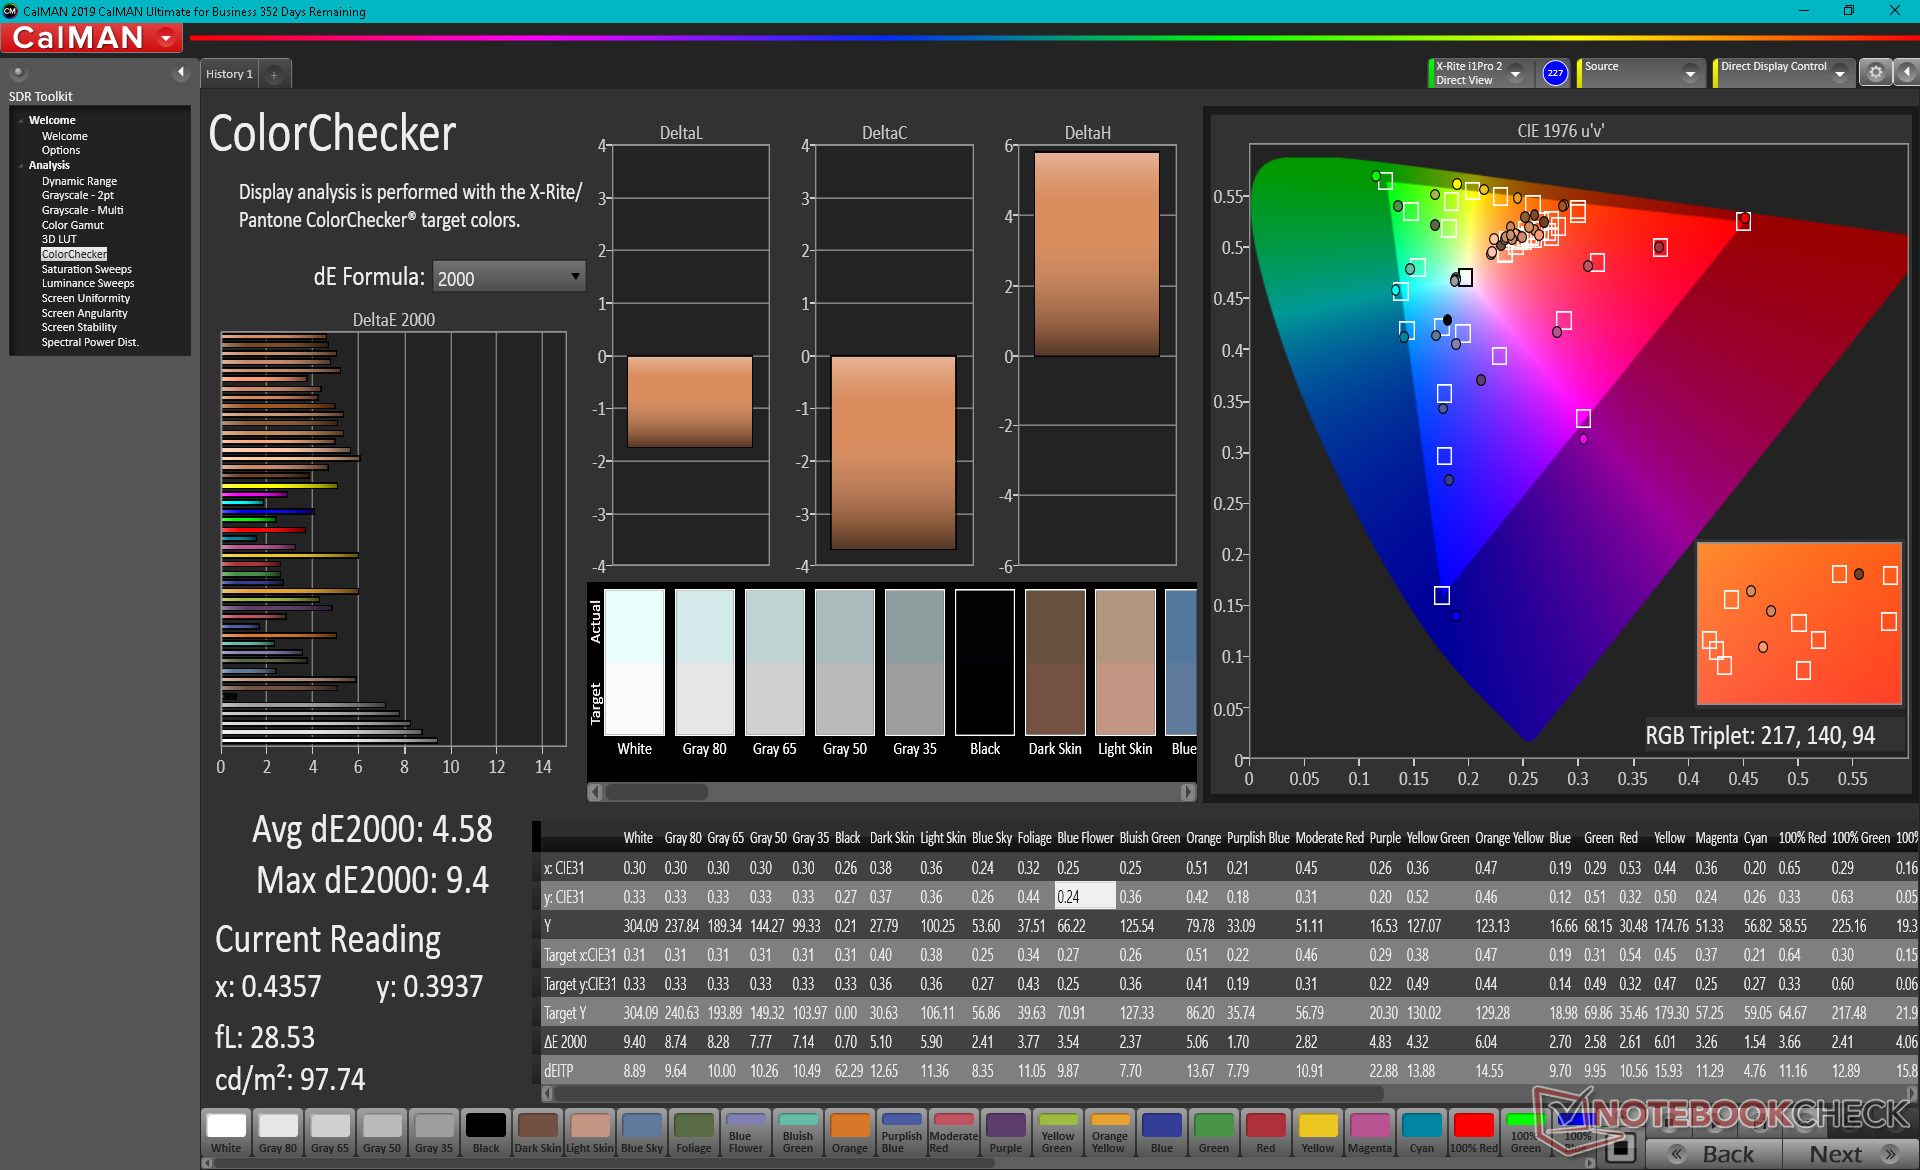
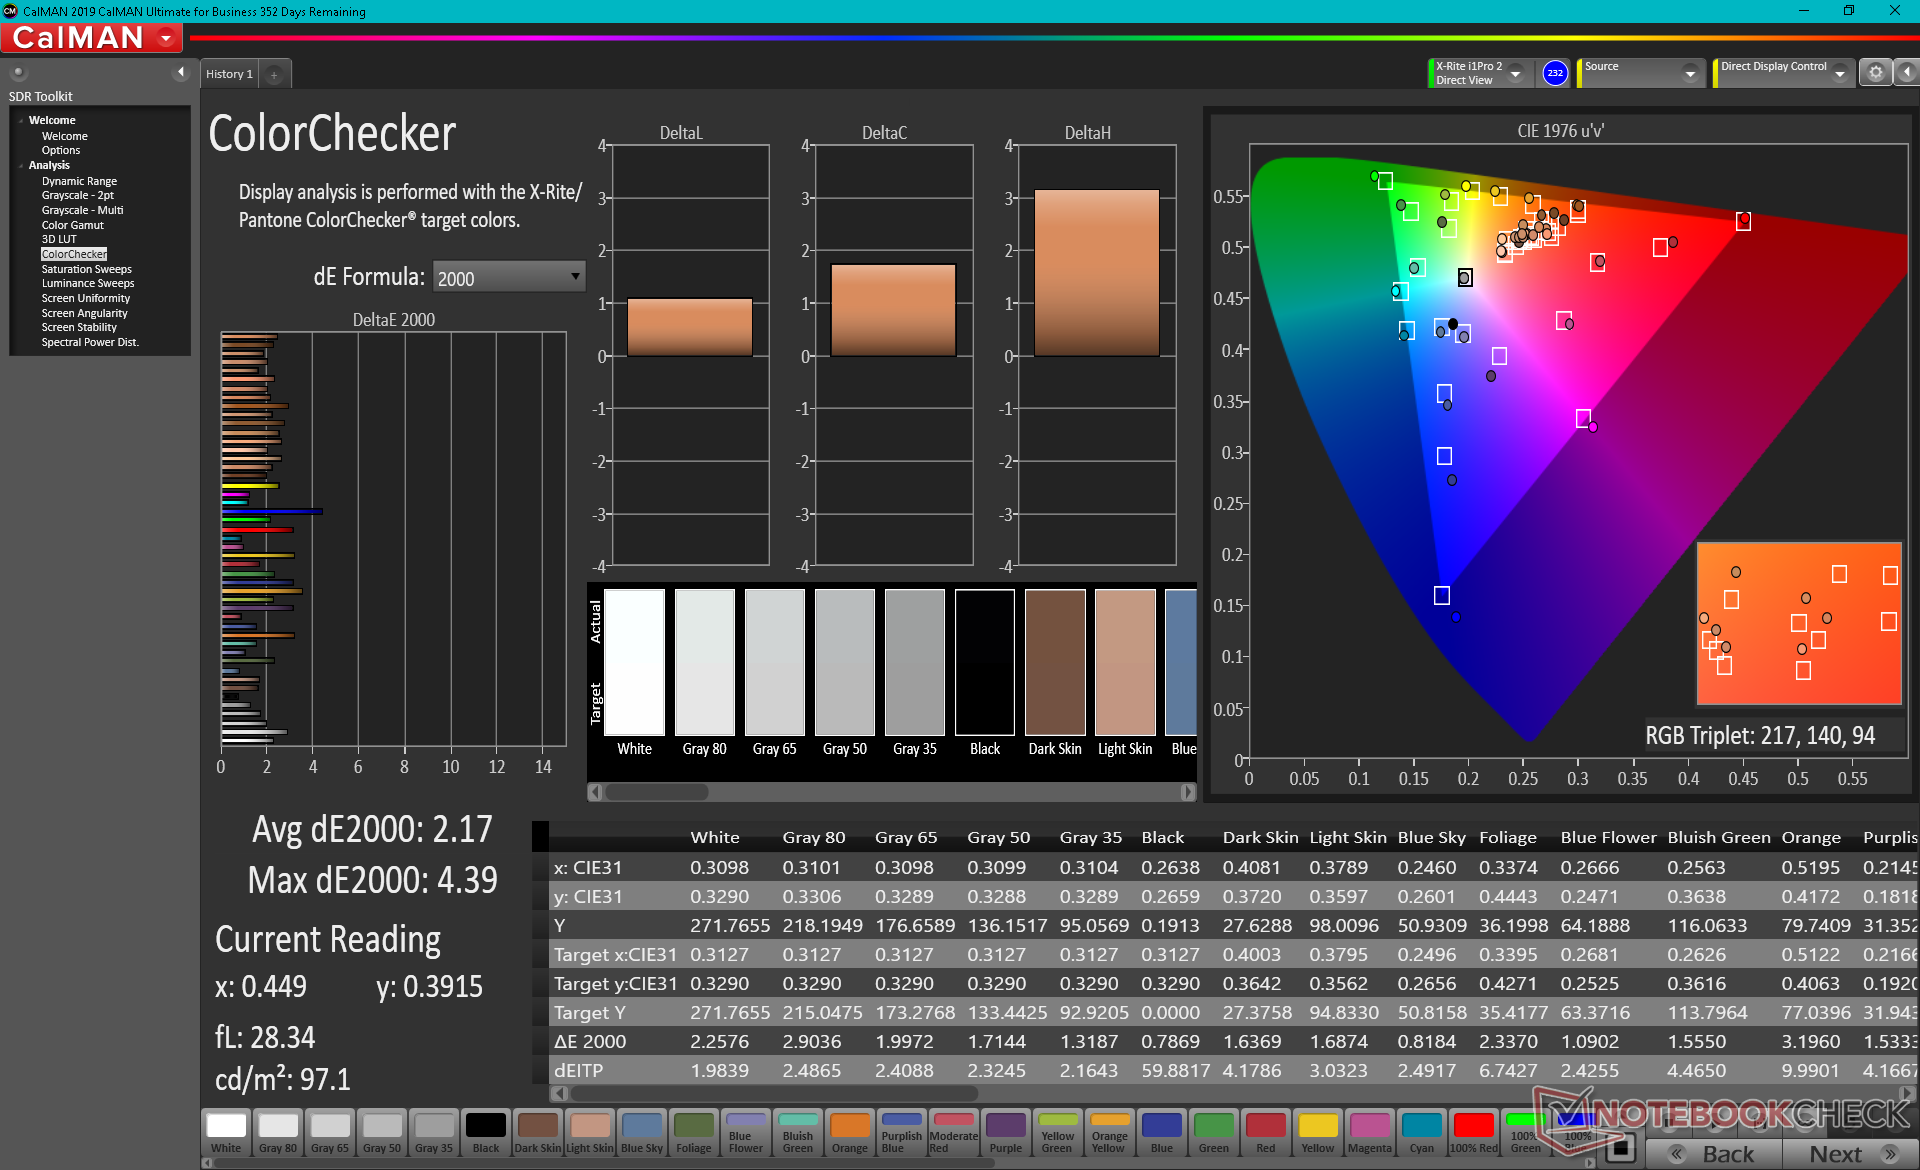
ΔE ColorChecker Calman: 4.58 | ∀{0.5-29.43 Ø4.71}
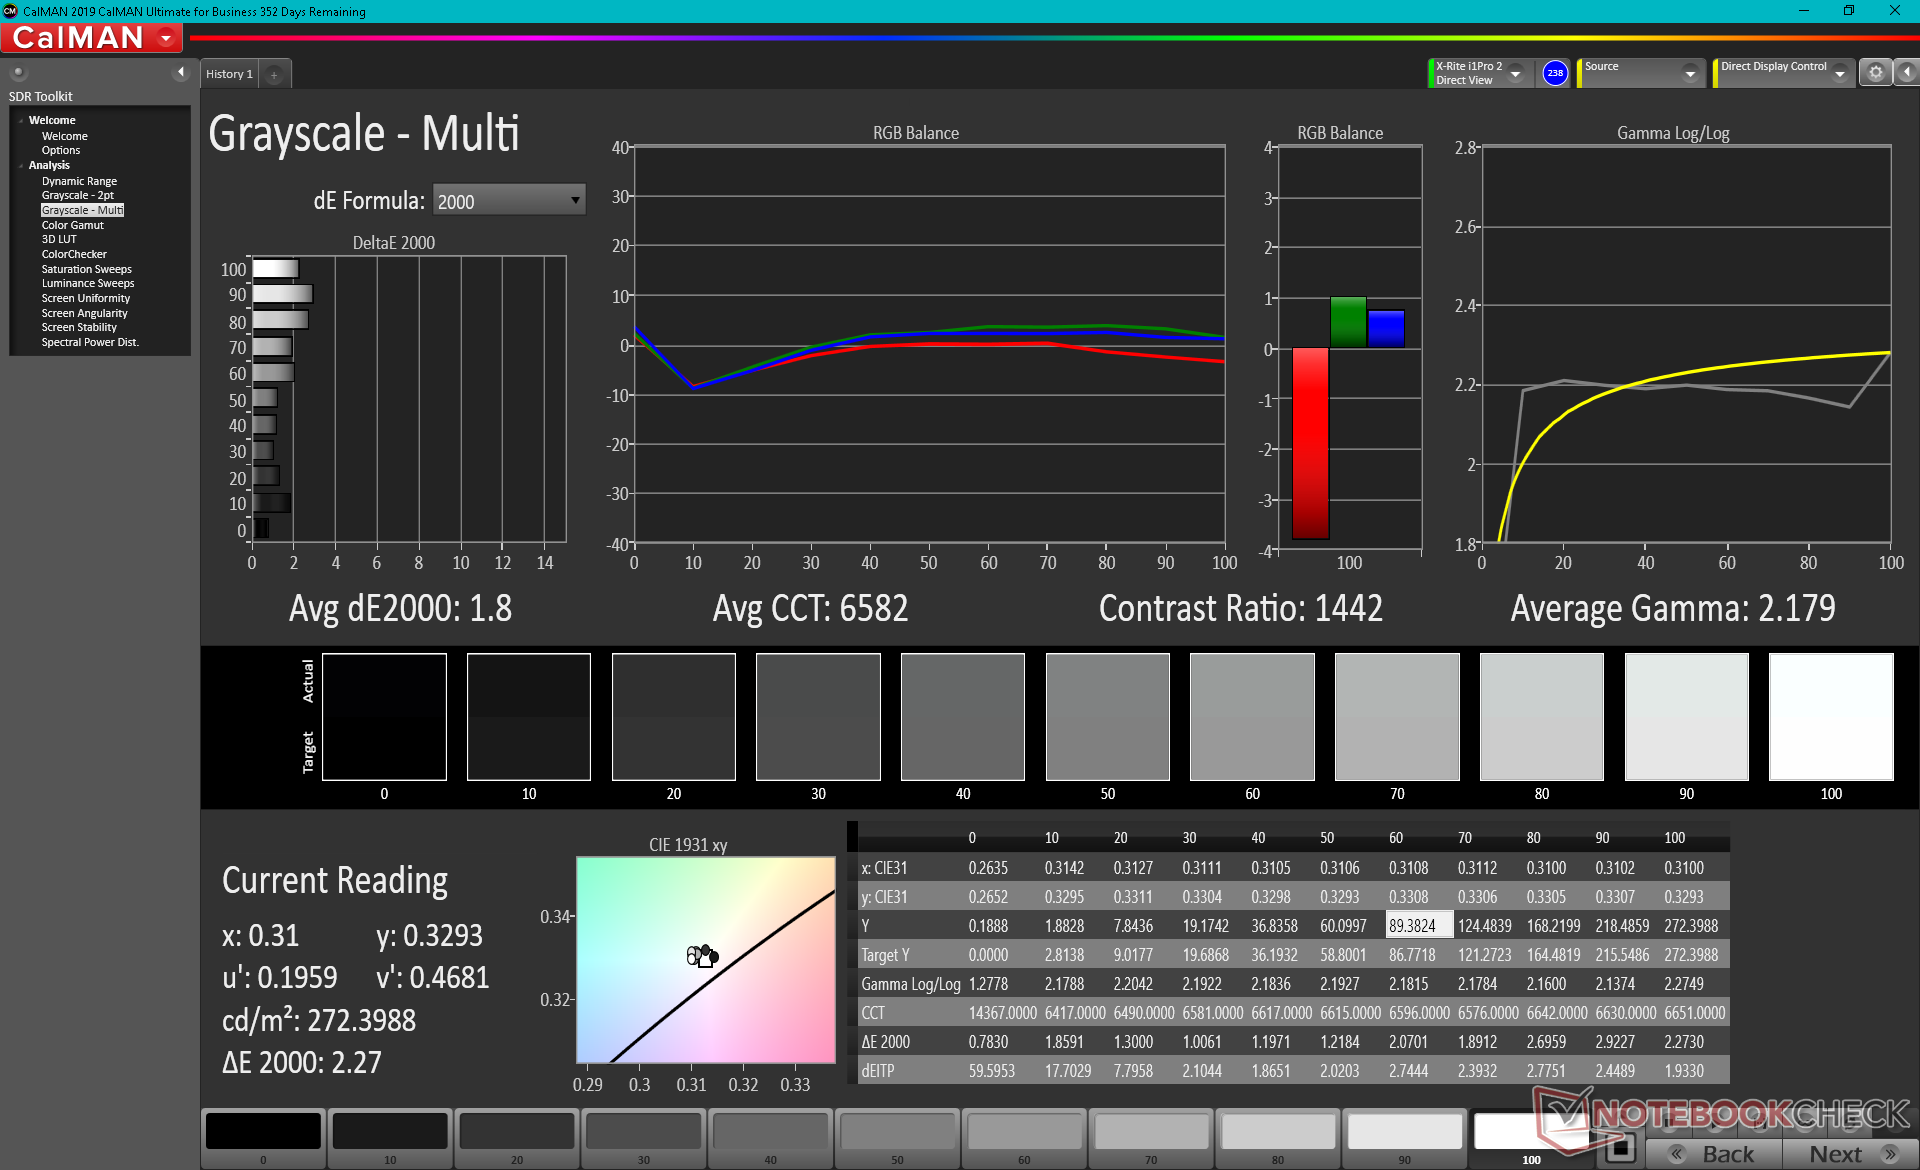
calibrated: 2.17
ΔE Greyscale Calman: 6.4 | ∀{0.09-98 Ø4.96}
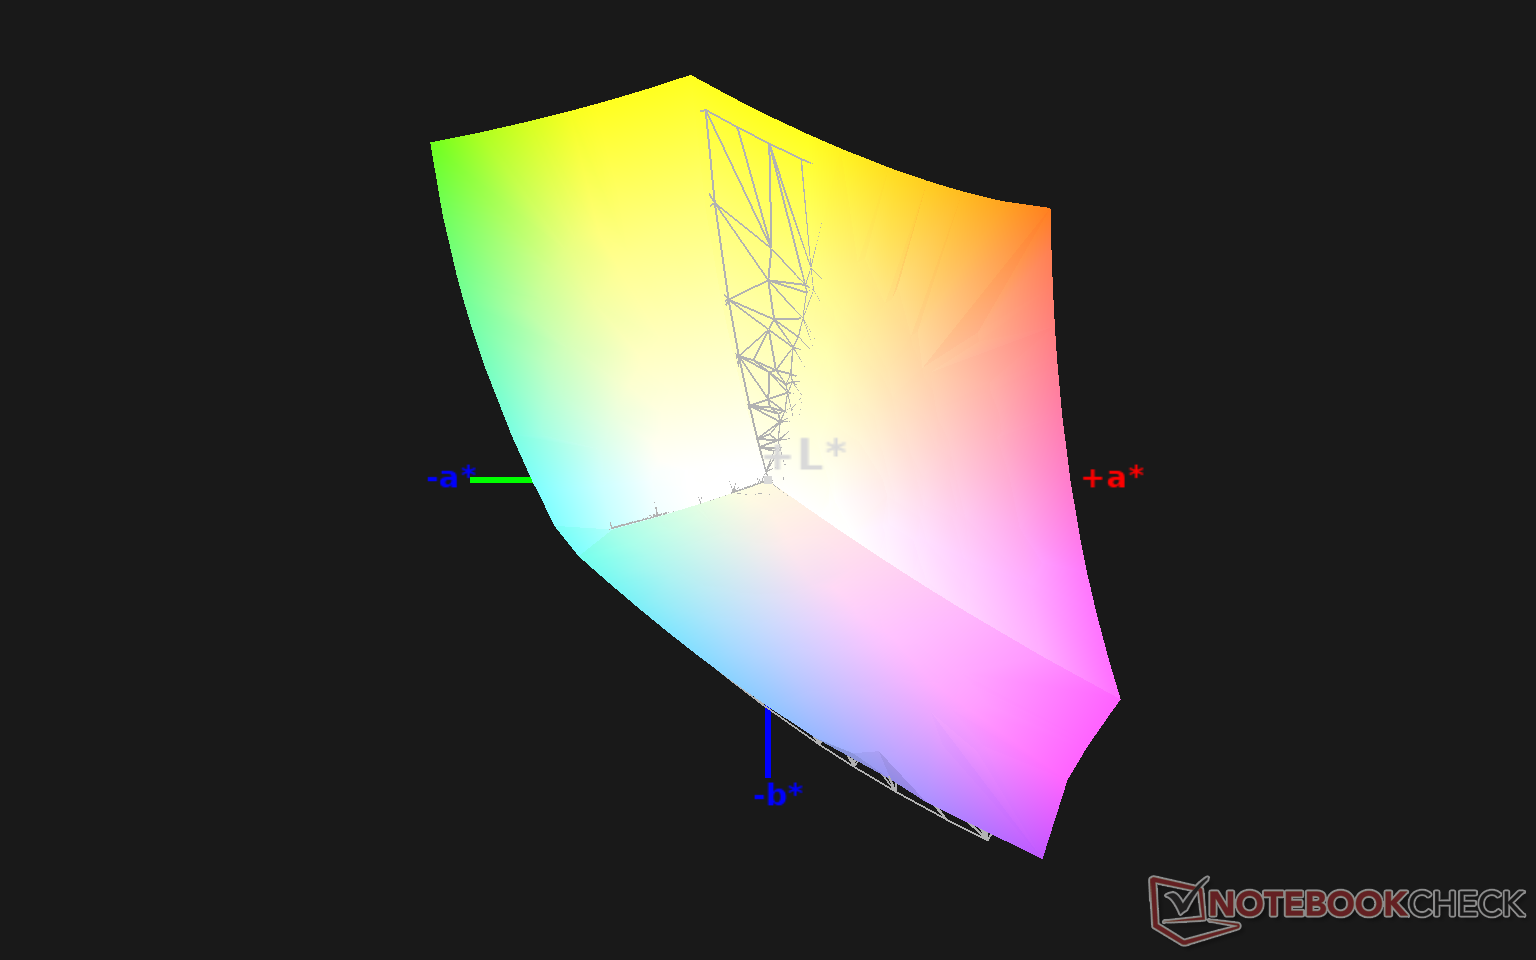
99% sRGB (Argyll 1.6.3 3D)
66.7% AdobeRGB 1998 (Argyll 1.6.3 3D)
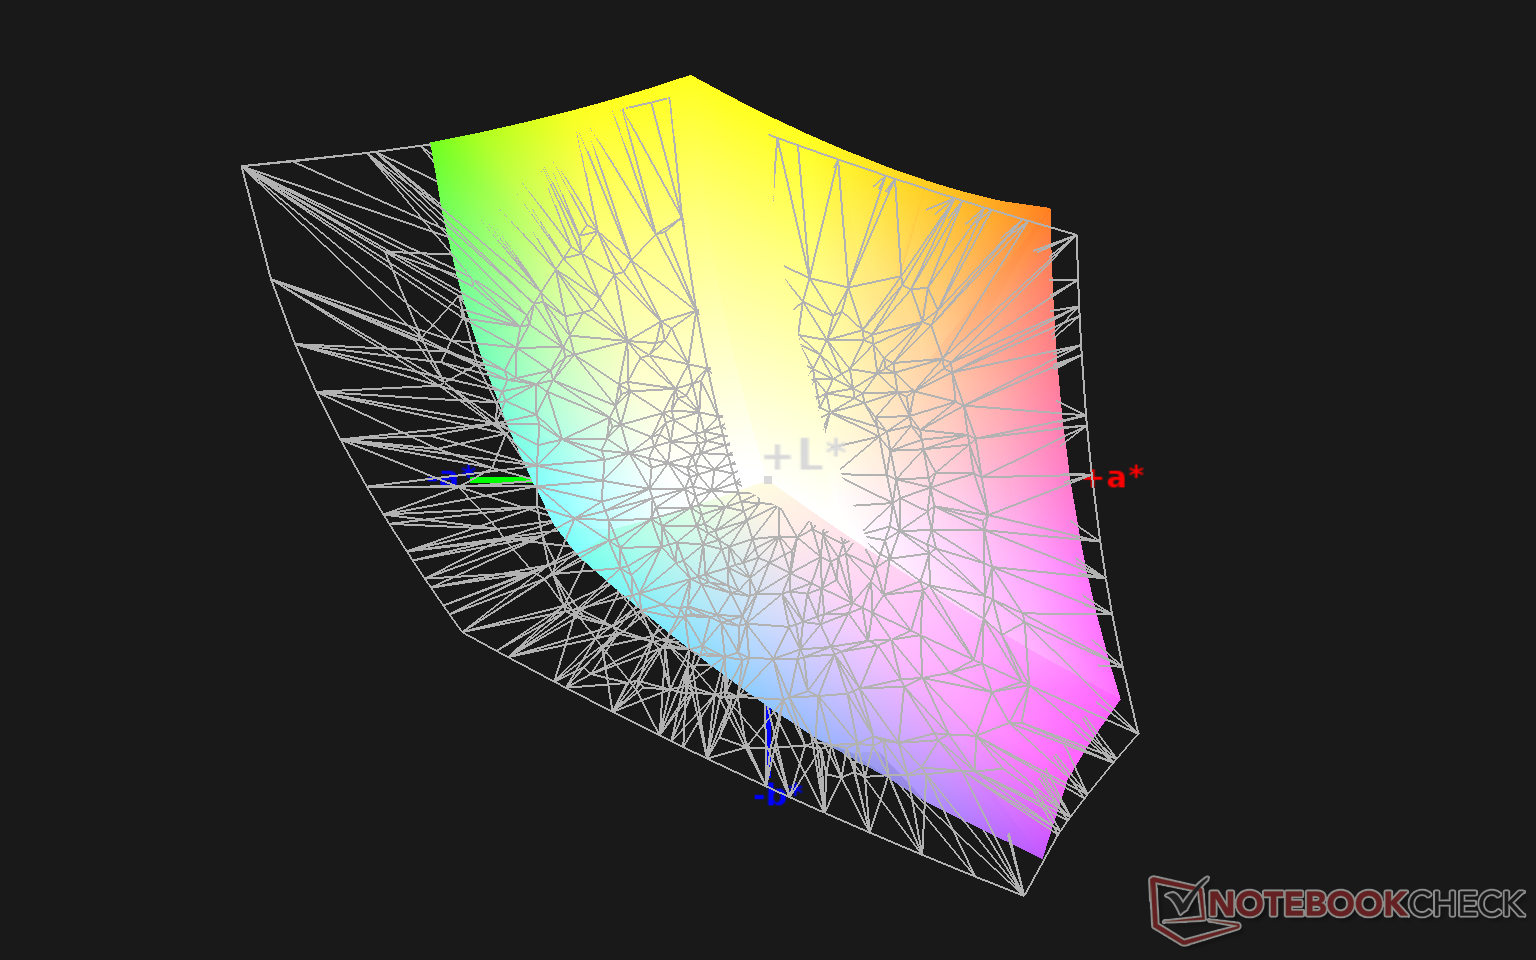
74.6% AdobeRGB 1998 (Argyll 3D)
99% sRGB (Argyll 3D)
74.3% Display P3 (Argyll 3D)
Gamma: 2.3
CCT: 7414 K
| Dell Inspiron 15 7000 7506 2-in-1 Black Edition AU Optronics B156ZAN, IPS, 15.6", 3840x2160 | HP Envy x360 15-ee0257ng BOE NV156FHM-N4T, IPS, 15.6", 1920x1080 | Microsoft Surface Book 3 15 LG Philips LGD0554, IPS, 15", 3240x2160 | Asus ZenBook Flip 15 UX563FD-A1027T BOE HF NE156QUM-N64, IPS, 15.6", 3840x2160 | Lenovo Yoga C740-15IML B156HAN02.5, IPS LED, 15.6", 1920x1080 | Dell Inspiron 15 7000 7577 4K Name: AU Optronics B156ZAN, IPS, 15.6", 3840x2160 | |
|---|---|---|---|---|---|---|
| Display | -43% | -13% | -7% | -45% | -6% | |
| Display P3 Coverage (%) | 74.3 | 40.43 -46% | 61.5 -17% | 66.2 -11% | 39.04 -47% | 68.4 -8% |
| sRGB Coverage (%) | 99 | 59.6 -40% | 92.7 -6% | 97.2 -2% | 57.9 -42% | 97.1 -2% |
| AdobeRGB 1998 Coverage (%) | 74.6 | 41.77 -44% | 63.6 -15% | 68.3 -8% | 40.33 -46% | 69.6 -7% |
| Response Times | 38% | 29% | -6% | 7% | 26% | |
| Response Time Grey 50% / Grey 80% * (ms) | 55.2 ? | 34 ? 38% | 38 ? 31% | 60 ? -9% | 50.8 ? 8% | 35.2 ? 36% |
| Response Time Black / White * (ms) | 34 ? | 21 ? 38% | 25 ? 26% | 35 ? -3% | 32.4 ? 5% | 28.4 ? 16% |
| PWM Frequency (Hz) | 250 ? | |||||
| Screen | -34% | 24% | 17% | -38% | -5% | |
| Brightness middle (cd/m²) | 303.8 | 314 3% | 428 41% | 351 16% | 286 -6% | 322.9 6% |
| Brightness (cd/m²) | 296 | 280 -5% | 413 40% | 335 13% | 268 -9% | 309 4% |
| Brightness Distribution (%) | 93 | 72 -23% | 89 -4% | 87 -6% | 83 -11% | 90 -3% |
| Black Level * (cd/m²) | 0.24 | 0.275 -15% | 0.23 4% | 0.31 -29% | 0.2 17% | 0.36 -50% |
| Contrast (:1) | 1266 | 1142 -10% | 1861 47% | 1132 -11% | 1430 13% | 897 -29% |
| Colorchecker dE 2000 * | 4.58 | 5.94 -30% | 2.65 42% | 1.74 62% | 7.3 -59% | 3.99 13% |
| Colorchecker dE 2000 max. * | 9.4 | 21.71 -131% | 8.12 14% | 2.76 71% | 21.7 -131% | 8.97 5% |
| Colorchecker dE 2000 calibrated * | 2.17 | 5.15 -137% | 0.92 58% | 5.1 -135% | ||
| Greyscale dE 2000 * | 6.4 | 2.97 54% | 3.99 38% | 2.22 65% | 7 -9% | 5.3 17% |
| Gamma | 2.3 96% | 2.4 92% | 3.12 71% | 2.35 94% | 2.35 94% | 2.041 108% |
| CCT | 7414 88% | 6581 99% | 6309 103% | 6667 97% | 5847 111% | 6941 94% |
| Color Space (Percent of AdobeRGB 1998) (%) | 66.7 | 38.1 -43% | 58 -13% | 62 -7% | 36.9 -45% | 62.9 -6% |
| Color Space (Percent of sRGB) (%) | 99 | 59.1 -40% | 93 -6% | 97 -2% | 57.5 -42% | 96.8 -2% |
| Média Total (Programa/Configurações) | -13% /
-27% | 13% /
18% | 1% /
9% | -25% /
-34% | 5% /
-1% |
* ... menor é melhor
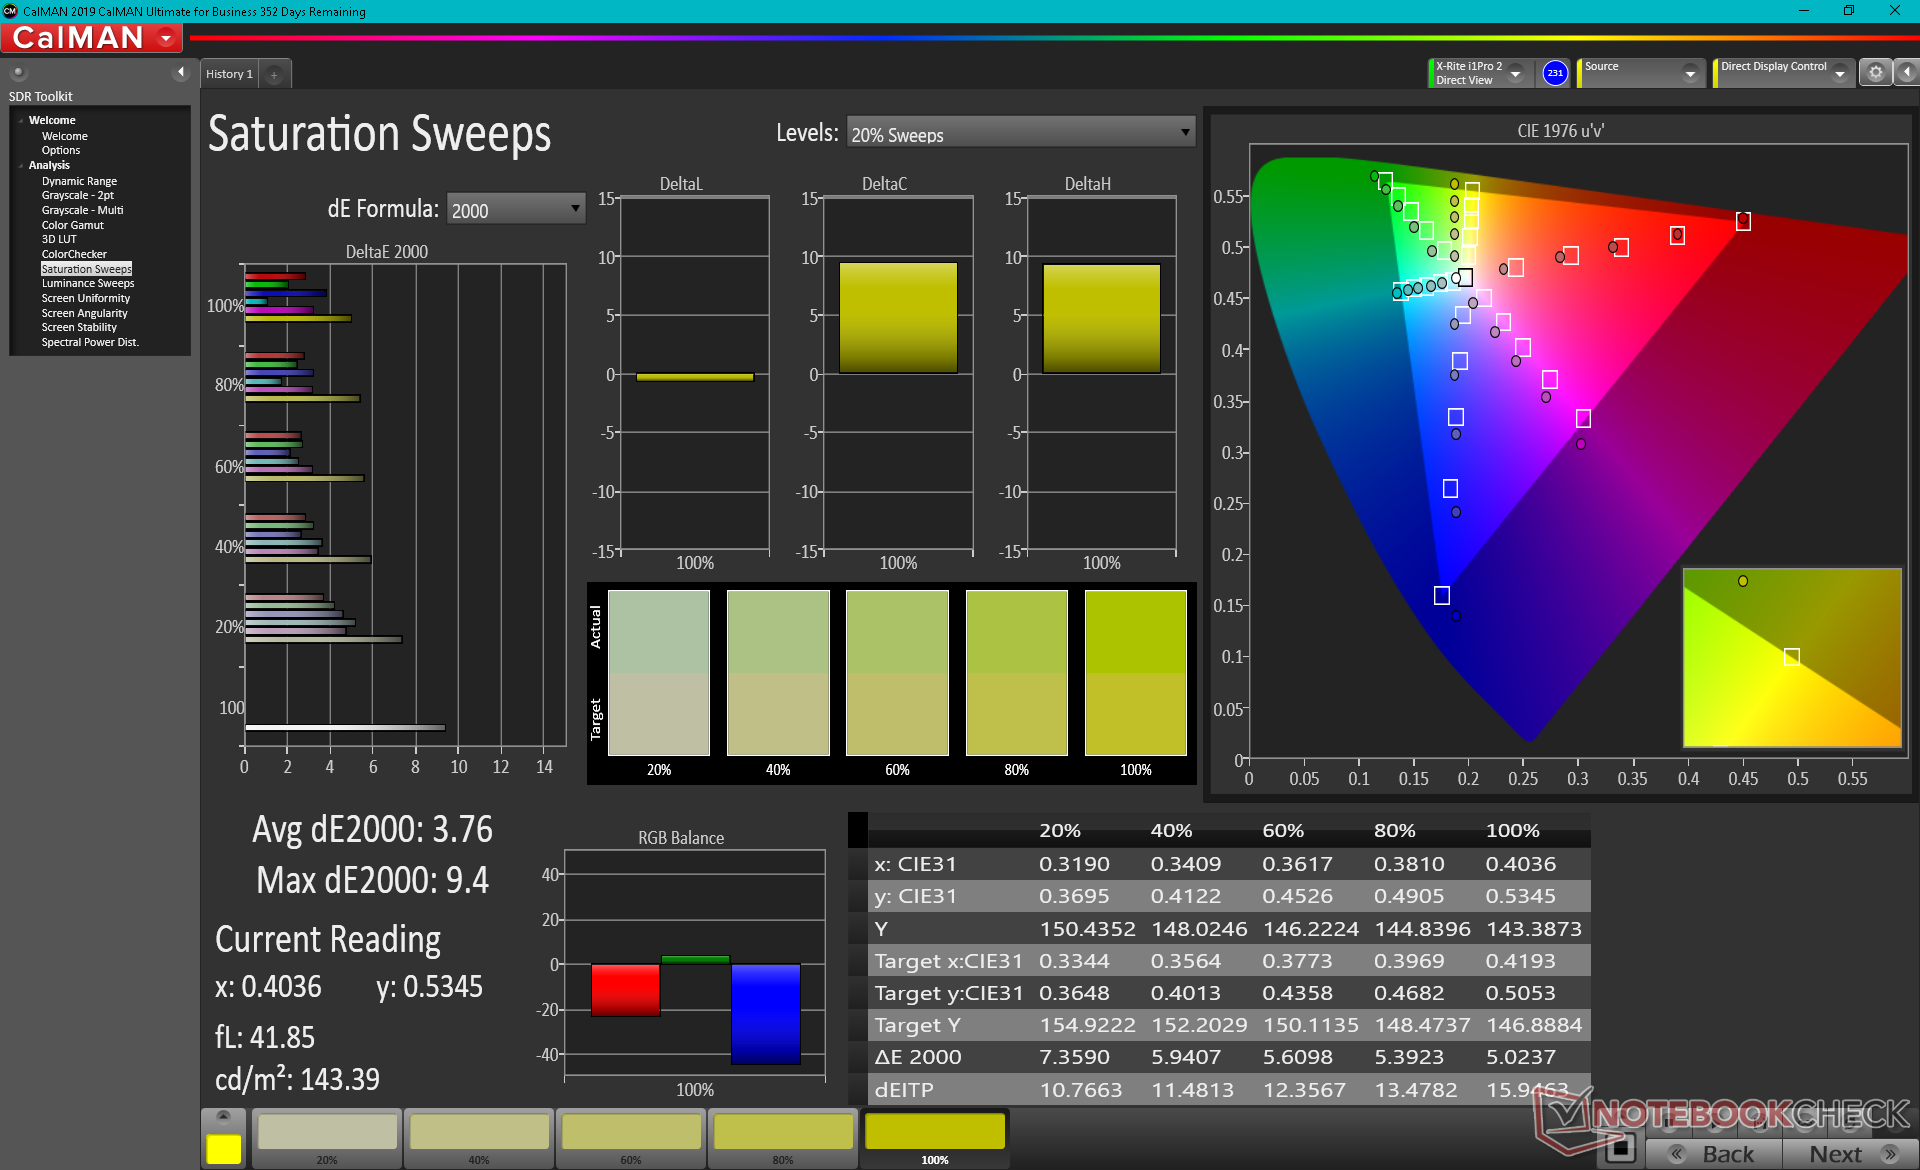
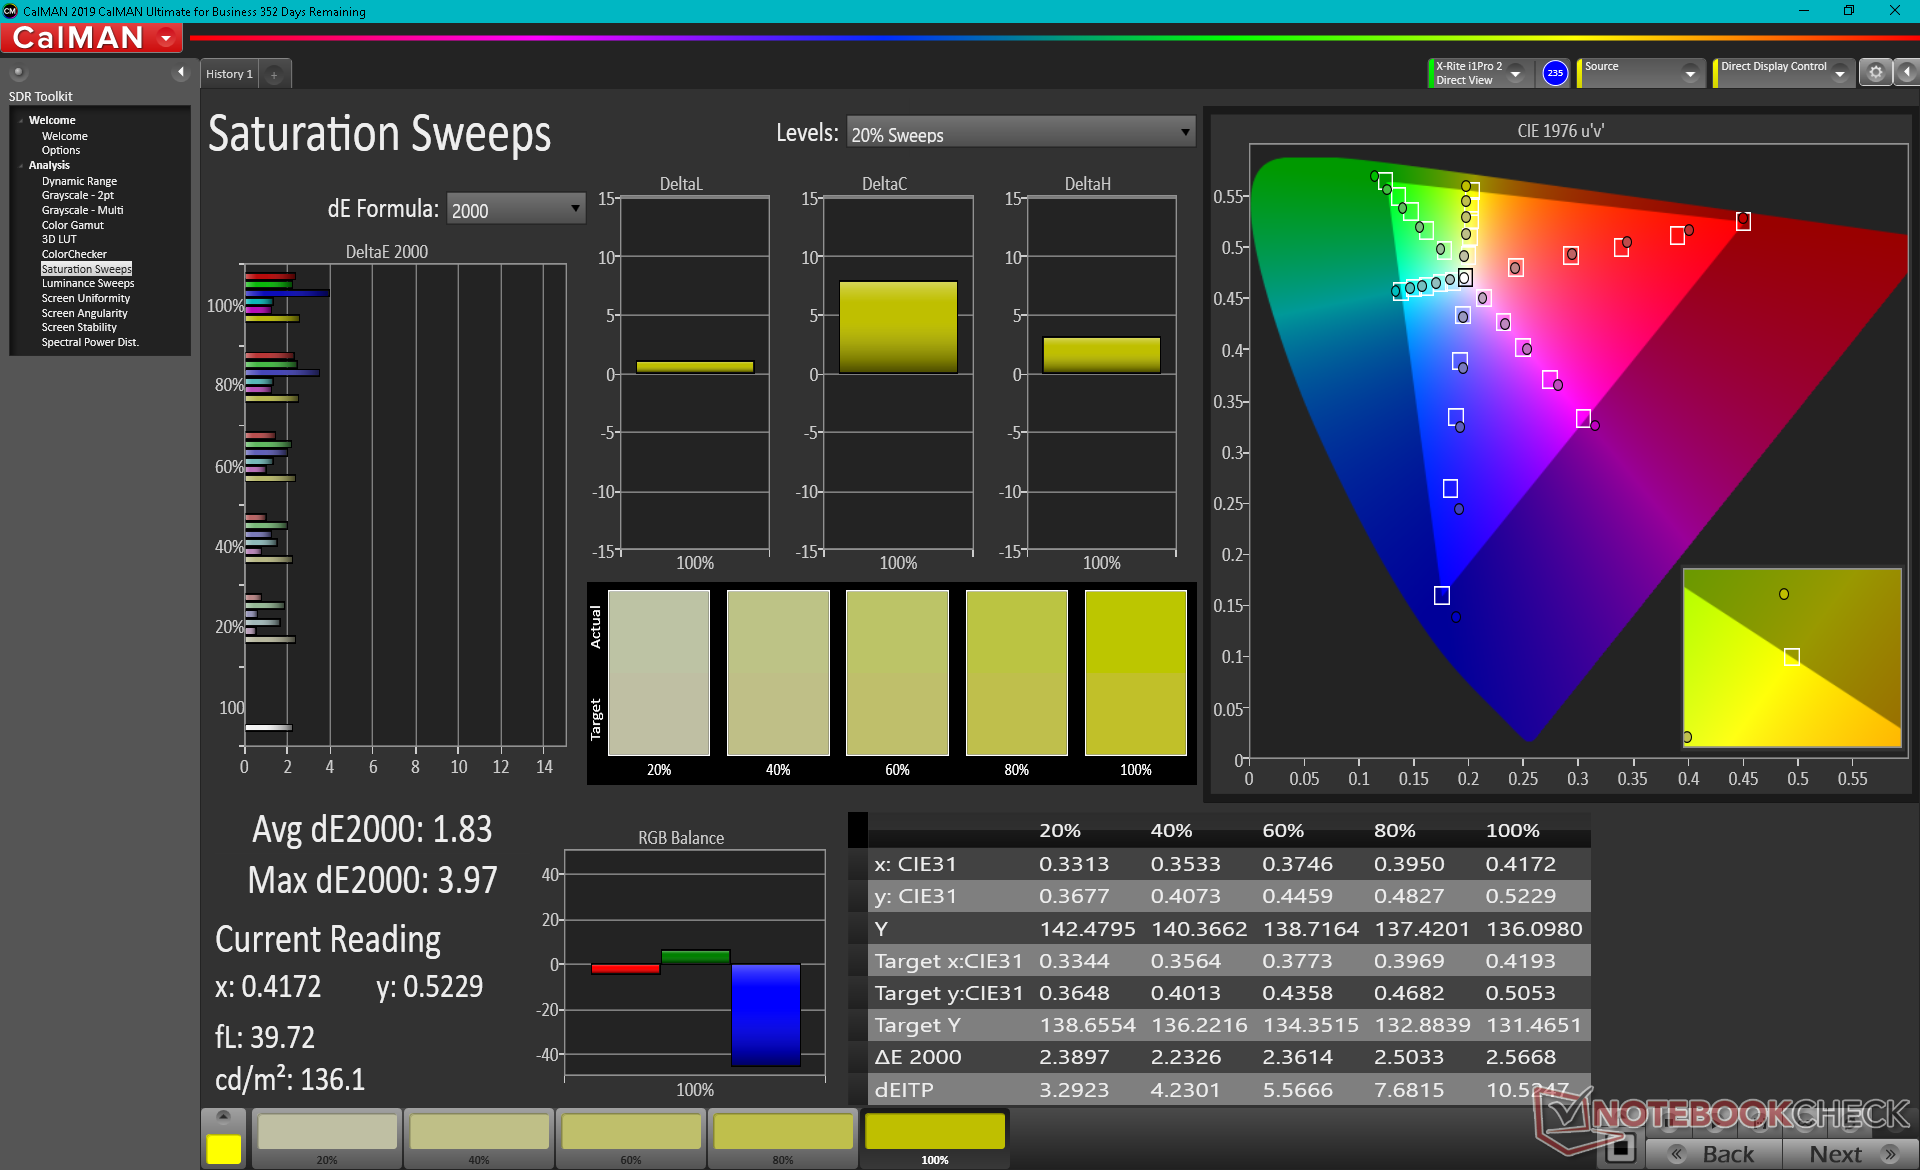
O espaço de cor é quase idêntico ao do painel FHD na edição padrão Silver Edition a 99 por cento do sRGB. Assim, a mudança para a opção de painel 4K resultará em textos e imagens mais nítidos, mas não em cores mais profundas.
A temperatura da cor é muito fria fora da caixa para um valor médio de DeltaE de 6,4 de escala de cinza pobre. Calibrar o painel por conta própria resolve este inconveniente para cores muito mais precisas, como mostram as medidas do nosso CalMan abaixo. Recomendamos aplicar nosso perfil ICC calibrado acima para obter o máximo do display se você não tiver um colorímetro próprio.
Exibir tempos de resposta
| ↔ Tempo de resposta preto para branco | ||
|---|---|---|
| 34 ms ... ascensão ↗ e queda ↘ combinadas | ↗ 19.2 ms ascensão | 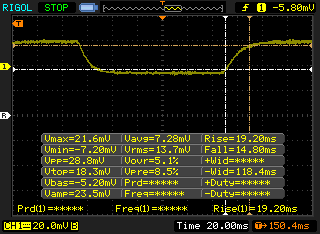 |
| ↘ 14.8 ms queda | ||
| A tela mostra taxas de resposta lentas em nossos testes e será insatisfatória para os jogadores. Em comparação, todos os dispositivos testados variam de 0.1 (mínimo) a 240 (máximo) ms. » 91 % de todos os dispositivos são melhores. Isso significa que o tempo de resposta medido é pior que a média de todos os dispositivos testados (19.8 ms). | ||
| ↔ Tempo de resposta 50% cinza a 80% cinza | ||
| 55.2 ms ... ascensão ↗ e queda ↘ combinadas | ↗ 26.8 ms ascensão | 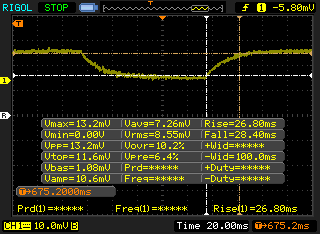 |
| ↘ 28.4 ms queda | ||
| A tela mostra taxas de resposta lentas em nossos testes e será insatisfatória para os jogadores. Em comparação, todos os dispositivos testados variam de 0.165 (mínimo) a 636 (máximo) ms. » 92 % de todos os dispositivos são melhores. Isso significa que o tempo de resposta medido é pior que a média de todos os dispositivos testados (31 ms). | ||
Cintilação da tela / PWM (modulação por largura de pulso)
| Tela tremeluzindo / PWM não detectado | 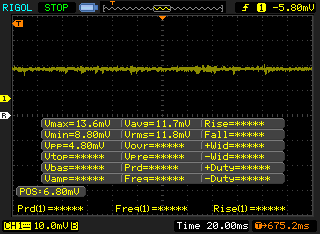 | ||
[pwm_comparison] Em comparação: 52 % de todos os dispositivos testados não usam PWM para escurecer a tela. Se PWM foi detectado, uma média de 7754 (mínimo: 5 - máximo: 343500) Hz foi medida. | |||
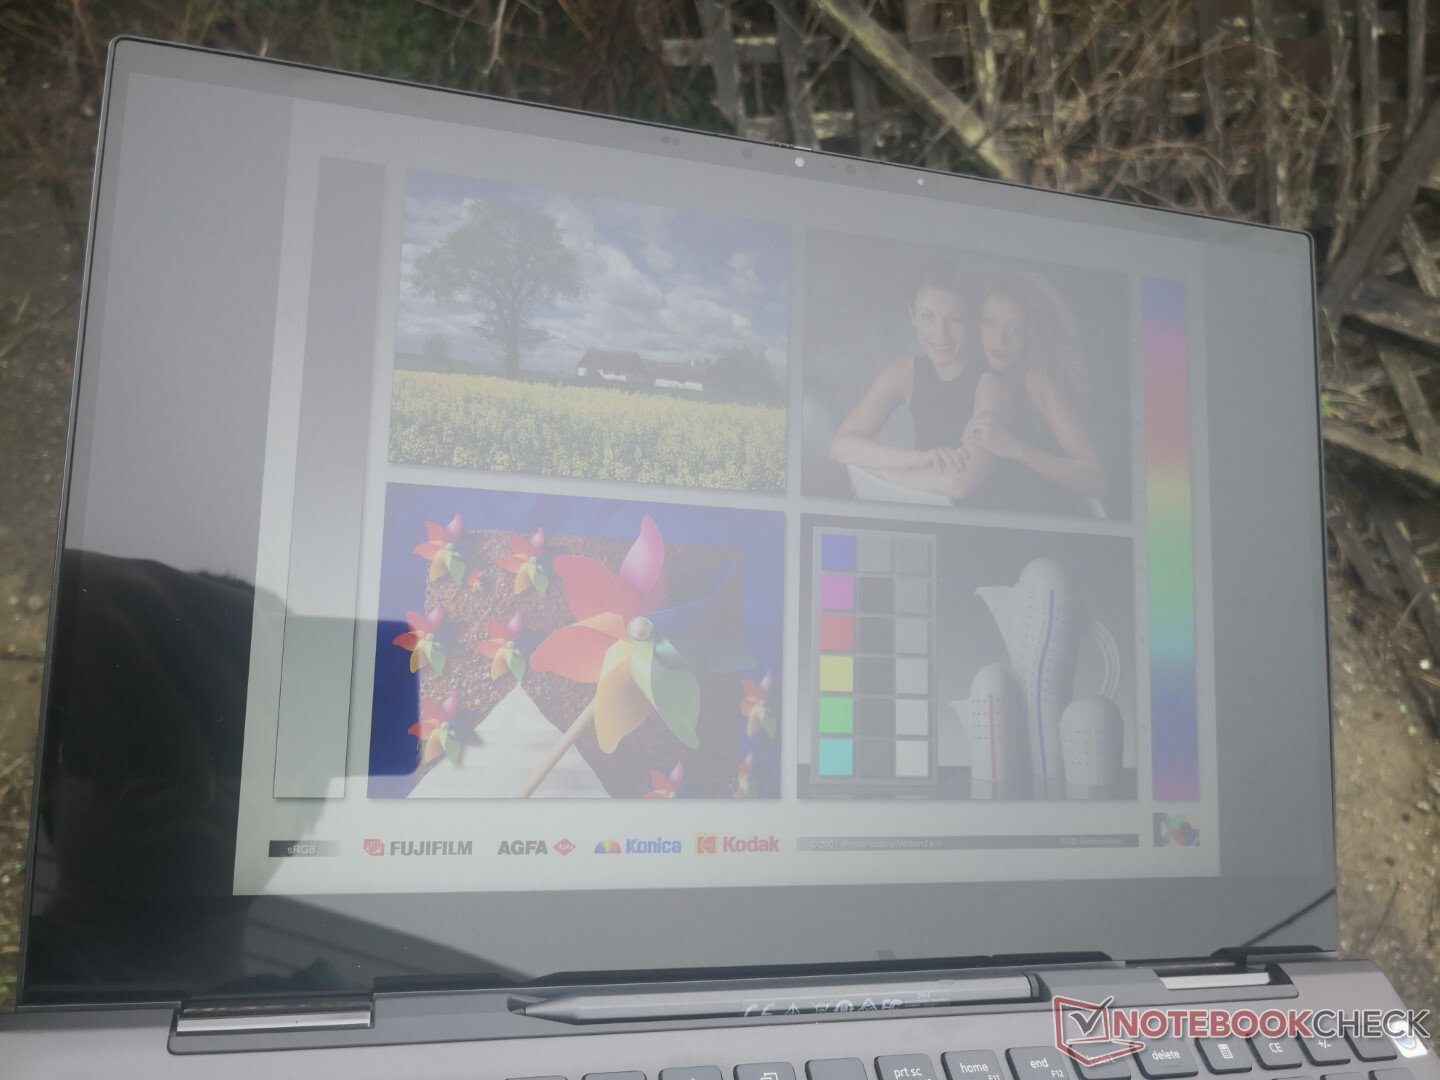
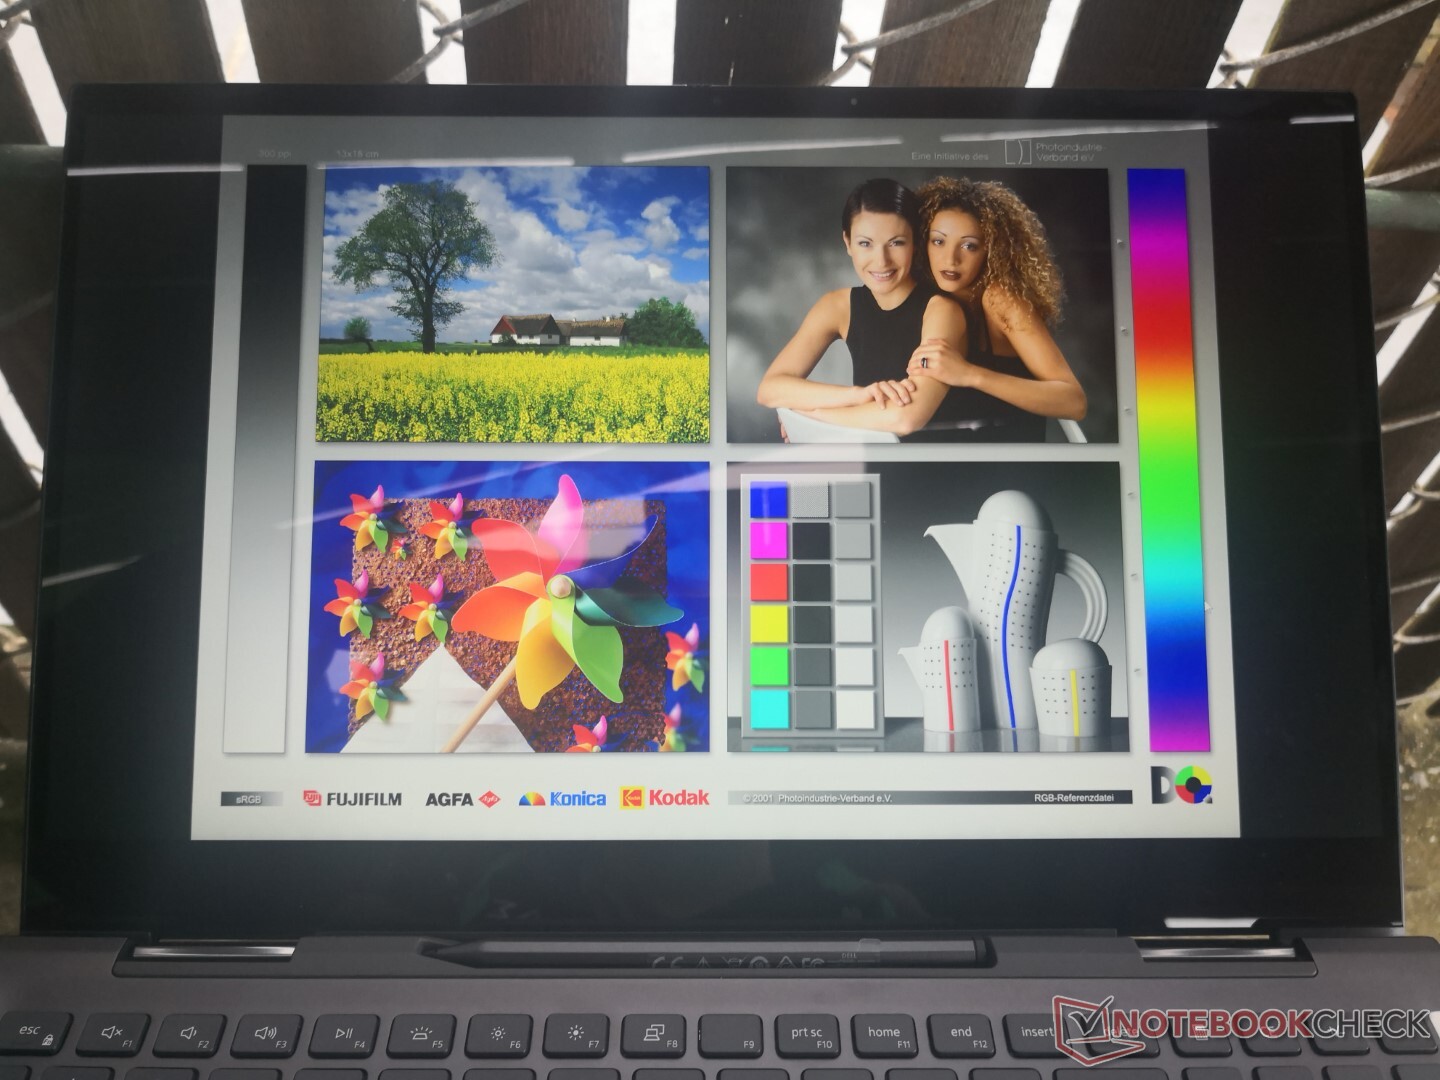
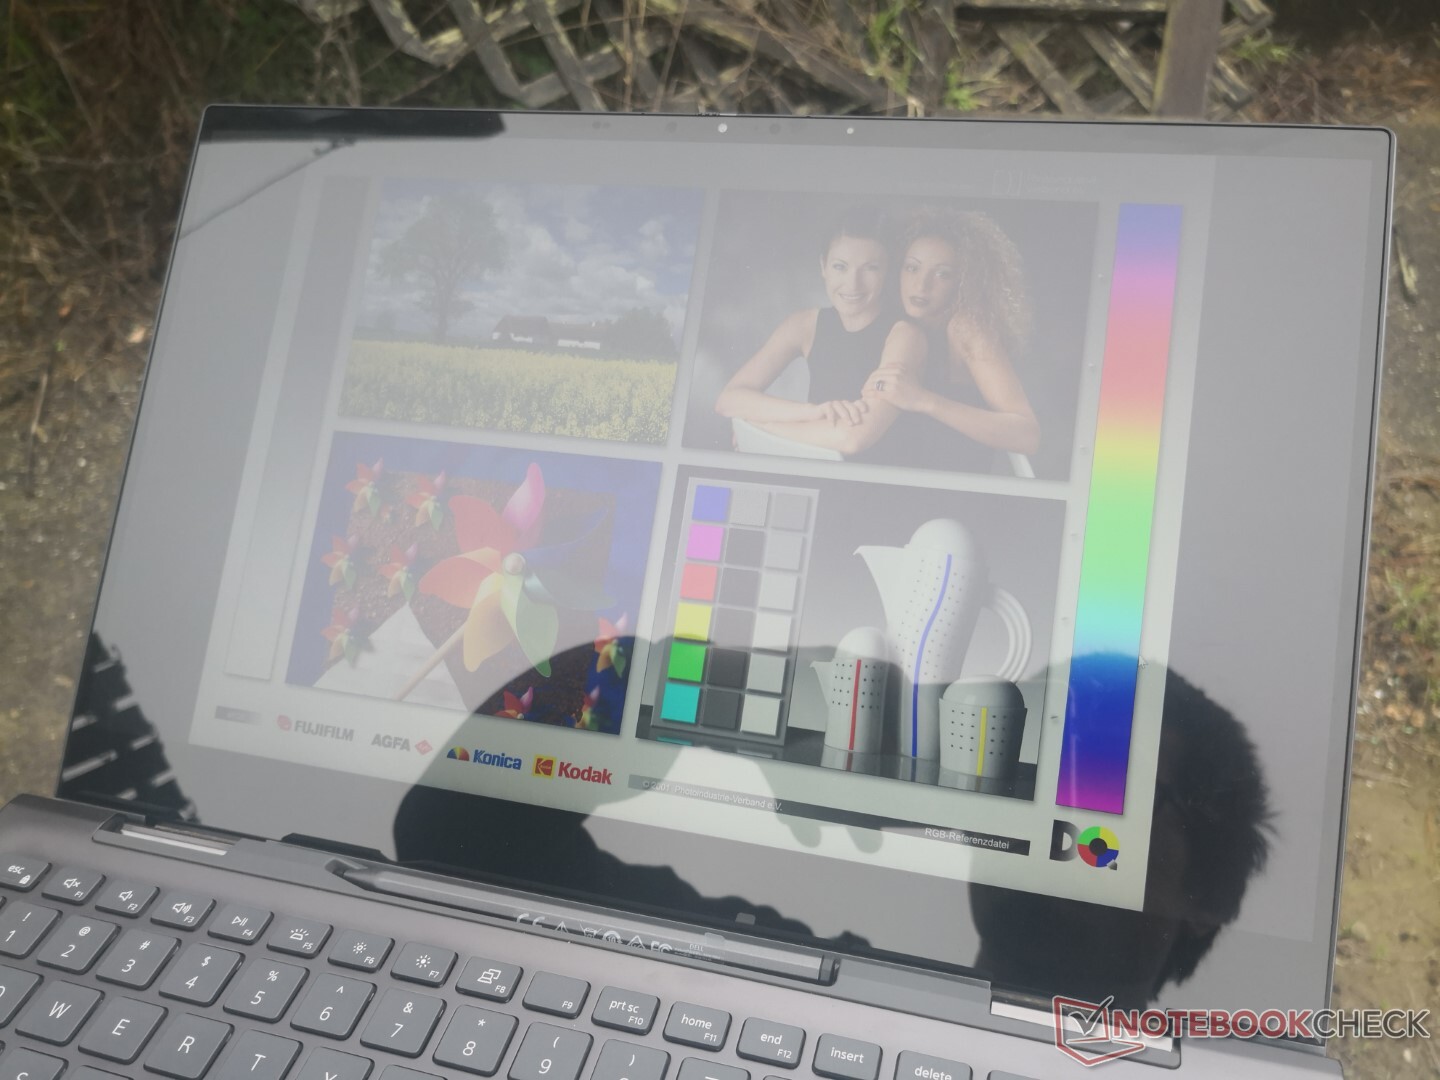
A visibilidade externa é semelhante à da Edição Silver, uma vez que ambas compartilham quase os mesmos níveis de brilho e reprodução de cores, apesar de suas diferenças de resolução nativa. No entanto, os proprietários da Black Edition provavelmente quererão aumentar a escala do texto para evitar o acúmulo de letras pequenas.
Desempenho
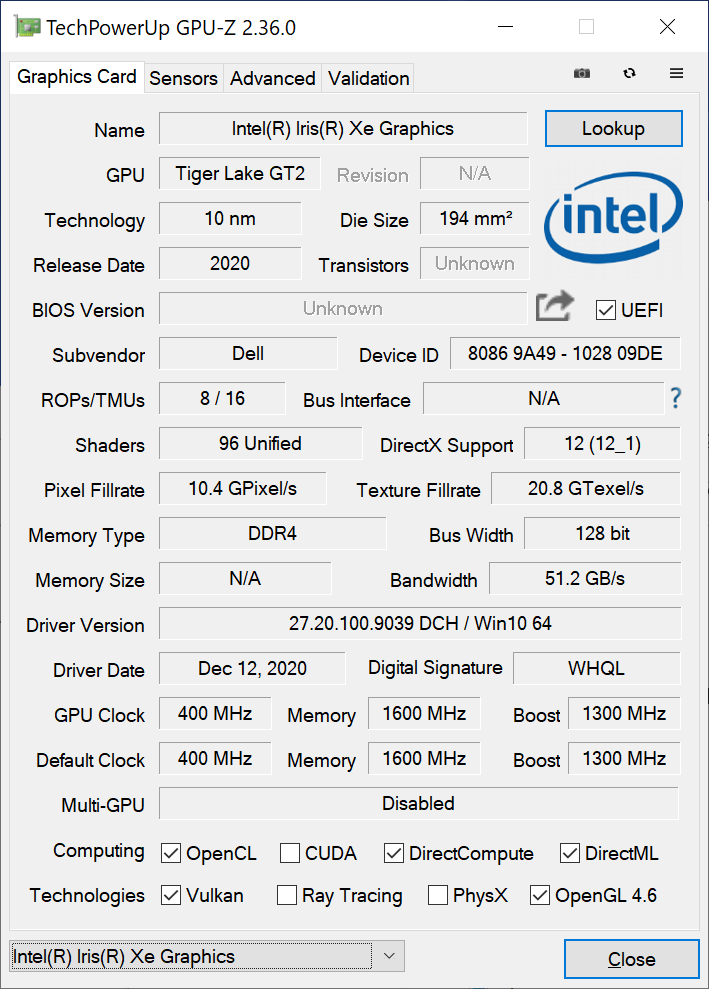
A maior característica do Inspiron 15 7506 2 em 1 Black Edition é sua GPU discreta Iris Xe Max, já que atualmente existem muito poucos laptops com tal opção. A Intel deixou claro que a GPU foi projetada principalmente para editores e prosumers em vez de gamers que nossos benchmarks abaixo mostrarão. Embora não haja variantes AMD disponíveis no momento, os usuários ainda podem configurar a Edição Silver com o GeForce MX330 em seu lugar, se assim o desejarem.
Vale notar que nos deparamos com um punhado de problemas de software e falhas quando a unidade foi enviada pela primeira vez para nós. Felizmente, a maioria destes problemas foi resolvida após atualização para o último driver gráfico no momento da revisão (27.20.100.9039). Os proprietários devem definitivamente se familiarizar com o software do Intel Graphics Command Center para atualização e ajuste fino da GPU Xe Max.
Todos os benchmarks abaixo foram realizados no modo Dell Ultra Performance para as mais altas pontuações possíveis.
Processador
O desempenho bruto da CPU é cerca de 5 a 8% mais lento que a média do Core i7-1165G7 em nosso banco de dados. Embora menor, isto é suficiente para colocá-lo ligeiramente abaixo do Core i5-1135G7 no Inspiron 15 7506 2 em 1 Silver Edition, embora a Black Edition deva abrigar o processador mais rápido. O desempenho multitarefa ainda é cerca de 20 a 25% mais rápido que o Core i7-1065G7 de última geração no Microsoft Surface Book 3
O menos caro AMD Ryzen 5 4500U oferece desempenho multitarefa similar ao nosso Core i7-1165G7, sendo 10 a 15 por cento mais lento em cargas de trabalho com rosca única.
Cinebench R15: CPU Multi 64Bit | CPU Single 64Bit
Blender: v2.79 BMW27 CPU
7-Zip 18.03: 7z b 4 -mmt1 | 7z b 4
Geekbench 5.5: Single-Core | Multi-Core
HWBOT x265 Benchmark v2.2: 4k Preset
LibreOffice : 20 Documents To PDF
R Benchmark 2.5: Overall mean
| Blender / v2.79 BMW27 CPU | |
| Asus Vivobook 15 F512DA-SH31 | |
| Dell Inspiron 15 5000 5502 | |
| Durabook S15ABG2 | |
| Microsoft Surface Book 3 15 | |
| HP Envy x360 15-ee0257ng | |
| Média Intel Core i7-1165G7 (468 - 1138, n=80) | |
| Dell Inspiron 15 7000 7506 2-in-1 Black Edition | |
| Dell Inspiron 15 7506 2-in-1 P97F | |
| Lenovo ThinkPad E15 Gen2-20T9S00K00 | |
| 7-Zip 18.03 / 7z b 4 -mmt1 | |
| Média Intel Core i7-1165G7 (4478 - 5507, n=80) | |
| Dell Inspiron 15 7000 7506 2-in-1 Black Edition | |
| Dell Inspiron 15 7506 2-in-1 P97F | |
| Dell Inspiron 15 5000 5502 | |
| Lenovo ThinkPad E15 Gen2-20T9S00K00 | |
| HP Envy x360 15-ee0257ng | |
| Microsoft Surface Book 3 15 | |
| Durabook S15ABG2 | |
| Asus Vivobook 15 F512DA-SH31 | |
| 7-Zip 18.03 / 7z b 4 | |
| Lenovo ThinkPad E15 Gen2-20T9S00K00 | |
| HP Envy x360 15-ee0257ng | |
| Dell Inspiron 15 7506 2-in-1 P97F | |
| Dell Inspiron 15 7000 7506 2-in-1 Black Edition | |
| Média Intel Core i7-1165G7 (15347 - 27405, n=80) | |
| Microsoft Surface Book 3 15 | |
| Durabook S15ABG2 | |
| Dell Inspiron 15 5000 5502 | |
| Asus Vivobook 15 F512DA-SH31 | |
| Geekbench 5.5 / Single-Core | |
| Média Intel Core i7-1165G7 (1302 - 1595, n=77) | |
| Dell Inspiron 15 7000 7506 2-in-1 Black Edition | |
| Dell Inspiron 15 7506 2-in-1 P97F | |
| Dell Inspiron 15 5000 5502 | |
| Microsoft Surface Book 3 15 | |
| Asus ZenBook Flip 15 UX563FD-A1027T | |
| Lenovo ThinkPad E15 Gen2-20T9S00K00 | |
| HP Envy x360 15-ee0257ng | |
| Durabook S15ABG2 | |
| Asus Vivobook 15 F512DA-SH31 | |
| Geekbench 5.5 / Multi-Core | |
| Lenovo ThinkPad E15 Gen2-20T9S00K00 | |
| Dell Inspiron 15 7000 7506 2-in-1 Black Edition | |
| Média Intel Core i7-1165G7 (3078 - 5926, n=77) | |
| HP Envy x360 15-ee0257ng | |
| Dell Inspiron 15 7506 2-in-1 P97F | |
| Microsoft Surface Book 3 15 | |
| Asus ZenBook Flip 15 UX563FD-A1027T | |
| Durabook S15ABG2 | |
| Dell Inspiron 15 5000 5502 | |
| Asus Vivobook 15 F512DA-SH31 | |
| HWBOT x265 Benchmark v2.2 / 4k Preset | |
| Lenovo ThinkPad E15 Gen2-20T9S00K00 | |
| Dell Inspiron 15 7506 2-in-1 P97F | |
| Dell Inspiron 15 7000 7506 2-in-1 Black Edition | |
| Média Intel Core i7-1165G7 (1.39 - 8.47, n=80) | |
| HP Envy x360 15-ee0257ng | |
| Microsoft Surface Book 3 15 | |
| Durabook S15ABG2 | |
| Dell Inspiron 15 5000 5502 | |
| Asus Vivobook 15 F512DA-SH31 | |
| LibreOffice / 20 Documents To PDF | |
| Asus Vivobook 15 F512DA-SH31 | |
| HP Envy x360 15-ee0257ng | |
| Durabook S15ABG2 | |
| Microsoft Surface Book 3 15 | |
| Dell Inspiron 15 5000 5502 | |
| Lenovo ThinkPad E15 Gen2-20T9S00K00 | |
| Dell Inspiron 15 7506 2-in-1 P97F | |
| Média Intel Core i7-1165G7 (21.5 - 88.1, n=78) | |
| Dell Inspiron 15 7000 7506 2-in-1 Black Edition | |
| R Benchmark 2.5 / Overall mean | |
| Asus Vivobook 15 F512DA-SH31 | |
| Durabook S15ABG2 | |
| Microsoft Surface Book 3 15 | |
| Dell Inspiron 15 5000 5502 | |
| Dell Inspiron 15 7506 2-in-1 P97F | |
| HP Envy x360 15-ee0257ng | |
| Lenovo ThinkPad E15 Gen2-20T9S00K00 | |
| Dell Inspiron 15 7000 7506 2-in-1 Black Edition | |
| Média Intel Core i7-1165G7 (0.552 - 1.002, n=80) | |
* ... menor é melhor
Desempenho do sistema
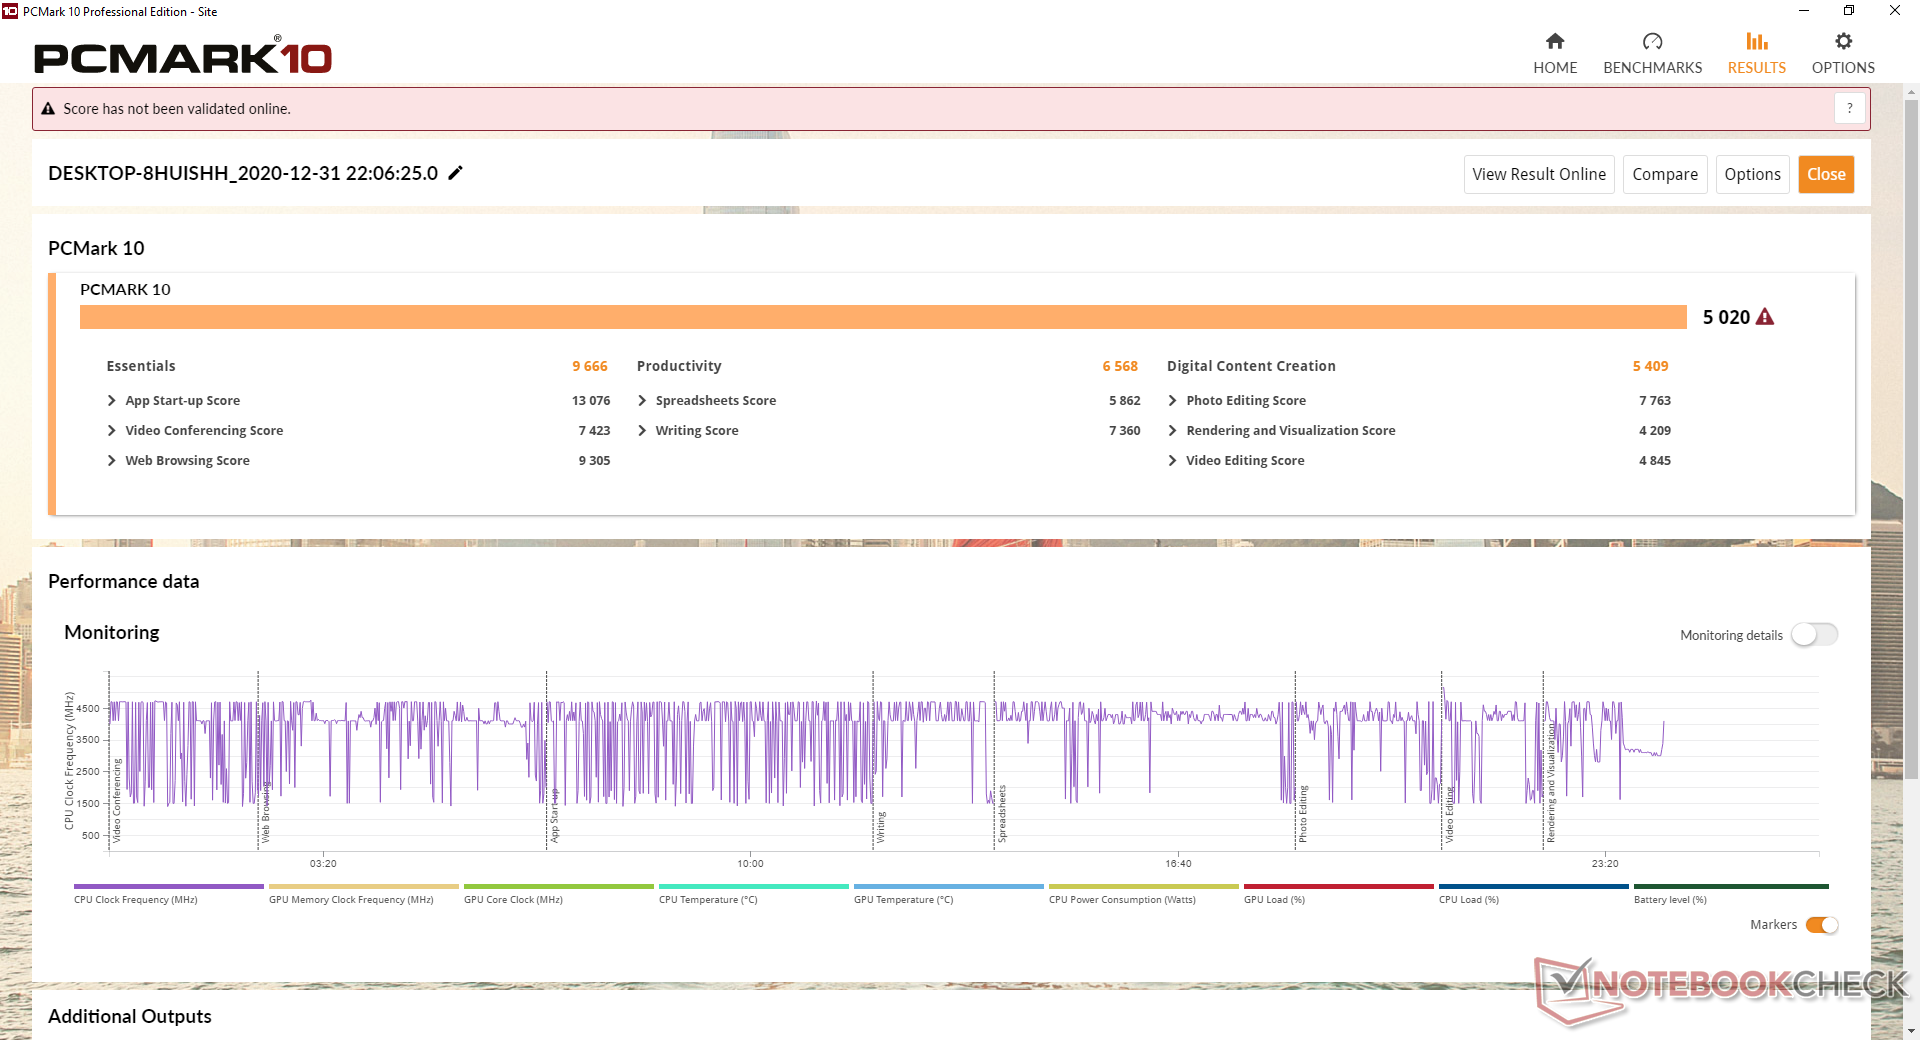
A pontuação PCMark 10 é alta quando comparada a outros conversíveis com GPUs integradas especialmente na Criação de Conteúdo Digital, provavelmente por causa da GPU Xe Max.
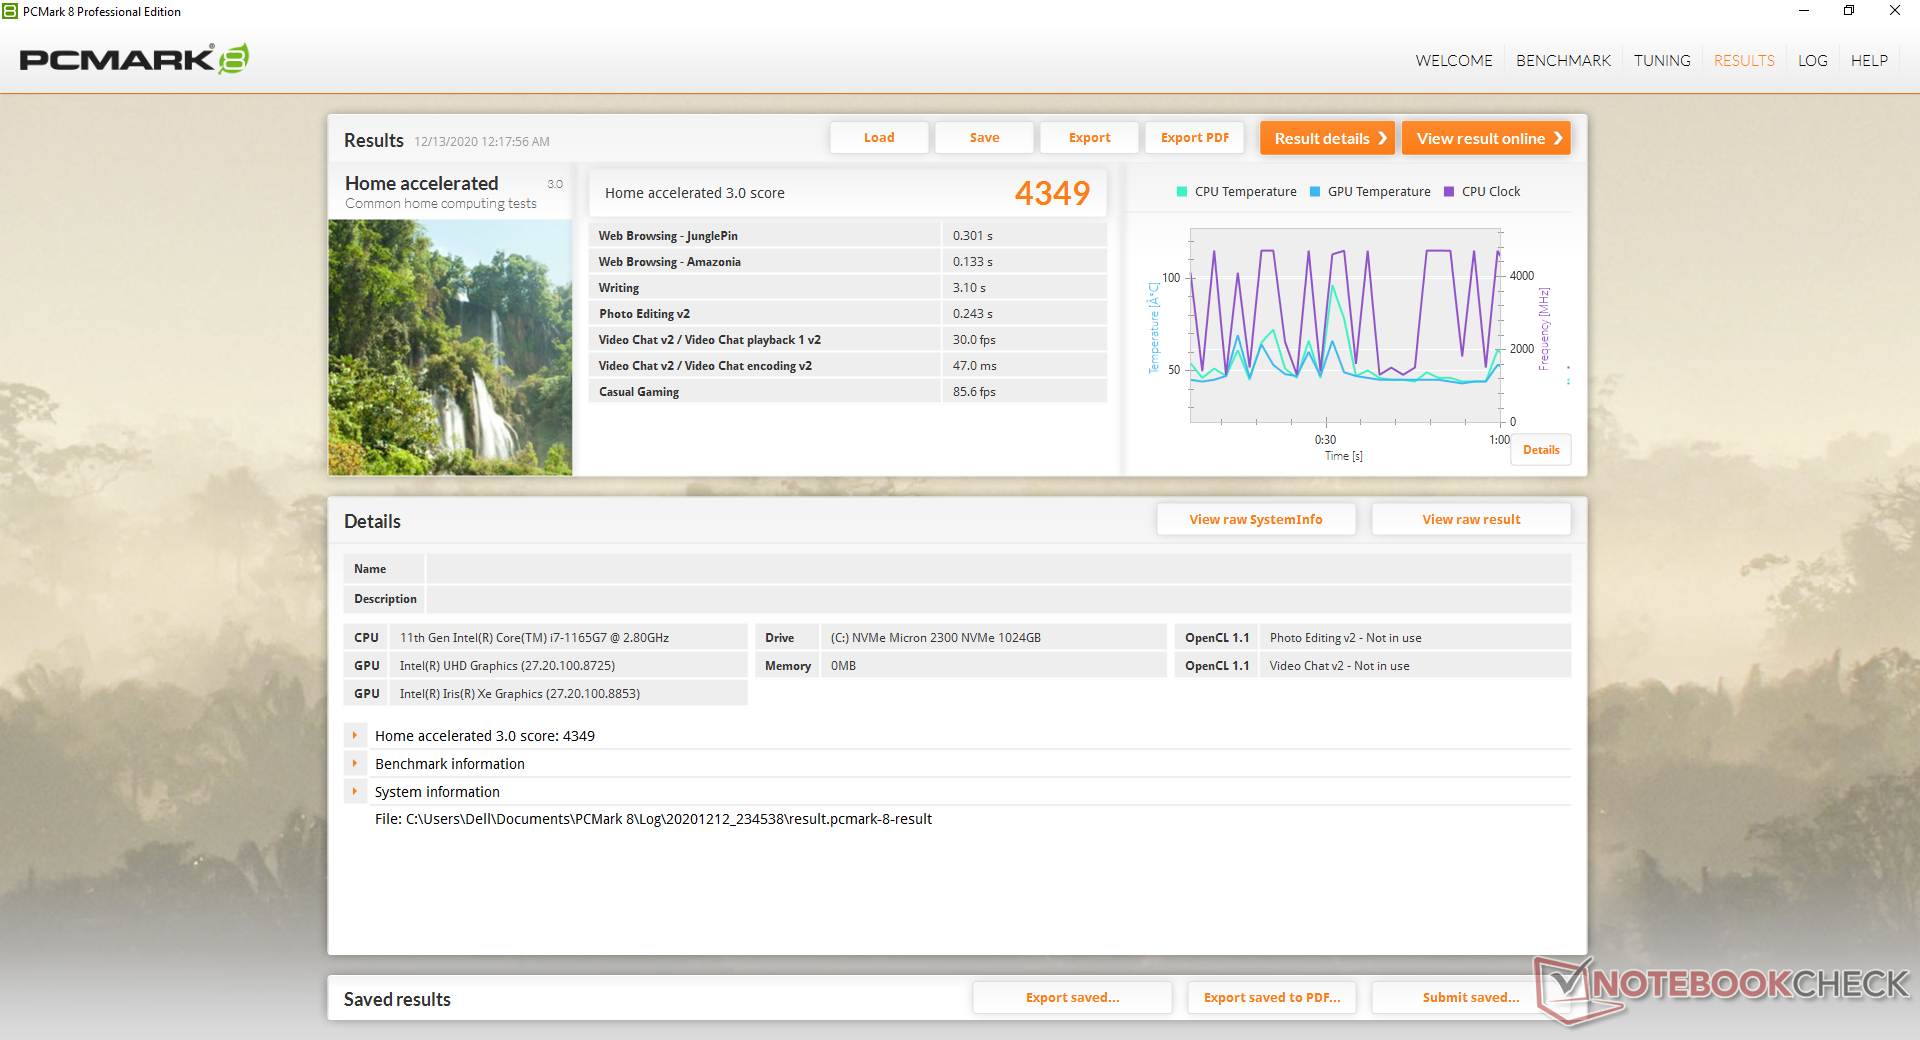
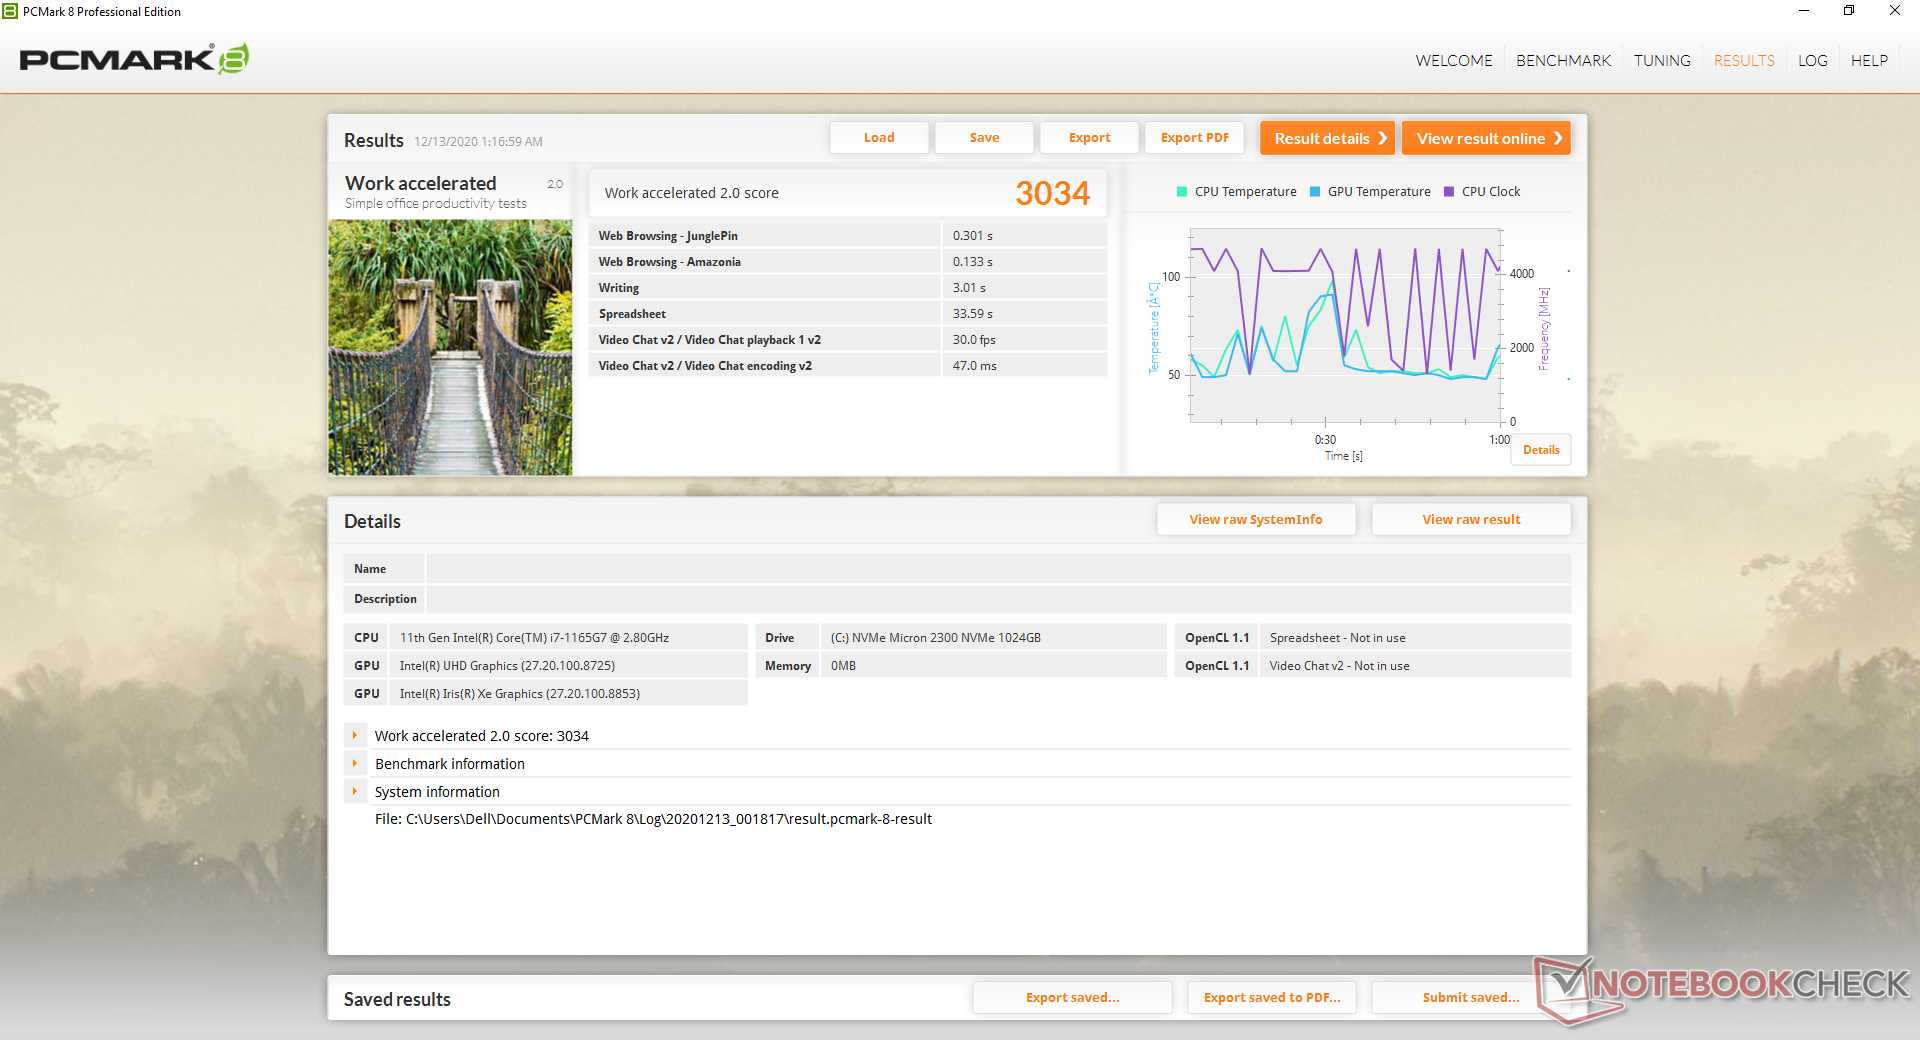
| PCMark 8 Home Score Accelerated v2 | 4349 pontos | |
| PCMark 8 Work Score Accelerated v2 | 3034 pontos | |
| PCMark 10 Score | 5020 pontos | |
Ajuda | ||
Latência do DPC
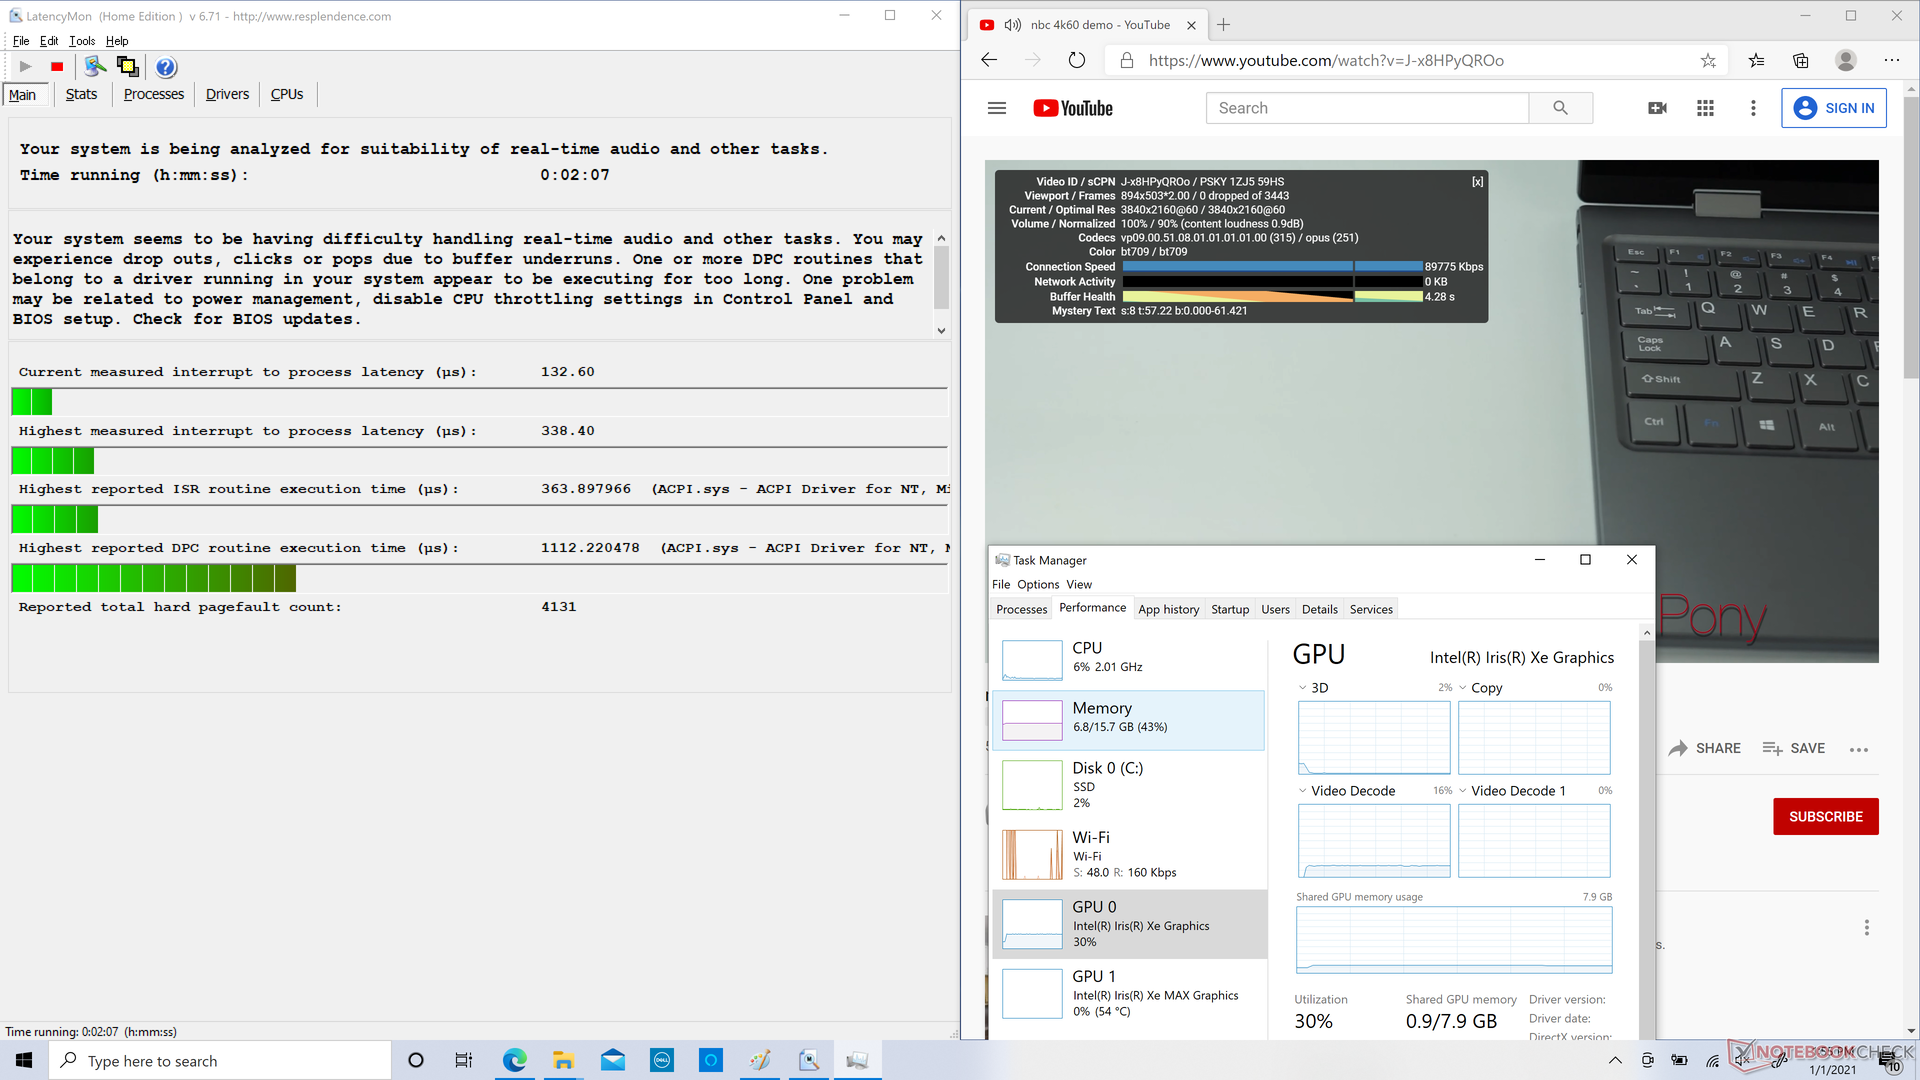
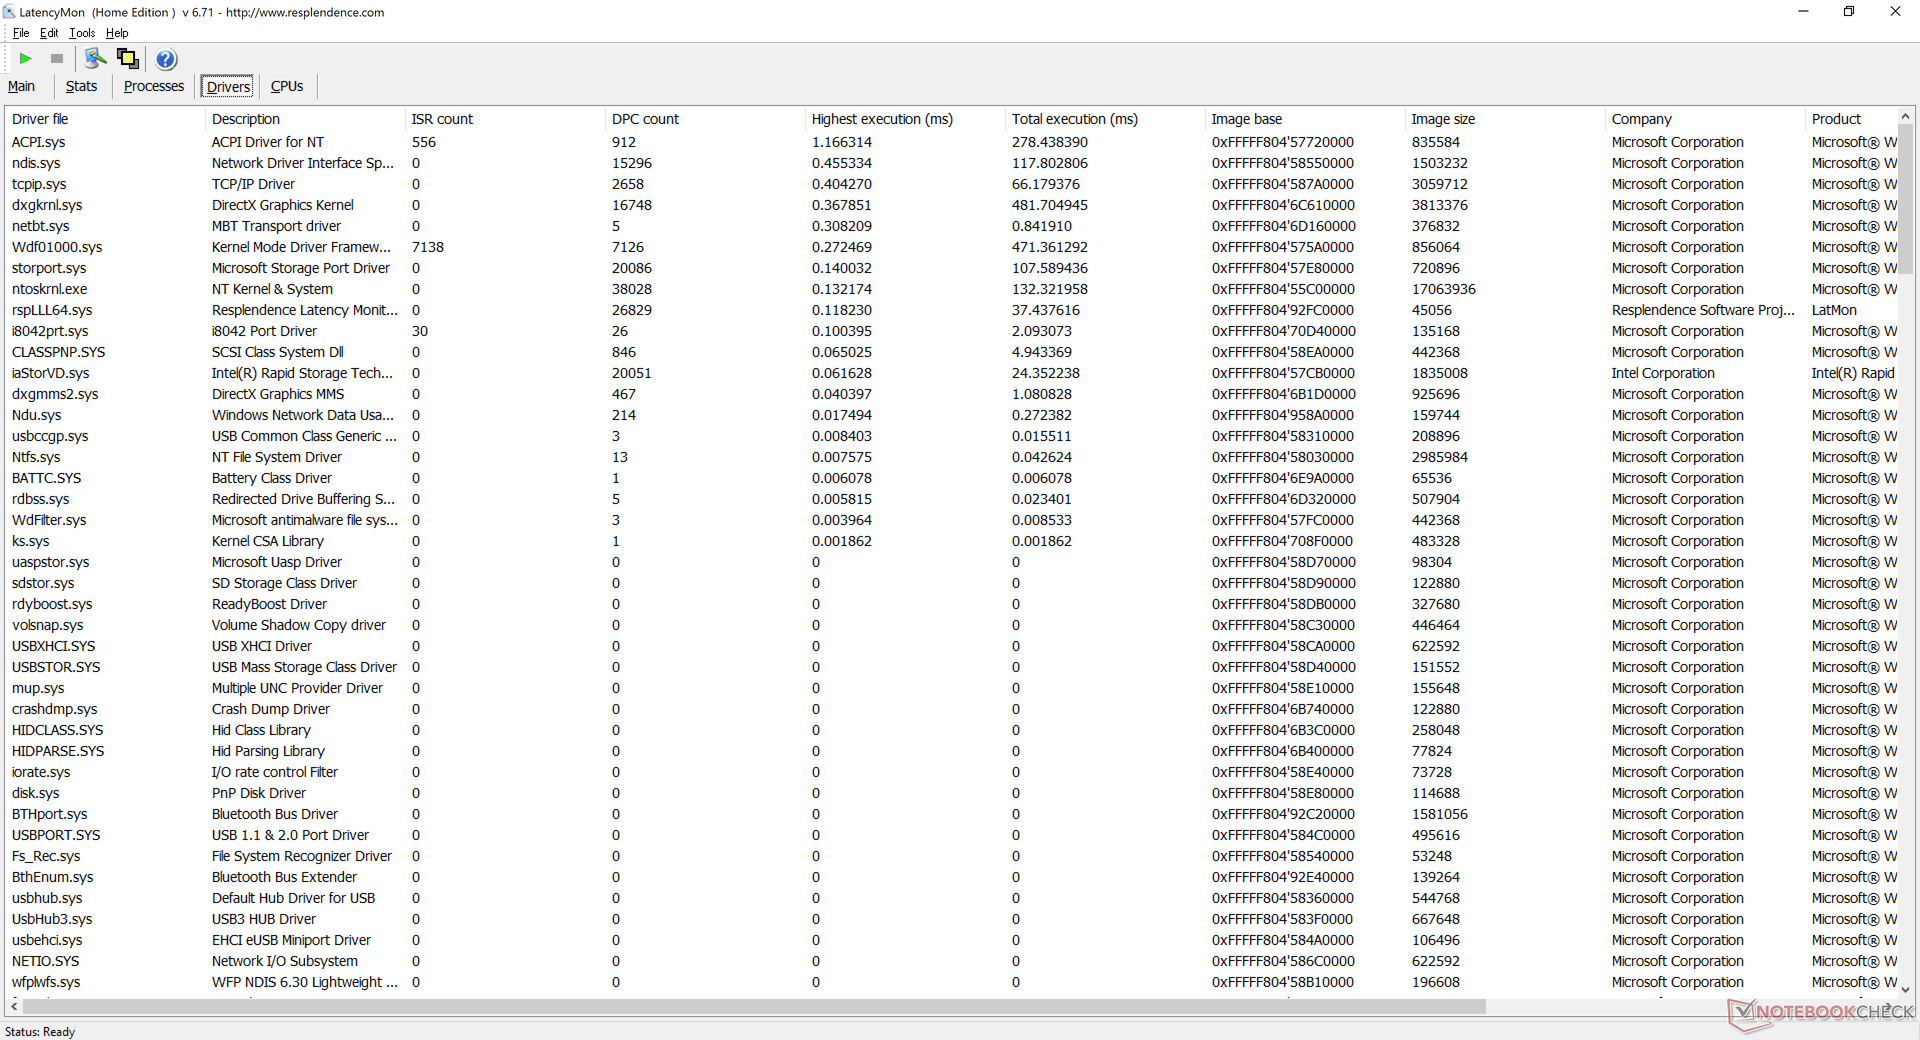
LatencyMon mostra pequenos problemas de latência do DPC relacionados ao ACPI.sys. A reprodução do vídeo 4K UHD a 60 FPS é de outra forma suave e sem queda de quadros durante nosso teste de minutos. A utilização da GPU fica em 30% em comparação com ~50% da plataforma Iris Plus G7 do ano passado.
| DPC Latencies / LatencyMon - interrupt to process latency (max), Web, Youtube, Prime95 | |
| Dell Inspiron 15 7506 2-in-1 P97F | |
| Microsoft Surface Book 3 15 | |
| Samsung Galaxy Book Flex 15-NP950 | |
| HP Envy x360 15-ee0257ng | |
| Dell Inspiron 15 7000 7506 2-in-1 Black Edition | |
* ... menor é melhor
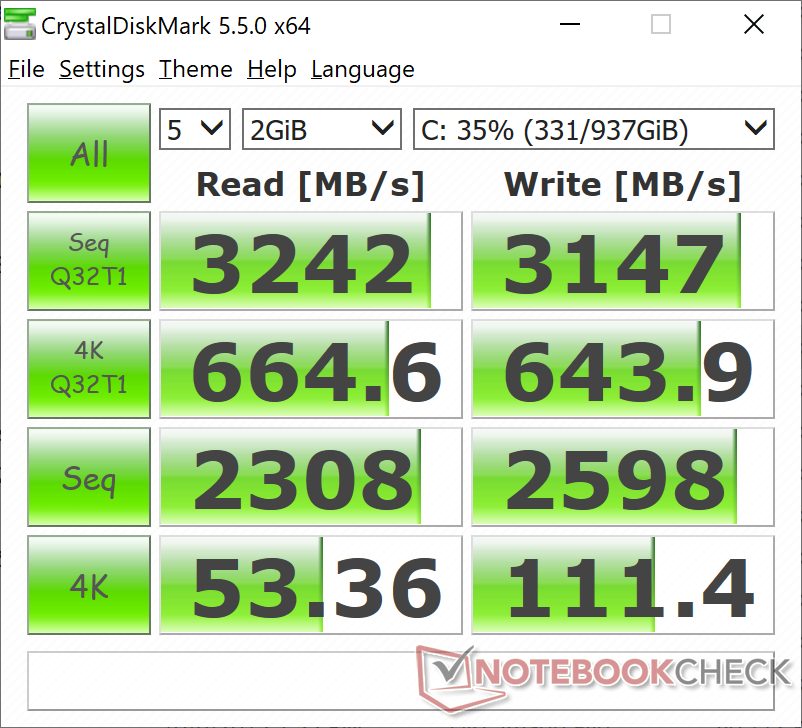
Dispositivos de armazenamento
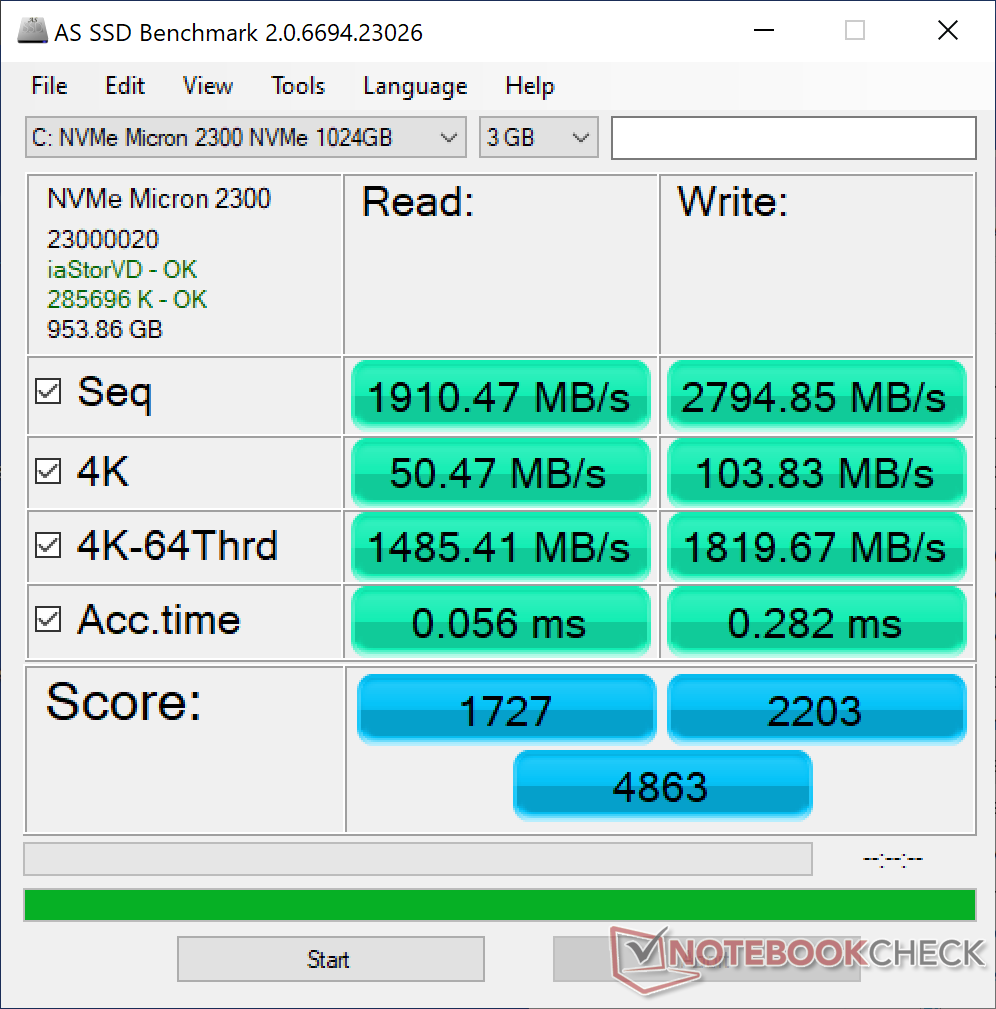
Nossa unidade de teste vem com um Micron 2300 NVMe SSD com taxas teóricas de leitura e escrita de até 3300 MB/s e 2700 MB/s, respectivamente. Em comparação, nossa unidade base Silver Edition vem com uma unidade Toshiba e, portanto, a Dell pode estar adquirindo de vários fabricantes de unidades para sua série Inspiron 15 7506 2 em 1.
A unidade Micron pode ter problemas para atingir seu potencial máximo. Ao executar o DiskSpd em um loop, as taxas de leitura atingiriam apenas 1090 MB/s, possivelmente devido à interrupção da atividade de fundo ou ao alcance dos limites térmicos.
Mais comparações de benchmark de HDD e SSD podem ser encontradas em nossa tabela aqui.
| Dell Inspiron 15 7000 7506 2-in-1 Black Edition Micron 2300 1TB MTFDHBA1T0TDV | HP Envy x360 15-ee0257ng Intel SSD 660p SSDPEKNW512G8 | Microsoft Surface Book 3 15 SK hynix BC501 HFM256GDGTNG | Asus ZenBook Flip 15 UX563FD-A1027T Samsung SSD PM981 MZVLB1T0HALR | Lenovo Yoga C740-15IML Samsung SSD PM981 MZVLB512HAJQ | Dell Inspiron 15 7506 2-in-1 P97F Toshiba KBG40ZNS256G NVMe | |
|---|---|---|---|---|---|---|
| AS SSD | -37% | -39% | -9% | 0% | -70% | |
| Seq Read (MB/s) | 1910 | 1587 -17% | 1625 -15% | 2739 43% | 2732 43% | 1470 -23% |
| Seq Write (MB/s) | 2795 | 864 -69% | 461.3 -83% | 1307 -53% | 1477 -47% | 324.2 -88% |
| 4K Read (MB/s) | 50.5 | 51.6 2% | 37.2 -26% | 47.43 -6% | 57.7 14% | 37.25 -26% |
| 4K Write (MB/s) | 103.8 | 125.1 21% | 100.9 -3% | 126 21% | 136.3 31% | 98 -6% |
| 4K-64 Read (MB/s) | 1485 | 323.1 -78% | 501 -66% | 1013 -32% | 1021 -31% | 796 -46% |
| 4K-64 Write (MB/s) | 1820 | 724 -60% | 311.7 -83% | 1371 -25% | 1651 -9% | 152.6 -92% |
| Access Time Read * (ms) | 0.056 | 0.101 -80% | 0.072 -29% | 0.082 -46% | 0.062 -11% | 0.146 -161% |
| Access Time Write * (ms) | 0.282 | 0.046 84% | 0.036 87% | 0.029 90% | 0.028 90% | 0.577 -105% |
| Score Read (Points) | 1727 | 533 -69% | 701 -59% | 1335 -23% | 1352 -22% | 980 -43% |
| Score Write (Points) | 2203 | 935 -58% | 459 -79% | 1628 -26% | 1935 -12% | 283 -87% |
| Score Total (Points) | 4863 | 1725 -65% | 1470 -70% | 3582 -26% | 3929 -19% | 1714 -65% |
| Copy ISO MB/s (MB/s) | 1892 | 1323 -30% | 1931 2% | 1972 4% | 353.5 -81% | |
| Copy Program MB/s (MB/s) | 649 | 340.8 -47% | 457.9 -29% | 642 -1% | 194.1 -70% | |
| Copy Game MB/s (MB/s) | 1558 | 823 -47% | 1242 -20% | 1090 -30% | 239 -85% | |
| CrystalDiskMark 5.2 / 6 | -39% | -51% | -14% | -7% | -53% | |
| Write 4K (MB/s) | 111.4 | 104.5 -6% | 87.4 -22% | 137.8 24% | 142.3 28% | 99.3 -11% |
| Read 4K (MB/s) | 53.4 | 49.7 -7% | 38.14 -29% | 44.15 -17% | 47.56 -11% | 32.1 -40% |
| Write Seq (MB/s) | 2598 | 981 -62% | 610 -77% | 2073 -20% | 2185 -16% | 353.1 -86% |
| Read Seq (MB/s) | 2308 | 1517 -34% | 1029 -55% | 2165 -6% | 2235 -3% | 1370 -41% |
| Write 4K Q32T1 (MB/s) | 644 | 398.8 -38% | 280.3 -56% | 431.9 -33% | 515 -20% | 171.1 -73% |
| Read 4K Q32T1 (MB/s) | 665 | 338.4 -49% | 259.6 -61% | 427.7 -36% | 413.4 -38% | 350.8 -47% |
| Write Seq Q32T1 (MB/s) | 3147 | 982 -69% | 829 -74% | 2253 -28% | 2981 -5% | 325.9 -90% |
| Read Seq Q32T1 (MB/s) | 3242 | 1650 -49% | 2037 -37% | 3480 7% | 3565 10% | 2197 -32% |
| Média Total (Programa/Configurações) | -38% /
-38% | -45% /
-44% | -12% /
-11% | -4% /
-3% | -62% /
-64% |
* ... menor é melhor

Disk Throttling: DiskSpd Read Loop, Queue Depth 8
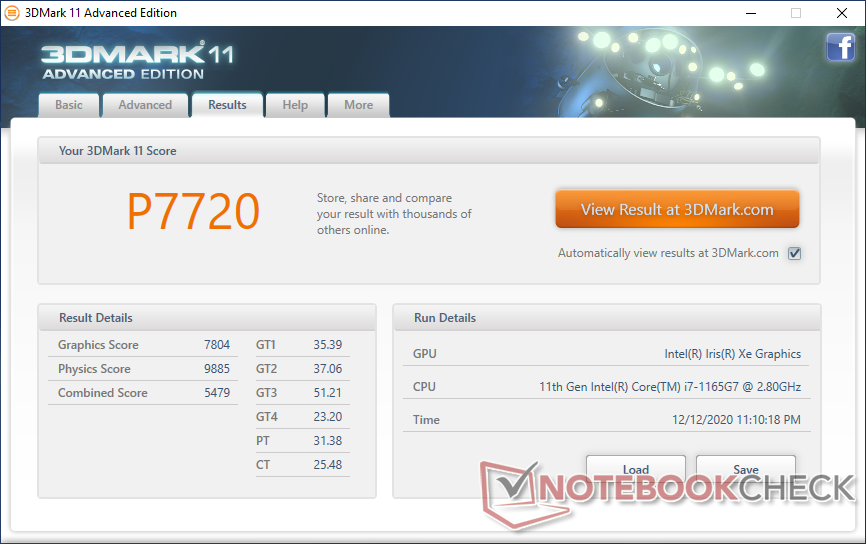
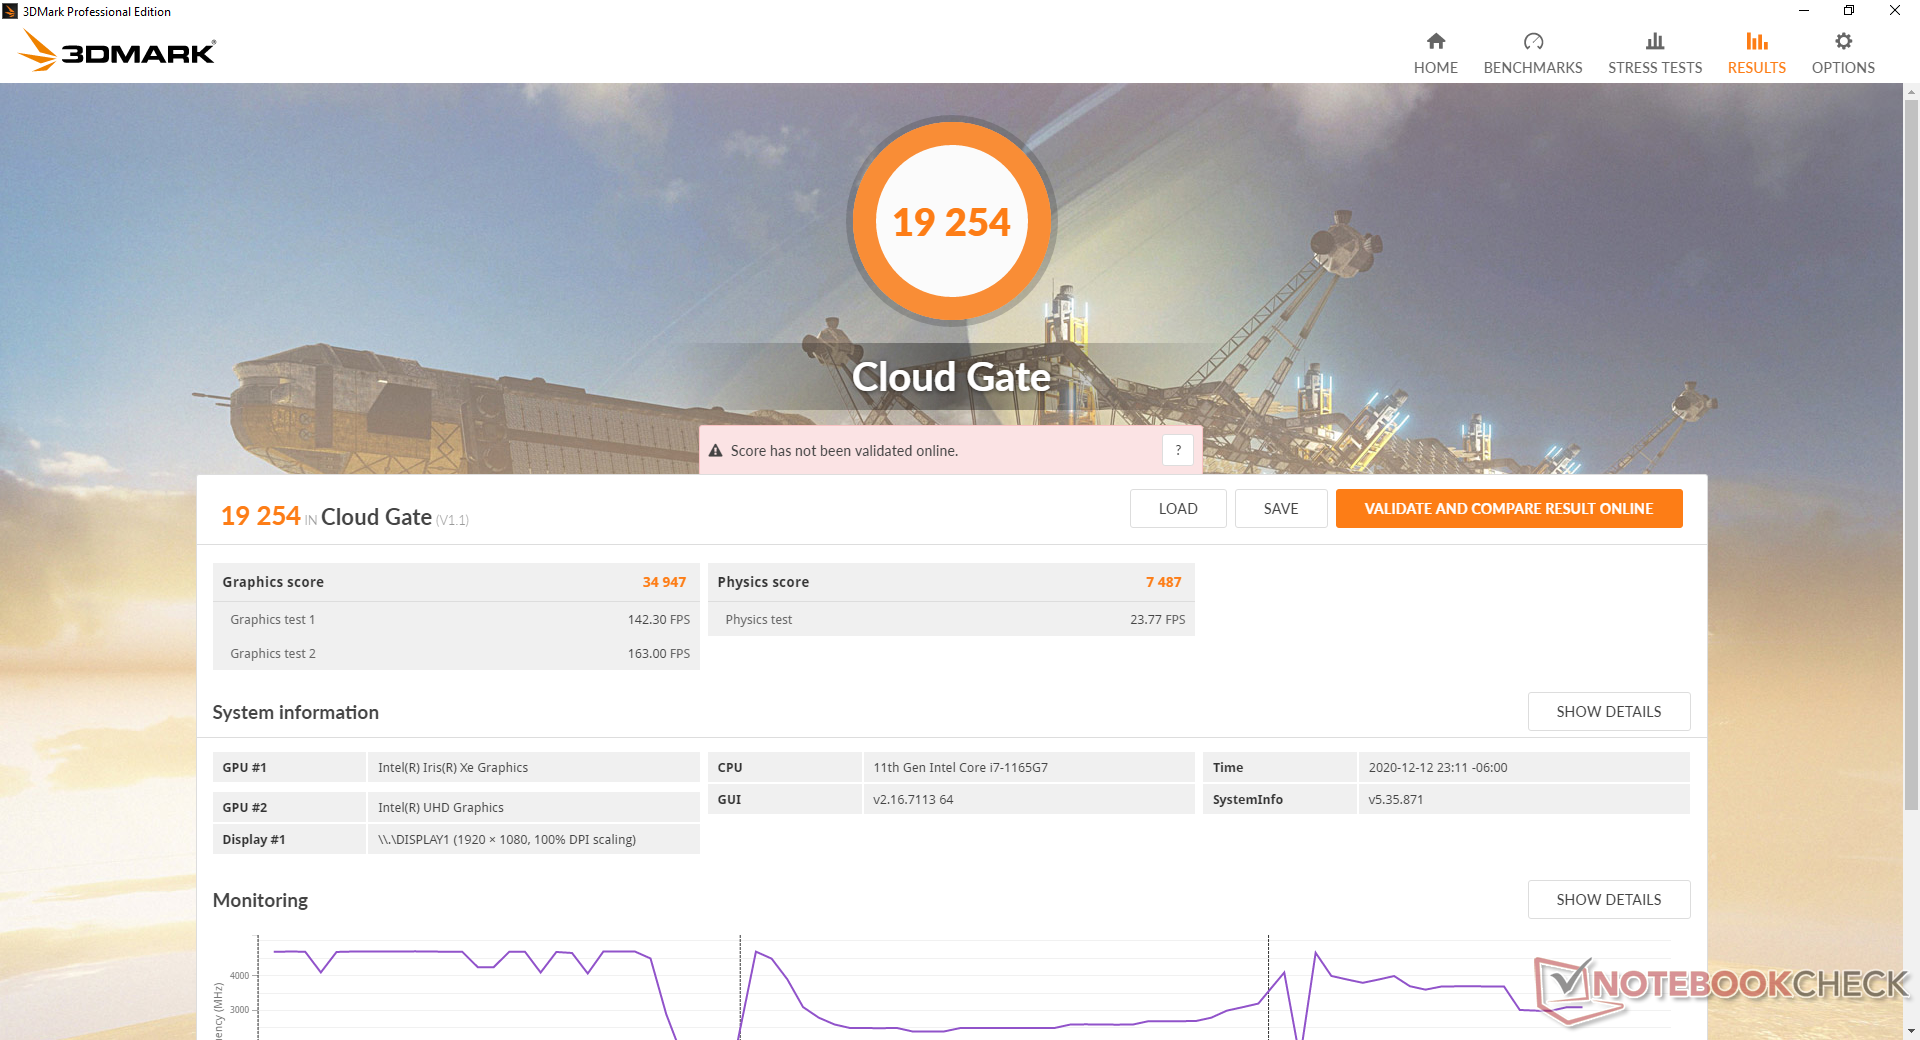
Desempenho da GPU
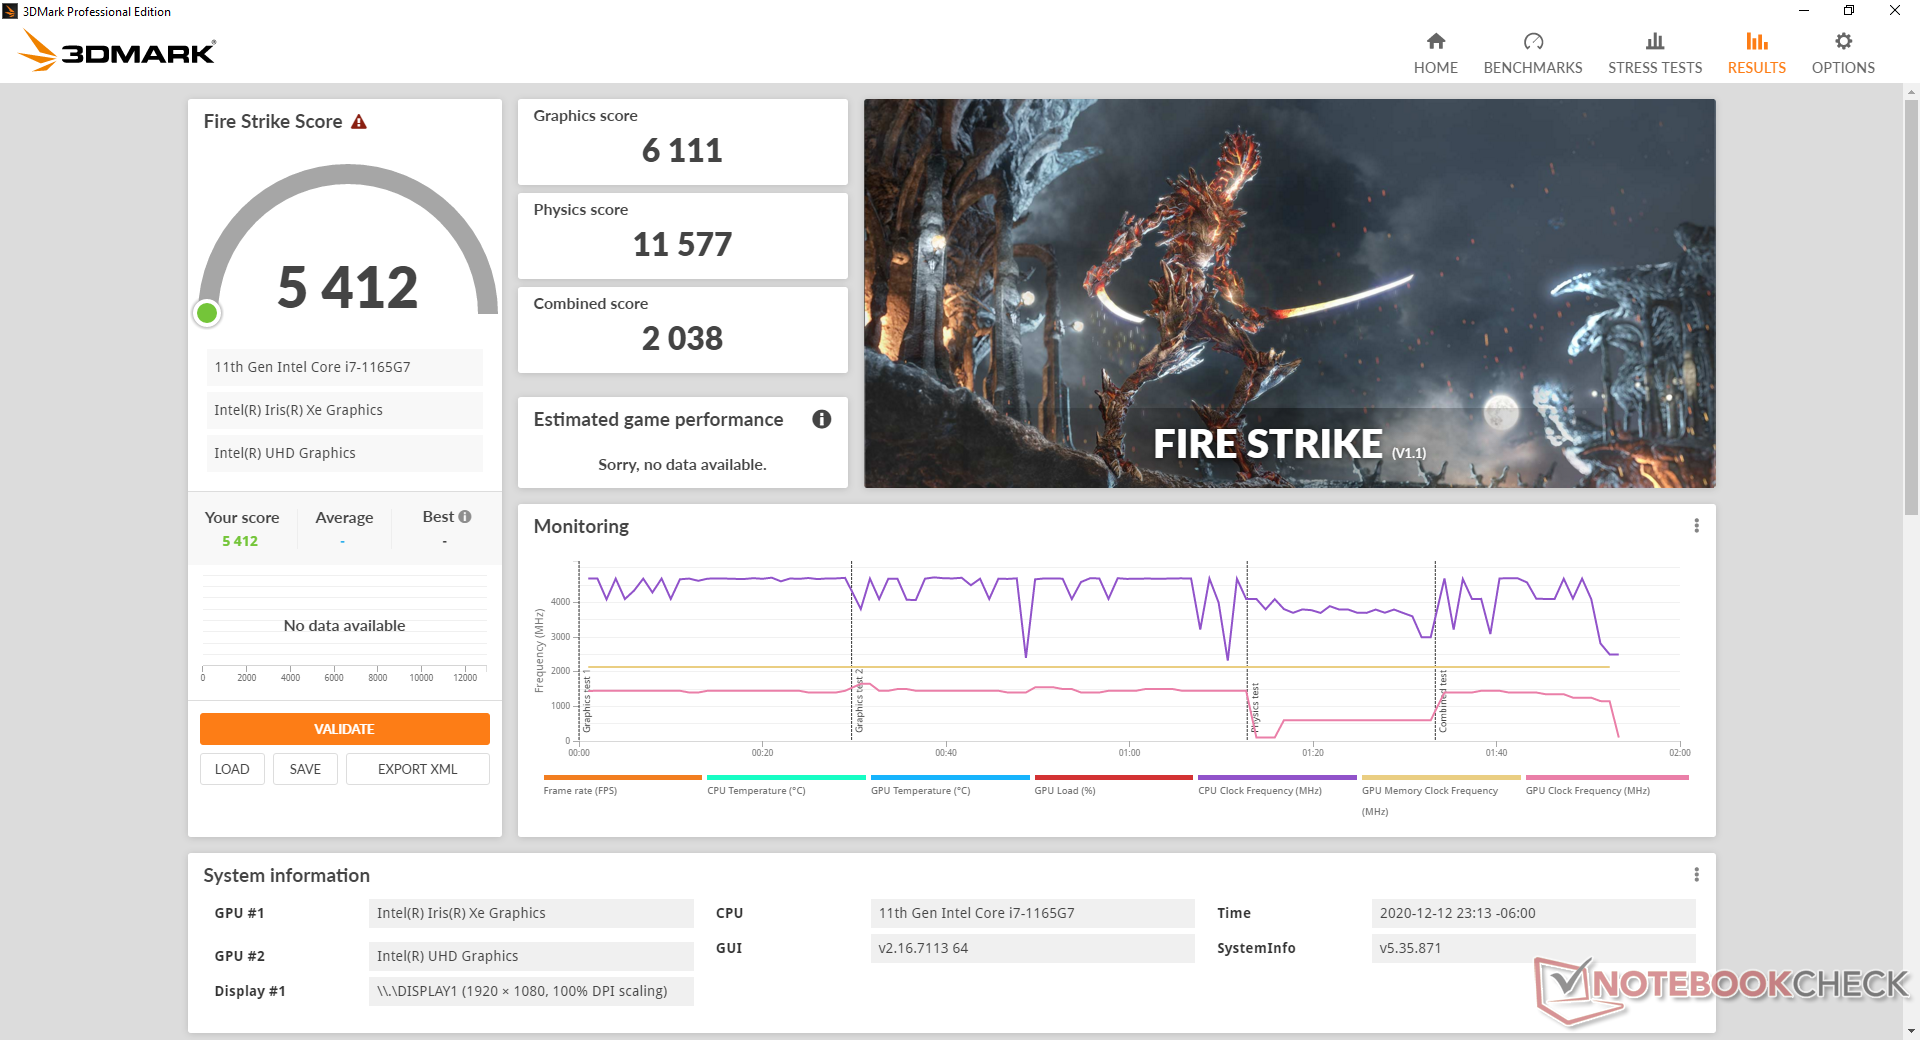
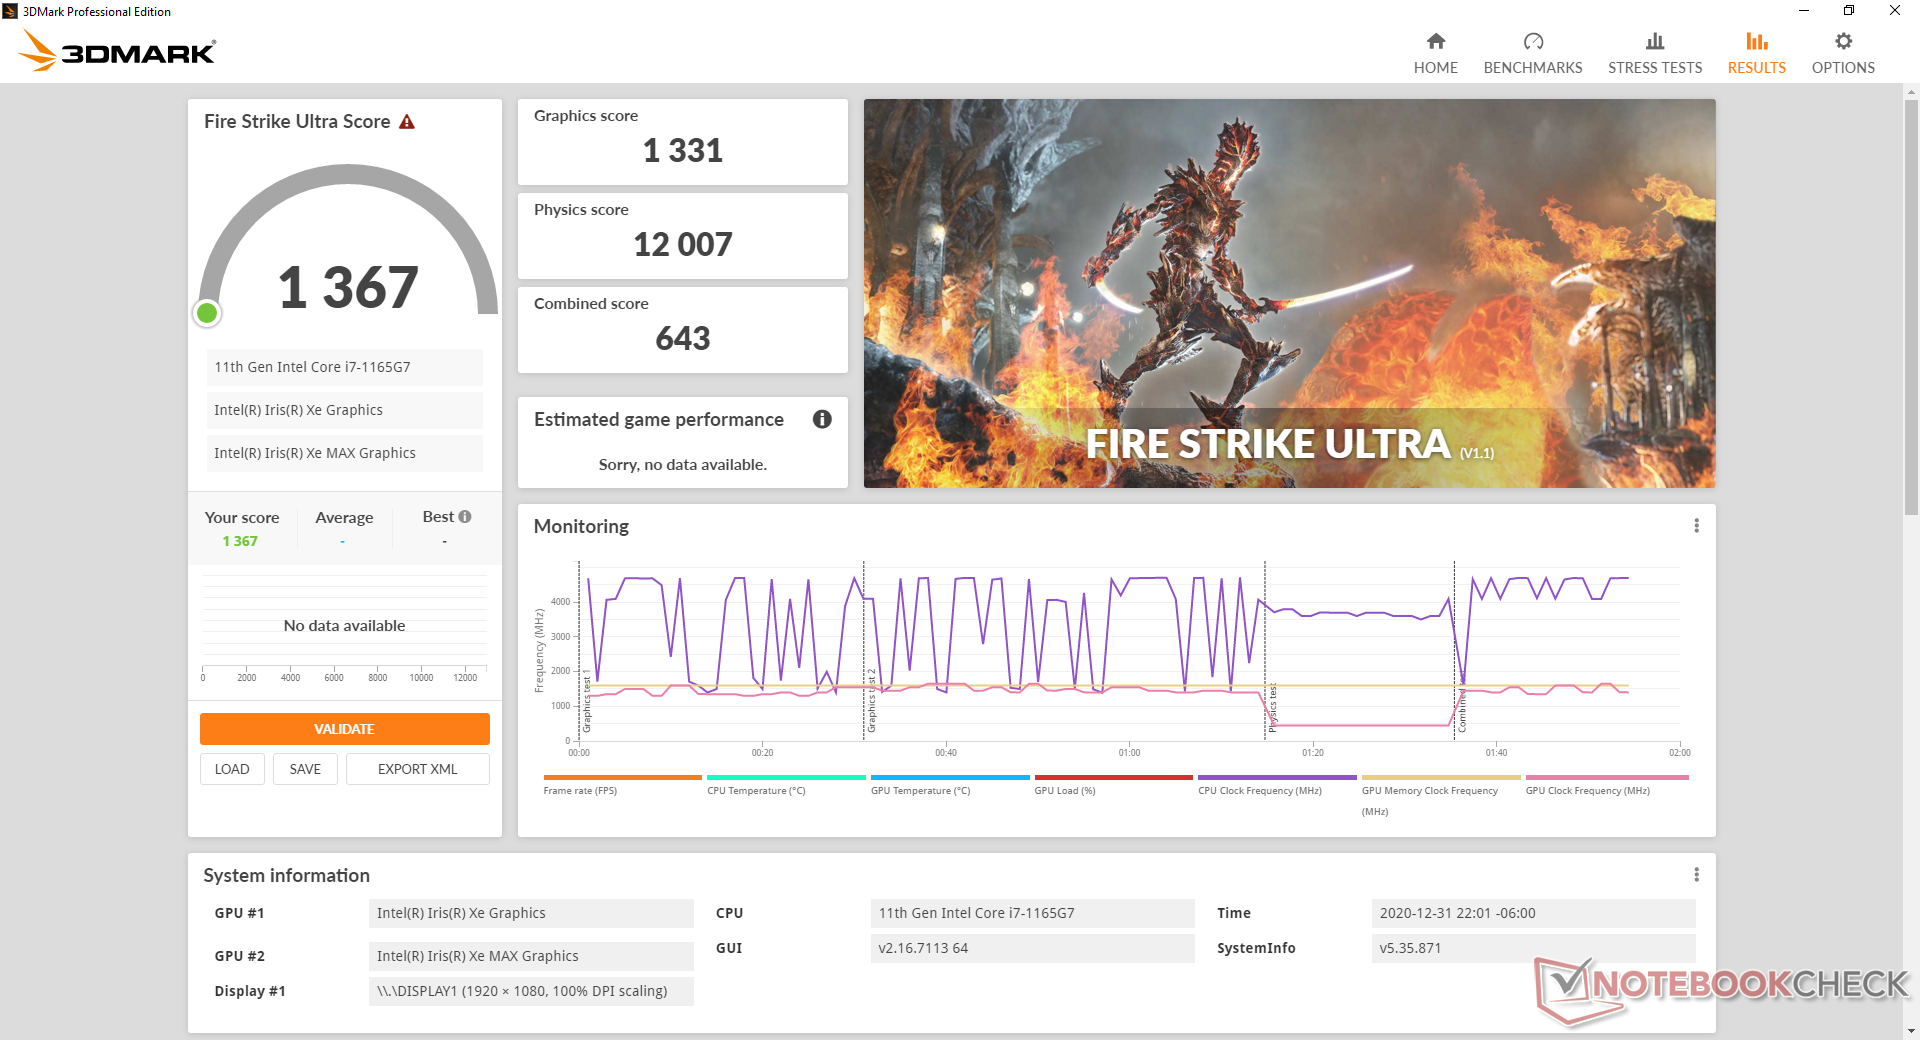
O desempenho gráfico bruto é cerca de 10 a 15% mais rápido do que o do Iris Xe 96 EU ou 60 a 70% mais rápido do que o do GeForce MX330 de acordo com 3DMark benchmarks. A Intel diz que a GPU não foi projetada para jogos e os benchmarks provam isso com taxas de quadros que podem ser até 50% mais lentas que o GeForce MX350 em títulos populares como GTA V ou DOTA 2. Mesmo em jogos onde a Intel sai na frente, as taxas de quadros instáveis e a falta de sincronia adaptativa afetam a experiência geral. O Iris Xe Max parece mais um Iris Xe integrado com overclocking do que uma GPU própria e discreta, pelo menos do ponto de vista dos jogos.
| 3DMark 06 Standard Score | 22466 pontos | |
| 3DMark 11 Performance | 7720 pontos | |
| 3DMark Cloud Gate Standard Score | 19254 pontos | |
| 3DMark Fire Strike Score | 5412 pontos | |
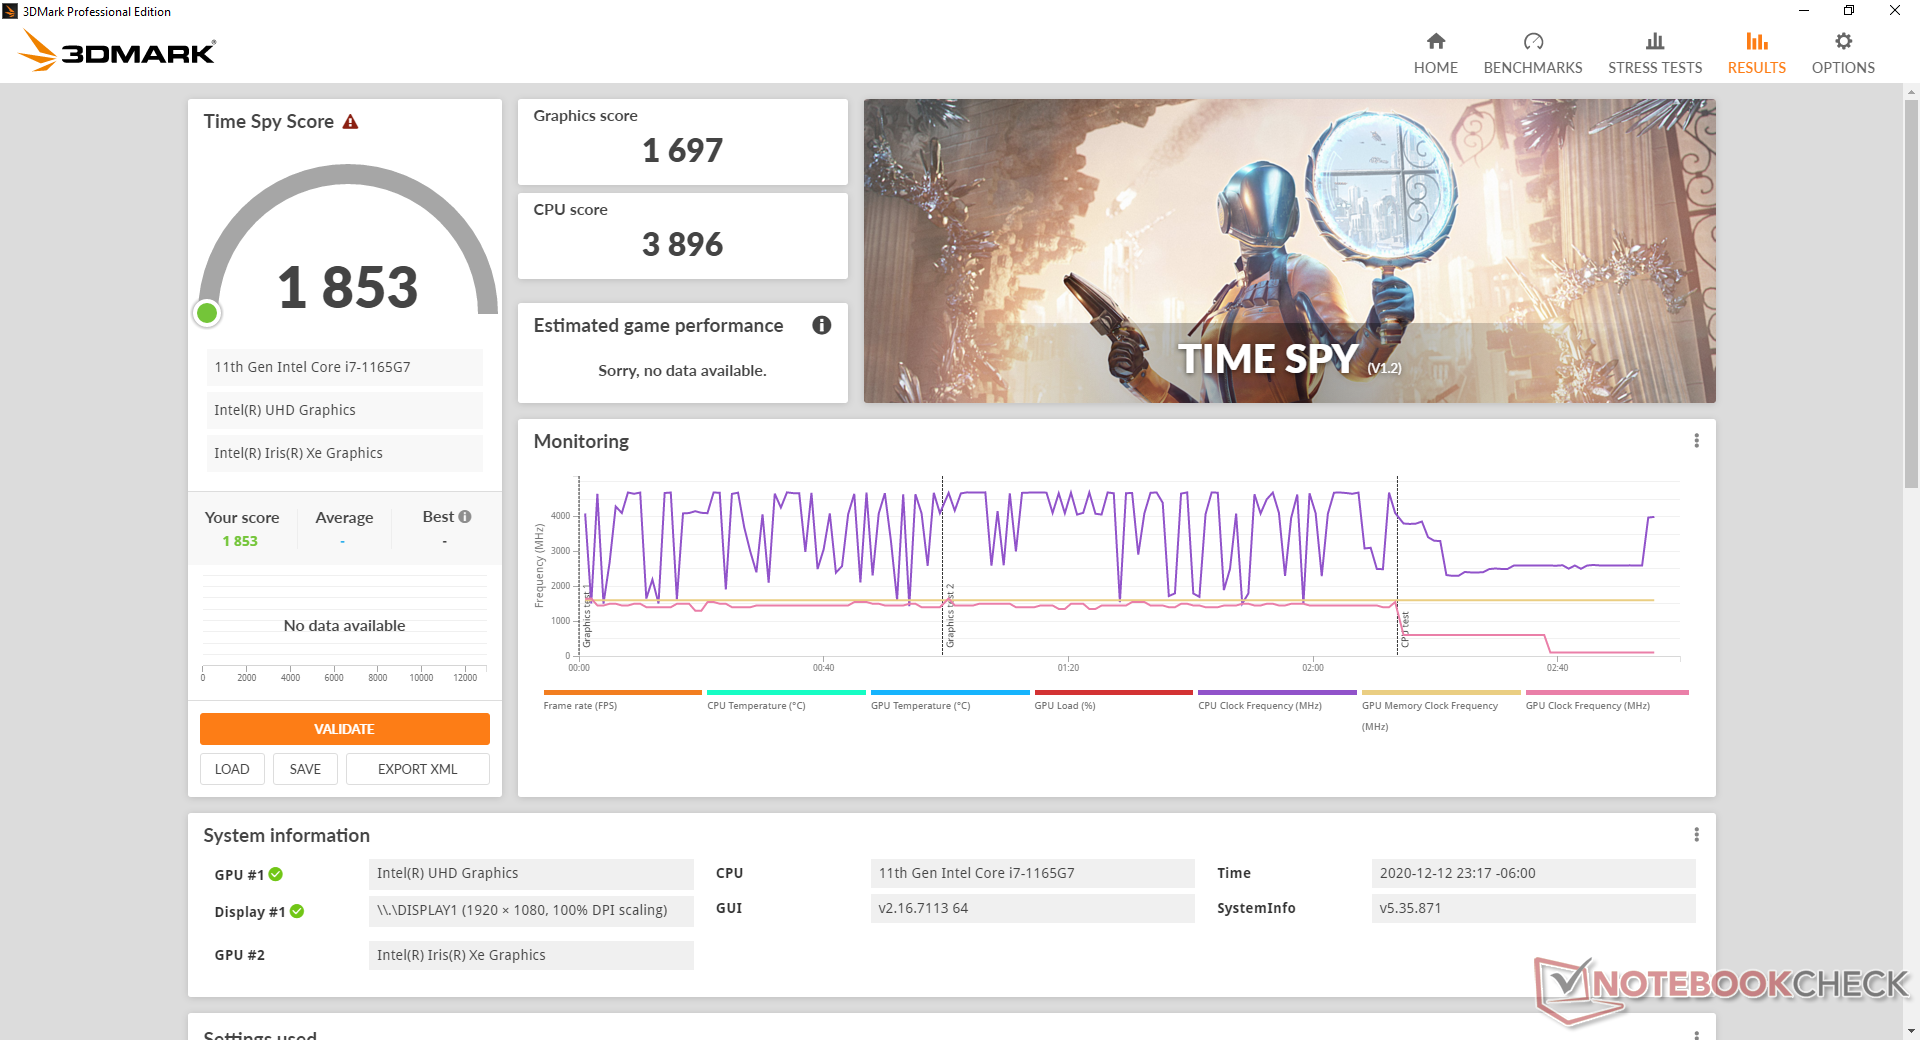
| 3DMark Time Spy Score | 1853 pontos | |
Ajuda | ||
| baixo | média | alto | ultra | QHD | 4K | |
|---|---|---|---|---|---|---|
| GTA V (2015) | 65.9 | 60.7 | 24 | |||
| The Witcher 3 (2015) | 54.2 | 53.7 | 33.8 | 17.7 | 11.2 | |
| Dota 2 Reborn (2015) | 59.1 | 40.3 | 38.3 | 38.4 | 20.1 | |
| Final Fantasy XV Benchmark (2018) | 46.1 | 24.2 | 17 | |||
| X-Plane 11.11 (2018) | 33.4 | 34.4 | 29.7 | |||
| Strange Brigade (2018) | 87.4 | 39.1 | 33 | 28.5 | 20.1 | 11 |
Emissions
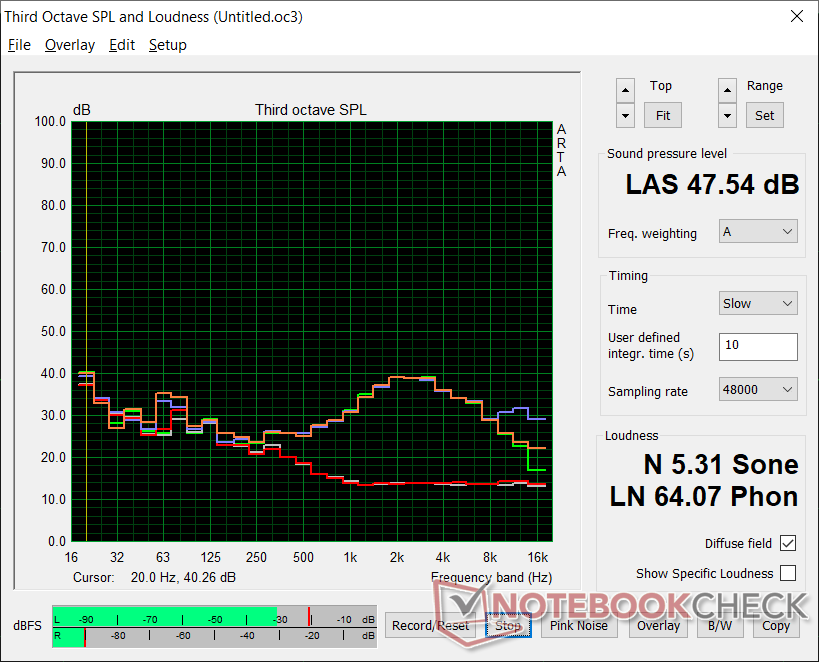
Ruído do sistema
Como a Silver Edition, o ventilador da Black Edition é quase sempre silencioso ou silencioso durante cargas baixas como navegação ou transmissão de vídeo. O barulho do ventilador normalmente seria de apenas 30,3 dB(A) ou 32,8 dB(A) contra um fundo silencioso de 27,3 dB(A) quando sob tais cenários
Se as cargas forem maiores, a Black Edition se tornará mais barulhenta mais rapidamente do que a Silver Edition. Executando a primeira cena de referência de 90 segundos no 3DMark 06, por exemplo, induziria um ruído do ventilador de 47,4 dB(A) enquanto a Edição Prateada permaneceria silenciosa. O ruído máximo dos ventiladores é o mesmo entre os dois laptops; basta um pouco mais de tempo para que a Silver Edition chegue a esse ponto
| Dell Inspiron 15 7000 7506 2-in-1 Black Edition Xe MAX, i7-1165G7, Micron 2300 1TB MTFDHBA1T0TDV | Samsung Galaxy Book Flex 15-NP950 GeForce MX250, i7-1065G7, Samsung SSD PM981a MZVLB512HBJQ | HP Envy x360 15-ee0257ng Vega 6, R5 4500U, Intel SSD 660p SSDPEKNW512G8 | Microsoft Surface Book 3 15 GeForce GTX 1660 Ti Max-Q, i7-1065G7, SK hynix BC501 HFM256GDGTNG | Asus ZenBook Flip 15 UX563FD-A1027T GeForce GTX 1050 Max-Q, i7-10510U, Samsung SSD PM981 MZVLB1T0HALR | Lenovo Yoga C740-15IML UHD Graphics 620, i7-10510U, Samsung SSD PM981 MZVLB512HAJQ | Dell Inspiron 15 7506 2-in-1 P97F Iris Xe G7 80EUs, i5-1135G7, Toshiba KBG40ZNS256G NVMe | |
|---|---|---|---|---|---|---|---|
| Noise | 13% | 4% | 3% | 3% | 6% | 9% | |
| desligado / ambiente * (dB) | 27.3 | 24.9 9% | 27 1% | 30.2 -11% | 30.3 -11% | 29.3 -7% | 27.1 1% |
| Idle Minimum * (dB) | 27.3 | 24.9 9% | 27 1% | 30.2 -11% | 30.3 -11% | 29.3 -7% | 27.1 1% |
| Idle Average * (dB) | 27.3 | 24.9 9% | 27 1% | 30.2 -11% | 30.3 -11% | 29.3 -7% | 27.1 1% |
| Idle Maximum * (dB) | 27.3 | 24.9 9% | 27 1% | 30.2 -11% | 30.3 -11% | 29.6 -8% | 27.1 1% |
| Load Average * (dB) | 47.4 | 38.4 19% | 43.2 9% | 30.9 35% | 33.7 29% | 32.4 32% | 31.5 34% |
| Witcher 3 ultra * (dB) | 47.4 | 38.4 19% | 45.1 5% | 37.4 21% | 37.4 21% | ||
| Load Maximum * (dB) | 47.5 | 38.5 19% | 43.2 9% | 34.3 28% | 38.9 18% | 33.3 30% | 47.2 1% |
* ... menor é melhor
Barulho
| Ocioso |
| 27.3 / 27.3 / 27.3 dB |
| Carga |
| 47.4 / 47.5 dB |
 | ||
30 dB silencioso 40 dB(A) audível 50 dB(A) ruidosamente alto |
||
min: | ||
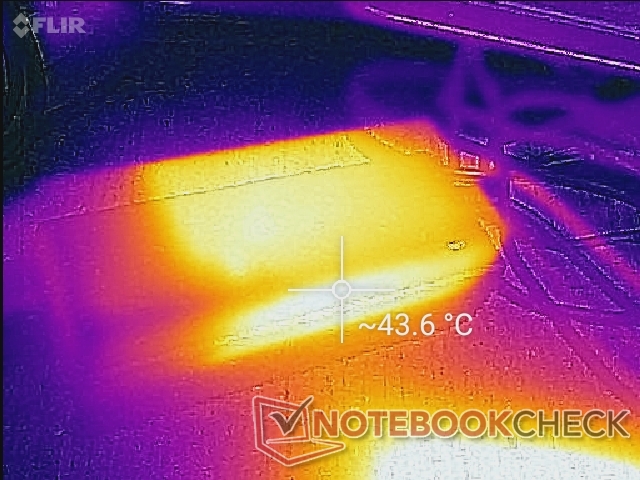
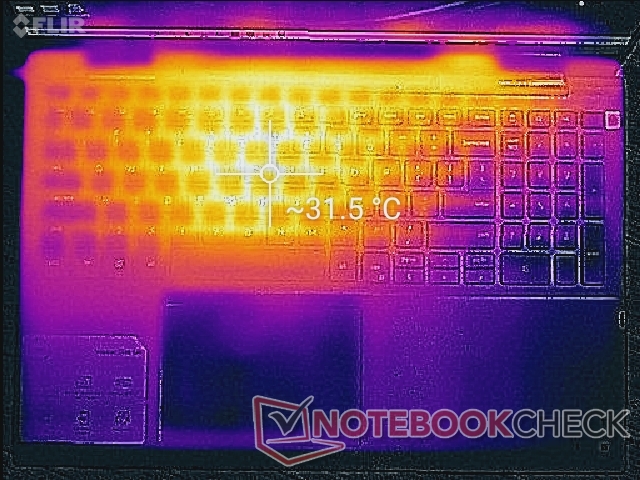
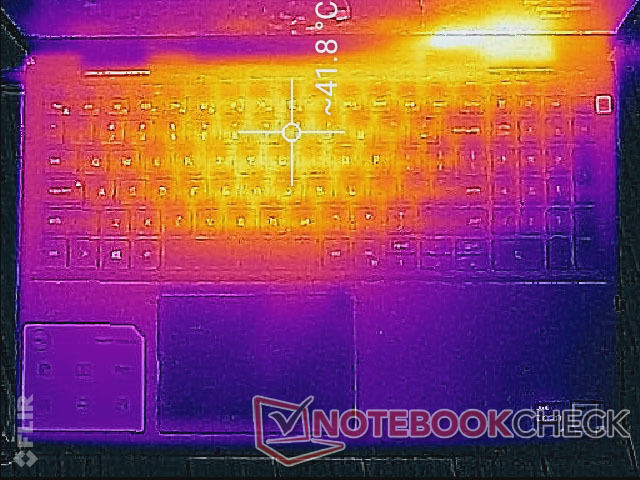
Temperatura
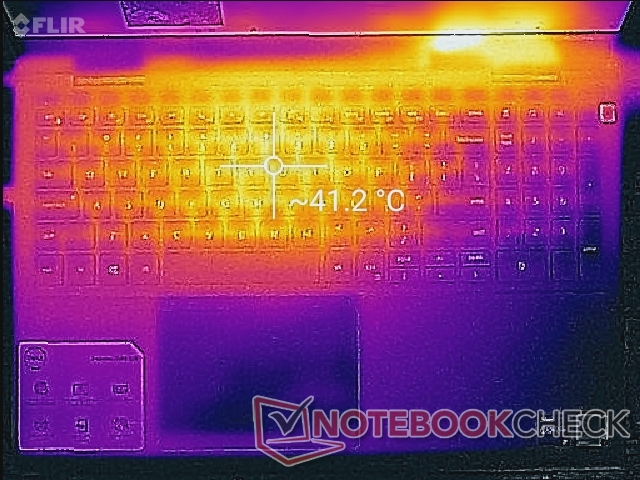
As temperaturas de superfície quando sob carga podem ser mais quentes que na Inspiron 15 7506 2 em 1 Silver Edition. O ponto quente do teclado, por exemplo, atinge quase 42 C ao rodar Prime95 e FurMark em comparação com apenas 35 C no Inspiron 15 7506 2 em 1 normal. A presença de uma GPU discreta é definitivamente parte da equação.
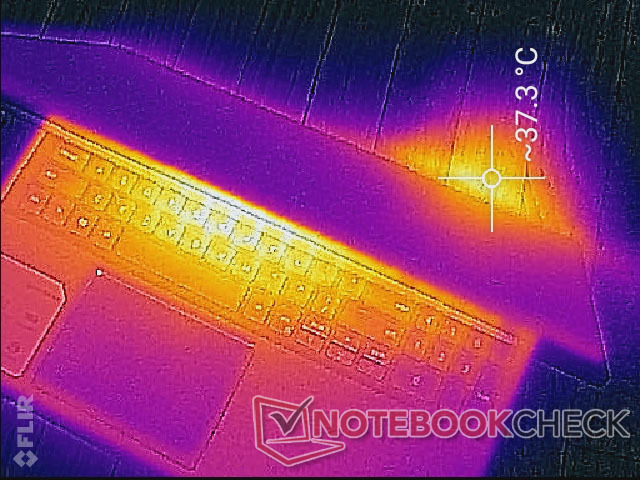
(±) A temperatura máxima no lado superior é 43 °C / 109 F, em comparação com a média de 36.8 °C / 98 F , variando de 21 a 71 °C para a classe Multimedia.
(-) A parte inferior aquece até um máximo de 48.8 °C / 120 F, em comparação com a média de 39.1 °C / 102 F
(+) Em uso inativo, a temperatura média para o lado superior é 25.6 °C / 78 F, em comparação com a média do dispositivo de 31.3 °C / ### class_avg_f### F.
(±) Jogando The Witcher 3, a temperatura média para o lado superior é 32.4 °C / 90 F, em comparação com a média do dispositivo de 31.3 °C / ## #class_avg_f### F.
(+) Os apoios para as mãos e o touchpad são mais frios que a temperatura da pele, com um máximo de 29.2 °C / 84.6 F e, portanto, são frios ao toque.
(±) A temperatura média da área do apoio para as mãos de dispositivos semelhantes foi 28.7 °C / 83.7 F (-0.5 °C / -0.9 F).


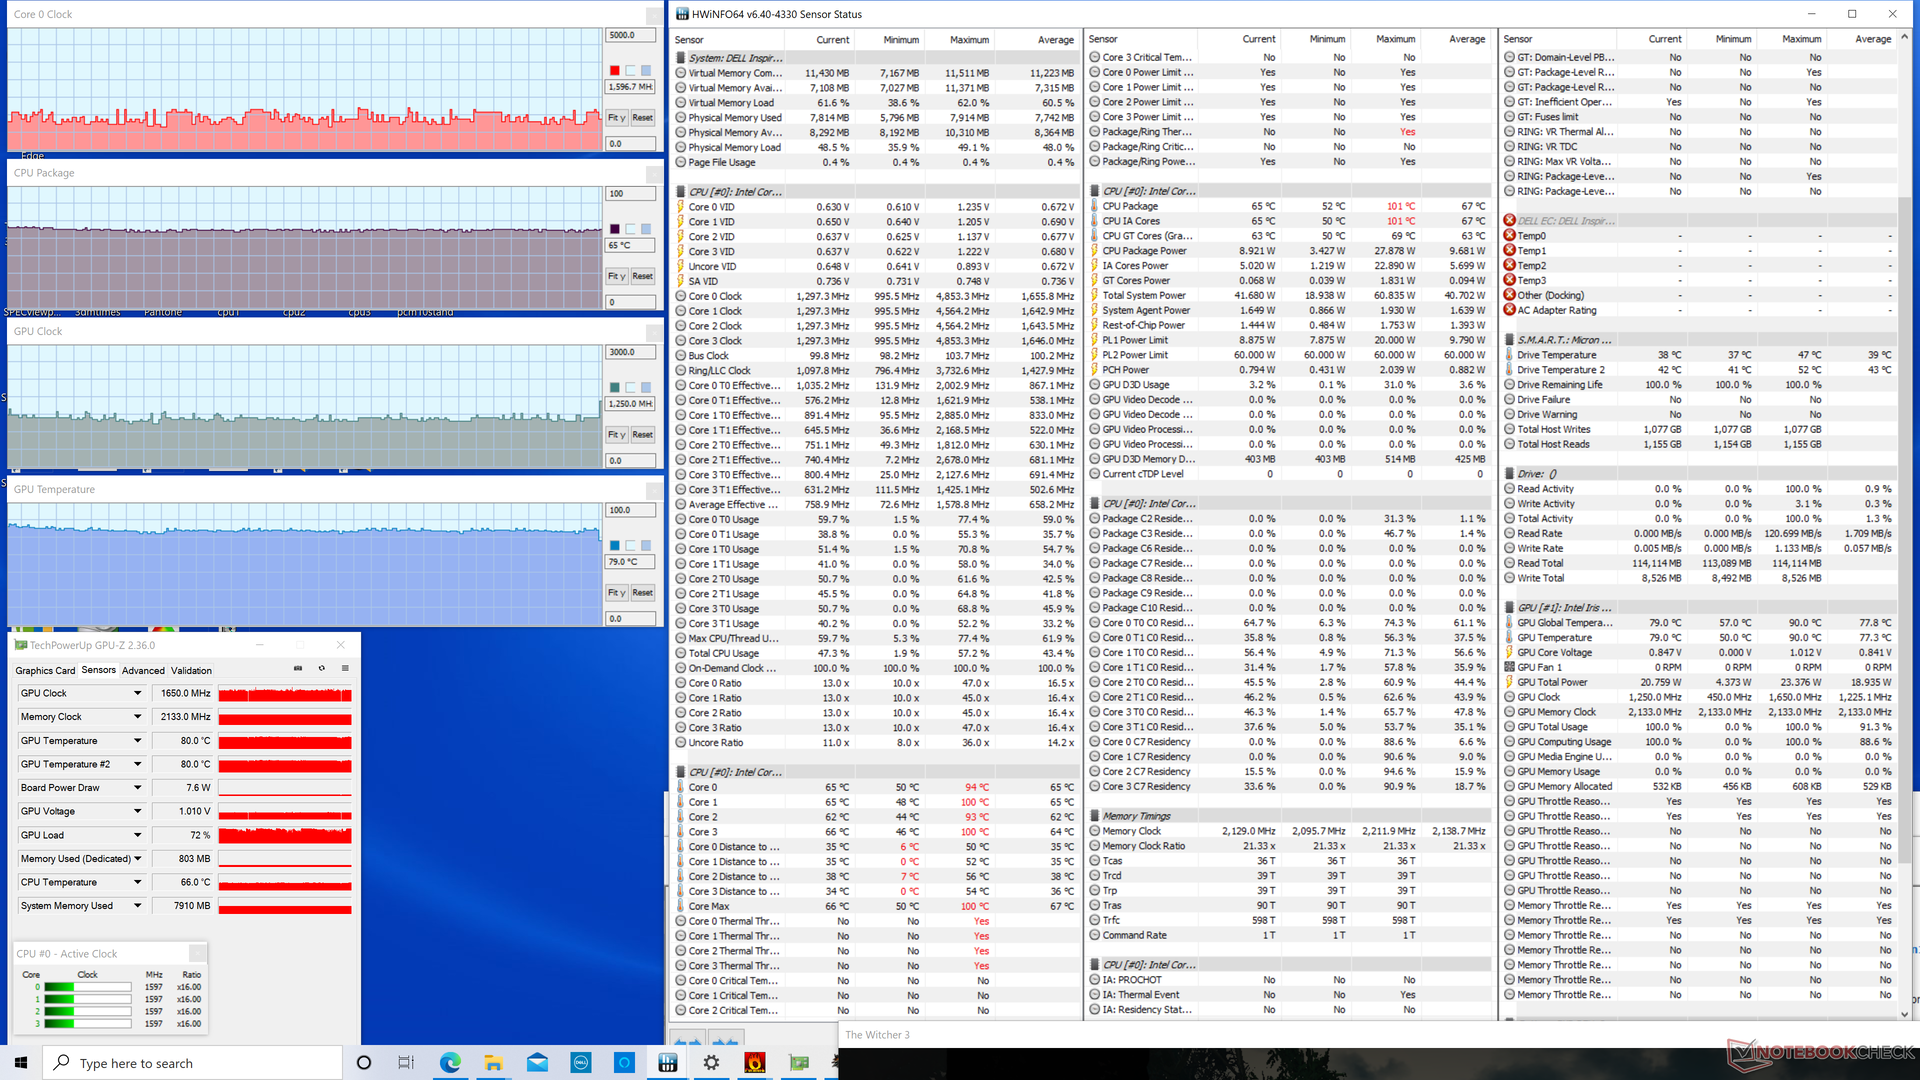
Teste de estresse
Ao rodar Prime95, as taxas de relógio da CPU aumentariam para 3,4 GHz durante os primeiros segundos e a uma temperatura central de 100 C. Entretanto, isto cai muito rapidamente para a faixa de 2,5 a 3,0 GHz para uma temperatura central ligeiramente mais fria de 93 C a 96 C. Estas taxas de relógio sustentadas são ainda mais baixas do que as que registramos na Edição Silver, que se estabiliza em torno de 3,0 a 3,2 GHz quando sujeita a condições semelhantes.
O funcionamento com energia de bateria limitará o desempenho da CPU. Um 3DMark 11 rodando com baterias retornaria pontuações de Física e Gráficos de 6483 e 7784 pontos, respectivamente, em comparação com 9885 e 7804 pontos quando em rede elétrica.
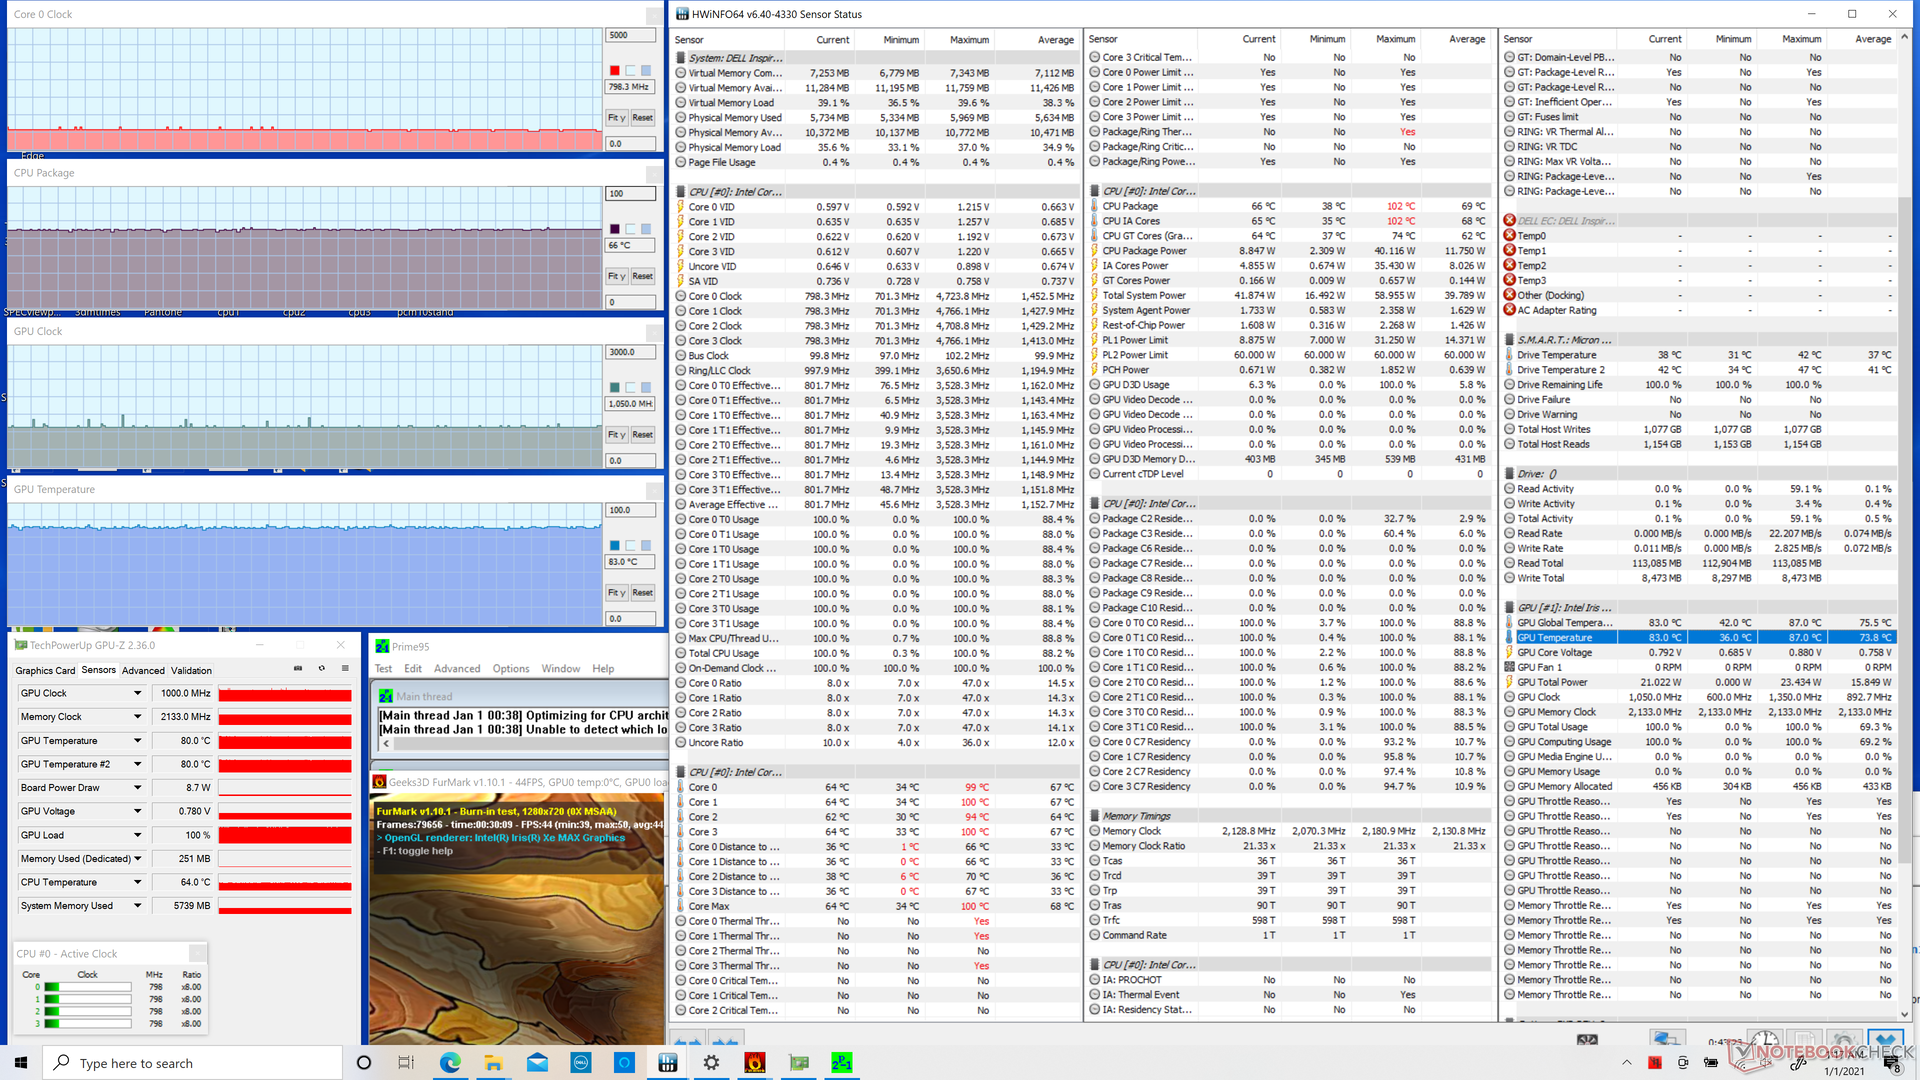
| RelógioCPU (GHz) | RelógioGPU (MHz) | Temperaturamédiada CPU (°C) | Temperaturamédiada GPU (°C) | |
| System Idle | -- | --49 | 47 | |
| Prime95 Stress | 2.5 - 3.0 | -- | 94 | 63 |
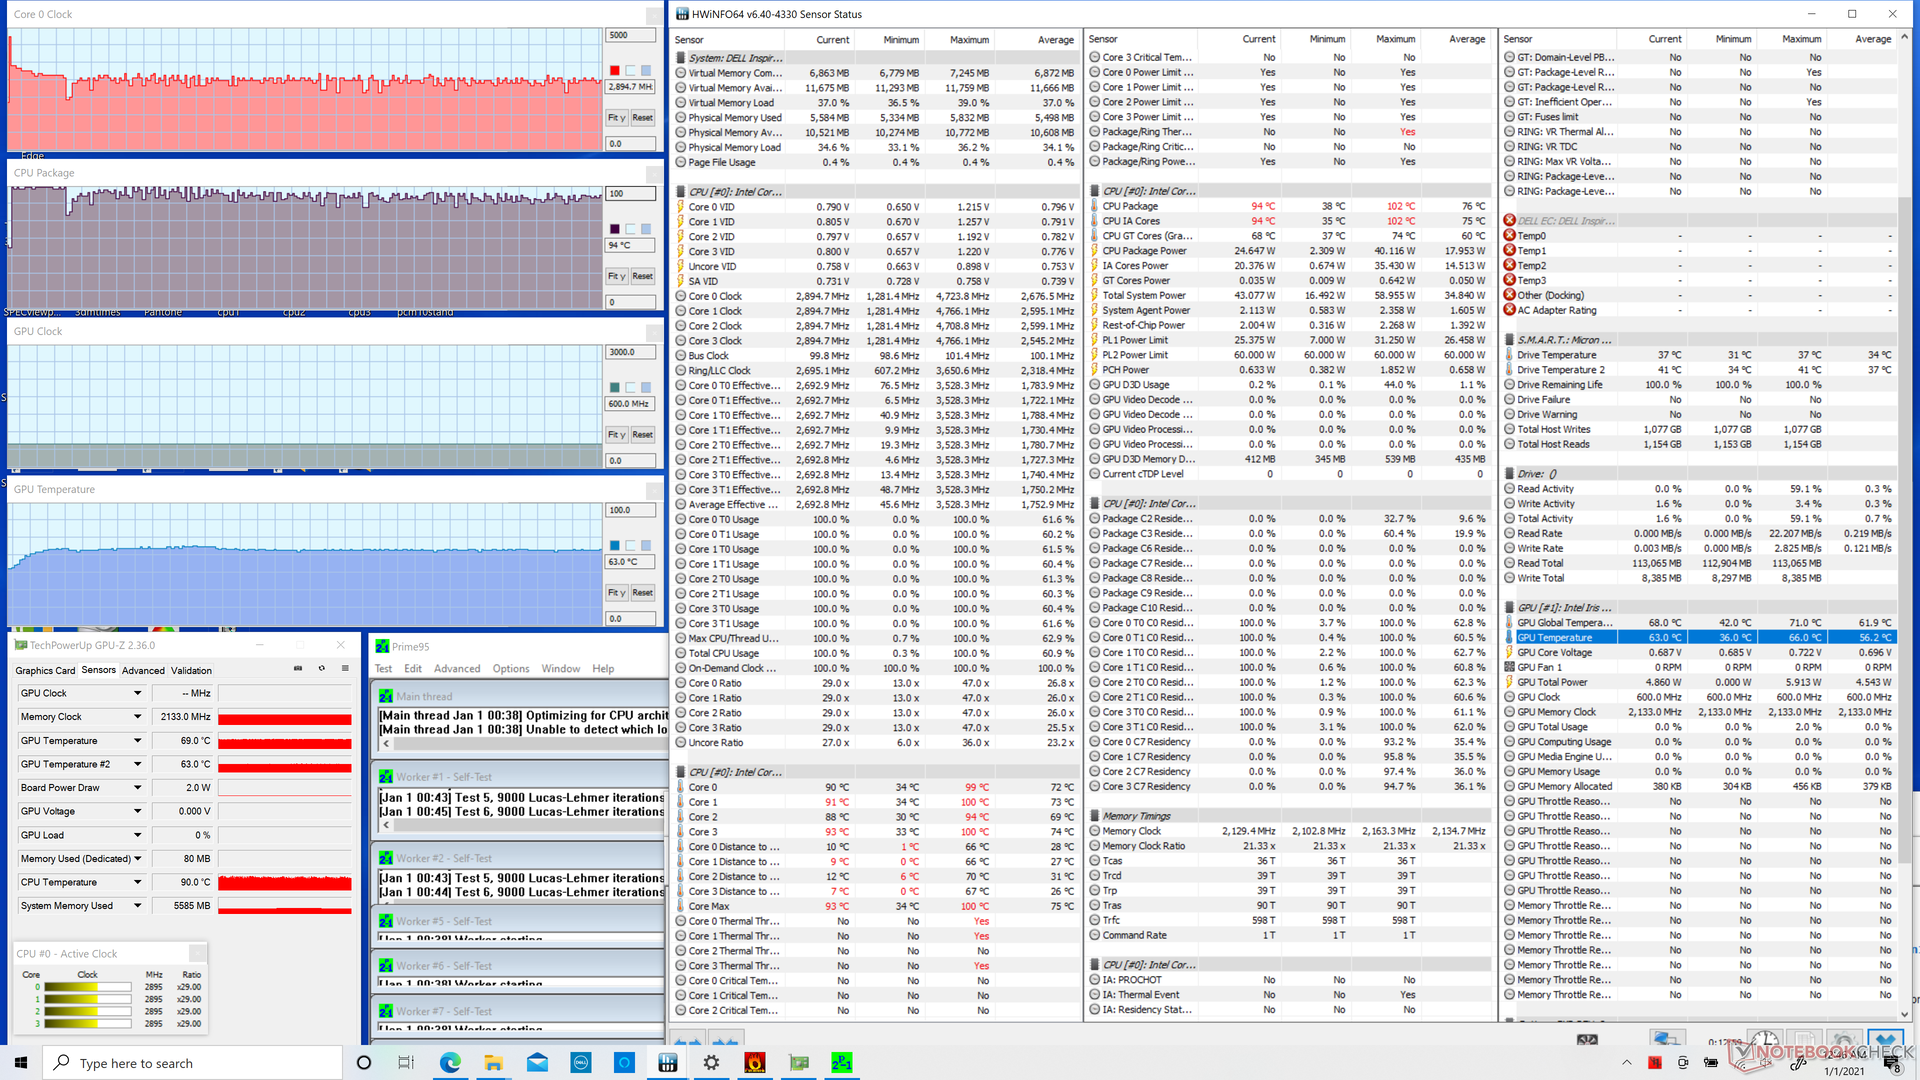
| Prime95 + FurMark Stress | 0.8 - 0.9 | 1050 | 66 | 83 |
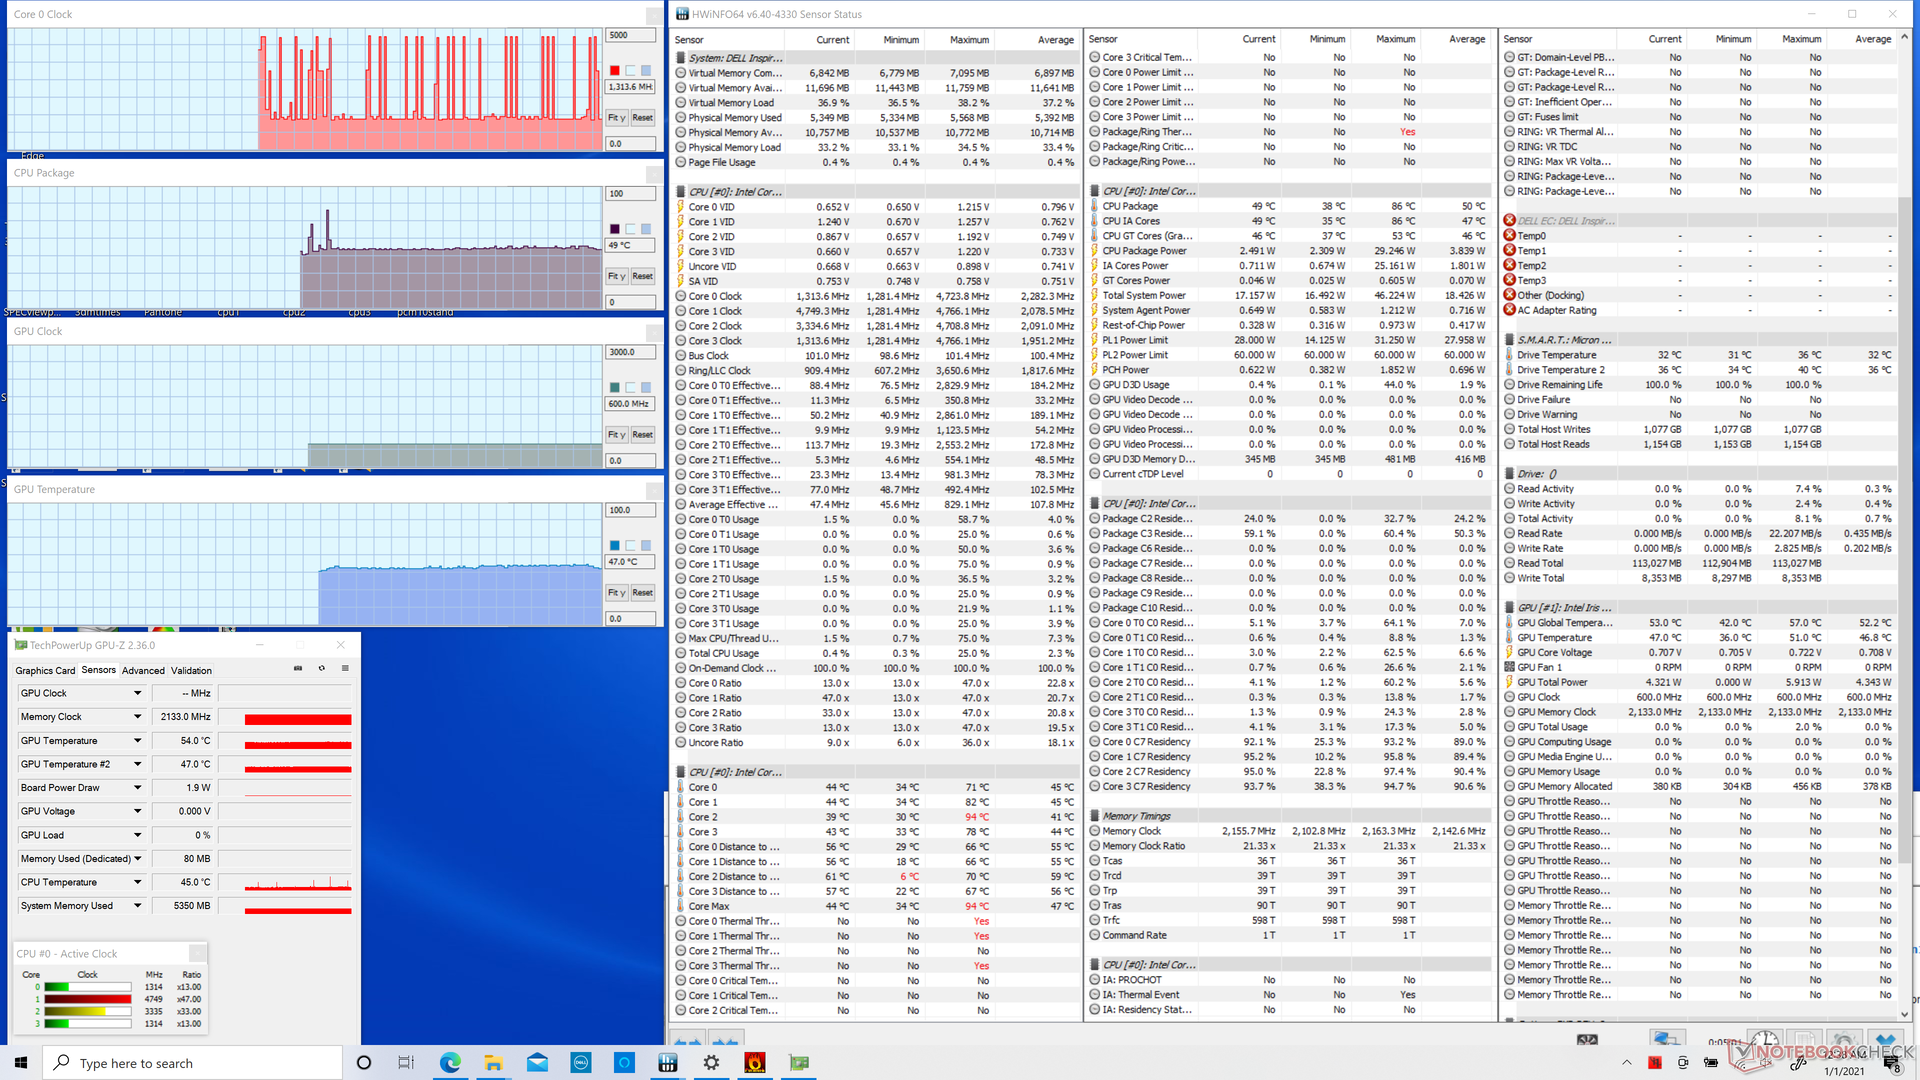
| Witcher 3 Stress | ~1.6 | 1250 | 65 | 79 |
Oradores


Dell Inspiron 15 7000 7506 2-in-1 Black Edition análise de áudio
(±) | o volume do alto-falante é médio, mas bom (###valor### dB)
Graves 100 - 315Hz
(-) | quase nenhum baixo - em média 22.7% menor que a mediana
(±) | a linearidade dos graves é média (11% delta para a frequência anterior)
Médios 400 - 2.000 Hz
(±) | médios mais altos - em média 8.4% maior que a mediana
(±) | a linearidade dos médios é média (8.6% delta para frequência anterior)
Altos 2 - 16 kHz
(+) | agudos equilibrados - apenas 3.4% longe da mediana
(+) | os máximos são lineares (6.2% delta da frequência anterior)
Geral 100 - 16.000 Hz
(±) | a linearidade do som geral é média (21.2% diferença em relação à mediana)
Comparado com a mesma classe
» 73% de todos os dispositivos testados nesta classe foram melhores, 7% semelhantes, 20% piores
» O melhor teve um delta de 5%, a média foi 17%, o pior foi 45%
Comparado com todos os dispositivos testados
» 59% de todos os dispositivos testados foram melhores, 7% semelhantes, 34% piores
» O melhor teve um delta de 4%, a média foi 23%, o pior foi 134%
Apple MacBook 12 (Early 2016) 1.1 GHz análise de áudio
(+) | os alto-falantes podem tocar relativamente alto (###valor### dB)
Graves 100 - 315Hz
(±) | graves reduzidos - em média 11.3% menor que a mediana
(±) | a linearidade dos graves é média (14.2% delta para a frequência anterior)
Médios 400 - 2.000 Hz
(+) | médios equilibrados - apenas 2.4% longe da mediana
(+) | médios são lineares (5.5% delta para frequência anterior)
Altos 2 - 16 kHz
(+) | agudos equilibrados - apenas 2% longe da mediana
(+) | os máximos são lineares (4.5% delta da frequência anterior)
Geral 100 - 16.000 Hz
(+) | o som geral é linear (10.2% diferença em relação à mediana)
Comparado com a mesma classe
» 7% de todos os dispositivos testados nesta classe foram melhores, 2% semelhantes, 90% piores
» O melhor teve um delta de 5%, a média foi 18%, o pior foi 53%
Comparado com todos os dispositivos testados
» 5% de todos os dispositivos testados foram melhores, 1% semelhantes, 94% piores
» O melhor teve um delta de 4%, a média foi 23%, o pior foi 134%
Energy Management
Consumo de energia
Sem surpresas, a Black Edition será mais exigente que a opção base Silver Edition sem GPU discreta. Simplesmente ocioso na área de trabalho pode chegar a 16 W na Edição Preta em comparação com apenas 9 W na Edição Prateada menor. A execução de cargas maiores como 3DMark 06 ou jogos pode resultar em um consumo de energia até 70% maior do que a Silver Edition. É claro que os proprietários da Black Edition podem desfrutar de um desempenho gráfico bruto 60 a 90% mais rápido do que os proprietários do modelo base Silver Edition
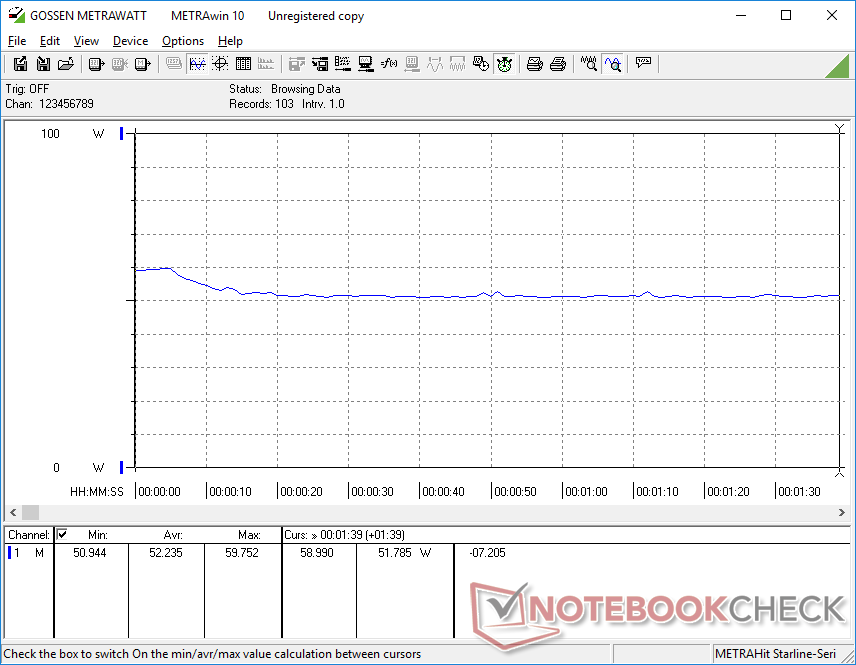
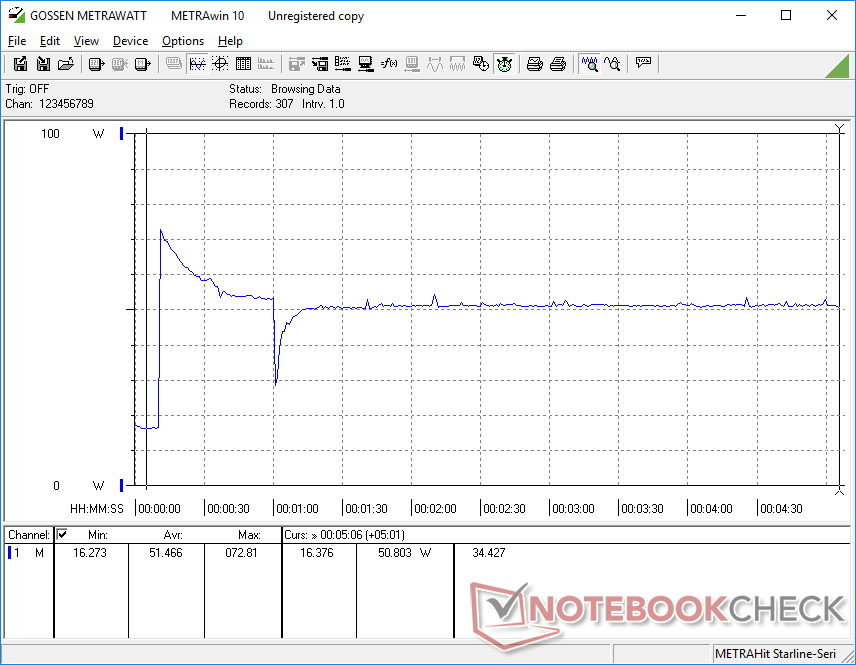
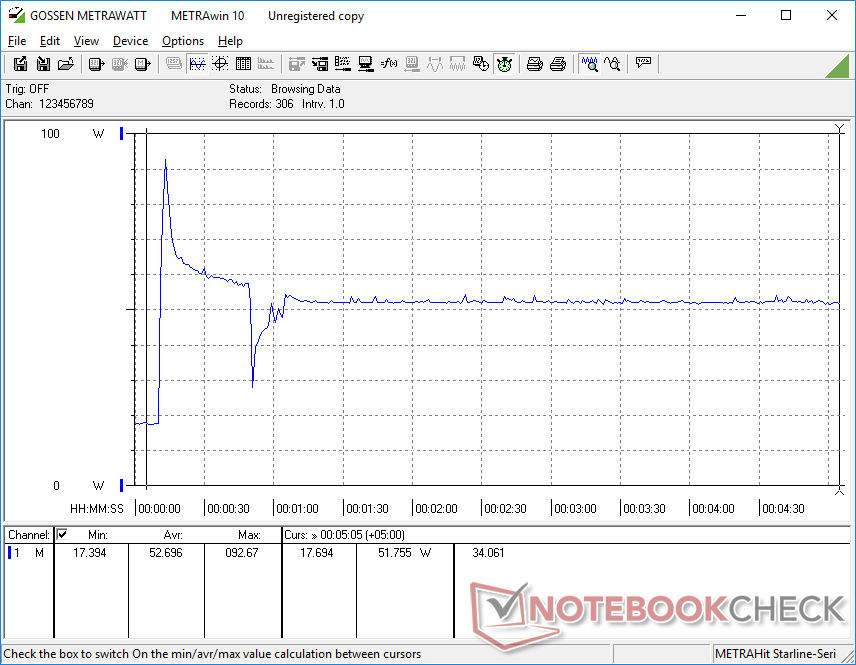
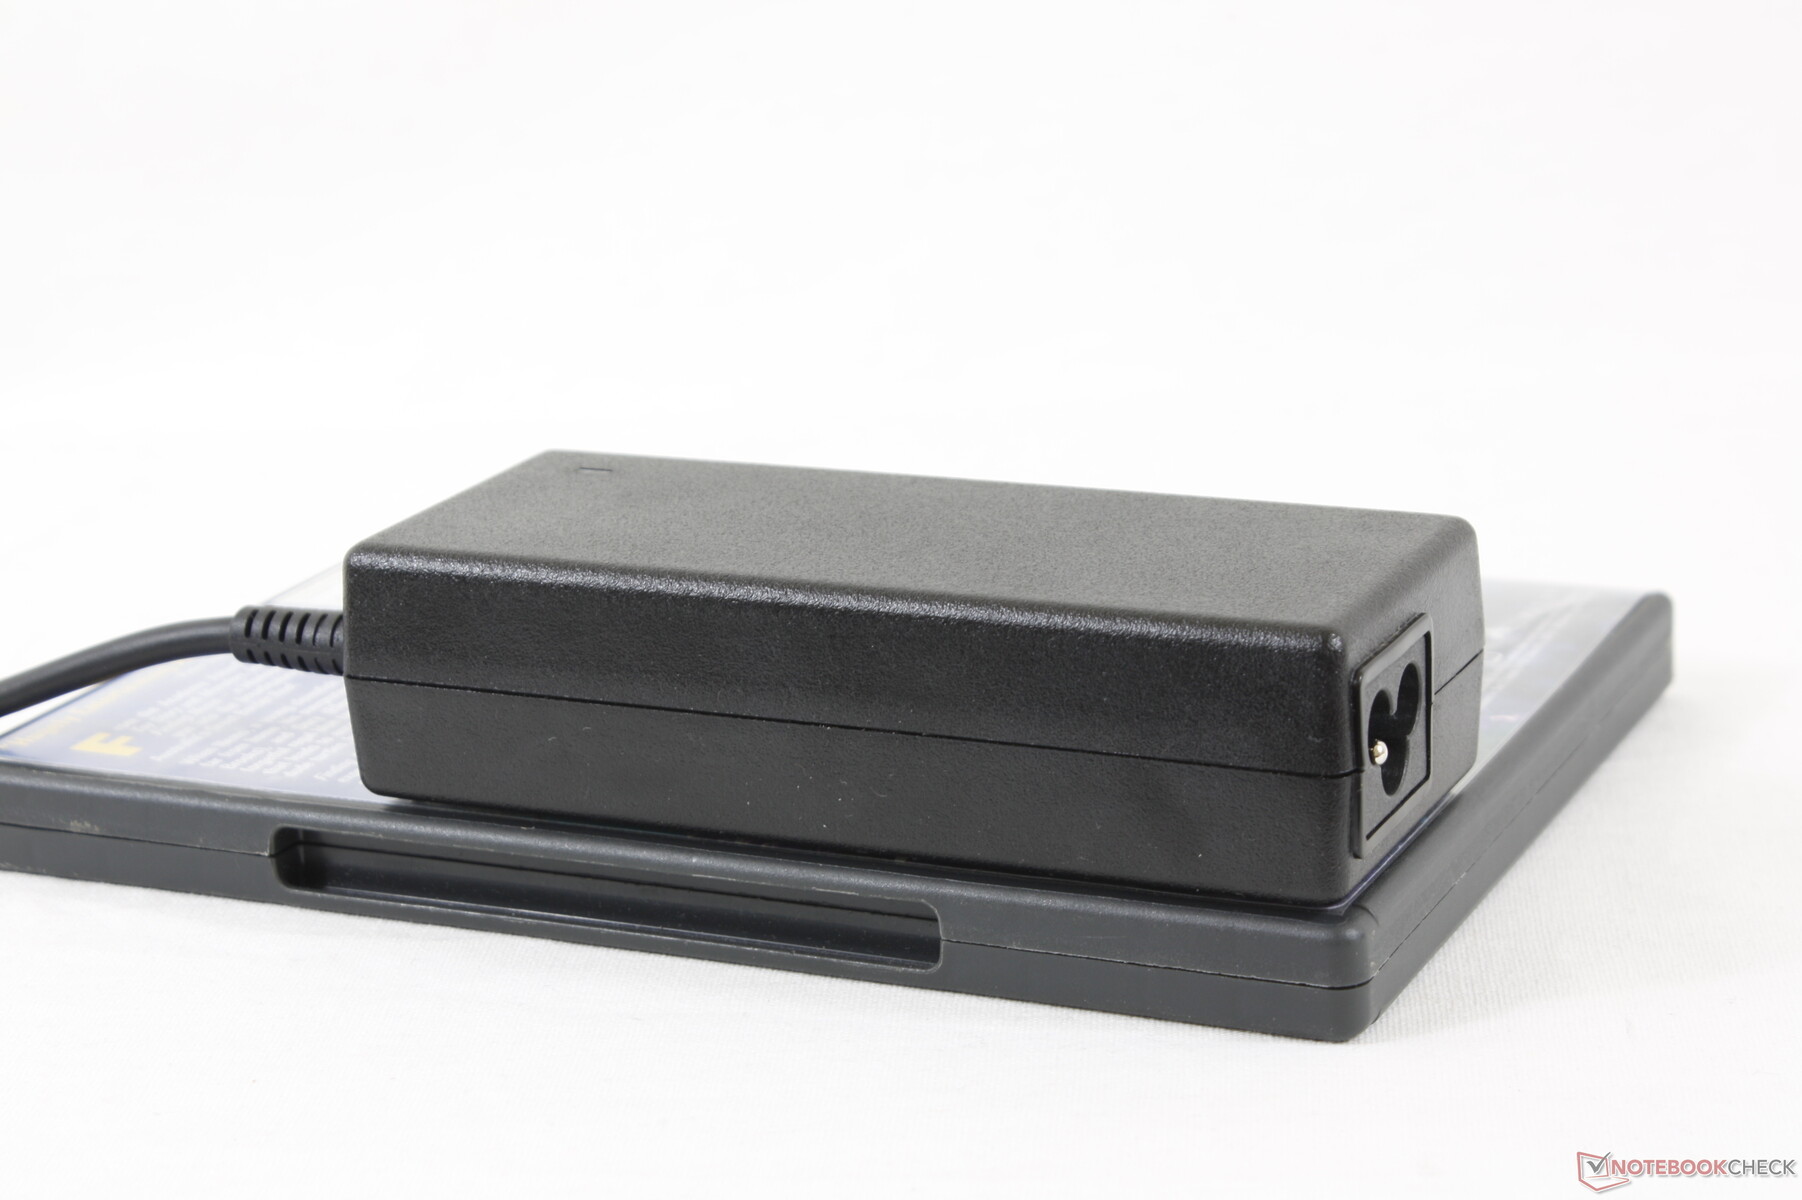
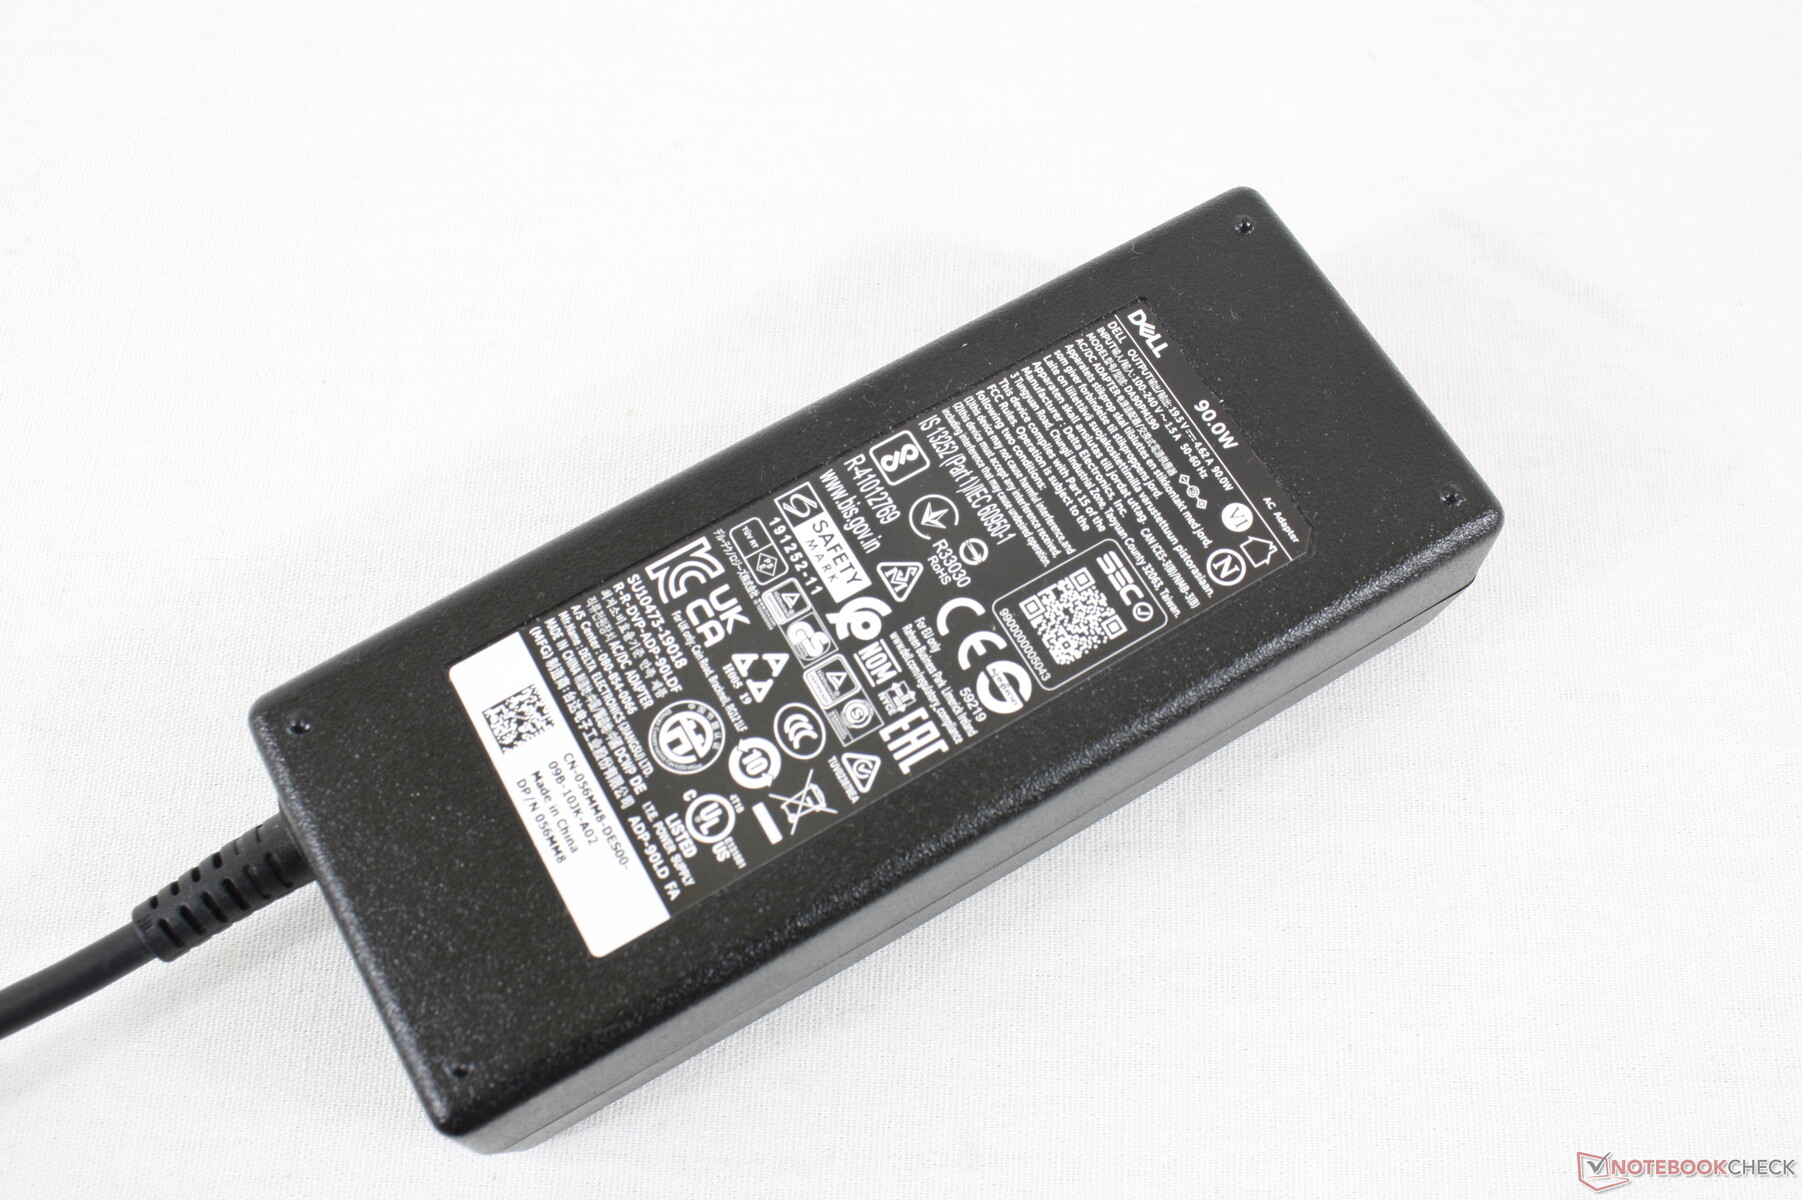
A Black Edition vem com um adaptador de 90 W AC ligeiramente maior (~12,5 x 5 x 3,2 cm) em comparação com o adaptador de 65 W da Silver Edition. Somos capazes de medir um consumo máximo de 92,7 W ao executar cargas extremas, mas esta taxa é apenas temporária, como mostram os gráficos abaixo, devido a limitações térmicas. O comportamento reflete nossas observações de taxa de clock mencionadas acima em nossa seção Teste de Estresse.

| desligado | |
| Ocioso | |
| Carga |
|
Key:
min: | |
| Dell Inspiron 15 7000 7506 2-in-1 Black Edition i7-1165G7, Xe MAX, Micron 2300 1TB MTFDHBA1T0TDV, IPS, 3840x2160, 15.6" | Samsung Galaxy Book Flex 15-NP950 i7-1065G7, GeForce MX250, Samsung SSD PM981a MZVLB512HBJQ, IPS, QLED, 1920x1080, 15.6" | HP Envy x360 15-ee0257ng R5 4500U, Vega 6, Intel SSD 660p SSDPEKNW512G8, IPS, 1920x1080, 15.6" | Microsoft Surface Book 3 15 i7-1065G7, GeForce GTX 1660 Ti Max-Q, SK hynix BC501 HFM256GDGTNG, IPS, 3240x2160, 15" | Asus ZenBook Flip 15 UX563FD-A1027T i7-10510U, GeForce GTX 1050 Max-Q, Samsung SSD PM981 MZVLB1T0HALR, IPS, 3840x2160, 15.6" | Lenovo Yoga C740-15IML i7-10510U, UHD Graphics 620, Samsung SSD PM981 MZVLB512HAJQ, IPS LED, 1920x1080, 15.6" | Dell Inspiron 15 7506 2-in-1 P97F i5-1135G7, Iris Xe G7 80EUs, Toshiba KBG40ZNS256G NVMe, IPS, 1920x1080, 15.6" | |
|---|---|---|---|---|---|---|---|
| Power Consumption | 16% | 25% | -11% | -1% | 33% | 31% | |
| Idle Minimum * (Watt) | 4 | 4.2 -5% | 3.9 2% | 4.2 -5% | 2.3 43% | 2.97 26% | 3.9 2% |
| Idle Average * (Watt) | 15.5 | 8.7 44% | 7 55% | 7.4 52% | 10.3 34% | 7.2 54% | 6.9 55% |
| Idle Maximum * (Watt) | 16.2 | 11.3 30% | 10.5 35% | 9 44% | 11 32% | 9.9 39% | 8.5 48% |
| Load Average * (Watt) | 49.7 | 58 -17% | 48 3% | 78 -57% | 77 -55% | 40.8 18% | 30.5 39% |
| Witcher 3 ultra * (Watt) | 52.2 | 44.6 15% | 94.2 -80% | 68 -30% | 42.6 18% | ||
| Load Maximum * (Watt) | 92.7 | 67 28% | 65 30% | 108 -17% | 118 -27% | 64.7 30% | 69.7 25% |
* ... menor é melhor
Vida útil da bateria
A capacidade da bateria é quase 30% maior do que no Inspiron 15 7506 2 em 1 normal. Quando sujeita às mesmas condições WLAN, nossa unidade Black Edition duraria cerca de uma hora a mais a quase 10 horas.
A carga desde a capacidade vazia até a plena leva pouco menos de 2 horas. O sistema também pode ser recarregado via USB-C.
| Dell Inspiron 15 7000 7506 2-in-1 Black Edition i7-1165G7, Xe MAX, 68 Wh | Samsung Galaxy Book Flex 15-NP950 i7-1065G7, GeForce MX250, 69.7 Wh | HP Envy x360 15-ee0257ng R5 4500U, Vega 6, 51 Wh | Microsoft Surface Book 3 15 i7-1065G7, GeForce GTX 1660 Ti Max-Q, 82 Wh | Asus ZenBook Flip 15 UX563FD-A1027T i7-10510U, GeForce GTX 1050 Max-Q, 71 Wh | Lenovo Yoga C740-15IML i7-10510U, UHD Graphics 620, 60.3 Wh | Dell Inspiron 15 7506 2-in-1 P97F i5-1135G7, Iris Xe G7 80EUs, 53 Wh | |
|---|---|---|---|---|---|---|---|
| Duração da bateria | 21% | -3% | 14% | 10% | 16% | -19% | |
| Reader / Idle (h) | 25 | 16.2 -35% | 19.5 -22% | 18.8 -25% | |||
| WiFi v1.3 (h) | 9.7 | 11.7 21% | 9.4 -3% | 8.5 -12% | 9.4 -3% | 10.4 7% | 8.3 -14% |
| Load (h) | 1.6 | 3 88% | 2.5 56% | 2 25% | 1.3 -19% |
Pro
Contra
Veredicto
O Inspiron 7506 2 em 1 Black Edition começa atualmente a $1500 USD em comparação com $700 ou $800 para a Silver Edition. Quando até mesmo a CPU Core i5 na Edição Silver pode superar nosso Core i7 Black Edition, no entanto, o desempenho por dólar para esta configuração em particular não é o melhor para dizer o mínimo. A esse preço, o próprio XPS 15 da Dell é sem dúvida uma compra mais sólida, especialmente para editores gráficos ou criadores de conteúdo que podem fazer uso da potência extra e cores melhores.
O Inspiron Black Edition tem como alvo um nicho de audiência que quer tanto uma tela sensível ao toque conversível quanto a discreta GPU Iris Xe Max. Os usuários que não se enquadram nessa categoria podem estar mais interessados em gastar seus 1,5K no Dell XPS 15.
Os usuários que consideram a Black Edition provavelmente a desejam principalmente para a GPU Iris Xe Max. Se assim for, tenha em mente que seus cenários de uso são muito mais estreitos quando comparados com a série GeForce. Se você fizer mesmo um pouco de jogo, então a série GeForce MX ainda é recomendada por seus drivers superiores, estabilidade e compatibilidade. Se você fizer uma tonelada de codificação ou trabalho em Adobe Lightroom, então o Xe Max especializado seria a melhor aposta. Até que os preços comecem a cair, no entanto, o Inspiron Black Edition vai ser um produto difícil de vender quando comparado ao seu equivalente Silver Edition ou à série XPS 15.
Preço e disponibilidade
O Dell Inspiron 7506 2 em 1 Black Edition é agora enviado na Best Buy por $1400 USD com especificações similares às de nossa unidade revisada
A Amazon também tem uma configuração, mas a revendedora está fixando o preço em quase US$ 2.000,00.
Dell Inspiron 15 7000 7506 2-in-1 Black Edition
- 01/04/2021 v7 (old)
Allen Ngo
Price comparison

