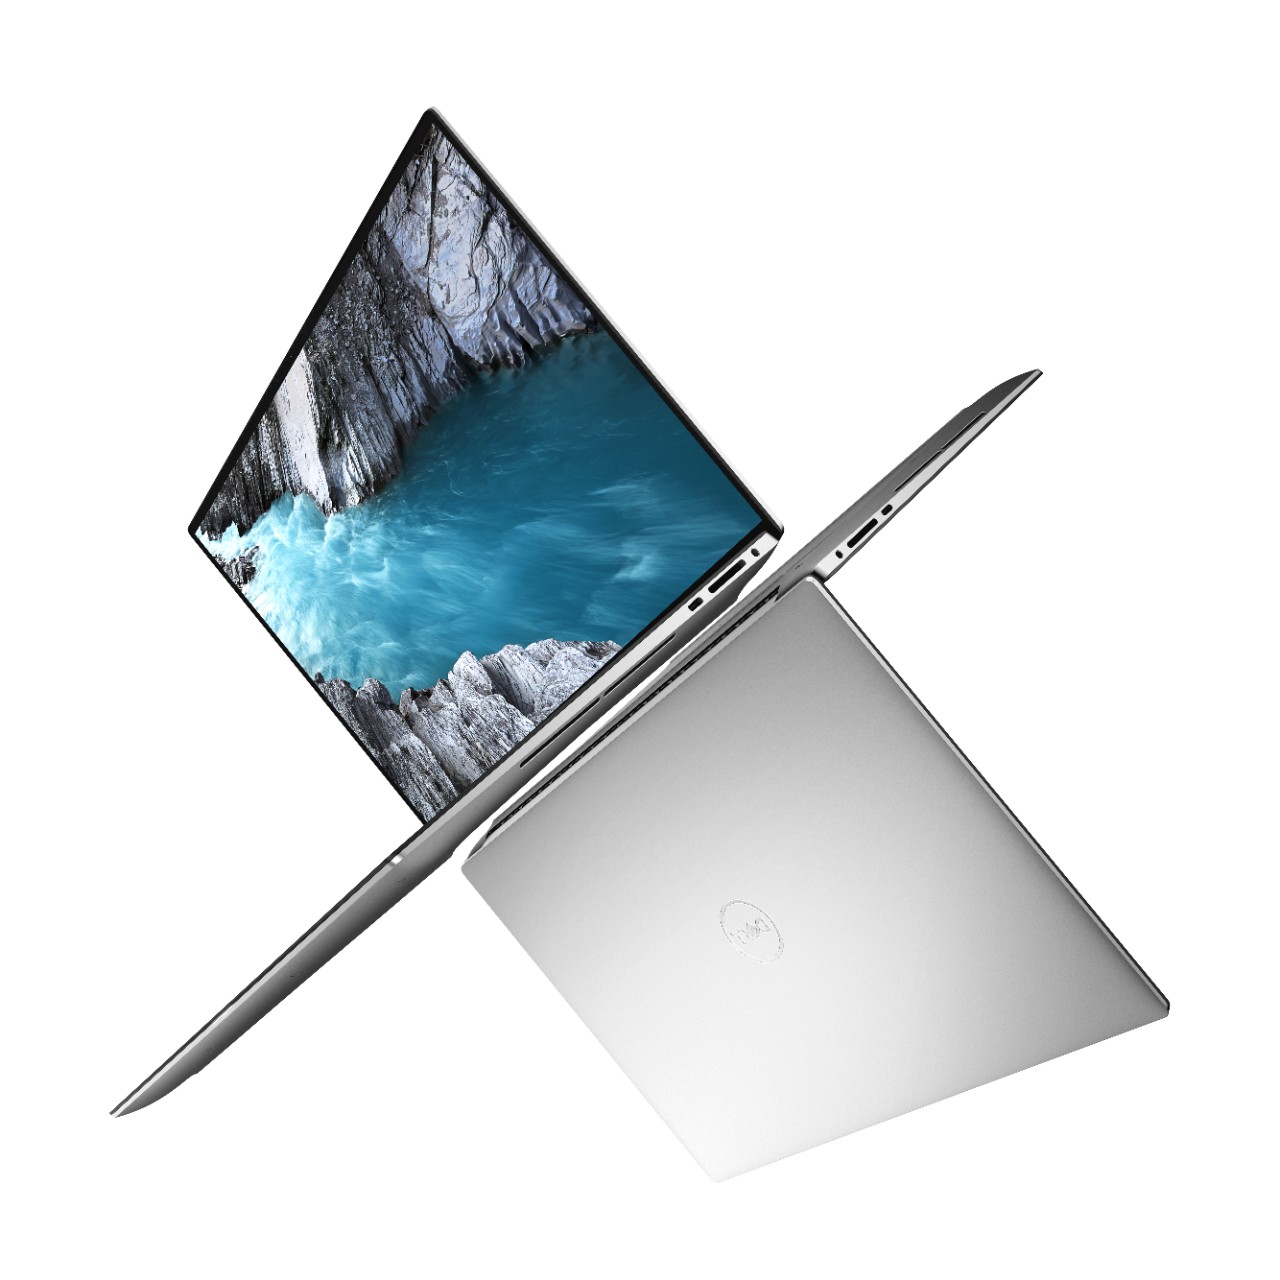
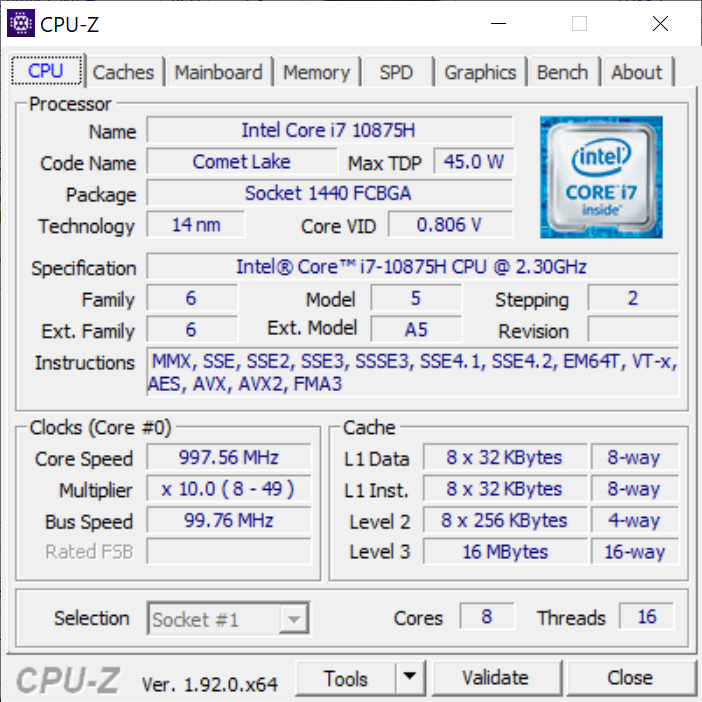
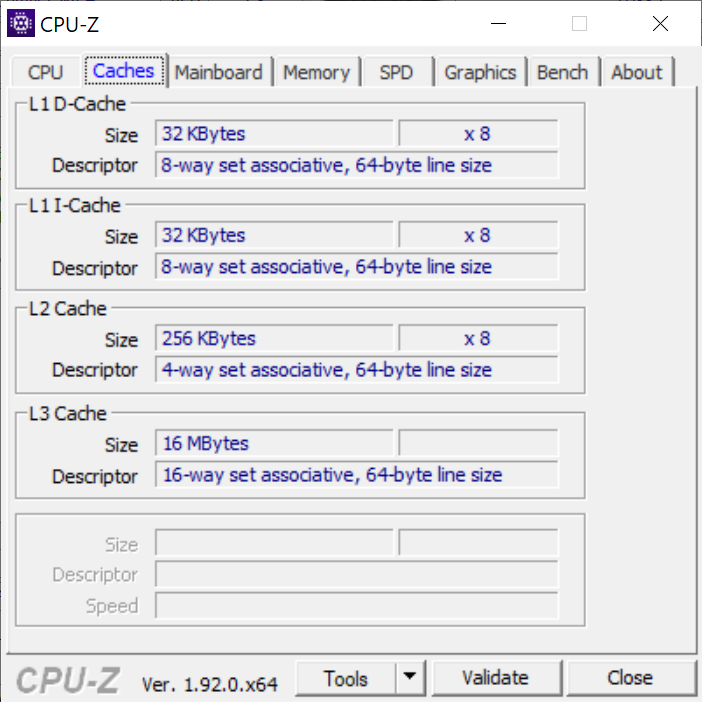
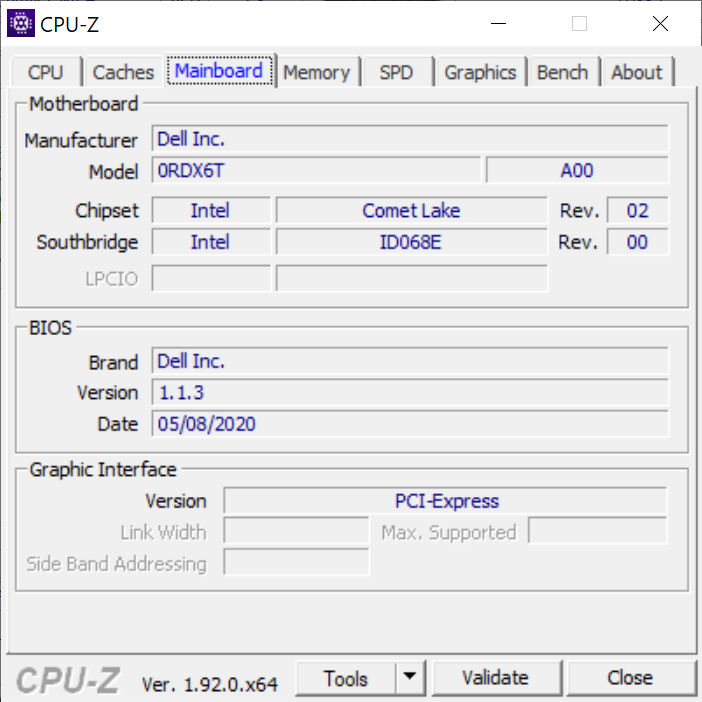
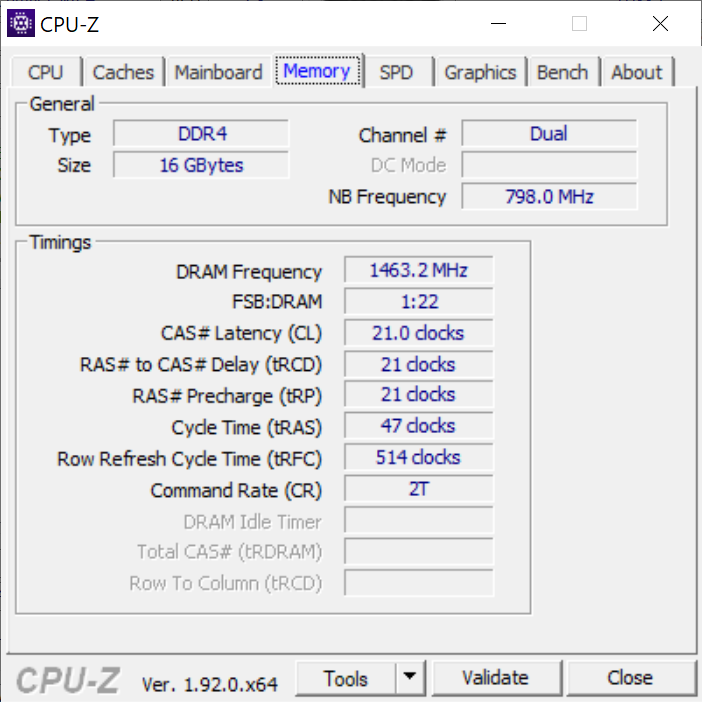
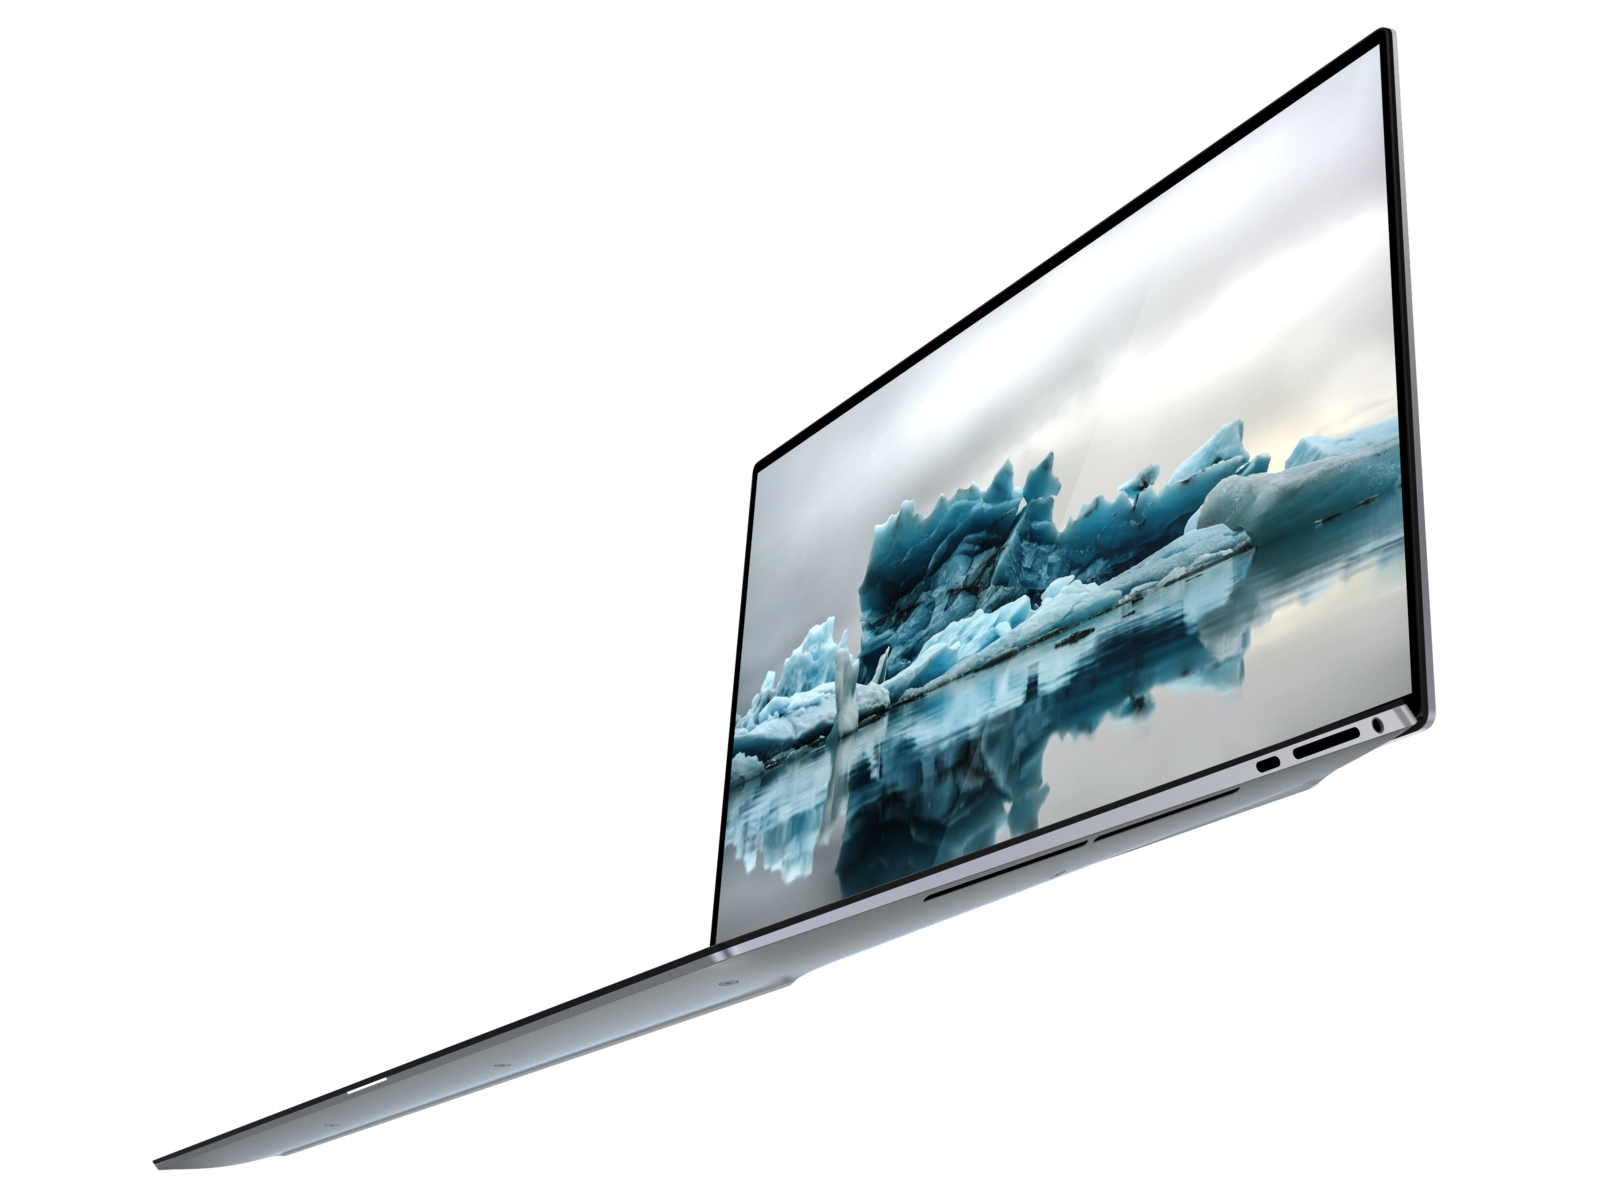
Breve Análise do Portátil Dell XPS 15 9500 Core i7 GeForce GTX 1650 Ti: Sem a bobagem do Core i9
Avaliação | Data | Modelo | Peso | Altura | Size | Resolução | Preço |
|---|---|---|---|---|---|---|---|
| 90.1 % v7 (old) | 06/2020 | Dell XPS 15 9500 Core i7 4K UHD i7-10875H, GeForce GTX 1650 Ti Mobile | 2 kg | 18 mm | 15.60" | 3840x2400 | |
| 86 % v7 (old) | 12/2019 | Lenovo Yoga C940-15IRH i7-9750H, GeForce GTX 1650 Max-Q | 2 kg | 19.7 mm | 15.60" | 1920x1080 | |
| 85.2 % v7 (old) | 03/2020 | Asus ZenBook 15 UX534FTC-A8190T i7-10510U, GeForce GTX 1650 Max-Q | 1.6 kg | 18.9 mm | 15.60" | 1920x1080 | |
| 85.2 % v7 (old) | 11/2019 | MSI Prestige 15 A10SC i7-10710U, GeForce GTX 1650 Max-Q | 1.7 kg | 16 mm | 15.60" | 3840x2160 | |
| 86.8 % v7 (old) | 06/2020 | Dell XPS 15 9500 Core i5 i5-10300H, UHD Graphics 630 | 1.8 kg | 18 mm | 15.60" | 1920x1200 | |
| 89.7 % v7 (old) | 12/2019 | Apple MacBook Pro 16 2019 i9 5500M i9-9880H, Radeon Pro 5500M | 2 kg | 16.2 mm | 16.00" | 3072x1920 |


| SD Card Reader | |
| average JPG Copy Test (av. of 3 runs) | |
| Dell XPS 15 9500 Core i7 4K UHD (Toshiba Exceria Pro SDXC 64 GB UHS-II) | |
| Dell XPS 15 7590 9980HK GTX 1650 (Toshiba Exceria Pro SDXC 64 GB UHS-II) | |
| MSI Prestige 15 A10SC (Toshiba Exceria Pro M501 UHS-II) | |
| Dell XPS 15 9575 i5-8305G (Toshiba Exceria Pro M501 UHS-II) | |
| maximum AS SSD Seq Read Test (1GB) | |
| Dell XPS 15 9575 i5-8305G (Toshiba Exceria Pro M501 UHS-II) | |
| Dell XPS 15 9500 Core i7 4K UHD (Toshiba Exceria Pro SDXC 64 GB UHS-II) | |
| MSI Prestige 15 A10SC (Toshiba Exceria Pro M501 UHS-II) | |
| Dell XPS 15 7590 9980HK GTX 1650 (Toshiba Exceria Pro SDXC 64 GB UHS-II) | |


| |||||||||||||||||||||||||
iluminação: 91 %
iluminação com acumulador: 557.9 cd/m²
Contraste: 1431:1 (Preto: 0.39 cd/m²)
ΔE ColorChecker Calman: 4.54 | ∀{0.5-29.43 Ø4.72}
calibrated: 3.82
ΔE Greyscale Calman: 3.2 | ∀{0.09-98 Ø4.97}
100% sRGB (Argyll 1.6.3 3D)
89.5% AdobeRGB 1998 (Argyll 1.6.3 3D)
99.8% AdobeRGB 1998 (Argyll 3D)
100% sRGB (Argyll 3D)
89.7% Display P3 (Argyll 3D)
Gamma: 1.99
CCT: 6451 K
| Dell XPS 15 9500 Core i7 4K UHD Sharp LQ156R1, IPS, 15.6", 3840x2400 | Dell XPS 15 9500 Core i5 Sharp LQ156N1, IPS, 15.6", 1920x1200 | Lenovo Yoga C940-15IRH LG Philips LP156WFC-SPU1, IPS, 15.6", 1920x1080 | Asus ZenBook 15 UX534FTC-A8190T BOE CQ NV156FHM-N63, IPS, 15.6", 1920x1080 | MSI Prestige 15 A10SC Sharp LQ156D1JW42, IPS, 15.6", 3840x2160 | Apple MacBook Pro 16 2019 i9 5500M APPA044, IPS, 16", 3072x1920 | |
|---|---|---|---|---|---|---|
| Display | -10% | -25% | -26% | -5% | ||
| Display P3 Coverage (%) | 89.7 | 81.5 -9% | 61.5 -31% | 65 -28% | 82 -9% | |
| sRGB Coverage (%) | 100 | 100 0% | 92.7 -7% | 86.2 -14% | 98.3 -2% | |
| AdobeRGB 1998 Coverage (%) | 99.8 | 79.6 -20% | 63.6 -36% | 62.9 -37% | 96.2 -4% | |
| Response Times | 18% | 0% | 11% | -18% | -1% | |
| Response Time Grey 50% / Grey 80% * (ms) | 54 ? | 42 ? 22% | 48.4 ? 10% | 45 ? 17% | 60 ? -11% | 52.4 ? 3% |
| Response Time Black / White * (ms) | 33.2 ? | 28.8 ? 13% | 36.4 ? -10% | 32 ? 4% | 41.2 ? -24% | 34.9 ? -5% |
| PWM Frequency (Hz) | 26040 ? | 131700 | ||||
| Screen | 4% | -2% | -13% | 0% | 17% | |
| Brightness middle (cd/m²) | 557.9 | 592 6% | 484.8 -13% | 299 -46% | 464.5 -17% | 519 -7% |
| Brightness (cd/m²) | 541 | 565 4% | 463 -14% | 280 -48% | 451 -17% | 477 -12% |
| Brightness Distribution (%) | 91 | 85 -7% | 82 -10% | 89 -2% | 92 1% | 86 -5% |
| Black Level * (cd/m²) | 0.39 | 0.46 -18% | 0.26 33% | 0.21 46% | 0.5 -28% | 0.39 -0% |
| Contrast (:1) | 1431 | 1287 -10% | 1865 30% | 1424 0% | 929 -35% | 1331 -7% |
| Colorchecker dE 2000 * | 4.54 | 3.19 30% | 4.5 1% | 4.76 -5% | 3.36 26% | 2.28 50% |
| Colorchecker dE 2000 max. * | 7.92 | 5.45 31% | 7.55 5% | 9 -14% | 7.06 11% | 6.54 17% |
| Colorchecker dE 2000 calibrated * | 3.82 | 2.03 47% | 1.19 69% | 3.42 10% | 0.86 77% | |
| Greyscale dE 2000 * | 3.2 | 3.9 -22% | 5.7 -78% | 3.53 -10% | 1.3 59% | 0.9 72% |
| Gamma | 1.99 111% | 2.25 98% | 2.45 90% | 2.3 96% | 2.14 103% | 2145 0% |
| CCT | 6451 101% | 6522 100% | 6101 107% | 7228 90% | 6596 99% | 6572 99% |
| Color Space (Percent of AdobeRGB 1998) (%) | 89.5 | 71.6 -20% | 58.7 -34% | 56 -37% | 84.8 -5% | 78 -13% |
| Color Space (Percent of sRGB) (%) | 100 | 100 0% | 92.8 -7% | 86 -14% | 98.3 -2% | |
| Média Total (Programa/Configurações) | 4% /
3% | -9% /
-6% | -9% /
-13% | -8% /
-3% | 8% /
14% |
* ... menor é melhor
Exibir tempos de resposta
| ↔ Tempo de resposta preto para branco | ||
|---|---|---|
| 33.2 ms ... ascensão ↗ e queda ↘ combinadas | ↗ 19.2 ms ascensão | 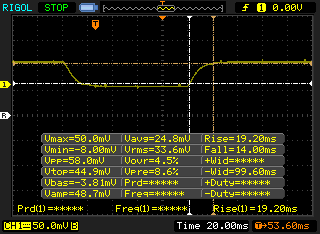 |
| ↘ 14 ms queda | ||
| A tela mostra taxas de resposta lentas em nossos testes e será insatisfatória para os jogadores. Em comparação, todos os dispositivos testados variam de 0.1 (mínimo) a 240 (máximo) ms. » 90 % de todos os dispositivos são melhores. Isso significa que o tempo de resposta medido é pior que a média de todos os dispositivos testados (19.8 ms). | ||
| ↔ Tempo de resposta 50% cinza a 80% cinza | ||
| 54 ms ... ascensão ↗ e queda ↘ combinadas | ↗ 26.4 ms ascensão | 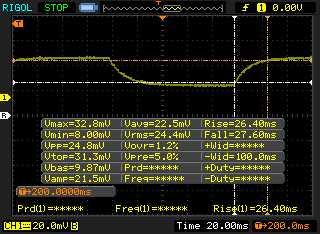 |
| ↘ 27.6 ms queda | ||
| A tela mostra taxas de resposta lentas em nossos testes e será insatisfatória para os jogadores. Em comparação, todos os dispositivos testados variam de 0.165 (mínimo) a 636 (máximo) ms. » 91 % de todos os dispositivos são melhores. Isso significa que o tempo de resposta medido é pior que a média de todos os dispositivos testados (31 ms). | ||
Cintilação da tela / PWM (modulação por largura de pulso)
| Tela tremeluzindo / PWM não detectado | 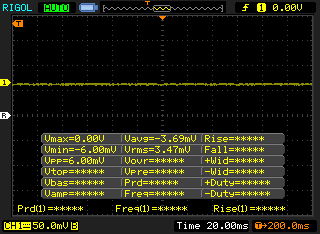 | ||
[pwm_comparison] Em comparação: 52 % de todos os dispositivos testados não usam PWM para escurecer a tela. Se PWM foi detectado, uma média de 7781 (mínimo: 5 - máximo: 343500) Hz foi medida. | |||
Cinebench R15: CPU Multi 64Bit | CPU Single 64Bit
Blender: v2.79 BMW27 CPU
7-Zip 18.03: 7z b 4 -mmt1 | 7z b 4
Geekbench 5.5: Single-Core | Multi-Core
HWBOT x265 Benchmark v2.2: 4k Preset
LibreOffice : 20 Documents To PDF
R Benchmark 2.5: Overall mean
| Cinebench R20 / CPU (Multi Core) | |
| Eluktronics RP-15 | |
| MSI GS66 Stealth 10SFS | |
| Média Intel Core i7-10875H (1986 - 4176, n=32) | |
| Dell XPS 15 7590 9980HK GTX 1650 | |
| Dell XPS 15 9500 Core i7 4K UHD | |
| Apple MacBook Pro 15 2019 i9 Vega 16 | |
| Medion Erazer X15805 | |
| Razer Blade 15 RZ09-0328 | |
| Lenovo IdeaPad S740-15IRH | |
| Schenker Work 15 | |
| Dell XPS 15 9500 Core i5 | |
| MSI Alpha 15 A3DDK-034 | |
| Cinebench R20 / CPU (Single Core) | |
| Medion Erazer X15805 | |
| Dell XPS 15 9500 Core i7 4K UHD | |
| Eluktronics RP-15 | |
| Média Intel Core i7-10875H (430 - 524, n=32) | |
| MSI GS66 Stealth 10SFS | |
| Razer Blade 15 RZ09-0328 | |
| Apple MacBook Pro 15 2019 i9 Vega 16 | |
| Lenovo IdeaPad S740-15IRH | |
| Dell XPS 15 7590 9980HK GTX 1650 | |
| Dell XPS 15 9500 Core i5 | |
| Schenker Work 15 | |
| MSI Alpha 15 A3DDK-034 | |
| Cinebench R15 / CPU Multi 64Bit | |
| Eluktronics RP-15 | |
| MSI GS66 Stealth 10SFS | |
| Dell XPS 15 7590 9980HK GTX 1650 | |
| Média Intel Core i7-10875H (1003 - 1833, n=38) | |
| Dell XPS 15 9500 Core i7 4K UHD | |
| Apple MacBook Pro 15 2019 i9 Vega 16 | |
| Medion Erazer X15805 | |
| Razer Blade 15 RZ09-0328 | |
| Lenovo IdeaPad S740-15IRH | |
| Schenker Work 15 | |
| Dell XPS 15 9500 Core i5 | |
| MSI Alpha 15 A3DDK-034 | |
| Cinebench R15 / CPU Single 64Bit | |
| Dell XPS 15 9500 Core i7 4K UHD | |
| Média Intel Core i7-10875H (190 - 220, n=37) | |
| Medion Erazer X15805 | |
| Dell XPS 15 7590 9980HK GTX 1650 | |
| MSI GS66 Stealth 10SFS | |
| Razer Blade 15 RZ09-0328 | |
| Lenovo IdeaPad S740-15IRH | |
| Eluktronics RP-15 | |
| Dell XPS 15 9500 Core i5 | |
| Apple MacBook Pro 15 2019 i9 Vega 16 | |
| Schenker Work 15 | |
| MSI Alpha 15 A3DDK-034 | |
| Blender / v2.79 BMW27 CPU | |
| Dell XPS 15 9500 Core i5 | |
| Schenker Work 15 | |
| Schenker Work 15 | |
| Razer Blade 15 RZ09-0328 | |
| Apple MacBook Pro 15 2019 i9 Vega 16 | |
| Dell XPS 15 9500 Core i7 4K UHD | |
| Média Intel Core i7-10875H (259 - 535, n=30) | |
| MSI GS66 Stealth 10SFS | |
| Eluktronics RP-15 | |
| 7-Zip 18.03 / 7z b 4 -mmt1 | |
| Média Intel Core i7-10875H (5071 - 5780, n=31) | |
| Dell XPS 15 9500 Core i7 4K UHD | |
| MSI GS66 Stealth 10SFS | |
| Razer Blade 15 RZ09-0328 | |
| Dell XPS 15 9500 Core i5 | |
| Eluktronics RP-15 | |
| Schenker Work 15 | |
| Schenker Work 15 | |
| 7-Zip 18.03 / 7z b 4 | |
| Eluktronics RP-15 | |
| MSI GS66 Stealth 10SFS | |
| Média Intel Core i7-10875H (29844 - 49562, n=31) | |
| Dell XPS 15 9500 Core i7 4K UHD | |
| Razer Blade 15 RZ09-0328 | |
| Schenker Work 15 | |
| Schenker Work 15 | |
| Dell XPS 15 9500 Core i5 | |
| Geekbench 5.5 / Single-Core | |
| Dell XPS 15 9500 Core i7 4K UHD | |
| Média Intel Core i7-10875H (1233 - 1371, n=29) | |
| MSI GS66 Stealth 10SFS | |
| Eluktronics RP-15 | |
| Dell XPS 15 9500 Core i5 | |
| Razer Blade 15 RZ09-0328 | |
| MSI Alpha 15 A3DDK-034 | |
| Geekbench 5.5 / Multi-Core | |
| Eluktronics RP-15 | |
| Dell XPS 15 9500 Core i7 4K UHD | |
| Média Intel Core i7-10875H (5715 - 8620, n=29) | |
| MSI GS66 Stealth 10SFS | |
| Razer Blade 15 RZ09-0328 | |
| Dell XPS 15 9500 Core i5 | |
| MSI Alpha 15 A3DDK-034 | |
| HWBOT x265 Benchmark v2.2 / 4k Preset | |
| Eluktronics RP-15 | |
| MSI GS66 Stealth 10SFS | |
| Média Intel Core i7-10875H (7.27 - 14.1, n=27) | |
| Dell XPS 15 9500 Core i7 4K UHD | |
| Razer Blade 15 RZ09-0328 | |
| Schenker Work 15 | |
| Schenker Work 15 | |
| Dell XPS 15 9500 Core i5 | |
| LibreOffice / 20 Documents To PDF | |
| Dell XPS 15 9500 Core i5 | |
| Eluktronics RP-15 | |
| Razer Blade 15 RZ09-0328 | |
| Dell XPS 15 9500 Core i7 4K UHD | |
| MSI GS66 Stealth 10SFS | |
| Média Intel Core i7-10875H (30.2 - 84.3, n=30) | |
| R Benchmark 2.5 / Overall mean | |
| Dell XPS 15 9500 Core i5 | |
| MSI GS66 Stealth 10SFS | |
| Dell XPS 15 9500 Core i7 4K UHD | |
| Média Intel Core i7-10875H (0.546 - 0.662, n=29) | |
| Eluktronics RP-15 | |
* ... menor é melhor
| PCMark 8 Home Score Accelerated v2 | 3731 pontos | |
| PCMark 8 Work Score Accelerated v2 | 4540 pontos | |
| PCMark 10 Score | 5125 pontos | |
Ajuda | ||
| DPC Latencies / LatencyMon - interrupt to process latency (max), Web, Youtube, Prime95 | |
| Dell XPS 15 9500 Core i7 4K UHD | |
| MSI GS66 Stealth 10SFS | |
| Dell XPS 15 9500 Core i5 | |
| Eluktronics RP-15 | |
* ... menor é melhor
| Dell XPS 15 9500 Core i7 4K UHD SK Hynix PC611 512GB | Dell XPS 15 7590 9980HK GTX 1650 Toshiba XG6 KXG60ZNV1T02 | Lenovo Yoga C940-15IRH Intel Optane Memory H10 with Solid State Storage 32GB + 512GB HBRPEKNX0202A(L/H) | Asus ZenBook 15 UX534FTC-A8190T Samsung SSD PM981 MZVLB1T0HALR | MSI Prestige 15 A10SC Samsung SSD PM981 MZVLB1T0HALR | Dell XPS 15 9500 Core i5 Toshiba KBG40ZNS256G NVMe | |
|---|---|---|---|---|---|---|
| AS SSD | 32% | -25% | 27% | 30% | -69% | |
| Seq Read (MB/s) | 2072 | 1723 -17% | 769 -63% | 2643 28% | 1274 -39% | 1423 -31% |
| Seq Write (MB/s) | 1486 | 1386 -7% | 351.1 -76% | 1533 3% | 1395 -6% | 766 -48% |
| 4K Read (MB/s) | 47.41 | 43.25 -9% | 69.1 46% | 49.12 4% | 50.3 6% | 42.21 -11% |
| 4K Write (MB/s) | 117.6 | 98.3 -16% | 100.9 -14% | 134.7 15% | 119.8 2% | 74.8 -36% |
| 4K-64 Read (MB/s) | 967 | 1078 11% | 472 -51% | 1028 6% | 1599 65% | 973 1% |
| 4K-64 Write (MB/s) | 715 | 1456 104% | 948 33% | 1353 89% | 1455 103% | 218.8 -69% |
| Access Time Read * (ms) | 0.057 | 0.05 12% | 0.071 -25% | 0.033 42% | 0.044 23% | 0.125 -119% |
| Access Time Write * (ms) | 0.096 | 0.039 59% | 0.137 -43% | 0.028 71% | 0.092 4% | 0.552 -475% |
| Score Read (Points) | 1222 | 1294 6% | 618 -49% | 1342 10% | 1777 45% | 1157 -5% |
| Score Write (Points) | 981 | 1693 73% | 1084 10% | 1641 67% | 1714 75% | 370 -62% |
| Score Total (Points) | 2809 | 3638 30% | 2024 -28% | 3622 29% | 4411 57% | 2094 -25% |
| Copy ISO MB/s (MB/s) | 1999 | 3182 59% | 839 -58% | 2226 11% | 2830 42% | 1151 -42% |
| Copy Program MB/s (MB/s) | 627 | 984 57% | 455.8 -27% | 506 -19% | 609 -3% | 499.4 -20% |
| Copy Game MB/s (MB/s) | 1001 | 1824 82% | 969 -3% | 1230 23% | 1424 42% | 733 -27% |
| CrystalDiskMark 5.2 / 6 | 1% | 2% | 8% | -13% | -23% | |
| Write 4K (MB/s) | 123.3 | 104.3 -15% | 102.2 -17% | 138.1 12% | 150.8 22% | 93.3 -24% |
| Read 4K (MB/s) | 41.85 | 45.23 8% | 114.3 173% | 45.89 10% | 47.3 13% | 45.9 10% |
| Write Seq (MB/s) | 2054 | 1729 -16% | 468.3 -77% | 2147 5% | 981 -52% | 1211 -41% |
| Read Seq (MB/s) | 1617 | 1861 15% | 1236 -24% | 2188 35% | 976 -40% | 1633 1% |
| Write 4K Q32T1 (MB/s) | 413 | 509 23% | 556 35% | 427.8 4% | 442.7 7% | 273.1 -34% |
| Read 4K Q32T1 (MB/s) | 377.5 | 388.5 3% | 421.6 12% | 404 7% | 499.7 32% | 356 -6% |
| Write Seq Q32T1 (MB/s) | 2705 | 2813 4% | 1264 -53% | 2396 -11% | 1706 -37% | 1198 -56% |
| Read Seq Q32T1 (MB/s) | 3442 | 2906 -16% | 2239 -35% | 3454 0% | 1758 -49% | 2269 -34% |
| Média Total (Programa/Configurações) | 17% /
20% | -12% /
-15% | 18% /
20% | 9% /
14% | -46% /
-52% |
* ... menor é melhor

Disk Throttling: DiskSpd Read Loop, Queue Depth 8
| 3DMark | |
| 1920x1080 Fire Strike Graphics | |
| Eluktronics RP-15 | |
| Maingear Vector 15 | |
| MSI P65 8RF-451 - Creator | |
| Asus Zephyrus S GX531GM | |
| Dell XPS 15 9500 Core i7 4K UHD | |
| Gainward GeForce GTX 1650 4 GB | |
| Dell XPS 15 7590 9980HK GTX 1650 | |
| Lenovo IdeaPad S740-15IRH | |
| Dell XPS 15 9570 i7 UHD | |
| Dell XPS 15 9500 Core i5 | |
| 2560x1440 Time Spy Graphics | |
| Eluktronics RP-15 | |
| Maingear Vector 15 | |
| MSI P65 8RF-451 - Creator | |
| Asus Zephyrus S GX531GM | |
| Dell XPS 15 9500 Core i7 4K UHD | |
| Gainward GeForce GTX 1650 4 GB | |
| Dell XPS 15 7590 9980HK GTX 1650 | |
| Lenovo IdeaPad S740-15IRH | |
| Dell XPS 15 9570 i7 UHD | |
| Dell XPS 15 9500 Core i5 | |
| 2560x1440 Time Spy Score | |
| Eluktronics RP-15 | |
| Maingear Vector 15 | |
| MSI P65 8RF-451 - Creator | |
| Gainward GeForce GTX 1650 4 GB | |
| Asus Zephyrus S GX531GM | |
| Dell XPS 15 9500 Core i7 4K UHD | |
| Dell XPS 15 7590 9980HK GTX 1650 | |
| Lenovo IdeaPad S740-15IRH | |
| Dell XPS 15 9570 i7 UHD | |
| Dell XPS 15 9500 Core i5 | |
| 3DMark 11 | |
| 1280x720 Performance GPU | |
| Eluktronics RP-15 | |
| Maingear Vector 15 | |
| MSI P65 8RF-451 - Creator | |
| Gainward GeForce GTX 1650 4 GB | |
| Dell XPS 15 9500 Core i7 4K UHD | |
| Asus Zephyrus S GX531GM | |
| Dell XPS 15 7590 9980HK GTX 1650 | |
| Lenovo IdeaPad S740-15IRH | |
| Dell XPS 15 9570 i7 UHD | |
| Dell XPS 15 9500 Core i5 | |
| 1280x720 Performance Combined | |
| Eluktronics RP-15 | |
| Dell XPS 15 9500 Core i7 4K UHD | |
| Maingear Vector 15 | |
| Gainward GeForce GTX 1650 4 GB | |
| Lenovo IdeaPad S740-15IRH | |
| Dell XPS 15 9570 i7 UHD | |
| MSI P65 8RF-451 - Creator | |
| Dell XPS 15 7590 9980HK GTX 1650 | |
| Asus Zephyrus S GX531GM | |
| Dell XPS 15 9500 Core i5 | |
| 3DMark 06 Standard Score | 39720 pontos | |
| 3DMark Vantage P Result | 43517 pontos | |
| 3DMark 11 Performance | 13331 pontos | |
| 3DMark Cloud Gate Standard Score | 20269 pontos | |
| 3DMark Fire Strike Score | 9222 pontos | |
| 3DMark Time Spy Score | 3774 pontos | |
Ajuda | ||
| baixo | média | alto | ultra | 4K | |
|---|---|---|---|---|---|
| The Witcher 3 (2015) | 209.9 | 100.8 | 65.6 | 38.1 | |
| Dota 2 Reborn (2015) | 150 | 139 | 130 | 120 | 51.8 |
| X-Plane 11.11 (2018) | 109 | 78.2 | 63.3 | 45.8 | |
| Shadow of the Tomb Raider (2018) | 139 | 62 | 57 | 48 | |
| Assassin´s Creed Odyssey (2018) | 86 | 60 | 42 | 25 | |
| Apex Legends (2019) | 144 | 91 | 84 | 74 | |
| Far Cry New Dawn (2019) | 73 | 57 | 58 | 51 | |
| Metro Exodus (2019) | 91.6 | 48.7 | 35.9 | 27.9 | |
| Dirt Rally 2.0 (2019) | 247.3 | 92.7 | 74.6 | 44.8 | |
| The Division 2 (2019) | 115 | 56 | 47 | 35 | |
| Anno 1800 (2019) | 68.4 | 64.5 | 49.1 | 27.6 | |
| Total War: Three Kingdoms (2019) | 190.2 | 59.1 | 40.8 | 27.2 | |
| F1 2019 (2019) | 206 | 105 | 89 | 76 | |
| Borderlands 3 (2019) | 128.3 | 59.9 | 38.5 | 29.3 | |
| Ghost Recon Breakpoint (2019) | 72 | 53 | 47 | 31 | |
| GRID 2019 (2019) | 103.8 | 70.7 | 64.1 | 27.3 | |
| Need for Speed Heat (2019) | 60.4 | 43.3 | 39 | 37.3 | |
| Star Wars Jedi Fallen Order (2019) | 44.1 | 41.5 | 40.7 | ||
| Escape from Tarkov (2020) | 120.5 | 89.7 | 60.4 | 73 | |
| Hunt Showdown (2020) | 150 | 58.5 | 47.5 | ||
| Doom Eternal (2020) | 149.5 | 90.7 | 66.6 |
| Dell XPS 15 9500 Core i7 4K UHD GeForce GTX 1650 Ti Mobile, i7-10875H, SK Hynix PC611 512GB | Dell XPS 15 7590 9980HK GTX 1650 GeForce GTX 1650 Mobile, i9-9980HK, Toshiba XG6 KXG60ZNV1T02 | Lenovo Yoga C940-15IRH GeForce GTX 1650 Max-Q, i7-9750H, Intel Optane Memory H10 with Solid State Storage 32GB + 512GB HBRPEKNX0202A(L/H) | Asus ZenBook 15 UX534FTC-A8190T GeForce GTX 1650 Max-Q, i7-10510U, Samsung SSD PM981 MZVLB1T0HALR | MSI Prestige 15 A10SC GeForce GTX 1650 Max-Q, i7-10710U, Samsung SSD PM981 MZVLB1T0HALR | Dell XPS 15 9500 Core i5 UHD Graphics 630, i5-10300H, Toshiba KBG40ZNS256G NVMe | |
|---|---|---|---|---|---|---|
| Noise | -2% | -0% | 4% | 3% | 9% | |
| desligado / ambiente * (dB) | 28.4 | 28.2 1% | 28.7 -1% | 30.3 -7% | 29.3 -3% | 28 1% |
| Idle Minimum * (dB) | 28.4 | 28.2 1% | 28.7 -1% | 30.3 -7% | 30.1 -6% | 28 1% |
| Idle Average * (dB) | 28.4 | 28.2 1% | 28.8 -1% | 30.3 -7% | 30.2 -6% | 28 1% |
| Idle Maximum * (dB) | 28.4 | 30.4 -7% | 28.8 -1% | 30.9 -9% | 30.2 -6% | 28 1% |
| Load Average * (dB) | 46 | 43.8 5% | 45 2% | 31.3 32% | 31.5 32% | 28 39% |
| Witcher 3 ultra * (dB) | 42 | 47.2 -12% | 44.7 -6% | 38.1 9% | 37 12% | |
| Load Maximum * (dB) | 47.1 | 47.2 -0% | 44.7 5% | 38.2 19% | 47 -0% | 41.9 11% |
* ... menor é melhor
Barulho
| Ocioso |
| 28.4 / 28.4 / 28.4 dB |
| Carga |
| 46 / 47.1 dB |
 | ||
30 dB silencioso 40 dB(A) audível 50 dB(A) ruidosamente alto |
||
min: | ||
(±) A temperatura máxima no lado superior é 44 °C / 111 F, em comparação com a média de 36.8 °C / 98 F , variando de 21 a 71 °C para a classe Multimedia.
(-) A parte inferior aquece até um máximo de 48.8 °C / 120 F, em comparação com a média de 39.1 °C / 102 F
(+) Em uso inativo, a temperatura média para o lado superior é 30.5 °C / 87 F, em comparação com a média do dispositivo de 31.3 °C / ### class_avg_f### F.
(-) Jogando The Witcher 3, a temperatura média para o lado superior é 38.9 °C / 102 F, em comparação com a média do dispositivo de 31.3 °C / ## #class_avg_f### F.
(+) Os apoios para as mãos e o touchpad estão atingindo a temperatura máxima da pele (34.4 °C / 93.9 F) e, portanto, não estão quentes.
(-) A temperatura média da área do apoio para as mãos de dispositivos semelhantes foi 28.7 °C / 83.7 F (-5.7 °C / -10.2 F).
| desligado | |
| Ocioso | |
| Carga |
|
Key:
min: | |
| Dell XPS 15 9500 Core i7 4K UHD i7-10875H, GeForce GTX 1650 Ti Mobile, SK Hynix PC611 512GB, IPS, 3840x2400, 15.6" | Dell XPS 15 7590 9980HK GTX 1650 i9-9980HK, GeForce GTX 1650 Mobile, Toshiba XG6 KXG60ZNV1T02, OLED, 3840x2160, 15.6" | Lenovo Yoga C940-15IRH i7-9750H, GeForce GTX 1650 Max-Q, Intel Optane Memory H10 with Solid State Storage 32GB + 512GB HBRPEKNX0202A(L/H), IPS, 1920x1080, 15.6" | Asus ZenBook 15 UX534FTC-A8190T i7-10510U, GeForce GTX 1650 Max-Q, Samsung SSD PM981 MZVLB1T0HALR, IPS, 1920x1080, 15.6" | MSI Prestige 15 A10SC i7-10710U, GeForce GTX 1650 Max-Q, Samsung SSD PM981 MZVLB1T0HALR, IPS, 3840x2160, 15.6" | Dell XPS 15 9500 Core i5 i5-10300H, UHD Graphics 630, Toshiba KBG40ZNS256G NVMe, IPS, 1920x1200, 15.6" | |
|---|---|---|---|---|---|---|
| Power Consumption | 4% | 6% | 41% | 14% | 49% | |
| Idle Minimum * (Watt) | 5.7 | 6.2 -9% | 5.2 9% | 2.8 51% | 6.1 -7% | 2.9 49% |
| Idle Average * (Watt) | 13.5 | 9.6 29% | 10.7 21% | 7.7 43% | 13.2 2% | 7.6 44% |
| Idle Maximum * (Watt) | 19.6 | 21.2 -8% | 24.3 -24% | 9.4 52% | 19.2 2% | 8 59% |
| Load Average * (Watt) | 114.1 | 104.3 9% | 84.4 26% | 57 50% | 75 34% | 41.7 63% |
| Witcher 3 ultra * (Watt) | 93 | 91.7 1% | 83.9 10% | 62 33% | 74 20% | |
| Load Maximum * (Watt) | 135.2 | 135.3 -0% | 142.8 -6% | 116 14% | 89.7 34% | 94.8 30% |
* ... menor é melhor
| Dell XPS 15 9500 Core i7 4K UHD i7-10875H, GeForce GTX 1650 Ti Mobile, 86 Wh | Dell XPS 15 7590 9980HK GTX 1650 i9-9980HK, GeForce GTX 1650 Mobile, 97 Wh | Lenovo Yoga C940-15IRH i7-9750H, GeForce GTX 1650 Max-Q, 69 Wh | Asus ZenBook 15 UX534FTC-A8190T i7-10510U, GeForce GTX 1650 Max-Q, 71 Wh | MSI Prestige 15 A10SC i7-10710U, GeForce GTX 1650 Max-Q, 82 Wh | Dell XPS 15 9575 i5-8305G i5-8305G, Vega M GL / 870, 75 Wh | Dell XPS 15 9500 Core i5 i5-10300H, UHD Graphics 630, 56 Wh | |
|---|---|---|---|---|---|---|---|
| Duração da bateria | 6% | -21% | 25% | -9% | -28% | -1% | |
| Reader / Idle (h) | 23 | 15.2 -34% | 18.2 -21% | 27.2 18% | 19.1 -17% | 11.1 -52% | 26.4 15% |
| WiFi v1.3 (h) | 9.1 | 7.8 -14% | 9.7 7% | 12.4 36% | 7.6 -16% | 9.4 3% | 9.3 2% |
| Load (h) | 2 | 3.3 65% | 1 -50% | 2.4 20% | 2.1 5% | 1.3 -35% | 1.6 -20% |
Pro
Contra
O XPS 15 9500 com gráficos Core i7-10875H e GTX 1650 Ti serve para substituir diretamente o XPS 15 do ano passado com gráficos Core i9-9980HK e GTX 1650. Em termos de desempenho, o modelo mais novo é marginalmente mais rápido, sem precisar funcionar mais quente ou mais barulhento. Os usuários que esperavam uma experiência mais silenciosa ou mais fria terão que corrigir suas expectativas originais, já que o consumo de energia e o ruído permaneceram estáveis.
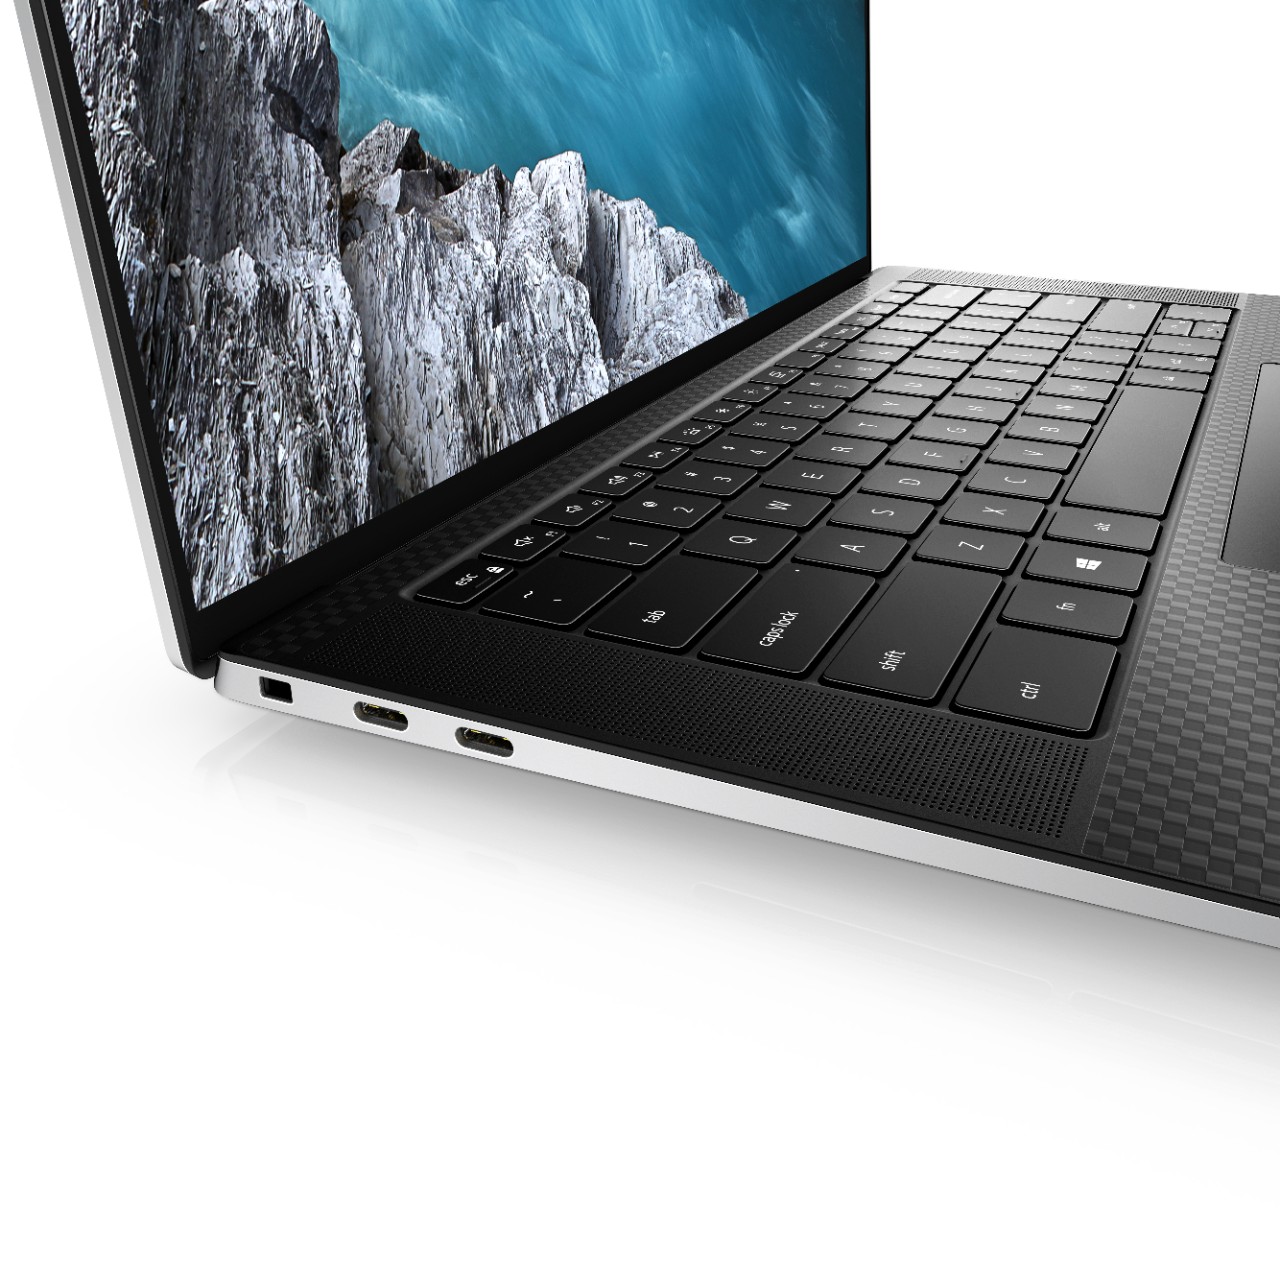
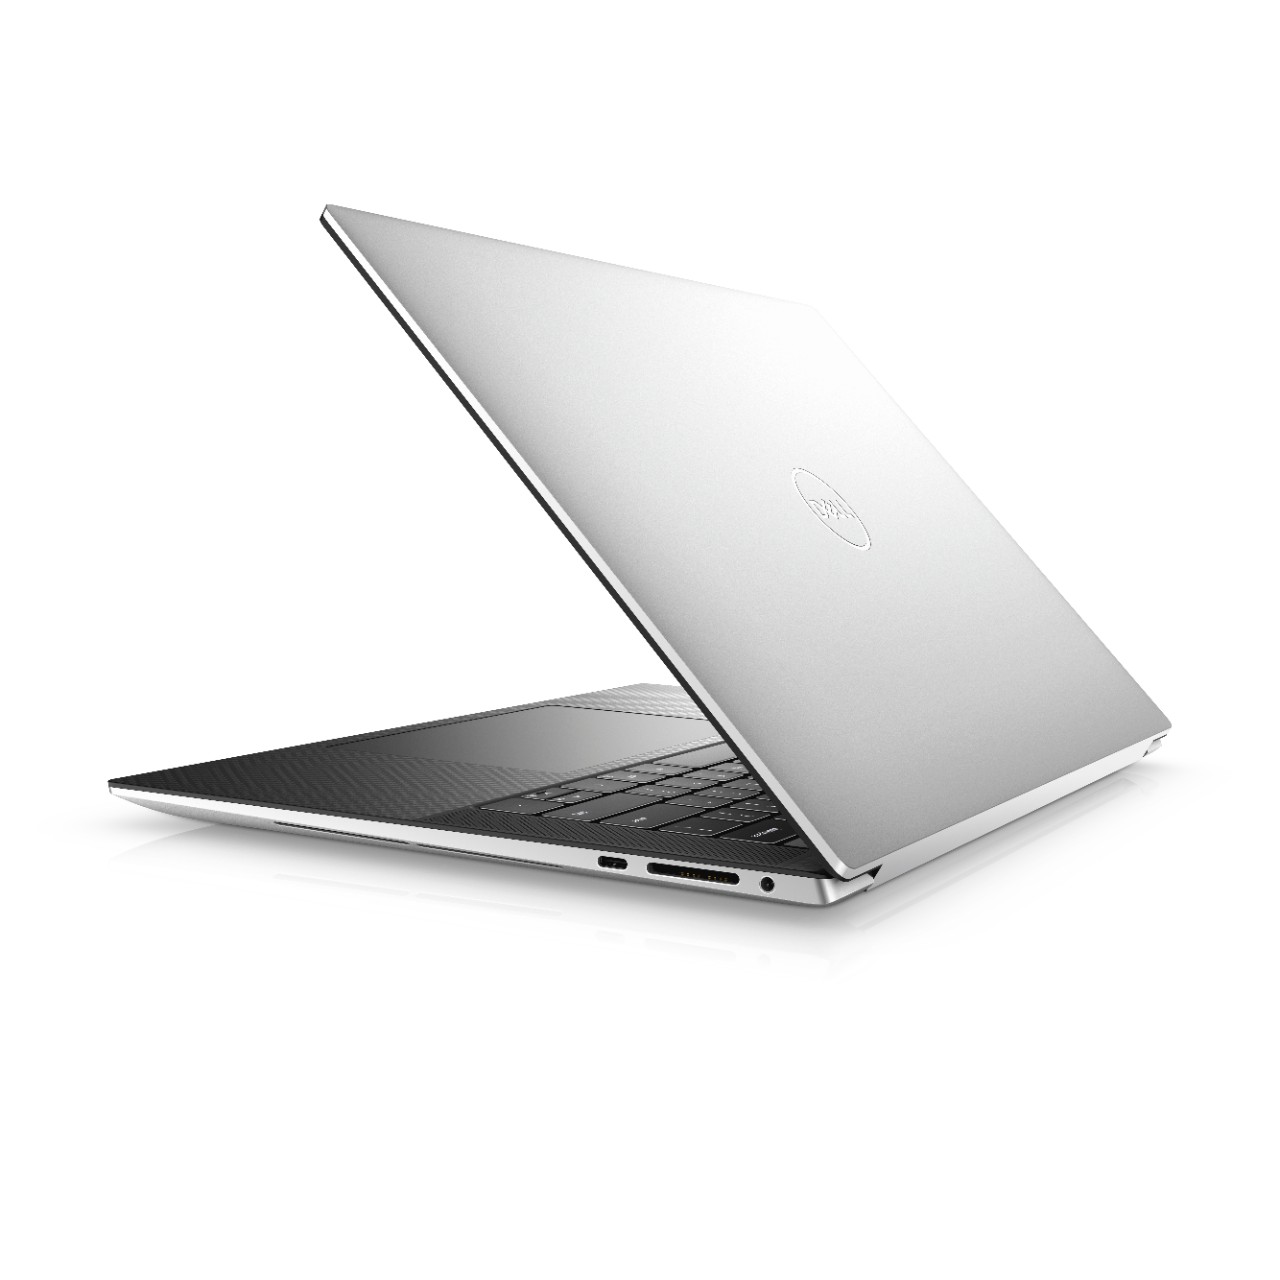
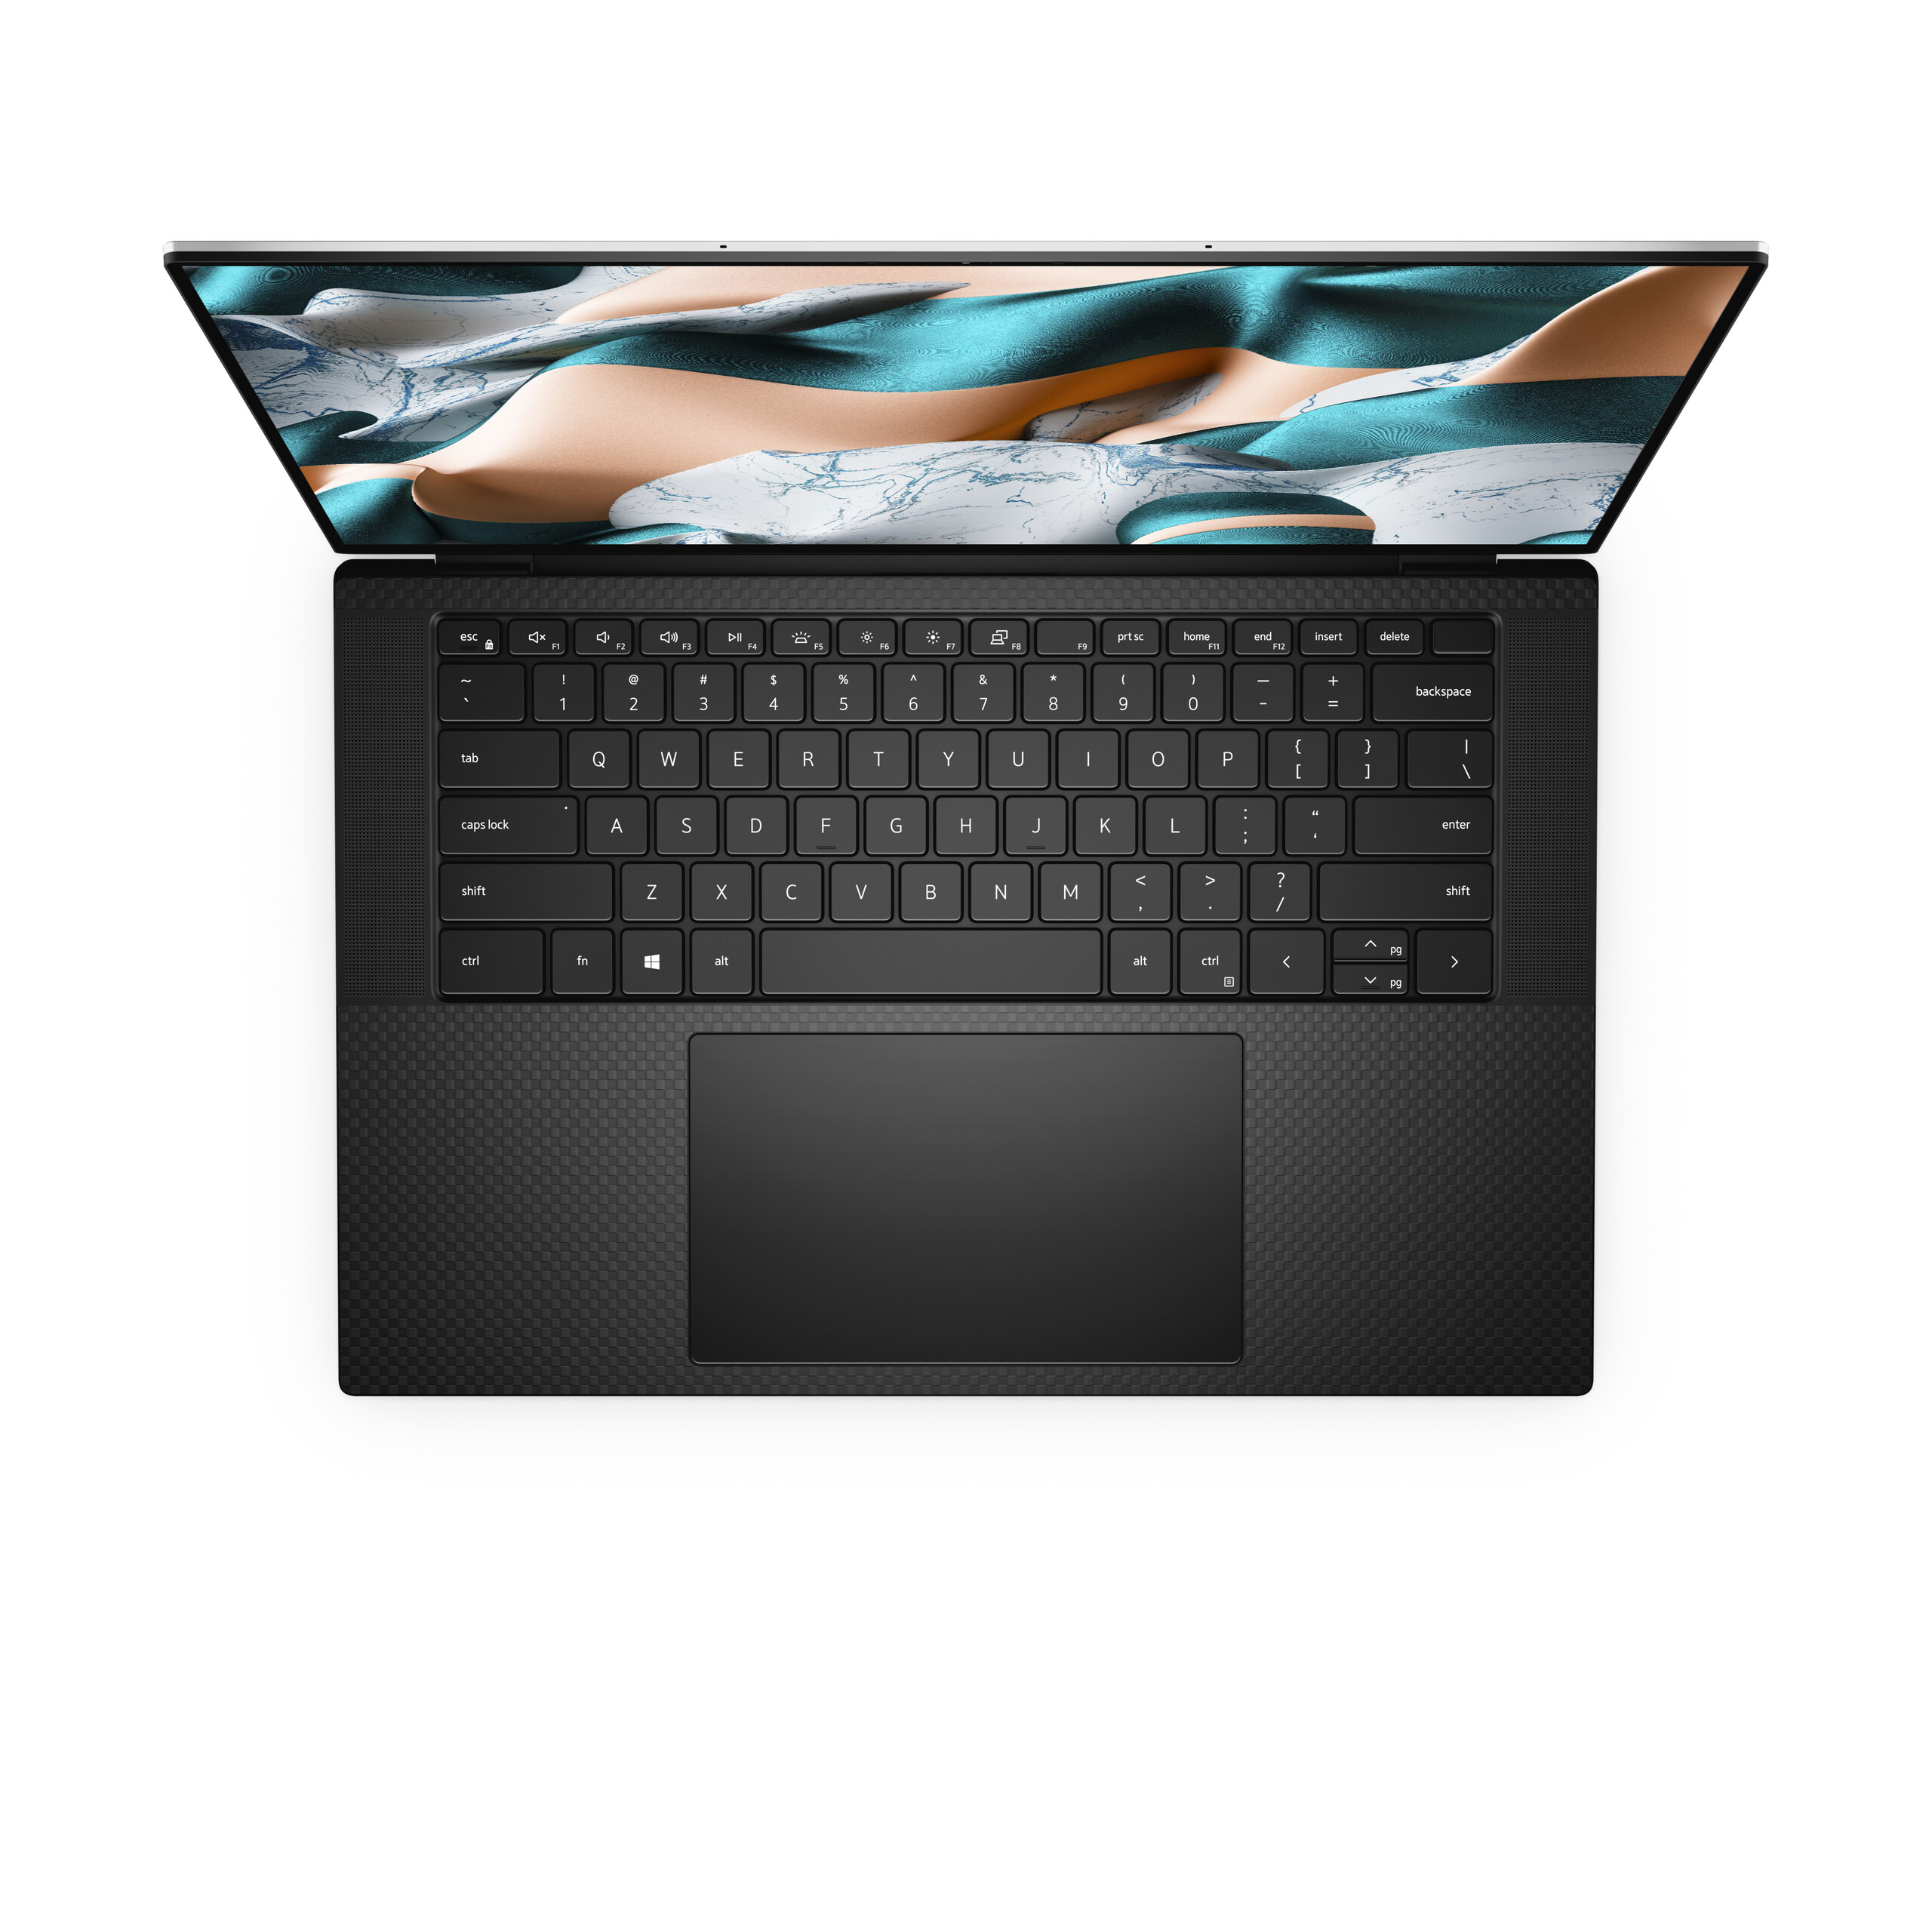
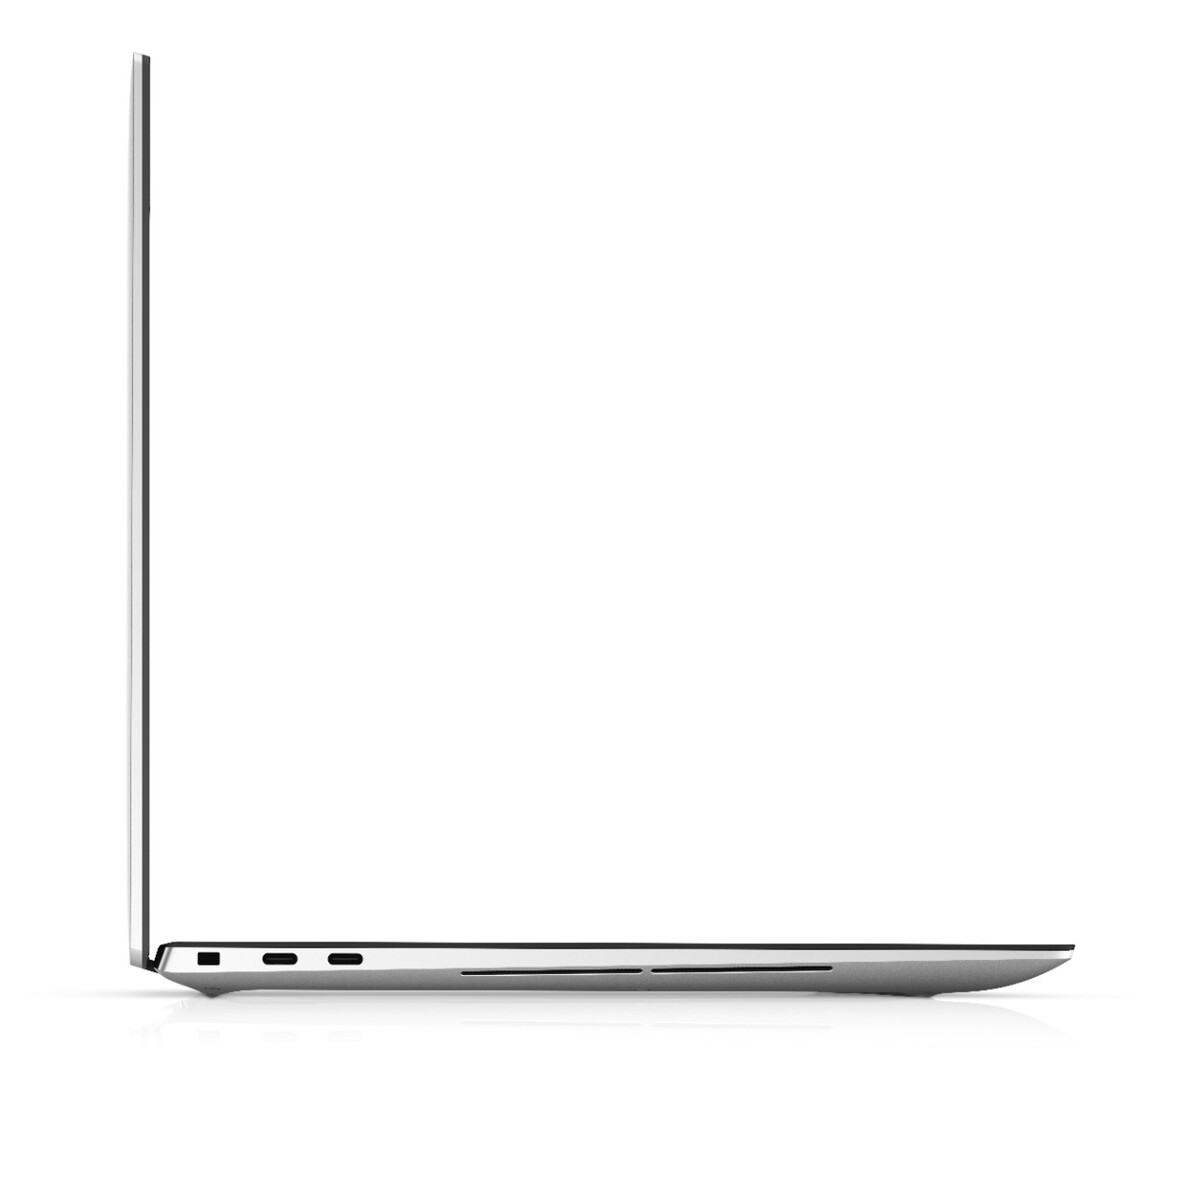
A melhor razão para escolher o XPS 15 9500 em vez do antigo XPS 15 7590 ainda é pela sua tela 16:10 porque esta mudança será imediatamente perceptível e benéfica para o usuário final em relação aos upgrades menores de desempenho da CPU ou GPU. Outras mudanças físicas como as dimensões menores, clickpad maior, áudio melhorado e melhor resposta do teclado ajudam a tornar o modelo mais novo muito melhor para usar do que o modelo de 2019. Nossos principais problemas com o sistema se relacionam principalmente com a super confiança do USB Type-C e a sustentabilidade do desempenho médio da GPU quando se joga. Felizmente, o anterior pode ser abordado com adaptadores, enquanto qualquer pessoa incomodada pelo segundo pode escolher entre muitas outras opções, desde Alienware até MSI, onde o desempenho da GPU é mais estável e, muitas vezes, mais rápido.
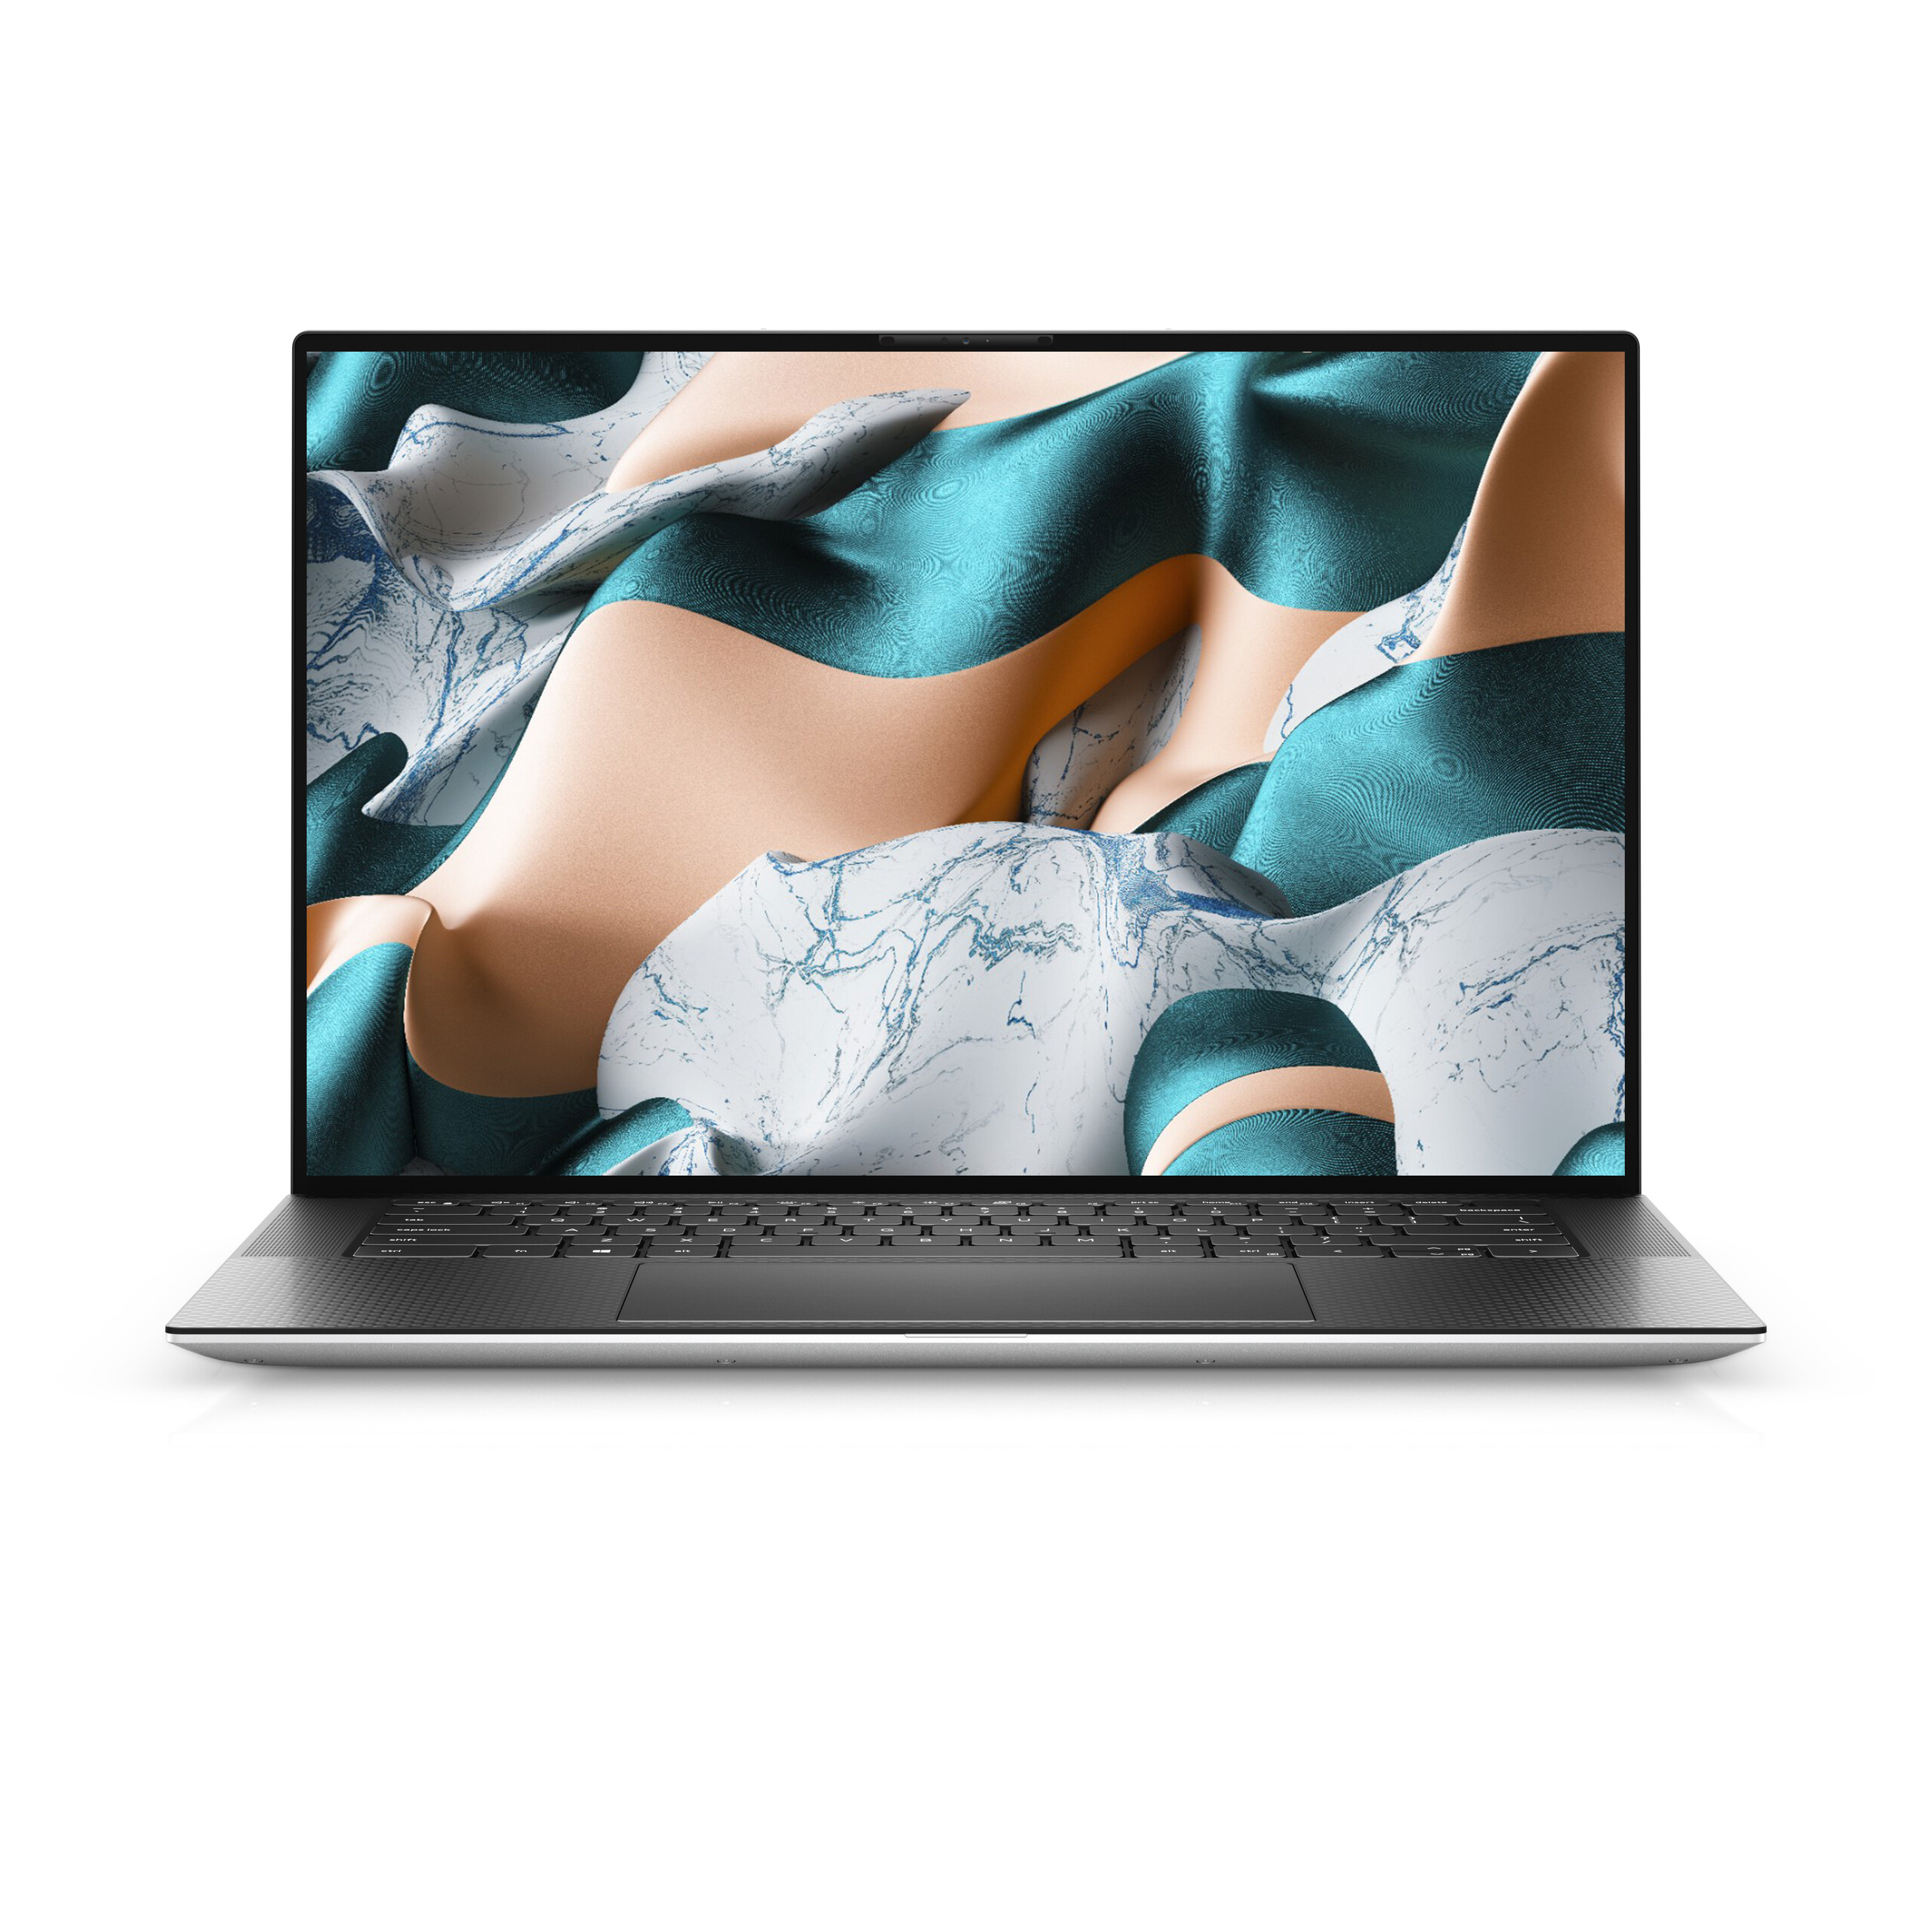
O XPS 15 2016 foi um catalisador para designs de Ultrabooks com marcos estreitos e o XPS 15 2020 provavelmente fará o mesmo para a telas 16:10. Apenas isso separa o XPS 15 9500 de outros Ultrabooks com Core H muito mais do que qualquer diferença de processador que você possa encontrar.
Dell XPS 15 9500 Core i7 4K UHD
- 06/09/2020 v7 (old)
Allen Ngo
Price comparison
