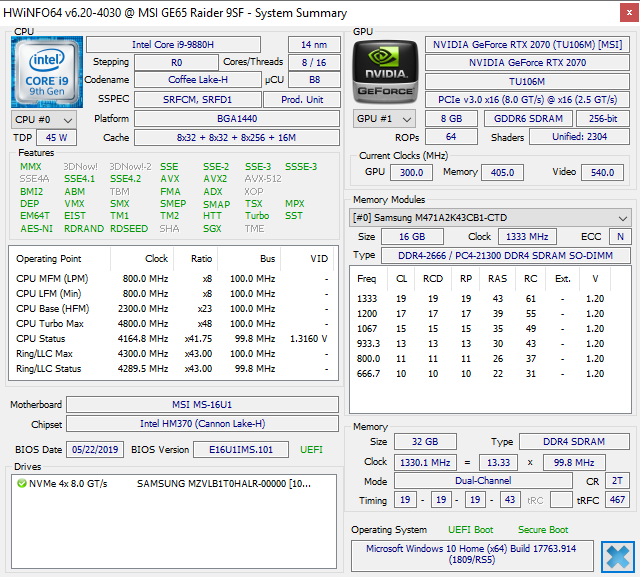
Breve Análise do Portátil MSI GE65 Raider 9SF: Grandes melhorias em relação ao GE63
Avaliação | Data | Modelo | Peso | Altura | Size | Resolução | Preço |
|---|---|---|---|---|---|---|---|
| 84.7 % v7 (old) | 12/2019 | MSI GE65 Raider 9SF-049US i9-9880H, GeForce RTX 2070 Mobile | 2.3 kg | 26.9 mm | 15.60" | 1920x1080 | |
| 84.8 % v7 (old) | Lenovo Legion Y740-15ICHg i7-9750H, GeForce RTX 2070 Max-Q | 2.3 kg | 25 mm | 15.60" | 1920x1080 | ||
| 83 % v7 (old) | 09/2019 | Alienware m15 R2 P87F i7-9750H, GeForce RTX 2080 Max-Q | 2.2 kg | 18.3 mm | 15.60" | 1920x1080 | |
| 81.1 % v7 (old) | Maingear Vector 15 i7-9750H, GeForce GTX 1660 Ti Mobile | 1.9 kg | 19.8 mm | 15.60" | 1920x1080 | ||
| 84.4 % v7 (old) | 08/2019 | Asus Strix GL531GV-PB74 i7-9750H, GeForce RTX 2060 Mobile | 2.4 kg | 25.9 mm | 15.60" | 1920x1080 |
| SD Card Reader | |
| average JPG Copy Test (av. of 3 runs) | |
| Dell XPS 15 7590 9980HK GTX 1650 (Toshiba Exceria Pro SDXC 64 GB UHS-II) | |
| MSI GS73 Stealth 8RF-011 (Toshiba Exceria Pro SDXC 64 GB UHS-II) | |
| HP Omen 15-dc1303ng (Toshiba Exceria Pro SDXC 64 GB UHS-II) | |
| MSI GE63 Raider 8SG (Toshiba Exceria Pro SDXC 64 GB UHS-II) | |
| MSI GE65 Raider 9SF-049US (Toshiba Exceria Pro SDXC 64 GB UHS-II) | |
| maximum AS SSD Seq Read Test (1GB) | |
| MSI GS73 Stealth 8RF-011 (Toshiba Exceria Pro SDXC 64 GB UHS-II) | |
| Dell XPS 15 7590 9980HK GTX 1650 (Toshiba Exceria Pro SDXC 64 GB UHS-II) | |
| HP Omen 15-dc1303ng (Toshiba Exceria Pro SDXC 64 GB UHS-II) | |
| MSI GE63 Raider 8SG (Toshiba Exceria Pro SDXC 64 GB UHS-II) | |
| MSI GE65 Raider 9SF-049US (Toshiba Exceria Pro SDXC 64 GB UHS-II) | |
| Networking | |
| iperf3 transmit AX12 | |
| MSI Prestige 15 A10SC | |
| Lenovo Legion Y740-15ICHg | |
| Asus Strix GL531GV-PB74 | |
| Alienware m15 R2 P87F | |
| iperf3 receive AX12 | |
| MSI Prestige 15 A10SC | |
| Asus Strix GL531GV-PB74 | |
| Alienware m15 R2 P87F | |
| Lenovo Legion Y740-15ICHg | |
| |||||||||||||||||||||||||
iluminação: 90 %
iluminação com acumulador: 277.4 cd/m²
Contraste: 1156:1 (Preto: 0.24 cd/m²)
ΔE ColorChecker Calman: 1.51 | ∀{0.5-29.43 Ø4.73}
calibrated: 1.77
ΔE Greyscale Calman: 3.7 | ∀{0.09-98 Ø4.97}
99.1% sRGB (Argyll 1.6.3 3D)
65.1% AdobeRGB 1998 (Argyll 1.6.3 3D)
70.7% AdobeRGB 1998 (Argyll 3D)
98.9% sRGB (Argyll 3D)
69.3% Display P3 (Argyll 3D)
Gamma: 2.23
CCT: 7061 K
| MSI GE65 Raider 9SF-049US Sharp LQ156M1JW03, IPS, 15.6", 1920x1080 | MSI GE63 Raider 8SG AU Optronics B156HAN07.1, IPS, 15.6", 1920x1080 | Lenovo Legion Y740-15ICHg BOE NV156FHM-N4J, IPS, 15.6", 1920x1080 | Alienware m15 R2 P87F Sharp LQ156M1, IPS, 15.6", 1920x1080 | Asus Strix GL531GV-PB74 Panda LM156LF-GL02, IPS, 15.6", 1920x1080 | Razer Blade 15 GTX 1660 Ti BOE NV156FHM-N4K, IPS, 15.6", 1920x1080 | |
|---|---|---|---|---|---|---|
| Display | -7% | -5% | -6% | -41% | -6% | |
| Display P3 Coverage (%) | 69.3 | 65.1 -6% | 67.7 -2% | 65.3 -6% | 40.13 -42% | 65.3 -6% |
| sRGB Coverage (%) | 98.9 | 91.7 -7% | 91.6 -7% | 95.1 -4% | 60.3 -39% | 91.8 -7% |
| AdobeRGB 1998 Coverage (%) | 70.7 | 65.9 -7% | 67.1 -5% | 65.9 -7% | 41.48 -41% | 66.5 -6% |
| Response Times | 17% | -17% | -2% | -113% | 4% | |
| Response Time Grey 50% / Grey 80% * (ms) | 13.2 ? | 8.8 ? 33% | 19 ? -44% | 16.4 ? -24% | 26 ? -97% | 13.6 ? -3% |
| Response Time Black / White * (ms) | 11.2 ? | 11.2 ? -0% | 10 ? 11% | 8.8 ? 21% | 25.6 ? -129% | 10 ? 11% |
| PWM Frequency (Hz) | 23150 ? | 23810 ? | 200 ? | |||
| Screen | -7% | 2% | -51% | -84% | -29% | |
| Brightness middle (cd/m²) | 277.4 | 268.3 -3% | 477 72% | 324.2 17% | 290.1 5% | 312.7 13% |
| Brightness (cd/m²) | 264 | 261 -1% | 431 63% | 304 15% | 274 4% | 305 16% |
| Brightness Distribution (%) | 90 | 84 -7% | 84 -7% | 90 0% | 86 -4% | 90 0% |
| Black Level * (cd/m²) | 0.24 | 0.2 17% | 0.175 27% | 0.38 -58% | 0.54 -125% | 0.27 -13% |
| Contrast (:1) | 1156 | 1342 16% | 2726 136% | 853 -26% | 537 -54% | 1158 0% |
| Colorchecker dE 2000 * | 1.51 | 2.65 -75% | 4.17 -176% | 5.01 -232% | 5.16 -242% | 4.57 -203% |
| Colorchecker dE 2000 max. * | 4.93 | 4.67 5% | 6.97 -41% | 12.7 -158% | 18.09 -267% | 6.81 -38% |
| Colorchecker dE 2000 calibrated * | 1.77 | 2.76 -56% | 2.51 -42% | 1.64 7% | 4.35 -146% | 2.91 -64% |
| Greyscale dE 2000 * | 3.7 | 2.2 41% | 3.49 6% | 7.9 -114% | 4.4 -19% | 4.3 -16% |
| Gamma | 2.23 99% | 2.33 94% | 2.5 88% | 2.35 94% | 2.1 105% | 2.29 96% |
| CCT | 7061 92% | 6862 95% | 7076 92% | 8455 77% | 7362 88% | 7098 92% |
| Color Space (Percent of AdobeRGB 1998) (%) | 65.1 | 59.3 -9% | 60 -8% | 60.8 -7% | 38.1 -41% | 59.4 -9% |
| Color Space (Percent of sRGB) (%) | 99.1 | 93.3 -6% | 91 -8% | 95.5 -4% | 60 -39% | 91.3 -8% |
| Média Total (Programa/Configurações) | 1% /
-4% | -7% /
-2% | -20% /
-36% | -79% /
-80% | -10% /
-21% |
* ... menor é melhor
Exibir tempos de resposta
| ↔ Tempo de resposta preto para branco | ||
|---|---|---|
| 11.2 ms ... ascensão ↗ e queda ↘ combinadas | ↗ 6 ms ascensão | 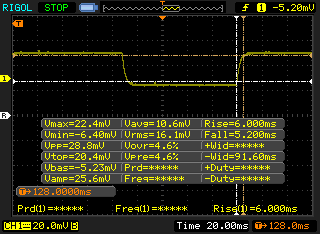 |
| ↘ 5.2 ms queda | ||
| A tela mostra boas taxas de resposta em nossos testes, mas pode ser muito lenta para jogadores competitivos. Em comparação, todos os dispositivos testados variam de 0.1 (mínimo) a 240 (máximo) ms. » 30 % de todos os dispositivos são melhores. Isso significa que o tempo de resposta medido é melhor que a média de todos os dispositivos testados (19.9 ms). | ||
| ↔ Tempo de resposta 50% cinza a 80% cinza | ||
| 13.2 ms ... ascensão ↗ e queda ↘ combinadas | ↗ 7.2 ms ascensão | 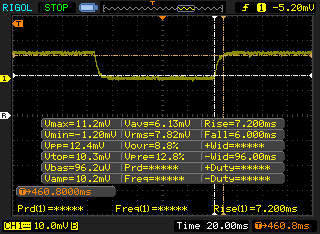 |
| ↘ 6 ms queda | ||
| A tela mostra boas taxas de resposta em nossos testes, mas pode ser muito lenta para jogadores competitivos. Em comparação, todos os dispositivos testados variam de 0.165 (mínimo) a 636 (máximo) ms. » 27 % de todos os dispositivos são melhores. Isso significa que o tempo de resposta medido é melhor que a média de todos os dispositivos testados (31.1 ms). | ||
Cintilação da tela / PWM (modulação por largura de pulso)
| Tela tremeluzindo/PWM detectado | 23150 Hz | ≤ 19 % configuração de brilho | 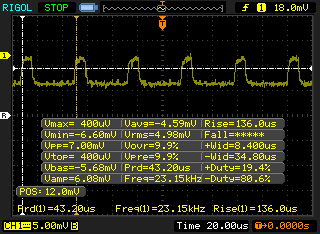 |
A luz de fundo da tela pisca em 23150 Hz (pior caso, por exemplo, utilizando PWM) Cintilação detectada em uma configuração de brilho de 19 % e abaixo. Não deve haver cintilação ou PWM acima desta configuração de brilho. A frequência de 23150 Hz é bastante alta, então a maioria dos usuários sensíveis ao PWM não deve notar nenhuma oscilação. [pwm_comparison] Em comparação: 52 % de todos os dispositivos testados não usam PWM para escurecer a tela. Se PWM foi detectado, uma média de 7794 (mínimo: 5 - máximo: 343500) Hz foi medida. | |||
| Cinebench R20 | |
| CPU (Single Core) | |
| AMD Radeon RX Vega 64 | |
| Eurocom Sky X4C i9-9900KS | |
| Medion Erazer X15805 | |
| Eurocom Nightsky RX15 | |
| MSI GE65 Raider 9SF-049US | |
| MSI Prestige 15 A10SC | |
| Média Intel Core i9-9880H (441 - 474, n=7) | |
| Lenovo Yoga C940-15IRH | |
| Dell G3 3590 | |
| Schenker Key 16 | |
| Razer Blade Stealth i7-1065G7 Iris Plus | |
| Asus Zephyrus GX501 | |
| CPU (Multi Core) | |
| AMD Radeon RX Vega 64 | |
| Eurocom Sky X4C i9-9900KS | |
| Eurocom Nightsky RX15 | |
| MSI GE65 Raider 9SF-049US | |
| Média Intel Core i9-9880H (2953 - 3712, n=7) | |
| Medion Erazer X15805 | |
| Lenovo Yoga C940-15IRH | |
| MSI Prestige 15 A10SC | |
| Schenker Key 16 | |
| Dell G3 3590 | |
| Asus Zephyrus GX501 | |
| Razer Blade Stealth i7-1065G7 Iris Plus | |
| Cinebench R15 | |
| CPU Single 64Bit | |
| Eurocom Sky X4C i9-9900KS | |
| AMD Radeon RX Vega 64 | |
| Medion Erazer X15805 | |
| Eurocom Nightsky RX15 | |
| MSI GE65 Raider 9SF-049US | |
| MSI Prestige 15 A10SC | |
| Média Intel Core i9-9880H (181 - 198, n=11) | |
| Lenovo Yoga C940-15IRH | |
| Dell G3 3590 | |
| Schenker Key 16 | |
| Asus Zephyrus GX501 | |
| Razer Blade Stealth i7-1065G7 Iris Plus | |
| CPU Multi 64Bit | |
| AMD Radeon RX Vega 64 | |
| Eurocom Sky X4C i9-9900KS | |
| Eurocom Nightsky RX15 | |
| MSI GE65 Raider 9SF-049US | |
| Média Intel Core i9-9880H (1317 - 1721, n=11) | |
| Lenovo Yoga C940-15IRH | |
| Medion Erazer X15805 | |
| Schenker Key 16 | |
| MSI Prestige 15 A10SC | |
| Dell G3 3590 | |
| Asus Zephyrus GX501 | |
| Razer Blade Stealth i7-1065G7 Iris Plus | |
| PCMark 10 | |
| Score | |
| MSI GE65 Raider 9SF-049US | |
| Eurocom Nightsky RX15 | |
| Média Intel Core i9-9880H, NVIDIA GeForce RTX 2070 Mobile (5826 - 6452, n=2) | |
| Lenovo Legion Y740-15ICHg | |
| Alienware m15 R2 P87F | |
| MSI GE63 Raider 8SG | |
| Essentials | |
| MSI GE65 Raider 9SF-049US | |
| Eurocom Nightsky RX15 | |
| Média Intel Core i9-9880H, NVIDIA GeForce RTX 2070 Mobile (9146 - 9752, n=2) | |
| Lenovo Legion Y740-15ICHg | |
| MSI GE63 Raider 8SG | |
| Alienware m15 R2 P87F | |
| Productivity | |
| MSI GE65 Raider 9SF-049US | |
| Eurocom Nightsky RX15 | |
| Média Intel Core i9-9880H, NVIDIA GeForce RTX 2070 Mobile (8025 - 8273, n=2) | |
| Lenovo Legion Y740-15ICHg | |
| Alienware m15 R2 P87F | |
| MSI GE63 Raider 8SG | |
| Digital Content Creation | |
| MSI GE65 Raider 9SF-049US | |
| Eurocom Nightsky RX15 | |
| Lenovo Legion Y740-15ICHg | |
| Média Intel Core i9-9880H, NVIDIA GeForce RTX 2070 Mobile (7311 - 9034, n=2) | |
| Alienware m15 R2 P87F | |
| MSI GE63 Raider 8SG | |
| PCMark 8 | |
| Home Score Accelerated v2 | |
| Lenovo Legion Y740-15ICHg | |
| MSI GE65 Raider 9SF-049US | |
| Média Intel Core i9-9880H, NVIDIA GeForce RTX 2070 Mobile (4578 - 4679, n=2) | |
| Alienware m15 R2 P87F | |
| MSI GE63 Raider 8SG | |
| Eurocom Nightsky RX15 | |
| Work Score Accelerated v2 | |
| MSI GE65 Raider 9SF-049US | |
| Média Intel Core i9-9880H, NVIDIA GeForce RTX 2070 Mobile (5919 - 6095, n=2) | |
| Lenovo Legion Y740-15ICHg | |
| Alienware m15 R2 P87F | |
| MSI GE63 Raider 8SG | |
| Eurocom Nightsky RX15 | |
| PCMark 8 Home Score Accelerated v2 | 4679 pontos | |
| PCMark 8 Work Score Accelerated v2 | 6095 pontos | |
| PCMark 10 Score | 6452 pontos | |
Ajuda | ||
| MSI GE65 Raider 9SF-049US Samsung SSD PM981 MZVLB1T0HALR | MSI GE63 Raider 8SG WDC PC SN520 SDAPNUW-512G | Lenovo Legion Y740-15ICHg WDC PC SN520 SDAPMUW-128G | Alienware m15 R2 P87F 2x Toshiba XG6 KXG60ZNV512G (RAID 0) | Asus Strix GL531GV-PB74 Intel SSD 660p SSDPEKNW512G8 | MSI GE75 9SG Samsung SSD PM981 MZVLB1T0HALR | |
|---|---|---|---|---|---|---|
| AS SSD | -31% | -39% | -1% | -19% | 2% | |
| Seq Read (MB/s) | 1211 | 904 -25% | 1372 13% | 1925 59% | 1280 6% | 1358 12% |
| Seq Write (MB/s) | 2420 | 1344 -44% | 746 -69% | 2371 -2% | 905 -63% | 2381 -2% |
| 4K Read (MB/s) | 27.11 | 24.99 -8% | 35.42 31% | 37.2 37% | 48.73 80% | 27.02 0% |
| 4K Write (MB/s) | 88.9 | 107.4 21% | 99.9 12% | 108.9 22% | 107 20% | 89.2 0% |
| 4K-64 Read (MB/s) | 1665 | 631 -62% | 302.1 -82% | 1177 -29% | 321.1 -81% | 1642 -1% |
| 4K-64 Write (MB/s) | 1831 | 731 -60% | 191.4 -90% | 1135 -38% | 761 -58% | 1799 -2% |
| Access Time Read * (ms) | 0.089 | 0.131 -47% | 0.132 -48% | 0.065 27% | 0.058 35% | 0.067 25% |
| Access Time Write * (ms) | 0.208 | 0.099 52% | 0.037 82% | 0.108 48% | 0.046 78% | 0.05 76% |
| Score Read (Points) | 1813 | 746 -59% | 475 -74% | 1407 -22% | 498 -73% | 1805 0% |
| Score Write (Points) | 2162 | 973 -55% | 366 -83% | 1481 -31% | 958 -56% | 2127 -2% |
| Score Total (Points) | 4956 | 2126 -57% | 1065 -79% | 3633 -27% | 1711 -65% | 4899 -1% |
| Copy ISO MB/s (MB/s) | 2483 | 1187 -52% | 1062 -57% | 2073 -17% | 1519 -39% | 3193 29% |
| Copy Program MB/s (MB/s) | 776 | 673 -13% | 426 -45% | 576 -26% | 749 -3% | 198.2 -74% |
| Copy Game MB/s (MB/s) | 1621 | 1295 -20% | 650 -60% | 1426 -12% | 943 -42% | 1054 -35% |
* ... menor é melhor

| 3DMark 11 | |
| 1280x720 Performance GPU | |
| MSI RTX 2080 Ti Gaming X Trio | |
| Asus ROG Strix RTX 2080 OC | |
| Eurocom Sky X4C i9-9900KS | |
| Asus ROG Strix RTX 2070 OC | |
| Asus ROG Zephyrus S GX701GXR | |
| MSI GE65 Raider 9SF-049US | |
| Média NVIDIA GeForce RTX 2070 Mobile (23335 - 27298, n=21) | |
| Walmart EVOO Gaming 17 | |
| Alienware 17 R5 | |
| Schenker XMG Neo 15 XNE15M19 | |
| Maingear Vector 15 | |
| Lenovo IdeaPad L340-15IRH 81LK00BMGE | |
| Asus Zephyrus S GX531GM | |
| 1280x720 Performance Combined | |
| Eurocom Sky X4C i9-9900KS | |
| MSI RTX 2080 Ti Gaming X Trio | |
| MSI GE65 Raider 9SF-049US | |
| Asus ROG Strix RTX 2070 OC | |
| Asus ROG Strix RTX 2080 OC | |
| Média NVIDIA GeForce RTX 2070 Mobile (8716 - 16364, n=21) | |
| Walmart EVOO Gaming 17 | |
| Maingear Vector 15 | |
| Schenker XMG Neo 15 XNE15M19 | |
| Alienware 17 R5 | |
| Asus ROG Zephyrus S GX701GXR | |
| Lenovo IdeaPad L340-15IRH 81LK00BMGE | |
| Asus Zephyrus S GX531GM | |
| 3DMark 11 Performance | 22592 pontos | |
| 3DMark Cloud Gate Standard Score | 48855 pontos | |
| 3DMark Fire Strike Score | 18601 pontos | |
| 3DMark Time Spy Score | 8110 pontos | |
Ajuda | ||
| Shadow of the Tomb Raider - 1920x1080 Highest Preset AA:T | |
| Corsair One i160 | |
| Eurocom Sky X4C i9-9900KS | |
| Razer Blade Pro 17 4K UHD 120 Hz | |
| MSI GE65 Raider 9SF-049US | |
| Média NVIDIA GeForce RTX 2070 Mobile (74.2 - 97, n=11) | |
| Schenker XMG Ultra 17 Coffee Lake Refresh | |
| Walmart EVOO Gaming 17 | |
| Razer Blade 15 GTX 1660 Ti | |
| Lenovo Yoga C940-15IRH | |
| Asus Zephyrus S GX531GM | |
| The Witcher 3 - 1920x1080 Ultra Graphics & Postprocessing (HBAO+) | |
| Corsair One i160 | |
| Eurocom Sky X4C i9-9900KS | |
| Razer Blade Pro 17 4K UHD 120 Hz | |
| MSI GE65 Raider 9SF-049US | |
| Média NVIDIA GeForce RTX 2070 Mobile (64 - 82.1, n=21) | |
| Walmart EVOO Gaming 17 | |
| Schenker XMG Ultra 17 Coffee Lake Refresh | |
| Razer Blade 15 GTX 1660 Ti | |
| Asus Zephyrus S GX531GM | |
| Lenovo Yoga C940-15IRH | |
| baixo | média | alto | ultra | |
|---|---|---|---|---|
| BioShock Infinite (2013) | 325 | 309.3 | 292.5 | 170 |
| The Witcher 3 (2015) | 290.1 | 241.3 | 152.3 | 78.4 |
| Shadow of the Tomb Raider (2018) | 143 | 107 | 101 | 95 |
| MSI GE65 Raider 9SF-049US GeForce RTX 2070 Mobile, i9-9880H, Samsung SSD PM981 MZVLB1T0HALR | MSI GE63 Raider 8SG GeForce RTX 2080 Mobile, i7-8750H, WDC PC SN520 SDAPNUW-512G | Lenovo Legion Y740-15ICHg GeForce RTX 2070 Max-Q, i7-9750H, WDC PC SN520 SDAPMUW-128G | Asus Strix GL531GV-PB74 GeForce RTX 2060 Mobile, i7-9750H, Intel SSD 660p SSDPEKNW512G8 | Eurocom Nightsky RX15 GeForce RTX 2070 Mobile, i9-9980HK, Samsung SSD 970 Pro 512GB | Razer Blade 15 RTX 2080 Max-Q GeForce RTX 2080 Max-Q, i7-9750H, Samsung SSD PM981 MZVLB512HAJQ | |
|---|---|---|---|---|---|---|
| Noise | -3% | 6% | 2% | 0% | 13% | |
| desligado / ambiente * (dB) | 28.8 | 28.5 1% | 30 -4% | 28.2 2% | 28.2 2% | 28.3 2% |
| Idle Minimum * (dB) | 33 | 33.9 -3% | 31.3 5% | 28.8 13% | 28.2 15% | 28.8 13% |
| Idle Average * (dB) | 33 | 33.9 -3% | 31.3 5% | 31.4 5% | 28.2 15% | 28.8 13% |
| Idle Maximum * (dB) | 33.1 | 34.3 -4% | 31.3 5% | 33.3 -1% | 31.7 4% | 29 12% |
| Load Average * (dB) | 38 | 39.5 -4% | 42 -11% | 46.2 -22% | 53.7 -41% | 33.5 12% |
| Witcher 3 ultra * (dB) | 52.9 | 56.2 -6% | 42.1 20% | 50.5 5% | 53.7 -2% | 45 15% |
| Load Maximum * (dB) | 57.8 | 57.2 1% | 46.5 20% | 51.3 11% | 53.7 7% | 45.2 22% |
* ... menor é melhor
Barulho
| Ocioso |
| 33 / 33 / 33.1 dB |
| Carga |
| 38 / 57.8 dB |
 | ||
30 dB silencioso 40 dB(A) audível 50 dB(A) ruidosamente alto |
||
min: | ||
(±) A temperatura máxima no lado superior é 45 °C / 113 F, em comparação com a média de 40.4 °C / 105 F , variando de 21.2 a 68.8 °C para a classe Gaming.
(-) A parte inferior aquece até um máximo de 53 °C / 127 F, em comparação com a média de 43.2 °C / 110 F
(+) Em uso inativo, a temperatura média para o lado superior é 25.8 °C / 78 F, em comparação com a média do dispositivo de 33.9 °C / ### class_avg_f### F.
(±) Jogando The Witcher 3, a temperatura média para o lado superior é 33.4 °C / 92 F, em comparação com a média do dispositivo de 33.9 °C / ## #class_avg_f### F.
(+) Os apoios para as mãos e o touchpad são mais frios que a temperatura da pele, com um máximo de 29 °C / 84.2 F e, portanto, são frios ao toque.
(±) A temperatura média da área do apoio para as mãos de dispositivos semelhantes foi 28.8 °C / 83.8 F (-0.2 °C / -0.4 F).
MSI GE65 Raider 9SF-049US análise de áudio
(+) | os alto-falantes podem tocar relativamente alto (###valor### dB)
Graves 100 - 315Hz
(-) | quase nenhum baixo - em média 20.5% menor que a mediana
(±) | a linearidade dos graves é média (8.8% delta para a frequência anterior)
Médios 400 - 2.000 Hz
(+) | médios equilibrados - apenas 3.3% longe da mediana
(+) | médios são lineares (4.6% delta para frequência anterior)
Altos 2 - 16 kHz
(+) | agudos equilibrados - apenas 1.4% longe da mediana
(+) | os máximos são lineares (5% delta da frequência anterior)
Geral 100 - 16.000 Hz
(±) | a linearidade do som geral é média (15.6% diferença em relação à mediana)
Comparado com a mesma classe
» 36% de todos os dispositivos testados nesta classe foram melhores, 6% semelhantes, 58% piores
» O melhor teve um delta de 6%, a média foi 18%, o pior foi 132%
Comparado com todos os dispositivos testados
» 23% de todos os dispositivos testados foram melhores, 5% semelhantes, 72% piores
» O melhor teve um delta de 4%, a média foi 24%, o pior foi 134%
Apple MacBook 12 (Early 2016) 1.1 GHz análise de áudio
(+) | os alto-falantes podem tocar relativamente alto (###valor### dB)
Graves 100 - 315Hz
(±) | graves reduzidos - em média 11.3% menor que a mediana
(±) | a linearidade dos graves é média (14.2% delta para a frequência anterior)
Médios 400 - 2.000 Hz
(+) | médios equilibrados - apenas 2.4% longe da mediana
(+) | médios são lineares (5.5% delta para frequência anterior)
Altos 2 - 16 kHz
(+) | agudos equilibrados - apenas 2% longe da mediana
(+) | os máximos são lineares (4.5% delta da frequência anterior)
Geral 100 - 16.000 Hz
(+) | o som geral é linear (10.2% diferença em relação à mediana)
Comparado com a mesma classe
» 7% de todos os dispositivos testados nesta classe foram melhores, 2% semelhantes, 91% piores
» O melhor teve um delta de 5%, a média foi 18%, o pior foi 53%
Comparado com todos os dispositivos testados
» 5% de todos os dispositivos testados foram melhores, 1% semelhantes, 94% piores
» O melhor teve um delta de 4%, a média foi 24%, o pior foi 134%
| desligado | |
| Ocioso | |
| Carga |
|
Key:
min: | |
| MSI GE65 Raider 9SF-049US i9-9880H, GeForce RTX 2070 Mobile, Samsung SSD PM981 MZVLB1T0HALR, IPS, 1920x1080, 15.6" | Eurocom Nightsky RX15 i9-9980HK, GeForce RTX 2070 Mobile, Samsung SSD 970 Pro 512GB, OLED, 3840x2160, 15.6" | Maingear Vector 15 i7-9750H, GeForce GTX 1660 Ti Mobile, , IPS, 1920x1080, 15.6" | Razer Blade 15 RTX 2080 Max-Q i7-9750H, GeForce RTX 2080 Max-Q, Samsung SSD PM981 MZVLB512HAJQ, IPS, 1920x1080, 15.6" | MSI P65 Creator 9SF-657 i9-9880H, GeForce RTX 2070 Max-Q, 2x Samsung SSD PM981 MZVLB512HAJQ (RAID 0), IPS, 3840x2160, 15.6" | MSI GE63 Raider RGB 8RF-008 i7-8750H, GeForce GTX 1070 Mobile, Samsung SSD PM871a MZNLN256HMHQ, TN, 1920x1080, 15.6" | |
|---|---|---|---|---|---|---|
| Power Consumption | -13% | 2% | 14% | 14% | 17% | |
| Idle Minimum * (Watt) | 15 | 12.6 16% | 16.2 -8% | 12.5 17% | 9.4 37% | 9 40% |
| Idle Average * (Watt) | 18.5 | 21.4 -16% | 21.1 -14% | 15.3 17% | 17.4 6% | 14 24% |
| Idle Maximum * (Watt) | 20.2 | 34.4 -70% | 26.4 -31% | 20.7 -2% | 19.6 3% | 19 6% |
| Load Average * (Watt) | 110.9 | 123.2 -11% | 85.1 23% | 90.2 19% | 103 7% | 91 18% |
| Witcher 3 ultra * (Watt) | 187.3 | 192.4 -3% | 158.2 16% | 162 14% | 182 3% | |
| Load Maximum * (Watt) | 260 | 246.6 5% | 188 28% | 209.3 19% | 216 17% | 238 8% |
* ... menor é melhor
| MSI GE65 Raider 9SF-049US i9-9880H, GeForce RTX 2070 Mobile, 51 Wh | MSI GE63 Raider 8SG i7-8750H, GeForce RTX 2080 Mobile, 51 Wh | Razer Blade 15 RTX 2080 Max-Q i7-9750H, GeForce RTX 2080 Max-Q, 80 Wh | Walmart EVOO Gaming 17 i7-9750H, GeForce RTX 2060 Mobile, 46 Wh | Maingear Vector 15 i7-9750H, GeForce GTX 1660 Ti Mobile, 62 Wh | HP Omen 15-dc1303ng i7-8750H, GeForce RTX 2070 Max-Q, 70 Wh | |
|---|---|---|---|---|---|---|
| Duração da bateria | 15% | 141% | 17% | 67% | 24% | |
| Reader / Idle (h) | 6.2 | 6.2 0% | 15.9 156% | 5 -19% | ||
| WiFi v1.3 (h) | 3.6 | 4 11% | 6.6 83% | 4.2 17% | 6 67% | 3.3 -8% |
| Load (h) | 0.6 | 0.8 33% | 1.7 183% | 1.2 100% |
Pro
Contra
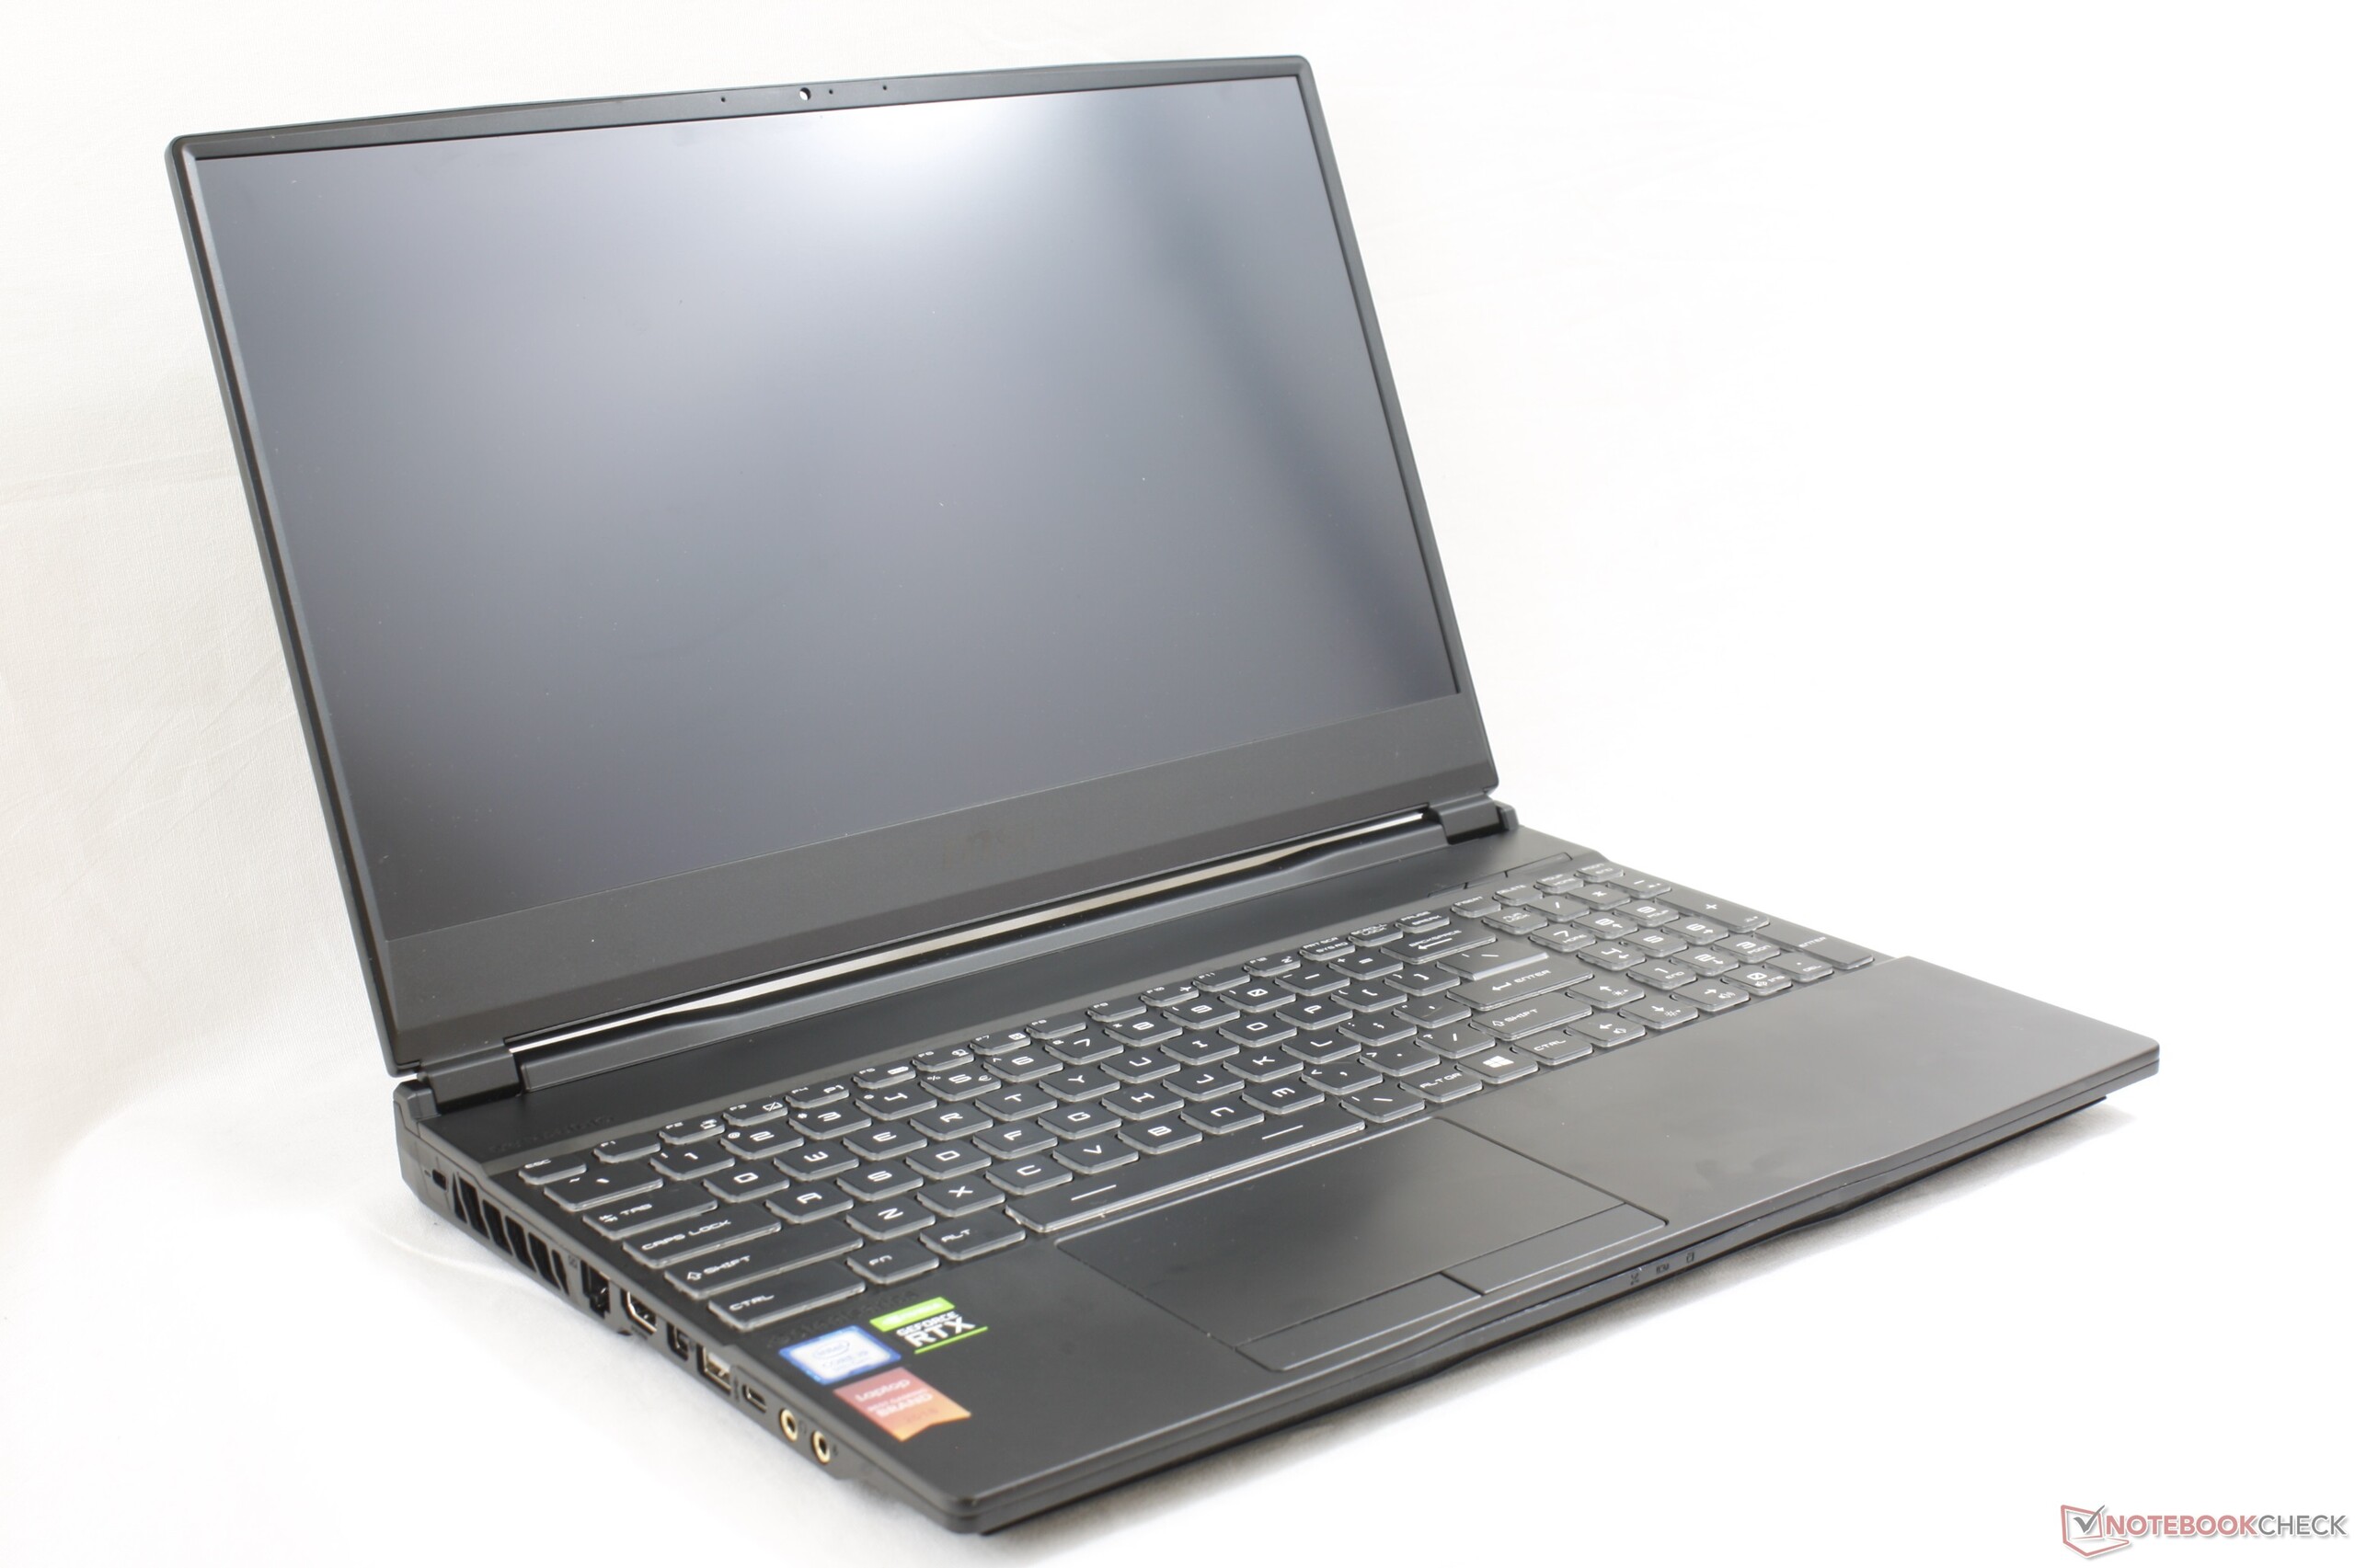
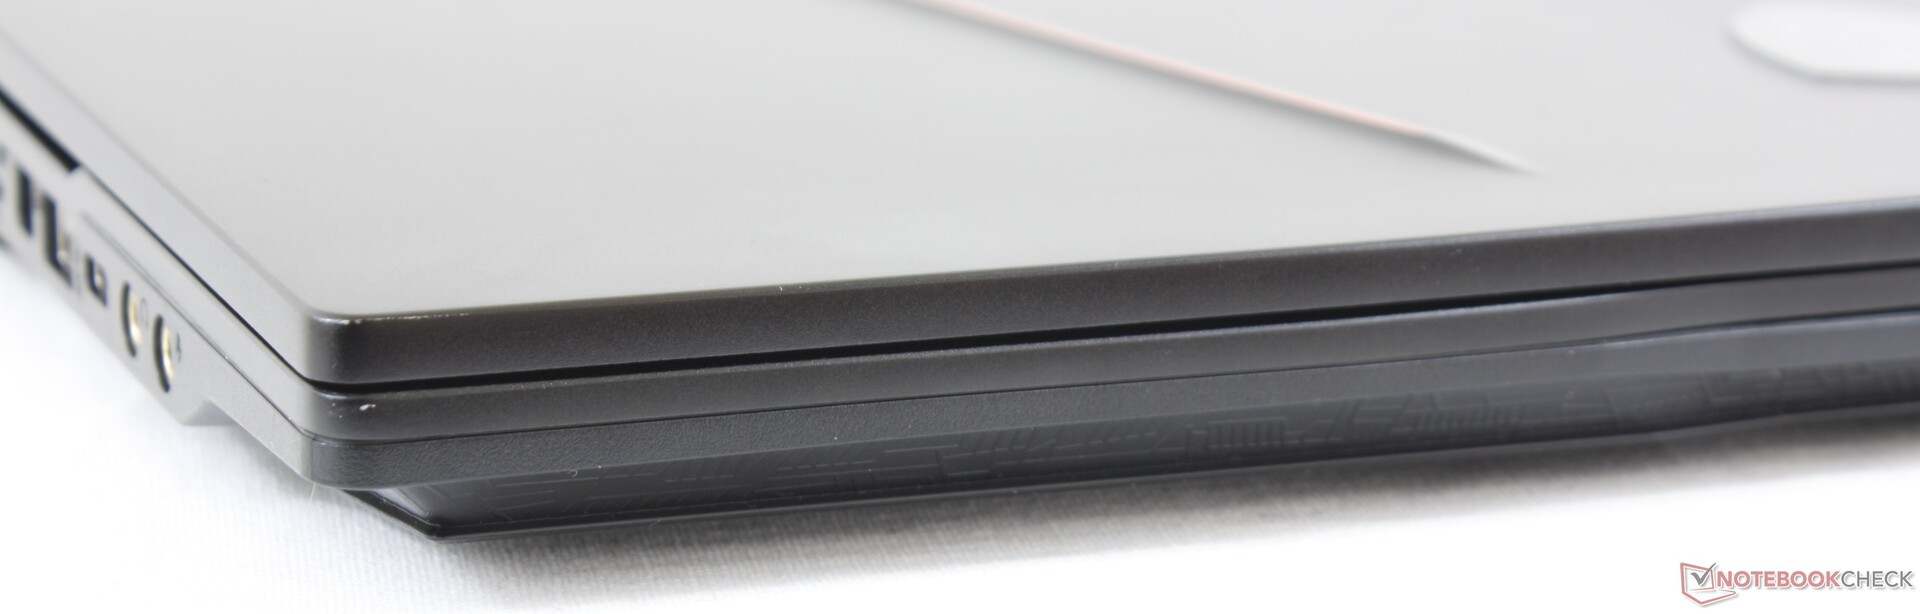
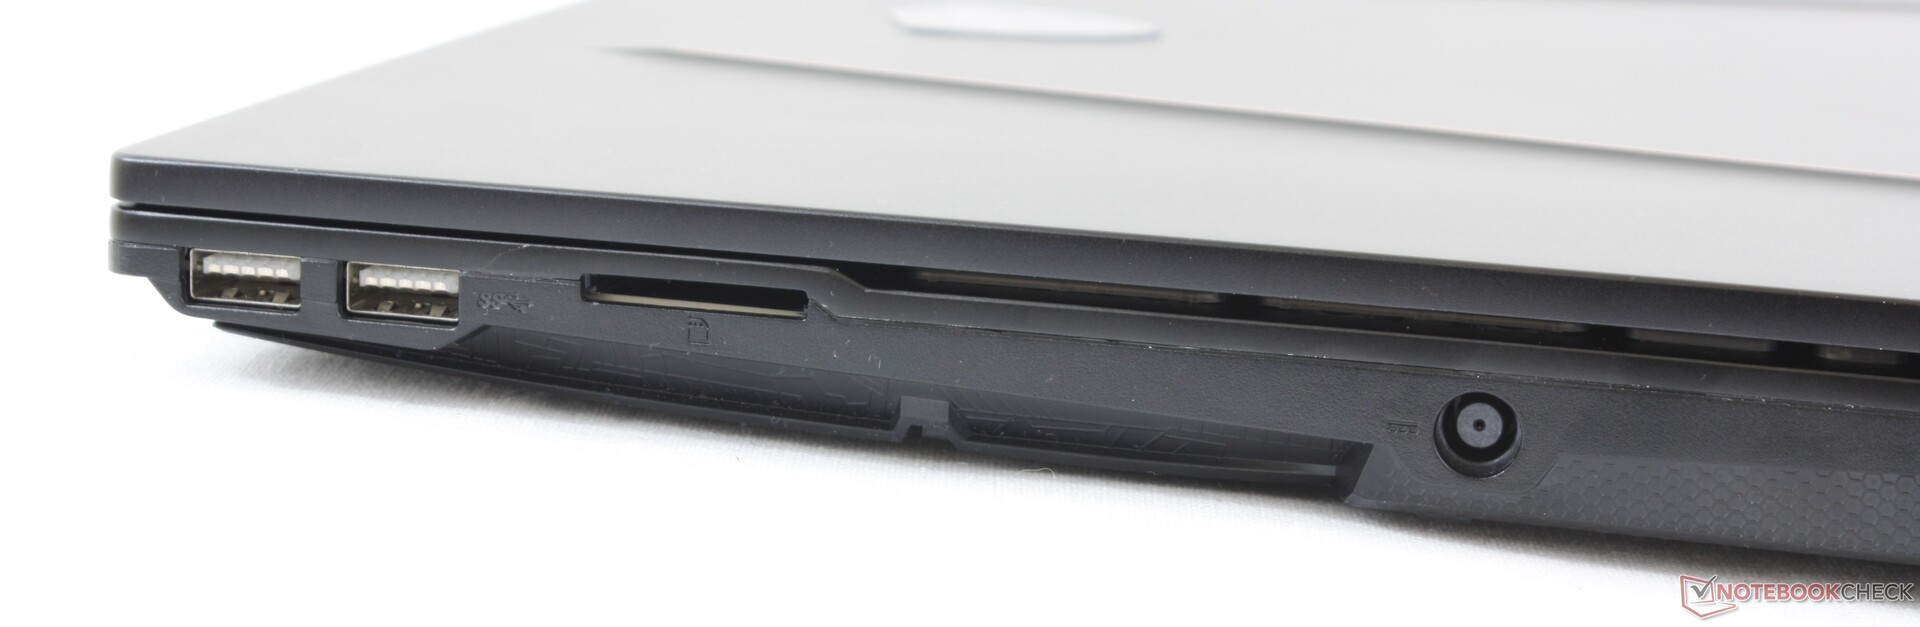
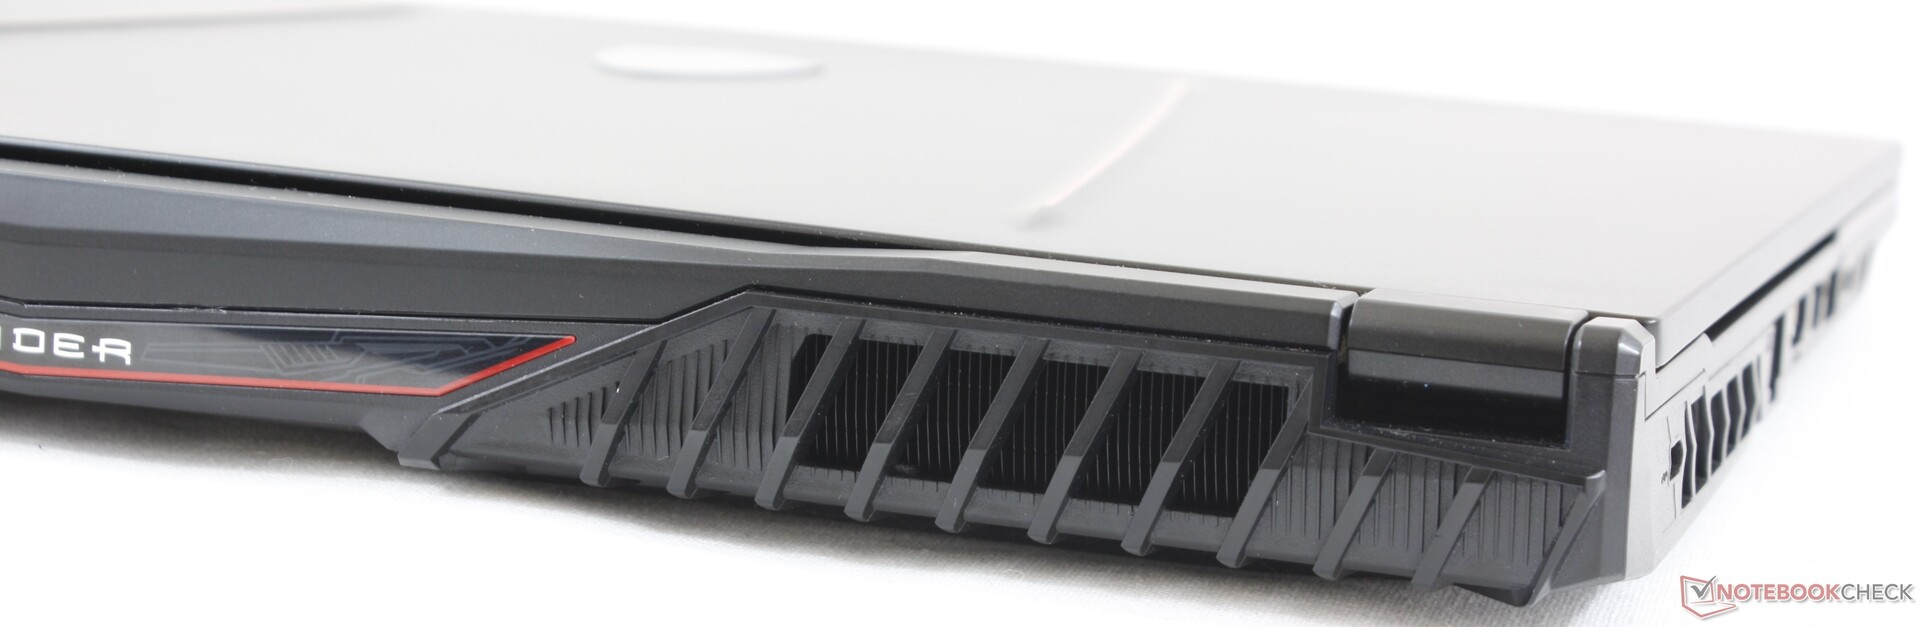
Pegue o GE63, corte um pouco pelas laterais e você acaba com o GE65. A mais recente máquina de gama média da MSI mantém tudo o que gostamos no GE63 enquanto atualiza alguns dos aspectos que não gostamos no processo. Quer dizer que a série agora é visivelmente mais compacta e mais apta para viagens do que antes, sem ser mais barulhenta ou mais quente.
Por outro lado, algumas características menos desejáveis não melhoraram de modo geral entre gerações. O brilho da tela, as portas, a duração da bateria, a rigidez do chassi e o ruído são praticamente os mesmos do GE63. Como resultado, a escolha do GE65 sobre o GE63 será amplamente superficial.
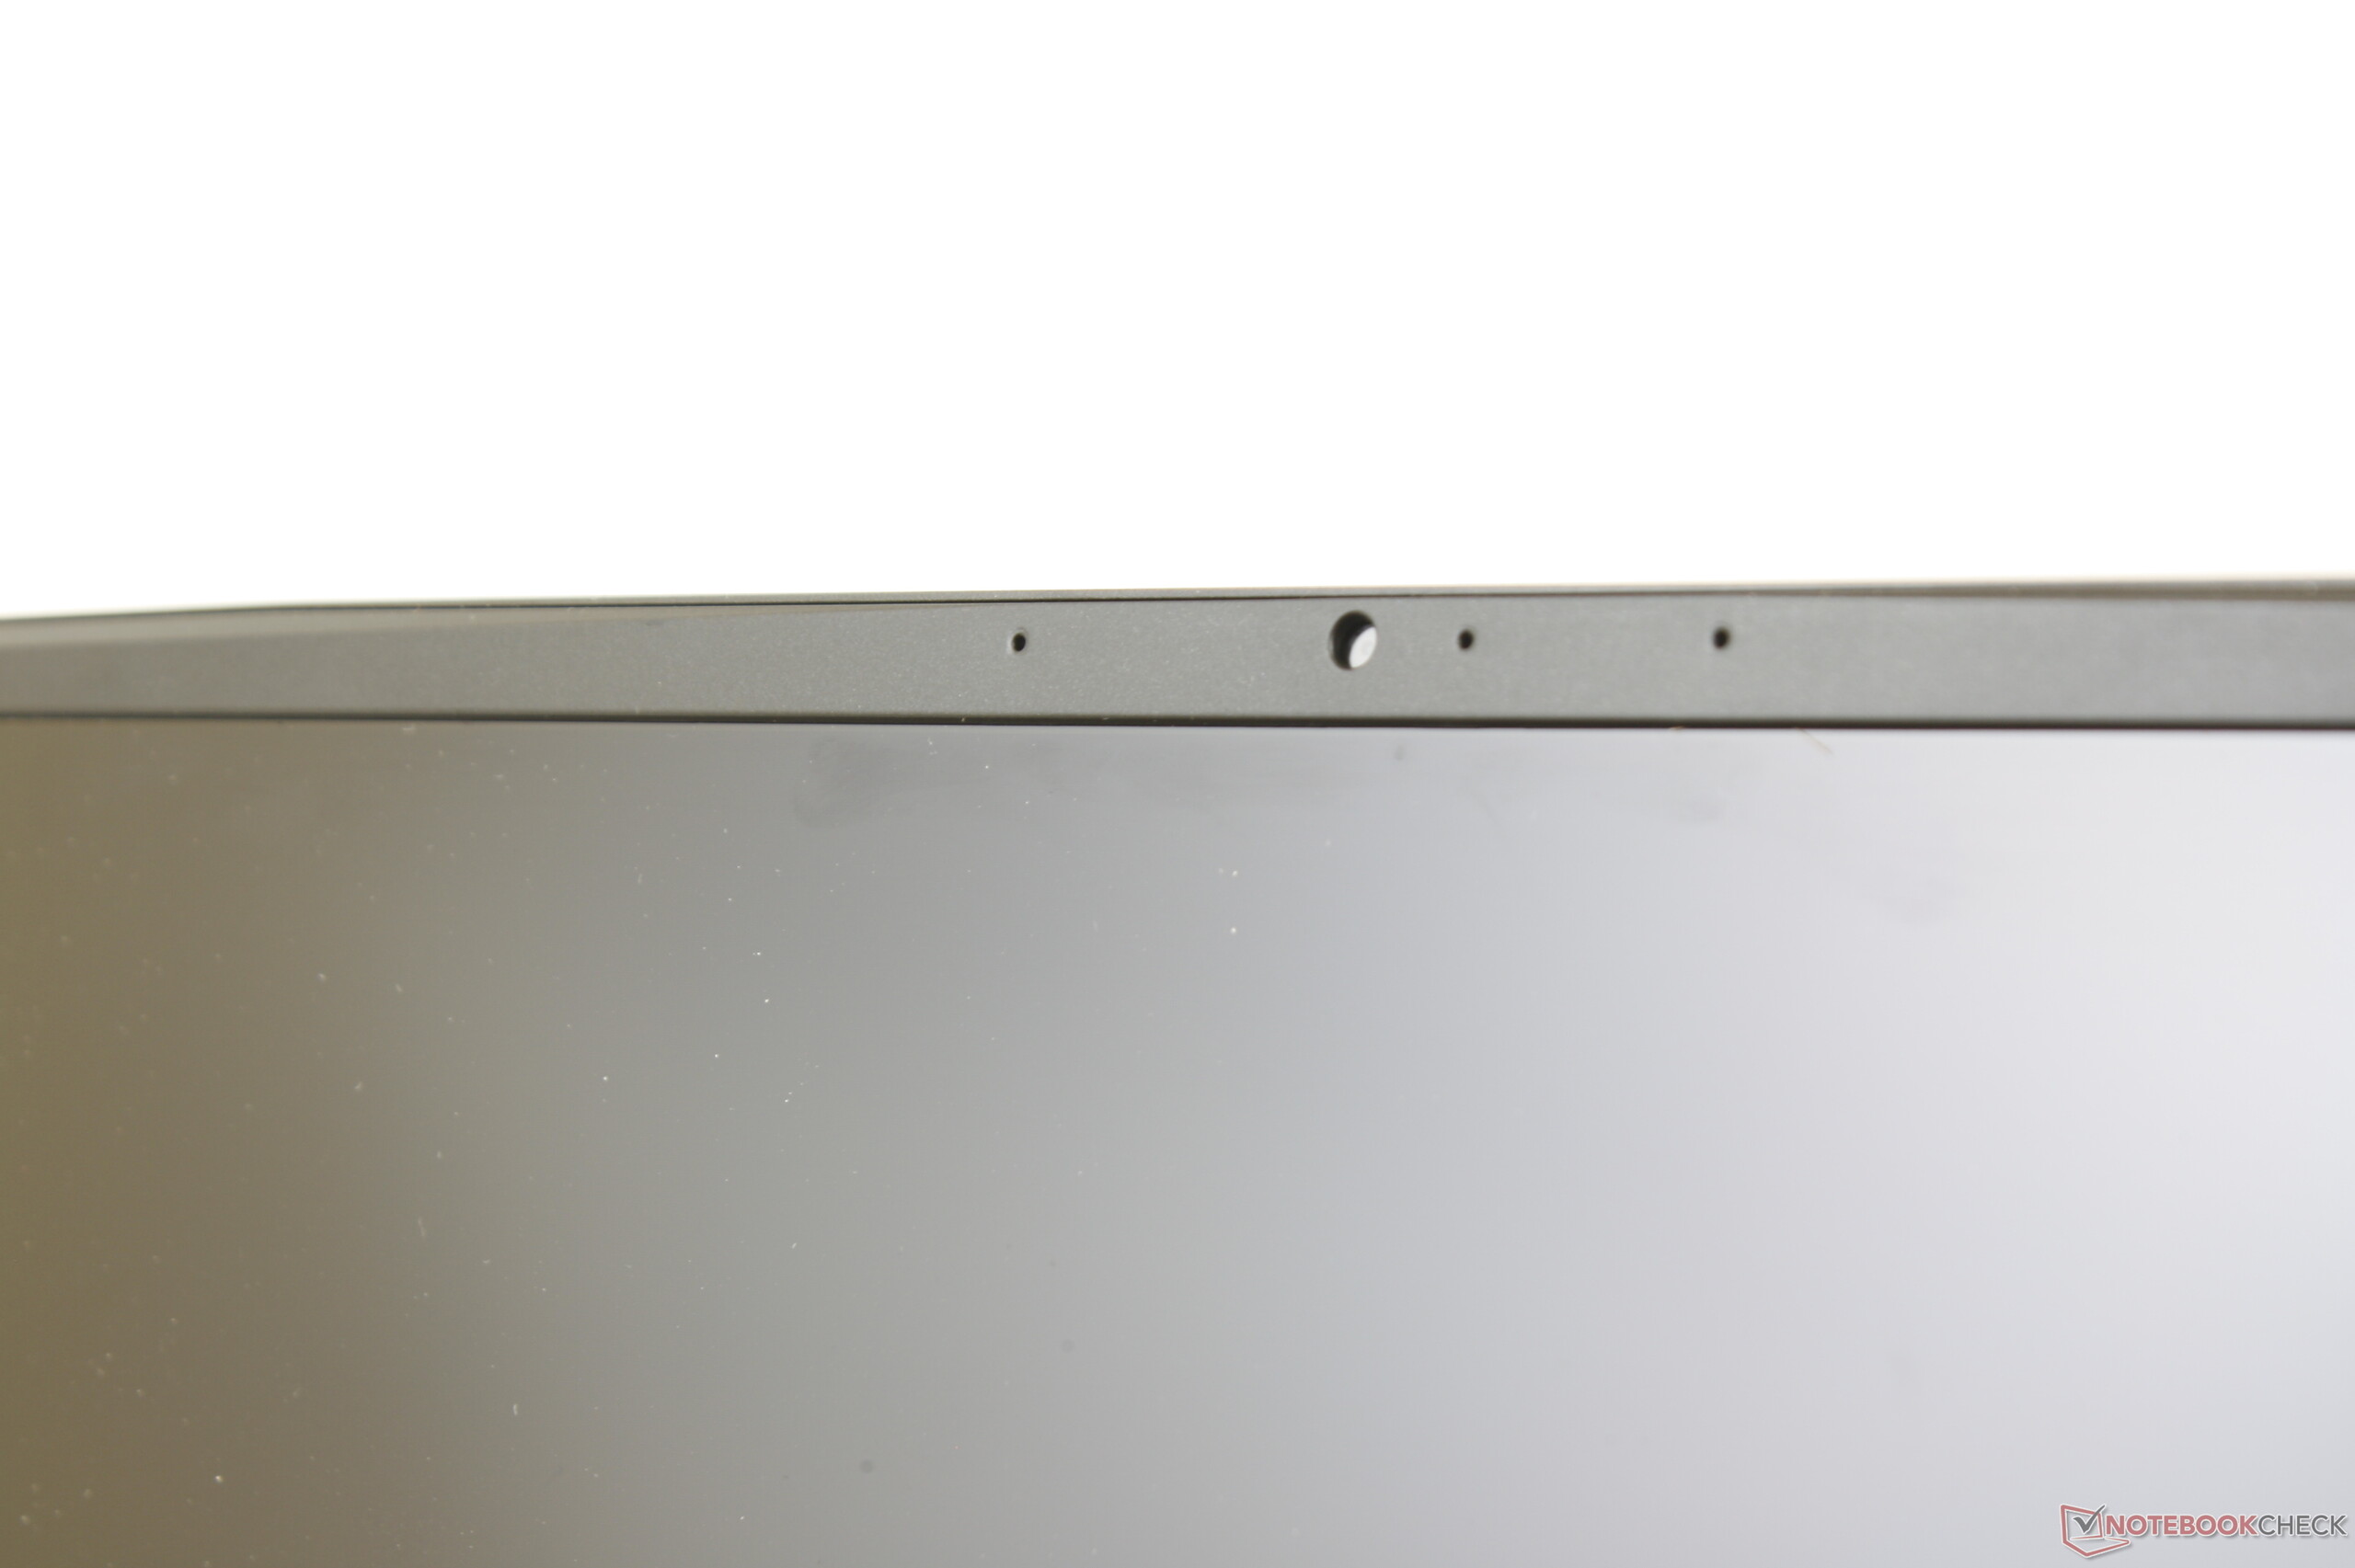
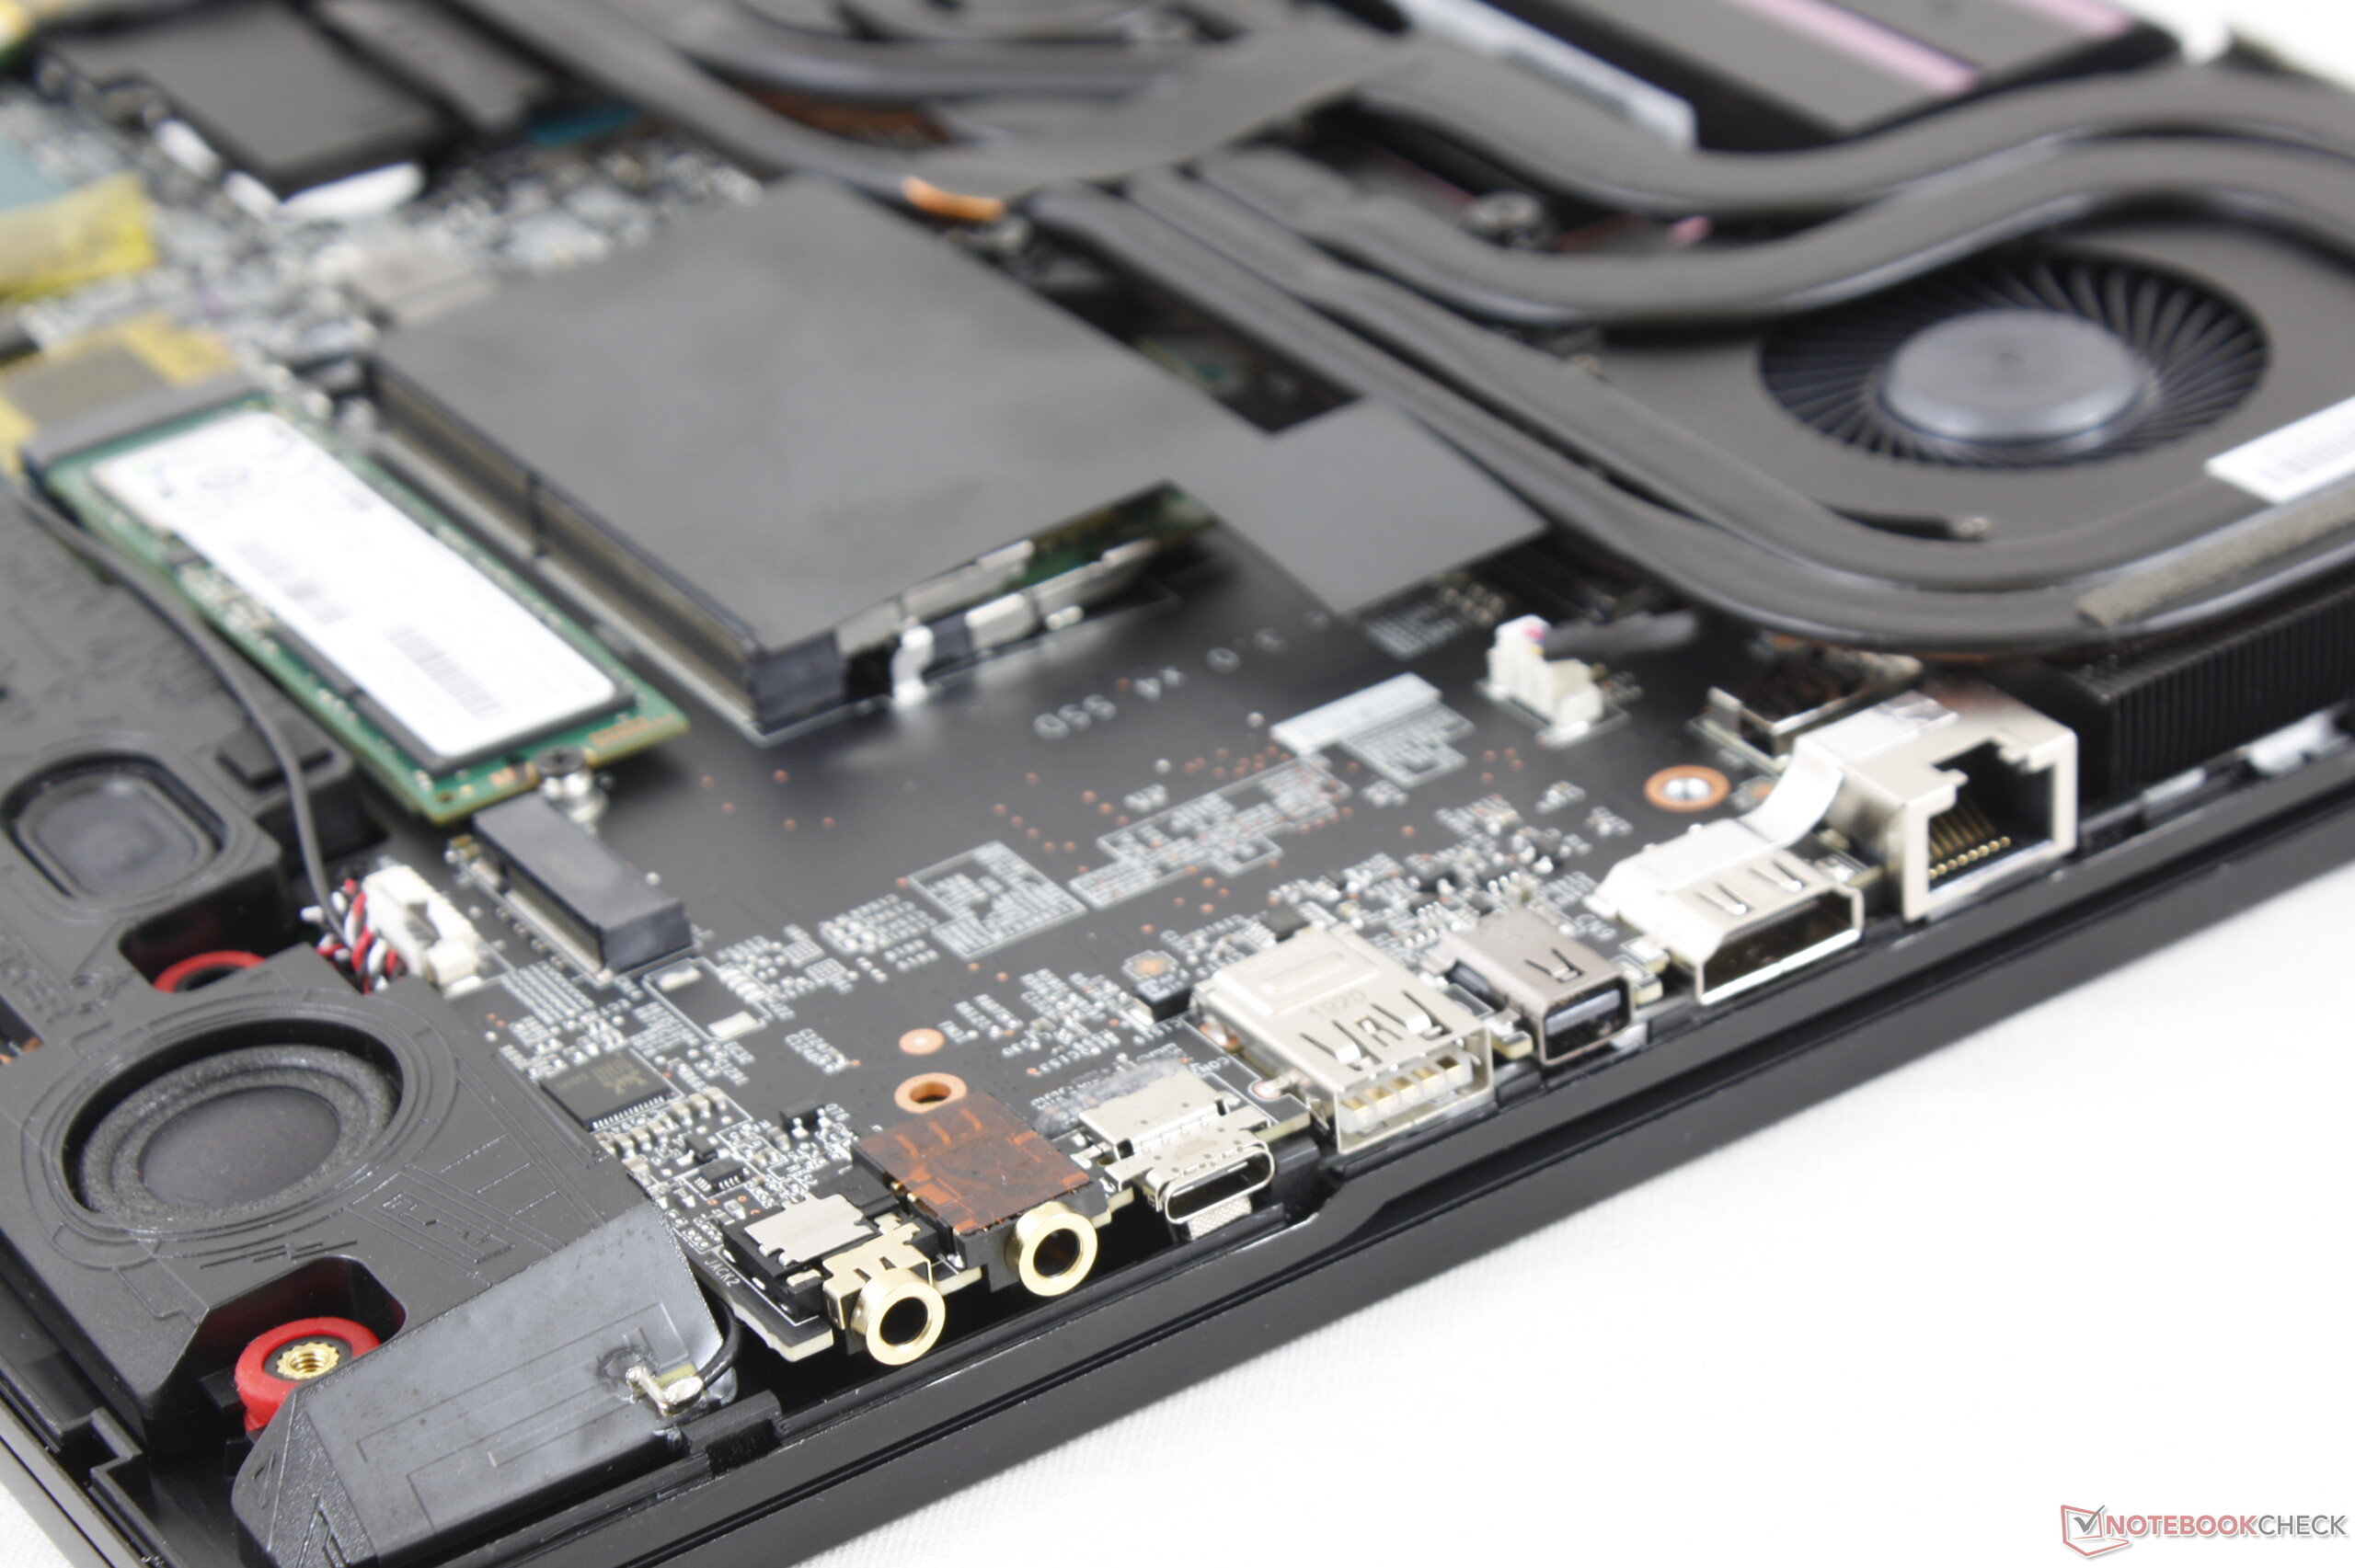
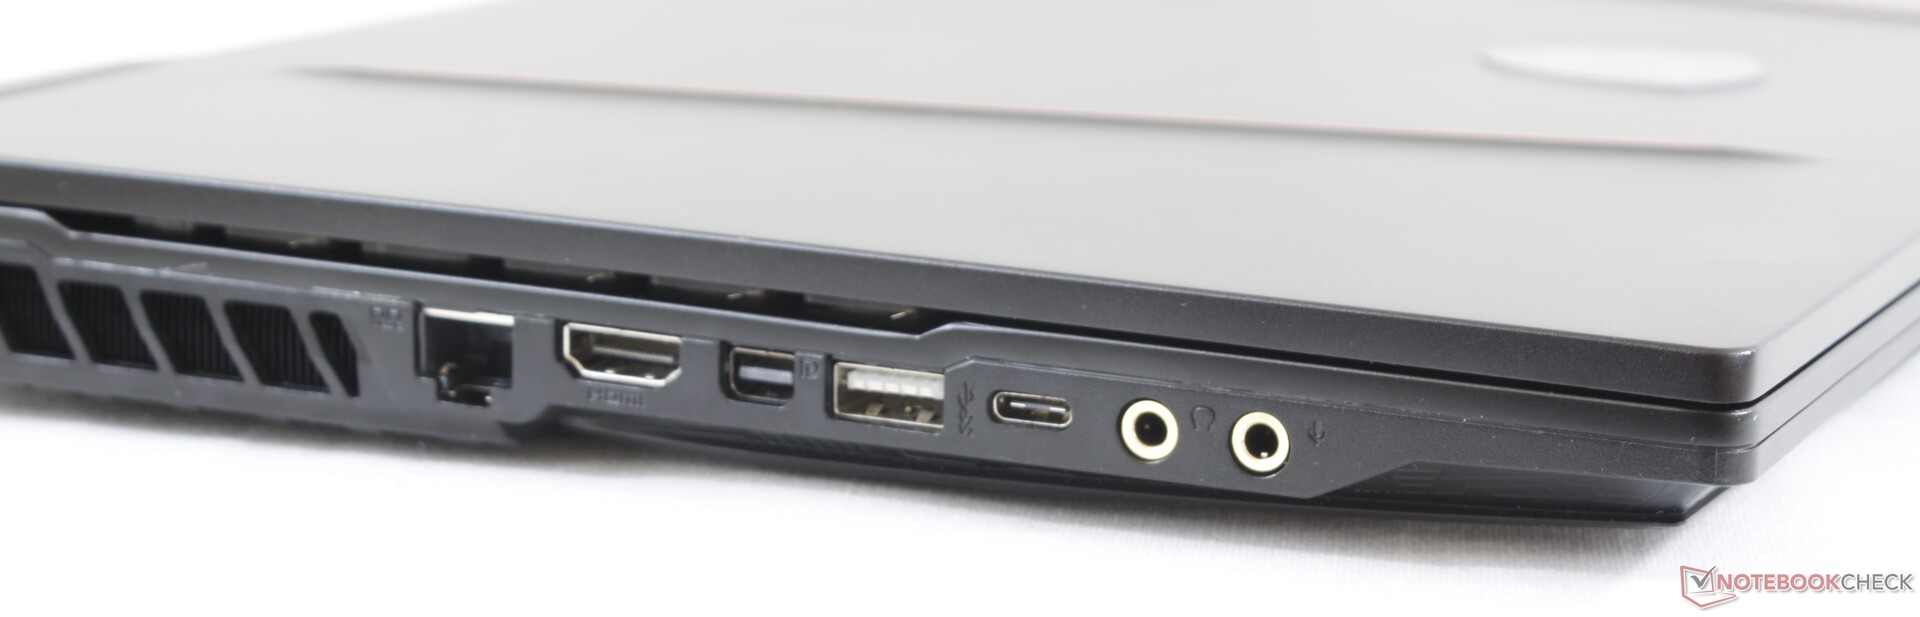
Os potenciais compradores provavelmente compararão o MSI GE65 com o Asus ROG Strix Scar III G531GW já que os dois portáteis carregam a mesma CPU Core i9 e GPU RTX 2070. Depois de testar os dois sistemas, a solução MSI tem vantagem, pois é mais fácil manter, com mais opções de armazenamento, mais portas, um teclado melhor, uma webcam de verdade e ventiladores geralmente mais silenciosos durante cargas de trabalho baixas, enquanto o sistema Asus tem um design de chassi mais robusto com uma tela mais brilhante.
Por US$ 2.600, nossa configuração do Core i9 pode ser uma grande pílula para engolir para um portátil para jogos de gama média. Recomendamos a configuração Core i7 e a atualização do armazenamento para economizar custos, pois a manutenção é muito mais fácil do que no GS65. É difícil voltar aos monitores de 60 Hz depois de se acostumar com as opções de 144 ou 240 Hz.
MSI GE65 Raider 9SF-049US
- 12/23/2019 v7 (old)
Allen Ngo
Price comparison
