Breve Análise do Conversível Lenovo Yoga C940-15IRH: O XPS 15 2-em-1 que a Dell deveria ter feito
Avaliação | Data | Modelo | Peso | Altura | Size | Resolução | Preço |
|---|---|---|---|---|---|---|---|
| 86 % v7 (old) | 12/2019 | Lenovo Yoga C940-15IRH i7-9750H, GeForce GTX 1650 Max-Q | 2 kg | 19.7 mm | 15.60" | 1920x1080 | |
| 87.8 % v7 (old) | 08/2019 | Dell XPS 15 7590 9980HK GTX 1650 i9-9980HK, GeForce GTX 1650 Mobile | 2 kg | 17 mm | 15.60" | 3840x2160 | |
| 83.1 % v7 (old) | 10/2019 | Asus ZenBook 15 UX534FT-DB77 i7-8565U, GeForce GTX 1650 Max-Q | 1.7 kg | 18.9 mm | 15.60" | 1920x1080 | |
| 83.9 % v7 (old) | 08/2019 | HP Gaming Pavilion 15-dk0009ng i7-9750H, GeForce GTX 1660 Ti Max-Q | 2.4 kg | 23.4 mm | 15.60" | 1920x1080 | |
| 85.2 % v7 (old) | 11/2019 | MSI Prestige 15 A10SC i7-10710U, GeForce GTX 1650 Max-Q | 1.7 kg | 16 mm | 15.60" | 3840x2160 |
| Networking | |
| iperf3 transmit AX12 | |
| MSI Prestige 15 A10SC | |
| Dell XPS 15 7590 9980HK GTX 1650 | |
| Asus ZenBook 15 UX534FT-DB77 | |
| iperf3 receive AX12 | |
| MSI Prestige 15 A10SC | |
| Asus ZenBook 15 UX534FT-DB77 | |
| Dell XPS 15 7590 9980HK GTX 1650 | |
| |||||||||||||||||||||||||
iluminação: 82 %
iluminação com acumulador: 484.8 cd/m²
Contraste: 1865:1 (Preto: 0.26 cd/m²)
ΔE ColorChecker Calman: 4.5 | ∀{0.5-29.43 Ø4.73}
calibrated: 1.19
ΔE Greyscale Calman: 5.7 | ∀{0.09-98 Ø4.97}
92.8% sRGB (Argyll 1.6.3 3D)
58.7% AdobeRGB 1998 (Argyll 1.6.3 3D)
63.6% AdobeRGB 1998 (Argyll 3D)
92.7% sRGB (Argyll 3D)
61.5% Display P3 (Argyll 3D)
Gamma: 2.45
CCT: 6101 K
| Lenovo Yoga C940-15IRH LG Philips LP156WFC-SPU1, IPS, 15.6", 1920x1080 | Dell XPS 15 7590 9980HK GTX 1650 Samsung 156WR04, SDCA029, OLED, 15.6", 3840x2160 | Asus ZenBook 15 UX534FT-DB77 BOE NV156FHM-N63, IPS, 15.6", 1920x1080 | Lenovo Ideapad 720S-15IKB 81AC001AGE Chi Mei CMN15E8 / N156HCE-EN1 CMN, IPS, 15.6", 1920x1080 | HP Gaming Pavilion 15-dk0009ng LG Philips LGD05FE, IPS, 15.6", 1920x1080 | MSI GP65 Leopard 9SE-225US LG Philips LGD0625, IPS, 15.6", 1920x1080 | HP Spectre x360 15-df0126ng AU Optronics AUO30EB, IPS, 15.6", 3840x2160 | |
|---|---|---|---|---|---|---|---|
| Display | 31% | 1% | 0% | 3% | 4% | 7% | |
| Display P3 Coverage (%) | 61.5 | 88.1 43% | 66.6 8% | 63.6 3% | 64.2 4% | 64.8 5% | 68.1 11% |
| sRGB Coverage (%) | 92.7 | 99.6 7% | 87.7 -5% | 89.4 -4% | 95.1 3% | 96.2 4% | 94.2 2% |
| AdobeRGB 1998 Coverage (%) | 63.6 | 91.8 44% | 64.1 1% | 64.3 1% | 65.8 3% | 66.3 4% | 68.4 8% |
| Response Times | 94% | 12% | 31% | 69% | 76% | -2% | |
| Response Time Grey 50% / Grey 80% * (ms) | 48.4 ? | 2.3 ? 95% | 41.2 ? 15% | 34 ? 30% | 16.4 ? 66% | 9.6 ? 80% | 57 ? -18% |
| Response Time Black / White * (ms) | 36.4 ? | 2.4 ? 93% | 33.2 ? 9% | 25 ? 31% | 10.4 ? 71% | 10.4 ? 71% | 31 ? 15% |
| PWM Frequency (Hz) | 59.5 ? | 25000 ? | |||||
| Screen | -1% | -36% | -12% | 5% | 2% | -16% | |
| Brightness middle (cd/m²) | 484.8 | 421.2 -13% | 312.6 -36% | 332 -32% | 345 -29% | 348.3 -28% | 330 -32% |
| Brightness (cd/m²) | 463 | 417 -10% | 290 -37% | 301 -35% | 324 -30% | 327 -29% | 310 -33% |
| Brightness Distribution (%) | 82 | 94 15% | 85 4% | 83 1% | 86 5% | 85 4% | 87 6% |
| Black Level * (cd/m²) | 0.26 | 0.31 -19% | 0.29 -12% | 0.42 -62% | 0.4 -54% | 0.37 -42% | |
| Contrast (:1) | 1865 | 1008 -46% | 1145 -39% | 821 -56% | 871 -53% | 892 -52% | |
| Colorchecker dE 2000 * | 4.5 | 6.06 -35% | 5.78 -28% | 3.73 17% | 1.3 71% | 1.6 64% | 4.03 10% |
| Colorchecker dE 2000 max. * | 7.55 | 11.89 -57% | 8.86 -17% | 6.6 13% | 2.8 63% | 5.07 33% | 6.74 11% |
| Colorchecker dE 2000 calibrated * | 1.19 | 3.78 -218% | 2 -68% | 1.1 8% | 1 16% | 1.96 -65% | |
| Greyscale dE 2000 * | 5.7 | 2.8 51% | 5.4 5% | 3.96 31% | 1.2 79% | 2.3 60% | 4.49 21% |
| Gamma | 2.45 90% | 2.15 102% | 2.21 100% | 2.4 92% | 2.31 95% | 2.203 100% | 2.57 86% |
| CCT | 6101 107% | 6235 104% | 7864 83% | 6921 94% | 6476 100% | 6707 97% | 6744 96% |
| Color Space (Percent of AdobeRGB 1998) (%) | 58.7 | 81 38% | 57.1 -3% | 58 -1% | 60.5 3% | 61 4% | 61 4% |
| Color Space (Percent of sRGB) (%) | 92.8 | 99.6 7% | 87.4 -6% | 89 -4% | 94.9 2% | 96 3% | 94 1% |
| Média Total (Programa/Configurações) | 41% /
21% | -8% /
-23% | 6% /
-4% | 26% /
13% | 27% /
12% | -4% /
-10% |
* ... menor é melhor
Exibir tempos de resposta
| ↔ Tempo de resposta preto para branco | ||
|---|---|---|
| 36.4 ms ... ascensão ↗ e queda ↘ combinadas | ↗ 21.2 ms ascensão | 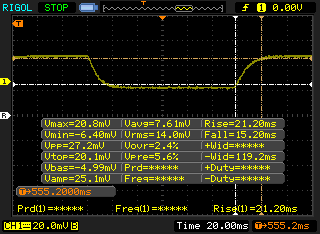 |
| ↘ 15.2 ms queda | ||
| A tela mostra taxas de resposta lentas em nossos testes e será insatisfatória para os jogadores. Em comparação, todos os dispositivos testados variam de 0.1 (mínimo) a 240 (máximo) ms. » 95 % de todos os dispositivos são melhores. Isso significa que o tempo de resposta medido é pior que a média de todos os dispositivos testados (19.9 ms). | ||
| ↔ Tempo de resposta 50% cinza a 80% cinza | ||
| 48.4 ms ... ascensão ↗ e queda ↘ combinadas | ↗ 24.4 ms ascensão | 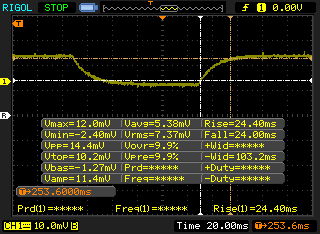 |
| ↘ 24 ms queda | ||
| A tela mostra taxas de resposta lentas em nossos testes e será insatisfatória para os jogadores. Em comparação, todos os dispositivos testados variam de 0.165 (mínimo) a 636 (máximo) ms. » 84 % de todos os dispositivos são melhores. Isso significa que o tempo de resposta medido é pior que a média de todos os dispositivos testados (31.1 ms). | ||
Cintilação da tela / PWM (modulação por largura de pulso)
| Tela tremeluzindo / PWM não detectado | 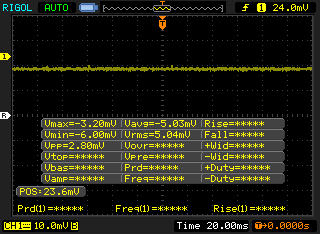 | ||
[pwm_comparison] Em comparação: 52 % de todos os dispositivos testados não usam PWM para escurecer a tela. Se PWM foi detectado, uma média de 7798 (mínimo: 5 - máximo: 343500) Hz foi medida. | |||
| PCMark 8 Home Score Accelerated v2 | 4069 pontos | |
| PCMark 8 Work Score Accelerated v2 | 5359 pontos | |
| PCMark 10 Score | 4887 pontos | |
Ajuda | ||
| Lenovo Yoga C940-15IRH Intel Optane Memory H10 with Solid State Storage 32GB + 512GB HBRPEKNX0202A(L/H) | Dell XPS 15 7590 9980HK GTX 1650 Toshiba XG6 KXG60ZNV1T02 | Asus ZenBook 15 UX534FT-DB77 Samsung SSD PM981 MZVLB1T0HALR | Lenovo Ideapad 720S-15IKB 81AC001AGE Samsung SSD PM981 MZVLB512HAJQ | HP Gaming Pavilion 15-dk0009ng Samsung SSD PM981 MZVLB256HAHQ | MSI GP65 Leopard 9SE-225US Toshiba KBG30ZMT512G | |
|---|---|---|---|---|---|---|
| AS SSD | 99% | 75% | 139% | 27% | -17% | |
| Seq Read (MB/s) | 769 | 1723 124% | 1887 145% | 2469 221% | 2088 172% | 1307 70% |
| Seq Write (MB/s) | 351.1 | 1386 295% | 1432 308% | 1991 467% | 1347 284% | 730 108% |
| 4K Read (MB/s) | 69.1 | 43.25 -37% | 52.3 -24% | 54.3 -21% | 36.14 -48% | 27.58 -60% |
| 4K Write (MB/s) | 100.9 | 98.3 -3% | 146 45% | 99.8 -1% | 96.5 -4% | 80.3 -20% |
| 4K-64 Read (MB/s) | 472 | 1078 128% | 969 105% | 1823 286% | 565 20% | 878 86% |
| 4K-64 Write (MB/s) | 948 | 1456 54% | 1375 45% | 1282 35% | 588 -38% | 246.8 -74% |
| Access Time Read * (ms) | 0.071 | 0.05 30% | 0.034 52% | 0.042 41% | 0.093 -31% | 0.231 -225% |
| Access Time Write * (ms) | 0.137 | 0.039 72% | 0.075 45% | 0.039 72% | 0.038 72% | 0.223 -63% |
| Score Read (Points) | 618 | 1294 109% | 1210 96% | 2125 244% | 810 31% | 1036 68% |
| Score Write (Points) | 1084 | 1693 56% | 1664 54% | 1581 46% | 819 -24% | 400 -63% |
| Score Total (Points) | 2024 | 3638 80% | 3483 72% | 4771 136% | 2014 0% | 1940 -4% |
| Copy ISO MB/s (MB/s) | 839 | 3182 279% | 1375 64% | 1043 24% | 993 18% | |
| Copy Program MB/s (MB/s) | 455.8 | 984 116% | 468 3% | 371.7 -18% | 309.5 -32% | |
| Copy Game MB/s (MB/s) | 969 | 1824 88% | 1287 33% | 399.9 -59% | 582 -40% | |
| CrystalDiskMark 5.2 / 6 | 50% | 63% | 59% | 14% | -26% | |
| Write 4K (MB/s) | 102.2 | 104.3 2% | 141.6 39% | 139.3 36% | 100 -2% | 99.3 -3% |
| Read 4K (MB/s) | 114.3 | 45.23 -60% | 45.28 -60% | 46.78 -59% | 31.39 -73% | 46.96 -59% |
| Write Seq (MB/s) | 468.3 | 1729 269% | 1975 322% | 2125 354% | 1308 179% | |
| Read Seq (MB/s) | 1236 | 1861 51% | 2272 84% | 2354 90% | 1083 -12% | |
| Write 4K Q32T1 (MB/s) | 556 | 509 -8% | 458.6 -18% | 298.4 -46% | 362.9 -35% | 240.1 -57% |
| Read 4K Q32T1 (MB/s) | 421.6 | 388.5 -8% | 391.4 -7% | 355.8 -16% | 425.7 1% | 581 38% |
| Write Seq Q32T1 (MB/s) | 1264 | 2813 123% | 2393 89% | 2128 68% | 1411 12% | 686 -46% |
| Read Seq Q32T1 (MB/s) | 2239 | 2906 30% | 3464 55% | 3324 48% | 3240 45% | 1581 -29% |
| Write 4K Q8T8 (MB/s) | 268.1 | |||||
| Read 4K Q8T8 (MB/s) | 977 | |||||
| Média Total (Programa/Configurações) | 75% /
81% | 69% /
70% | 99% /
105% | 21% /
23% | -22% /
-19% |
* ... menor é melhor

| 3DMark 11 | |
| 1280x720 Performance GPU | |
| MSI RTX 2060 Gaming Z 6G | |
| Alienware 17 R5 | |
| MSI GP65 Leopard 9SE-225US | |
| Maingear Vector 15 | |
| HP Gaming Pavilion 15-dk0009ng | |
| Gainward GeForce GTX 1650 4 GB | |
| Asus Zephyrus S GX531GM | |
| Dell XPS 15 7590 9980HK GTX 1650 | |
| Lenovo Yoga C940-15IRH | |
| MSI Prestige 15 A10SC | |
| Média NVIDIA GeForce GTX 1650 Max-Q (10248 - 12259, n=14) | |
| Dell XPS 15 9575 i7-8705G | |
| Asus TUF FX705GE-EW096T | |
| Lenovo ThinkPad X1 Extreme-20MF000XGE | |
| Asus Zenbook UX510UW-CN044T | |
| 1280x720 Performance Combined | |
| MSI RTX 2060 Gaming Z 6G | |
| MSI GP65 Leopard 9SE-225US | |
| HP Gaming Pavilion 15-dk0009ng | |
| Maingear Vector 15 | |
| Gainward GeForce GTX 1650 4 GB | |
| Alienware 17 R5 | |
| Lenovo Yoga C940-15IRH | |
| MSI Prestige 15 A10SC | |
| Dell XPS 15 7590 9980HK GTX 1650 | |
| Média NVIDIA GeForce GTX 1650 Max-Q (6409 - 10846, n=13) | |
| Dell XPS 15 9575 i7-8705G | |
| Lenovo ThinkPad X1 Extreme-20MF000XGE | |
| Asus TUF FX705GE-EW096T | |
| Asus Zephyrus S GX531GM | |
| Asus Zenbook UX510UW-CN044T | |
| 3DMark 11 Performance | 11952 pontos | |
| 3DMark Cloud Gate Standard Score | 29013 pontos | |
| 3DMark Fire Strike Score | 7717 pontos | |
| 3DMark Time Spy Score | 3494 pontos | |
Ajuda | ||
| Shadow of the Tomb Raider | |
| 1280x720 Lowest Preset | |
| Corsair One i160 | |
| Eurocom Nightsky RX15 | |
| MSI GE75 9SG | |
| MSI RTX 2060 Gaming Z 6G | |
| Walmart EVOO Gaming 17 | |
| Gainward GeForce GTX 1650 4 GB | |
| Média NVIDIA GeForce GTX 1650 Max-Q (92 - 151, n=5) | |
| MSI Prestige 15 A10SC | |
| Asus Zephyrus S GX531GM | |
| Dell XPS 15 7590 9980HK GTX 1650 | |
| Lenovo Yoga C940-15IRH | |
| Lenovo ThinkPad X1 Extreme-20MF000XGE | |
| MSI GE63 Raider 8SG | |
| Asus TUF FX705GE-EW096T | |
| Asus ROG Zephyrus G15 GA502DU | |
| Dell XPS 13 7390 2-in-1 Core i7 | |
| 1920x1080 Highest Preset AA:T | |
| Corsair One i160 | |
| MSI GE75 9SG | |
| Eurocom Nightsky RX15 | |
| MSI RTX 2060 Gaming Z 6G | |
| Walmart EVOO Gaming 17 | |
| MSI GE63 Raider 8SG | |
| Asus ROG Zephyrus G15 GA502DU | |
| Lenovo Yoga C940-15IRH | |
| Gainward GeForce GTX 1650 4 GB | |
| Asus Zephyrus S GX531GM | |
| Média NVIDIA GeForce GTX 1650 Max-Q (33 - 45, n=6) | |
| MSI Prestige 15 A10SC | |
| Dell XPS 15 7590 9980HK GTX 1650 | |
| Asus TUF FX705GE-EW096T | |
| Lenovo ThinkPad X1 Extreme-20MF000XGE | |
| baixo | média | alto | ultra | |
|---|---|---|---|---|
| BioShock Infinite (2013) | 317.2 | 231.2 | 215.2 | 84.3 |
| The Witcher 3 (2015) | 196 | 119.8 | 65.1 | 36.5 |
| Rocket League (2017) | 247.2 | 222.4 | 145.6 | |
| Shadow of the Tomb Raider (2018) | 105 | 58 | 51 | 45 |
| Lenovo Yoga C940-15IRH GeForce GTX 1650 Max-Q, i7-9750H, Intel Optane Memory H10 with Solid State Storage 32GB + 512GB HBRPEKNX0202A(L/H) | Dell XPS 15 7590 9980HK GTX 1650 GeForce GTX 1650 Mobile, i9-9980HK, Toshiba XG6 KXG60ZNV1T02 | Asus ZenBook 15 UX534FT-DB77 GeForce GTX 1650 Max-Q, i7-8565U, Samsung SSD PM981 MZVLB1T0HALR | Lenovo Ideapad 720S-15IKB 81AC001AGE GeForce GTX 1050 Ti Max-Q, i7-7700HQ, Samsung SSD PM981 MZVLB512HAJQ | HP Gaming Pavilion 15-dk0009ng GeForce GTX 1660 Ti Max-Q, i7-9750H, Samsung SSD PM981 MZVLB256HAHQ | MSI GP65 Leopard 9SE-225US GeForce RTX 2060 Mobile, i7-9750H, Toshiba KBG30ZMT512G | |
|---|---|---|---|---|---|---|
| Noise | -1% | 7% | 0% | 8% | -0% | |
| desligado / ambiente * (dB) | 28.7 | 28.2 2% | 28.4 1% | 30.3 -6% | 28.2 2% | 28.2 2% |
| Idle Minimum * (dB) | 28.7 | 28.2 2% | 28.4 1% | 30.3 -6% | 29.3 -2% | 29.5 -3% |
| Idle Average * (dB) | 28.8 | 28.2 2% | 28.4 1% | 30.3 -5% | 29.3 -2% | 29.6 -3% |
| Idle Maximum * (dB) | 28.8 | 30.4 -6% | 28.4 1% | 30.3 -5% | 29.3 -2% | 29.6 -3% |
| Load Average * (dB) | 45 | 43.8 3% | 33.9 25% | 39.3 13% | 32.3 28% | 33 27% |
| Witcher 3 ultra * (dB) | 44.7 | 47.2 -6% | 39.8 11% | 34 24% | 47.2 -6% | |
| Load Maximum * (dB) | 44.7 | 47.2 -6% | 40.2 10% | 39.6 11% | 41.2 8% | 52 -16% |
* ... menor é melhor
Barulho
| Ocioso |
| 28.7 / 28.8 / 28.8 dB |
| Carga |
| 45 / 44.7 dB |
 | ||
30 dB silencioso 40 dB(A) audível 50 dB(A) ruidosamente alto |
||
min: | ||
(-) A temperatura máxima no lado superior é 46.2 °C / 115 F, em comparação com a média de 36.8 °C / 98 F , variando de 21 a 71 °C para a classe Multimedia.
(±) A parte inferior aquece até um máximo de 45 °C / 113 F, em comparação com a média de 39.1 °C / 102 F
(+) Em uso inativo, a temperatura média para o lado superior é 23.9 °C / 75 F, em comparação com a média do dispositivo de 31.3 °C / ### class_avg_f### F.
(±) Jogando The Witcher 3, a temperatura média para o lado superior é 32 °C / 90 F, em comparação com a média do dispositivo de 31.3 °C / ## #class_avg_f### F.
(+) Os apoios para as mãos e o touchpad são mais frios que a temperatura da pele, com um máximo de 31 °C / 87.8 F e, portanto, são frios ao toque.
(-) A temperatura média da área do apoio para as mãos de dispositivos semelhantes foi 28.7 °C / 83.7 F (-2.3 °C / -4.1 F).
Lenovo Yoga C940-15IRH análise de áudio
(+) | os alto-falantes podem tocar relativamente alto (###valor### dB)
Graves 100 - 315Hz
(±) | graves reduzidos - em média 9.8% menor que a mediana
(±) | a linearidade dos graves é média (14% delta para a frequência anterior)
Médios 400 - 2.000 Hz
(±) | médios mais altos - em média 6.5% maior que a mediana
(+) | médios são lineares (5.1% delta para frequência anterior)
Altos 2 - 16 kHz
(+) | agudos equilibrados - apenas 3.4% longe da mediana
(±) | a linearidade dos máximos é média (8.5% delta para frequência anterior)
Geral 100 - 16.000 Hz
(±) | a linearidade do som geral é média (17.8% diferença em relação à mediana)
Comparado com a mesma classe
» 52% de todos os dispositivos testados nesta classe foram melhores, 7% semelhantes, 41% piores
» O melhor teve um delta de 5%, a média foi 17%, o pior foi 45%
Comparado com todos os dispositivos testados
» 36% de todos os dispositivos testados foram melhores, 8% semelhantes, 56% piores
» O melhor teve um delta de 4%, a média foi 24%, o pior foi 134%
Apple MacBook 12 (Early 2016) 1.1 GHz análise de áudio
(+) | os alto-falantes podem tocar relativamente alto (###valor### dB)
Graves 100 - 315Hz
(±) | graves reduzidos - em média 11.3% menor que a mediana
(±) | a linearidade dos graves é média (14.2% delta para a frequência anterior)
Médios 400 - 2.000 Hz
(+) | médios equilibrados - apenas 2.4% longe da mediana
(+) | médios são lineares (5.5% delta para frequência anterior)
Altos 2 - 16 kHz
(+) | agudos equilibrados - apenas 2% longe da mediana
(+) | os máximos são lineares (4.5% delta da frequência anterior)
Geral 100 - 16.000 Hz
(+) | o som geral é linear (10.2% diferença em relação à mediana)
Comparado com a mesma classe
» 7% de todos os dispositivos testados nesta classe foram melhores, 2% semelhantes, 91% piores
» O melhor teve um delta de 5%, a média foi 18%, o pior foi 53%
Comparado com todos os dispositivos testados
» 5% de todos os dispositivos testados foram melhores, 1% semelhantes, 94% piores
» O melhor teve um delta de 4%, a média foi 24%, o pior foi 134%
| desligado | |
| Ocioso | |
| Carga |
|
Key:
min: | |
| Lenovo Yoga C940-15IRH i7-9750H, GeForce GTX 1650 Max-Q, Intel Optane Memory H10 with Solid State Storage 32GB + 512GB HBRPEKNX0202A(L/H), IPS, 1920x1080, 15.6" | Dell XPS 15 7590 9980HK GTX 1650 i9-9980HK, GeForce GTX 1650 Mobile, Toshiba XG6 KXG60ZNV1T02, OLED, 3840x2160, 15.6" | Asus ZenBook 15 UX534FT-DB77 i7-8565U, GeForce GTX 1650 Max-Q, Samsung SSD PM981 MZVLB1T0HALR, IPS, 1920x1080, 15.6" | HP Gaming Pavilion 15-dk0009ng i7-9750H, GeForce GTX 1660 Ti Max-Q, Samsung SSD PM981 MZVLB256HAHQ, IPS, 1920x1080, 15.6" | MSI GP65 Leopard 9SE-225US i7-9750H, GeForce RTX 2060 Mobile, Toshiba KBG30ZMT512G, IPS, 1920x1080, 15.6" | HP Pavilion Gaming 15-cx0003ng i7-8750H, GeForce GTX 1050 Ti Mobile, Intel Optane 16 GB MEMPEK1J016GAH + HGST HTS721010A9E630 1 TB HDD, IPS, 1920x1080, 15.6" | |
|---|---|---|---|---|---|---|
| Power Consumption | -4% | 7% | -11% | -61% | 9% | |
| Idle Minimum * (Watt) | 5.2 | 6.2 -19% | 5 4% | 6.8 -31% | 13.6 -162% | 5.5 -6% |
| Idle Average * (Watt) | 10.7 | 9.6 10% | 13.2 -23% | 10.7 -0% | 17.9 -67% | 8.5 21% |
| Idle Maximum * (Watt) | 24.3 | 21.2 13% | 24 1% | 12.5 49% | 20.6 15% | 11.9 51% |
| Load Average * (Watt) | 84.4 | 104.3 -24% | 70 17% | 87.2 -3% | 96 -14% | 94 -11% |
| Witcher 3 ultra * (Watt) | 83.9 | 91.7 -9% | 63.3 25% | 121 -44% | 154.6 -84% | 86 -3% |
| Load Maximum * (Watt) | 142.8 | 135.3 5% | 114 20% | 191.4 -34% | 218.6 -53% | 144 -1% |
* ... menor é melhor
| Lenovo Yoga C940-15IRH i7-9750H, GeForce GTX 1650 Max-Q, 69 Wh | Dell XPS 15 7590 9980HK GTX 1650 i9-9980HK, GeForce GTX 1650 Mobile, 97 Wh | Asus ZenBook 15 UX534FT-DB77 i7-8565U, GeForce GTX 1650 Max-Q, 71 Wh | Lenovo Ideapad 720S-15IKB 81AC001AGE i7-7700HQ, GeForce GTX 1050 Ti Max-Q, 79 Wh | HP Gaming Pavilion 15-dk0009ng i7-9750H, GeForce GTX 1660 Ti Max-Q, 52.5 Wh | MSI GP65 Leopard 9SE-225US i7-9750H, GeForce RTX 2060 Mobile, 51 Wh | Dell XPS 15 9575 i7-8705G i7-8705G, Vega M GL / 870, 75 Wh | |
|---|---|---|---|---|---|---|---|
| Duração da bateria | 65% | 65% | 32% | -24% | -39% | -19% | |
| Reader / Idle (h) | 18.2 | 15.2 -16% | 21.5 18% | 22.6 24% | 8.7 -52% | 6 -67% | 11.2 -38% |
| WiFi v1.3 (h) | 9.7 | 7.8 -20% | 8.4 -13% | 9.8 1% | 4.8 -51% | 3.9 -60% | 7 -28% |
| Load (h) | 1 | 3.3 230% | 2.9 190% | 1.7 70% | 1.3 30% | 1.1 10% | 1.1 10% |
| Witcher 3 ultra (h) | 1 |
Pro
Contra
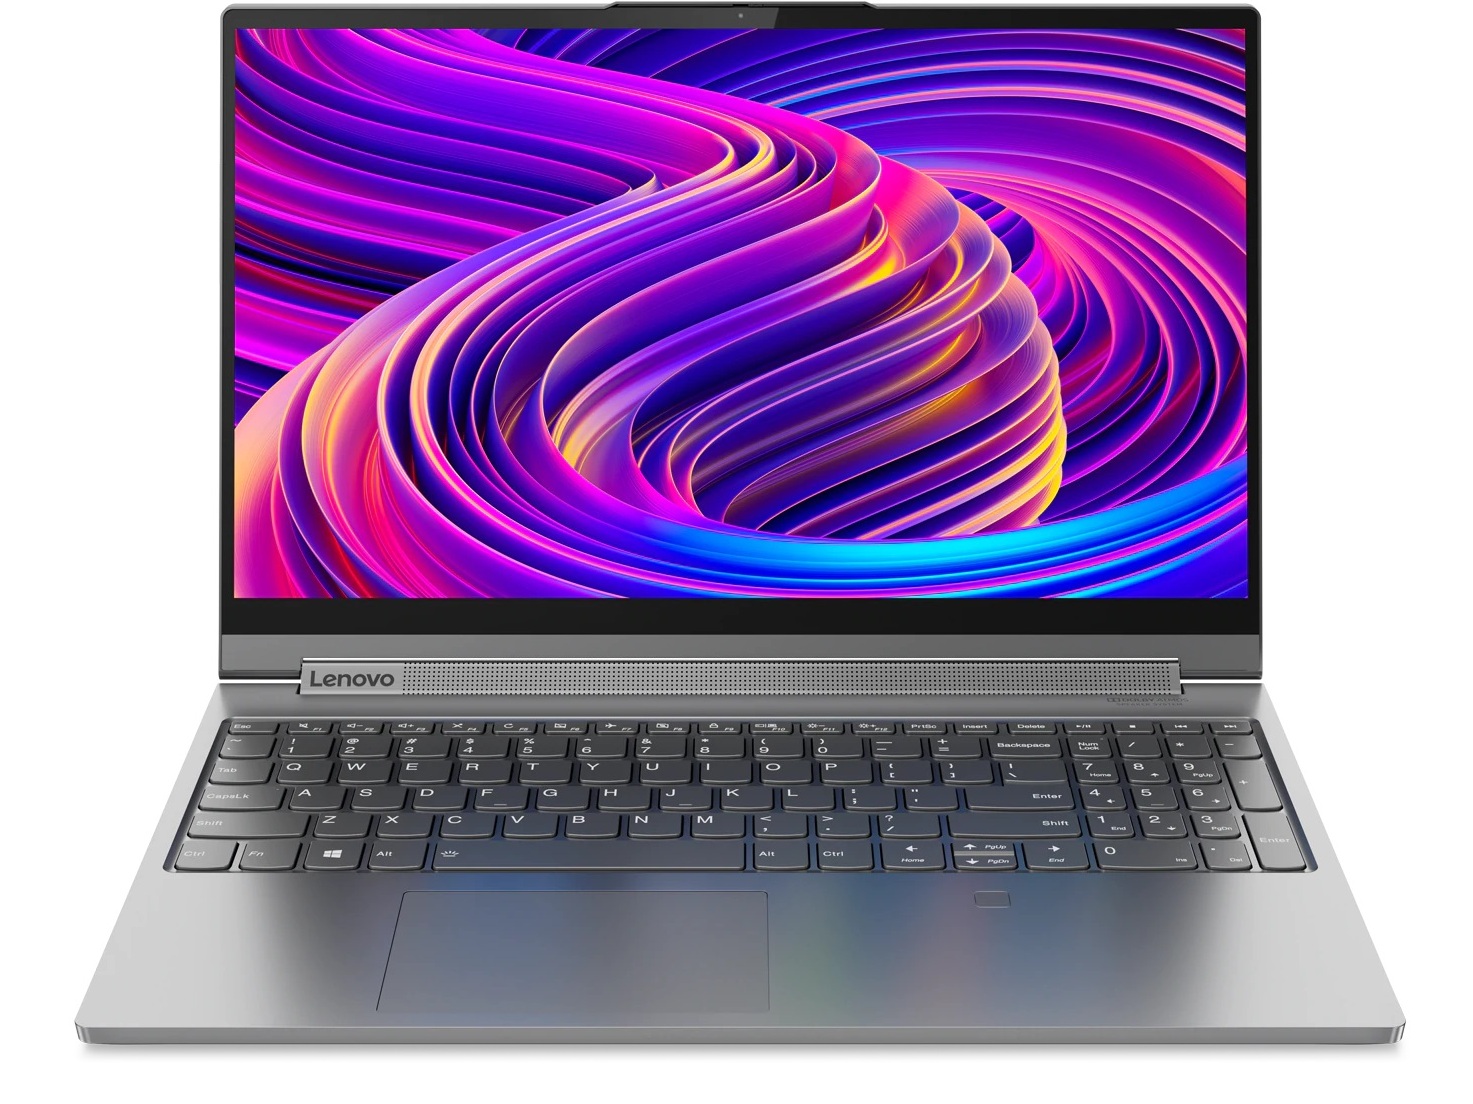
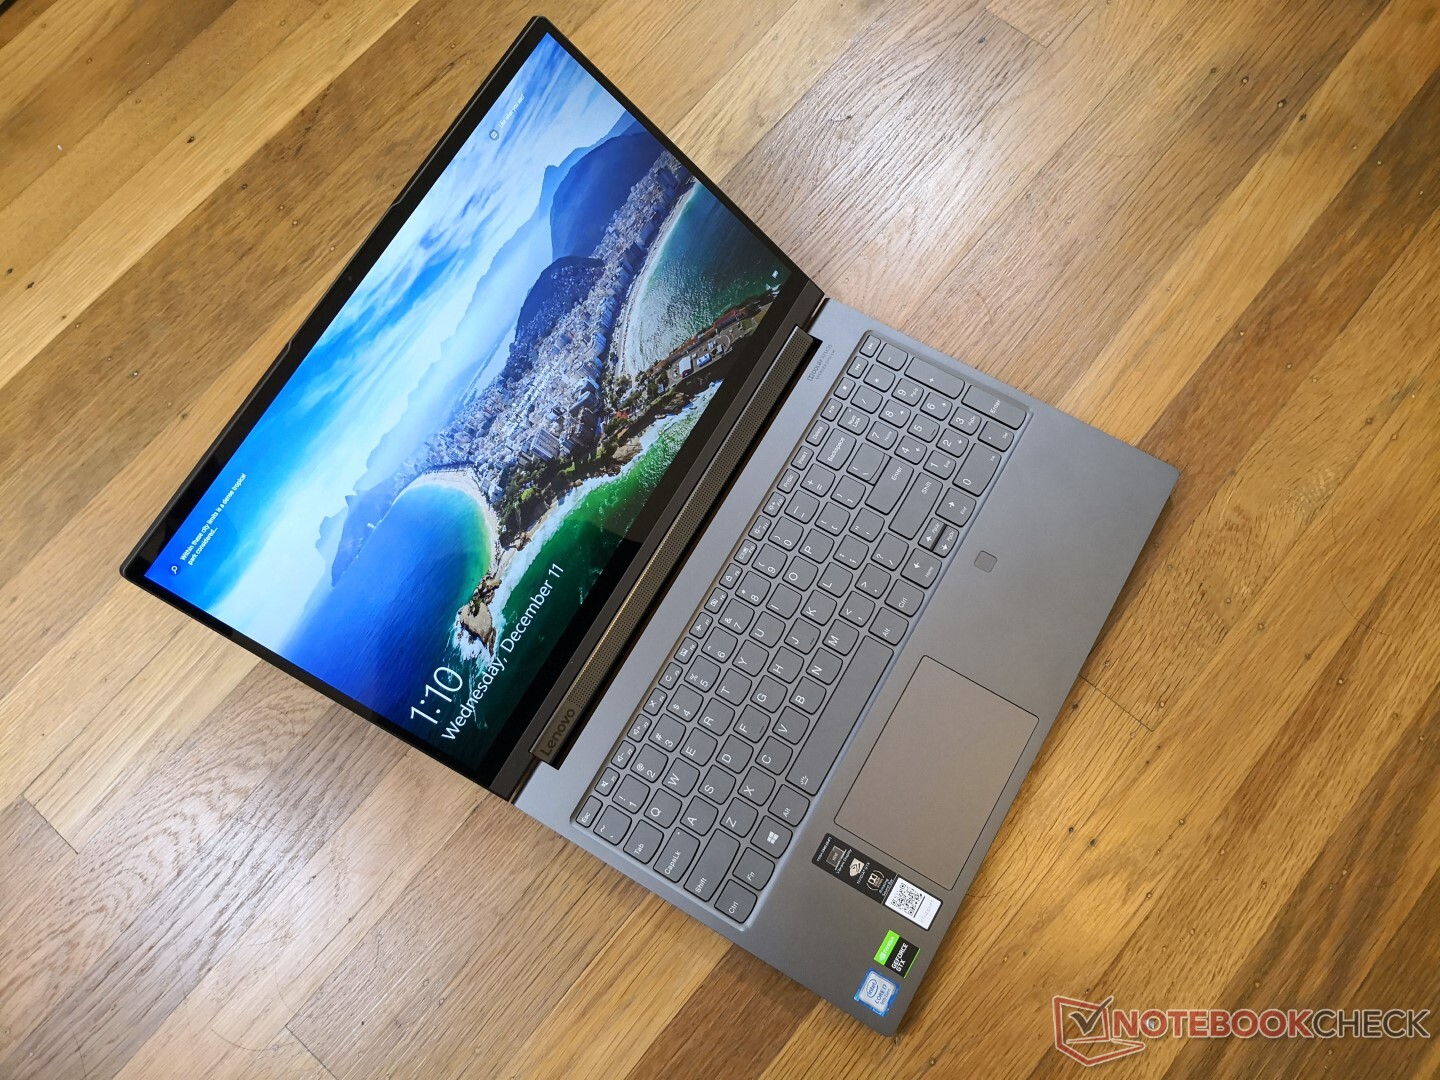
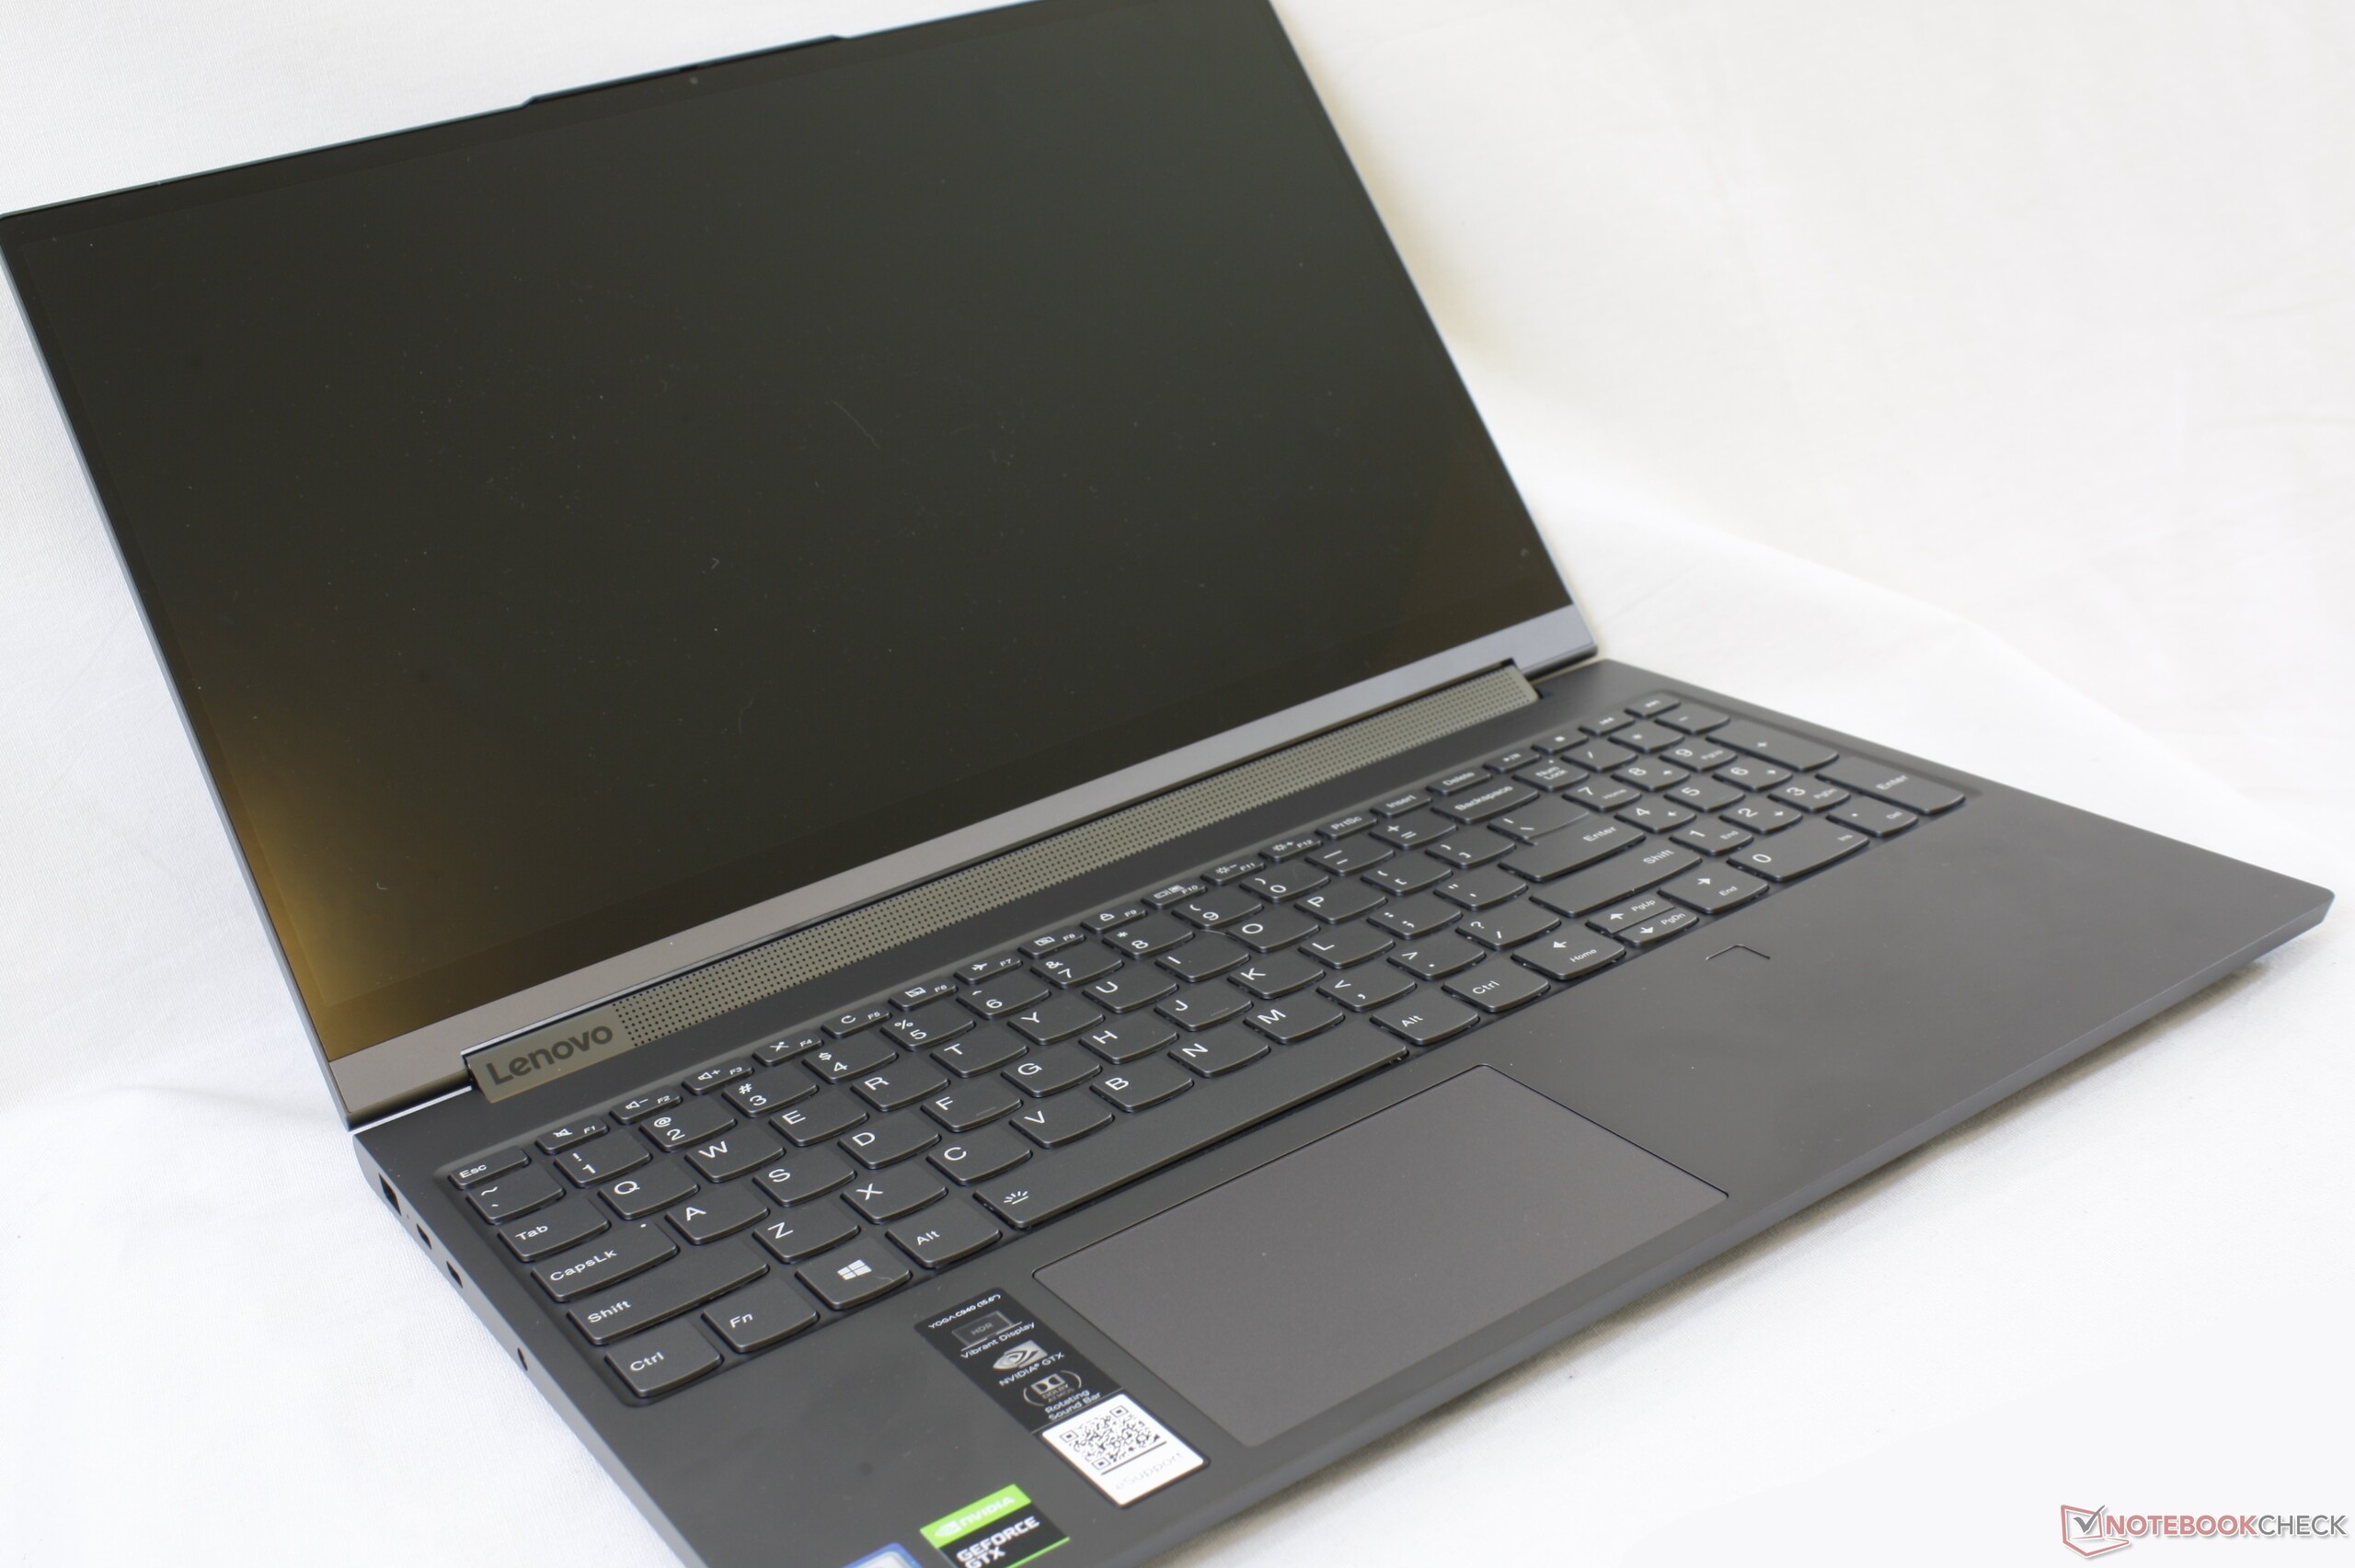
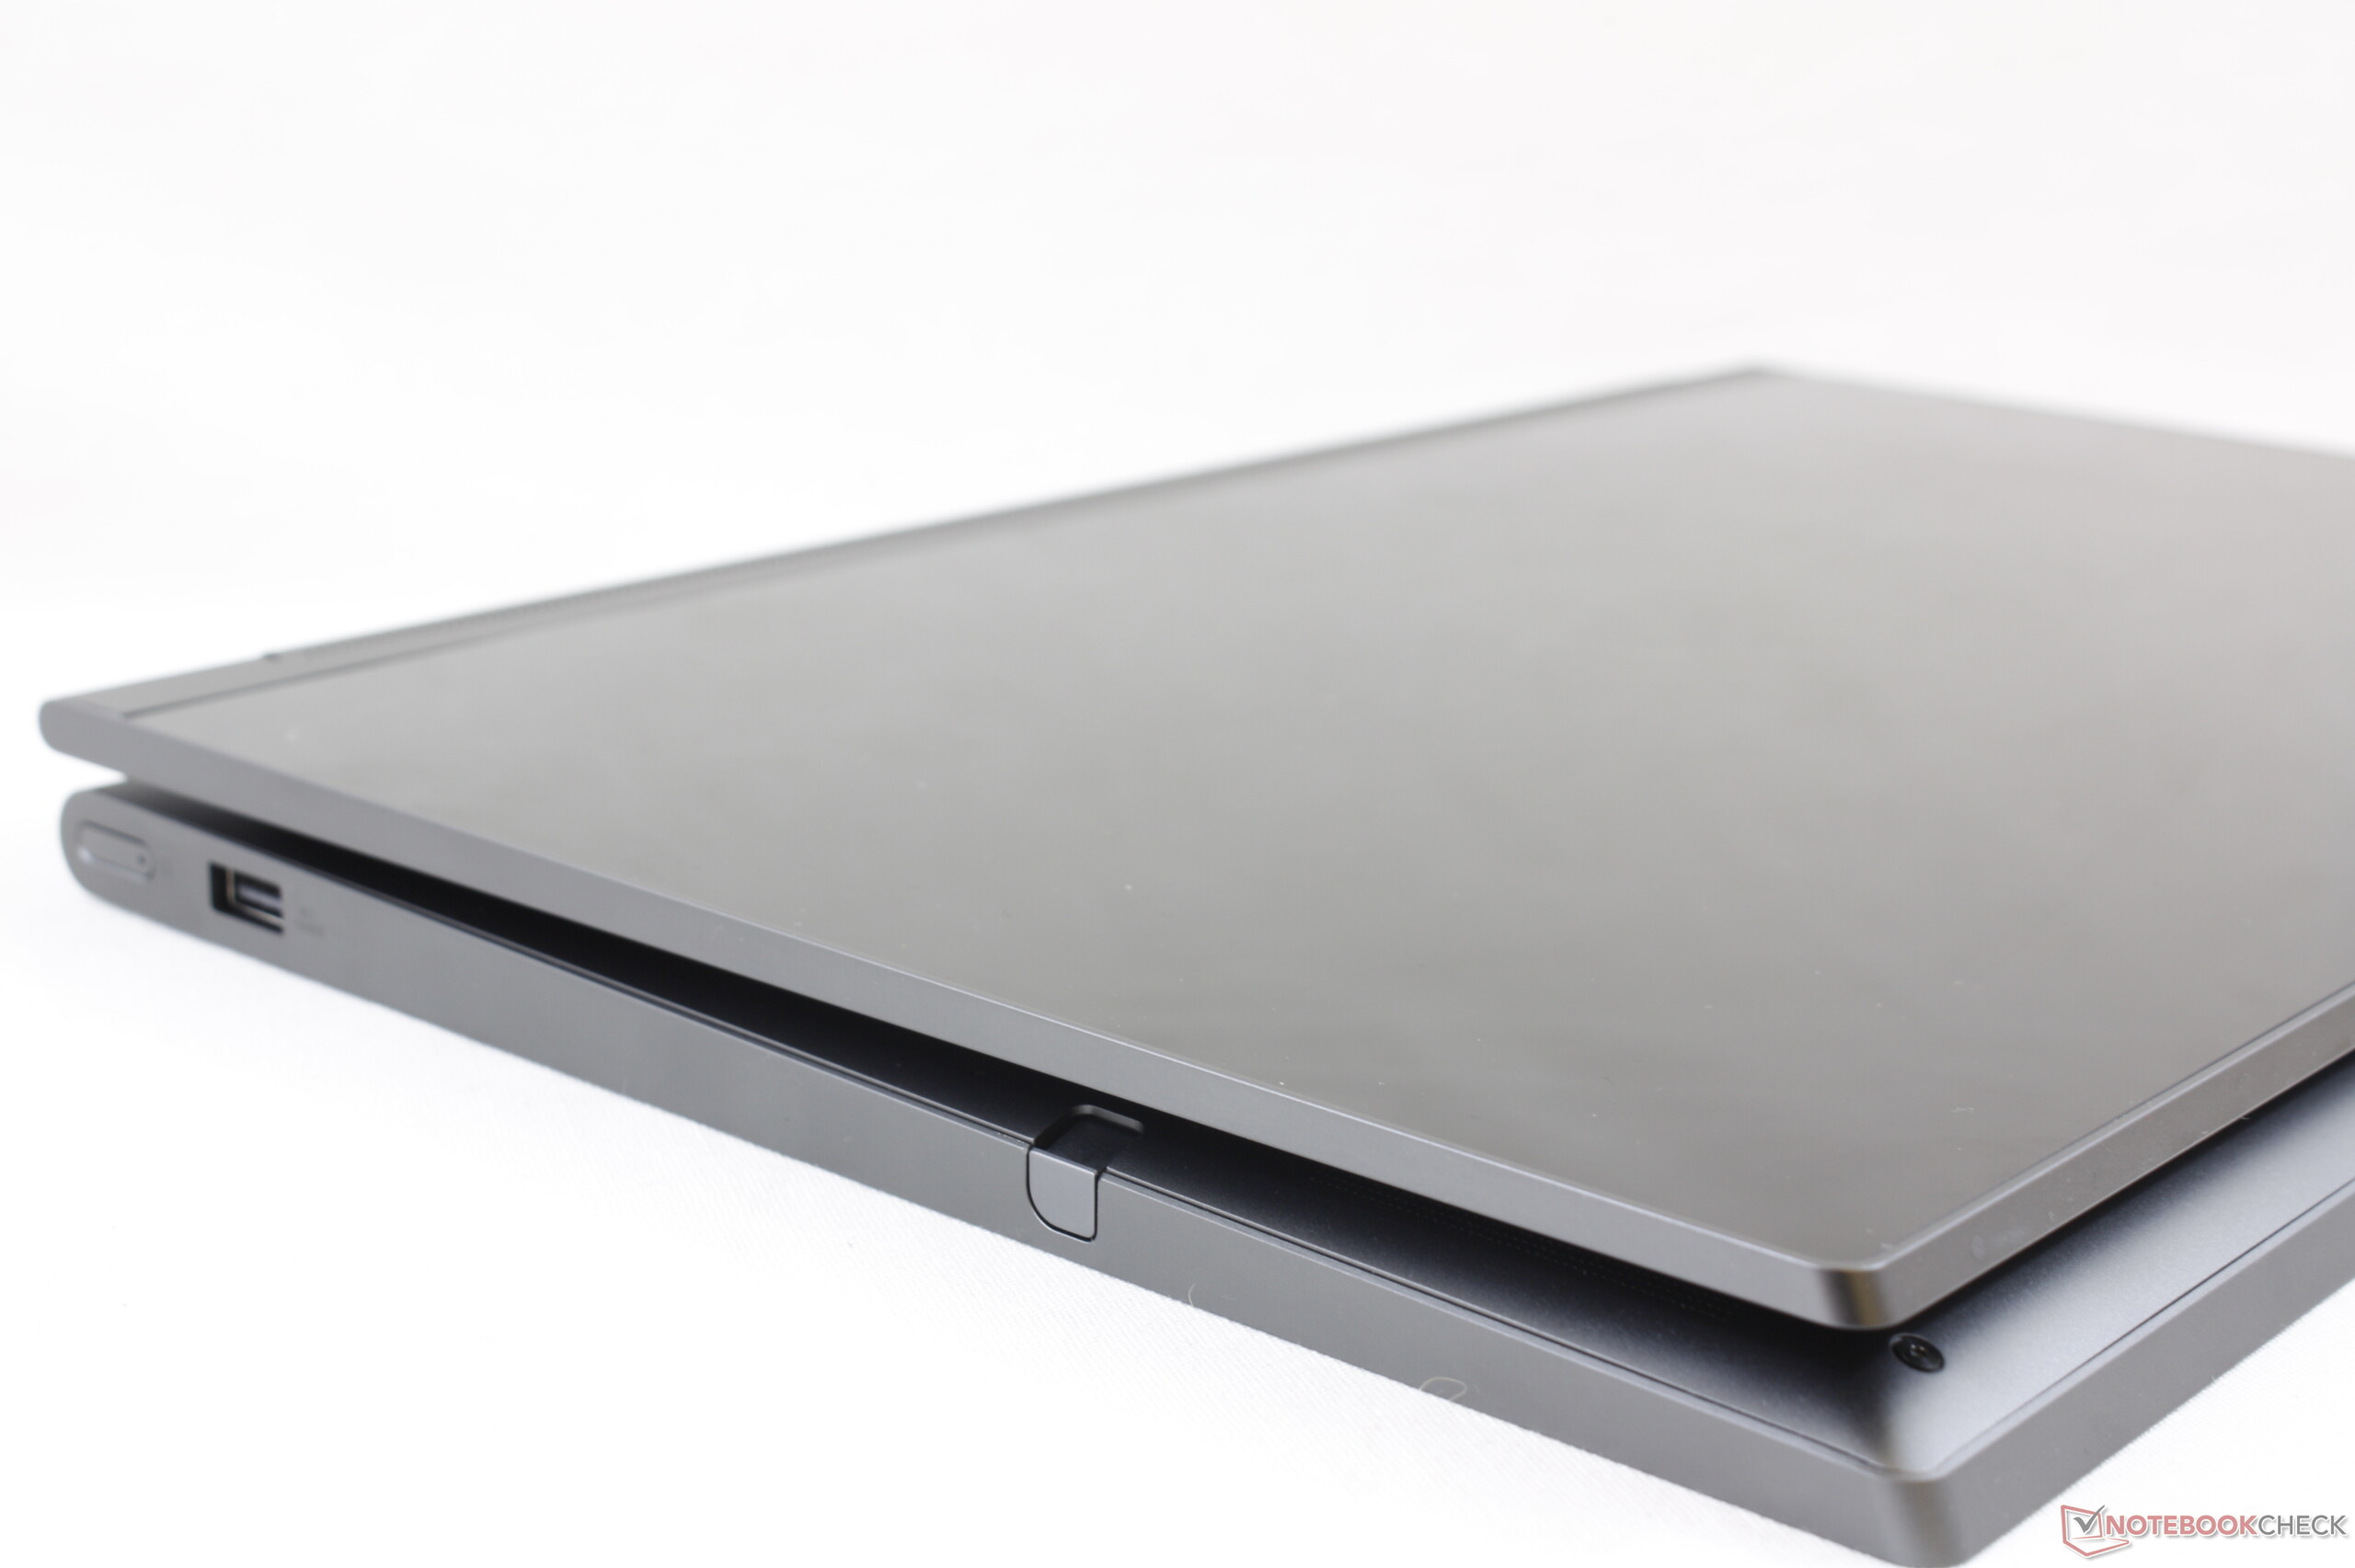
Quando a Dell anunciou o XPS 15 2-em-1, os usuários esperavam um XPS 15 padrão, mas com dobradiças de 360 graus. O que obtivemos foi um chassi completamente diferente com uma série de CPU/GPU não comprovada que pode ter afastado a base de fãs do XPS 15 principal. O Lenovo Yoga C940-15 está realmente mais próximo do que a maioria dos usuários imaginou que o XPS 15 2-em-1: uma tela táctil conversível com um teclado chiclet tradicional, CPU tradicional Intel Core H, GPU GeForce GTX, armazenamento facilmente reparável e um slot para caneta mais seguro em vez de um magnético.
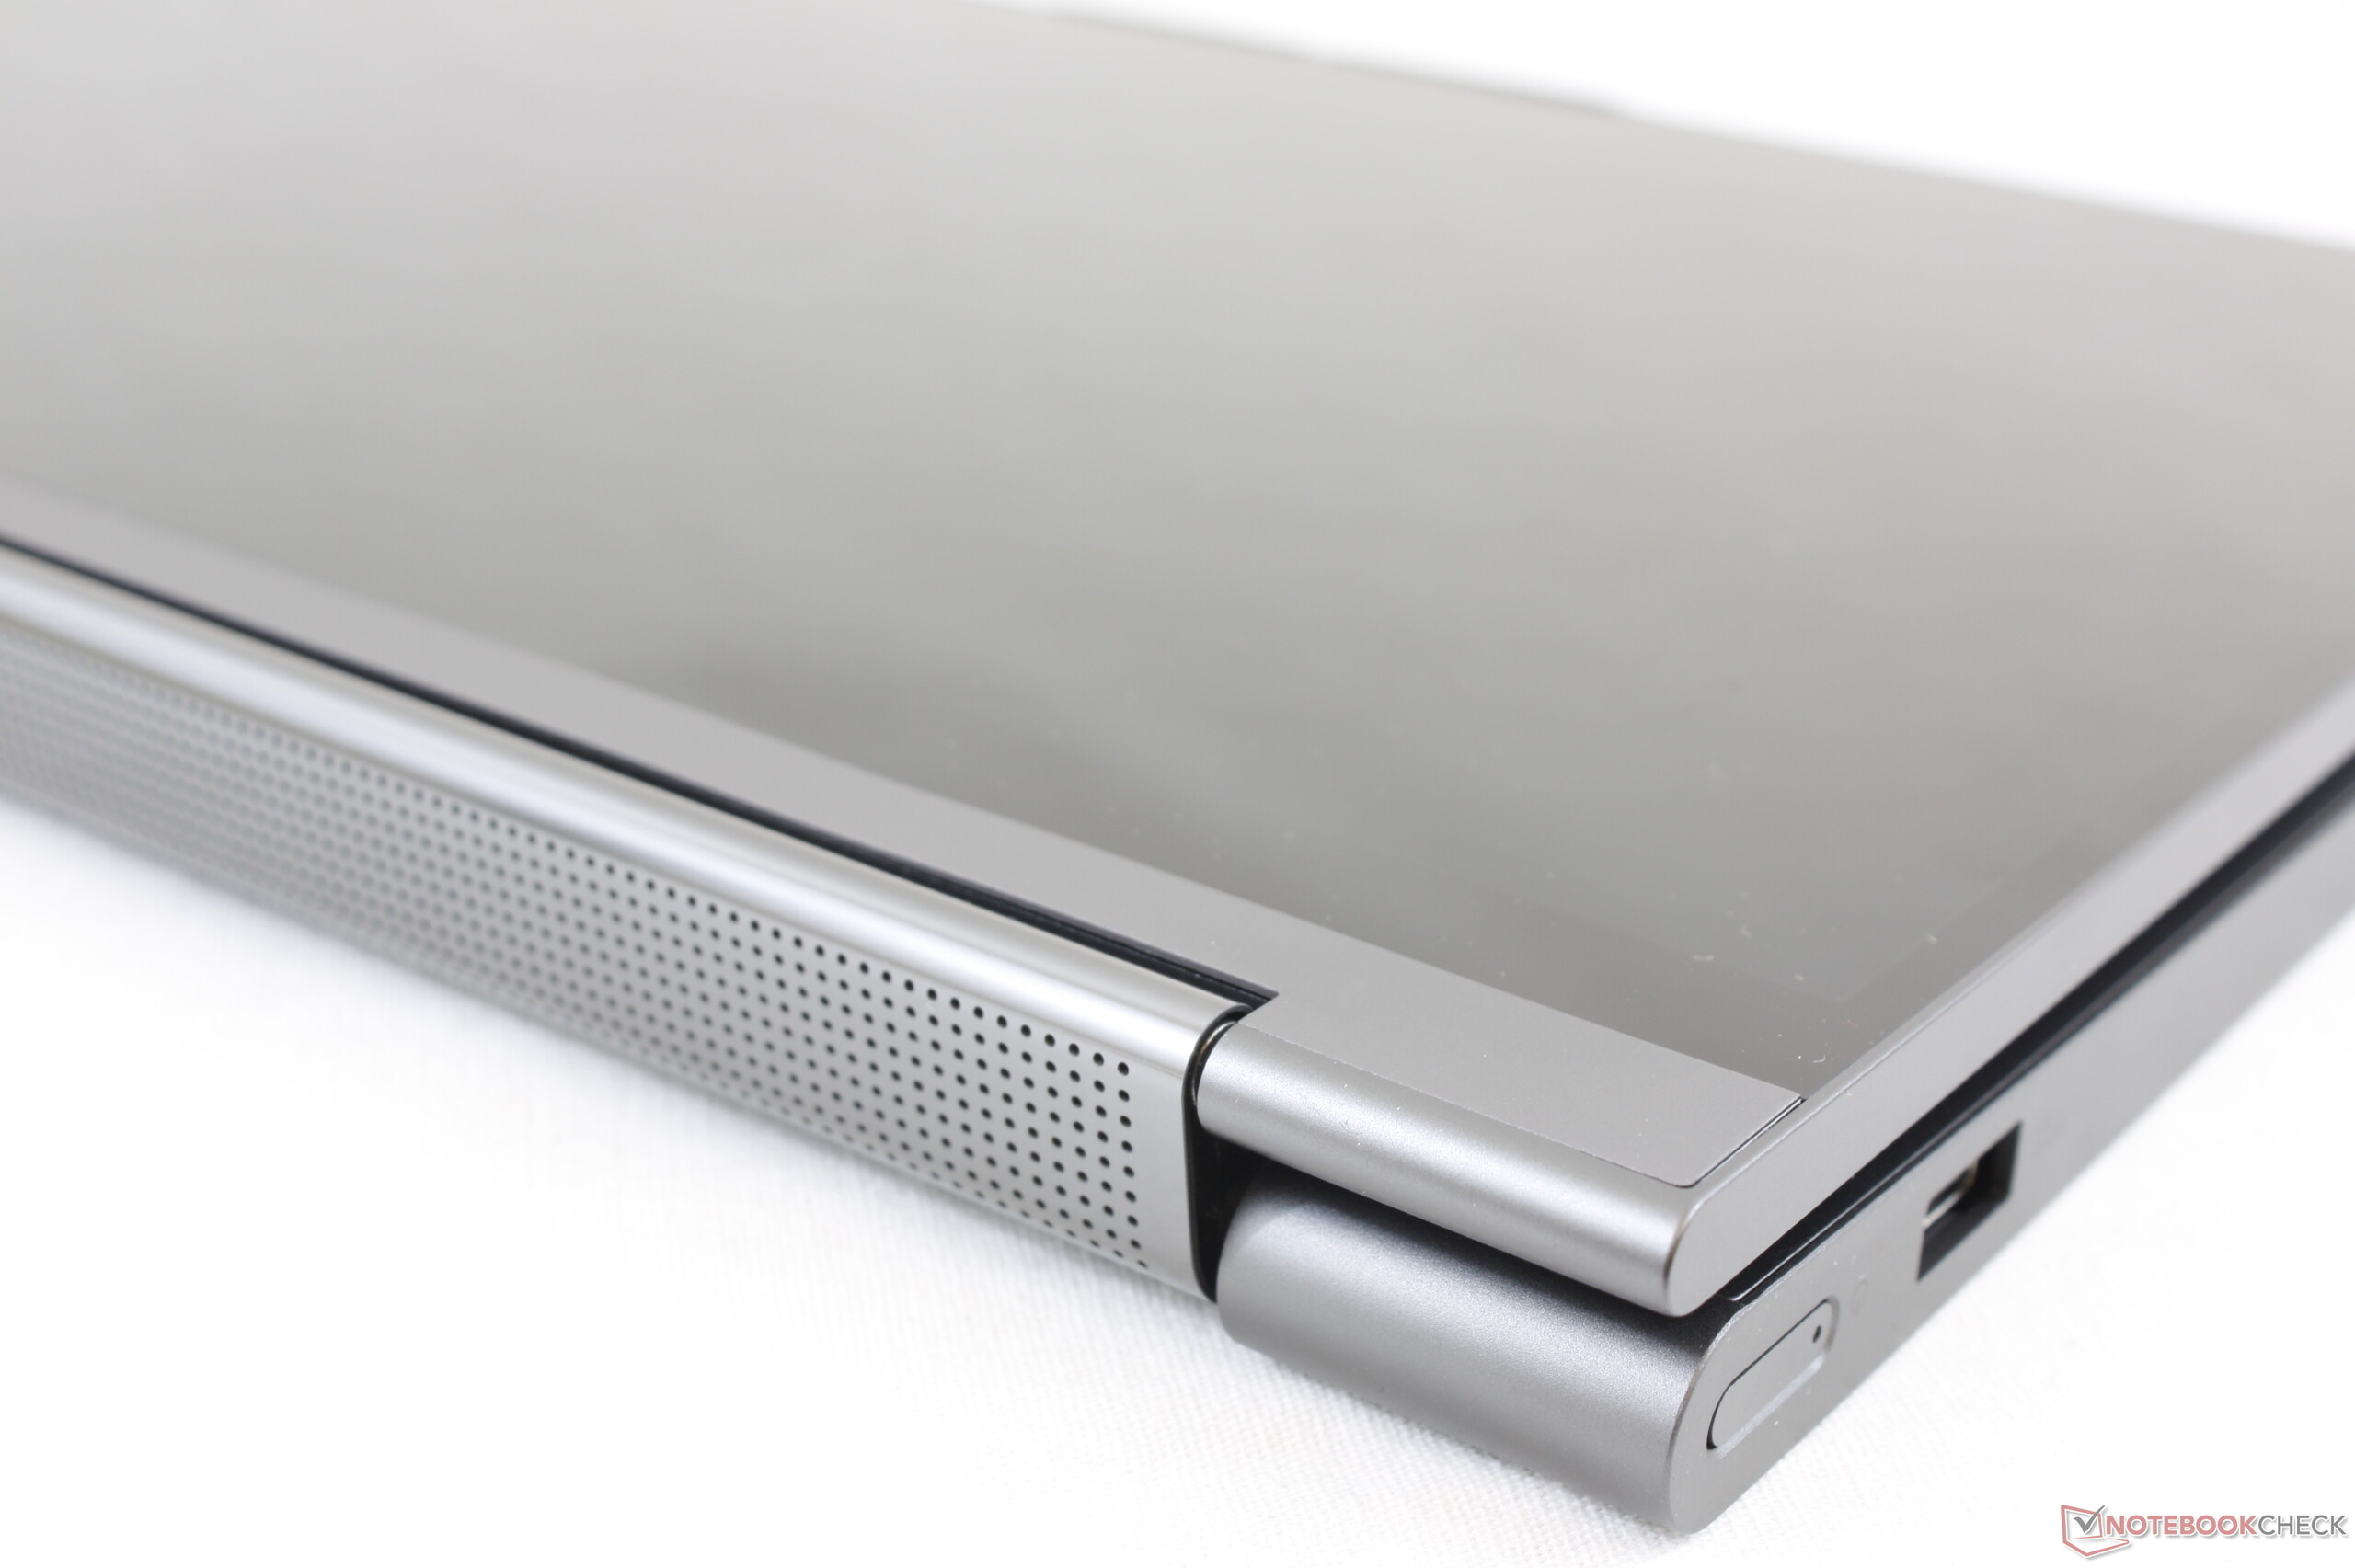
Ter uma GPU GTX com capacidade para jogos em um formato conversível de 15,6 polegadas tem suas desvantagens. Ou seja, o modo tablet é melhor usado com moderação ou durante períodos curtos devido ao peso e tamanho da unidade. Mesmo assim, o Yoga C940 ainda é mais leve, brilhante, menor e mais poderoso do que os concorrentes 2019 HP Spectre x360 15 para torná-lo a melhor opção geral nessa categoria específica. O XPS 15 9575 2-em-1 é um pouco menor, mas fica aquém da maioria dos outros aspectos, incluindo desempenho, duração da bateria, brilho e áudio. Esperamos que as iterações futuras melhorem o peso, as teclas suaves do teclado e o clickpad.
O Lenovo Yoga C940-15 oferece um desempenho por volume muito alto para um conversível de 15,6 polegadas. Embora não seja particularmente leve ou barato por cerca de US$ 1.500 no varejo, é a opção superior quando comparado ao XPS 15 2-em-1 ou ao atual HP Spectre x360 15.
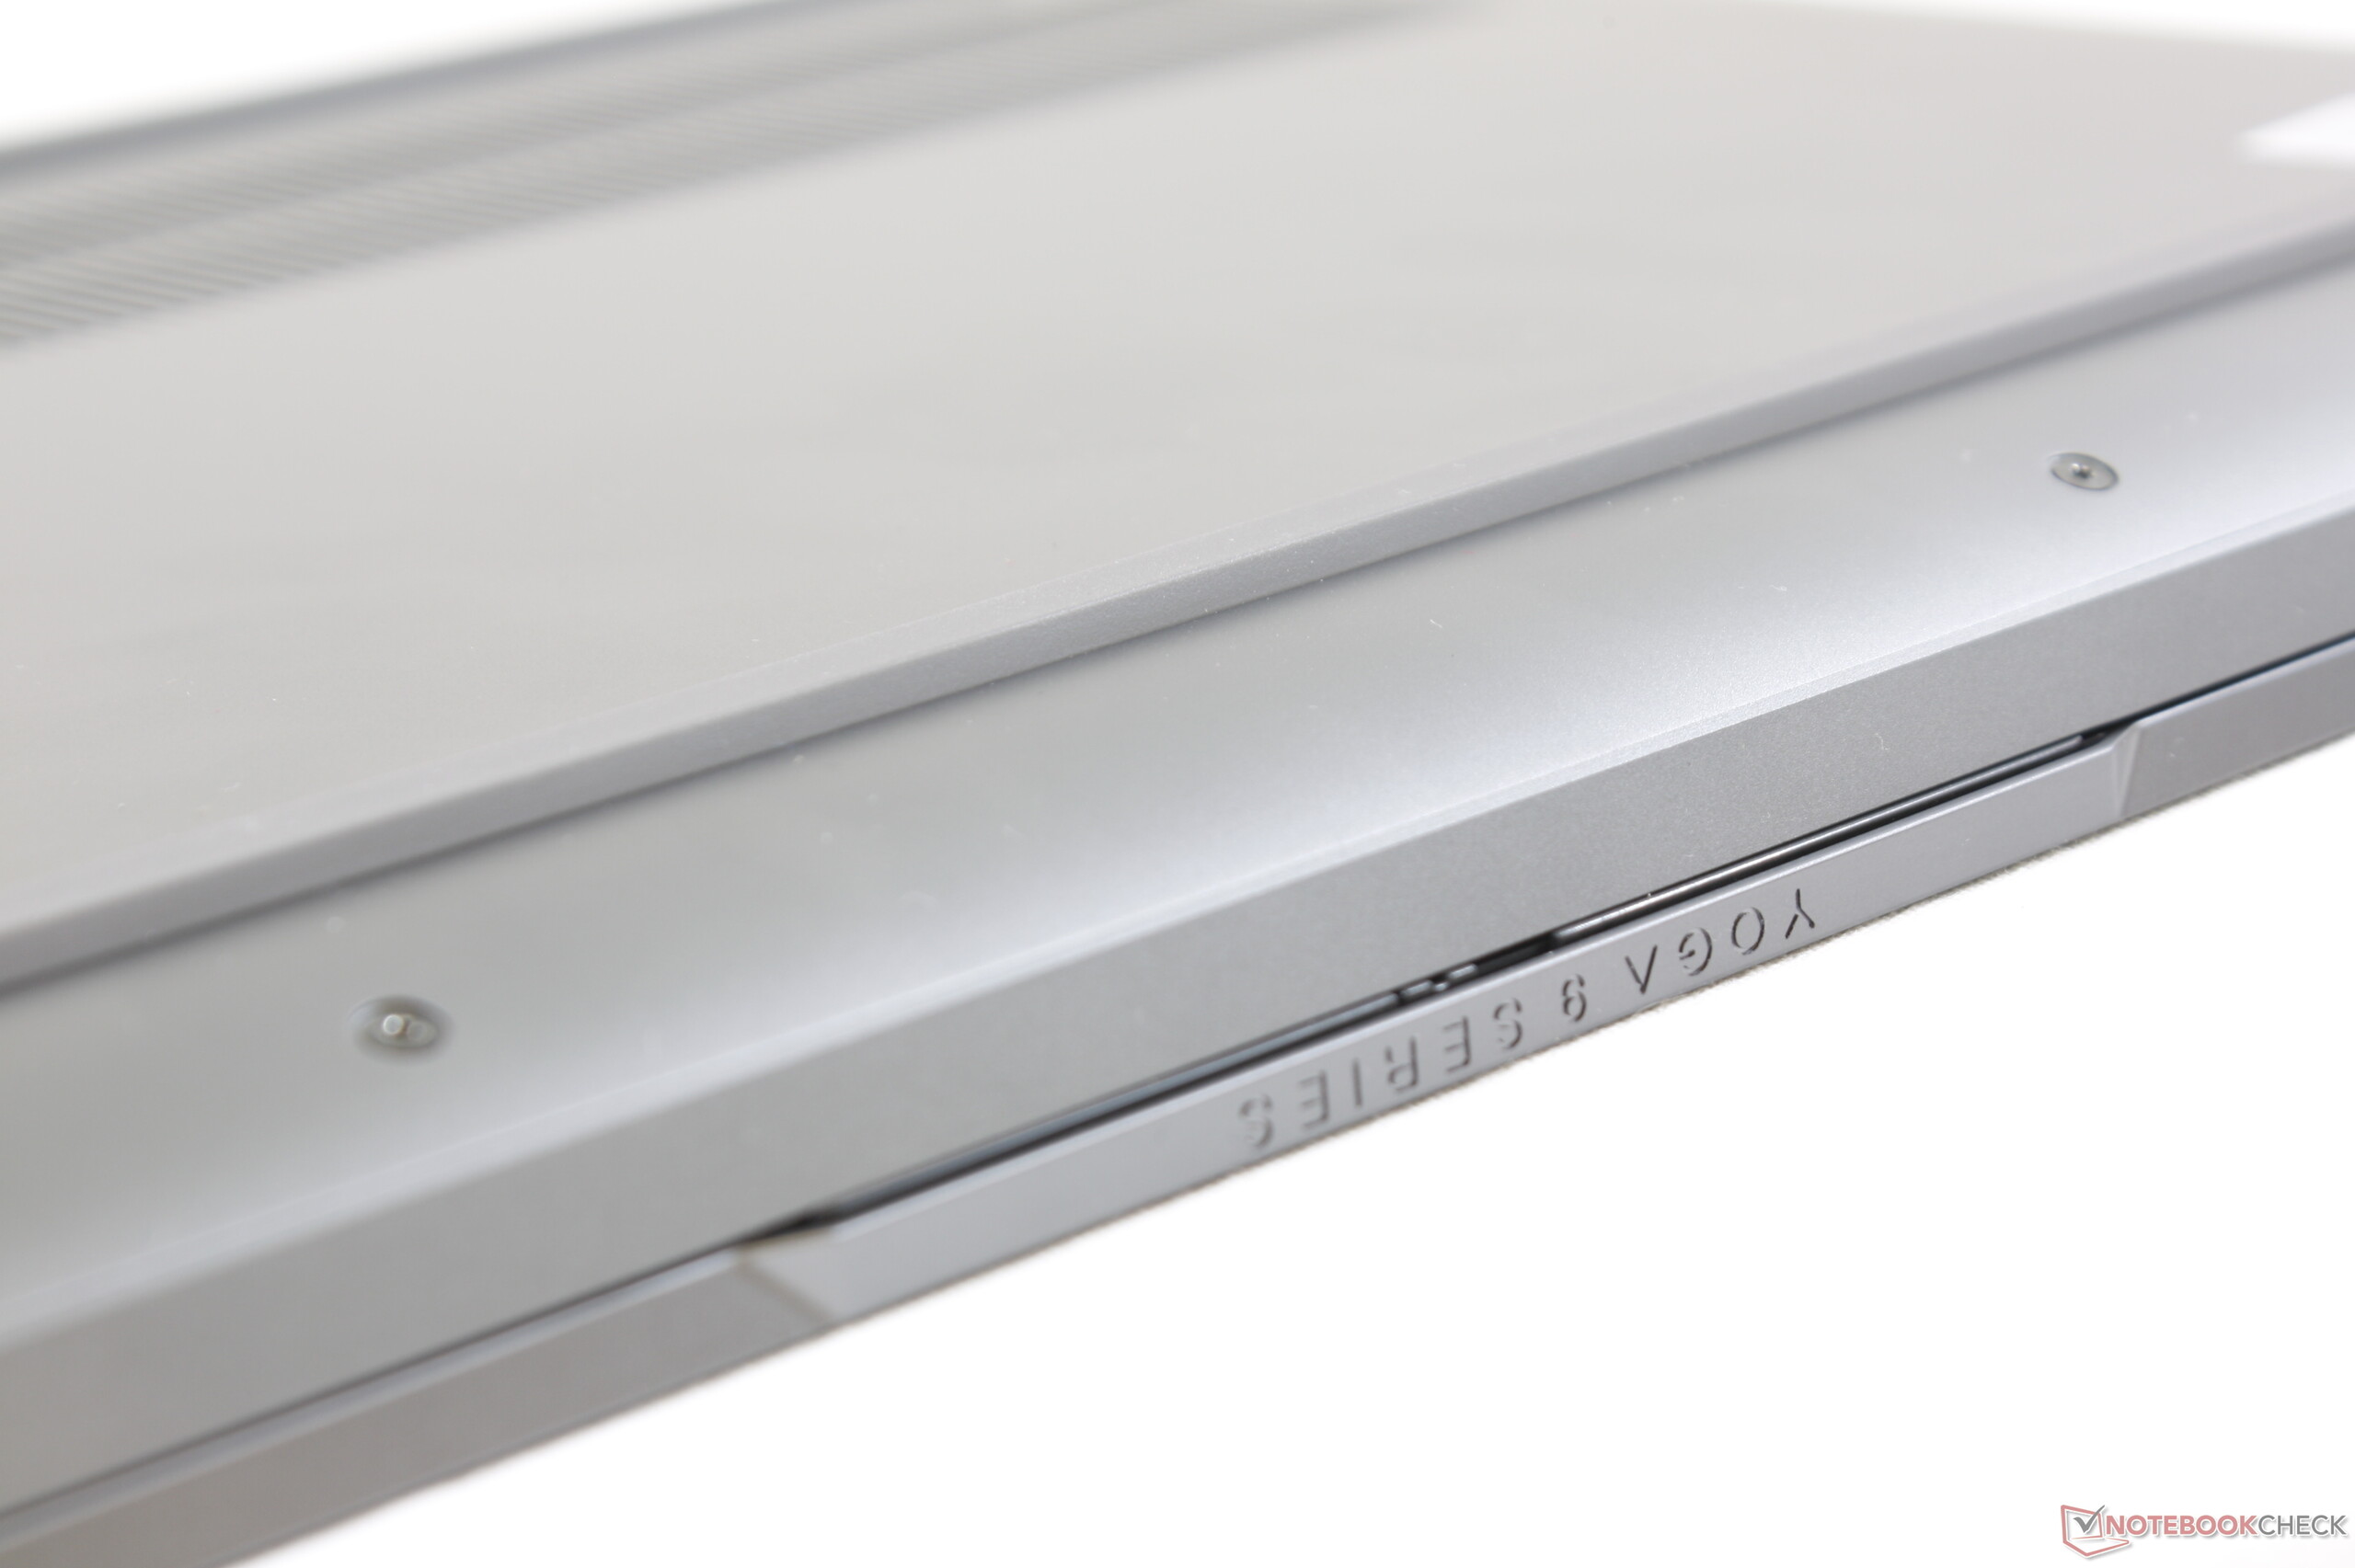
Lenovo Yoga C940-15IRH
- 12/15/2019 v7 (old)
Allen Ngo
Price comparison
