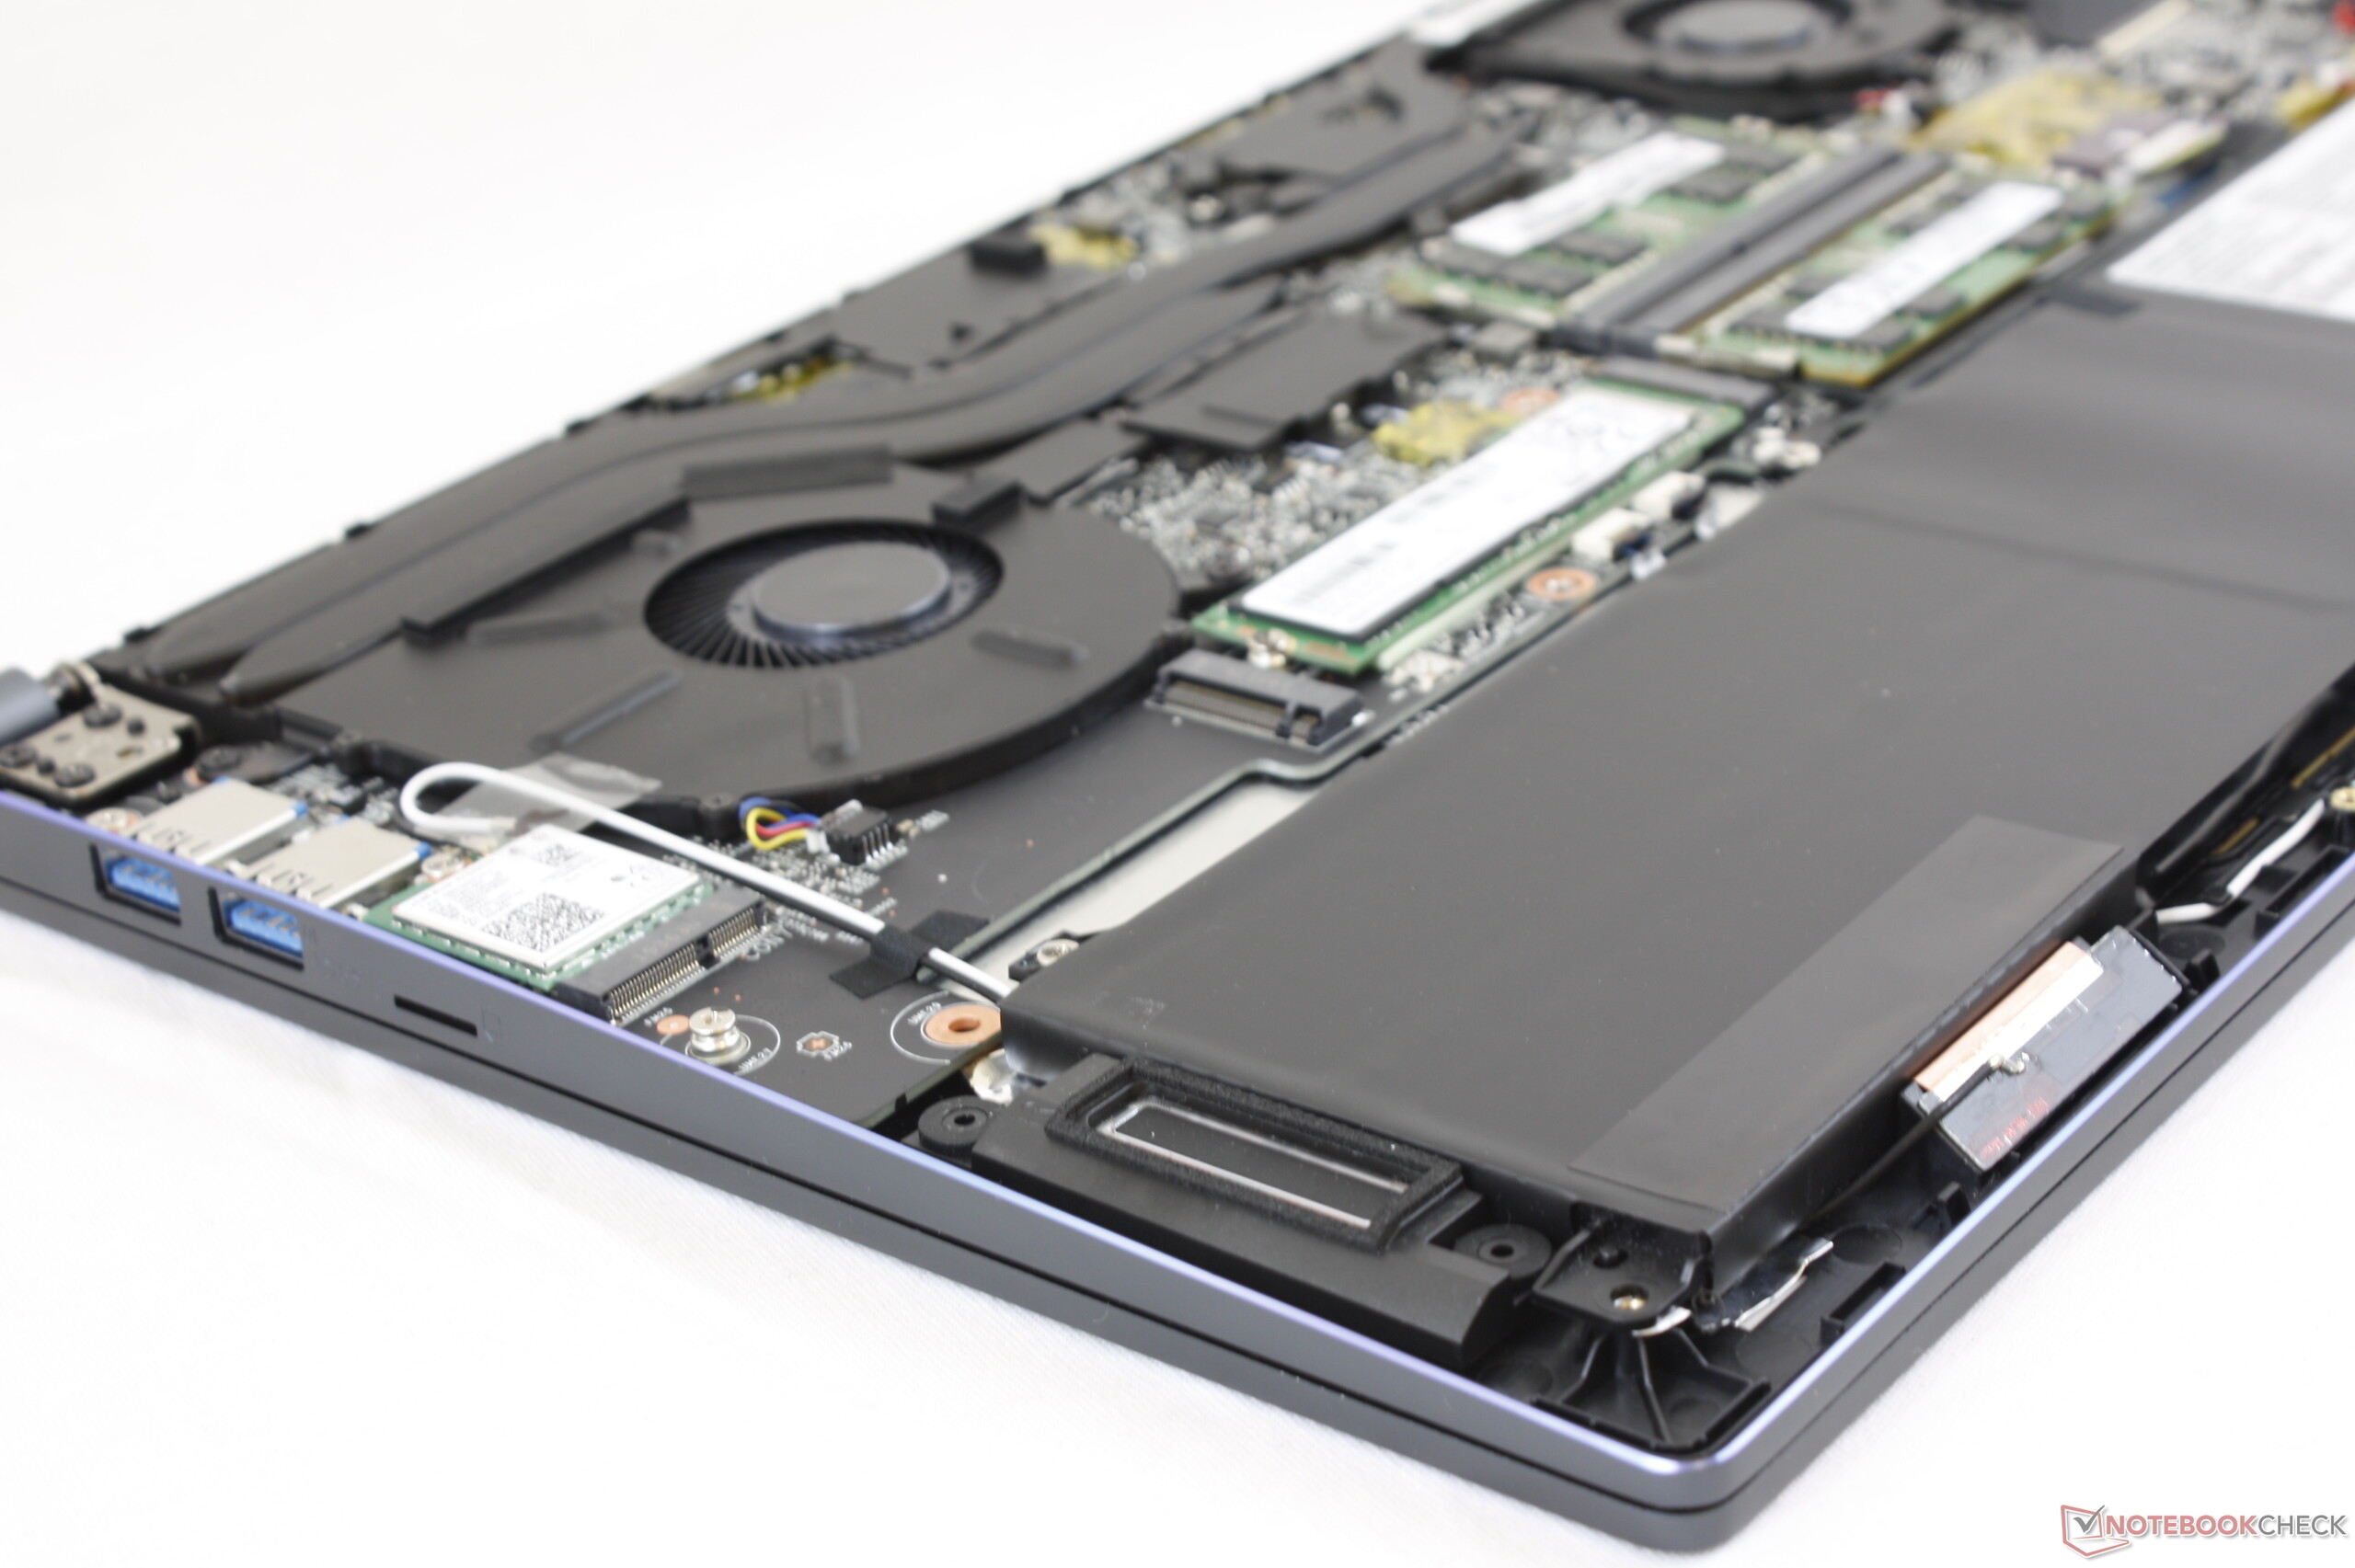
Breve Análise do Portátil MSI Prestige 15 A10SC: Uma das melhores alternativas do Dell XPS 15
Avaliação | Data | Modelo | Peso | Altura | Size | Resolução | Preço |
|---|---|---|---|---|---|---|---|
| 85.2 % v7 (old) | 11/2019 | MSI Prestige 15 A10SC i7-10710U, GeForce GTX 1650 Max-Q | 1.7 kg | 16 mm | 15.60" | 3840x2160 | |
| 82.9 % v7 (old) | 11/2019 | Microsoft Surface Laptop 3 15 Ryzen 5 3580U R5 3580U, Vega 9 | 1.5 kg | 14.7 mm | 15.00" | 2496x1664 | |
| 86.6 % v7 (old) | 07/2019 | Lenovo ThinkPad T590-20N4002VGE i7-8565U, GeForce MX250 | 1.9 kg | 19.95 mm | 15.60" | 1920x1080 | |
| 83.1 % v7 (old) | 10/2019 | Asus ZenBook 15 UX534FT-DB77 i7-8565U, GeForce GTX 1650 Max-Q | 1.7 kg | 18.9 mm | 15.60" | 1920x1080 | |
| 86.3 % v7 (old) | 09/2019 | Dell XPS 15 7590 i5 iGPU FHD i5-9300H, UHD Graphics 630 | 1.9 kg | 17 mm | 15.60" | 1920x1080 |
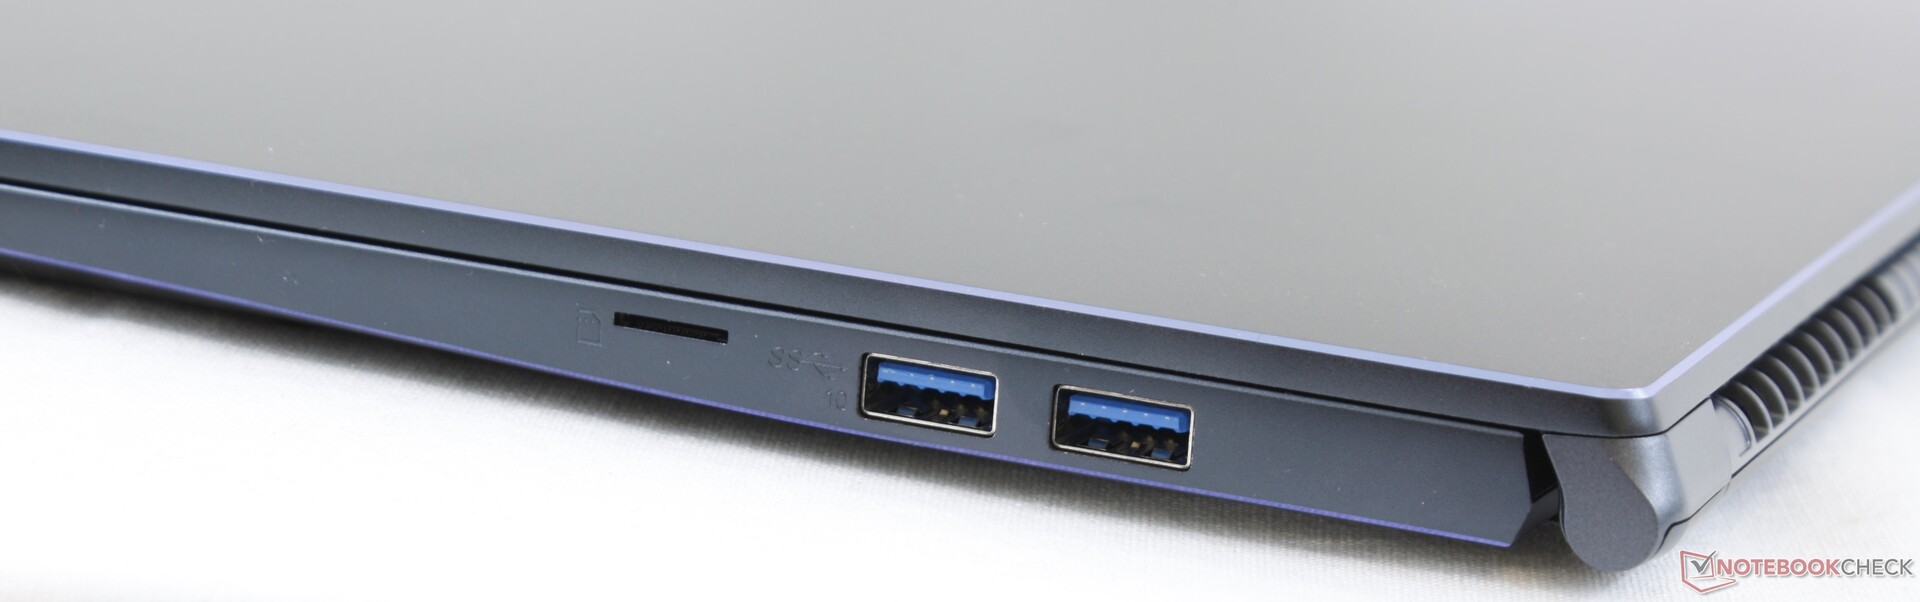
| SD Card Reader | |
| average JPG Copy Test (av. of 3 runs) | |
| Dell Latitude 5500 (Toshiba Exceria Pro M501 64 GB UHS-II) | |
| Dell Precision 5530 Xeon E-2176M (Toshiba Exceria Pro SDXC 64 GB UHS-II) | |
| MSI Prestige 15 A10SC (Toshiba Exceria Pro M501 UHS-II) | |
| Lenovo ThinkPad T590-20N4002VGE (Toshiba Exceria Pro M501 UHS-II) | |
| maximum AS SSD Seq Read Test (1GB) | |
| Dell Latitude 5500 (Toshiba Exceria Pro M501 64 GB UHS-II) | |
| MSI Prestige 15 A10SC (Toshiba Exceria Pro M501 UHS-II) | |
| Dell Precision 5530 Xeon E-2176M (Toshiba Exceria Pro SDXC 64 GB UHS-II) | |
| Lenovo ThinkPad T590-20N4002VGE (Toshiba Exceria Pro M501 UHS-II) | |
| |||||||||||||||||||||||||
iluminação: 92 %
iluminação com acumulador: 464.5 cd/m²
Contraste: 929:1 (Preto: 0.5 cd/m²)
ΔE ColorChecker Calman: 3.36 | ∀{0.5-29.43 Ø4.73}
calibrated: 3.42
ΔE Greyscale Calman: 1.3 | ∀{0.09-98 Ø4.97}
98.3% sRGB (Argyll 1.6.3 3D)
84.8% AdobeRGB 1998 (Argyll 1.6.3 3D)
96.2% AdobeRGB 1998 (Argyll 3D)
98.3% sRGB (Argyll 3D)
82% Display P3 (Argyll 3D)
Gamma: 2.14
CCT: 6596 K
| MSI Prestige 15 A10SC Sharp LQ156D1JW42, IPS, 15.6", 3840x2160 | Microsoft Surface Laptop 3 15 Ryzen 5 3580U Sharp LQ150P1JX51, IPS, 15", 2496x1664 | MSI P65 Creator 9SF-657 AU Optronics AUO41EB, IPS, 15.6", 3840x2160 | Dell Precision 5530 Xeon E-2176M Sharp SHP148D / LQ156D1, IGZO, 15.6", 3840x2160 | Dell Latitude 5500 LGD05FF 156WFD, IPS, 15.6", 1920x1080 | Lenovo ThinkPad T590-20N4002VGE LP156WFC-SPD1, aSi IPS LED, 15.6", 1920x1080 | |
|---|---|---|---|---|---|---|
| Display | -17% | 2% | -9% | -52% | -51% | |
| Display P3 Coverage (%) | 82 | 66.9 -18% | 84.4 3% | 76.5 -7% | 38.07 -54% | 38.79 -53% |
| sRGB Coverage (%) | 98.3 | 99.3 1% | 100 2% | 98.4 0% | 57.3 -42% | 58.3 -41% |
| AdobeRGB 1998 Coverage (%) | 96.2 | 63.7 -34% | 98.5 2% | 76.4 -21% | 39.33 -59% | 40.11 -58% |
| Response Times | 16% | 20% | 19% | 34% | 36% | |
| Response Time Grey 50% / Grey 80% * (ms) | 60 ? | 47.2 ? 21% | 51 ? 15% | 48 ? 20% | 37.6 ? 37% | 37.2 ? 38% |
| Response Time Black / White * (ms) | 41.2 ? | 36.8 ? 11% | 31 ? 25% | 33.6 ? 18% | 28.4 ? 31% | 27.2 ? 34% |
| PWM Frequency (Hz) | 26040 ? | 21370 ? | 1000 | |||
| Screen | 4% | -31% | -16% | -39% | -43% | |
| Brightness middle (cd/m²) | 464.5 | 416.9 -10% | 445 -4% | 451.7 -3% | 234 -50% | 276 -41% |
| Brightness (cd/m²) | 451 | 389 -14% | 462 2% | 440 -2% | 229 -49% | 262 -42% |
| Brightness Distribution (%) | 92 | 86 -7% | 83 -10% | 90 -2% | 93 1% | 88 -4% |
| Black Level * (cd/m²) | 0.5 | 0.4 20% | 0.5 -0% | 0.4 20% | 0.23 54% | 0.23 54% |
| Contrast (:1) | 929 | 1042 12% | 890 -4% | 1129 22% | 1017 9% | 1200 29% |
| Colorchecker dE 2000 * | 3.36 | 2.75 18% | 4.75 -41% | 3.11 7% | 5.2 -55% | 5.6 -67% |
| Colorchecker dE 2000 max. * | 7.06 | 6.64 6% | 7.79 -10% | 8.62 -22% | 14.7 -108% | 16.4 -132% |
| Colorchecker dE 2000 calibrated * | 3.42 | 0.71 79% | 3.07 10% | 4.6 -35% | 4.7 -37% | |
| Greyscale dE 2000 * | 1.3 | 1.8 -38% | 4.49 -245% | 3.7 -185% | 2.5 -92% | 3 -131% |
| Gamma | 2.14 103% | 2.09 105% | 2.49 88% | 2.11 104% | 2.44 90% | 2.18 101% |
| CCT | 6596 99% | 6646 98% | 7374 88% | 6492 100% | 6649 98% | 7075 92% |
| Color Space (Percent of AdobeRGB 1998) (%) | 84.8 | 63.4 -25% | 87 3% | 69 -19% | 36.2 -57% | 36.9 -56% |
| Color Space (Percent of sRGB) (%) | 98.3 | 99.4 1% | 100 2% | 98 0% | 57 -42% | 58.1 -41% |
| Média Total (Programa/Configurações) | 1% /
1% | -3% /
-17% | -2% /
-10% | -19% /
-32% | -19% /
-34% |
* ... menor é melhor
Exibir tempos de resposta
| ↔ Tempo de resposta preto para branco | ||
|---|---|---|
| 41.2 ms ... ascensão ↗ e queda ↘ combinadas | ↗ 22.8 ms ascensão | 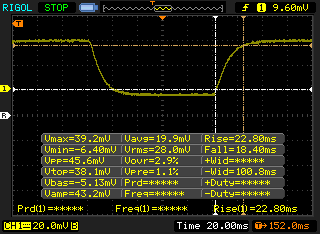 |
| ↘ 18.4 ms queda | ||
| A tela mostra taxas de resposta lentas em nossos testes e será insatisfatória para os jogadores. Em comparação, todos os dispositivos testados variam de 0.1 (mínimo) a 240 (máximo) ms. » 98 % de todos os dispositivos são melhores. Isso significa que o tempo de resposta medido é pior que a média de todos os dispositivos testados (19.9 ms). | ||
| ↔ Tempo de resposta 50% cinza a 80% cinza | ||
| 60 ms ... ascensão ↗ e queda ↘ combinadas | ↗ 29.2 ms ascensão | 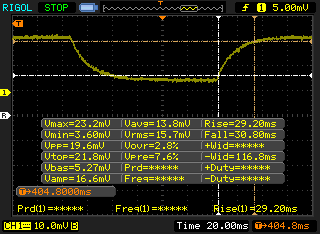 |
| ↘ 30.8 ms queda | ||
| A tela mostra taxas de resposta lentas em nossos testes e será insatisfatória para os jogadores. Em comparação, todos os dispositivos testados variam de 0.165 (mínimo) a 636 (máximo) ms. » 96 % de todos os dispositivos são melhores. Isso significa que o tempo de resposta medido é pior que a média de todos os dispositivos testados (31.1 ms). | ||
Cintilação da tela / PWM (modulação por largura de pulso)
| Tela tremeluzindo/PWM detectado | 26040 Hz | ≤ 24 % configuração de brilho | 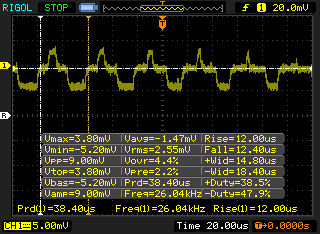 |
A luz de fundo da tela pisca em 26040 Hz (pior caso, por exemplo, utilizando PWM) Cintilação detectada em uma configuração de brilho de 24 % e abaixo. Não deve haver cintilação ou PWM acima desta configuração de brilho. A frequência de 26040 Hz é bastante alta, então a maioria dos usuários sensíveis ao PWM não deve notar nenhuma oscilação. [pwm_comparison] Em comparação: 52 % de todos os dispositivos testados não usam PWM para escurecer a tela. Se PWM foi detectado, uma média de 7798 (mínimo: 5 - máximo: 343500) Hz foi medida. | |||
| wPrime 2.10 - 1024m | |
| Dell XPS 13 7390 2-in-1 Core i7 | |
| Média Intel Core i7-10710U (171.1 - 177.4, n=2) | |
| MSI GE75 9SG | |
* ... menor é melhor
| PCMark 8 Home Score Accelerated v2 | 3546 pontos | |
| PCMark 8 Work Score Accelerated v2 | 4483 pontos | |
| PCMark 10 Score | 5009 pontos | |
Ajuda | ||
| MSI Prestige 15 A10SC Samsung SSD PM981 MZVLB1T0HALR | Microsoft Surface Laptop 3 15 Ryzen 5 3580U SK hynix BC501 HFM256GDGTNG | Lenovo ThinkPad T590-20N4002VGE Toshiba XG6 KXG60ZNV512G | Dell Latitude 5500 Toshiba XG6 KXG60ZNV1T02 | HP EliteBook 755 G5 3UN79EA Toshiba XG5 KXG50ZNV512G | Dell Precision 5530 Xeon E-2176M SK hynix PC400 512 GB | MSI P65 Creator 9SF-657 2x Samsung SSD PM981 MZVLB512HAJQ (RAID 0) | |
|---|---|---|---|---|---|---|---|
| AS SSD | -52% | 13% | 2% | -149% | -18% | 20% | |
| Seq Read (MB/s) | 1274 | 1122 -12% | 2551 100% | 1287 1% | 1810 42% | 2169 70% | 2860 124% |
| Seq Write (MB/s) | 1395 | 514 -63% | 2376 70% | 1280 -8% | 261.4 -81% | 1022 -27% | 2604 87% |
| 4K Read (MB/s) | 50.3 | 34.98 -30% | 52.7 5% | 49.57 -1% | 24.38 -52% | 38.43 -24% | 45.15 -10% |
| 4K Write (MB/s) | 119.8 | 96.8 -19% | 153 28% | 158 32% | 5.77 -95% | 92.8 -23% | 100.2 -16% |
| 4K-64 Read (MB/s) | 1599 | 492 -69% | 1406 -12% | 1043 -35% | 528 -67% | 970 -39% | 1428 -11% |
| 4K-64 Write (MB/s) | 1455 | 339.9 -77% | 1439 -1% | 1415 -3% | 90.7 -94% | 926 -36% | 1401 -4% |
| Access Time Read * (ms) | 0.044 | 0.056 -27% | 0.067 -52% | 0.039 11% | 0.2 -355% | 0.073 -66% | 0.049 -11% |
| Access Time Write * (ms) | 0.092 | 0.11 -20% | 0.027 71% | 0.027 71% | 0.748 -713% | 0.053 42% | 0.037 60% |
| Score Read (Points) | 1777 | 639 -64% | 1714 -4% | 1221 -31% | 733 -59% | 1226 -31% | 1759 -1% |
| Score Write (Points) | 1714 | 488 -72% | 1829 7% | 1701 -1% | 123 -93% | 1121 -35% | 1762 3% |
| Score Total (Points) | 4411 | 1434 -67% | 4418 0% | 3558 -19% | 1157 -74% | 2922 -34% | 4411 0% |
| Copy ISO MB/s (MB/s) | 2830 | 828 -71% | 2625 -7% | ||||
| Copy Program MB/s (MB/s) | 609 | 200.5 -67% | 495.9 -19% | ||||
| Copy Game MB/s (MB/s) | 1424 | 387.4 -73% | 1384 -3% |
* ... menor é melhor

| 3DMark | |
| 1280x720 Cloud Gate Standard Graphics | |
| Lenovo Legion Y740-17IRH | |
| Razer Blade 15 GTX 1660 Ti | |
| Asus FX503VM-EH73 | |
| MSI GT72S-6QEG16SR421BW | |
| Acer Nitro 5 AN515-54-78TL | |
| Gainward GeForce GTX 1650 4 GB | |
| HP Pavilion Gaming 15-cx0003ng | |
| Média NVIDIA GeForce GTX 1650 Max-Q (21759 - 53981, n=12) | |
| Lenovo Yoga 730-15IKB | |
| MSI Prestige 15 A10SC | |
| 1920x1080 Fire Strike Graphics | |
| Lenovo Legion Y740-17IRH | |
| Razer Blade 15 GTX 1660 Ti | |
| Asus FX503VM-EH73 | |
| MSI GT72S-6QEG16SR421BW | |
| Acer Nitro 5 AN515-54-78TL | |
| Gainward GeForce GTX 1650 4 GB | |
| Média NVIDIA GeForce GTX 1650 Max-Q (6985 - 8618, n=12) | |
| MSI Prestige 15 A10SC | |
| HP Pavilion Gaming 15-cx0003ng | |
| Lenovo Yoga 730-15IKB | |
| 2560x1440 Time Spy Graphics | |
| Lenovo Legion Y740-17IRH | |
| Razer Blade 15 GTX 1660 Ti | |
| Asus FX503VM-EH73 | |
| Gainward GeForce GTX 1650 4 GB | |
| Acer Nitro 5 AN515-54-78TL | |
| MSI Prestige 15 A10SC | |
| Média NVIDIA GeForce GTX 1650 Max-Q (2836 - 3238, n=10) | |
| MSI GT72S-6QEG16SR421BW | |
| HP Pavilion Gaming 15-cx0003ng | |
| Lenovo Yoga 730-15IKB | |
| 3DMark 11 | |
| 1280x720 Performance GPU | |
| Lenovo Legion Y740-17IRH | |
| Razer Blade 15 GTX 1660 Ti | |
| Asus FX503VM-EH73 | |
| Gainward GeForce GTX 1650 4 GB | |
| MSI GT72S-6QEG16SR421BW | |
| MSI Prestige 15 A10SC | |
| Média NVIDIA GeForce GTX 1650 Max-Q (10248 - 12259, n=14) | |
| HP Pavilion Gaming 15-cx0003ng | |
| Lenovo Yoga 730-15IKB | |
| 1280x720 Performance Combined | |
| Lenovo Legion Y740-17IRH | |
| Gainward GeForce GTX 1650 4 GB | |
| Razer Blade 15 GTX 1660 Ti | |
| MSI Prestige 15 A10SC | |
| MSI GT72S-6QEG16SR421BW | |
| Média NVIDIA GeForce GTX 1650 Max-Q (6409 - 10846, n=13) | |
| HP Pavilion Gaming 15-cx0003ng | |
| Asus FX503VM-EH73 | |
| Lenovo Yoga 730-15IKB | |
| 3DMark 11 Performance | 11613 pontos | |
| 3DMark Cloud Gate Standard Score | 17802 pontos | |
| 3DMark Fire Strike Score | 7103 pontos | |
| 3DMark Time Spy Score | 3282 pontos | |
Ajuda | ||
| Shadow of the Tomb Raider | |
| 1280x720 Lowest Preset | |
| MSI GE75 9SG | |
| Gainward GeForce GTX 1650 4 GB | |
| Razer Blade Pro 17 4K UHD 120 Hz | |
| Lenovo Legion Y740-17IRH | |
| Alienware m15 P79F | |
| Média NVIDIA GeForce GTX 1650 Max-Q (92 - 151, n=5) | |
| Razer Blade 15 GTX 1660 Ti | |
| MSI Prestige 15 A10SC | |
| Dell G3 3590 | |
| Asus GL753VD | |
| Asus TUF FX705GE-EW096T | |
| Dell Inspiron 15 5000 5585 | |
| Microsoft Surface Laptop 3 15 Ryzen 5 3580U | |
| Dell XPS 13 7390 2-in-1 Core i7 | |
| 1920x1080 Highest Preset AA:T | |
| MSI GE75 9SG | |
| Razer Blade Pro 17 4K UHD 120 Hz | |
| Alienware m15 P79F | |
| Lenovo Legion Y740-17IRH | |
| Razer Blade 15 GTX 1660 Ti | |
| Gainward GeForce GTX 1650 4 GB | |
| Média NVIDIA GeForce GTX 1650 Max-Q (33 - 45, n=6) | |
| MSI Prestige 15 A10SC | |
| Asus TUF FX705GE-EW096T | |
| Asus GL753VD | |
| baixo | média | alto | ultra | |
|---|---|---|---|---|
| BioShock Infinite (2013) | 296.3 | 215.1 | 188.4 | 77 |
| The Witcher 3 (2015) | 155.4 | 94.1 | 54.8 | 30.8 |
| Rocket League (2017) | 196 | 128.2 | 88 | |
| Shadow of the Tomb Raider (2018) | 113 | 51 | 42 | 35 |
| MSI Prestige 15 A10SC GeForce GTX 1650 Max-Q, i7-10710U, Samsung SSD PM981 MZVLB1T0HALR | Microsoft Surface Laptop 3 15 Ryzen 5 3580U Vega 9, R5 3580U, SK hynix BC501 HFM256GDGTNG | MSI P65 Creator 9SF-657 GeForce RTX 2070 Max-Q, i9-9880H, 2x Samsung SSD PM981 MZVLB512HAJQ (RAID 0) | Lenovo ThinkPad T590-20N4002VGE GeForce MX250, i7-8565U, Toshiba XG6 KXG60ZNV512G | Dell Latitude 5500 UHD Graphics 620, i7-8665U, Toshiba XG6 KXG60ZNV1T02 | HP EliteBook 755 G5 3UN79EA Vega 10, R7 2700U, Toshiba XG5 KXG50ZNV512G | Dell Precision 5530 Xeon E-2176M Quadro P2000, E-2176M, SK hynix PC400 512 GB | |
|---|---|---|---|---|---|---|---|
| Noise | 6% | -9% | 4% | 9% | 0% | -7% | |
| desligado / ambiente * (dB) | 29.3 | 28 4% | 30.2 -3% | 29.4 -0% | 28.8 2% | 30.5 -4% | 28.4 3% |
| Idle Minimum * (dB) | 30.1 | 28 7% | 32.8 -9% | 29.3 3% | 28.8 4% | 30.5 -1% | 28.4 6% |
| Idle Average * (dB) | 30.2 | 28 7% | 32.8 -9% | 29.3 3% | 28.8 5% | 30.5 -1% | 28.4 6% |
| Idle Maximum * (dB) | 30.2 | 28 7% | 33.6 -11% | 31.8 -5% | 28.8 5% | 30.5 -1% | 28.4 6% |
| Load Average * (dB) | 31.5 | 29.2 7% | 40.9 -30% | 33.5 -6% | 30.3 4% | 37.5 -19% | 46.5 -48% |
| Witcher 3 ultra * (dB) | 37 | 39 -5% | 33.5 9% | 46.5 -26% | |||
| Load Maximum * (dB) | 47 | 41.4 12% | 42.7 9% | 35.8 24% | 32.6 31% | 35 26% | 46.5 1% |
* ... menor é melhor
Barulho
| Ocioso |
| 30.1 / 30.2 / 30.2 dB |
| Carga |
| 31.5 / 47 dB |
 | ||
30 dB silencioso 40 dB(A) audível 50 dB(A) ruidosamente alto |
||
min: | ||
(-) A temperatura máxima no lado superior é 56 °C / 133 F, em comparação com a média de 36.8 °C / 98 F , variando de 21 a 71 °C para a classe Multimedia.
(-) A parte inferior aquece até um máximo de 60.6 °C / 141 F, em comparação com a média de 39.1 °C / 102 F
(+) Em uso inativo, a temperatura média para o lado superior é 27.2 °C / 81 F, em comparação com a média do dispositivo de 31.3 °C / ### class_avg_f### F.
(-) Jogando The Witcher 3, a temperatura média para o lado superior é 39.4 °C / 103 F, em comparação com a média do dispositivo de 31.3 °C / ## #class_avg_f### F.
(+) Os apoios para as mãos e o touchpad estão atingindo a temperatura máxima da pele (34.6 °C / 94.3 F) e, portanto, não estão quentes.
(-) A temperatura média da área do apoio para as mãos de dispositivos semelhantes foi 28.7 °C / 83.7 F (-5.9 °C / -10.6 F).
MSI Prestige 15 A10SC análise de áudio
(±) | o volume do alto-falante é médio, mas bom (###valor### dB)
Graves 100 - 315Hz
(±) | graves reduzidos - em média 12.8% menor que a mediana
(+) | o baixo é linear (6.4% delta para a frequência anterior)
Médios 400 - 2.000 Hz
(+) | médios equilibrados - apenas 4.6% longe da mediana
(±) | a linearidade dos médios é média (10% delta para frequência anterior)
Altos 2 - 16 kHz
(+) | agudos equilibrados - apenas 2.4% longe da mediana
(+) | os máximos são lineares (6.4% delta da frequência anterior)
Geral 100 - 16.000 Hz
(±) | a linearidade do som geral é média (20.2% diferença em relação à mediana)
Comparado com a mesma classe
» 68% de todos os dispositivos testados nesta classe foram melhores, 8% semelhantes, 24% piores
» O melhor teve um delta de 5%, a média foi 17%, o pior foi 45%
Comparado com todos os dispositivos testados
» 52% de todos os dispositivos testados foram melhores, 8% semelhantes, 39% piores
» O melhor teve um delta de 4%, a média foi 24%, o pior foi 134%
Apple MacBook 12 (Early 2016) 1.1 GHz análise de áudio
(+) | os alto-falantes podem tocar relativamente alto (###valor### dB)
Graves 100 - 315Hz
(±) | graves reduzidos - em média 11.3% menor que a mediana
(±) | a linearidade dos graves é média (14.2% delta para a frequência anterior)
Médios 400 - 2.000 Hz
(+) | médios equilibrados - apenas 2.4% longe da mediana
(+) | médios são lineares (5.5% delta para frequência anterior)
Altos 2 - 16 kHz
(+) | agudos equilibrados - apenas 2% longe da mediana
(+) | os máximos são lineares (4.5% delta da frequência anterior)
Geral 100 - 16.000 Hz
(+) | o som geral é linear (10.2% diferença em relação à mediana)
Comparado com a mesma classe
» 7% de todos os dispositivos testados nesta classe foram melhores, 2% semelhantes, 91% piores
» O melhor teve um delta de 5%, a média foi 18%, o pior foi 53%
Comparado com todos os dispositivos testados
» 5% de todos os dispositivos testados foram melhores, 1% semelhantes, 94% piores
» O melhor teve um delta de 4%, a média foi 24%, o pior foi 134%
| desligado | |
| Ocioso | |
| Carga |
|
Key:
min: | |
| MSI Prestige 15 A10SC i7-10710U, GeForce GTX 1650 Max-Q, Samsung SSD PM981 MZVLB1T0HALR, IPS, 3840x2160, 15.6" | Microsoft Surface Laptop 3 15 Ryzen 5 3580U R5 3580U, Vega 9, SK hynix BC501 HFM256GDGTNG, IPS, 2496x1664, 15" | Lenovo ThinkPad T590-20N4002VGE i7-8565U, GeForce MX250, Toshiba XG6 KXG60ZNV512G, aSi IPS LED, 1920x1080, 15.6" | Dell Latitude 5500 i7-8665U, UHD Graphics 620, Toshiba XG6 KXG60ZNV1T02, IPS, 1920x1080, 15.6" | HP EliteBook 755 G5 3UN79EA R7 2700U, Vega 10, Toshiba XG5 KXG50ZNV512G, IPS, 1920x1080, 15.6" | MSI P65 Creator 9SF-657 i9-9880H, GeForce RTX 2070 Max-Q, 2x Samsung SSD PM981 MZVLB512HAJQ (RAID 0), IPS, 3840x2160, 15.6" | Dell Precision 5530 Xeon E-2176M E-2176M, Quadro P2000, SK hynix PC400 512 GB, IGZO, 3840x2160, 15.6" | |
|---|---|---|---|---|---|---|---|
| Power Consumption | 46% | 29% | 40% | 33% | -53% | -24% | |
| Idle Minimum * (Watt) | 6.1 | 3.3 46% | 4.1 33% | 4.4 28% | 5 18% | 9.4 -54% | 9.8 -61% |
| Idle Average * (Watt) | 13.2 | 7.1 46% | 8.3 37% | 6.9 48% | 10.6 20% | 17.4 -32% | 16.8 -27% |
| Idle Maximum * (Watt) | 19.2 | 7.2 62% | 11.8 39% | 7.7 60% | 12.9 33% | 19.6 -2% | 16.9 12% |
| Load Average * (Watt) | 75 | 44.8 40% | 61.6 18% | 43.6 42% | 40.6 46% | 103 -37% | 102.3 -36% |
| Witcher 3 ultra * (Watt) | 74 | 45.1 39% | 54.4 26% | 76.5 -3% | |||
| Load Maximum * (Watt) | 89.7 | 53 41% | 69.4 23% | 69.1 23% | 46.6 48% | 216 -141% | 114.5 -28% |
* ... menor é melhor
| MSI Prestige 15 A10SC i7-10710U, GeForce GTX 1650 Max-Q, 82 Wh | Microsoft Surface Laptop 3 15 Ryzen 5 3580U R5 3580U, Vega 9, 45 Wh | Lenovo ThinkPad T590-20N4002VGE i7-8565U, GeForce MX250, 57 Wh | Dell Latitude 5500 i7-8665U, UHD Graphics 620, 68 Wh | HP EliteBook 755 G5 3UN79EA R7 2700U, Vega 10, 56 Wh | MSI P65 Creator 9SF-657 i9-9880H, GeForce RTX 2070 Max-Q, 82 Wh | Dell Precision 5530 Xeon E-2176M E-2176M, Quadro P2000, 97 Wh | |
|---|---|---|---|---|---|---|---|
| Duração da bateria | -0% | 53% | 62% | -16% | -40% | -6% | |
| Reader / Idle (h) | 19.1 | 18.7 -2% | 11.9 -38% | 9.6 -50% | 16.5 -14% | ||
| WiFi v1.3 (h) | 7.6 | 9.1 20% | 10.5 38% | 12.3 62% | 8.3 9% | 6 -21% | 8.4 11% |
| Load (h) | 2.1 | 1.7 -19% | 3.5 67% | 1.7 -19% | 1.1 -48% | 1.8 -14% |
Pro
Contra
Veredicto - Excelente com algumas desvantagens
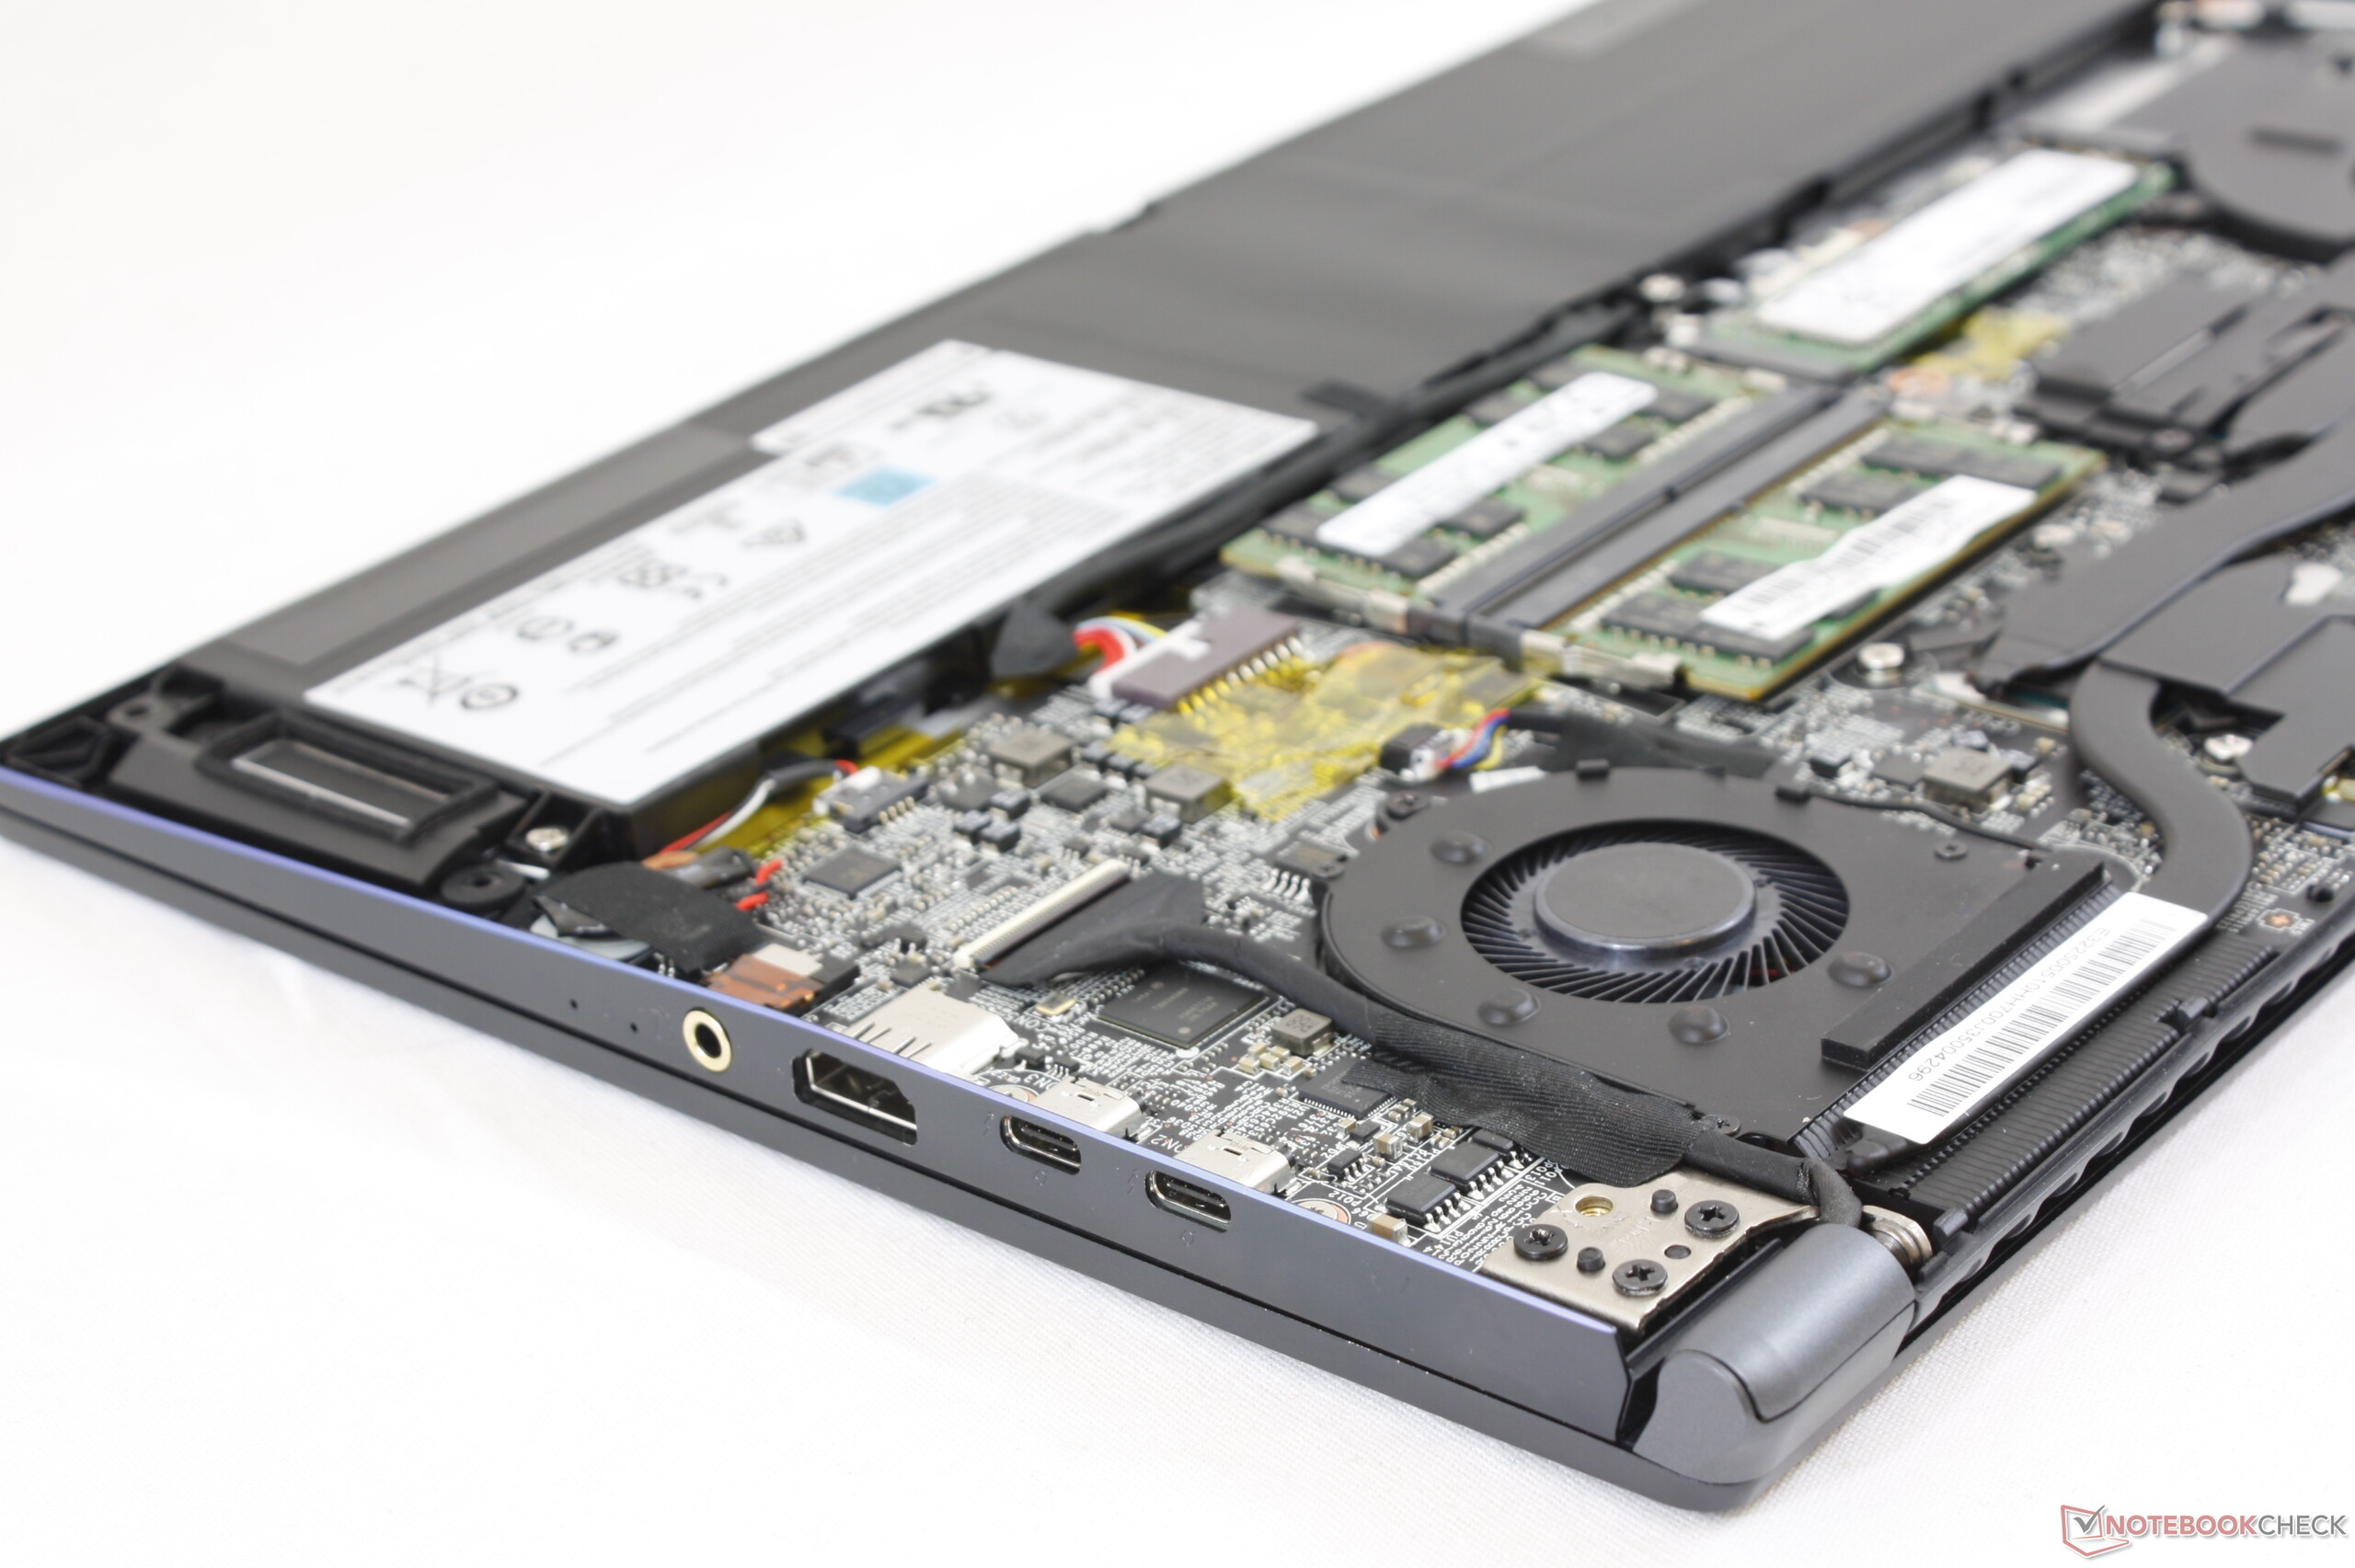
(Atualização de 14 de novembro de 2019: Não conseguimos reproduzir o comportamento de afogamento da CPU em uma segunda unidade Prestige 15. As velocidades e a temperatura do núcleo se estabilizariam em 2,8 GHz e 95 °C, respectivamente, na segunda unidade. No entanto, as temperaturas do núcleo são mais altas do que gostaríamos quando sob uso tão intenso. Recomendamos manter seu sistema atualizado por meio dos controladores da MSI e App Center e ficar de olho na temperatura da CPU se estiver com 100% de utilização.)
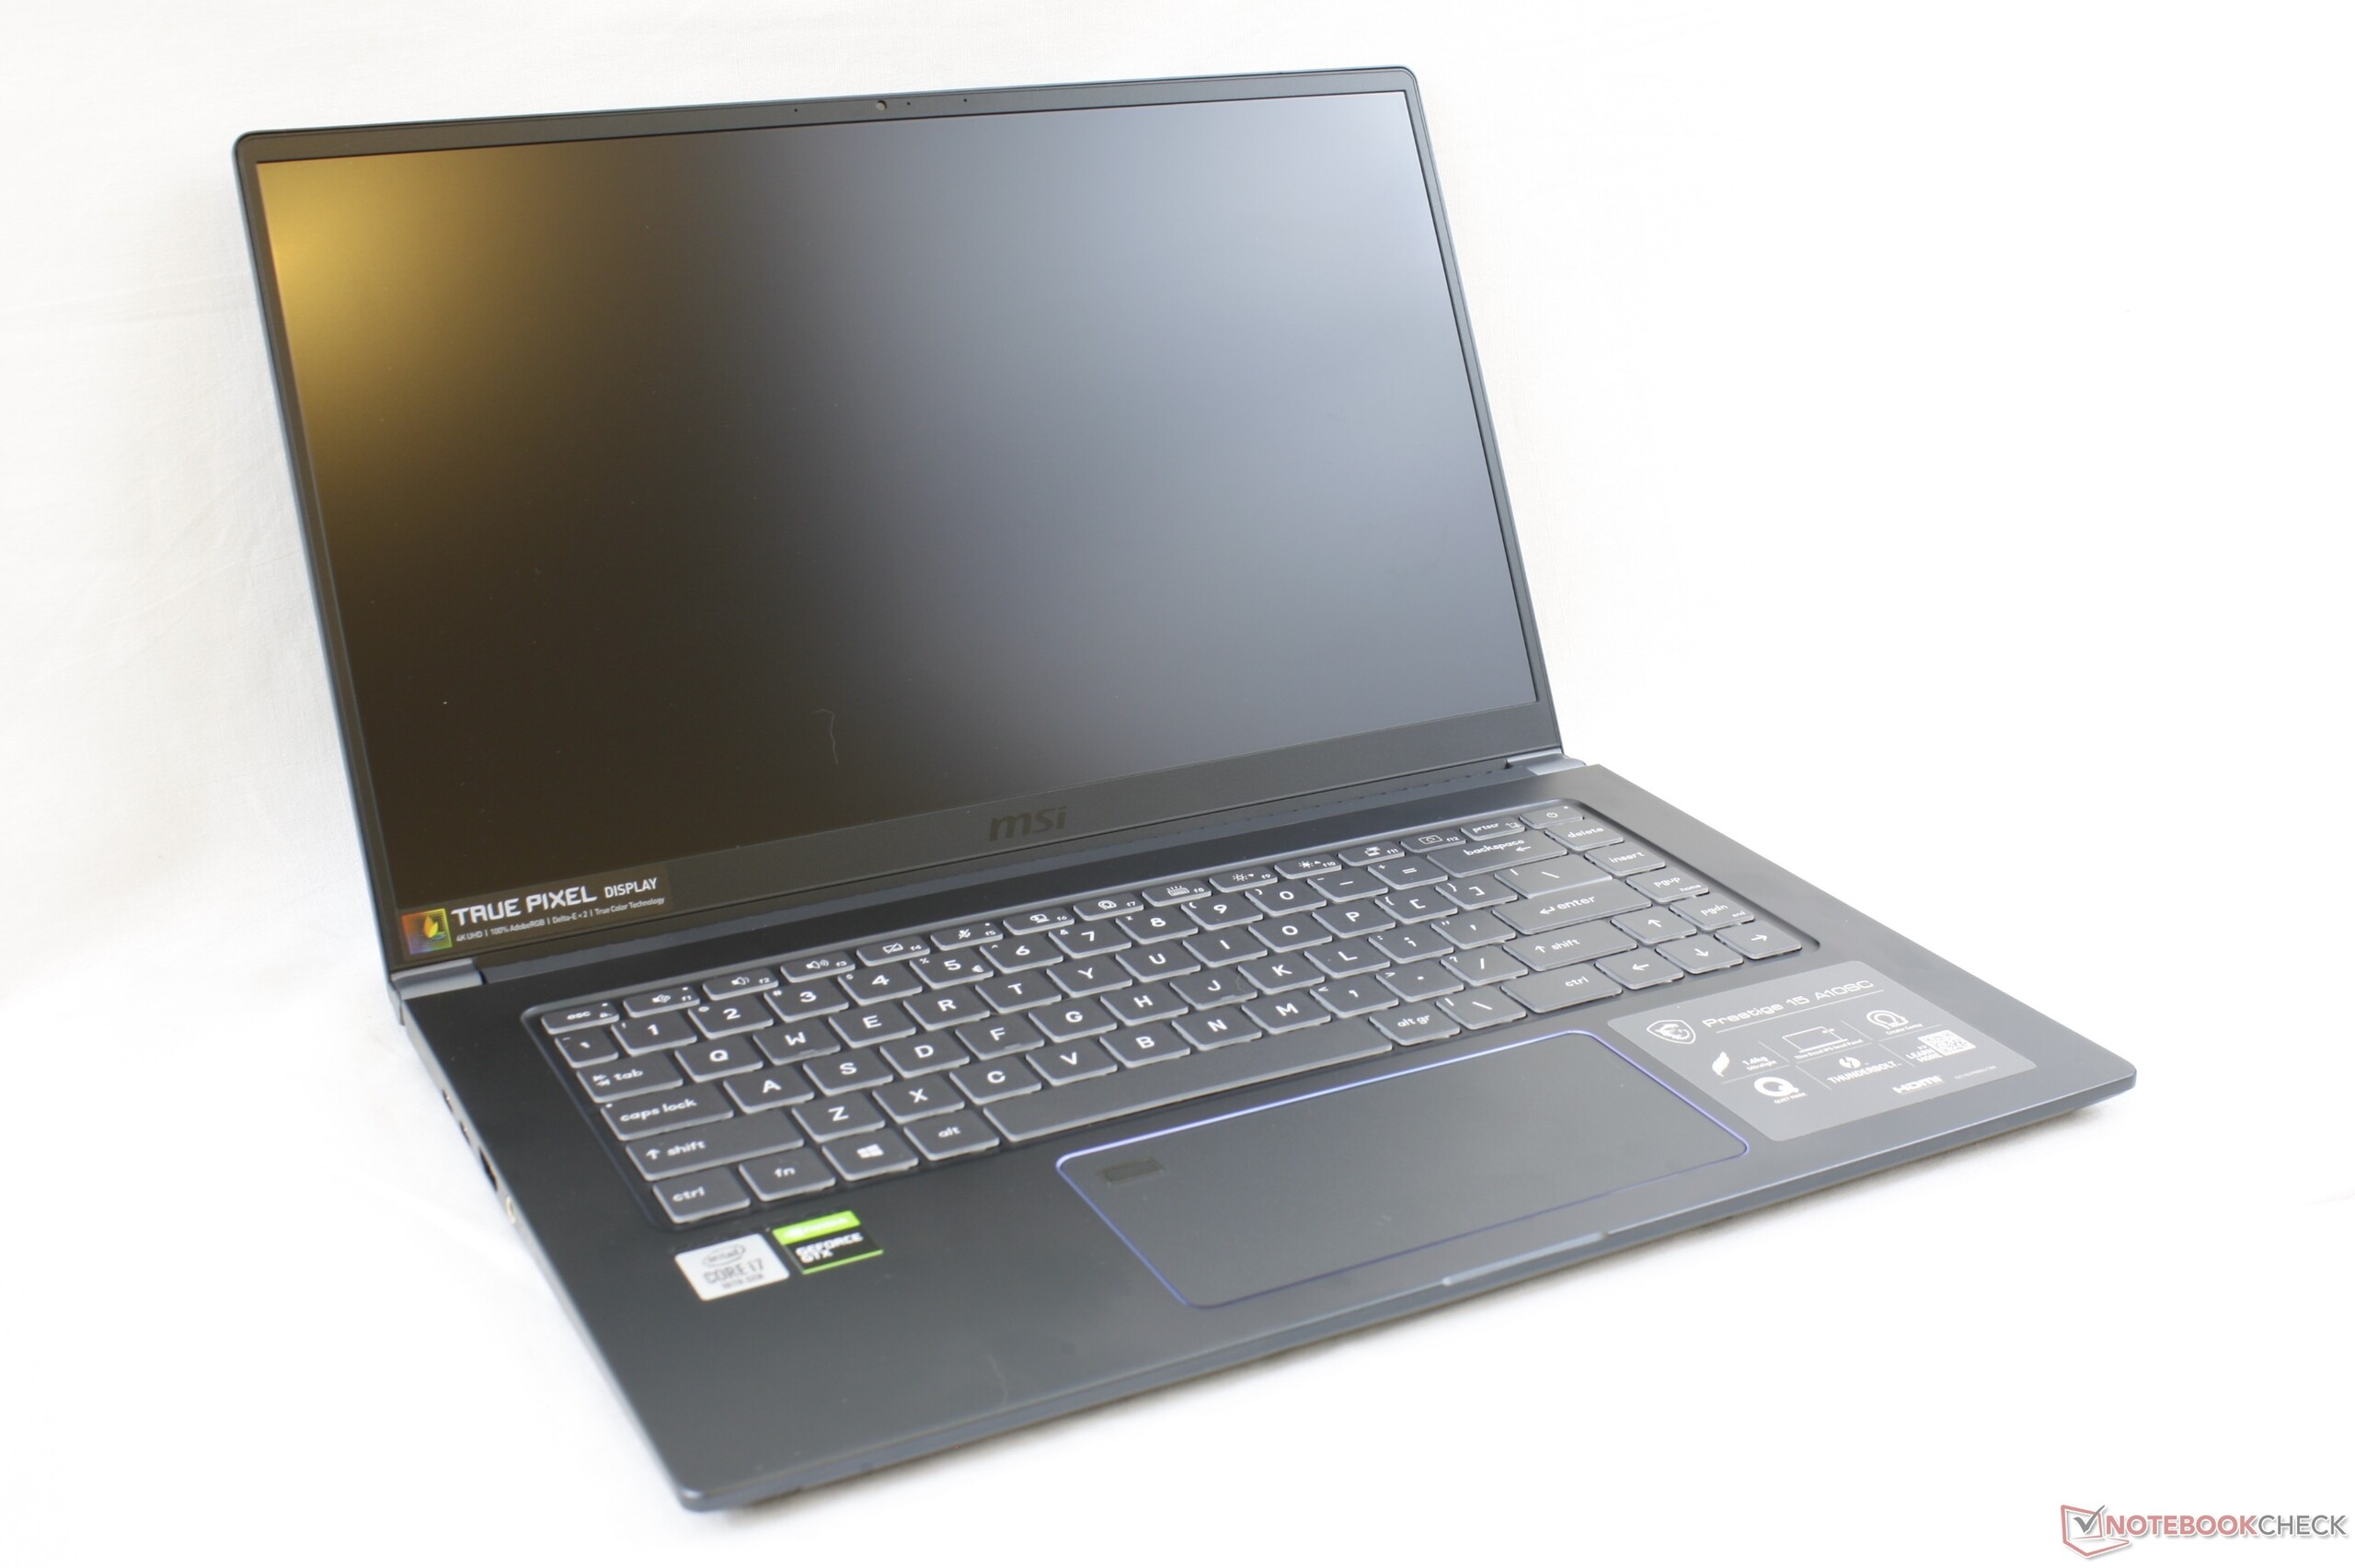
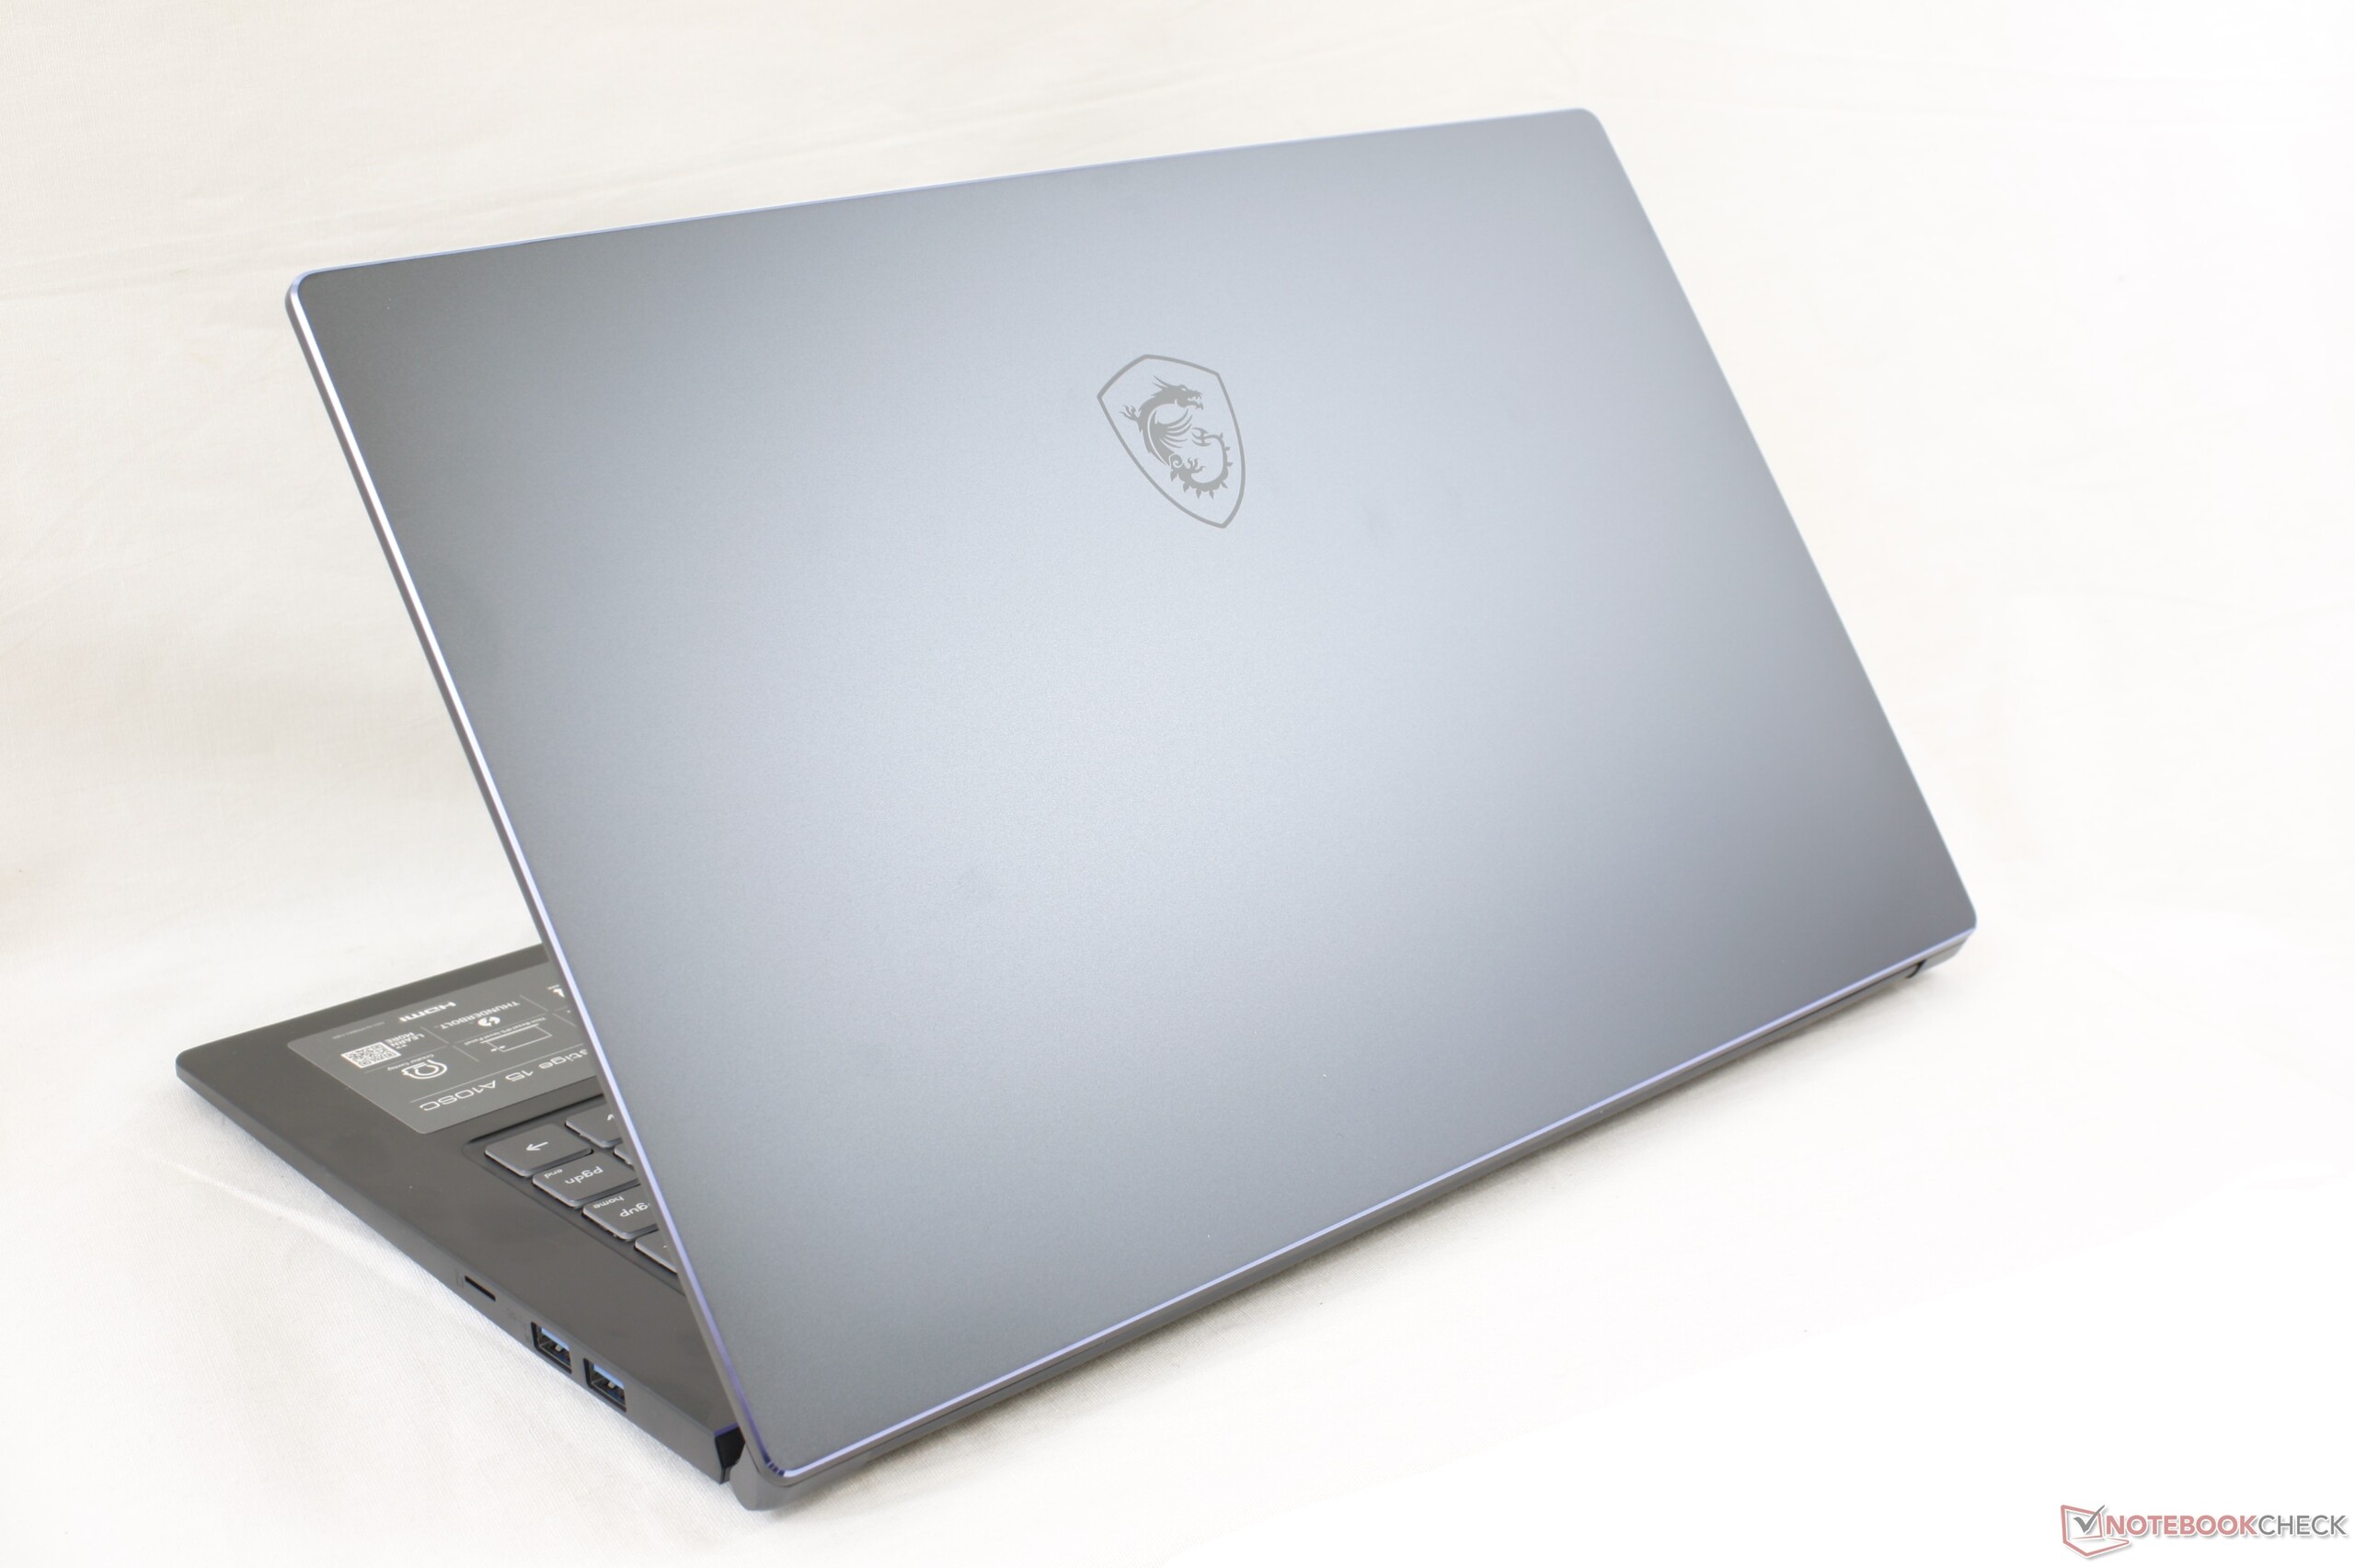
O Prestige 15 é a prova de que a MSI pode produzir mais do que apenas produtos de jogos. É indiscutivelmente tão visualmente atraente quanto o XPS 15, ZenBook 15 ou Spectre x360 15, sendo mais leve e, em geral, mais versátil para viagens devido ao seu carregador USB Tipo C. A CPU Comet Lake-U hexa-core funciona muito bem como uma alternativa à Coffee Lake-H quad-core, desde que os programas executados possam explorar completamente os seis núcleos físicos disponíveis. Enquanto isso, a tela 4K UHD é mais brilhante e precisa do que a maioria dos Ultrabooks de 15,6 polegadas tem para oferecer, incluindo o Asus e HP acima mencionados. O ruído do ventilador também é menos propenso a pulsar durante usos mais intensos quando comparado aos Ultrabooks com os processadores Intel série H mais exigentes.
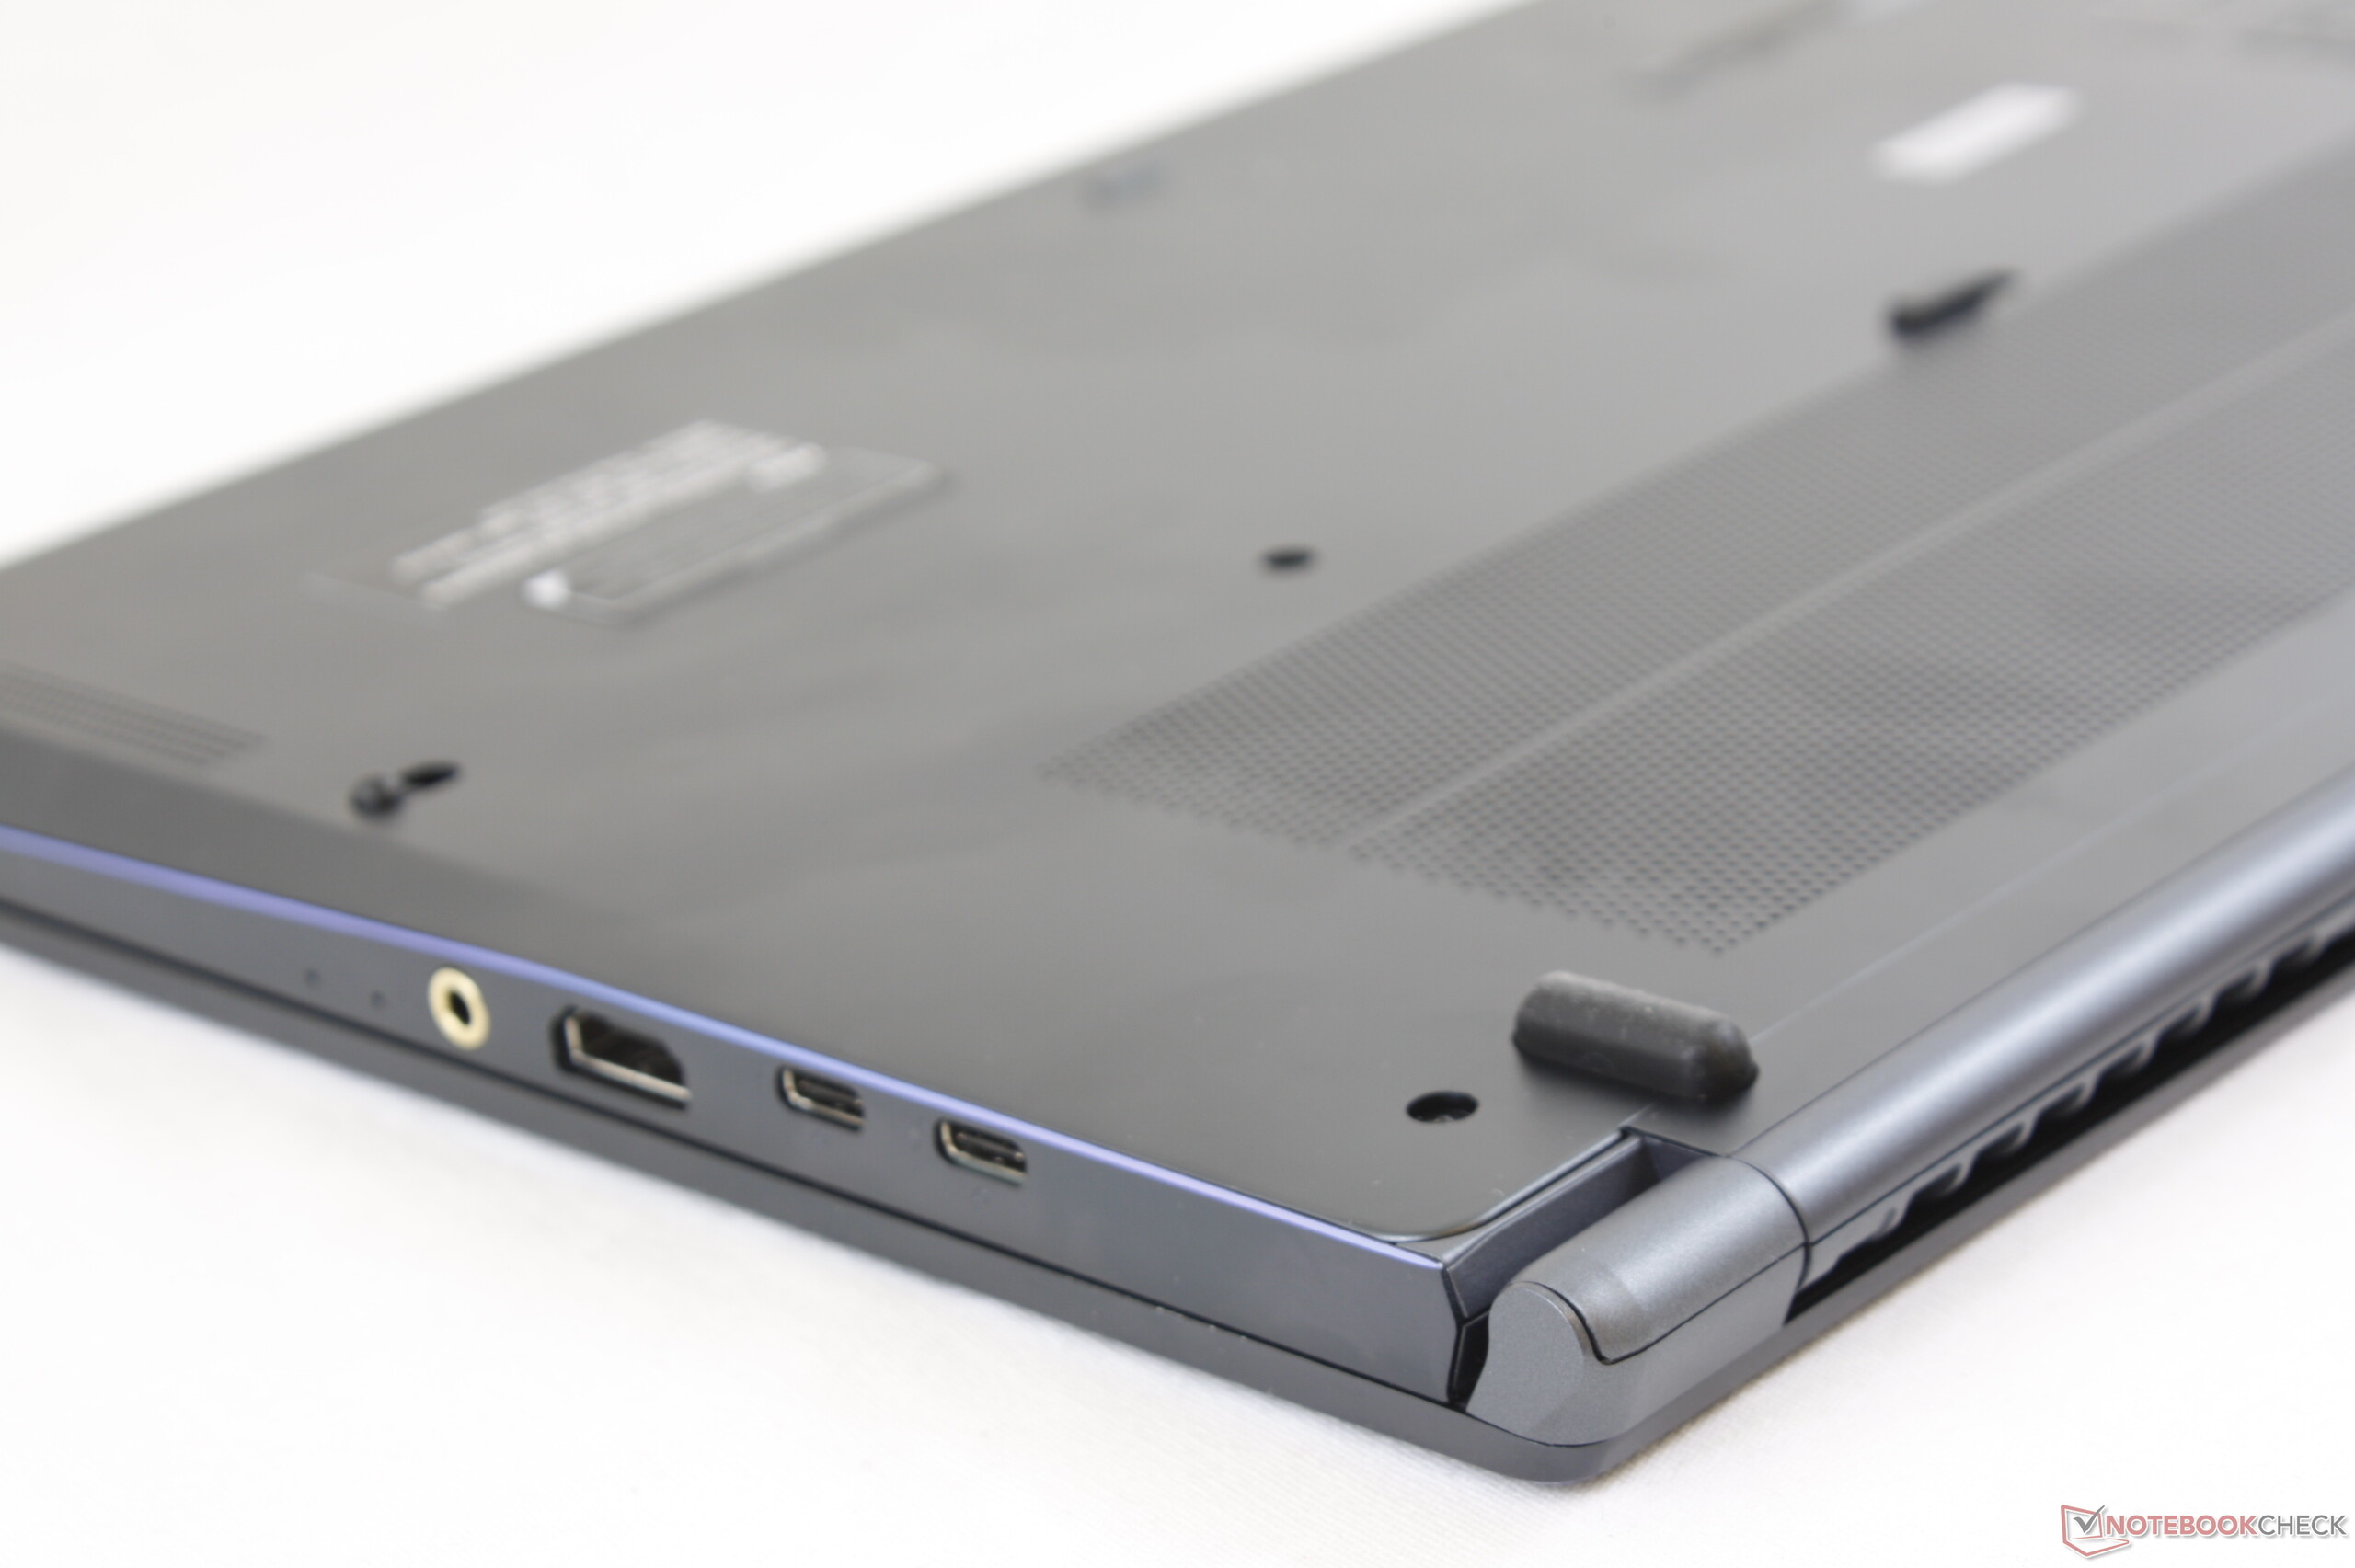
Ainda há muito que a MSI pode fazer para tornar o Prestige 15 ainda melhor. A falta de um Kensington Lock e câmera IR, por exemplo, são estranhas omissões em um portátil de escritório de gama alta. A carcaça poderia ser mais rígida, pois não se sente tão forte quanto os carros-chefes da Dell ou HP. O afogamento da CPU poderia ser melhor gerenciado quando está sendo utilizada em 100 por cento. Embora o sistema use uma CPU Intel ULV e GPU Max-Q Nvidia, as temperaturas do núcleo ainda são muito quentes quando estão sob uso intenso. A resposta do teclado e do clickpad, em particular, poderia ser mais clara e menos esponjosa.
O MSI Prestige 15 oferece um excelente equilíbrio entre peso, qualidade da tela, desempenho da CPU, desempenho da GPU e opções de portas. Esperamos que a rigidez do chassi, a resposta do teclado e do clickpad, a otimização da CPU e alguns recursos de segurança ausentes possam ser abordados em futuras revisões.
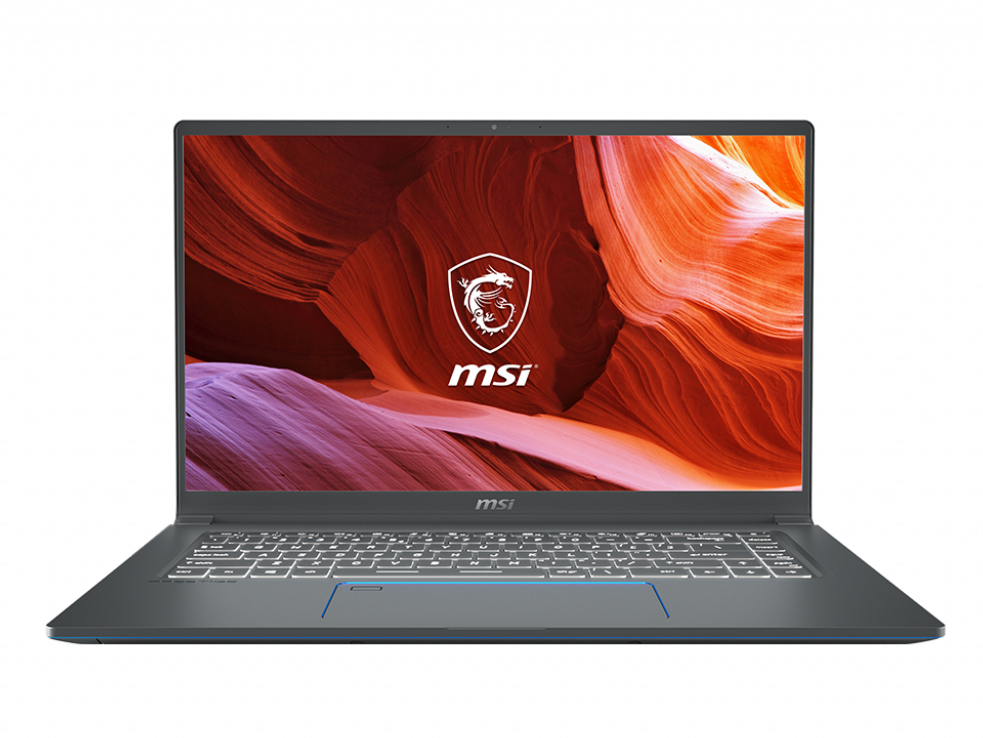
MSI Prestige 15 A10SC
- 11/14/2019 v7 (old)
Allen Ngo
Price comparison
