Breve Análise do Portátil Gigabyte Aero 15-Y9 (i9-8950HK, RTX 2080 Max-Q)
| SD Card Reader | |
| average JPG Copy Test (av. of 3 runs) | |
| Gigabyte Aero 15-X9 (Toshiba Exceria Pro SDXC 64 GB UHS-II) | |
| Gigabyte Aero 15-Y9 (Toshiba Exceria Pro SDXC 64 GB UHS-II) | |
| Gigabyte Aero 15X v8 (Toshiba Exceria Pro SDXC 64 GB UHS-II) | |
| Média da turma Gaming (20.9 - 210, n=54, últimos 2 anos) | |
| maximum AS SSD Seq Read Test (1GB) | |
| Gigabyte Aero 15X v8 (Toshiba Exceria Pro SDXC 64 GB UHS-II) | |
| Gigabyte Aero 15-X9 (Toshiba Exceria Pro SDXC 64 GB UHS-II) | |
| Gigabyte Aero 15-Y9 (Toshiba Exceria Pro SDXC 64 GB UHS-II) | |
| Média da turma Gaming (25.5 - 261, n=51, últimos 2 anos) | |
| |||||||||||||||||||||||||
iluminação: 92 %
iluminação com acumulador: 350 cd/m²
Contraste: 1207:1 (Preto: 0.29 cd/m²)
ΔE ColorChecker Calman: 0.93 | ∀{0.5-29.43 Ø4.71}
calibrated: 0.62
ΔE Greyscale Calman: 1.21 | ∀{0.09-98 Ø4.96}
100% sRGB (Argyll 1.6.3 3D)
88% AdobeRGB 1998 (Argyll 1.6.3 3D)
99.7% AdobeRGB 1998 (Argyll 3D)
100% sRGB (Argyll 3D)
86.8% Display P3 (Argyll 3D)
Gamma: 2.2
CCT: 6672 K
| Gigabyte Aero 15-Y9 AU Optronics B156ZAN03.1 (AUO31EB), IPS, 3840x2160 | Gigabyte Aero 15-X9 LGD05C0, IPS, 1920x1080 | MSI GS65 8RF-019DE Stealth Thin AU Optronics B156HAN08.0 (AUO80ED), IPS, 1920x1080 | Asus Zephyrus S GX531GS AU Optronics B156HAN08.2 (AUO82ED), IPS, 1920x1080 | Acer Predator Triton 500 AU Optronics B156HAN08.2 (AUO82ED), IPS, 1920x1080 | Razer Blade 15 RTX 2070 Max-Q LG Philips LGD05C0, IPS, 1920x1080 | |
|---|---|---|---|---|---|---|
| Display | -23% | -22% | -22% | -22% | -21% | |
| Display P3 Coverage (%) | 86.8 | 63.5 -27% | 66.2 -24% | 66.7 -23% | 64.2 -26% | 65.3 -25% |
| sRGB Coverage (%) | 100 | 93.1 -7% | 92.1 -8% | 91.2 -9% | 92.6 -7% | 94.9 -5% |
| AdobeRGB 1998 Coverage (%) | 99.7 | 64.5 -35% | 67.2 -33% | 66.7 -33% | 65.7 -34% | 66.3 -34% |
| Response Times | 63% | 64% | 77% | 74% | 66% | |
| Response Time Grey 50% / Grey 80% * (ms) | 60 ? | 16.4 ? 73% | 17.6 ? 71% | 7.4 ? 88% | 8 ? 87% | 16.8 ? 72% |
| Response Time Black / White * (ms) | 28.8 ? | 13.6 ? 53% | 12.8 ? 56% | 10 ? 65% | 11.2 ? 61% | 11.6 ? 60% |
| PWM Frequency (Hz) | ||||||
| Screen | -27% | -62% | -75% | -143% | -81% | |
| Brightness middle (cd/m²) | 350 | 250 -29% | 254 -27% | 294 -16% | 304 -13% | 314.7 -10% |
| Brightness (cd/m²) | 337 | 235 -30% | 262 -22% | 275 -18% | 299 -11% | 312 -7% |
| Brightness Distribution (%) | 92 | 85 -8% | 89 -3% | 84 -9% | 89 -3% | 90 -2% |
| Black Level * (cd/m²) | 0.29 | 0.29 -0% | 0.22 24% | 0.24 17% | 0.27 7% | 0.38 -31% |
| Contrast (:1) | 1207 | 862 -29% | 1155 -4% | 1225 1% | 1126 -7% | 828 -31% |
| Colorchecker dE 2000 * | 0.93 | 1.46 -57% | 2.37 -155% | 2.57 -176% | 4.66 -401% | 2.56 -175% |
| Colorchecker dE 2000 max. * | 1.43 | 2.47 -73% | 4.71 -229% | 4.88 -241% | 9.65 -575% | 4.89 -242% |
| Colorchecker dE 2000 calibrated * | 0.62 | 1.84 -197% | 2.14 -245% | 1.72 -177% | 1.71 -176% | |
| Greyscale dE 2000 * | 1.21 | 1.27 -5% | 1.58 -31% | 2.41 -99% | 5.53 -357% | 3.4 -181% |
| Gamma | 2.2 100% | 2.4 92% | 2.48 89% | 2.5 88% | 2.5 88% | 2.3 96% |
| CCT | 6672 97% | 6749 96% | 6785 96% | 6370 102% | 8028 81% | 6435 101% |
| Color Space (Percent of AdobeRGB 1998) (%) | 88 | 60 -32% | 60 -32% | 59 -33% | 60 -32% | 60.7 -31% |
| Color Space (Percent of sRGB) (%) | 100 | 93 -7% | 92 -8% | 91 -9% | 93 -7% | 94.6 -5% |
| Média Total (Programa/Configurações) | 4% /
-14% | -7% /
-39% | -7% /
-46% | -30% /
-93% | -12% /
-51% |
* ... menor é melhor
Exibir tempos de resposta
| ↔ Tempo de resposta preto para branco | ||
|---|---|---|
| 28.8 ms ... ascensão ↗ e queda ↘ combinadas | ↗ 13.2 ms ascensão | 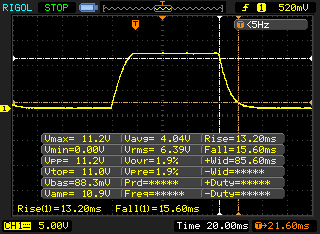 |
| ↘ 15.6 ms queda | ||
| A tela mostra taxas de resposta relativamente lentas em nossos testes e pode ser muito lenta para os jogadores. Em comparação, todos os dispositivos testados variam de 0.1 (mínimo) a 240 (máximo) ms. » 76 % de todos os dispositivos são melhores. Isso significa que o tempo de resposta medido é pior que a média de todos os dispositivos testados (19.8 ms). | ||
| ↔ Tempo de resposta 50% cinza a 80% cinza | ||
| 60 ms ... ascensão ↗ e queda ↘ combinadas | ↗ 29.2 ms ascensão | 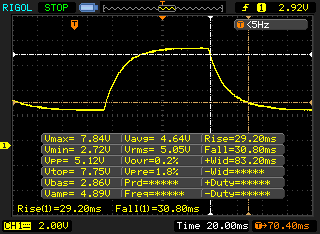 |
| ↘ 30.8 ms queda | ||
| A tela mostra taxas de resposta lentas em nossos testes e será insatisfatória para os jogadores. Em comparação, todos os dispositivos testados variam de 0.165 (mínimo) a 636 (máximo) ms. » 96 % de todos os dispositivos são melhores. Isso significa que o tempo de resposta medido é pior que a média de todos os dispositivos testados (31 ms). | ||
Cintilação da tela / PWM (modulação por largura de pulso)
| Tela tremeluzindo / PWM não detectado | 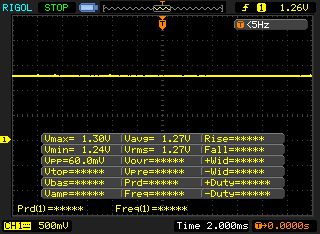 | ||
[pwm_comparison] Em comparação: 52 % de todos os dispositivos testados não usam PWM para escurecer a tela. Se PWM foi detectado, uma média de 7754 (mínimo: 5 - máximo: 343500) Hz foi medida. | |||

| Cinebench R10 | |
| Rendering Single 32Bit | |
| Média da turma Gaming (7457 - 12575, n=9, últimos 2 anos) | |
| Gigabyte Aero 15-Y9 | |
| Gigabyte Aero 15-X9 | |
| Rendering Multiple CPUs 32Bit | |
| Média da turma Gaming (42932 - 102066, n=9, últimos 2 anos) | |
| Gigabyte Aero 15-Y9 | |
| Gigabyte Aero 15-X9 | |
| Cinebench R20 | |
| CPU (Single Core) | |
| Média da turma Gaming (442 - 913, n=106, últimos 2 anos) | |
| Gigabyte Aero 15-Y9 | |
| CPU (Multi Core) | |
| Média da turma Gaming (4029 - 16433, n=106, últimos 2 anos) | |
| Gigabyte Aero 15-Y9 | |
| Geekbench 3 | |
| 32 Bit Multi-Core Score | |
| Gigabyte Aero 15-Y9 | |
| Gigabyte Aero 15-X9 | |
| 32 Bit Single-Core Score | |
| Gigabyte Aero 15-Y9 | |
| Gigabyte Aero 15-X9 | |
| Geekbench 4.4 | |
| 64 Bit Multi-Core Score | |
| Média da turma Gaming (89200 - 101054, n=3, últimos 2 anos) | |
| Gigabyte Aero 15-Y9 | |
| Gigabyte Aero 15-X9 | |
| 64 Bit Single-Core Score | |
| Média da turma Gaming (9335 - 9775, n=3, últimos 2 anos) | |
| Gigabyte Aero 15-Y9 | |
| Gigabyte Aero 15-X9 | |
| Mozilla Kraken 1.1 - Total | |
| Gigabyte Aero 15-X9 (Edge 44) | |
| Razer Blade 15 RTX 2070 Max-Q (Edge 44.17763.1.0) | |
| Gigabyte Aero 15-Y9 (Edge 44) | |
| Média da turma Gaming (391 - 590, n=100, últimos 2 anos) | |
| Octane V2 - Total Score | |
| Média da turma Gaming (93292 - 139447, n=27, últimos 2 anos) | |
| Gigabyte Aero 15-Y9 (Edge 44) | |
| Gigabyte Aero 15-X9 (Edge 44) | |
| Razer Blade 15 RTX 2070 Max-Q (Edge 44.17763.1.0) | |
| JetStream 1.1 - 1.1 Total | |
| Média da turma Gaming (549 - 647, n=3, últimos 2 anos) | |
| Gigabyte Aero 15-Y9 (Edge 44) | |
| Razer Blade 15 RTX 2070 Max-Q (Edge 44.17763.1.0) | |
| Gigabyte Aero 15-X9 (Edge 44) | |
* ... menor é melhor
| PCMark 7 Score | 6905 pontos | |
| PCMark 8 Home Score Accelerated v2 | 3944 pontos | |
| PCMark 8 Creative Score Accelerated v2 | 5164 pontos | |
| PCMark 8 Work Score Accelerated v2 | 4775 pontos | |
| PCMark 10 Score | 5743 pontos | |
Ajuda | ||

| Gigabyte Aero 15-Y9 Intel SSD 760p SSDPEKKW020T8 | Gigabyte Aero 15-X9 Intel SSD 760p SSDPEKKW010T8 | MSI GS65 8RF-019DE Stealth Thin Samsung SSD PM981 MZVLB512HAJQ | Asus Zephyrus S GX531GS WDC PC SN520 SDAPNUW-512G | Acer Predator Triton 500 2x WDC PC SN720 SDAPNTW-256G-1014 (RAID 0) | Razer Blade 15 RTX 2070 Max-Q Samsung SSD PM981 MZVLB512HAJQ | |
|---|---|---|---|---|---|---|
| CrystalDiskMark 5.2 / 6 | -8% | -6% | -20% | 14% | -6% | |
| Write 4K (MB/s) | 109.4 | 97.1 -11% | 95.3 -13% | 98.2 -10% | 93.6 -14% | 93.9 -14% |
| Read 4K (MB/s) | 56.6 | 53.7 -5% | 40.13 -29% | 39.43 -30% | 38.82 -31% | 40.56 -28% |
| Write Seq (MB/s) | 1508 | 1526 1% | 1883 25% | 1386 -8% | 2455 63% | 1468 -3% |
| Read Seq (MB/s) | 2427 | 2020 -17% | 1322 -46% | 1100 -55% | 2107 -13% | 1540 -37% |
| Write 4K Q32T1 (MB/s) | 307 | 285.6 -7% | 309.9 1% | 270.3 -12% | 298.7 -3% | 293.5 -4% |
| Read 4K Q32T1 (MB/s) | 351.3 | 321.8 -8% | 353.7 1% | 340.3 -3% | 338.7 -4% | 346 -2% |
| Write Seq Q32T1 (MB/s) | 1523 | 1533 1% | 1919 26% | 1454 -5% | 2902 91% | 1941 27% |
| Read Seq Q32T1 (MB/s) | 2825 | 2351 -17% | 2466 -13% | 1681 -40% | 3536 25% | 3266 16% |
| 3DMark 06 Standard Score | 38435 pontos | |
| 3DMark 11 Performance | 19220 pontos | |
| 3DMark Ice Storm Standard Score | 66387 pontos | |
| 3DMark Cloud Gate Standard Score | 29945 pontos | |
| 3DMark Fire Strike Score | 16020 pontos | |
| 3DMark Time Spy Score | 6399 pontos | |
Ajuda | ||
| 3DMark | |
| 1920x1080 Fire Strike Graphics | |
| Média da turma Gaming (12242 - 62849, n=115, últimos 2 anos) | |
| Razer Blade 15 RTX 2070 Max-Q | |
| Gigabyte Aero 15-Y9 | |
| Gigabyte Aero 15-X9 | |
| MSI GS65 8RF-019DE Stealth Thin | |
| 2560x1440 Time Spy Graphics | |
| Média da turma Gaming (5012 - 26212, n=115, últimos 2 anos) | |
| Razer Blade 15 RTX 2070 Max-Q | |
| Gigabyte Aero 15-X9 | |
| Gigabyte Aero 15-Y9 | |
| baixo | média | alto | ultra | 4K | |
|---|---|---|---|---|---|
| BioShock Infinite (2013) | 280.1 | 197.5 | 187.8 | 137.6 | |
| GTA V (2015) | 140 | 135.3 | 115.4 | 62.6 | 74 |
| The Witcher 3 (2015) | 255 | 192.7 | 117.3 | 65.7 | 39.6 |
| X-Plane 11.11 (2018) | 91 | 80.5 | 67.2 | 51.8 | |
| Far Cry 5 (2018) | 114 | 94 | 88 | 84 | 34 |
| Darksiders III (2018) | 137 | 103.5 | 94.3 | 84.8 | 29.8 |
| Apex Legends (2019) | 143.7 | 137.1 | 111.8 | 109.9 | 36 |
| Far Cry New Dawn (2019) | 101 | 88 | 82 | 74 | 36 |
| Metro Exodus (2019) | 116.7 | 77.7 | 58.2 | 47.8 | 20.9 |
| Anthem (2019) | 84.5 | 73.7 | 72.1 | 67.4 | 26.4 |
| Dirt Rally 2.0 (2019) | 157.8 | 116.1 | 101.1 | 66.3 | 31.2 |
| The Division 2 (2019) | 132 | 97 | 84 | 69 | 26 |
| The Witcher 3 - 1920x1080 Ultra Graphics & Postprocessing (HBAO+) | |
| Média da turma Gaming (104.7 - 240, n=7, últimos 2 anos) | |
| Acer Predator Triton 500 | |
| Razer Blade 15 RTX 2070 Max-Q | |
| Gigabyte Aero 15-Y9 | |
| Gigabyte Aero 15-X9 | |
| MSI GS65 8RF-019DE Stealth Thin | |
| Asus Zephyrus S GX531GS | |
| BioShock Infinite - 1920x1080 Ultra Preset, DX11 (DDOF) | |
| Razer Blade 15 RTX 2070 Max-Q | |
| Gigabyte Aero 15-Y9 | |
| Gigabyte Aero 15-X9 | |
| GTA V - 1920x1080 Highest AA:4xMSAA + FX AF:16x | |
| Média da turma Gaming (48.3 - 186.9, n=94, últimos 2 anos) | |
| Gigabyte Aero 15-Y9 | |
| Gigabyte Aero 15-X9 | |
| X-Plane 11.11 - 1920x1080 high (fps_test=3) | |
| Média da turma Gaming (55.5 - 143.5, n=109, últimos 2 anos) | |
| Gigabyte Aero 15-Y9 | |
| Gigabyte Aero 15-X9 | |
| Gigabyte Aero 15-Y9 Intel Core i9-8950HK, NVIDIA GeForce RTX 2080 Max-Q | Gigabyte Aero 15-X9 Intel Core i7-8750H, NVIDIA GeForce RTX 2070 Max-Q | Gigabyte Aero 15-Y9 Intel Core i9-8950HK, NVIDIA GeForce RTX 2080 Max-Q | |
|---|---|---|---|
| BioShock Infinite | |||
| 1920x1080 Ultra Preset, DX11 (DDOF) (fps) | 137.6 | 127.7 -7% | 118.9 ? -14% |
| X-Plane 11.11 | |||
| 1920x1080 high (fps_test=3) (fps) | 67.2 | 61.6 -8% | 55.8 ? -17% |
| Far Cry 5 | |||
| 1920x1080 Ultra Preset AA:T (fps) | 84 | 67 -20% | 66 ? -21% |
| Darksiders III | |||
| 1920x1080 Epic (fps) | 84.8 | 64.9 -23% | 81.4 ? -4% |
| Média Total (Programa/Configurações) | -15% /
-15% | -14% /
-14% |
Barulho
| Ocioso |
| 31 / 33 / 36 dB |
| Carga |
| 44 / 45 dB |
 | ||
30 dB silencioso 40 dB(A) audível 50 dB(A) ruidosamente alto |
||
min: | ||
| Gigabyte Aero 15-Y9 i9-8950HK, GeForce RTX 2080 Max-Q | Gigabyte Aero 15-X9 i7-8750H, GeForce RTX 2070 Max-Q | MSI GS65 8RF-019DE Stealth Thin i7-8750H, GeForce GTX 1070 Max-Q | Asus Zephyrus S GX531GS i7-8750H, GeForce GTX 1070 Max-Q | Acer Predator Triton 500 i7-8750H, GeForce RTX 2080 Max-Q | Razer Blade 15 RTX 2070 Max-Q i7-8750H, GeForce RTX 2070 Max-Q | Média da turma Gaming | |
|---|---|---|---|---|---|---|---|
| Noise | -2% | 3% | -9% | 0% | 8% | 8% | |
| desligado / ambiente * (dB) | 29 | 30 -3% | 30 -3% | 29 -0% | 29 -0% | 28.8 1% | 24.1 ? 17% |
| Idle Minimum * (dB) | 31 | 32 -3% | 30 3% | 33 -6% | 30 3% | 28.8 7% | 26 ? 16% |
| Idle Average * (dB) | 33 | 34 -3% | 31 6% | 34 -3% | 32 3% | 28.8 13% | 27.4 ? 17% |
| Idle Maximum * (dB) | 36 | 36 -0% | 34 6% | 40 -11% | 34 6% | 29.4 18% | 30.1 ? 16% |
| Load Average * (dB) | 44 | 42 5% | 43 2% | 47 -7% | 44 -0% | 35.7 19% | 43.6 ? 1% |
| Witcher 3 ultra * (dB) | 43 | 44 -2% | 42 2% | 51 -19% | 46 -7% | 42.5 1% | |
| Load Maximum * (dB) | 45 | 48 -7% | 44 2% | 53 -18% | 47 -4% | 45 -0% | 54.2 ? -20% |
* ... menor é melhor
(-) A temperatura máxima no lado superior é 64 °C / 147 F, em comparação com a média de 40.4 °C / 105 F , variando de 21.2 a 68.8 °C para a classe Gaming.
(-) A parte inferior aquece até um máximo de 69 °C / 156 F, em comparação com a média de 43.2 °C / 110 F
(+) Em uso inativo, a temperatura média para o lado superior é 26.4 °C / 80 F, em comparação com a média do dispositivo de 33.9 °C / ### class_avg_f### F.
(-) Jogando The Witcher 3, a temperatura média para o lado superior é 48.3 °C / 119 F, em comparação com a média do dispositivo de 33.9 °C / ## #class_avg_f### F.
(-) Os apoios para as mãos e o touchpad podem ficar muito quentes ao toque, com um máximo de 41 °C / 105.8 F.
(-) A temperatura média da área do apoio para as mãos de dispositivos semelhantes foi 28.8 °C / 83.8 F (-12.2 °C / -22 F).
| Gigabyte Aero 15-Y9 i9-8950HK, GeForce RTX 2080 Max-Q | Gigabyte Aero 15-X9 i7-8750H, GeForce RTX 2070 Max-Q | MSI GS65 8RF-019DE Stealth Thin i7-8750H, GeForce GTX 1070 Max-Q | Asus Zephyrus S GX531GS i7-8750H, GeForce GTX 1070 Max-Q | Acer Predator Triton 500 i7-8750H, GeForce RTX 2080 Max-Q | Razer Blade 15 RTX 2070 Max-Q i7-8750H, GeForce RTX 2070 Max-Q | Média da turma Gaming | |
|---|---|---|---|---|---|---|---|
| Heat | 8% | 16% | 6% | 3% | 18% | 9% | |
| Maximum Upper Side * (°C) | 64 | 56 12% | 49 23% | 54 16% | 49 23% | 49 23% | 45.2 ? 29% |
| Maximum Bottom * (°C) | 69 | 66 4% | 63 9% | 60 13% | 58 16% | 49 29% | 48.1 ? 30% |
| Idle Upper Side * (°C) | 29 | 27 7% | 24 17% | 30 -3% | 33 -14% | 25.4 12% | 31 ? -7% |
| Idle Bottom * (°C) | 29 | 27 7% | 25 14% | 30 -3% | 33 -14% | 27.2 6% | 34.2 ? -18% |
* ... menor é melhor
Gigabyte Aero 15-Y9 análise de áudio
(±) | o volume do alto-falante é médio, mas bom (###valor### dB)
Graves 100 - 315Hz
(±) | graves reduzidos - em média 14.1% menor que a mediana
(±) | a linearidade dos graves é média (13.7% delta para a frequência anterior)
Médios 400 - 2.000 Hz
(±) | médios mais altos - em média 5.3% maior que a mediana
(+) | médios são lineares (5.1% delta para frequência anterior)
Altos 2 - 16 kHz
(+) | agudos equilibrados - apenas 3.8% longe da mediana
(+) | os máximos são lineares (6.5% delta da frequência anterior)
Geral 100 - 16.000 Hz
(±) | a linearidade do som geral é média (16.1% diferença em relação à mediana)
Comparado com a mesma classe
» 39% de todos os dispositivos testados nesta classe foram melhores, 7% semelhantes, 54% piores
» O melhor teve um delta de 6%, a média foi 18%, o pior foi 132%
Comparado com todos os dispositivos testados
» 26% de todos os dispositivos testados foram melhores, 5% semelhantes, 69% piores
» O melhor teve um delta de 4%, a média foi 23%, o pior foi 134%
Acer Predator Triton 500 análise de áudio
(±) | o volume do alto-falante é médio, mas bom (###valor### dB)
Graves 100 - 315Hz
(±) | graves reduzidos - em média 13% menor que a mediana
(±) | a linearidade dos graves é média (12.3% delta para a frequência anterior)
Médios 400 - 2.000 Hz
(+) | médios equilibrados - apenas 3.8% longe da mediana
(+) | médios são lineares (5.3% delta para frequência anterior)
Altos 2 - 16 kHz
(+) | agudos equilibrados - apenas 2.3% longe da mediana
(+) | os máximos são lineares (4.7% delta da frequência anterior)
Geral 100 - 16.000 Hz
(+) | o som geral é linear (14.5% diferença em relação à mediana)
Comparado com a mesma classe
» 27% de todos os dispositivos testados nesta classe foram melhores, 7% semelhantes, 66% piores
» O melhor teve um delta de 6%, a média foi 18%, o pior foi 132%
Comparado com todos os dispositivos testados
» 18% de todos os dispositivos testados foram melhores, 4% semelhantes, 77% piores
» O melhor teve um delta de 4%, a média foi 23%, o pior foi 134%
| desligado | |
| Ocioso | |
| Carga |
|
Key:
min: | |
| Gigabyte Aero 15-Y9 i9-8950HK, GeForce RTX 2080 Max-Q | Gigabyte Aero 15-X9 i7-8750H, GeForce RTX 2070 Max-Q | MSI GS65 8RF-019DE Stealth Thin i7-8750H, GeForce GTX 1070 Max-Q | Asus Zephyrus S GX531GS i7-8750H, GeForce GTX 1070 Max-Q | Acer Predator Triton 500 i7-8750H, GeForce RTX 2080 Max-Q | Razer Blade 15 RTX 2070 Max-Q i7-8750H, GeForce RTX 2070 Max-Q | Média da turma Gaming | |
|---|---|---|---|---|---|---|---|
| Power Consumption | 12% | 24% | -6% | -1% | 18% | 0% | |
| Idle Minimum * (Watt) | 17 | 16 6% | 7 59% | 17 -0% | 16 6% | 10.4 39% | 13 ? 24% |
| Idle Average * (Watt) | 21 | 18 14% | 11 48% | 20 5% | 22 -5% | 14.6 30% | 19 ? 10% |
| Idle Maximum * (Watt) | 27 | 23 15% | 20 26% | 29 -7% | 32 -19% | 16.3 40% | 24.6 ? 9% |
| Load Average * (Watt) | 111 | 88 21% | 98 12% | 112 -1% | 89 20% | 88.5 20% | 110.7 ? -0% |
| Witcher 3 ultra * (Watt) | 130 | 120 8% | 132 -2% | 152 -17% | 147 -13% | 155.4 -20% | |
| Load Maximum * (Watt) | 183 | 167 9% | 182 1% | 211 -15% | 173 5% | 182.4 -0% | 259 ? -42% |
* ... menor é melhor
| Gigabyte Aero 15-Y9 i9-8950HK, GeForce RTX 2080 Max-Q, 94.24 Wh | Gigabyte Aero 15-X9 i7-8750H, GeForce RTX 2070 Max-Q, 94.24 Wh | MSI GS65 8RF-019DE Stealth Thin i7-8750H, GeForce GTX 1070 Max-Q, 82 Wh | Asus Zephyrus S GX531GS i7-8750H, GeForce GTX 1070 Max-Q, 50 Wh | Acer Predator Triton 500 i7-8750H, GeForce RTX 2080 Max-Q, 82 Wh | Razer Blade 15 RTX 2070 Max-Q i7-8750H, GeForce RTX 2070 Max-Q, 80 Wh | Média da turma Gaming | |
|---|---|---|---|---|---|---|---|
| Duração da bateria | 8% | -11% | -63% | -43% | -3% | 5% | |
| Reader / Idle (h) | 9.4 | 9.2 -2% | 8.5 -10% | 3.6 -62% | 5.6 -40% | 11.4 21% | 8.27 ? -12% |
| H.264 (h) | 5.5 | 6.1 11% | 5.9 7% | 8.32 ? 51% | |||
| WiFi v1.3 (h) | 5.9 | 6.4 8% | 6 2% | 2.6 -56% | 3.2 -46% | 6.5 10% | 7.11 ? 21% |
| Load (h) | 2.5 | 2.9 16% | 1.4 -44% | 0.7 -72% | 1.4 -44% | 1.5 -40% | 1.502 ? -40% |
Pro
Contra
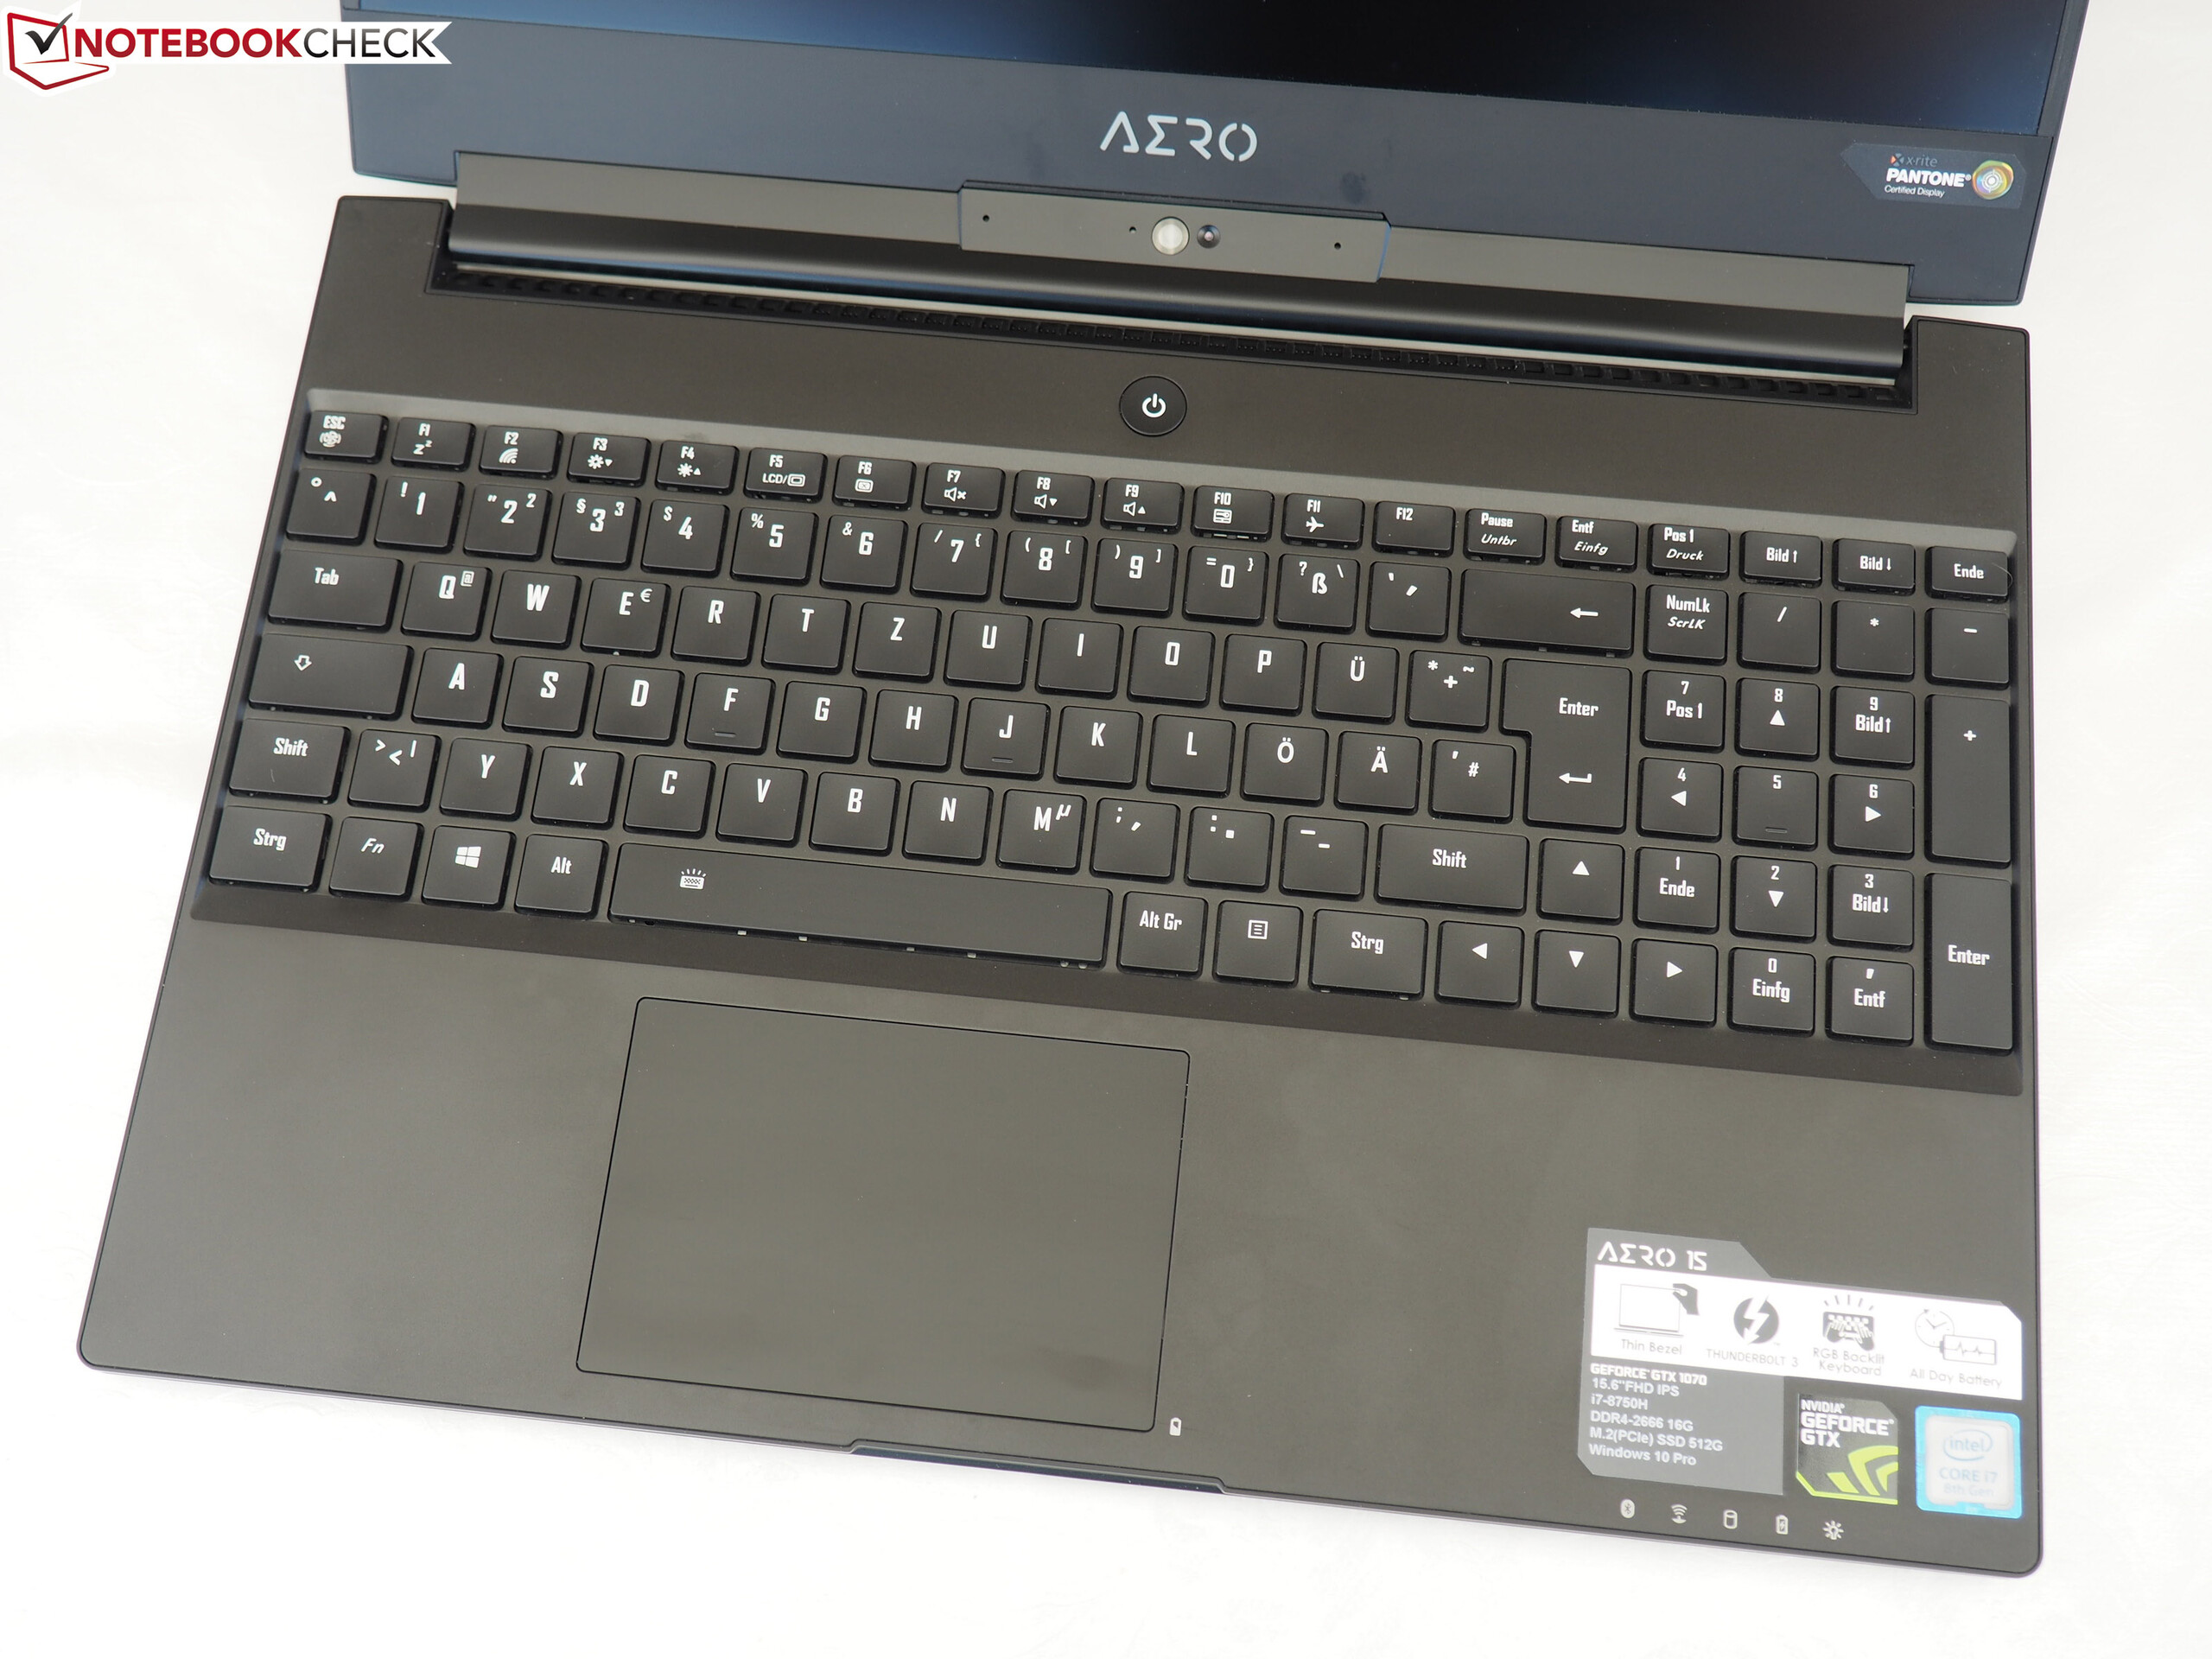
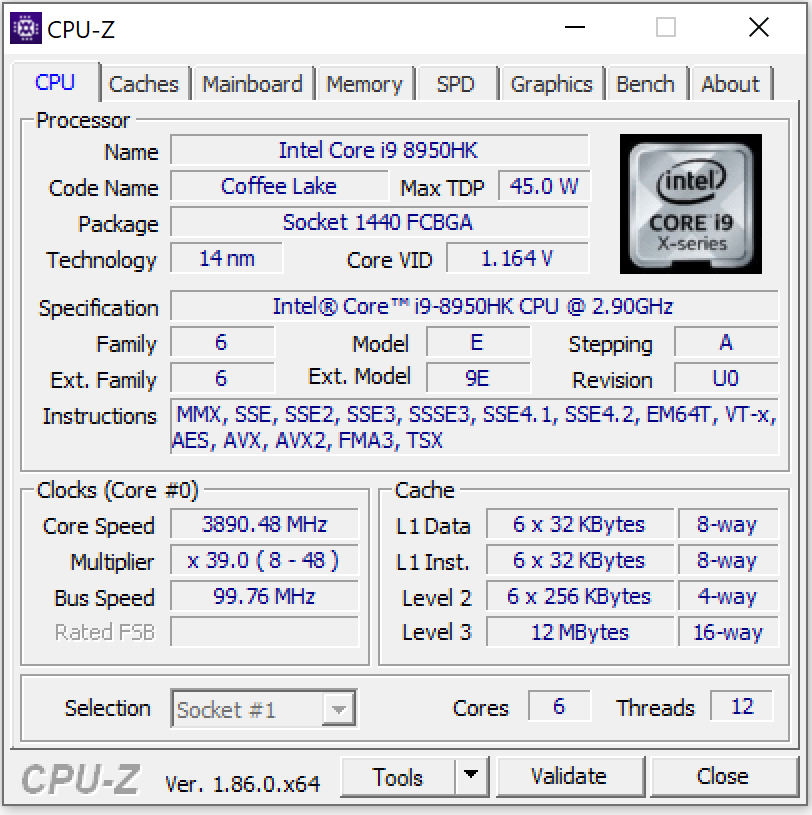
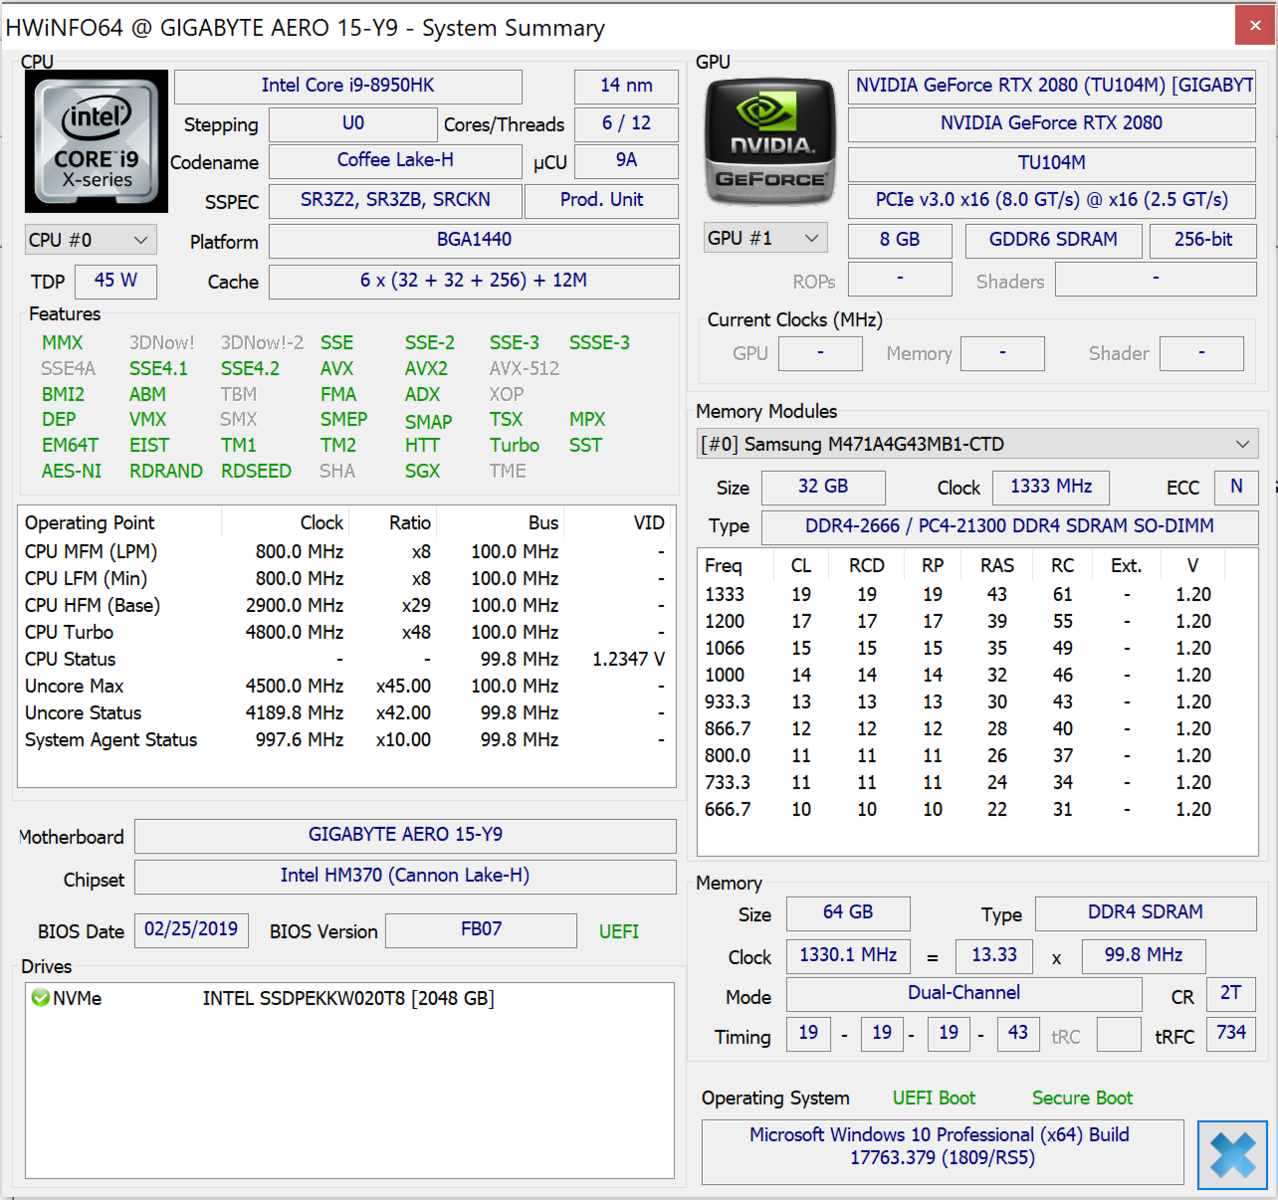
A unidade na nossa frente hoje, o Aero 15-Y9, representa o modelo carro chefe da gama Aero-15 e, como esperado, o fabricante teve como objetivo impressionar: A Gigabyte usou o melhor para esta configuração. A combinação de uma CPU Core i9-8950HK e GPU GeForce GTX 2080 Max-Q permite uma experiência de jogo fluente com resolução FHD e com configurações de detalhes médios a máximos em sua tela 4K mate.
No entanto, o portátil é equipado apenas com uma variante Max-Q (80 W) da RTX 2080.
Como resultado, o Aero 15-Y9 não é realmente capaz de se distanciar do Aero 15-X9 equipado com RTX 2070 Max-Q. Ao executar no mesmo modo de RAM (canal único/canal duplo), os dois dispositivos frequentemente ofereciam taxas de quadros semelhantes. Como resultado, a maioria dos potenciais compradores estaria melhor servida pela versão mais barata do RTX 2070 Max-Q do Aero.
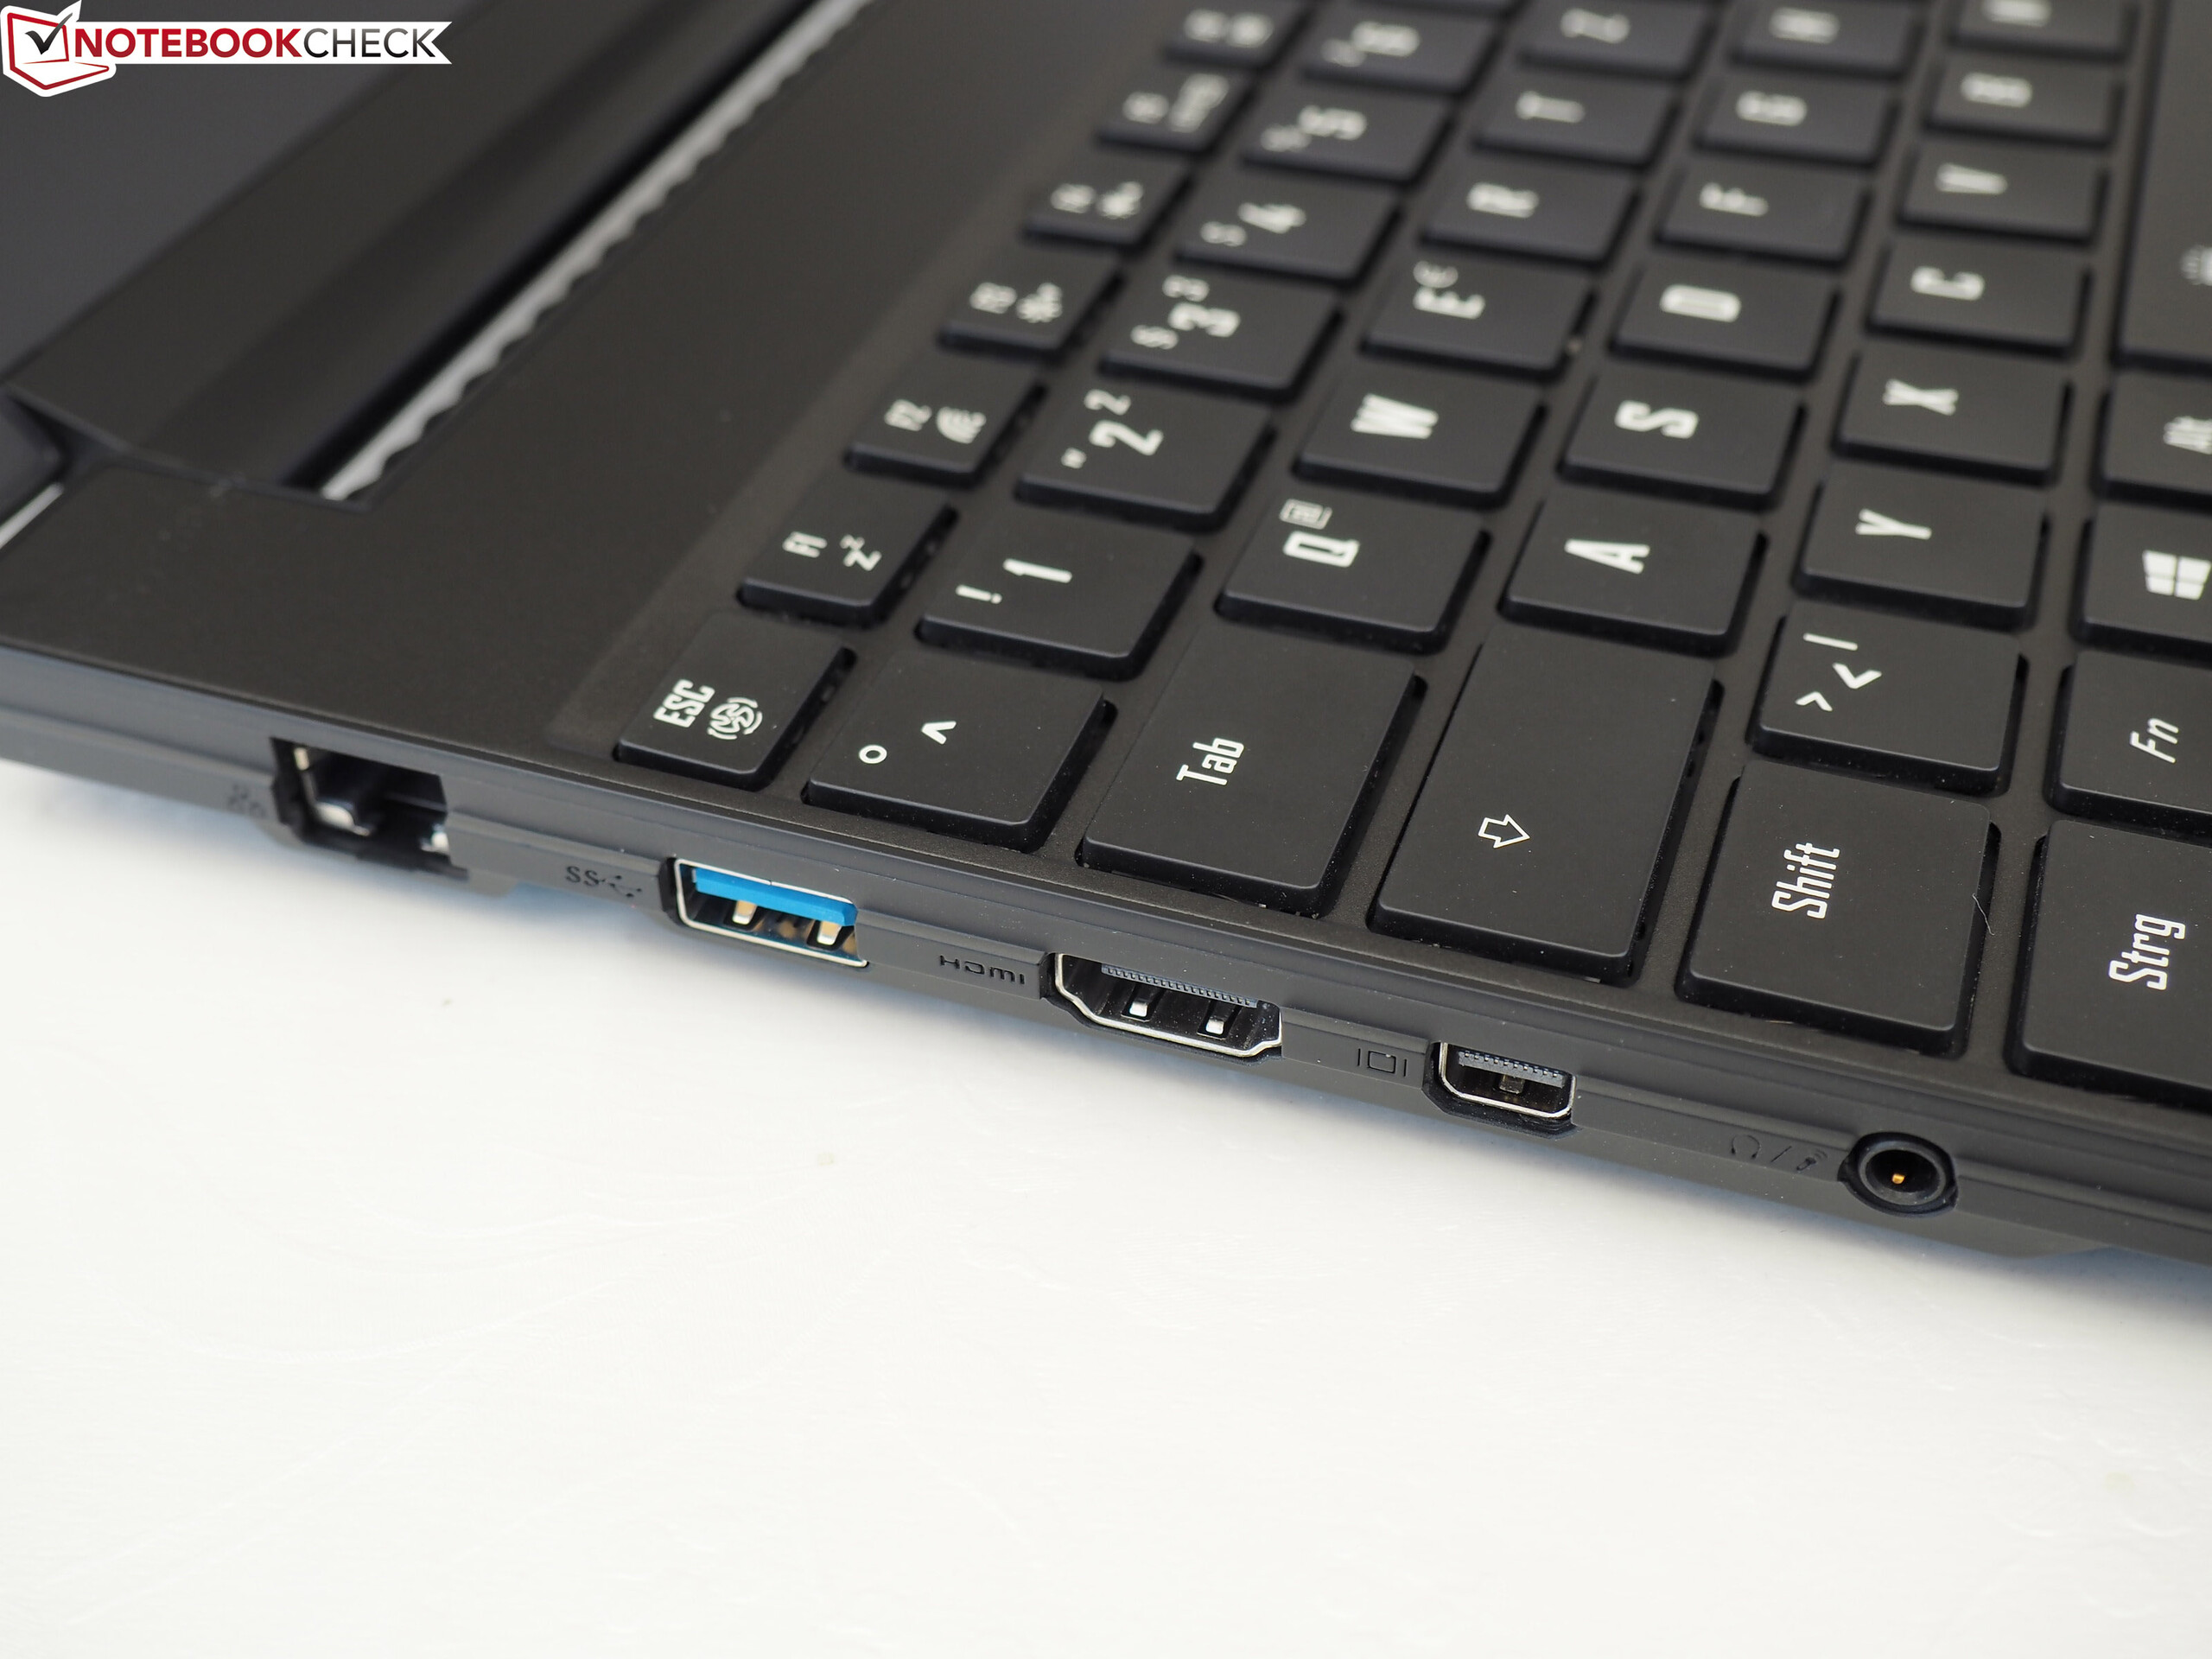
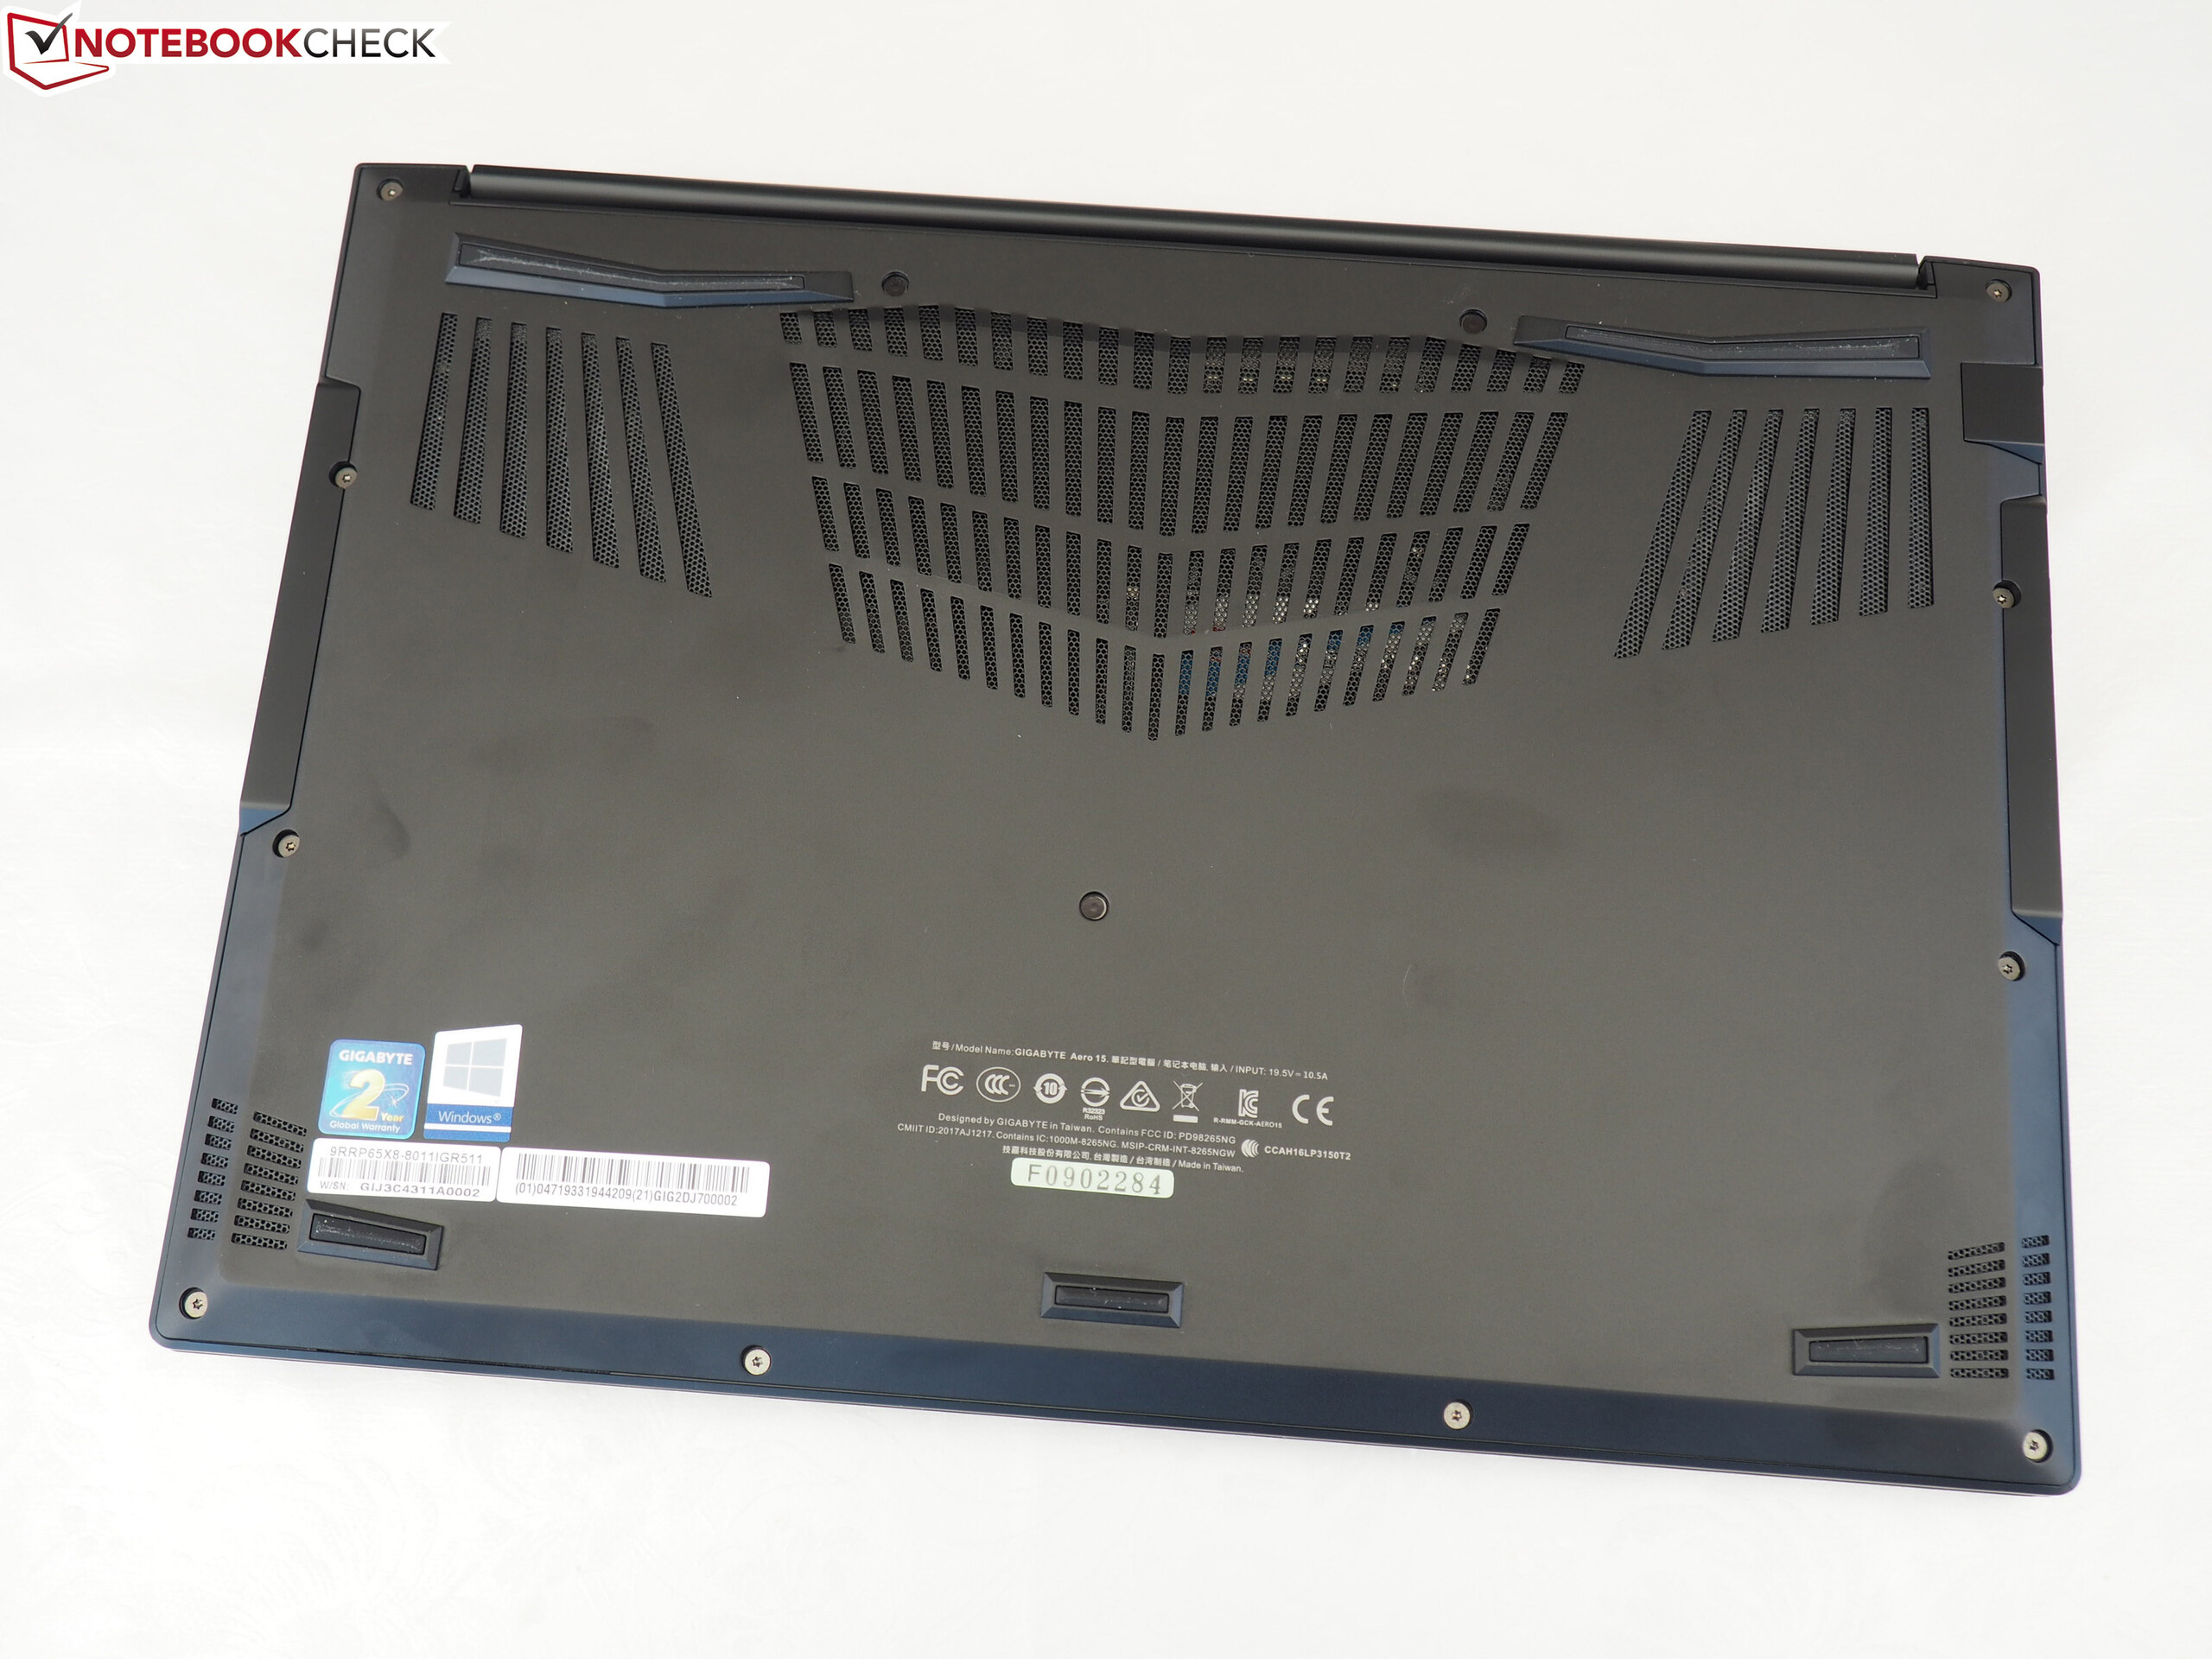
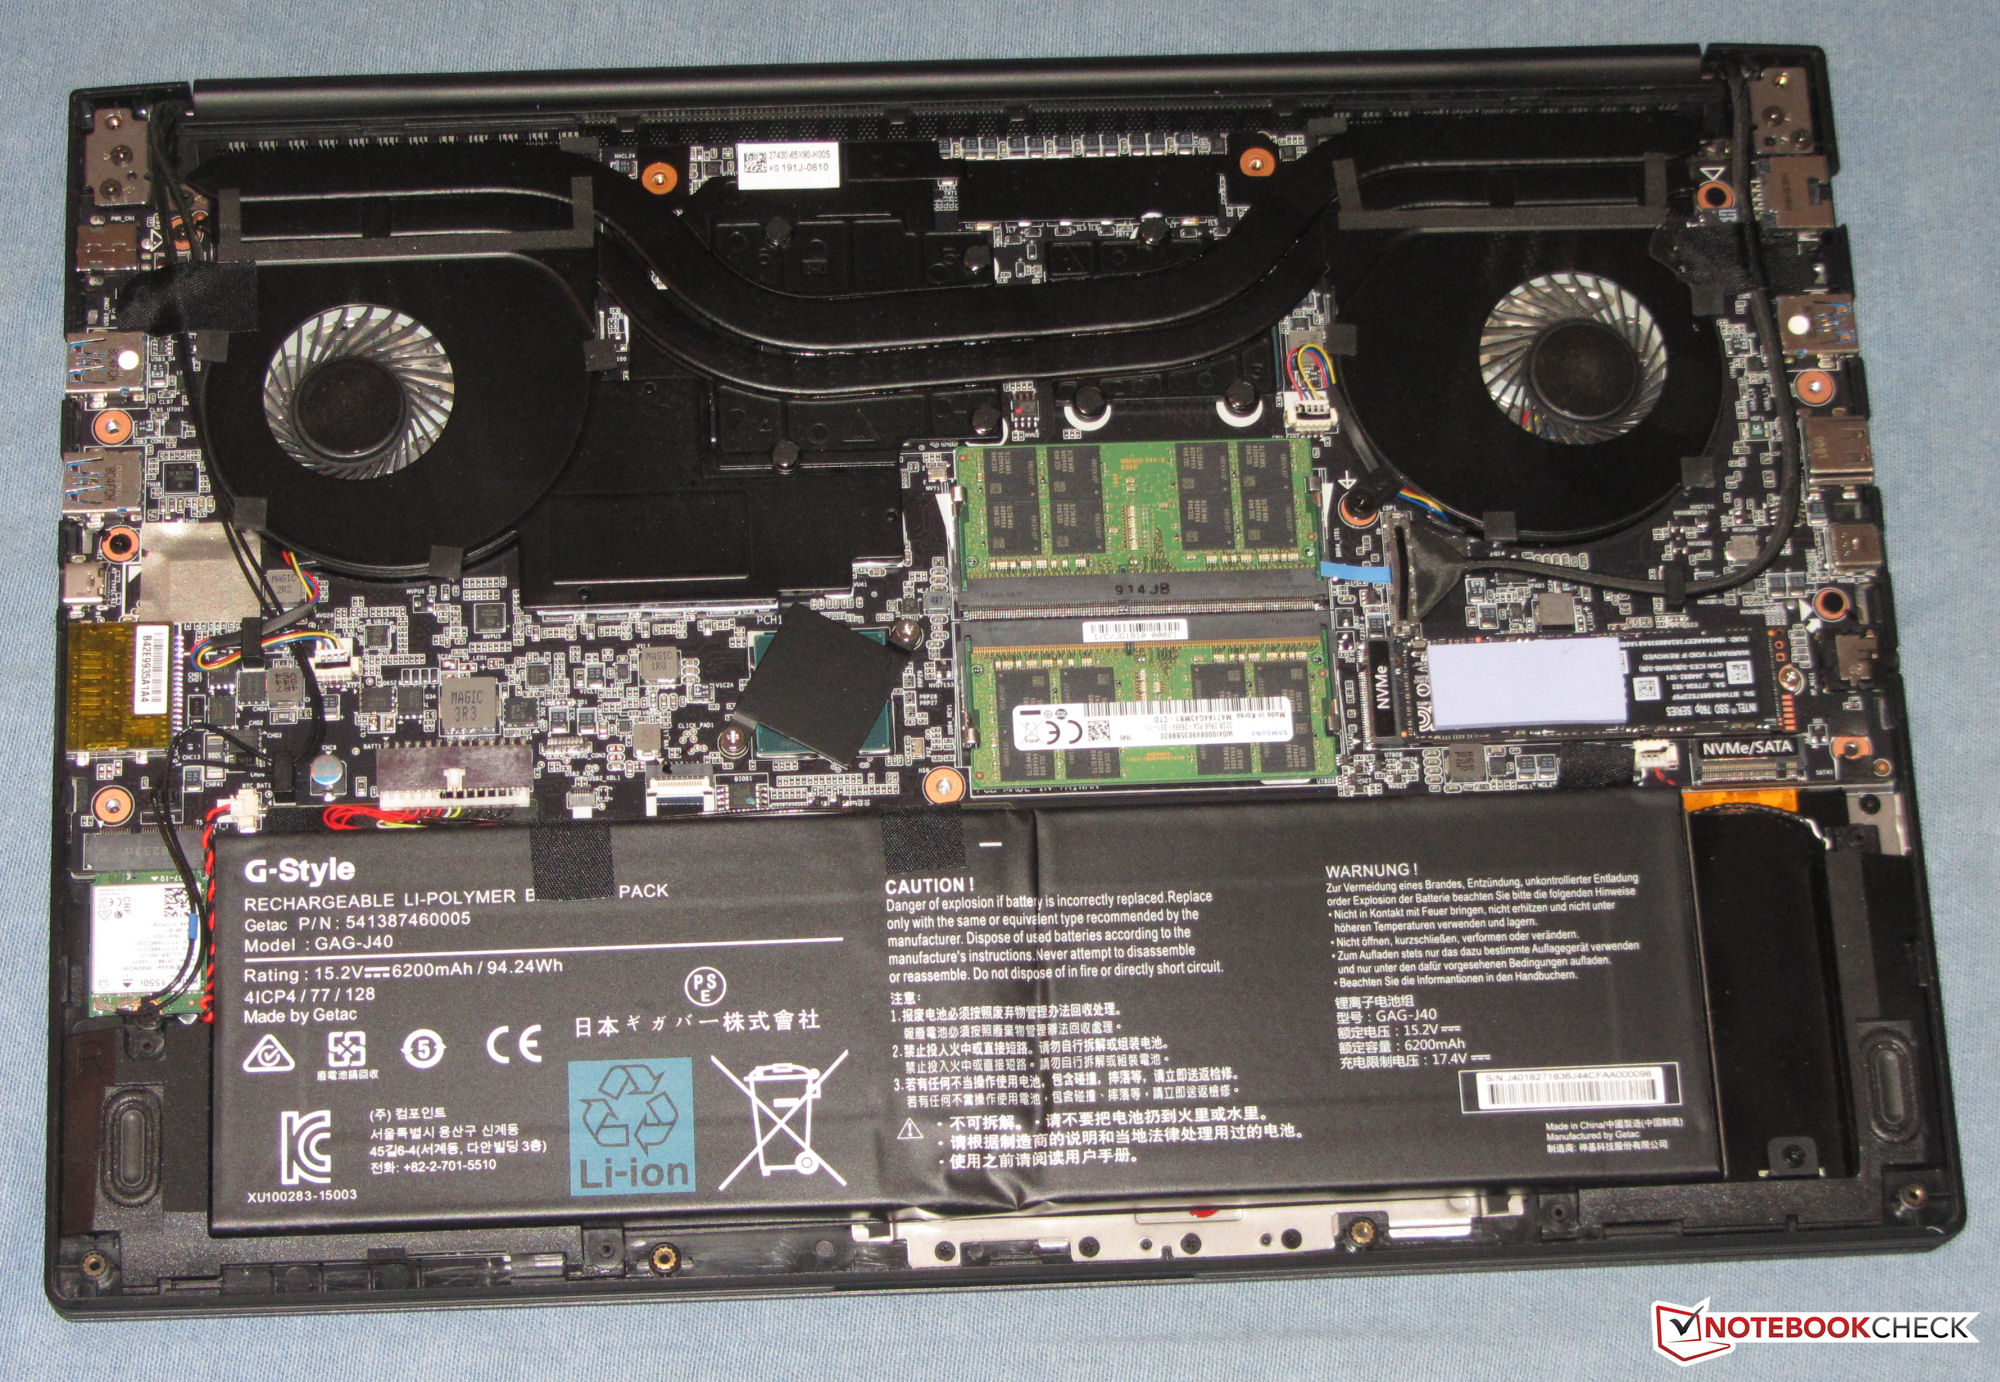
O SSD NVMe incluído oferece não apenas excelentes taxas de transferência, mas também muito espaço de armazenamento (2 TB). Internamente, o portátil também possui um slot adicional para um segundo SSD M.2 2280. Nenhum slot está disponível para uma unidade de 2,5 polegadas no Aero 15.
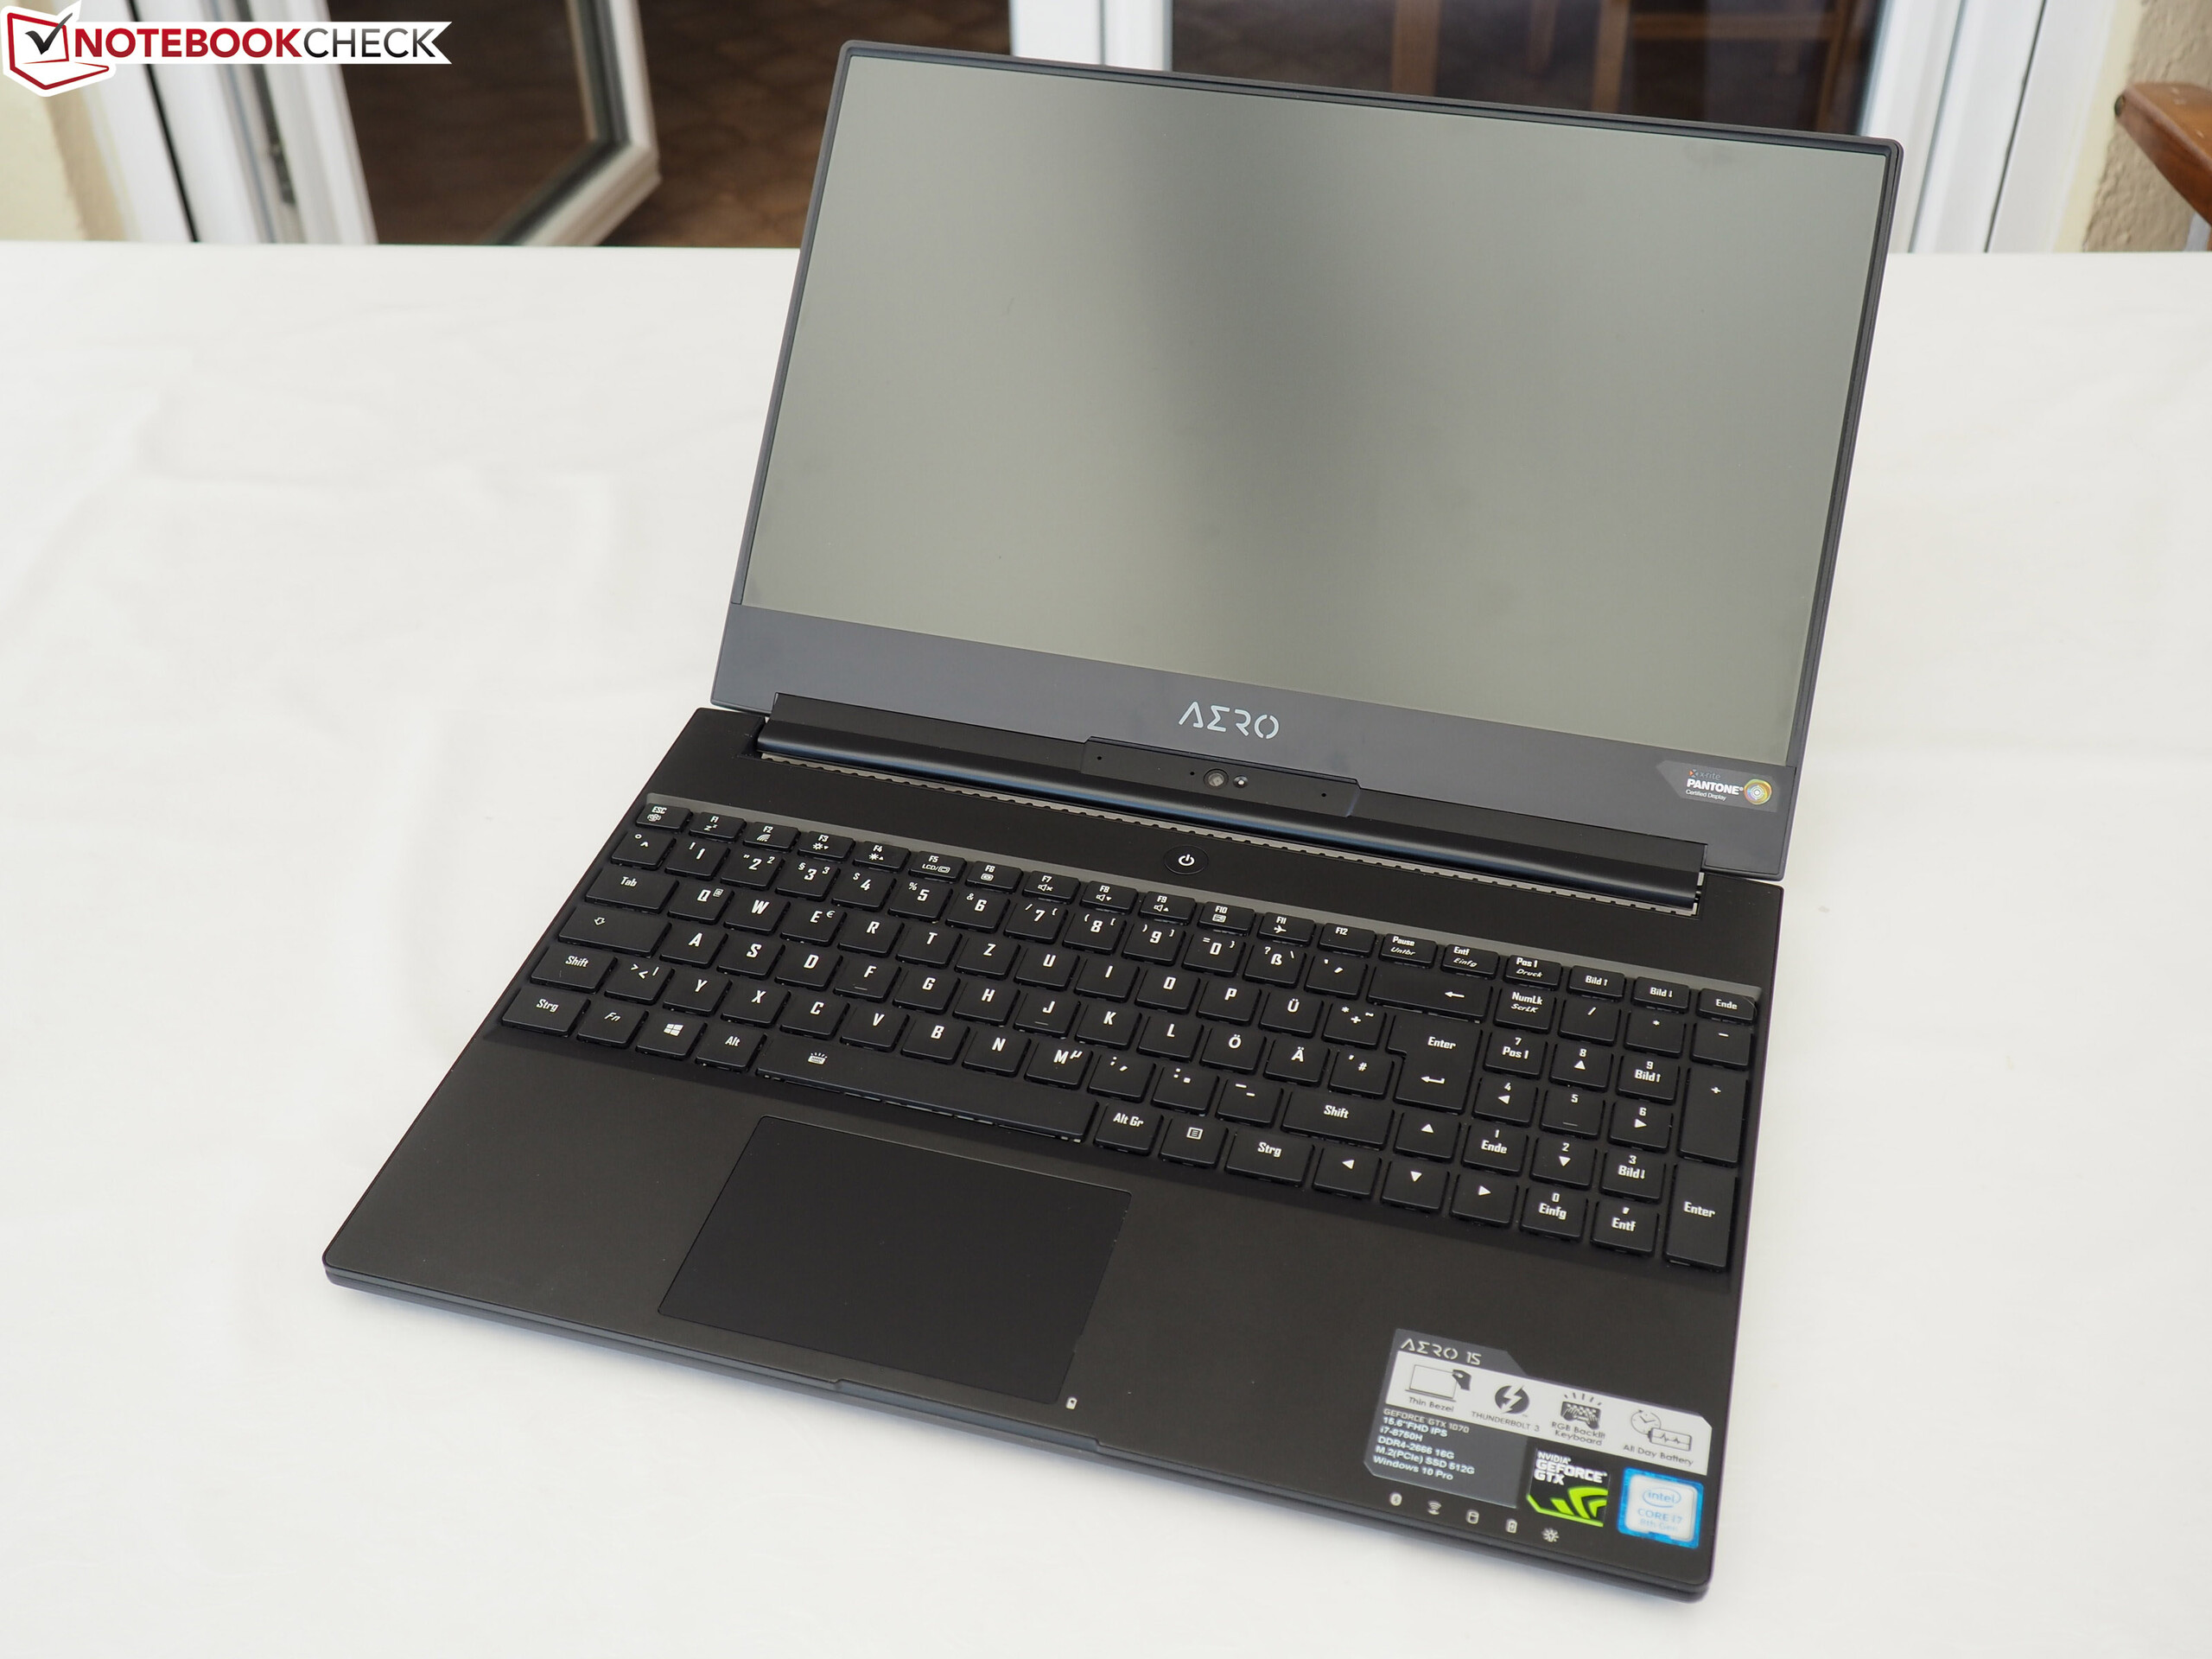
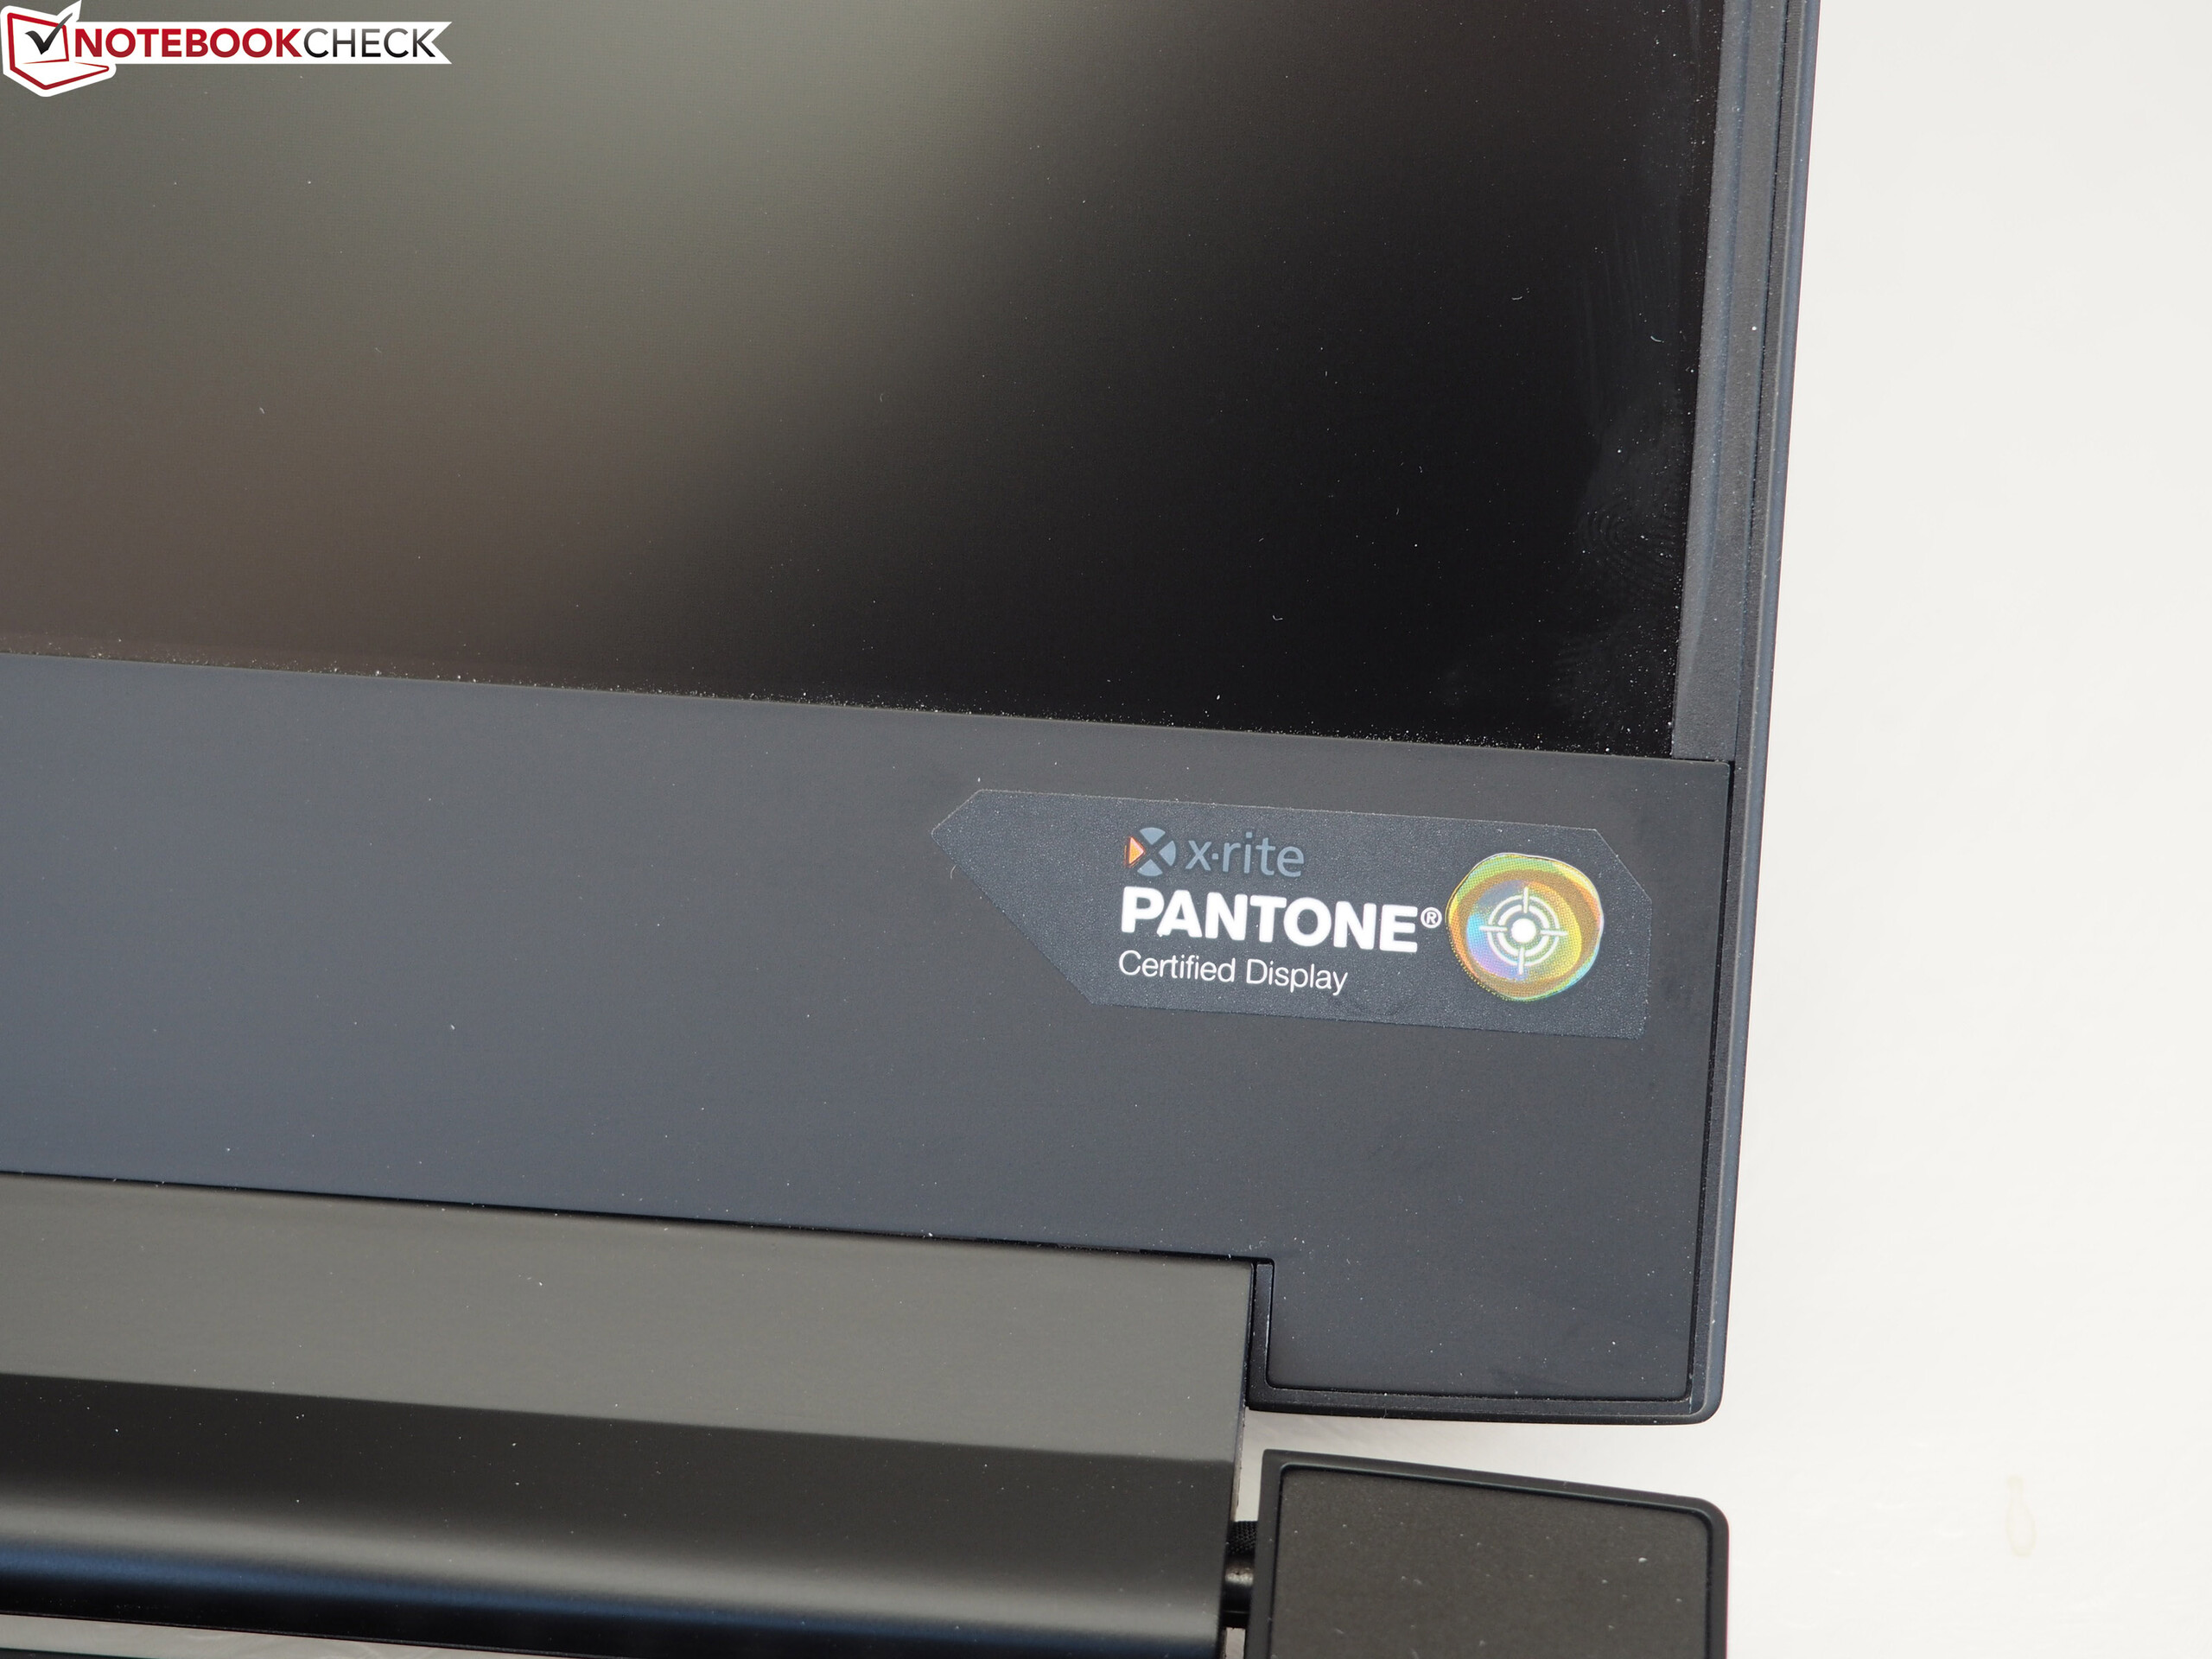
A tela IPS 4K mate impressionou com bons ângulos de visão, bom brilho e contraste e impressionante reprodução de cores. No entanto, os tempos de reação ficam claramente atrás do Aero 15-X9 equipado com um painel de 144 Hz. A duração da bateria também está um pouco atrás do Aero 15-X9. Isso não é surpresa e é esperado da tela 4K. No entanto, em geral, o desempenho da bateria foi muito bom para um portátil de jogos.
Gigabyte Aero 15-Y9
- 05/14/2020 v7 (old)
Sascha Mölck