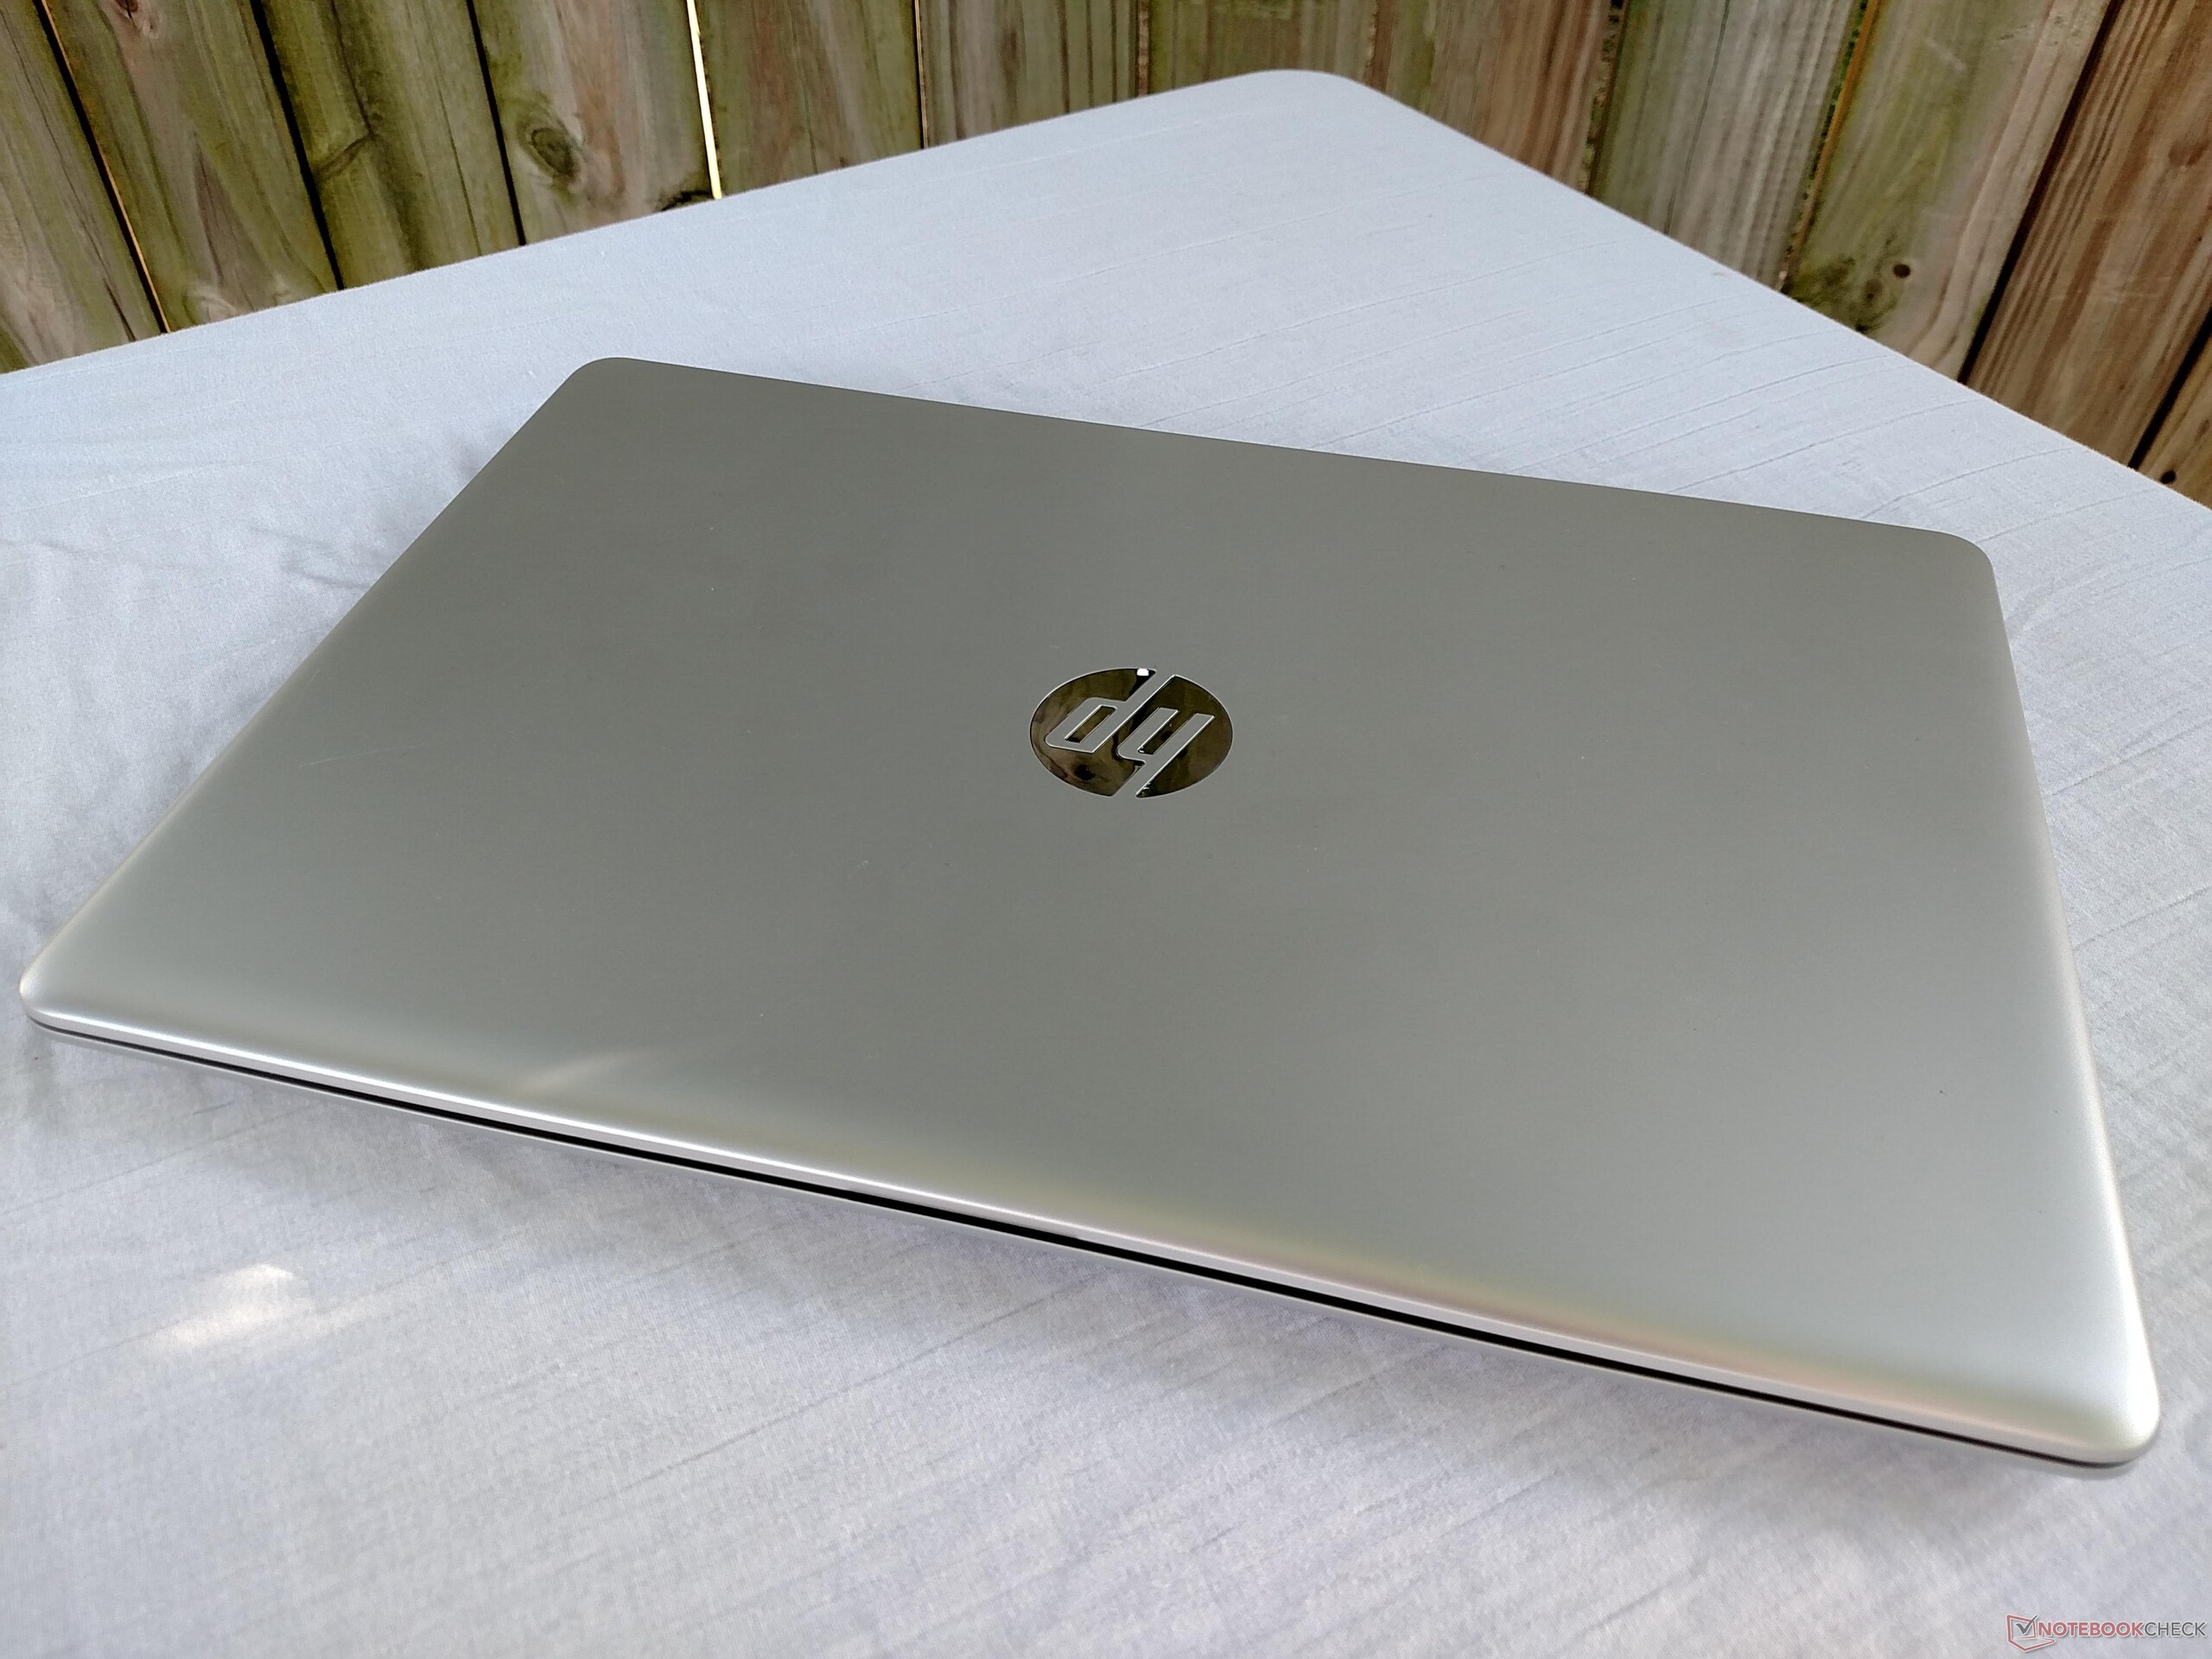
Breve Análise do Portátil HP 15-BW077AX (A9-9420, Radeon R5)

| SD Card Reader | |
| average JPG Copy Test (av. of 3 runs) | |
| Lenovo Yoga 510-14AST | |
| HP Pavilion 15-aw004ng W8Y60EA | |
| Lenovo B50-10 80QR0013GE | |
| HP 15-bw077ax | |
| Asus X555DA-BB11 | |
| maximum AS SSD Seq Read Test (1GB) | |
| Lenovo B50-10 80QR0013GE | |
| Lenovo Yoga 510-14AST | |
| HP Pavilion 15-aw004ng W8Y60EA | |
| HP 15-bw077ax | |
| Asus X555DA-BB11 | |
| Networking | |
| iperf3 transmit AX12 | |
| HP 15-bw077ax | |
| Lenovo Yoga 510-14AST | |
| Asus X555DA-BB11 | |
| iperf3 receive AX12 | |
| HP 15-bw077ax | |
| Asus X555DA-BB11 | |
| Lenovo Yoga 510-14AST | |
| |||||||||||||||||||||||||
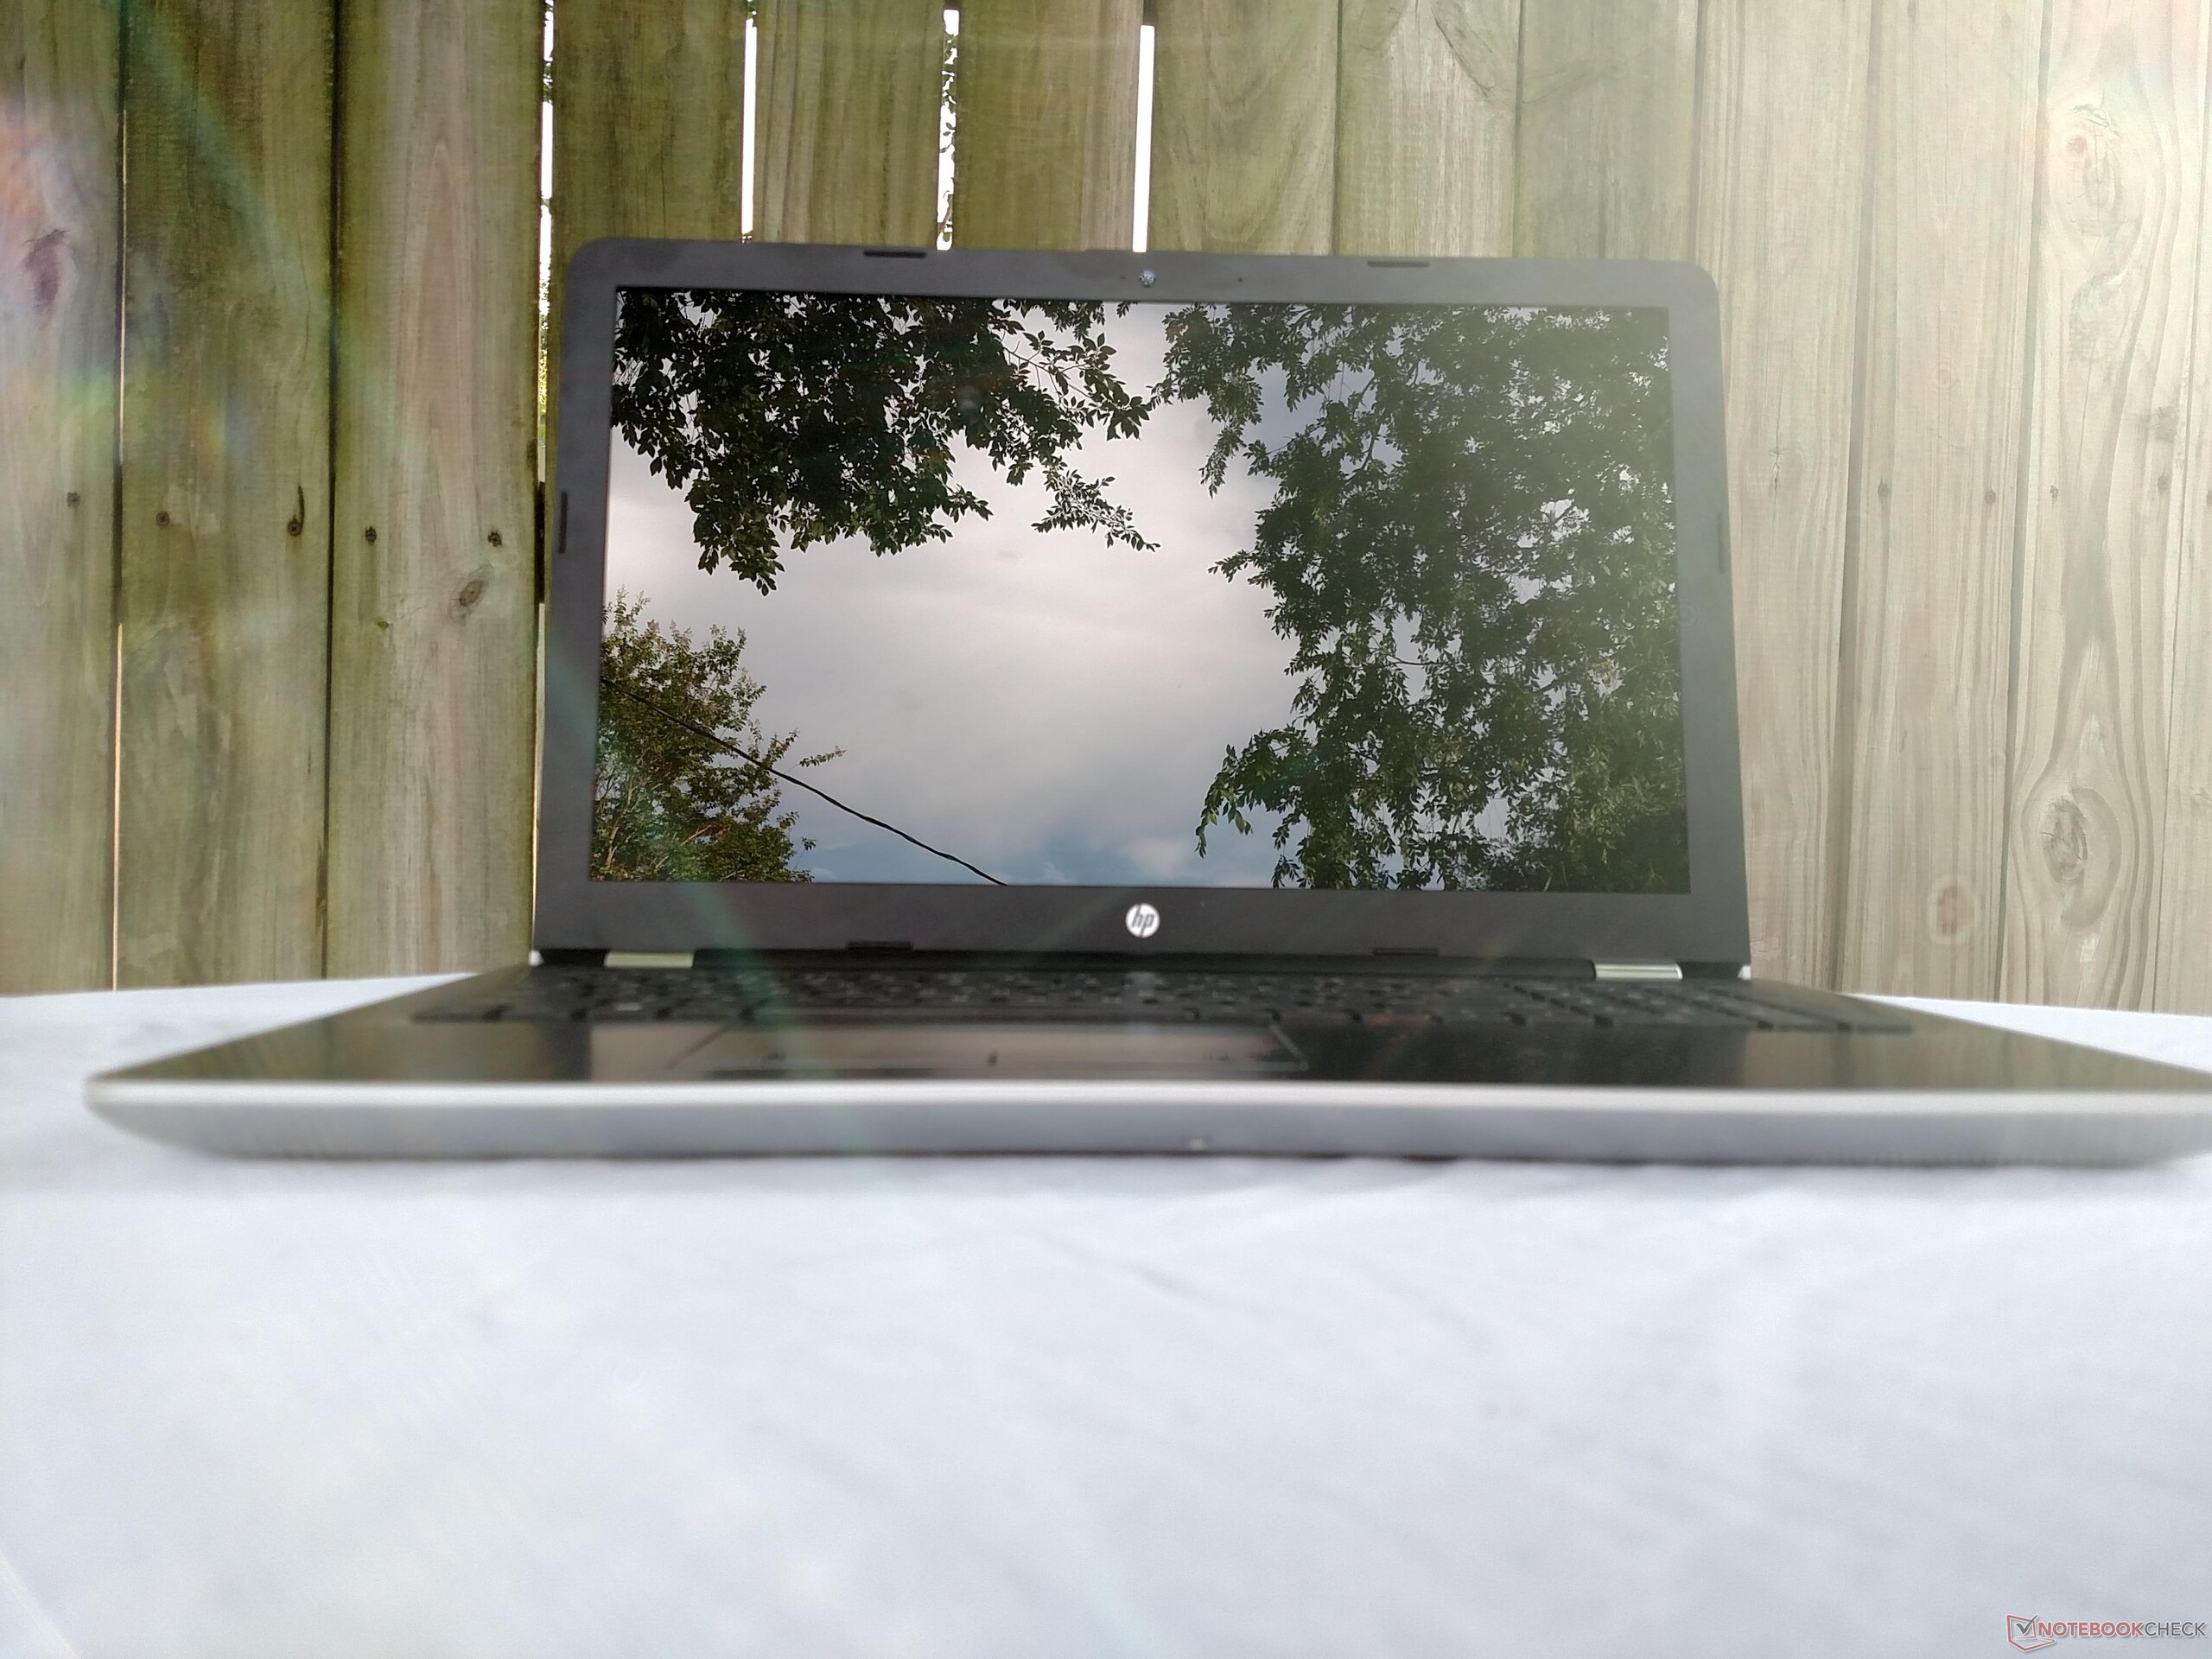
iluminação: 73 %
iluminação com acumulador: 192.8 cd/m²
Contraste: 719:1 (Preto: 0.27 cd/m²)
ΔE ColorChecker Calman: 9.9 | ∀{0.5-29.43 Ø4.71}
ΔE Greyscale Calman: 11.6 | ∀{0.09-98 Ø4.96}
58% sRGB (Argyll 1.6.3 3D)
37% AdobeRGB 1998 (Argyll 1.6.3 3D)
Gamma: 2.16
CCT: 11981 K
| HP 15-bw077ax BOE BOE06A4, TN LED, 15.6", 1366x768 | Lenovo B50-10 80QR0013GE Chi Mei N156BGE-EA2, TN LED, 15.6", 1366x768 | Lenovo Yoga 510-14AST AU Optronics B140XTN02.E, TN LED, 14", 1366x768 | Asus X555DA-BB11 TN LED, 15.6", 1920x1080 | HP Pavilion 15-aw004ng W8Y60EA Chi Mei, TN LED, 15.6", 1920x1080 | |
|---|---|---|---|---|---|
| Display | |||||
| Display P3 Coverage (%) | 40.21 | 34.15 | 35.12 | 40.35 | |
| sRGB Coverage (%) | 60.1 | 51.4 | 52.7 | 60.3 | |
| AdobeRGB 1998 Coverage (%) | 41.56 | 35.28 | 36.29 | 41.71 | |
| Response Times | 23% | -47% | 1% | 0% | |
| Response Time Grey 50% / Grey 80% * (ms) | 42.4 ? | 28 ? 34% | 70 ? -65% | 42 ? 1% | 41 ? 3% |
| Response Time Black / White * (ms) | 22.4 ? | 20 ? 11% | 29 ? -29% | 22.4 ? -0% | 23 ? -3% |
| PWM Frequency (Hz) | 198.4 ? | 200 ? | |||
| Screen | 5% | -17% | 6% | -3% | |
| Brightness middle (cd/m²) | 194.1 | 245 26% | 242 25% | 242.7 25% | 240 24% |
| Brightness (cd/m²) | 192 | 230 20% | 224 17% | 232 21% | 228 19% |
| Brightness Distribution (%) | 73 | 84 15% | 88 21% | 88 21% | 89 22% |
| Black Level * (cd/m²) | 0.27 | 0.46 -70% | 0.62 -130% | 0.52 -93% | 0.49 -81% |
| Contrast (:1) | 719 | 533 -26% | 390 -46% | 467 -35% | 490 -32% |
| Colorchecker dE 2000 * | 9.9 | 8.34 16% | 13.03 -32% | 4.9 51% | 10.96 -11% |
| Colorchecker dE 2000 max. * | 23.4 | 12.31 47% | 18.79 20% | 20.3 13% | 18.36 22% |
| Greyscale dE 2000 * | 11.6 | 9.48 18% | 14.6 -26% | 2.7 77% | 11.34 2% |
| Gamma | 2.16 102% | 2.38 92% | 2.22 99% | 2.34 94% | 2.27 97% |
| CCT | 11981 54% | 10624 61% | 18869 34% | 6876 95% | 12292 53% |
| Color Space (Percent of AdobeRGB 1998) (%) | 37 | 38 3% | 33 -11% | 33.5 -9% | 39 5% |
| Color Space (Percent of sRGB) (%) | 58 | 57 -2% | 52 -10% | 52.5 -9% | 60 3% |
| Média Total (Programa/Configurações) | 14% /
8% | -32% /
-22% | 4% /
5% | -2% /
-2% |
* ... menor é melhor
Exibir tempos de resposta
| ↔ Tempo de resposta preto para branco | ||
|---|---|---|
| 22.4 ms ... ascensão ↗ e queda ↘ combinadas | ↗ 17.2 ms ascensão | 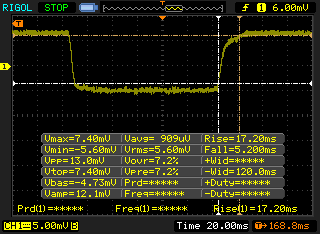 |
| ↘ 5.2 ms queda | ||
| A tela mostra boas taxas de resposta em nossos testes, mas pode ser muito lenta para jogadores competitivos. Em comparação, todos os dispositivos testados variam de 0.1 (mínimo) a 240 (máximo) ms. » 51 % de todos os dispositivos são melhores. Isso significa que o tempo de resposta medido é pior que a média de todos os dispositivos testados (19.8 ms). | ||
| ↔ Tempo de resposta 50% cinza a 80% cinza | ||
| 42.4 ms ... ascensão ↗ e queda ↘ combinadas | ↗ 22 ms ascensão | 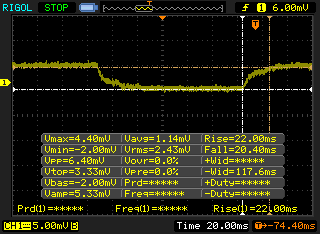 |
| ↘ 20.4 ms queda | ||
| A tela mostra taxas de resposta lentas em nossos testes e será insatisfatória para os jogadores. Em comparação, todos os dispositivos testados variam de 0.165 (mínimo) a 636 (máximo) ms. » 70 % de todos os dispositivos são melhores. Isso significa que o tempo de resposta medido é pior que a média de todos os dispositivos testados (31 ms). | ||
Cintilação da tela / PWM (modulação por largura de pulso)
| Tela tremeluzindo/PWM detectado | 198.4 Hz | ≤ 99 % configuração de brilho | 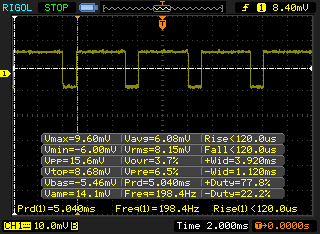 |
A luz de fundo da tela pisca em 198.4 Hz (pior caso, por exemplo, utilizando PWM) Cintilação detectada em uma configuração de brilho de 99 % e abaixo. Não deve haver cintilação ou PWM acima desta configuração de brilho. A frequência de 198.4 Hz é relativamente baixa, portanto, usuários sensíveis provavelmente notarão cintilação e sentirão fadiga ocular na configuração de brilho indicada e abaixo. [pwm_comparison] Em comparação: 52 % de todos os dispositivos testados não usam PWM para escurecer a tela. Se PWM foi detectado, uma média de 7754 (mínimo: 5 - máximo: 343500) Hz foi medida. | |||
| Cinebench R15 | |
| CPU Single 64Bit | |
| Acer TravelMate P249-M-3895 | |
| Lenovo Thinkpad 13-20J1001BUS | |
| HP Pavilion 15-aw004ng W8Y60EA | |
| HP 15-bw077ax | |
| Asus X555DA-BB11 | |
| Lenovo Yoga 510-14AST | |
| Lenovo B50-10 80QR0013GE | |
| CPU Multi 64Bit | |
| Lenovo Thinkpad 13-20J1001BUS | |
| Acer TravelMate P249-M-3895 | |
| HP Pavilion 15-aw004ng W8Y60EA | |
| Asus X555DA-BB11 | |
| Lenovo B50-10 80QR0013GE | |
| Lenovo Yoga 510-14AST | |
| HP 15-bw077ax | |
| Cinebench R10 | |
| Rendering Multiple CPUs 32Bit | |
| Lenovo Thinkpad 13-20J1001BUS | |
| Acer TravelMate P249-M-3895 | |
| HP Pavilion 15-aw004ng W8Y60EA | |
| Asus X555DA-BB11 | |
| HP 15-bw077ax | |
| Lenovo Yoga 510-14AST | |
| Lenovo B50-10 80QR0013GE | |
| Rendering Single 32Bit | |
| Lenovo Thinkpad 13-20J1001BUS | |
| Acer TravelMate P249-M-3895 | |
| HP 15-bw077ax | |
| Lenovo Yoga 510-14AST | |
| HP Pavilion 15-aw004ng W8Y60EA | |
| Asus X555DA-BB11 | |
| Lenovo B50-10 80QR0013GE | |
| wPrime 2.10 - 1024m | |
| Lenovo Yoga 510-14AST | |
| HP 15-bw077ax | |
| Lenovo Thinkpad 13-20J1001BUS | |
| Asus X555DA-BB11 | |
* ... menor é melhor
| PCMark 8 | |
| Home Score Accelerated v2 | |
| HP Pavilion 15-aw004ng W8Y60EA | |
| Lenovo Yoga 510-14AST | |
| Asus X555DA-BB11 | |
| HP 15-bw077ax | |
| Lenovo B50-10 80QR0013GE | |
| Work Score Accelerated v2 | |
| HP Pavilion 15-aw004ng W8Y60EA | |
| Lenovo Yoga 510-14AST | |
| Asus X555DA-BB11 | |
| HP 15-bw077ax | |
| Lenovo B50-10 80QR0013GE | |
| Creative Score Accelerated v2 | |
| HP Pavilion 15-aw004ng W8Y60EA | |
| Lenovo Yoga 510-14AST | |
| Asus X555DA-BB11 | |
| HP 15-bw077ax | |
| Lenovo B50-10 80QR0013GE | |
| PCMark 8 Home Score Accelerated v2 | 2005 pontos | |
| PCMark 8 Creative Score Accelerated v2 | 2350 pontos | |
| PCMark 8 Work Score Accelerated v2 | 2961 pontos | |
Ajuda | ||
| HP 15-bw077ax WDC Scorpio Blue WD10JPVX-60JC3T1 | Lenovo B50-10 80QR0013GE Seagate Momentus Thin ST500LT012-1DG142 | Lenovo Yoga 510-14AST | Asus X555DA-BB11 Seagate Momentus SpinPoint M8 ST1000LM024 HN-M101MBB | HP Pavilion 15-aw004ng W8Y60EA | |
|---|---|---|---|---|---|
| CrystalDiskMark 3.0 | -3% | 6722% | -5% | 5054% | |
| Read Seq (MB/s) | 91.3 | 103.5 13% | 434.6 376% | 106.9 17% | 503 451% |
| Write Seq (MB/s) | 90.2 | 91.1 1% | 207.7 130% | 97.5 8% | 316.6 251% |
| Read 512 (MB/s) | 29.02 | 33.74 16% | 356.3 1128% | 32.28 11% | 261.9 802% |
| Write 512 (MB/s) | 39.51 | 38.77 -2% | 195.6 395% | 35.39 -10% | 281.2 612% |
| Read 4k (MB/s) | 0.34 | 0.374 10% | 26.71 7756% | 0.373 10% | 17.04 4912% |
| Write 4k (MB/s) | 0.94 | 0.649 -31% | 56.8 5943% | 0.636 -32% | 46.55 4852% |
| Read 4k QD32 (MB/s) | 0.83 | 0.818 -1% | 176.3 21141% | 0.694 -16% | 125 14960% |
| Write 4k QD32 (MB/s) | 0.96 | 0.648 -32% | 163.3 16910% | 0.682 -29% | 131.4 13588% |

| 3DMark 11 | |
| 1280x720 Performance GPU | |
| HP Pavilion 15-aw004ng W8Y60EA | |
| Lenovo ThinkPad X1 Yoga 2017 20JES03T00 | |
| Lenovo ThinkPad L570 20J80020PB | |
| Asus Zenbook UX360UA-C4159T | |
| Toshiba Portege X30-D (PT274U-01N001) | |
| Fujitsu Lifebook S936 6600U 512GB PalmSecure | |
| Acer TravelMate P449-M-7407 | |
| Asus X555DA-BB11 | |
| Lenovo Yoga 510-14AST | |
| Acer TravelMate P249-M-3895 | |
| HP 15-bw077ax | |
| Lenovo B50-10 80QR0013GE | |
| 1280x720 Performance Combined | |
| Lenovo ThinkPad L570 20J80020PB | |
| Lenovo ThinkPad X1 Yoga 2017 20JES03T00 | |
| Acer TravelMate P449-M-7407 | |
| Asus Zenbook UX360UA-C4159T | |
| Fujitsu Lifebook S936 6600U 512GB PalmSecure | |
| HP Pavilion 15-aw004ng W8Y60EA | |
| Toshiba Portege X30-D (PT274U-01N001) | |
| Lenovo Yoga 510-14AST | |
| Acer TravelMate P249-M-3895 | |
| Asus X555DA-BB11 | |
| HP 15-bw077ax | |
| Lenovo B50-10 80QR0013GE | |
| 3DMark | |
| 1280x720 Cloud Gate Standard Graphics | |
| HP Pavilion 15-aw004ng W8Y60EA | |
| Lenovo ThinkPad L570 20J80020PB | |
| Lenovo ThinkPad X1 Yoga 2017 20JES03T00 | |
| Asus Zenbook UX360UA-C4159T | |
| Microsoft Surface Pro (2017) i5 | |
| Toshiba Portege X30-D (PT274U-01N001) | |
| Acer TravelMate P449-M-7407 | |
| Fujitsu Lifebook S936 6600U 512GB PalmSecure | |
| Lenovo Thinkpad 13-20J1001BUS | |
| Lenovo Yoga 510-14AST | |
| Asus X555DA-BB11 | |
| HP 15-bw077ax | |
| Lenovo B50-10 80QR0013GE | |
| 1920x1080 Fire Strike Graphics | |
| HP Pavilion 15-aw004ng W8Y60EA | |
| Lenovo ThinkPad L570 20J80020PB | |
| Lenovo ThinkPad X1 Yoga 2017 20JES03T00 | |
| Microsoft Surface Pro (2017) i5 | |
| Toshiba Portege X30-D (PT274U-01N001) | |
| Acer TravelMate P449-M-7407 | |
| Lenovo Yoga 510-14AST | |
| Asus X555DA-BB11 | |
| HP 15-bw077ax | |
| 1920x1080 Ice Storm Extreme Graphics | |
| Lenovo ThinkPad L570 20J80020PB | |
| HP Pavilion 15-aw004ng W8Y60EA | |
| Acer TravelMate P449-M-7407 | |
| Toshiba Portege X30-D (PT274U-01N001) | |
| Lenovo Yoga 510-14AST | |
| Lenovo Thinkpad 13-20J1001BUS | |
| Asus X555DA-BB11 | |
| 3DMark 11 Performance | 1103 pontos | |
| 3DMark Cloud Gate Standard Score | 2673 pontos | |
| 3DMark Fire Strike Score | 596 pontos | |
Ajuda | ||
| Ashes of the Singularity - 1280x768 low (classificar por valor) | |
| HP 15-bw077ax | |
| HP Pavilion 15-aw004ng W8Y60EA | |
| Batman: Arkham City | |
| 1024x768 Low Preset (classificar por valor) | |
| HP 15-bw077ax | |
| 1366x768 Medium Preset (classificar por valor) | |
| HP 15-bw077ax | |
| 1366x768 High Preset DX11 AA:2x MS (classificar por valor) | |
| HP 15-bw077ax | |
| Batman: Arkham Origins | |
| 1024x768 All Off (classificar por valor) | |
| HP 15-bw077ax | |
| 1366x768 Normal / On (PhysX Off) (classificar por valor) | |
| HP 15-bw077ax | |
| 1366x768 DX11 Enhanced / On (PhysX Off) AA:2x MS (classificar por valor) | |
| HP 15-bw077ax | |
| Call of Duty: Advanced Warfare - 1024x768 Low / Off (Shader Preload On) (classificar por valor) | |
| HP 15-bw077ax | |
| The Witcher 3 - 1024x768 Low Graphics & Postprocessing (classificar por valor) | |
| HP 15-bw077ax | |
| baixo | média | alto | ultra | |
|---|---|---|---|---|
| Mafia 2 (2010) | 26 | 21 | 17 | |
| Batman: Arkham City (2011) | 35 | 27 | 13 | |
| BioShock Infinite (2013) | 38 | 22 | 18 | |
| Metro: Last Light (2013) | 13 | 10 | 6 | |
| Company of Heroes 2 (2013) | 13 | 10 | 5 | |
| Batman: Arkham Origins (2013) | 44 | 26 | 14 | |
| Middle-earth: Shadow of Mordor (2014) | 16 | 11 | ||
| Alien: Isolation (2014) | 27 | 17 | ||
| Call of Duty: Advanced Warfare (2014) | 12 | |||
| The Witcher 3 (2015) | 9 | |||
| Batman: Arkham Knight (2015) | 8 | 5 | ||
| Rise of the Tomb Raider (2016) | 14 | 8 | ||
| Hitman 2016 (2016) | 4 | 2 | ||
| Ashes of the Singularity (2016) | 7 |
Barulho
| Ocioso |
| 31.8 / 33.2 / 34 dB |
| Carga |
| 33.3 / 36.4 dB |
 | ||
30 dB silencioso 40 dB(A) audível 50 dB(A) ruidosamente alto |
||
min: | ||
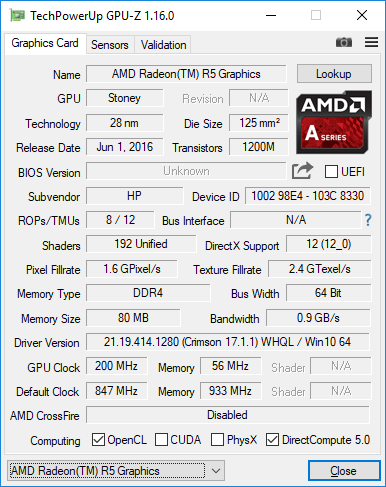
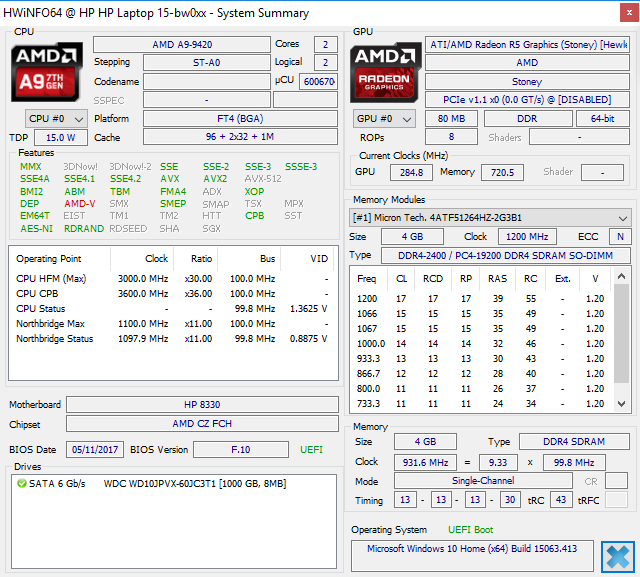
| HP 15-bw077ax Radeon R5 (Stoney Ridge), A9-9420, WDC Scorpio Blue WD10JPVX-60JC3T1 | Lenovo B50-10 80QR0013GE HD Graphics (Bay Trail), N3540, Seagate Momentus Thin ST500LT012-1DG142 | Lenovo Yoga 510-14AST Radeon R5 (Stoney Ridge), A9-9410 | Asus X555DA-BB11 Radeon R6 (Carrizo), A10-8700P, Seagate Momentus SpinPoint M8 ST1000LM024 HN-M101MBB | HP Pavilion 15-aw004ng W8Y60EA Radeon R8 M445DX, A10-9600P | |
|---|---|---|---|---|---|
| Noise | -2% | 5% | 1% | -7% | |
| desligado / ambiente * (dB) | 27.8 | 31.2 -12% | 30.4 -9% | 28.9 -4% | 31.2 -12% |
| Idle Minimum * (dB) | 31.8 | 33.5 -5% | 30.4 4% | 31.6 1% | 31.7 -0% |
| Idle Average * (dB) | 33.2 | 33.5 -1% | 30.4 8% | 32 4% | 31.9 4% |
| Idle Maximum * (dB) | 34 | 33.5 1% | 30.4 11% | 32.4 5% | 31.9 6% |
| Load Average * (dB) | 33.3 | 33.5 -1% | 31.3 6% | 33.3 -0% | 41 -23% |
| Load Maximum * (dB) | 36.4 | 33.5 8% | 33.3 9% | 35.5 2% | 42.7 -17% |
* ... menor é melhor
(+) A temperatura máxima no lado superior é 37.2 °C / 99 F, em comparação com a média de 36.8 °C / 98 F , variando de 21 a 71 °C para a classe Multimedia.
(±) A parte inferior aquece até um máximo de 40.6 °C / 105 F, em comparação com a média de 39.1 °C / 102 F
(+) Em uso inativo, a temperatura média para o lado superior é 27.8 °C / 82 F, em comparação com a média do dispositivo de 31.3 °C / ### class_avg_f### F.
(+) Os apoios para as mãos e o touchpad estão atingindo a temperatura máxima da pele (33 °C / 91.4 F) e, portanto, não estão quentes.
(-) A temperatura média da área do apoio para as mãos de dispositivos semelhantes foi 28.7 °C / 83.7 F (-4.3 °C / -7.7 F).
HP 15-bw077ax análise de áudio
(±) | o volume do alto-falante é médio, mas bom (###valor### dB)
Graves 100 - 315Hz
(±) | graves reduzidos - em média 8.8% menor que a mediana
(±) | a linearidade dos graves é média (9.4% delta para a frequência anterior)
Médios 400 - 2.000 Hz
(+) | médios equilibrados - apenas 2.2% longe da mediana
(±) | a linearidade dos médios é média (7.7% delta para frequência anterior)
Altos 2 - 16 kHz
(+) | agudos equilibrados - apenas 2.4% longe da mediana
(+) | os máximos são lineares (6.7% delta da frequência anterior)
Geral 100 - 16.000 Hz
(+) | o som geral é linear (14.6% diferença em relação à mediana)
Comparado com a mesma classe
» 35% de todos os dispositivos testados nesta classe foram melhores, 4% semelhantes, 61% piores
» O melhor teve um delta de 5%, a média foi 17%, o pior foi 45%
Comparado com todos os dispositivos testados
» 19% de todos os dispositivos testados foram melhores, 4% semelhantes, 77% piores
» O melhor teve um delta de 4%, a média foi 23%, o pior foi 134%
Lenovo Yoga 510-14AST análise de áudio
(-) | alto-falantes não muito altos (###valor### dB)
Graves 100 - 315Hz
(-) | quase nenhum baixo - em média 24.3% menor que a mediana
(±) | a linearidade dos graves é média (11.4% delta para a frequência anterior)
Médios 400 - 2.000 Hz
(+) | médios equilibrados - apenas 2.6% longe da mediana
(±) | a linearidade dos médios é média (8.2% delta para frequência anterior)
Altos 2 - 16 kHz
(+) | agudos equilibrados - apenas 2.1% longe da mediana
(±) | a linearidade dos máximos é média (8.1% delta para frequência anterior)
Geral 100 - 16.000 Hz
(±) | a linearidade do som geral é média (21.8% diferença em relação à mediana)
Comparado com a mesma classe
» 61% de todos os dispositivos testados nesta classe foram melhores, 8% semelhantes, 31% piores
» O melhor teve um delta de 6%, a média foi 20%, o pior foi 57%
Comparado com todos os dispositivos testados
» 62% de todos os dispositivos testados foram melhores, 7% semelhantes, 31% piores
» O melhor teve um delta de 4%, a média foi 23%, o pior foi 134%
| desligado | |
| Ocioso | |
| Carga |
|
Key:
min: | |
| HP 15-bw077ax A9-9420, Radeon R5 (Stoney Ridge), WDC Scorpio Blue WD10JPVX-60JC3T1, TN LED, 1366x768, 15.6" | Lenovo B50-10 80QR0013GE N3540, HD Graphics (Bay Trail), Seagate Momentus Thin ST500LT012-1DG142, TN LED, 1366x768, 15.6" | Lenovo Yoga 510-14AST A9-9410, Radeon R5 (Stoney Ridge), , TN LED, 1366x768, 14" | Asus X555DA-BB11 A10-8700P, Radeon R6 (Carrizo), Seagate Momentus SpinPoint M8 ST1000LM024 HN-M101MBB, TN LED, 1920x1080, 15.6" | HP Pavilion 15-aw004ng W8Y60EA A10-9600P, Radeon R8 M445DX, , TN LED, 1920x1080, 15.6" | |
|---|---|---|---|---|---|
| Power Consumption | 28% | 20% | -30% | -43% | |
| Idle Minimum * (Watt) | 8 | 4.8 40% | 3.9 51% | 8.3 -4% | 5.5 31% |
| Idle Average * (Watt) | 9.4 | 7.5 20% | 7.4 21% | 8.6 9% | 8.2 13% |
| Idle Maximum * (Watt) | 13.9 | 9.2 34% | 9.4 32% | 13.1 6% | 9.5 32% |
| Load Average * (Watt) | 18.5 | 16 14% | 19.2 -4% | 31.2 -69% | 44.5 -141% |
| Load Maximum * (Watt) | 23 | 15.4 33% | 22.5 2% | 43.9 -91% | 58 -152% |
* ... menor é melhor
| HP 15-bw077ax A9-9420, Radeon R5 (Stoney Ridge), 31 Wh | Lenovo B50-10 80QR0013GE N3540, HD Graphics (Bay Trail), 24 Wh | Lenovo Yoga 510-14AST A9-9410, Radeon R5 (Stoney Ridge), 35 Wh | Asus X555DA-BB11 A10-8700P, Radeon R6 (Carrizo), 37 Wh | HP Pavilion 15-aw004ng W8Y60EA A10-9600P, Radeon R8 M445DX, 41 Wh | |
|---|---|---|---|---|---|
| Duração da bateria | 3% | 63% | -8% | 25% | |
| Reader / Idle (h) | 9 | 14.1 57% | 7.3 -19% | 9.3 3% | |
| WiFi v1.3 (h) | 3.4 | 3.5 3% | 5.4 59% | 2.9 -15% | 4.3 26% |
| Load (h) | 1.1 | 1.9 73% | 1.2 9% | 1.6 45% |
Pro
Contra


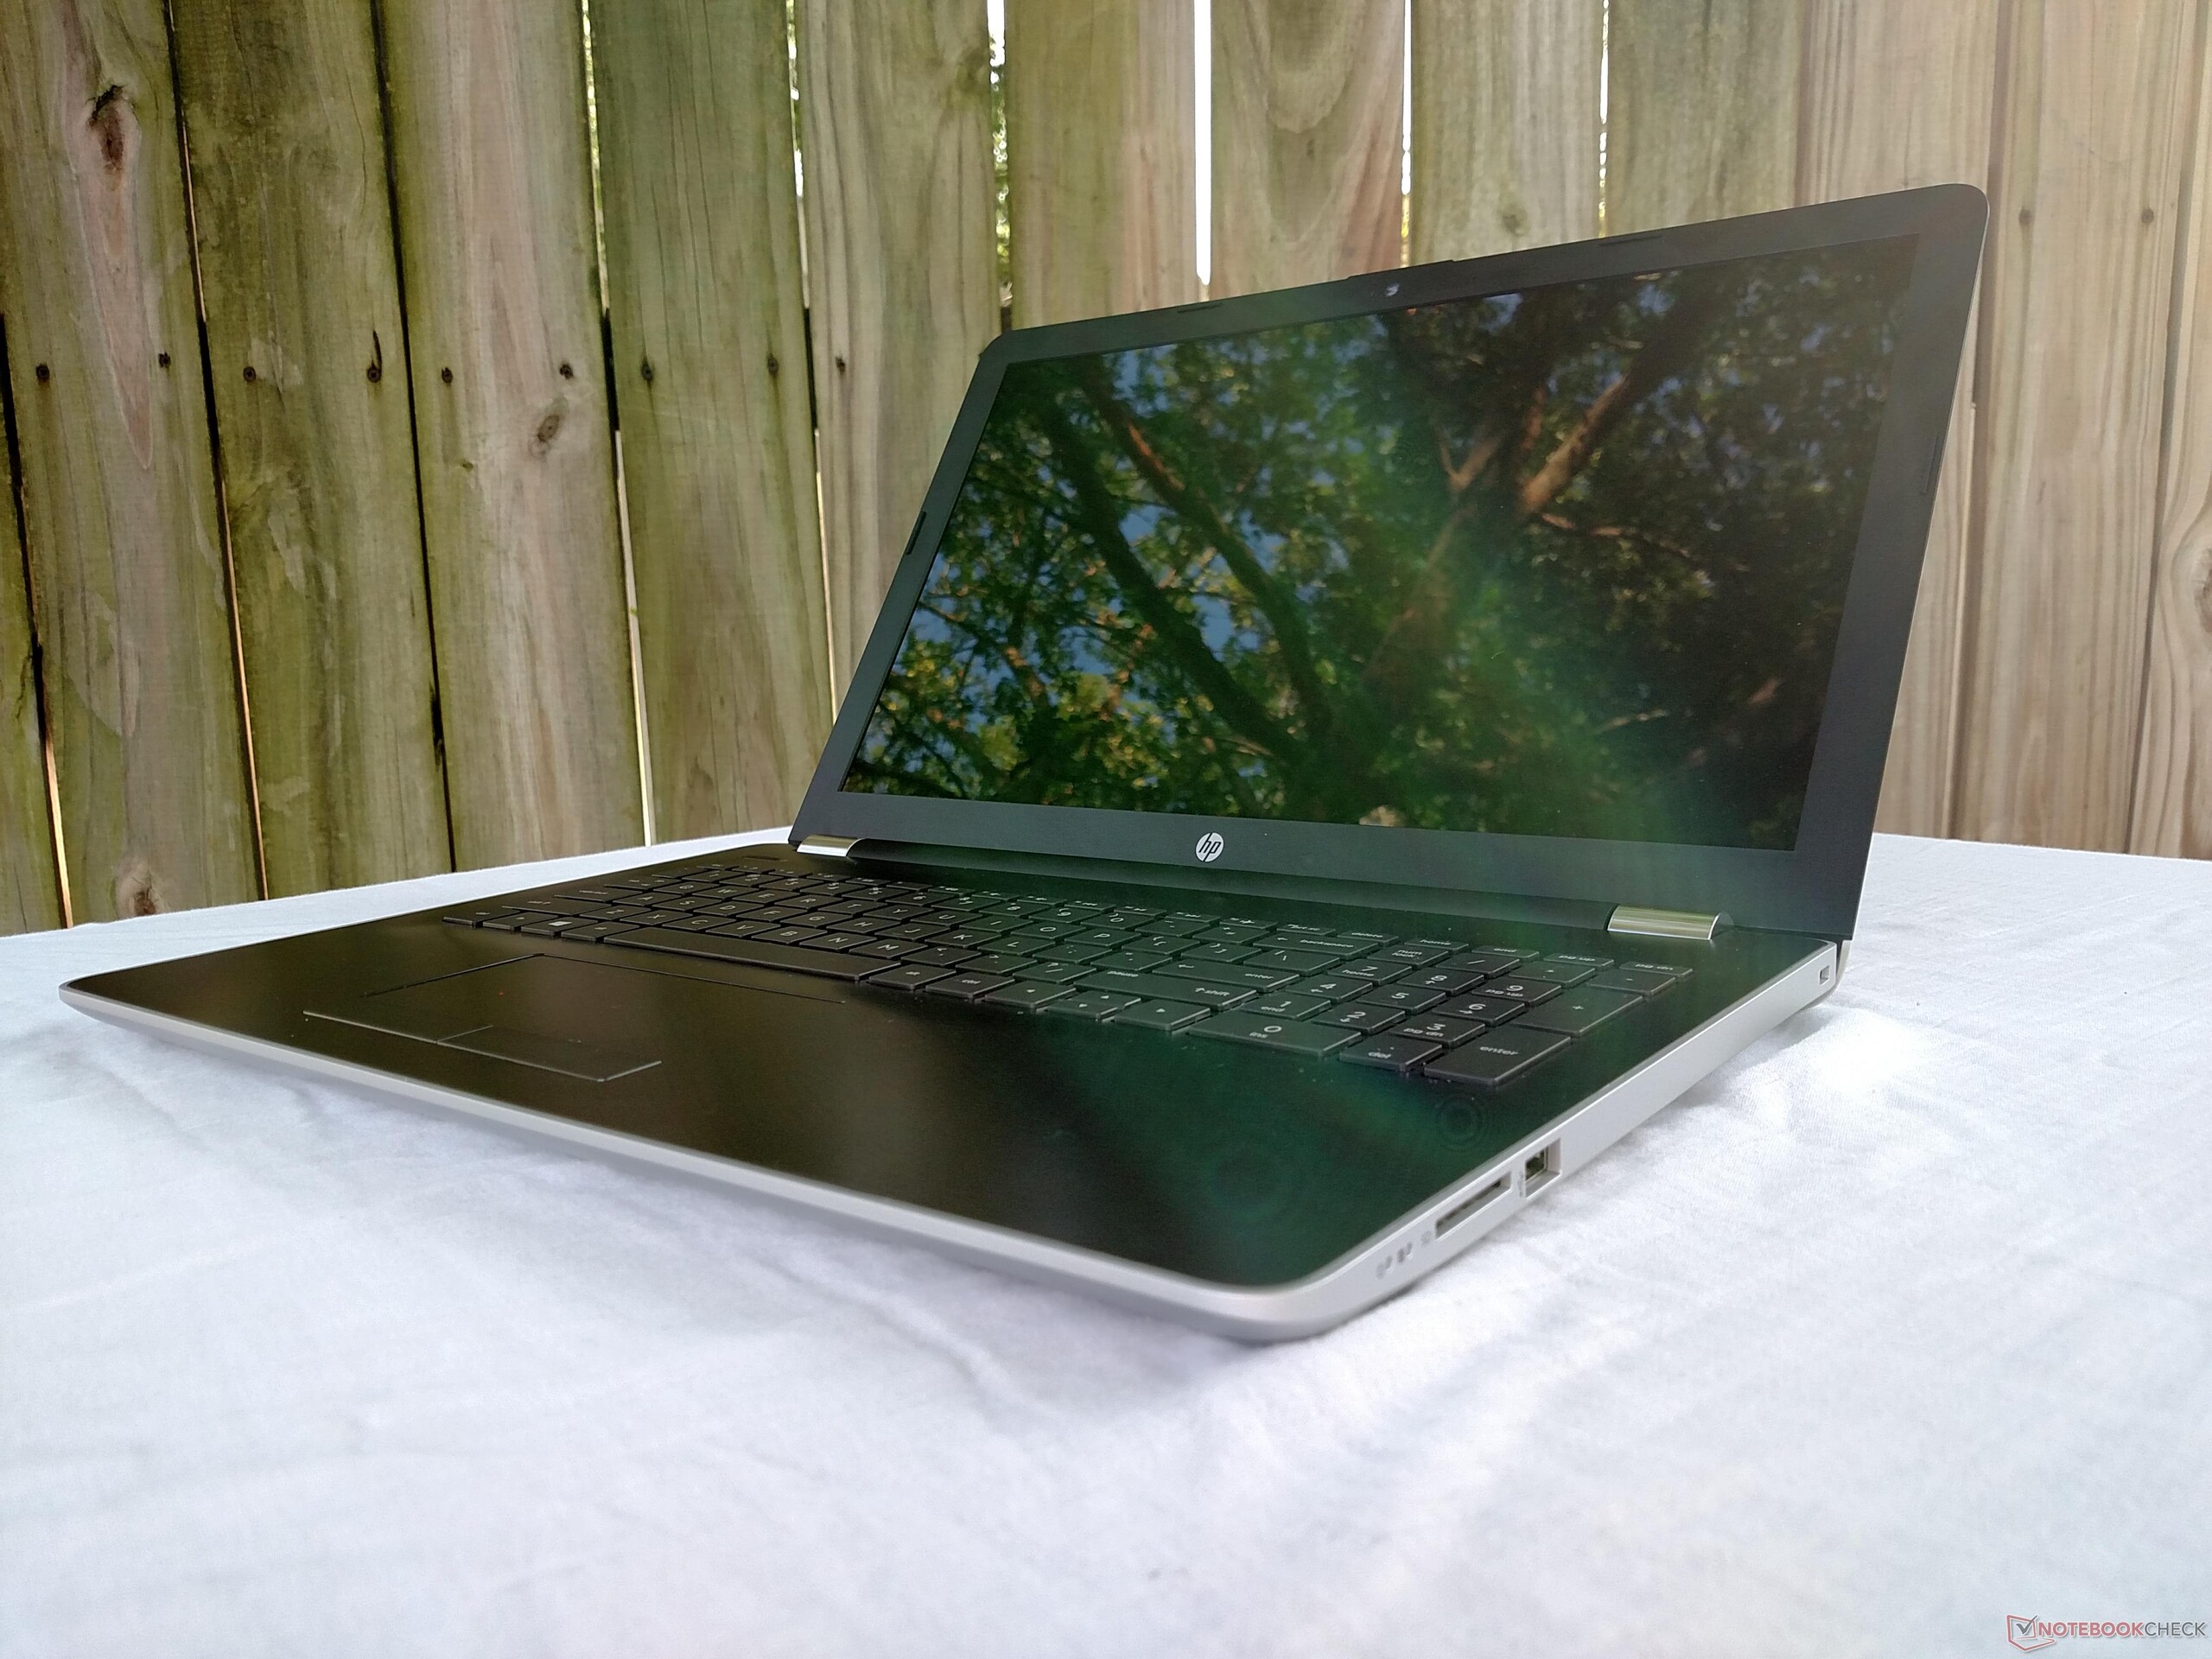
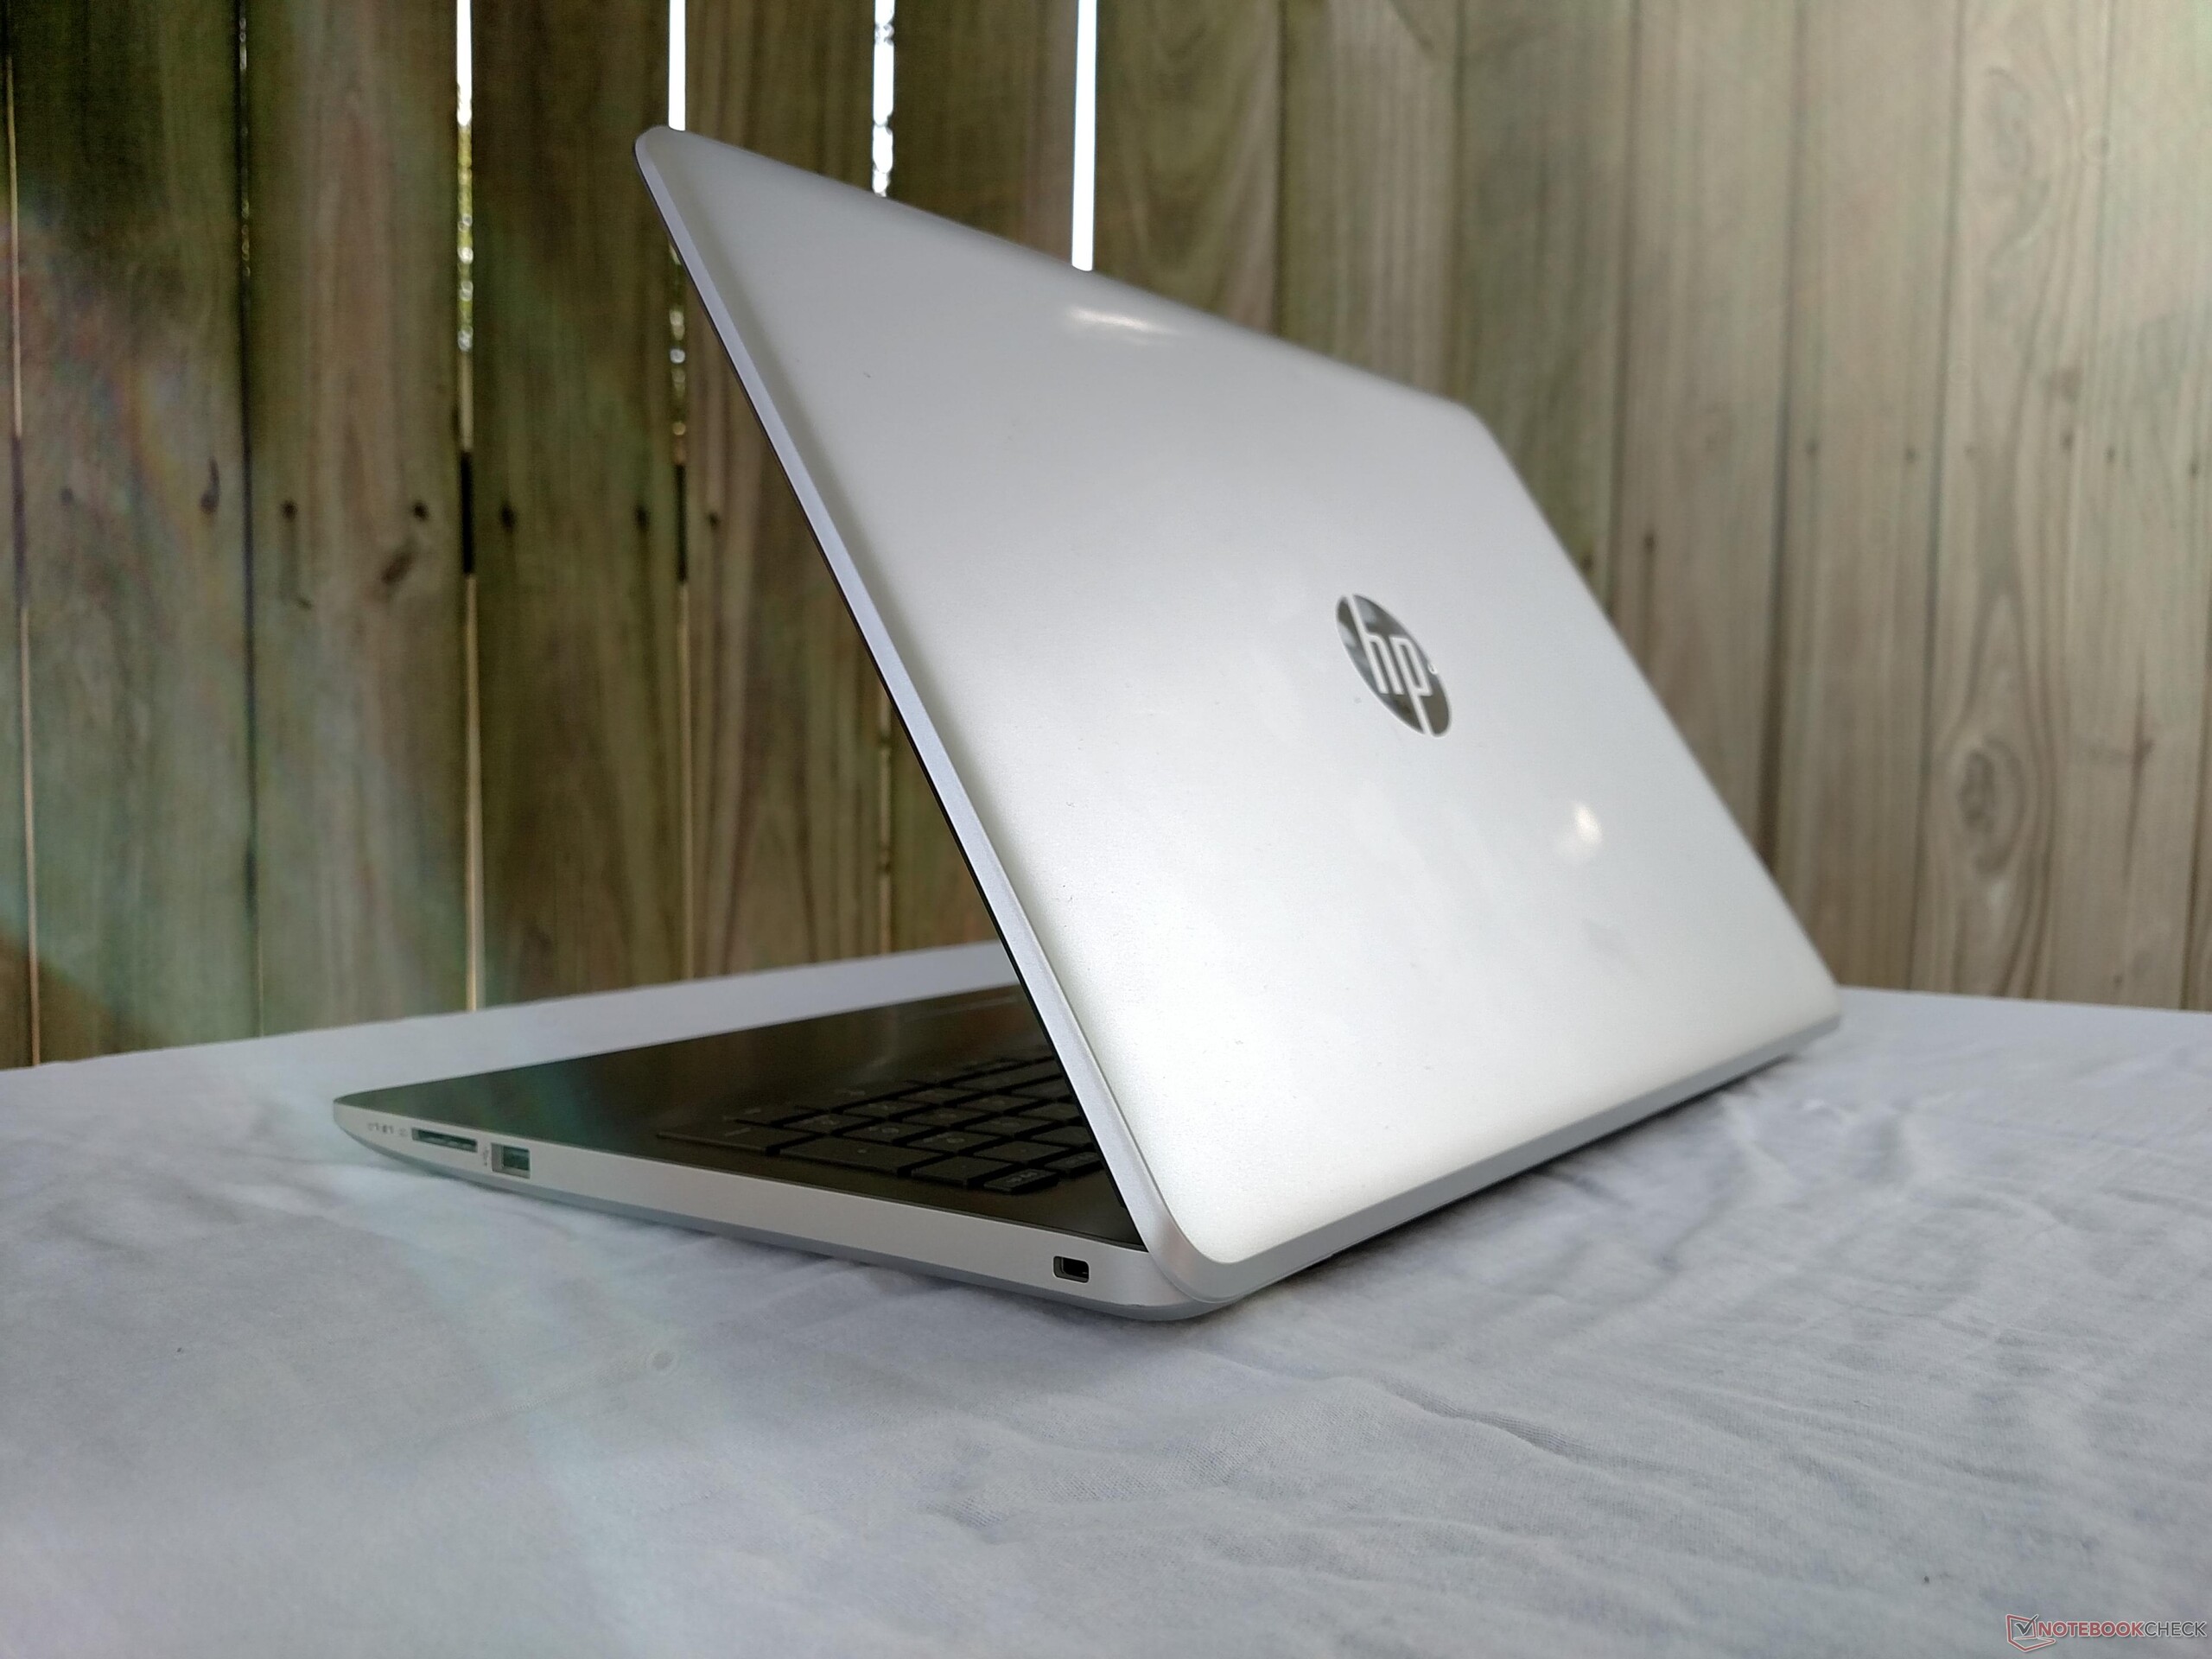
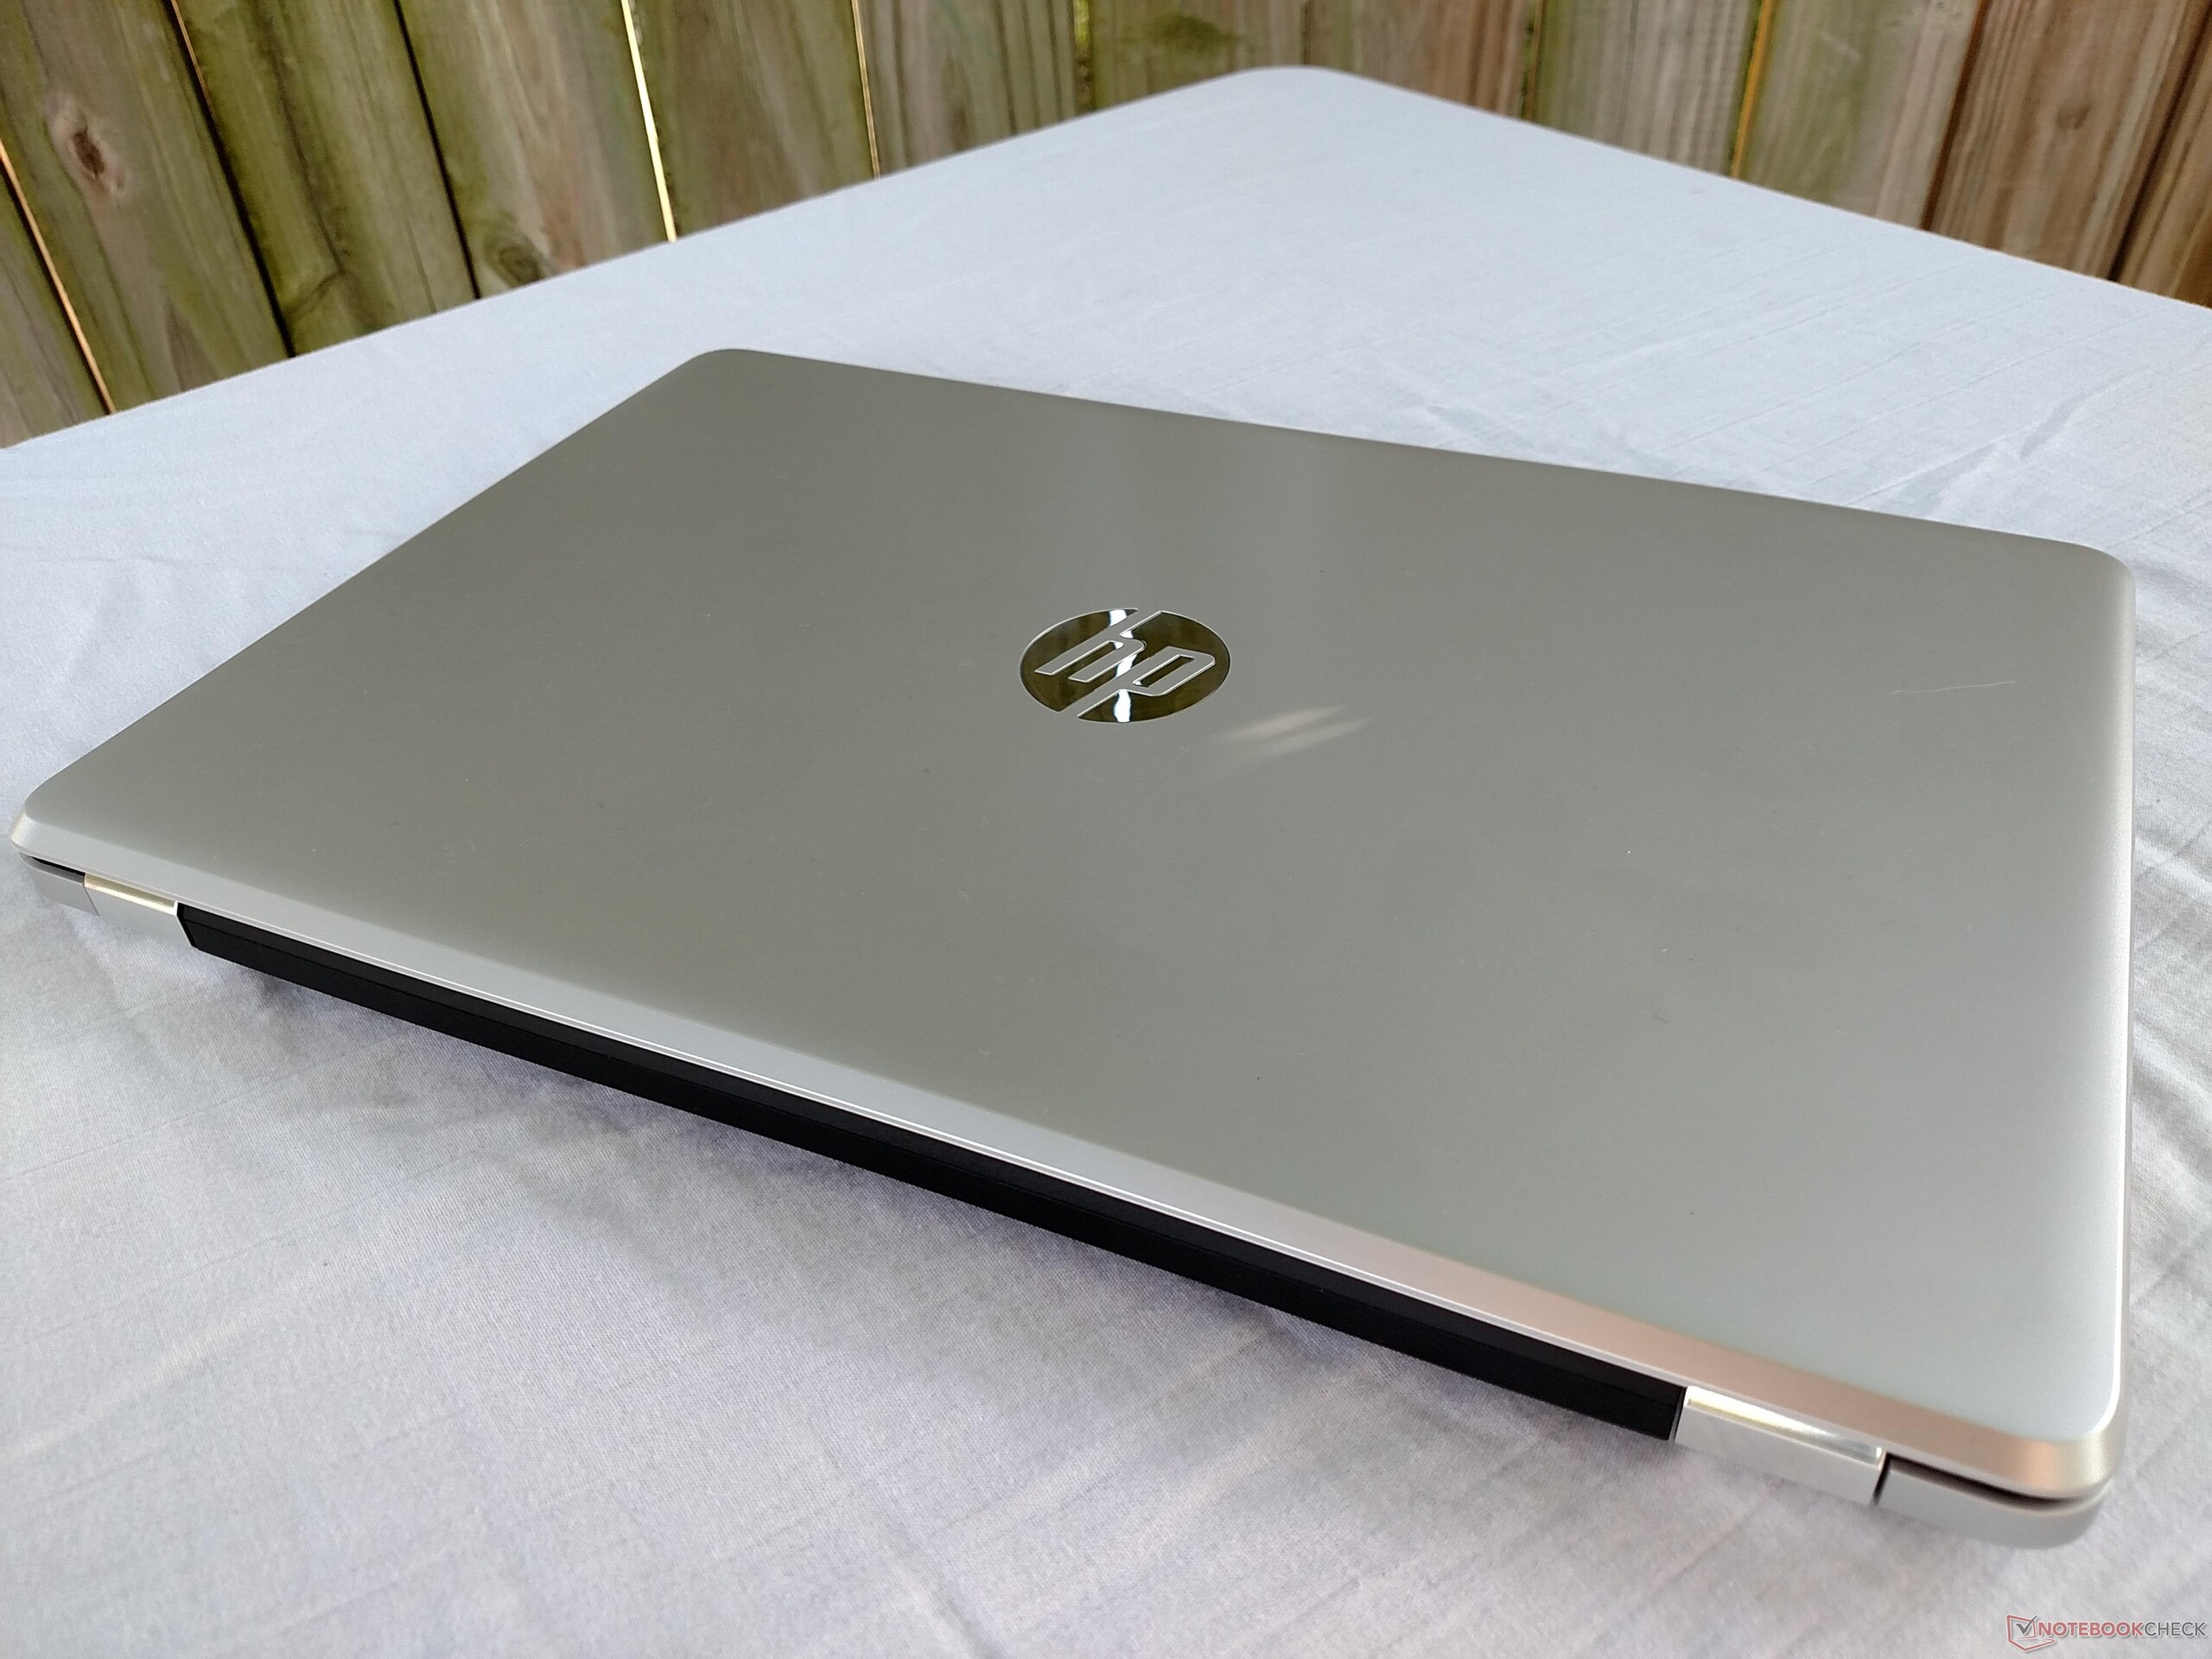
O HP 15-bw077ax é um portátil de compromissos sem muito retorno. A qualidade de construção é boa para uma opção econômica, e o portátil permanece muito frio e silencioso, inclusive sob uso intenso. Os alto-falantes também oferecem uma experiência multimídia rica e estão uma classe acima de outros portáteis econômicos.
No entanto, a CPU é insuficiente e o sistema como um todo é abismalmente lento. Junte isso com uma tela imprecisa, um teclado grudento, e uma experiência pobre e se torna muito difícil recomendar o HP 15-bw077ax. Realmente não há nada aqui que faça com que o aparelho se destaque, e o portátil provavelmente fique nas prateleiras das lojas, ignorado pelos compradores potenciais.
Se estiver procurando por uma opção econômica, não está aqui. Os Chromebooks podem oferecer uma experiência mais fluente e rápida devido ao seu SO leve a um preço similar (ou mais barato), e existem outras opções econômicas muito melhores. Nossa lista dos melhores portáteis empresariais econômicos possui diversas opções que oferecem um desempenho muito melhor por quase o mesmo preço deste portátil. De qualquer forme, este é um dos aparelhos que você definitivamente irá querer passar.
HP 15-bw077ax
- 07/08/2017 v6 (old)
Sam Medley
Price comparison
