Análises para AMD Ryzen 7 4700U processador
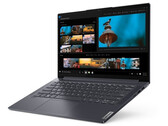
Lenovo Yoga Slim 7 14ARE05 em Revista: Casa de força compacta com boa vida útil da bateria
O notebook Lenovo de 14 polegadas apresenta um poderoso Ryzen 7 4700U APU com NVMe SSD e oferece uma vida útil decente da bateria. As emissões de ruído e temperatura são relativamente baixas para um dispositivo tão fino.
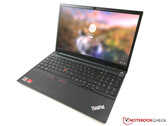
AMD Ryzen 7 4700U, Vega 7, 14", 1.4 kgLenovo ThinkPad E15 Gen.2 Revisão: Laptop de escritório com um chip AMD e novo design
O laptop de escritório de 15,6 polegadas da Lenovo vem com a carcaça redesenhada e apenas CPUs AMD. Examinamos a segunda geração do ThinkPad E15 com um processador Ryzen 7.
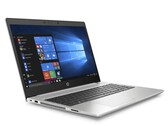
AMD Ryzen 7 4700U, Vega 7, 15.6", 1.8 kgBreve Análise do Portátil HP ProBook 455 G7: Desempenho mais rápido graças ao Zen2
Com as CPUs Renoir da AMD, a HP elevou significativamente o nível de desempenho do ProBook 455 G7. Examinamos mais de perto e determinamos se a duração da bateria é afetada por essa alteração. Nesta análise, também abordaremos todos os outros novos recursos e verificaremos se vale a pena comprar o portátil.
AMD Ryzen 7 4700U, Vega 7, 15.6", 1.8 kgBreve Análise do Portátil Acer Swift 3 SF314-42: Rápido, fino e com boa duração da bateria - O subportátil Ryzen é quase completamente convincente
O novo portátil Acer de 14 polegadas tem a novíssima APU Ryzen 7 4700U da AMD a bordo, que não tem desempenho nem de CPU nem de GPU. No entanto, a boa autonomia da bateria não foi comprometida, apesar da grande potência computacional da máquina. O novo Swift 3 também está bem equipado em outras áreas, com a Acer incluindo um SSD NVMe, uma tela IPS mate, um teclado retroiluminado e RAM de dois canais.
AMD Ryzen 7 4700U, Vega 7, 14", 1.2 kgFujitsu Lifebook U9311A, R7 4700U: AMD Radeon RX Vega 7, 13.30", 0.9 kg
ánalise externa » Fujitsu Lifebook U9311A, R7 4700U
Asus VivoBook Flip 14 TM420IA-EC230T: AMD Radeon RX Vega 7, 14.00", 1.5 kg
ánalise externa » Asus VivoBook Flip 14 TM420IA-EC230T
HP Envy x360 13-ay0004ns: AMD Radeon RX Vega 7, 13.30", 1.3 kg
ánalise externa » HP Envy x360 13-ay0004ns
LG Ultra PC 13U70P-G.AAW7U1: AMD Radeon RX Vega 7, 13.30", 1 kg
ánalise externa » LG Ultra PC 13U70P-G.AAW7U1
HP 15s-eq1073ns: AMD Radeon RX Vega 7, 15.60", 1.7 kg
ánalise externa » HP 15s-eq1073ns
HP 15s-eq1071ns: AMD Radeon RX Vega 7, 15.60", 1.7 kg
ánalise externa » HP 15s-eq1071ns
Acer Aspire 5 A515-44-R5QH: AMD Radeon RX Vega 7, 15.60", 1.8 kg
ánalise externa » Acer Aspire 5 A515-44-R5QH
HP 15s-eq1083ns: AMD Radeon RX Vega 7, 15.60", 1.7 kg
ánalise externa » HP 15s-eq1083ns
HP Envy x360 13-ay0003ns: AMD Radeon RX Vega 7, 13.30", 1.3 kg
ánalise externa » HP Envy x360 13-ay0003ns
Acer Swift 3 SF314-42-R7QS: AMD Radeon RX Vega 7, 14.00", 1.2 kg
ánalise externa » Acer Swift 3 SF314-42-R7QS
Asus VivoBook 15 S513IA-DB74: AMD Radeon RX Vega 7, 15.60", 1.6 kg
ánalise externa » Asus VivoBook 15 S513IA-DB74
HP Pavilion 15-eh0014na: AMD Radeon RX Vega 7, 15.60", 1.8 kg
ánalise externa » HP Pavilion 15-eh0014na
HP 15s-eq1105ns: AMD Radeon RX Vega 7, 15.60", 1.7 kg
ánalise externa » HP 15s-eq1105ns
HP Pavilion 15-eh0177ng: AMD Radeon RX Vega 7, 15.60", 1.8 kg
ánalise externa » HP Pavilion 15-eh0177ng
HP Probook 635 Aero G7, 4700U: AMD Radeon RX Vega 7, 13.30", 1 kg
ánalise externa » HP Probook 635 Aero G7, 4700U
Lenovo Yoga Slim 7 14ARE05-82A200ABMH: AMD Radeon RX Vega 7, 14.00", 1.3 kg
ánalise externa » Lenovo Yoga Slim 7 14ARE05-82A200ABMH
Asus VivoBook 15 M513IA-BQ443T: AMD Radeon RX Vega 7, 15.60", 1.8 kg
ánalise externa » Asus VivoBook 15 M513IA-BQ443T
Lenovo ThinkBook 14 G2 ARE-20VF000BGE: AMD Radeon RX Vega 7, 14.00", 1.4 kg
ánalise externa » Lenovo ThinkBook 14 G2 ARE-20VF000BGE
MSI Modern 14 B4MW-005TH: AMD Radeon RX Vega 7, 14.00", 1.3 kg
ánalise externa » MSI Modern 14 B4MW-005TH
Asus ZenBook 14 UM425IA-AM006T: AMD Radeon RX Vega 7, 14.00", 1.3 kg
ánalise externa » Asus ZenBook 14 UM425IA-AM006T
Asus VivoBook S15 M513IA-EJ354: AMD Radeon RX Vega 7, 15.60", 1.8 kg
ánalise externa » Asus VivoBook S15 M513IA-EJ354
Asus VivoBook Flip 14 TM420IA-EC207: AMD Radeon RX Vega 7, 14.00", 1.5 kg
ánalise externa » Asus VivoBook Flip 14 TM420IA-EC207
Acer Swift 3 SF314-42-R30P: AMD Radeon RX Vega 7, 14.00", 1.2 kg
ánalise externa » Acer Swift 3 SF314-42-R30P
Asus VivoBook S14 M433IA-EB069: AMD Radeon RX Vega 7, 14.00", 1.4 kg
ánalise externa » Asus VivoBook S14 M433IA-EB069
Asus ZenBook 14 UM421IA: AMD Radeon RX Vega 7, 14.00", 1.3 kg
ánalise externa » Asus ZenBook 14 UM421IA
Lenovo IdeaPad Flex 5 14ARE05-81X200DHMH: AMD Radeon RX Vega 7, 14.00", 1.5 kg
ánalise externa » Lenovo IdeaPad Flex 5 14ARE05-81X200DHMH
HP Envy x360 15-ee0425no: AMD Radeon RX Vega 7, 15.60", 2 kg
ánalise externa » HP Envy x360 15-ee0425no
Asus VivoBook 14 S413IA-EK663T: AMD Radeon RX Vega 7, 14.00", 1.4 kg
ánalise externa » Asus VivoBook 14 S413IA-EK663T
HP ProBook x360 435 G7, Ryzen 7 4700U: AMD Radeon RX Vega 7, 13.30", 1.5 kg
ánalise externa » HP ProBook x360 435 G7, Ryzen 7 4700U
Lenovo ThinkPad E15 Gen2-20T9S00K00: AMD Radeon RX Vega 7, 15.60", 1.8 kg
ánalise externa » Lenovo ThinkPad E15 Gen2-20T9S00K00
Lenovo Yoga Slim 7 14ARE05 82A20008GE: AMD Radeon RX Vega 7, 14.00", 1.4 kg
ánalise externa » Lenovo Yoga Slim 7 14ARE05 82A20008GE
HP Envy x360 13-ay0008nw: AMD Radeon RX Vega 7, 13.30", 1.4 kg
ánalise externa » HP Envy x360 13-ay0008nw
Lenovo Yoga 6 13, 4700U: AMD Radeon RX Vega 7, 13.30", 1.4 kg
ánalise externa » Lenovo Yoga 6 13, 4700U
Acer Swift 3 SF314-42-R3ZU: AMD Radeon RX Vega 7, 14.00", 1.2 kg
ánalise externa » Acer Swift 3 SF314-42-R3ZU
HP ProBook 445 G7, R7 4700U: AMD Radeon RX Vega 7, 14.00", 1.6 kg
ánalise externa » HP ProBook 445 G7, R7 4700U
Lenovo IdeaPad Flex 5 14ARE05-81X2004YGE: AMD Radeon RX Vega 7, 14.00", 1.5 kg
ánalise externa » Lenovo IdeaPad Flex 5 14ARE05-81X2004YGE
HP Envy x360 13-ay0003nd: AMD Radeon RX Vega 7, 13.30", 1.3 kg
ánalise externa » HP Envy x360 13-ay0003nd
HP Envy x360 15-ee0175nd: AMD Radeon RX Vega 7, 15.60", 2 kg
ánalise externa » HP Envy x360 15-ee0175nd
Asus VivoBook S15 M533IA-BQ070T: AMD Radeon RX Vega 7, 15.60", 1.8 kg
ánalise externa » Asus VivoBook S15 M533IA-BQ070T
HP ProBook 455 G7-175W8EA: AMD Radeon RX Vega 7, 15.60", 1.8 kg
ánalise externa » HP ProBook 455 G7-175W8EA
Asus VivoBook Flip 14 TM420IA: AMD Radeon RX Vega 7, 14.00", 1.6 kg
ánalise externa » Asus VivoBook Flip 14 TM420IA
Lenovo ThinkPad E14 Gen2-20T6000MGE: AMD Radeon RX Vega 7, 14.00", 1.6 kg
ánalise externa » Lenovo ThinkPad E14 Gen2-20T6000MGE
Acer Swift 3 SF314-42-R991: AMD Radeon RX Vega 7, 14.00", 1.2 kg
ánalise externa » Acer Swift 3 SF314-42-R991
HP Envy x360 13-ay0002ns: AMD Radeon RX Vega 7, 13.30", 1.3 kg
ánalise externa » HP Envy x360 13-ay0002ns
MSI Modern 14 B4MW-032XES: AMD Radeon RX Vega 7, 14.00", 1.3 kg
ánalise externa » MSI Modern 14 B4MW-032XES
Asus ZenBook 14 UM425IA-HM032R: AMD Radeon RX Vega 7, 14.00", 1.1 kg
ánalise externa » Asus ZenBook 14 UM425IA-HM032R
Acer Aspire 5 A515-44-R8VV: AMD Radeon RX Vega 7, 15.60", 1.8 kg
ánalise externa » Acer Aspire 5 A515-44-R8VV
Xiaomi RedmiBook 16 R7 4700U: AMD Radeon RX Vega 7, 16.10", 1.8 kg
ánalise externa » Xiaomi RedmiBook 16 R7 4700U
Lenovo Yoga Slim 7-14ARE05, Ryzen 7 4700U: AMD Radeon RX Vega 7, 14.00", 1.4 kg
ánalise externa » Lenovo Yoga Slim 7 14ARE05, Ryzen 7 4700U
Acer Swift 3 SF314-42-R9YN: AMD Radeon RX Vega 7, 14.00", 1.2 kg
ánalise externa » Acer Swift 3 SF314-42-R9YN
Lenovo IdeaPad 5 15ARE05-81YQ006JMH: AMD Radeon RX Vega 7, 15.60", 1.6 kg
ánalise externa » Lenovo IdeaPad 5 15ARE05-81YQ006JMH
Asus VivoBook S14 M433IA, Ryzen 7 4700U: AMD Radeon RX Vega 7, 14.00", 1.4 kg
ánalise externa » Asus VivoBook S14 M433IA, Ryzen 7 4700U
Asus ZenBook 14 UM433IQ-A5026T: NVIDIA GeForce MX350, 14.00", 1.2 kg
ánalise externa » Asus ZenBook 14 UM433IQ-A5026T
Acer Swift 3 SF314-42-R4XJ: AMD Radeon RX Vega 7, 14.00", 1.2 kg
ánalise externa » Acer Swift 3 SF314-42-R4XJ
Lenovo Yoga Slim 7 14ARE05 82A20008GE: AMD Radeon RX Vega 7, 14.00", 1.4 kg
» Ryzen 7 4700U Unleashed - Lenovo não retém o APU do Yoga 7 Slim 14ARE05
Lenovo ThinkPad E15 Gen2-20T9S00K00: AMD Radeon RX Vega 7, 15.60", 1.8 kg
» O ThinkPad E15 Gen.2 AMD da Lenovo oferece um design mais compacto e muito mais desempenho
Asus VivoBook Flip 14 TM420IA: AMD Radeon RX Vega 7, 14.00", 1.6 kg
» O Asus VivoBook Flip 14, acionado pelos Ryzen, mostra o quanto a Intel precisa lançar sua plataforma Tiger Lake