Breve Análise do Portátil Lenovo Legion Y740-15ICH (i7-8750H, RTX 2070 Max-Q)


| |||||||||||||||||||||||||
iluminação: 85 %
iluminação com acumulador: 320.4 cd/m²
Contraste: 763:1 (Preto: 0.42 cd/m²)
ΔE ColorChecker Calman: 3.21 | ∀{0.5-29.43 Ø4.71}
calibrated: 2.36
ΔE Greyscale Calman: 3.6 | ∀{0.09-98 Ø4.96}
92% sRGB (Argyll 1.6.3 3D)
59% AdobeRGB 1998 (Argyll 1.6.3 3D)
64.7% AdobeRGB 1998 (Argyll 3D)
92.4% sRGB (Argyll 3D)
63.5% Display P3 (Argyll 3D)
Gamma: 2.27
CCT: 6503 K
| Lenovo Legion Y740-15ICHg LP156WFG-SPB2, IPS, 15.6", 1920x1080 | Gigabyte Aero 15-X9 LGD05C0, IPS, 15.6", 1920x1080 | Acer Predator Triton 500 AU Optronics B156HAN08.2 (AUO82ED), IPS, 15.6", 1920x1080 | Razer Blade 15 RTX 2070 Max-Q LG Philips LGD05C0, IPS, 15.6", 1920x1080 | Alienware m15 GTX 1070 Max-Q AU Optronics B156HAN, IPS, 15.6", 1920x1080 | |
|---|---|---|---|---|---|
| Display | 0% | 1% | 3% | -1% | |
| Display P3 Coverage (%) | 63.5 | 63.5 0% | 64.2 1% | 65.3 3% | 63.5 0% |
| sRGB Coverage (%) | 92.4 | 93.1 1% | 92.6 0% | 94.9 3% | 89.4 -3% |
| AdobeRGB 1998 Coverage (%) | 64.7 | 64.5 0% | 65.7 2% | 66.3 2% | 64.5 0% |
| Response Times | 5% | 36% | 12% | 7% | |
| Response Time Grey 50% / Grey 80% * (ms) | 18.8 ? | 16.4 ? 13% | 8 ? 57% | 16.8 ? 11% | 18 ? 4% |
| Response Time Black / White * (ms) | 13.2 ? | 13.6 ? -3% | 11.2 ? 15% | 11.6 ? 12% | 12 ? 9% |
| PWM Frequency (Hz) | |||||
| Screen | 18% | -5% | 9% | -3% | |
| Brightness middle (cd/m²) | 320.4 | 250 -22% | 304 -5% | 314.7 -2% | 353.6 10% |
| Brightness (cd/m²) | 298 | 235 -21% | 299 0% | 312 5% | 346 16% |
| Brightness Distribution (%) | 85 | 85 0% | 89 5% | 90 6% | 86 1% |
| Black Level * (cd/m²) | 0.42 | 0.29 31% | 0.27 36% | 0.38 10% | 0.3 29% |
| Contrast (:1) | 763 | 862 13% | 1126 48% | 828 9% | 1179 55% |
| Colorchecker dE 2000 * | 3.21 | 1.46 55% | 4.66 -45% | 2.56 20% | 4.55 -42% |
| Colorchecker dE 2000 max. * | 5.54 | 2.47 55% | 9.65 -74% | 4.89 12% | 7.91 -43% |
| Colorchecker dE 2000 calibrated * | 2.36 | 1.72 27% | 1.71 28% | 3.37 -43% | |
| Greyscale dE 2000 * | 3.6 | 1.27 65% | 5.53 -54% | 3.4 6% | 4.1 -14% |
| Gamma | 2.27 97% | 2.4 92% | 2.5 88% | 2.3 96% | 2.27 97% |
| CCT | 6503 100% | 6749 96% | 8028 81% | 6435 101% | 7434 87% |
| Color Space (Percent of AdobeRGB 1998) (%) | 59 | 60 2% | 60 2% | 60.7 3% | 57.9 -2% |
| Color Space (Percent of sRGB) (%) | 92 | 93 1% | 93 1% | 94.6 3% | 88.9 -3% |
| Média Total (Programa/Configurações) | 8% /
13% | 11% /
1% | 8% /
8% | 1% /
-2% |
* ... menor é melhor
Exibir tempos de resposta
| ↔ Tempo de resposta preto para branco | ||
|---|---|---|
| 13.2 ms ... ascensão ↗ e queda ↘ combinadas | ↗ 8 ms ascensão | 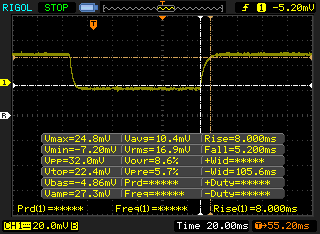 |
| ↘ 5.2 ms queda | ||
| A tela mostra boas taxas de resposta em nossos testes, mas pode ser muito lenta para jogadores competitivos. Em comparação, todos os dispositivos testados variam de 0.1 (mínimo) a 240 (máximo) ms. » 34 % de todos os dispositivos são melhores. Isso significa que o tempo de resposta medido é melhor que a média de todos os dispositivos testados (19.8 ms). | ||
| ↔ Tempo de resposta 50% cinza a 80% cinza | ||
| 18.8 ms ... ascensão ↗ e queda ↘ combinadas | ↗ 11.6 ms ascensão | 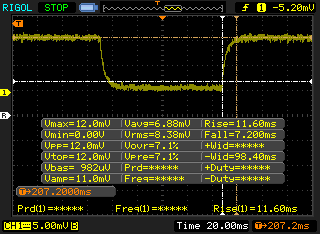 |
| ↘ 7.2 ms queda | ||
| A tela mostra boas taxas de resposta em nossos testes, mas pode ser muito lenta para jogadores competitivos. Em comparação, todos os dispositivos testados variam de 0.165 (mínimo) a 636 (máximo) ms. » 32 % de todos os dispositivos são melhores. Isso significa que o tempo de resposta medido é melhor que a média de todos os dispositivos testados (31 ms). | ||
Cintilação da tela / PWM (modulação por largura de pulso)
| Tela tremeluzindo / PWM não detectado | 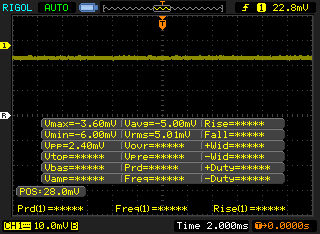 | ||
[pwm_comparison] Em comparação: 52 % de todos os dispositivos testados não usam PWM para escurecer a tela. Se PWM foi detectado, uma média de 7757 (mínimo: 5 - máximo: 343500) Hz foi medida. | |||
| Cinebench R10 | |
| Rendering Multiple CPUs 32Bit | |
| Média da turma Gaming (42932 - 102066, n=9, últimos 2 anos) | |
| Gigabyte Aero 15-X9 | |
| Média Intel Core i7-8750H (29664 - 35307, n=25) | |
| HP Omen 15-dc0015ng | |
| Rendering Single 32Bit | |
| Média da turma Gaming (7457 - 12575, n=9, últimos 2 anos) | |
| Média Intel Core i7-8750H (6236 - 6645, n=25) | |
| HP Omen 15-dc0015ng | |
| Gigabyte Aero 15-X9 | |
| PCMark 8 Home Score Accelerated v2 | 5115 pontos | |
| PCMark 8 Work Score Accelerated v2 | 5852 pontos | |
| PCMark 10 Score | 5941 pontos | |
Ajuda | ||
| Lenovo Legion Y740-15ICHg Samsung SSD PM981 MZVLB256HAHQ | Gigabyte Aero 15-X9 Intel SSD 760p SSDPEKKW010T8 | Acer Predator Triton 500 2x WDC PC SN720 SDAPNTW-256G-1014 (RAID 0) | Razer Blade 15 RTX 2070 Max-Q Samsung SSD PM981 MZVLB512HAJQ | Alienware m15 GTX 1070 Max-Q Toshiba XG5 KXG50ZNV512G | |
|---|---|---|---|---|---|
| AS SSD | |||||
| Seq Read (MB/s) | 1953 | 2113 8% | 2913 49% | 1840 -6% | 1967 1% |
| Seq Write (MB/s) | 1629 | 1471 -10% | 2492 53% | 1822 12% | 1135 -30% |
| 4K Read (MB/s) | 33.2 | 55 66% | 38.7 17% | 52.3 58% | 29.17 -12% |
| 4K Write (MB/s) | 88.1 | 107.1 22% | 107.2 22% | 110.7 26% | 93.4 6% |
| 4K-64 Read (MB/s) | 757 | 914 21% | 1228 62% | 1126 49% | 995 31% |
| 4K-64 Write (MB/s) | 1501 | 703 -53% | 1079 -28% | 1717 14% | 656 -56% |
| Access Time Read * (ms) | 0.077 | 0.114 -48% | 0.047 39% | 0.116 -51% | |
| Access Time Write * (ms) | 0.043 | 0.034 21% | 0.035 19% | 0.033 23% | 0.063 -47% |
| Score Read (Points) | 985 | 1180 20% | 1558 58% | 1362 38% | 1221 24% |
| Score Write (Points) | 1752 | 957 -45% | 1435 -18% | 2010 15% | 862 -51% |
| Score Total (Points) | 3230 | 2722 -16% | 3770 17% | 4079 26% | 2667 -17% |
| Copy ISO MB/s (MB/s) | 1872 | 1864 0% | 1975 6% | 642 -66% | |
| Copy Program MB/s (MB/s) | 478.2 | 362.6 -24% | 526 10% | 431.5 -10% | |
| Copy Game MB/s (MB/s) | 1165 | 936 -20% | 1200 3% | 706 -39% | |
| CrystalDiskMark 5.2 / 6 | |||||
| Write 4K (MB/s) | 81 | 97.1 20% | 93.6 16% | 93.9 16% | 107.4 33% |
| Read 4K (MB/s) | 36.03 | 53.7 49% | 38.82 8% | 40.56 13% | 42.91 19% |
| Write Seq (MB/s) | 1687 | 1526 -10% | 2455 46% | 1468 -13% | 467.5 -72% |
| Read Seq (MB/s) | 1835 | 2020 10% | 2107 15% | 1540 -16% | 2335 27% |
| Write 4K Q32T1 (MB/s) | 205.3 | 285.6 39% | 298.7 45% | 293.5 43% | 289.7 41% |
| Read 4K Q32T1 (MB/s) | 229 | 321.8 41% | 338.7 48% | 346 51% | 354.4 55% |
| Write Seq Q32T1 (MB/s) | 1683 | 1533 -9% | 2902 72% | 1941 15% | 460.9 -73% |
| Read Seq Q32T1 (MB/s) | 3363 | 2351 -30% | 3536 5% | 3266 -3% | 3111 -7% |
* ... menor é melhor

| 3DMark 06 Standard Score | 37344 pontos | |
| 3DMark 11 Performance | 18304 pontos | |
| 3DMark Ice Storm Standard Score | 162624 pontos | |
| 3DMark Cloud Gate Standard Score | 36817 pontos | |
| 3DMark Fire Strike Score | 15027 pontos | |
| 3DMark Fire Strike Extreme Score | 7614 pontos | |
| 3DMark Time Spy Score | 6540 pontos | |
Ajuda | ||
| Batman: Arkham Knight | |
| 1280x720 Low / Off AF:Trilinear | |
| Lenovo Legion Y740-15ICHg | |
| Média NVIDIA GeForce RTX 2070 Max-Q (n=1) | |
| 1366x768 Normal / Off AF:4x | |
| Lenovo Legion Y740-15ICHg | |
| Média NVIDIA GeForce RTX 2070 Max-Q (n=1) | |
| 1920x1080 High / On (Interactive Smoke & Paper Debris Off) AA:SM AF:8x | |
| Lenovo Legion Y740-15ICHg | |
| Média NVIDIA GeForce RTX 2070 Max-Q (n=1) | |
| 1920x1080 High / On AA:SM AF:16x | |
| Lenovo Legion Y740-15ICHg | |
| Média NVIDIA GeForce RTX 2070 Max-Q (n=1) | |
| baixo | média | alto | ultra | |
|---|---|---|---|---|
| BioShock Infinite (2013) | 302 | 282 | 261 | 211 |
| The Witcher 3 (2015) | 57 | |||
| Batman: Arkham Knight (2015) | 163 | 153 | 129 | 87 |
| Rise of the Tomb Raider (2016) | 231 | 184 | 116 | 100 |
Barulho
| Ocioso |
| 32.6 / 32.7 / 32.7 dB |
| Carga |
| 33.3 / 45.2 dB |
 | ||
30 dB silencioso 40 dB(A) audível 50 dB(A) ruidosamente alto |
||
min: | ||
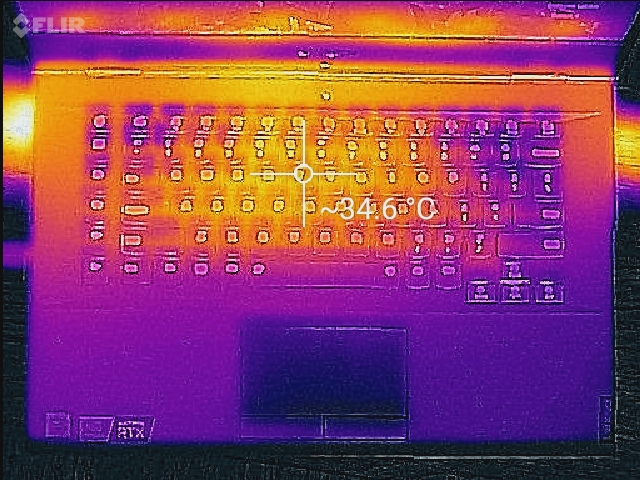
(+) A temperatura máxima no lado superior é 37.6 °C / 100 F, em comparação com a média de 40.4 °C / 105 F , variando de 21.2 a 68.8 °C para a classe Gaming.
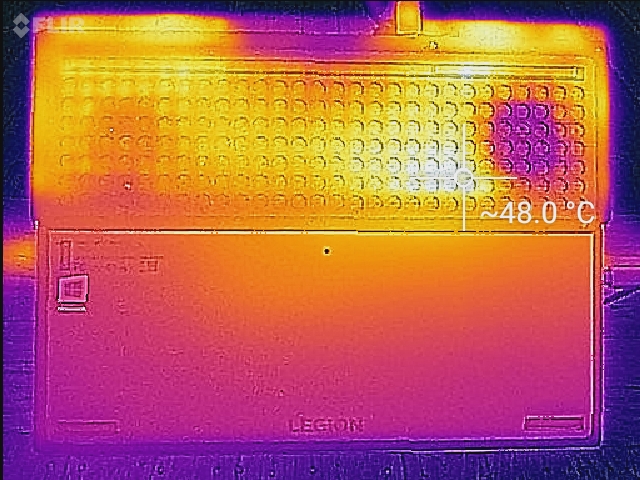
(-) A parte inferior aquece até um máximo de 45.2 °C / 113 F, em comparação com a média de 43.2 °C / 110 F
(+) Em uso inativo, a temperatura média para o lado superior é 28 °C / 82 F, em comparação com a média do dispositivo de 33.9 °C / ### class_avg_f### F.
(+) Jogando The Witcher 3, a temperatura média para o lado superior é 29.5 °C / 85 F, em comparação com a média do dispositivo de 33.9 °C / ## #class_avg_f### F.
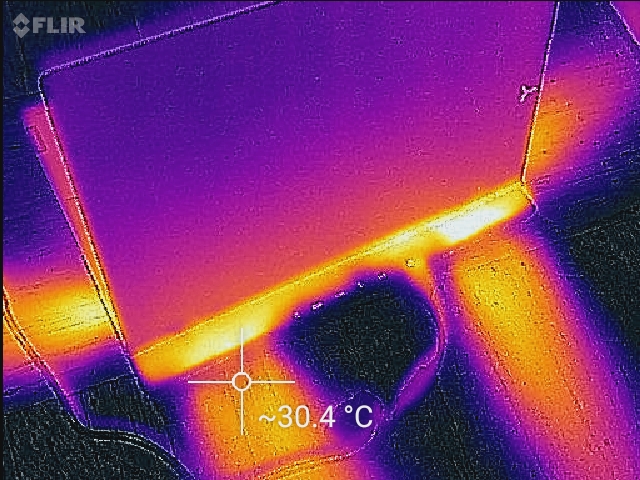
(+) Os apoios para as mãos e o touchpad são mais frios que a temperatura da pele, com um máximo de 29.2 °C / 84.6 F e, portanto, são frios ao toque.
(±) A temperatura média da área do apoio para as mãos de dispositivos semelhantes foi 28.8 °C / 83.8 F (-0.4 °C / -0.8 F).
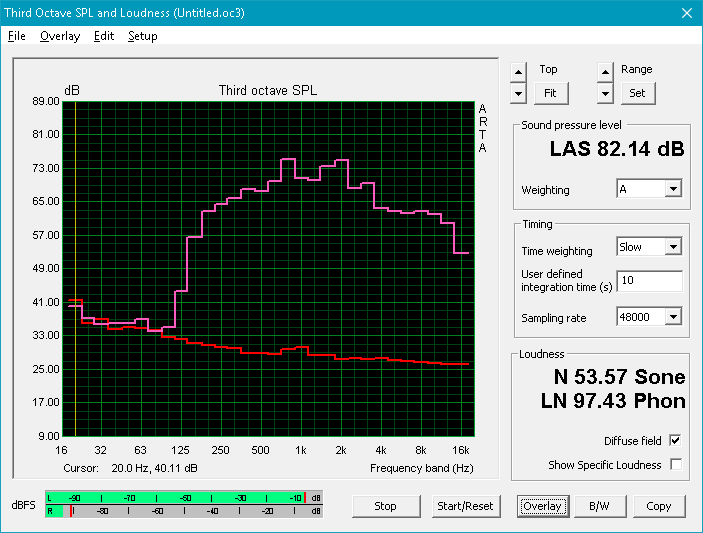
Lenovo Legion Y740-15ICHg análise de áudio
(+) | os alto-falantes podem tocar relativamente alto (###valor### dB)
Graves 100 - 315Hz
(±) | graves reduzidos - em média 10.2% menor que a mediana
(±) | a linearidade dos graves é média (14.7% delta para a frequência anterior)
Médios 400 - 2.000 Hz
(±) | médios mais altos - em média 6.7% maior que a mediana
(±) | a linearidade dos médios é média (7% delta para frequência anterior)
Altos 2 - 16 kHz
(+) | agudos equilibrados - apenas 2.6% longe da mediana
(+) | os máximos são lineares (6.5% delta da frequência anterior)
Geral 100 - 16.000 Hz
(±) | a linearidade do som geral é média (19.8% diferença em relação à mediana)
Comparado com a mesma classe
» 70% de todos os dispositivos testados nesta classe foram melhores, 6% semelhantes, 24% piores
» O melhor teve um delta de 6%, a média foi 18%, o pior foi 132%
Comparado com todos os dispositivos testados
» 51% de todos os dispositivos testados foram melhores, 7% semelhantes, 42% piores
» O melhor teve um delta de 4%, a média foi 23%, o pior foi 134%
Razer Blade 15 RTX 2070 Max-Q análise de áudio
(-) | alto-falantes não muito altos (###valor### dB)
Graves 100 - 315Hz
(±) | graves reduzidos - em média 7.7% menor que a mediana
(±) | a linearidade dos graves é média (11.1% delta para a frequência anterior)
Médios 400 - 2.000 Hz
(±) | médios mais altos - em média 7.8% maior que a mediana
(±) | a linearidade dos médios é média (9.5% delta para frequência anterior)
Altos 2 - 16 kHz
(+) | agudos equilibrados - apenas 3% longe da mediana
(±) | a linearidade dos máximos é média (7.2% delta para frequência anterior)
Geral 100 - 16.000 Hz
(±) | a linearidade do som geral é média (23.9% diferença em relação à mediana)
Comparado com a mesma classe
» 86% de todos os dispositivos testados nesta classe foram melhores, 5% semelhantes, 9% piores
» O melhor teve um delta de 6%, a média foi 18%, o pior foi 132%
Comparado com todos os dispositivos testados
» 72% de todos os dispositivos testados foram melhores, 6% semelhantes, 22% piores
» O melhor teve um delta de 4%, a média foi 23%, o pior foi 134%
| desligado | |
| Ocioso | |
| Carga |
|
Key:
min: | |
| Lenovo Legion Y740-15ICHg i7-8750H, GeForce RTX 2070 Max-Q, Samsung SSD PM981 MZVLB256HAHQ, IPS, 1920x1080, 15.6" | MSI GE75 8SF i7-8750H, GeForce RTX 2070 Mobile, Kingston RBUSNS8154P3256GJ1, IPS, 1920x1080, 17.3" | Gigabyte Aero 15-X9 i7-8750H, GeForce RTX 2070 Max-Q, Intel SSD 760p SSDPEKKW010T8, IPS, 1920x1080, 15.6" | Acer Predator Triton 500 i7-8750H, GeForce RTX 2080 Max-Q, 2x WDC PC SN720 SDAPNTW-256G-1014 (RAID 0), IPS, 1920x1080, 15.6" | Razer Blade 15 RTX 2070 Max-Q i7-8750H, GeForce RTX 2070 Max-Q, Samsung SSD PM981 MZVLB512HAJQ, IPS, 1920x1080, 15.6" | Alienware m15 GTX 1070 Max-Q i7-8750H, GeForce GTX 1070 Max-Q, Toshiba XG5 KXG50ZNV512G, IPS, 1920x1080, 15.6" | HP Omen 15-dc0015ng i7-8750H, GeForce GTX 1070 Max-Q, Toshiba XG5 KXG50ZNV512G, IPS, 1920x1080, 15.6" | Lenovo Legion Y730-15ICH i5-8300H i5-8300H, GeForce GTX 1050 Ti Mobile, Intel Optane 16 GB MEMPEK1J016GAL + HGST ST1000LM049 1 TB HDD, IPS, 1920x1080, 15.6" | |
|---|---|---|---|---|---|---|---|---|
| Power Consumption | -6% | 14% | 3% | 19% | 23% | 1% | 34% | |
| Idle Minimum * (Watt) | 22.9 | 16.4 28% | 16 30% | 16 30% | 10.4 55% | 7.6 67% | 14 39% | 8 65% |
| Idle Average * (Watt) | 27.2 | 21.9 19% | 18 34% | 22 19% | 14.6 46% | 13.8 49% | 18.2 33% | 11.8 57% |
| Idle Maximum * (Watt) | 27.5 | 25.4 8% | 23 16% | 32 -16% | 16.3 41% | 14.6 47% | 24 13% | 13.1 52% |
| Load Average * (Watt) | 83.4 | 90.7 -9% | 88 -6% | 89 -7% | 88.5 -6% | 97.6 -17% | 143 -71% | 90.2 -8% |
| Witcher 3 ultra * (Watt) | 143.6 | 203.3 -42% | 120 16% | 147 -2% | 155.4 -8% | 145.8 -2% | 126 12% | 107.8 25% |
| Load Maximum * (Watt) | 160.5 | 222.9 -39% | 167 -4% | 173 -8% | 182.4 -14% | 172.5 -7% | 190 -18% | 136.2 15% |
* ... menor é melhor
| Lenovo Legion Y740-15ICHg i7-8750H, GeForce RTX 2070 Max-Q, 57 Wh | MSI GE75 8SF i7-8750H, GeForce RTX 2070 Mobile, 65 Wh | Gigabyte Aero 15-X9 i7-8750H, GeForce RTX 2070 Max-Q, 94.24 Wh | Acer Predator Triton 500 i7-8750H, GeForce RTX 2080 Max-Q, 82 Wh | Razer Blade 15 RTX 2070 Max-Q i7-8750H, GeForce RTX 2070 Max-Q, 80 Wh | Alienware m15 GTX 1070 Max-Q i7-8750H, GeForce GTX 1070 Max-Q, 90 Wh | HP Omen 15-dc0015ng i7-8750H, GeForce GTX 1070 Max-Q, 70.07 Wh | Lenovo Legion Y730-15ICH i5-8300H i5-8300H, GeForce GTX 1050 Ti Mobile, 57 Wh | |
|---|---|---|---|---|---|---|---|---|
| Duração da bateria | 25% | 176% | 44% | 137% | 152% | 104% | 87% | |
| Reader / Idle (h) | 3.9 | 9.2 136% | 5.6 44% | 11.4 192% | 10.5 169% | 7.7 97% | 9.6 146% | |
| WiFi v1.3 (h) | 2.8 | 3.5 25% | 6.4 129% | 3.2 14% | 6.5 132% | 7.7 175% | 4.6 64% | 5.3 89% |
| Load (h) | 0.8 | 2.9 262% | 1.4 75% | 1.5 88% | 1.7 113% | 2 150% | 1 25% |
Pro
Contra
Embora ainda tenha sua parcela de inadequações, o Y740-15ICHg elimina cerca de metade das queixas originais que apresentamos sobre seu predecessor direto, o Y730-15ICH. O novo painel da tela melhora consideravelmente os tempos de resposta em preto e branco e apresenta uma taxa de atualização de 144 Hz (para o NVIDIA G-Sync). Além disso, a limitação da GPU foi levantada; o RTX 2070 Max-Q é mais de duas vezes mais veloz que o anterior GeForce GTX 1050 Ti. Tudo isto é conseguido sem um aumento substancial no ruído do ventilador do sistema, embora as temperaturas da superfície tenham certamente aumentado notavelmente.
Outras vitórias notáveis para o Legion Y740-15ICHg incluem desempenho de CPU muito potente, tanto de curto prazo quanto sustentado, bem como desempenho geral rápido do sistema graças à combinação com um SSD NVMe Samsung PM981. A máquina se esforça para lidar com o estresse do sistema sintético combinado, mas o estresse da CPU e da GPU, de forma independente, não apresenta problemas, e os jogar jogos normais do mundo real, é tranquilo. É verdade que é improvável que os jogadores alcancem taxas de quadros estáveis de 144 fps+ sem reduzir a qualidade para configurações médias ou baixas na maioria dos jogos, mas ainda é bom ter essa opção.
Embora fique aquém das áreas de portabilidade e dispositivos de entrada, o Lenovo Legion Y740-15ICHg é uma melhoria significativa em relação ao seu antecessor, lidando facilmente com a maioria dos jogos com calma e sem criar um buraco na carteira.
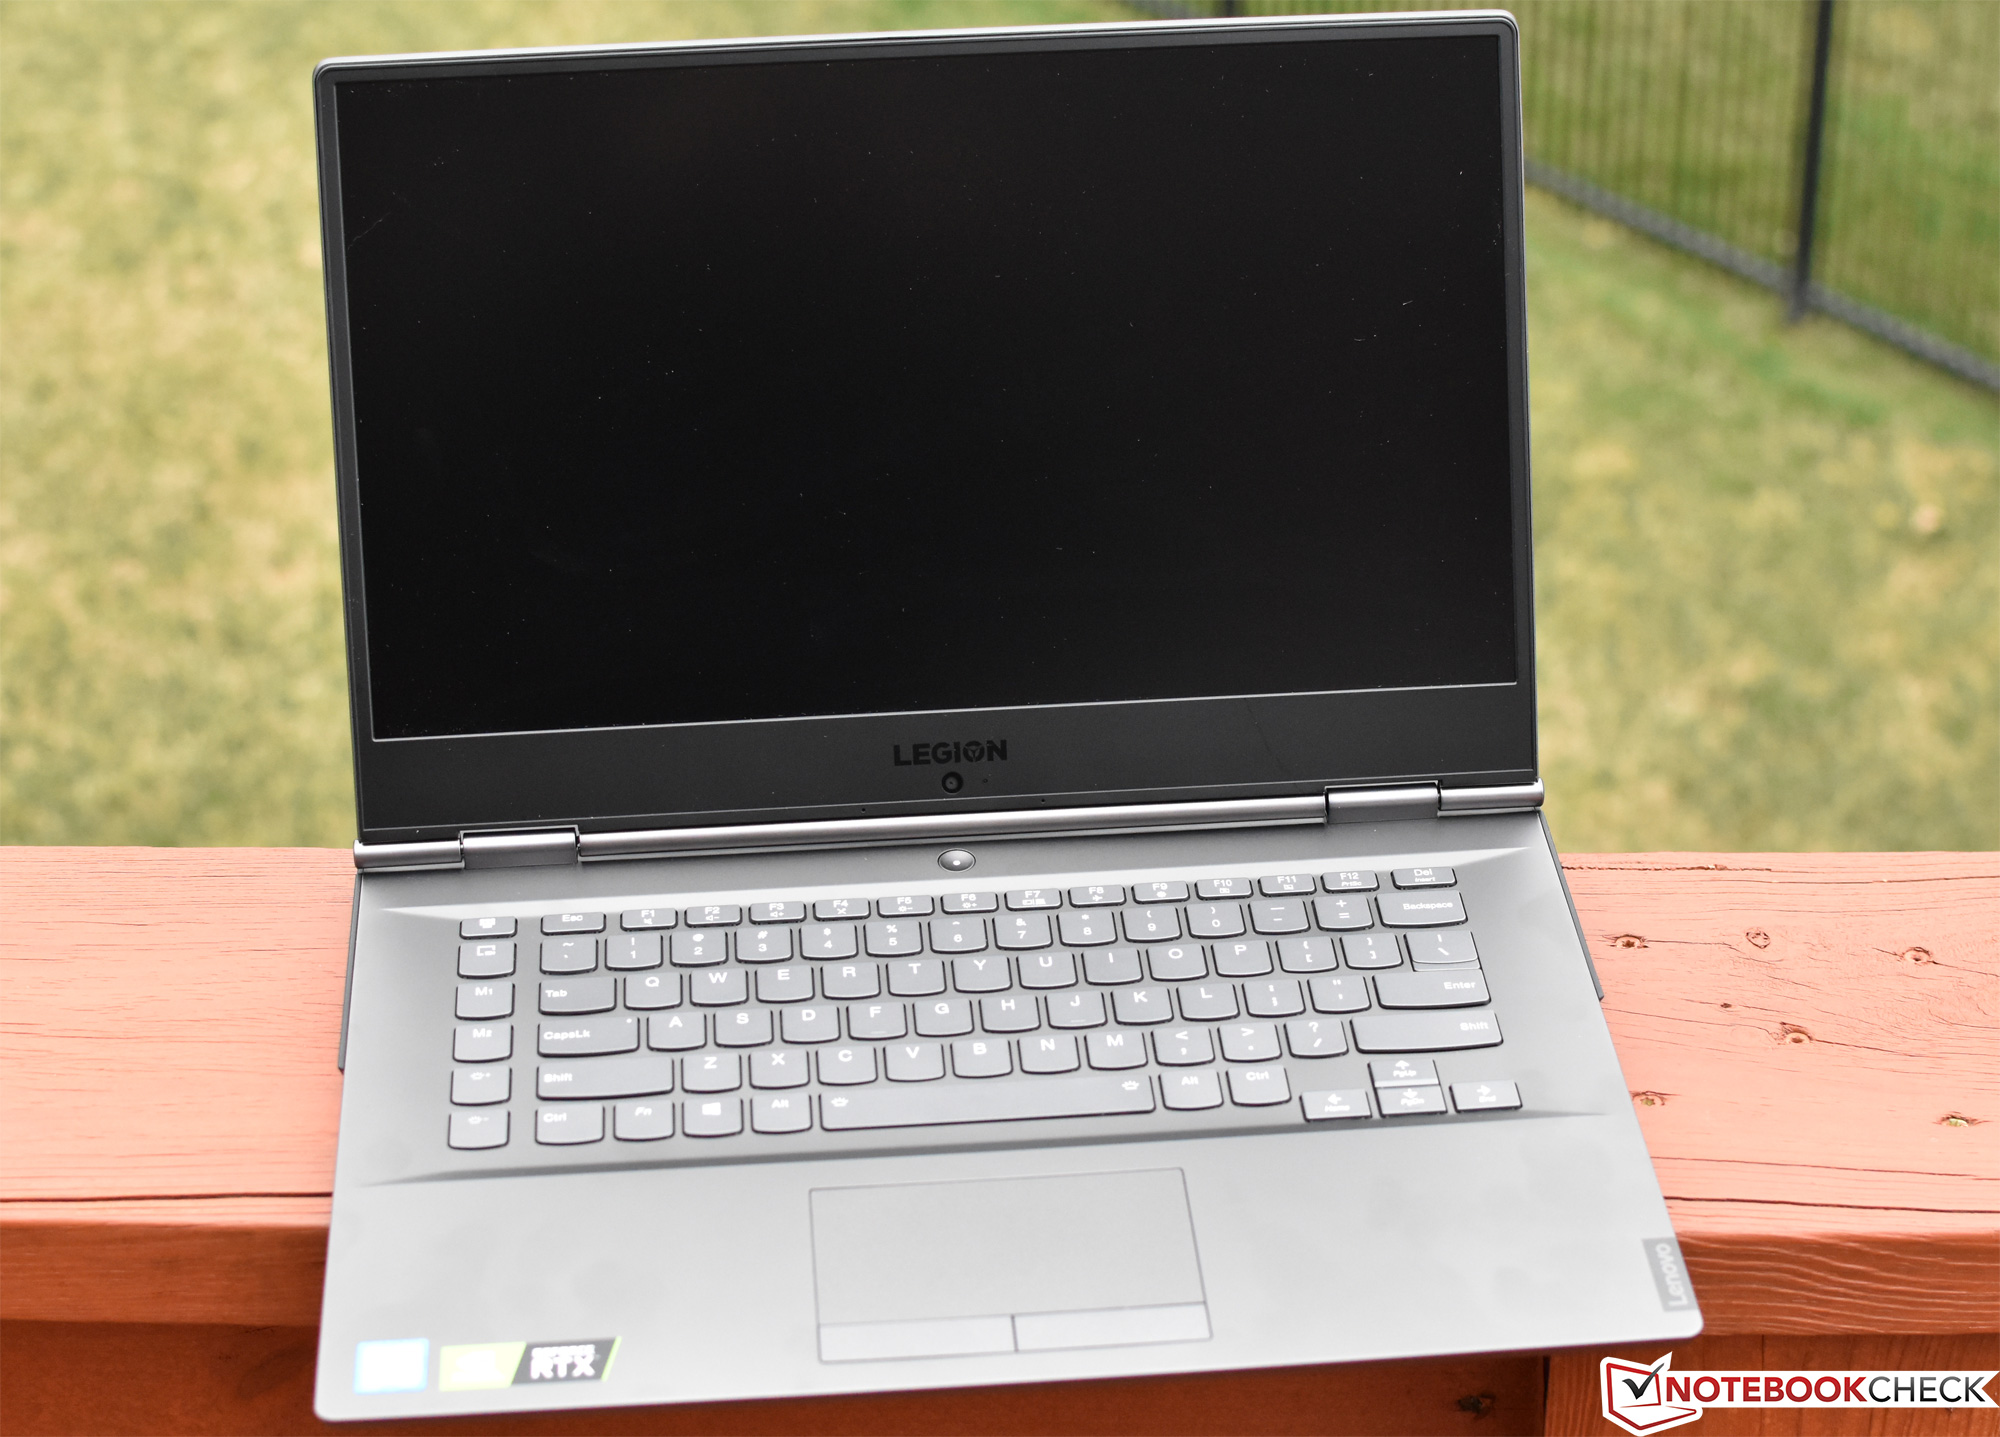
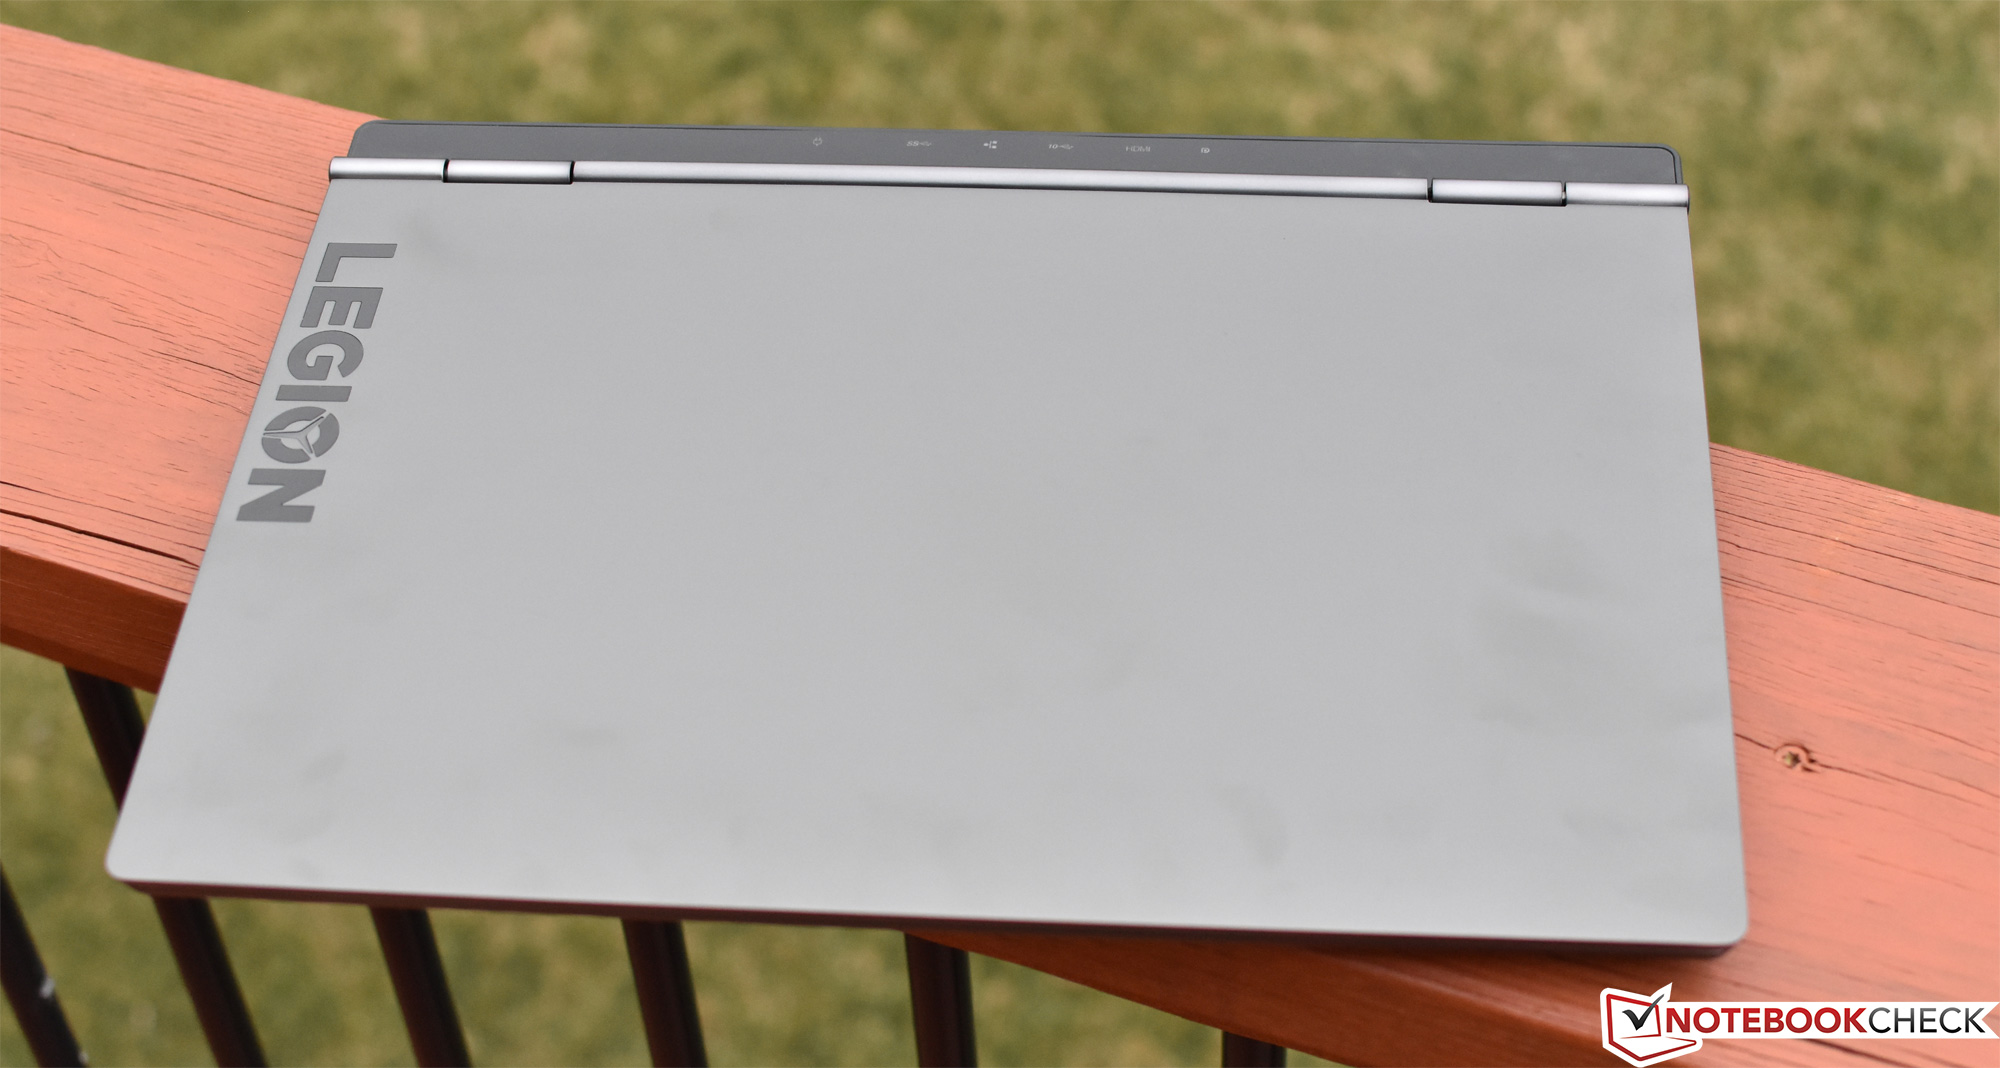
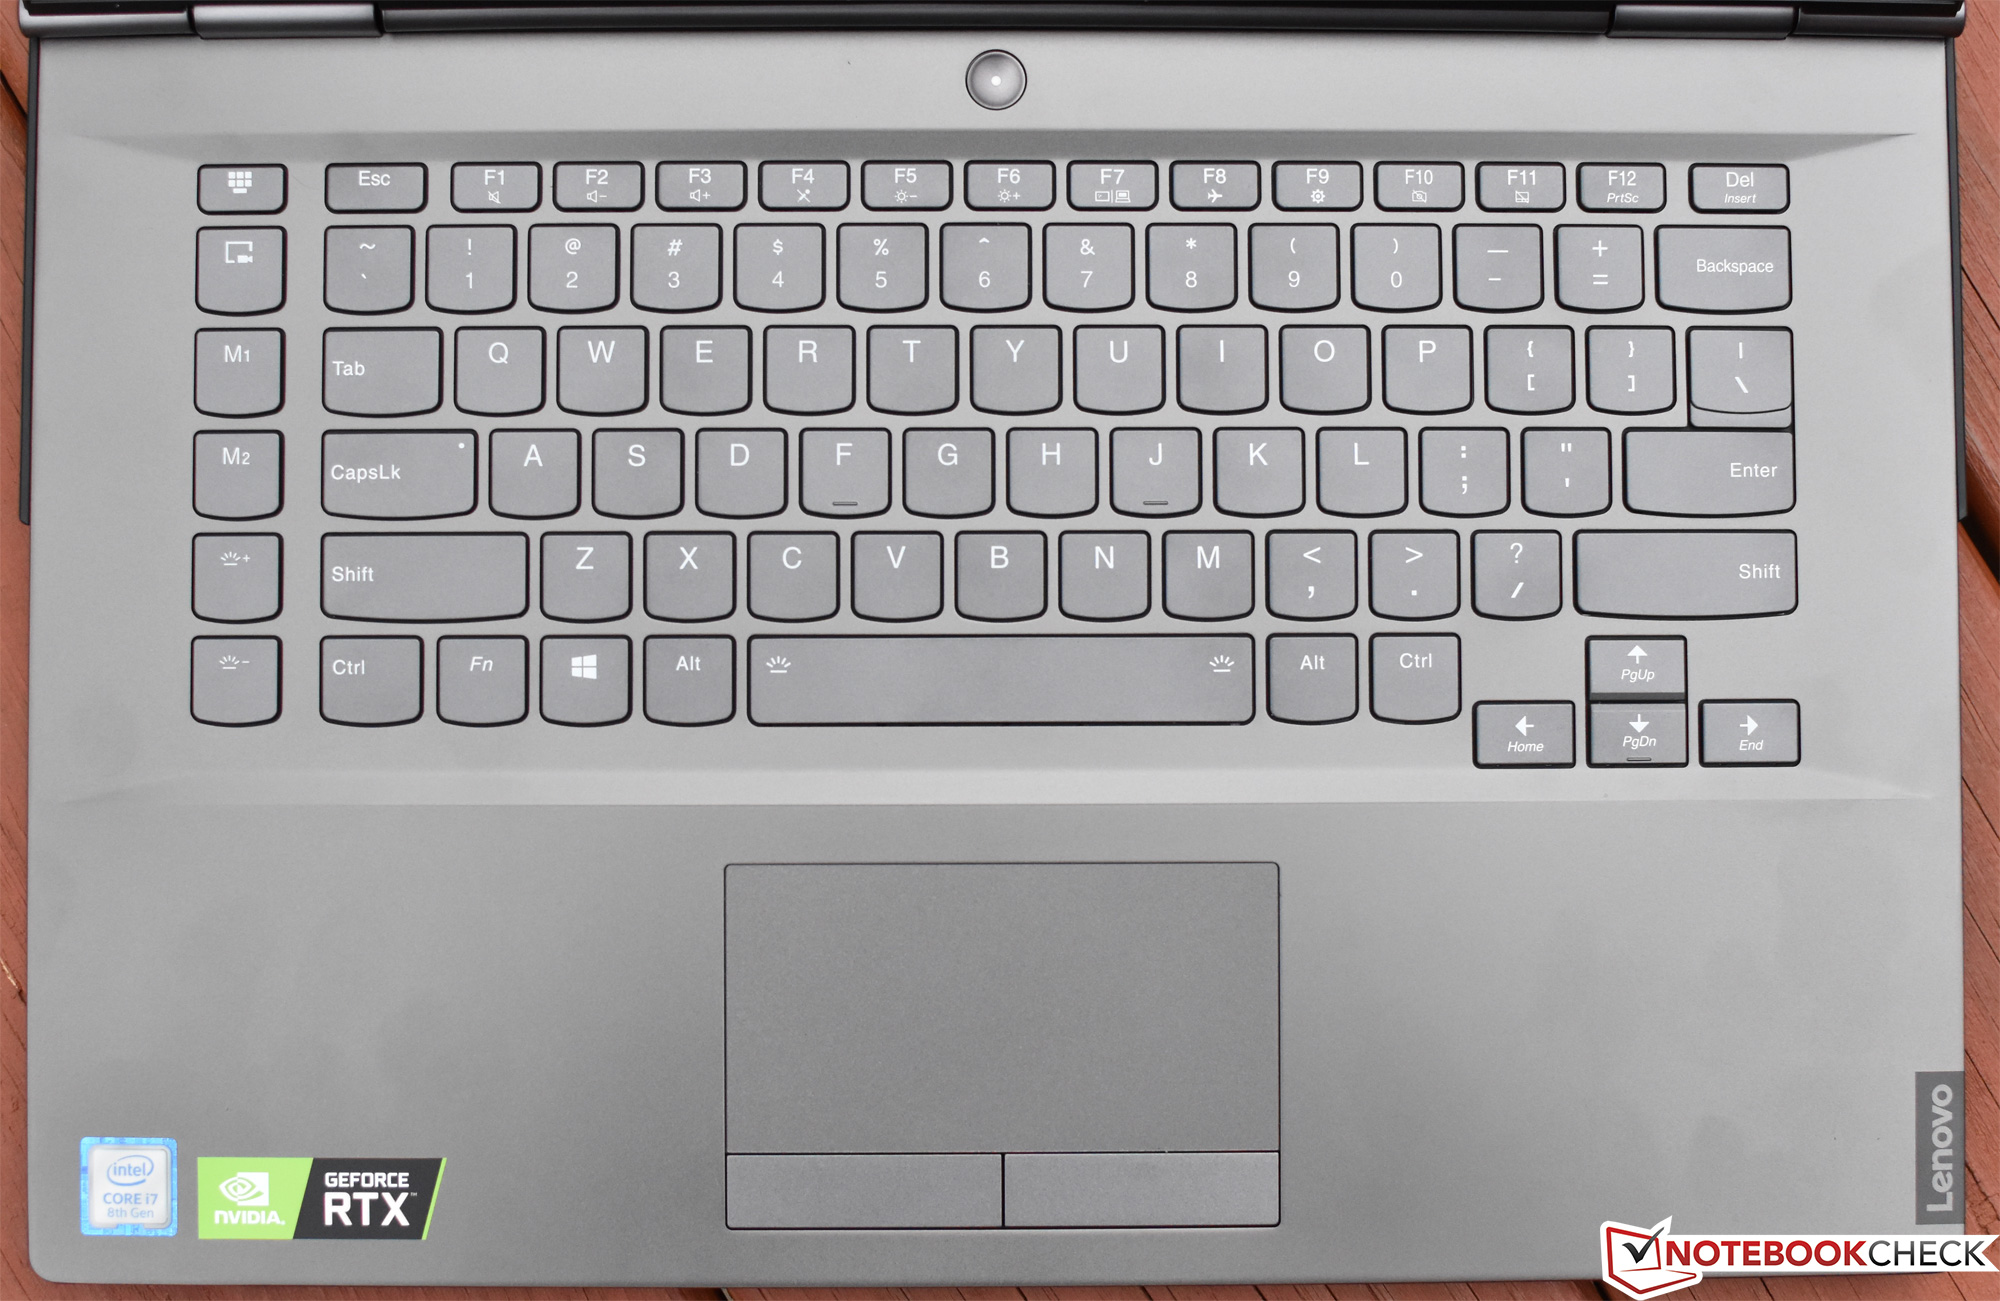
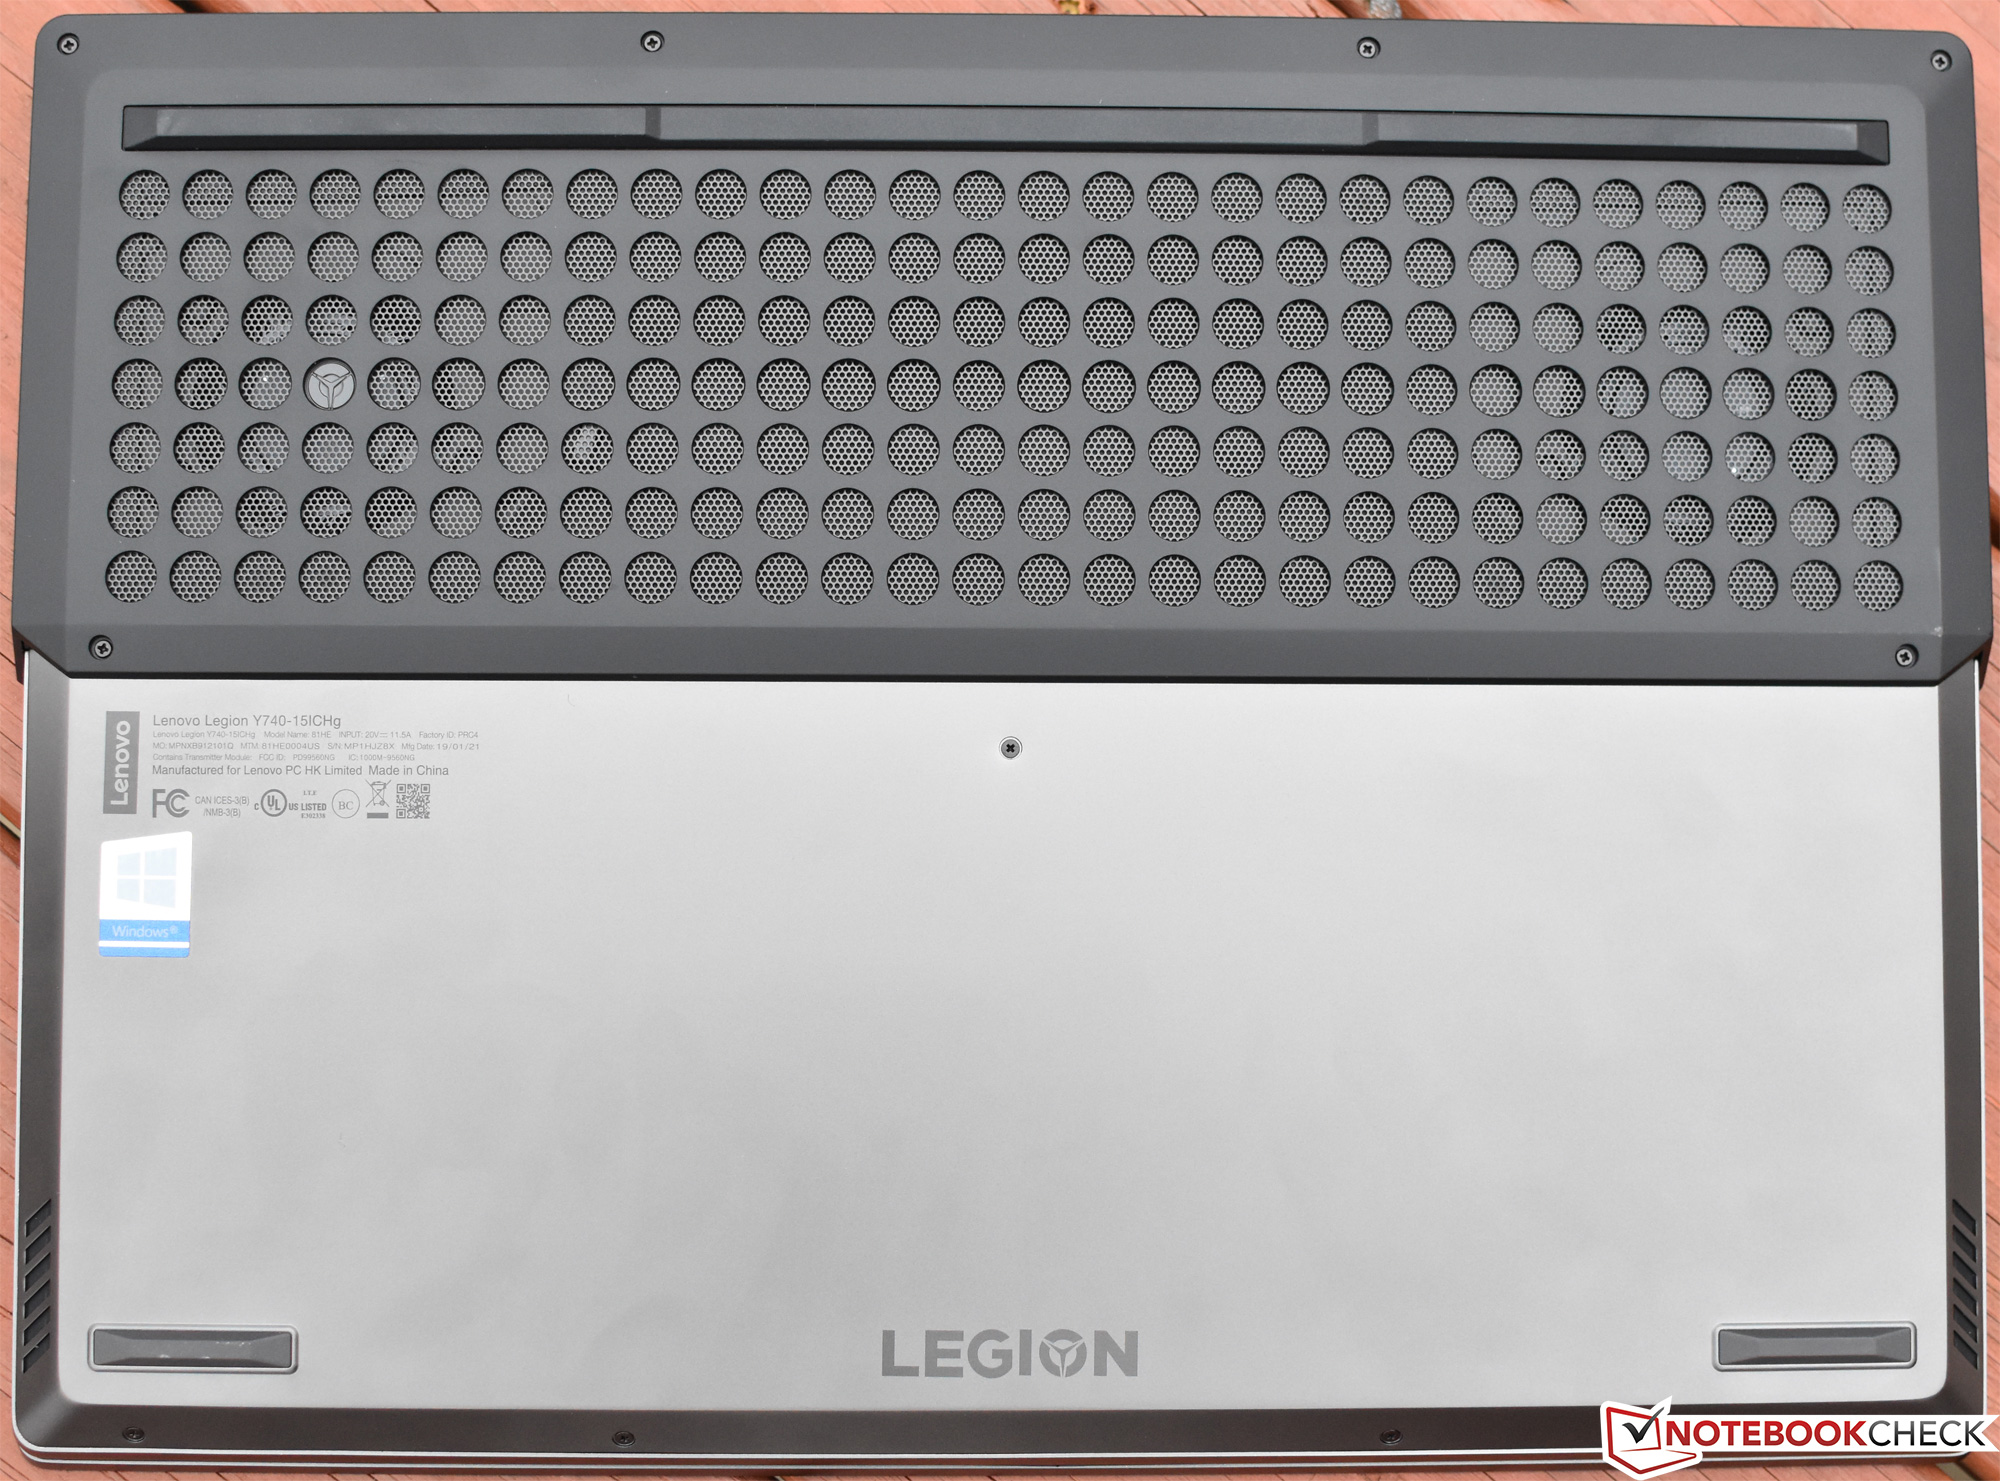
O design, embora não convencional, tem sucesso estético e ao mesmo tempo, embora, do ponto de vista da durabilidade, deixa algo a desejar. A tampa da tela, em particular, é mais flexível do que gostaríamos e o dispositivo se flexiona sob uma pressão moderada no centro da unidade base. Os dispositivos de entrada são meramente decentes; o deslocamento curto das teclas e a resposta esponjosa do teclado e a força de atuação cansativa dos botões do touchpad são facilmente superados pelos principais concorrentes (como o XPS 15 e MSI GS60). A manutenção é relativamente simples.
O Legion Y740-15ICH tem um bom preço, com um preço recomendado pelo fabricante de $1990 para nossa configuração (com um desconto que baixa até aproximadamente $1.752 até o momento da redação deste texto). Ele é poderoso o suficiente para rodar praticamente todos os jogos modernos em configurações altas, resolução nativa FHD com mais de 60 fps. A concorrência inclui o Alienware m15, Razer Blade 15, Acer Predator Triton 500, e MSI GE75, todos os quais carregam seus próprios prós e contras. Tudo somado, no entanto, o Y740 representa uma melhoria substancial em relação ao seu antecessor, e uma consideração séria para aqueles que procuram um portátil de jogos capaz que lida com os principais desafios sem criar um buraco em sua carteira.
Lenovo Legion Y740-15ICHg
- 09/20/2019 v7 (old)
Steve Schardein
Price comparison
