

Notebookcheck Logo

Breve Análise do Portátil Lenovo Legion Y730-15ICH (i5-8300H, GTX 1050 Ti)

Flagship features, mainstream price.

O Legion Y730 é a alternativa mais sofisticada para o Legion Y530 e o Legion Y7000, com características de carro-chefe, incluindo iluminação RGB por tecla, Thunderbolt 3 e teclas Macro dedicadas. É uma pena que os SKUs atuais estejam limitados à GeForce GTX 1050 Ti.
Lenovo Legion Y730-15ICH i5-8300H (Legion Y730-15 Serie)
Processador
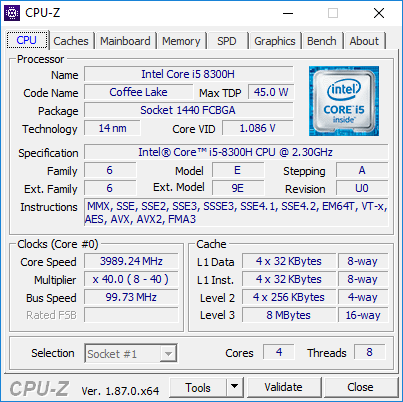
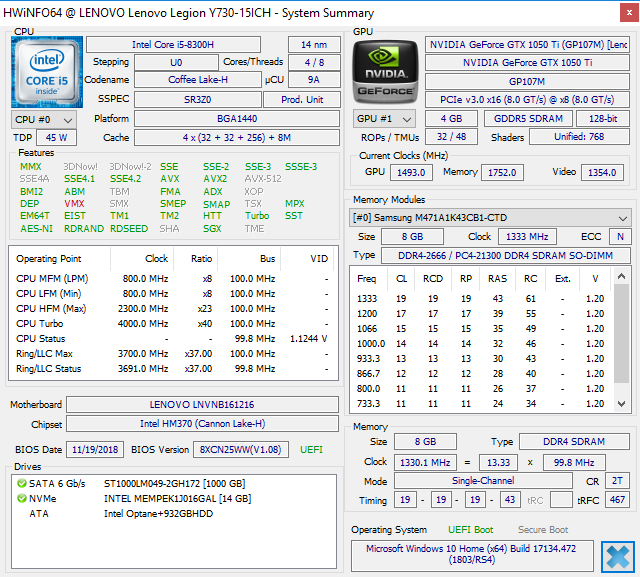
Intel Core i5-8300H 4c/8t 4 x 2.3 - 4 GHz, Coffee Lake-H
Placa gráfica
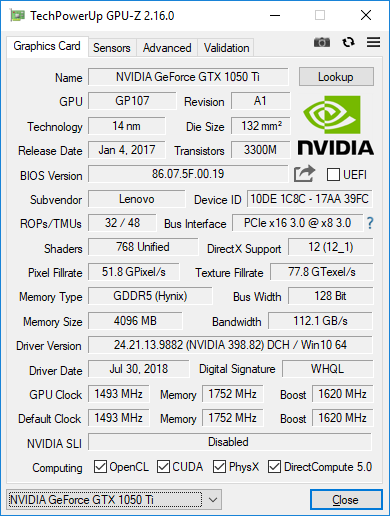
NVIDIA GeForce GTX 1050 Ti Mobile - 4 GB VRAM, Análises do: 1493 MHz, Memoría: 7008 MHz, GDDR5, 398.82, Nvidia Optimus
Memória
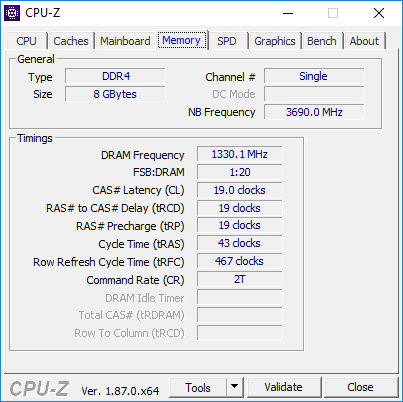
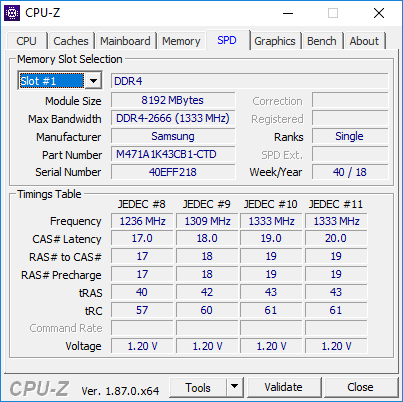
8 GB 
, DDR4-2666, PC4-21300, 19-19-19-43, Single-Channel
Pantalha
15.60 polegadas 16:9, 1920 x 1080 pixel 141 PPI, BOE NV156FHM-N61, IPS, BOE06FB, Brilhante: não
placa mãe
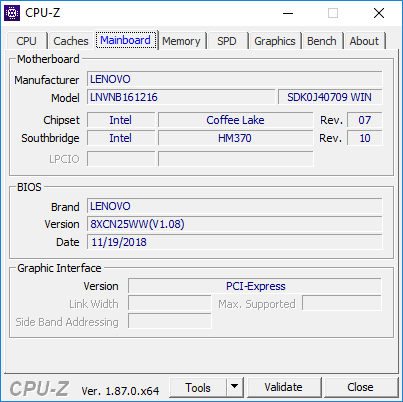
Intel HM370
Disco rígido
Intel Optane 16 GB MEMPEK1J016GAL + HGST ST1000LM049 1 TB HDD, 2 baias de armazenamento
Placa de Som
Intel Cannon Lake-H/S - cAVS (Audio, Voice, Speech)
Conexões
4 USB 3.0, 3 USB 3.1 Gen2, 1 Thunderbolt, 1 HDMI, 1 DisplayPort, 1 Kensington Lock, Conexões Audio: 3.5 mm combo
Funcionamento em rede
Realtek RTL8168/8111 Gigabit-LAN (10/100/1000MBit/s), Intel Wireless-AC 9560 (a/b/g/n = Wi-Fi 4/ac = Wi-Fi 5/), Bluetooth 5.0
Tamanho
altura x largura x profundidade (em mm): 19.95 x 362 x 267
Bateria
57 Wh Lítio-Polímero, 3 células
Sistema Operativo
Microsoft Windows 10 Home 64 Bit
Câmera
Webcam: 720p
Características adicionais
Alto falantes: Estéreo, Teclado: Chiclet, Iluminação do Teclado: sim, Lenovo Vantage, Utility, 12 Meses Garantia
peso
2.2 kg, Suprimento de energia: 571 g
Preço
1000 USD
Nota: O fabricante pode utilizar componentes de diferentes fornecedores, incluindo painéis de exibição, unidades ou cartões de memória com especificações semelhantes.


❌
389 mm 274.7 mm 24.95 mm 2.6 kg384 mm 262 mm 25 mm 2.3 kg365 mm 260 mm 24 mm 2.3 kg362.5 mm 225 mm 23 mm 2 kg362 mm 267 mm 19.95 mm 2.2 kg359 mm 254 mm 21.7 mm 1.9 kg355 mm 235 mm 19.9 mm 2 kg297 mm 210 mm 1 mm 5.7 g
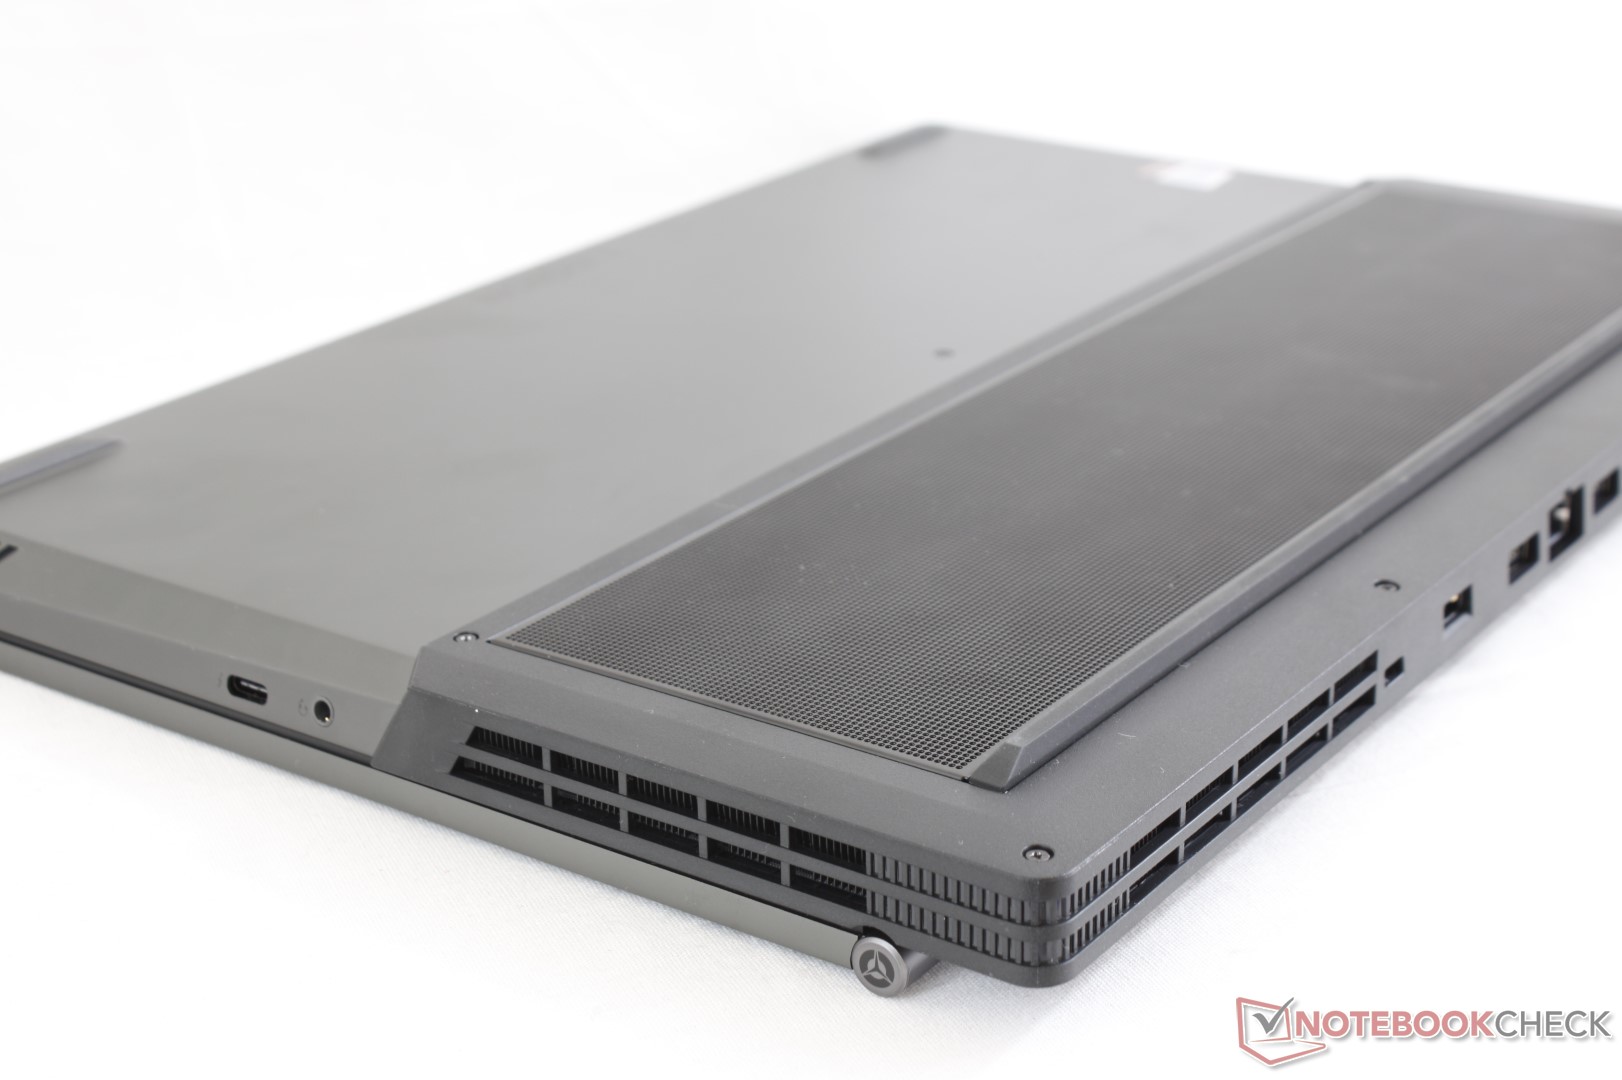
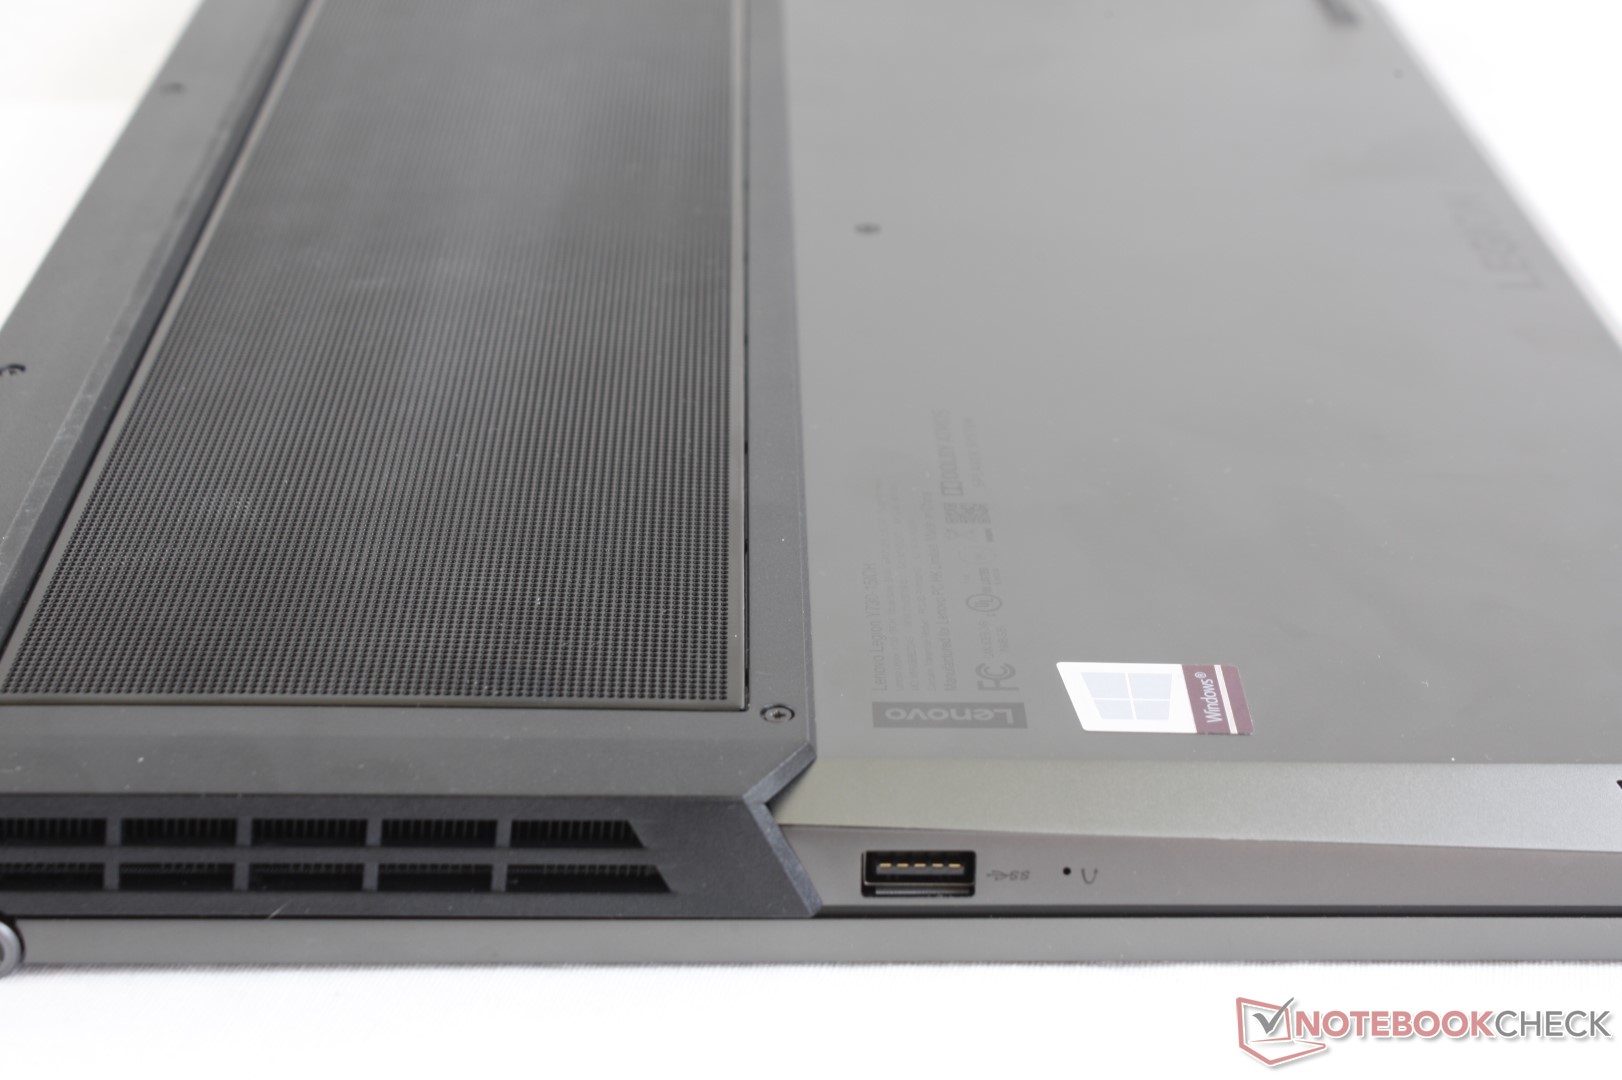
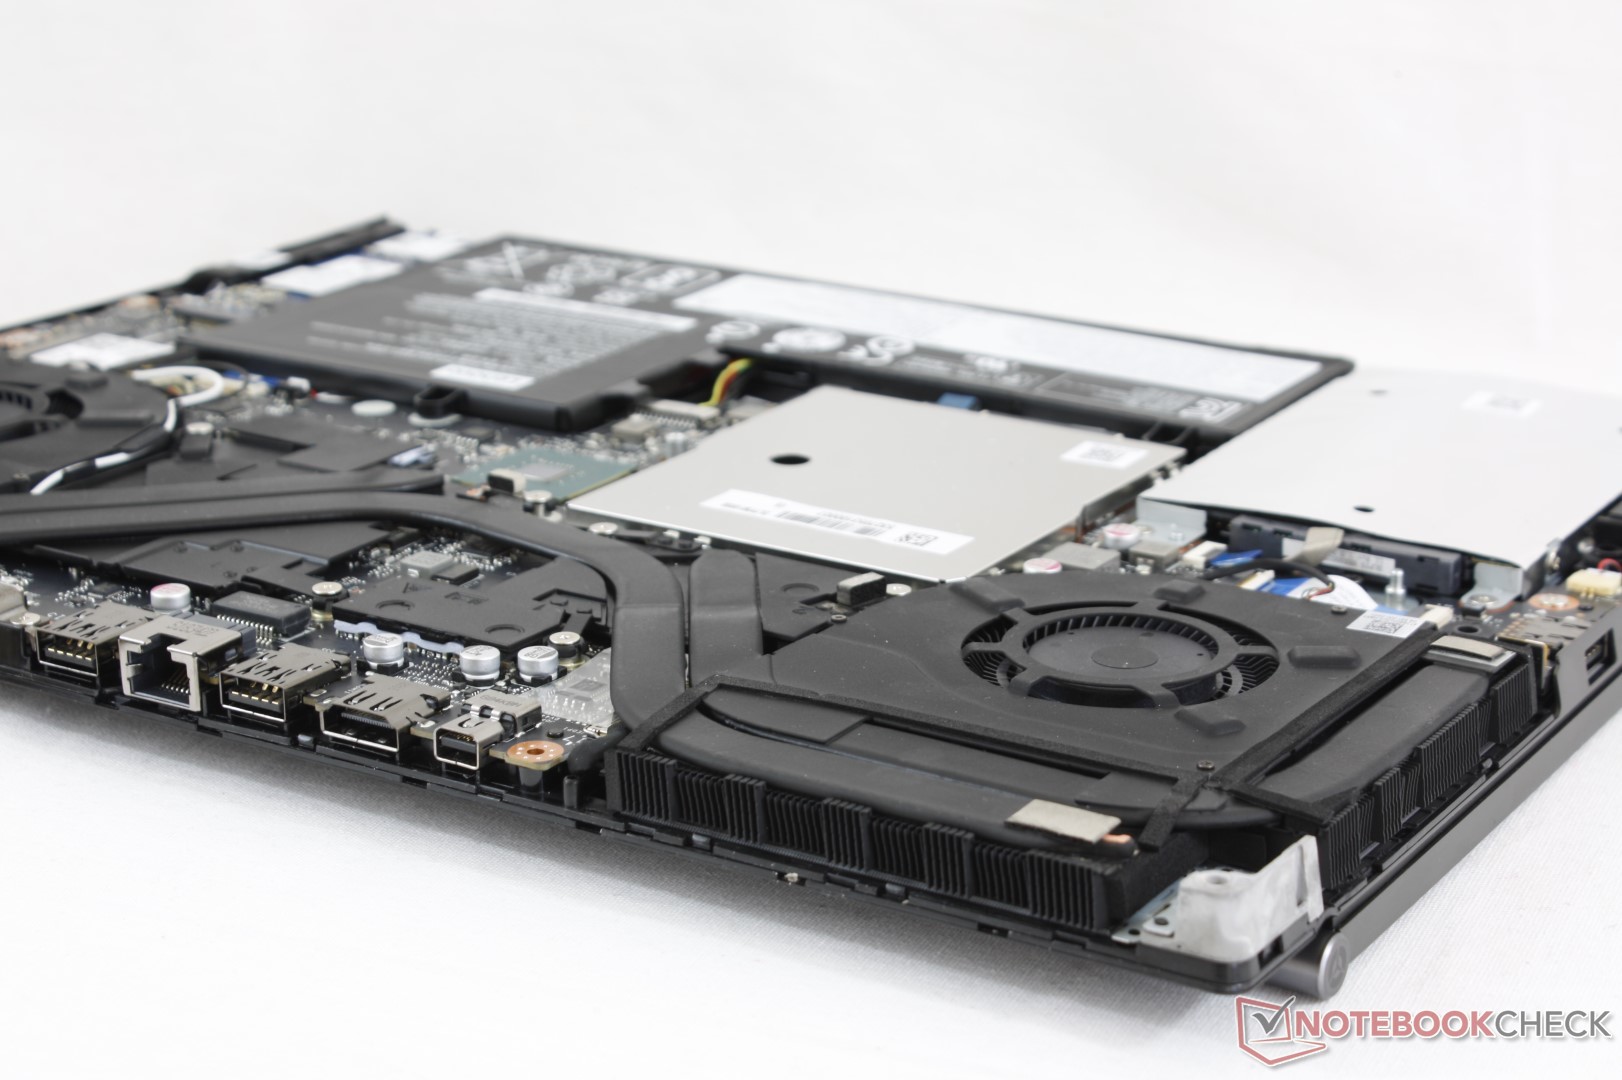
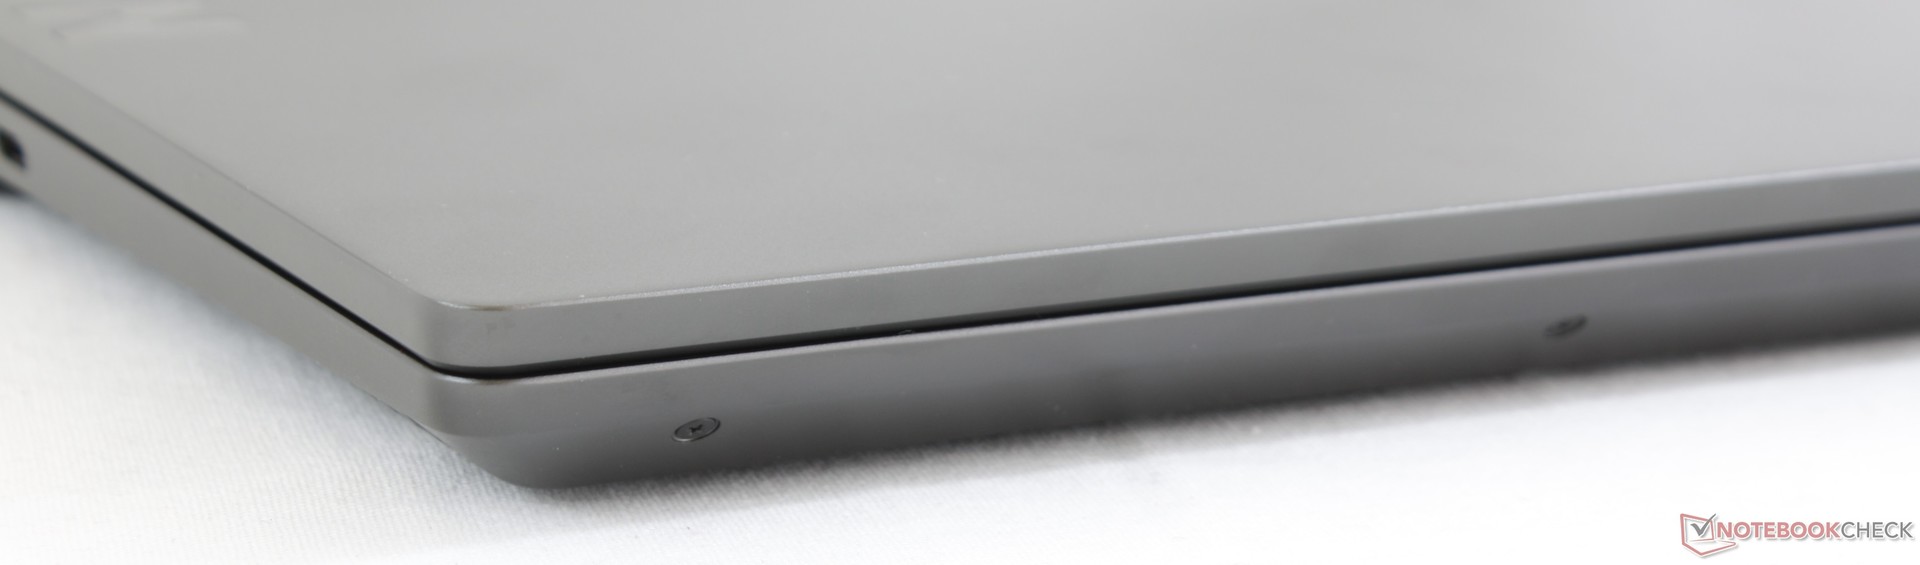
Front: No connectivity
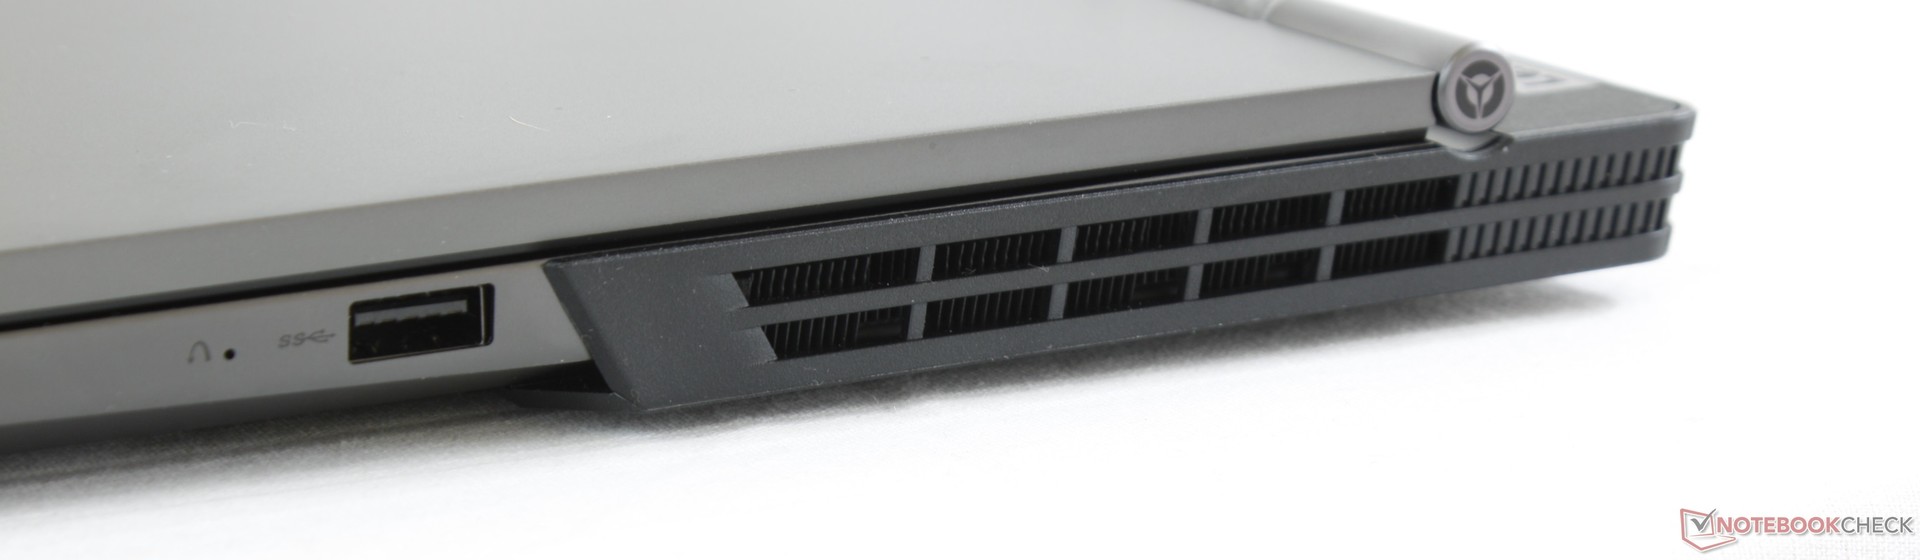
Right: USB 3.1 Gen. 1
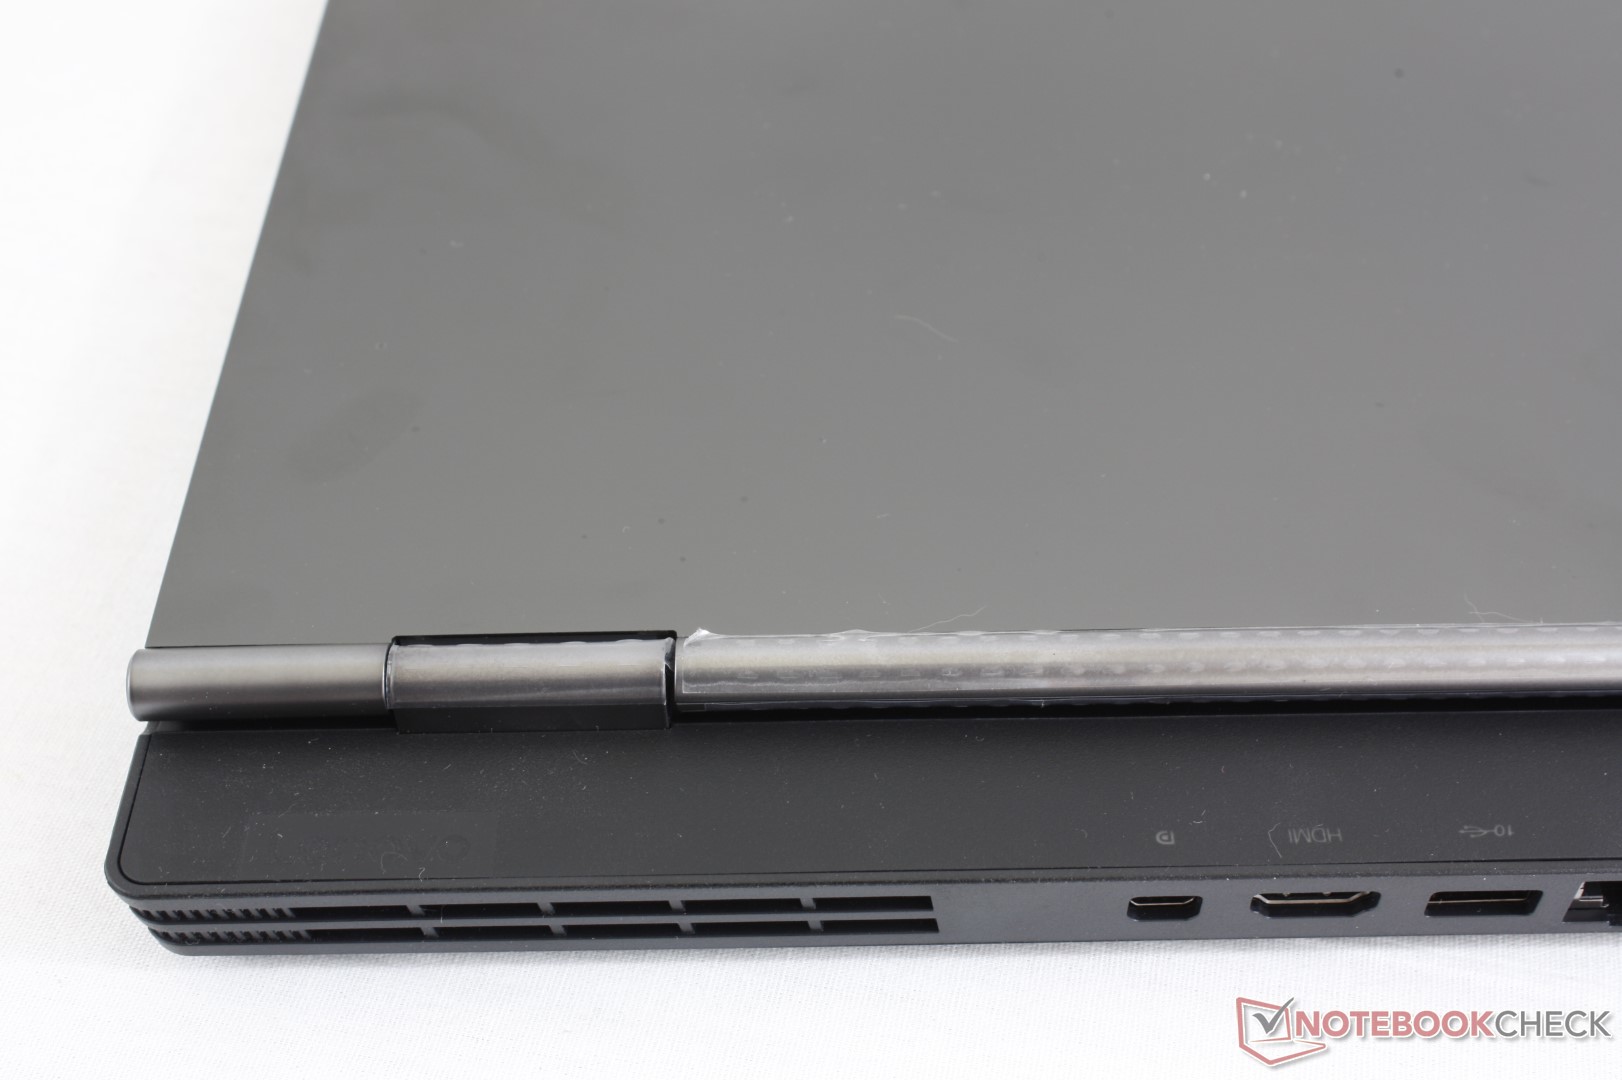
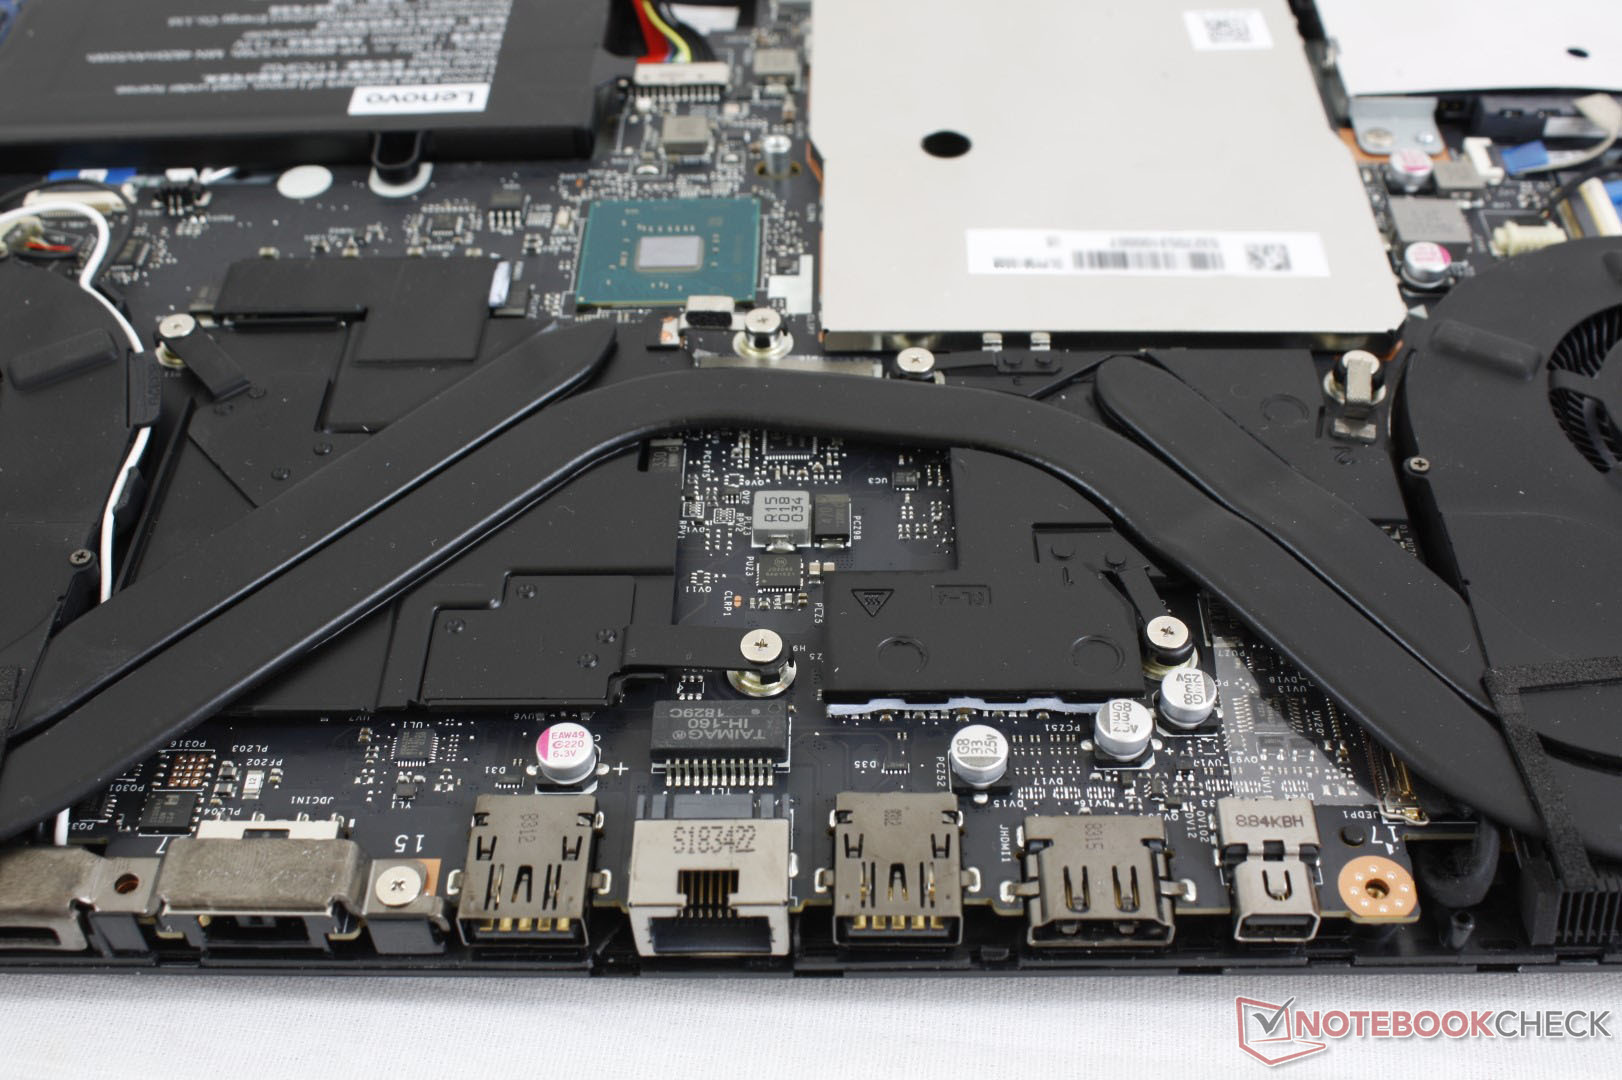
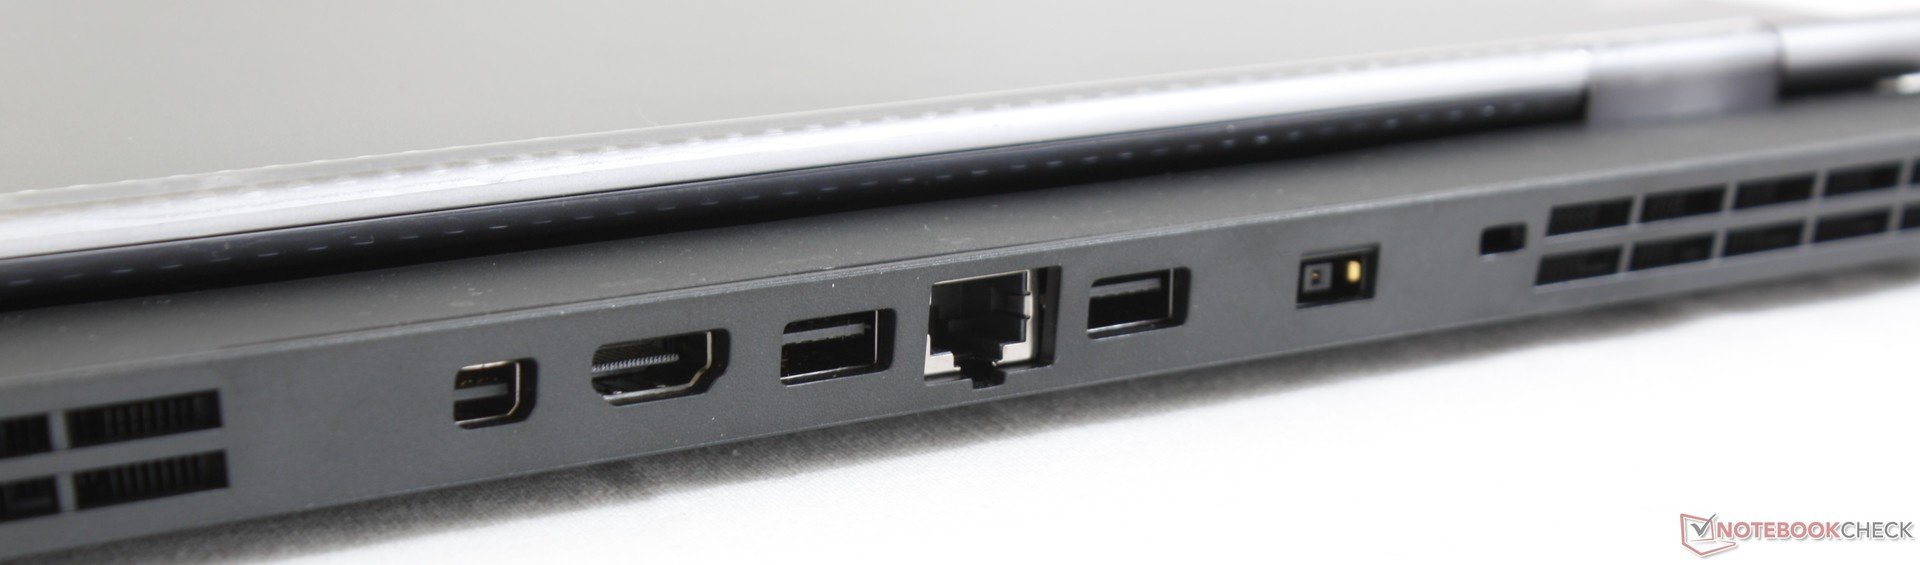
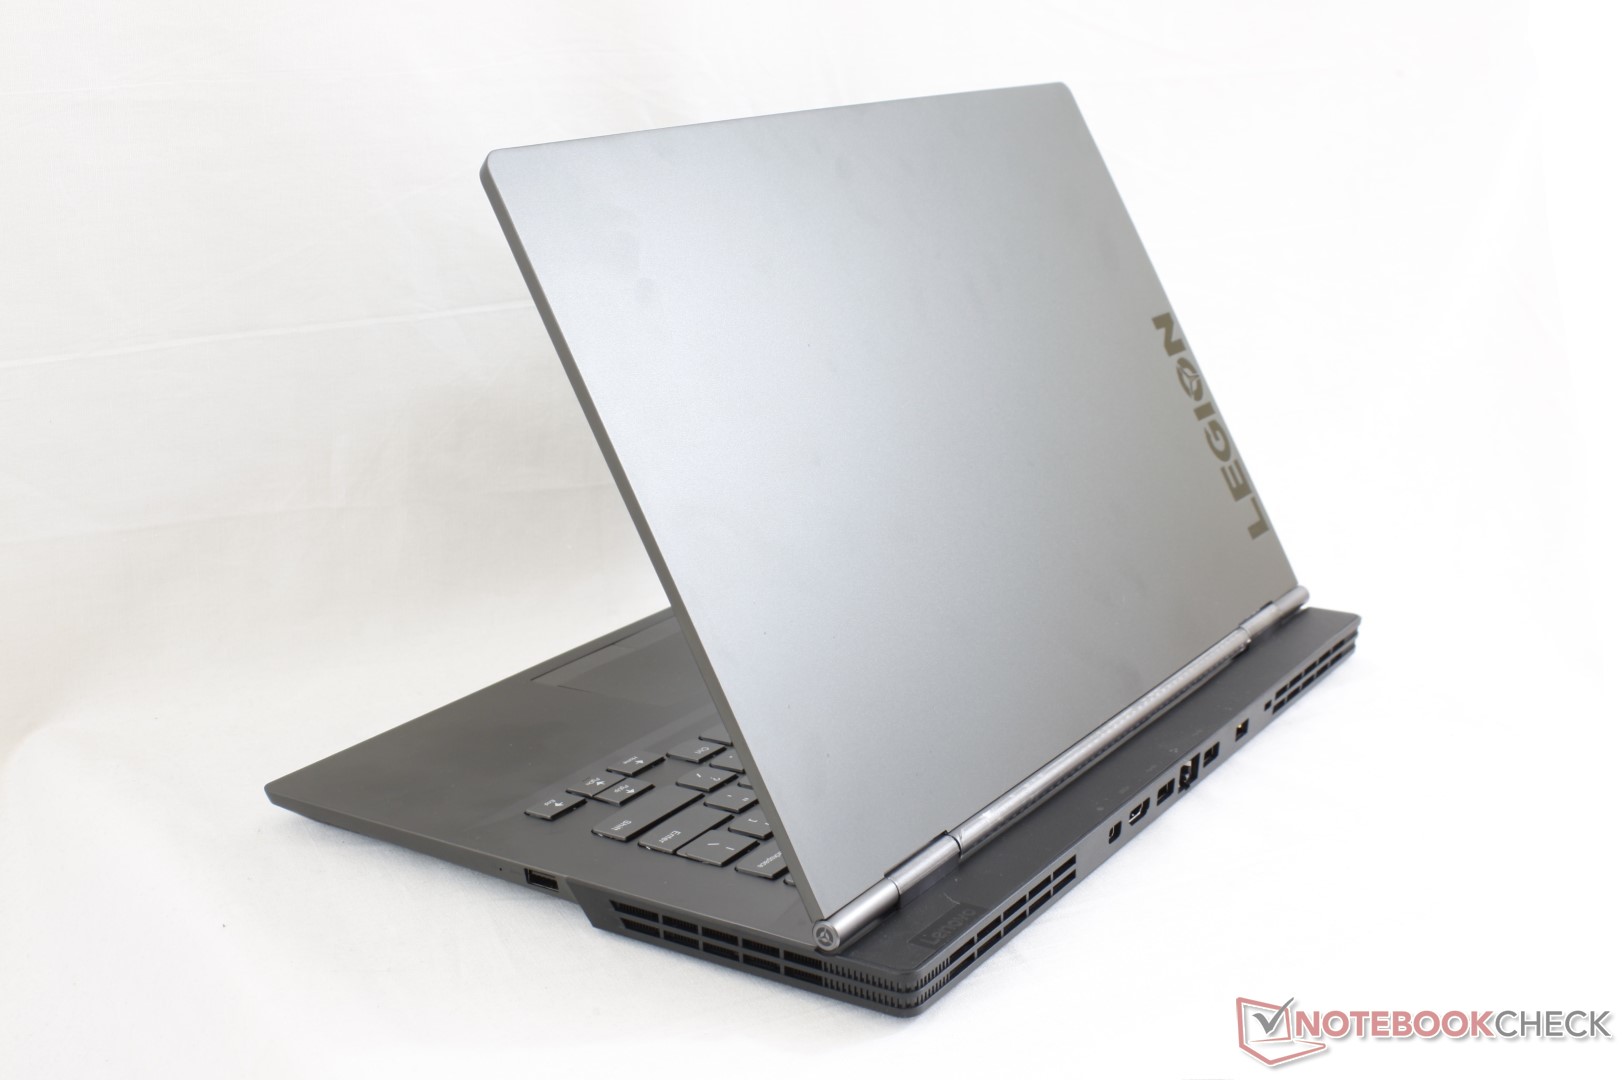
Rear: 2 x USB 3.1 Gen. 2, RJ-45, Mini DisplayPort 1.4, HDMI 2.0, Kensington Lock, AC adapter
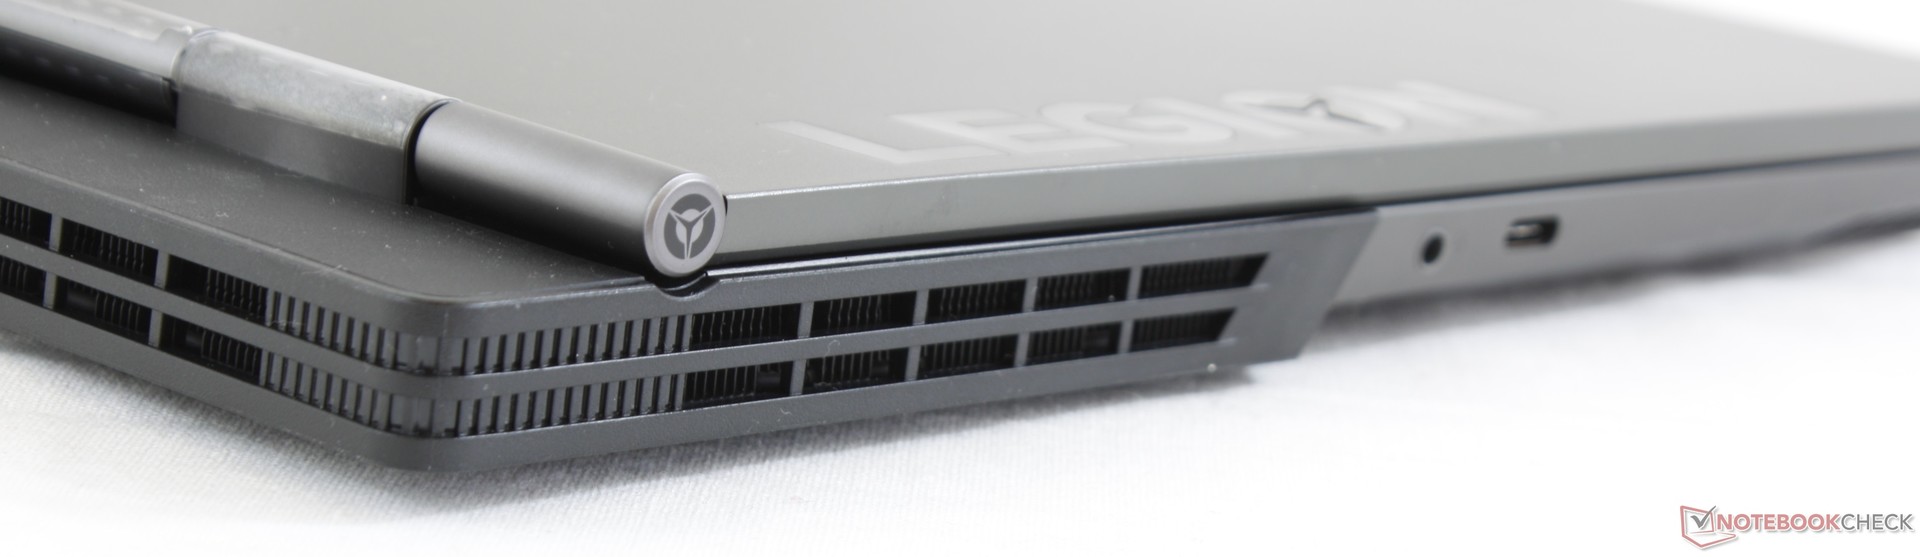
Left: USB Type-C w/ Thunderbolt 3, 3.5 mm combo audio
Networking
iperf3 transmit AX12
Lenovo Legion Y730-15ICH i5-8300H
Intel Wireless-AC 9560
721 MBit/s
Razer Blade 15 Base Model
Intel Wireless-AC 9260
653 MBit/s -9%
Dell G7 15-7588
Intel Wireless-AC 9560
642 MBit/s -11%
Lenovo Legion Y530-15ICH
Intel Dual Band Wireless-AC 3165
144 (113min - 190max) MBit/s -80%
iperf3 receive AX12
Razer Blade 15 Base Model
Intel Wireless-AC 9260
666 MBit/s +8%
Dell G7 15-7588
Intel Wireless-AC 9560
660 MBit/s +7%
Lenovo Legion Y730-15ICH i5-8300H
Intel Wireless-AC 9560
619 MBit/s
Lenovo Legion Y530-15ICH
Intel Dual Band Wireless-AC 3165
293 (186min - 315max) MBit/s -53%
271.1
cd/m²
283.7
cd/m²
280.1
cd/m²
257.1
cd/m²
286.5
cd/m²
275.2
cd/m²
240.5
cd/m²
272.4
cd/m²
252.8
cd/m²
Distribuição do brilho
BOE NV156FHM-N61 testado com X-Rite i1Pro 2
Máximo: 286.5 cd/m² (Nits) Médio: 268.8 cd/m² Minimum: 3.95 cd/m²
iluminação: 84 %
iluminação com acumulador: 286.5 cd/m²
Contraste: 868:1 (Preto: 0.33 cd/m²)
ΔE ColorChecker Calman: 6.3 | ∀{0.5-29.43 Ø4.69}
calibrated: 4.17
ΔE Greyscale Calman: 5.6 | ∀{0.09-98 Ø4.94}
85.1% sRGB (Argyll 1.6.3 3D)
55.7% AdobeRGB 1998 (Argyll 1.6.3 3D)
62.5% AdobeRGB 1998 (Argyll 3D)
85.5% sRGB (Argyll 3D)
65.9% Display P3 (Argyll 3D)
Gamma: 2.23
CCT: 6822 K
Lenovo Legion Y730-15ICH i5-8300H
BOE NV156FHM-N61, IPS, 15.6", 1920x1080
Lenovo Legion Y530-15ICH
LG Display LP156WFG-SPB2, IPS, 15.6", 1920x1080
Dell G7 15-7588
LG Philips LGD053F, IPS, 15.6", 1920x1080
Razer Blade 15 Base Model
BOE NV156FHM-N61, IPS, 15.6", 1920x1080
Asus FX504GD
AU Optronics B156HTN03.8, TN LED, 15.6", 1920x1080
MSI GF63 8RC
AU Optronics B156HAN02.1, IPS, 15.6", 1920x1080
Display
2%
-38%
1%
-39%
-35%
Display P3 Coverage (%)
65.9
62.5
-5%
37.82
-43%
66.3
1%
37.09
-44%
39.43
-40%
sRGB Coverage (%)
85.5
93
9%
56.2
-34%
86.6
1%
55.8
-35%
59.3
-31%
AdobeRGB 1998 Coverage (%)
62.5
63.8
2%
39.2
-37%
63.3
1%
38.34
-39%
40.73
-35%
Response Times
69%
22%
11%
33%
28%
Response Time Grey 50% / Grey 80% * (ms)
43.2 ?(25.2, 18)
15 ?(8, 7)
65%
38.8 ?(16, 22.8)
10%
39.2 ?(19.6, 19.6)
9%
41.6 ?(19.6, 22)
4%
33.2 ?(15.2, 18)
23%
Response Time Black / White * (ms)
40 ?(21.2, 18.8)
11 ?(7, 4)
72%
26.8 ?(14.4, 12.4)
33%
35.2 ?(20.4, 14.8)
12%
15.2 ?(10, 5.2)
62%
27.2 ?(15.6, 11.6)
32%
PWM Frequency (Hz)
21740 ?(99)
21190 ?(99)
Screen
7%
-30%
15%
-33%
-10%
Brightness middle (cd/m²)
286.5
305
6%
250.9
-12%
273.6
-5%
260
-9%
266.6
-7%
Brightness (cd/m²)
269
284
6%
246
-9%
262
-3%
241
-10%
257
-4%
Brightness Distribution (%)
84
83
-1%
89
6%
86
2%
85
1%
89
6%
Black Level * (cd/m²)
0.33
0.52
-58%
0.34
-3%
0.3
9%
0.55
-67%
0.29
12%
Contrast (:1)
868
587
-32%
738
-15%
912
5%
473
-46%
919
6%
Colorchecker dE 2000 *
6.3
3.63
42%
7.34
-17%
3.22
49%
7
-11%
5.93
6%
Colorchecker dE 2000 max. *
10.01
8.18
18%
28.66
-186%
7.61
24%
22.52
-125%
16.28
-63%
Colorchecker dE 2000 calibrated *
4.17
1.31
69%
4.42
-6%
4.1
2%
5.27
-26%
3.6
14%
Greyscale dE 2000 *
5.6
4.77
15%
6.8
-21%
1.4
75%
6.1
-9%
6.8
-21%
Gamma
2.23 99%
2.54 87%
2.164 102%
2.24 98%
1.97 112%
2.43 91%
CCT
6822 95%
7500 87%
6780 96%
6636 98%
7894 82%
7192 90%
Color Space (Percent of AdobeRGB 1998) (%)
55.7
59
6%
36
-35%
56.4
1%
35.5
-36%
37.6
-32%
Color Space (Percent of sRGB) (%)
85.1
93
9%
56
-34%
86.2
1%
61
-28%
59.3
-30%
Média Total (Programa/Configurações)
26% / 14%
-15% / -25%
9% / 12%
-13% / -26%
-6% / -10%

* ... menor é melhor

Exibir tempos de resposta

ℹ
Os tempos de resposta do display mostram a rapidez com que a tela é capaz de mudar de uma cor para outra. Tempos de resposta lentos podem gerar imagens residuais e fazer com que objetos em movimento pareçam desfocados (fantasmas). Os jogadores de títulos 3D de ritmo acelerado devem prestar atenção especial aos tempos de resposta rápidos.
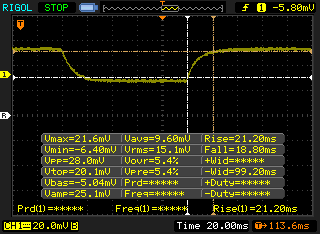
   ↔    Tempo de resposta preto para branco
40 ms ... ascensão ↗ e queda ↘ combinadas↗ 21.2 ms ascensão
↘ 18.8 ms queda
A tela mostra taxas de resposta lentas em nossos testes e será insatisfatória para os jogadores.
Em comparação, todos os dispositivos testados variam de 0.1 (mínimo) a 240 (máximo) ms. » 97 % de todos os dispositivos são melhores.
Isso significa que o tempo de resposta medido é pior que a média de todos os dispositivos testados (19.7 ms).
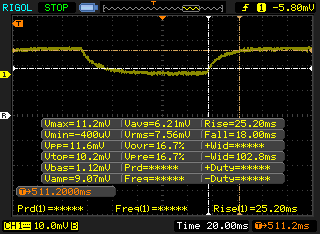
   ↔    Tempo de resposta 50% cinza a 80% cinza
43.2 ms ... ascensão ↗ e queda ↘ combinadas↗ 25.2 ms ascensão
↘ 18 ms queda
A tela mostra taxas de resposta lentas em nossos testes e será insatisfatória para os jogadores.
Em comparação, todos os dispositivos testados variam de 0.13 (mínimo) a 636 (máximo) ms. » 72 % de todos os dispositivos são melhores.
Isso significa que o tempo de resposta medido é pior que a média de todos os dispositivos testados (30.7 ms).

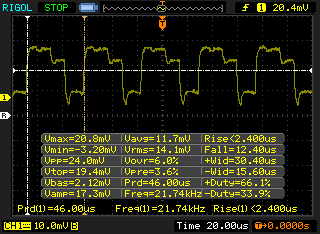
Cintilação da tela / PWM (modulação por largura de pulso)

ℹ
Para escurecer a tela, alguns notebooks simplesmente ligam e desligam a luz de fundo em rápida sucessão - um método chamado Modulação por Largura de Pulso (PWM). Idealmente, esta frequência de ciclagem deve ser indetectável ao olho humano. Se a frequência for muito baixa, os usuários com olhos sensíveis podem sentir cansaço ou dores de cabeça ou até mesmo notar a oscilação total.
Tela tremeluzindo/PWM detectado 21740 Hz ≤ 99 % configuração de brilho

A luz de fundo da tela pisca em 21740 Hz (pior caso, por exemplo, utilizando PWM) Cintilação detectada em uma configuração de brilho de 99 % e abaixo. Não deve haver cintilação ou PWM acima desta configuração de brilho.

A frequência de 21740 Hz é bastante alta, então a maioria dos usuários sensíveis ao PWM não deve notar nenhuma oscilação.

[pwm_comparison] Em comparação: 52 % de todos os dispositivos testados não usam PWM para escurecer a tela. Se PWM foi detectado, uma média de 7625 (mínimo: 5 - máximo: 343500) Hz foi medida.

020406080100120140160180200220240260280300320340360380400420440460480500520540560580600620640660680700720740760780800820840860880900920Tooltip
Lenovo Legion Y730-15ICH i5-8300H GeForce GTX 1050 Ti Mobile, i5-8300H, Intel Optane 16 GB MEMPEK1J016GAL + HGST ST1000LM049 1 TB HDD; CPU Multi 64Bit: Ø823 (815.58-828.24) Points
Razer Blade 15 Base Model GeForce GTX 1060 Max-Q, i7-8750H, Samsung SSD PM981 MZVLB256HAHQ; CPU Multi 64Bit: Ø864 (856.88-926.63) Points
Asus FX504GD GeForce GTX 1050 Mobile, i5-8300H, Seagate Mobile HDD 1TB ST1000LX015-1U7172; CPU Multi 64Bit: Ø605 (578.56-609.13) Points
MSI GF63 8RC GeForce GTX 1050 Mobile, i5-8300H, Seagate BarraCuda Pro Compute 1TB ST1000LM049; CPU Multi 64Bit: Ø749 (744.21-811.72) Points
Cinebench R15
CPU Single 64Bit
Eurocom Sky X4C
Intel Core i7-8700K
192 Points +16%
Dell XPS 15 9570 Core i9 UHD
Intel Core i9-8950HK
190 Points +14%
Lenovo Legion Y530-15ICH
Intel Core i7-8750H
175 Points +5%
Asus FX504GD
Intel Core i5-8300H
170 Points +2%
Média Intel Core i5-8300H
  (151 - 174, n=17)
168.6 Points +2%
Lenovo Yoga 730-15IKB
Intel Core i7-8550U
168 Points +1%
Lenovo Legion Y730-15ICH i5-8300H
Intel Core i5-8300H
166 Points
HP Omen X 17-ap0xx
Intel Core i7-7820HK
162 Points -2%
Lenovo Legion Y520-15IKBN-80WK001KUS
Intel Core i7-7700HQ
159 Points -4%
Lenovo Legion Y520-15IKBN 80WK0042GE
Intel Core i5-7300HQ
143 Points -14%
CPU Multi 64Bit
Eurocom Sky X4C
Intel Core i7-8700K
1359 Points +66%
Dell XPS 15 9570 Core i9 UHD
Intel Core i9-8950HK
1230 Points +50%
Lenovo Legion Y530-15ICH
Intel Core i7-8750H
1219 Points +48%
Lenovo Legion Y730-15ICH i5-8300H
Intel Core i5-8300H
821 Points
Média Intel Core i5-8300H
  (609 - 850, n=17)
793 Points -3%
HP Omen X 17-ap0xx
Intel Core i7-7820HK
770 Points -6%
Lenovo Yoga 730-15IKB
Intel Core i7-8550U
723 Points -12%
Lenovo Legion Y520-15IKBN-80WK001KUS
Intel Core i7-7700HQ
652 Points -21%
Asus FX504GD
Intel Core i5-8300H
609 Points -26%
Lenovo Legion Y520-15IKBN 80WK0042GE
Intel Core i5-7300HQ
517 Points -37%
Cinebench R11.5
CPU Single 64Bit
Eurocom Sky X4C
Intel Core i7-8700K
2.16 Points
Lenovo Yoga 730-15IKB
Intel Core i7-8550U
1.94 Points
Média Intel Core i5-8300H
  (1.72 - 1.96, n=7)
1.87 Points
HP Omen X 17-ap0xx
Intel Core i7-7820HK
1.84 Points
Lenovo Legion Y520-15IKBN-80WK001KUS
Intel Core i7-7700HQ
1.72 Points
Asus FX504GD
Intel Core i5-8300H
1.72 Points
Lenovo Legion Y520-15IKBN 80WK0042GE
Intel Core i5-7300HQ
1.5 Points
CPU Multi 64Bit
Eurocom Sky X4C
Intel Core i7-8700K
14.98 Points
HP Omen X 17-ap0xx
Intel Core i7-7820HK
8.47 Points
Lenovo Yoga 730-15IKB
Intel Core i7-8550U
7.94 Points
Média Intel Core i5-8300H
  (6.2 - 8.79, n=7)
7.93 Points
Lenovo Legion Y520-15IKBN-80WK001KUS
Intel Core i7-7700HQ
7.12 Points
Asus FX504GD
Intel Core i5-8300H
6.2 Points
Lenovo Legion Y520-15IKBN 80WK0042GE
Intel Core i5-7300HQ
5.38 Points
Cinebench R10
Rendering Multiple CPUs 32Bit
Eurocom Sky X4C
Intel Core i7-8700K
38810 Points
HP Omen X 17-ap0xx
Intel Core i7-7820HK
23052 Points
Lenovo Yoga 730-15IKB
Intel Core i7-8550U
22910 Points
Média Intel Core i5-8300H
  (20061 - 24718, n=4)
22328 Points
Asus FX504GD
Intel Core i5-8300H
20061 Points
Lenovo Legion Y520-15IKBN 80WK0042GE
Intel Core i5-7300HQ
18158 Points
Rendering Single 32Bit
Eurocom Sky X4C
Intel Core i7-8700K
7243 Points
Asus FX504GD
Intel Core i5-8300H
6482 Points
Lenovo Yoga 730-15IKB
Intel Core i7-8550U
6454 Points
Média Intel Core i5-8300H
  (6115 - 6524, n=4)
6392 Points
HP Omen X 17-ap0xx
Intel Core i7-7820HK
6062 Points
Lenovo Legion Y520-15IKBN 80WK0042GE
Intel Core i5-7300HQ
5436 Points
wPrime 2.10 - 1024m
Média Intel Core i5-8300H
  (206 - 286, n=4)
256 s *
Asus FX504GD
Intel Core i5-8300H
252.1 s *
HP Omen X 17-ap0xx
Intel Core i7-7820HK
215.4 s *
Eurocom Sky X4C
Intel Core i7-8700K
120.9 s *

* ... menor é melhor

Cinebench R15 CPU Single 64Bit
166 Points
Cinebench R15 CPU Multi 64Bit
821 Points
Cinebench R15 OpenGL 64Bit
104.5 fps
Cinebench R15 Ref. Match 64Bit
99.6 %
Ajuda
PCMark 10
Score
Dell G7 15-7588
GeForce GTX 1060 Max-Q, i7-8750H, SK hynix SC311 SATA
5285 Points +17%
Lenovo Legion Y530-15ICH
GeForce GTX 1060 Mobile, i7-8750H, Samsung SSD PM981 MZVLB256HAHQ
5125 Points +13%
Média Intel Core i5-8300H, NVIDIA GeForce GTX 1050 Ti Mobile
  (4527 - 4812, n=3)
4682 Points +3%
Lenovo Legion Y730-15ICH i5-8300H
GeForce GTX 1050 Ti Mobile, i5-8300H, Intel Optane 16 GB MEMPEK1J016GAL + HGST ST1000LM049 1 TB HDD
4527 Points
Asus FX504GD
GeForce GTX 1050 Mobile, i5-8300H, Seagate Mobile HDD 1TB ST1000LX015-1U7172
3808 Points -16%
MSI GF63 8RC
GeForce GTX 1050 Mobile, i5-8300H, Seagate BarraCuda Pro Compute 1TB ST1000LM049
3711 Points -18%
Essentials
Lenovo Legion Y530-15ICH
GeForce GTX 1060 Mobile, i7-8750H, Samsung SSD PM981 MZVLB256HAHQ
8702 Points +3%
Dell G7 15-7588
GeForce GTX 1060 Max-Q, i7-8750H, SK hynix SC311 SATA
8466 Points 0%
Lenovo Legion Y730-15ICH i5-8300H
GeForce GTX 1050 Ti Mobile, i5-8300H, Intel Optane 16 GB MEMPEK1J016GAL + HGST ST1000LM049 1 TB HDD
8457 Points
Média Intel Core i5-8300H, NVIDIA GeForce GTX 1050 Ti Mobile
  (8085 - 8457, n=3)
8320 Points -2%
Asus FX504GD
GeForce GTX 1050 Mobile, i5-8300H, Seagate Mobile HDD 1TB ST1000LX015-1U7172
6583 Points -22%
MSI GF63 8RC
GeForce GTX 1050 Mobile, i5-8300H, Seagate BarraCuda Pro Compute 1TB ST1000LM049
5849 Points -31%
Productivity
Dell G7 15-7588
GeForce GTX 1060 Max-Q, i7-8750H, SK hynix SC311 SATA
7710 Points +21%
Lenovo Legion Y530-15ICH
GeForce GTX 1060 Mobile, i7-8750H, Samsung SSD PM981 MZVLB256HAHQ
7019 Points +10%
Média Intel Core i5-8300H, NVIDIA GeForce GTX 1050 Ti Mobile
  (6385 - 7246, n=3)
6887 Points +8%
Lenovo Legion Y730-15ICH i5-8300H
GeForce GTX 1050 Ti Mobile, i5-8300H, Intel Optane 16 GB MEMPEK1J016GAL + HGST ST1000LM049 1 TB HDD
6385 Points
Asus FX504GD
GeForce GTX 1050 Mobile, i5-8300H, Seagate Mobile HDD 1TB ST1000LX015-1U7172
5927 Points -7%
MSI GF63 8RC
GeForce GTX 1050 Mobile, i5-8300H, Seagate BarraCuda Pro Compute 1TB ST1000LM049
5694 Points -11%
Digital Content Creation
Dell G7 15-7588
GeForce GTX 1060 Max-Q, i7-8750H, SK hynix SC311 SATA
6139 Points +32%
Lenovo Legion Y530-15ICH
GeForce GTX 1060 Mobile, i7-8750H, Samsung SSD PM981 MZVLB256HAHQ
5983 Points +28%
Média Intel Core i5-8300H, NVIDIA GeForce GTX 1050 Ti Mobile
  (4665 - 4980, n=3)
4868 Points +4%
Lenovo Legion Y730-15ICH i5-8300H
GeForce GTX 1050 Ti Mobile, i5-8300H, Intel Optane 16 GB MEMPEK1J016GAL + HGST ST1000LM049 1 TB HDD
4665 Points
MSI GF63 8RC
GeForce GTX 1050 Mobile, i5-8300H, Seagate BarraCuda Pro Compute 1TB ST1000LM049
4164 Points -11%
Asus FX504GD
GeForce GTX 1050 Mobile, i5-8300H, Seagate Mobile HDD 1TB ST1000LX015-1U7172
3843 Points -18%
PCMark 8
Home Score Accelerated v2
Lenovo Legion Y530-15ICH
GeForce GTX 1060 Mobile, i7-8750H, Samsung SSD PM981 MZVLB256HAHQ
4440 Points +13%
Média Intel Core i5-8300H, NVIDIA GeForce GTX 1050 Ti Mobile
  (3931 - 4253, n=4)
4106 Points +4%
Dell G7 15-7588
GeForce GTX 1060 Max-Q, i7-8750H, SK hynix SC311 SATA
3968 Points +1%
Lenovo Legion Y730-15ICH i5-8300H
GeForce GTX 1050 Ti Mobile, i5-8300H, Intel Optane 16 GB MEMPEK1J016GAL + HGST ST1000LM049 1 TB HDD
3931 Points
Asus FX504GD
GeForce GTX 1050 Mobile, i5-8300H, Seagate Mobile HDD 1TB ST1000LX015-1U7172
3909 Points -1%
MSI GF63 8RC
GeForce GTX 1050 Mobile, i5-8300H, Seagate BarraCuda Pro Compute 1TB ST1000LM049
3704 Points -6%
Work Score Accelerated v2
Lenovo Legion Y530-15ICH
GeForce GTX 1060 Mobile, i7-8750H, Samsung SSD PM981 MZVLB256HAHQ
5543 Points +6%
Dell G7 15-7588
GeForce GTX 1060 Max-Q, i7-8750H, SK hynix SC311 SATA
5410 Points +4%
Média Intel Core i5-8300H, NVIDIA GeForce GTX 1050 Ti Mobile
  (5208 - 5369, n=4)
5322 Points +2%
Lenovo Legion Y730-15ICH i5-8300H
GeForce GTX 1050 Ti Mobile, i5-8300H, Intel Optane 16 GB MEMPEK1J016GAL + HGST ST1000LM049 1 TB HDD
5208 Points
Asus FX504GD
GeForce GTX 1050 Mobile, i5-8300H, Seagate Mobile HDD 1TB ST1000LX015-1U7172
5018 Points -4%
MSI GF63 8RC
GeForce GTX 1050 Mobile, i5-8300H, Seagate BarraCuda Pro Compute 1TB ST1000LM049
4609 Points -12%
PCMark 8 Home Score Accelerated v2
3931 pontos
PCMark 8 Work Score Accelerated v2
5208 pontos
PCMark 10 Score
4527 pontos
Ajuda
Lenovo Legion Y730-15ICH i5-8300H
Intel Optane 16 GB MEMPEK1J016GAL + HGST ST1000LM049 1 TB HDD
Lenovo Legion Y530-15ICH
Samsung SSD PM981 MZVLB256HAHQ
Dell G7 15-7588
SK hynix SC311 SATA
Asus FX504GD
Seagate Mobile HDD 1TB ST1000LX015-1U7172
MSI GF63 8RC
Seagate BarraCuda Pro Compute 1TB ST1000LM049
Razer Blade 15 Base Model
Samsung SSD PM981 MZVLB256HAHQ
CrystalDiskMark 5.2 / 6
250%
-20%
-82%
-77%
259%
Write 4K (MB/s)
66.9
108.9
63%
61.3
-8%
0.27
-100%
1.244
-98%
112.5
68%
Read 4K (MB/s)
118.5
40.23
-66%
22.45
-81%
0.586
-100%
0.544
-100%
43.09
-64%
Write Seq (MB/s)
157.7
1390
781%
243.9
55%
86.8
-45%
97.1
-38%
1450
819%
Read Seq (MB/s)
886
964
9%
506
-43%
113.2
-87%
162.1
-82%
1392
57%
Write 4K Q32T1 (MB/s)
162.4
314.2
93%
145.1
-11%
0.242
-100%
1.674
-99%
356.1
119%
Read 4K Q32T1 (MB/s)
353
369.2
5%
195.1
-45%
0.963
-100%
0.998
-100%
406.9
15%
Write Seq Q32T1 (MB/s)
159.8
1506
842%
186
16%
98.4
-38%
134.8
-16%
1451
808%
Read Seq Q32T1 (MB/s)
926
3446
272%
540
-42%
110.2
-88%
154.8
-83%
3272
253%
Intel Optane 16 GB MEMPEK1J016GAL + HGST ST1000LM049 1 TB HDD
CDM 5/6 Read Seq Q32T1: 926 MB/s
CDM 5/6 Write Seq Q32T1: 159.8 MB/s
CDM 5/6 Read 4K Q32T1: 353 MB/s
CDM 5/6 Write 4K Q32T1: 162.4 MB/s
CDM 5 Read Seq: 886 MB/s
CDM 5 Write Seq: 157.7 MB/s
CDM 5/6 Read 4K: 118.5 MB/s
CDM 5/6 Write 4K: 66.9 MB/s
3DMark 11
1280x720 Performance GPU
Eurocom Sky X4C
NVIDIA GeForce GTX 1080 Mobile, i7-8700K
26912 Points +174%
Lenovo Legion Y920-17IKB
NVIDIA GeForce GTX 1070 Mobile, i7-7820HK
21879 Points +123%
Lenovo Legion Y530-15ICH
NVIDIA GeForce GTX 1060 Mobile, i7-8750H
14569 Points +49%
Dell G7 15-7588
NVIDIA GeForce GTX 1060 Max-Q, i7-8750H
14487 Points +48%
Dell XPS 15 9575 i7-8705G
AMD Radeon RX Vega M GL / 870, i7-8705G
10118 Points +3%
Lenovo Legion Y730-15ICH i5-8300H
NVIDIA GeForce GTX 1050 Ti Mobile, i5-8300H
9805 Points
Média NVIDIA GeForce GTX 1050 Ti Mobile
  (8304 - 10402, n=36)
9591 Points -2%
Dell XPS 15 9570 Core i9 UHD
NVIDIA GeForce GTX 1050 Ti Max-Q, i9-8950HK
9032 Points -8%
Asus FX504GD
NVIDIA GeForce GTX 1050 Mobile, i5-8300H
7133 Points -27%
1280x720 Performance Combined
Eurocom Sky X4C
NVIDIA GeForce GTX 1080 Mobile, i7-8700K
13928 Points +76%
Lenovo Legion Y530-15ICH
NVIDIA GeForce GTX 1060 Mobile, i7-8750H
11099 Points +40%
Dell G7 15-7588
NVIDIA GeForce GTX 1060 Max-Q, i7-8750H
10798 Points +36%
Lenovo Legion Y920-17IKB
NVIDIA GeForce GTX 1070 Mobile, i7-7820HK
9500 Points +20%
Dell XPS 15 9575 i7-8705G
AMD Radeon RX Vega M GL / 870, i7-8705G
8633 Points +9%
Dell XPS 15 9570 Core i9 UHD
NVIDIA GeForce GTX 1050 Ti Max-Q, i9-8950HK
8450 Points +7%
Lenovo Legion Y730-15ICH i5-8300H
NVIDIA GeForce GTX 1050 Ti Mobile, i5-8300H
7932 Points
Média NVIDIA GeForce GTX 1050 Ti Mobile
  (6104 - 9172, n=35)
7823 Points -1%
Asus FX504GD
NVIDIA GeForce GTX 1050 Mobile, i5-8300H
7025 Points -11%
3DMark
1280x720 Cloud Gate Standard Graphics
Eurocom Sky X4C
NVIDIA GeForce GTX 1080 Mobile, i7-8700K
124077 Points +144%
Lenovo Legion Y530-15ICH
NVIDIA GeForce GTX 1060 Mobile, i7-8750H
83591 Points +64%
Dell G7 15-7588
NVIDIA GeForce GTX 1060 Max-Q, i7-8750H
81015 Points +59%
Lenovo Legion Y920-17IKB
NVIDIA GeForce GTX 1070 Mobile, i7-7820HK
70132 Points +38%
Lenovo Legion Y520-15IKBN-80WK001KUS
NVIDIA GeForce GTX 1050 Ti Mobile, i7-7700HQ
50981 Points 0%
Lenovo Legion Y730-15ICH i5-8300H
NVIDIA GeForce GTX 1050 Ti Mobile, i5-8300H
50922 Points
Média NVIDIA GeForce GTX 1050 Ti Mobile
  (43721 - 53978, n=37)
50013 Points -2%
Dell XPS 15 9575 i7-8705G
AMD Radeon RX Vega M GL / 870, i7-8705G
42351 Points -17%
Dell XPS 15 9570 Core i9 UHD
NVIDIA GeForce GTX 1050 Ti Max-Q, i9-8950HK
42202 Points -17%
Asus FX504GD
NVIDIA GeForce GTX 1050 Mobile, i5-8300H
38881 Points -24%
1920x1080 Fire Strike Graphics
Eurocom Sky X4C
NVIDIA GeForce GTX 1080 Mobile, i7-8700K
20909 Points +161%
Lenovo Legion Y920-17IKB
NVIDIA GeForce GTX 1070 Mobile, i7-7820HK
16629 Points +108%
Lenovo Legion Y530-15ICH
NVIDIA GeForce GTX 1060 Mobile, i7-8750H
11640 Points +45%
Dell G7 15-7588
NVIDIA GeForce GTX 1060 Max-Q, i7-8750H
11309 Points +41%
Lenovo Legion Y730-15ICH i5-8300H
NVIDIA GeForce GTX 1050 Ti Mobile, i5-8300H
8004 Points
Média NVIDIA GeForce GTX 1050 Ti Mobile
  (6792 - 8376, n=38)
7743 Points -3%
Lenovo Legion Y520-15IKBN-80WK001KUS
NVIDIA GeForce GTX 1050 Ti Mobile, i7-7700HQ
7682 Points -4%
Dell XPS 15 9570 Core i9 UHD
NVIDIA GeForce GTX 1050 Ti Max-Q, i9-8950HK
7374 Points -8%
Dell XPS 15 9575 i7-8705G
AMD Radeon RX Vega M GL / 870, i7-8705G
7348 Points -8%
Asus FX504GD
NVIDIA GeForce GTX 1050 Mobile, i5-8300H
6356 Points -21%
3DMark 11 Performance
9335 pontos
3DMark Cloud Gate Standard Score
23927 pontos
3DMark Fire Strike Score
6989 pontos
Ajuda
05101520253035404550Tooltip
Lenovo Legion Y730-15ICH i5-8300H GeForce GTX 1050 Ti Mobile, i5-8300H, Intel Optane 16 GB MEMPEK1J016GAL + HGST ST1000LM049 1 TB HDD: Ø48.3 (44-51) fps
baixomédiaaltoultra
BioShock Infinite (2013) 233.1 198.8 176.7 74.8
The Witcher 3 (2015) 142.2 91.5 51.9 27.9
Rise of the Tomb Raider (2016) 125.3 95 51.3 40
Lenovo Legion Y730-15ICH i5-8300H
GeForce GTX 1050 Ti Mobile, i5-8300H, Intel Optane 16 GB MEMPEK1J016GAL + HGST ST1000LM049 1 TB HDD
Lenovo Legion Y530-15ICH
GeForce GTX 1060 Mobile, i7-8750H, Samsung SSD PM981 MZVLB256HAHQ
Dell G7 15-7588
GeForce GTX 1060 Max-Q, i7-8750H, SK hynix SC311 SATA
Asus FX504GD
GeForce GTX 1050 Mobile, i5-8300H, Seagate Mobile HDD 1TB ST1000LX015-1U7172
MSI GF63 8RC
GeForce GTX 1050 Mobile, i5-8300H, Seagate BarraCuda Pro Compute 1TB ST1000LM049
Razer Blade 15 Base Model
GeForce GTX 1060 Max-Q, i7-8750H, Samsung SSD PM981 MZVLB256HAHQ
Noise
-1%
-2%
-0%
-4%
-6%
desligado / ambiente * (dB)
28.9
30.2
-4%
28.1
3%
28.1
3%
28
3%
27.8
4%
Idle Minimum * (dB)
32.2
30.9
4%
29
10%
29
10%
33.8
-5%
31
4%
Idle Average * (dB)
32.5
30.9
5%
29
11%
29.2
10%
34
-5%
31.2
4%
Idle Maximum * (dB)
32.7
31.6
3%
29.2
11%
29.7
9%
34.2
-5%
31.3
4%
Load Average * (dB)
33.2
42.3
-27%
40.6
-22%
44.3
-33%
37.3
-12%
47.2
-42%
Witcher 3 ultra * (dB)
43.1
49.8
-16%
40.7
6%
43.4
-1%
51.3
-19%
Load Maximum * (dB)
45
40
11%
49.8
-11%
47.7
-6%
46
-2%
44.3
2%

* ... menor é melhor

Barulho

Ocioso
32.2 / 32.5 / 32.7 dB
Carga
33.2 / 45 dB
  red to green bar
 
 
30 dB
silencioso
40 dB(A)
audível
50 dB(A)
ruidosamente alto
 
min: dark, med: mid, max: light   Audix TM1, Arta (15 cm de distância)   ruído ambiente: 28.9 dB(A)
27.8 °C28 °C23.8 °C
24.6 °C30 °C22 °C
21.6 °C18.8 °C19.2 °C
Máximo: 30 °C
Médio: 24 °C
32.6 °C34.2 °C40.8 °C
23.6 °C28.8 °C27.6 °C
22.8 °C24.8 °C25 °C
Máximo: 40.8 °C
Médio: 28.9 °C
alimentação elétrica  46 °C | Temperatura do quarto 20 °C | Fluke 62 Mini IR Thermometer
(+) A temperatura média para o lado superior sob carga máxima é 24 °C / 75 F, em comparação com a média de 33.9 °C / ###class_avg_f# ## F para os dispositivos da classe Gaming.
(+) A temperatura máxima no lado superior é 30 °C / 86 F, em comparação com a média de 40.4 °C / 105 F , variando de 21.2 a 68.8 °C para a classe Gaming.
(±) A parte inferior aquece até um máximo de 40.8 °C / 105 F, em comparação com a média de 43.2 °C / 110 F
(+) Em uso inativo, a temperatura média para o lado superior é 21.7 °C / 71 F, em comparação com a média do dispositivo de 33.9 °C / ### class_avg_f### F.
(+) Jogando The Witcher 3, a temperatura média para o lado superior é 25.6 °C / 78 F, em comparação com a média do dispositivo de 33.9 °C / ## #class_avg_f### F.
(+) Os apoios para as mãos e o touchpad são mais frios que a temperatura da pele, com um máximo de 23.4 °C / 74.1 F e, portanto, são frios ao toque.
(+) A temperatura média da área do apoio para as mãos de dispositivos semelhantes foi 28.8 °C / 83.8 F (+5.4 °C / 9.7 F).
dB(A) 0102030405060708090Deep BassMiddle BassHigh BassLower RangeMidsHigher MidsLower HighsMid HighsUpper HighsSuper Highs2036.439.42535.532.3313232.94030.730.55032.4316330.631.38029.229.810030.329.912531.737.316029.250.820027.256.625025.659.831526.361.240024.961.650023.760.363023.162.880024.672.3100025.171.7125022.469.5160022.570.220002270.5250022.363.9315021.564.340002361500022.159.4630021.259.3800021.259.21000020.859.91250020.8601600020.952.6SPL3579.2N2.443.1median 23median 60.3Delta2.33.935.335.132.931.831.83236.535.132.428.93328.936.328.848.32761.52752.924.860.92462.822.763.32269.521.267.82174.82075.919.472.718.97117.770.117.86917.671.817.668.117.671.417.673.717.670.417.571.617.671.617.669.617.459.717.583.630.662.51.5median 69.6median 17.84.72.4hearing rangehide median Pink NoiseLenovo Legion Y730-15ICH i5-8300HApple MacBook 12 (Early 2016) 1.1 GHz
Diagrama de frequência (as caixas de seleção podem ser marcadas e desmarcadas para comparar dispositivos)
Lenovo Legion Y730-15ICH i5-8300H análise de áudio

(±) | o volume do alto-falante é médio, mas bom (###valor### dB)
Graves 100 - 315Hz
(±) | graves reduzidos - em média 11.3% menor que a mediana
(±) | a linearidade dos graves é média (14% delta para a frequência anterior)
Médios 400 - 2.000 Hz
(±) | médios mais altos - em média 7.1% maior que a mediana
(+) | médios são lineares (5.9% delta para frequência anterior)
Altos 2 - 16 kHz
(+) | agudos equilibrados - apenas 1.7% longe da mediana
(+) | os máximos são lineares (4.8% delta da frequência anterior)
Geral 100 - 16.000 Hz
(±) | a linearidade do som geral é média (19.3% diferença em relação à mediana)
Comparado com a mesma classe
» 66% de todos os dispositivos testados nesta classe foram melhores, 8% semelhantes, 27% piores
» O melhor teve um delta de 6%, a média foi 18%, o pior foi 132%
Comparado com todos os dispositivos testados
» 47% de todos os dispositivos testados foram melhores, 8% semelhantes, 45% piores
» O melhor teve um delta de 4%, a média foi 23%, o pior foi 136%

Apple MacBook 12 (Early 2016) 1.1 GHz análise de áudio

(+) | os alto-falantes podem tocar relativamente alto (###valor### dB)
Graves 100 - 315Hz
(±) | graves reduzidos - em média 11.3% menor que a mediana
(±) | a linearidade dos graves é média (14.2% delta para a frequência anterior)
Médios 400 - 2.000 Hz
(+) | médios equilibrados - apenas 2.4% longe da mediana
(+) | médios são lineares (5.5% delta para frequência anterior)
Altos 2 - 16 kHz
(+) | agudos equilibrados - apenas 2% longe da mediana
(+) | os máximos são lineares (4.5% delta da frequência anterior)
Geral 100 - 16.000 Hz
(+) | o som geral é linear (10.2% diferença em relação à mediana)
Comparado com a mesma classe
» 8% de todos os dispositivos testados nesta classe foram melhores, 2% semelhantes, 90% piores
» O melhor teve um delta de 5%, a média foi 18%, o pior foi 53%
Comparado com todos os dispositivos testados
» 5% de todos os dispositivos testados foram melhores, 1% semelhantes, 94% piores
» O melhor teve um delta de 4%, a média foi 23%, o pior foi 136%

Consumo de energia
desligadodarklight 0.51 / 0.76 Watt
Ociosodarkmidlight 8 / 11.8 / 13.1 Watt
Carga midlight 90.2 / 136.2 Watt
 color bar
Key: min: dark, med: mid, max: light        Metrahit Energy
Lenovo Legion Y730-15ICH i5-8300H
i5-8300H, GeForce GTX 1050 Ti Mobile, Intel Optane 16 GB MEMPEK1J016GAL + HGST ST1000LM049 1 TB HDD, IPS, 1920x1080, 15.6"
Lenovo Legion Y530-15ICH
i7-8750H, GeForce GTX 1060 Mobile, Samsung SSD PM981 MZVLB256HAHQ, IPS, 1920x1080, 15.6"
Dell G7 15-7588
i7-8750H, GeForce GTX 1060 Max-Q, SK hynix SC311 SATA, IPS, 1920x1080, 15.6"
Asus FX504GD
i5-8300H, GeForce GTX 1050 Mobile, Seagate Mobile HDD 1TB ST1000LX015-1U7172, TN LED, 1920x1080, 15.6"
MSI GF63 8RC
i5-8300H, GeForce GTX 1050 Mobile, Seagate BarraCuda Pro Compute 1TB ST1000LM049, IPS, 1920x1080, 15.6"
Razer Blade 15 Base Model
i7-8750H, GeForce GTX 1060 Max-Q, Samsung SSD PM981 MZVLB256HAHQ, IPS, 1920x1080, 15.6"
Power Consumption
-5%
12%
12%
16%
-14%
Idle Minimum * (Watt)
8
7.3
9%
5.5
31%
7.2
10%
5.4
32%
10.2
-27%
Idle Average * (Watt)
11.8
11.1
6%
7.6
36%
10.2
14%
10.4
12%
13.2
-12%
Idle Maximum * (Watt)
13.1
12.6
4%
9
31%
10.9
17%
10.5
20%
17.6
-34%
Load Average * (Watt)
90.2
109
-21%
94
-4%
93.3
-3%
84.7
6%
99.5
-10%
Witcher 3 ultra * (Watt)
107.8
116.3
-8%
95.8
11%
92.7
14%
113.6
-5%
Load Maximum * (Watt)
136.2
168
-23%
154.4
-13%
102.5
25%
119.9
12%
133.3
2%

* ... menor é melhor

Tempo de Execução da Bateria
Ocioso (sem WLAN, min brilho)
9h 37min
WiFi Websurfing
5h 15min
Carga (máximo brilho)
1h 00min
Lenovo Legion Y730-15ICH i5-8300H
i5-8300H, GeForce GTX 1050 Ti Mobile, 57 Wh
Lenovo Legion Y530-15ICH
i7-8750H, GeForce GTX 1060 Mobile, 52 Wh
Dell G7 15-7588
i7-8750H, GeForce GTX 1060 Max-Q, 56 Wh
Asus FX504GD
i5-8300H, GeForce GTX 1050 Mobile, 48 Wh
MSI GF63 8RC
i5-8300H, GeForce GTX 1050 Mobile, 51 Wh
Razer Blade 15 Base Model
i7-8750H, GeForce GTX 1060 Max-Q, 65 Wh
Duração da bateria
-34%
59%
-21%
-2%
25%
Reader / Idle (h)
9.6
8.3
-14%
10.9
14%
7.5
-22%
9.5
-1%
11.5
20%
WiFi v1.3 (h)
5.3
3.8
-28%
7.5
42%
3.7
-30%
5.5
4%
5.5
4%
Load (h)
1
0.4
-60%
2.2
120%
0.9
-10%
0.9
-10%
1.5
50%

Pro

+ Temperaturas relativamente baixas durante jogos
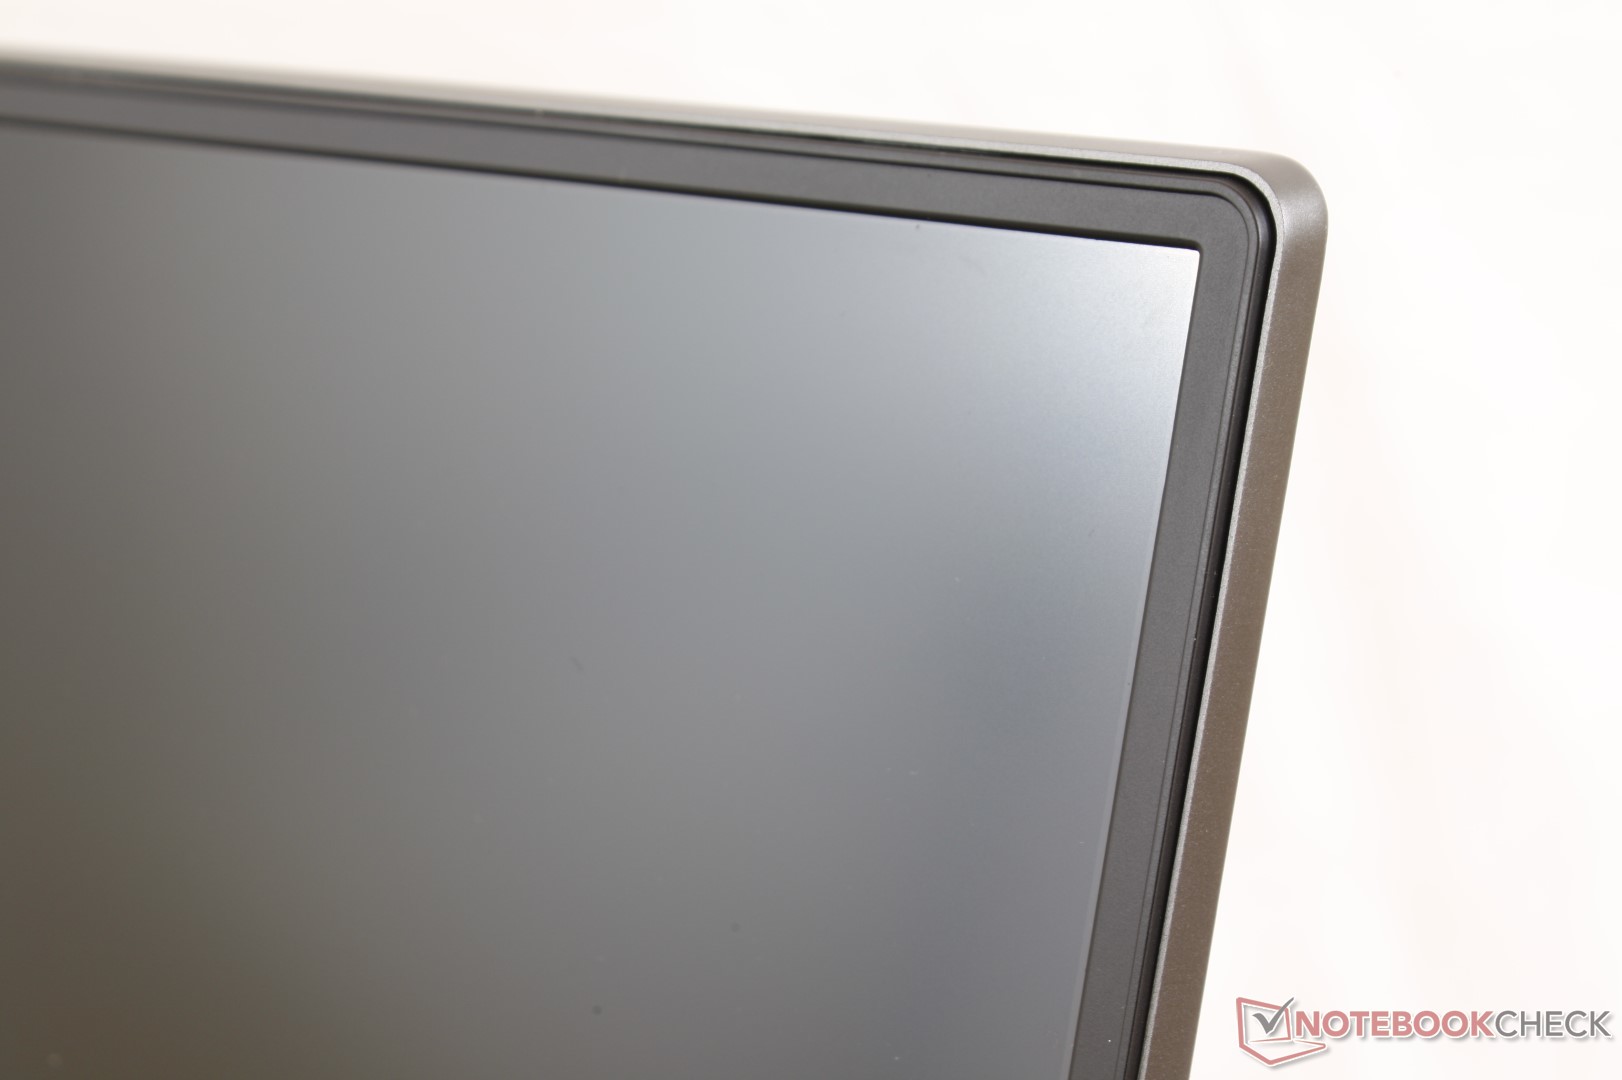
+ Marcos estreitos nos três lados da tela
+ Potente sustentabilidade do desempenho do Turbo Boost da CPU
+ Ventiladores silenciosos sob uso leve a médio
+ Teclas e botões do mouse silenciosos
+ Iluminação RGB por tecla
+ Tela mate nítida
+ Thunderbolt 3

Contra

- Tempos de resposta preto-branco lentos da tela, mais ghosting
- Formato relativamente grande para a classe de tamanho
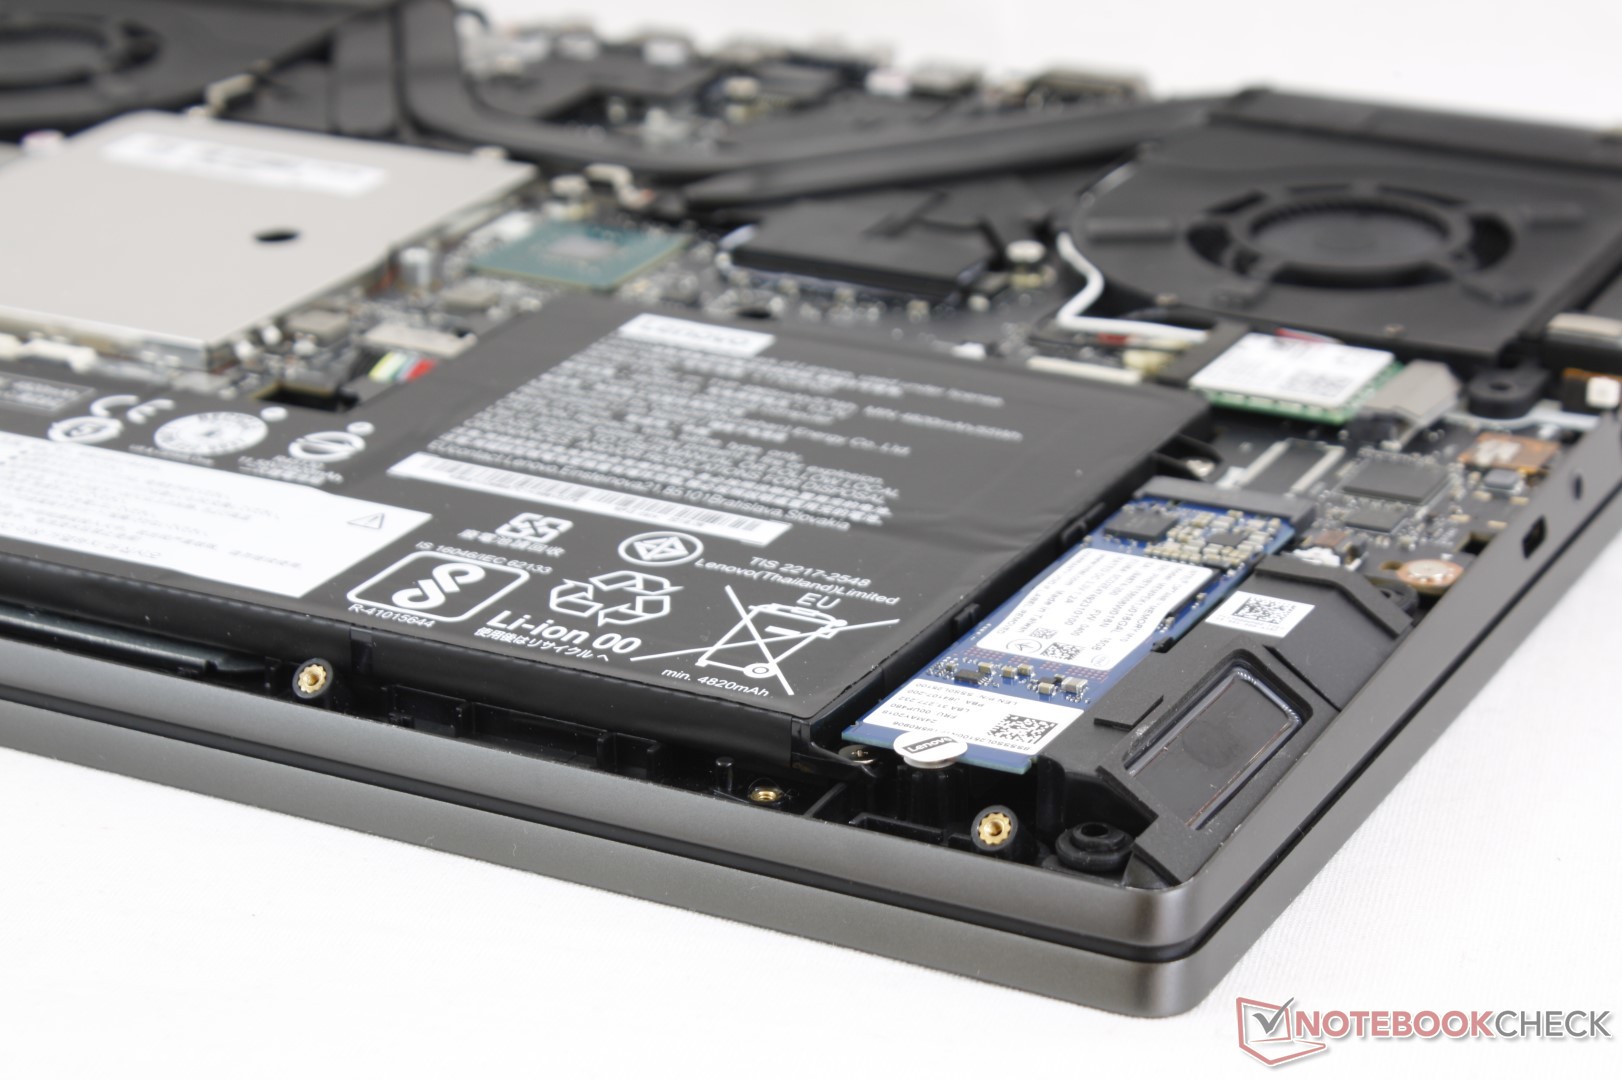
- Remove a unidade M.2 pode anular a garantia
- Limitado à GPU GTX 1050 Ti apenas
- Sem opções de tela de 120/144 Hz
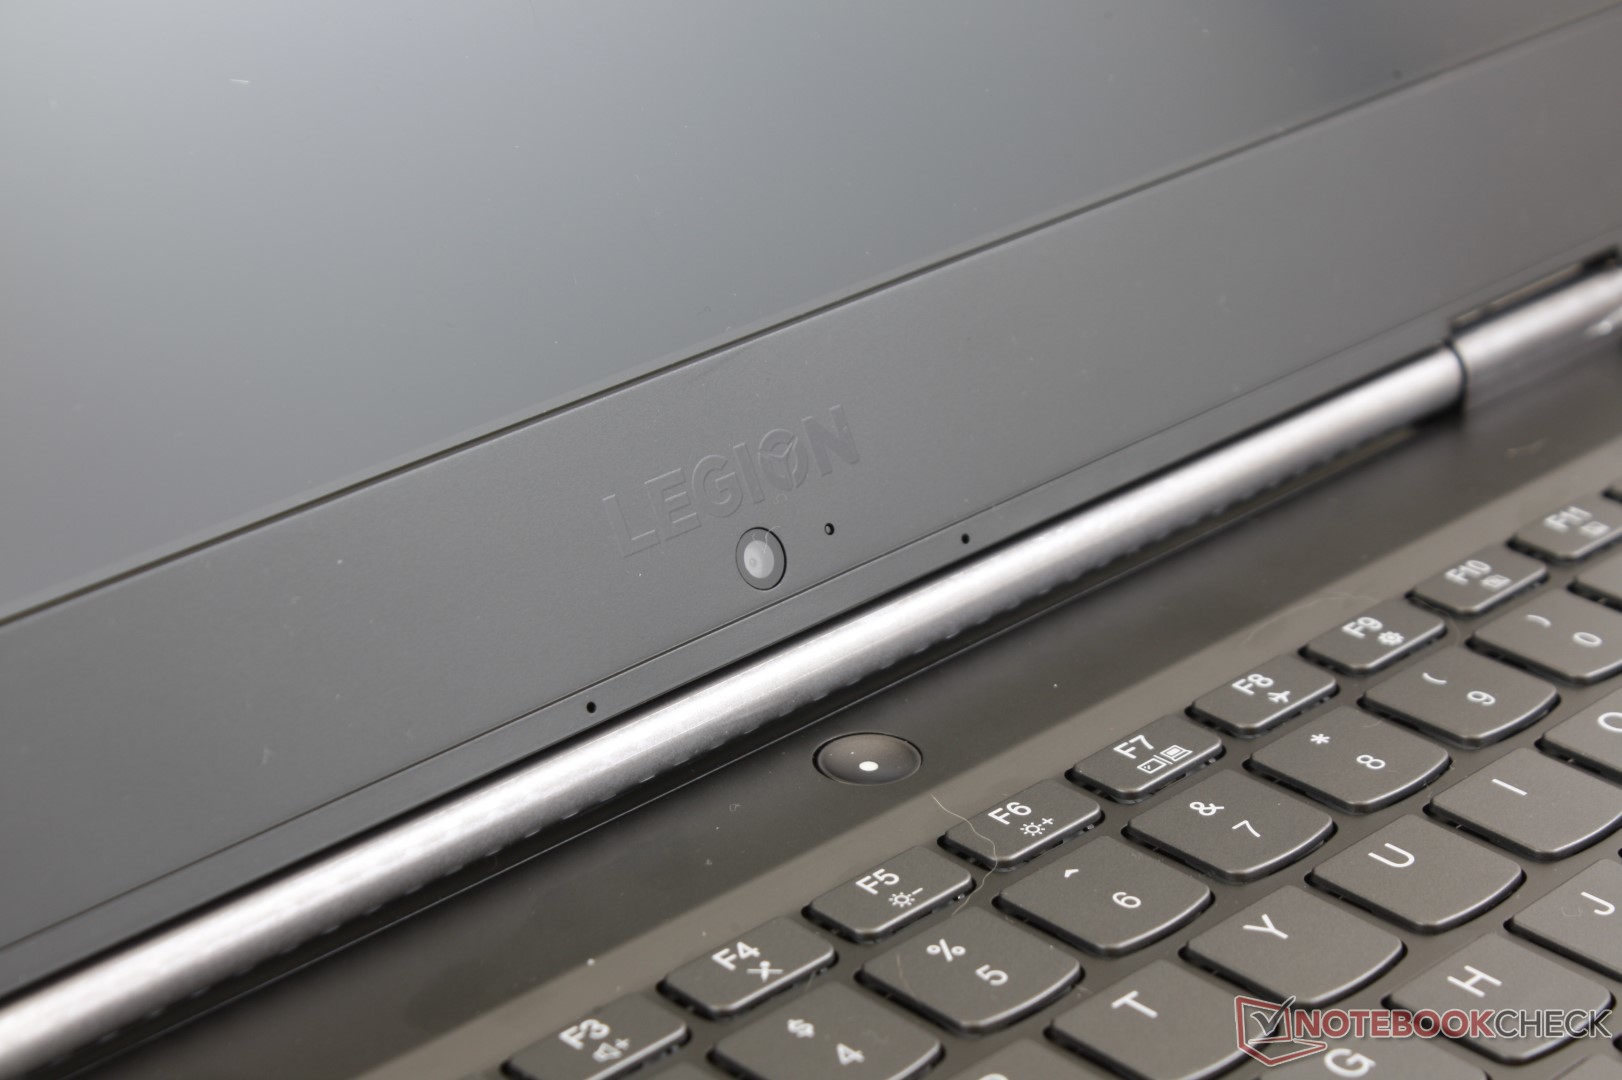
- Posição não ideal da webcam
- Trackpad pequeno
- Sem teclado numérico
- Tampa frágil
In review: Lenovo Legion Y730-15ICH

O Legion Y730 está em uma posição precária. É a versão mais fina, mais leve e mais avançada do Legion Y530 com mais sinos e assobios como luzes LED, superfícies de alumínio e Thunderbolt 3, mas não tem a opção de GPU GeForce GTX 1060 encontrada em sua alternativa de orçamento. Por que o Legion Y730 está preso com a GTX 1050 Ti a GPU, está além do nosso raciocínio, especialmente porque o portátil roda relativamente bem quando joga, com excelente desempenho do Turbo Boost da CPU. O chassi é claramente capaz de lidar com GPUs mais rápidas e nós suspeitamos que uma atualização virá em breve com a próxima geração de gráficos da Nvidia.

Os maiores pontos de venda do Y730 são as luzes RGB por tecla e a porta Thunderbolt 3 por um preço baixo de $1.000 USD. Na verdade, a maioria dos concorrentes de jogos de nível de entrada como o MSI GF63, Gigabyte Sabre 15, ou Asus TUF FX504 não possui um ou ambos desses recursos. O resto do portátil, no entanto, é meramente mediano, incluindo seus lentos tempos de resposta em preto e branco, teclas esponjosas do teclado e tampa frágil. Os gamers estariam melhor apenas esperando por uma atualização do Legion Y730 com opções de GPU mais rápidas ou optando pelo menos dispendioso Legion Y530 e seu SKU GTX 1060 mais rápido.

Um estranho amálgama de recursos e aparência de gama alta amarradas por uma opção de GPU convencional e uma tampa fraca. A iteração atual do Legion Y730 poderia receber uma atualização mais cedo ou mais tarde em relação à sua rigidez de chassi e opções de GPU.

Lenovo Legion Y730-15ICH i5-8300H - 01/04/2019 v6 (old)
Allen Ngo

Acabamento
75 / 98 → 77%
Teclado
83%
Mouse
86%
Conectividade
54 / 81 → 67%
Peso
62 / 10-66 → 92%
Bateria
83%
Pantalha
85%
Desempenho do jogos
90%
Desempenho da aplicação
93%
Temperatura
95 / 95 → 100%
Ruído
85 / 90 → 94%
Áudio
60%
Câmera
42 / 85 → 50%
Médio
76%
83%
Gaming - Médio equilibrado

Price comparison

Google LogoAdd as a preferred source on Google
Mail Logo
> Análises e revisões de portáteis e celulares > Análises > Análises > Breve Análise do Portátil Lenovo Legion Y730-15ICH (i5-8300H, GTX 1050 Ti)
Allen Ngo, 2019-01-10 (Update: 2024-11- 4)