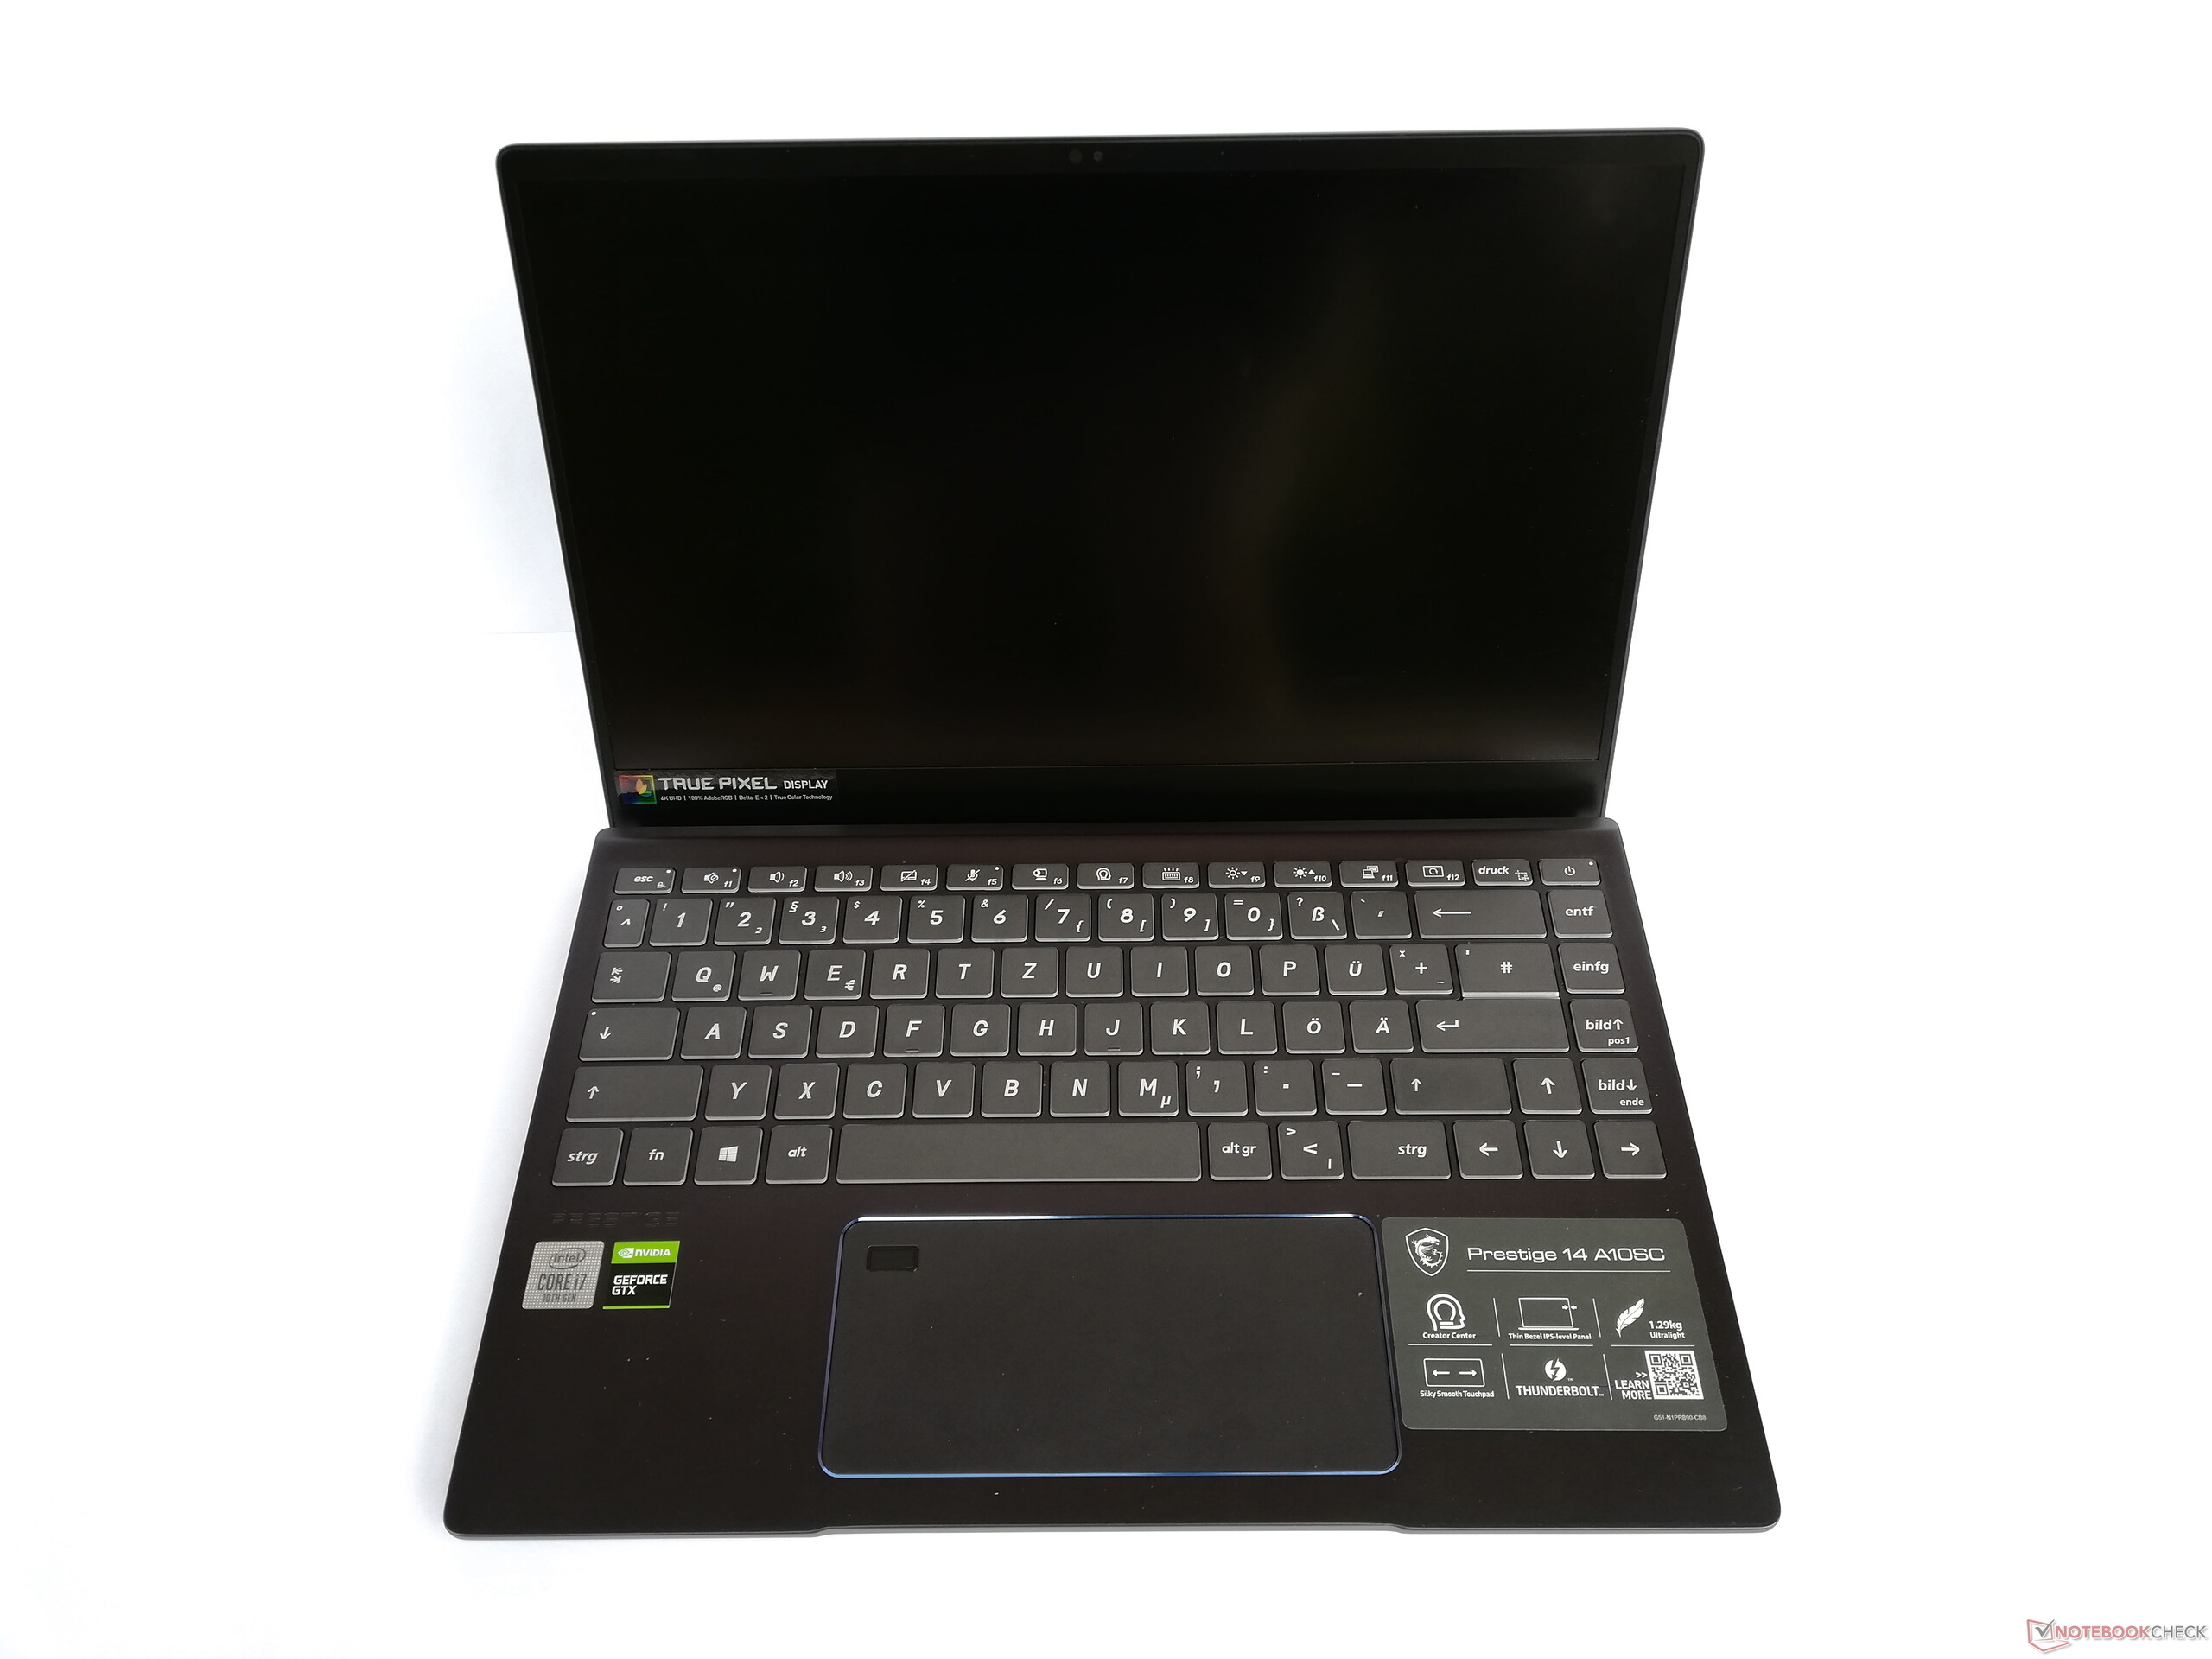
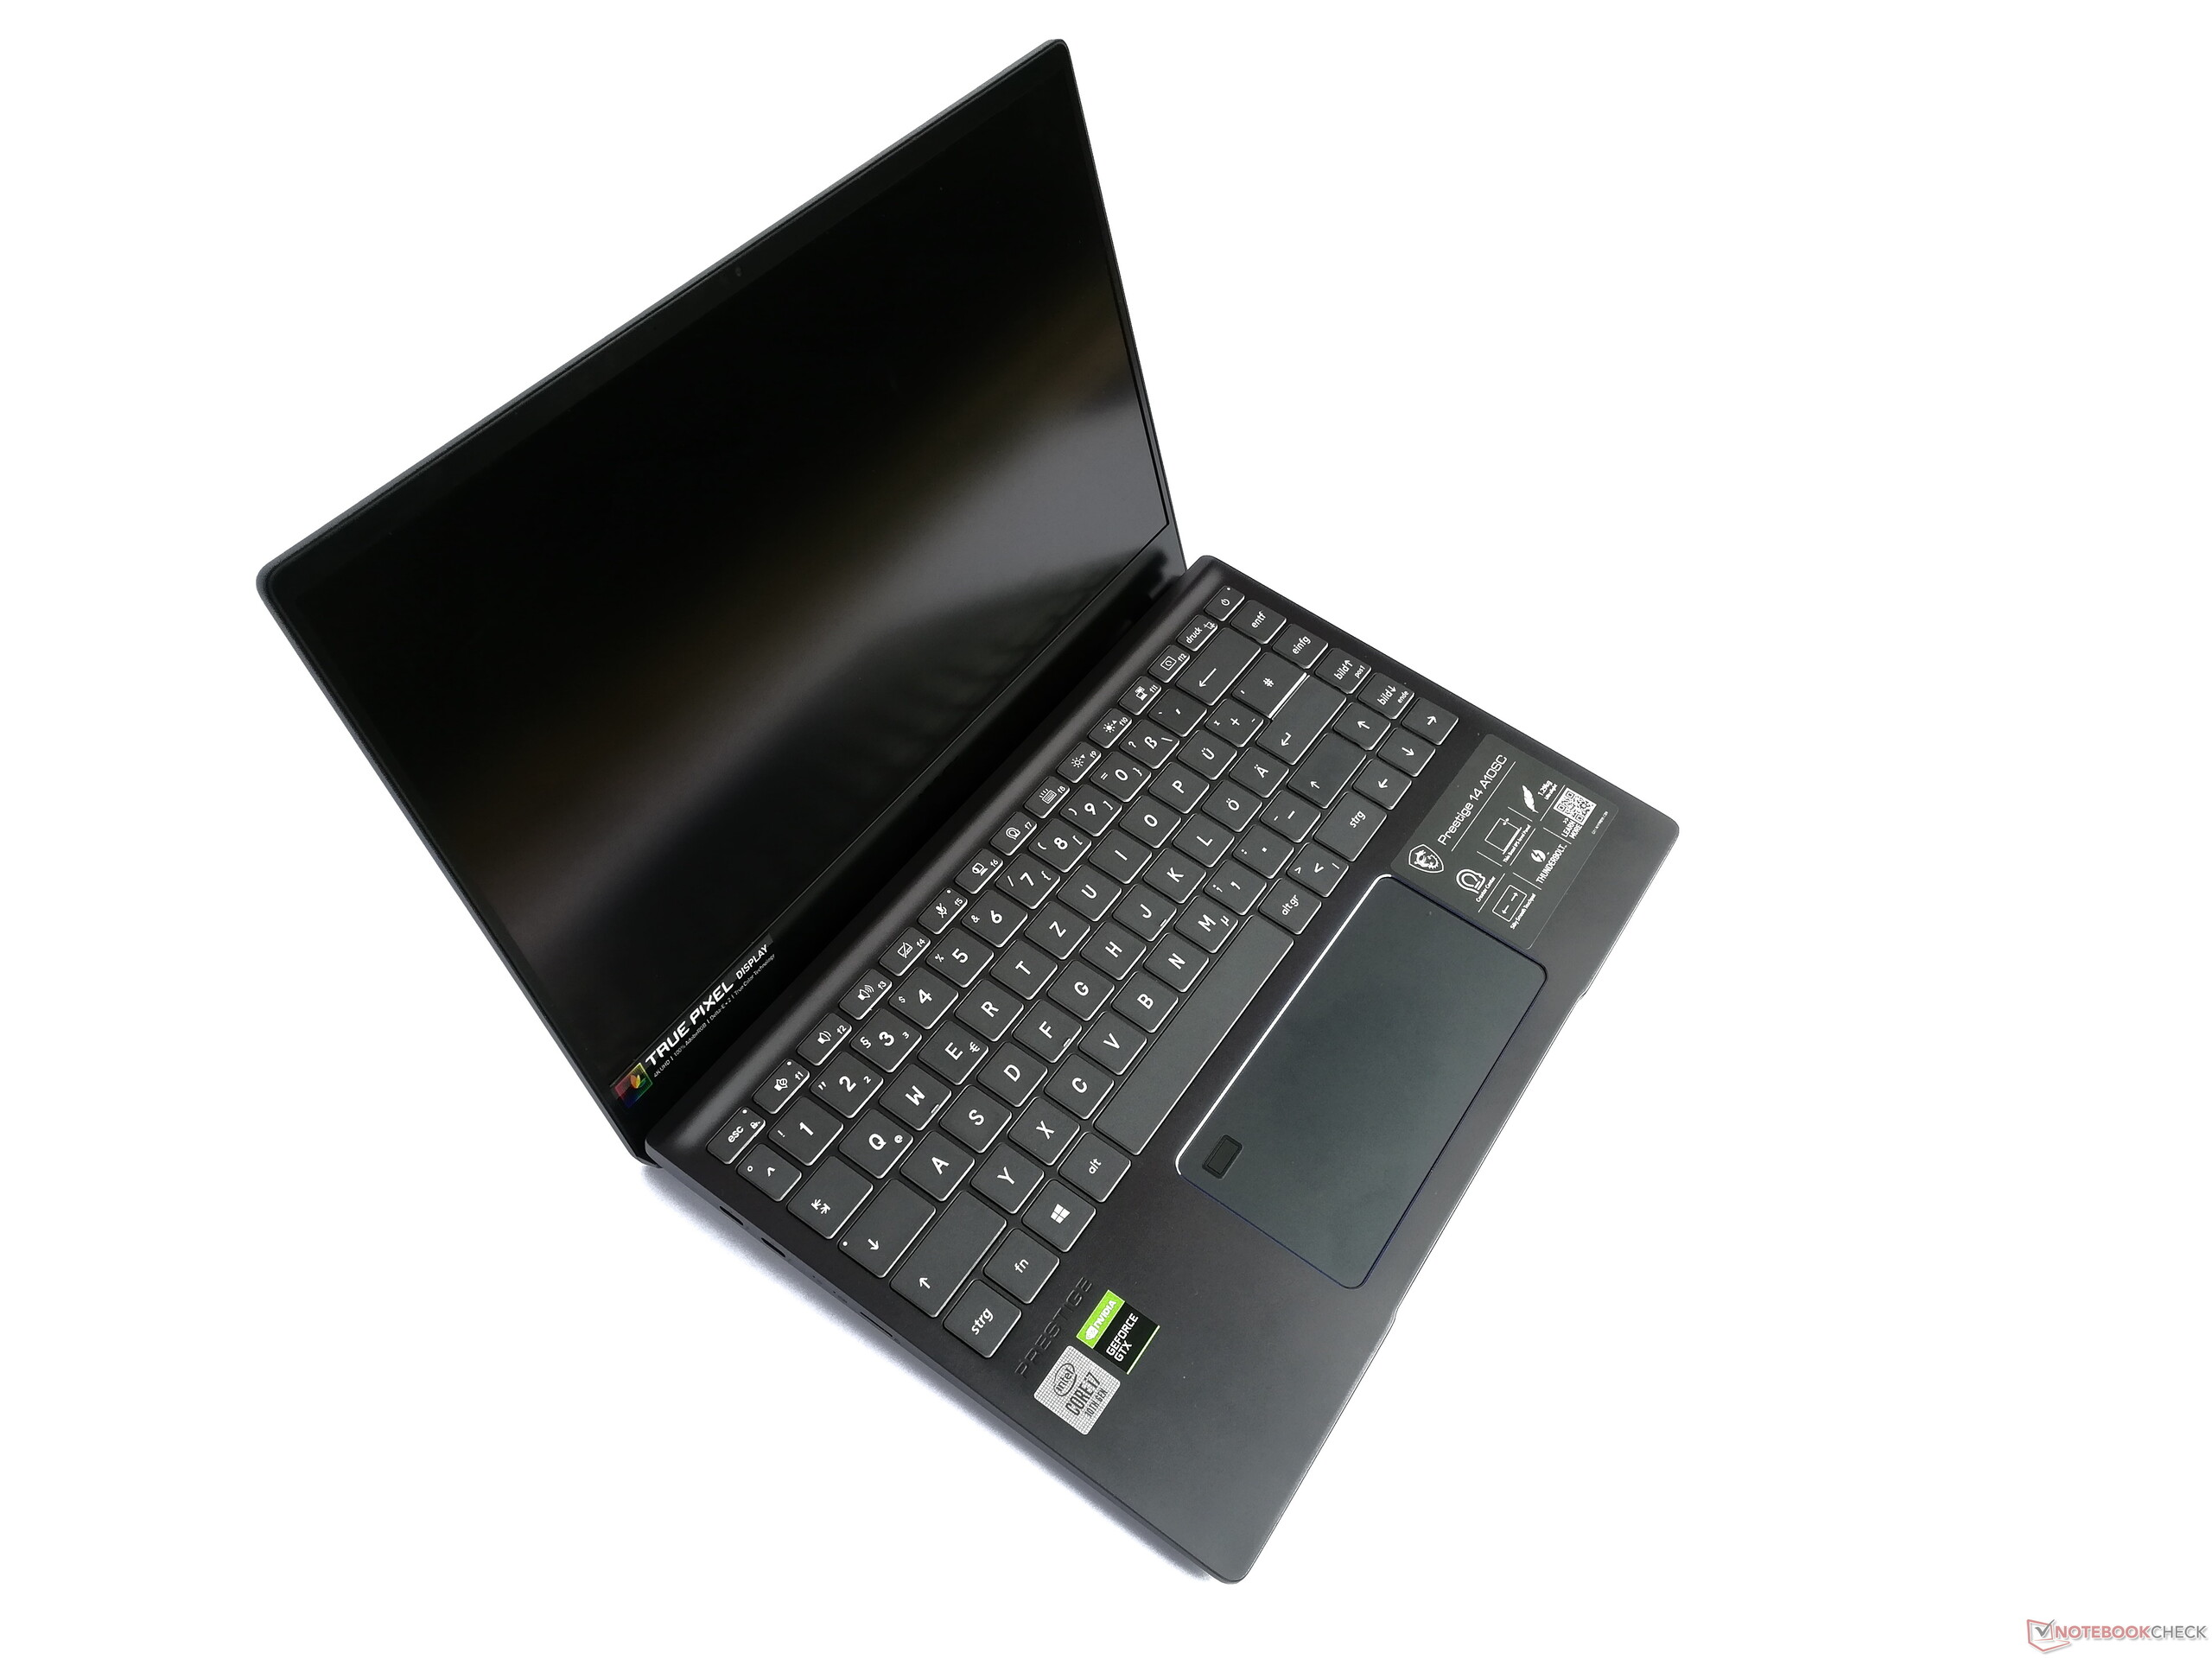
Breve Análise do Portátil MSI Prestige 14 A10SC-009: Comet Lake para criadores de conteúdo
Avaliação | Data | Modelo | Peso | Altura | Size | Resolução | Preço |
|---|---|---|---|---|---|---|---|
| 84.2 % v7 (old) | 02/2020 | MSI Prestige 14 A10SC-009 i7-10710U, GeForce GTX 1650 Max-Q | 1.3 kg | 16 mm | 14.00" | 3840x2160 | |
| 85.2 % v7 (old) | 11/2019 | MSI Prestige 15 A10SC i7-10710U, GeForce GTX 1650 Max-Q | 1.7 kg | 16 mm | 15.60" | 3840x2160 | |
| 83.7 % v7 (old) | 11/2019 | Razer Blade Stealth 13, Core i7-1065G7 i7-1065G7, GeForce GTX 1650 Max-Q | 1.5 kg | 15.3 mm | 13.30" | 3840x2160 | |
| 83.1 % v7 (old) | 10/2019 | Asus ZenBook 15 UX534FT-DB77 i7-8565U, GeForce GTX 1650 Max-Q | 1.7 kg | 18.9 mm | 15.60" | 1920x1080 | |
| 80.8 % v7 (old) | 10/2019 | HP ZBook 15u G6 6TP54EA i7-8565U, Radeon Pro WX 3200 | 1.6 kg | 19 mm | 15.60" | 3840x2160 |
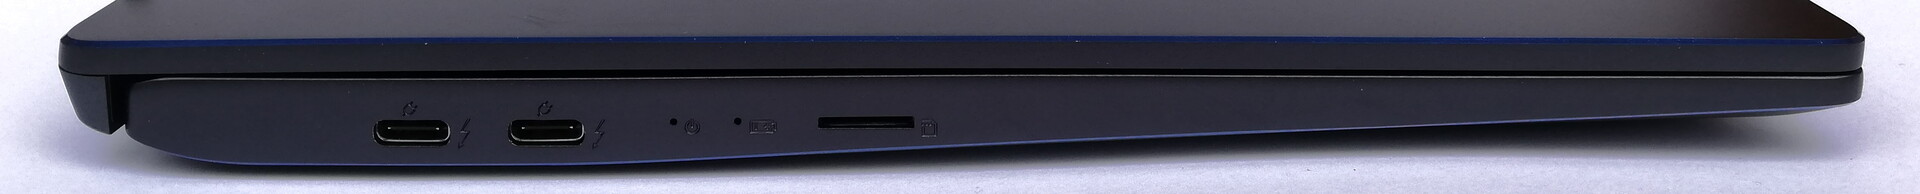
| SD Card Reader | |
| average JPG Copy Test (av. of 3 runs) | |
| MSI Prestige 15 A10SC (Toshiba Exceria Pro M501 UHS-II) | |
| MSI Prestige 14 A10SC-009 (Toshiba Exceria Pro M501 microSDXC 64GB) | |
| Média da turma Multimedia (23 - 531, n=43, últimos 2 anos) | |
| Asus ZenBook 15 UX534FT-DB77 (Toshiba Exceria Pro SDXC 64 GB UHS-II) | |
| maximum AS SSD Seq Read Test (1GB) | |
| MSI Prestige 15 A10SC (Toshiba Exceria Pro M501 UHS-II) | |
| Média da turma Multimedia (27.9 - 1455, n=42, últimos 2 anos) | |
| MSI Prestige 14 A10SC-009 (Toshiba Exceria Pro M501 microSDXC 64GB) | |
| Asus ZenBook 15 UX534FT-DB77 (Toshiba Exceria Pro SDXC 64 GB UHS-II) | |
| |||||||||||||||||||||||||
iluminação: 86 %
iluminação com acumulador: 567 cd/m²
Contraste: 1274:1 (Preto: 0.445 cd/m²)
ΔE ColorChecker Calman: 1.55 | ∀{0.5-29.43 Ø4.72}
calibrated: 1.24
ΔE Greyscale Calman: 1.48 | ∀{0.09-98 Ø4.97}
Gamma: 2.19
CCT: 6741 K
| MSI Prestige 14 A10SC-009 IPS, 3840x2160, 14" | MSI Prestige 15 A10SC Sharp LQ156D1JW42, IPS, 3840x2160, 15.6" | Razer Blade Stealth 13, Core i7-1065G7 AUO202B, IPS LED, 3840x2160, 13.3" | Asus ZenBook 15 UX534FT-DB77 BOE NV156FHM-N63, IPS, 1920x1080, 15.6" | HP ZBook 15u G6 6TP54EA AU Optronics AUO30EB, IPS, 3840x2160, 15.6" | |
|---|---|---|---|---|---|
| Display | |||||
| Display P3 Coverage (%) | 82 | 64.3 | 66.6 | 69.2 | |
| sRGB Coverage (%) | 98.3 | 95.8 | 87.7 | 97.1 | |
| AdobeRGB 1998 Coverage (%) | 96.2 | 65.7 | 64.1 | 69.7 | |
| Response Times | -12% | -11% | 17% | -4% | |
| Response Time Grey 50% / Grey 80% * (ms) | 55 ? | 60 ? -9% | 62 ? -13% | 41.2 ? 25% | 68.8 ? -25% |
| Response Time Black / White * (ms) | 36 ? | 41.2 ? -14% | 39 ? -8% | 33.2 ? 8% | 29.6 18% |
| PWM Frequency (Hz) | 26040 ? | ||||
| Screen | -42% | -55% | -100% | -49% | |
| Brightness middle (cd/m²) | 567 | 464.5 -18% | 353 -38% | 312.6 -45% | 451 -20% |
| Brightness (cd/m²) | 516 | 451 -13% | 335 -35% | 290 -44% | 434 -16% |
| Brightness Distribution (%) | 86 | 92 7% | 90 5% | 85 -1% | 89 3% |
| Black Level * (cd/m²) | 0.445 | 0.5 -12% | 0.25 44% | 0.31 30% | 0.25 44% |
| Contrast (:1) | 1274 | 929 -27% | 1412 11% | 1008 -21% | 1804 42% |
| Colorchecker dE 2000 * | 1.55 | 3.36 -117% | 4.4 -184% | 5.78 -273% | 4.4 -184% |
| Colorchecker dE 2000 max. * | 5.14 | 7.06 -37% | 7.21 -40% | 8.86 -72% | 6.7 -30% |
| Colorchecker dE 2000 calibrated * | 1.24 | 3.42 -176% | 1.1 11% | 3.78 -205% | 1.8 -45% |
| Greyscale dE 2000 * | 1.48 | 1.3 12% | 5.49 -271% | 5.4 -265% | 5 -238% |
| Gamma | 2.19 100% | 2.14 103% | 2.26 97% | 2.21 100% | 2.31 95% |
| CCT | 6741 96% | 6596 99% | 7689 85% | 7864 83% | 7717 84% |
| Color Space (Percent of AdobeRGB 1998) (%) | 84.8 | 61 | 57.1 | 63 | |
| Color Space (Percent of sRGB) (%) | 98.3 | 96 | 87.4 | 97 | |
| Média Total (Programa/Configurações) | -27% /
-37% | -33% /
-47% | -42% /
-78% | -27% /
-41% |
* ... menor é melhor
Exibir tempos de resposta
| ↔ Tempo de resposta preto para branco | ||
|---|---|---|
| 36 ms ... ascensão ↗ e queda ↘ combinadas | ↗ 22 ms ascensão | 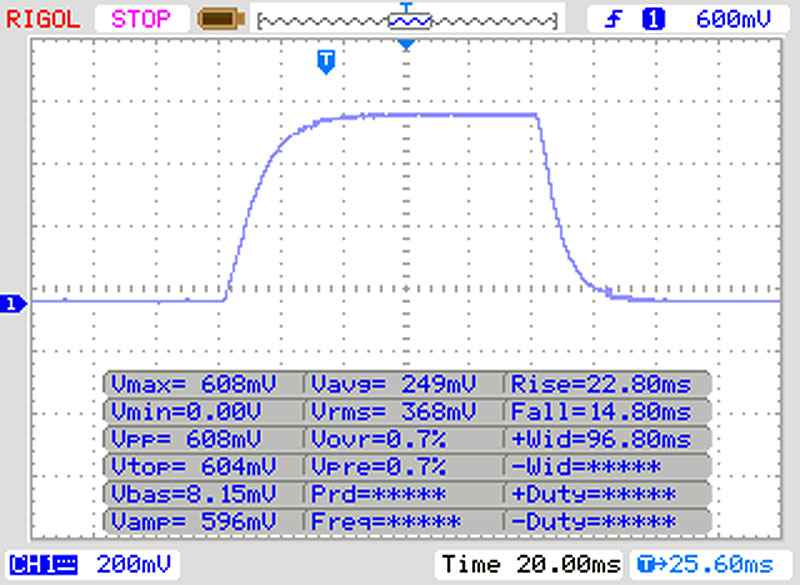 |
| ↘ 14 ms queda | ||
| A tela mostra taxas de resposta lentas em nossos testes e será insatisfatória para os jogadores. Em comparação, todos os dispositivos testados variam de 0.1 (mínimo) a 240 (máximo) ms. » 94 % de todos os dispositivos são melhores. Isso significa que o tempo de resposta medido é pior que a média de todos os dispositivos testados (19.8 ms). | ||
| ↔ Tempo de resposta 50% cinza a 80% cinza | ||
| 55 ms ... ascensão ↗ e queda ↘ combinadas | ↗ 27 ms ascensão | 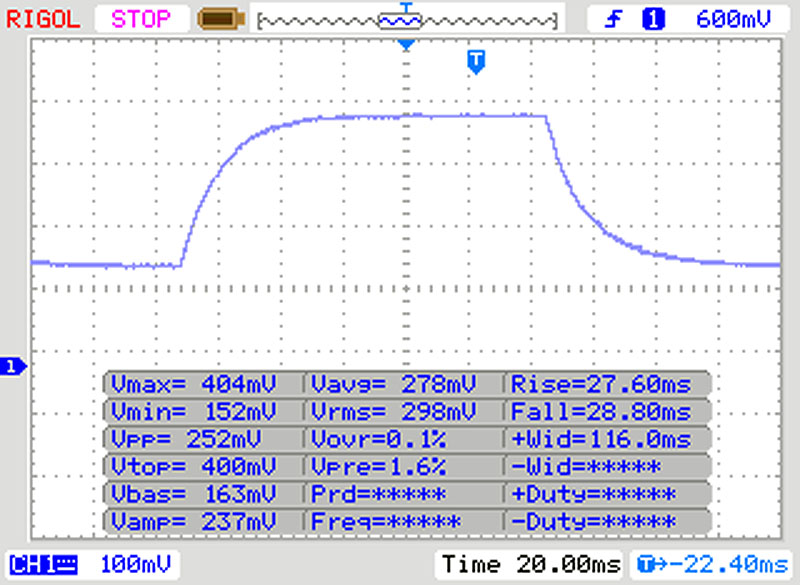 |
| ↘ 28 ms queda | ||
| A tela mostra taxas de resposta lentas em nossos testes e será insatisfatória para os jogadores. Em comparação, todos os dispositivos testados variam de 0.165 (mínimo) a 636 (máximo) ms. » 92 % de todos os dispositivos são melhores. Isso significa que o tempo de resposta medido é pior que a média de todos os dispositivos testados (31 ms). | ||
Cintilação da tela / PWM (modulação por largura de pulso)
| Tela tremeluzindo / PWM não detectado |  | ||
[pwm_comparison] Em comparação: 52 % de todos os dispositivos testados não usam PWM para escurecer a tela. Se PWM foi detectado, uma média de 7781 (mínimo: 5 - máximo: 343500) Hz foi medida. | |||

| PCMark 8 Home Score Accelerated v2 | 3511 pontos | |
| PCMark 8 Work Score Accelerated v2 | 4422 pontos | |
| PCMark 10 Score | 5150 pontos | |
Ajuda | ||
| MSI Prestige 14 A10SC-009 Samsung SSD PM981 MZVLB1T0HALR | MSI Prestige 15 A10SC Samsung SSD PM981 MZVLB1T0HALR | Razer Blade Stealth 13, Core i7-1065G7 Lite-On CA3-8D512 | Asus ZenBook 15 UX534FT-DB77 Samsung SSD PM981 MZVLB1T0HALR | HP ZBook 15u G6 6TP54EA Samsung SSD PM981 MZVLB512HAJQ | Média Samsung SSD PM981 MZVLB1T0HALR | |
|---|---|---|---|---|---|---|
| CrystalDiskMark 5.2 / 6 | -14% | 10% | 6% | -6% | 2% | |
| Write 4K (MB/s) | 163.8 | 150.8 -8% | 153 -7% | 141.6 -14% | 156 -5% | 165.7 ? 1% |
| Read 4K (MB/s) | 48.6 | 47.3 -3% | 59.5 22% | 45.28 -7% | 45.73 -6% | 44.6 ? -8% |
| Write Seq (MB/s) | 2269 | 981 -57% | 1608 -29% | 1975 -13% | 1158 -49% | 1982 ? -13% |
| Read Seq (MB/s) | 1963 | 976 -50% | 2293 17% | 2272 16% | 1132 -42% | 1764 ? -10% |
| Write 4K Q32T1 (MB/s) | 289.8 | 442.7 53% | 497 71% | 458.6 58% | 369.2 27% | 395 ? 36% |
| Read 4K Q32T1 (MB/s) | 373.6 | 499.7 34% | 544 46% | 391.4 5% | 573 53% | 434 ? 16% |
| Write Seq Q32T1 (MB/s) | 2395 | 1706 -29% | 1640 -32% | 2393 0% | 1969 -18% | 2351 ? -2% |
| Read Seq Q32T1 (MB/s) | 3479 | 1758 -49% | 3158 -9% | 3464 0% | 3138 -10% | 3234 ? -7% |
| Write 4K Q8T8 (MB/s) | 960 | 1408 ? | ||||
| Read 4K Q8T8 (MB/s) | 844 | 1449 ? | ||||
| AS SSD | -15% | -26% | -13% | 2% | -4% | |
| Seq Read (MB/s) | 2300 | 1274 -45% | 2666 16% | 1887 -18% | 2083 -9% | 1993 ? -13% |
| Seq Write (MB/s) | 2051 | 1395 -32% | 1497 -27% | 1432 -30% | 1715 -16% | 2036 ? -1% |
| 4K Read (MB/s) | 46.23 | 50.3 9% | 53.7 16% | 52.3 13% | 55.3 20% | 46.4 ? 0% |
| 4K Write (MB/s) | 84.6 | 119.8 42% | 133.7 58% | 146 73% | 137.6 63% | 109.7 ? 30% |
| 4K-64 Read (MB/s) | 1552 | 1599 3% | 652 -58% | 969 -38% | 1211 -22% | 1502 ? -3% |
| 4K-64 Write (MB/s) | 1789 | 1455 -19% | 272 -85% | 1375 -23% | 1446 -19% | 1625 ? -9% |
| Access Time Read * (ms) | 0.049 | 0.044 10% | 0.075 -53% | 0.034 31% | 0.039 20% | 0.05158 ? -5% |
| Access Time Write * (ms) | 0.045 | 0.092 -104% | 0.032 29% | 0.075 -67% | 0.026 42% | 0.05581 ? -24% |
| Score Read (Points) | 1828 | 1777 -3% | 972 -47% | 1210 -34% | 1474 -19% | 1747 ? -4% |
| Score Write (Points) | 2079 | 1714 -18% | 555 -73% | 1664 -20% | 1755 -16% | 1942 ? -7% |
| Score Total (Points) | 4831 | 4411 -9% | 1982 -59% | 3483 -28% | 3976 -18% | 4588 ? -5% |
| Média Total (Programa/Configurações) | -15% /
-14% | -8% /
-11% | -4% /
-5% | -2% /
-1% | -1% /
-1% |
* ... menor é melhor

| 3DMark 11 Performance | 10232 pontos | |
| 3DMark Cloud Gate Standard Score | 14259 pontos | |
| 3DMark Fire Strike Score | 6517 pontos | |
Ajuda | ||
| BioShock Infinite - 1920x1080 Ultra Preset, DX11 (DDOF) | |
| MSI Prestige 15 A10SC | |
| Média NVIDIA GeForce GTX 1650 Max-Q (70.2 - 84.3, n=7) | |
| Asus ZenBook 15 UX534FT-DB77 | |
| Razer Blade Stealth 13, Core i7-1065G7 | |
| MSI Prestige 14 A10SC-009 | |
| HP ZBook 15u G6 6TP54EA | |
| Dota 2 Reborn | |
| 3840x2160 ultra (3/3) best looking | |
| Média da turma Multimedia (106.4 - 139.3, n=4, últimos 2 anos) | |
| HP ZBook 15u G6 6TP54EA | |
| 1920x1080 ultra (3/3) best looking | |
| Média da turma Multimedia (29 - 179.9, n=67, últimos 2 anos) | |
| Média NVIDIA GeForce GTX 1650 Max-Q (64.4 - 105.6, n=5) | |
| MSI Prestige 14 A10SC-009 | |
| HP ZBook 15u G6 6TP54EA | |
| 1920x1080 high (2/3) | |
| Média NVIDIA GeForce GTX 1650 Max-Q (71.2 - 128, n=5) | |
| Média da turma Multimedia (31.1 - 196.9, n=67, últimos 2 anos) | |
| MSI Prestige 14 A10SC-009 | |
| HP ZBook 15u G6 6TP54EA | |
| Final Fantasy XV Benchmark | |
| 3840x2160 High Quality | |
| Média da turma Multimedia (42 - 83.4, n=4, últimos 2 anos) | |
| Média NVIDIA GeForce GTX 1650 Max-Q (8.7 - 9.6, n=2) | |
| MSI Prestige 14 A10SC-009 | |
| 1920x1080 High Quality | |
| Média da turma Multimedia (7.61 - 144.4, n=65, últimos 2 anos) | |
| Média NVIDIA GeForce GTX 1650 Max-Q (23.1 - 33.1, n=3) | |
| MSI Prestige 14 A10SC-009 | |
| 1920x1080 Standard Quality | |
| Média da turma Multimedia (11.4 - 181.1, n=65, últimos 2 anos) | |
| Média NVIDIA GeForce GTX 1650 Max-Q (36.7 - 45.7, n=3) | |
| MSI Prestige 14 A10SC-009 | |
| 1280x720 Lite Quality | |
| Média da turma Multimedia (21.4 - 232, n=64, últimos 2 anos) | |
| Média NVIDIA GeForce GTX 1650 Max-Q (51.7 - 91.2, n=2) | |
| MSI Prestige 14 A10SC-009 | |
| baixo | média | alto | ultra | 4K | |
|---|---|---|---|---|---|
| BioShock Infinite (2013) | 70.2 | ||||
| Dota 2 Reborn (2015) | 86.2 | 76.5 | 71.2 | 64.4 | |
| Final Fantasy XV Benchmark (2018) | 51.7 | 36.7 | 23.1 | 8.7 | |
| Star Wars Jedi Fallen Order (2019) | 50.4 | 40.3 | 39.6 | 12.7 |
Barulho
| Ocioso |
| 30.3 / 30.3 / 30.3 dB |
| Carga |
| 40.2 / 43.5 dB |
 | ||
30 dB silencioso 40 dB(A) audível 50 dB(A) ruidosamente alto |
||
min: | ||
(-) A temperatura máxima no lado superior é 48 °C / 118 F, em comparação com a média de 36.8 °C / 98 F , variando de 21 a 71 °C para a classe Multimedia.
(-) A parte inferior aquece até um máximo de 51 °C / 124 F, em comparação com a média de 39.1 °C / 102 F
(+) Em uso inativo, a temperatura média para o lado superior é 26.9 °C / 80 F, em comparação com a média do dispositivo de 31.3 °C / ### class_avg_f### F.
(+) Os apoios para as mãos e o touchpad estão atingindo a temperatura máxima da pele (35.2 °C / 95.4 F) e, portanto, não estão quentes.
(-) A temperatura média da área do apoio para as mãos de dispositivos semelhantes foi 28.7 °C / 83.7 F (-6.5 °C / -11.7 F).
Razer Blade Stealth 13, Core i7-1065G7 análise de áudio
(-) | alto-falantes não muito altos (###valor### dB)
Graves 100 - 315Hz
(±) | graves reduzidos - em média 14.1% menor que a mediana
(±) | a linearidade dos graves é média (13.6% delta para a frequência anterior)
Médios 400 - 2.000 Hz
(±) | médios mais altos - em média 6.2% maior que a mediana
(±) | a linearidade dos médios é média (7.2% delta para frequência anterior)
Altos 2 - 16 kHz
(+) | agudos equilibrados - apenas 1.5% longe da mediana
(+) | os máximos são lineares (5% delta da frequência anterior)
Geral 100 - 16.000 Hz
(±) | a linearidade do som geral é média (18.2% diferença em relação à mediana)
Comparado com a mesma classe
» 52% de todos os dispositivos testados nesta classe foram melhores, 7% semelhantes, 41% piores
» O melhor teve um delta de 5%, a média foi 18%, o pior foi 53%
Comparado com todos os dispositivos testados
» 39% de todos os dispositivos testados foram melhores, 8% semelhantes, 53% piores
» O melhor teve um delta de 4%, a média foi 24%, o pior foi 134%
| desligado | |
| Ocioso | |
| Carga |
|
Key:
min: | |
| MSI Prestige 14 A10SC-009 i7-10710U, GeForce GTX 1650 Max-Q, Samsung SSD PM981 MZVLB1T0HALR, IPS, 3840x2160, 14" | MSI Prestige 15 A10SC i7-10710U, GeForce GTX 1650 Max-Q, Samsung SSD PM981 MZVLB1T0HALR, IPS, 3840x2160, 15.6" | Razer Blade Stealth 13, Core i7-1065G7 i7-1065G7, GeForce GTX 1650 Max-Q, Lite-On CA3-8D512, IPS LED, 3840x2160, 13.3" | Asus ZenBook 15 UX534FT-DB77 i7-8565U, GeForce GTX 1650 Max-Q, Samsung SSD PM981 MZVLB1T0HALR, IPS, 1920x1080, 15.6" | HP ZBook 15u G6 6TP54EA i7-8565U, Radeon Pro WX 3200, Samsung SSD PM981 MZVLB512HAJQ, IPS, 3840x2160, 15.6" | Média NVIDIA GeForce GTX 1650 Max-Q | Média da turma Multimedia | |
|---|---|---|---|---|---|---|---|
| Power Consumption | -21% | -25% | -29% | 8% | -26% | -9% | |
| Idle Minimum * (Watt) | 5.2 | 6.1 -17% | 10.7 -106% | 5 4% | 5.5 -6% | 7.75 ? -49% | 5.69 ? -9% |
| Idle Average * (Watt) | 12.2 | 13.2 -8% | 13.6 -11% | 13.2 -8% | 9.8 20% | 11.8 ? 3% | 10.1 ? 17% |
| Idle Maximum * (Watt) | 14.3 | 19.2 -34% | 15.7 -10% | 24 -68% | 12 16% | 16.6 ? -16% | 12.3 ? 14% |
| Load Average * (Watt) | 67 | 75 -12% | 60 10% | 70 -4% | 59 12% | 75.2 ? -12% | 65.3 ? 3% |
| Load Maximum * (Watt) | 67 | 89.7 -34% | 71 -6% | 114 -70% | 70 -4% | 105.5 ? -57% | 112.5 ? -68% |
| Witcher 3 ultra * (Watt) | 74 | 64 | 63.3 | 51 |
* ... menor é melhor
| MSI Prestige 14 A10SC-009 i7-10710U, GeForce GTX 1650 Max-Q, 52 Wh | MSI Prestige 15 A10SC i7-10710U, GeForce GTX 1650 Max-Q, 82 Wh | Razer Blade Stealth 13, Core i7-1065G7 i7-1065G7, GeForce GTX 1650 Max-Q, 53.1 Wh | Asus ZenBook 15 UX534FT-DB77 i7-8565U, GeForce GTX 1650 Max-Q, 71 Wh | HP ZBook 15u G6 6TP54EA i7-8565U, Radeon Pro WX 3200, 56 Wh | Média da turma Multimedia | |
|---|---|---|---|---|---|---|
| Duração da bateria | 41% | -11% | 66% | 17% | 79% | |
| Reader / Idle (h) | 9.9 | 19.1 93% | 8.3 -16% | 21.5 117% | 12.4 25% | 25.2 ? 155% |
| WiFi v1.3 (h) | 5.9 | 7.6 29% | 5.5 -7% | 8.4 42% | 6.9 17% | 12 ? 103% |
| Load (h) | 2.1 | 2.1 0% | 1.9 -10% | 2.9 38% | 2.3 10% | 1.675 ? -20% |
Pro
Contra
Veredicto - Bom desempenho com trocas
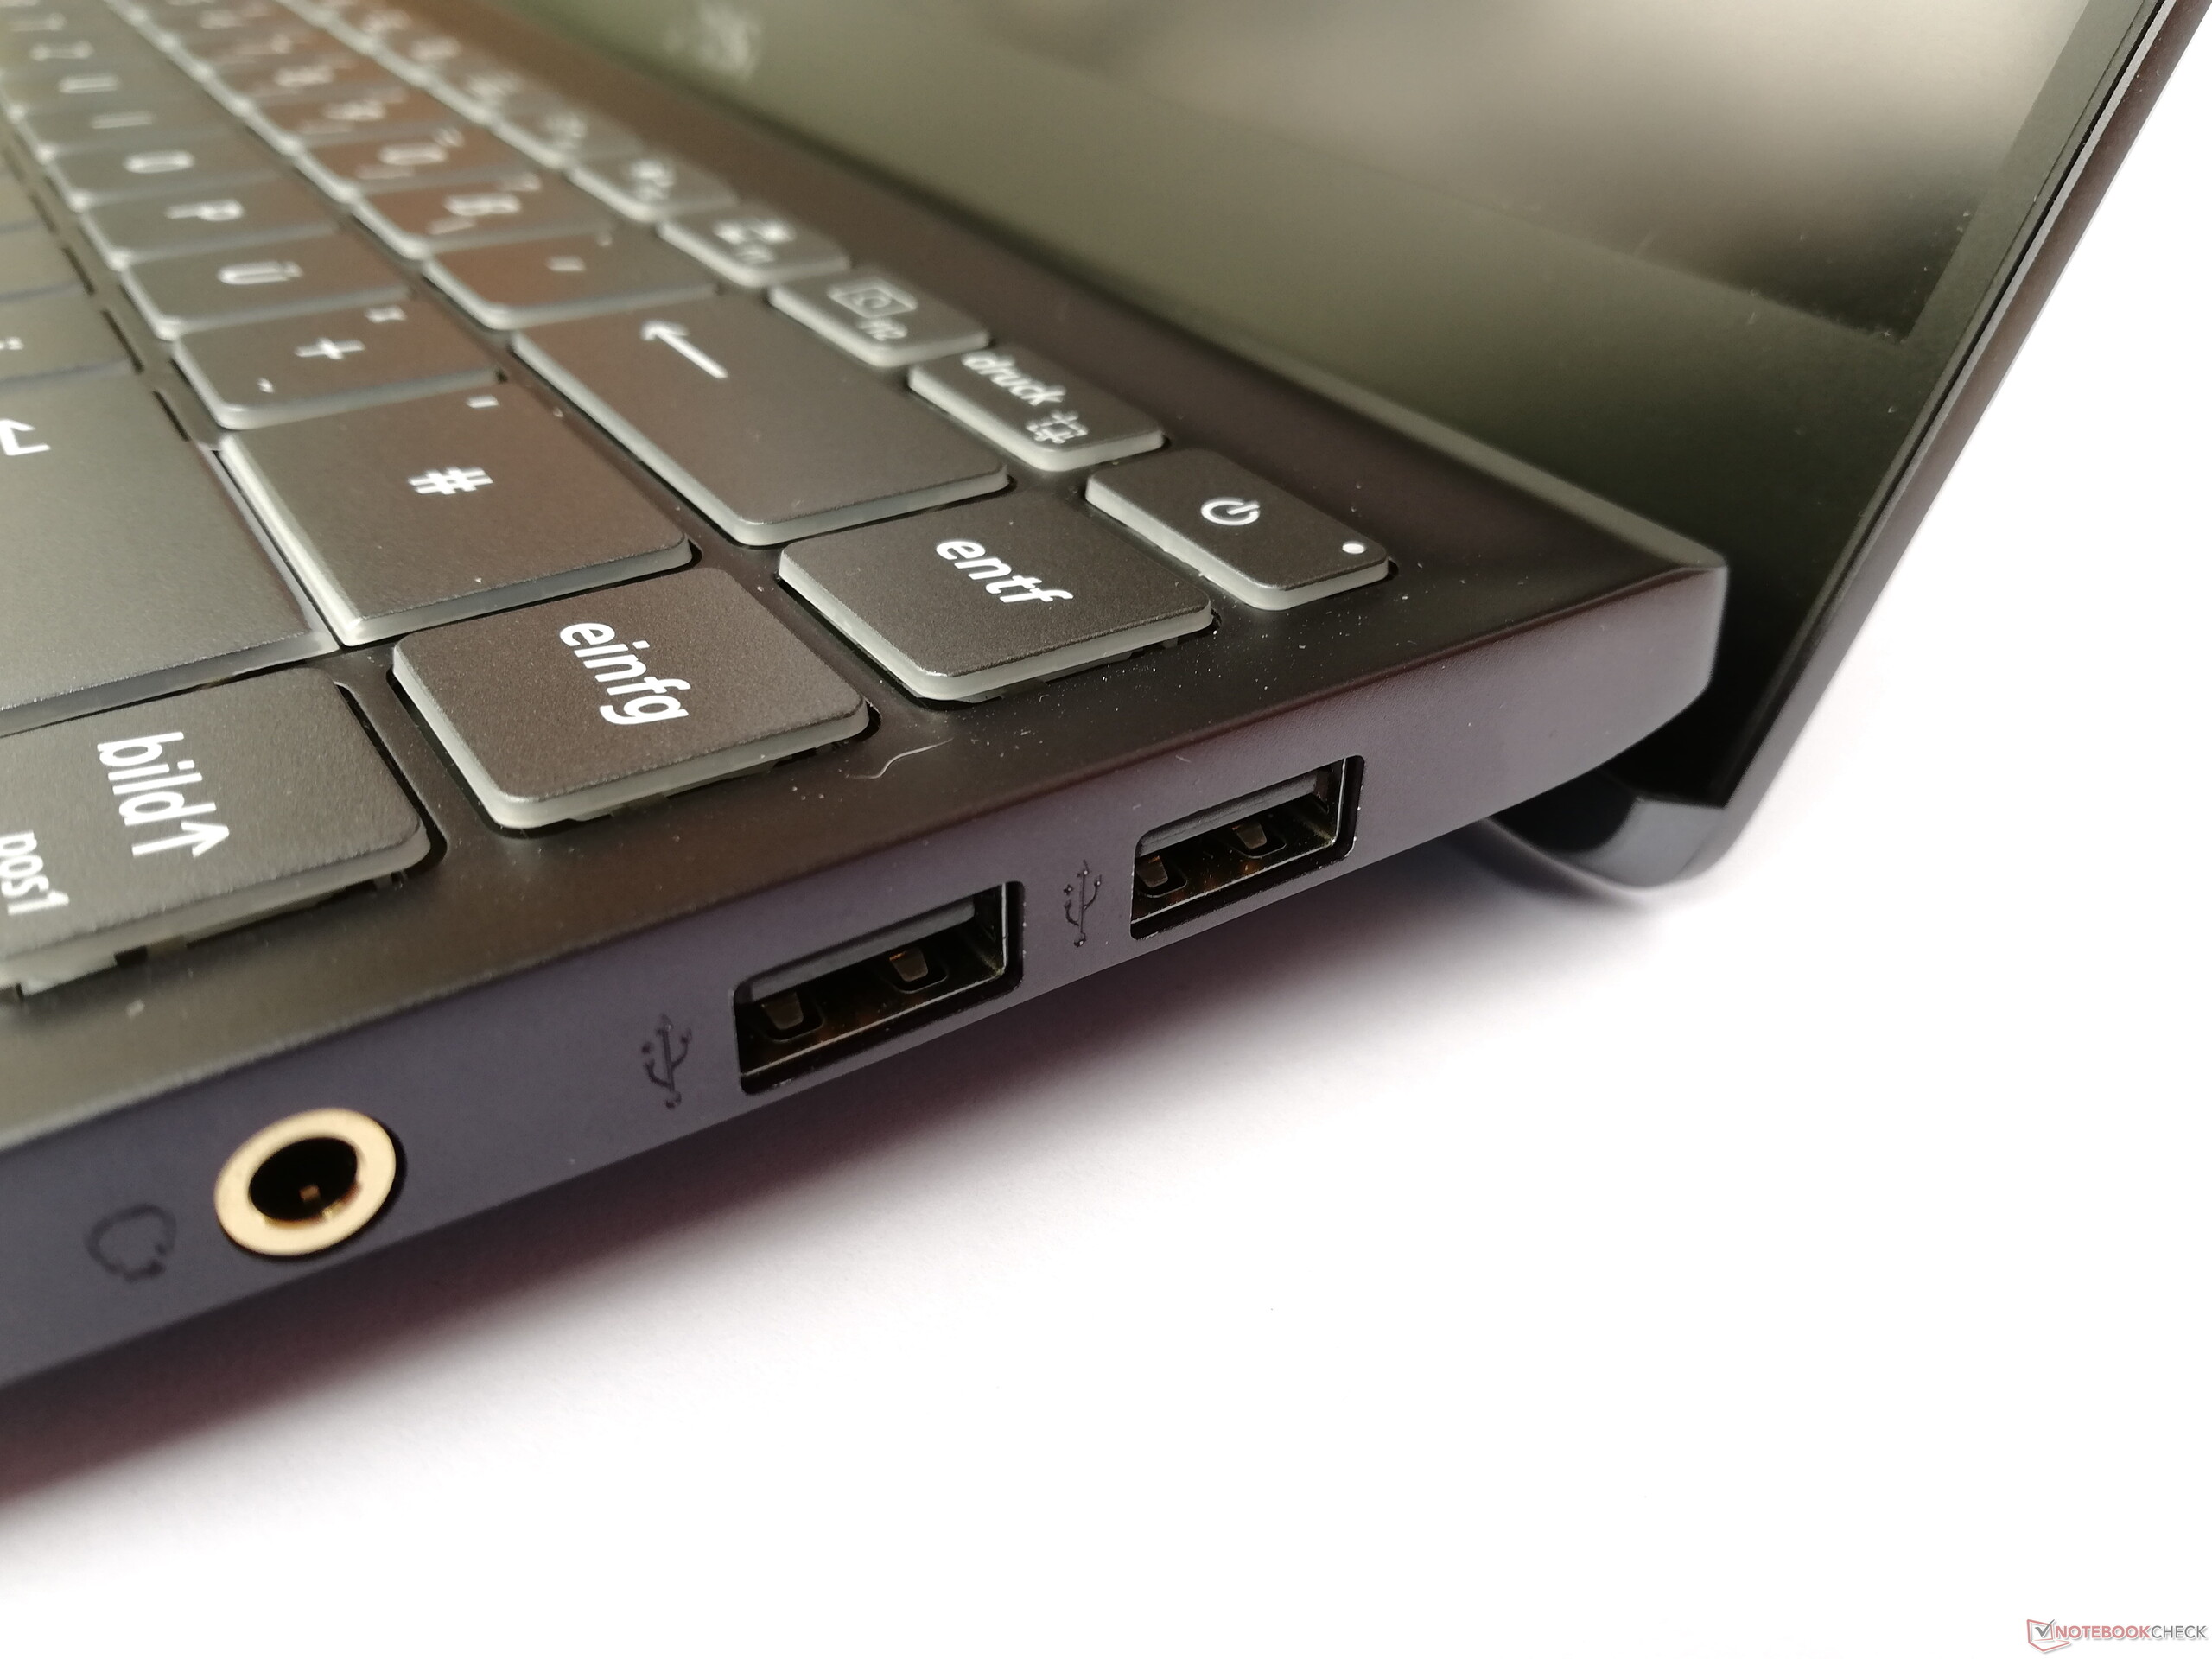
O MSI Prestige provou ser um portátil contraditório em nosso teste. O desempenho é bom, mas cai um pouco mais fortemente do que no nosso teste em setembro de 2019. A tela já está excelentemente calibrada e também possui uma boa relação de contraste, mas o valor do preto ligeiramente aumentado e a concorrência parcialmente melhor nublam esse ponto também. A tela já está excelentemente calibrada e também possui uma boa taxa de contraste, mas o valor do preto ligeiramente aumentado e a concorrência parcialmente melhor nublam esse ponto também. Como não há porta HDMI, as duas portas Thunderbolt serão bloqueadas em casos extremos, pelo que uma estação docking correspondente remediará isso naturalmente.
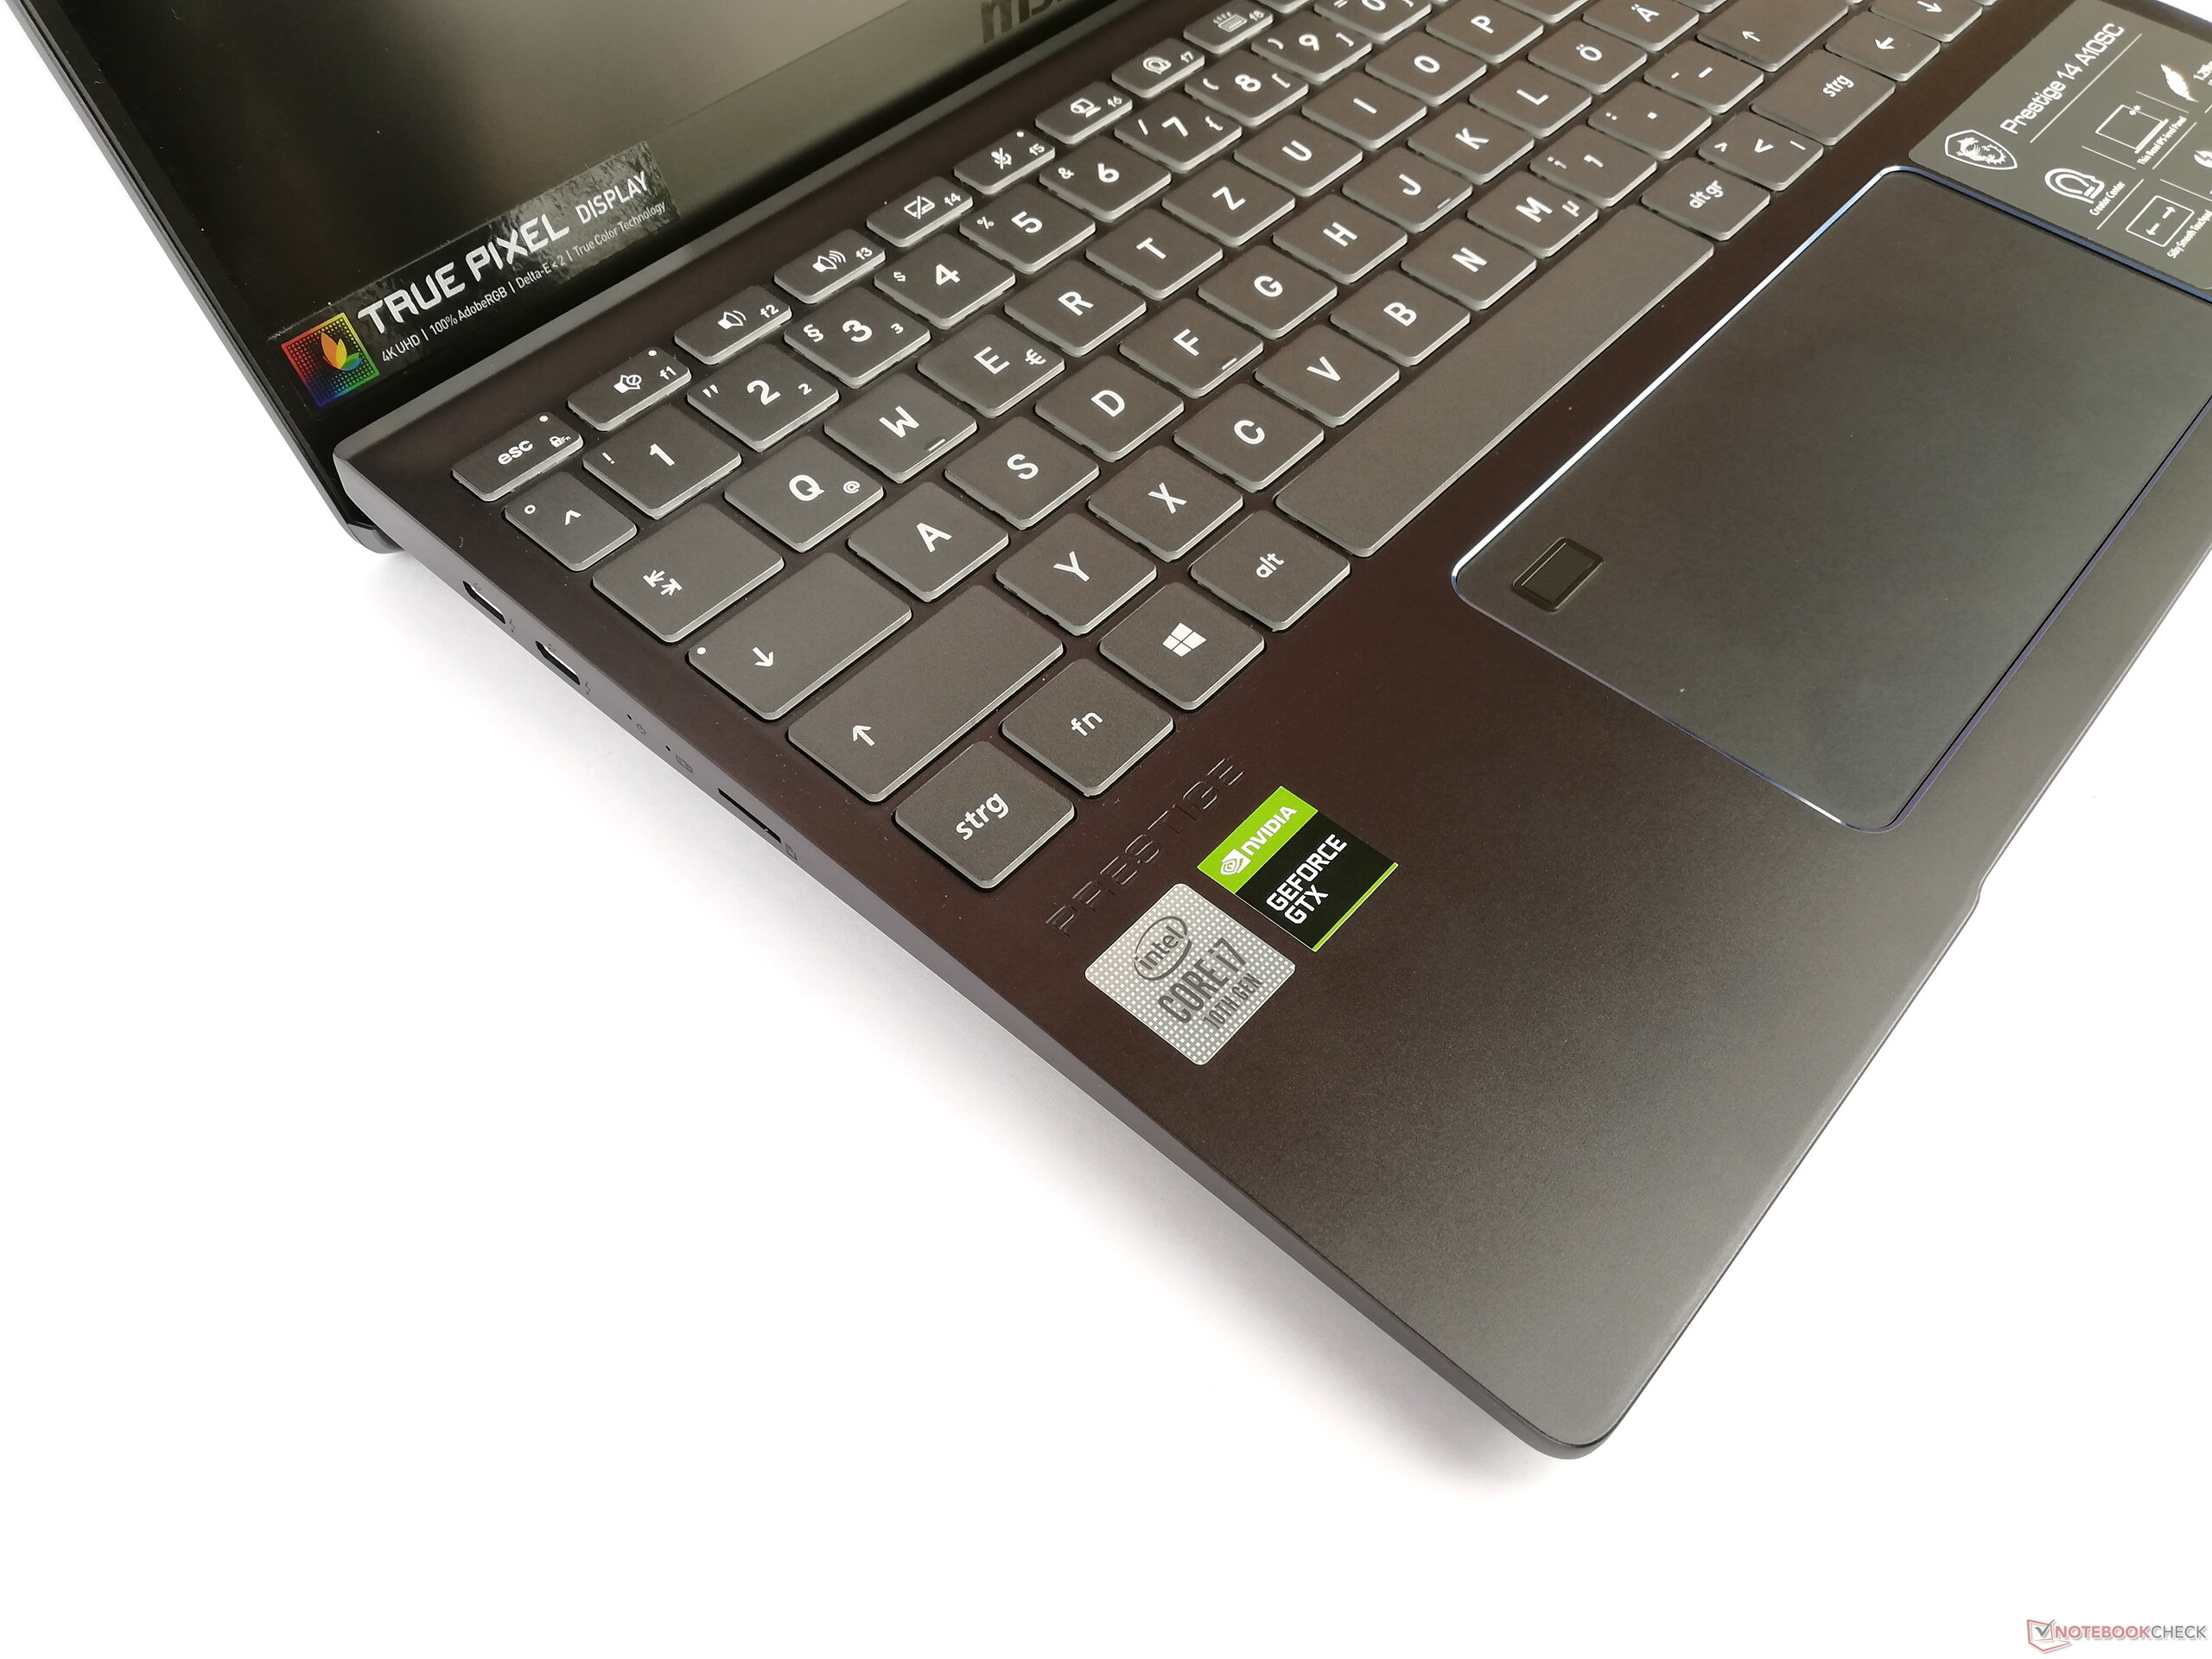
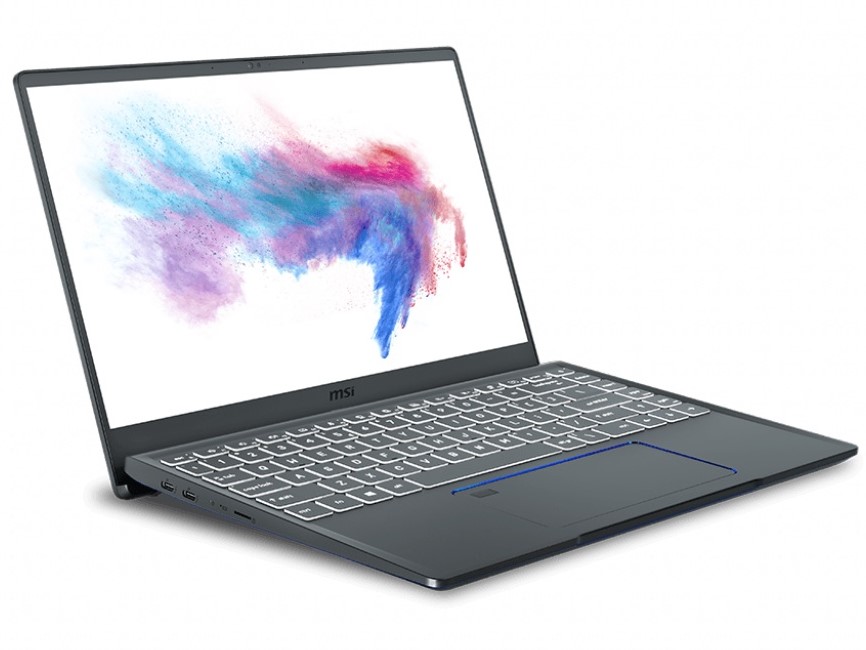
O MSI Prestige 14 traz muito poder. Mas os compradores também devem aceitar alguns compromissos.
Mas tudo isto sendo muito minucioso. O Prestige 14 é equipado com bom desempenho para seu tamanho e oferece muito hardware por seu preço. Quase não existem opções de manutenção disponíveis, e os compromissos que precisam ser feitos, por exemplo, na duração da bateria com a tela 4K, podem ser avaliados por qualquer comprador em potencial. Quem optar por comprar esse portátil não ficará decepcionado, mas também é recomendável dar uma olhada na concorrência.
MSI Prestige 14 A10SC-009
- 02/17/2020 v7 (old)
Mike Wobker