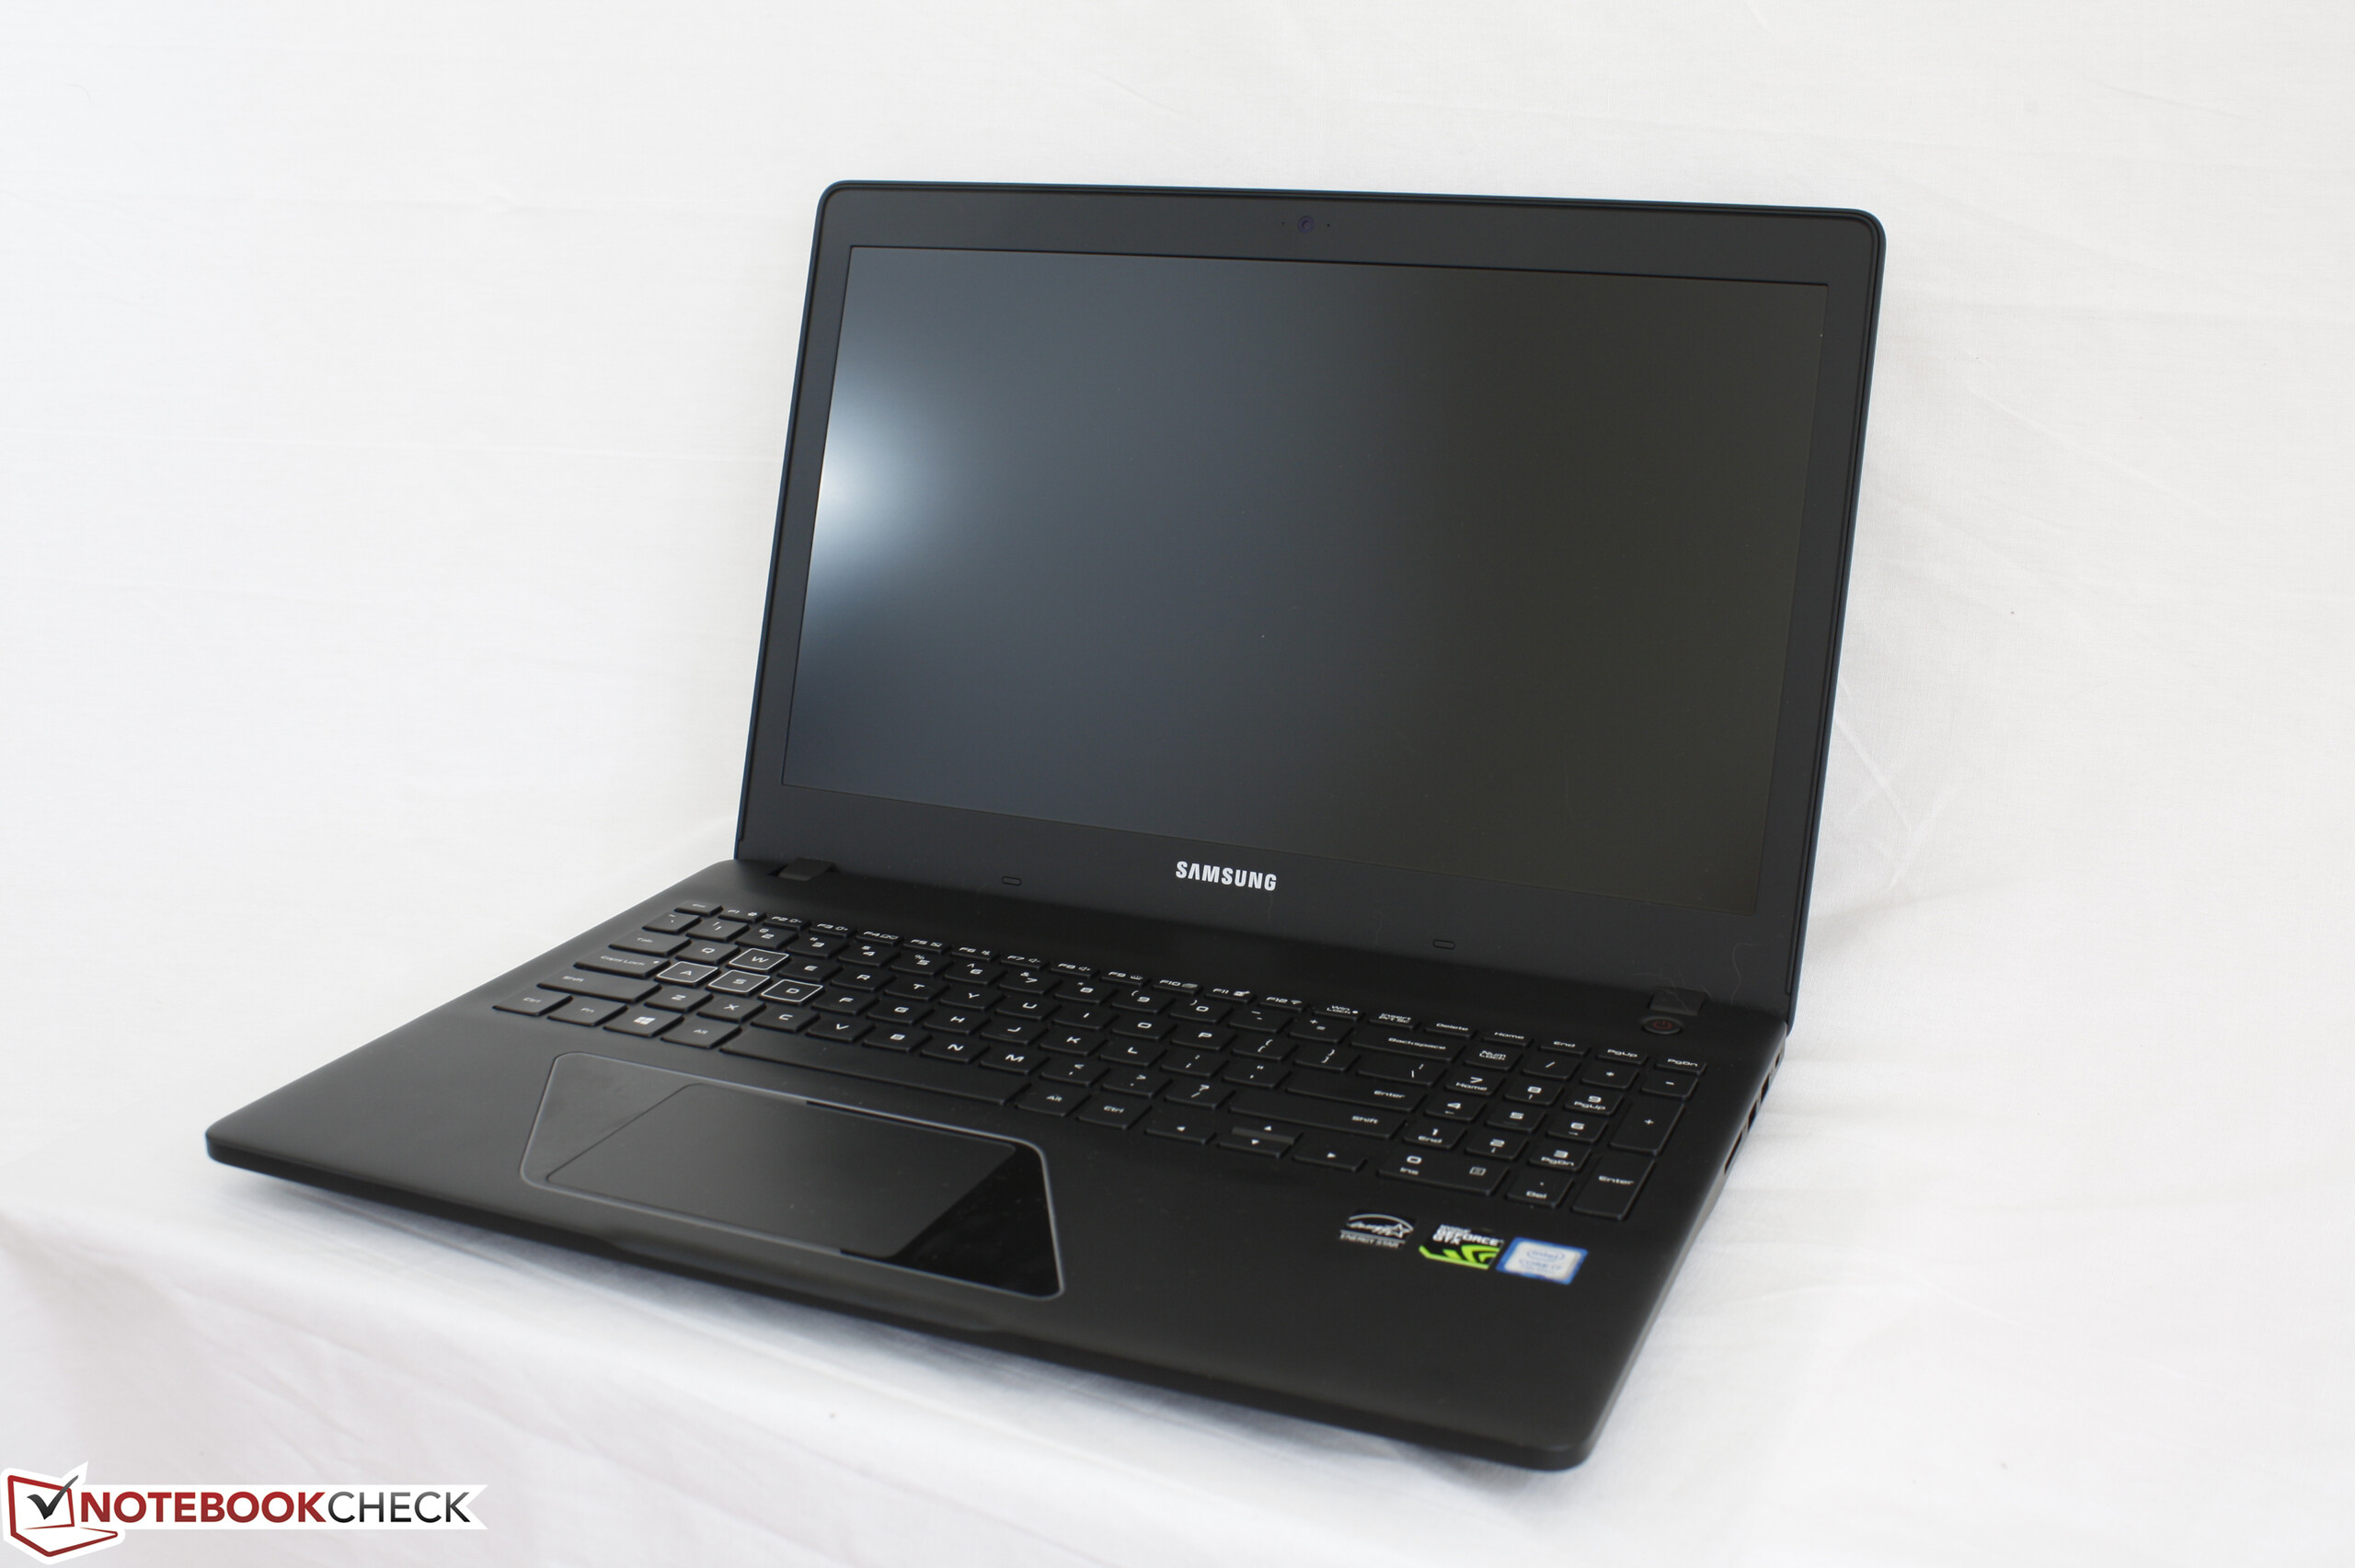
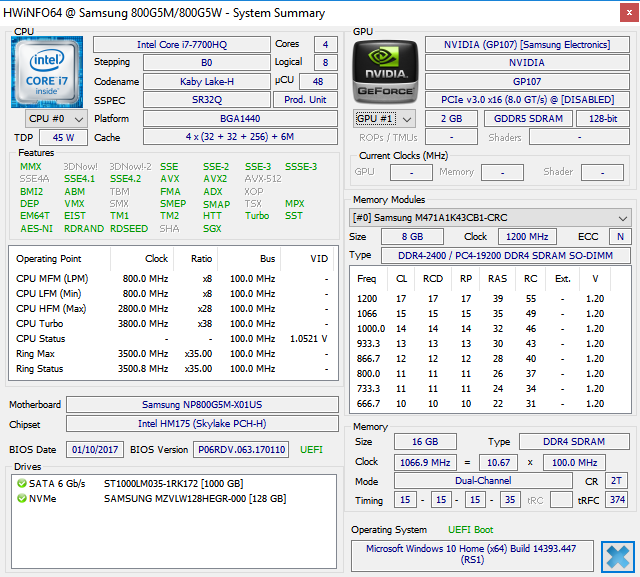
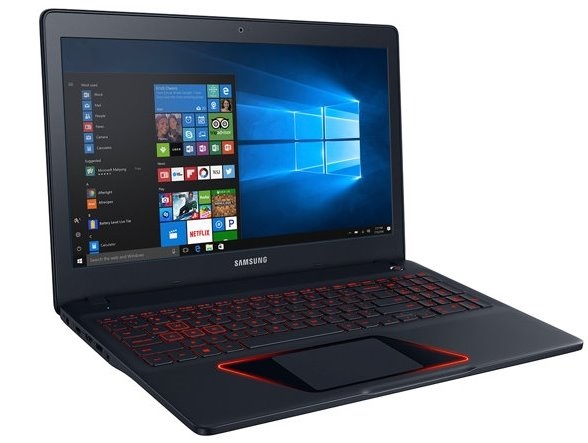
Breve Análise do Portátil Samsung Odyssey NP800G5M (7700HQ, FHD, GTX 1050)
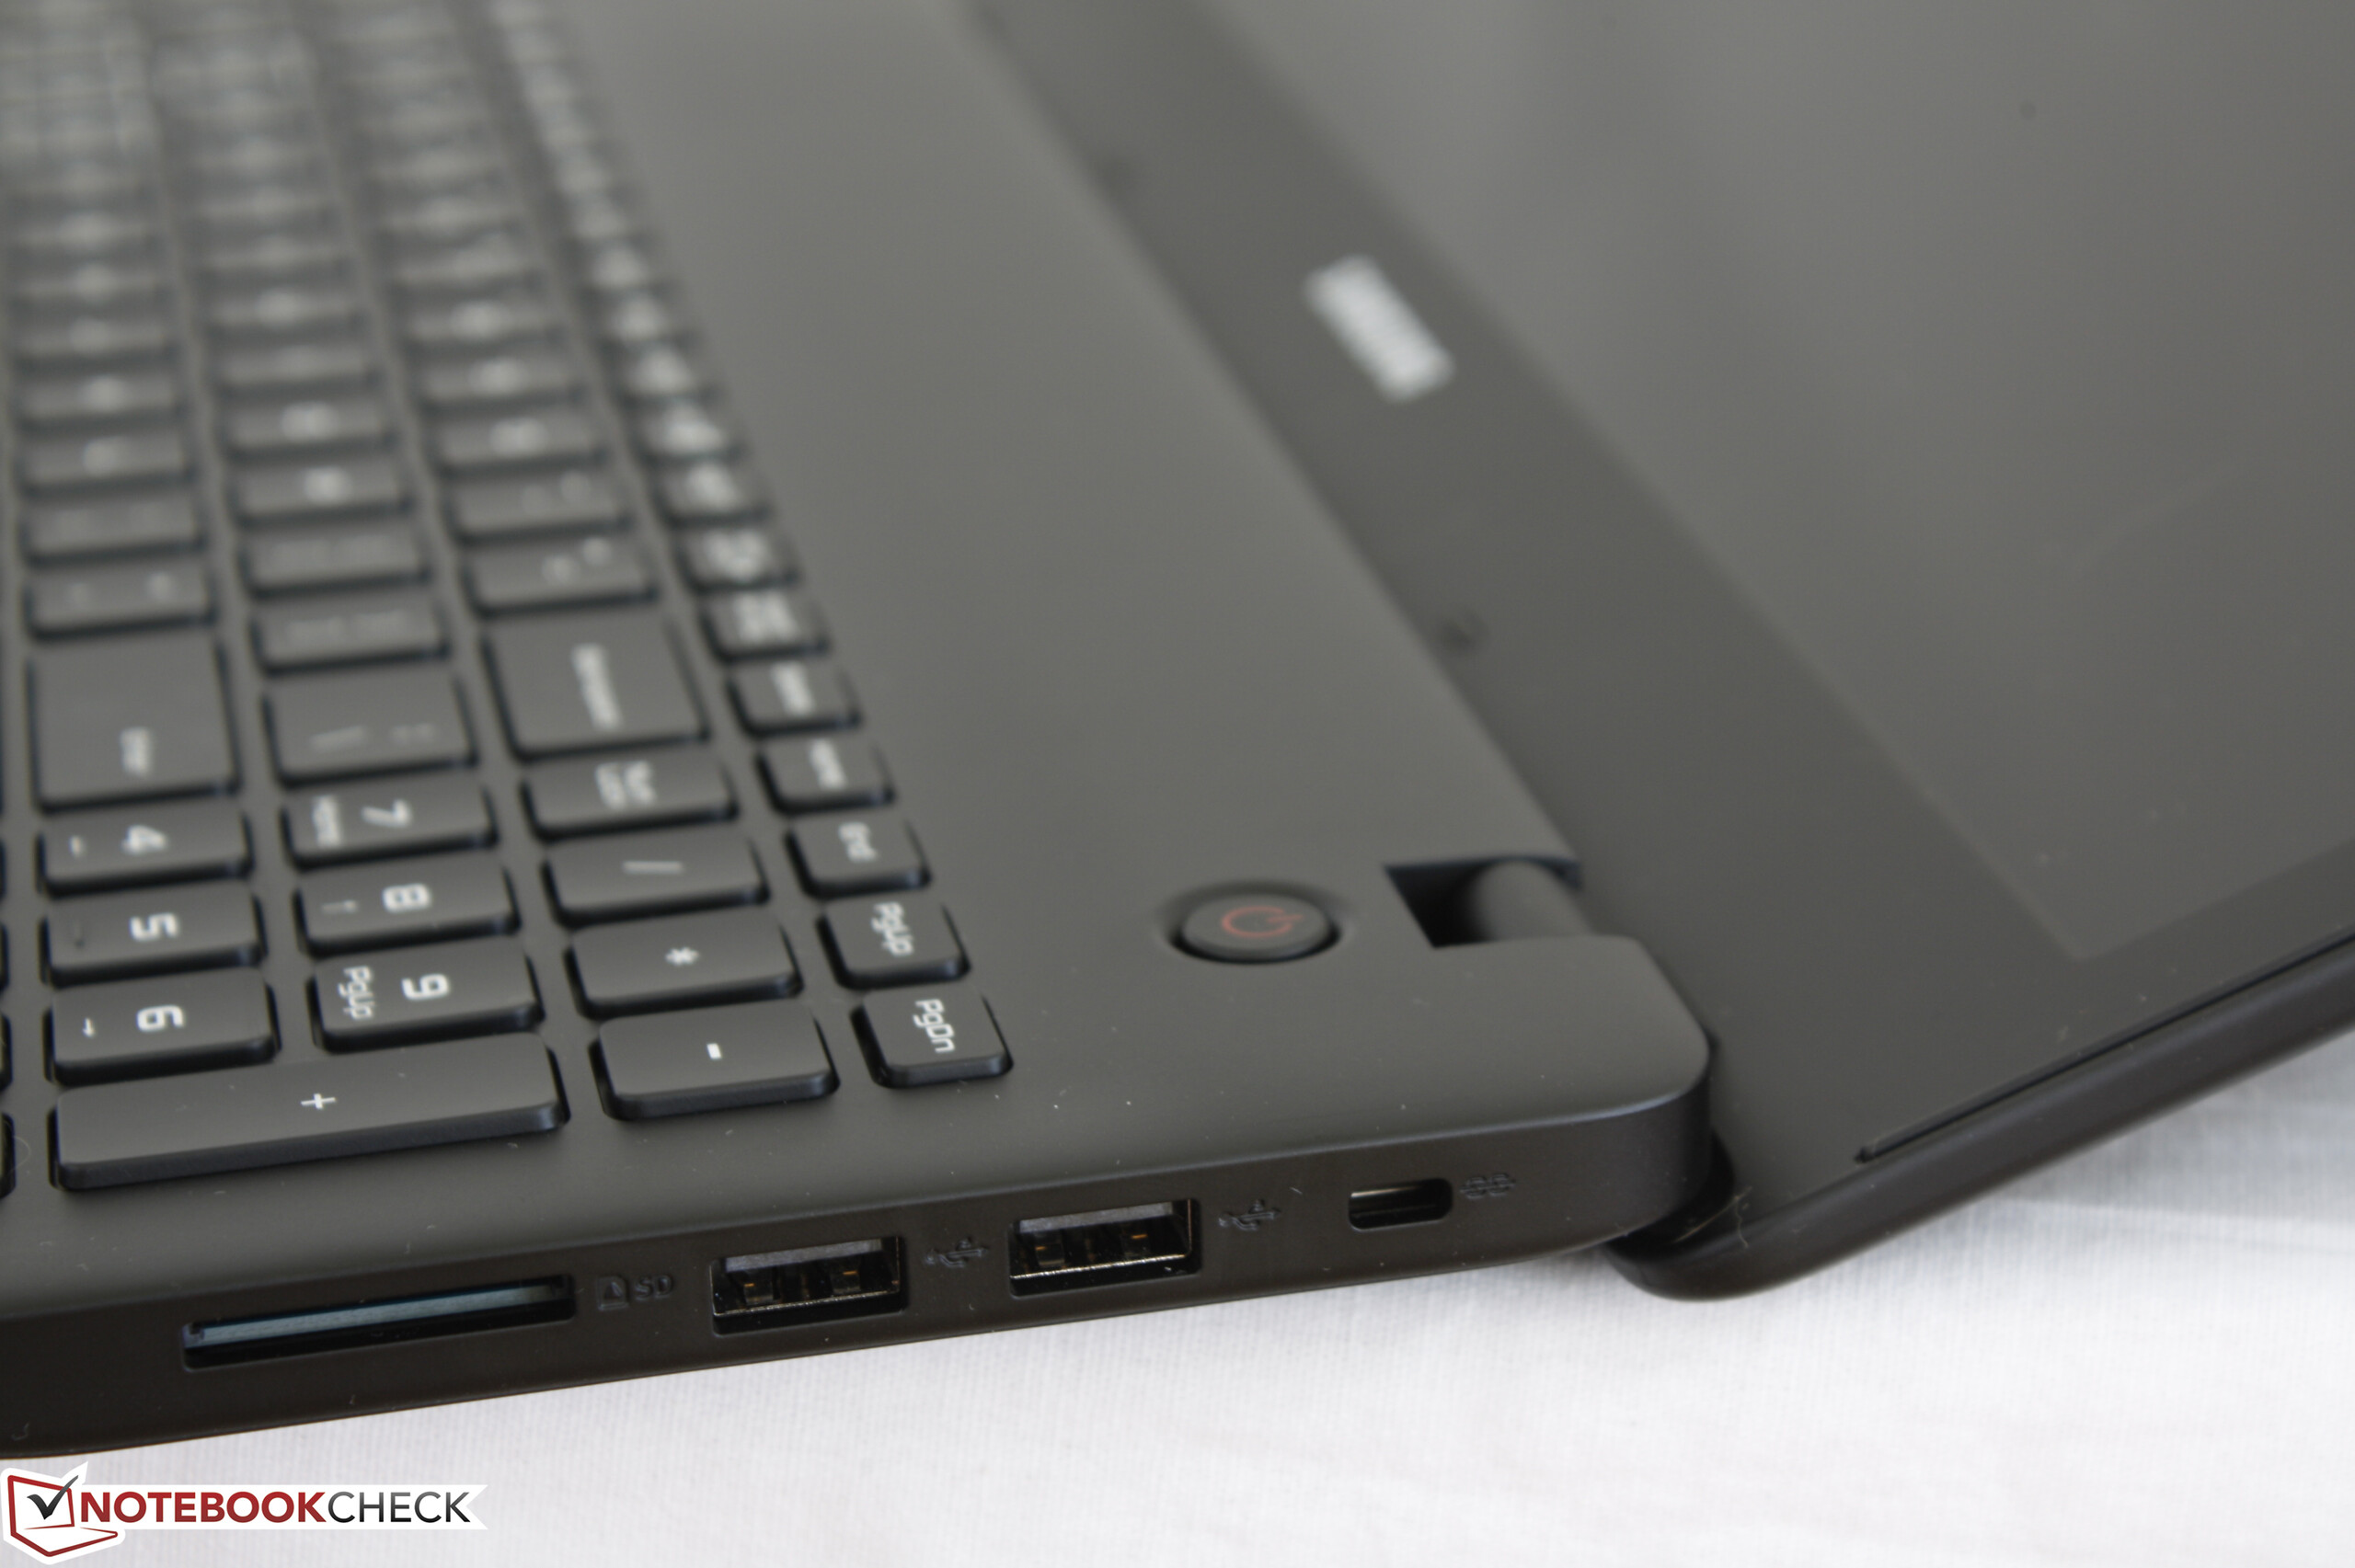

| SD Card Reader | |
| average JPG Copy Test (av. of 3 runs) | |
| Dell XPS 15 9560 (i7-7700HQ, UHD) | |
| Asus FX502VM-AS73 | |
| Samsung Odyssey NP800G5M-X01US | |
| maximum AS SSD Seq Read Test (1GB) | |
| Dell XPS 15 9560 (i7-7700HQ, UHD) | |
| Asus FX502VM-AS73 | |
| Samsung Odyssey NP800G5M-X01US | |
| Networking | |
| iperf3 transmit AX12 | |
| HP Pavilion 15t-bc200 X7P44AV | |
| Asus FX502VM-AS73 | |
| Samsung Odyssey NP800G5M-X01US | |
| iperf3 receive AX12 | |
| HP Pavilion 15t-bc200 X7P44AV | |
| Asus FX502VM-AS73 | |
| Samsung Odyssey NP800G5M-X01US | |
| |||||||||||||||||||||||||
iluminação: 90 %
iluminação com acumulador: 255.9 cd/m²
Contraste: 533:1 (Preto: 0.48 cd/m²)
ΔE ColorChecker Calman: 5.9 | ∀{0.5-29.43 Ø4.71}
ΔE Greyscale Calman: 5.6 | ∀{0.09-98 Ø4.96}
70.1% sRGB (Argyll 1.6.3 3D)
44.8% AdobeRGB 1998 (Argyll 1.6.3 3D)
48.71% AdobeRGB 1998 (Argyll 3D)
70.4% sRGB (Argyll 3D)
47.11% Display P3 (Argyll 3D)
Gamma: 2.21
CCT: 7250 K
| Samsung Odyssey NP800G5M-X01US IPS, 15.6", 1920x1080 | Asus FX502VM-AS73 TN LED, 15.6", 1920x1080 | HP Pavilion 15t-bc200 X7P44AV LGD04D4, , 15.6", 3840x2160 | Dell XPS 15 2017 9560 (7300HQ, Full-HD) Sharp SHP1453 LQ156M1, LED IGZO IPS InfinityEdge, 15.6", 1920x1080 | Gigabyte P55W v7 LG Philips LP156WF6 (LGD046F), IPS, 15.6", 1920x1080 | Apple MacBook Pro 15 2016 (2.9 GHz, 460) Apple APPA030, IPS, 15.4", 2880x1800 | |
|---|---|---|---|---|---|---|
| Display | -19% | 34% | 44% | 25% | 77% | |
| Display P3 Coverage (%) | 47.11 | 38.28 -19% | 63 34% | 68.9 46% | 63.5 35% | 99 110% |
| sRGB Coverage (%) | 70.4 | 56.9 -19% | 94.4 34% | 98.9 40% | 82 16% | 100 42% |
| AdobeRGB 1998 Coverage (%) | 48.71 | 39.47 -19% | 64.8 33% | 70.9 46% | 59.9 23% | 87.3 79% |
| Response Times | 30% | 24% | -48% | 16% | -43% | |
| Response Time Grey 50% / Grey 80% * (ms) | 38.8 ? | 28.4 ? 27% | 30.4 ? 22% | 54 ? -39% | 37 ? 5% | 46 ? -19% |
| Response Time Black / White * (ms) | 33.6 ? | 22.4 ? 33% | 24.8 ? 26% | 52.4 ? -56% | 25 ? 26% | 56 ? -67% |
| PWM Frequency (Hz) | 19230 ? | 119000 ? | ||||
| Screen | -8% | 15% | 46% | 28% | 61% | |
| Brightness middle (cd/m²) | 255.9 | 209.5 -18% | 259 1% | 400 56% | 287 12% | 420 64% |
| Brightness (cd/m²) | 249 | 205 -18% | 255 2% | 392 57% | 289 16% | 401 61% |
| Brightness Distribution (%) | 90 | 92 2% | 87 -3% | 89 -1% | 87 -3% | 90 0% |
| Black Level * (cd/m²) | 0.48 | 0.69 -44% | 0.51 -6% | 0.26 46% | 0.29 40% | 0.3 37% |
| Contrast (:1) | 533 | 304 -43% | 508 -5% | 1538 189% | 990 86% | 1400 163% |
| Colorchecker dE 2000 * | 5.9 | 4.7 20% | 3.9 34% | 4.9 17% | 4.92 17% | 3.33 44% |
| Colorchecker dE 2000 max. * | 18.9 | 19.7 -4% | 6.9 63% | 11 42% | 11 42% | 5.11 73% |
| Greyscale dE 2000 * | 5.6 | 1.8 68% | 4.5 20% | 7.2 -29% | 3.66 35% | 2.73 51% |
| Gamma | 2.21 100% | 2.23 99% | 2.43 91% | 2.11 104% | 2.32 95% | 2.48 89% |
| CCT | 7250 90% | 6975 93% | 7257 90% | 6911 94% | 6482 100% | 6457 101% |
| Color Space (Percent of AdobeRGB 1998) (%) | 44.8 | 36.2 -19% | 59.5 33% | 64.2 43% | 54 21% | 78.09 74% |
| Color Space (Percent of sRGB) (%) | 70.1 | 56.6 -19% | 98.9 41% | 82 17% | 99.97 43% | |
| Média Total (Programa/Configurações) | 1% /
-5% | 24% /
21% | 14% /
33% | 23% /
26% | 32% /
50% |
* ... menor é melhor
Exibir tempos de resposta
| ↔ Tempo de resposta preto para branco | ||
|---|---|---|
| 33.6 ms ... ascensão ↗ e queda ↘ combinadas | ↗ 18.8 ms ascensão | 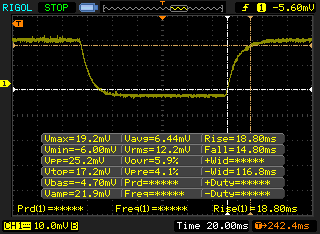 |
| ↘ 14.8 ms queda | ||
| A tela mostra taxas de resposta lentas em nossos testes e será insatisfatória para os jogadores. Em comparação, todos os dispositivos testados variam de 0.1 (mínimo) a 240 (máximo) ms. » 90 % de todos os dispositivos são melhores. Isso significa que o tempo de resposta medido é pior que a média de todos os dispositivos testados (19.8 ms). | ||
| ↔ Tempo de resposta 50% cinza a 80% cinza | ||
| 38.8 ms ... ascensão ↗ e queda ↘ combinadas | ↗ 20.8 ms ascensão | 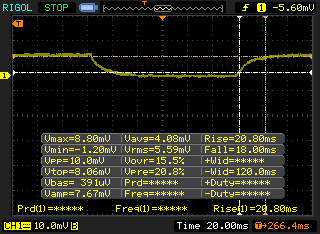 |
| ↘ 18 ms queda | ||
| A tela mostra taxas de resposta lentas em nossos testes e será insatisfatória para os jogadores. Em comparação, todos os dispositivos testados variam de 0.165 (mínimo) a 636 (máximo) ms. » 58 % de todos os dispositivos são melhores. Isso significa que o tempo de resposta medido é pior que a média de todos os dispositivos testados (31 ms). | ||
Cintilação da tela / PWM (modulação por largura de pulso)
| Tela tremeluzindo/PWM detectado | 19230 Hz | ≤ 99 % configuração de brilho | 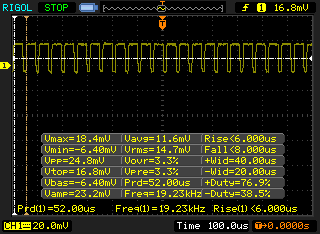 |
A luz de fundo da tela pisca em 19230 Hz (pior caso, por exemplo, utilizando PWM) Cintilação detectada em uma configuração de brilho de 99 % e abaixo. Não deve haver cintilação ou PWM acima desta configuração de brilho. A frequência de 19230 Hz é bastante alta, então a maioria dos usuários sensíveis ao PWM não deve notar nenhuma oscilação. [pwm_comparison] Em comparação: 52 % de todos os dispositivos testados não usam PWM para escurecer a tela. Se PWM foi detectado, uma média de 7754 (mínimo: 5 - máximo: 343500) Hz foi medida. | |||
| Cinebench R10 | |
| Rendering Multiple CPUs 32Bit | |
| Eurocom Tornado F5 | |
| Samsung Odyssey NP800G5M-X01US | |
| MSI GS63VR 7RF-228US | |
| MSI GT80 Titan SLI | |
| Asus GL702VM-GC102D | |
| Rendering Single 32Bit | |
| Eurocom Tornado F5 | |
| Samsung Odyssey NP800G5M-X01US | |
| MSI GS63VR 7RF-228US | |
| MSI GT80 Titan SLI | |
| Asus GL702VM-GC102D | |
| wPrime 2.10 - 1024m | |
| MSI GS63VR 7RF-228US | |
| Samsung Odyssey NP800G5M-X01US | |
| Eurocom Tornado F5 | |
* ... menor é melhor
| PCMark 8 | |
| Home Score Accelerated v2 | |
| Asus FX502VM-AS73 | |
| Gigabyte P55W v7 | |
| Samsung Odyssey NP800G5M-X01US | |
| Asus ROG Strix GL553VD-DS71 | |
| Dell XPS 15 2017 9560 (7300HQ, Full-HD) | |
| Work Score Accelerated v2 | |
| Gigabyte P55W v7 | |
| Samsung Odyssey NP800G5M-X01US | |
| Dell XPS 15 2017 9560 (7300HQ, Full-HD) | |
| Asus ROG Strix GL553VD-DS71 | |
| Asus FX502VM-AS73 | |
| Creative Score Accelerated v2 | |
| Asus FX502VM-AS73 | |
| Samsung Odyssey NP800G5M-X01US | |
| Asus ROG Strix GL553VD-DS71 | |
| PCMark 8 Home Score Accelerated v2 | 4001 pontos | |
| PCMark 8 Creative Score Accelerated v2 | 5362 pontos | |
| PCMark 8 Work Score Accelerated v2 | 5305 pontos | |
Ajuda | ||
| Samsung Odyssey NP800G5M-X01US Samsung PM961 NVMe MZVLW128HEGR | Asus FX502VM-AS73 SK Hynix HFS256G39TND-N210A | HP Pavilion 15t-bc200 X7P44AV Intel SSD 600p SSDPEKKW256G7 | Asus ROG Strix GL553VD-DS71 HGST Travelstar 7K1000 HTS721010A9E630 | Dell XPS 15 9560 (i7-7700HQ, UHD) Lite-On CX2-8B512-Q11 | |
|---|---|---|---|---|---|
| CrystalDiskMark 3.0 | -46% | 19% | -93% | 94% | |
| Read Seq (MB/s) | 1518 | 503 -67% | 1115 -27% | 93.5 -94% | 1684 11% |
| Write Seq (MB/s) | 798 | 138.2 -83% | 311 -61% | 89.6 -89% | 1106 39% |
| Read 512 (MB/s) | 460.5 | 343.5 -25% | 706 53% | 39.06 -92% | 977 112% |
| Write 512 (MB/s) | 195.8 | 137.8 -30% | 472.3 141% | 51.1 -74% | 1119 472% |
| Read 4k (MB/s) | 47.16 | 29.36 -38% | 31.97 -32% | 0.57 -99% | 45.14 -4% |
| Write 4k (MB/s) | 143.1 | 70.9 -50% | 135.1 -6% | 1.05 -99% | 134.1 -6% |
| Read 4k QD32 (MB/s) | 521 | 369.9 -29% | 288.3 -45% | 1.06 -100% | 509 -2% |
| Write 4k QD32 (MB/s) | 176.4 | 99.7 -43% | 405.5 130% | 1.04 -99% | 398.1 126% |

| 3DMark | |
| 1920x1080 Fire Strike Graphics | |
| MSI GS63VR 7RF-228US | |
| Acer Aspire VX5-591G-75C4 VX15 | |
| Asus Strix GL502VT-DS74 | |
| Zotac GeForce GTX 1050 2GB | |
| Asus ROG Strix GL553VD-DS71 | |
| Samsung Odyssey NP800G5M-X01US | |
| Gigabyte P55K v5 | |
| Asus Zenbook UX510UW-CN044T | |
| MSI PX60 6QD | |
| Fire Strike Extreme Graphics | |
| MSI GS63VR 7RF-228US | |
| Asus Strix GL502VT-DS74 | |
| Zotac GeForce GTX 1050 2GB | |
| Asus ROG Strix GL553VD-DS71 | |
| Samsung Odyssey NP800G5M-X01US | |
| Gigabyte P55K v5 | |
| Asus Zenbook UX510UW-CN044T | |
| 1280x720 Cloud Gate Standard Graphics | |
| Asus Strix GL502VT-DS74 | |
| Acer Aspire VX5-591G-75C4 VX15 | |
| Zotac GeForce GTX 1050 2GB | |
| Samsung Odyssey NP800G5M-X01US | |
| Asus ROG Strix GL553VD-DS71 | |
| Gigabyte P55K v5 | |
| MSI GS63VR 7RF-228US | |
| Asus Zenbook UX510UW-CN044T | |
| MSI PX60 6QD | |
| 3DMark 11 | |
| 1280x720 Performance GPU | |
| MSI GS63VR 7RF-228US | |
| Asus Strix GL502VT-DS74 | |
| Acer Aspire VX5-591G-75C4 VX15 | |
| Zotac GeForce GTX 1050 2GB | |
| Samsung Odyssey NP800G5M-X01US | |
| Asus ROG Strix GL553VD-DS71 | |
| Gigabyte P55K v5 | |
| Asus Zenbook UX510UW-CN044T | |
| MSI PX60 6QD | |
| 1280x720 Performance Combined | |
| MSI GS63VR 7RF-228US | |
| Zotac GeForce GTX 1050 2GB | |
| Asus Strix GL502VT-DS74 | |
| Samsung Odyssey NP800G5M-X01US | |
| Asus ROG Strix GL553VD-DS71 | |
| Gigabyte P55K v5 | |
| Acer Aspire VX5-591G-75C4 VX15 | |
| MSI PX60 6QD | |
| Asus Zenbook UX510UW-CN044T | |
| 3DMark 11 Performance | 7872 pontos | |
| 3DMark Ice Storm Standard Score | 84774 pontos | |
| 3DMark Cloud Gate Standard Score | 20291 pontos | |
| 3DMark Fire Strike Score | 5455 pontos | |
| 3DMark Fire Strike Extreme Score | 2678 pontos | |
Ajuda | ||
| baixo | média | alto | ultra | |
|---|---|---|---|---|
| BioShock Infinite (2013) | 63.6 | |||
| Metro: Last Light (2013) | 78 | 43.8 | ||
| Thief (2014) | 73 | 40.4 | ||
| The Witcher 3 (2015) | 43 | 20.8 | ||
| Batman: Arkham Knight (2015) | 91 | 79 | 47 | 25 |
| Dota 2 Reborn (2015) | 115 | |||
| Fallout 4 (2015) | 41.5 | 34.2 | ||
| Rise of the Tomb Raider (2016) | 70.1 | 38.7 | 33.4 | |
| Ashes of the Singularity (2016) | 54.7 | 34.1 | 29.6 | |
| Doom (2016) | 47.5 | 43.5 | ||
| Overwatch (2016) | 95.3 | 54.2 |
Barulho
| Ocioso |
| 28.1 / 29.1 / 29.1 dB |
| HDD |
| 29.1 dB |
| Carga |
| 49.2 / 49.2 dB |
 | ||
30 dB silencioso 40 dB(A) audível 50 dB(A) ruidosamente alto |
||
min: | ||
| Samsung Odyssey NP800G5M-X01US GeForce GTX 1050 Mobile, i7-7700HQ, Samsung PM961 NVMe MZVLW128HEGR | Asus FX502VM-AS73 GeForce GTX 1060 Mobile, i7-7700HQ, SK Hynix HFS256G39TND-N210A | HP Pavilion 15t-bc200 X7P44AV GeForce GTX 1050 Mobile, i7-7700HQ, Intel SSD 600p SSDPEKKW256G7 | Dell XPS 15 9560 (i7-7700HQ, UHD) GeForce GTX 1050 Mobile, i7-7700HQ, Lite-On CX2-8B512-Q11 | Gigabyte P55W v7 GeForce GTX 1060 Mobile, i7-7700HQ, Liteonit CV3-8D256 | Apple MacBook Pro 15 2016 (2.9 GHz, 460) Radeon Pro 460, 6920HQ, Apple SSD SM1024L | |
|---|---|---|---|---|---|---|
| Noise | -4% | -3% | -1% | -7% | 3% | |
| desligado / ambiente * (dB) | 28.1 | 28.7 -2% | 28.9 -3% | 28.4 -1% | 30 -7% | 29 -3% |
| Idle Minimum * (dB) | 28.1 | 30.6 -9% | 32.3 -15% | 29 -3% | 33 -17% | 30.3 -8% |
| Idle Average * (dB) | 29.1 | 30.6 -5% | 32.3 -11% | 29 -0% | 34 -17% | 30.3 -4% |
| Idle Maximum * (dB) | 29.1 | 31 -7% | 32.3 -11% | 32.2 -11% | 35 -20% | 30.3 -4% |
| Load Average * (dB) | 49.2 | 46.2 6% | 43.2 12% | 47.1 4% | 39 21% | 35.1 29% |
| Load Maximum * (dB) | 49.2 | 52.3 -6% | 45.2 8% | 47.1 4% | 50 -2% | 46 7% |
| Witcher 3 ultra * (dB) | 52 |
* ... menor é melhor
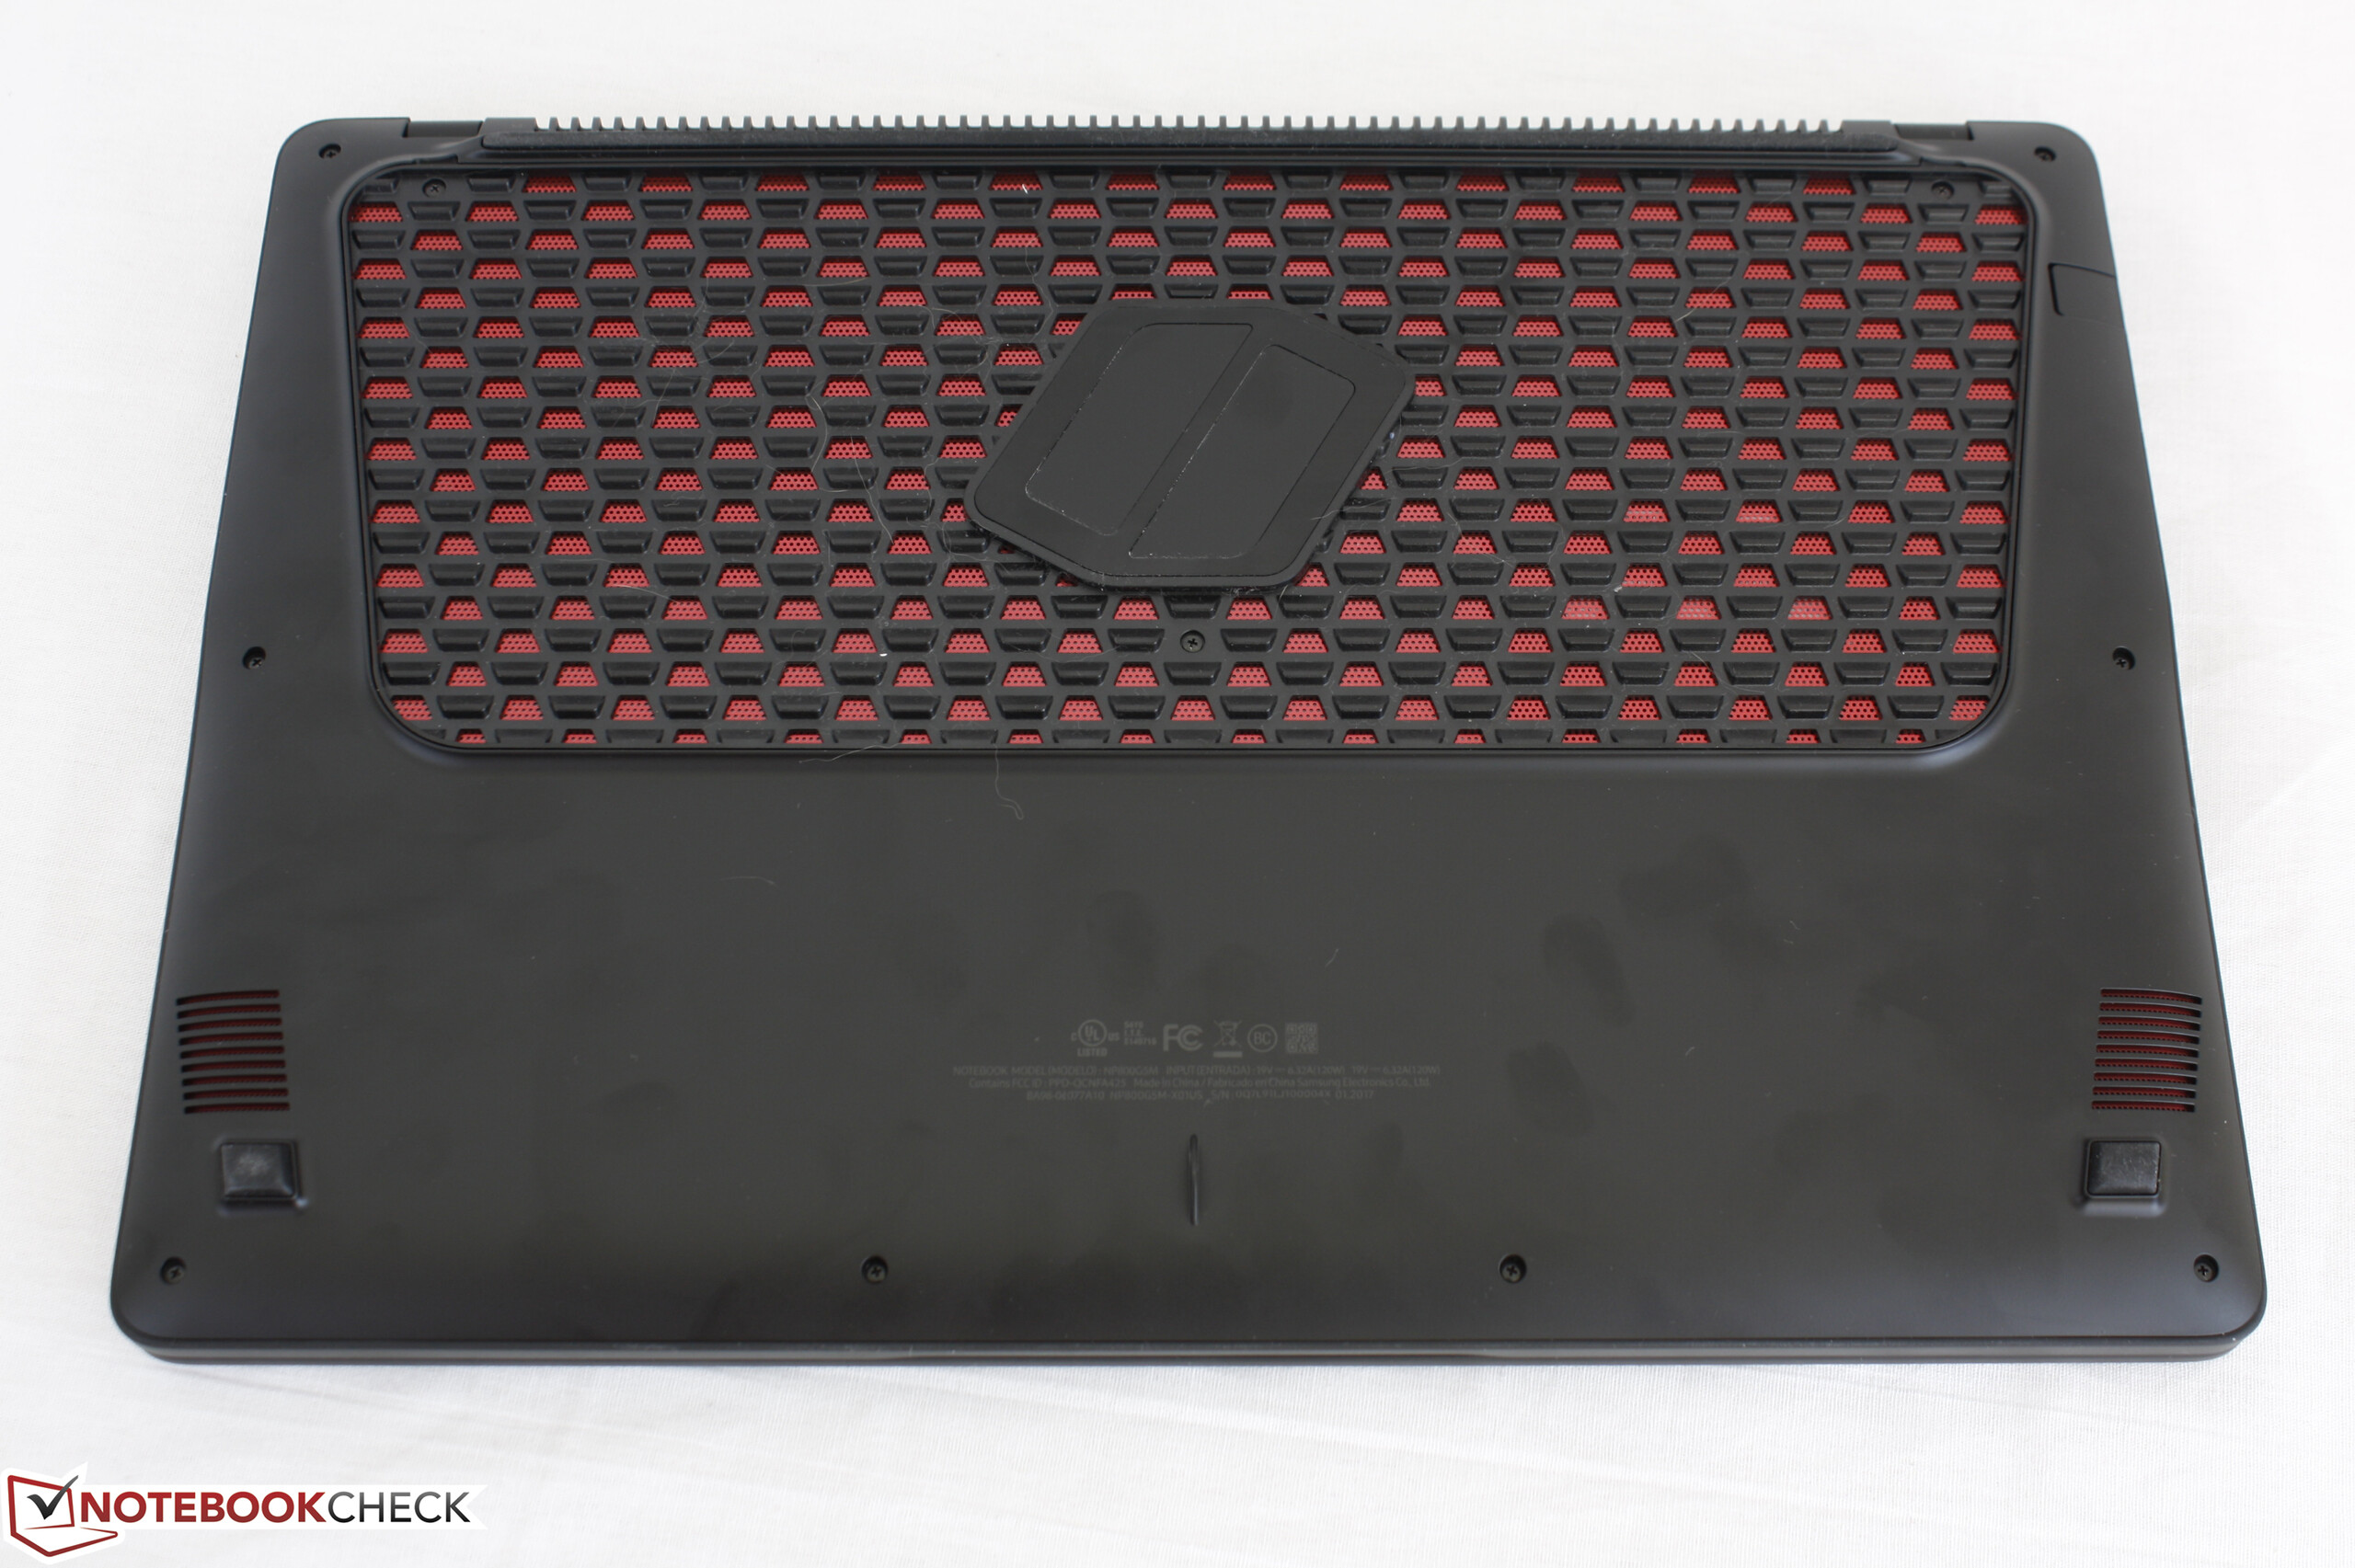
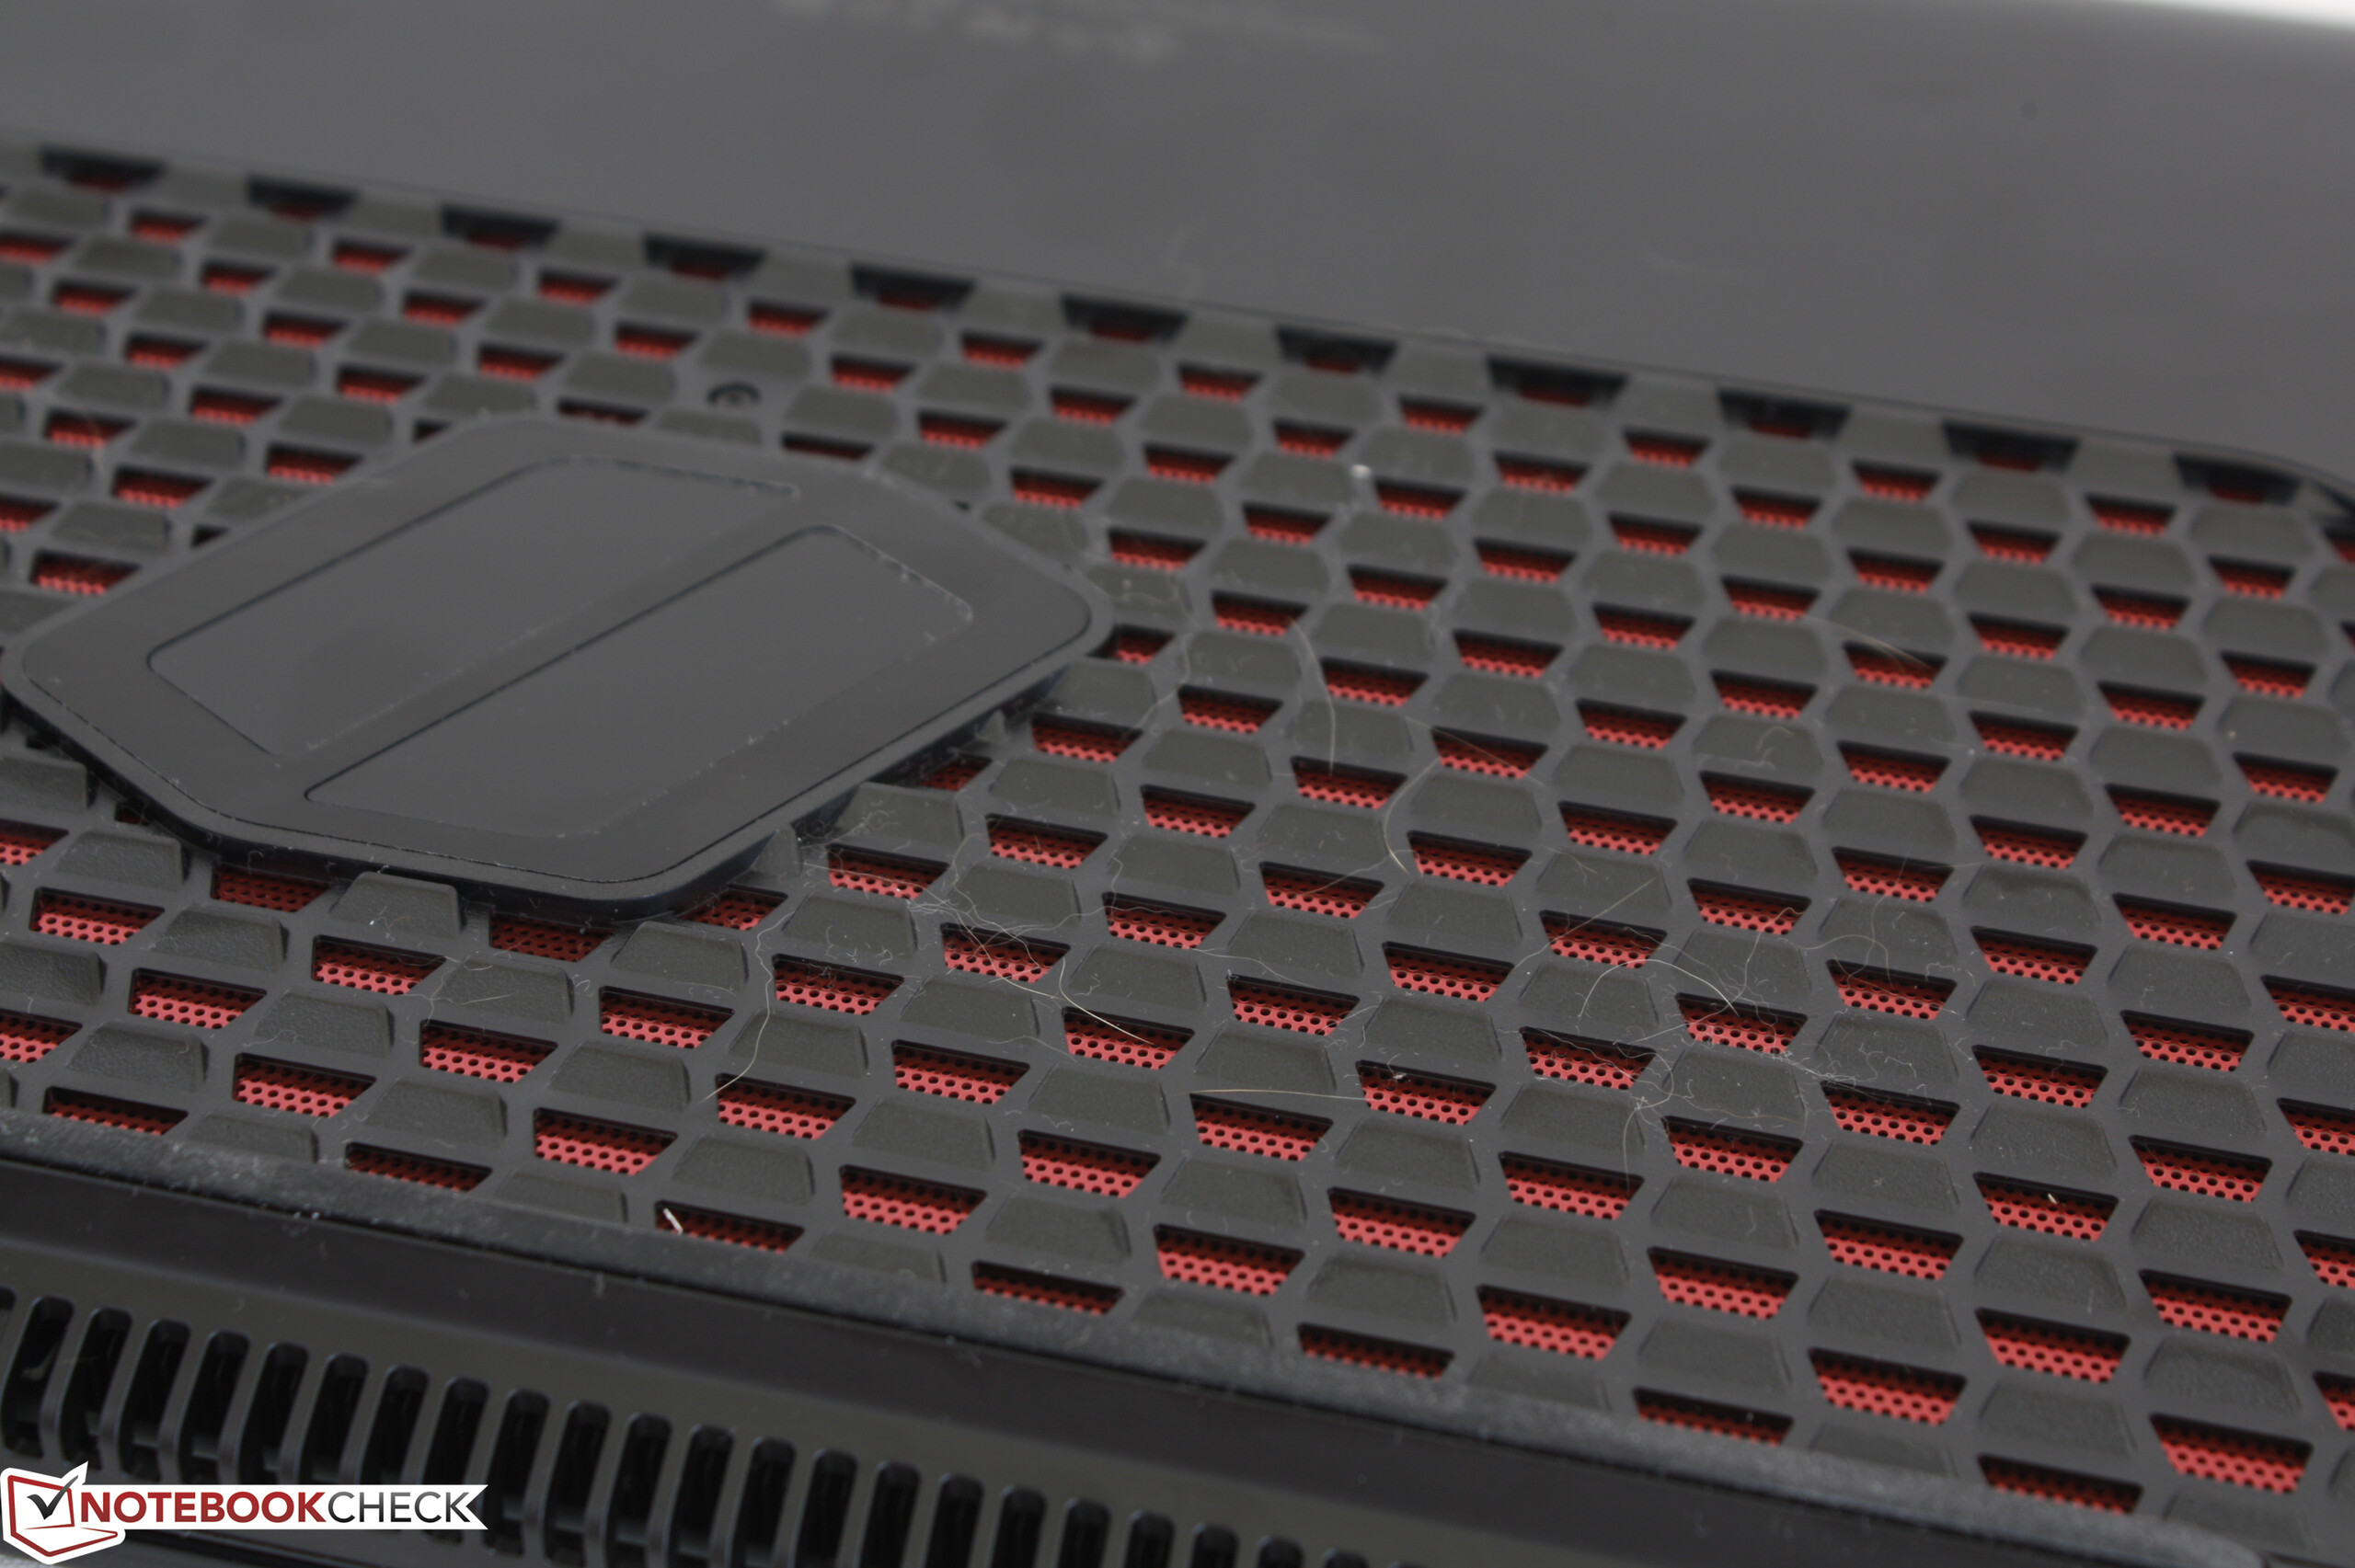
(-) A temperatura máxima no lado superior é 58.4 °C / 137 F, em comparação com a média de 40.4 °C / 105 F , variando de 21.2 a 68.8 °C para a classe Gaming.
(-) A parte inferior aquece até um máximo de 54.2 °C / 130 F, em comparação com a média de 43.2 °C / 110 F
(+) Em uso inativo, a temperatura média para o lado superior é 25.4 °C / 78 F, em comparação com a média do dispositivo de 33.9 °C / ### class_avg_f### F.
(±) Jogando The Witcher 3, a temperatura média para o lado superior é 33.8 °C / 93 F, em comparação com a média do dispositivo de 33.9 °C / ## #class_avg_f### F.
(+) Os apoios para as mãos e o touchpad são mais frios que a temperatura da pele, com um máximo de 27 °C / 80.6 F e, portanto, são frios ao toque.
(±) A temperatura média da área do apoio para as mãos de dispositivos semelhantes foi 28.8 °C / 83.8 F (+1.8 °C / 3.2 F).
Samsung Odyssey NP800G5M-X01US análise de áudio
(-) | alto-falantes não muito altos (###valor### dB)
Graves 100 - 315Hz
(-) | quase nenhum baixo - em média 15.2% menor que a mediana
(±) | a linearidade dos graves é média (13.7% delta para a frequência anterior)
Médios 400 - 2.000 Hz
(+) | médios equilibrados - apenas 2% longe da mediana
(±) | a linearidade dos médios é média (10.1% delta para frequência anterior)
Altos 2 - 16 kHz
(±) | máximos mais altos - em média 8.4% maior que a mediana
(±) | a linearidade dos máximos é média (11.5% delta para frequência anterior)
Geral 100 - 16.000 Hz
(-) | o som geral não é linear (37.2% diferença em relação à mediana)
Comparado com a mesma classe
» 99% de todos os dispositivos testados nesta classe foram melhores, 0% semelhantes, 1% piores
» O melhor teve um delta de 6%, a média foi 18%, o pior foi 132%
Comparado com todos os dispositivos testados
» 94% de todos os dispositivos testados foram melhores, 1% semelhantes, 5% piores
» O melhor teve um delta de 4%, a média foi 23%, o pior foi 134%
Apple MacBook 12 (Early 2016) 1.1 GHz análise de áudio
(+) | os alto-falantes podem tocar relativamente alto (###valor### dB)
Graves 100 - 315Hz
(±) | graves reduzidos - em média 11.3% menor que a mediana
(±) | a linearidade dos graves é média (14.2% delta para a frequência anterior)
Médios 400 - 2.000 Hz
(+) | médios equilibrados - apenas 2.4% longe da mediana
(+) | médios são lineares (5.5% delta para frequência anterior)
Altos 2 - 16 kHz
(+) | agudos equilibrados - apenas 2% longe da mediana
(+) | os máximos são lineares (4.5% delta da frequência anterior)
Geral 100 - 16.000 Hz
(+) | o som geral é linear (10.2% diferença em relação à mediana)
Comparado com a mesma classe
» 7% de todos os dispositivos testados nesta classe foram melhores, 2% semelhantes, 90% piores
» O melhor teve um delta de 5%, a média foi 18%, o pior foi 53%
Comparado com todos os dispositivos testados
» 5% de todos os dispositivos testados foram melhores, 1% semelhantes, 94% piores
» O melhor teve um delta de 4%, a média foi 23%, o pior foi 134%
| desligado | |
| Ocioso | |
| Carga |
|
Key:
min: | |
| Samsung Odyssey NP800G5M-X01US | Asus FX502VM-AS73 | Dell XPS 15 2017 9560 (7300HQ, Full-HD) | Asus ROG Strix GL553VD-DS71 | Gigabyte P55W v7 | Apple MacBook Pro 15 2016 (2.9 GHz, 460) | |
|---|---|---|---|---|---|---|
| Power Consumption | -57% | 0% | -12% | -28% | 14% | |
| Idle Minimum * (Watt) | 6.7 | 14.9 -122% | 6.6 1% | 7.7 -15% | 8 -19% | 3 55% |
| Idle Average * (Watt) | 8.9 | 15.1 -70% | 9 -1% | 11.7 -31% | 13 -46% | 9.9 -11% |
| Idle Maximum * (Watt) | 10.8 | 15.2 -41% | 10.7 1% | 12 -11% | 18 -67% | 12.5 -16% |
| Load Average * (Watt) | 81.8 | 105.8 -29% | 77.5 5% | 80.5 2% | 76 7% | 70.6 14% |
| Witcher 3 ultra * (Watt) | 92.2 | |||||
| Load Maximum * (Watt) | 122.7 | 148.8 -21% | 130 -6% | 128.4 -5% | 143 -17% | 90.8 26% |
* ... menor é melhor
| Samsung Odyssey NP800G5M-X01US i7-7700HQ, GeForce GTX 1050 Mobile, 43 Wh | Asus FX502VM-AS73 i7-7700HQ, GeForce GTX 1060 Mobile, 64 Wh | Dell XPS 15 2017 9560 (7300HQ, Full-HD) i5-7300HQ, GeForce GTX 1050 Mobile, 56 Wh | Asus ROG Strix GL553VD-DS71 i7-7700HQ, GeForce GTX 1050 Mobile, 48 Wh | Gigabyte P55W v7 i7-7700HQ, GeForce GTX 1060 Mobile, 63 Wh | Apple MacBook Pro 15 2016 (2.9 GHz, 460) 6920HQ, Radeon Pro 460, 76 Wh | |
|---|---|---|---|---|---|---|
| Duração da bateria | -17% | 9% | -20% | 28% | 52% | |
| Reader / Idle (h) | 10.2 | 6.1 -40% | 9.4 -8% | 7.3 -28% | 13.2 29% | |
| WiFi v1.3 (h) | 4.4 | 4.6 5% | 5.6 27% | 4.6 5% | 5.8 32% | 10.3 134% |
| Load (h) | 1.3 | 1.1 -15% | 1.4 8% | 0.8 -38% | 1.6 23% | 0.9 -31% |
Pro
Contra
Nossas impressões sobre o primeiro portátil Odyssey não uma grande mistura. Por um lado, o sistema se desempenha de forma admirável, sem afogamentos da CPU ou GPU e funciona com temperaturas operacionais aceitavelmente baixas para um portátil de jogos. Sua habilidade de manter as velocidades Turbo Boost é algo com o que os portáteis de jogos super finos tendem a ter dificuldade, portanto, o Odyssey, pelo menos conseguiu obter o desempenho de forma apropriada.
Fora o seu bom desempenho, o Odyssey luta contra outros fatores. O mais notório pe o ruído da ventoinha durante os jogos, inclusive para um portátil de jogos. Com quase 50 dB(A), este nível se espera de GPUs mais poderosas como a GTX 1070 ou GTX 1080 - não da GTX 1050. O controle manual da ventoinha teria sido de muita utilidade para permitir que o usuário regule o ruído e as temperaturas para uma experiência de jogo muito mais agradável.
Os recortes de orçamento também se tornam mais evidentes a medida que passamos mais tempo com o portátil. O leitor de cartões SD é lento, os recursos de conectividade são barebones, a VRAM da GPU é da metade, a capacidade da bateria é pequena, e tanto o contraste quanto as cores não são tão profundos quanto em alternativas mais caras. As teclas WASD extra mornas também são uma estranha decisão no design; um fabricante de carros nunca projetaria volantes desconfortavelmente quentes, pelo mesmo motivo que um portátil de jogos nunca deveria ter teclas WASD quentes.
O HP Pavilion 15t com a mesma CPU e GPU também é vendido na faixa de preços de $1100 a $1200 USD como o nosso Odyssey. Enquanto o Samsung o supera em desempenho, é bastante ordinário quase em todos os outros aspectos e não oferece o suficiente para se destacar sobre outros portáteis com GTX 1050.
O primeiro portátil de jogos Odyssey da Samsung finalmente está disponível e.. é enjoado e nada especial. Os desempenhos da CPU e GPU são ótimos e sem afogamentos, mas o ruído da ventoinha é severo.
Samsung Odyssey NP800G5M-X01US
- 04/24/2017 v6 (old)
Allen Ngo
Price comparison
