Breve Análise do Smartphone Samsung Galaxy S20+: Um telefone com recursos de vídeo de 8K
Device comparison
Avaliação | Data | Modelo | Peso | Unidade | Size | Resolução | Preço |
|---|---|---|---|---|---|---|---|
| 87.7 % v7 (old) | 04/2020 | Samsung Galaxy S20+ Exynos 990, Mali-G77 MP11 | 188 g | 128 GB UFS 3.0 Flash | 6.70" | 3200x1440 | |
| 87.1 % v7 (old) | 09/2019 | Apple iPhone 11 Pro Max A13 Bionic, A13 Bionic GPU | 226 g | 64 GB SSD | 6.50" | 2688x1242 | |
| 89 % v7 (old) | 12/2019 | Huawei Mate 30 Pro Kirin 990, Mali-G76 MP16 | 198 g | 256 GB UFS 3.0 Flash | 6.53" | 2400x1176 | |
| 86.9 % v7 (old) | 11/2019 | OnePlus 7T Pro SD 855+, Adreno 640 | 206 g | 256 GB UFS 3.0 Flash | 6.67" | 3120x1440 | |
| 84.7 % v7 (old) | 07/2019 | Sony Xperia 1 SD 855, Adreno 640 | 178 g | 128 GB UFS 2.1 Flash | 6.50" | 3840x1644 |


| |||||||||||||||||||||||||
iluminação: 94 %
iluminação com acumulador: 740 cd/m²
Contraste: ∞:1 (Preto: 0 cd/m²)
ΔE ColorChecker Calman: 2.6 | ∀{0.5-29.43 Ø4.71}
ΔE Greyscale Calman: 1.5 | ∀{0.09-98 Ø4.96}
99.7% sRGB (Calman 2D)
Gamma: 2.269
CCT: 6284 K
| Samsung Galaxy S20+ AMOLED, 3200x1440, 6.7" | Apple iPhone 11 Pro Max OLED, 2688x1242, 6.5" | Huawei Mate 30 Pro OLED, 2400x1176, 6.5" | OnePlus 7T Pro AMOLED, 3120x1440, 6.7" | Sony Xperia 1 OLED, 3840x1644, 6.5" | |
|---|---|---|---|---|---|
| Screen | 10% | -21% | -21% | 17% | |
| Brightness middle (cd/m²) | 740 | 790 7% | 592 -20% | 606 -18% | 541 -27% |
| Brightness (cd/m²) | 747 | 790 6% | 605 -19% | 611 -18% | 543 -27% |
| Brightness Distribution (%) | 94 | 97 3% | 96 2% | 95 1% | 99 5% |
| Black Level * (cd/m²) | |||||
| Colorchecker dE 2000 * | 2.6 | 1.4 46% | 2.5 4% | 3.46 -33% | 0.8 69% |
| Colorchecker dE 2000 max. * | 4.57 | 3.4 26% | 5.5 -20% | 5.64 -23% | 1.7 63% |
| Greyscale dE 2000 * | 1.5 | 1.9 -27% | 2.6 -73% | 2 -33% | 1.2 20% |
| Gamma | 2.269 97% | 2.23 99% | 2.16 102% | 2.258 97% | 2.2 100% |
| CCT | 6284 103% | 6466 101% | 6173 105% | 6779 96% | 6601 98% |
* ... menor é melhor
Cintilação da tela / PWM (modulação por largura de pulso)
| Tela tremeluzindo/PWM detectado | 214 Hz | 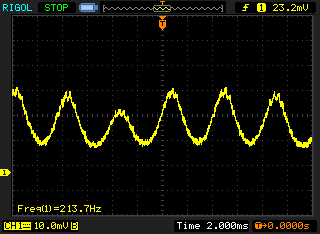 | |
A luz de fundo da tela pisca em 214 Hz (pior caso, por exemplo, utilizando PWM) . A frequência de 214 Hz é relativamente baixa, portanto, usuários sensíveis provavelmente notarão cintilação e sentirão fadiga ocular na configuração de brilho indicada e abaixo. [pwm_comparison] Em comparação: 52 % de todos os dispositivos testados não usam PWM para escurecer a tela. Se PWM foi detectado, uma média de 7747 (mínimo: 5 - máximo: 343500) Hz foi medida. | |||
Exibir tempos de resposta
| ↔ Tempo de resposta preto para branco | ||
|---|---|---|
| 8 ms ... ascensão ↗ e queda ↘ combinadas | ↗ 5 ms ascensão | 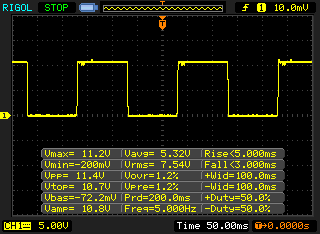 |
| ↘ 3 ms queda | ||
| A tela mostra taxas de resposta rápidas em nossos testes e deve ser adequada para jogos. Em comparação, todos os dispositivos testados variam de 0.1 (mínimo) a 240 (máximo) ms. » 22 % de todos os dispositivos são melhores. Isso significa que o tempo de resposta medido é melhor que a média de todos os dispositivos testados (19.8 ms). | ||
| ↔ Tempo de resposta 50% cinza a 80% cinza | ||
| 10 ms ... ascensão ↗ e queda ↘ combinadas | ↗ 5 ms ascensão | 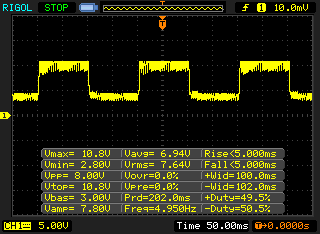 |
| ↘ 5 ms queda | ||
| A tela mostra boas taxas de resposta em nossos testes, mas pode ser muito lenta para jogadores competitivos. Em comparação, todos os dispositivos testados variam de 0.165 (mínimo) a 636 (máximo) ms. » 23 % de todos os dispositivos são melhores. Isso significa que o tempo de resposta medido é melhor que a média de todos os dispositivos testados (31 ms). | ||
| PCMark for Android | |
| Work performance score (classificar por valor) | |
| Samsung Galaxy S20+ | |
| Huawei Mate 30 Pro | |
| OnePlus 7T Pro | |
| Sony Xperia 1 | |
| Média Samsung Exynos 990 (13627 - 14760, n=5) | |
| Work 2.0 performance score (classificar por valor) | |
| Samsung Galaxy S20+ | |
| Huawei Mate 30 Pro | |
| OnePlus 7T Pro | |
| Sony Xperia 1 | |
| Média Samsung Exynos 990 (10008 - 11784, n=5) | |
| AnTuTu v8 - Total Score (classificar por valor) | |
| Samsung Galaxy S20+ | |
| Apple iPhone 11 Pro Max | |
| Huawei Mate 30 Pro | |
| OnePlus 7T Pro | |
| Média Samsung Exynos 990 (296746 - 527820, n=5) | |
| Basemark GPU 1.1 | |
| 1920x1080 Vulkan Medium Offscreen (classificar por valor) | |
| Samsung Galaxy S20+ | |
| Huawei Mate 30 Pro | |
| OnePlus 7T Pro | |
| Média Samsung Exynos 990 (71.4 - 71.6, n=2) | |
| Vulkan Medium Native (classificar por valor) | |
| Samsung Galaxy S20+ | |
| Huawei Mate 30 Pro | |
| OnePlus 7T Pro | |
| Média Samsung Exynos 990 (42.3 - 63, n=2) | |
| 1920x1080 OpenGL Medium Offscreen (classificar por valor) | |
| Samsung Galaxy S20+ | |
| Huawei Mate 30 Pro | |
| OnePlus 7T Pro | |
| Média Samsung Exynos 990 (84.1 - 85.6, n=2) | |
| VRMark - Amber Room (classificar por valor) | |
| Samsung Galaxy S20+ | |
| Huawei Mate 30 Pro | |
| OnePlus 7T Pro | |
| Média Samsung Exynos 990 (4607 - 4957, n=3) | |
| Jetstream 2 - 2.0 Total | |
| Média da turma Smartphone (63.9 - 423, n=122, últimos 2 anos) | |
| Apple iPhone 11 Pro Max (Safari Mobile 13.1) | |
| Huawei Mate 30 Pro (Chrome 78) | |
| OnePlus 7T Pro (Chrome 78) | |
| Sony Xperia 1 (Chrome 75) | |
| Média Samsung Exynos 990 (50.6 - 56.8, n=5) | |
| Samsung Galaxy S20+ (Chrome 80) | |
| JetStream 1.1 - 1.1 Total | |
| Apple iPhone 11 Pro Max (Safari Mobile 13.1) | |
| Huawei Mate 30 Pro (Chrome 78) | |
| OnePlus 7T Pro (Chrome 78) | |
| Sony Xperia 1 | |
| Média Samsung Exynos 990 (89.3 - 96.2, n=5) | |
| Samsung Galaxy S20+ (Chrome 80) | |
| Speedometer 2.0 - Result 2.0 | |
| Média da turma Smartphone (49.3 - 733, n=82, últimos 2 anos) | |
| Apple iPhone 11 Pro Max (Safari Mobile 13.1) | |
| Huawei Mate 30 Pro (Chrome 78) | |
| OnePlus 7T Pro (Chome 78) | |
| Sony Xperia 1 (Chrome 75) | |
| Samsung Galaxy S20+ (Chome 80) | |
| Média Samsung Exynos 990 (50.8 - 64.4, n=4) | |
| WebXPRT 3 - Overall | |
| Apple iPhone 11 Pro Max (Safari Mobile 13.1) | |
| Média da turma Smartphone (104 - 380, n=12, últimos 2 anos) | |
| Huawei Mate 30 Pro (Chrome 78) | |
| Sony Xperia 1 (Chrome 75) | |
| Média Samsung Exynos 990 (86 - 102, n=5) | |
| OnePlus 7T Pro (Chrome 78) | |
| Samsung Galaxy S20+ (Chrome 80) | |
| Octane V2 - Total Score | |
| Média da turma Smartphone (2800 - 126661, n=147, últimos 2 anos) | |
| Apple iPhone 11 Pro Max (Safari Mobile 13.1) | |
| OnePlus 7T Pro (Chrome 78) | |
| Huawei Mate 30 Pro (Chrome 78) | |
| Sony Xperia 1 (Chrome 75) | |
| Média Samsung Exynos 990 (18094 - 20022, n=5) | |
| Samsung Galaxy S20+ (Chrome 80) | |
| Mozilla Kraken 1.1 - Total | |
| Samsung Galaxy S20+ (Chrome 80) | |
| Média Samsung Exynos 990 (2294 - 2511, n=5) | |
| OnePlus 7T Pro (Chrome 78) | |
| Sony Xperia 1 (Chrome 75) | |
| Huawei Mate 30 Pro (Chrome 78) | |
| Média da turma Smartphone (257 - 28190, n=125, últimos 2 anos) | |
| Apple iPhone 11 Pro Max (Safari Mobile 13.1) | |
* ... menor é melhor
| Samsung Galaxy S20+ | Huawei Mate 30 Pro | OnePlus 7T Pro | Sony Xperia 1 | Média 128 GB UFS 3.0 Flash | Média da turma Smartphone | |
|---|---|---|---|---|---|---|
| AndroBench 3-5 | 7% | -38% | -57% | -7% | 80% | |
| Sequential Read 256KB (MB/s) | 1603 | 1781 11% | 1489 -7% | 750 -53% | 1520 ? -5% | 2212 ? 38% |
| Sequential Write 256KB (MB/s) | 694 | 401.8 -42% | 405 -42% | 206.9 -70% | 546 ? -21% | 1890 ? 172% |
| Random Read 4KB (MB/s) | 199.6 | 226.4 13% | 169 -15% | 147.3 -26% | 206 ? 3% | 310 ? 55% |
| Random Write 4KB (MB/s) | 229.8 | 259.2 13% | 26 -89% | 24.16 -89% | 193.9 ? -16% | 357 ? 55% |
| Sequential Read 256KB SDCard (MB/s) | 66.8 ? | 82.5 ? 24% | 31.34 ? -53% | 67.3 ? 1% | ||
| Sequential Write 256KB SDCard (MB/s) | 57.6 ? | 69.2 ? 20% | 27.84 ? -52% | 55.7 ? -3% |
(±) A temperatura máxima no lado superior é 44.8 °C / 113 F, em comparação com a média de 35.3 °C / 96 F , variando de 21.9 a 247 °C para a classe Smartphone.
(±) A parte inferior aquece até um máximo de 43.6 °C / 110 F, em comparação com a média de 34 °C / 93 F
(+) Em uso inativo, a temperatura média para o lado superior é 31.2 °C / 88 F, em comparação com a média do dispositivo de 33 °C / ### class_avg_f### F.
Samsung Galaxy S20+ análise de áudio
(+) | os alto-falantes podem tocar relativamente alto (###valor### dB)
Graves 100 - 315Hz
(-) | quase nenhum baixo - em média 73.2% menor que a mediana
(+) | o baixo é linear (0% delta para a frequência anterior)
Médios 400 - 2.000 Hz
(-) | quase nenhum médio - em média 73.2% menor que a mediana
(+) | médios são lineares (0% delta para frequência anterior)
Altos 2 - 16 kHz
(-) | quase nenhum máximo - em média 73.2% menor que a mediana
(+) | os máximos são lineares (0% delta da frequência anterior)
Geral 100 - 16.000 Hz
(-) | o som geral não é linear (115.8% diferença em relação à mediana)
Comparado com a mesma classe
» 88% de todos os dispositivos testados nesta classe foram melhores, 4% semelhantes, 8% piores
» O melhor teve um delta de 11%, a média foi 34%, o pior foi 134%
Comparado com todos os dispositivos testados
» 96% de todos os dispositivos testados foram melhores, 1% semelhantes, 3% piores
» O melhor teve um delta de 4%, a média foi 23%, o pior foi 134%
Apple iPhone 11 Pro Max análise de áudio
(+) | os alto-falantes podem tocar relativamente alto (###valor### dB)
Graves 100 - 315Hz
(-) | quase nenhum baixo - em média 15.4% menor que a mediana
(±) | a linearidade dos graves é média (10.3% delta para a frequência anterior)
Médios 400 - 2.000 Hz
(±) | médios mais altos - em média 5.7% maior que a mediana
(+) | médios são lineares (5.9% delta para frequência anterior)
Altos 2 - 16 kHz
(±) | máximos mais altos - em média 8.8% maior que a mediana
(+) | os máximos são lineares (3.5% delta da frequência anterior)
Geral 100 - 16.000 Hz
(±) | a linearidade do som geral é média (19.4% diferença em relação à mediana)
Comparado com a mesma classe
» 28% de todos os dispositivos testados nesta classe foram melhores, 9% semelhantes, 64% piores
» O melhor teve um delta de 11%, a média foi 34%, o pior foi 134%
Comparado com todos os dispositivos testados
» 48% de todos os dispositivos testados foram melhores, 7% semelhantes, 45% piores
» O melhor teve um delta de 4%, a média foi 23%, o pior foi 134%
| desligado | |
| Ocioso | |
| Carga |
|
Key:
min: | |
| Samsung Galaxy S20+ 4500 mAh | Apple iPhone 11 Pro Max 3969 mAh | Huawei Mate 30 Pro 4500 mAh | OnePlus 7T Pro 4085 mAh | Sony Xperia 1 3330 mAh | Média Samsung Exynos 990 | Média da turma Smartphone | |
|---|---|---|---|---|---|---|---|
| Power Consumption | -1% | 22% | -40% | 22% | 13% | 8% | |
| Idle Minimum * (Watt) | 1 | 0.92 8% | 0.87 13% | 2.1 -110% | 1 -0% | 0.846 ? 15% | 0.885 ? 11% |
| Idle Average * (Watt) | 1.7 | 2.9 -71% | 1.75 -3% | 3 -76% | 1.48 13% | 1.534 ? 10% | 1.481 ? 13% |
| Idle Maximum * (Watt) | 2.3 | 2.94 -28% | 1.83 20% | 3.5 -52% | 1.56 32% | 1.858 ? 19% | 1.67 ? 27% |
| Load Average * (Watt) | 5.8 | 3.65 37% | 3.85 34% | 5.3 9% | 3.76 35% | 5.14 ? 11% | 6.73 ? -16% |
| Load Maximum * (Watt) | 11.8 | 6.18 48% | 6.64 44% | 8.3 30% | 8.48 28% | 10.7 ? 9% | 11.3 ? 4% |
* ... menor é melhor
| Samsung Galaxy S20+ 4500 mAh | Apple iPhone 11 Pro Max 3969 mAh | Huawei Mate 30 Pro 4500 mAh | OnePlus 7T Pro 4085 mAh | Sony Xperia 1 3330 mAh | |
|---|---|---|---|---|---|
| Duração da bateria | 42% | 6% | 11% | -26% | |
| Reader / Idle (h) | 34 | 43.6 28% | 36.2 6% | 33.6 -1% | 17.8 -48% |
| H.264 (h) | 16.3 | 22.4 37% | 18.3 12% | 16 -2% | 11.9 -27% |
| WiFi v1.3 (h) | 13.2 | 15.2 15% | 13.7 4% | 15.2 15% | 7.4 -44% |
| Load (h) | 3.6 | 6.8 89% | 3.7 3% | 4.7 31% | 4.1 14% |
Pro
Contra
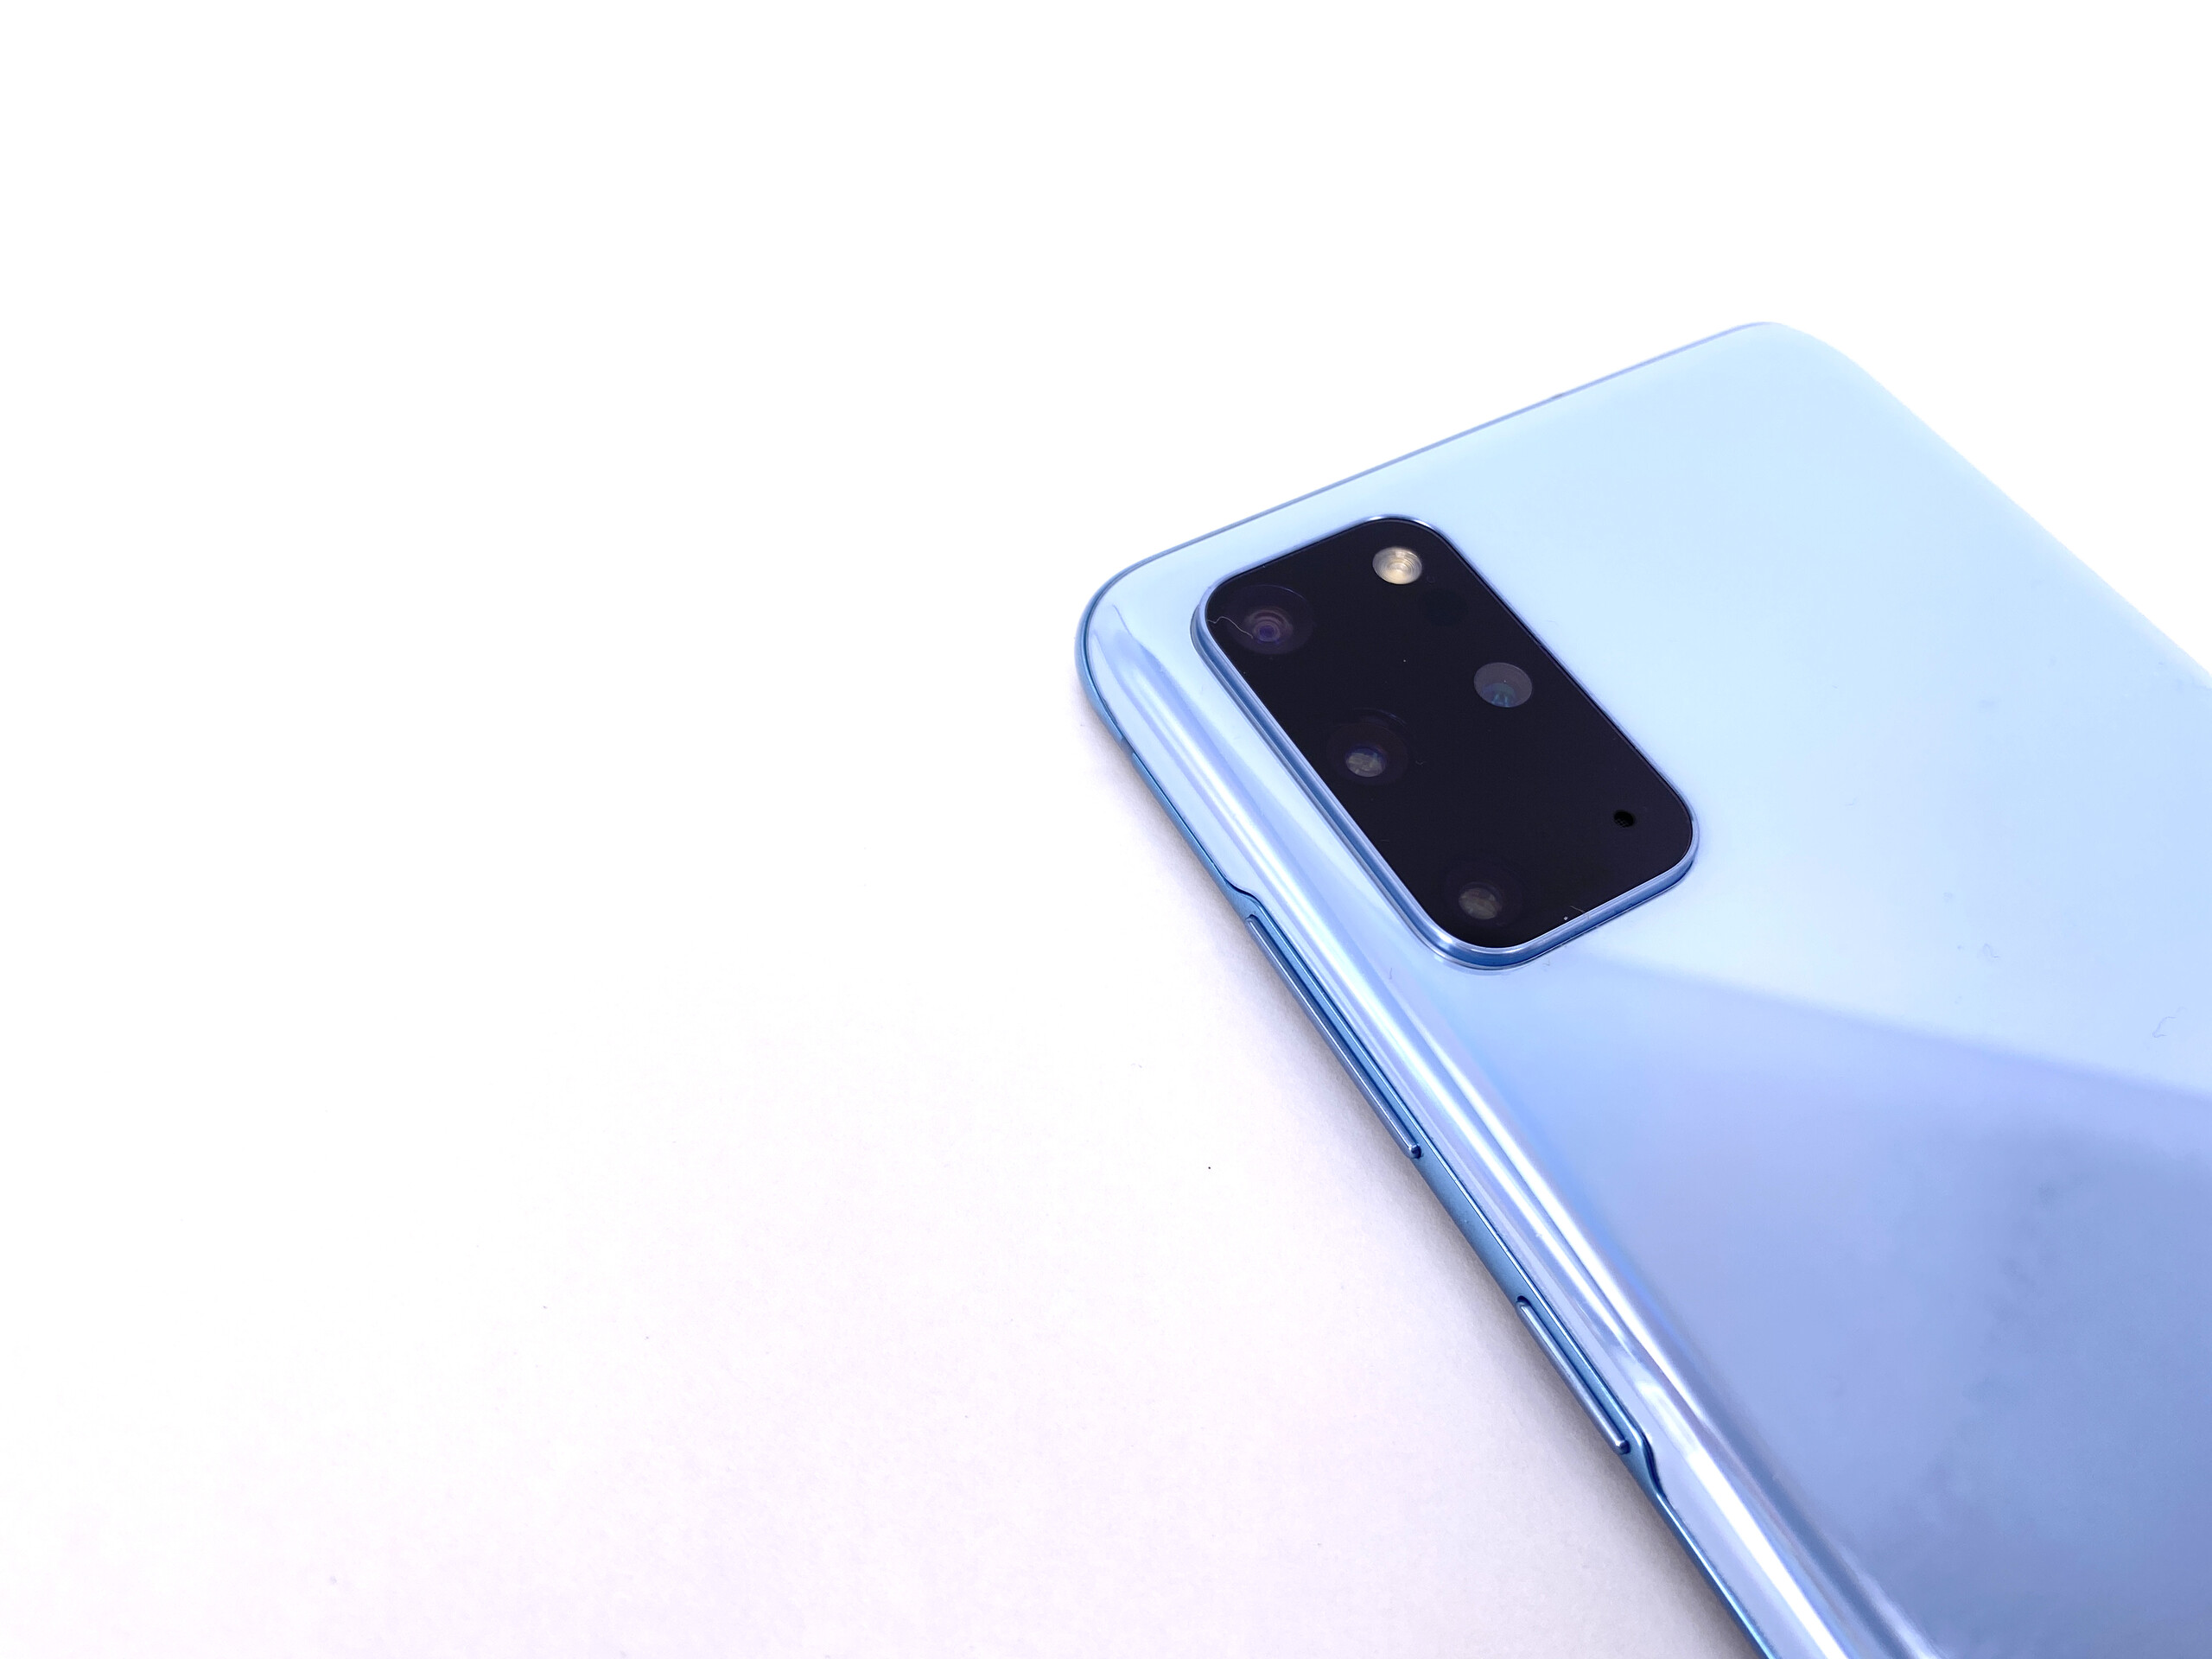
Veredicto - Fraqueza da câmera

O preço do Galaxy S20+ já caiu significativamente, logo após o lançamento da Samsung a 999 Euros (~US$ 1.093). Sem dúvida, essa é uma boa notícia para os consumidores, pois eles podem obter o mesmo smartphone gastando menos dinheiro. No entanto, os clientes europeus receberão um Galaxy S20+ que não corresponde ao seu potencial. Isso ocorre principalmente porque a Samsung equipa o dispositivo com o Exynos 990, seu chipset interno que fica aquém do Snapdragon 865 em muitas áreas. Em resumo, o Galaxy S20+ europeu tem conectividade 5G pior, maior afogamento sob carga e pior desempenho da CPU do que seu irmão Snapdragon 865. No geral, a versão do Galaxy S20+ com Snapdragon 865 seria o melhor dos dois dispositivos a comprar.
Pelo menos a duração da bateria do SoC Exynos está agora se aproximando lentamente do nível da concorrência. No entanto, o Exynos 990 é relativamente sedento de energia sob uso intenso sustentado. Você não deve esperar a melhor tecnologia de carregamento da Samsung com o Galaxy S20+, pois a empresa reserva isso para o Galaxy S20 Ultra. Em geral, tanto o Galaxy S20 quanto o Galaxy S20 Plus se sentem como uma redução significativa em comparação com o S20 Ultra.
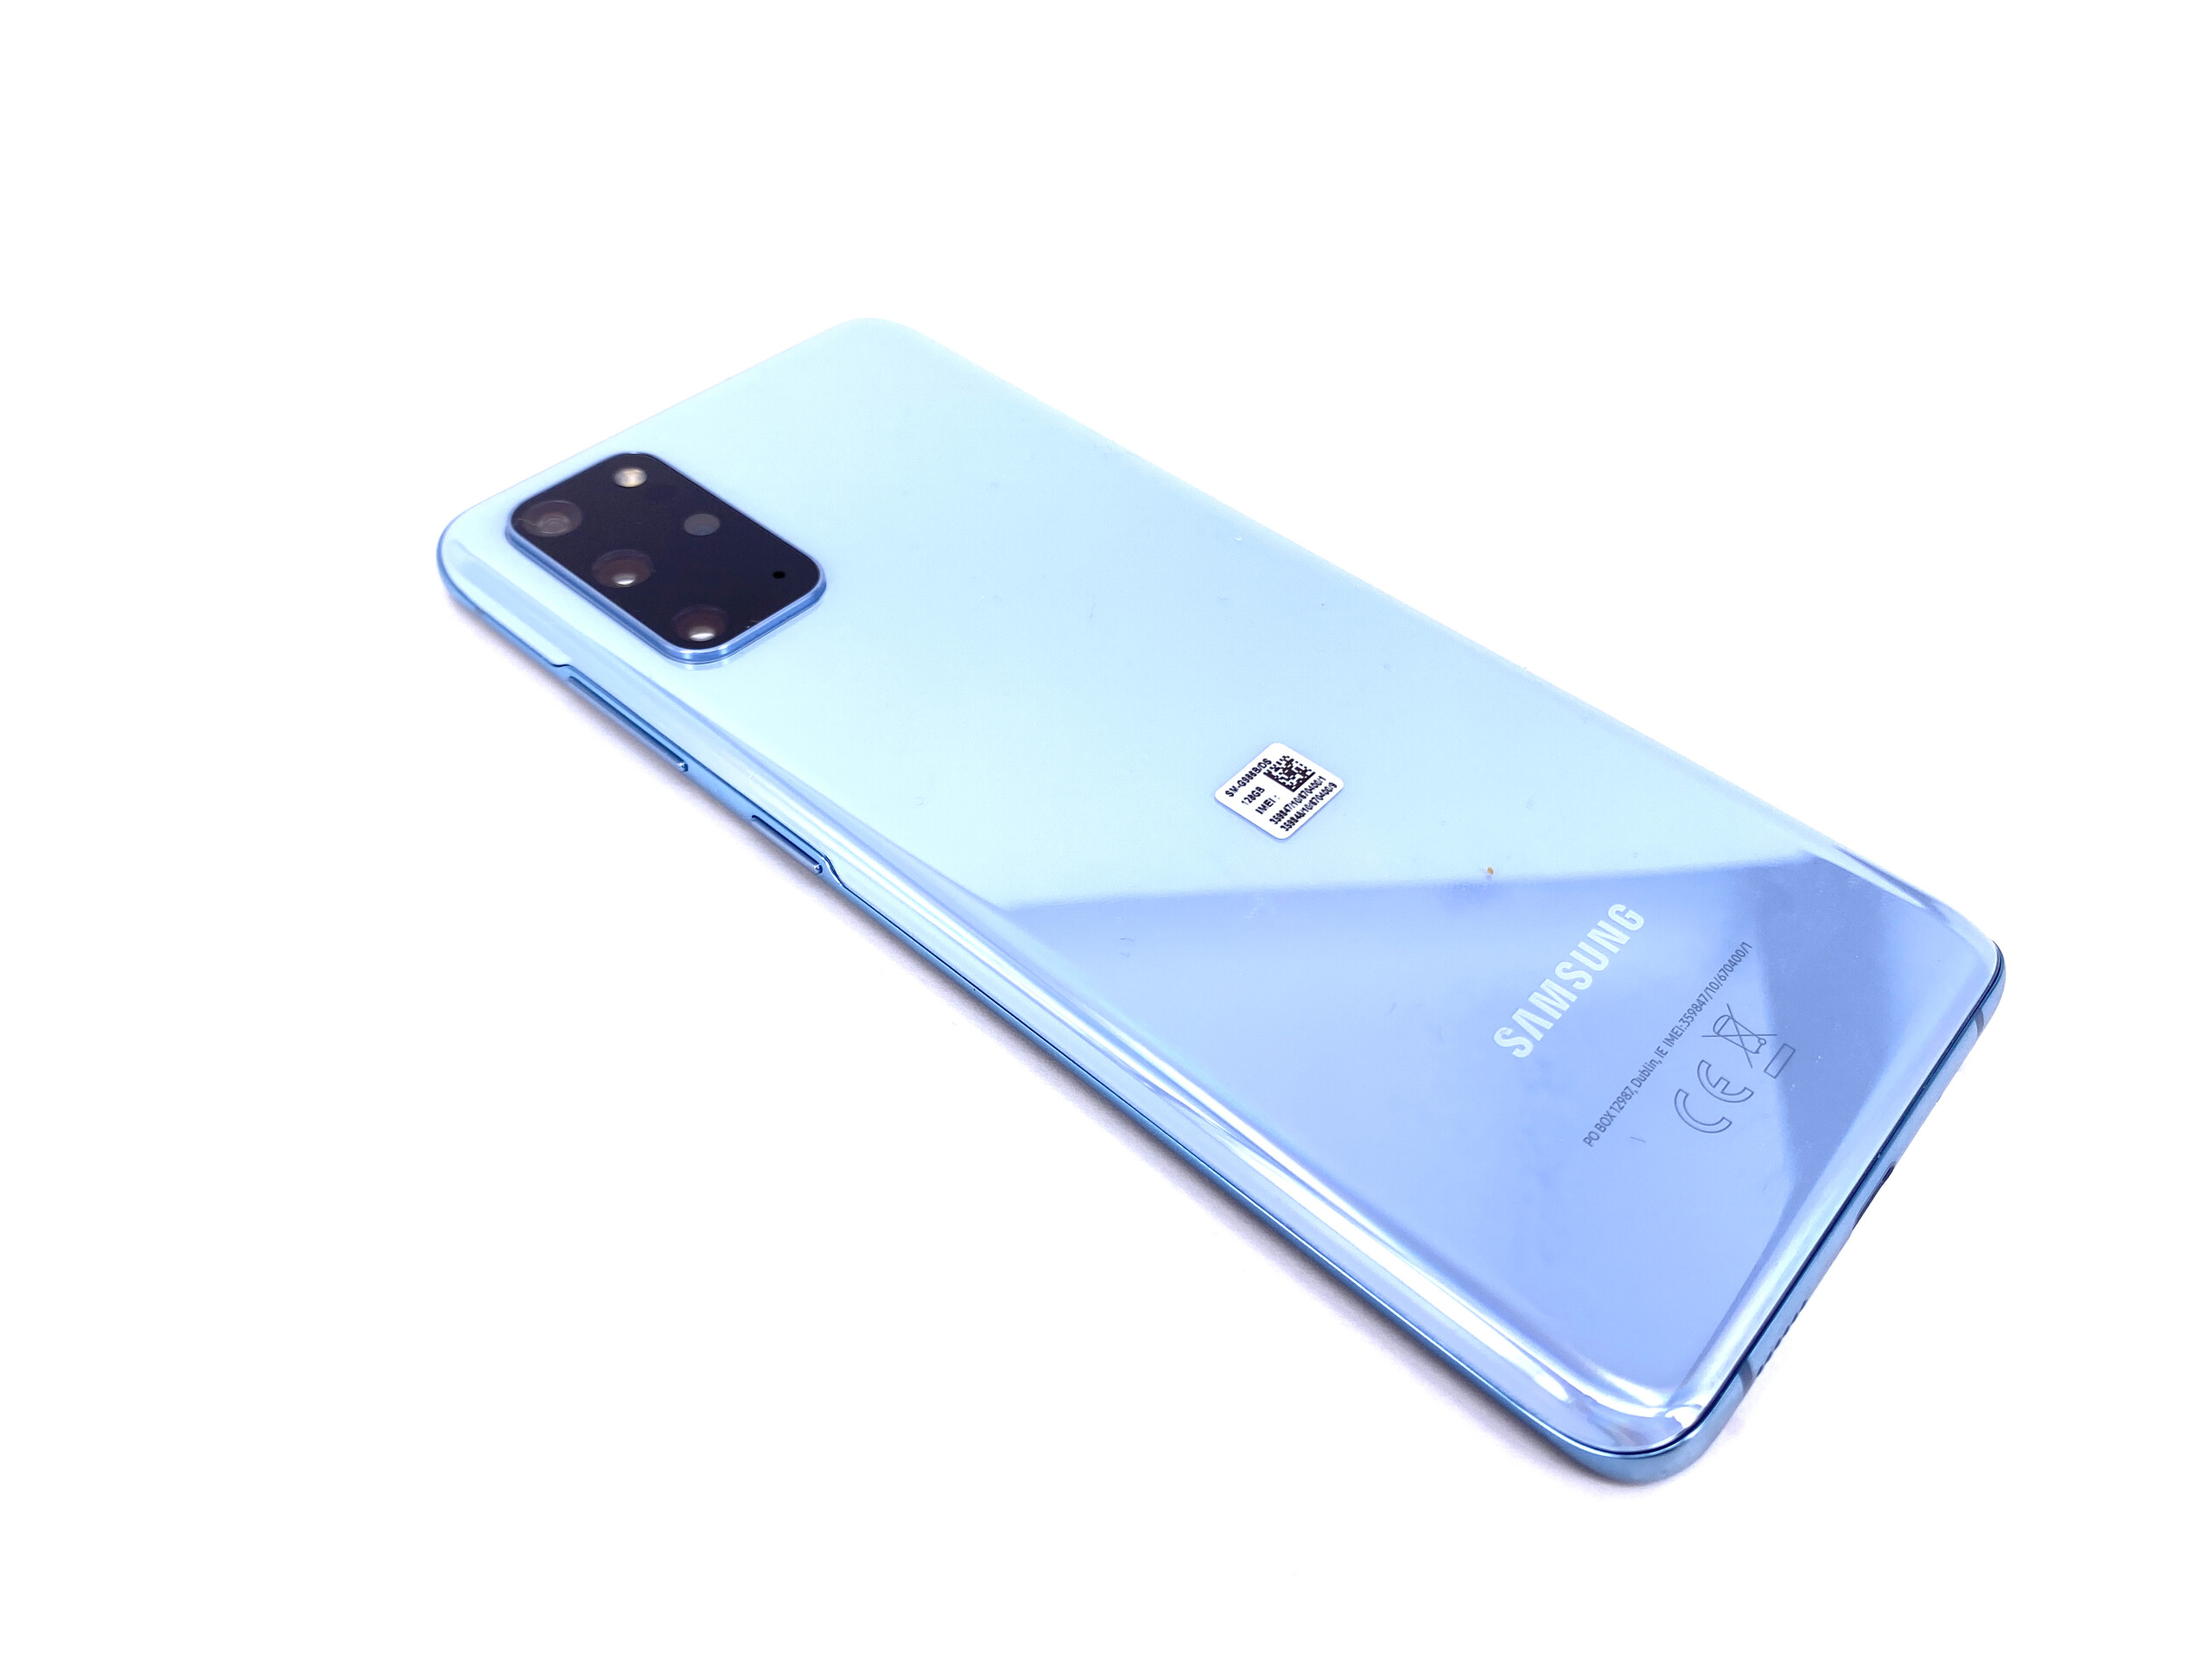
Isto é principalmente devido às câmeras que a Samsung inclui. Sem um zoom óptico real, parece que a Samsung priorizou os recursos de vídeo de 8K em vez de uma lente telefoto adequada. No entanto, a empresa aplica muitas restrições à gravação de vídeo em 8K, como a incapacidade de aplicar zoom ou usar o foco automático. Da mesma forma, a Samsung restringe as opções que podem ser usadas ao gravar vídeos de 60 FPS em 1080p e superior.
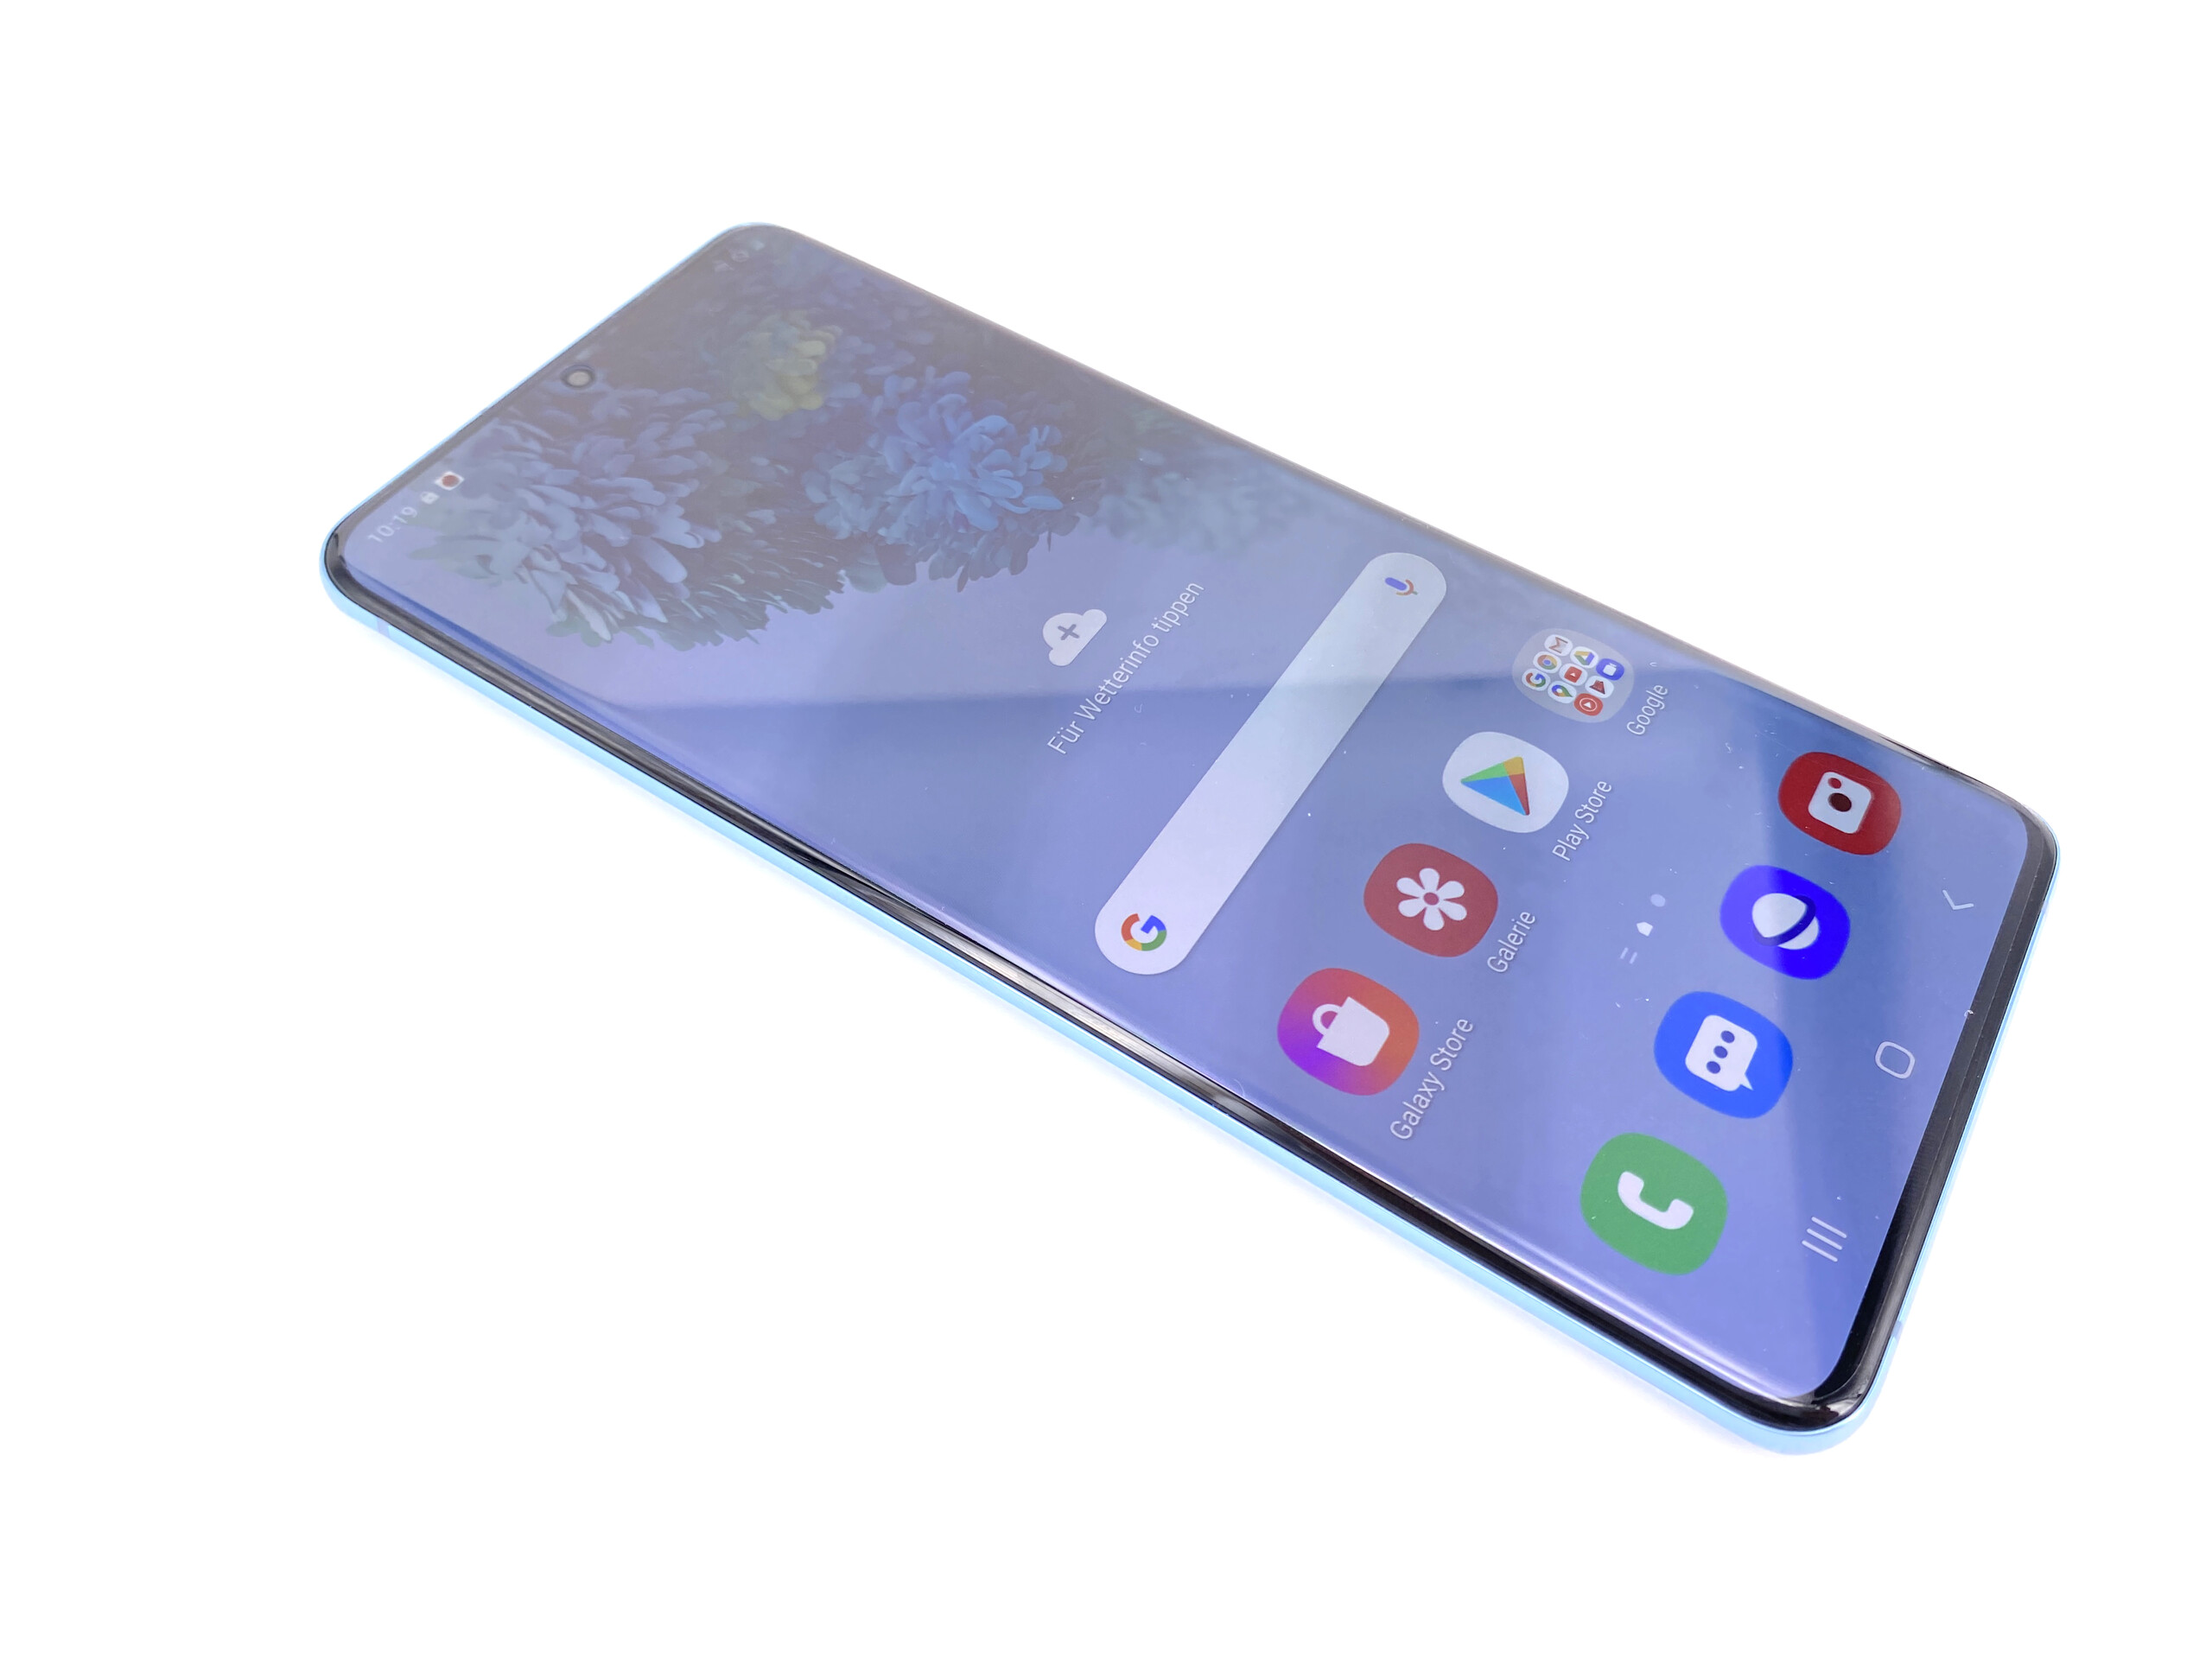
As omissões da câmera são uma pena, pois o Galaxy S20+ tira fotos decentes. Da mesma forma, o One UI 2.1 se sente moderno e inclui as mais recentes correções de segurança, enquanto o dispositivo possui uma tela AMOLED brilhante e responsiva.
O Samsung Galaxy S20+ usa truques para esconder os pontos fracos de sua câmera. Sua ótima tela ainda faz valer a pena dar uma olhada.
Em resumo, você deve procurar outras opções se quiser a melhor câmera de smartphone. Manter-se fiel à Samsung o recompensará com um carro-chefe de alta qualidade que pode convencer com seu Wi-Fi, boa qualidade de chamada, precisão decente de GPS, qualidade de construção impressionante e duração da bateria.
Samsung Galaxy S20+
- 08/31/2022 v7 (old)
Florian Schmitt
Price comparison
