Breve Análise do Tablet Lenovo Tab M10


| |||||||||||||||||||||||||
iluminação: 86 %
iluminação com acumulador: 339 cd/m²
Contraste: 807:1 (Preto: 0.42 cd/m²)
ΔE ColorChecker Calman: 5.8 | ∀{0.5-29.43 Ø4.73}
ΔE Greyscale Calman: 8.6 | ∀{0.09-98 Ø4.97}
97.8% sRGB (Calman 2D)
Gamma: 2.16
CCT: 8718 K
| Lenovo Tab M10 IPS, 1920x1200, 10.1" | Acer Iconia Tab 10 A3-A50 IPS, 1920x1200, 10.1" | Amazon Fire HD 10 2017 IPS, 1920x1200, 10.1" | Chuwi Hi9 Plus IPS, 2560x1600, 10.8" | Huawei MediaPad T5 10 IPS, 1920x1200, 10.1" | Lenovo Tab P10 IPS, 1920x1200, 10.1" | Samsung Galaxy Tab A 10.5 SM-T590N IPS, 1920x1200, 10.5" | |
|---|---|---|---|---|---|---|---|
| Screen | -4% | 25% | 10% | 22% | 17% | 50% | |
| Brightness middle (cd/m²) | 339 | 340 0% | 426 26% | 308 -9% | 356 5% | 522 54% | 556 64% |
| Brightness (cd/m²) | 327 | 320 -2% | 399 22% | 297 -9% | 340 4% | 495 51% | 514 57% |
| Brightness Distribution (%) | 86 | 84 -2% | 91 6% | 92 7% | 92 7% | 84 -2% | 87 1% |
| Black Level * (cd/m²) | 0.42 | 0.19 55% | 0.38 10% | 0.29 31% | 0.5 -19% | 0.41 2% | 0.42 -0% |
| Contrast (:1) | 807 | 1789 122% | 1121 39% | 1062 32% | 712 -12% | 1273 58% | 1324 64% |
| Colorchecker dE 2000 * | 5.8 | 15 -159% | 4.5 22% | 6.2 -7% | 2.3 60% | 6.7 -16% | 1.8 69% |
| Colorchecker dE 2000 max. * | 11.6 | 22.8 -97% | 7.9 32% | 10.5 9% | 6.5 44% | 12.2 -5% | 3.2 72% |
| Greyscale dE 2000 * | 8.6 | 4 53% | 5.2 40% | 6.6 23% | 1.4 84% | 9.1 -6% | 2.2 74% |
| Gamma | 2.16 102% | 2.09 105% | 2.23 99% | 2.19 100% | 2.16 102% | 2.14 103% | 2.26 97% |
| CCT | 8718 75% | 6940 94% | 6875 95% | 8216 79% | 6565 99% | 9417 69% | 6819 95% |
* ... menor é melhor
Cintilação da tela / PWM (modulação por largura de pulso)
| Tela tremeluzindo / PWM não detectado | 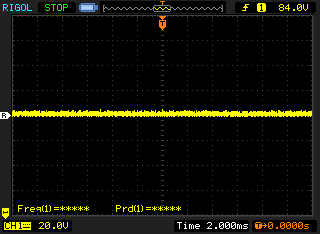 | ||
[pwm_comparison] Em comparação: 52 % de todos os dispositivos testados não usam PWM para escurecer a tela. Se PWM foi detectado, uma média de 7798 (mínimo: 5 - máximo: 343500) Hz foi medida. | |||
Exibir tempos de resposta
| ↔ Tempo de resposta preto para branco | ||
|---|---|---|
| 42.4 ms ... ascensão ↗ e queda ↘ combinadas | ↗ 21.6 ms ascensão | 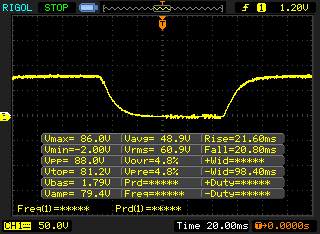 |
| ↘ 20.8 ms queda | ||
| A tela mostra taxas de resposta lentas em nossos testes e será insatisfatória para os jogadores. Em comparação, todos os dispositivos testados variam de 0.1 (mínimo) a 240 (máximo) ms. » 98 % de todos os dispositivos são melhores. Isso significa que o tempo de resposta medido é pior que a média de todos os dispositivos testados (19.9 ms). | ||
| ↔ Tempo de resposta 50% cinza a 80% cinza | ||
| 77.6 ms ... ascensão ↗ e queda ↘ combinadas | ↗ 39.6 ms ascensão | 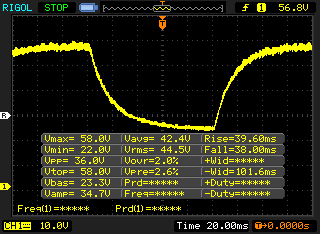 |
| ↘ 38 ms queda | ||
| A tela mostra taxas de resposta lentas em nossos testes e será insatisfatória para os jogadores. Em comparação, todos os dispositivos testados variam de 0.165 (mínimo) a 636 (máximo) ms. » 99 % de todos os dispositivos são melhores. Isso significa que o tempo de resposta medido é pior que a média de todos os dispositivos testados (31.1 ms). | ||
| AnTuTu v7 - Total Score | |
| Chuwi Hi9 Plus | |
| Huawei MediaPad T5 10 | |
| Amazon Fire HD 10 2017 | |
| Lenovo Tab P10 | |
| Lenovo Tab M10 | |
| Samsung Galaxy Tab A 10.5 SM-T590N | |
| Média Qualcomm Snapdragon 450 (56497 - 73468, n=11) | |
| JetStream 1.1 - 1.1 Total | |
| Acer Iconia Tab 10 A3-A50 (Browser: Chrome Version 63) | |
| Amazon Fire HD 10 2017 (Amazon Silk 61.2) | |
| Chuwi Hi9 Plus (Google Chrome 70) | |
| Huawei MediaPad T5 10 (Chrome 67) | |
| Média Qualcomm Snapdragon 450 (22 - 22.7, n=13) | |
| Lenovo Tab P10 (Chrome 71) | |
| Lenovo Tab M10 (Chrome 71.0.3578.99) | |
| Samsung Galaxy Tab A 10.5 SM-T590N (Chrome 69.0.3497.100) | |
| Octane V2 - Total Score | |
| Média da turma Tablet (763 - 138481, n=74, últimos 2 anos) | |
| Acer Iconia Tab 10 A3-A50 (Browser: Chrome Version 63) | |
| Amazon Fire HD 10 2017 (Amazon Silk 61.2) | |
| Chuwi Hi9 Plus (Chrome 70) | |
| Huawei MediaPad T5 10 (Chrome 67) | |
| Samsung Galaxy Tab A 10.5 SM-T590N (Chrome 69.0.3497.100) | |
| Lenovo Tab P10 (Chrome 71) | |
| Lenovo Tab M10 (Chrome 71.0.3578.99) | |
| Média Qualcomm Snapdragon 450 (3470 - 4115, n=14) | |
| Mozilla Kraken 1.1 - Total | |
| Samsung Galaxy Tab A 10.5 SM-T590N (Chrome 69.0.3497.100) | |
| Média Qualcomm Snapdragon 450 (11012 - 11863, n=14) | |
| Lenovo Tab M10 (Chrome 71.0.3578.99) | |
| Lenovo Tab P10 (Chrome 71) | |
| Huawei MediaPad T5 10 (Chrome 67) | |
| Chuwi Hi9 Plus (Chrome 70) | |
| Amazon Fire HD 10 2017 (Amazon Silk 61.2) | |
| Acer Iconia Tab 10 A3-A50 (Browser: Chrome Version 63) | |
| Média da turma Tablet (243 - 27101, n=68, últimos 2 anos) | |
| WebXPRT 3 - Overall | |
| Média da turma Tablet (108 - 480, n=11, últimos 2 anos) | |
| Huawei MediaPad T5 10 (Chrome 67) | |
| Lenovo Tab M10 (Chrome 71.0.3578.99) | |
| Samsung Galaxy Tab A 10.5 SM-T590N (Chrome 69.0.3497.100) | |
| Média Qualcomm Snapdragon 450 (28 - 34, n=8) | |
| WebXPRT 2015 - Overall | |
| Amazon Fire HD 10 2017 (Amazon Silk 61.2) | |
| Huawei MediaPad T5 10 (Chrome 67) | |
| Lenovo Tab P10 (Chrome 71) | |
| Lenovo Tab M10 (Chrome 71.0.3578.99) | |
| Samsung Galaxy Tab A 10.5 SM-T590N (Chrome 69.0.3497.100) | |
| Média Qualcomm Snapdragon 450 (90 - 103, n=7) | |
* ... menor é melhor
| Lenovo Tab M10 | Acer Iconia Tab 10 A3-A50 | Amazon Fire HD 10 2017 | Chuwi Hi9 Plus | Huawei MediaPad T5 10 | Lenovo Tab P10 | Samsung Galaxy Tab A 10.5 SM-T590N | Média 16 GB eMMC Flash | Média da turma Tablet | |
|---|---|---|---|---|---|---|---|---|---|
| AndroBench 3-5 | -12% | 4% | -7% | 118% | 56% | 25% | -35% | 1645% | |
| Sequential Read 256KB (MB/s) | 279.9 | 173.7 -38% | 262.2 -6% | 145 -48% | 312.2 12% | 276.7 -1% | 285.6 2% | 164.5 ? -41% | 1987 ? 610% |
| Sequential Write 256KB (MB/s) | 52.6 | 92.4 76% | 147.7 181% | 132.5 152% | 83.8 59% | 205.7 291% | 103.3 96% | 43 ? -18% | 1580 ? 2904% |
| Random Read 4KB (MB/s) | 52.5 | 13.7 -74% | 27.72 -47% | 42.2 -20% | 76.7 46% | 53.9 3% | 71.1 35% | 21.7 ? -59% | 268 ? 410% |
| Random Write 4KB (MB/s) | 11.32 | 8.77 -23% | 9.37 -17% | 13.01 15% | 76.1 572% | 15.75 39% | 13.39 18% | 8.08 ? -29% | 312 ? 2656% |
| Sequential Read 256KB SDCard (MB/s) | 83.5 ? | 80.4 ? -4% | 55.5 ? -34% | 21.16 -75% | 83.9 ? 0% | 84.3 ? 1% | 80.6 ? -3% | 59.1 ? -29% | |
| Sequential Write 256KB SDCard (MB/s) | 61.2 ? | 56.8 ? -7% | 30.14 ? -51% | 20.44 -67% | 72.5 ? 18% | 61 ? 0% | 60.4 ? -1% | 39.8 ? -35% |
Dead Trigger 2
Asphalt 9: Legends (Graphics: High)
Asphalt 9: Legends (Graphics: Normal)
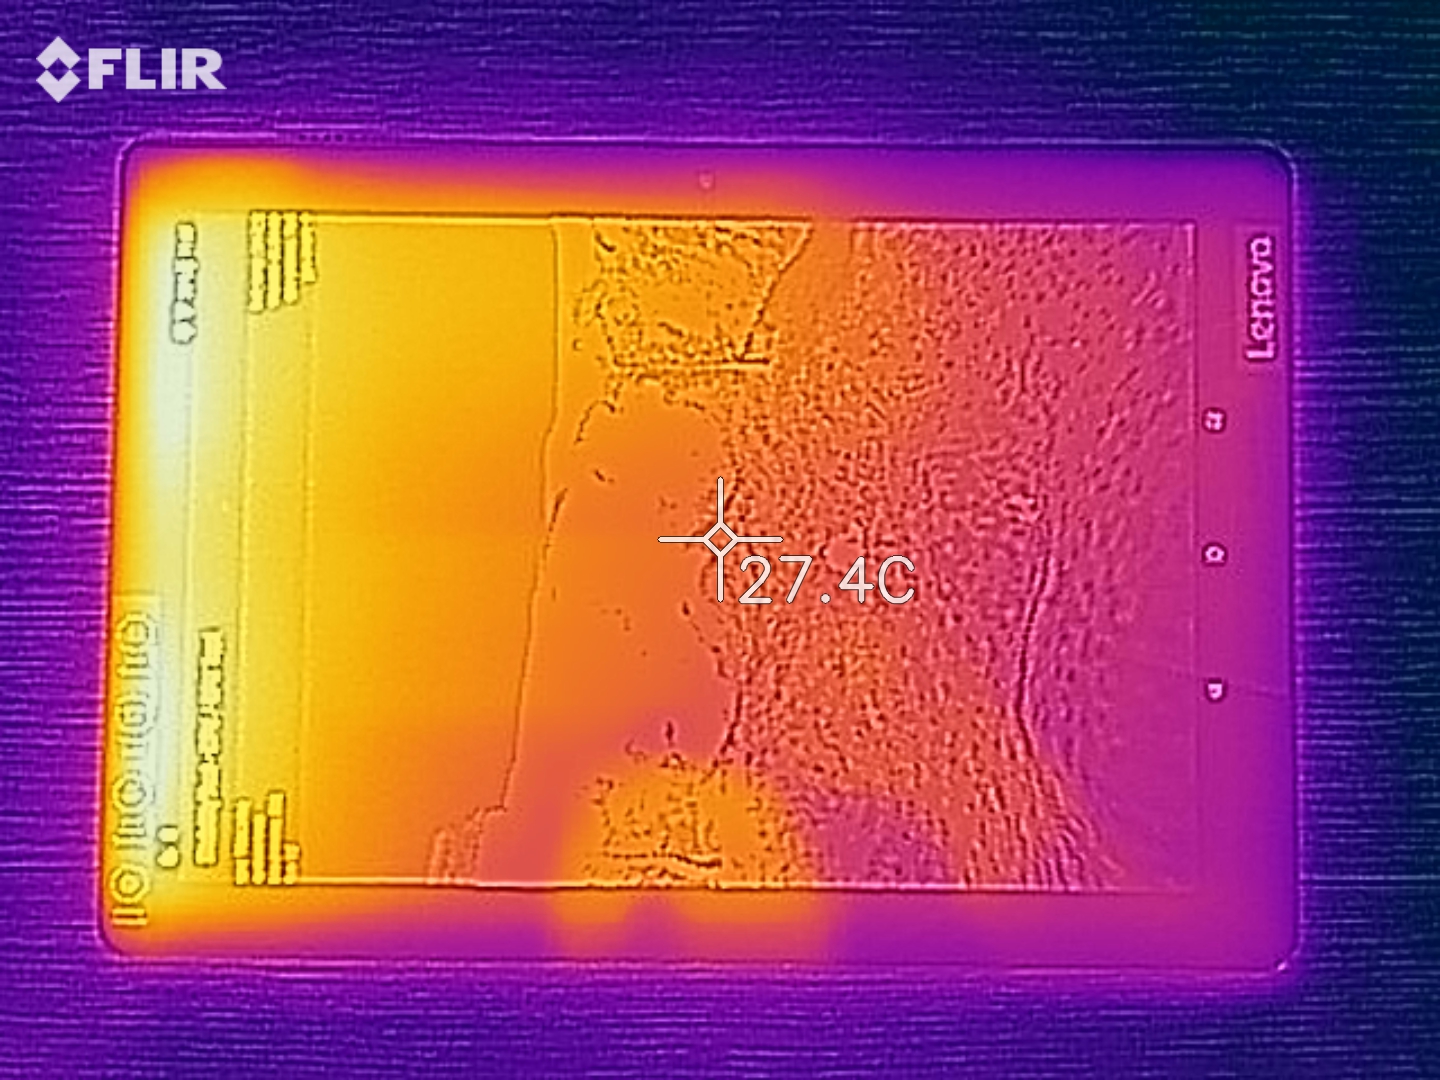
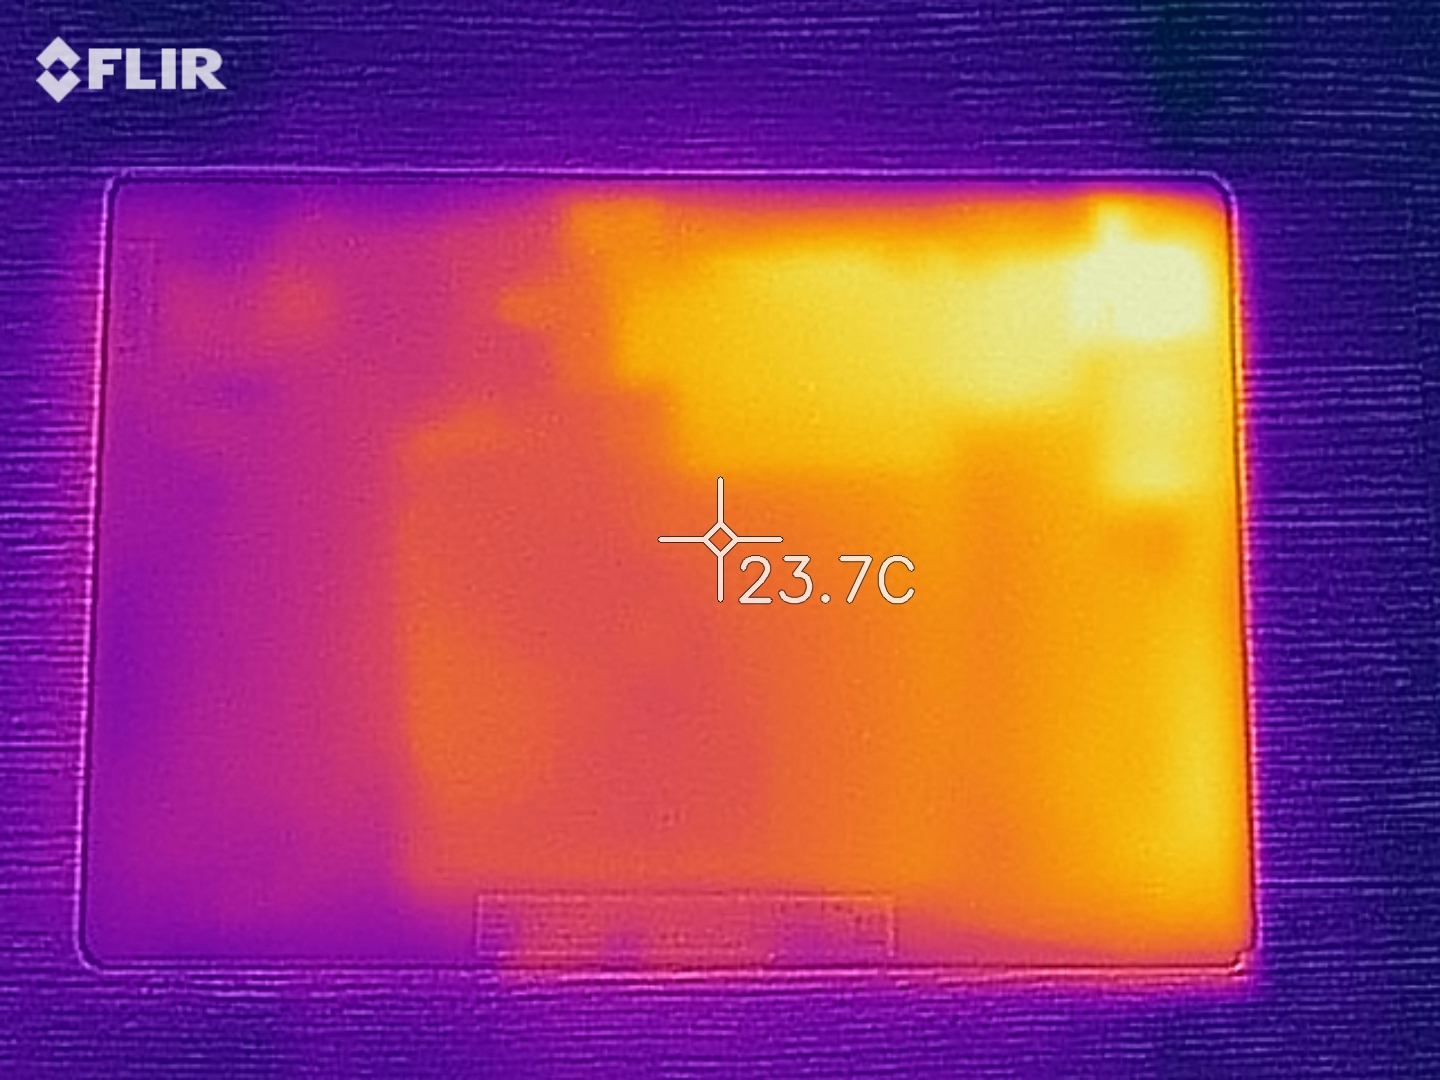
(+) A temperatura máxima no lado superior é 31.8 °C / 89 F, em comparação com a média de 33.6 °C / 92 F , variando de 20.7 a 53.2 °C para a classe Tablet.
(+) A parte inferior aquece até um máximo de 29.4 °C / 85 F, em comparação com a média de 33.2 °C / 92 F
(+) Em uso inativo, a temperatura média para o lado superior é 27.3 °C / 81 F, em comparação com a média do dispositivo de 30 °C / ### class_avg_f### F.
Lenovo Tab M10 análise de áudio
(+) | os alto-falantes podem tocar relativamente alto (###valor### dB)
Graves 100 - 315Hz
(-) | quase nenhum baixo - em média 26.5% menor que a mediana
(±) | a linearidade dos graves é média (8.5% delta para a frequência anterior)
Médios 400 - 2.000 Hz
(+) | médios equilibrados - apenas 4.6% longe da mediana
(+) | médios são lineares (5.3% delta para frequência anterior)
Altos 2 - 16 kHz
(±) | máximos mais altos - em média 7.5% maior que a mediana
(+) | os máximos são lineares (3.5% delta da frequência anterior)
Geral 100 - 16.000 Hz
(±) | a linearidade do som geral é média (20.5% diferença em relação à mediana)
Comparado com a mesma classe
» 59% de todos os dispositivos testados nesta classe foram melhores, 7% semelhantes, 34% piores
» O melhor teve um delta de 7%, a média foi 20%, o pior foi 129%
Comparado com todos os dispositivos testados
» 54% de todos os dispositivos testados foram melhores, 8% semelhantes, 38% piores
» O melhor teve um delta de 4%, a média foi 24%, o pior foi 134%
Lenovo Tab P10 análise de áudio
(+) | os alto-falantes podem tocar relativamente alto (###valor### dB)
Graves 100 - 315Hz
(-) | quase nenhum baixo - em média 24.7% menor que a mediana
(±) | a linearidade dos graves é média (9.7% delta para a frequência anterior)
Médios 400 - 2.000 Hz
(+) | médios equilibrados - apenas 4.4% longe da mediana
(+) | médios são lineares (5.9% delta para frequência anterior)
Altos 2 - 16 kHz
(+) | agudos equilibrados - apenas 3.3% longe da mediana
(+) | os máximos são lineares (5% delta da frequência anterior)
Geral 100 - 16.000 Hz
(±) | a linearidade do som geral é média (17.3% diferença em relação à mediana)
Comparado com a mesma classe
» 43% de todos os dispositivos testados nesta classe foram melhores, 5% semelhantes, 53% piores
» O melhor teve um delta de 7%, a média foi 20%, o pior foi 129%
Comparado com todos os dispositivos testados
» 32% de todos os dispositivos testados foram melhores, 8% semelhantes, 59% piores
» O melhor teve um delta de 4%, a média foi 24%, o pior foi 134%
| desligado | |
| Ocioso | |
| Carga |
|
Key:
min: | |
| Lenovo Tab M10 4850 mAh | Acer Iconia Tab 10 A3-A50 6100 mAh | Amazon Fire HD 10 2017 6300 mAh | Chuwi Hi9 Plus 7000 mAh | Huawei MediaPad T5 10 5100 mAh | Lenovo Tab P10 7000 mAh | Samsung Galaxy Tab A 10.5 SM-T590N 7300 mAh | |
|---|---|---|---|---|---|---|---|
| Power Consumption | -81% | -21% | -57% | -96% | 4% | -1% | |
| Idle Minimum * (Watt) | 0.98 | 3.21 -228% | 1.55 -58% | 2.18 -122% | 2.33 -138% | 1.01 -3% | 1.26 -29% |
| Idle Average * (Watt) | 4.45 | 5.97 -34% | 4.17 6% | 5.29 -19% | 8.46 -90% | 4.16 7% | 4.22 5% |
| Idle Maximum * (Watt) | 4.51 | 6.19 -37% | 4.25 6% | 5.37 -19% | 8.49 -88% | 4.17 8% | 4.29 5% |
| Load Average * (Watt) | 5.78 | 9.72 -68% | 7.13 -23% | 8.56 -48% | 11.14 -93% | 5.45 6% | 5.48 5% |
| Load Maximum * (Watt) | 7.18 | 9.97 -39% | 9.63 -34% | 12.86 -79% | 12.3 -71% | 6.9 4% | 6.57 8% |
* ... menor é melhor
| Lenovo Tab M10 4850 mAh | Acer Iconia Tab 10 A3-A50 6100 mAh | Amazon Fire HD 10 2017 6300 mAh | Chuwi Hi9 Plus 7000 mAh | Huawei MediaPad T5 10 5100 mAh | Lenovo Tab P10 7000 mAh | Samsung Galaxy Tab A 10.5 SM-T590N 7300 mAh | |
|---|---|---|---|---|---|---|---|
| Duração da bateria | -34% | -5% | -18% | 37% | 37% | 59% | |
| Reader / Idle (h) | 21.5 | 12.3 -43% | 16 -26% | 20.7 -4% | 55.5 158% | 21.9 2% | 32.7 52% |
| H.264 (h) | 9.9 | 9.8 -1% | 9.7 -2% | 15.2 54% | 16.1 63% | ||
| WiFi v1.3 (h) | 9.7 | 6.5 -33% | 9 -7% | 10.6 9% | 8.8 -9% | 16.5 70% | 15.6 61% |
| Load (h) | 4 | 2.9 -27% | 4.6 15% | 1.6 -60% | 4 0% | 4.8 20% | 6.4 60% |
Pro
Contra
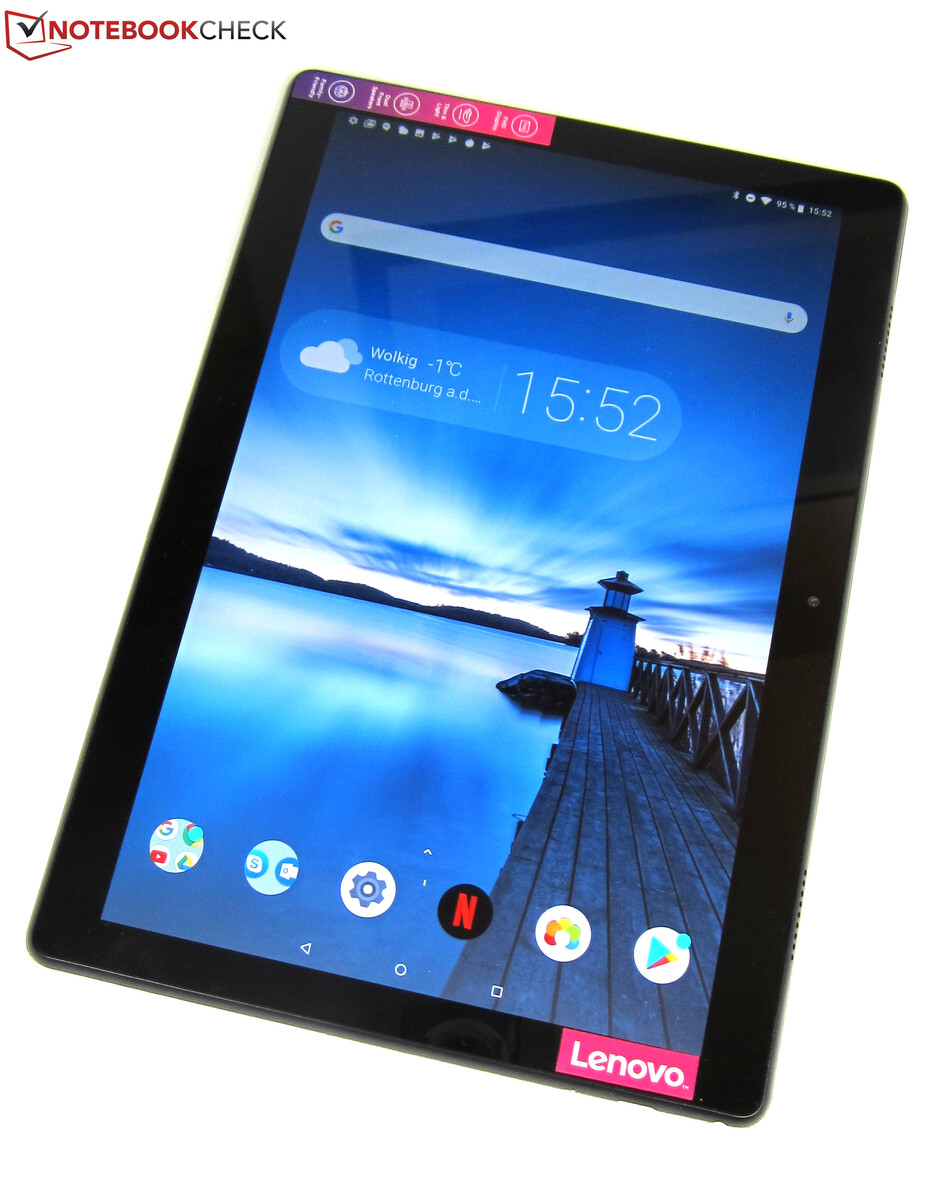
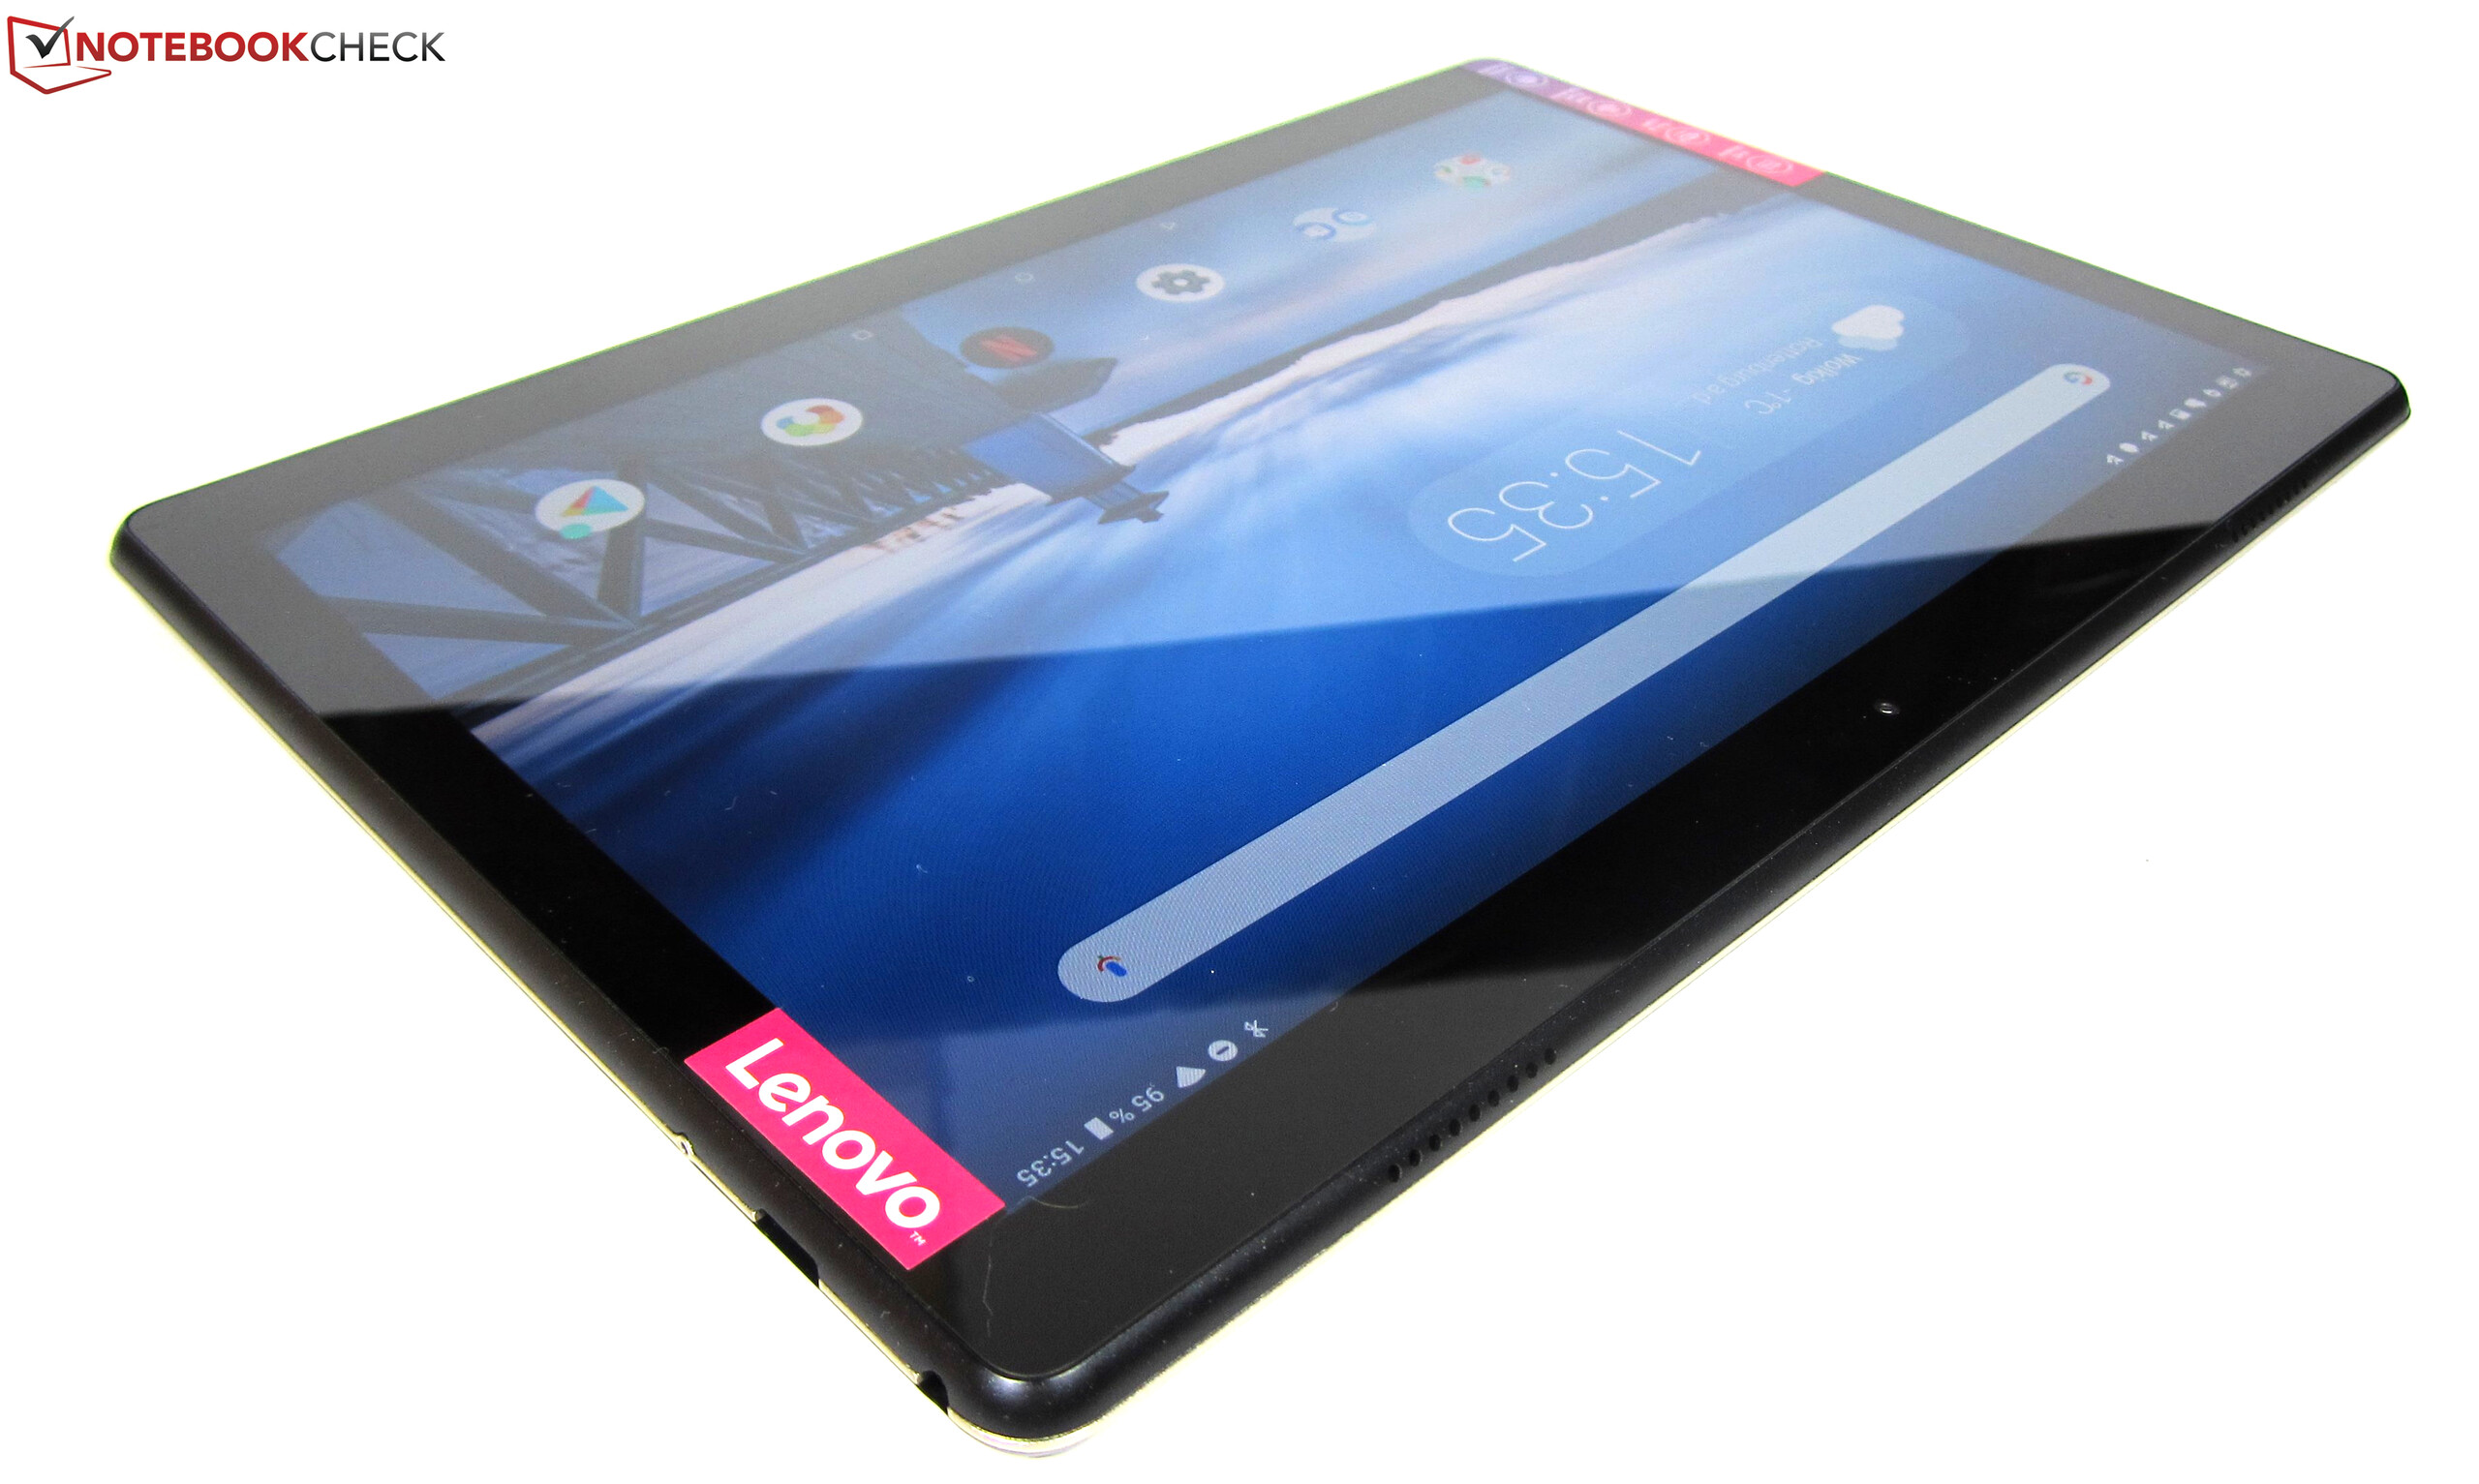
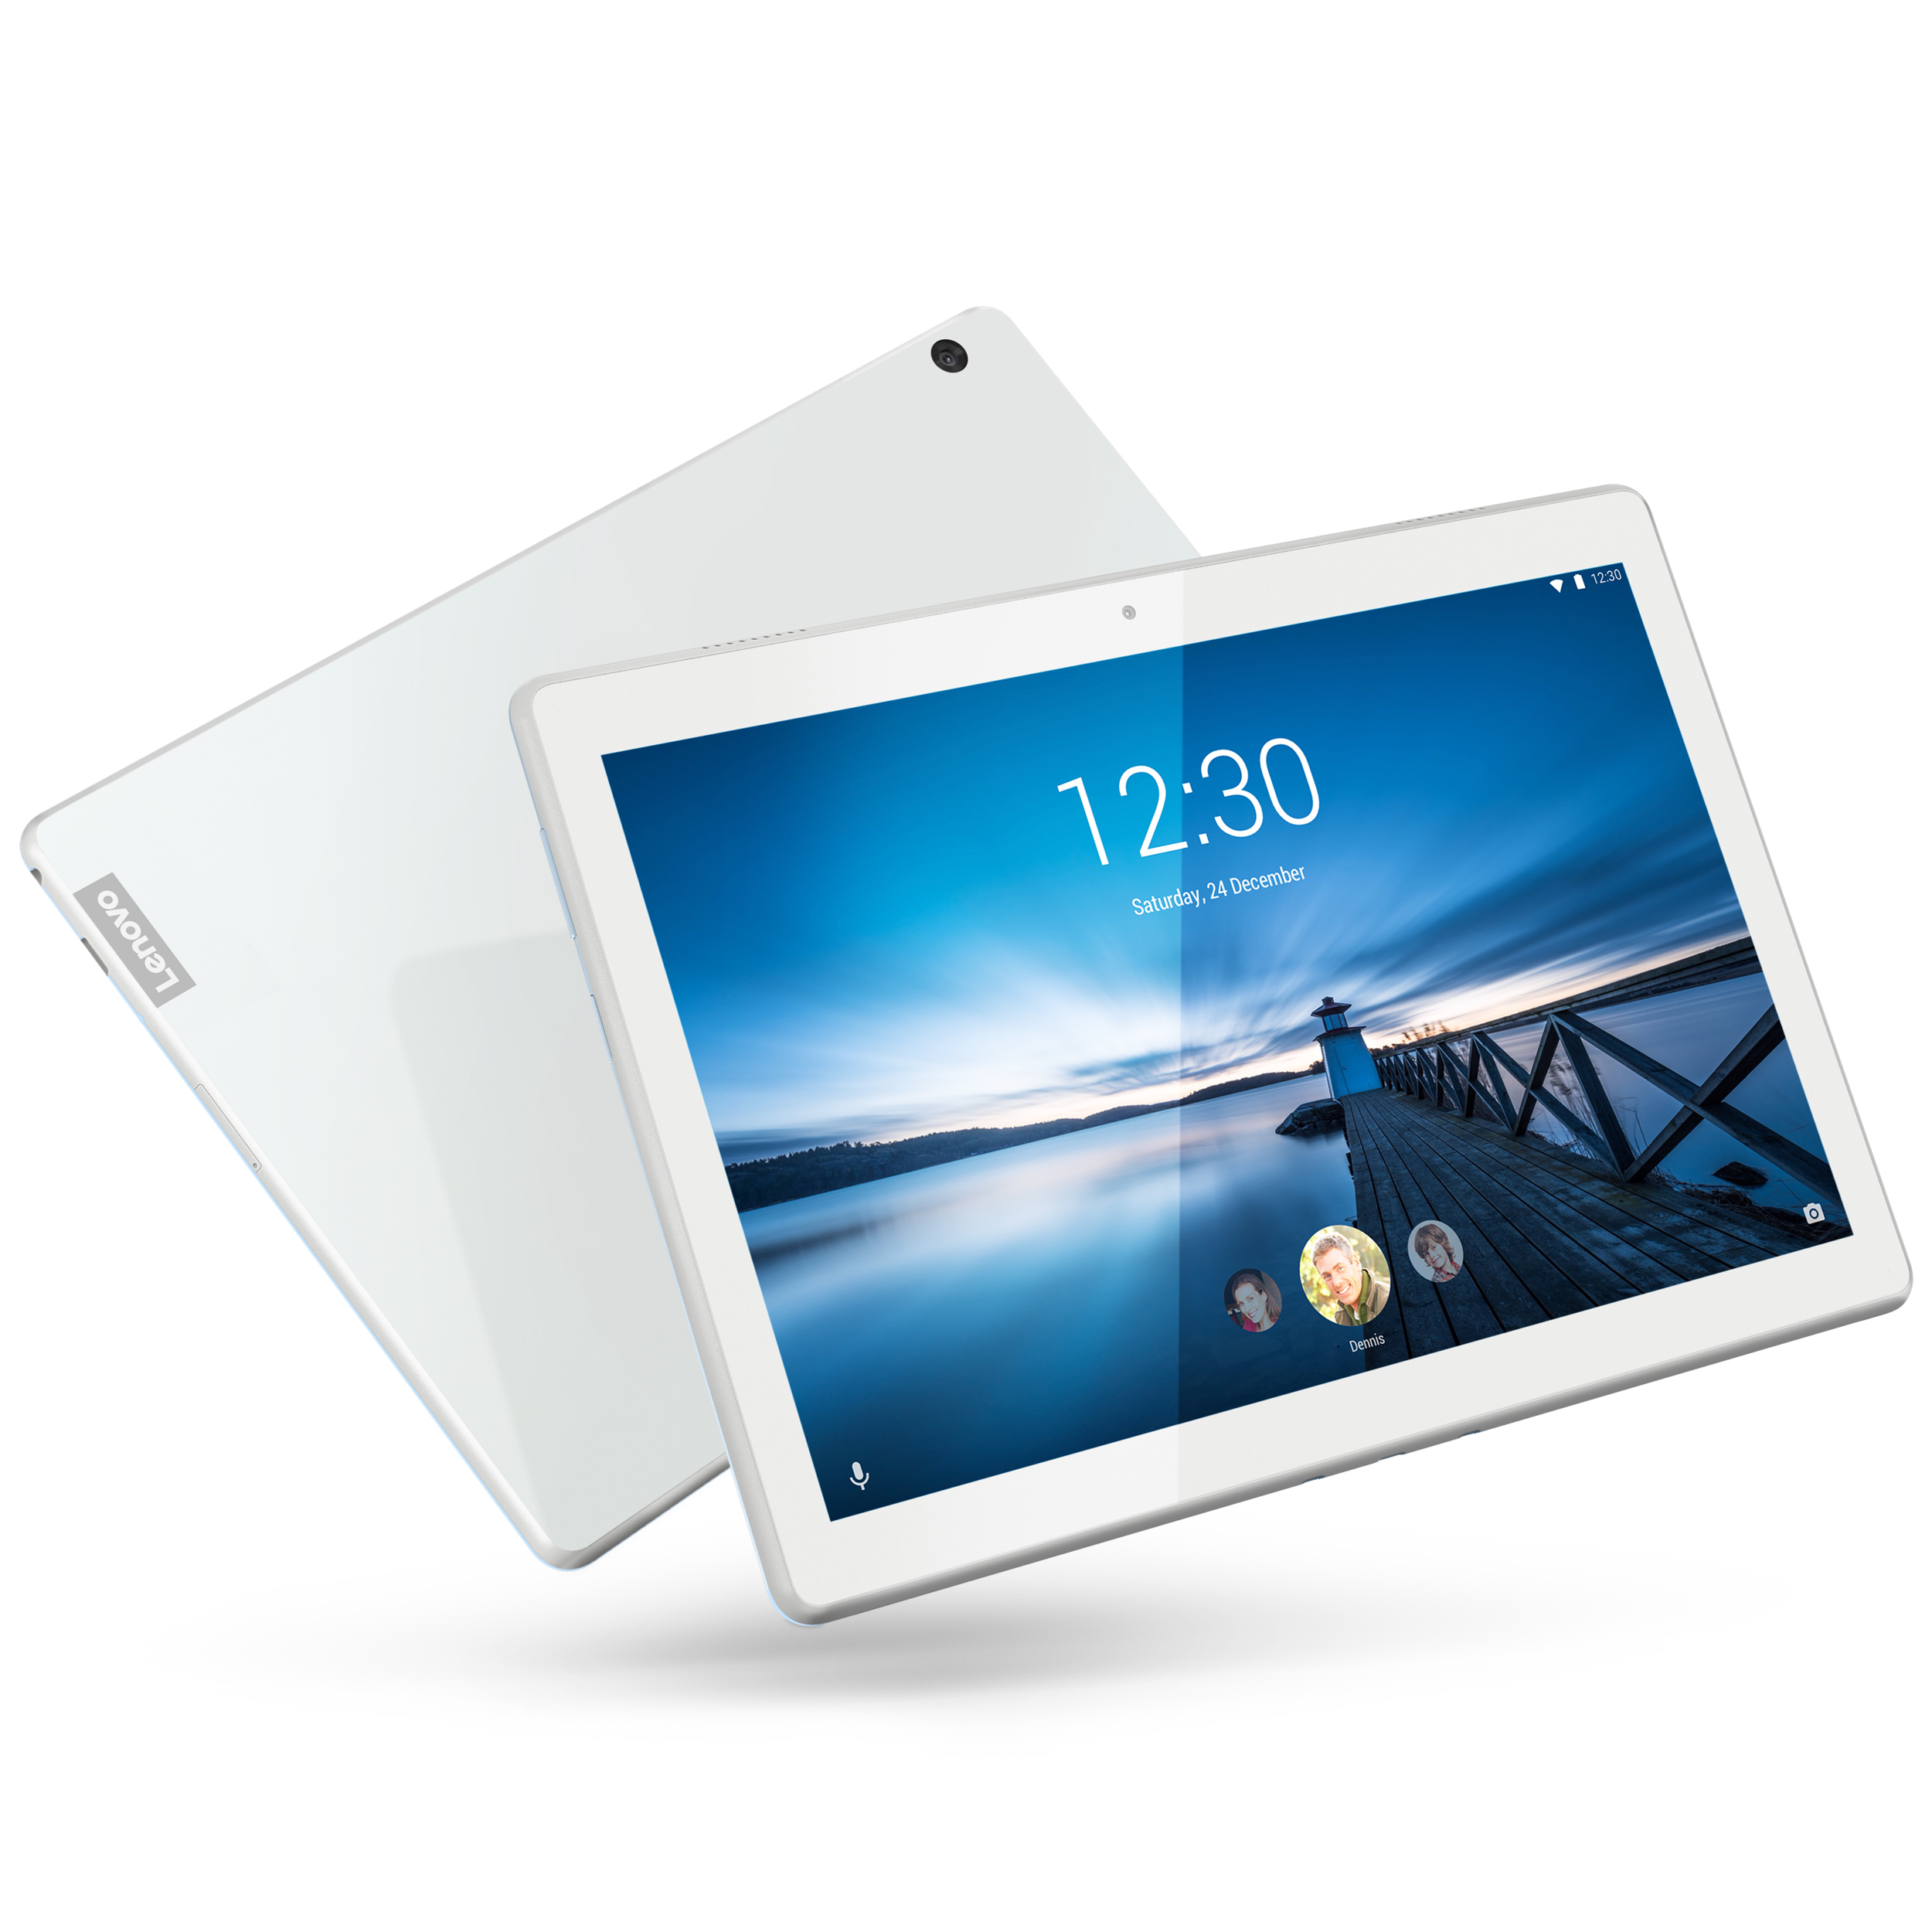
O Lenovo Tab M10 é um tablet de gama média decente. O tablet é acessível e possui recursos amigáveis para crianças, o que deve atrair algumas pessoas a comprá-lo. Seu SoC Snapdragon 450 é poderoso o suficiente para a maioria das tarefas, enquanto seus alto-falantes estéreo são melhores que os da maioria.
O Lenovo Smart Dock também é uma adição útil, desde que você o compre junto com o Tab M10 em sua região, pois atualmente não é possível comprá-lo separadamente. A funcionalidade do Amazon Alexa permite que o tablet funcione como um alto-falante quase inteligente, o que dá ao utilitário Tab M10 uma utilidade adicional.
O Lenovo Tab M10 é um tablet para toda a família que está a partir de £179,99 (~$237). No entanto, seu preço acessível também vem com compromissos como sua tela escura e a duração da bateria decepcionante.
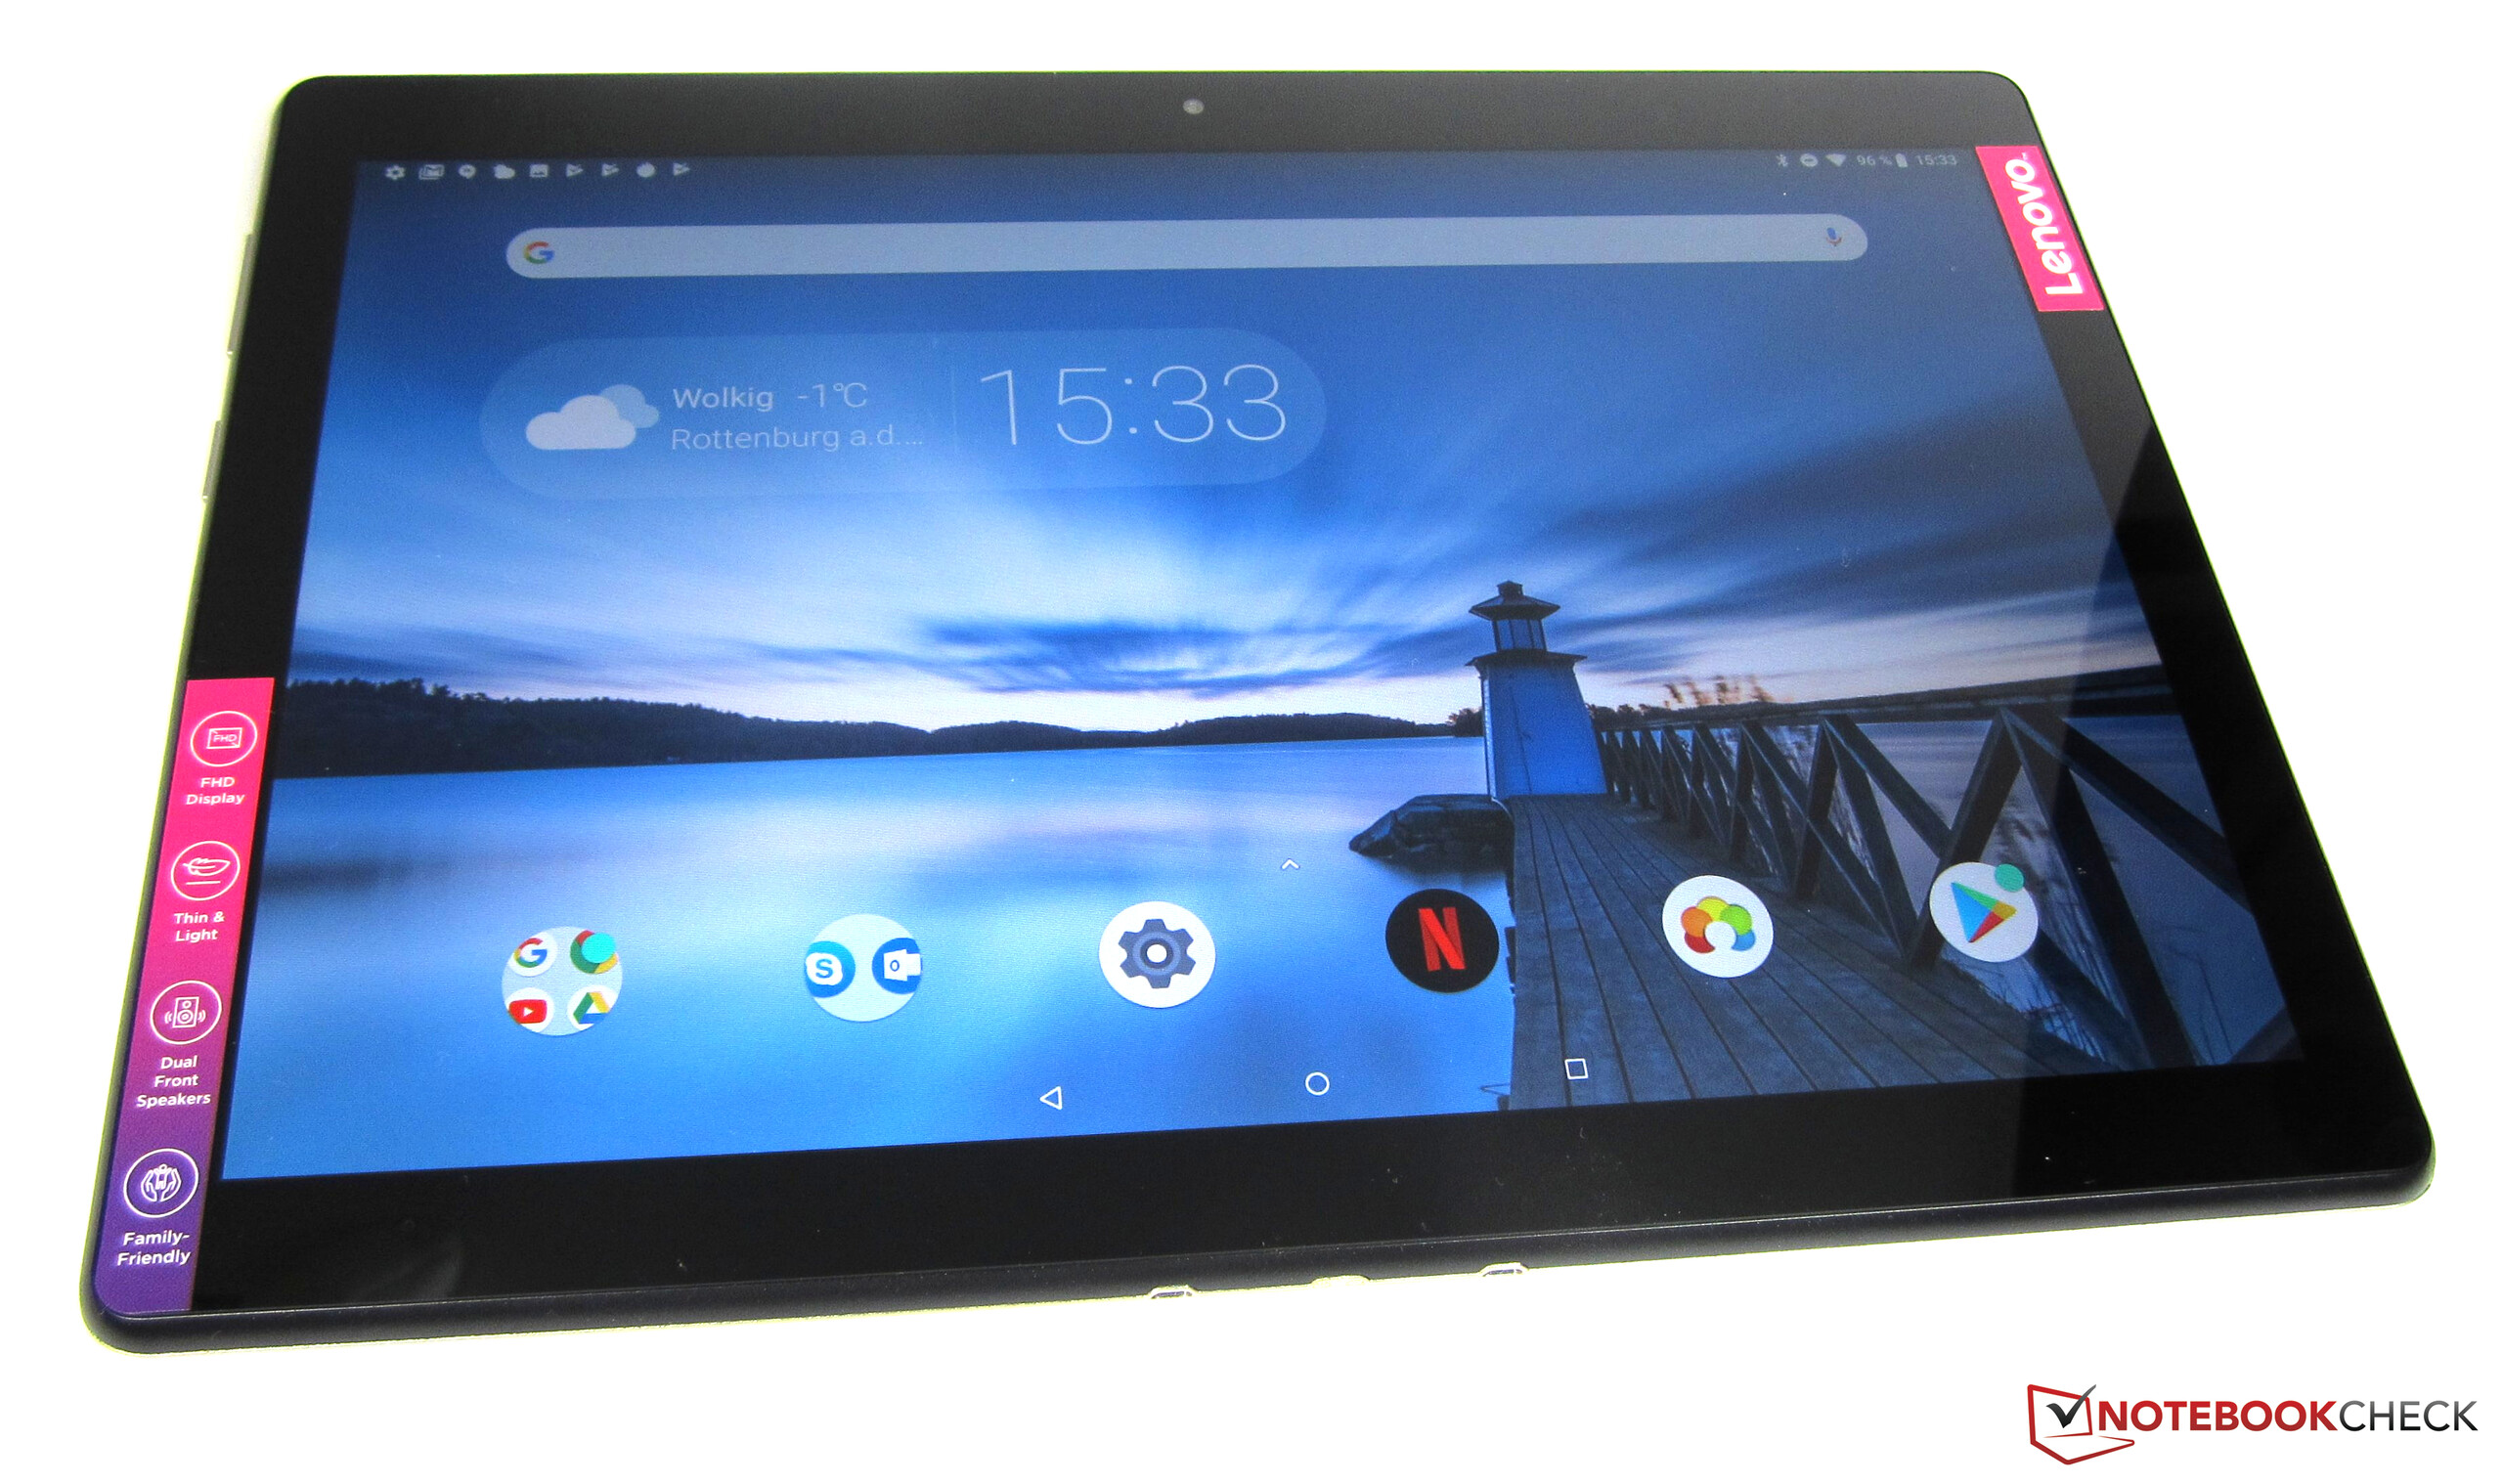
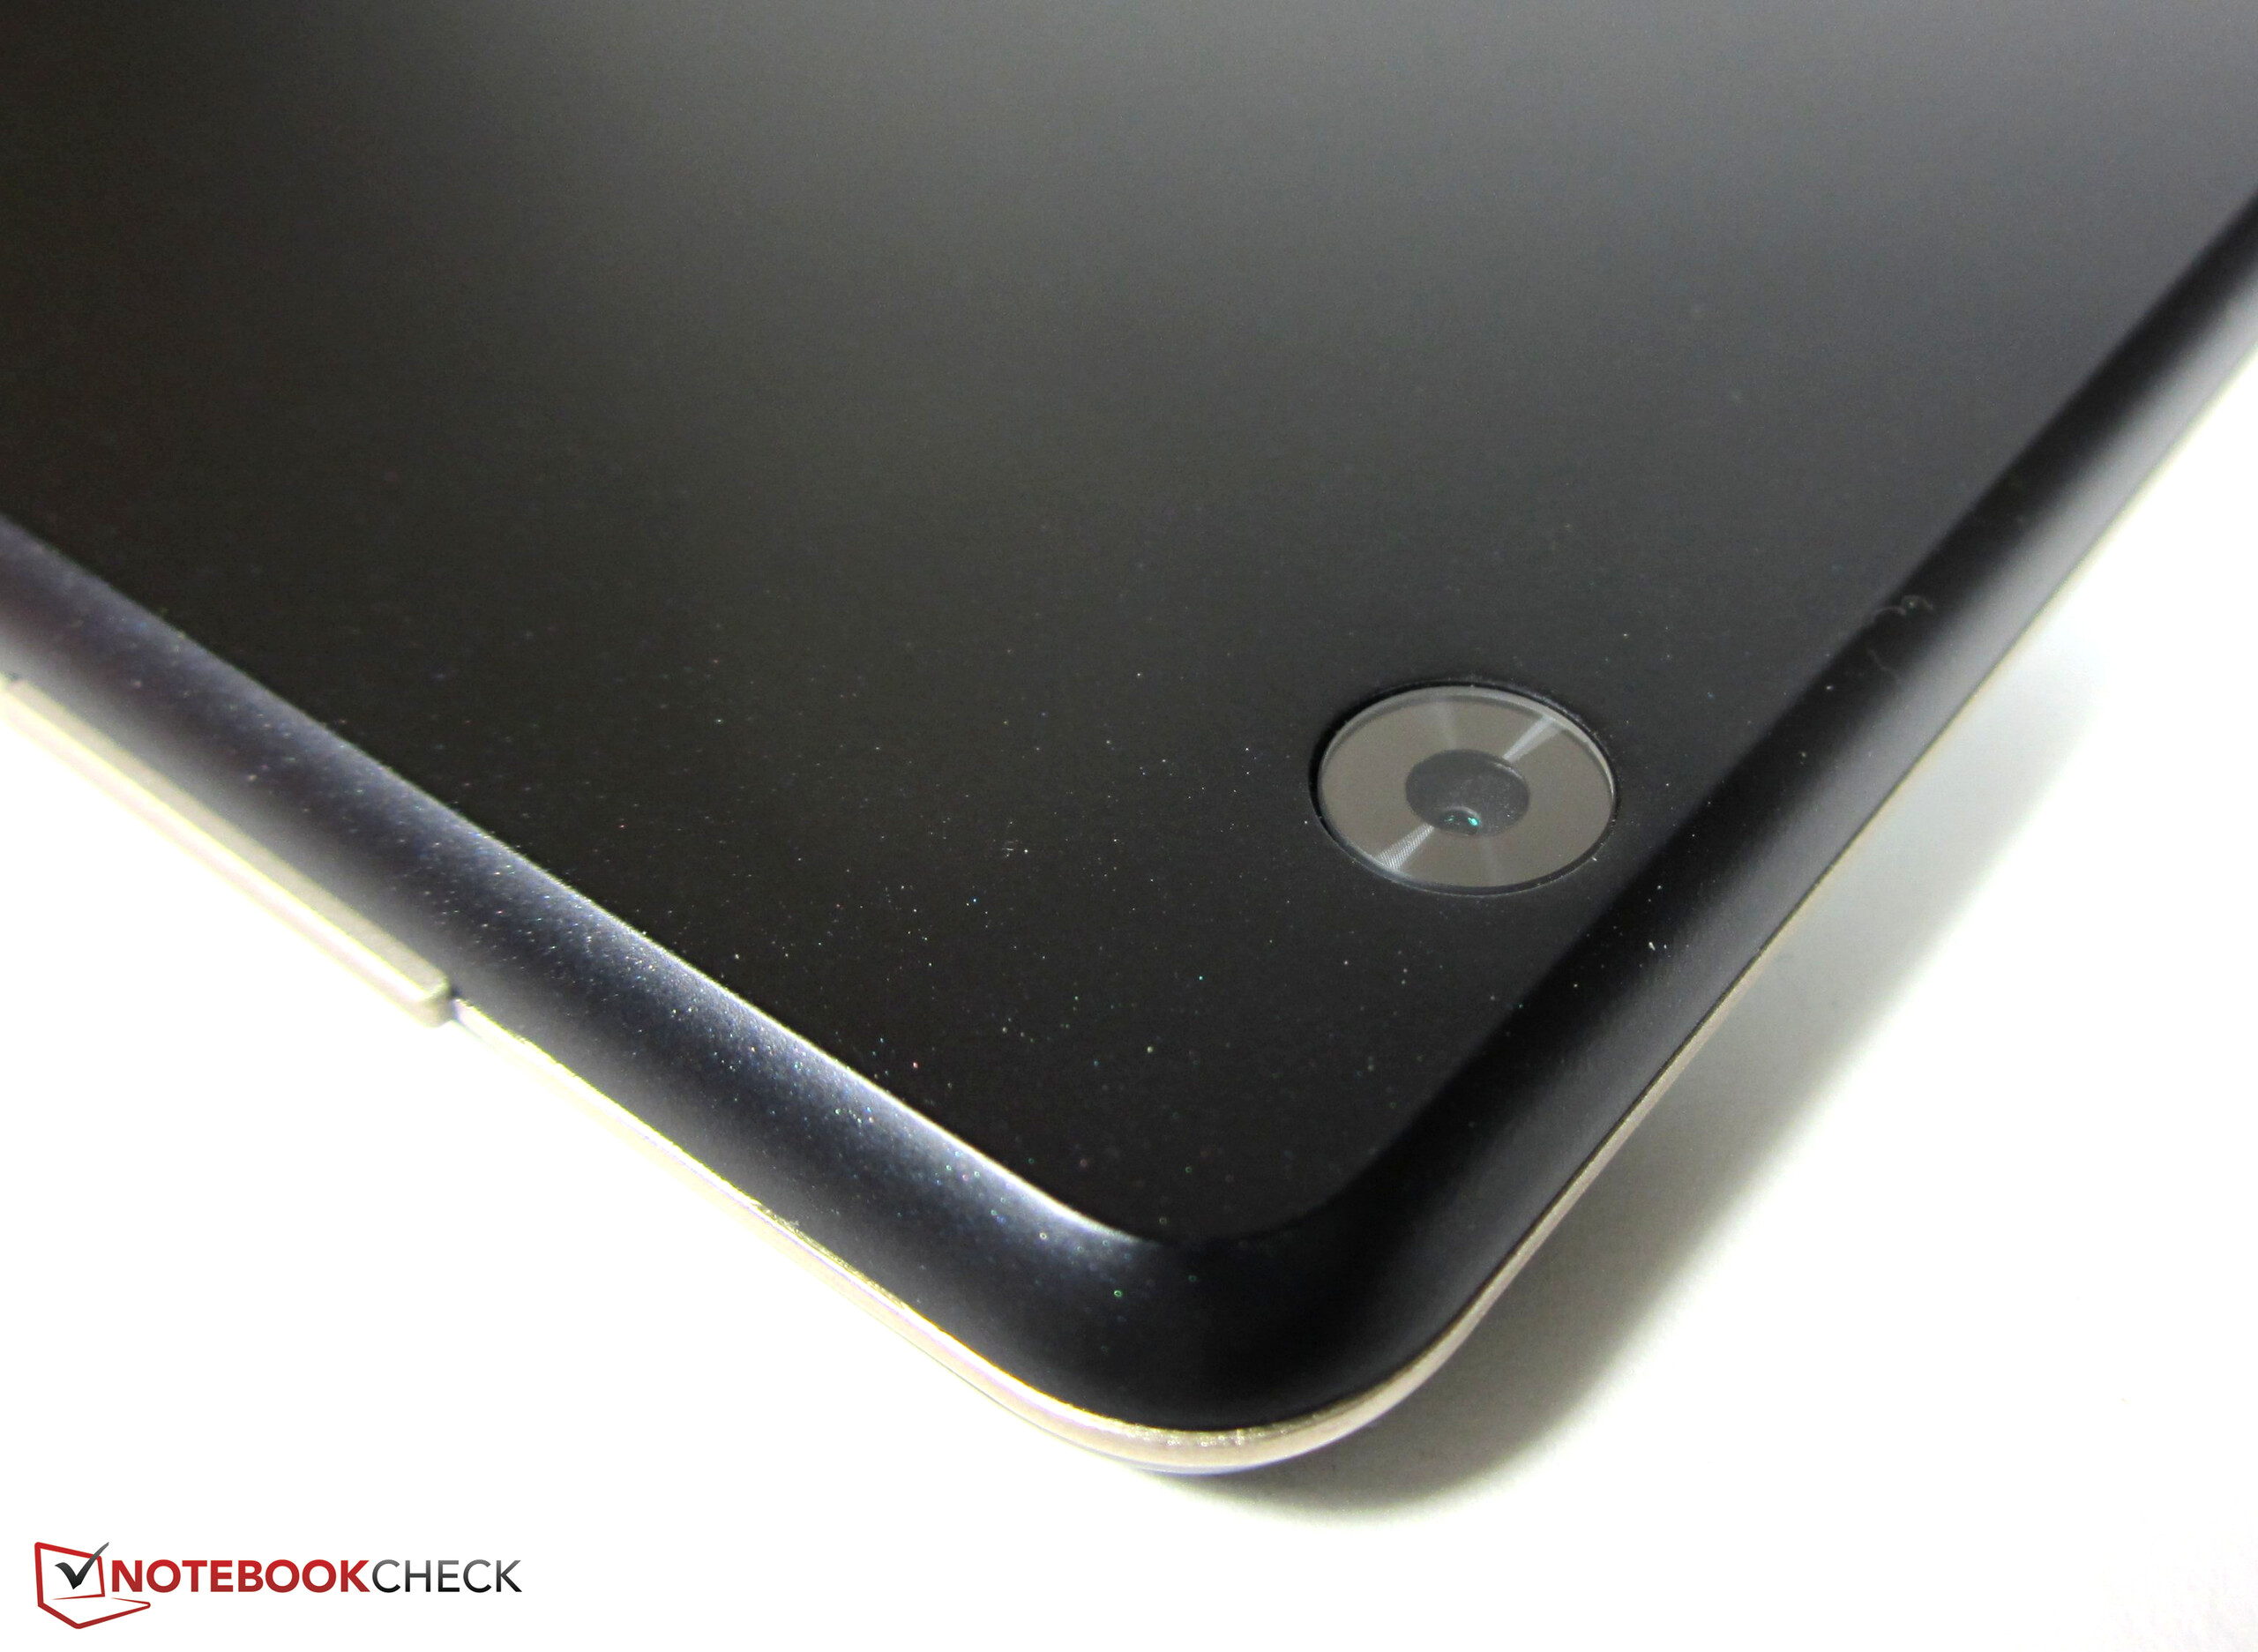
No entanto, o Tab M10 também tem seus problemas. O modelo básico está equipado com 2 GB de RAM e 16 GB de armazenamento. Além disso, suas câmeras são terríveis, e tem uma duração de bateria decepcionante em comparação com o Tab P10. Além disso, sua tela é muito escura para nosso gosto, e é uma pena que a Lenovo não tenha incluído nenhum perfil de cores ou opções de balanço de branco que possam retificar a alta temperatura de cor da tela.
Embora o Tab M10 recebe uma recomendação nossa, sugerimos considerar o Tab P10 sobre seu irmão mais barato. O Tab P10 custa cerca de $100 a mais do que o Tab M10, mas você obtém mais RAM, armazenamento adicional, o dobro de alto-falantes e uma tela mais brilhante com uma bateria muito maior. Além disso, o Tab P10 tem um sensor de digitai, melhores câmeras e um design mais elegante do que o Tab M10. Ele também tem um sensor de luz ambiente que o Tab M10 estranhamente não tem. Em suma, o Tab P10 vale o custo extra se puder esticar o seu orçamento.
Lenovo Tab M10
- 11/05/2019 v7 (old)
Manuel Masiero
Price comparison
