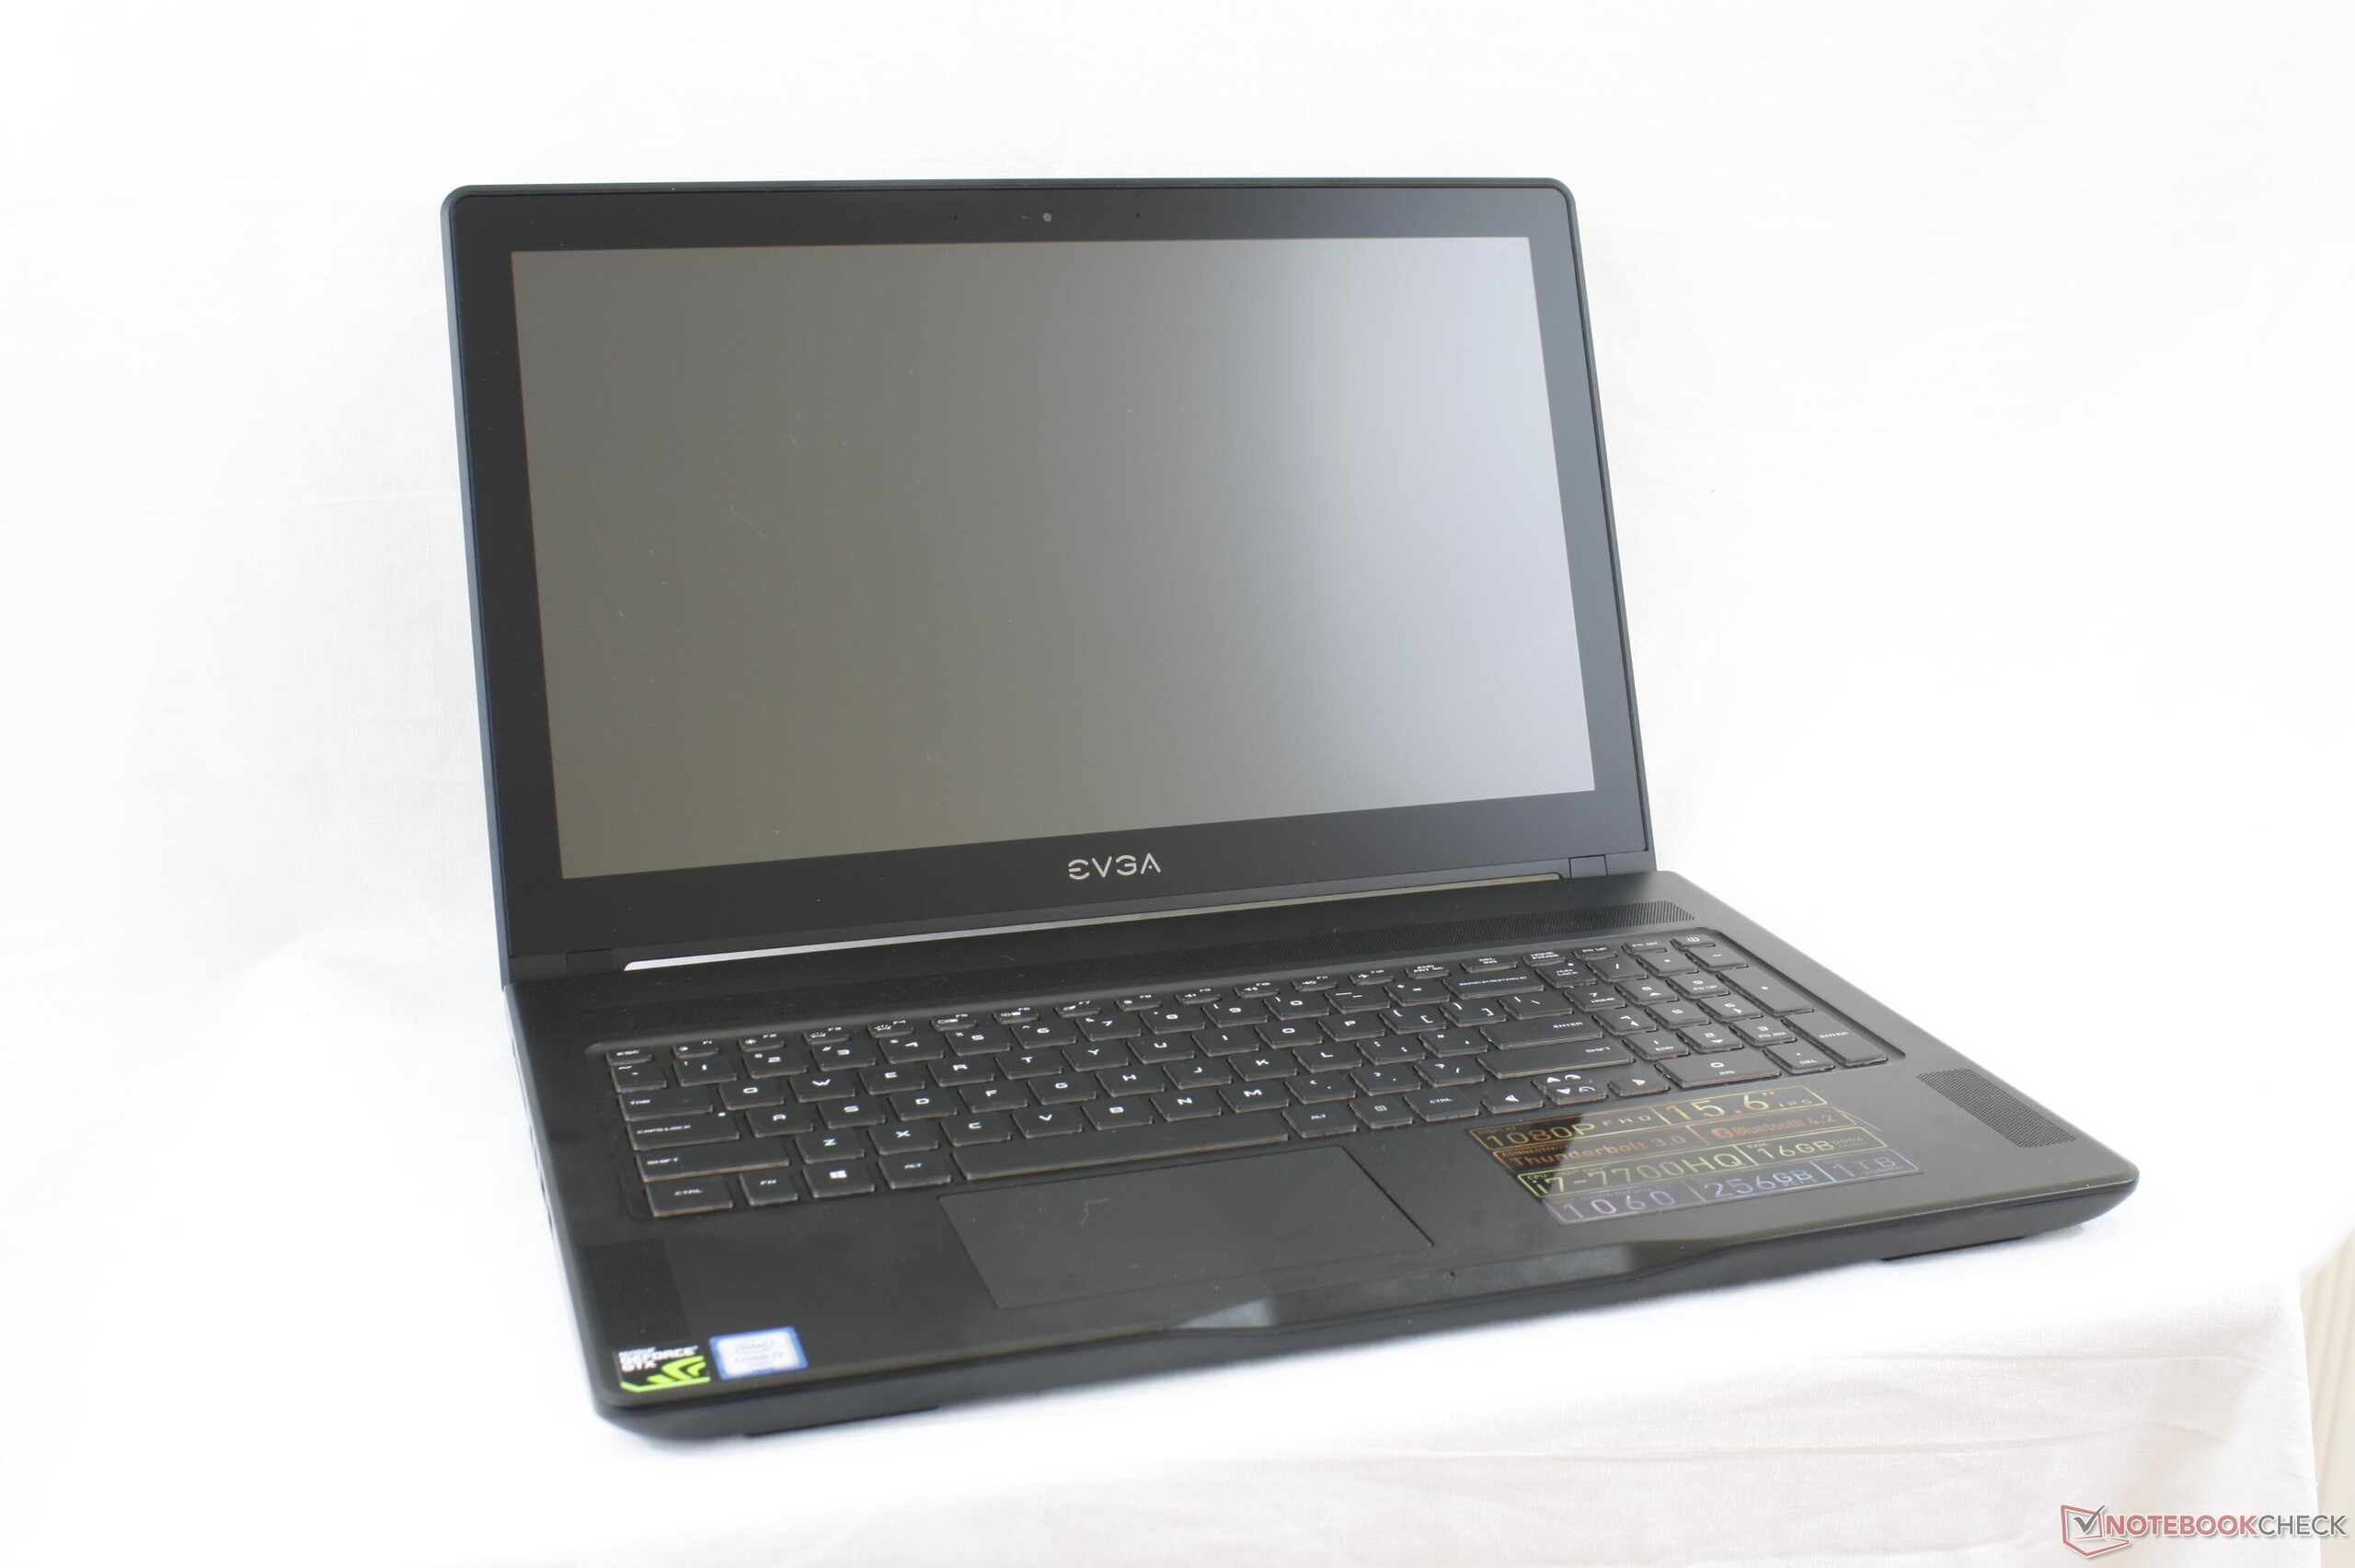
Breve Análise do Portátil EVGA SC15 (i7-7700HQ, GTX 1060)
| Networking | |
| iperf3 transmit AX12 | |
| MSI GS63VR 7RF-228US | |
| Dell XPS 15 9560 (i7-7700HQ, UHD) | |
| EVGA SC15 | |
| iperf3 receive AX12 | |
| MSI GS63VR 7RF-228US | |
| EVGA SC15 | |
| Dell XPS 15 9560 (i7-7700HQ, UHD) | |
| |||||||||||||||||||||||||
iluminação: 73 %
iluminação com acumulador: 281.5 cd/m²
Contraste: 1043:1 (Preto: 0.27 cd/m²)
ΔE ColorChecker Calman: 3.9 | ∀{0.5-29.43 Ø4.71}
ΔE Greyscale Calman: 3.8 | ∀{0.09-98 Ø4.96}
89.3% sRGB (Argyll 1.6.3 3D)
57.8% AdobeRGB 1998 (Argyll 1.6.3 3D)
63.6% AdobeRGB 1998 (Argyll 3D)
89.6% sRGB (Argyll 3D)
62.3% Display P3 (Argyll 3D)
Gamma: 2.27
CCT: 7322 K
| EVGA SC15 ID: AUO42ED, Name: AU Optronics B156HAN04.2, , 15.6", 1920x1080 | Asus Zephyrus GX501 AUO B156HAN04.2 (AUO42ED), IPS, 15.6", 1920x1080 | Apple MacBook Pro 15 2017 (2.8 GHz, 555) APPA031, IPS, 15.4", 2880x1800 | Gigabyte Aero 15 N156HCA-EA1 (CMN15D7), IPS, 15.6", 1920x1080 | Aorus X5 v6 IPS, 15.6", 2880x1620 | MSI GS63VR 7RF-228US IPS, 15.6", 3840x2160 | |
|---|---|---|---|---|---|---|
| Display | 3% | 34% | 4% | -2% | -21% | |
| Display P3 Coverage (%) | 62.3 | 64.8 4% | 97.9 57% | 65.2 5% | 62.5 0% | 48.21 -23% |
| sRGB Coverage (%) | 89.6 | 91.8 2% | 99.9 11% | 92.5 3% | 86.2 -4% | 72.6 -19% |
| AdobeRGB 1998 Coverage (%) | 63.6 | 65.9 4% | 85.9 35% | 66.5 5% | 62.5 -2% | 49.81 -22% |
| Response Times | 13% | -13% | -4% | 7% | 28% | |
| Response Time Grey 50% / Grey 80% * (ms) | 41.6 ? | 40.4 ? 3% | 48 ? -15% | 42.8 ? -3% | 34 ? 18% | 28 ? 33% |
| Response Time Black / White * (ms) | 30.8 ? | 24 ? 22% | 33.8 ? -10% | 32 ? -4% | 32 ? -4% | 23.6 ? 23% |
| PWM Frequency (Hz) | 119000 ? | 26000 ? | 198.4 | 1351 ? | ||
| Screen | -7% | 41% | -9% | -5% | -47% | |
| Brightness middle (cd/m²) | 281.5 | 328 17% | 545 94% | 320 14% | 280.4 0% | 274.2 -3% |
| Brightness (cd/m²) | 253 | 305 21% | 523 107% | 316 25% | 271 7% | 263 4% |
| Brightness Distribution (%) | 73 | 83 14% | 86 18% | 90 23% | 83 14% | 92 26% |
| Black Level * (cd/m²) | 0.27 | 0.25 7% | 0.44 -63% | 0.36 -33% | 0.249 8% | 0.44 -63% |
| Contrast (:1) | 1043 | 1312 26% | 1239 19% | 889 -15% | 1126 8% | 623 -40% |
| Colorchecker dE 2000 * | 3.9 | 6.02 -54% | 1.6 59% | 4.62 -18% | 4.94 -27% | 8 -105% |
| Colorchecker dE 2000 max. * | 7.1 | 10.14 -43% | 3.8 46% | 9.75 -37% | 8.13 -15% | 14.6 -106% |
| Greyscale dE 2000 * | 3.8 | 6.32 -66% | 1.9 50% | 6 -58% | 5.13 -35% | 9.1 -139% |
| Gamma | 2.27 97% | 2.28 96% | 2.26 97% | 2.46 89% | 2.26 97% | 2.24 98% |
| CCT | 7322 89% | 8194 79% | 6834 95% | 6761 96% | 7433 87% | 5020 129% |
| Color Space (Percent of AdobeRGB 1998) (%) | 57.8 | 60 4% | 60 4% | 55.9 -3% | 45.7 -21% | |
| Color Space (Percent of sRGB) (%) | 89.3 | 92 3% | 92 3% | 85.9 -4% | 72.1 -19% | |
| Média Total (Programa/Configurações) | 3% /
-2% | 21% /
31% | -3% /
-6% | 0% /
-3% | -13% /
-32% |
* ... menor é melhor
Exibir tempos de resposta
| ↔ Tempo de resposta preto para branco | ||
|---|---|---|
| 30.8 ms ... ascensão ↗ e queda ↘ combinadas | ↗ 17.6 ms ascensão | 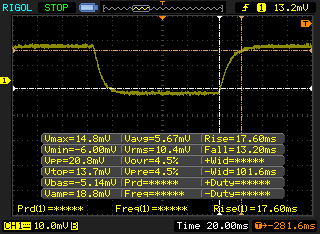 |
| ↘ 13.2 ms queda | ||
| A tela mostra taxas de resposta lentas em nossos testes e será insatisfatória para os jogadores. Em comparação, todos os dispositivos testados variam de 0.1 (mínimo) a 240 (máximo) ms. » 83 % de todos os dispositivos são melhores. Isso significa que o tempo de resposta medido é pior que a média de todos os dispositivos testados (19.8 ms). | ||
| ↔ Tempo de resposta 50% cinza a 80% cinza | ||
| 41.6 ms ... ascensão ↗ e queda ↘ combinadas | ↗ 21.6 ms ascensão | 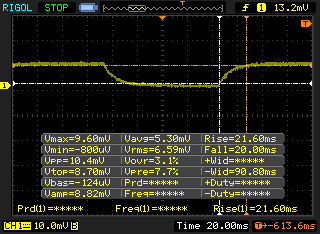 |
| ↘ 20 ms queda | ||
| A tela mostra taxas de resposta lentas em nossos testes e será insatisfatória para os jogadores. Em comparação, todos os dispositivos testados variam de 0.165 (mínimo) a 636 (máximo) ms. » 67 % de todos os dispositivos são melhores. Isso significa que o tempo de resposta medido é pior que a média de todos os dispositivos testados (31 ms). | ||
Cintilação da tela / PWM (modulação por largura de pulso)
| Tela tremeluzindo / PWM não detectado | 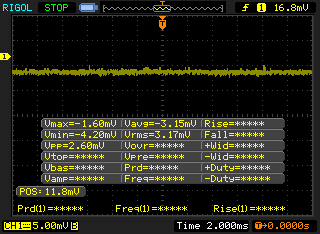 | ||
[pwm_comparison] Em comparação: 52 % de todos os dispositivos testados não usam PWM para escurecer a tela. Se PWM foi detectado, uma média de 7754 (mínimo: 5 - máximo: 343500) Hz foi medida. | |||
| wPrime 2.10 - 1024m | |
| EVGA SC17 GTX 1070 | |
| Eurocom Sky MX5 R3 | |
| EVGA SC15 | |
| Samsung Odyssey NP800G5M-X01US | |
| MSI GP62-2QEi781FD | |
| Eurocom Tornado F5 | |
* ... menor é melhor
| PCMark 8 | |
| Home Score Accelerated v2 | |
| EVGA SC15 | |
| Aorus X5 v6 | |
| Apple MacBook Pro 15 2017 (2.8 GHz, 555) | |
| Work Score Accelerated v2 | |
| EVGA SC15 | |
| Aorus X5 v6 | |
| Apple MacBook Pro 15 2017 (2.8 GHz, 555) | |
| Creative Score Accelerated v2 | |
| Aorus X5 v6 | |
| EVGA SC15 | |
| Apple MacBook Pro 15 2017 (2.8 GHz, 555) | |
| PCMark 8 Home Score Accelerated v2 | 5085 pontos | |
| PCMark 8 Creative Score Accelerated v2 | 7505 pontos | |
| PCMark 8 Work Score Accelerated v2 | 5400 pontos | |
Ajuda | ||
| EVGA SC15 Toshiba NVMe THNSN5256GPU7 | MSI GS63VR 7RF-228US Samsung SM961 MZVKW512HMJP m.2 PCI-e | Aorus X5 v6 Samsung SM951 MZVPV256 m.2 | Dell XPS 15 9560 (i7-7700HQ, UHD) Lite-On CX2-8B512-Q11 | Aorus X7 DT v6 Samsung SM951 MZVPV512HDGL m.2 PCI-e | |
|---|---|---|---|---|---|
| AS SSD | 37% | -56% | 9% | 17% | |
| Copy Game MB/s (MB/s) | 977 | 1082 11% | 1073 10% | 540 -45% | 1134 16% |
| Copy Program MB/s (MB/s) | 442.3 | 401.9 -9% | 351.5 -21% | 411.5 -7% | 502 13% |
| Copy ISO MB/s (MB/s) | 1071 | 1666 56% | 351.1 -67% | 1272 19% | 1482 38% |
| Score Total (Points) | 2474 | 3756 52% | 1630 -34% | 2810 14% | 2695 9% |
| Score Write (Points) | 896 | 1468 64% | 514 -43% | 1022 14% | 665 -26% |
| Score Read (Points) | 1081 | 1549 43% | 756 -30% | 1206 12% | 1353 25% |
| Access Time Write * (ms) | 0.035 | 0.029 17% | 0.025 29% | 0.034 3% | 0.025 29% |
| Access Time Read * (ms) | 0.054 | 0.041 24% | 0.367 -580% | 0.034 37% | 0.047 13% |
| 4K-64 Write (MB/s) | 706 | 1185 68% | 272.5 -61% | 789 12% | 366.9 -48% |
| 4K-64 Read (MB/s) | 822 | 1229 50% | 521 -37% | 962 17% | 1107 35% |
| 4K Write (MB/s) | 95.5 | 127.6 34% | 131.3 37% | 112.2 17% | 149.1 56% |
| 4K Read (MB/s) | 39.13 | 48.01 23% | 44.6 14% | 41.34 6% | 48.93 25% |
| Seq Write (MB/s) | 943 | 1550 64% | 1099 17% | 1207 28% | 1494 58% |
| Seq Read (MB/s) | 2203 | 2719 23% | 1904 -14% | 2026 -8% | 1971 -11% |
* ... menor é melhor

| 3DMark | |
| 1920x1080 Fire Strike Graphics | |
| Eurocom Sky X7E2 | |
| Eurocom Sky MX5 R3 | |
| Asus Zephyrus GX501 | |
| Nvidia GeForce GTX 1060 Founders Edition 6 GB | |
| EVGA SC15 | |
| Lenovo Legion Y720 80VR002XGE | |
| Asus Strix GL502VT-DS74 | |
| HP Pavilion 15 Power 1GK62AV | |
| Asus Zenbook UX510UW-CN044T | |
| Fire Strike Extreme Graphics | |
| Eurocom Sky X7E2 | |
| Eurocom Sky MX5 R3 | |
| EVGA SC15 | |
| Asus Strix GL502VT-DS74 | |
| HP Pavilion 15 Power 1GK62AV | |
| Asus Zenbook UX510UW-CN044T | |
| 3840x2160 Fire Strike Ultra Graphics | |
| Eurocom Sky X7E2 | |
| Eurocom Sky MX5 R3 | |
| Asus Zephyrus GX501 | |
| Nvidia GeForce GTX 1060 Founders Edition 6 GB | |
| EVGA SC15 | |
| HP Pavilion 15 Power 1GK62AV | |
| 3DMark 11 | |
| 1280x720 Performance GPU | |
| Eurocom Sky X7E2 | |
| Asus Zephyrus GX501 | |
| Eurocom Sky MX5 R3 | |
| Nvidia GeForce GTX 1060 Founders Edition 6 GB | |
| EVGA SC15 | |
| Lenovo Legion Y720 80VR002XGE | |
| Asus Strix GL502VT-DS74 | |
| HP Pavilion 15 Power 1GK62AV | |
| Asus Zenbook UX510UW-CN044T | |
| 1280x720 Performance Combined | |
| Nvidia GeForce GTX 1060 Founders Edition 6 GB | |
| Eurocom Sky X7E2 | |
| Eurocom Sky MX5 R3 | |
| Asus Zephyrus GX501 | |
| EVGA SC15 | |
| Asus Strix GL502VT-DS74 | |
| HP Pavilion 15 Power 1GK62AV | |
| Asus Zenbook UX510UW-CN044T | |
| 3DMark 11 Performance | 13148 pontos | |
| 3DMark Ice Storm Standard Score | 110194 pontos | |
| 3DMark Cloud Gate Standard Score | 24201 pontos | |
| 3DMark Fire Strike Score | 9750 pontos | |
| 3DMark Fire Strike Extreme Score | 5165 pontos | |
Ajuda | ||
| baixo | média | alto | ultra | |
|---|---|---|---|---|
| BioShock Infinite (2013) | 110 | |||
| Metro: Last Light (2013) | 82.7 | |||
| Thief (2014) | 79 | |||
| The Witcher 3 (2015) | 66 | 39.6 | ||
| Batman: Arkham Knight (2015) | 89 | 62 | ||
| Metal Gear Solid V (2015) | 60 | |||
| Dota 2 Reborn (2015) | 117.9 | |||
| Fallout 4 (2015) | 70.8 | |||
| Rise of the Tomb Raider (2016) | 66.8 | |||
| Ashes of the Singularity (2016) | 63.7 | 59.2 | ||
| Doom (2016) | 98.4 | |||
| Overwatch (2016) | 103.9 | |||
| Mafia 3 (2016) | 41 | |||
| Prey (2017) | 110.3 |
| Rise of the Tomb Raider - 1920x1080 Very High Preset AA:FX AF:16x | |
| EVGA SC17 GTX 1070 | |
| Nvidia GeForce GTX 1060 Founders Edition 6 GB | |
| Nvidia GeForce GTX 1060 Founders Edition 6 GB | |
| EVGA SC15 | |
| Aorus x3 Plus v7 | |
| EVGA SC17 | |
| Asus Strix GL502VT-DS74 | |
| HP Omen 15-ax213ng | |
| HP Pavilion 17 FHD V3A33AV | |
Barulho
| Ocioso |
| 31.9 / 32 / 32 dB |
| Carga |
| 36.5 / 53.4 dB |
 | ||
30 dB silencioso 40 dB(A) audível 50 dB(A) ruidosamente alto |
||
min: | ||
| EVGA SC15 GeForce GTX 1060 Mobile, i7-7700HQ, Toshiba NVMe THNSN5256GPU7 | Asus Zephyrus GX501 GeForce GTX 1080 Max-Q, i7-7700HQ, Samsung SSD SM961 1TB M.2 MZVKW1T0HMLH | Apple MacBook Pro 15 2017 (2.8 GHz, 555) Radeon Pro 555, i7-7700HQ, Apple SSD SM0256L | MSI GS63VR 7RF-228US GeForce GTX 1060 Mobile, i7-7700HQ, Samsung SM961 MZVKW512HMJP m.2 PCI-e | Gigabyte Aero 15 GeForce GTX 1060 Mobile, i7-7700HQ, Lite-On CX2-8B512-Q11 | Aorus X5 v6 GeForce GTX 1070 Mobile, 6820HK, Samsung SM951 MZVPV256 m.2 | |
|---|---|---|---|---|---|---|
| Noise | -2% | 1% | -3% | -4% | -14% | |
| desligado / ambiente * (dB) | 28 | 31 -11% | 30.9 -10% | 28.8 -3% | 31 -11% | 29.3 -5% |
| Idle Minimum * (dB) | 31.9 | 32 -0% | 31.3 2% | 33.1 -4% | 32 -0% | 33.4 -5% |
| Idle Average * (dB) | 32 | 33 -3% | 31.3 2% | 33.1 -3% | 33 -3% | 35.2 -10% |
| Idle Maximum * (dB) | 32 | 34 -6% | 31.7 1% | 34 -6% | 34 -6% | 35.2 -10% |
| Load Average * (dB) | 36.5 | 39 -7% | 39.7 -9% | 37.2 -2% | 39 -7% | 53.3 -46% |
| Witcher 3 ultra * (dB) | 40.3 | 42 -4% | 35.5 12% | 46.1 -14% | 43 -7% | |
| Load Maximum * (dB) | 53.4 | 46 14% | 48.6 9% | 47.1 12% | 50 6% | 57.6 -8% |
* ... menor é melhor
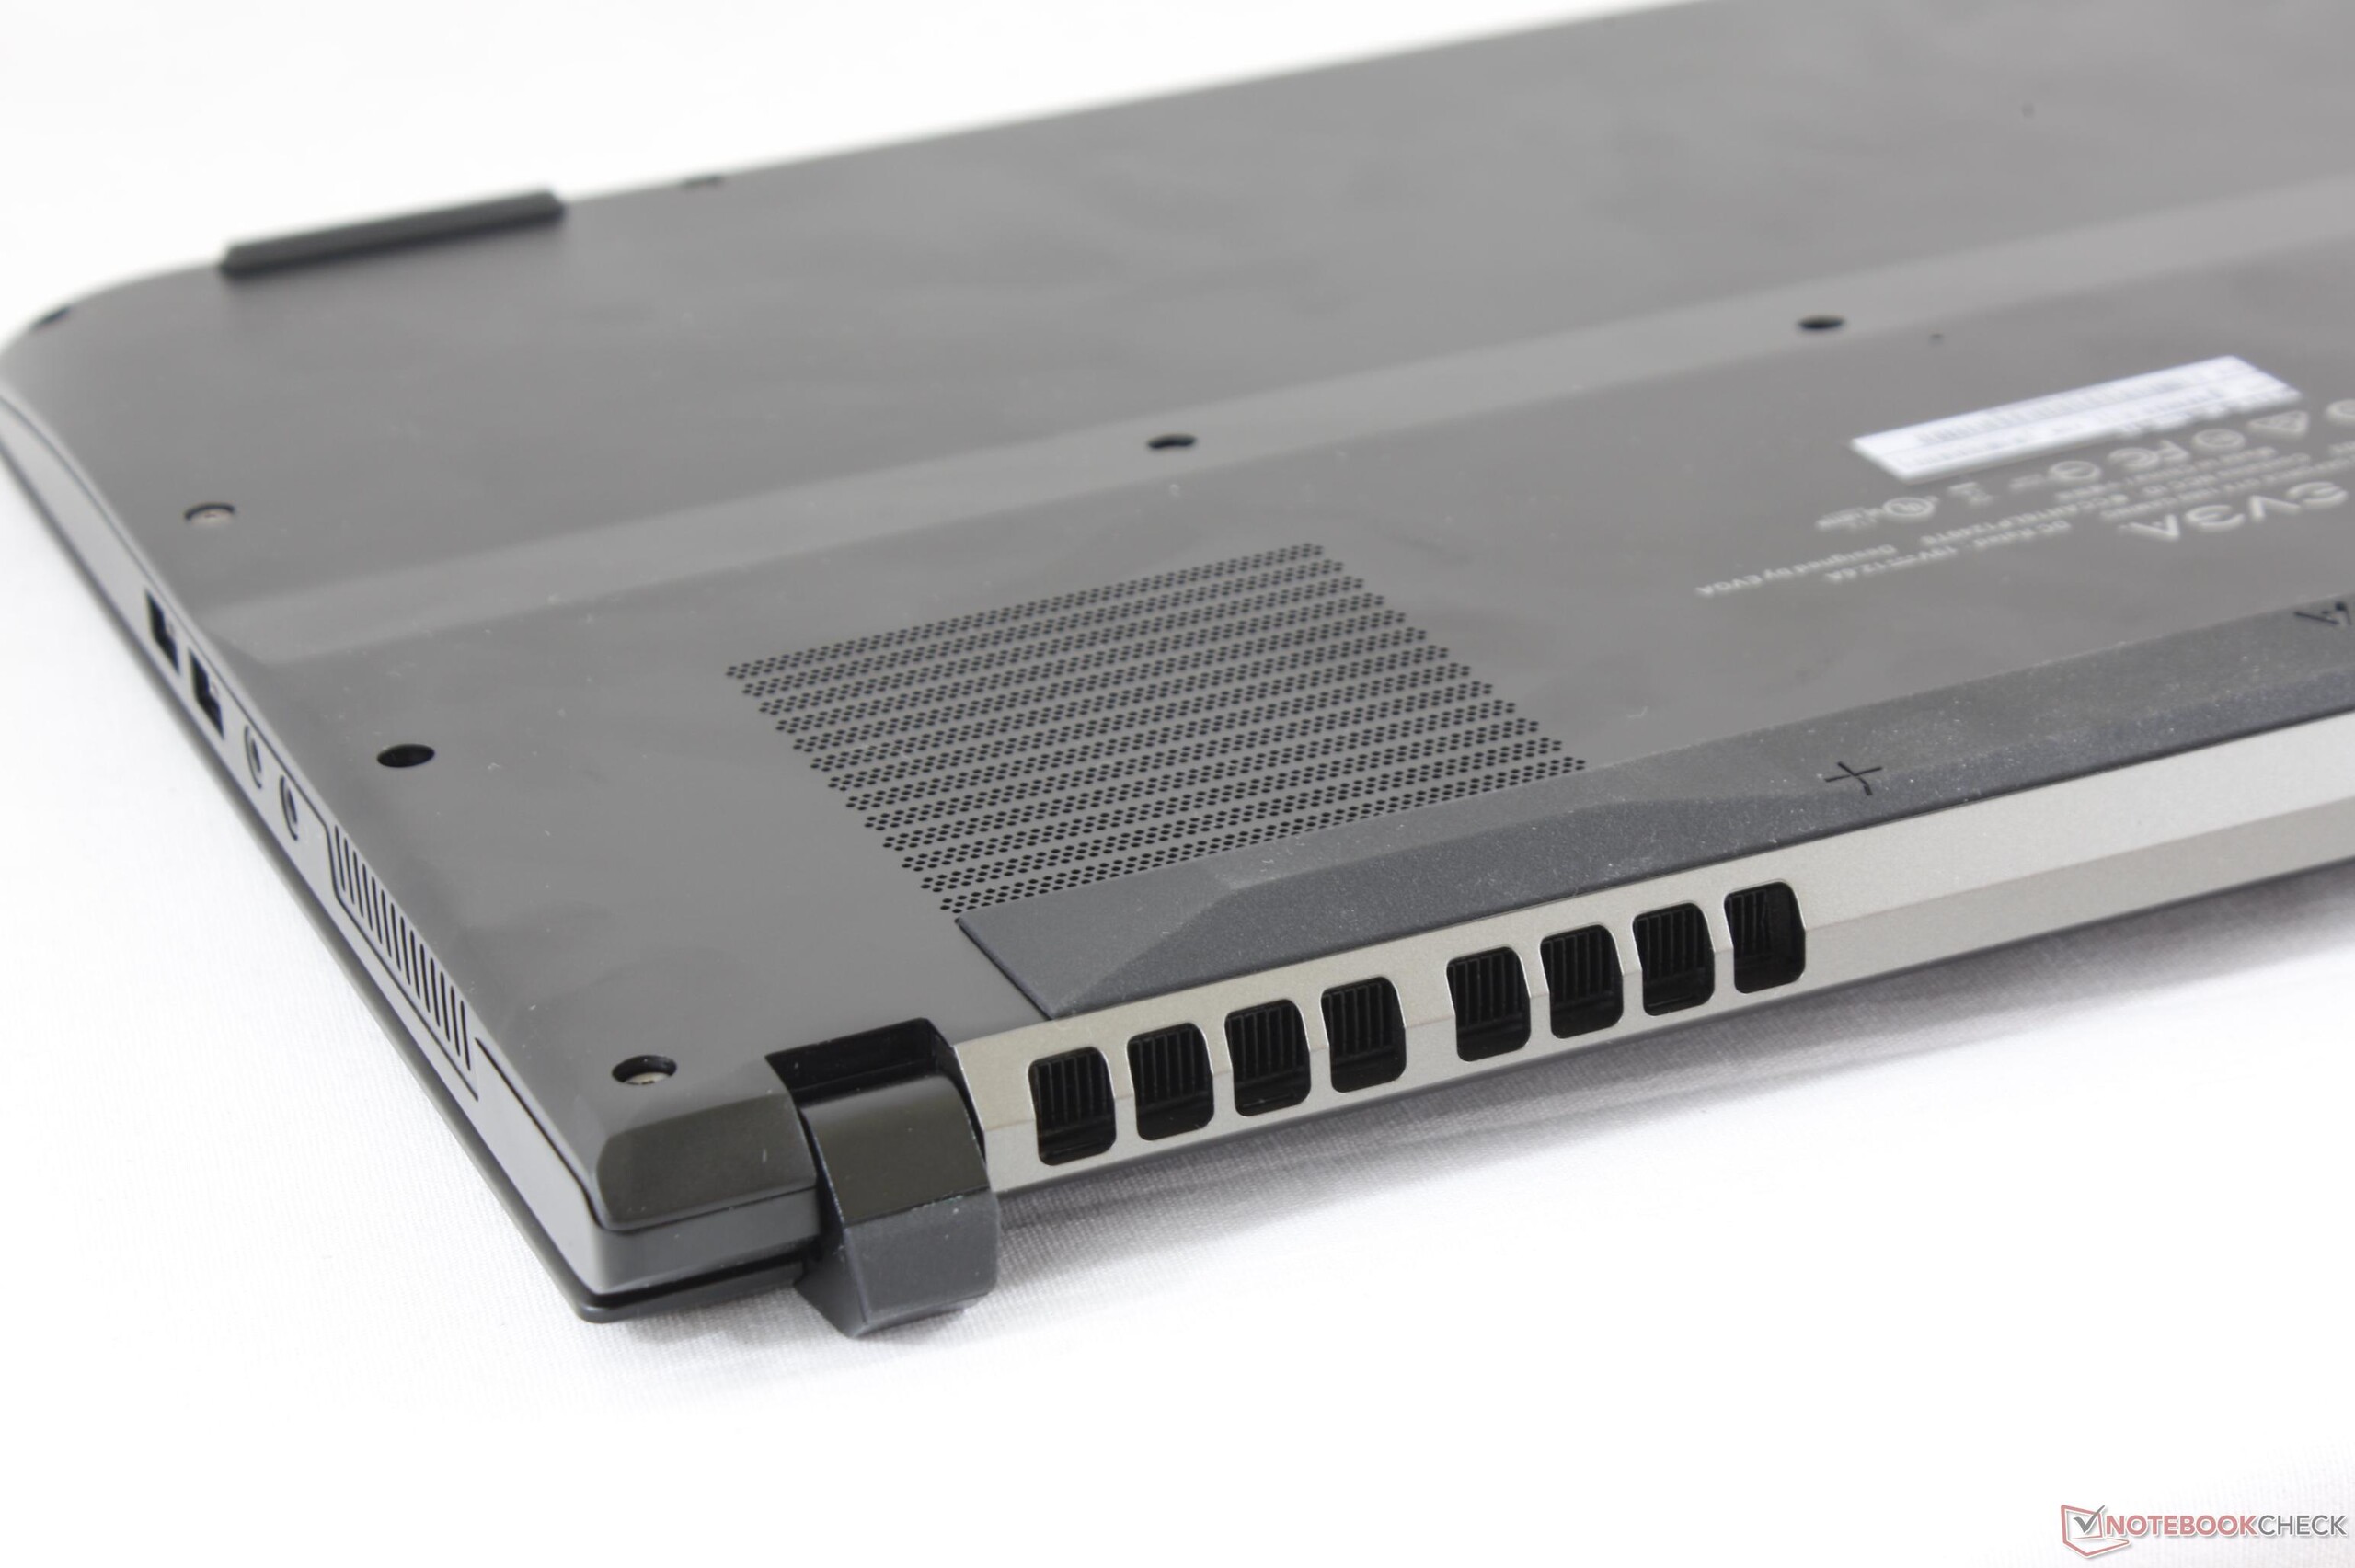
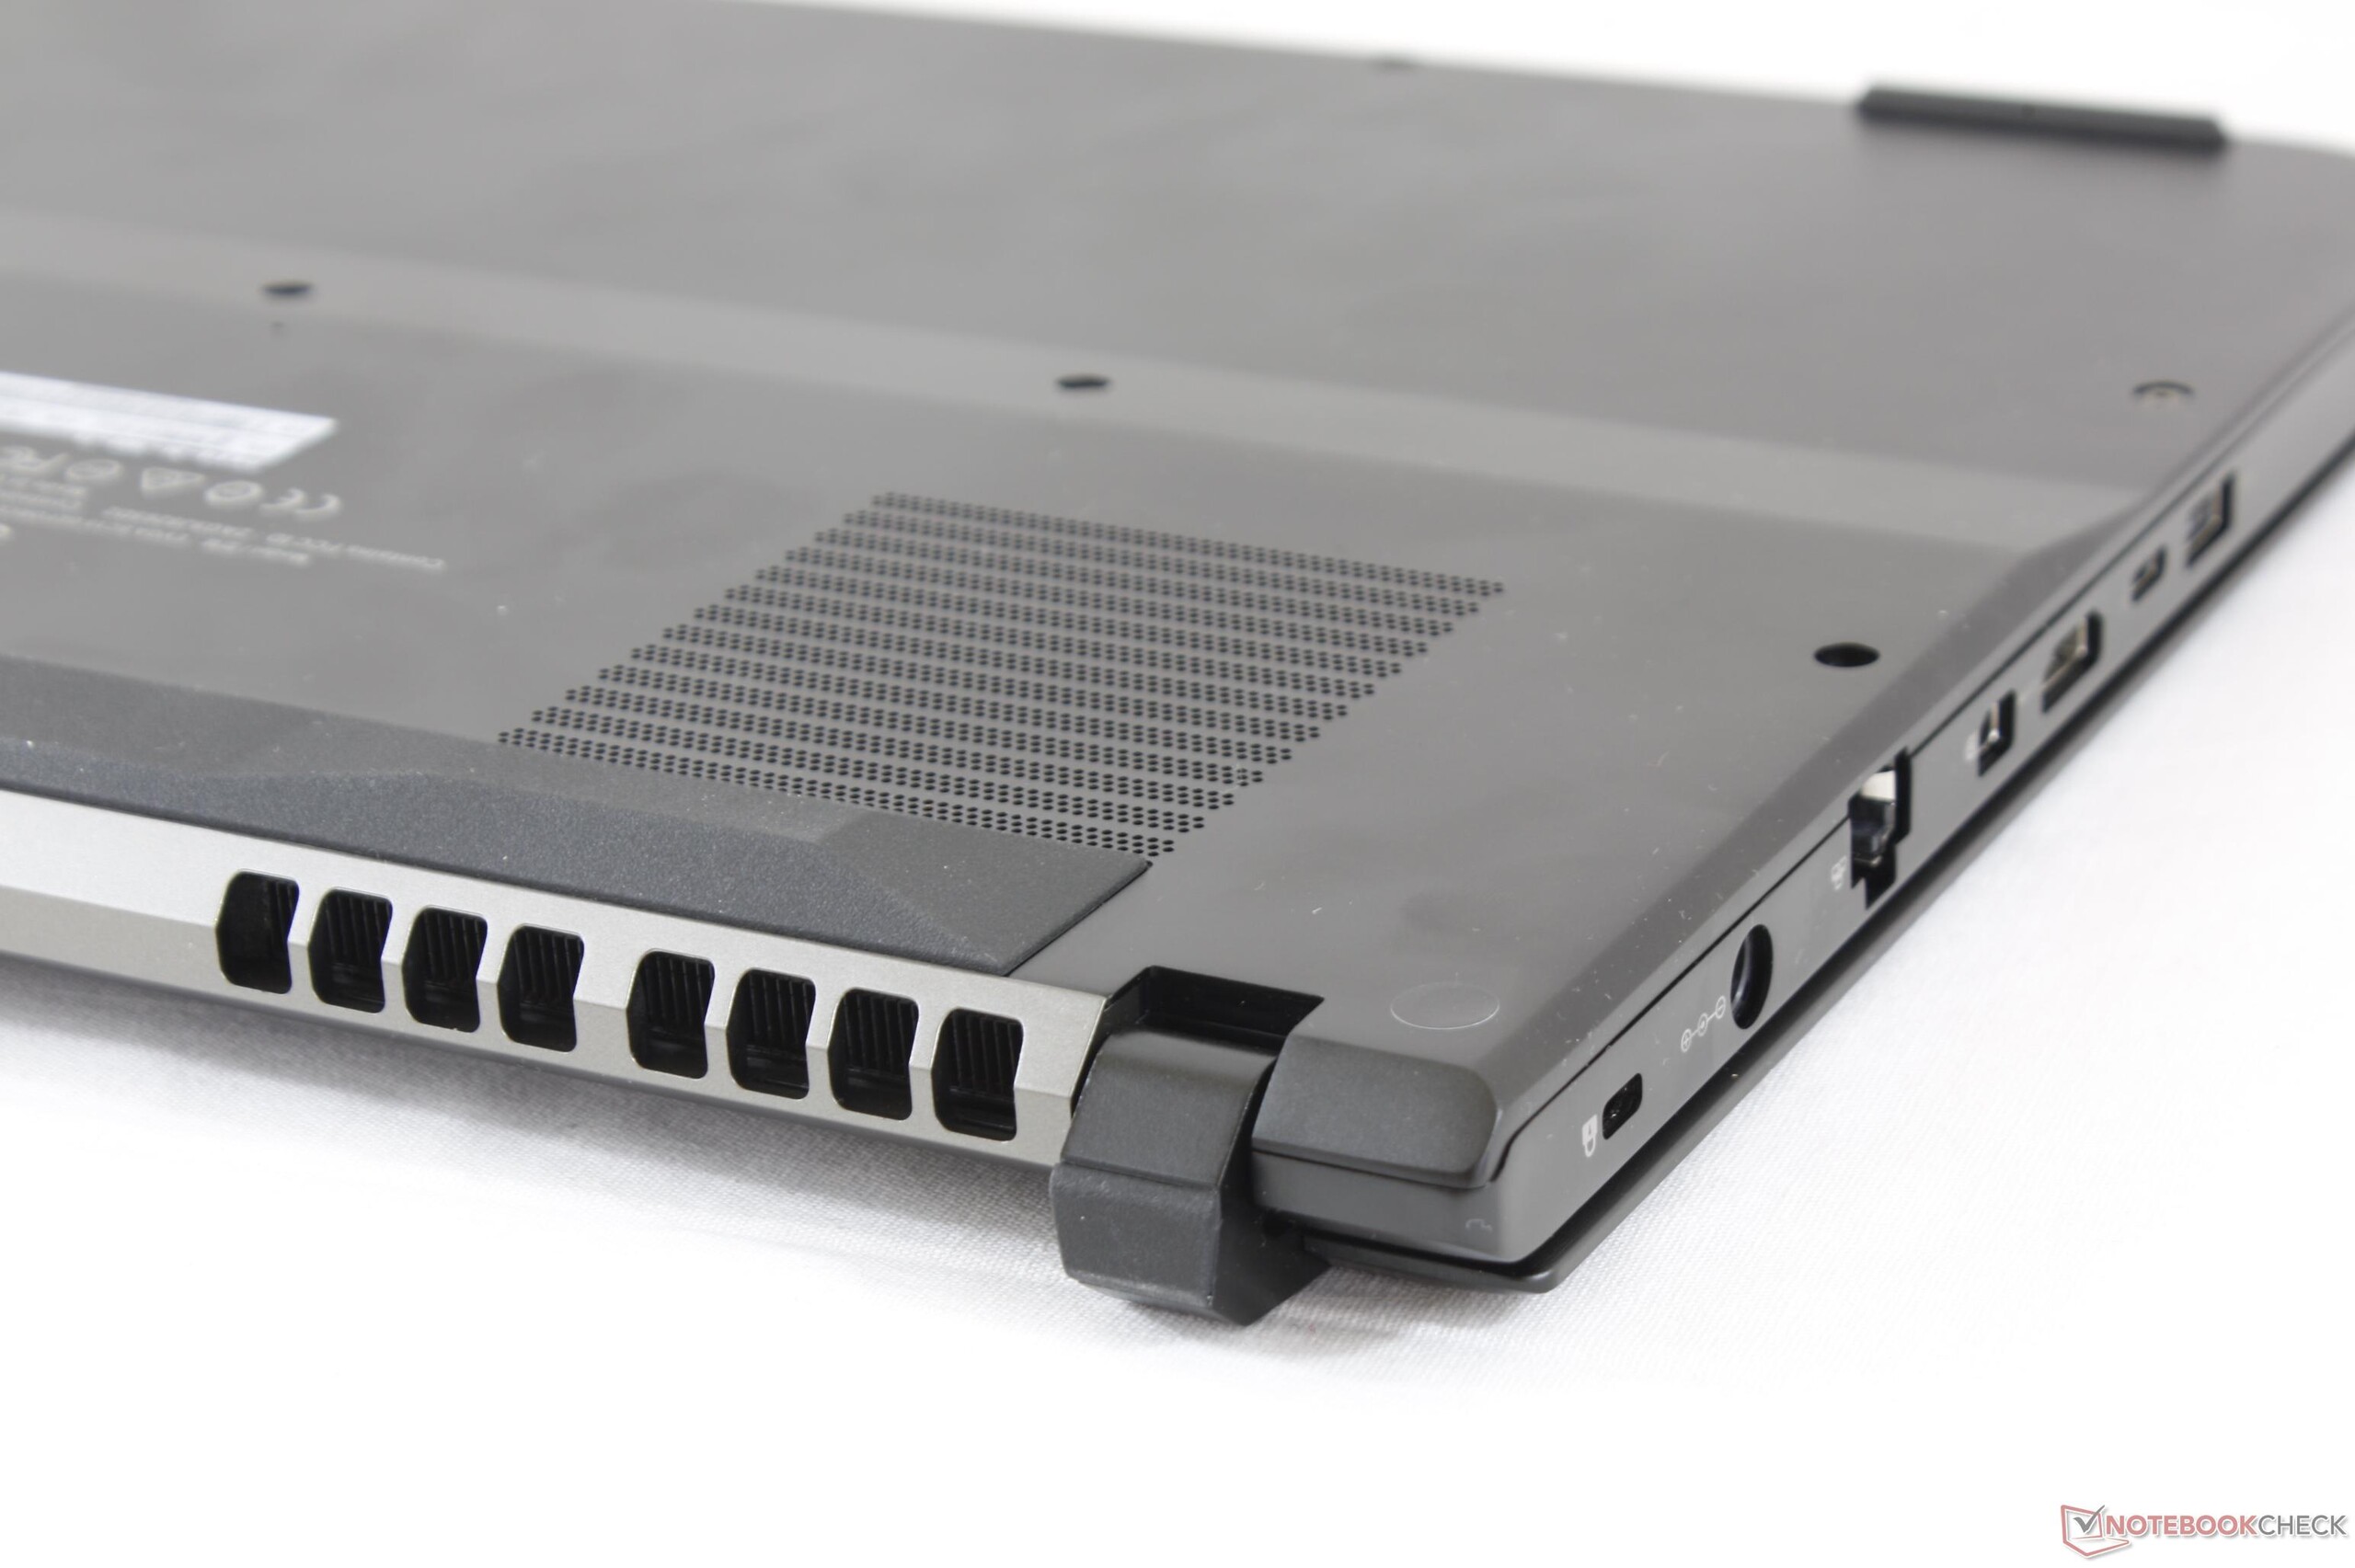
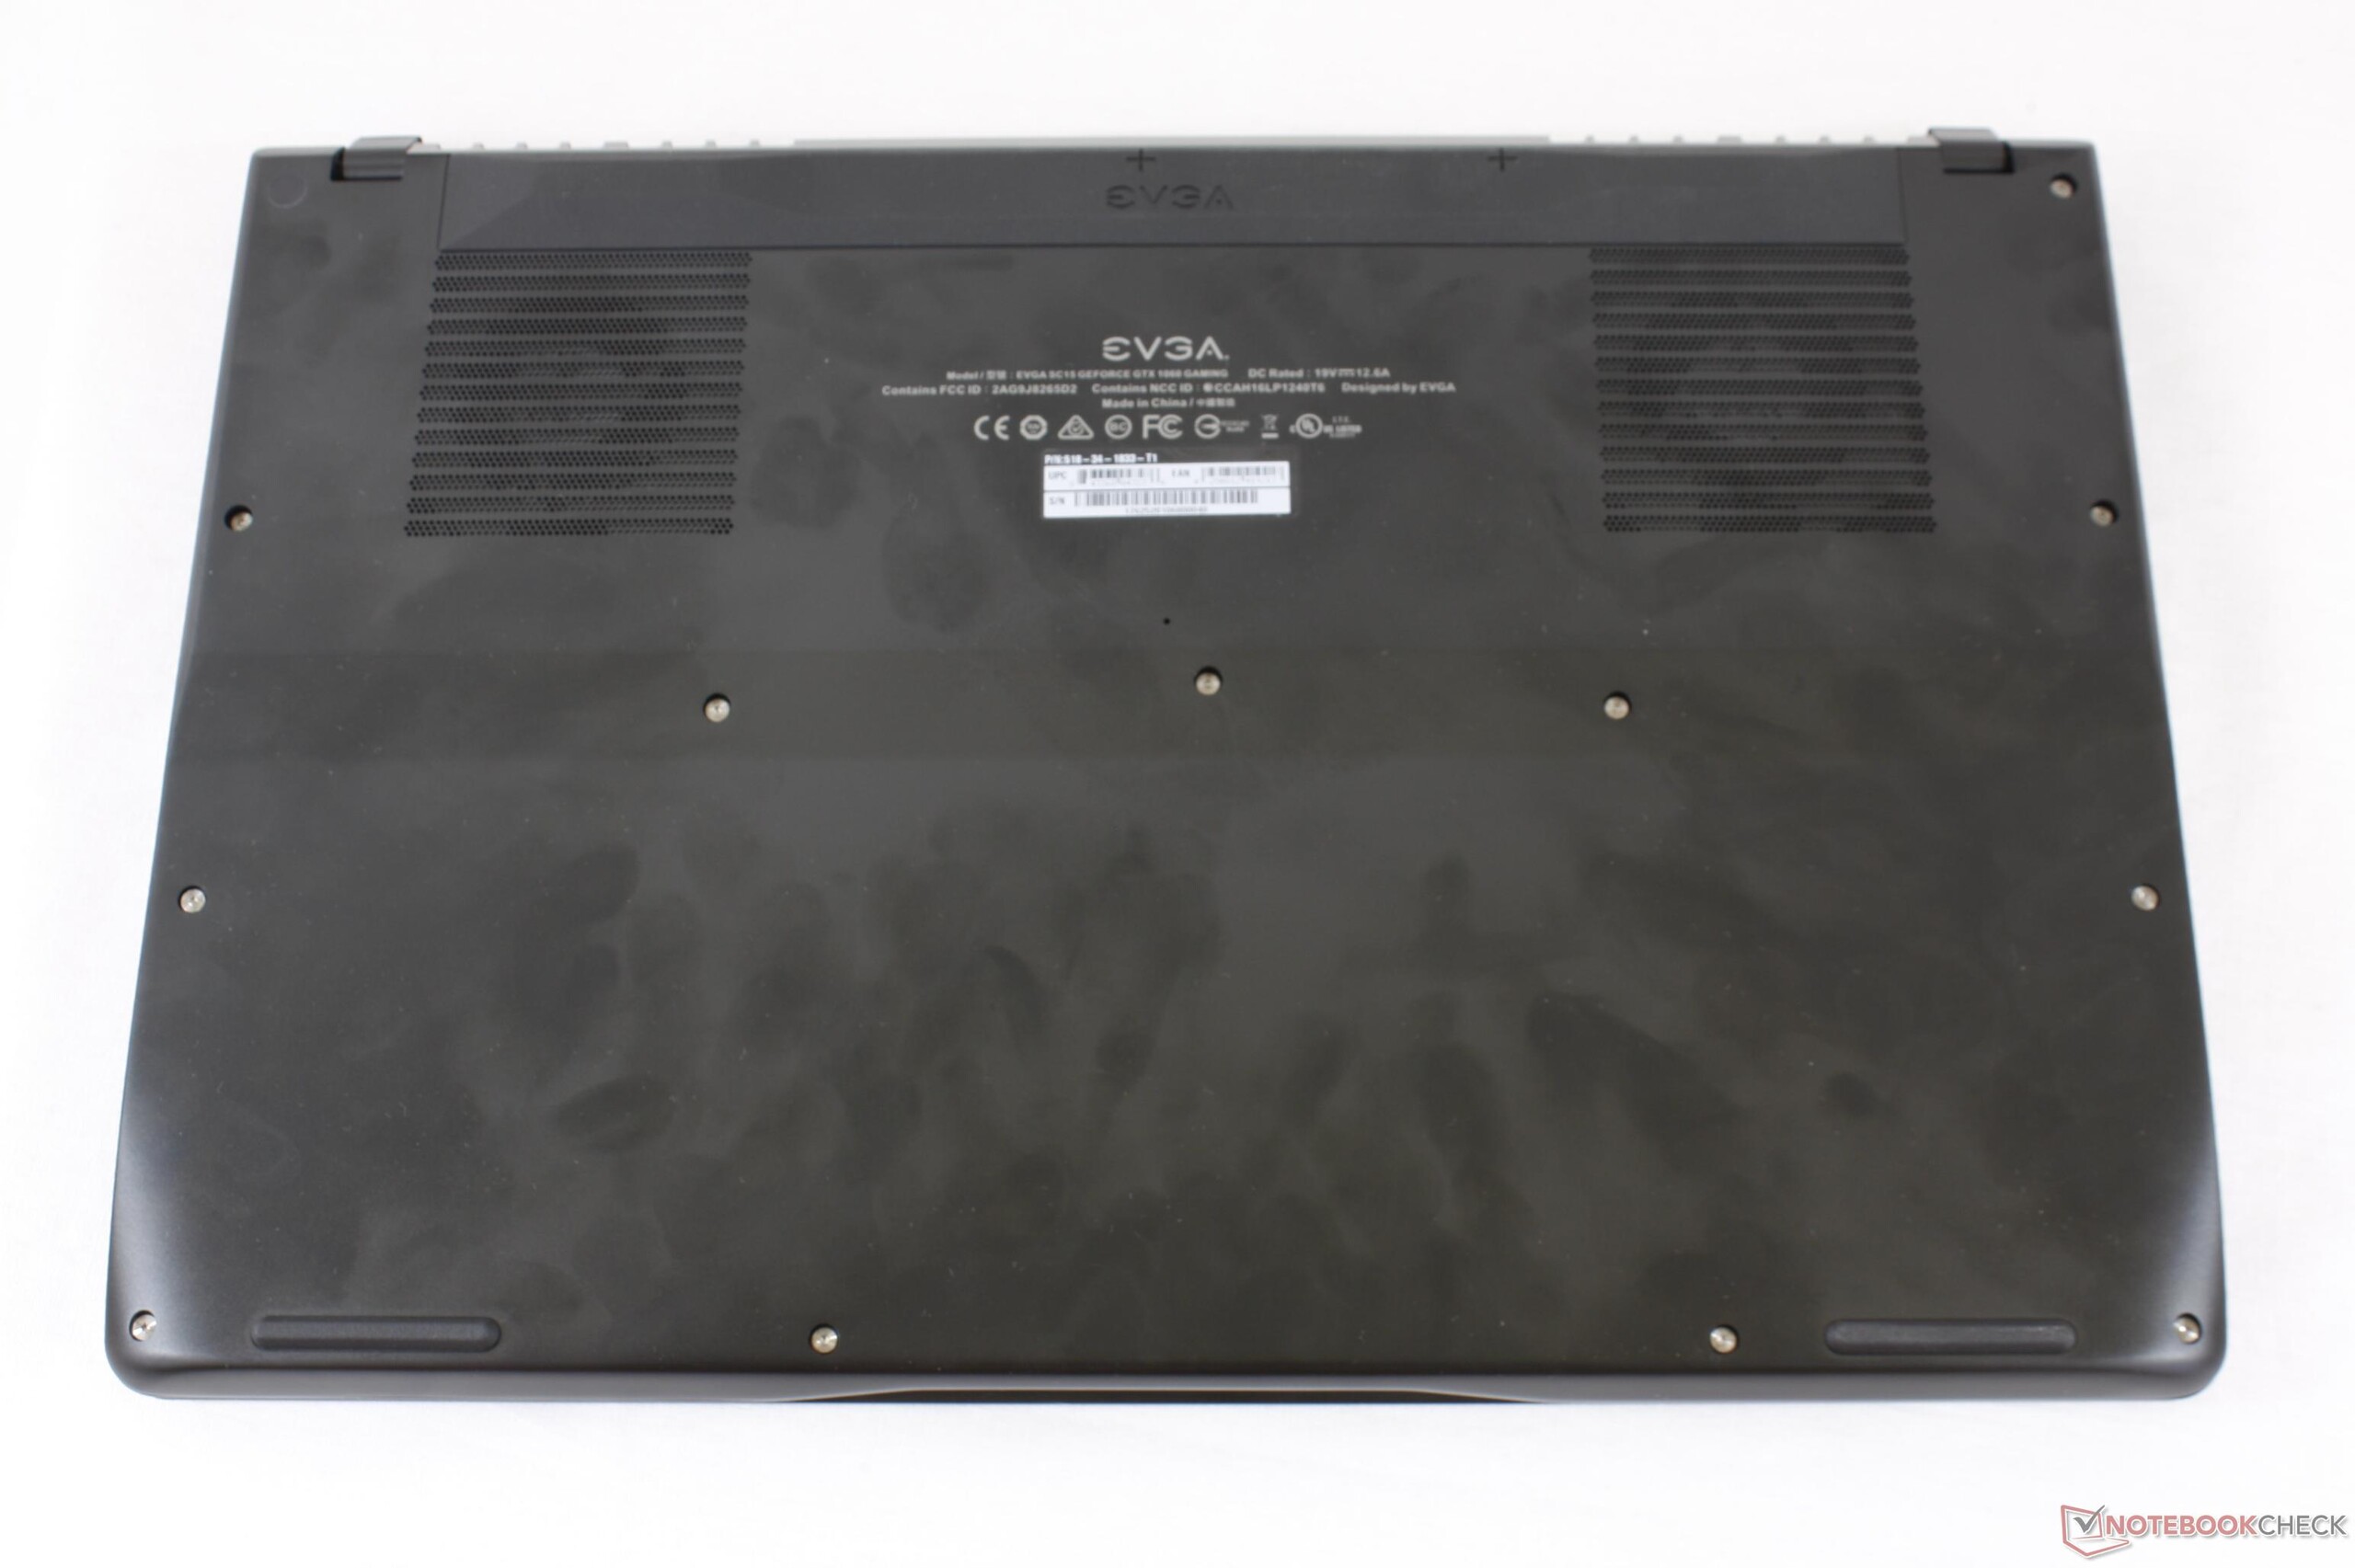
(-) A temperatura máxima no lado superior é 49.2 °C / 121 F, em comparação com a média de 40.4 °C / 105 F , variando de 21.2 a 68.8 °C para a classe Gaming.
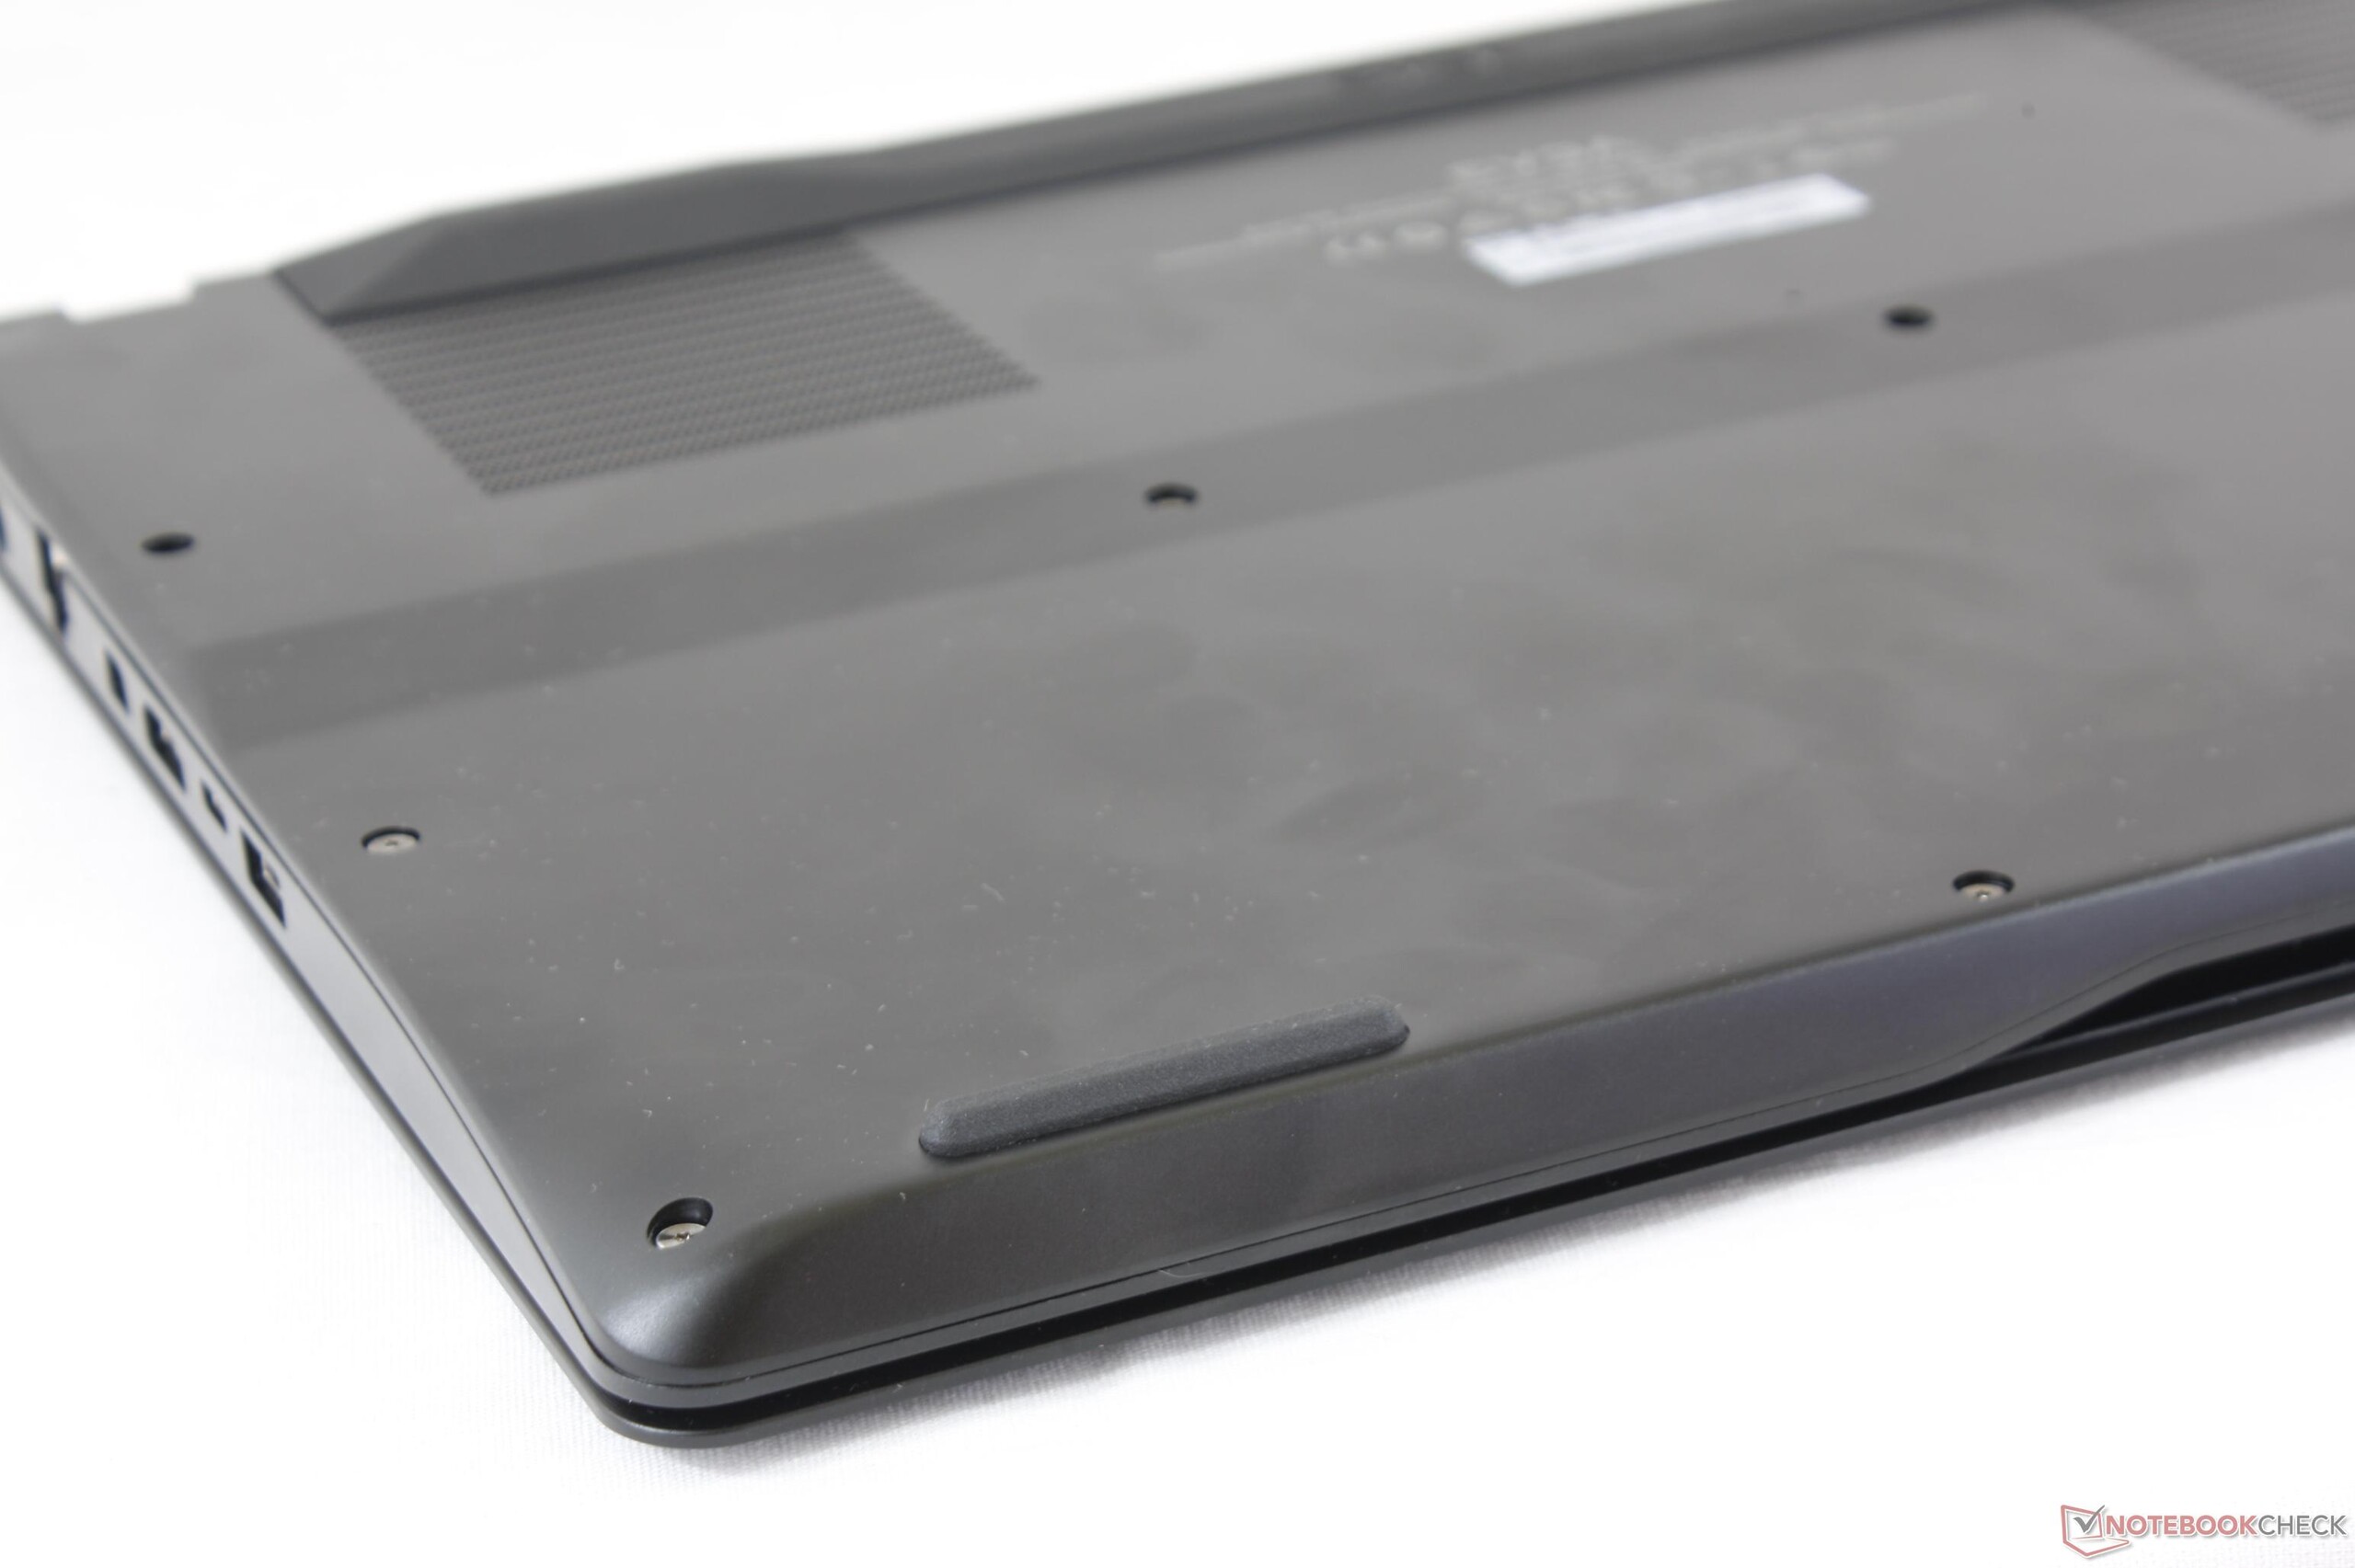
(-) A parte inferior aquece até um máximo de 45.2 °C / 113 F, em comparação com a média de 43.2 °C / 110 F
(+) Em uso inativo, a temperatura média para o lado superior é 26.8 °C / 80 F, em comparação com a média do dispositivo de 33.9 °C / ### class_avg_f### F.
(±) Jogando The Witcher 3, a temperatura média para o lado superior é 32 °C / 90 F, em comparação com a média do dispositivo de 33.9 °C / ## #class_avg_f### F.
(+) Os apoios para as mãos e o touchpad são mais frios que a temperatura da pele, com um máximo de 29.8 °C / 85.6 F e, portanto, são frios ao toque.
(±) A temperatura média da área do apoio para as mãos de dispositivos semelhantes foi 28.8 °C / 83.8 F (-1 °C / -1.8 F).
EVGA SC15 análise de áudio
(-) | alto-falantes não muito altos (###valor### dB)
Graves 100 - 315Hz
(-) | quase nenhum baixo - em média 15.8% menor que a mediana
(±) | a linearidade dos graves é média (7.3% delta para a frequência anterior)
Médios 400 - 2.000 Hz
(±) | médios mais altos - em média 6.8% maior que a mediana
(±) | a linearidade dos médios é média (14.5% delta para frequência anterior)
Altos 2 - 16 kHz
(+) | agudos equilibrados - apenas 2.5% longe da mediana
(±) | a linearidade dos máximos é média (8% delta para frequência anterior)
Geral 100 - 16.000 Hz
(-) | o som geral não é linear (34.7% diferença em relação à mediana)
Comparado com a mesma classe
» 99% de todos os dispositivos testados nesta classe foram melhores, 1% semelhantes, 1% piores
» O melhor teve um delta de 6%, a média foi 18%, o pior foi 132%
Comparado com todos os dispositivos testados
» 93% de todos os dispositivos testados foram melhores, 1% semelhantes, 6% piores
» O melhor teve um delta de 4%, a média foi 23%, o pior foi 134%
Apple MacBook 12 (Early 2016) 1.1 GHz análise de áudio
(+) | os alto-falantes podem tocar relativamente alto (###valor### dB)
Graves 100 - 315Hz
(±) | graves reduzidos - em média 11.3% menor que a mediana
(±) | a linearidade dos graves é média (14.2% delta para a frequência anterior)
Médios 400 - 2.000 Hz
(+) | médios equilibrados - apenas 2.4% longe da mediana
(+) | médios são lineares (5.5% delta para frequência anterior)
Altos 2 - 16 kHz
(+) | agudos equilibrados - apenas 2% longe da mediana
(+) | os máximos são lineares (4.5% delta da frequência anterior)
Geral 100 - 16.000 Hz
(+) | o som geral é linear (10.2% diferença em relação à mediana)
Comparado com a mesma classe
» 7% de todos os dispositivos testados nesta classe foram melhores, 2% semelhantes, 90% piores
» O melhor teve um delta de 5%, a média foi 18%, o pior foi 53%
Comparado com todos os dispositivos testados
» 5% de todos os dispositivos testados foram melhores, 1% semelhantes, 94% piores
» O melhor teve um delta de 4%, a média foi 23%, o pior foi 134%
| desligado | |
| Ocioso | |
| Carga |
|
Key:
min: | |
| EVGA SC15 i7-7700HQ, GeForce GTX 1060 Mobile, Toshiba NVMe THNSN5256GPU7, , 1920x1080, 15.6" | Asus Zephyrus GX501 i7-7700HQ, GeForce GTX 1080 Max-Q, Samsung SSD SM961 1TB M.2 MZVKW1T0HMLH, IPS, 1920x1080, 15.6" | Apple MacBook Pro 15 2017 (2.8 GHz, 555) i7-7700HQ, Radeon Pro 555, Apple SSD SM0256L, IPS, 2880x1800, 15.4" | Gigabyte Aero 15 i7-7700HQ, GeForce GTX 1060 Mobile, Lite-On CX2-8B512-Q11, IPS, 1920x1080, 15.6" | Aorus X5 v6 6820HK, GeForce GTX 1070 Mobile, Samsung SM951 MZVPV256 m.2, IPS, 2880x1620, 15.6" | |
|---|---|---|---|---|---|
| Power Consumption | -3% | 46% | 21% | -33% | |
| Idle Minimum * (Watt) | 25.8 | 18 30% | 3.4 87% | 12 53% | 25 3% |
| Idle Average * (Watt) | 26.6 | 23 14% | 13.9 48% | 15 44% | 28.9 -9% |
| Idle Maximum * (Watt) | 26.7 | 31 -16% | 17.6 34% | 20 25% | 30.1 -13% |
| Load Average * (Watt) | 80.3 | 79 2% | 71.1 11% | 82 -2% | 167.3 -108% |
| Witcher 3 ultra * (Watt) | 121.2 | 148 -22% | 57.9 52% | 111 8% | |
| Load Maximum * (Watt) | 159.3 | 196 -23% | 88.5 44% | 161 -1% | 222.6 -40% |
* ... menor é melhor
| EVGA SC15 i7-7700HQ, GeForce GTX 1060 Mobile, 62 Wh | Asus Zephyrus GX501 i7-7700HQ, GeForce GTX 1080 Max-Q, 50 Wh | Apple MacBook Pro 15 2017 (2.8 GHz, 555) i7-7700HQ, Radeon Pro 555, 76 Wh | MSI GS63VR 7RF-228US i7-7700HQ, GeForce GTX 1060 Mobile, 65 Wh | Gigabyte Aero 15 i7-7700HQ, GeForce GTX 1060 Mobile, 94.24 Wh | Aorus X5 v6 6820HK, GeForce GTX 1070 Mobile, 94.24 Wh | |
|---|---|---|---|---|---|---|
| Duração da bateria | -29% | 127% | 35% | 124% | 14% | |
| Reader / Idle (h) | 3.7 | 3.1 -16% | 6.4 73% | 10.6 186% | 4.2 14% | |
| WiFi v1.3 (h) | 2.8 | 2.2 -21% | 10.7 282% | 3.9 39% | 7 150% | 3 7% |
| Load (h) | 1.4 | 0.7 -50% | 1 -29% | 1.3 -7% | 1.9 36% | 1.7 21% |
| Witcher 3 ultra (h) | 1.5 |
Pro
Contra
O SC15 é quase tudo o que desejaríamos de um portátil de jogos GTX 1060 balanceado. O chassi é de qualidade muito alta, o ruído da ventoinha não é exageradamente alto, o desempenho da CPU é consistente, e tanto o G-Sync como a taxa de atualização de 120 Hz vem como padrão. Quem estiver considerando o GS63VR, Omen 15, Gigabyte P55, Asus GL552/FX502, Aorus X5, ou outro portátil de jogos fino de 15-polegadas, encontrará o EVGA não apenas fisicamente mais rígido e mais robusto, mas também mais silencioso e mais frio no geral. Realmente não há outra alternativa fina se se trata de duração da bateria, temperatura, e ruído.
Existem algumas desvantagens importantes que impedem o SC15 de ser o portátil de jogos GTX 1060 de 15 polegadas para possuir. Talvez sua maior desvantagem é a falta de outras opções de tela. A MSI e a Aorus oferecem painéis com tempos de resposta de 5 ms e 3 ms para um ghosting dramaticamente reduzido em comparação com a EVGA de 18 ms (preto-branco) EVGA. A alta taxa de atualização de 120 Hz é boa, mas suas vantagens são confusas pelos tempos de resposta lentos e o fato de que uma GPU mais poderosa é necessária para alcançar taxas de fotogramas tão elevadas para a latência de entrada rápida. Um SKU especulativo de 120 Hz/5 ms seria a melhor coisa para o SC15, mesmo que isso signifique sacrificar ângulos de visão IPS por TN.
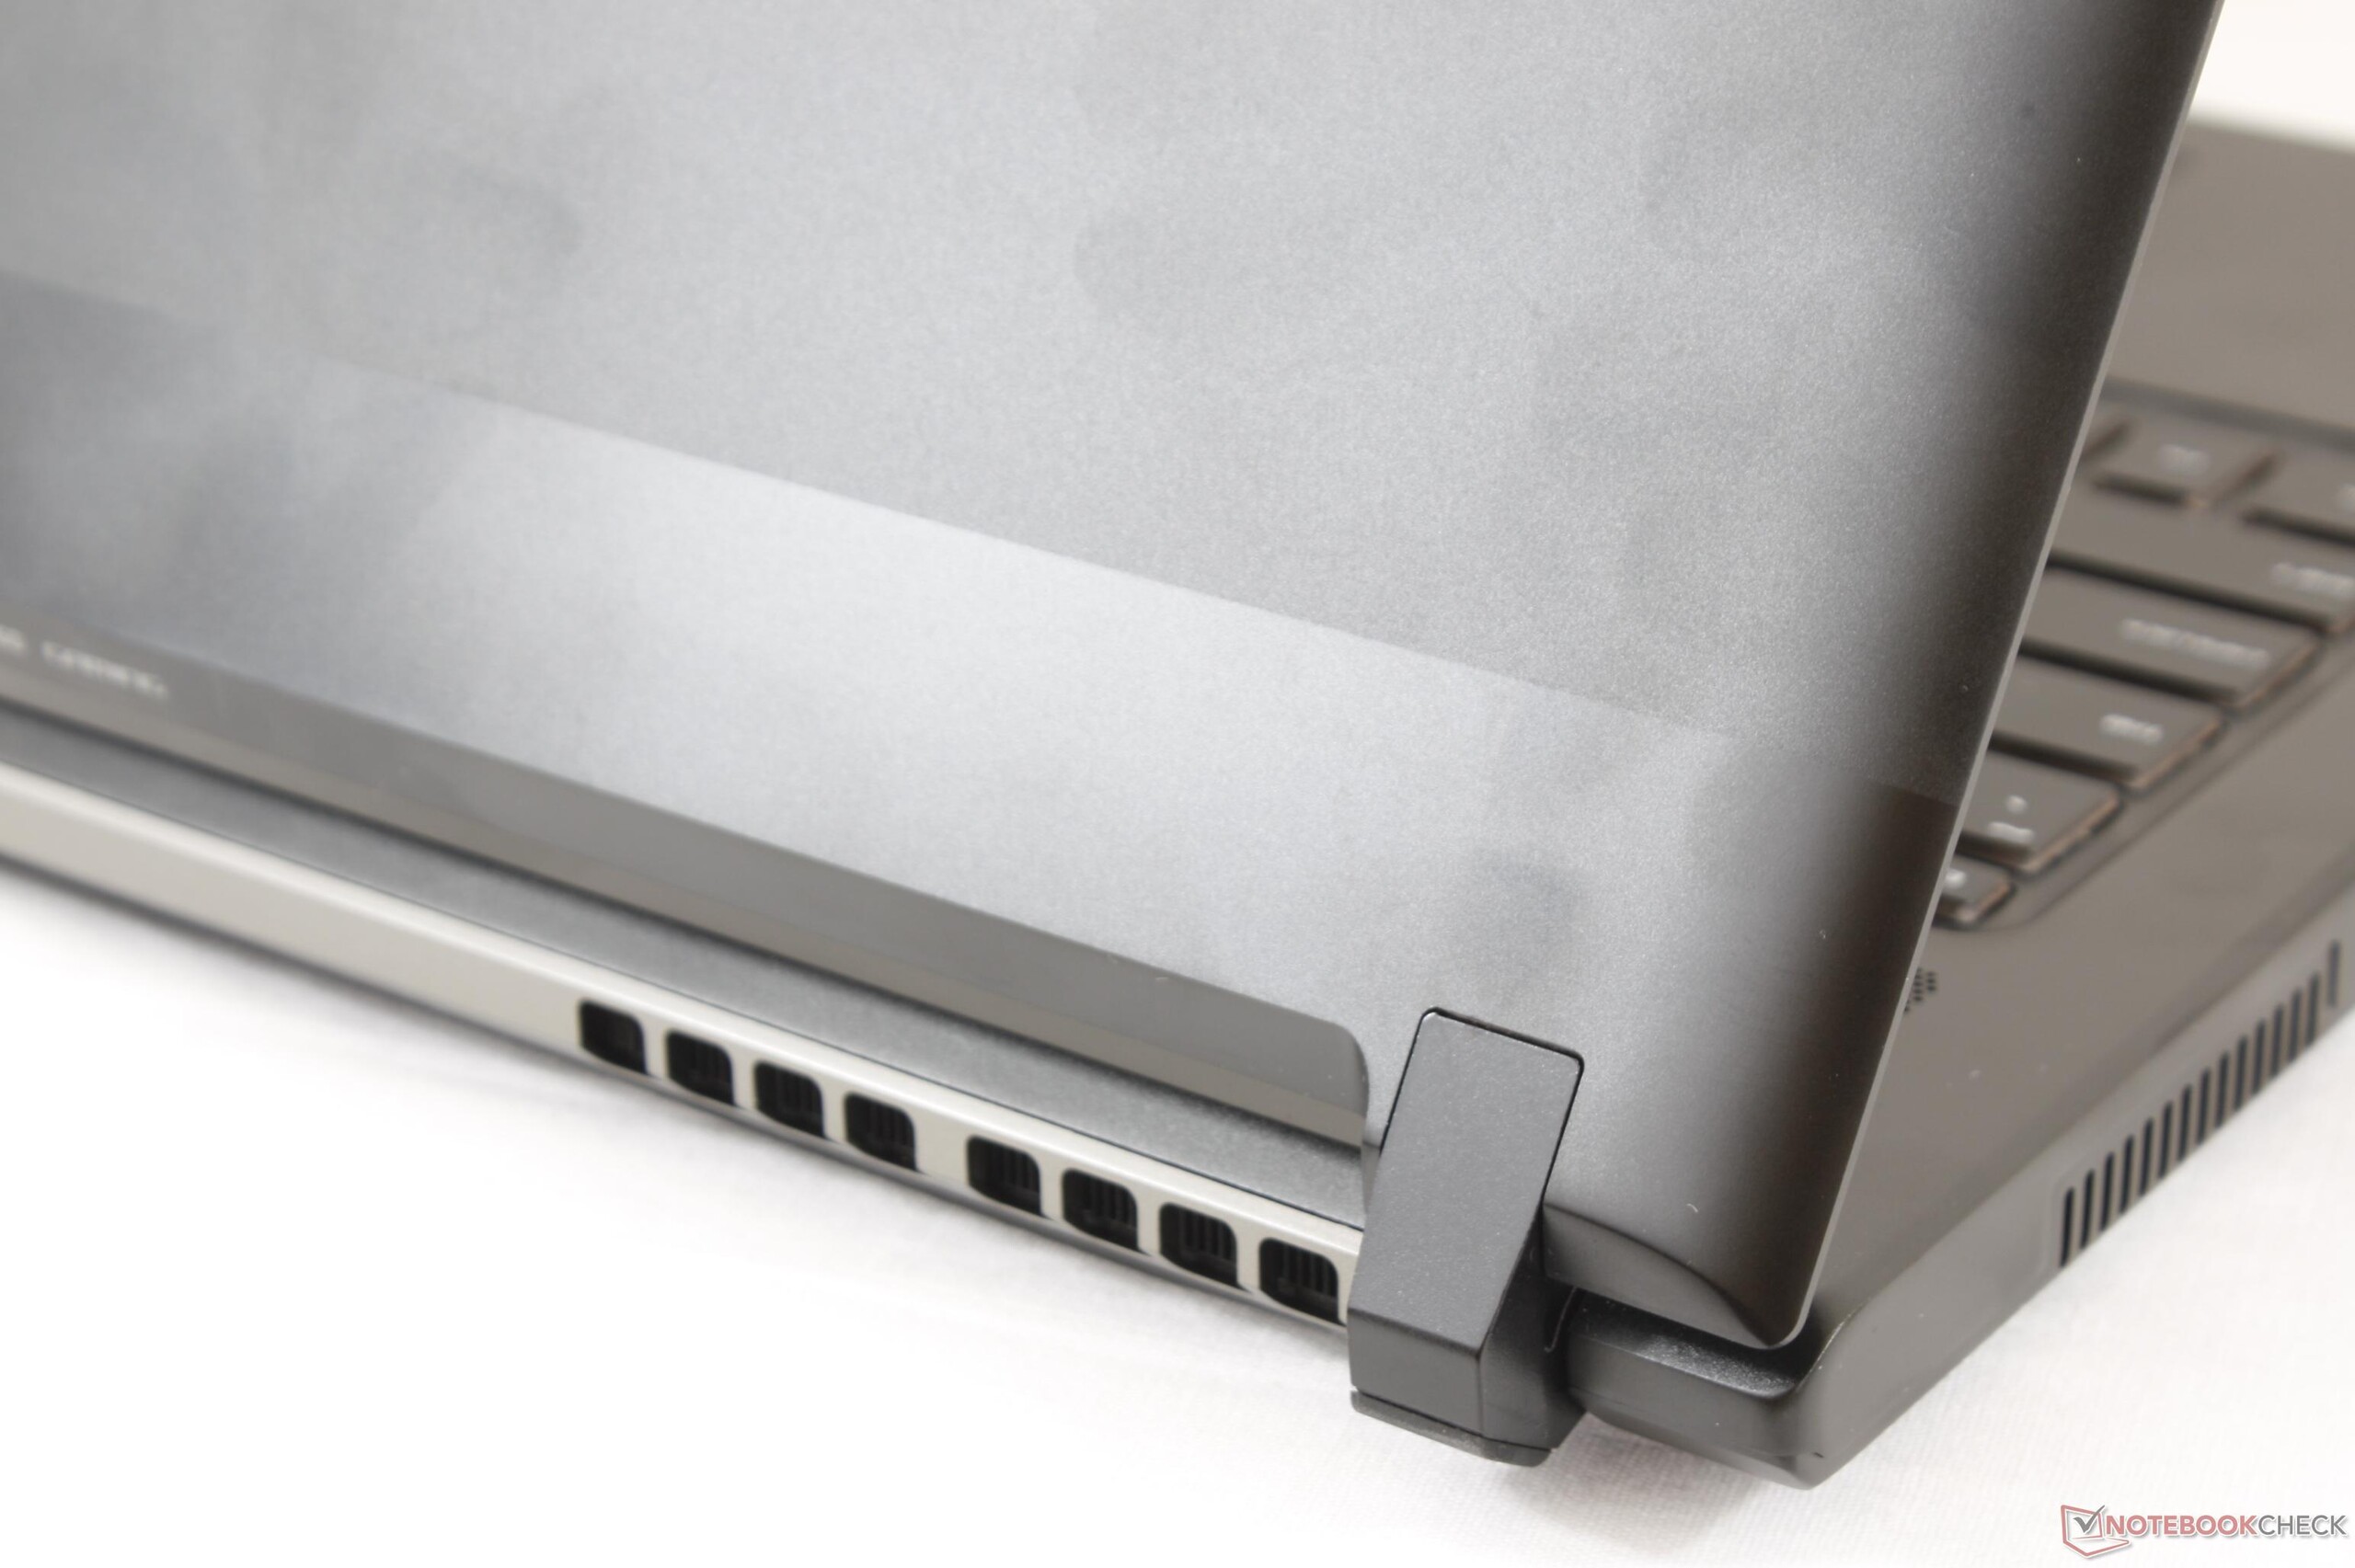
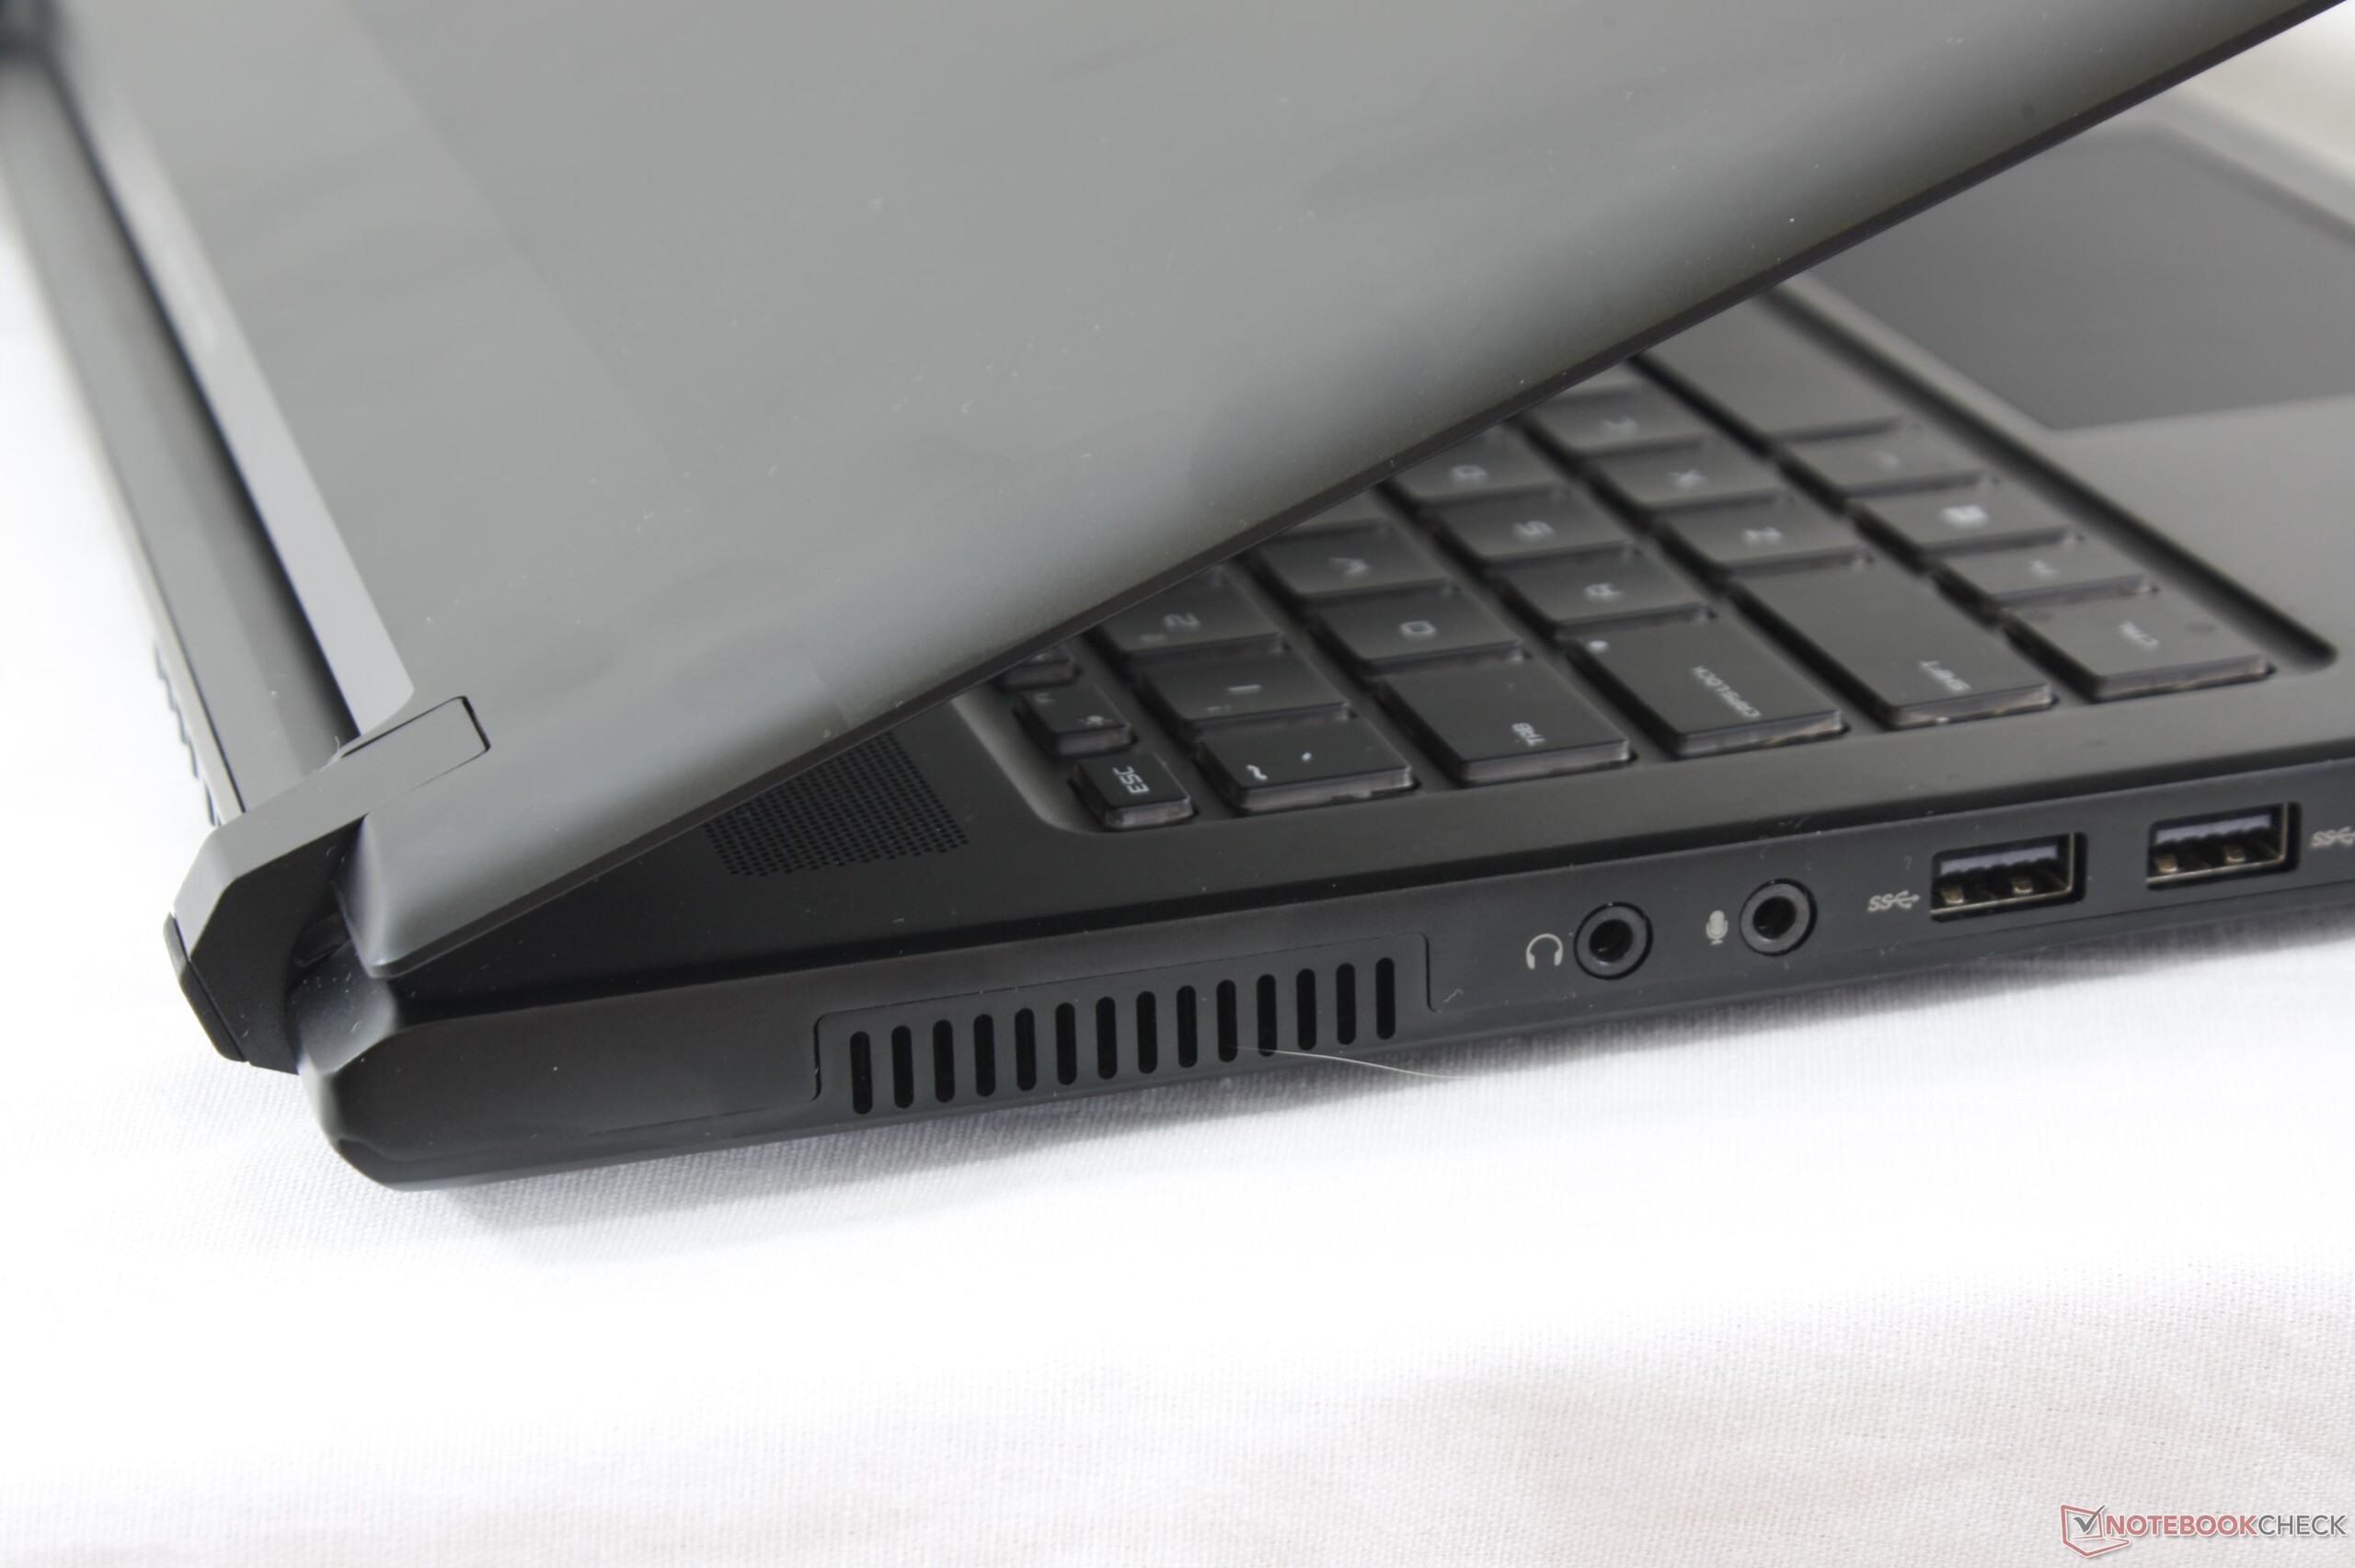
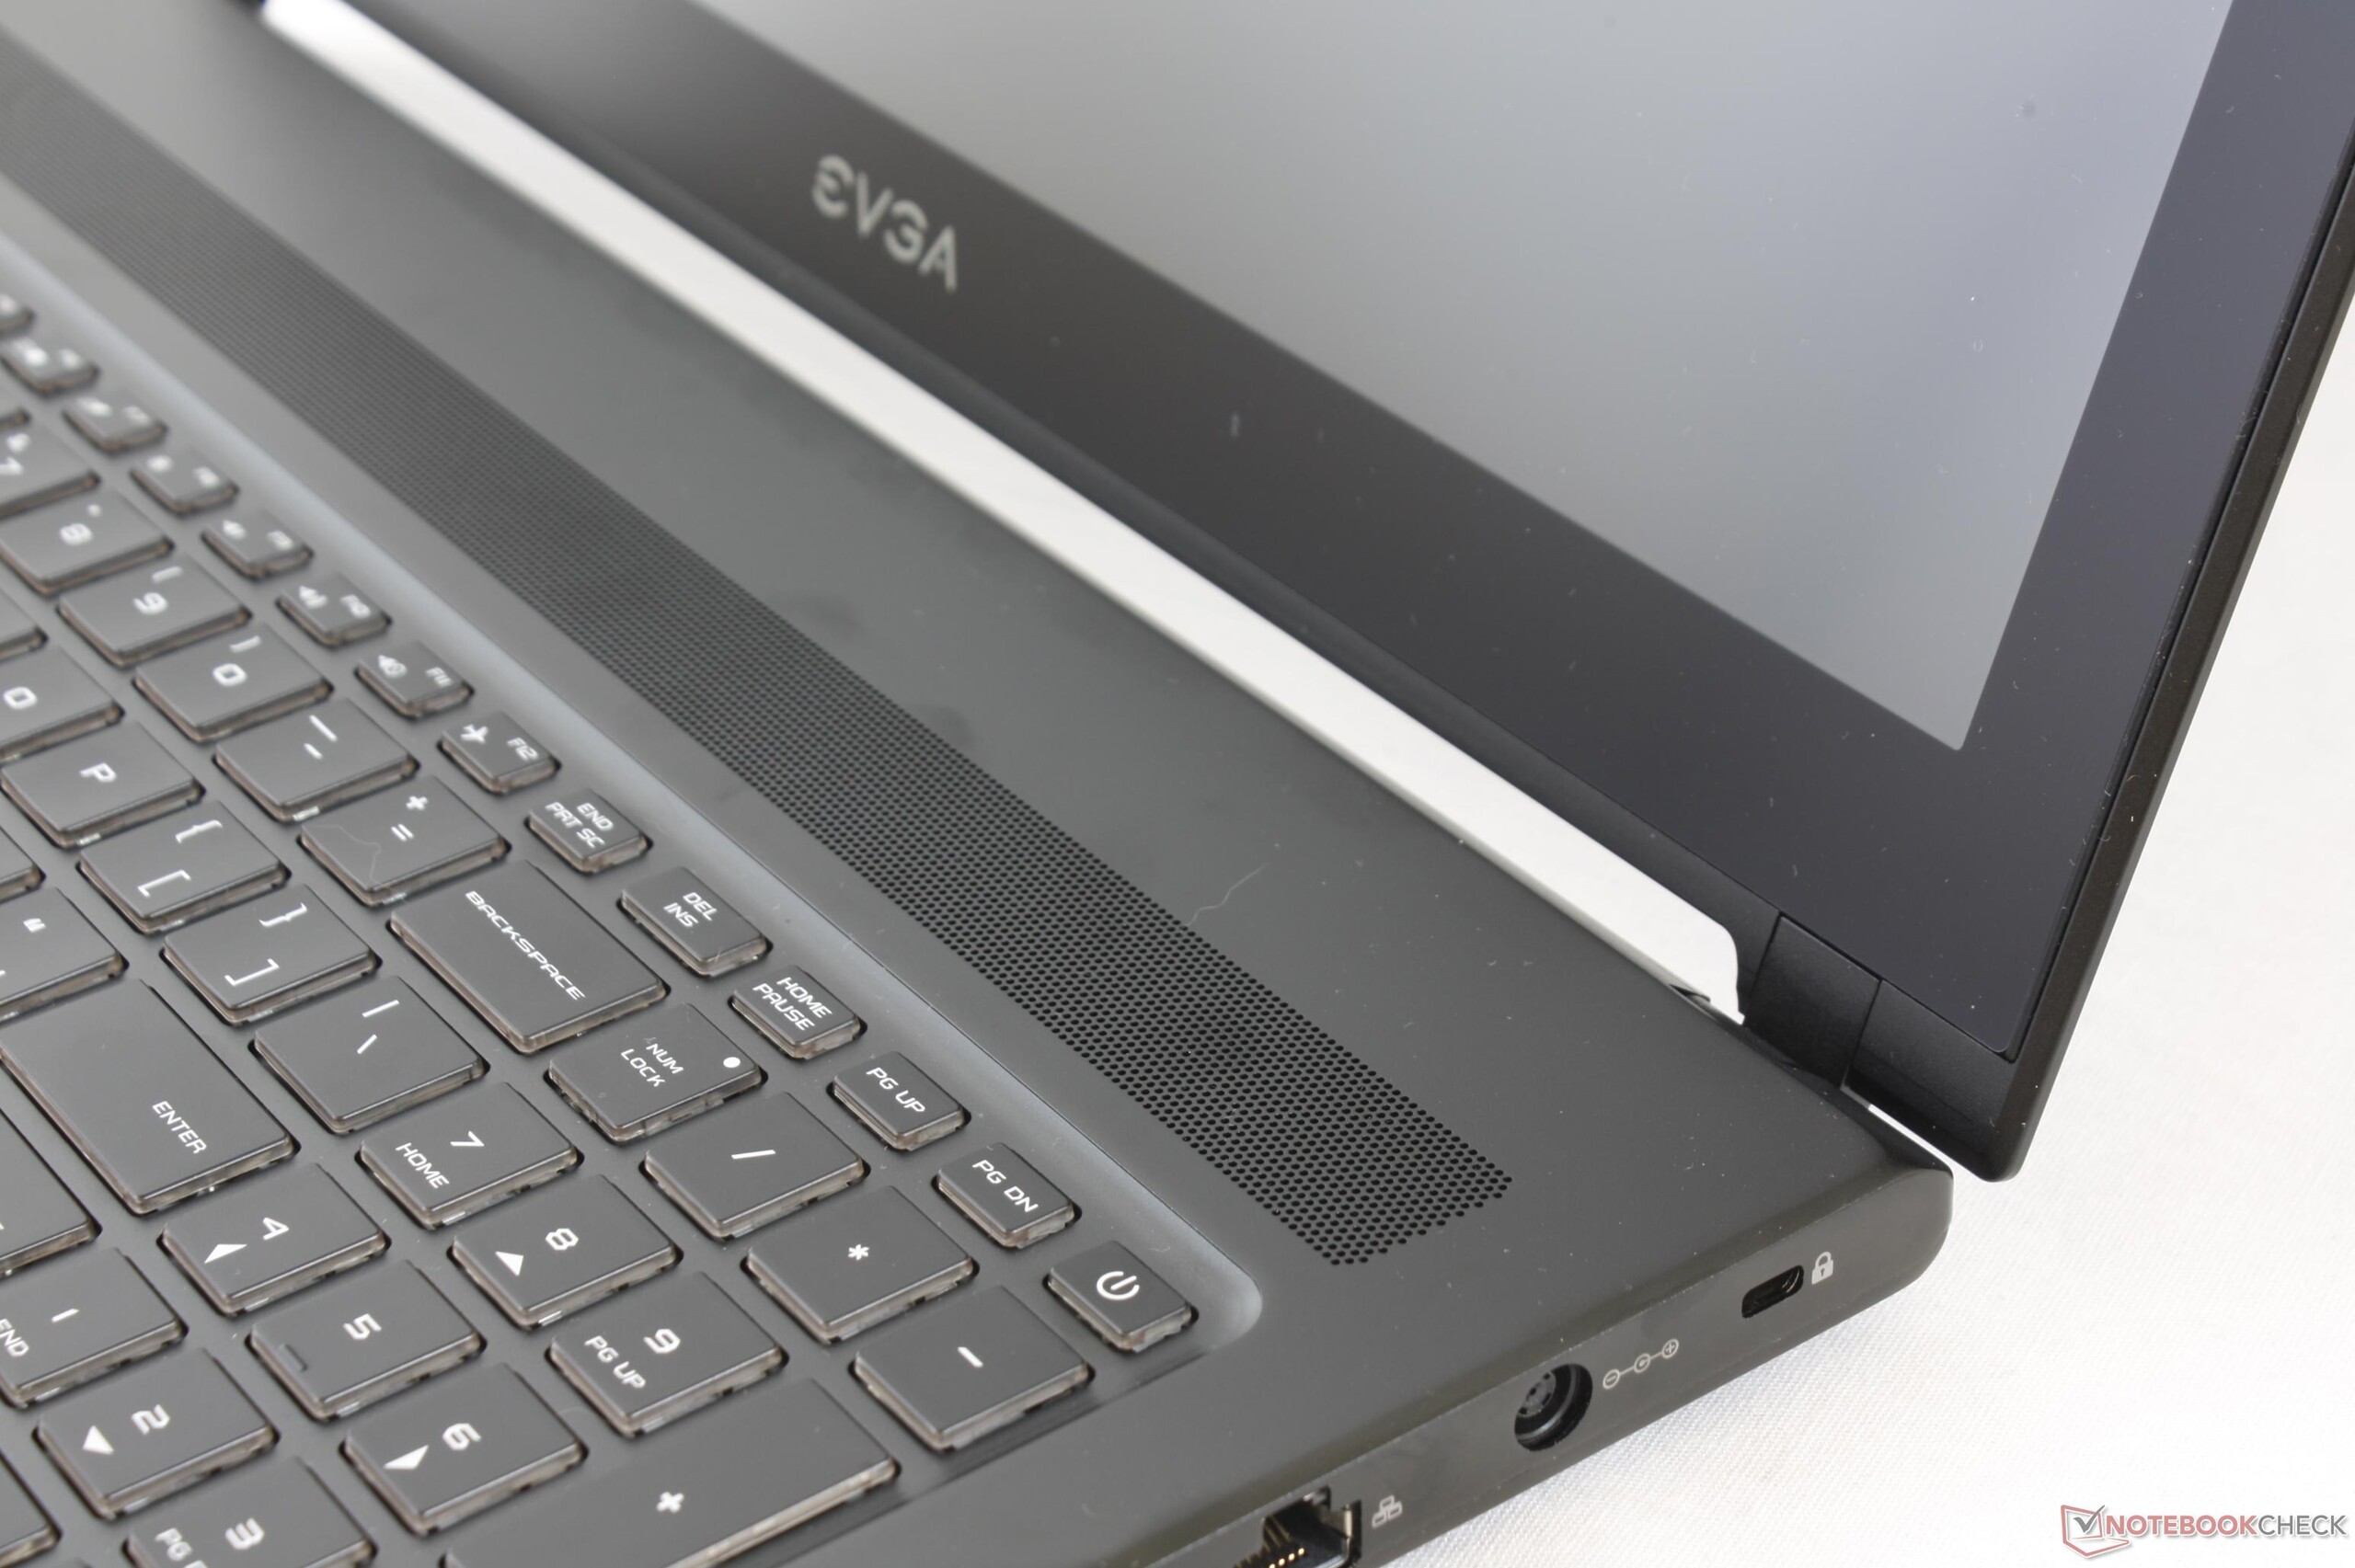
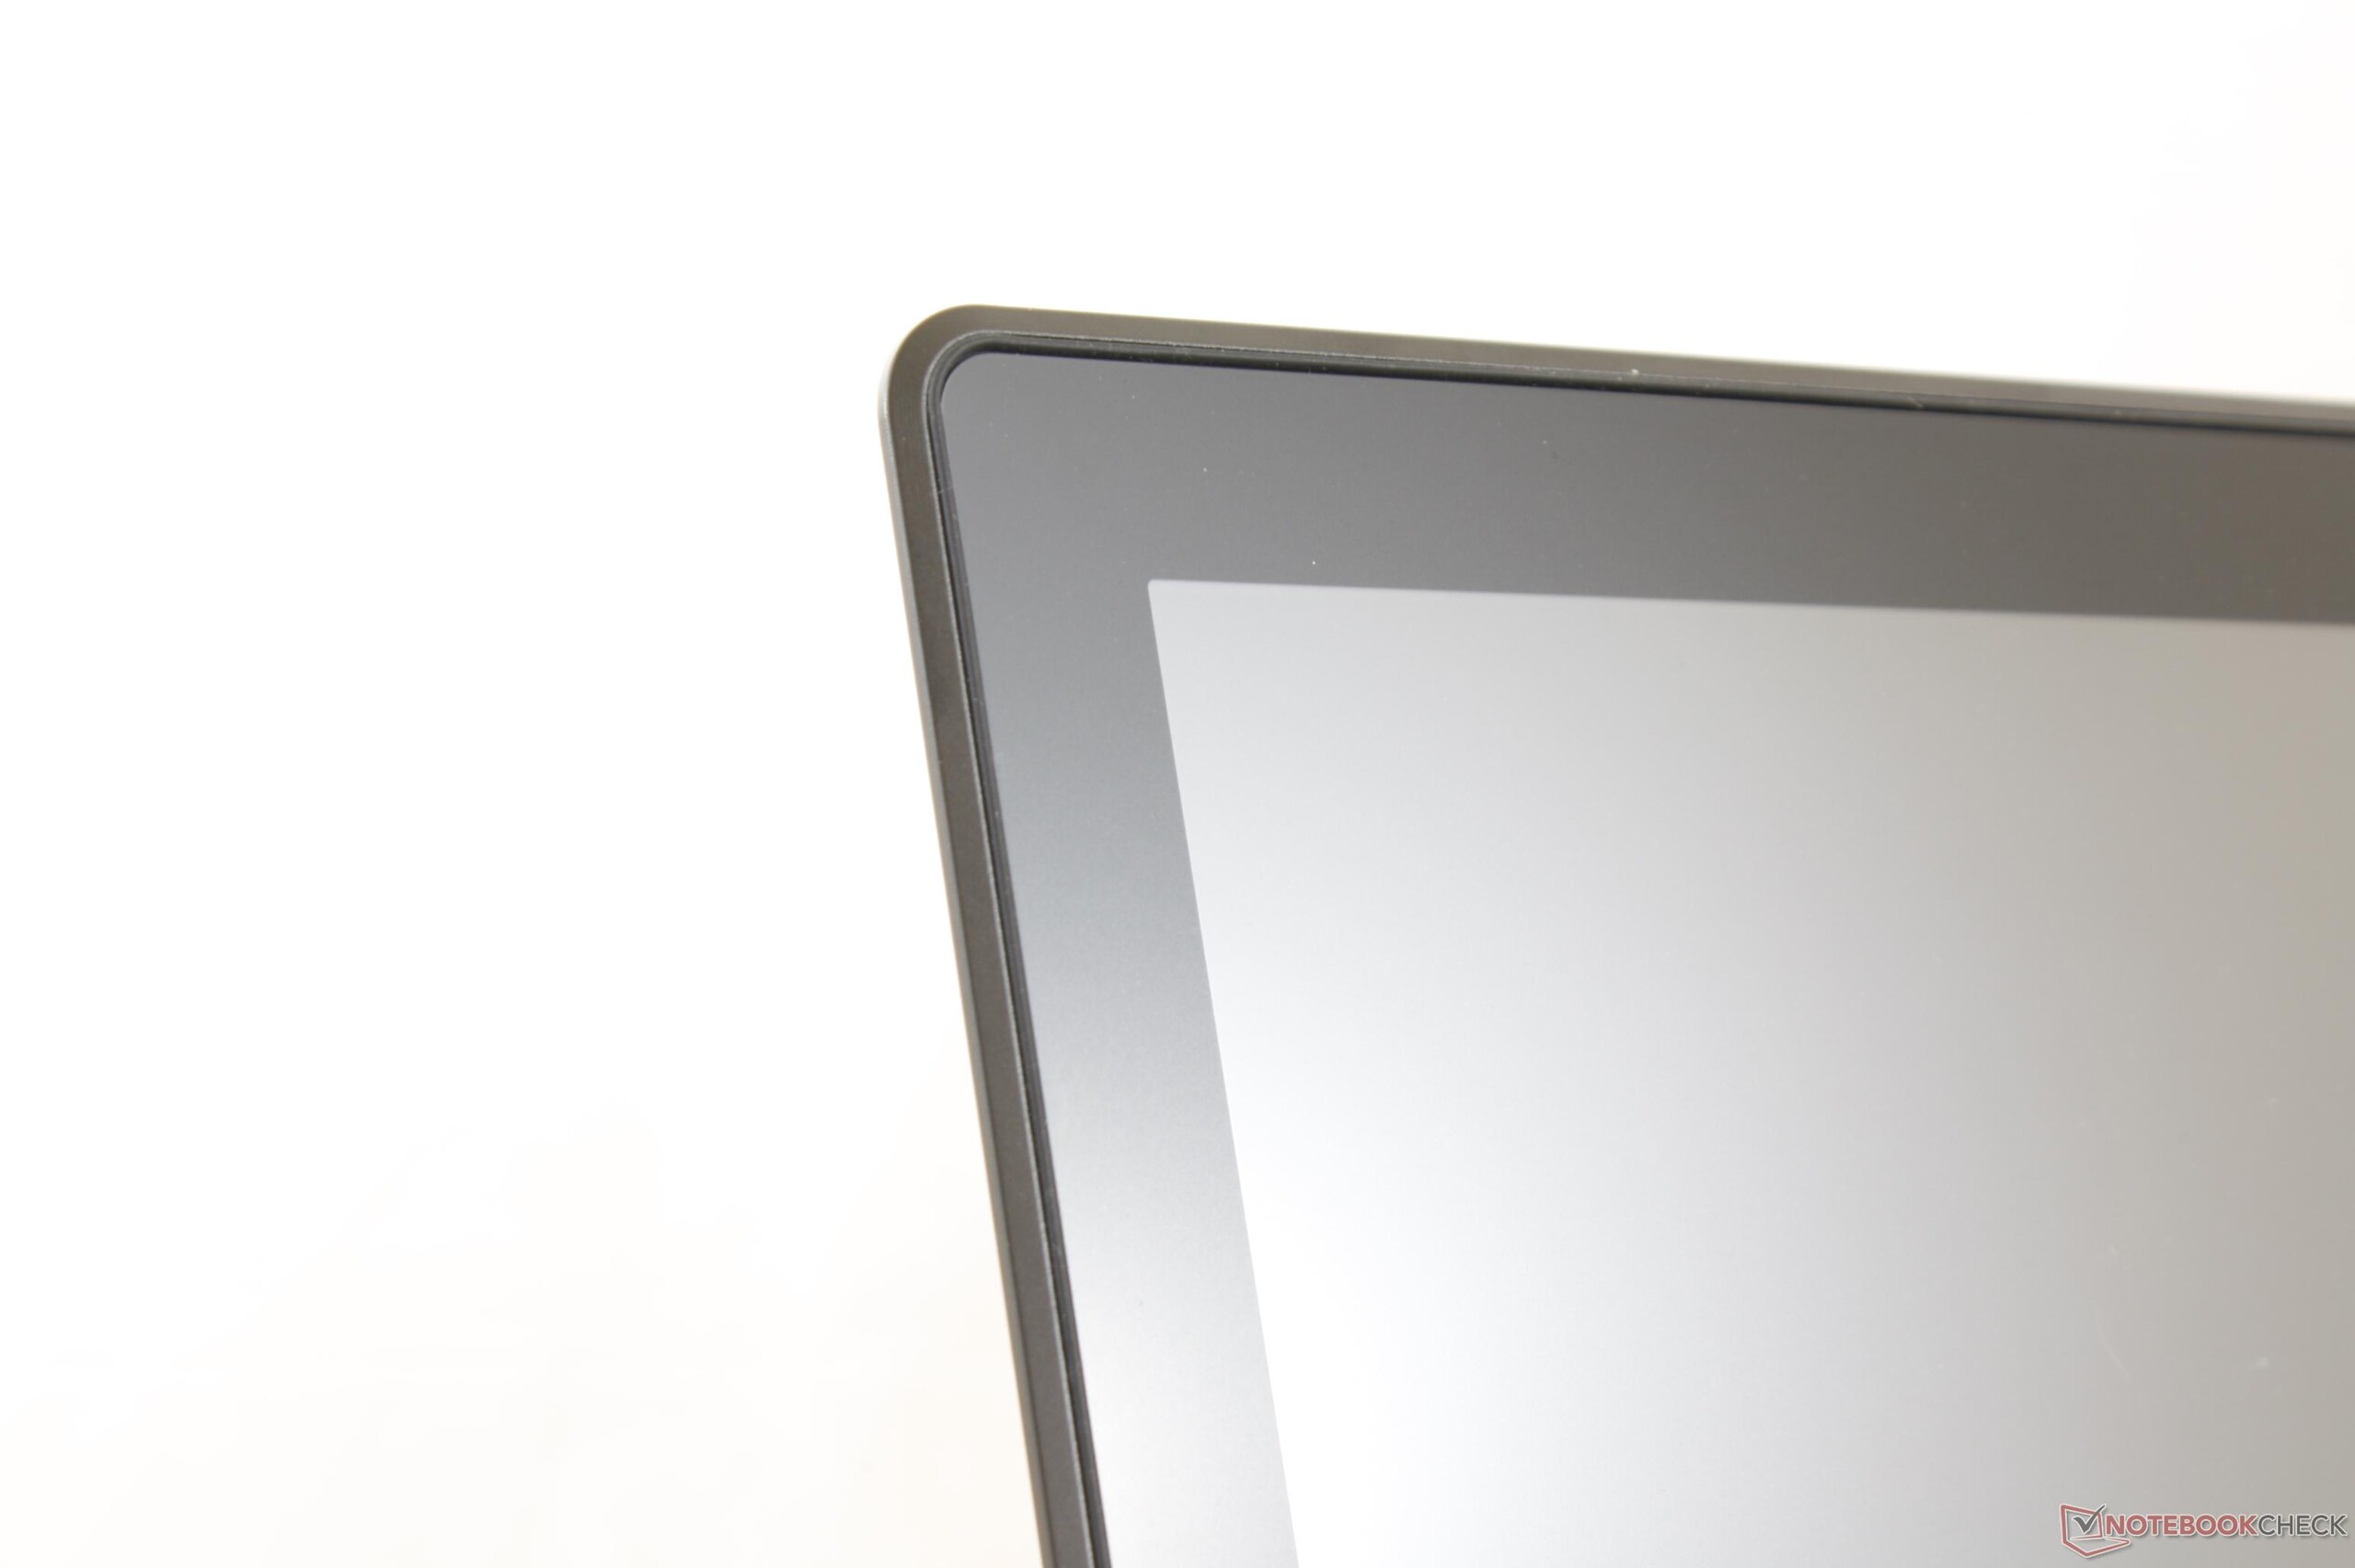
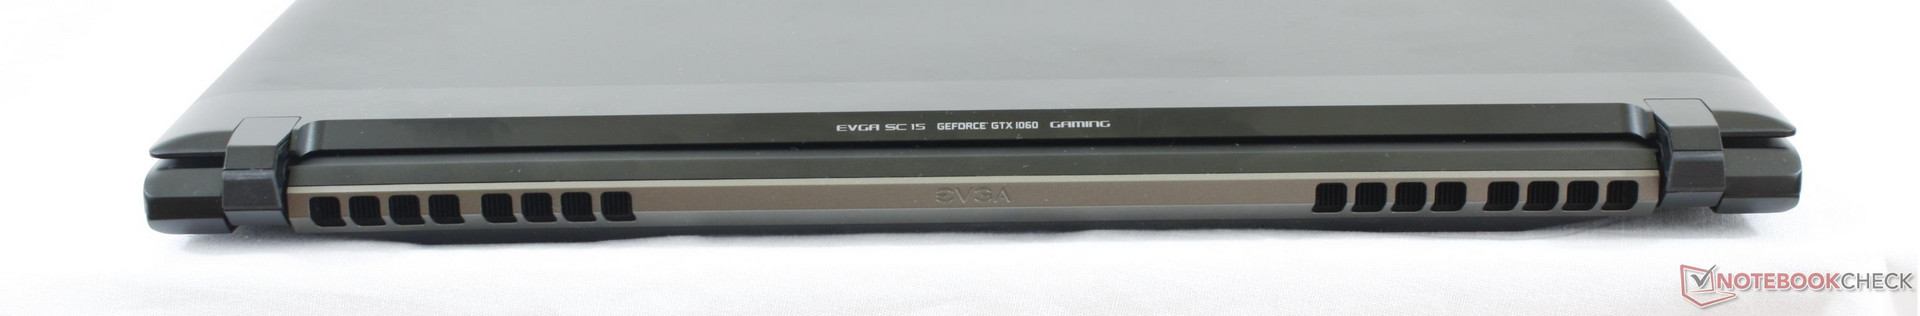
As queixas sobre a tela não terminam por aí, já que o painel mate de borda a borda é bastante grosso. Embora isso tenha a vantagem de uma tampa mais forte e mais inflexível, o conteúdo na tela sofre de granulação adicional como resultado.
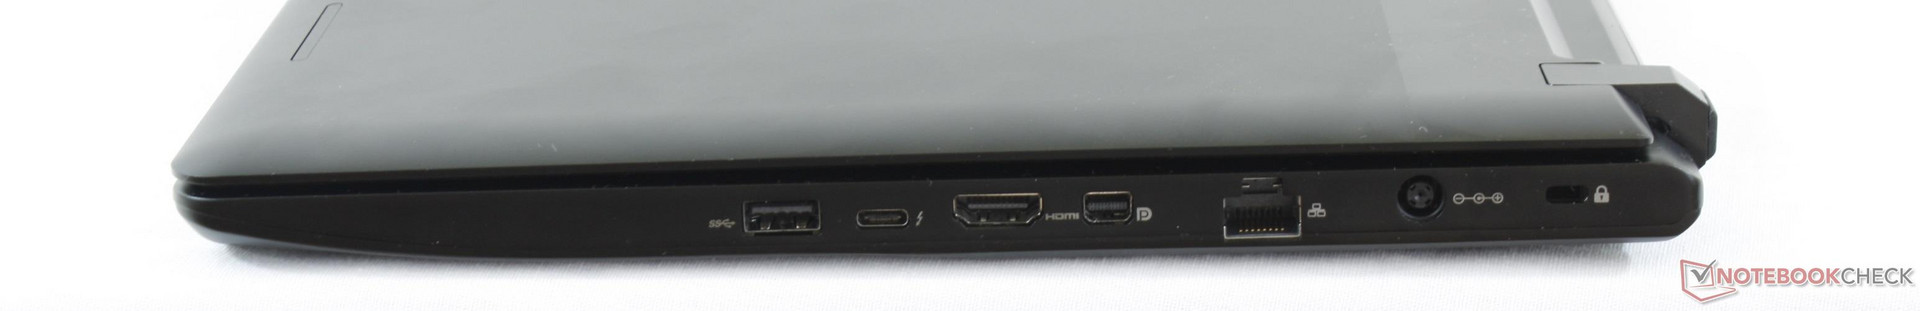
Algumas outras desvantagens são pequenas em comparação, porém, se somam. Os alto-falantes pobres, a falta de um leitor SD integrado, a pobre duração da bateria, o alto consumo de energia no modo inativo e o peso pesado poderiam aborrecer alguns jogadores. Como a maioria dos portáteis da Apple, o preço premium não é necessariamente para os recursos sofisticados, mas para a qualidade excepcional da construção geral.
O SC15 é ,ais sólido, mais silencioso e mais frio que qualquer outros portátil de jogos atualmente disponível nesta classe de tamanho e configuração. Os lentos tempos de resposta da tela e a falta de SKUs reduzem o valor de uma oferta de muito alta qualidade.
EVGA SC15
- 07/05/2017 v6 (old)
Allen Ngo
Price comparison
