Razer Blade 15 Advanced (Início de 2021) Revisão: Agora com uma tela 360-Hz

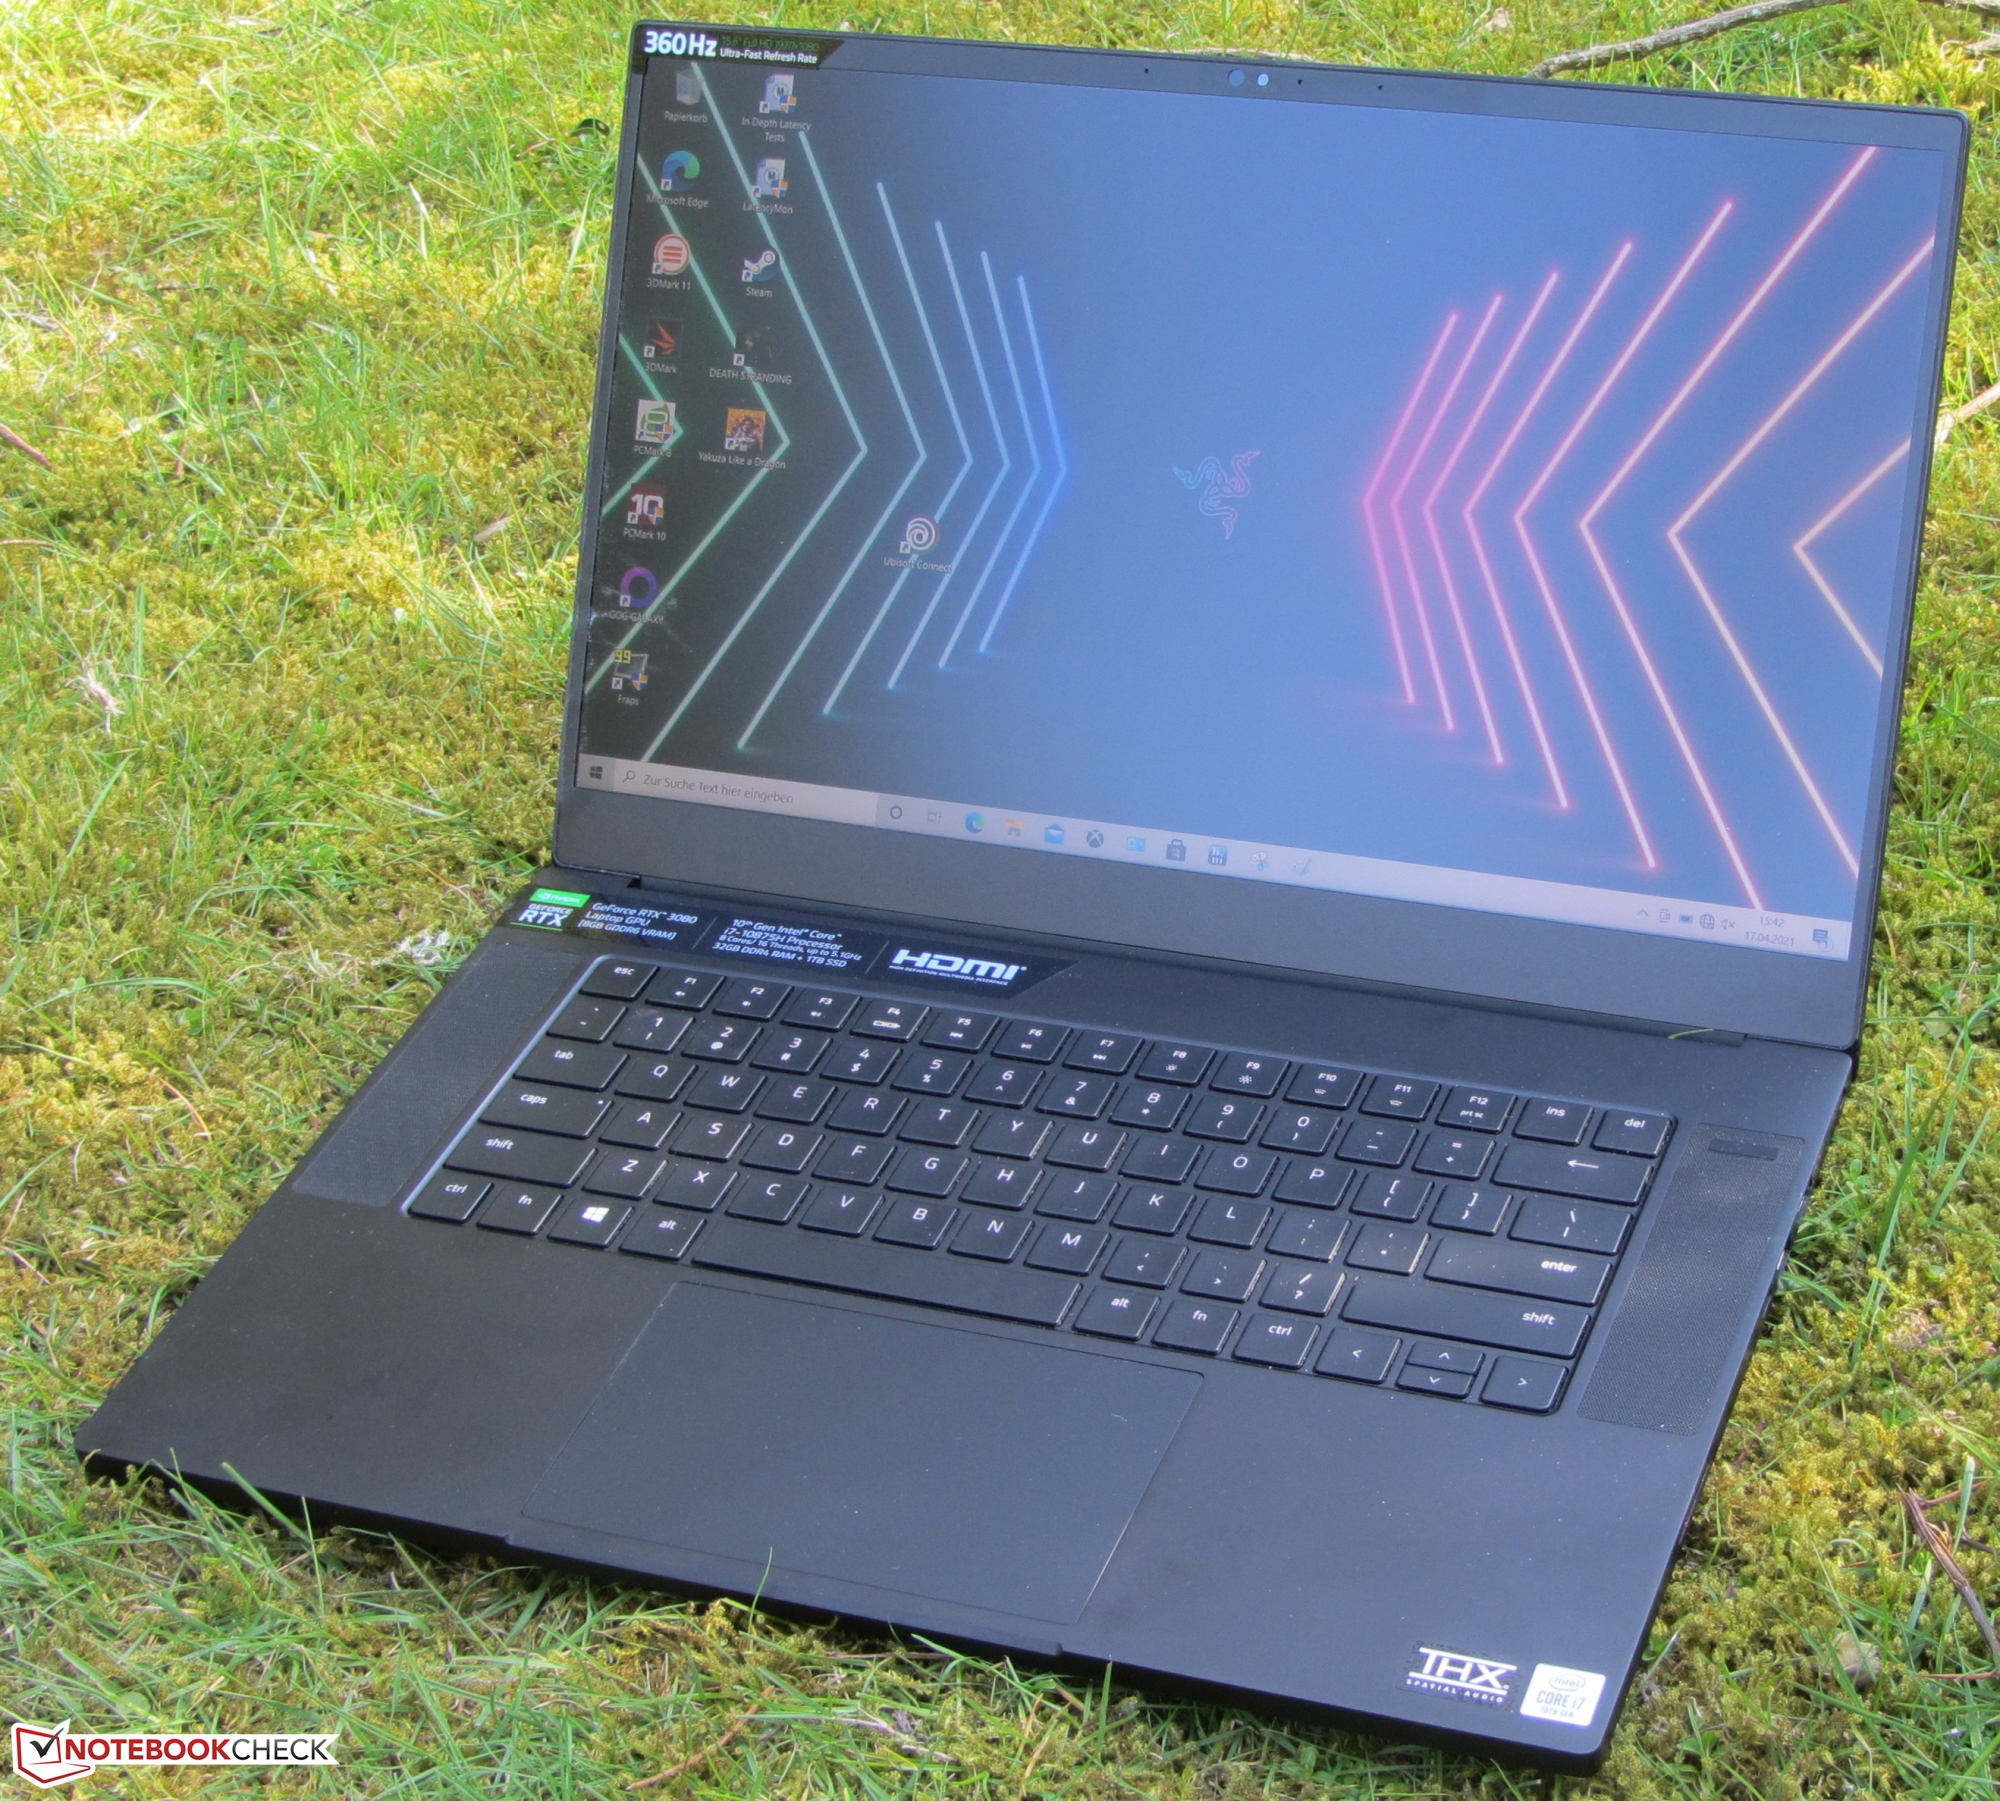
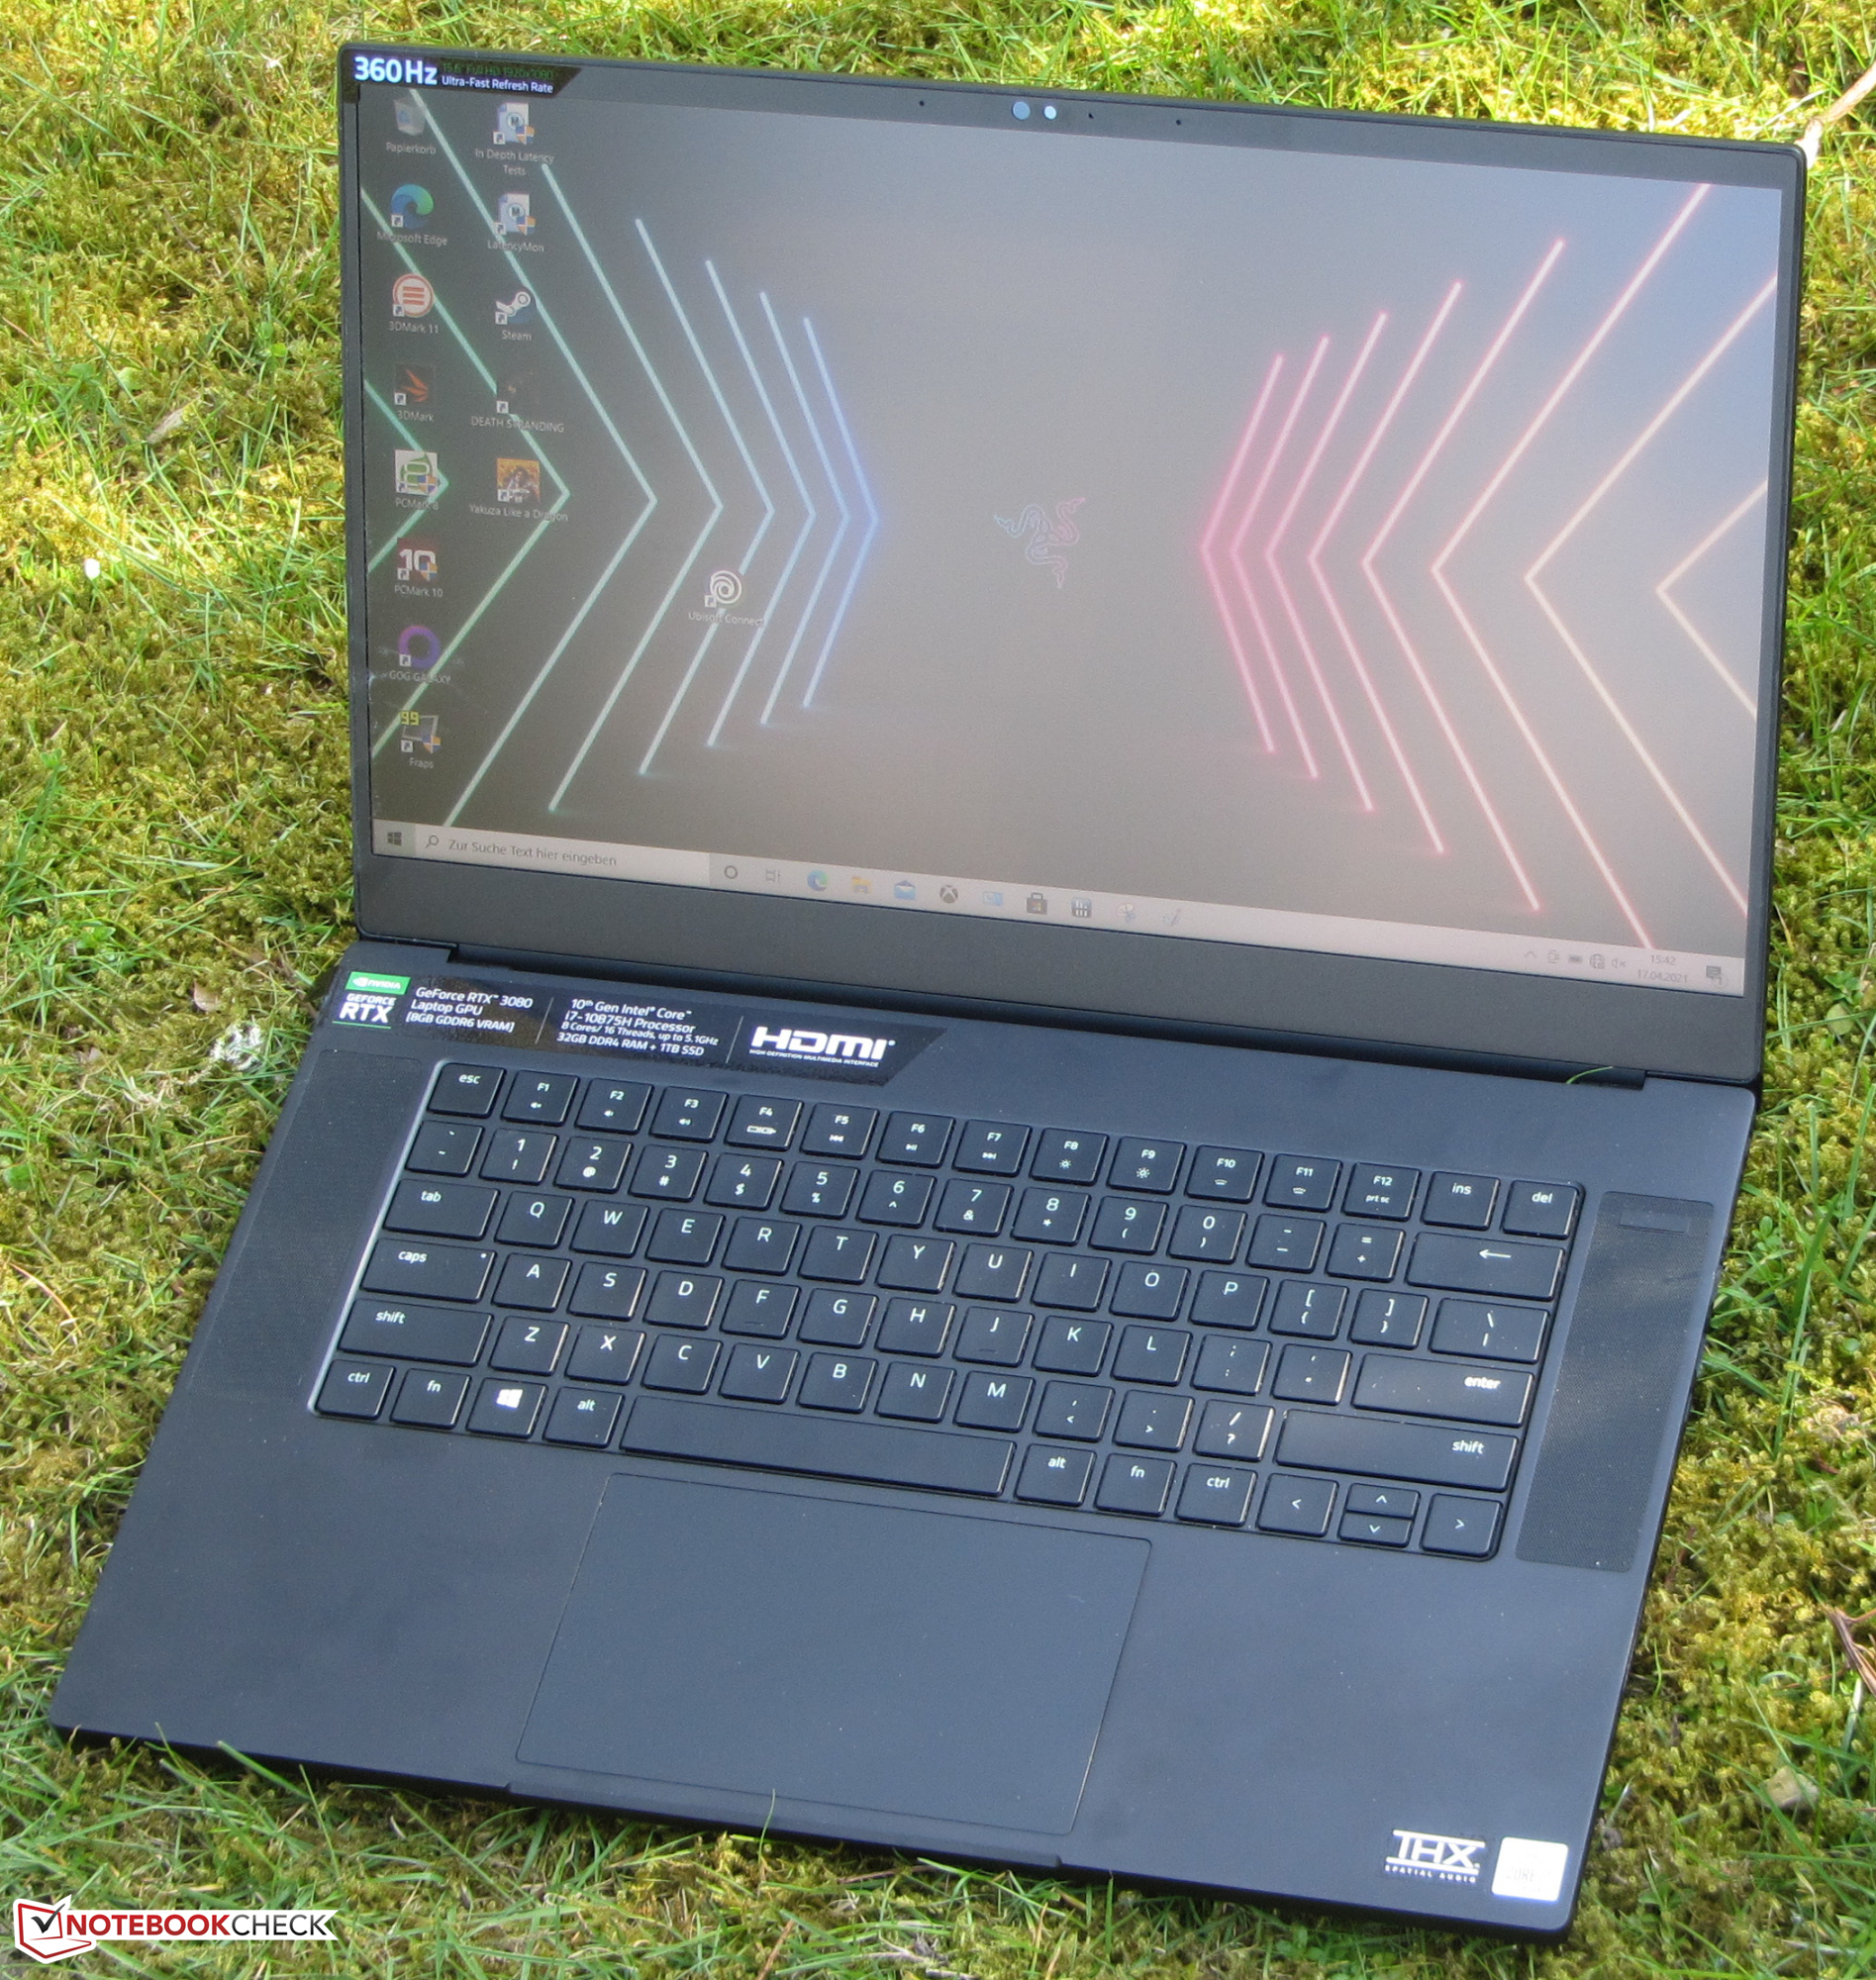
O Razer Blade 15 Advanced (Início de 2021) é um notebook fino de 15,6 polegadas com hardware muito poderoso. Os dispositivos concorrentes incluem o Schenker XMG Pro 15 (Início de 2021)o Asus ROG Zephyrus G15 GA503Qo Aorus 15P XC e o Lenovo Legion 7 15IMH05.
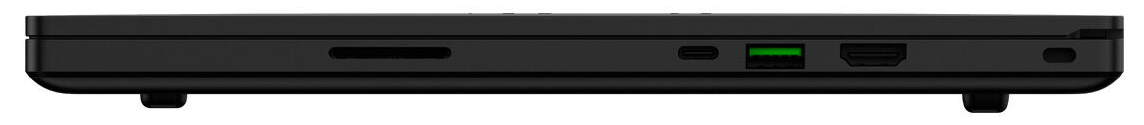
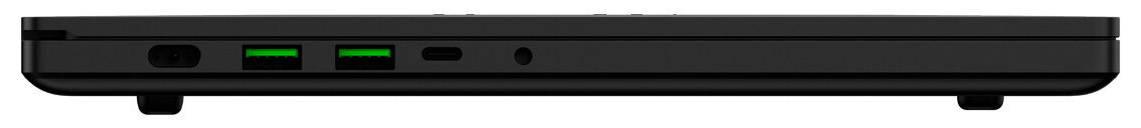
Como nosso dispositivo de revisão atual e seu predecessor são construídos de forma idêntica, nós preferimos incluir nesta revisão as informações sobre a carcaça, conectividade, dispositivos de entrada e alto-falantes. Os leitores podem encontrar todas as informações relevantes em nossas revisões do Lâmina 15 Avançada (2019) e o Lâmina 15 Avançada (2020).
Likely Competitors
Avaliação | Data | Modelo | Peso | Altura | Size | Resolução | Preço |
|---|---|---|---|---|---|---|---|
| 87.5 % v7 (old) | 05/2021 | Razer Blade 15 Advanced Model Early 2021 i7-10875H, GeForce RTX 3080 Laptop GPU | 2 kg | 16.99 mm | 15.60" | 1920x1080 | |
| 86 % v7 (old) | 03/2021 | Schenker XMG Pro 15 (Early 2021, RTX 3080) i7-10870H, GeForce RTX 3080 Laptop GPU | 2 kg | 19.8 mm | 15.60" | 1920x1080 | |
| 83.8 % v7 (old) | 02/2021 | Asus ROG Zephyrus G15 GA503Q R9 5900HS, GeForce RTX 3080 Laptop GPU | 2 kg | 20 mm | 15.60" | 2560x1440 | |
| 86.1 % v7 (old) | 02/2021 | Aorus 15P XC i7-10870H, GeForce RTX 3070 Laptop GPU | 2.2 kg | 27 mm | 15.60" | 1920x1080 | |
| 86.3 % v7 (old) | 12/2020 | Lenovo Legion 7 15IMH05-81YT001VGE i9-10980HK, GeForce RTX 2080 Super Max-Q | 2.4 kg | 19.9 mm | 15.60" | 1920x1080 |
Visão geral das mudanças
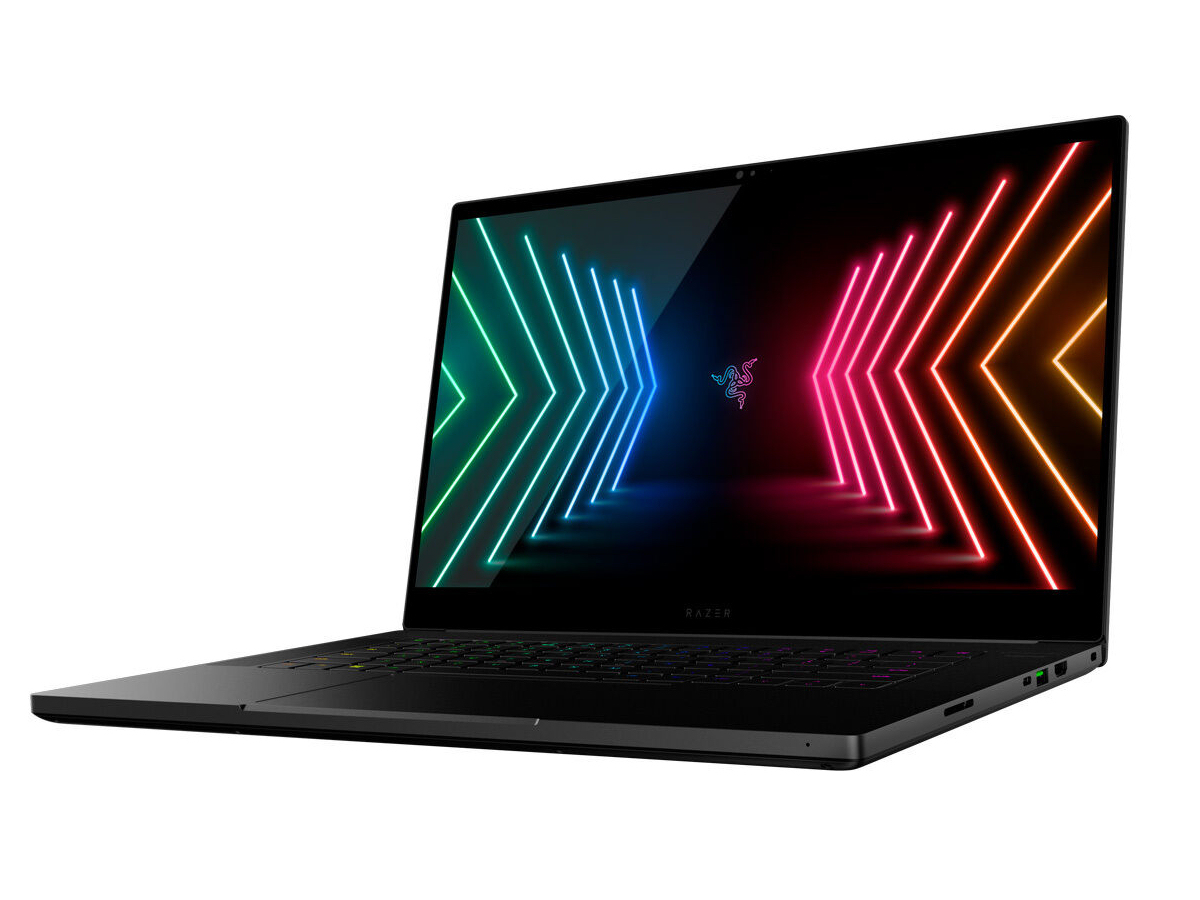
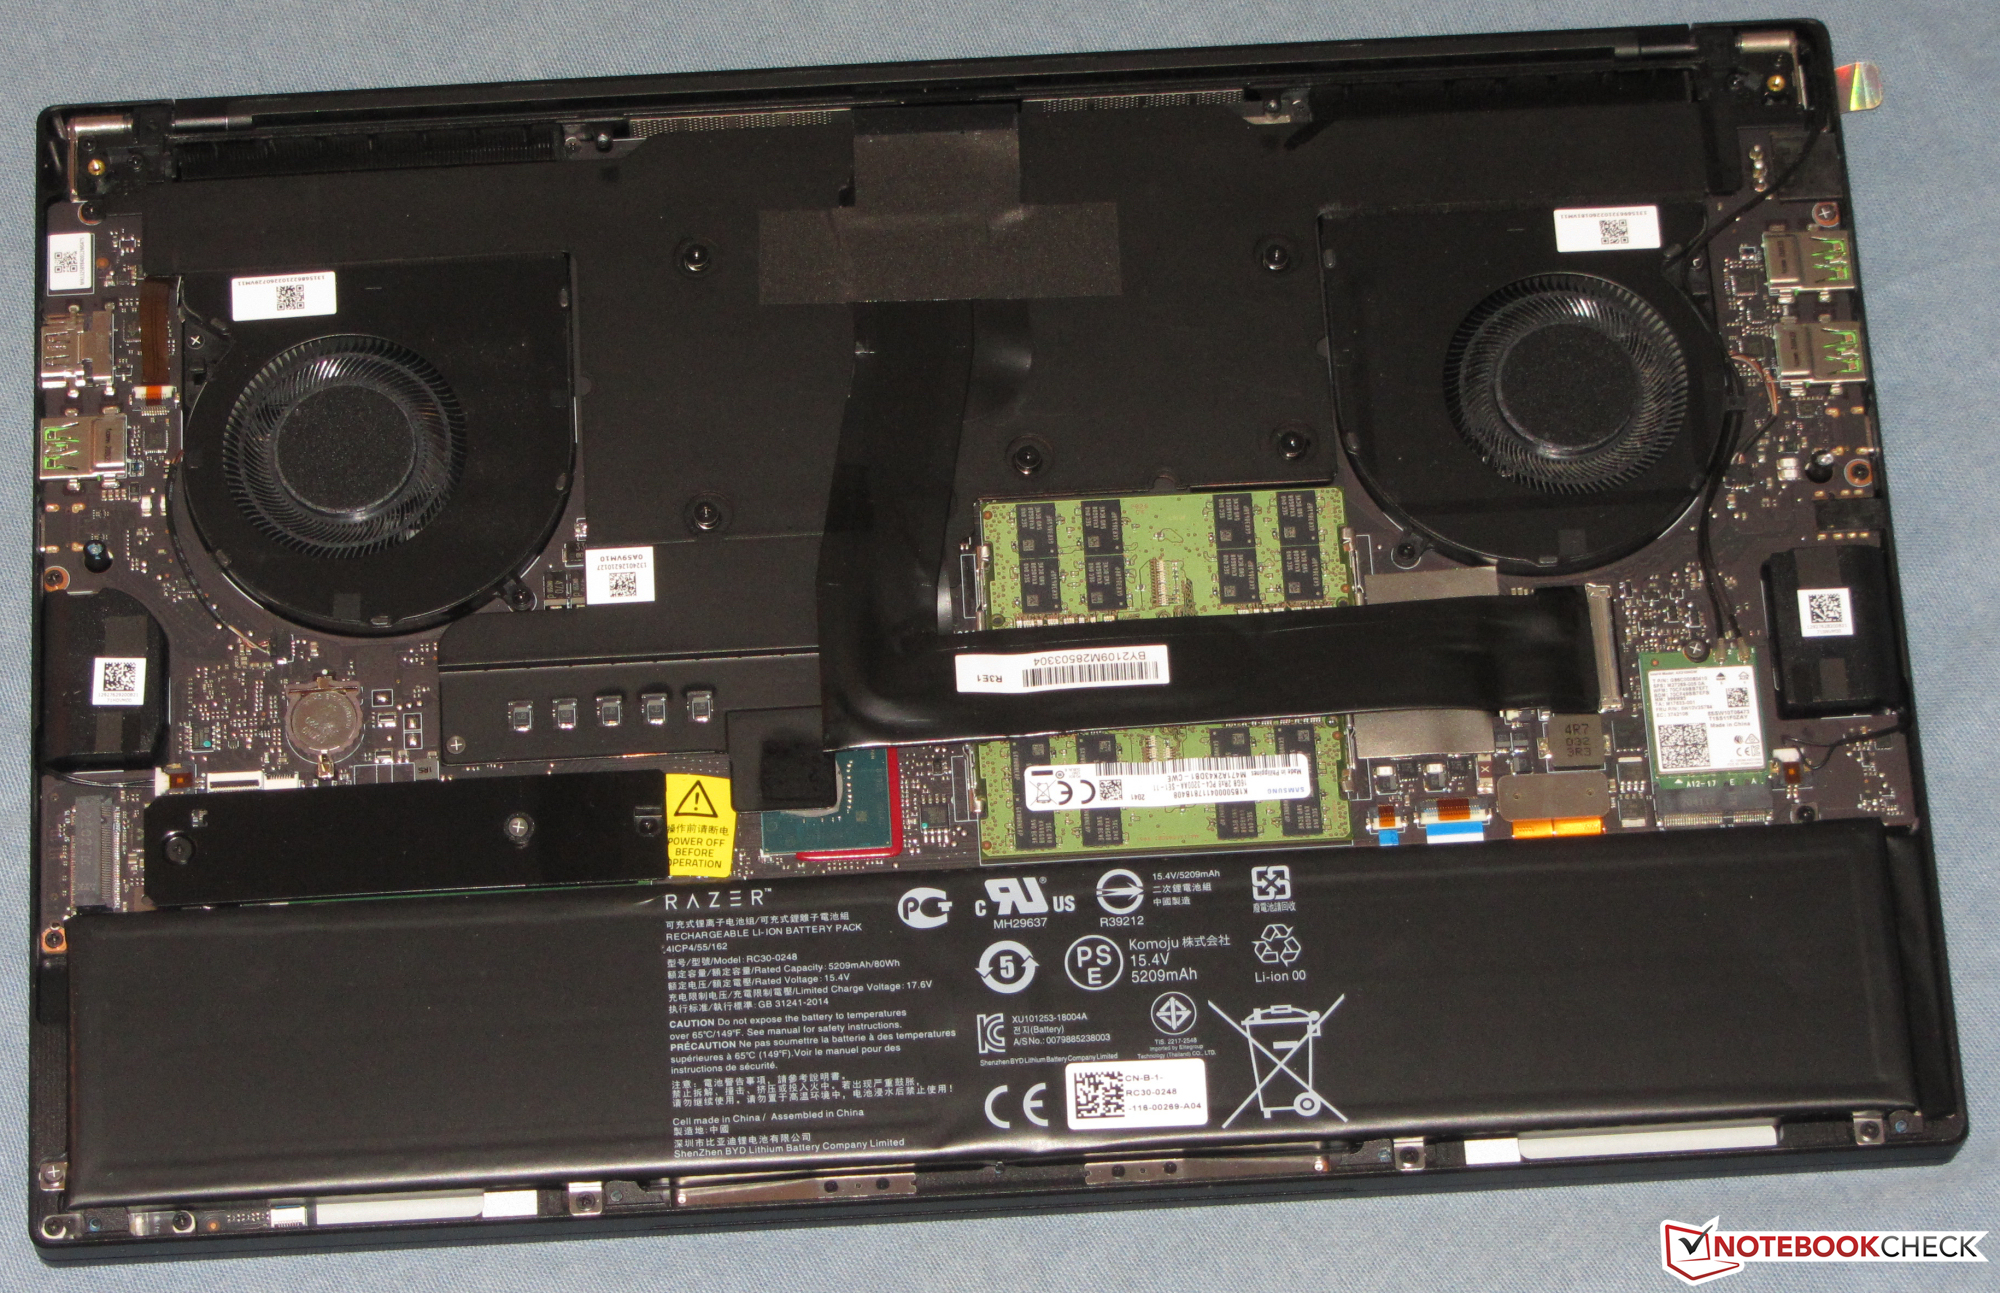
À primeira vista, o Lâmina 15 Avançado 2020 se parece exatamente com o modelo de 2021. O esquema de cores, a forma e a pegada não mudaram. Entretanto, o modelo 2021 é um pouco mais fino (16,9 mm vs. 17,8 mm). No entanto, houve mudanças nos componentes internos. O modelo 2021 vem com as novas GPUs RTX série 3000 e tem um segundo slot M.2-2280 SSD. Além disso, possui uma tela 360-Hz 1080p.
| SD Card Reader | |
| average JPG Copy Test (av. of 3 runs) | |
| Razer Blade 15 Advanced Model Early 2021 (AV PRO microSD 128 GB V60) | |
| Razer Blade 15 RTX 2080 Super Max-Q (Toshiba Exceria Pro SDXC 64 GB UHS-II) | |
| Aorus 15P XC (Toshiba Exceria Pro SDXC 64 GB UHS-II) | |
| Média da turma Gaming (20.9 - 210, n=54, últimos 2 anos) | |
| maximum AS SSD Seq Read Test (1GB) | |
| Aorus 15P XC (Toshiba Exceria Pro SDXC 64 GB UHS-II) | |
| Razer Blade 15 RTX 2080 Super Max-Q (Toshiba Exceria Pro SDXC 64 GB UHS-II) | |
| Razer Blade 15 Advanced Model Early 2021 (AV PRO microSD 128 GB V60) | |
| Média da turma Gaming (25.5 - 261, n=51, últimos 2 anos) | |


")
")
 GeForce RTX 3080 Laptop GPU, i7-10870H, Samsung SSD 970 EVO Plus 1TB")
 GeForce RTX 3080 Laptop GPU, i7-10870H, Samsung SSD 970 EVO Plus 1TB")


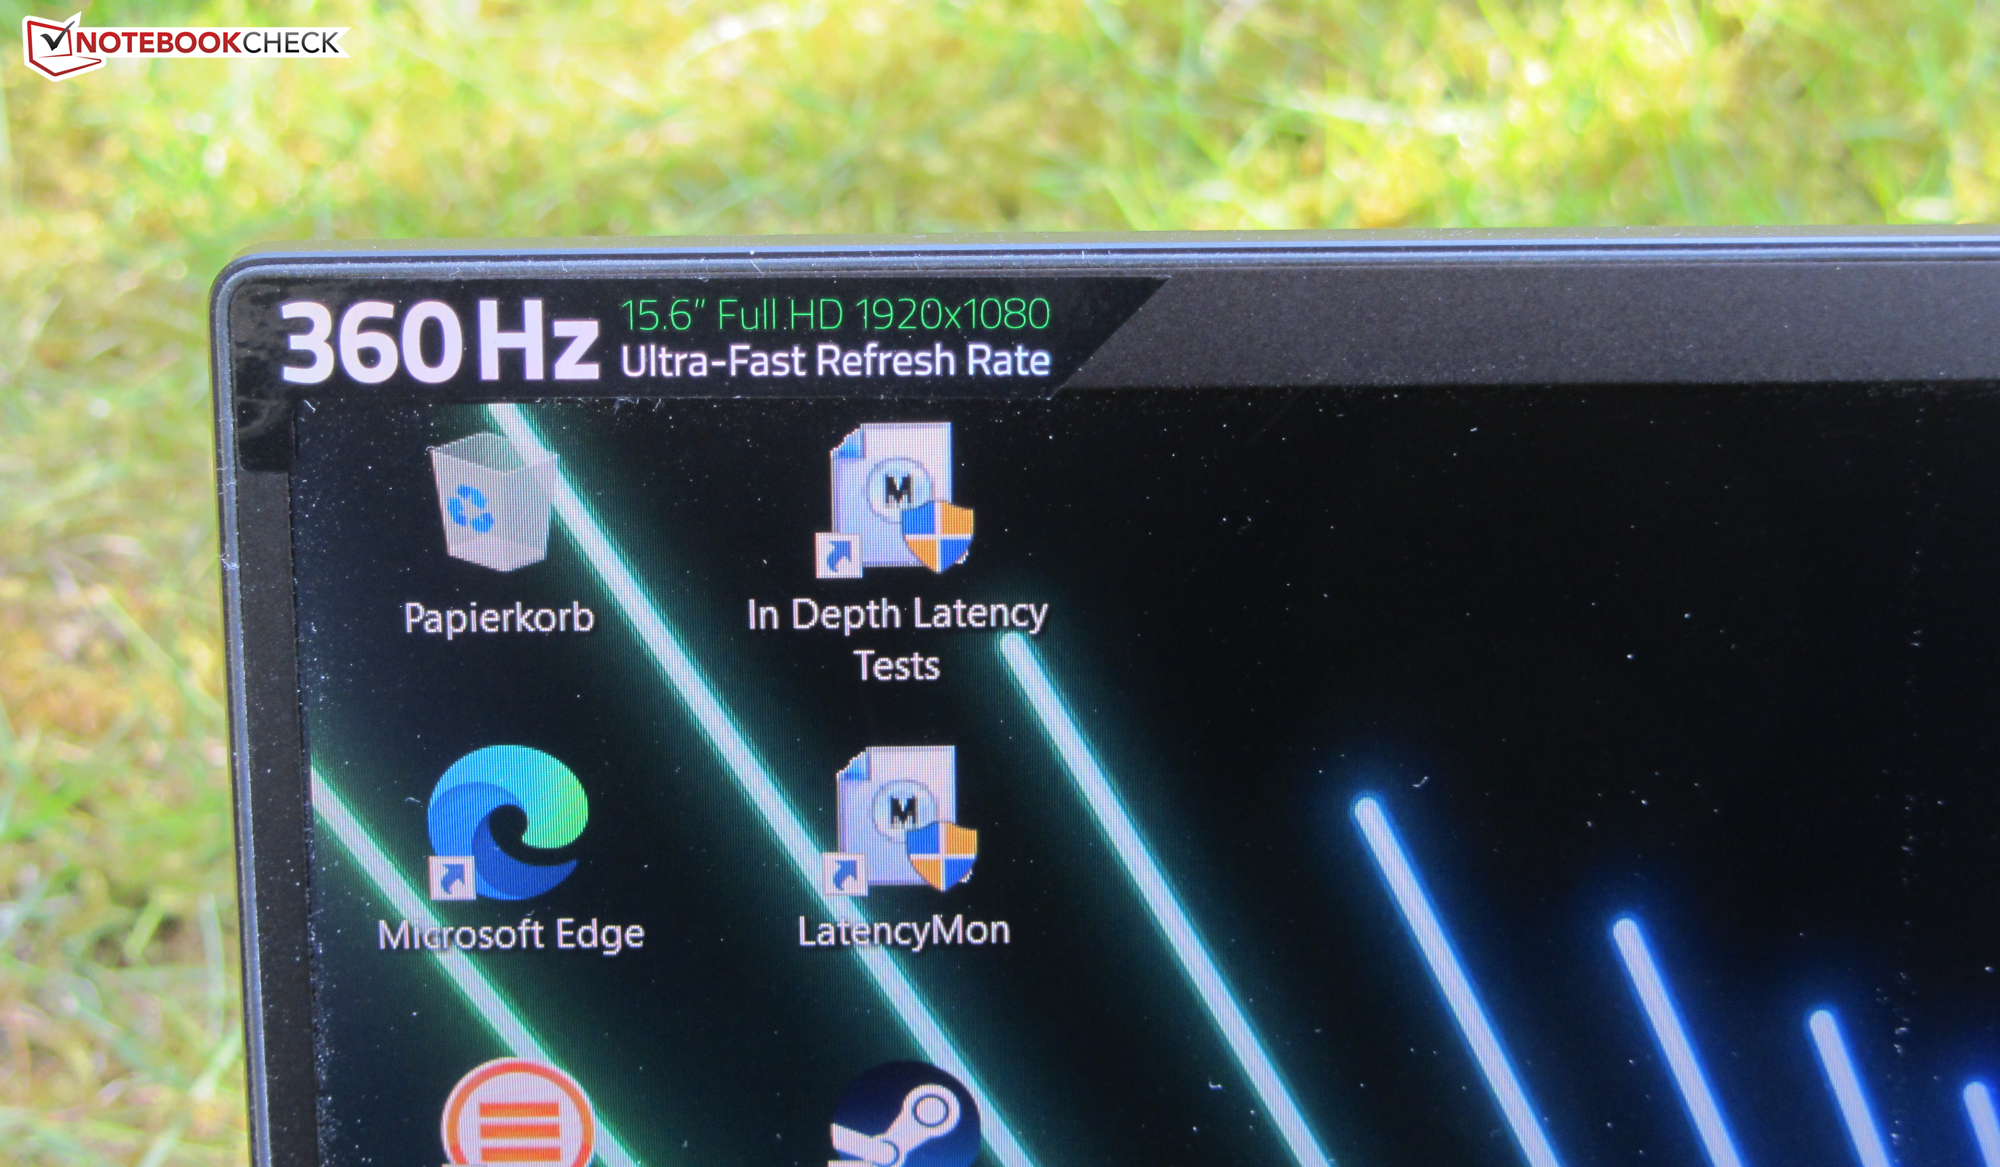
Mostrador - 360-Hz-IPS
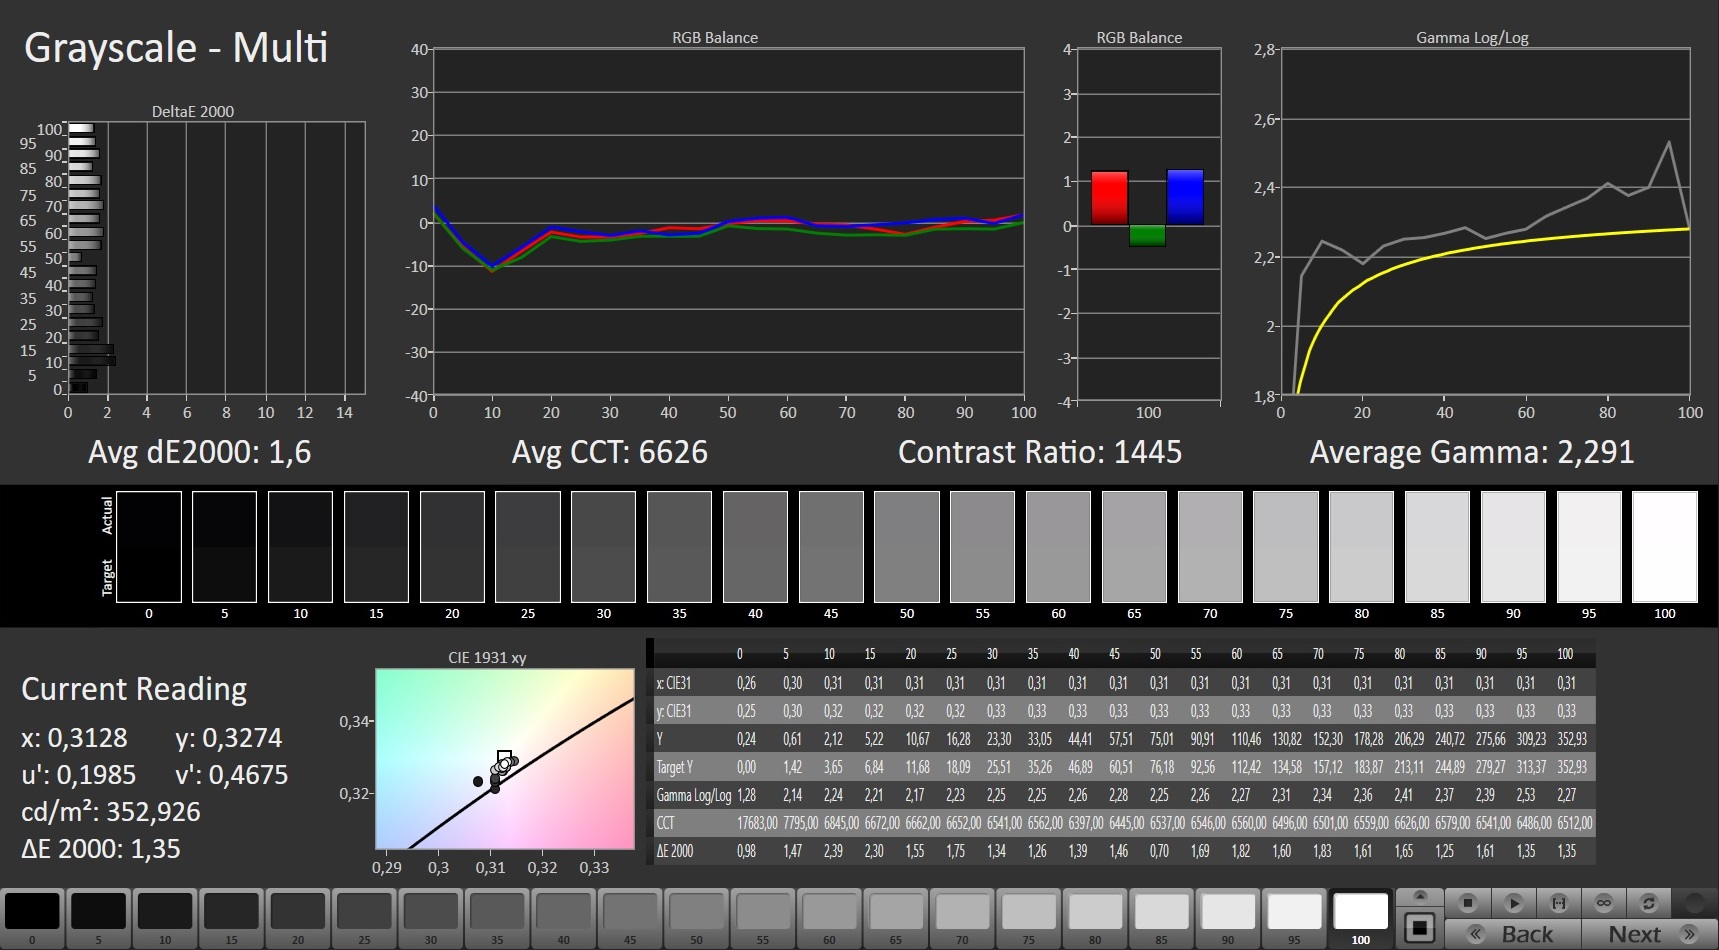
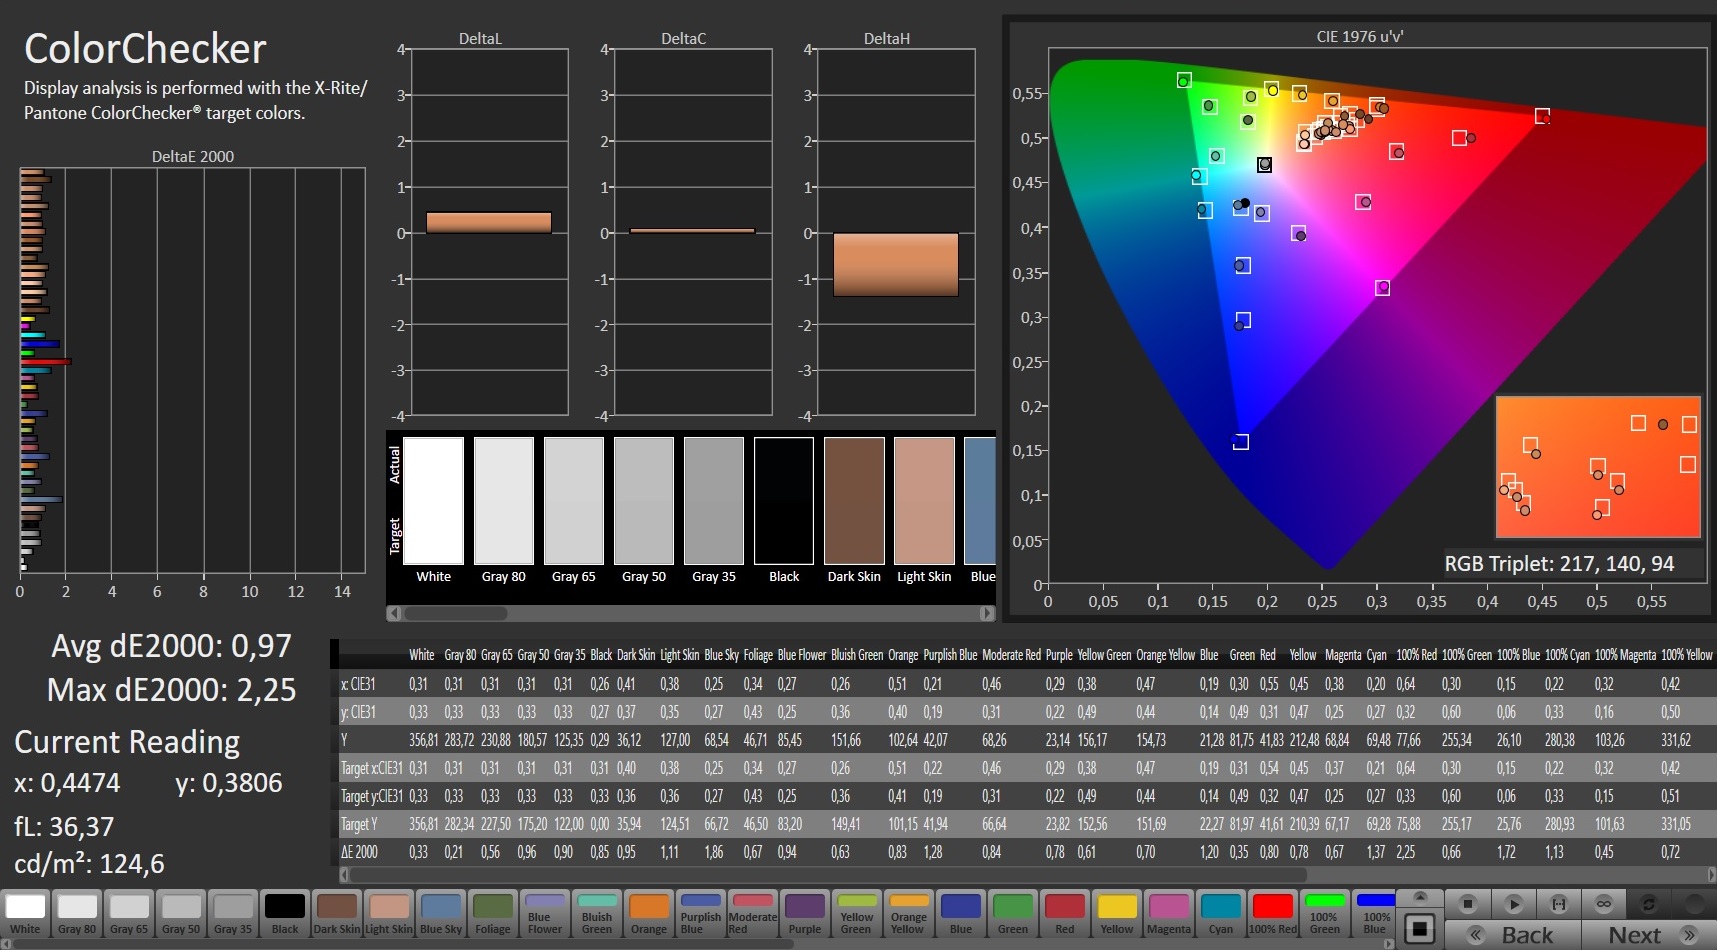
Tanto a relação de contraste (1408:1) quanto o brilho (334,2 cd/m²) são bastante bons. Os tempos de resposta do painel IPS de 15,6 polegadas estão em um bom nível, mas são ligeiramente inferiores aos tempos de resposta do painel de 300-Hz que o Lâmina 15 Avançado 2020 tinha. Positivo: a tela não exibe PWM tremeluzente
| |||||||||||||||||||||||||
iluminação: 94 %
iluminação com acumulador: 338 cd/m²
Contraste: 1408:1 (Preto: 0.24 cd/m²)
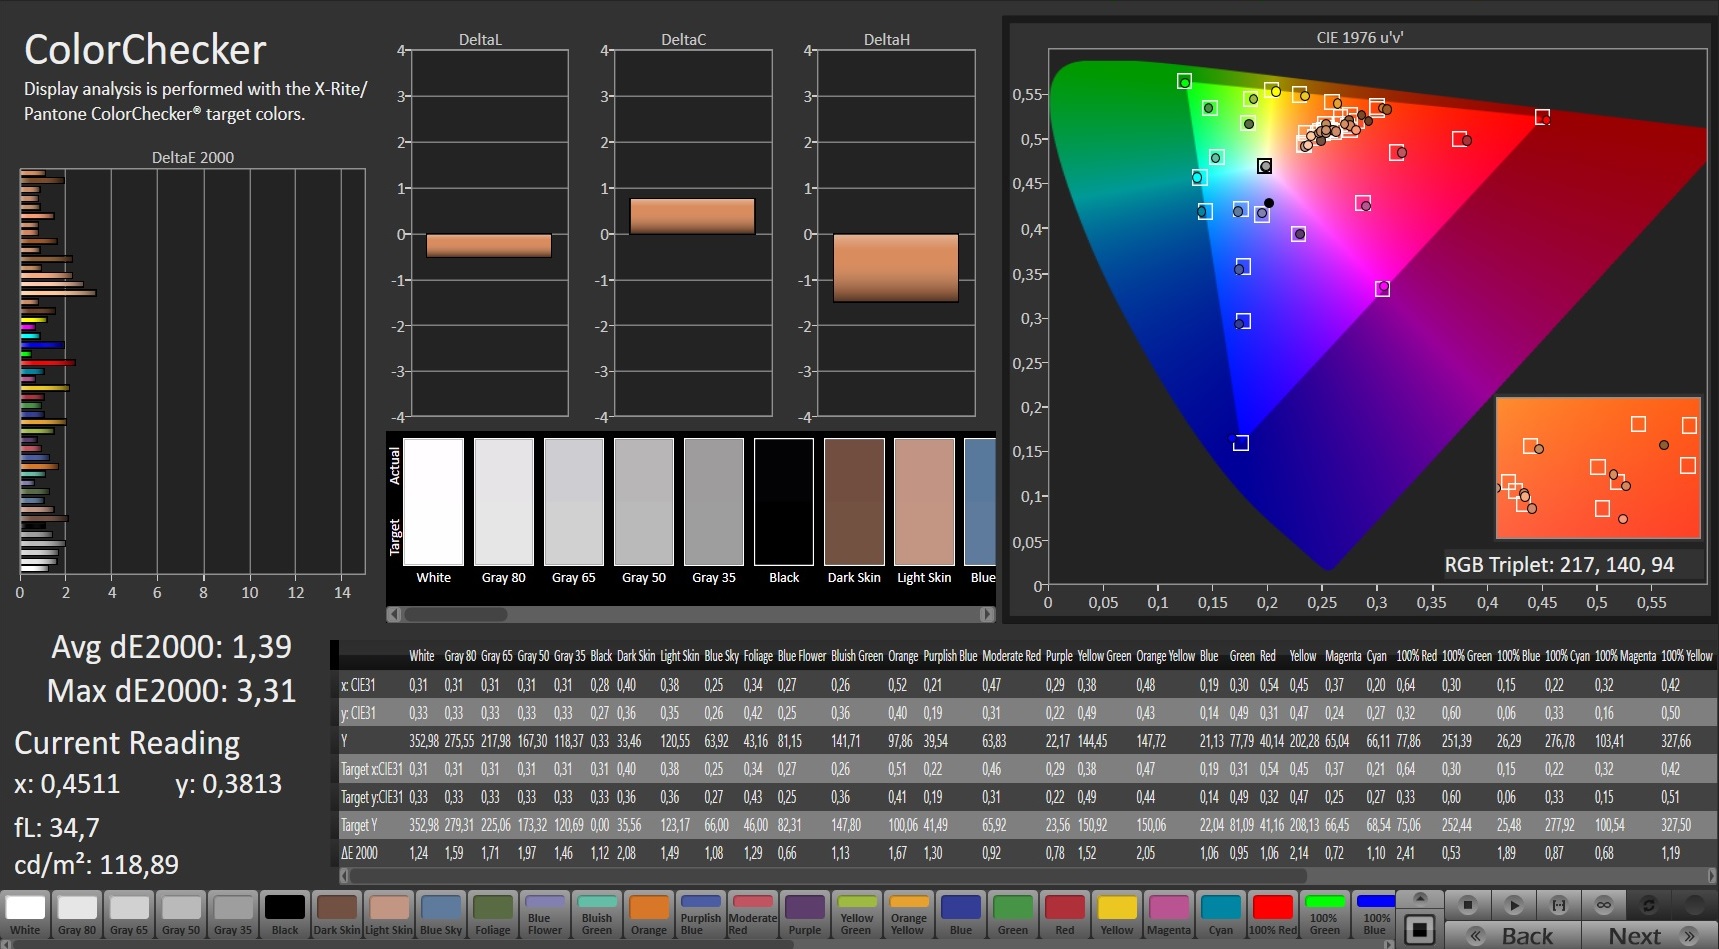
ΔE ColorChecker Calman: 1.39 | ∀{0.5-29.43 Ø4.72}
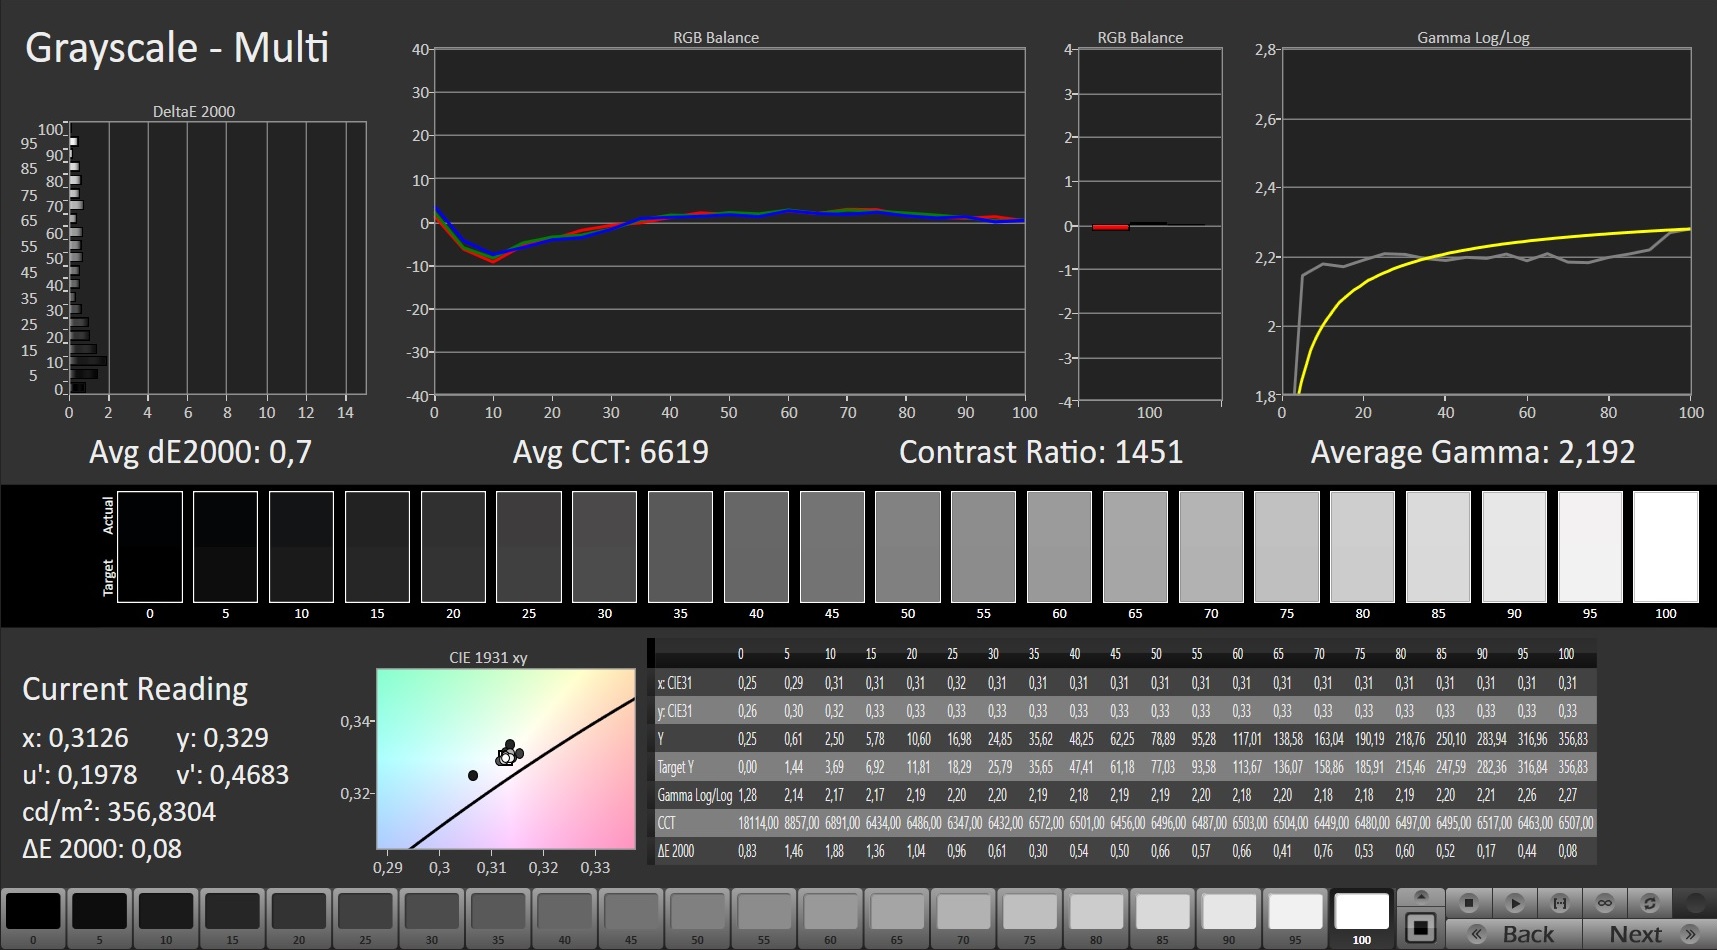
calibrated: 0.97
ΔE Greyscale Calman: 1.6 | ∀{0.09-98 Ø4.97}
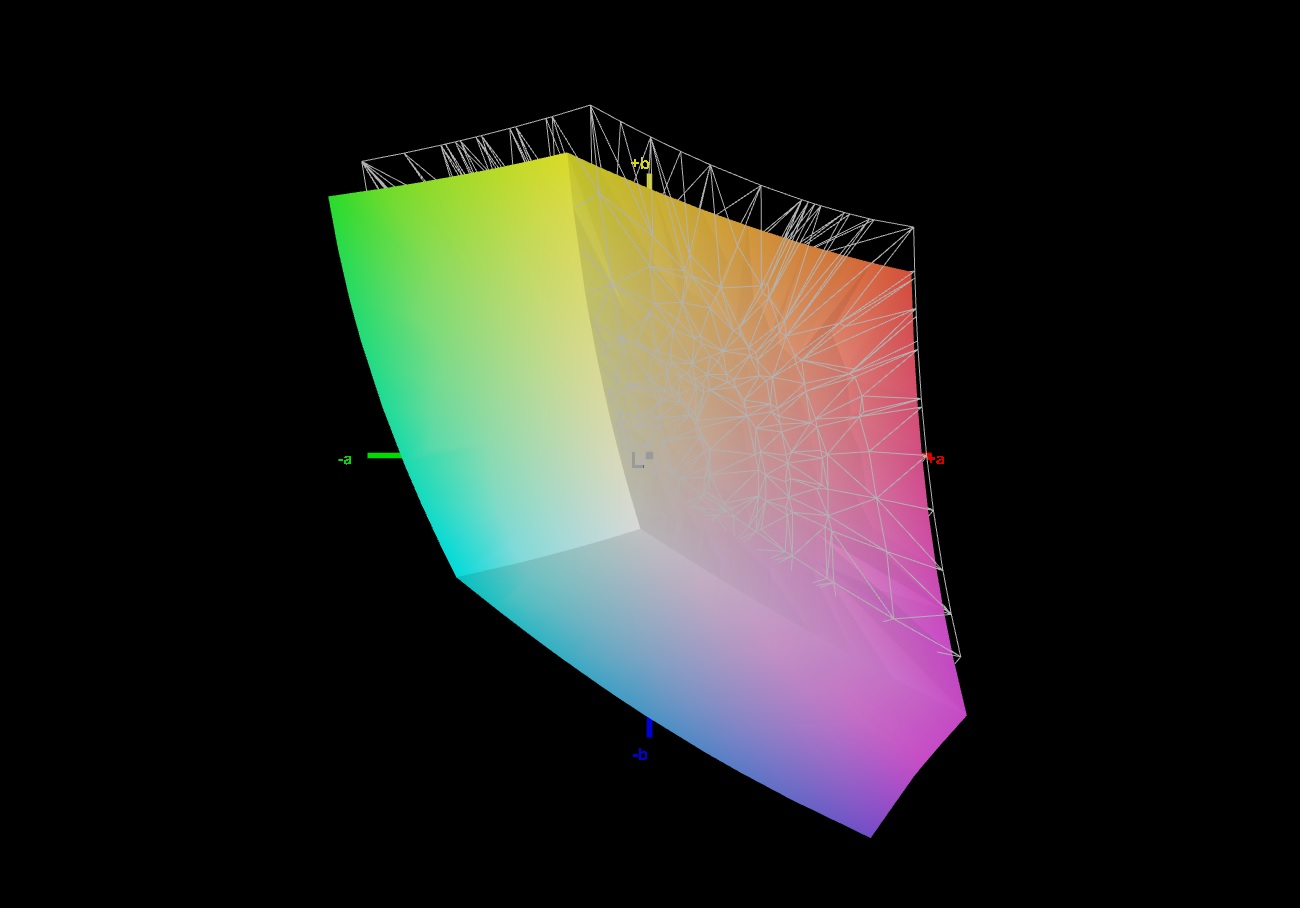
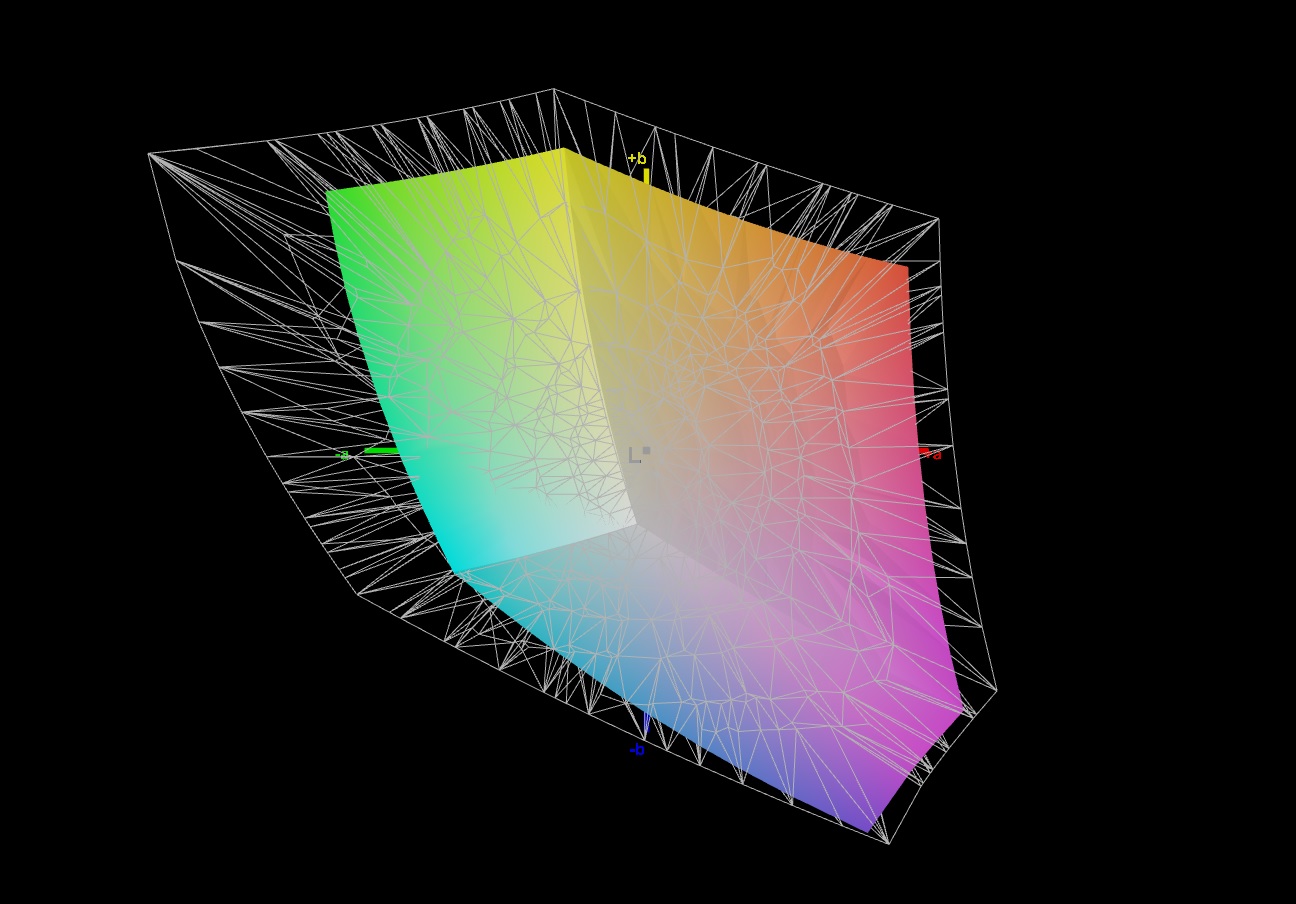
89% sRGB (Argyll 1.6.3 3D)
68% AdobeRGB 1998 (Argyll 1.6.3 3D)
68% AdobeRGB 1998 (Argyll 3D)
96.4% sRGB (Argyll 3D)
65.9% Display P3 (Argyll 3D)
Gamma: 2.291
CCT: 6626 K
| Razer Blade 15 Advanced Model Early 2021 TL156VDXP02-0, IPS, 1920x1080, 15.6" | Schenker XMG Pro 15 (Early 2021, RTX 3080) AU Optronics AUO7A8C (B156HAN12.0), IPS, 1920x1080, 15.6" | Asus ROG Zephyrus G15 GA503Q CMN N156KME-GNA (CMN152A), IPS-Level, 2560x1440, 15.6" | Aorus 15P XC Sharp LQ156M1JW03, IPS, 1920x1080, 15.6" | Lenovo Legion 7 15IMH05-81YT001VGE AUO048E, IPS, 1920x1080, 15.6" | Razer Blade 15 RTX 2080 Super Max-Q AU Optronics B156HAN12.0, IPS, 1920x1080, 15.6" | |
|---|---|---|---|---|---|---|
| Display | 4% | 26% | 2% | 5% | 5% | |
| Display P3 Coverage (%) | 65.9 | 69.2 5% | 97.3 48% | 67.2 2% | 70.3 7% | 70.2 7% |
| sRGB Coverage (%) | 96.4 | 99.7 3% | 99.9 4% | 98.7 2% | 99.4 3% | 99 3% |
| AdobeRGB 1998 Coverage (%) | 68 | 70.8 4% | 86.2 27% | 68.6 1% | 71.3 5% | 71.4 5% |
| Response Times | 41% | 19% | 19% | 37% | 38% | |
| Response Time Grey 50% / Grey 80% * (ms) | 16 ? | 3.6 ? 77% | 8.8 ? 45% | 11.2 ? 30% | 8 ? 50% | 6 ? 62% |
| Response Time Black / White * (ms) | 10.4 ? | 10 ? 4% | 11.2 ? -8% | 9.6 ? 8% | 8 ? 23% | 9 ? 13% |
| PWM Frequency (Hz) | 24040 ? | |||||
| Screen | -12% | -65% | -1% | -25% | -21% | |
| Brightness middle (cd/m²) | 338 | 327 -3% | 327 -3% | 298 -12% | 470 39% | 347 3% |
| Brightness (cd/m²) | 334 | 335 0% | 309 -7% | 278 -17% | 468 40% | 328 -2% |
| Brightness Distribution (%) | 94 | 89 -5% | 89 -5% | 88 -6% | 85 -10% | 89 -5% |
| Black Level * (cd/m²) | 0.24 | 0.22 8% | 0.33 -38% | 0.29 -21% | 0.21 12% | 0.285 -19% |
| Contrast (:1) | 1408 | 1486 6% | 991 -30% | 1028 -27% | 2238 59% | 1218 -13% |
| Colorchecker dE 2000 * | 1.39 | 2.18 -57% | 4.49 -223% | 0.96 31% | 3.28 -136% | 2.35 -69% |
| Colorchecker dE 2000 max. * | 3.31 | 4.24 -28% | 8.42 -154% | 3.22 3% | 7.31 -121% | 4.15 -25% |
| Colorchecker dE 2000 calibrated * | 0.97 | 1 -3% | 2.27 -134% | 0.83 14% | 0.8 18% | 1.16 -20% |
| Greyscale dE 2000 * | 1.6 | 2.6 -63% | 4.2 -163% | 1.3 19% | 4.49 -181% | 3.04 -90% |
| Gamma | 2.291 96% | 2.123 104% | 2.173 101% | 2.242 98% | 2.4 92% | 2.35 94% |
| CCT | 6626 98% | 6815 95% | 7014 93% | 6519 100% | 7438 87% | 6658 98% |
| Color Space (Percent of AdobeRGB 1998) (%) | 68 | 71 4% | 86 26% | 69 1% | 65 -4% | 65 -4% |
| Color Space (Percent of sRGB) (%) | 89 | 93 4% | 99 11% | 91 2% | 99 11% | 99 11% |
| Média Total (Programa/Configurações) | 11% /
-3% | -7% /
-38% | 7% /
2% | 6% /
-12% | 7% /
-9% |
* ... menor é melhor
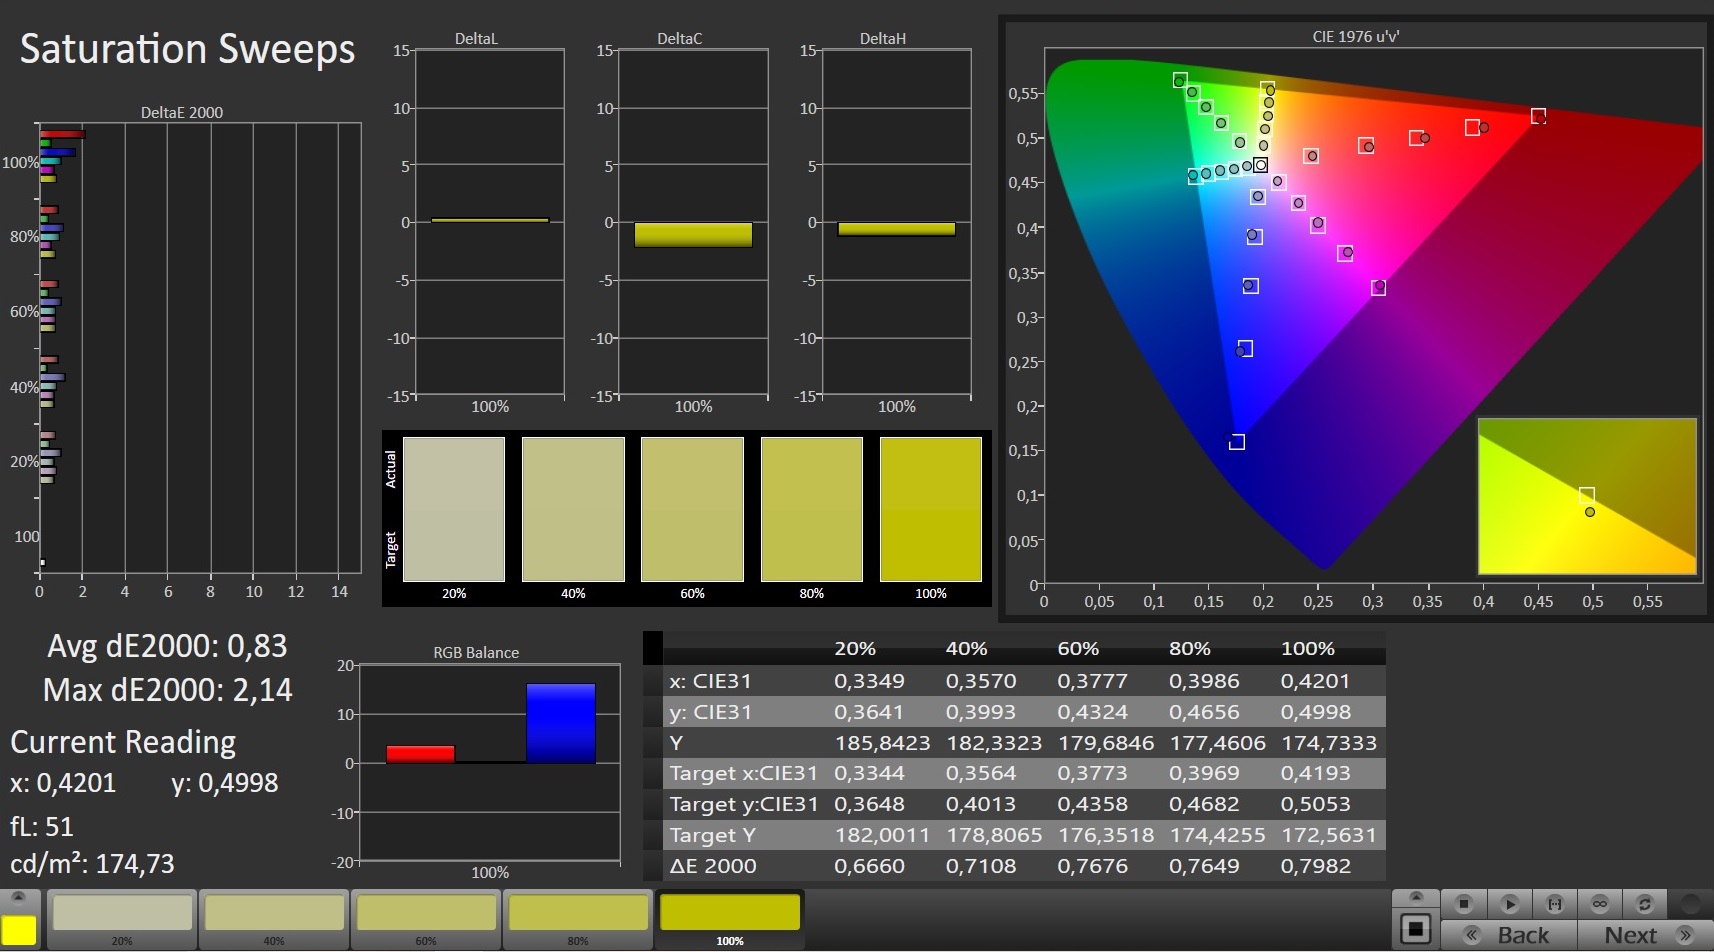
Diretamente fora da caixa, a tela é muito precisa em termos de cores. Os desvios de cor (DeltaE 2000 de 1,4) estão bem abaixo do limite perceptível (DeltaE 2000 de 3 ou mais). A tela não é manchada por um elenco azulado. A precisão da cor pode ser melhorada ainda mais através da calibração. Através da calibração, conseguimos baixar o DeltaE 2000 para 0,97 e melhorar o rastreamento em escala de cinza. O painel consegue cobrir 89% do sRGB e 68% do AdobeRGB.

Exibir tempos de resposta
| ↔ Tempo de resposta preto para branco | ||
|---|---|---|
| 10.4 ms ... ascensão ↗ e queda ↘ combinadas | ↗ 6 ms ascensão | 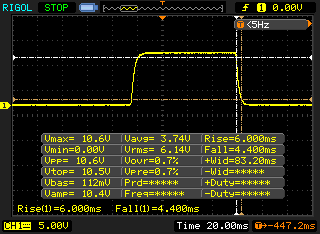 |
| ↘ 4.4 ms queda | ||
| A tela mostra boas taxas de resposta em nossos testes, mas pode ser muito lenta para jogadores competitivos. Em comparação, todos os dispositivos testados variam de 0.1 (mínimo) a 240 (máximo) ms. » 28 % de todos os dispositivos são melhores. Isso significa que o tempo de resposta medido é melhor que a média de todos os dispositivos testados (19.8 ms). | ||
| ↔ Tempo de resposta 50% cinza a 80% cinza | ||
| 16 ms ... ascensão ↗ e queda ↘ combinadas | ↗ 7.6 ms ascensão | 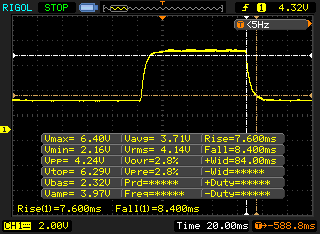 |
| ↘ 8.4 ms queda | ||
| A tela mostra boas taxas de resposta em nossos testes, mas pode ser muito lenta para jogadores competitivos. Em comparação, todos os dispositivos testados variam de 0.165 (mínimo) a 636 (máximo) ms. » 30 % de todos os dispositivos são melhores. Isso significa que o tempo de resposta medido é melhor que a média de todos os dispositivos testados (31 ms). | ||
Cintilação da tela / PWM (modulação por largura de pulso)
| Tela tremeluzindo / PWM não detectado | 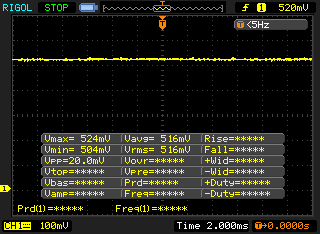 | ||
[pwm_comparison] Em comparação: 52 % de todos os dispositivos testados não usam PWM para escurecer a tela. Se PWM foi detectado, uma média de 7763 (mínimo: 5 - máximo: 343500) Hz foi medida. | |||
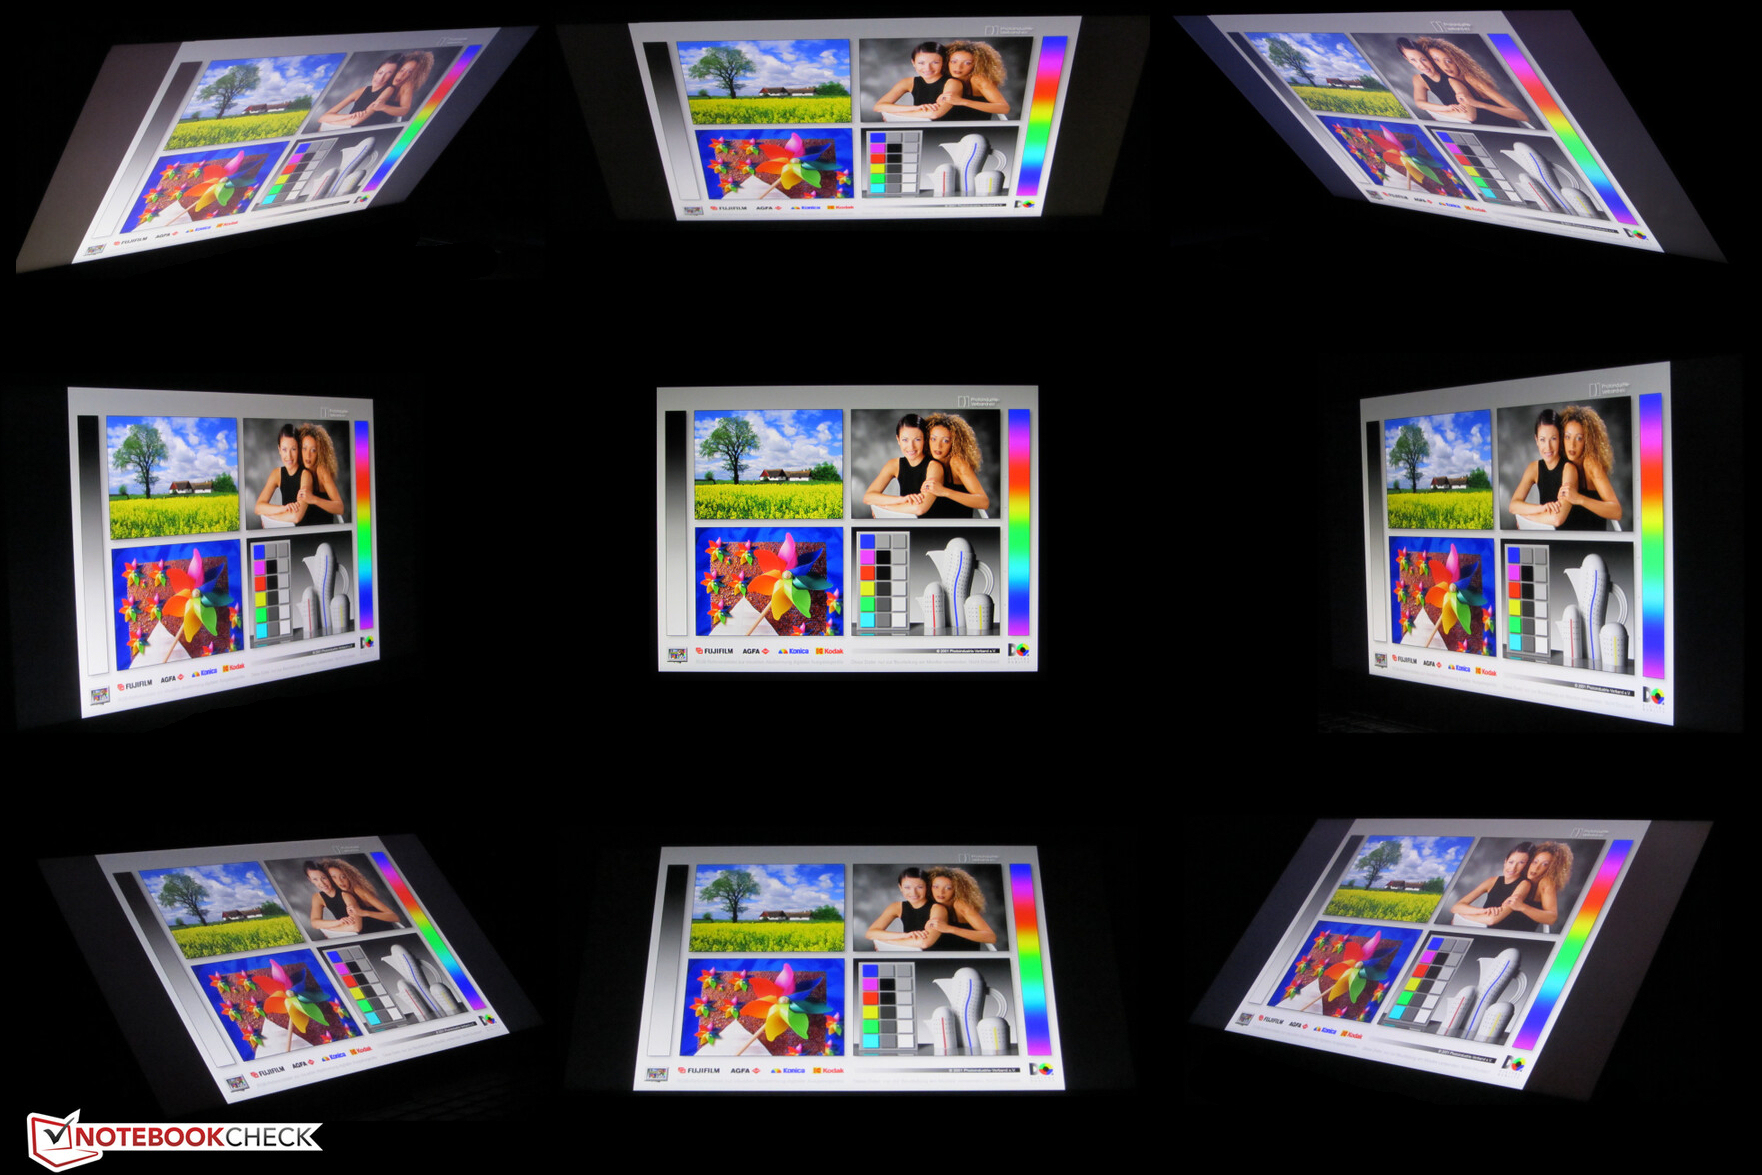
O painel IPS oferece ângulos de visão muito amplos, razão pela qual o conteúdo da tela pode ser lido a partir de qualquer posição. Ao ar livre, a tela é legível desde que o sol não brilhe muito

Desempenho - Suficiente para os próximos dois anos
O Razer Blade 15 Advanced (Início de 2021) é um caderno de 15,6 polegadas para jogos, que pode manusear facilmente todos os títulos modernos a 1080p
Configurações de revisão
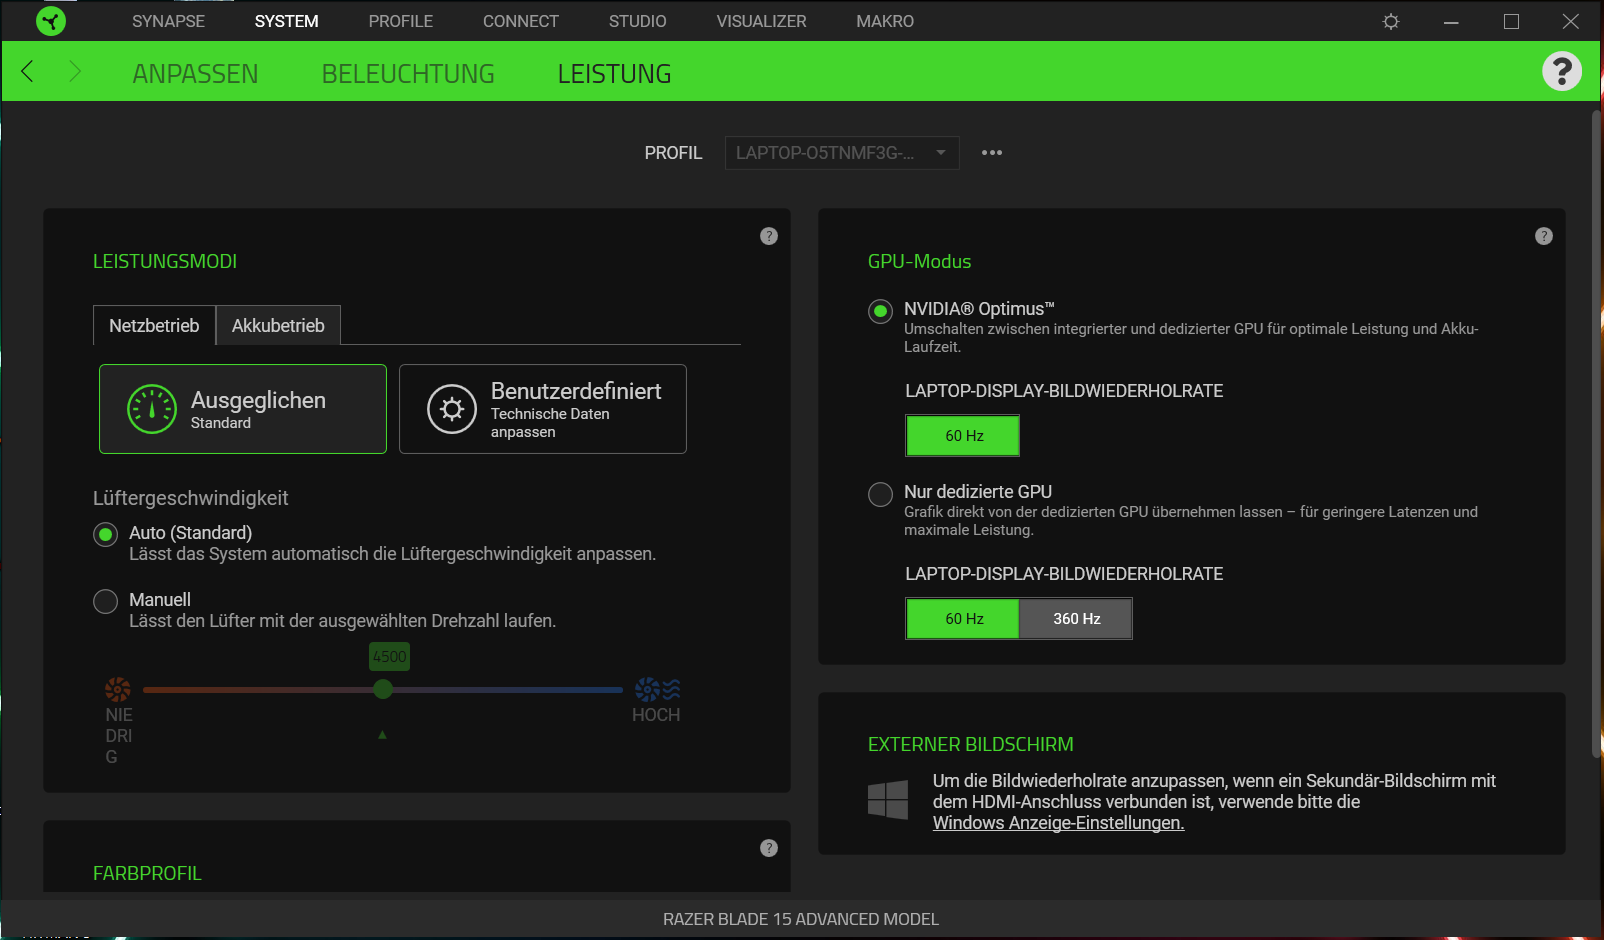
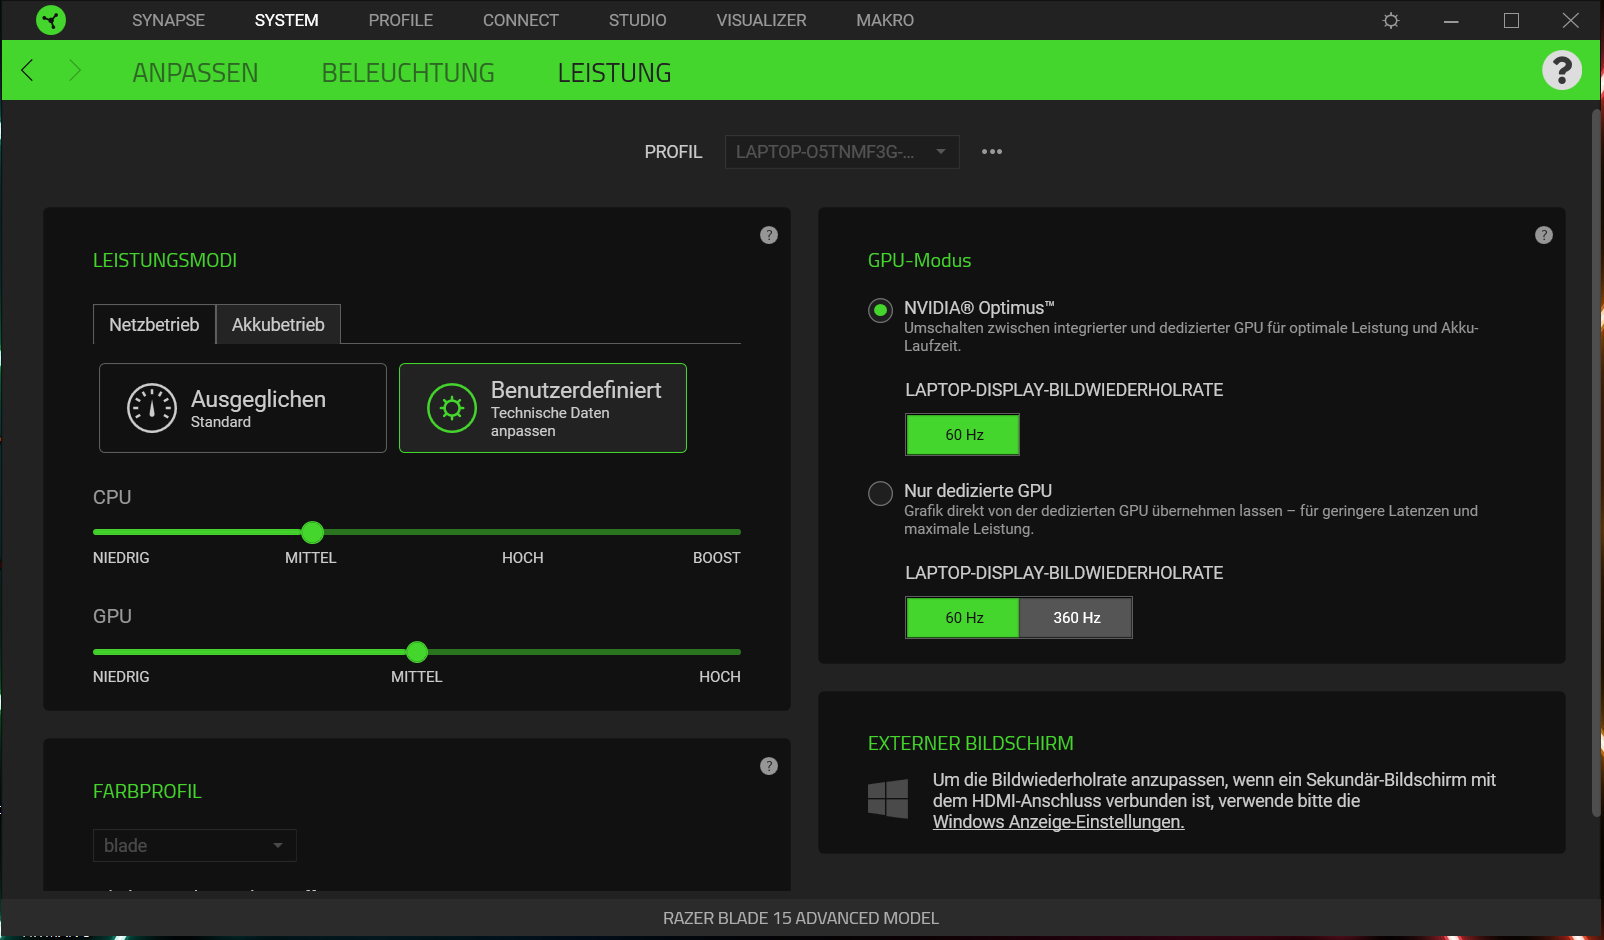
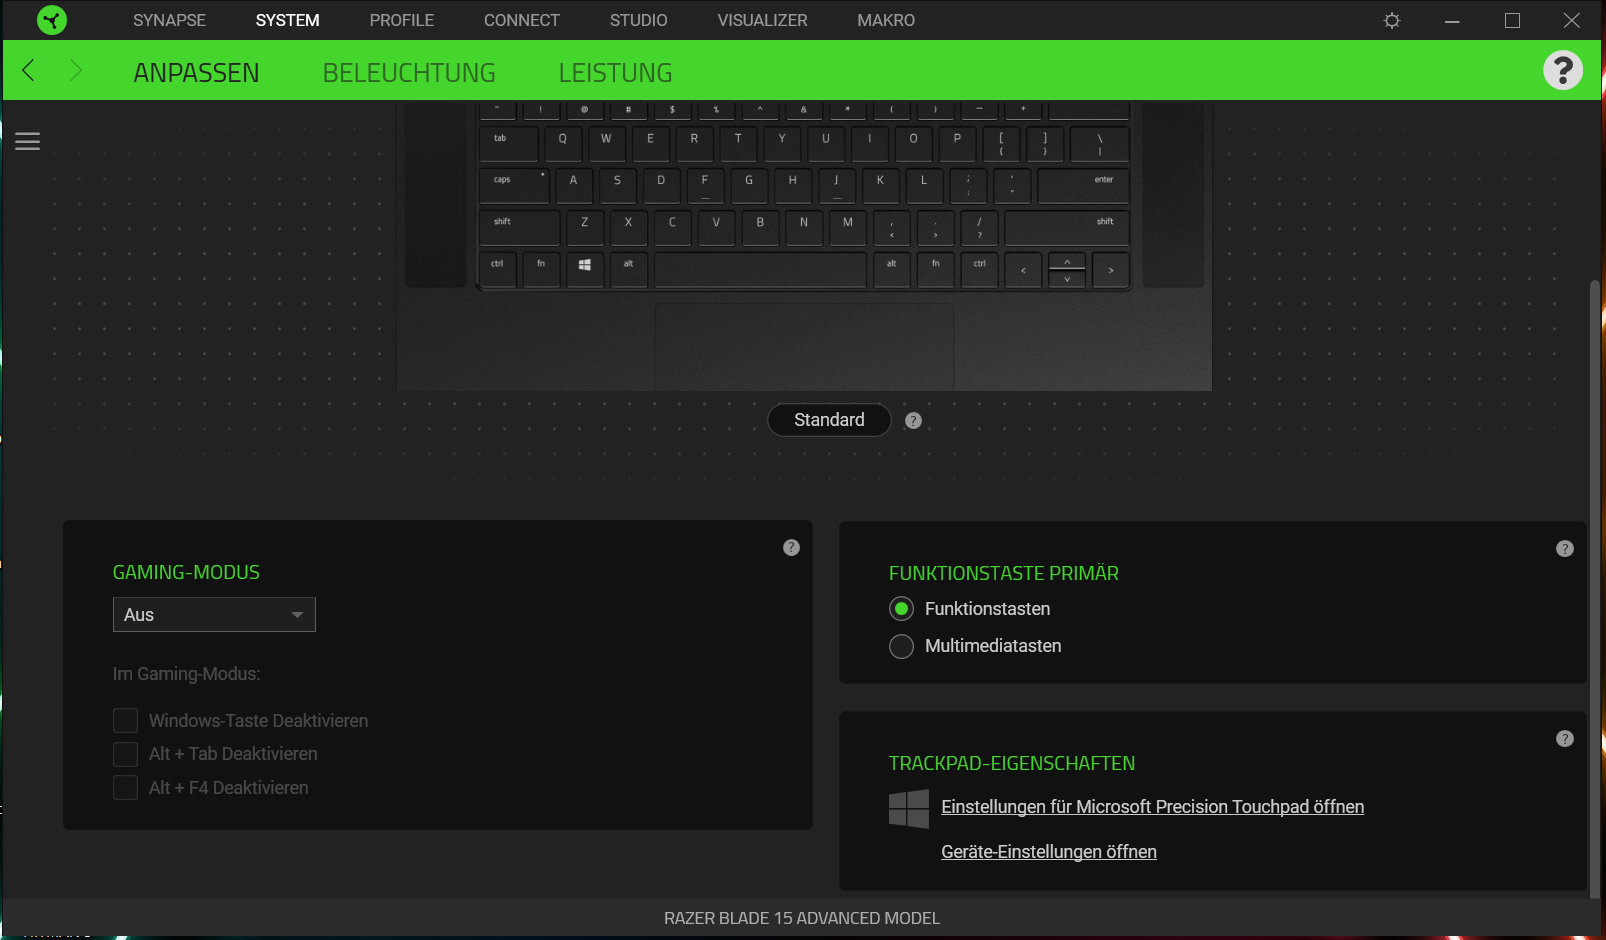
O utilitário Razer Synapse pré-instalado permite aos usuários configurar os perfis dos ventiladores e ajustar o desempenho da CPU e da GPU. Conduzimos a maioria de nossos benchmarks no modo Equilibrado. Além disso, ajustamos a velocidade dos ventiladores para Auto. Entretanto, conduzimos alguns de nossos benchmarks no modo Performance (desempenho máximo da CPU/GPU). Os resultados dos benchmarks, que conduzimos no modo Performance, são marcados com a palavra "max"
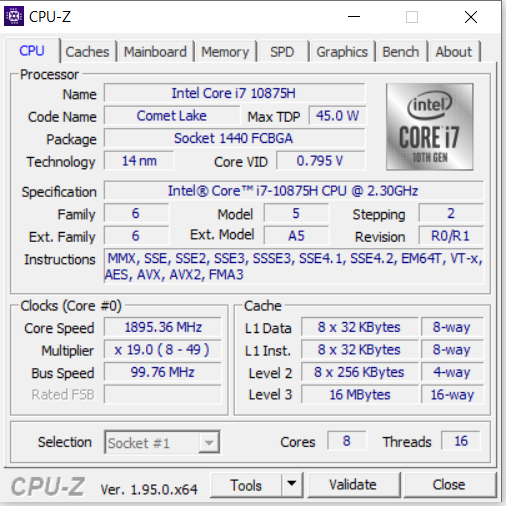
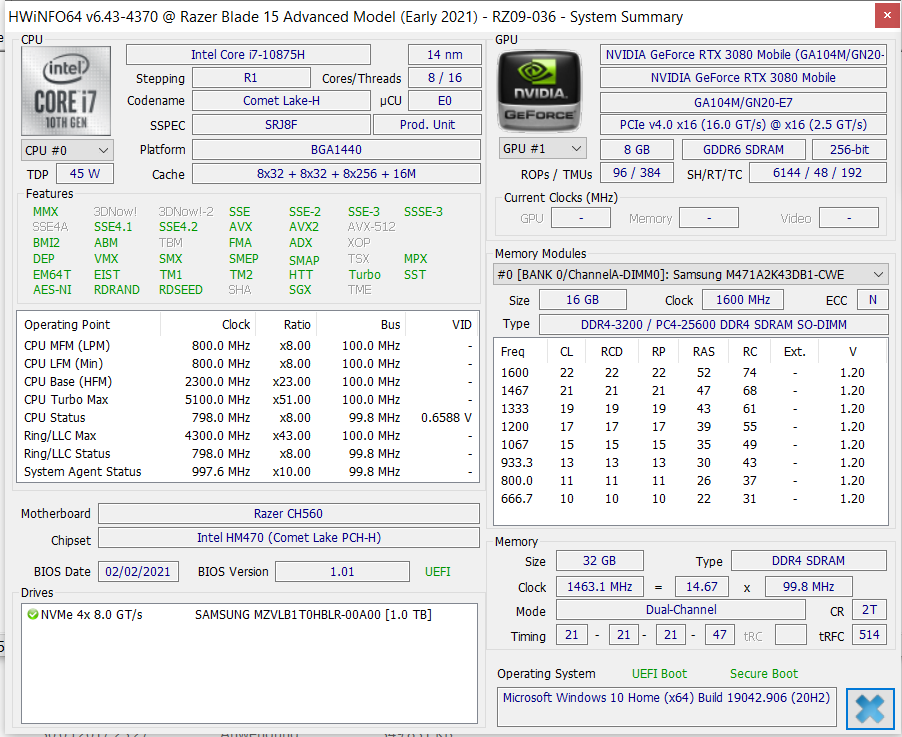
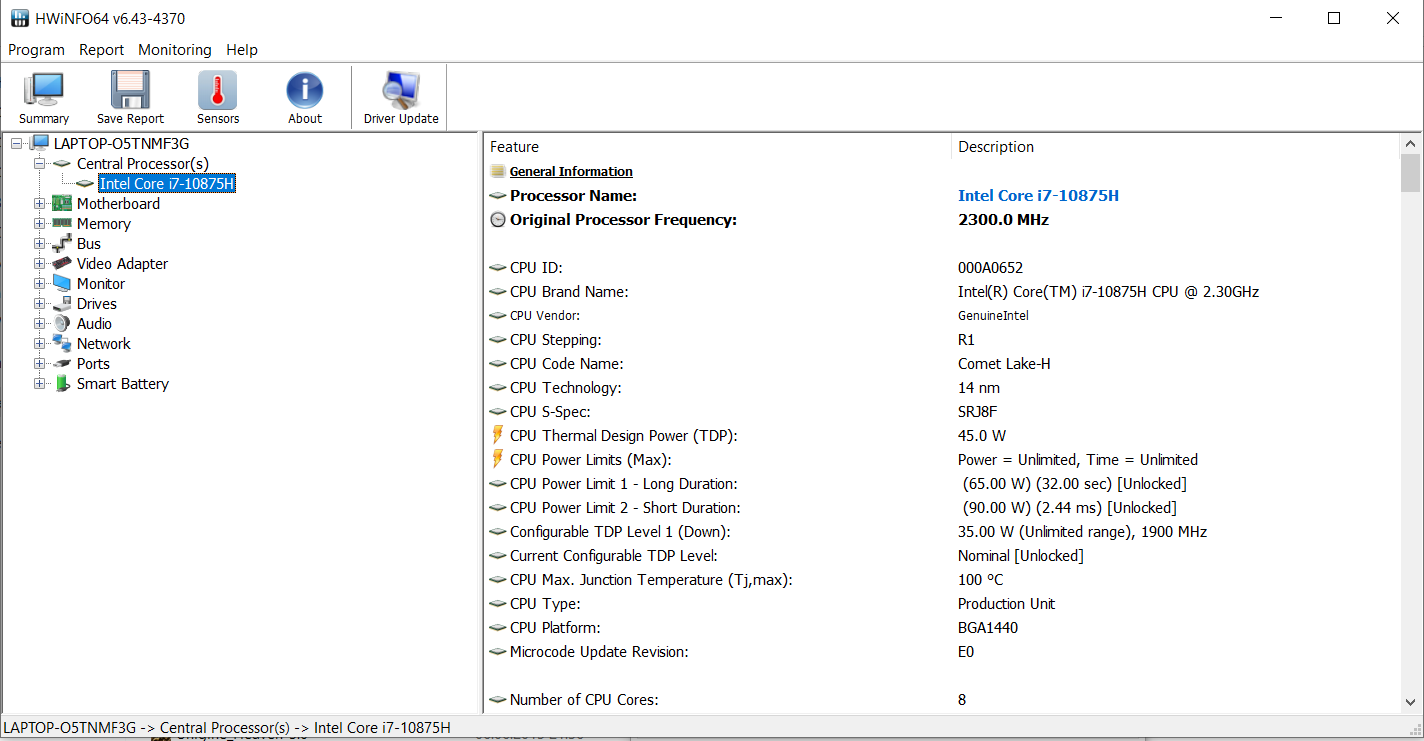
Processador
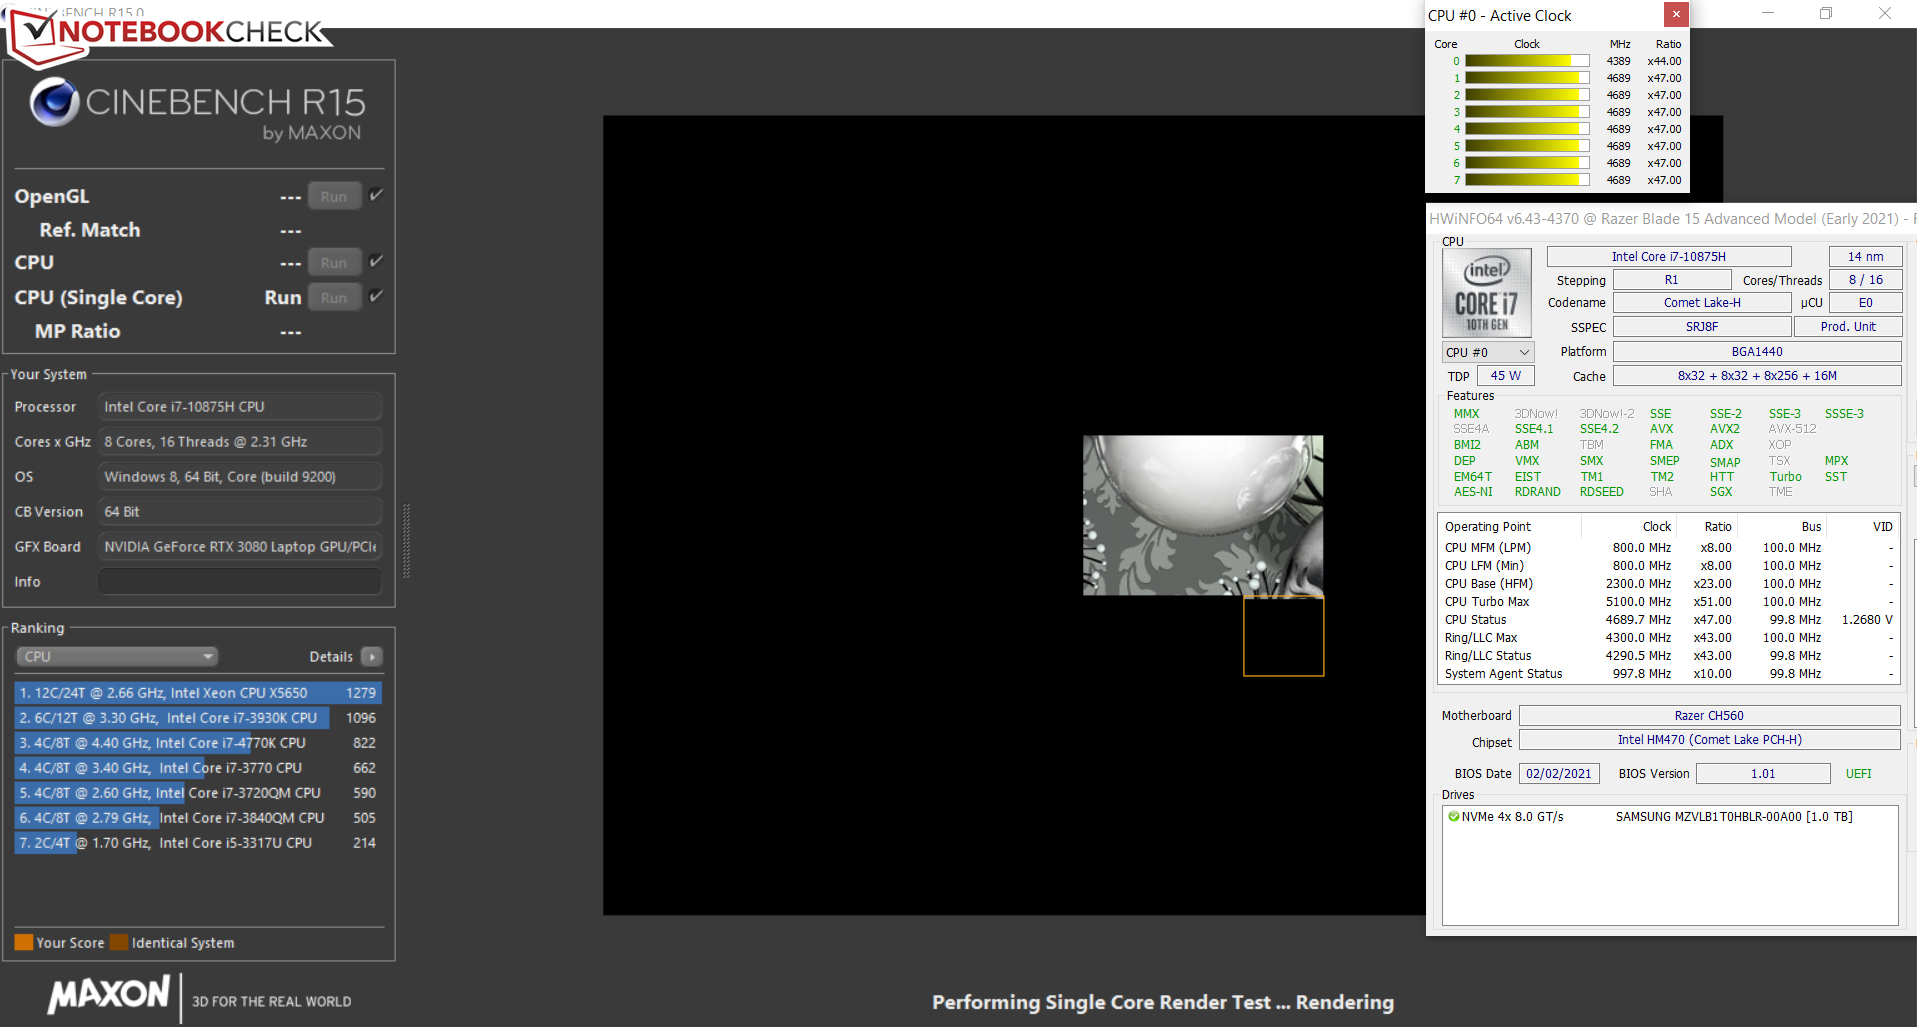
O Núcleo i7-10875H é um processador com base em Comet Lake-ocore com um relógio de base de 2,3 GHz. Tem um relógio de impulso de todos os núcleos de 4,3 GHz e um relógio de impulso de um único núcleo de 5,1 GHz. Suporta hipercorreção (dois núcleos por rosca).
No Cinebench R15, a CPU funciona em 2,8 a 3,4 GHz quando todos os núcleos são utilizados e em 4,2 a 4,8 GHz quando apenas um núcleo é utilizado. Na potência da bateria, a freqüência de todos os núcleos varia de 2 GHz a 2,2 GHz e a freqüência de um núcleo varia entre 1,9 e 3,8 GHz
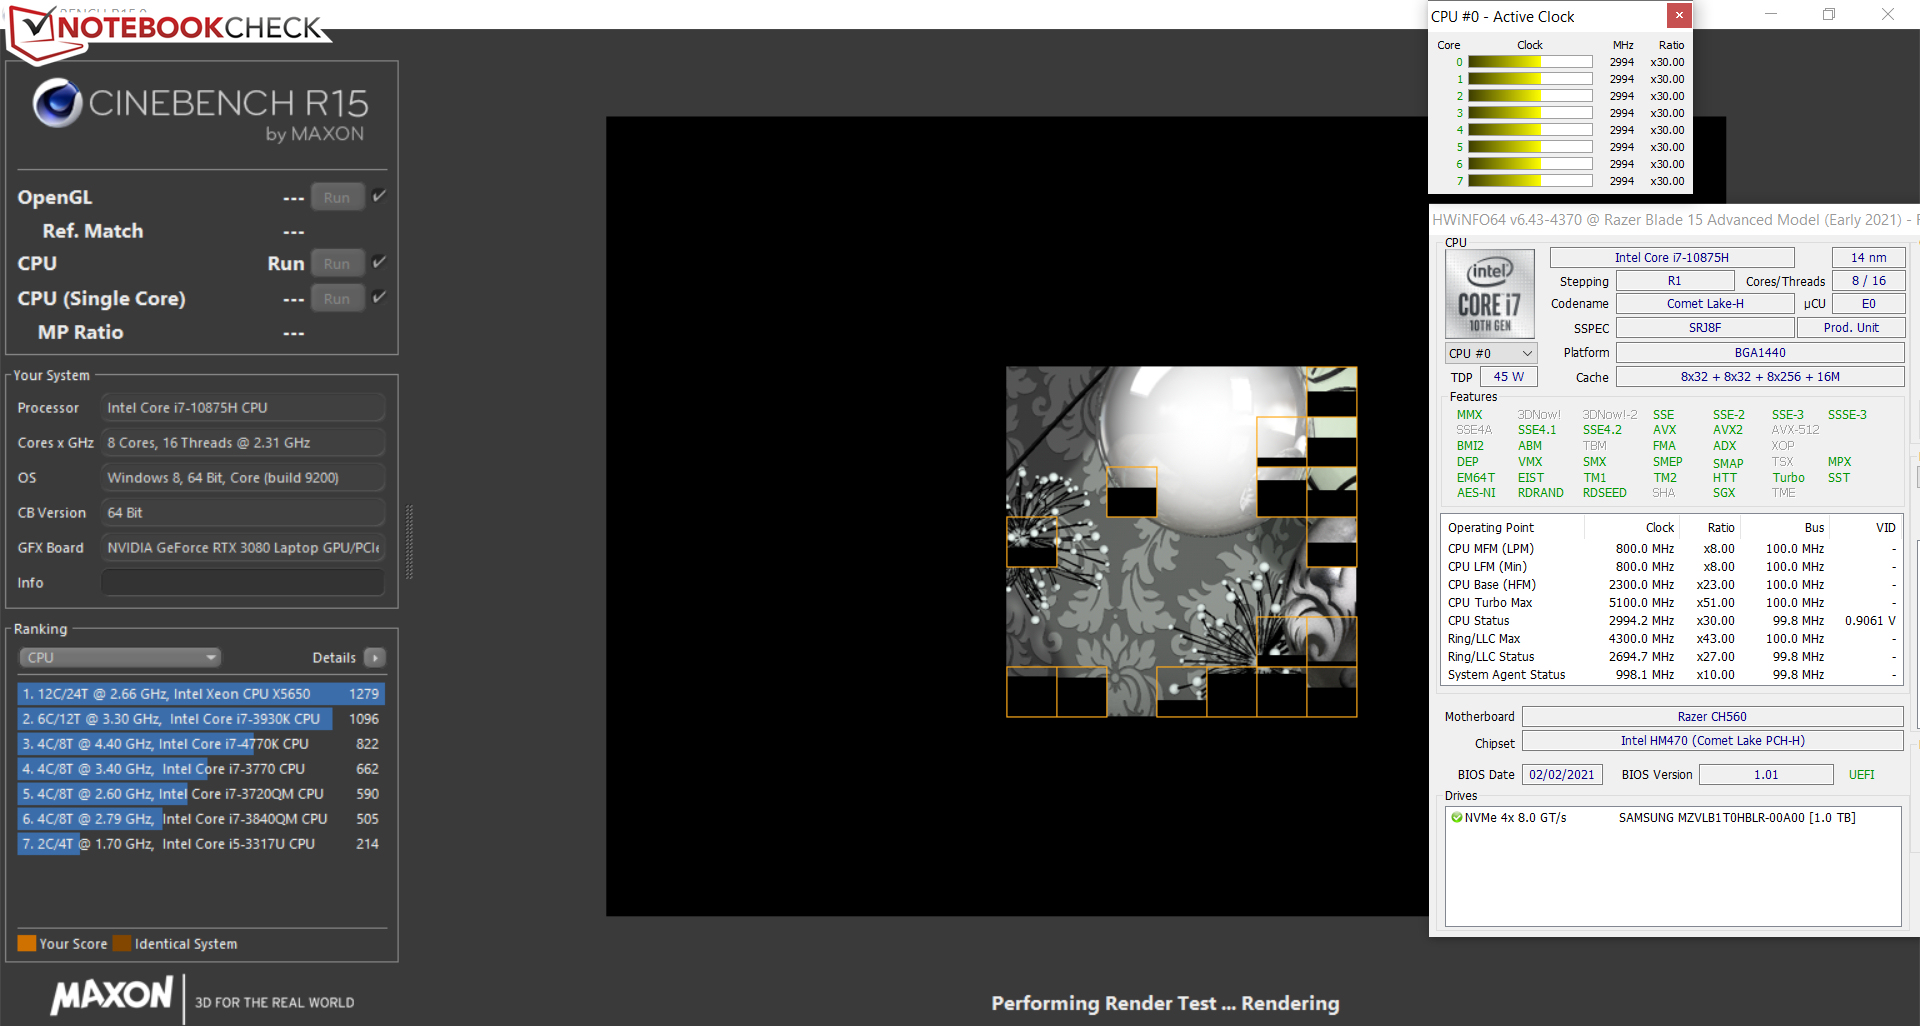
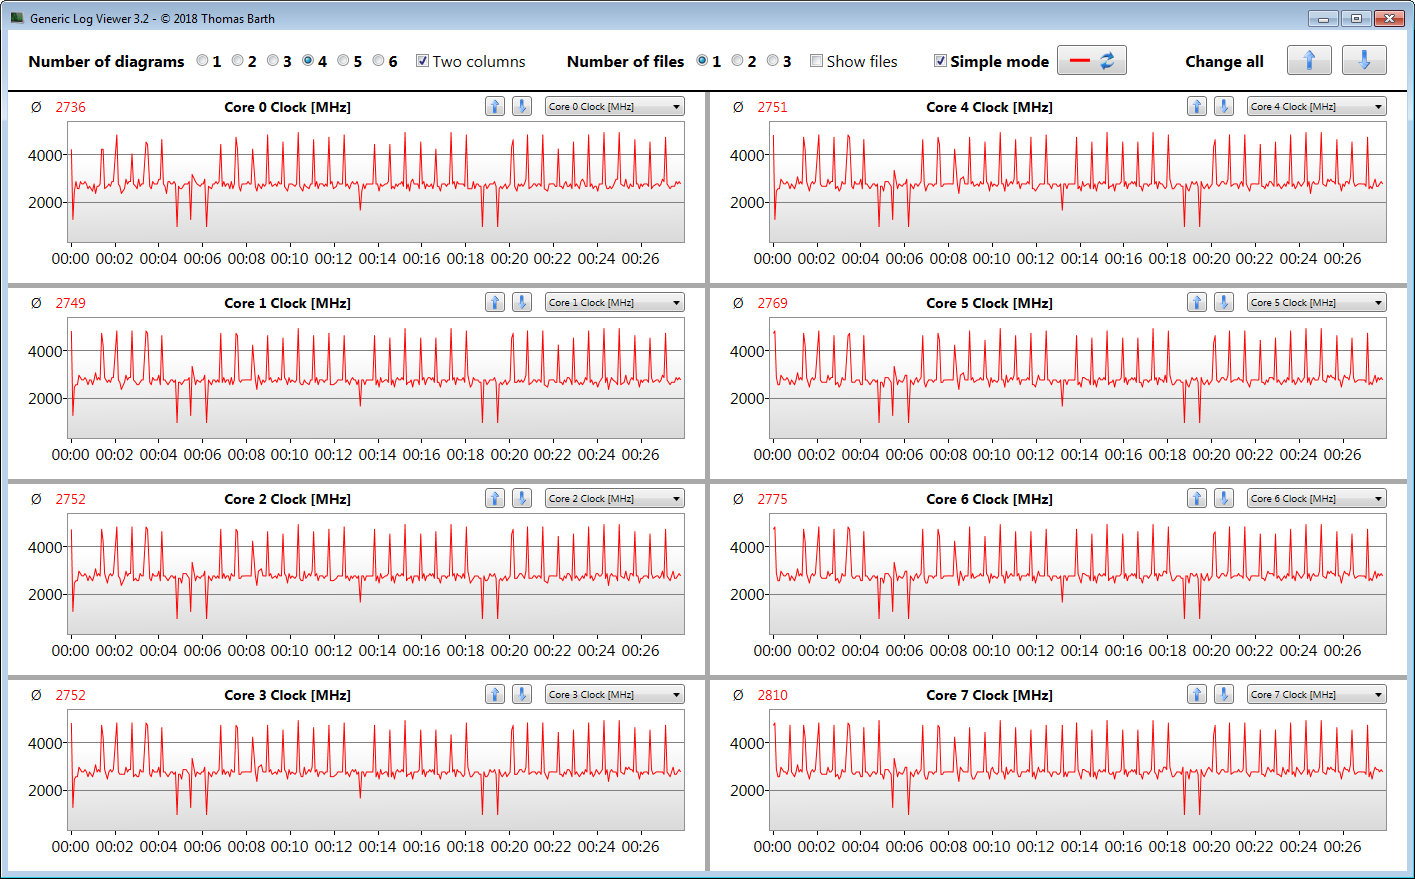
Verificamos se o Turbo boost pode ser usado durante um longo período de tempo, executando o benchmark Cinebench multi-core em um loop contínuo por 30 minutos. A tecnologia de turboalimentação é utilizada em um nível baixo. Entretanto, no modo "Performance", que você pode habilitar no utilitário "Synapse", o processador é capaz de manter relógios mais altos

| Cinebench R15 | |
| CPU Single 64Bit | |
| Média da turma Gaming (188.8 - 343, n=109, últimos 2 anos) | |
| Asus ROG Zephyrus G15 GA503Q | |
| Lenovo Legion 7 15IMH05-81YT001VGE | |
| Média Intel Core i7-10875H (190 - 220, n=37) | |
| Schenker XMG Pro 15 (Early 2021, RTX 3080) | |
| Aorus 15P XC | |
| Razer Blade 15 Advanced Model Early 2021 (Max.) | |
| Razer Blade 15 Advanced Model Early 2021 | |
| Razer Blade 15 RTX 2080 Super Max-Q | |
| CPU Multi 64Bit | |
| Média da turma Gaming (1578 - 6271, n=108, últimos 2 anos) | |
| Asus ROG Zephyrus G15 GA503Q | |
| Aorus 15P XC | |
| Schenker XMG Pro 15 (Early 2021, RTX 3080) | |
| Lenovo Legion 7 15IMH05-81YT001VGE | |
| Média Intel Core i7-10875H (1003 - 1833, n=38) | |
| Razer Blade 15 Advanced Model Early 2021 (Max.) | |
| Razer Blade 15 Advanced Model Early 2021 | |
| Razer Blade 15 RTX 2080 Super Max-Q | |
| Blender - v2.79 BMW27 CPU | |
| Razer Blade 15 Advanced Model Early 2021 | |
| Razer Blade 15 RTX 2080 Super Max-Q | |
| Média Intel Core i7-10875H (259 - 535, n=30) | |
| Razer Blade 15 Advanced Model Early 2021 (Max.) | |
| Schenker XMG Pro 15 (Early 2021, RTX 3080) | |
| Aorus 15P XC | |
| Lenovo Legion 7 15IMH05-81YT001VGE | |
| Asus ROG Zephyrus G15 GA503Q | |
| Média da turma Gaming (80 - 330, n=107, últimos 2 anos) | |
| Cinebench R20 | |
| CPU (Single Core) | |
| Média da turma Gaming (442 - 895, n=109, últimos 2 anos) | |
| Asus ROG Zephyrus G15 GA503Q | |
| Lenovo Legion 7 15IMH05-81YT001VGE | |
| Média Intel Core i7-10875H (430 - 524, n=32) | |
| Razer Blade 15 RTX 2080 Super Max-Q | |
| Razer Blade 15 Advanced Model Early 2021 (Max.) | |
| Razer Blade 15 Advanced Model Early 2021 | |
| Aorus 15P XC | |
| Schenker XMG Pro 15 (Early 2021, RTX 3080) | |
| CPU (Multi Core) | |
| Média da turma Gaming (4029 - 16108, n=109, últimos 2 anos) | |
| Asus ROG Zephyrus G15 GA503Q | |
| Lenovo Legion 7 15IMH05-81YT001VGE | |
| Aorus 15P XC | |
| Média Intel Core i7-10875H (1986 - 4176, n=32) | |
| Schenker XMG Pro 15 (Early 2021, RTX 3080) | |
| Razer Blade 15 Advanced Model Early 2021 (Max.) | |
| Razer Blade 15 RTX 2080 Super Max-Q | |
| Razer Blade 15 Advanced Model Early 2021 | |
| HWBOT x265 Benchmark v2.2 - 4k Preset | |
| Média da turma Gaming (11.5 - 44.3, n=108, últimos 2 anos) | |
| Asus ROG Zephyrus G15 GA503Q | |
| Lenovo Legion 7 15IMH05-81YT001VGE | |
| Aorus 15P XC | |
| Razer Blade 15 Advanced Model Early 2021 (Max.) | |
| Média Intel Core i7-10875H (7.27 - 14.1, n=27) | |
| Schenker XMG Pro 15 (Early 2021, RTX 3080) | |
| Razer Blade 15 RTX 2080 Super Max-Q | |
| Razer Blade 15 Advanced Model Early 2021 | |
| LibreOffice - 20 Documents To PDF | |
| Schenker XMG Pro 15 (Early 2021, RTX 3080) | |
| Razer Blade 15 Advanced Model Early 2021 | |
| Asus ROG Zephyrus G15 GA503Q | |
| Lenovo Legion 7 15IMH05-81YT001VGE | |
| Aorus 15P XC | |
| Média Intel Core i7-10875H (30.2 - 84.3, n=30) | |
| Média da turma Gaming (19 - 88.8, n=108, últimos 2 anos) | |
| Razer Blade 15 RTX 2080 Super Max-Q | |
| Razer Blade 15 Advanced Model Early 2021 (Max.) | |
| R Benchmark 2.5 - Overall mean | |
| Schenker XMG Pro 15 (Early 2021, RTX 3080) | |
| Aorus 15P XC | |
| Média Intel Core i7-10875H (0.546 - 0.662, n=29) | |
| Razer Blade 15 Advanced Model Early 2021 | |
| Razer Blade 15 RTX 2080 Super Max-Q | |
| Razer Blade 15 Advanced Model Early 2021 (Max.) | |
| Lenovo Legion 7 15IMH05-81YT001VGE | |
| Asus ROG Zephyrus G15 GA503Q | |
| Média da turma Gaming (0.3439 - 0.759, n=109, últimos 2 anos) | |
* ... menor é melhor
Desempenho do sistema
O sistema sempre se sente responsivo. Não encontramos nenhum problema. O laptop Razer oferece desempenho suficiente para todas as aplicações atuais.
| PCMark 8 Home Score Accelerated v2 | 4090 pontos | |
| PCMark 8 Creative Score Accelerated v2 | 5339 pontos | |
| PCMark 8 Work Score Accelerated v2 | 5555 pontos | |
| PCMark 10 Score | 6167 pontos | |
Ajuda | ||
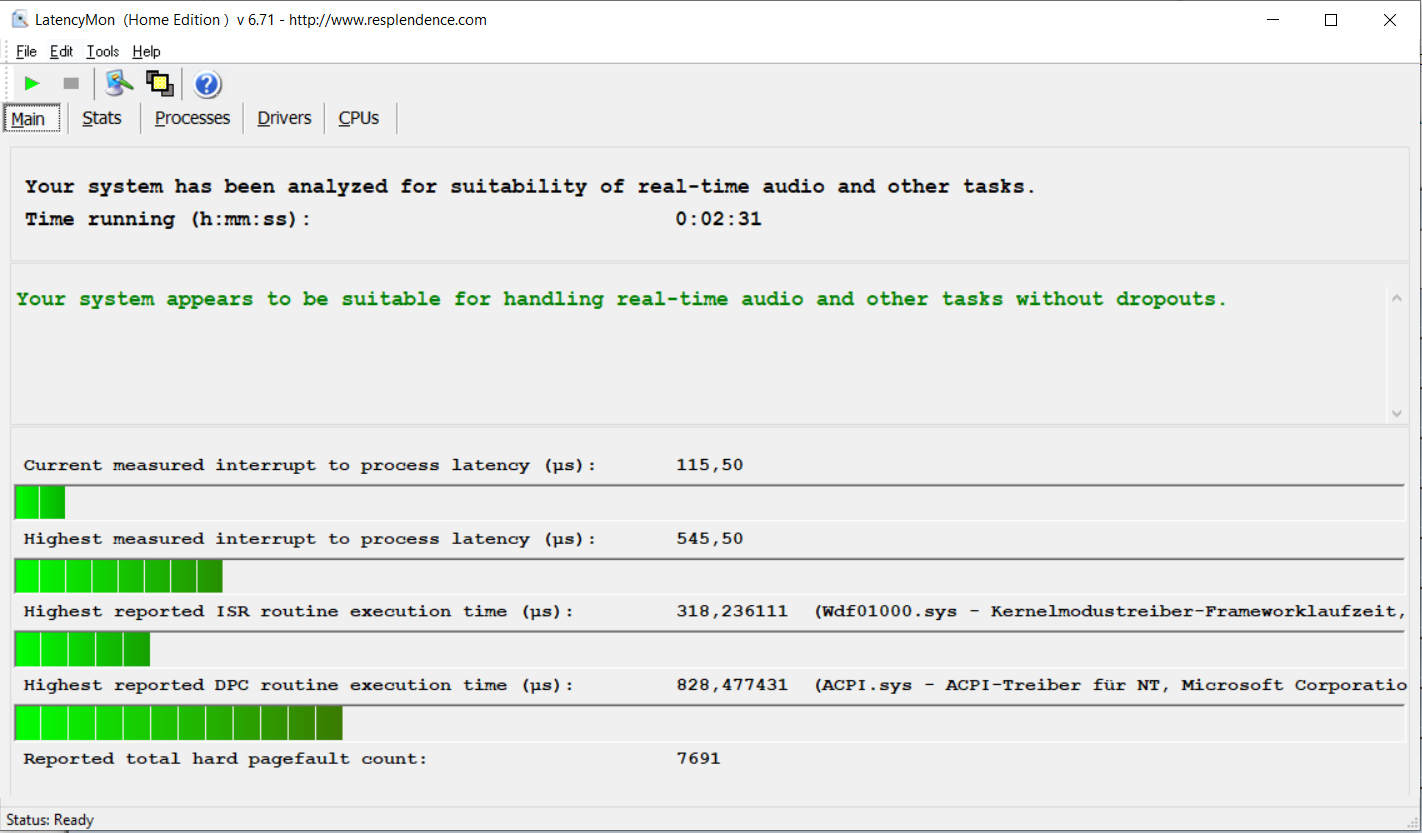
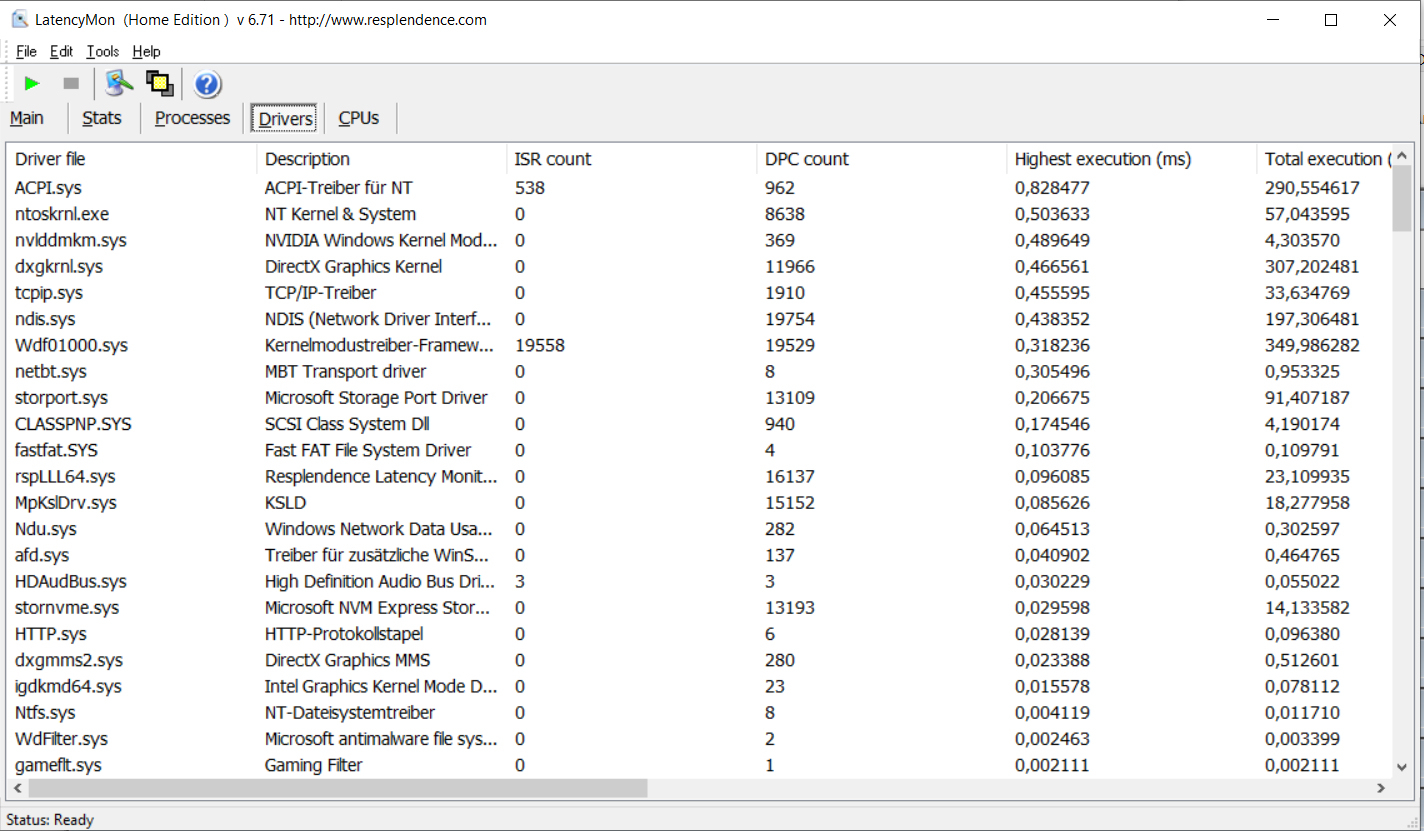
Latências DPC
Nosso teste de latência padronizado (web-surfing, reprodução de vídeo 4K, Prime95) não revelou nenhum problema. O sistema é adequado para trabalhar com áudio e vídeo em tempo real
| DPC Latencies / LatencyMon - interrupt to process latency (max), Web, Youtube, Prime95 | |
| Lenovo Legion 7 15IMH05-81YT001VGE | |
| Aorus 15P XC | |
| Razer Blade 15 RTX 2080 Super Max-Q | |
| Schenker XMG Pro 15 (Early 2021, RTX 3080) | |
| Razer Blade 15 Advanced Model Early 2021 | |
| Asus ROG Zephyrus G15 GA503Q | |
* ... menor é melhor
Dispositivos de armazenamento
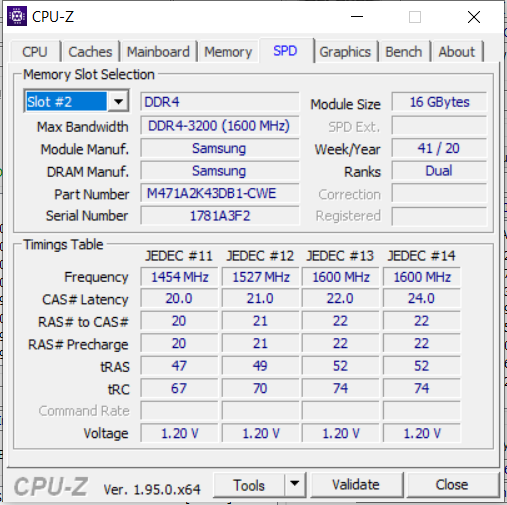
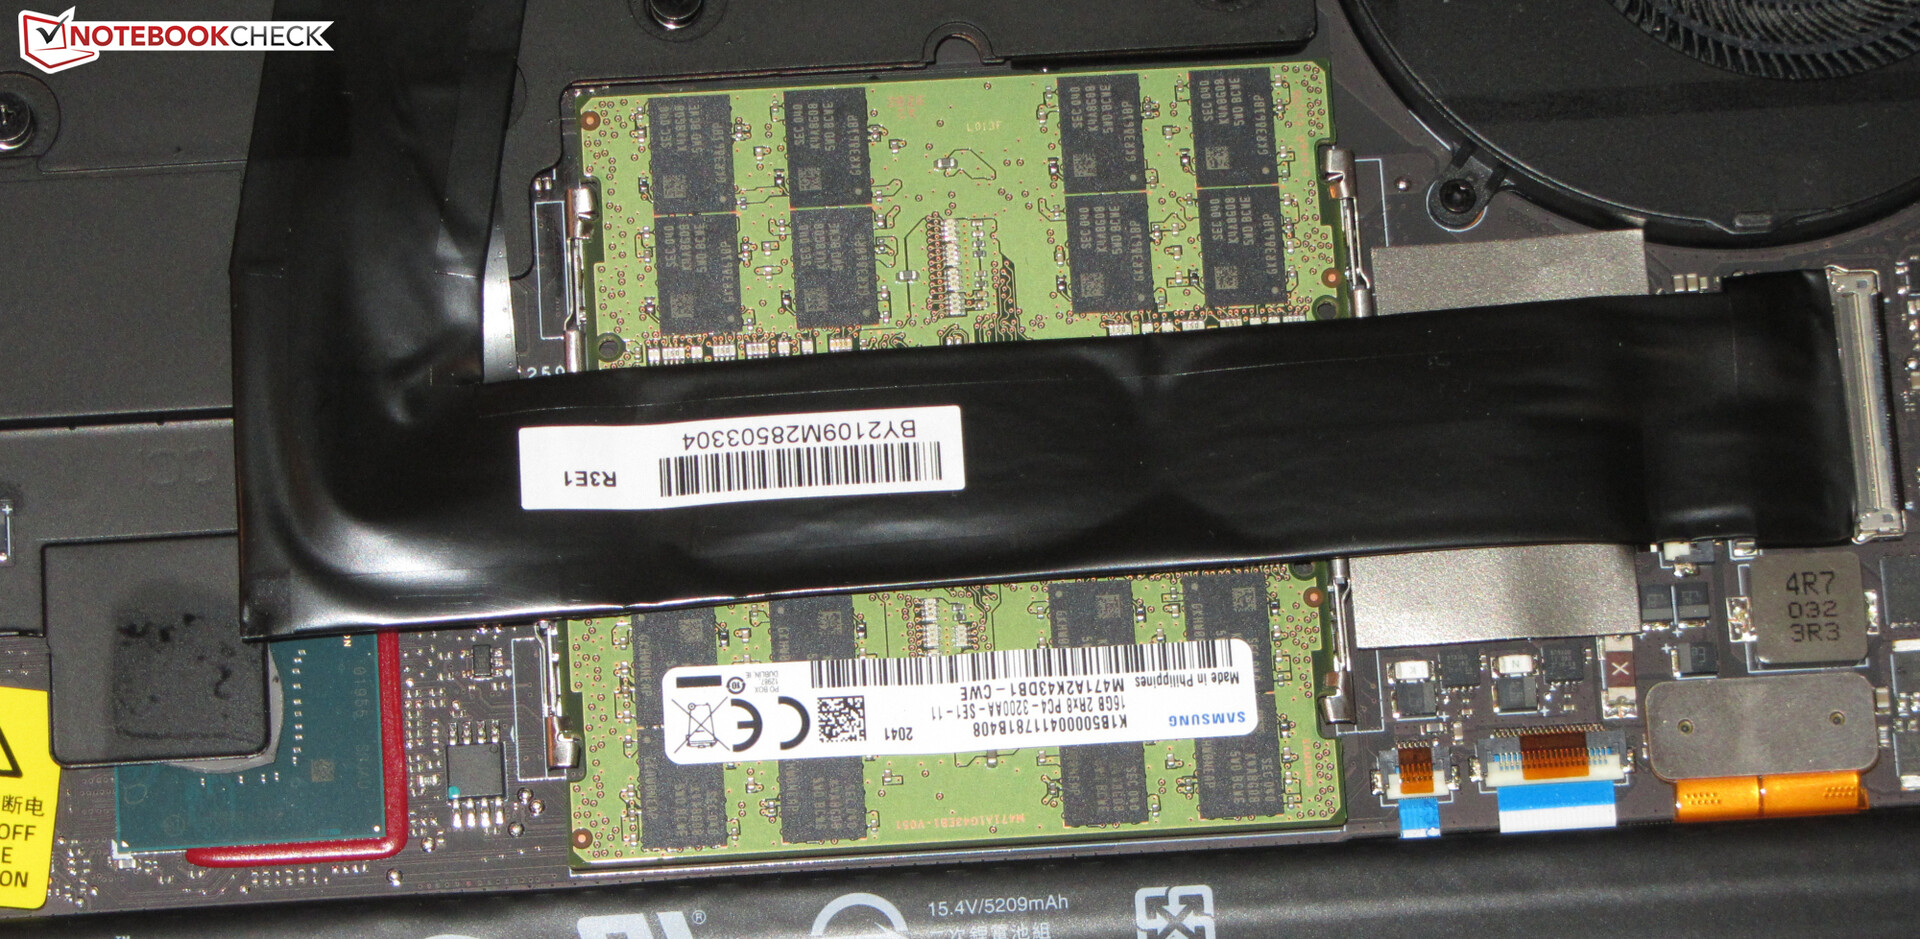
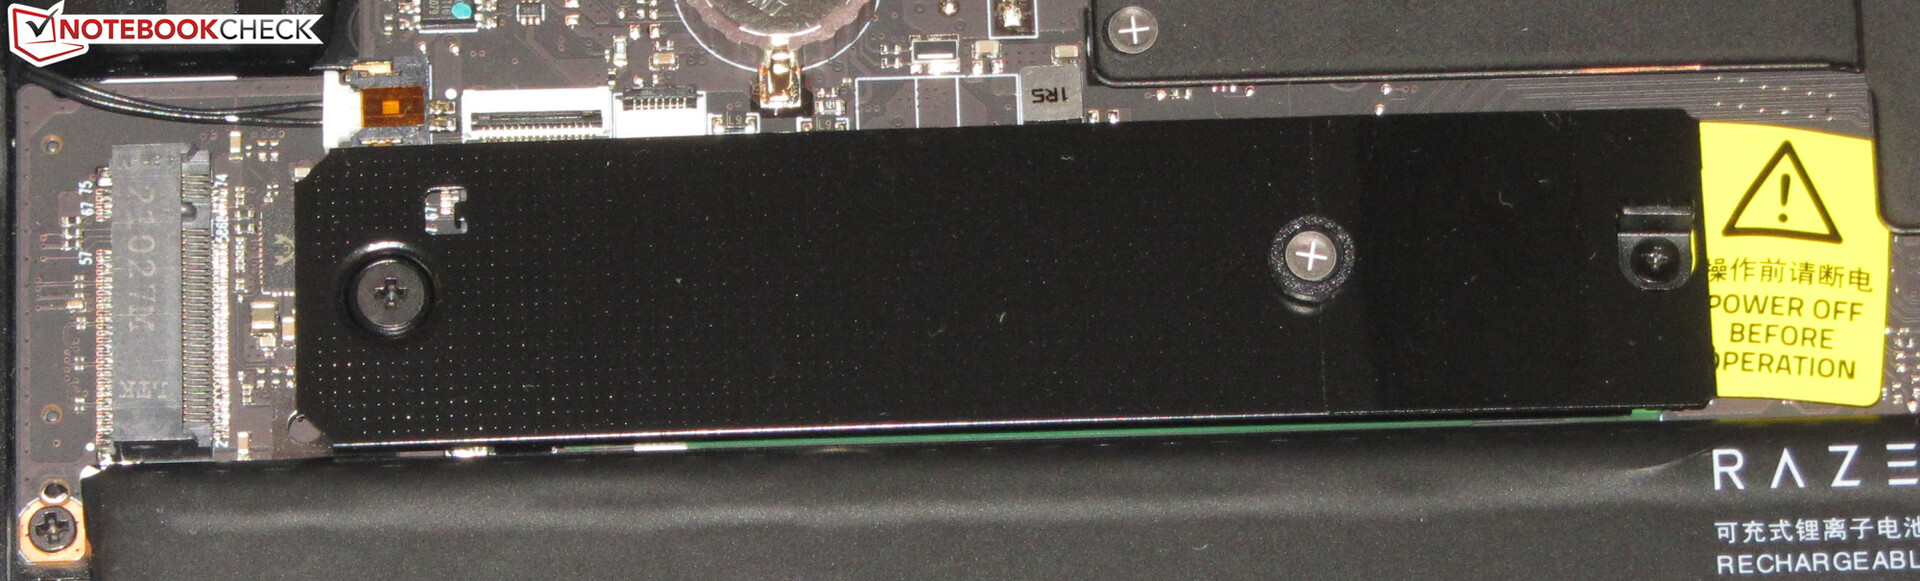
Um SSD NVMe de 1 TB (M.2-2280) serve como acionamento do sistema. Ele oferece taxas de transferência de dados muito boas. Um segundo NVMe SSD (M.2-2280) também pode ser instalado.

| Razer Blade 15 Advanced Model Early 2021 Samsung PM981a MZVLB1T0HBLR | Schenker XMG Pro 15 (Early 2021, RTX 3080) Samsung SSD 970 EVO Plus 1TB | Asus ROG Zephyrus G15 GA503Q SK Hynix HFM001TD3JX013N | Aorus 15P XC ESR512GTLCG-EAC-4 | Lenovo Legion 7 15IMH05-81YT001VGE 2x Samsung PM981a MZVLB1T0HBLR (RAID 0) | Razer Blade 15 RTX 2080 Super Max-Q Samsung PM981a MZVLB1T0HBLR | |
|---|---|---|---|---|---|---|
| CrystalDiskMark 5.2 / 6 | 24% | 15% | 5% | 4% | 6% | |
| Write 4K (MB/s) | 138 | 160.9 17% | 156.4 13% | 130.2 -6% | 110.4 -20% | 135.7 -2% |
| Read 4K (MB/s) | 47.41 | 54 14% | 66.7 41% | 45.47 -4% | 55.1 16% | 46.98 -1% |
| Write Seq (MB/s) | 1922 | 2944 53% | 2318 21% | 2269 18% | 2180 13% | |
| Read Seq (MB/s) | 1673 | 2781 66% | 2151 29% | 1643 -2% | 1949 16% | |
| Write 4K Q32T1 (MB/s) | 445.5 | 495.2 11% | 525 18% | 547 23% | 466.6 5% | 510 14% |
| Read 4K Q32T1 (MB/s) | 534 | 593 11% | 452.1 -15% | 654 22% | 517 -3% | 569 7% |
| Write Seq Q32T1 (MB/s) | 2976 | 3283 10% | 3055 3% | 2512 -16% | 3424 15% | 2984 0% |
| Read Seq Q32T1 (MB/s) | 3232 | 3549 10% | 3607 12% | 3382 5% | 3519 9% | 3238 0% |
| Write 4K Q8T8 (MB/s) | 1496 | |||||
| Read 4K Q8T8 (MB/s) | 1597 | |||||
| AS SSD | 21% | 6% | -0% | -1% | -6% | |
| Seq Read (MB/s) | 2112 | 2959 40% | 2950 40% | 2694 28% | 3088 46% | 1950 -8% |
| Seq Write (MB/s) | 2024 | 2521 25% | 1600 -21% | 2327 15% | 2561 27% | 2322 15% |
| 4K Read (MB/s) | 46.53 | 50.9 9% | 53.6 15% | 47.77 3% | 43.01 -8% | 45.48 -2% |
| 4K Write (MB/s) | 89.7 | 141.1 57% | 126.8 41% | 98.8 10% | 102 14% | 95.4 6% |
| 4K-64 Read (MB/s) | 1747 | 2110 21% | 1429 -18% | 1746 0% | 1549 -11% | 1484 -15% |
| 4K-64 Write (MB/s) | 1962 | 2329 19% | 2177 11% | 2267 16% | 1378 -30% | 1887 -4% |
| Access Time Read * (ms) | 0.052 | 0.034 35% | 0.064 -23% | 0.079 -52% | 0.051 2% | 0.051 2% |
| Access Time Write * (ms) | 0.04 | 0.026 35% | 0.029 27% | 0.039 2% | 0.037 7% | 0.038 5% |
| Score Read (Points) | 2004 | 2457 23% | 1778 -11% | 2063 3% | 1901 -5% | 1725 -14% |
| Score Write (Points) | 2254 | 2722 21% | 2464 9% | 2598 15% | 1737 -23% | 2215 -2% |
| Score Total (Points) | 5280 | 6412 21% | 5090 -4% | 5698 8% | 4583 -13% | 4843 -8% |
| Copy ISO MB/s (MB/s) | 2128 | 2275 7% | 1877 -12% | 2684 26% | 1903 -11% | |
| Copy Program MB/s (MB/s) | 707 | 593 -16% | 555 -21% | 544 -23% | 505 -29% | |
| Copy Game MB/s (MB/s) | 1471 | 1408 -4% | 1201 -18% | 1116 -24% | 1113 -24% | |
| Média Total (Programa/Configurações) | 23% /
22% | 11% /
10% | 3% /
2% | 2% /
0% | 0% /
-2% |
* ... menor é melhor
Continuous read speed: DiskSpd Read Loop, Queue Depth 8
Placa Gráfica
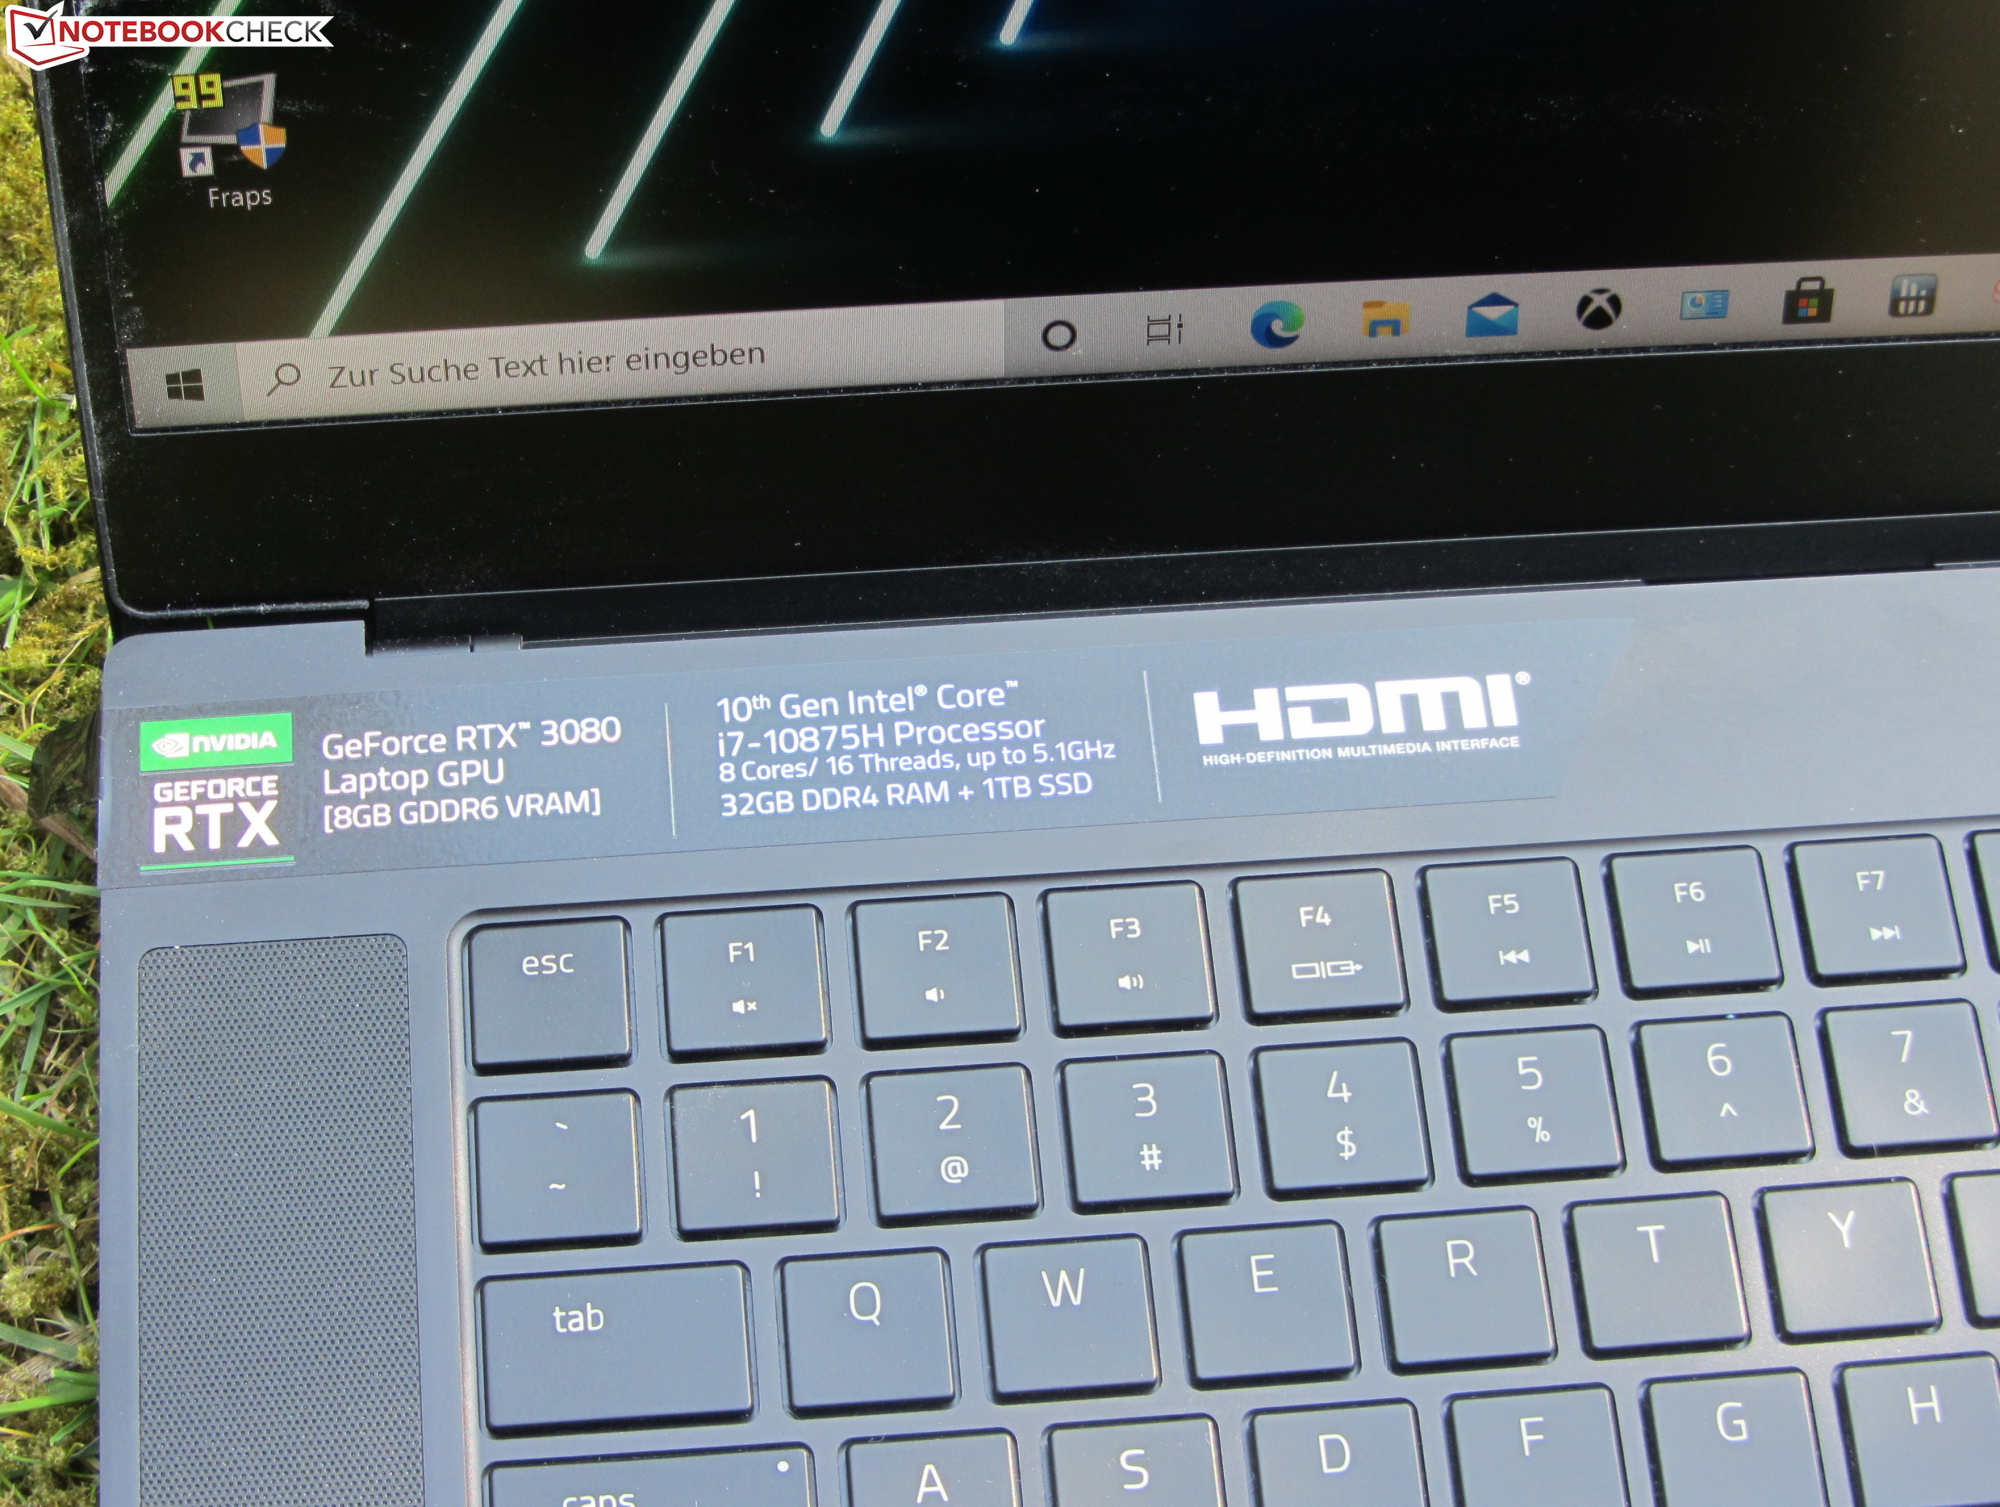
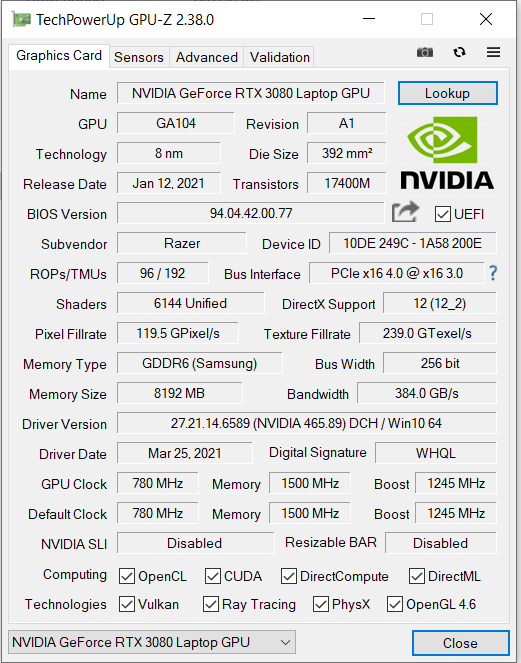
O GeForce RTX 3080 (laptop) é atualmente a GPU mais alta da Nvidia para notebooks. O desempenho no mundo real depende muito do TGP máximo, que os fabricantes podem determinar por conta própria. No entanto, os fabricantes de notebooks têm que ficardentro de certos limites definidos pela Nvidia.
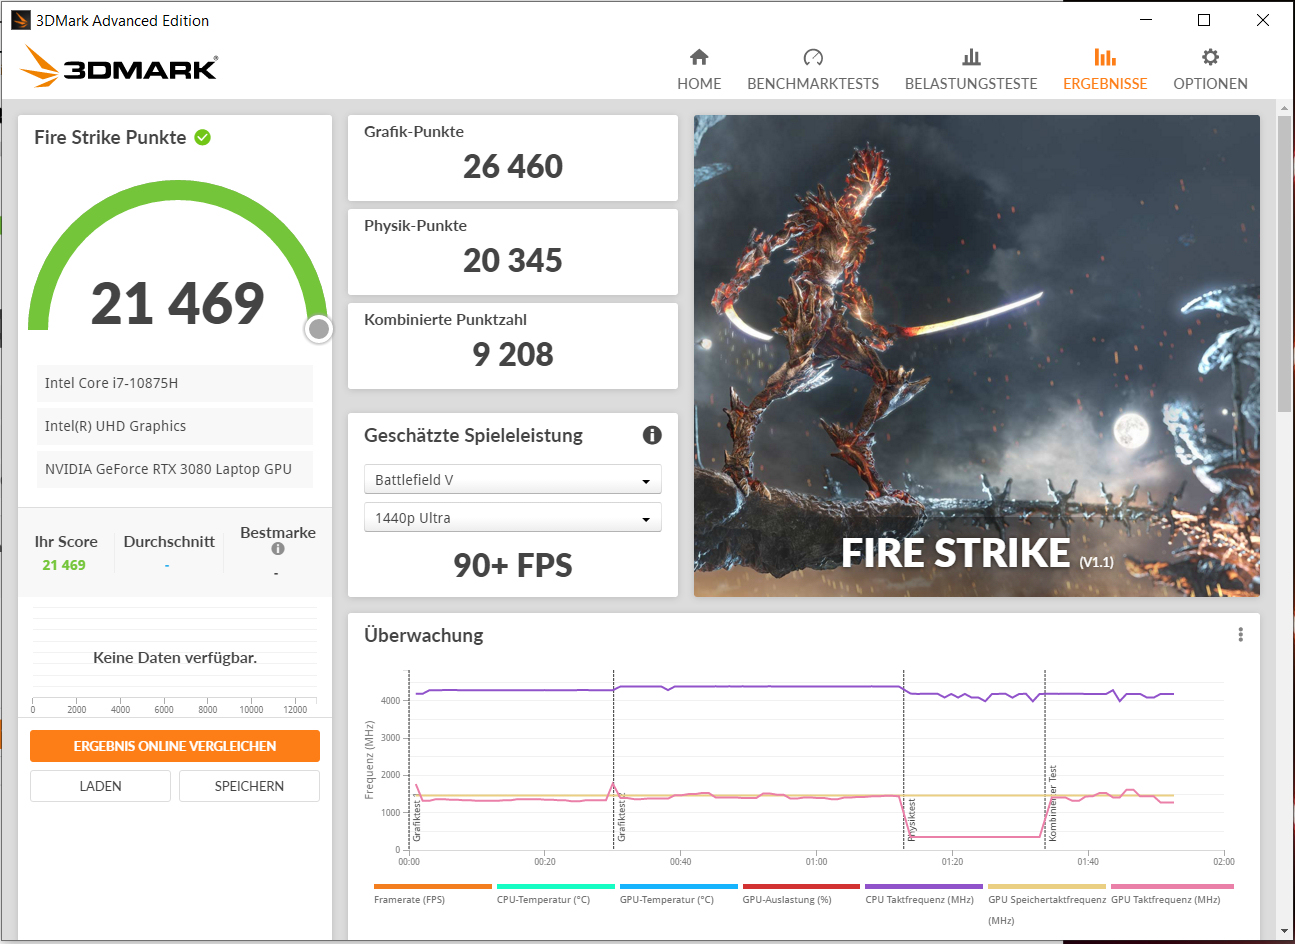
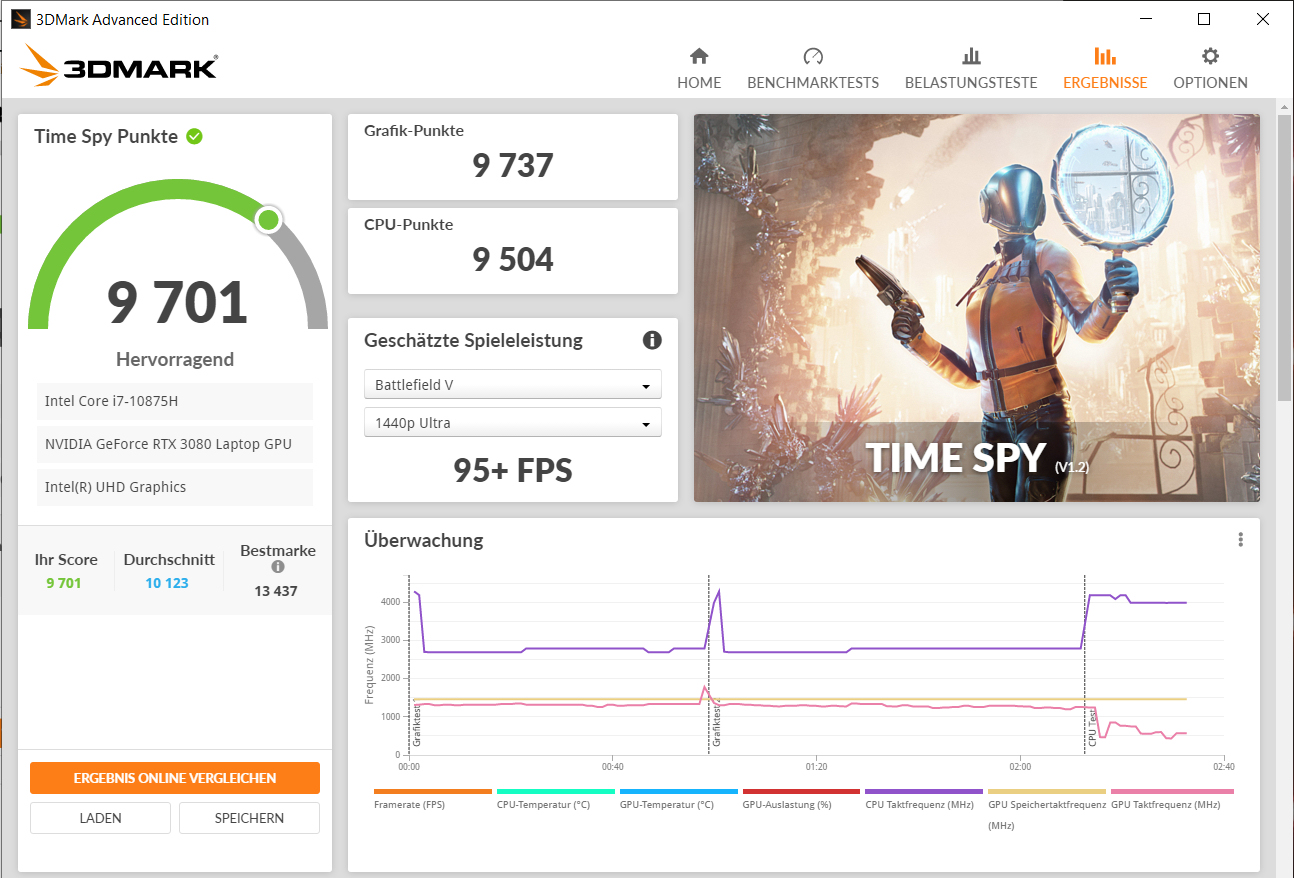
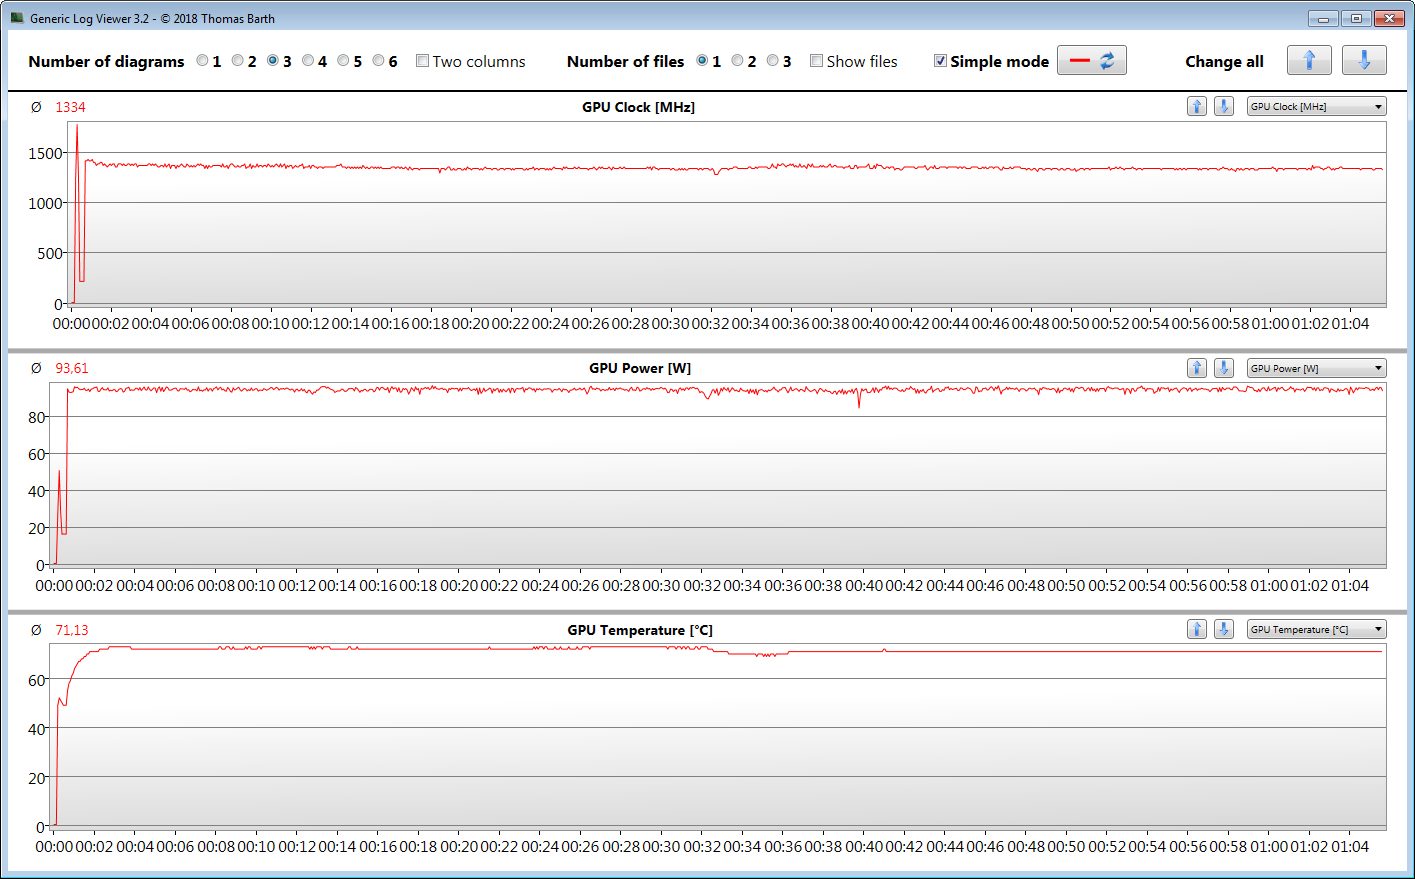
O RTX 3080 na lâmina 15 Advanced tem um TGP máximo de 95 watts (80 W (Base) + 15 W (Dynamic Boost)). Estes não são valores muito altos para esta GPU em particular. A placa gráfica pode desenhar até 95 W no modo High Performance, que você pode selecionar no utilitário Synapse. Por padrão, o laptop roda em modo Balanceado (80 W (Base) + 5 W (Dynamic Boost).
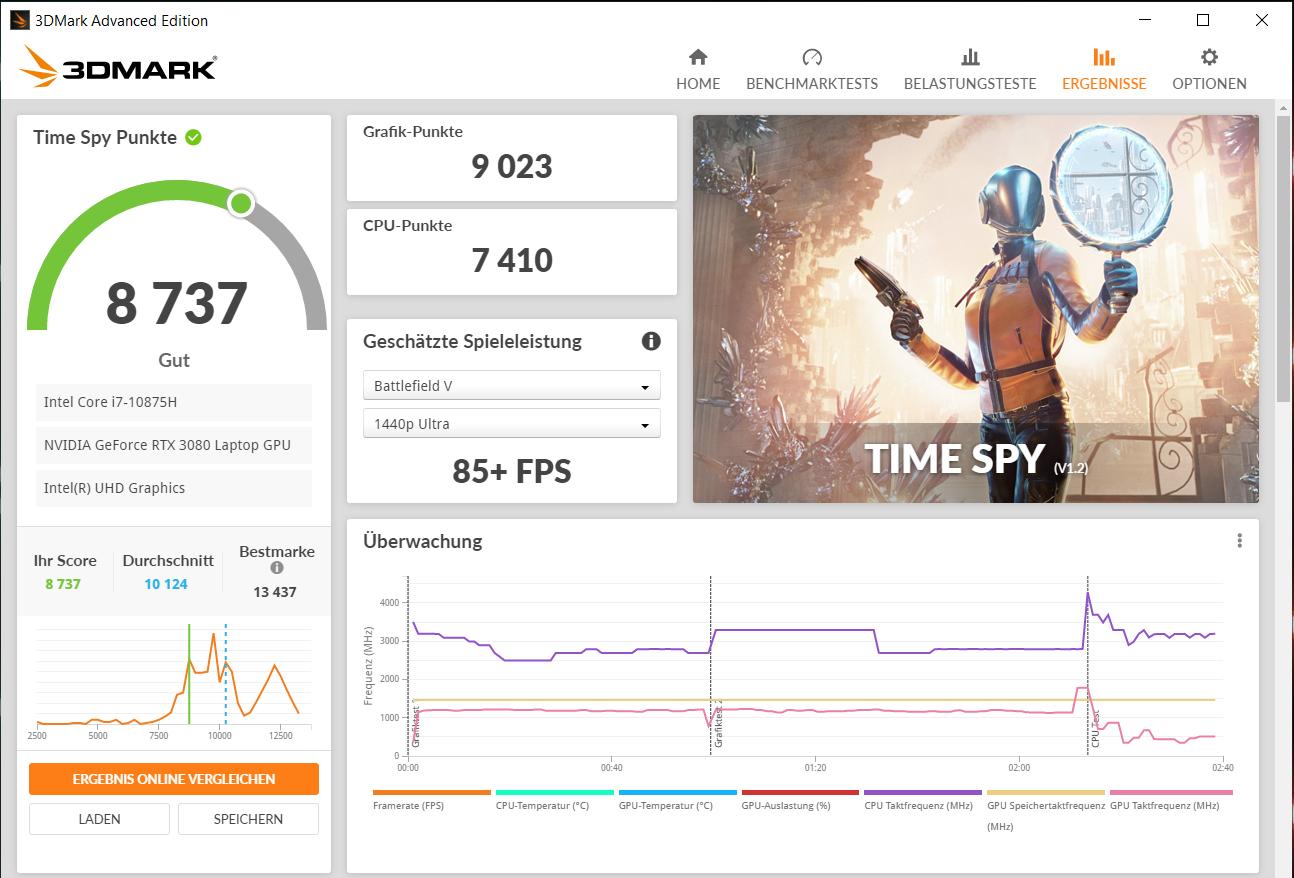
Nos 3DMark benchmarks, o Blade 15 Advanced tem o desempenho esperado. Aqui, oAorus 15P XCcom um ritmo nominalmente mais lento GeForce RTX 3070 tem um desempenho ligeiramente melhor, pois sua GPU tem um TGP máximo de 130 W.
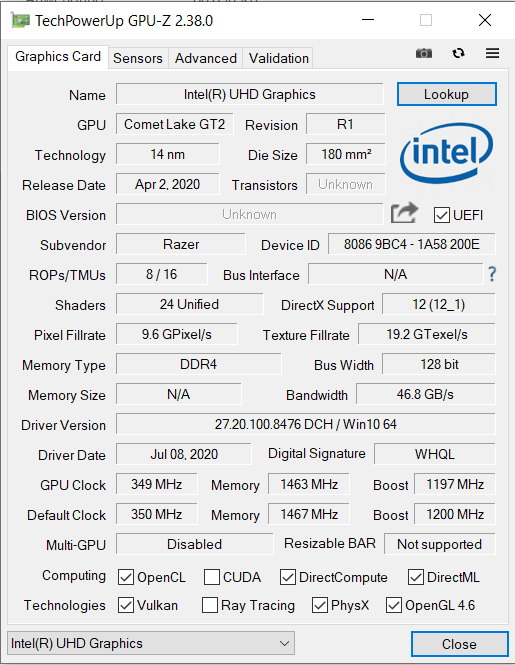
O RTX 3080 possui 8 GB de GDDR6 VRAM rápido. OUHD Graphics 630que está integrada noCore i7-10875HA tecnologia de comutação gráfica da Nvidia (Optimus) é suportada. O iGPU pode ser desativado nas configurações da BIOS.
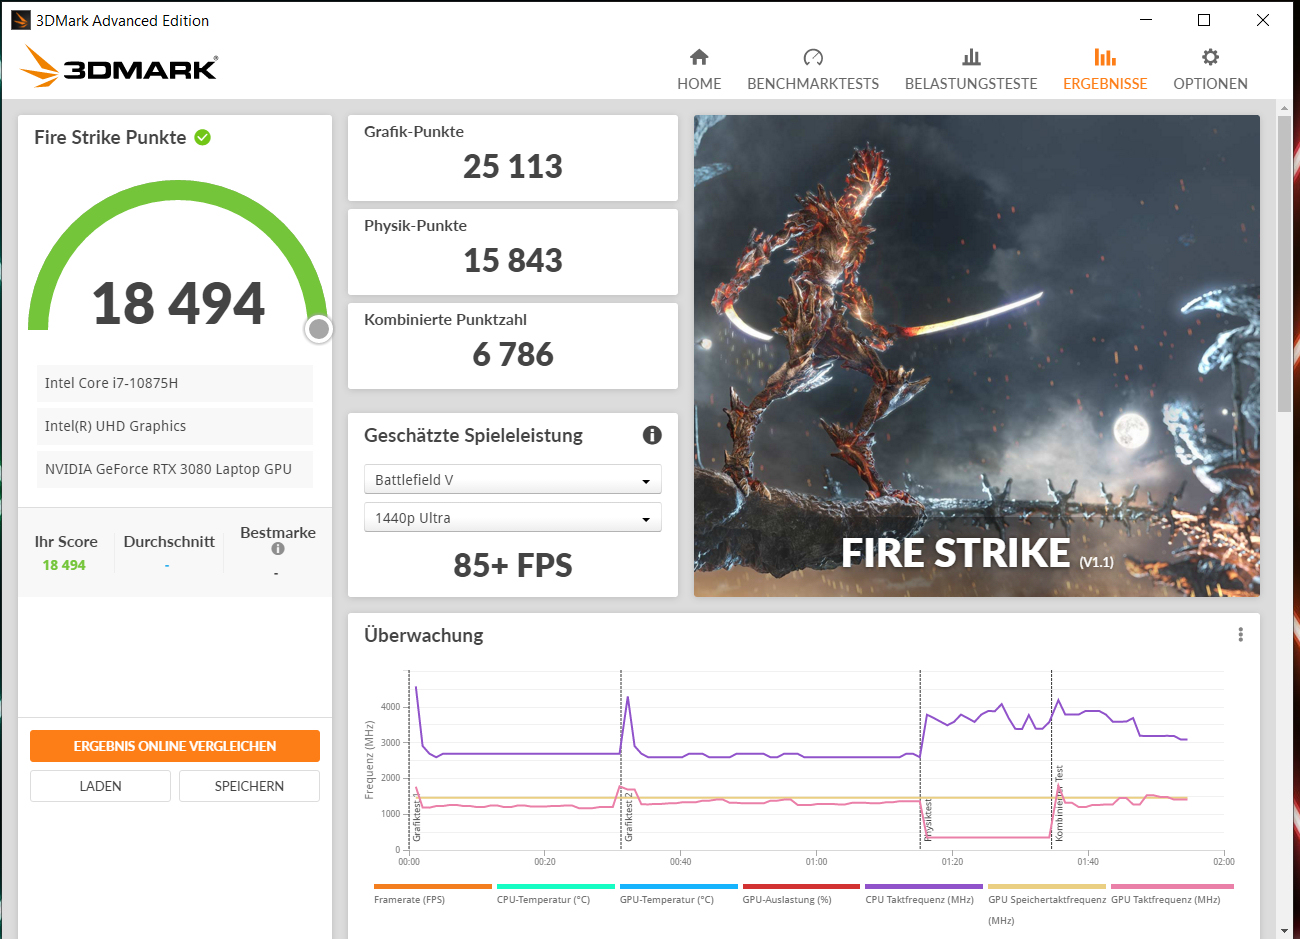

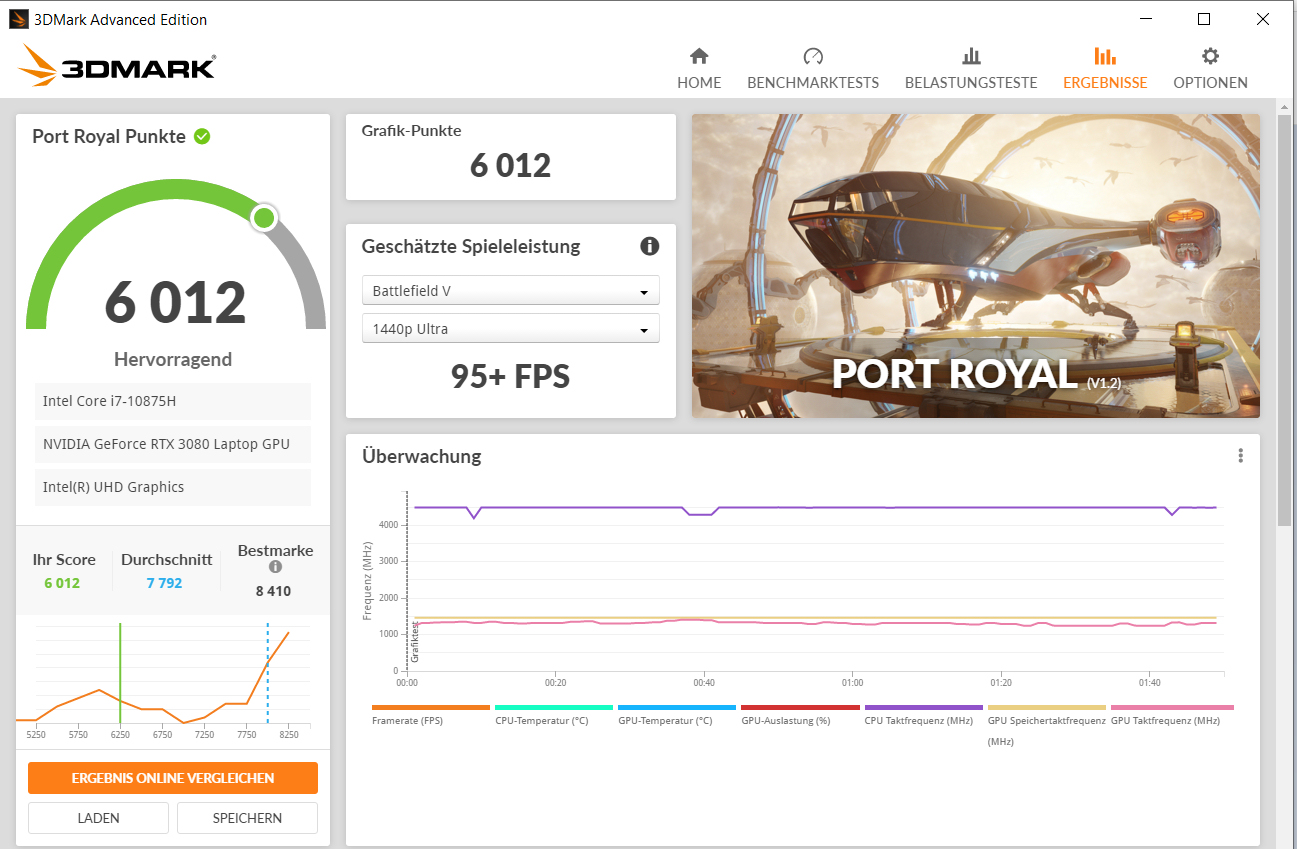

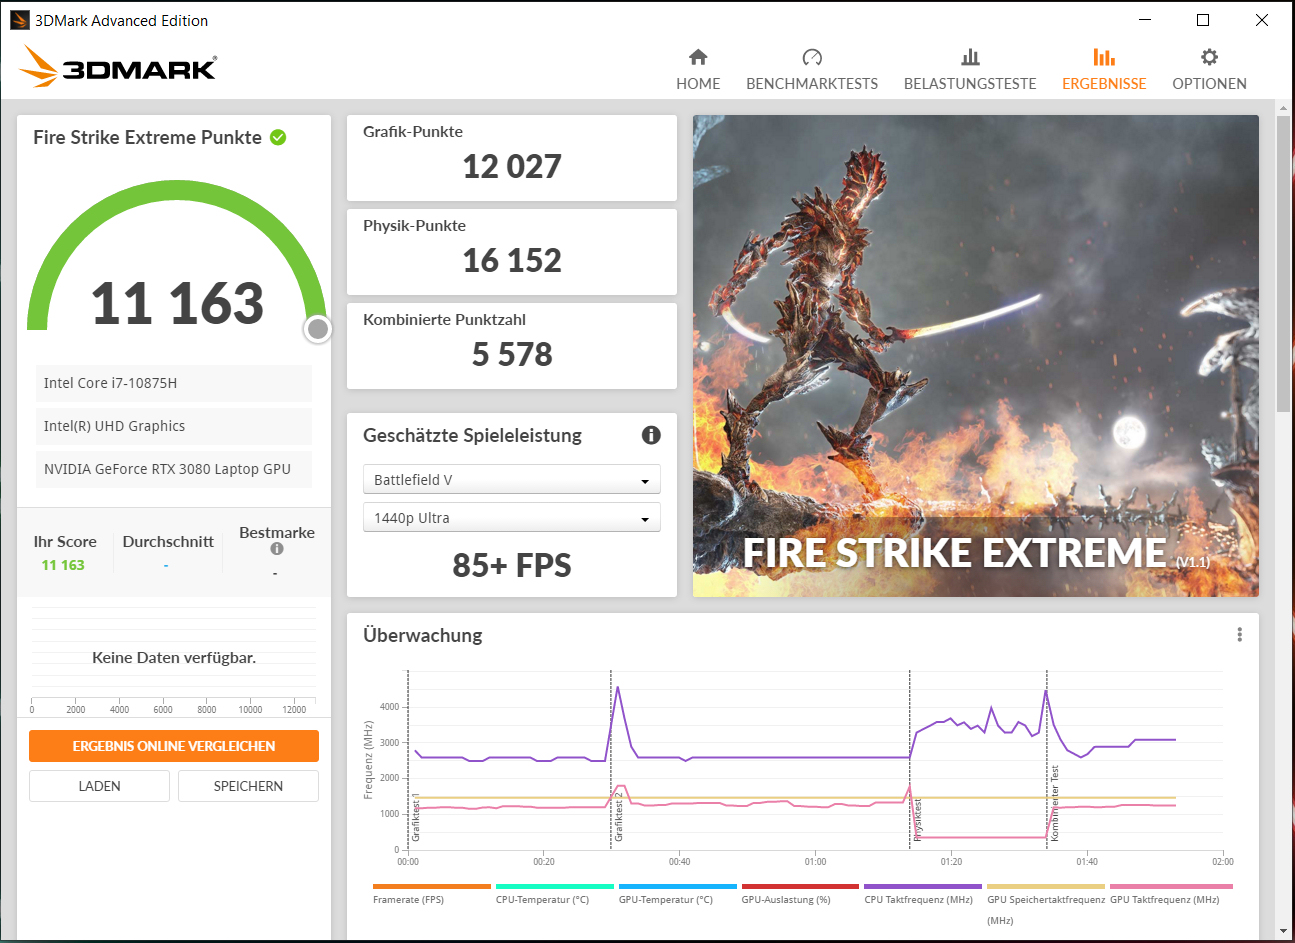

| 3DMark 11 Performance | 24180 pontos | |
| 3DMark Cloud Gate Standard Score | 38779 pontos | |
| 3DMark Fire Strike Score | 18494 pontos | |
| 3DMark Fire Strike Extreme Score | 11163 pontos | |
| 3DMark Time Spy Score | 8737 pontos | |
Ajuda | ||
Desempenho nos jogos
O Blade 15 Advanced pode lidar com títulos atuais a 1080p nas configurações mais altas. Para alcançar taxas de quadros jogáveis em resoluções mais altas (por exemplo, ao jogar com um monitor externo), as configurações gráficas terão que ser baixadas em alguns casos
| The Witcher 3 - 1920x1080 Ultra Graphics & Postprocessing (HBAO+) | |
| Média da turma Gaming (95 - 240, n=8, últimos 2 anos) | |
| Média NVIDIA GeForce RTX 3080 Laptop GPU (85.1 - 123, n=40) | |
| Aorus 15P XC | |
| Razer Blade 15 Advanced Model Early 2021 (Max.) | |
| Schenker XMG Pro 15 (Early 2021, RTX 3080) | |
| Razer Blade 15 Advanced Model Early 2021 | |
| Asus ROG Zephyrus G15 GA503Q | |
| Lenovo Legion 7 15IMH05-81YT001VGE | |
| Razer Blade 15 RTX 2080 Super Max-Q | |
| Dota 2 Reborn - 1920x1080 ultra (3/3) best looking | |
| Média da turma Gaming (84.8 - 248, n=110, últimos 2 anos) | |
| Lenovo Legion 7 15IMH05-81YT001VGE | |
| Média NVIDIA GeForce RTX 3080 Laptop GPU (98 - 156, n=45) | |
| Aorus 15P XC | |
| Razer Blade 15 Advanced Model Early 2021 (Max.) | |
| Asus ROG Zephyrus G15 GA503Q | |
| Schenker XMG Pro 15 (Early 2021, RTX 3080) | |
| Razer Blade 15 RTX 2080 Super Max-Q | |
| Razer Blade 15 Advanced Model Early 2021 | |
| X-Plane 11.11 - 1920x1080 high (fps_test=3) | |
| Média da turma Gaming (52.1 - 143.5, n=113, últimos 2 anos) | |
| Lenovo Legion 7 15IMH05-81YT001VGE | |
| Média NVIDIA GeForce RTX 3080 Laptop GPU (65.6 - 113, n=44) | |
| Razer Blade 15 Advanced Model Early 2021 (Max.) | |
| Razer Blade 15 RTX 2080 Super Max-Q | |
| Schenker XMG Pro 15 (Early 2021, RTX 3080) | |
| Aorus 15P XC | |
| Razer Blade 15 Advanced Model Early 2021 | |
| Asus ROG Zephyrus G15 GA503Q | |
| Far Cry 5 - 1920x1080 Ultra Preset AA:T | |
| Média da turma Gaming (70 - 151, n=9, últimos 2 anos) | |
| Média NVIDIA GeForce RTX 3080 Laptop GPU (75 - 146, n=33) | |
| Lenovo Legion 7 15IMH05-81YT001VGE | |
| Razer Blade 15 Advanced Model Early 2021 (Max.) | |
| Aorus 15P XC | |
| Razer Blade 15 Advanced Model Early 2021 | |
| Razer Blade 15 RTX 2080 Super Max-Q | |
| Doom Eternal - 1920x1080 Ultra Preset | |
| Média NVIDIA GeForce RTX 3080 Laptop GPU (163 - 190, n=4) | |
| Razer Blade 15 Advanced Model Early 2021 | |
| Asus ROG Zephyrus G15 GA503Q | |
| Razer Blade 15 RTX 2080 Super Max-Q | |
| Watch Dogs Legion | |
| 1920x1080 Ultra Preset + Ultra Ray Tracing (DX12) | |
| Média NVIDIA GeForce RTX 3080 Laptop GPU (41 - 61, n=6) | |
| Aorus 15P XC | |
| Razer Blade 15 Advanced Model Early 2021 | |
| Asus ROG Zephyrus G15 GA503Q | |
| 1920x1080 Ultra Preset (DX12) | |
| Média NVIDIA GeForce RTX 3080 Laptop GPU (65 - 91.1, n=6) | |
| Aorus 15P XC | |
| Razer Blade 15 Advanced Model Early 2021 | |
| Asus ROG Zephyrus G15 GA503Q | |
| Hitman 3 - 1920x1080 Maximum Settings AF:16x | |
| Média NVIDIA GeForce RTX 3080 Laptop GPU (129.1 - 201, n=3) | |
| Aorus 15P XC | |
| Razer Blade 15 Advanced Model Early 2021 | |
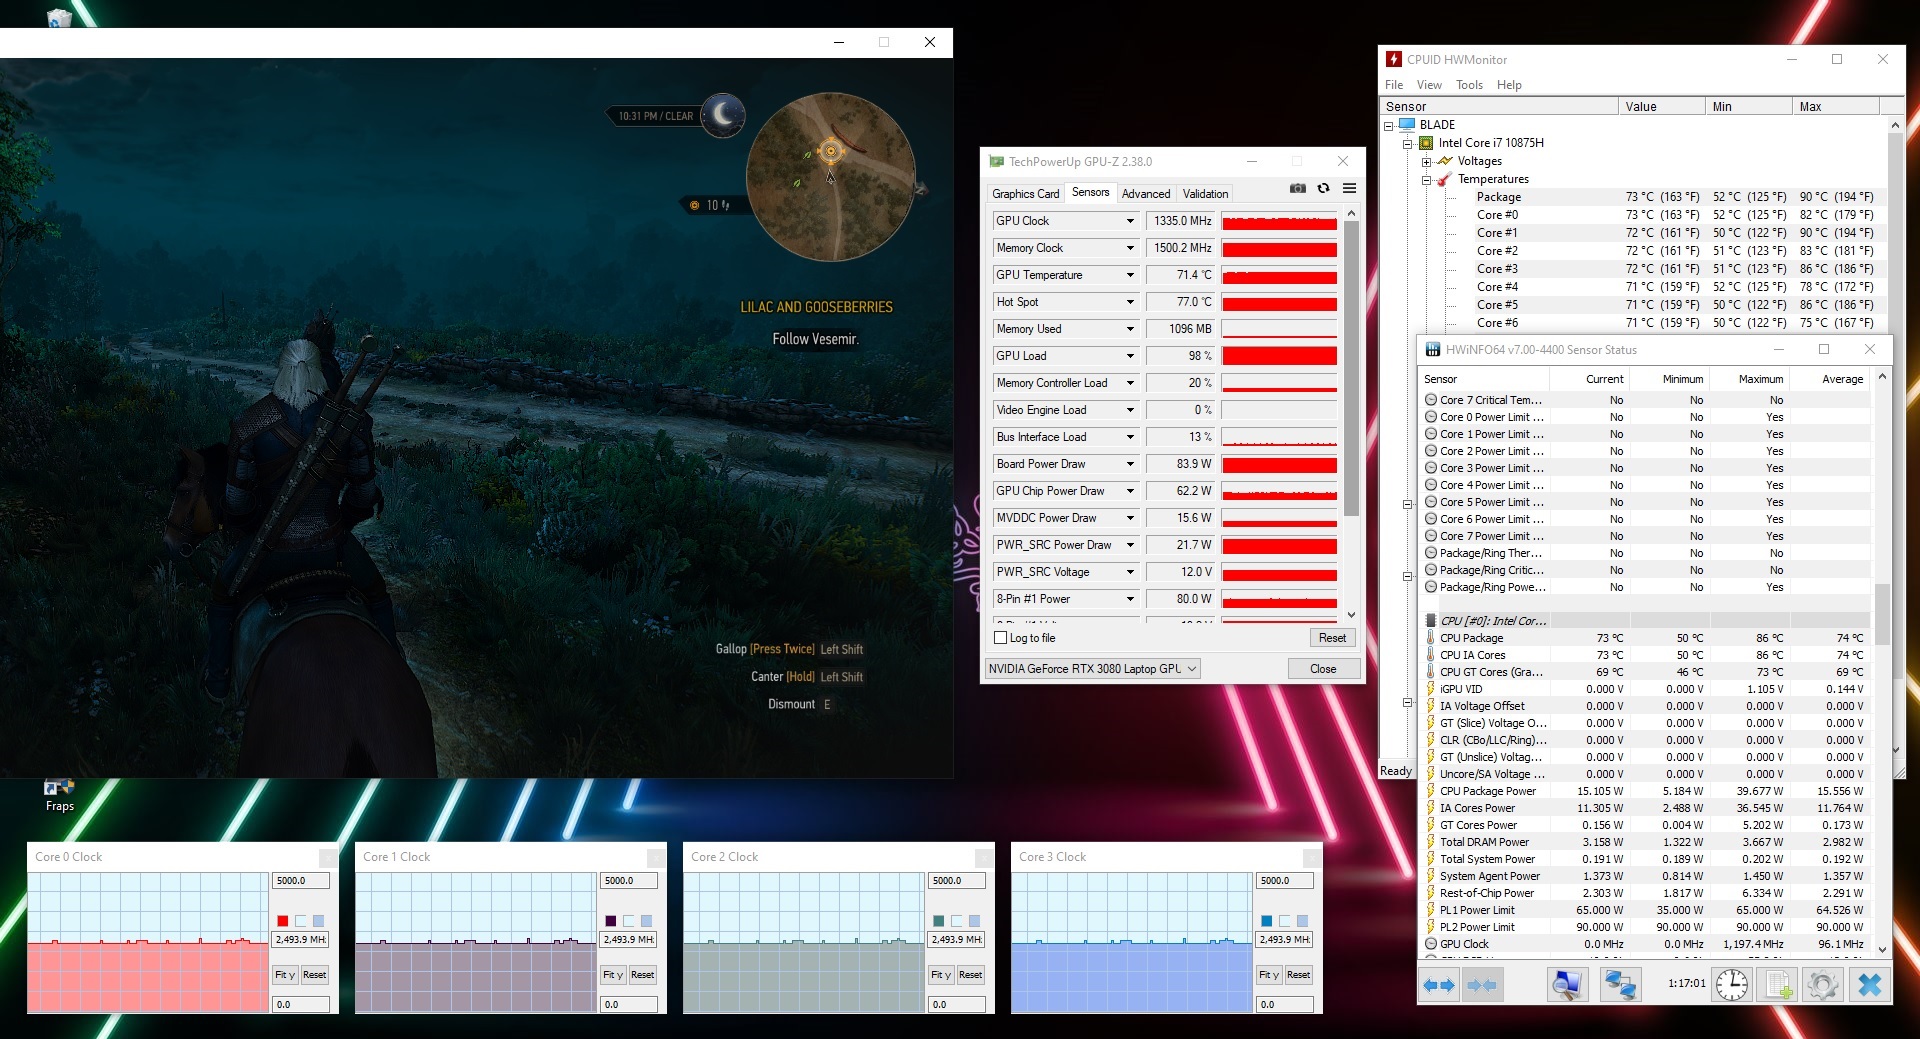
Usamos o jogo de vídeo conhecido como "The Witcher 3" para verificar se as taxas de quadros podem ser mantidas consistentemente durante um período de tempo prolongado. Para isso, executamos o jogo nas configurações mais altas a 1080p por uma hora. Durante toda a execução do jogo, o personagem controlado pelo jogador simplesmente fica parado. Não há quedas na taxa de quadros a serem relatadas

| baixo | média | alto | ultra | |
|---|---|---|---|---|
| The Witcher 3 (2015) | 316 | 262 | 170 | 93.2 |
| Dota 2 Reborn (2015) | 144 | 132 | 122 | 103 |
| X-Plane 11.11 (2018) | 105 | 91.9 | 76.9 | |
| Far Cry 5 (2018) | 138 | 115 | 109 | 104 |
| Shadow of the Tomb Raider (2018) | 130 | 116 | 113 | 106 |
| Doom Eternal (2020) | 289 | 197 | 177 | 174 |
| Serious Sam 4 (2020) | 112 | 91.1 | 74.8 | 72.6 |
| Watch Dogs Legion (2020) | 93 | 90.8 | 79.9 | 67.2 |
| Dirt 5 (2020) | 155 | 114 | 99.3 | 81 |
| Assassin´s Creed Valhalla (2020) | 121 | 93 | 79 | 69 |
| Immortals Fenyx Rising (2020) | 117 | 105 | 94 | 89 |
| Hitman 3 (2021) | 160.1 | 135.4 | 131.4 | 129.1 |
| Outriders (2021) | 111 | 102 | 109 | 98.9 |
Emissões - A lâmina 15 fica bem quente
Ruído do sistema
Quando ociosos e sob carga baixa, os ventiladores muitas vezes ficam parados, o que leva a uma operação silenciosa. Sob carga alta, os ventiladores começam a girar muito rápido. Medimos um nível máximo de pressão sonora de 47,7 dB(A) durante nosso teste de estresse. Em nosso teste de estresse em jogos com o The Witcher 3, o nível máximo de pressão sonora foi de 43 dB(A).
Barulho
| Ocioso |
| 26 / 28 / 40 dB |
| Carga |
| 45 / 45 dB |
 | ||
30 dB silencioso 40 dB(A) audível 50 dB(A) ruidosamente alto |
||
min: | ||
| Razer Blade 15 Advanced Model Early 2021 i7-10875H, GeForce RTX 3080 Laptop GPU | Razer Blade 15 RTX 2080 Super Max-Q i7-10875H, GeForce RTX 2080 Super Max-Q | Schenker XMG Pro 15 (Early 2021, RTX 3080) i7-10870H, GeForce RTX 3080 Laptop GPU | Asus ROG Zephyrus G15 GA503Q R9 5900HS, GeForce RTX 3080 Laptop GPU | Aorus 15P XC i7-10870H, GeForce RTX 3070 Laptop GPU | Lenovo Legion 7 15IMH05-81YT001VGE i9-10980HK, GeForce RTX 2080 Super Max-Q | Média da turma Gaming | |
|---|---|---|---|---|---|---|---|
| Noise | -6% | -14% | -2% | -2% | 2% | 2% | |
| desligado / ambiente * (dB) | 24 | 30.1 -25% | 25 -4% | 25 -4% | 24 -0% | 24.4 -2% | 24.1 ? -0% |
| Idle Minimum * (dB) | 26 | 30.1 -16% | 33 -27% | 26 -0% | 25 4% | 24.4 6% | 25.9 ? -0% |
| Idle Average * (dB) | 28 | 30.1 -8% | 34 -21% | 27 4% | 29 -4% | 24.4 13% | 27.4 ? 2% |
| Idle Maximum * (dB) | 40 | 30.1 25% | 35 12% | 31 22% | 34 15% | 24.4 39% | 29.9 ? 25% |
| Load Average * (dB) | 45 | 46.8 -4% | 51 -13% | 49 -9% | 44 2% | 49.3 -10% | 43 ? 4% |
| Witcher 3 ultra * (dB) | 43 | 48.4 -13% | 52 -21% | 49 -14% | 49 -14% | 54 -26% | |
| Load Maximum * (dB) | 45 | 46 -2% | 57 -27% | 51 -13% | 53 -18% | 46.6 -4% | 54.1 ? -20% |
* ... menor é melhor
Temperatura
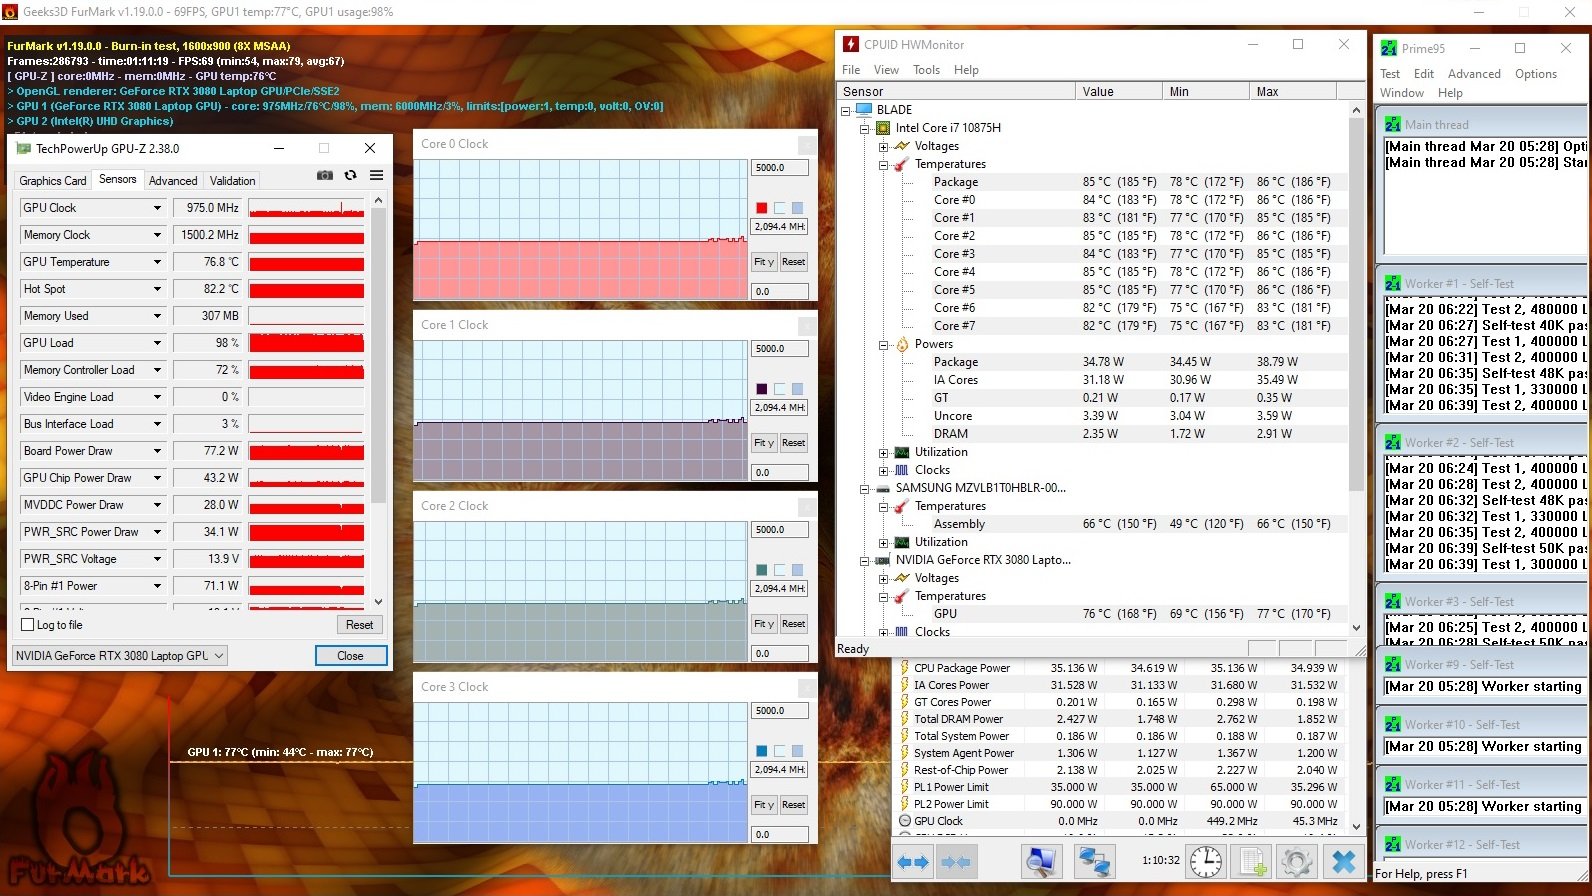
Em nosso teste de estresse (Prime95 e FurMark funcionando continuamente por pelo menos uma hora), o processador funcionava a 2,1 GHz e a GPU funcionava a 975 MHz. O teste de estresse é um cenário de caso extremo, que é muito improvável que ocorra na vida real. Nós o usamos para testar a estabilidade do sistema sob carga total
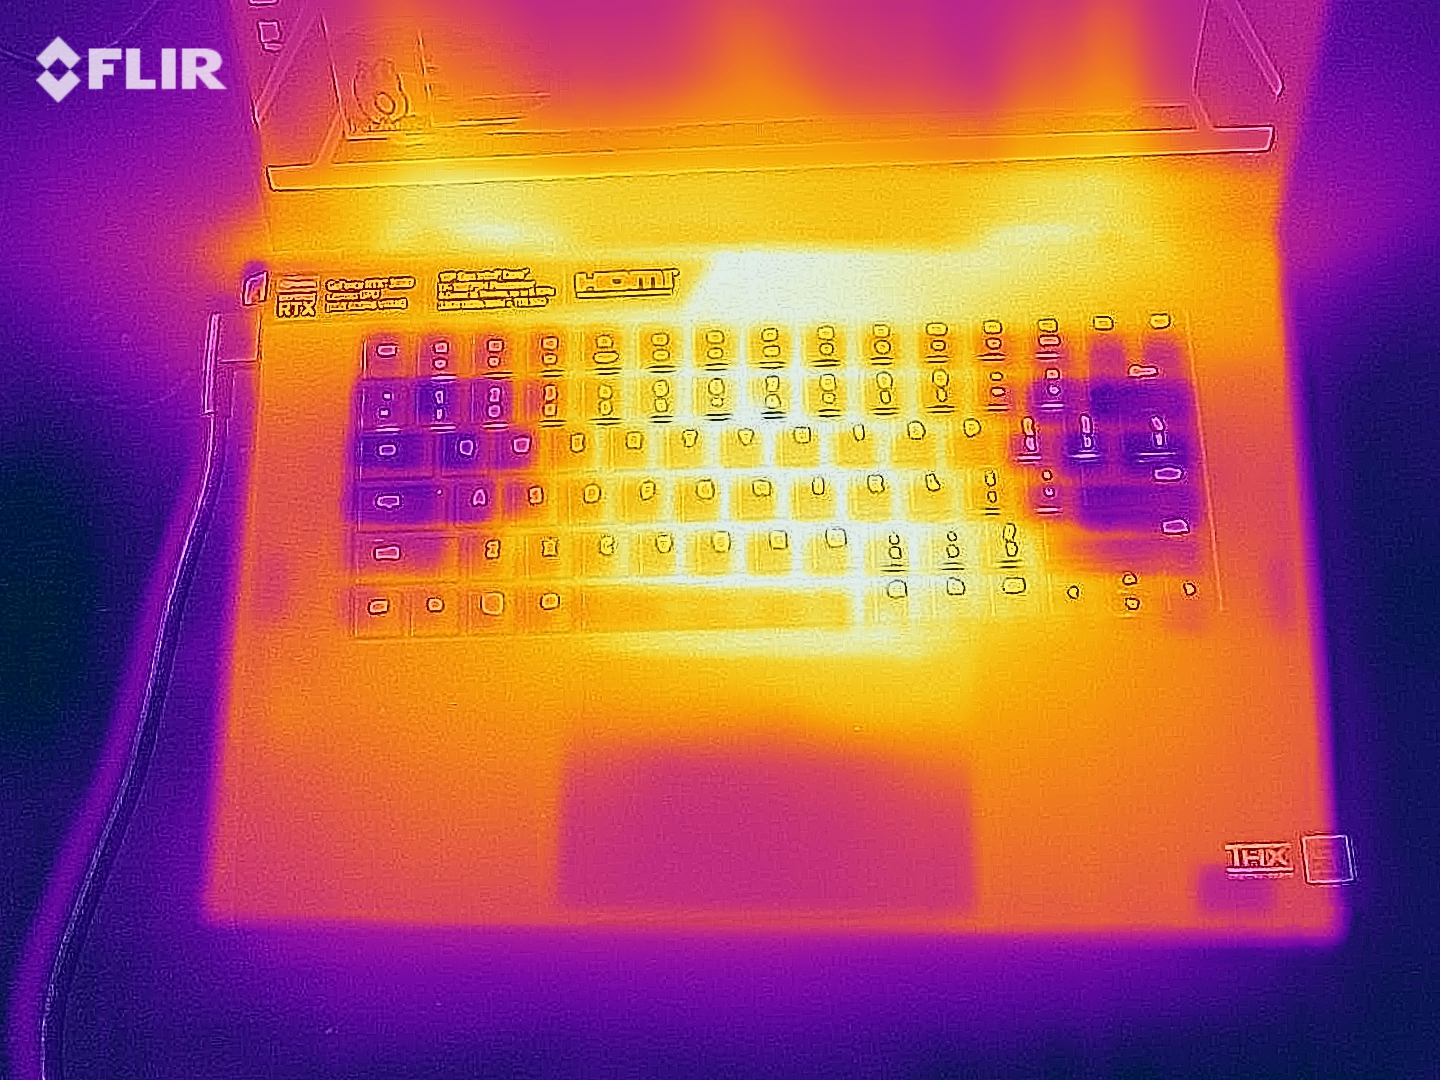
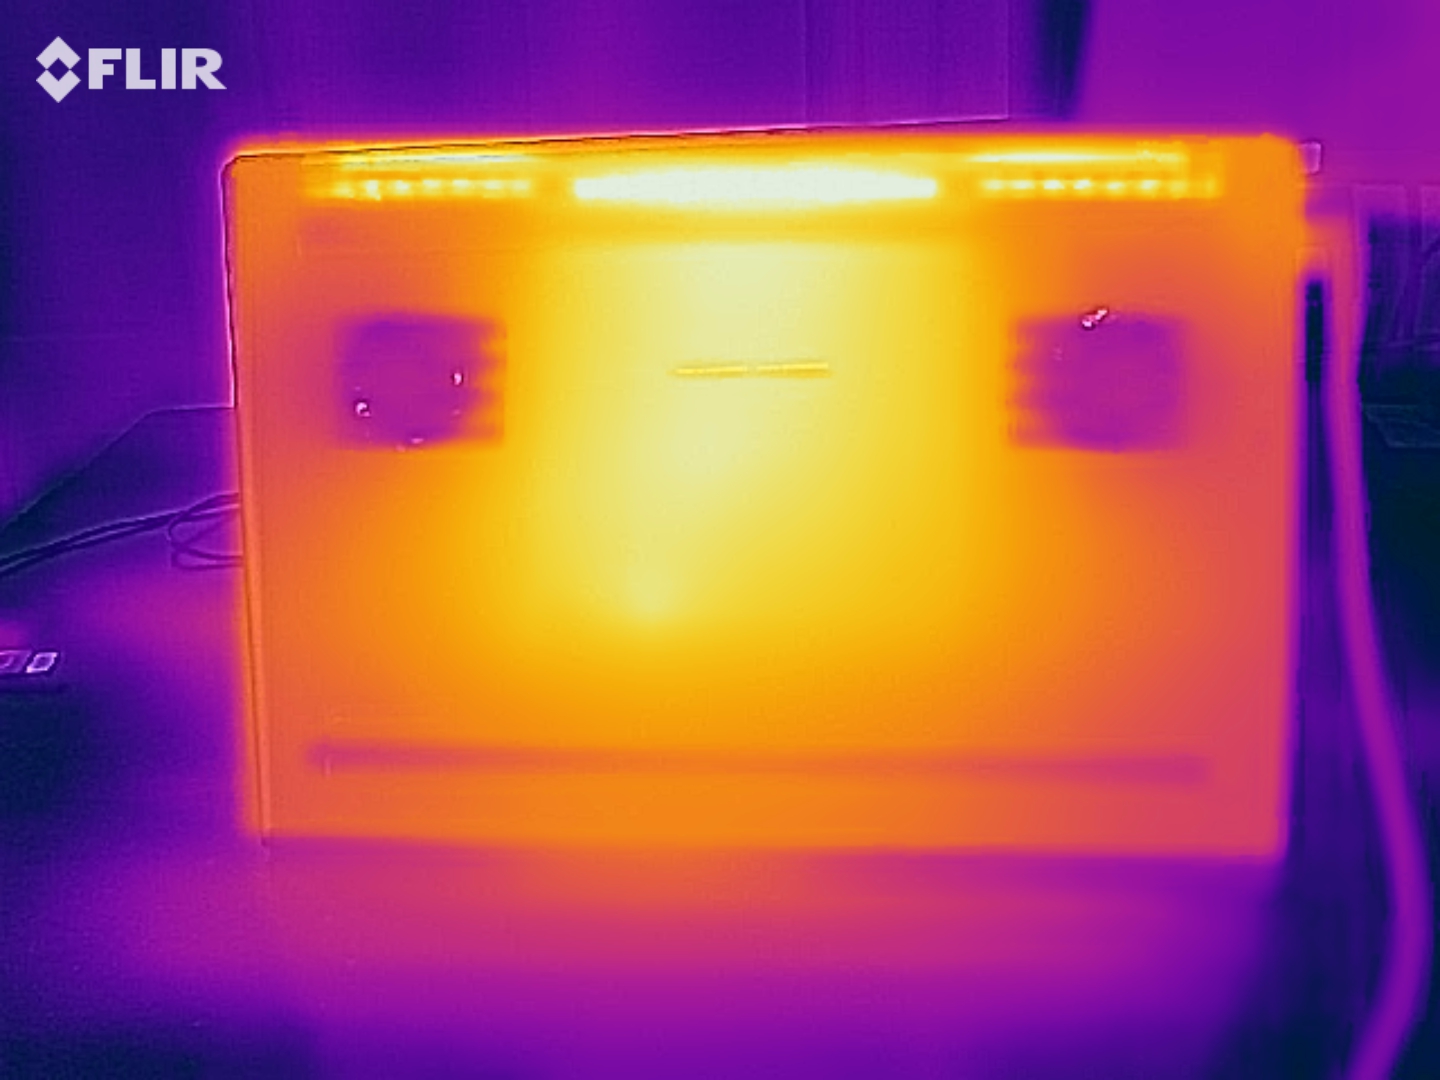
O notebook se torna bastante quente. Durante o teste de estresse, a marca de 50-°C (122-°F) foi excedida em vários pontos de medição. No teste de estresse do jogo, as temperaturas da superfície foram ligeiramente mais baixas. No uso diário, as temperaturas são sempre mais do que aceitáveis.
(-) A temperatura máxima no lado superior é 49 °C / 120 F, em comparação com a média de 40.4 °C / 105 F , variando de 21.2 a 68.8 °C para a classe Gaming.
(-) A parte inferior aquece até um máximo de 54 °C / 129 F, em comparação com a média de 43.2 °C / 110 F
(+) Em uso inativo, a temperatura média para o lado superior é 29.3 °C / 85 F, em comparação com a média do dispositivo de 33.9 °C / ### class_avg_f### F.
(-) Jogando The Witcher 3, a temperatura média para o lado superior é 44.3 °C / 112 F, em comparação com a média do dispositivo de 33.9 °C / ## #class_avg_f### F.
(-) Os apoios para as mãos e o touchpad podem ficar muito quentes ao toque, com um máximo de 45 °C / 113 F.
(-) A temperatura média da área do apoio para as mãos de dispositivos semelhantes foi 28.8 °C / 83.8 F (-16.2 °C / -29.2 F).
| Razer Blade 15 Advanced Model Early 2021 i7-10875H, GeForce RTX 3080 Laptop GPU | Razer Blade 15 RTX 2080 Super Max-Q i7-10875H, GeForce RTX 2080 Super Max-Q | Schenker XMG Pro 15 (Early 2021, RTX 3080) i7-10870H, GeForce RTX 3080 Laptop GPU | Asus ROG Zephyrus G15 GA503Q R9 5900HS, GeForce RTX 3080 Laptop GPU | Aorus 15P XC i7-10870H, GeForce RTX 3070 Laptop GPU | Lenovo Legion 7 15IMH05-81YT001VGE i9-10980HK, GeForce RTX 2080 Super Max-Q | Média da turma Gaming | |
|---|---|---|---|---|---|---|---|
| Heat | 1% | -8% | -3% | 7% | 19% | 2% | |
| Maximum Upper Side * (°C) | 49 | 52 -6% | 51 -4% | 51 -4% | 47 4% | 35.2 28% | 45.2 ? 8% |
| Maximum Bottom * (°C) | 54 | 53 2% | 66 -22% | 56 -4% | 57 -6% | 32.5 40% | 48.1 ? 11% |
| Idle Upper Side * (°C) | 30 | 29.3 2% | 32 -7% | 29 3% | 26 13% | 29.4 2% | 31.1 ? -4% |
| Idle Bottom * (°C) | 32 | 30.2 6% | 32 -0% | 34 -6% | 27 16% | 29.6 7% | 34.3 ? -7% |
* ... menor é melhor
Oradores
Razer Blade 15 Advanced Model Early 2021 análise de áudio
(+) | os alto-falantes podem tocar relativamente alto (###valor### dB)
Graves 100 - 315Hz
(-) | quase nenhum baixo - em média 23.1% menor que a mediana
(±) | a linearidade dos graves é média (12% delta para a frequência anterior)
Médios 400 - 2.000 Hz
(±) | médios mais altos - em média 5.2% maior que a mediana
(+) | médios são lineares (4% delta para frequência anterior)
Altos 2 - 16 kHz
(+) | agudos equilibrados - apenas 4.1% longe da mediana
(±) | a linearidade dos máximos é média (7.2% delta para frequência anterior)
Geral 100 - 16.000 Hz
(±) | a linearidade do som geral é média (17.2% diferença em relação à mediana)
Comparado com a mesma classe
» 46% de todos os dispositivos testados nesta classe foram melhores, 11% semelhantes, 42% piores
» O melhor teve um delta de 6%, a média foi 18%, o pior foi 132%
Comparado com todos os dispositivos testados
» 32% de todos os dispositivos testados foram melhores, 8% semelhantes, 60% piores
» O melhor teve um delta de 4%, a média foi 24%, o pior foi 134%
Gerenciamento de energia - O laptop Razer oferece uma grande autonomia de bateria
Consumo de energia
Quando ociosos, medimos um consumo máximo de energia de 22 watts. Durante o teste de estresse, o consumo de energia atingiu um pico de 165 watts. Nos jogos, o consumo de energia foi em média de 126 watts. A potência nominal do adaptador AC é de 230 watts
| desligado | |
| Ocioso | |
| Carga |
|
Key:
min: | |
| Razer Blade 15 Advanced Model Early 2021 i7-10875H, GeForce RTX 3080 Laptop GPU | Razer Blade 15 RTX 2080 Super Max-Q i7-10875H, GeForce RTX 2080 Super Max-Q | Schenker XMG Pro 15 (Early 2021, RTX 3080) i7-10870H, GeForce RTX 3080 Laptop GPU | Asus ROG Zephyrus G15 GA503Q R9 5900HS, GeForce RTX 3080 Laptop GPU | Aorus 15P XC i7-10870H, GeForce RTX 3070 Laptop GPU | Lenovo Legion 7 15IMH05-81YT001VGE i9-10980HK, GeForce RTX 2080 Super Max-Q | Média da turma Gaming | |
|---|---|---|---|---|---|---|---|
| Power Consumption | 1% | -4% | 8% | -28% | -1% | -20% | |
| Idle Minimum * (Watt) | 13 | 10.6 18% | 8 38% | 10 23% | 14 -8% | 9 31% | 13.1 ? -1% |
| Idle Average * (Watt) | 15 | 13.1 13% | 13 13% | 12 20% | 17 -13% | 12.6 16% | 18.8 ? -25% |
| Idle Maximum * (Watt) | 22 | 15.8 28% | 22 -0% | 17 23% | 33 -50% | 17 23% | 24.4 ? -11% |
| Load Average * (Watt) | 98 | 131 -34% | 97 1% | 108 -10% | 96 2% | 115 -17% | 108.6 ? -11% |
| Witcher 3 ultra * (Watt) | 126 | 146 -16% | 179 -42% | 123 2% | 179 -42% | 159 -26% | |
| Load Maximum * (Watt) | 165 | 169 -2% | 225 -36% | 182 -10% | 256 -55% | 216 -31% | 254 ? -54% |
* ... menor é melhor
Vida útil da bateria
Nosso teste Wi-Fi praticamente orientado simula cargas que são consistentes com a navegação na web. Aqui, o laptop Razer atinge um tempo de funcionamento da bateria de 8h 58m. Em nosso teste de vídeo, o Blade 15 Advanced durou 8h e 56m. Realizamos nossos testes de Wi-Fi e vídeo com a luminosidade da tela ajustada para 150 cd/m². Além disso, em nosso teste de vídeo, também desativamos os módulos de comutação.
| Razer Blade 15 Advanced Model Early 2021 i7-10875H, GeForce RTX 3080 Laptop GPU, 80 Wh | Schenker XMG Pro 15 (Early 2021, RTX 3080) i7-10870H, GeForce RTX 3080 Laptop GPU, 73 Wh | Asus ROG Zephyrus G15 GA503Q R9 5900HS, GeForce RTX 3080 Laptop GPU, 90 Wh | Aorus 15P XC i7-10870H, GeForce RTX 3070 Laptop GPU, 99 Wh | Lenovo Legion 7 15IMH05-81YT001VGE i9-10980HK, GeForce RTX 2080 Super Max-Q, 80 Wh | Razer Blade 15 RTX 2080 Super Max-Q i7-10875H, GeForce RTX 2080 Super Max-Q, 80 Wh | Média da turma Gaming | |
|---|---|---|---|---|---|---|---|
| Duração da bateria | -30% | -12% | -27% | -58% | -24% | -24% | |
| Reader / Idle (h) | 14.4 | 8.4 -42% | 12.1 -16% | 9.5 -34% | 8.7 -40% | 8.71 ? -40% | |
| H.264 (h) | 8.9 | 5.5 -38% | 7 -21% | 1.5 -83% | 7.3 -18% | 8.28 ? -7% | |
| WiFi v1.3 (h) | 9 | 7.2 -20% | 9.4 4% | 6.7 -26% | 3.4 -62% | 6.1 -32% | 6.96 ? -23% |
| Load (h) | 2 | 1.6 -20% | 1.5 -25% | 1.5 -25% | 1.4 -30% | 1.9 -5% | 1.47 ? -26% |
Pro
Contra
Veredicto
O Blade 15 Advanced (Início de 2021) é uma versão atualizada do Blade 15 Advanced (2020). Tem a mesma aparência do modelo anterior no exterior. No entanto, houve algumas mudanças no interior. O modelo deste ano recebe uma tela 360-Hz, um segundo slot SSD (M.2-2280, NVMe) e uma GPU de próxima geração (Ampere).
A combinação do Core i7-10875H e oGeForce RTX 3080 pode rodar todos os títulos atuais sem problemas. Ao todo, o Blade 15 Advanced (Início de 2021) oferece uma experiência de jogo sem compromissos. O GeForce RTX 3080 oferece mais desempenho no mesmo TGP do que oGeForce RTX 2080 Super Max-Q no modo do ano passado.
Pequenas melhorias tornam o já bom laptop para jogos ainda melhor.
A tela (FHD, IPS, 360 Hz) marca alguns pontos principais graças a seus amplos ângulos de visão, ótima reprodução de cores e boa cobertura do espaço de cores. Tanto a relação de contraste quanto a luminosidade estão em um nível decente. Entretanto, a tela 300-Hz do Blade 15 Advanced 2020 ofereceu melhores tempos de resposta.
O Blade 15 Advanced (Início de 2021) oferece maiores tempos de funcionamento da bateria. Ela durou de duas a três horas a mais em nossos testes de bateria do que o modelo 2020. A bateria pode ser carregada com o adaptador de energia incluído ou com um carregador USB-C (com uma potência nominal de 45 W ou superior). No entanto, o laptop não será capaz de obter energia suficiente de um carregador USB-C.
Preço e Disponibilidade
O Razer Blade 15 Advanced (Início de 2021) está atualmente disponível em Best Buy por $2900.
Razer Blade 15 Advanced Model Early 2021
- 04/30/2021 v7 (old)
Sascha Mölck
Price comparison

